0000108312wwd:SeriesONotesMemberus-gaap:NotesPayableToBanksMember2019-09-30
UNITED STATES SECURITIES AND EXCHANGE COMMISSION
Washington, D.C. 20549
FORM 10-K
☒TANNUAL REPORT PURSUANT TO SECTION 13 OR 15(d) OF THE SECURITIES EXCHANGE ACT OF 1934
For the fiscal year ended September 30, 20162019
or
☐¨TRANSITION REPORT PURSUANT TO SECTION 13 OR 15(d) OF THE SECURITIES EXCHANGE ACT OF 1934
For the transition period from _____ to _____
|
|
|
|
|
|
|
|
Commission file number 000-08408 |
WOODWARD, INC. |
(Exact name of registrant as specified in its charter) |
Delaware | 36-1984010 |
(State or other jurisdiction of incorporation or organization) | (I.R.S. Employer Identification No.) |
1081 Woodward Way, Fort Collins, Colorado | 80524 |
(Address of principal executive offices) | (Zip Code) |
(970) 482-5811 |
(Registrant’s telephone number, including area code) |
Securities registered pursuant to Section 12(b) of the Act: |
Title of each class:class | Trading Symbol(s) | Name of each exchange on which registered:registered |
Common stock,Stock, par value $.001455$0.001455 per share | WWD | NASDAQ Global Select Market |
Securities registered pursuant to Section 12(g) of the Act:
|
None
|
Indicate by check mark if the registrant is a well-known seasoned issuer, as defined in Rule 405 of the Securities Act. Yes ☒x No ☐¨
Indicate by check mark if the registrant is not required to file reports pursuant to Section 13 or Section 15(d) of the Act. Yes ☐¨ No ☒x
Indicate by check mark whether the registrant (1) has filed all reports required to be filed by Section 13 or 15(d) of the Securities Exchange Act of 1934 during the preceding 12 months (or for such shorter period that the registrant was required to file such reports), and (2) has been subject to such filing requirements for the past 90 days.
Yes ☒T No ☐¨
Indicate by check mark whether the registrant has submitted electronically and posted on its corporate Web site, if any, every Interactive Data File required to be submitted and posted pursuant to Rule 405 of Regulation S-T (§232.405 of this chapter) during the preceding 12 months (or for such shorter period that the registrant was required to submit and post such files).
Yes ☒T No ☐¨
Indicate by check mark if disclosure of delinquent filers pursuant to Item 405 of Regulation S-K is not contained herein, and will not be contained, to the best of registrant’s knowledge, in definitive proxy or information statements incorporated by reference in Part III of this Form 10-K or any amendment to this Form 10-K. ☐
Indicate by check mark whether the registrant is a large accelerated filer, an accelerated filer, a non-accelerated filer, or a smaller reporting company or an emerging growth company. See definitions of “large accelerated filer,” “accelerated filer”filer,” “smaller reporting company” and “smaller reporting“emerging growth company” in Rule 12b-2 of the Exchange Act (Check one):Act.
Large accelerated filer ☒Accelerated filer ☐FilerT Accelerated Filer ¨ Non-accelerated filer ☐Filer ¨Smaller reportingReporting Company ¨
Emerging Growth Company ¨
If an emerging growth company, ☐indicate by check mark if the registrant has elected not to use the extended transition period for complying with any new or revised financial accounting standards provided pursuant to Section 13(a) of the Exchange Act. ¨
Indicate by check mark whether the registrant is a shell company (as defined in Rule 12b-2 of the Exchange Act).
Yes ☐¨ No ☒T
Aggregate market value of registrant’s common stock held by non-affiliates of the registrant, based upon the closing price of a share of the registrant’s common stock on March 31, 20162019 as reported on The NASDAQ Global Select Market on that date: $2,321,670,771.$4,213,667,368. For purposes of this calculation, shares of common stock held by (i) persons holding more than 5% of the outstanding shares of stock, (ii) officers and directors of the registrant, and (iii) the Woodward Governor Company Profit Sharing Trust, Woodward Governor Company Deferred Shares Trust, or the Woodward Charitable Trust, as of March 31, 2016,2019, are excluded in that such persons may be deemed to be affiliates. This determination is not necessarily conclusive of affiliate status.
NumberAs of November 22, 2019, 61,965,458 shares of the registrant’s common stock outstanding aswith a par value of November 14, 2016: 61,625,138.$0.001455 per share were outstanding.
DOCUMENTS INCORPORATED BY REFERENCE
Portions of our proxy statement for the Annual Meeting of Stockholders to be held January 25, 2017,29, 2020, are incorporated by reference into Parts II and III of this Form 10-K, to the extent indicated.
Forward Looking Statements
PART I
Forward Looking Statements
This Annual Report on Form 10-K, including “Management’s Discussion and Analysis of Financial Condition and Results of Operations,” contains forward-looking statements regarding future events and our future results within the meaning of the Private Securities Litigation Reform Act of 1995. All statements other than statements of historical fact are statements that are deemed forward-looking statements. These statements are based on current expectations, estimates, forecasts, and projections about the industries in which we operate and the beliefs and assumptions of management. Words such as “anticipate,” “believe,” “estimate,” “seek,” “goal,” “expect,” “forecast,” “intend,” “continue,” “outlook,” “plan,” “project,” “target,” “strive,” “can,” “could,” “may,” “should,” “will,” “would,” variations of such words, and similar expressions are intended to identify such forward-looking statements. In addition, any statements that refer to projections of our future financial performance, our anticipated growth and trends in our businesses, and other characteristics of future events or circumstances are forward-looking statements. Forward-looking statements may include, among others, statements relating to:
| ·
| | future sales, earnings, cash flow, uses of cash, and other measures of financial performance;
|
| ·
| | descriptions of our
•plans and expectations for future operations; |
| ·
| | plans and expectations relating to the performance of our joint venture with General Electric Company;
|
| ·
| | investments in new campuses, business sites and related business developments;
|
| ·
| | the effect of economic trends or growth;
|
| ·
| | the expected level of activity in particular industries or markets and the effects of those changes;
|
| ·
| | the scope, nature, or impact of acquisition activity and integration of such acquisition into our business;
|
| ·
| | the research, development, production, and support of new products and services;
|
| ·
| | new business opportunities;
|
| ·
| | restructuring and alignment costs and savings;
|
| ·
| | our plans, objectives, expectations and intentions with respect to business opportunities that may be available to us;
|
| ·
| | our liquidity, including our ability to meet capital spending requirements and operations;
|
| ·
| | future repurchases of common stock;
|
| ·
| | future levels of indebtedness and capital spending;
|
| ·
| | the stability of financial institutions, including those lending to us; and
|
| ·
| | pension and other postretirement plan assumptions and future contributions.
|
Readers are cautioned that these forward-looking statements are only predictions and are subjectexpectations related to risks, uncertainties,our acquisition of L’Orange GmbH and assumptions that are difficultits affiliate, Fluid Mechanics LLC, and their related operations in Germany, the United States and China, including: a long-term supply agreement entered into with MTU, a subsidiary of Rolls-Royce, in connection with the acquisition; the opportunity to predict, including:
| ·
| | a decline in business with, or financial distress of, our significant customers;
|
| ·
| | global economic uncertainty and instability in the financial markets;
|
| ·
| | our ability to manage product liability claims, product recalls or other liabilities associated with the products and services that we provide;
|
| ·
| | our ability to obtain financing, on acceptable terms or at all, to implement our business plans, complete acquisitions, or otherwise take advantage of business opportunities or respond to business pressures;
|
| ·
| | the long sales cycle, customer evaluation process, and implementation period of some of our products and services;
|
| ·
| | our ability to implement and realize the intended effects of any restructuring and alignment efforts;
|
| ·
| | our ability to successfully manage competitive factors, including prices, promotional incentives, competitor product development, industry consolidation, and commodity and other input cost increases;
|
| ·
| | our ability to manage our expenses and product mix while responding to sales increases or decreases;
|
| ·
| | the ability of our subcontractors to perform contractual obligations and our suppliers to provide us with materials of sufficient quality or quantity required to meet our production needs at favorable prices or at all;
|
| ·
| | our ability to monitor our technological expertise and the success of, and/or costs associated with, our product development activities;
|
| ·
| | consolidation in the aerospace market and our participation in a strategic joint venture with General Electric Company may make it more difficult to secure long-term sales in certain aerospace markets;
|
| ·
| | our debt obligations, our debt service requirements, and our ability to operate our business, pursue business strategies and incur additional debt in light of covenants contained in our outstanding debt agreements;
|
| ·
| | our ability to manage additional tax expense and exposures;
|
| ·
| | risks related to our U.S. Government contracting activities, including liabilities resulting from legal and regulatory proceedings, inquiries, or investigations related to such activities;
|
| ·
| | the potential of a significant reduction in defense sales due to decreases in the amount of U.S. Federal defense spending or other specific budget cuts impacting defense programs in which we participate;
|
| ·
| | changes in government spending patterns, priorities, subsidy programs and/or regulatory requirements;
|
| ·
| | future impairment charges resulting from changes in the estimates of fair value of reporting units or of long-lived assets;
|
| ·
| | future results of our subsidiaries;
|
| ·
| | environmental liabilities related to manufacturing activities and/or real estate acquisitions;
|
| ·
| | our continued access to a stable workforce and favorable labor relations with our employees;
|
| ·
| | physical and other risks related to our operations and suppliers, including natural disasters, which could disrupt production;
|
| ·
| | our ability to successfully manage regulatory, tax, and legal matters (including the adequacy of amounts accrued for contingencies, the U.S. Foreign Corrupt Practices Act, and product liability, patent, and intellectual property matters);
|
| ·
| | risks related to our common stock, including changes in prices and trading volumes;
|
| ·
| | risks from operating internationally, including the impact on reported earnings from fluctuations in foreign currency exchange rates, and compliance with and changes in the legal and regulatory environments of the United States and the countries in which we operate;
|
| ·
| | risks associated with political and economic uncertainty in the European Union;
|
| ·
| | fair value of defined benefit plan assets and assumptions used in determining our retirement pension and other postretirement benefit obligations and related expenses including, among others, discount rates and investment return on pension assets;
|
| ·
| | industry risks, including changes in commodity prices for oil, natural gas, and other minerals, unforeseen events that may reduce commercial aviation, and changing emissions standards;
|
| ·
| | our operations may be adversely affected by information systems interruptions or intrusions; and
|
| ·
| | certain provisions of our charter documents and Delaware law that could discourage or prevent others from acquiring our company.
|
These factors are representativefurther develop sales opportunities with new customers and achieve other synergies, including supply chain savings; and the liability recognized by the Company in connection with the various pension plans assumed as part of the risks, uncertainties,acquisition;
•future sales, earnings, cash flow, uses of cash, and assumptions that could cause actual outcomes and results to differ materially from what is expressed or forecastother measures of financial performance;
•trends in our forward-looking statements. Other factors are discussed underbusiness and the caption “Risk Factors”markets in Part I, Item 1Awhich we operate, including expectations in this Annual Reportthose markets in future periods;
•our expected expenses in future periods and trends in such expenses over time;
•descriptions of our plans and expectations for future operations;
•our expectations with regard to the return to service of the Boeing 737 MAX aircraft and the related impact on Form 10-K forour original equipment manufacturer and initial provisioning sales;
•plans and expectations relating to the fiscal year ended September 30, 2016 (this “Form 10-K”). performance of our joint venture with General Electric Company;
•investments in new campuses, business sites and related business developments;
•the effect of economic trends or growth;
•the expected levels of activity in particular industries or markets and the effects of changes in those levels;
•the scope, nature, or impact of acquisition activity and integration of such acquisition into our business;
•the research, development, production, and support of new products and services;
•new business opportunities;
•restructuring and alignment costs and savings;
•our plans, objectives, expectations and intentions with respect to business opportunities that may be available to us;
•our liquidity, including our ability to meet capital spending requirements and operations;
•future repurchases of common stock;
•future levels of indebtedness and capital spending;
•the stability of financial institutions, including those lending to us;
•pension and other postretirement plan assumptions and future contributions; and
•our tax rate and other effects of the changes in U.S. federal tax law.
We undertake no obligation to revise or update any forward-looking statements for any reason.reason, except as required by applicable law.
Unless we have indicated otherwise or the context otherwise requires, references in this Form 10-K to “Woodward,” “the Company,” “we,” “us,” and “our” refer to Woodward, Inc. and its consolidated subsidiaries.
Except where we have otherwise indicated or the context otherwise requires, amounts presented in this Form 10-K are in thousands, except per share amounts.
Item 1.Business
General
General
Woodward enhances the global quality of life, creating innovative energy control solutions that optimize the performance, efficiency and emissions of our customers’ products. We are an independent designer, manufacturer, and service provider of energy control solutions for the aerospace and optimization solutions. We design, produceindustrial markets. Our innovative fluid, combustion, electrical, and servicemotion control systems help customers offer cleaner, more reliable, and more efficient low-emission,equipment. Our customers include leading original equipment manufacturers and high-performance energy control products for diverse applications in challenging environments.end users of their products. We have production and assembly facilities in the United States, Europe Asia and South America,Asia, and promote our products and services through our worldwide locations.
Our strategic focus is providing energy control and optimization solutions for the aerospace industrial and energyindustrial markets. The precise and efficient control of energy, including motion, fluid, combustion and electrical energy, combustion, and motion, is a growing requirement in the markets we serve. Our customers look to us to optimize the efficiency, emissions and operation of power equipment in both commercial and defense operations. Our core technologies leverage well across our markets and customer applications, enabling us to develop and integrate cost-effective and state-of-the-art fuel, combustion, fluid, actuation and electronic systems. We focus primarily on serving original equipment manufacturers (“OEMs”) and equipment packagers, partnering with them to bring superior component and system solutions to their demanding applications. We also provide aftermarket repair, maintenance, replacement and other service support for our installed products.
Our components and integrated systems optimize performance of commercial aircraft, defense aircraft, military ground vehicles and other equipment, gas and steam turbines, wind turbines, including converters and power grid related equipment, industrial diesel, gas, alternativebio-diesel and dual fuel reciprocating engines, and electrical power systems. Our innovative motion, fluid, energy, combustion, control,and electrical energy and motion control systems help our customers offer more cost-effective, cleaner, and more reliable equipment.
Woodward was established in 1870, incorporated in 1902, and is headquartered in Fort Collins, Colorado. The mailing address of our world headquarters is 1081 Woodward Way, Fort Collins, Colorado 80524. Our telephone number at that location is (970) 482-5811, and our website is www.woodward.com.www.woodward.com. None of the information contained on our website is incorporated into this document by reference.
Markets and Principal Lines of Business
We serve the aerospace industrial and energyindustrial markets through our two reportable segments – Aerospace and Industrial. In the first quarter of fiscal year 2016, we changed the name of our Energy segment to Industrial. The term “energy” is largely viewed as “oil and gas” and therefore was not representative of the broader markets we serve in this segment. Our customers require technological solutions to meet their needs for performance, efficiency, and reliability, and to reduce their costs of operation.
Within the aerospace market, we provide systems, components and solutions for both commercial and defense applications. Our key focus areas within this market are:
| ·
| | Propulsion and combustion control solutions for turbine powered aircrafts; and
|
| ·
| | Fluid and motion control solutions for critical aerospace and defense applications.
|
Propulsion and combustion control solutions for turbine powered aircraft; and
Fluid and motion control solutions for critical aerospace and defense applications.
Within the industrial and energy markets,market, our key focus areas are:
| ·
| | Applications and control solutions for machines that produce electricity utilizing conventional or renewable energy sources; and |
| ·
| | Fluid, motion, and combustion control solutions for complex oil and gas, industrial, and transportation applications.
|
Additional information about our operations in fiscal year 2016 and outlookcontrol solutions for the future, including certain segment information, is included in “Item 7 – Management’s Discussionmachines that produce electricity utilizing conventional or renewable energy sources; and Analysis of Financial Condition
Fluid, motion, and Results of Operations.” Additional information about our business segmentscombustion control solutions for complex oil and certain geographical information is included in Note 20, Segment information gas, industrial, power generation, and Note 21, Supplemental quarterly financial data (Unaudited), to the Consolidated Financial Statements in “Item 8 – Financial Statements and Supplementary Data.”transportation applications.
Products, Services and Applications
Aerospace
Our Aerospace segment designs, manufactures and services systems and products for the management of fuel, air, and combustion and motion control. These products include main fuel pumps, metering units, actuators, air valves, specialty valves, fuel nozzles, and thrust reverser actuation systems for turbine engines and nacelles, as well as flight deck controls,
actuators, servocontrols, motors and sensors for aircraft. These products are used on commercial and private aircraftsaircraft and helicopters,rotorcraft, as well as inon military fixed-wing aircraft and rotorcraft, guided weapons, and other defense systems.
We have significant content on a wide variety of commercial aircraft, rotorcraft and business jet platforms, includingsuch as the Airbus A320,A320neo, Boeing 737 MAX and 787, Bell 429 and Gulfstream G650. We also have significant content on defense applications such as the Blackhawk and Apache helicopters, F-18F/A-18 and F-35 fighter jets, and guided tactical weapons (for example, the Joint Direct Attack Munition (“JDAM”)).
Revenues from the Aerospace segment are generated by sales to OEMs, tier-one suppliers, and prime contractors, and through aftermarket sales of components, such as provisioning spares or replacements, and spare parts. We also provide aftermarket maintenance, repair and overhaul, andas well as other services to commercial airlines, turbine OEM repair facilities, military depots, third party repair shops, and other end users.
Industrial
Our Industrial segment designs, produces and services systems and products for the management of fuel, air, fluids, gases, electricity, motion, combustion and combustion.electricity. These products include actuators, valves, pumps, injectors,fuel injection systems, solenoids, ignition systems, speed controls, electronics and software, power converters, sensors and other devices that measure, communicate and protect electrical distribution systems. Our products are used on industrial gas turbines (including heavy frame, aeroderivative and aeroderivativesmall industrial gas turbines), steam turbines, reciprocating engines (including low speed, medium speed and high speed engines, natural gas vehicles and diesel, heavy fuel oil and dual-fuel engines), electric power generation and power distribution systems, wind turbines, and compressors. The equipment on which our products are found is used to generate and distribute power; to extract and distribute fossil and renewable fuels; in the mining of other commodities; to generate and distribute power; and to convert fuel to work in transportation and freight (both marine and locomotives), mobile, and industrial equipment applications.��
Revenues from our Industrial segment are generated primarily by sales to OEMs and by providing aftermarket products and other related services to our OEM customers. Our Industrial segment also sells products through an independent network of distributors and, in some cases, directly to end users.
Customers
For the fiscal year ended September 30, 2016,2019, approximately 42%47% of our consolidated net sales were made to our five largest customers. Sales to our five largest customers represented approximately 40%42% of our consolidated net sales for the fiscal year ended September 30, 20152018 and approximately 39%43% of our consolidated net sales for the fiscal year ended September 30, 2014. 2017.
Sales to our largest customer in fiscal year ended September 30, 2019, The Boeing Company, accounted for approximately 15% of our consolidated net sales, 12% in the fiscal year ended September 30, 2018, and 11% in the fiscal year ended September 30, 2017. Accounts receivable from Boeing represented approximately 14% of accounts receivable at September 30, 2019 and 14% at September 30, 2018. Sales to our second largest customer in the fiscal year ended September 30, 2019, General Electric, accounted for approximately 17%14% of our consolidated net sales in the fiscal year ended September 30, 2016, 18% of our consolidated net sales2019, 16% in the fiscal yearyears ended September 30, 2015,2018 and 15%2017. Accounts receivable from GE totaled approximately 8% of our consolidated net sales in the fiscal year endedaccounts receivable at both September 30, 2014. Our accounts receivable from General Electric represented approximately 14% of total accounts receivable as of2019 and September 30, 2016 and 15% as of September 30, 2015. During fiscal year 2016 we entered into a strategic joint venture (“JV”) with General Electric Company (“GE”), acting through its GE Aviation business unit. The JV sells fuel systems for GE’s large engine programs. Fuel systems for GE large engine programs that we previously sold directly to GE are now sold to the JV, which in turn sells them to GE. No other customer represented greater than 10% of our total accounts receivable.2018. We believe General ElectricBoeing, GE, and our other significant customers are creditworthy and will be able to satisfy their credit obligations to us.
The following customers account for approximately 10% or more of sales to each of our reportingreportable segments for the fiscal year ended September 30, 2016.
2019.
|
|
|
|
| Customer |
Aerospace |
| CustomerThe Boeing Company, General Electric Company, United Technologies
|
AerospaceIndustrial
|
| Boeing, United Technologies
|
Industrial
| | Rolls-Royce, General Electric Company, Weichai Westport |
Competitive Environment
Our products and product support services are sold worldwide into a variety of markets. In all markets, we compete on the basis of differentiated technology and design, product performance and conformity with customer specifications. Additional factors are customer service and support, including on-time delivery and customer partnering, product quality, price, reputation and local presence. Both of our segments operate in uniquely competitive environments.
We believe that new competitors face significant barriers to entry into many of our markets, including various government mandated certification requirements to compete in the aerospace and industrial markets in which we participate.
Aerospace industry safety regulations and manufacturing standards demandhas significant product certification requirements to meet safety regulations, which form a basis for competition as well as a barrier to entry. Technological innovation and design, product performance including increased
efficiency and thrust, conformity with customer specifications, and product quality and reliability are of utmost importance in the aerospace and
defense industry. In addition, on-time delivery, pricing, and joint development capabilities with customers are points of competition within this market.
Our customers include airframe and aircraft engine OEM manufacturers and suppliers to these manufacturers. We supply these customers with technologically innovative system and component solutions and align our technology roadmaps with our customers. We focus on responding to needs for reduced cost and weight, emission control and reliability improvements.
We compete with numerous companies around the world that specialize in fuel and air management, combustion, electronic control, aircraft motion control, flight deck control, and thrust reverser products. Our competitors in aerospace include divisions of Eaton, Honeywell, Moog, and Parker Hannifin, and United Technologies Corporation Aerospace Systems (“UTC Aerospace Systems”) and its subsidiaries.Collins Aerospace. In addition, some of our OEM customers are capable of developing and manufacturing similar products internally. Several competitors are also customers for our products, such as Honeywell, Parker Hannifin, and UTC Aerospace Systems.Collins Aerospace.
OurWe believe our products achieveoffer high levels of field reliability, which offersprovides end users with an advantage in life-cycle cost. We address competition in aftermarket service through responsiveness to our customers’ needs, providing short turnaround times, greater performance such as longer time between repairs, and maintaining a global presence.
Some of our customers are affiliated with our competitors through ownership or joint venture agreements. For example, Pratt and Whitney, one of our customers, is affiliated with Collins Aerospace, one of our competitors. Similarly, GE Aviation has a joint venture with Parker Hannifin for the supply of fuel nozzles. In the past, we also have partnered with our customers. During fiscal year 2016, we entered into a strategic joint venture (“JV”) with our largest customer, General Electric Company (“GE”), acting through its GE Aviation business unit. The JV primarily develops, manufactures and supports fuel systems for twin aisle aircraft engines and is described further in Note 6, Joint venture, in the Notes to the Consolidated Financial Statements in “Item 8 – Financial Statements and Supplementary Data.”
We compete in part by establishing relationships with our customers’ engineering organizations, and by offering innovative technical and commercial solutions to meet their market requirements. As discussed above, during fiscal year 2016 we entered intoOur ability to design, develop and test an integrated system with a strategic joint venture with GE, acting through its GE Aviation business unit. The JV sells fuel systems for GE’s large engine programs.customer is a competitive differentiator, offering the customer savings in both resources and time.
Industrial operates in the global markets for industrial turbines, industrial reciprocating engines, electric power generation systems (including wind turbines), power distribution networks, transportation, and wind turbines.oil and gas. Many of these markets are subject to regulatory product and performance certifications to meet emissions and safety requirements, which form a basis for competition as well as a barrier to entry.
We compete with numerous companies that specialize in various engine, turbine, and power management products, and our OEM customers are often capable of developing and manufacturing similiar products internally. Many of our customers are large global OEMs that require suppliers to support them around the world and to meet increasingly higher requirements in terms of safety, quality, delivery, reliability and cost.
Competitors include ABB, Emerson, EControls, HeinzmannGmbH & Co., Hoerbiger, Invensys, L’Orange GmbH, Meggitt, Robert Bosch AG, Schweitzer Electric, and Schweitzer Electric.Triconix. OEM customers with internal capabilities for similar products include Caterpillar, Cummins, General Electric, SiemensRolls-Royce Power Systems, Wärtsilä, and Wartsila.Weichai.
We believe we are a market leader in providing our customers advanced technology and superior product performance at a competitive price. We focus on developing and maintaining close relationships with our OEM customers’ engineering teams. Competitive success is based on the development of innovative components and systems that are aligned with the OEMs’ technology roadmaps to achieve future reliability, emission, efficiency, and fuel flexibility targets.
Government Contracts and Regulation
Portions of our business, particularly in our Aerospace segment, are heavily regulated. We contract with numerous U.S. Government agencies and entities, including all of the branches of the U.S. military, the National Aeronautics and Space Administration (“NASA”), and the Departments of Defense, Homeland Security, and Transportation. We also contract with similar government authorities outside the United States.States, subject in all cases to applicable law.
The U.S. Government, and potentially other governments, may terminate any of our government contracts, or any government contracts under which we are a subcontractor, at their convenience, as well as for default based on specified performance measurements. If any of our U.S. government contracts were to be terminated for convenience, we generally would be entitled to receive payment for work completed and allowable termination or cancellation costs. If any of our U.S. government contracts were to be terminated for our default, the U.S. Government generally would pay only for the work accepted, and could require us to pay the difference between the original contract price and the cost to re-procure the contract
items, net of the work accepted from the original contract. The U.S. Government could also hold us liable for damages resulting from the default.
We must comply with, and are affected by, laws and regulations relating to the formation, administration and performance of U.S. Government contracts. These laws and regulations, among other things:
| ·
| | require accurate, complete and current disclosure and certification of cost and pricing data in connection with certain contracts;
|
| ·
| | impose specific and unique cost accounting practices that may differ from accounting principles generally accepted in the United States (“U.S. GAAP”), and therefore require robust systems to reconcile;
|
| ·
| | impose regulations that define allowable and unallowable costs and otherwise govern our right to reimbursement under certain cost-based U.S. Government contracts;
|
require accurate, complete and current disclosure and certification of cost and pricing data in connection with certain contracts;
6impose specific and unique cost accounting practices that may differ from accounting principles generally accepted in the United States (“U.S. GAAP”), and therefore require robust systems to reconcile;
impose regulations that define allowable and unallowable costs and otherwise govern our right to reimbursement under certain cost-based U.S. Government contracts;
| ·
| | impose manufacturing specifications and other quality standards that may be more restrictive than for non-government business activities; and
|
| ·
| | restrict the use and dissemination of information classified for national security purposes due to the regulations of the U.S. Government and foreign governments pertaining to the export of certain products and technical data.
|
impose manufacturing specifications and other quality standards that may be more restrictive than for non-government business activities; and
restrict the use and dissemination of information classified for national security purposes due to the regulations of the U.S. Government and foreign governments pertaining to the export of certain products and technical data.
Sales made directly to U.S. Government agencies and entities, or indirectly through third party manufacturers utilizing Woodward parts and subassemblies, collectively represented 21%23% of our sales for each of the fiscal year 2016, 18% of our sales for fiscal year 2015,years 2019, 2018 and 17% of our sales for fiscal year 2014.2017. The level of U.S. spending for defense, alternative energy and other programs, and the mix of programs to which such funding is allocated, is subject to periodic congressional appropriation actions, and is subject to change, including elimination, at any time.
U.S. Government related sales from our reportingreportable segments for fiscal years 2016, 20152019, 2018 and 20142017 were as follows:
| | | | | | | | | | | | | | | |
|
|
|
|
|
|
|
|
|
|
|
|
|
|
|
| | | | | | | | | | | | | | | |
|
|
|
|
|
|
|
|
|
|
|
|
|
|
|
| Direct U.S. Government Sales | | Indirect U.S. Government Sales | | Commercial Sales | | Total | Direct U.S. Government Sales |
| Indirect U.S. Government Sales |
| Commercial Sales |
| Total |
Year ended September 30, 2016 | | | | | | | | | | | | | | | | |
Year ended September 30, 2019 | |
|
|
|
|
|
|
|
|
|
|
|
|
|
|
|
Aerospace | $ | 103,026 | | $ | 310,952 | | $ | 819,198 | | $ | 1,233,176 | $ | 118,334 |
| $ | 545,306 |
| $ | 1,216,880 |
| $ | 1,880,520 |
Industrial | | 6,550 | | | 9,845 | | | 773,507 | | | 789,902 |
| 4,491 |
|
| 13,810 |
|
| 1,001,376 |
|
| 1,019,677 |
Total net external sales | $ | 109,576 | | $ | 320,797 | | $ | 1,592,705 | | $ | 2,023,078 | $ | 122,825 |
| $ | 559,116 |
| $ | 2,218,256 |
| $ | 2,900,197 |
Percentage of total net sales | | 5 | % | | | 16 | % | | | 79 | % | | | 100 | % |
| 4 | % |
|
| 19 | % |
|
| 77 | % |
|
| 100 | % |
| | | | | | | | | | | | | | | |
|
|
|
|
|
|
|
|
|
|
|
|
|
|
|
Year ended September 30, 2015 | | | | | | | | | | | | | | | | |
Year ended September 30, 2018 | |
|
|
|
|
|
|
|
|
|
|
|
|
|
|
|
Aerospace | $ | 92,322 | | $ | 258,391 | | $ | 810,170 | | $ | 1,160,883 | $ | 84,252 |
| $ | 429,386 |
| $ | 1,044,350 |
| $ | 1,557,988 |
Industrial | | 4,836 | | | 8,839 | | | 863,745 | | | 877,420 |
| 2,547 |
|
| 8,658 |
|
| 756,680 |
|
| 767,885 |
Total net external sales | $ | 97,158 | | $ | 267,230 | | $ | 1,673,915 | | $ | 2,038,303 | $ | 86,799 |
| $ | 438,044 |
| $ | 1,801,030 |
| $ | 2,325,873 |
Percentage of total net sales | | 5 | % | | | 13 | % | | | 82 | % | | | 100 | % |
| 4 | % |
|
| 19 | % |
|
| 77 | % |
|
| 100 | % |
| | | | | | | | | | | | | | | |
|
|
|
|
|
|
|
|
|
|
|
|
|
|
|
Year ended September 30, 2014 | | | | | | | | | | | | | | | | |
Year ended September 30, 2017 | |
|
|
|
|
|
|
|
|
|
|
|
|
|
|
|
Aerospace | $ | 76,982 | | $ | 254,806 | | $ | 752,237 | | $ | 1,084,025 | $ | 106,685 |
| $ | 362,536 |
| $ | 873,118 |
| $ | 1,342,339 |
Industrial | | 2,517 | | | 5,588 | | | 909,110 | | | 917,215 |
| 3,726 |
|
| 10,814 |
|
| 741,806 |
|
| 756,346 |
Total net external sales | $ | 79,499 | | $ | 260,394 | | $ | 1,661,347 | | $ | 2,001,240 | $ | 110,411 |
| $ | 373,350 |
| $ | 1,614,924 |
| $ | 2,098,685 |
Percentage of total net sales | | 4 | % | | | 13 | % | | | 83 | % | | | 100 | % |
| 5 | % |
|
| 18 | % |
|
| 77 | % |
|
| 100 | % |
Seasonality
We do not believe our sales, in total or in either business segment, are subject to significant seasonal variation. However, our sales have generally been lower in the first quarter of our fiscal year as compared to the immediately preceding quarter due to fewer working days resulting from the observance of various holidays and scheduled plant shutdowns for annual maintenance.
Sales Order Backlog
Beginning in fiscal year 2019, for each of our reportable segments, we have elected to quantify backlog in a manner consistent with the definition of remaining performance obligations under Accounting Standards Codification Topic 606: Revenue from Contracts with Customers (“ASC 606”).
Our remaining performance obligations by segment, excluding material rights, as of October 31, 2019 and our sales order backlog of unshippedon firm sales orders by segment as of October 31, 20162018 is shown in the table below. For further discussion of our material rights obligations, refer to Note 3, Revenue, to the Consolidated Financial Statements in “Item 8 – Financial Statements and 2015 wasSupplementary Data.”
|
|
|
|
|
|
|
|
|
|
|
|
|
|
|
|
|
|
| October 31, 2019 |
| % Expected to be filled by September 30, 2020 |
| October 31, 2018 |
Aerospace | $ | 949,520 |
| 65 | % |
| $ | 1,355,635 |
Industrial |
| 353,983 |
| 95 |
|
|
| 292,897 |
| $ | 1,303,503 |
| 73 | % |
| $ | 1,648,532 |
Our remaining performance obligations as follows:
| | | | | | | | |
| | | | | | | | |
| October 31, 2016 | | % Expected to be filled by September 30, 2017 | | October 31, 2015 |
Aerospace | $ | 685,792 | | 77 | % | | $ | 571,329 |
Industrial | | 189,397 | | 96 | % | | | 208,347 |
| $ | 875,189 | | 81 | % | | $ | 779,676 |
Our current estimateof October 31, 2019 relate to the aggregate amount of the total contract transaction price of firm orders for which the performance obligation has not yet been recognized in revenue. Our sales order backlog isas of October 31, 2018 was based on unshipped firm sales orders that arewere open in our order entry systems. Unshipped orders are not necessarily an indicator of future sales levels because of variations in lead times and customer production schedules.
Manufacturing
We operate manufacturing and assembly plants in the United States, Europe Asia and South America.Asia. Our products consist of mechanical, electronic and electromechanical systems and components.
Aluminum, iron and steel are primary raw materials used to produce our mechanical components. Other commodities, such as gold, copper and nickel, are also used in the manufacture of our products, although in much smaller quantities. We
purchase various goods, including component parts and services used in production, logistics and product development processes from third parties. Generally there are numerous sources for the raw materials and components used in our products, which we believe are sufficiently available to meet current requirements.
We maintain global strategic sourcing models to meet our global facilities' production needs while building long-term supplier relationships and efficiently managing our overall supply costs. We expect our suppliers to maintain adequate levels of quality raw materials and component parts, and to deliver such parts on a timely basis to support production of our various products. We use a variety of agreements with suppliers intended to protect our intellectual property and processes and to monitor and mitigate risks of disruption in our supply base that could cause a business disruption to our production schedules or to our customers. The risks monitored include supplier financial viability, business continuity, quality, delivery and protection of our intellectual property and processes.
Our customers expect us to maintain adequate levels of certain finished goods and certain component parts to support our warranty commitments and sales to our aftermarket customers, and to deliver such parts on a timely basis to support our customers’ standard and customary needs. We carry certain finished goods and component parts in inventory to meet these rapid delivery requirements of our customers.
TheWe are subject to rules promulgated by the Securities and Exchange Commission (“SEC”) adoptedregarding disclosure rules for companies thatrelated to a company’s use of tantalum, tin, tungsten, and gold or their derivatives (collectively referred to as “conflict minerals”) in their products, with substantial supply chain verification requirements in the event the conflict minerals come or may come from the Democratic Republic of Congo or adjoining countries. The European Union is considering the imposition ofhas adopted similar reporting obligations.obligations that will be effective in 2021. Our conflict minerals report for calendar year 20152018 was filed with the SEC on May 31, 2016.30, 2019. We may face reputational challenges with our customers, stockholders and other stakeholders if we use and/or are unable to sufficiently verify the origins of the conflict minerals used in our products. Further, due to the complexity of our supply chain, the implementation of the existing U.S. requirements and any additional European requirements could affect the sourcing and availability of metals used in the manufacture of a number of parts contained in our products. Regardless, weWe have and will continue to incur costs associated with compliance, including time-consuming and costly efforts to determine the source of conflict minerals that may be used in our products.
Research and Development
We finance our research and development activities primarily with our own independent research and development funds. Our research and development costs include basic research, applied research, component and systems development, and other concept formulation studies.
Company funded expenditures related to new product development activities are expensed as incurred and are separately reported in the Company’s Consolidated Statements of Earnings. Across both of our segments, research and development costs totaled $126,170$159,107 in fiscal year 2016, $134,4852019, $148,279 in fiscal year 2015,2018, and $138,005$126,519 in fiscal year 2014.2017. Research and development costs were 6.2%5.5% of consolidated net sales in fiscal year 20162019 compared to 6.6%6.4% in fiscal year 20152018 and 6.9%6.0% in
fiscal year 2014.2017. See “Research and development costs” in Note 1, Operations and summary of significant accounting policies, to the Consolidated Financial Statements in “Item 8 – Financial Statements and Supplementary Data.”
Aerospace is focused on developing systems and components that we believe will be instrumental in helping our customers achieve their objectives of lower fuel consumption, lighter weight, more efficient performance, reduced emissions, and improved operating economics. We support our engine and airframe customers as they develop next generation designs across the commercial aviation, general aviation, civil private and military markets. Our development efforts support technology for a wide range of:
| ·
| | aerospace turbine engine applications, which include commercial, business and military turbofan engines of various thrust classes, turboshaft engines and turboprop engines;
|
| ·
| | electromechanical and hydraulic actuation systems for flight deck-to-flight surface control of fixed-wing aircraft and rotorcraft, and turbine engine nacelles, as well as guidance for weapon systems; and
|
| ·
| | motion control components for integration into comprehensive actuation systems.
|
aerospace turbine engine applications, which include commercial, business and military turbofan engines of various thrust classes, turboshaft engines and turboprop engines;
electromechanical and hydraulic actuation systems for flight deck-to-flight surface control of fixed-wing aircraft and rotorcraft, and turbine engine nacelles, as well as guidance for weapon systems; and
motion control components for integration into comprehensive actuation systems.
The aerospace industry is movinghas moved toward more electric (“fly-by-wire”), lighter weight aircraft, while demanding increased reliability and redundancy. In response, we are developing an expanded family of intelligent flight deck control products (including throttle and rudder controls) with both conventional and fly-by-wire technology, as well as motor driven actuation systems.
We collaborate closely with our customers as they develop their technology plans, which leads to new product concepts. We believe this collaboration allows us to develop technology that is aligned with our customers’ needs and therefore, increases the likelihood that our systems and components will be selected for inclusion in the platforms developed by our customers. Further, we believe our close collaboration with our customers during preliminary design stages allows us to provide products that deliver the component and system performance necessary forto bring greater value to our customers’ products. customers. This preliminary work may include opportunities to test new products in order to validate concepts and demonstrate performance in challenging environments.
Most technology development programs begin years before an expected entry to service, such as those for the next generation of commercial aircraft engines.aircraft. Other development programs result in nearer-term product launches associated with
new OEM offerings, product upgrades, or product replacements on existing programs. Some of the major projects/programs we are developing are listed below.
We developed the fuel system, air management system, and actuation hardware for CFM International’s LEAP engine program, andprogram. We also developed actuation system, combustion system and oil system components for Pratt & Whitney’s PurePowerGeared Turbo Fan (“GTF”) engine program. These programs target applications in the single aisle and regional aircraft markets with expected entry into service in the 2016 to 20182020 timeframe. Both the LEAP engine and the GTF engine (later named the PurePower engineengine) have been selected by Airbus as options to power its A320neo aircraft, which entered service in 2016. In addition, the LEAP engine has beenwas selected exclusively by Boeing exclusively for its 737 MAX, which entered service in 2017, and by Comac for its C919 aircraft.aircraft, which is currently in flight test. The PurePowerGTF engine has beenwas selected exclusively by Bombardier exclusively for its CSeries aircraft (now majority owned by Airbus and renamed the A220), which also entered service in 2016 and is currently in production. The GTF engine was also chosen by Embraer for its EJets E2 aircraft family, which entered service in 2018, by Mitsubishi for the MRJ regional aircraft and by Irkut for the MS-21 aircraft. The MRJ and MS-21 aircraft are currently in flight test.
During fiscal year 2016 we entered into aThe JV with GE acting through its GE Aviation business unit. The JV sellsprimarily develops, manufactures and supports fuel systems for GE’s large engine programs.twin aisle aircraft engines. The JV is developing the fuel system for the GE9X engine (which will power the Boeing 777X). We have been selected as the JV’s supplier of this fuel system.
We are the selected supplier for the thrust reverser actuation system (“TRAS”) for the Boeing 737 MAX and the CFM LEAP-engined Airbus A320neo. We are developing the TRAS programs for the Boeing 777X and the Airbus A330neo.A330neo, as well as the TRAS on the new nacelle version of the GTF engine to be used on the Airbus A320neo. The A330neo is scheduled to enterentered service in 2018, and the 777X is projected to enter service in late 2020.
We are currently developingdeveloped the fuel system, air management components, and actuation hardware for the Passport engine program, as well as the TRAS for the integrated propulsion system. Passport is the next generation GE Aviation engine for the large business aviation market, and has been selected by Bombardier to power its Global 7000 and 80007500 long-range business aircraft, expected to enter intowhich entered service in 2018 and 2019, respectively.2018.
In addition, we developed sensor solutions for the Airbus A350 high lift system, an actuation sub-system for the Boeing 787-9 that improves fuel burn, flight deck control components for the Bombardier CSeriesAirbus A220 and control and sensing solutions for the
Boeing KC-46A refueling tanker boom subsystem. We are currently developingdeveloped flight deck control components for the Bombardier Global 7000 and 80007500 aircraft, as well as other business aviation aircraft.
Industrial is focused on developing improvedinnovative technologies, including integrated control systems and system components, that will enable our OEM customers to cost-effectively meet mandated emissions regulations and fuel efficiency demands, allow for usage of a wider range of fuel sources, increase reliability (particularly in harsh environments), and reduce total cost of ownership,ownership. Our development efforts support global infrastructure growth, and safely distribute power on the electrical grid. technology for a wide range of:
Our efforts include research and development of technologies and products that improve the quality of combustion processes and provide the more precise flow of various fuels and gases in our customers’ gas turbines and industrial reciprocating engines. We also develop engines;
electronic devices and software solutions that provide improved control and protection of reciprocating engines, gas turbines, steam turbines, wind turbines, and engine- and turbine-powered equipment. Majorequipment; and
advanced prognostic and predictive intelligence that is integrated into many of our complex products and systems.
These development projects include efforts support our strategy of being the recognized market leader for:
application and control solutions for any machine that produces electricity utilizing conventional and renewable energy sources; and
control solutions for complex oil and gas, industrial and transportation applications.
We collaborate closely with our customers to jointly align our technology roadmaps. This collaboration allows us to develop new systems, products and technologies consistent with our customers’ future needs for performance, emissions and efficiency to deliver greater value. We strive to stay ahead of the competition through our modeling, prototyping, and state of the art test capabilities.
We partner with our customers on programs that can take months or years of development before being fully validated and launched into production. We also work with our customers on shorter term application programs for product and system upgrades. Some of the major projects/programs we are developing include:
high pressure common rail diesel fuel injection systems, systems;
natural gas metering and combustion systems;
comprehensive electronic control and air management solutions for natural gas and diesel engines;
emission certified stationary and mobile gas engine controlsystems;
heavy frame and aeroderivative electric actuation systems fuel flow controlenabling turbine electrification with cyber secure products;
steam turbine controls and valves that greatly simplify installation and actuators,significantly improve reliability; and various other technologies. Our technologies help our OEM customers’ engines, turbines, power
next generation power distribution, compressor and other powered equipment operate more efficiently and more reliably. full size wind turbine converters.
Employees
As of October 31, 2016,2019, we employedapproximately 6,8009,000 full-time employees of which approximately 1,7003,000 were located outside of the United States.States, with the majority in Germany, Poland and China. We believe that our relationships with our employees are good.
Approximately 17%12% of our total full-time workforce were union employees as of October 31, 2016,2019, all of whom work for our Aerospace segment and are located in the United States. The collective bargaining agreements with our union employees are generally renewed through contract renegotiation near the contract expiration dates. The MPC Employees Representative Union contract, which covers 483611 employees as of October 31, 2016,2019, expires September 30, 2017.October 1, 2021. The Local Lodge 727-N International Association of Machinists and Aerospace Workers agreement, which covers 416490 employees as of October 31, 2016,2019, expires April 21, 2017.22, 2021. The International Union, United Automobile, Aerospace and Agricultural Implement Workers of America and Local No. 509 agreement, which covers 223covered no employees as of October 31, 2016,2019, expires June 3, 2017.4, 2021. We believe that our relationships with our union employees and the representative unions are good.
Almost all of our other employees in the United States were at-will employees as of October 31, 2016,2019, and therefore, not subject to any type of employment contract or agreement. Our executive officers each have change-in-control agreements which have been filed with the SEC.
Outside of the United States, we enter into employment contracts and agreements in those countries in which such relationships are mandatory or customary.customary, including coordination through local works’ councils. The provisions of these agreements correspond in each case with the required or customary terms in the subject jurisdiction.
Patents, Intellectual Property, and Licensing
We own numerous patents and other intellectual property, and have licenses for the use of patents and other intellectual property owned by others, which relate to our products and their manufacture. In addition to owning a large portfolio of intellectual property, we also license intellectual property to and from third parties. For example, the U.S. Government has certain rights in our patents and other intellectual property developed in performance of certain government contracts, and it may use or authorize others to use the inventions covered by such patents for government purposes as allowed by law.
Some of our intellectualIntellectual property is not covered by patents (or patent applications) and includes trade secrets and other technological know-how that is not patentable or for which we have elected not to seek patent protection, including intellectual property relating to our manufacturing processes and engineering designs. Such unpatented technology, including research, development and engineering technical skills and know-how, as well as unpatented software, is important to our overall business and to the operations of each of our segments.
While our intellectual property assets taken together are important, we do not believe our business or either of our segments would be materially affected by the expiration of any particular intellectual property right or termination of any particular intellectual property patent license agreement.
As of September 30, 2016,2019, our Consolidated Balance SheetSheets includes $197,650$611,922 of net intangible assets. This value represents the carrying values, net of amortization, of certain assets acquired in various business acquisitions and does not purport to represent the fair value of our acquired intellectual property as of September 30, 2016. 2019.
U.S. GAAP requires that research and development costs be expensed as incurred; therefore, as we develop new intellectual property in the normal course of business, the costs of developing such assets are expensed as incurred, with no corresponding intangible asset recorded. Customers sometimes pay consideration to Woodward for product engineering and development activities that do not result in the immediate transfer of distinct products or services to the customer. For Woodward’s accounting policy with regards customer funded product engineering and development activities, see Note 3, Revenue, to the Notes to the Consolidated Financial Statements included in “Item 8 – Financial Statements and Supplementary Data.”
Environmental Matters and Climate Change
The Company is regulated by federal, state and international environmental laws governing our use, transport and disposal of substances and control of emissions. Compliance with these existing laws has not had a material impact on our capital expenditures, earnings or global competitive position.
We use hazardous materials and/or regulated materials in our manufacturing operations. We also own, operate, have acquired, and may in the future acquire facilities that were formerly owned and operated by others that used such materials. We believe that the risk that a significant release of regulated materials has occurred in the past or will occur in the future cannot be completely eliminated or prevented. We are engagedFrom time to time we engage in environmental remedial activities, generally in coordination with other companies, pursuant to federal and state laws. In addition, we may be exposed to other environmental costs including participation in superfund sites or other similar jurisdictional initiatives. When it is reasonably probable we will pay remediation costs at a site, and those costs can be reasonably estimated, we accrue a liability for such future costs with a related charge against our earnings. In formulating that estimate and recognizing those costs, we do not consider amounts expected to be recovered from insurance companies, or others, until such recovery is assured. Our accrued liability for environmental remediation costs is not significant and is included in the line item “Accrued liabilities” in the Consolidated Balance Sheets in “Item 8 – Financial Statements and Supplementary Data.”
We generally cannot reasonably estimate costs at sites in the early stages of remediation. Currently, we have one siteno sites undergoing remediation. There is no more than a remote chance that remediation costs at any individual site, or at all sites in the aggregate, will be material.
Our manufacturing facilities generally do not produce significant volumes or quantities of byproducts, including greenhouse gases, that would be considered hazardous waste or otherwise harmful to the environment. We do not expect legislation currently pending or expected in the next several years to have a significant negative impact on our operations in any of our segments.
Domestic and foreign legislative initiatives on emissions control, renewable energy, and climate change tend to favorably impact the sale of our energy control products. For example, our Industrial segment produces inverters for wind turbines and energy control products that help our customers maximize engine efficiency and minimize wasteful emissions, including greenhouse gases.
Executive Officers of the Registrant
Information about our executive officers is provided below. There are no family relationships between any of the executive officers listed below.
Thomas A. Gendron, Age 55.58. Chairman of the Board since January 2008; Chief Executive Officer, President, and Director since July 2005; Chief Operating Officer and President September 2002 through June 2005; Vice President and General Manager of Industrial Controls June 2001 through September 2002; Vice President of Industrial Controls April 2000 through May 2001; Director of Global Marketing and Industrial Controls’ Business Development February 1999 through March 2000.
Jonathan W. Thayer, Age 48. Vice Chairman, Corporate Operations and Chief Financial Officer since October 2019; and Vice Chairman, Corporate Operations since January 2019. Prior to January 2019, Mr. Thayer was employed at Exelon Corporation since 2012, where he held various positions, including Chief Financial Officer. Mr. Thayer served as Senior Vice President, Chief Financial Officer for Constellation Energy from October 2008 until its acquisition by Exelon in 2012. Mr. Thayer served as a member of the board of directors of Woodward from May 2016 through January 2019.
Robert F. Weber, Jr., Age 62.65. Vice Chairman since October 2011; Chief Financial Officer from August 2005 until September 2019; and Treasurer since September 2011, and Chief Financial Officer and Treasurer sincefrom August 2005.2005 through November 2018. Prior to August 2005, Mr. Weber was employed at Motorola, Inc. for 17 years, where he held various positions, including Corporate Vice President and General Manager, - EMEA Auto. Prior to this role, Mr. Weber served in a variety of financial positions at both a corporate and operating unit level with Motorola.
Martin V. GlassThomas G. Cromwell Age 50. Vice Chairman, Chief Operating Officer since February 2019. Prior to February 2019, Mr. Cromwell was employed at Kohler Co., Inc. for 10 years, most recently serving as Group President, Power from 2014 through February 2019.
Sagar A. Patel, Age 59.53. Business Unit President, AirframeFuel Systems and Controls since April 2011; President, Turbine Systems October 2009 through April 2011; Group Vice President, Turbine Systems September 2007 through September 2009; Vice President of the Aircraft Engine Systems Customer Business Segment December 2002 through August 2007; Director of Sales, Marketing,2019; and Engineering February 2000 through December 2002.
Sagar Patel, Age 50. President, Aircraft Turbine Systems sincefrom June 2011.2011 through April 2019. Prior to this role, Mr. Patel was employed at General Electric for 18 years, most recently serving as President, Mechanical Systems, GE Aviation, from March 2009 through June 2010. He served as President, Aerostructures, GE Aviation from July 2008 through July 2009 and as President and General Manager, MRS Systems, Inc., GE Aircraft Engines, from October 2005 through June 2008.
Chad R. Preiss, Age 51.54. Business Unit President, Engine & Turbine Controls since April 2019; and President, Industrial Control Systems sincefrom November 2016 through April 2019; President, Engine Systems October 2009 through November 2016; Group Vice President, Engine Systems October 2008 through September 2009; Vice President, Sales, Service, and Marketing, Engine Systems December 2007 through September 2008; and Vice President, Industrial Controls September 2004 through December 2007. Prior to this role, Mr. Preiss served in a variety of engineering and marketing/sales management roles, including Director of Business Development, since joining Woodward in 1988.
A. Christopher Fawzy, Age 47.50. Corporate Vice President, General Counsel, Corporate Secretary and Chief Compliance Officer since October 2009; Vice President, General Counsel, and Corporate Secretary June 2007 through September 2009. Mr. Fawzy became the Company’s Chief Compliance Officer in August 2009. Prior to joining Woodward, Mr. Fawzy was employed by Mentor Corporation, a global medical device company. He joined Mentor in 2001 and served as Corporate Counsel, then was promoted to General Counsel in 2003, and was appointed Vice President, General Counsel and Secretary in 2004.
Other Corporate Officers of the Registrant
Information about our other corporate officers is provided below. There are no family relationships between any of the corporate officers listed below or between any of the corporate officers listed below and the aforementioned executive officers.
James D. RudolphPaul P. Benson, Age 55. Corporate Vice President, Human Resources since November 2016,September 2019. Prior to September 2019, Mr. Benson was employed at Esterline Technologies Corporation from 2014 through September 2019, where he served as Executive Vice President Industrial Turbomachinery Systems April 2011and Chief Human Resources Officer. Prior to 2014, Mr. Benson was employed at Hewlett Packard Enterprise Company from 2006 through November 2016;2014, most recently serving as Senior Human Resources Director, Transformation.
Steven J. Meyer, Age 59. Corporate Vice President Global Sourcing October 2009 through April 2011; Vice President, Global Sourcing April 2009 through October 2009; Director of Global Sourcing April 2005 through April 2009; Director of Engineering for Industrial Controls March 2000 through April 2005. Prior to March 2000, Mr. Rudolph served in a variety of engineering, operations and sales roles since joining Woodward in 1984.
Steven J. Meyer, Age 56.September 2019; Corporate Vice President, Human Resources sincefrom October 2009;2009 through September 2019; Vice President, Human Resources November 2006 through September 2009; Director, Global Human Resources November 2002 through October 2006; Director, Human Resources for Industrial Controls July 1997 through October 2002. Prior to joining Woodward, Mr. Meyer was employed by PG&E Corporation and Nortel in a variety of roles in human resources.
John D. Tysver, Age 57. Corporate Vice President, Technology since October 2016; Vice President, Aircraft Turbine Systems’ Programs, Systems and Research & Development July 2015 through October 2016; Vice President and General Manager of Aircraft Turbine Systems’ Fuel Systems COE April 2011 through July 2015; Vice President of Turbine Systems’ Systems & Engineering October 2009 through April 2011; Director of Turbine Systems’ Systems & Engineering November 2006 through October 2009. Prior to November 2006, Mr. Tysver served in a variety of engineering leadership roles since joining Woodward in March 1991. Prior to joining Woodward, Mr. Tysver served in engineering roles at Sundstrand (now UTC Aerospace Systems).
Daniel M. Bowman, Age 54. Corporate Vice President, Supply ChainStrategy and Business Development since February 2011;August 2017; and Vice President, Engine FluidSales, Marketing, and Commercial Operations for Aircraft Turbine Systems and Controls Center of Excellence (“CoE”) October 2009 through February 2011; General Manager, Fluid Systems and Controls CoE December 2006 through October 2009; Director of Operations, Fluid Systems and Controls June 2005 through December 2006. Prior to joining Woodward in June 2005, Mr. Taylor was the Vice President and General Manager, Warner Electric and served in a variety of general management roles at Eaton Corporation from February 1998April 2007 through August 2003.
Matt R. Cook, Age 45. Corporate Vice President, Information Technology since January 2014; Director, Global Business Systems July 2012 through January 2014.2017. Prior to joining Woodward, Mr. CookBowman served as the Vice President of Sales, Marketing and Service at Fairbanks Morse Engine and held a variety of sales, marketing, and business development leadership roles at GE Aviation.
Matteo R. Pisciotta,Age 47. Corporate Vice President, Global Sourcing since August 2019. Prior to August 2019, Mr. Pisciotta was employed by Satcon Corporationat Polaris Industries, Inc., serving as Vice President, Global Information Technology.Procurement and Supply Chain from 2016 through August 2019. Prior to Satcon,2016, Mr. Cook served in a variety of senior roles in information technologyPisciotta was employed at Oshkosh Corporation for nine years, most recently serving as Vice President, Global Procurement and business development.Supply Chain from 2009 through 2016.
Information available on Woodward’s Website and Social Media
Through a link on the Investor Information section of our website, www.woodward.com,, we make available, free of charge, the following filings as soon as reasonably practicable after they are electronically filed or furnished to the SEC: our Annual Report on Form 10-K, Quarterly Reports on Form 10-Q, Current Reports on Form 8-K, Proxy Statements on Schedule 14A, and any amendments to those reports filed or furnished pursuant to Section 13(a) or 15(d) of the Securities Exchange Act of 1934.1934, as well as Section 16 reports of our officers and directors. The SEC also maintains a website that contains our SEC filings. The address of the site is www.sec.gov. Further, a copy of this Annual Report on Form 10-K is located at the SEC’s Public Reference Room at 100 F Street, NE, Washington, D.C. 20549. Information on the operation of the Public Reference Room can be obtained by calling the SEC at 1-800-SEC-0330. We provide notifications of news or announcements regarding our financial performance, including SEC filings,
investor events, press and earnings releases as part of our investor relations website. We have used, and intend to continue to use, our investor relations website, as well as the following as of the date of this filing, as means of disclosing material non-public information and for complying with the disclosure obligations under Regulation FD:
| ·
| | Facebook: Facebook.com/woodwardinc
|
| ·
| | LinkedIn: Linkedin.com/company/woodward
|
| ·
| | Google Plus: +WoodwardInc
|
| ·
| | YouTube: YouTube.com/user/woodwardinc
|
| ·
| | Goldenline (Poland): http://www.goldenline.pl/firma/woodward
|
| ·
| | XING (Germany): https://www.xing.com/companies/woodwardinc.
|
Twitter: @woodward_inc
Facebook: Facebook.com/woodwardinc
LinkedIn: Linkedin.com/company/woodward
YouTube: YouTube.com/user/woodwardinc
Goldenline (Poland): http://www.goldenline.pl/firma/woodward
XING (Germany): https://www.xing.com/companies/lorange.
None of the information contained on our website, or the above-mentioned social media sites, is incorporated into this document by reference.
Stockholders may obtain, without charge, a single copy of Woodward’s 20162019 Annual Report on Form 10-K upon written request to the Corporate Secretary, Woodward, Inc., 1081 Woodward Way, Fort Collins, Colorado 80524.
ItemItem 1A.
Risk Factors
Investment in our securities involves risk. An investor or potential investor should consider the risks summarized in this section when making investment decisions regarding our securities.
Important factors that could individually, or together with one or more other factors, affect our business, results of operations, financial condition, and/or cash flows include, but are not limited to, the following:
Company Risks
A significant portion of our revenue is concentrated among a relatively small number of customers. A decline in our customers’ business, or in our business with, or financial distress of, our significantsuch customers could decrease our consolidated net sales or impair our ability to collect amounts due and payable and have a material adverse effect on our business, financial condition, results of operations and cash flows.
A significant portion of our revenue is concentrated among a relatively small number of customers.We have fewer customers than many companies with similar sales volumes. For the fiscal year ended September 30, 2016,2019, approximately 42%47% of our consolidated net sales were made to our five largest customers. Sales to our five largest customers for the fiscal year ended September 30, 20152018 represented approximately 40%42% of our consolidated net sales. Sales to our largest customer General Electric,in the fiscal year ended September 30, 2019, The Boeing Company (“Boeing”), accounted for approximately 17%15% of our consolidated net sales, 12% in the fiscal year ended September 30, 2018, and 11% in the fiscal year ended September 30,
2017. Accounts receivable from Boeing represented approximately 14% of accounts receivable at September 30, 2019 and 14% at September 30, 2018. Sales to our second largest customer in the fiscal year ended September 30, 2019, General Electric Company (“GE”), accounted for approximately 14% of our consolidated net sales in the fiscal year ended September 30, 2016, 18%2019, and 16% in the fiscal year ended September 30, 2015 and 15% in the fiscal year ended September 30, 2014. Accounts receivable from General Electric represented approximately 14% of accounts receivable at September 30, 2016 and 15% at September 30, 2015. Sales to our next largest customer accounted for approximately 8% of our consolidated net sales in the fiscal year ended September 30, 2016 and 7% in each of theboth fiscal years ended September 30, 20152018 and 2017. Accounts receivable from GE represented approximately 8% of accounts receivable at both September 30, 2019 and September 30, 2014.2018. If any of our significant customers were to change suppliers, in-source production, institute significant restructuring or cost-cutting measures, or experience financial distress, these significant customers may substantially reduce, or otherwise be unable to pay for, purchases from us. Accordingly, our consolidated net sales could decrease significantly or we may experience difficulty collecting, or be unable to collect, amounts due and payable, which could have a material adverse effect on our business, financial condition, results of operations, and cash flows.
In October 2018 and March of 2019, two commercial aircraft accidents led to the grounding by the Federal Aviation Administration and other regulators of the Boeing 737 MAX aircraft, on which we have significant content. The grounding of the Boeing 737 MAX by the Federal Aviation Administration and other regulators, which started in March of 2019 has caused deliveries of that aircraft to be lower than expected in fiscal year 2019. The customer orders and demand for the aircraft has not changed significantly, and therefore we believe when the aircraft returns to service these missed deliveries will be fulfilled in future periods. In 2019, the grounding had a slightly negative impact on OEM sales, but a more significantly unfavorable impact on initial provisioning sales related to the 737 MAX aircraft and CFM LEAP engine. We anticipate the recovery of these initial provisioning sales in the periods following the aircraft’s return to service. Although we expect that deliveries of the 737 MAX program will resume and that the demand for the aircraft in the long-term has not changed, a prolonged grounding of the Boeing 737 MAX could substantially decrease our OEM and initial provisioning sales for the 737 MAX and CFM LEAP engines in the near term, which could have a material adverse effect on our business, financial condition, results of operations, and cash flows.
Instability in the financial markets and global or regional economic weakness or uncertainty could have a material adverse effect on the ability of our customers to perform their obligations to us and on their demand for our products and services.
Over the last six to eight years, there has been widespread concern over the instability in the financial markets and their influence on the global economy. As a result of the extreme volatility in the credit and capital markets and global economic uncertainty, our current or potential customers may experience cash flow problems and, as a result, may modify, delay or cancel plans to purchase our products. Additionally, if our customers face financial distress or are unable to secure necessary financing, they may not be able to pay, or may delay payment of, accounts receivable that are owed to us. Any inability of current or potential customers to pay us for our products may adversely affect our earnings and cash flows.
In addition, theThe general economic environment significantly affects demand for our products and services. Periods of slowing economic activity for example the global industrial recession currently impacting manysome of our markets, may cause global or regional slowdowns in spending on infrastructure development in the markets in which we operate, and customers may reduce their purchases of our products and services. In addition, weakness or uncertainty in any of our global markets, such as that most recently caused by the imposition and reciprocation of tariffs and duties, may materially adversely affect one or more areas of our business.
There can be no assurance that any market and economic uncertainty in the United StatesU.S. or internationally would not have a material adverse effect on our business, financial condition, results of operations, and cash flows.
Unforeseen events may occur that significantly reduce commercial aviation, which could adversely affect our business, financial condition and results of operations.
A significant portion of our business is related to commercial aviation. A global economic downturn and uncertainty in the marketplace typically lead to a general reduction in demand for air transportation services, leading some airlines to withdraw aircraft from service, which negatively affects sales of our aerospace components and services. These economic conditions can similarly affect our sales of systems and components for new business jet aircraft. The commercial airline industry tends to be cyclical and capital spending by airlines and aircraft manufacturers may be influenced by a variety of factors, including current and projected future traffic levels, aircraft fuel pricing, labor issues, competition, the retirement of older aircraft, regulatory changes, terrorism and related safety concerns, general economic conditions, worldwide airline profits and backlog levels. In the event these or other economic indicators stagnate or worsen, market demand for our components and systems could be negatively affected by renewed reductions in demand for air transportation services or commercial airlines’ financial difficulties, which could have a material adverse effect on our business, financial condition, results of operations, and cash flows.
Our profitability may suffer if we are unable to manage our expenses due toin connection with sales increases, sales decreases, or impacts of capital expansion projects, or if we experience change in product mix.
Some of our expenses are relatively fixed in relation to changes in sales volume and are difficult to adjust in the short term. Expenses driven by business activity other than sales level and other long-term expenditures, such as fixed manufacturing overhead, capital expenditures and research and development costs, may be difficult to reduce in a timely manner in response to a reduction in sales. Expenses such as depreciation or amortization, which are the result of past capital expenditures or business acquisitions, or interest expense, which is the result of the incurrence of debt primarily to finance our growth or business acquisitions, are generally fixed regardless of sales levels. In addition, the achievement of manufacturing efficiencies associated with capital expansion projects may not meet management’s current expectations. Due to our long sales cycle, in periods of sales increases it may be difficult to rapidly increase our production of finished goods, particularly if such sales increases are unanticipated. An increase in the production of our finished goods requires increases in both the purchases of raw materials and components and in the size of our workforce. If a sudden, unanticipated need for raw materials, components and labor arises in order to meet unexpected sales demand, we could experience difficulties in sourcing raw materials, components and labor at a favorable cost or to meet our production needs. These factors could result in delays in fulfilling customer sales contracts, damage to our reputation and relationships with our customers, an inability to meet the demands of the markets that we serve, which in turn could prevent us from taking advantage of business opportunities or responding to competitive pressures, and result in an increase in variable and fixed costs leading to a decrease in net earnings or even net losses. In addition, we sell products that have varying profit margins, and increases or decreases in sales of our various products may change the mix of products that we sell during any period. Any of these events could have a material adverse effect on our business, financial condition, results of operations, and cash flows.
The long sales cycle, customer evaluation process and implementation period of our products and services may increase the costs of obtaining orders and reduce the predictability of sales cycles and our inventory requirements.
Our products and services are technologically complex.complex and require significant capital commitments. Prospective customers generally must commit significant resources to test and evaluate our products and to install and integrate them into larger systems. Orders expected in one quarter may shift to another quarter or be cancelled with little advance notice as a result of customers’ budgetary constraints, internal acceptance reviews and other factors affecting the timing of customers’ purchase decisions. In addition, customers often require a significant number of product presentations and demonstrations before reaching a sufficient level of confidence in the product’s performance and compatibility with the approvals that typically accompany capital expenditure approval processes. The difficulty in forecasting demand increases the challenge in anticipating sales cycles and our inventory requirements, which may cause us to over-produce finished goods and could result in inventory write-offs, or could cause us to under-produce finished goods. Any such over-production or under-production could have a material adverse effect on our business, financial condition, results of operations, and cash flows.
Our product development activities may not be successful, may be more costly than currently anticipated, or we may not be able to produce newly developed products at a cost that meets the anticipated product cost structure.
Our business involves a significant level of product development activities, generally in connection with our customers’ development activities. Industry standards, customer expectations, or other products may emerge that could render one or more of our products or services less desirable or obsolete. Additionally, our competitors may develop new technology, or more efficient ways to produce their existing products that could cause our existing products or services to become less desirable or obsolete. Maintaining our market position requires continued investment in research and development. During an economic downturn or a subsequent recovery, we may need to maintain our investment in research and development, which may limit our ability to reduce these expenses in proportion to a sales shortfall. In addition, increased investments in research and development may divert resources from other potential investments in our business, such as acquisitions or investments in our facilities, processes and operations. If these activities are not as successful as currently anticipated, are not completed on a timely basis, or are more costly than currently anticipated, or if we are not able to produce newly developed products at a cost that meets the anticipated product cost structure, then our future sales, margins and/or earnings could be lower than expected, which could have a material adverse effect on our business, financial condition, results of operations, and cash flows.
The U.S. Government may change acquisition priorities and/or reduce spending, which could adversely affect our business, may be adversely affected by government contracting risks.financial condition and results of operations.
Sales made directly to U.S. Government agencies and entities were 5%4% of total net sales during fiscal year 2016,2019, 4% during fiscal year 2018, and 5% during fiscal year 2015, and 4% during fiscal year 2014,2017, primarily in the aerospace market. Sales made directly to U.S. Government agencies and entities, or indirectly through third party manufacturers, such as tier-one prime contractors, utilizing Woodward parts and subassemblies, accounted for approximately 21%23% of total sales in fiscal year 2016, 18%2019, 23% in fiscal year 2015,2018, and 17%23% in fiscal year 2014. 2017.
The level of U.S. defense spending is subject to periodic congressional authorization and appropriation actions and is subject to change at any time. The mix of programs to which such funding is allocated is also uncertain, and the level of U.S defense spending may be impacted by numerous factors out of our control such as the political environment, U.S. foreign policy, and macroeconomic conditions. We can provide no assurance that an increase in defense spending will be allocated to programs that would benefit our business. If the amount of spending were to decrease, or there were a shift from certain aerospace and defense programs on which we have content to other programs on which we do not, our sales could decrease. In addition, one or more of the aerospace or defense programs that we currently support could be phased-out or terminated. Any such reductions in U.S. Government needs under these existing aerospace and defense programs, unless offset by other aerospace and defense programs and opportunities, could have a material adverse effect on our sales.
The U.S. Government participates in a wide variety of operations, including homeland defense, counterinsurgency, counterterrorism, and other defense-related operations that employ our products and services. U.S. defense spending has historically been cyclical in nature, and defense budgets tend to rise when perceived threats to national security increase the level of concern over the country’s safety. The U.S. Government continues to adjust its funding priorities in response to changes in the perceived threat environment, the political environment, and changes in budgetary priorities. In addition, defense spending currently faces pressures due to the overall economic and political environment, budget deficits, and competing budget priorities. A decrease in U.S. Government defense spending or changes in the spending allocation could result in one or more of our programs being reduced, delayed, or terminated.
Shifts in domestic and international spending and tax policy, changes in security, defense, and intelligence priorities, changes in government budget appropriations, general and political economic conditions and developments, and other factors may affect a decision to fund, or the level of funding for, existing or proposed programs. If the priorities of the U.S. Government change and/or defense spending is reduced, this may adversely affect our business, financial condition, results of operations, and cash flows.
Our business may be adversely affected by government contracting risks.
Our contracts with the U.S. Government are subject to certain unique risks, including the risks set forth below, some of which are beyond our control, which could have a material adverse effect on our business, financial condition, results of operations, and cash flows.
Our U.S. Government contracts and the U.S. Government contracts of our customers are subject to modification, curtailment or termination by the government, either for the convenience of the government or for default as a result of a failure by us or our customers to perform under the applicable contract. If any of our contracts are terminated by the U.S. Government, our backlog would be reduced, in accordance with contract terms, by the expected value of the remaining work under such contracts. In addition, we are not the prime contractor on most of our contracts for supply to the U.S. Government, and the U.S. Government could terminate a prime contract under which we are a subcontractor, irrespective of the quality of our products and services as a subcontractor. We must comply with procurement laws and regulations relating to the formation, administration and performance of our U.S. Government contracts and the U.S. Government contracts of our customers. The U.S. Government may change procurement laws and regulations from time to time. A violation of U.S. Government procurement laws or regulations, a change in U.S. Government procurement laws and regulations, or a termination arising out of our default could expose us to liability, debarment, or suspension and could have an adverse effect on our ability to compete for future contracts and orders. We are subject to government inquiries, audits and investigations due to our business relationships with the U.S. Government and the heavily regulated industries in which we do business. In addition, our contract costs are subject to audits by the U.S. Government. U.S. Government agencies, including the Defense Contract Audit Agency and the Defense Contract Management Agency, routinely audit government contractors and subcontractors. These | ·
| | The level of U.S. defense spending is subject to periodic congressional appropriation actions and is subject to change at any time. The mix of programs to which such funding is allocated is also uncertain, and we can provide no assurance that an increase in defense spending will be allocated to programs that would benefit our business. If the amount of spending were to decrease, or there were a shift from certain aerospace and defense programs on which we
|
have content to other programs on which we do not, our sales could decrease. In addition, one or more of the aerospace or defense programs that we currently support could be phased-out or terminated. Any such reductions in U.S. Government needs under these existing aerospace and defense programs, unless offset by other aerospace and defense programs and opportunities, could have a material adverse effect on our sales.
|
| ·
| | Our U.S. Government contracts and the U.S. Government contracts of our customers are subject to modification, curtailment or termination by the government, either for the convenience of the government or for default as a result of a failure by us or our customers to perform under the applicable contract. If any of our contracts are terminated by the U.S. Government, our backlog would be reduced, in accordance with contract terms, by the expected value of the remaining work under such contracts. In addition, we are not the prime contractor on most of our contracts for supply to the U.S. Government, and the U.S. Government could terminate a prime contract under which we are a subcontractor, irrespective of the quality of our products and services as a subcontractor.
|
| ·
| | We must comply with procurement laws and regulations relating to the formation, administration and performance of our U.S. Government contracts and the U.S. Government contracts of our customers. The U.S. Government may change procurement laws and regulations from time to time. A violation of U.S. Government procurement laws or regulations, a change in U.S. Government procurement laws and regulations, or a termination arising out of our default could expose us to liability, debarment, or suspension and could have an adverse effect on our ability to compete for future contracts and orders.
|
| ·
| | We are subject to government inquiries, audits and investigations due to our business relationships with the U.S. Government and the heavily regulated industries in which we do business. In addition, our contract costs are subject to audits by the U.S. Government. U.S. Government agencies, including the Defense Contract Audit Agency and the Defense Contract Management Agency, routinely audit government contractors and subcontractors. These agencies review our performance under contracts, cost structure and compliance with applicable laws, regulations, and standards, as well as the adequacy of and our compliance with our internal control systems and policies. Any costs found to be misclassified or inaccurately allocated to a specific contract would be deemed non-reimbursable, and to the extent already reimbursed, would be refunded. Any inadequacies in our systems and policies could result in withholds on billed receivables, penalties and reduced future business. Any inquiries or investigations, including those related to our contract pricing, could potentially result in civil and criminal penalties and administrative sanctions, including termination of contracts, forfeiture of profits, suspension of payments, fines, suspension, and/or debarment from participating in future business opportunities with the U.S. Government. Such actions could harm our reputation, even if such allegations are later determined to be unfounded, and could have a material adverse effect on our business, results of operations, financial condition and cash flows.
|
agencies review our performance under contracts, cost structure and compliance with applicable laws, regulations, and standards, as well as the adequacy of and our compliance with our internal control systems and policies. Any costs found to be misclassified or inaccurately allocated to a specific contract would be deemed non-reimbursable, and to the extent already reimbursed, would be refunded. Any inadequacies in our systems and policies could result in withholds on billed receivables, penalties and reduced future business. Any inquiries or investigations, including those related to our contract pricing, could potentially result in civil and criminal penalties and administrative sanctions, including termination of contracts, forfeiture of profits, suspension of payments, fines, suspension, and/or debarment from participating in future business opportunities with the U.S. Government. Such actions could harm our reputation, even if such allegations are later determined to be unfounded, and could have a material adverse effect on our business, results of operations, financial condition and cash flows.
Product liability claims, product recalls or other liabilities associated with the products and services we provide may force us to pay substantial damage awards and other expenses that could exceed our accruals and insurance coverage.
The manufacture and sale of our products and the services we provide expose us to risks of product liability and other tort claims.claims, and any resulting liability. We currently have and have had in the past product liability claims relating to our products, and we will likely be subject to additional product liability claims in the future for both past, current and currentfuture products. Some of these claims may have a material adverse effect on our business, financial condition, results of operations and cash flows. We also provide certain services to our customers and are subject to claims with respect to the services provided. In providing such services, we may rely on subcontractors to perform all or a portion of the contracted services. It is possible that we could be liable to our customers for work performed by a subcontractor. Regardless of the outcome, product liability claims can be expensive to defend, can divert the attention of management and other personnel for significant periods of time, and can cause reputational damage. While we believe that we have appropriate insurance coverage available to us related to any such claims, our insurance may not cover all liabilities or be available in the future at a cost acceptable to us. An unsuccessful result in connection with a product liability claim, where the liabilities are not covered by insurance or for which indemnification or other recovery is not available, could have a material adverse effect on our business, financial condition, results of operations, and cash flows.
Suppliers may be unable to provide us with materials of sufficient quality or quantity required to meet our production needs at favorable prices or at all.
We are dependent upon suppliers for parts and raw materials used in the manufacture of components that we sell to our customers, and our raw material costs are subject to commodity market fluctuations. We may experience an increase in costs for parts or raw materials that we source from our suppliers, or we may experience a shortage of parts or raw materials for various reasons, such as the loss of a significant supplier, high overall demand creating shortages in parts and supplies we use, financial distress, work stoppages, natural disasters, fluctuations in commodity prices, the imposition of tariffs or other duties, or production or distribution difficulties that may affect one or more of our suppliers. In particular, current or future global economic uncertainty may affect the financial stability of our key suppliers or their access to financing, which may in turn affect their ability to perform their obligations to us. In some instances, we depend upon a single source of supply, manufacturing, or logistics support or participate in commodity markets that may be subject to allocations of limited supplies by suppliers. If one or more of our suppliers experiences financial difficulties, delivery delays or other performance problems, we may be unable to meet commitments to our customers or incur additional costs. Our customers rely on us to provide on-time delivery and have certain rights if our delivery standards are not maintained. AWe believe our supply management and production practices are based on an appropriate balancing of the foreseeable risks and the costs of alternative practices. Nonetheless, a significant increase in our supply costs, including for raw materials that are subject to commodity price fluctuations and the imposition of tariffs, or a
protracted interruption of supplies for any reason, could result in the delay of one or more of our customer contracts or could damage our reputation and relationships with customers. In addition, quality and sourcing issues that our suppliers may experience can also adversely affect the quality and effectiveness of our products and services and may result in liability or reputational harm to us. Any of these events could have a material adverse effect on our business, financial condition, results of operations, and cash flows.
Subcontractors may fail to perform contractual obligations or we may have disputes with subcontractors, which would adversely affect our ability to meet our obligations to our customers.
We frequently subcontract portions of work due under contracts with our customers and are dependent on the continued availability and satisfactory performance by these subcontractors. Nonperformance or underperformance by subcontractors could materially impact our ability to perform obligations to our customers. A subcontractor’s failure to perform could result in a customer terminating our contract for default, expose us to liability, substantially impair our ability to compete for future contracts and orders, and limit our ability to enforce fully all of our rights under these agreements, including any rights to indemnification. In addition, we may have disputes with our subcontractors, including disputes regarding the quality and
timeliness of work performed by the subcontractor, customer concerns about the subcontractor, our failure to extend existing task orders or issue new task orders under a subcontract, or our hiring of personnel of a subcontractor. Any of these events could have a material adverse effect on our business, reputation, financial condition, results of operations, and cash flows.
We may be unable to successfully execute or effectively integrate acquisitions, and divestitures may not occur as planned.
As part of our business strategy, we may pursue acquisitions of other companies and assets. For example, in fiscal year 2018, we acquired Woodward L’Orange. The success of these transactions will depend on, among other things, our ability to integrate assets and personnel acquired in these transactions and to apply our internal controls process to these acquired businesses. The integration of these acquisitions may require significant attention from our management, and the diversion of management’s attention and resources could have a material adverse effect on our ability to manage our business. In addition, we may incur unanticipated costs or expenses following an acquisition, including post-closing asset impairment charges, expenses associated with eliminating duplicate facilities, and other liabilities.
The success of our acquisitions is subject to risk, including, among others, the following:
failure to realize expected technological and product synergies, economies of scale and cost reductions;
unforeseen expenses, delays or conditions related to the acquisitions, including those due to regulations;
the assumption of unexpected liabilities or the exposure to unexpected penalties or other enforcement actions;
adverse effects on existing business relationships with suppliers and customers, including delays or cancellations of customer purchases, as well as revenue attrition in excess of anticipated levels if existing customers alter or reduce their historical buying patterns;
risks associated with entering into markets in which Woodward has limited or no prior experience, including potentially less visibility into demand;
inaccurate assumptions that may have been or may be made regarding the acquired business or the integration process;
financial and operational results that may differ materially from our assumptions and forecasts;
unforeseen difficulties that may arise in integrating operations, processes and systems;
higher than expected investments that may be required to implement necessary compliance processes and related systems, including information technology systems, accounting systems and internal controls over financial reporting;
fluctuations in foreign currency exchange rates that may impact the agreed upon purchase price;
the failure to retain, motivate and integrate key management and other employees of the acquired business;
higher than expected costs that may arise due to unforeseen changes in tax, trade, environmental, labor, safety, payroll or pension policies in any jurisdiction in which the acquired business conducts its operations; and
problems that we may experience in retaining customers and integrating customer bases.
Many of these factors are outside of our control and any one of them could result in increased costs, decreases in the amount of expected revenues, and diversion of management’s time and attention. Furthermore, we may not realize the degree or timing of benefits we anticipate when we first enter into these transactions. Failure to implement our acquisition strategy, including successfully integrating acquired businesses, could have a material adverse effect on our business, financial condition, results of operations, and cash flows.
We also may make strategic divestitures from time to time. These transactions may result in continued financial involvement in the divested businesses, such as through guarantees or other financial arrangements, following the transaction. Nonperformance by those divested businesses could affect our future financial results through additional payment obligations, higher costs or asset write-downs, any of which could have a material adverse effect on our business, financial condition, results of operations, and cash flows.
We have engaged in restructuring and alignment activities from time to time and may need to implement further restructurings or alignments in the future, and there can be no assurance that our restructuring or alignment efforts will have the intended effects.
From time to time, we have responded to changes in our industry and the markets we serve, or other changes in our business, by restructuring or aligning our operations. OurIn fiscal year 2018, we announced a restructuring plan and incurred workforce management costs primarily in connection with our decision to relocate our Duarte, California operations to our newly renovated Drake Campus in Fort Collins, Colorado. Historically, our restructuring activities have included workforce management and other restructuring charges related to our recently acquired businesses, including, among others, changes associated with integrating similar operations, managing our workforce, vacating or consolidating certain facilities and cancelling certain
contracts. Based onDue to cost reduction measures or changes in the industry and markets in which we compete, we may decide to implement restructuring or alignment activities in the future, such as closing plants, moving production lines, or making additions, reductions or other changes to our management or workforce. These restructuring and/or alignment activities generally result in charges and expenditures that may adversely affect our financial results for one or more periods.
Restructuring and/or alignment activities can create unanticipated consequences, such as instability or distraction among our workforce, and we cannot be sure that any restructuring or alignment efforts that we undertake will be successful. A variety of risks could cause us not to realize expected cost savings, including, among others, the following:
| ·
| | higher than expected severance costs related to staff reductions;
|
| ·
| | higher than expected retention costs for employees that will be retained;
|
| ·
| | higher than expected stand-alone overhead expenses;
|
| ·
| | delays in the anticipated timing of activities related to our cost-saving plan; and
|
| ·
| | other unexpected costs associated with operating the business.
|
higher than expected severance costs related to staff reductions;
higher than expected costs of closing plants;
higher than expected retention costs for employees that will be retained;
higher costs to hire new employees or delays or difficulty hiring the employees needed;
higher than expected stand-alone overhead expenses;
higher than expected operating costs associated with moving production lines;
delays in the anticipated timing of activities related to our cost-saving plan; and
other unexpected costs associated with operating the business.
If we are unable to structure our operations in the light of evolving market conditions, it could have a material adverse effect on our business, financial condition, results of operations, and cash flows.
ConsolidationWe operate in a highly competitive industry and, if we are unable to compete effectively in one or more of our markets, our business, financial condition and results of operations may be adversely affected.
We face intense competition from a number of established competitors in the aerospace marketUnited States and abroad, some of which are larger in size or are divisions of large diversified companies with substantially greater financial resources. In addition, global competition continues to increase. Companies compete on the basis of providing products that meet the needs of customers, as well as on the basis of price, quality, reliability, design and engineering capabilities, innovation, conformity to customers' specifications, timeliness of delivery, effectiveness of the distribution organization, and quality of customer support after the sale. Changes in competitive conditions, including the availability of new products and services, the introduction of new channels of distribution, and changes in OEM and aftermarket pricing, could impact our relationships with our customers and may adversely affect future sales, which could have a material adverse effect on our business, financial condition, results of operations, and cash flows.
Further, the markets in which we operate experience rapidly changing technologies and frequent introductions of new products and services. The technological expertise we have developed and maintained could become less valuable if a competitor were to develop a breakthrough technology that would allow it to match or exceed the performance of existing technologies at a lower cost. If we are unable to develop competitive technologies, future sales or earnings could be lower than expected, which could have a material adverse effect on our business, financial condition, results of operations, and cash flows.
In all of our markets, customers frequently develop new supply chain initiatives and/or sourcing models which could create new opportunities, but also could apply pressure to our customer relationships and/or strategic position with those customers.
Our participation in a strategic joint venture with GE may make it more difficult to secure long-term sales in certain aerospace marketsmarkets.
In January 2016, Woodward and General Electric Company (“GE”), acting through its GE Aviation business unit, consummated the formation of a strategic joint venture between Woodward and GE (the “JV”). The JV agreement does not restrict Woodward from entering into any market, however, consolidation in the aircraft engine market is increasingly prevalent, resulting in fewer engine manufacturers, and thus it may become more difficult for Woodward to secure new business with GE competitors on similar product applications both within and outside the specific JV market space. Additionally, if GE fails to win new content in the market space covered by the JV, Woodward may be prevented from expanding content on future commercial aircraft engines in those markets.
Industry consolidation trends could reduce our sales opportunities, decrease sales prices, and drive down demand for our products.
There has been consolidation and there may be further consolidation in the aerospace, power, and process industries. The consolidation in these industries has resulted in customers with vertically integrated operations, including increased in-sourcing capabilities, which may result in economies of scale for those companies. If our customers continue to seek to
control more aspects of vertically integrated projects, cost pressures resulting in further integration or industry consolidation could reduce our sales opportunities, decrease sales prices, and drive down demand for our products, which could have a material adverse effect on our business, financial condition, results of operations, and cash flows.
We may not be able to obtain financing, on acceptable terms or at all, to implement our business plans, complete acquisitions, or otherwise take advantage of business opportunities or respond to competitive pressures.
During the last several years, global financial markets, including the credit and debt and equity capital markets, and economic conditions have been volatile. These issues, along with significant write-offs in the financial services sector, the re-pricing of credit risk, and the global economic uncertainty, have in the past made, and may in the future make, it difficult to obtain financing. In addition, as a result of concerns about the stability of financial markets generally and the solvency of counterparties specifically, the cost of obtaining money from the credit markets may increase as many lenders and institutional investors have or may increase interest rates, enact tighter lending standards, refuse to refinance existing debt at maturity either at all or on terms similar to existing debt, and reduce and, in some cases, cease to provide financing to borrowers. Due to these factors, we cannot be certain that financing, to the extent needed, will be available on acceptable terms or at all. If financing is not available when needed, or is available only on unacceptable terms, we may be unable to implement our business plans,
complete acquisitions, fund significant capital expenditures, or otherwise take advantage of business opportunities or respond to competitive pressures, any of which could have a material adverse effect on our business, financial condition, results of operations, and cash flows.
Our debt obligations and the restrictive covenants in the agreements governing our debt could limit our ability to operate our business or pursue our business strategies, could adversely affect our business, financial condition, results of operations, and cash flows, and could significantly reduce stockholder benefits from a change of control event.
As of September 30, 2016,2019, our total debt was $729,244,$1,084,999, excluding unamortized debt issuance costs and including $156,700$262,297 of borrowings on our revolving credit facility, of which $150,000$220,000 was classified as current $393,000and $42,297 was classified as noncurrent, $650,000 in unsecured notes denominated in U.S. Dollarsdollars issued in private placements and $179,544$175,080 of unsecured notes denominated in Euros issued in private placements. Our debt obligations could require us to dedicate a portion of our cash flow from operations to payments on our indebtedness, reducing the availability of our cash flow for other purposes, including business development efforts and mergers and acquisitions. We are contractually obligated under the agreements governing our long-term debt to make principal payments of $0 in fiscal year 2017, $0 in fiscal year 2018, $143,000 in fiscal year 2019, $0 in fiscal year 2020, $100,000 in fiscal year 2021, $0 in fiscal year 2022, $0 in fiscal year 2023, $75,000 in fiscal year 2024, and the remaining $329,544 is due$650,080 in subsequent fiscal years. Interest on our long-term notes is payable semi-annually, with the exception of the Series J Notes which is payable quarterly, each year until all principal is paid. Our debt obligations could make us more vulnerable to general adverse economic and industry conditions and could limit our flexibility in planning for, or reacting to, changes in our business and the industries in which we operate, thereby placing us at a disadvantage to our competitors that have less indebtedness.
Our existing revolving credit facility and note purchase agreements impose financial covenants on us and our subsidiaries that require us to maintain certain leverage ratios and minimum levels of consolidated net worth. Certain of these agreements require us to repay outstanding borrowings with portions of the proceeds we receive from certain sales of property or assets and specified future debt offerings.
These financial covenants place certain restrictions on our business that may affect our ability to execute our business strategy successfully or take other actions that we believe would be in the best interests of our Company. These restrictions include limitations or restrictions, among other things, on our ability and the ability of our subsidiaries to:
| ·
| | incur additional indebtedness;
|
| ·
| | pay dividends or make distributions on our capital stock or certain other restricted payments or investments;
|
| ·
| | purchase or redeem stock;
|
| ·
| | issue stock of our subsidiaries;
|
| ·
| | make domestic and foreign investments and extend credit;
|
| ·
| | engage in transactions with affiliates;
|
| ·
| | transfer and sell assets;
|
| ·
| | effect a consolidation or merger or sell, transfer, lease, or otherwise dispose of all or substantially all of our assets; and
|
| ·
| | create liens on our assets to secure debt.
|
incur additional indebtedness;
pay dividends or make distributions on our capital stock or certain other restricted payments or investments;
purchase or redeem stock;
issue stock of our subsidiaries;
make domestic and foreign investments and extend credit;
engage in transactions with affiliates;
transfer and sell assets;
effect a consolidation or merger or sell, transfer, lease, or otherwise dispose of all or substantially all of our assets; and
create liens on our assets to secure debt.
These agreements contain certain customary events of default, including certain cross-default provisions related to other outstanding debt arrangements. Any breach of the covenants under these agreements or other event of default could cause a default under these agreements and/or a cross-default under our other debt arrangements, which could restrict our ability to borrow under our revolving credit facility. If there were an event of default under certain provisions of our debt
arrangements that was not cured or waived, the holders of the defaulted debt may be able to cause all amounts outstanding with respect to the debt instrument, plus any required settlement costs, to be due and payable immediately. Our assets and cash flow may not be sufficient to fully repay borrowings under our outstanding debt instruments if accelerated upon an event of default. If we are unable to repay, refinance, or restructure our indebtedness as required, or amend the covenants contained in these agreements, the lenders or note holders may be entitled to obtain a lien or institute foreclosure proceedings against our assets. Any of these events could have a material adverse effect on our business, financial condition, results of operations, and cash flows.
The Company, at its option, is permitted at any time to prepay all or any part of the then-outstanding principal amount of any series of our private placement notes, together with interest accrued on such amount to be prepaid to the date of prepayment, plus any applicable prepayment compensation amount. The prepayment compensation amount for the Euro denominated private placement notes includes any net gain or loss realized by the lenders on swap transactions entered into by the lenders under which the lenders would receive payment in U.S. dollars in exchange for scheduled Euro payments of principal and interest on the Euro denominated private placement notes by the Company to the lenders, adjusted for theoretical lender returns foregone on hypothetical reinvestments in U.S. Treasury securities. However, in the case of an event of default as defined in the loan documents, including a change in control event, the prepayment compensation amount will not be less than zero. Depending on the movement of foreign exchange rates over the terms of the Euro denominated private placement notes, such payments could have a material adverse effect on our business, financial condition, results of operations, and cash flows and could significantly reduce stockholder benefits from a change of control event.
Additional tax expense or additional tax exposures could affect our future profitability.
InApproximately 34%, in fiscal year 2016, approximately 23%2019, and 17%, in fiscal year 2018, of our earnings before income taxes was earned in jurisdictions outside the United States. Accordingly, we are subject to income taxes in both the United States and various non-U.S. jurisdictions.jurisdictions outside of the United States. Our tax liabilities are dependent upon the distribution mix of operating income among these different jurisdictions. Our tax expense includes estimates of additional tax that may be incurred and reflects various estimates, projections, and assumptions that could impact the valuation of our deferred tax assets and liabilities. Our future operating results could be adversely affected by changes in the effective tax rate, including:which could be caused by, among other things:
| ·
| | changes in the mix of earnings in countries with differing statutory tax rates;
|
| ·
| | changes in our overall profitability;
|
| ·
| | changes in tax legislation and tax rates;
|
| ·
| | changes in tax incentives;
|
| ·
| | changes in the projected realization of deferred tax assets and liabilities;
|
| ·
| | changes in management’s assessment of the amount of earnings indefinitely reinvested offshore; and
|
| ·
| | the results of audits and examinations of previously filed tax returns and continuing assessments of our tax exposures.
|
changes in the mix of earnings in countries with differing statutory tax rates;
changes in our overall profitability;
changes in rules or interpretations of existing tax laws;
changes in U.S. federal tax legislation and tax rates;
changes in state or non-U.S. government tax legislation and tax rates, particularly in response to the “The Tax Cuts and Jobs Act” enacted in December 2017 (the “Tax Act”);
changes in tax incentives;
changes in U.S. GAAP;
changes in the projected realization of deferred tax assets and liabilities;
changes in management’s assessment of the amount of earnings indefinitely reinvested offshore;
changes in management’s intentions regarding the amount of earnings reinvested offshore;and
the results of audits and examinations of previously filed tax returns and continuing assessments of our tax exposures.
We derive a significant portion of our revenues from non-U.S. sales to countries outside the United States and purchase raw materials and components from suppliers outside of the United States; therefore, we are subject to the risks inherent in doing business in other countries.
In 2016,fiscal year 2019, approximately 45%44% of our total sales were made to customers in jurisdictions outside of the United States (including products manufactured in the United States and sold outside the United States as well as products manufactured in international locations), including approximately 8%9% of our total sales to Brazil, Russia, India and China, known as the “BRIC” countries. We also purchase raw materials and components from suppliers outside the United States.
Accordingly, our business and results of operations are subject to risks associated with doing business internationally, including:
| ·
| | fluctuations in foreign exchange rates;
|
| ·
| | limitations on repatriation of earnings;
|
| ·
| | transportation delays and interruptions;
|
| ·
| | political, social and economic instability and disruptions;
|
| ·
| | government embargos or trade restrictions;
|
| ·
| | the imposition of duties and tariffs and other trade barriers;
|
| ·
| | import and export controls;
|
| ·
| | changes in labor conditions;
|
| ·
| | changes in regulatory environments;
|
| ·
| | the potential for nationalization of enterprises;
|
| ·
| | difficulties in staffing and managing multi-national operations;
|
| ·
| | limitations on the Company’s ability to enforce legal rights and remedies, including protection of intellectual property;
|
| ·
| | difficulty of enforcing agreements and collecting receivables through some foreign legal systems;
|
| ·
| | acts of terrorism or war;
|
| ·
| | potentially adverse tax consequences; and
|
| ·
| | difficulties in implementing restructuring actions on a timely basis.
|
fluctuations in foreign exchange rates;
limitations on repatriation of earnings;
transportation delays and interruptions;
political, social and economic instability and disruptions;
government embargos or trade restrictions;
the imposition of taxes, import and export controls, duties and tariffs, embargoes, sanctions and other trade barriers;
changes in labor conditions;
changes in regulatory environments;
the potential for nationalization of enterprises;
difficulties in staffing and managing multi-national operations;
limitations on the Company’s ability to enforce legal rights and remedies, including protection of intellectual property;
difficulty of enforcing agreements and collecting receivables through some foreign legal systems;
acts of terrorism or war;
potentially adverse tax consequences; and
difficulties in implementing restructuring actions on a timely basis.
The imposition of tariffs can have significant implications on the cost and supply of certain commodities used in both of our reporting segments. Over the longer term, if tariffs were to remain in place, there could be significant impact on costs and our ability to pass increased costs along to our customers, which could have a material adverse effect on our business, financial condition, results of operations and cash flows.
We are also subject to U.S. laws prohibiting companies from doing business in certain countries, or restricting the type of business that may be conducted in these countries. The cost of compliance with increasingly complex and often conflicting regulations governing various matters worldwide, including foreign investment, employment, import, export, business acquisitions, environmental and taxation matters, land use rights, property, and other matters, can also impair our flexibility in modifying product, marketing, pricing or other strategies for growing our businesses, as well as our ability to improve productivity and maintain acceptable operating margins. We must also comply with restrictions on exports imposed under the U.S. Export Control Laws and Sanctions Programs. These laws and regulations change from time to time and may restrict foreign sales.
In 2016,fiscal year 2019, our operations in China contributed to approximately 3%7% of our total sales were recorded in the Peoples’ Republic of China (“China”) and we have significant operations in China.net sales. Certain of our independent registered public accounting firm’s audit documentation related to their audit report, included in this annual report, may be located in the China. The Public Company Accounting Oversight Board (“PCAOB”) currently cannot inspect audit documentation located in China and, as such, prevents the PCAOB from regularly evaluating audit work of any auditors that was performed in China, including that performed by our independent auditors in China. As a result, investors may be deprived of the full benefits of PCAOB oversight of our global audits via their inspections. The inability of the PCAOB to conduct inspections of audit work performed in China makes it more difficult to
evaluate the effectiveness of our Chinese independent auditor’s audit procedures as compared to auditors in other jurisdictions that are subject to PCAOB inspections on all of their work.
Sales and purchases in currencies other than the U.S. dollar expose us to fluctuations in foreign currencies relative to the U.S. dollar. These exposures may change over time as our business and business practices evolve, and they could have a material adverse effect on our financial results and cash flows. An increase in the value of the U.S. dollar could increase the real cost to our customers of our products in those markets outside the United States where we sell in U.S. dollars, and a weakened U.S. dollar could increase the cost of local operating expenses and procurement of raw materials to the extent that we must purchase components in foreign currencies. Foreign currency exchange rate risk is reduced through several means, including the maintenance of local production facilities in the markets served, invoicing of customers in the same currency as the source of the products, and prompt settlement of inter-company balances utilizing a global netting system. While we monitor our exchange rate exposures and seek to reduce the risk of volatility, our actions may not be successful in significantly mitigating such volatility.
Of the $81,090$99,073 of cash and cash equivalents held at September 30, 2016, $80,7452019, $92,790 was held by our foreign locations. We are not presently aware of any significant restrictions on the repatriation of these funds, although a portion is considered indefinitely reinvested in these foreign subsidiaries. If these funds were needed to fund our operations or satisfy obligations in the United States, then they could be repatriated and their repatriation into the U.S.United States may cause us to incur
additional U.S. income taxes or foreign withholding taxes. Any additional U.S. taxes could be offset, in whole or in part, by foreign tax credits. The amount of such taxes and application of tax credits would be dependent on the income tax laws and other circumstances at the time these amounts are repatriated. Based on these variables, it is impractical to determine the income tax liability that might be incurred if these funds were to be repatriated. The additional uncertainty associated with the Tax Act increases the impracticality of determining this income tax liability.
In addition, uncertain global economic conditions arising from circumstances such as slowing growth in emerging regions could result in reduced customer confidence and decreased demand for our products and services, disruption in payment patterns and higher default rates, a tightening of credit markets, increased risk regarding supplier performance, increased counterparty risk with respect to the financial institutions with which we do business, and exchange rate fluctuations. While we employ comprehensive controls regarding global cash management to guard against cash or investment loss and to ensure our ability to fund our operations and commitments, a material disruption to the financial institutions with whom we transact business could have a material adverse effect on our international operations or on our business, financial condition, results of operations, and cash flows.
Political and economic uncertainty in the European Union could adversely impact our business, results of operations, financial condition and prospects.
Credit rating downgrades in certain European countries and/or speculation regarding changes to the composition or viability of the European Union (“EU”) create uncertain global economic conditions. On June 23, 2016, the United Kingdom (“UK”) voted to leave the EU. The UK’s voluntaryvote to voluntarily exit from the EU, generally referred to as the “Brexit,” triggered short-term financial volatility, including a decline in the value of the Great Britain Pound (“GBP”) in comparison to both the U.S. dollar (“USD”) and the European Union countries’ Euro (“EUR”). In addition, a process of negotiation will be requireddiscussions and negotiations to determine the future terms of the UK’s relationship with the EU are ongoing, and the uncertainty before, duringlegal and afterregulatory framework that will be applicable in the period of negotiationUK may change. Most recently, the EU extended the deadline for Brexit until January 31, 2020. The ongoing uncertainty could have a negative economic impact and result in further volatility in the markets for several years. The impact of the Brexit referendum and such ongoing uncertainty may result in various economic and financial consequences for businesses operating in the UK, the EU and beyond.
We derive a significant portion of our revenues from non-U.S. sales and are subject to the risks inherent in doing business in other countries, including the UK. During fiscal year 2016,2019, approximately 3% of our consolidated net sales were invoiced to customers in the UK through both our Aerospace and our Industrial reportable segments. Approximately 27%25% of our consolidated net sales were invoiced to customers in Europe overall. Woodward and its various subsidiaries hold financial assets and liabilities denominated in GBP and EUR, including cash and cash equivalents, accounts receivable, postretirement defined benefit pension plan assets and liabilities, and accounts payable, and the future impacts of the Brexit and the continued uncertainty surrounding the EU could have a material impact on our business, financial condition, results of operations and cash flows.
Changes in the estimates of fair value of reporting units or of long-lived assets, particularly goodwill, may result in future impairment charges, which could have a material adverse effect on our business, financial condition, results of operations and cash flows.
Over time, the fair values of long-lived assets change. At September 30, 2016,2019, we had $555,684$797,853 of goodwill, representing 21%20% of our total assets. We test goodwill for impairment at the reporting unit level on an annual basis as of July 31 of each year and more often if an event occurs or circumstances change that would more likely than not reduce the fair value of a reporting unit below its carrying amount. Based on the relevant U.S. GAAP authoritative guidance, we aggregate components of a single operating segment into a reporting unit, if appropriate. Future goodwill impairment charges may occur if estimates of fair values decrease, which would reduce future earnings. We test our indefinite lived intangible asset on an annual basis and more often if an event occurs or circumstances change that would more likely than not reduce the fair value of the indefinite lived intangible asset below its carrying amount. We also test property, plant, and equipment and other intangibles for impairment whenever events or changes in circumstances indicate that the carrying amount may not be recoverable. Future
asset impairment charges may occur if asset utilization declines, if customer demand decreases, or for a number of other reasons, which would reduce future earnings. Any such impairment charges could have a material adverse effect on our business, financial condition, results of operations, and cash flows. Impairment charges would also reduce our consolidated stockholders’ equity and increase our debt-to-total-capitalization ratio, which could negatively impact our credit rating and access to the debt and equity markets.
WeDuring the fourth quarter of fiscal year 2019, we completed our fiscal year 2019 annual goodwill impairment test during the quarter ended September 30, 2016.test. In performing the annual goodwill impairment test, we determined it was appropriate to aggregate certain components of the same operating segment into a single reporting unit. The identification of reporting units and consideration of aggregation criteria requires management’s judgment. Further, we use the income approach based on a discounted cash flow method that
incorporates various estimates and assumptions. The results of our fiscal year 20162019 annual goodwill impairment test performed as of July 31, 20162019 indicated the estimated fair values of each of our reporting units were in excess of their carrying amounts, and accordingly, no impairment existed. There can be no assurance that our estimates and assumptions of the fair value of our reporting units, the current economic environment, or the other inputs used in forecasting the present value of forecasted cash flows used to estimate the fair value of our reporting units will prove to be accurate projections of future performance.performance, and any material error in our estimates and assumptions, could result in us needing to take a material impairment charge, which would have the effects discussed above.
As part of our ongoing monitoring efforts, we will continue to consider the global economic environment and its potential impact on our businesses, as well as other factors, in assessing goodwill and other long-lived assets for possible indications of impairment.
Our manufacturing activities may result in future environmental costs or liabilities.
We use hazardous materials and/or regulated materials in our manufacturing operations. We also own, operate, have acquired, and may in the future acquire facilities that were formerly owned and operated by others that used such materials. The risk that a significant release of regulated materials has occurred in the past or will occur in the future cannot be completely eliminated or prevented. As a result, we are subject to a substantial number of costly regulations. In particular, we are required to comply with increasingly stringent requirements of federal, state, and local environmental, occupational health and safety laws and regulations in the United States, the European Union,EU, and other territories, including those governing emissions to air, discharges to water, noise and odor emissions, the generation, handling, storage, transportation, treatment and disposal of waste materials, and the cleanup of contaminated properties and human health and safety. Compliance with these laws and regulations results in ongoing costs and compliance with any future changes in these laws and regulations could result in the incurrence of additional costs. We cannot be certain that we have been, or will at all times be, in complete compliance with all environmental requirements, or that we will not incur additional material costs or liabilities in connection with these requirements. In addition, we may be exposed to other environmental costs such as participation in superfund sites or other similar jurisdictional initiatives.
As a result, we may incur material costs or liabilities or be required to undertake future environmental remediation activities that could damage our reputation and have a material adverse effect on our business, financial condition, results of operations, and cash flows.
Our financial and operating performance depends on continued access to a stable workforce and on favorable labor relations with our employees.
Certain of our operations in the United States and internationally involve different employee/employer relationships and the existence of works’ councils. In addition, a portionapproximately 12% of our workforce in the United States is unionized, and is expected to remain unionized for the foreseeable future. Competition for technical personnel in the industries in which we compete is intense. Due to the specialized nature of our business, our future performance is highly dependent upon our ability to maintain a workforce with the requisite skills in multiple areas including engineering, manufacturing, information technology, cybersecurity, business development and strategy, and management. Additionally, as we expand our operations internationally, it is increasingly important to hire and retain personnel with relevant experience in local laws, regulations, customs, traditions and business practices. Our future success depends in part on our continued ability to hire, train, assimilate, and retain qualified personnel. There is no assurance that we will continue to be successful in recruiting qualified employees in the future. Further, we periodically need to renegotiate our collective bargaining agreements, and any failure to negotiate new agreements or extensions in a timely manner could result in work stoppages or slowdowns. Any significant increases in labor costs, deterioration of employee relations, including any conflicts with works’ councils or unions, or slowdowns or work stoppages at any of our locations, whether due to employee turnover, changes in availability of qualified technical personnel, or otherwise, could have a material adverse effect on our business, our relationships with customers, and our financial condition, results of operations, and cash flows.
Failure of our production lines, or those of our subcontractors, to meet required certification standards could disrupt production and have a material adverse effect on our business, financial condition, results of operations and cash flows.
Our existing production lines, as well as the production lines of our subcontractors, are sometimes required to pass varying levels of qualification with certain of our customers. Some of our customers require that our production lines pass their specific qualification standards and that we, and any subcontractors that we may use, be registered under or certified to certain U.S. or international quality standards. We may be unable to obtain, maintain, or we may experience delays in obtaining, a certification or registration to a required quality standard. A delay in obtaining, or the failure to obtain a necessary quality certification or registration could result in significant out-of-sequence work and increased production costs,
as well as delayed deliveries to customers, which could have a material adverse effect on our business, financial condition, results of operations and cash flows.
Our operations and suppliers may be subject to physical and other risks, including natural disasters that could disrupt production and have a material adverse effect on our business, financial condition, results of operations and cash flows.
Our operations include principal facilities in the United States, China, Germany, and Poland. In addition, we operate sales and service facilities in Brazil, Bulgaria, India, Japan, the Netherlands, the Republic of Korea Russia and the United Kingdom.UK. We also have suppliers for materials and parts inside and outside the United States. Our operations and sources of supply could be disrupted by unforeseen events, including fires, tornadoes, tsunamis, hurricanes, earthquakes, floods and other forms of severe weather in countries in which we operate or in which our suppliers are located, any of which could adversely affect our operations and financial performance. Natural disasters, public health concerns, war, political unrest, terrorist activity, equipment failures, power outages, or other unforeseen events could result in physical damage to, and complete or partial closure of, one or more of our manufacturing facilities, or could cause temporary or long-term disruption in the supply of component products from some local and international suppliers, disruption in the transport of our products and significant delays in the shipment of products and the provision of services, which could in turn cause the loss of sales and
customers. Existing insurance arrangements may not provide protection for all of the costs that may arise from such events. Accordingly, disruption of our operations or the operations of a significant supplier could have a material adverse effect on our business, financial condition, results of operations, and cash flows.
Our intellectual property rights may not be sufficient to protect all our products or technologies.technologies and we may, regardless of intent, infringe on the intellectual property rights of others.
Our success depends in part on our ability to obtain patents or rights to patents, protect trade secrets and know-how, and prevent others from infringing on our patents, trademarks, and other intellectual property rights. We cannot be certain that our pending patent applications will result in the issuance of patents to us, that patents issued to or licensed by us in the past or in the future will not be challenged or circumvented by competitors, or that these patents will be found to be valid or sufficiently broad to preclude our competitors from introducing technologies similar to those covered by our patents and patent applications. Some of our intellectual property is not covered by patents (or patent applications) and includes trade secrets and other know-how that is not patentable or for which we have elected not to seek patent protection, including intellectual property relating to our manufacturing processes and engineering designs. We will be able to protect our intellectual property from unauthorized use by third parties only to the extent that it is covered by valid and enforceable patents, trademarks, licenses or licenses.other valid intellectual property rights. Patent protection generally involves complex legal and factual questions and, therefore, enforceability of patent rights cannot be predicted with certainty; thus, any patents that we own or license from others may not provide us with adequate protection against competitors. Moreover, the laws of certain foreign countriesjurisdictions do not recognize intellectual property rights or protect them to the same extent as do the laws of the United States. Additionally, our commercial success depends significantly on our ability to operate without infringing upon the patent and other proprietary rights of others. Our current or future technologies may, regardless of our intent, infringe upon the patents or violate other proprietary rights of third parties. In the event of such infringement or violation, we may face expensive litigation or indemnification obligations and may be prevented from selling existing products and pursuing product development or commercialization. If we are unable to sufficiently protect our patent and other proprietary rights or if we infringe on the patent or proprietary rights of others, our business, financial condition, results of operations, and cash flows could be materially adversely affected.
Amounts accrued for contingencies may be inadequate to cover the amount of loss when the matters are ultimately resolved.
In addition to intellectual property and product liability matters, we are currently involved or may become involved in claims, pending or threatened litigation or other legal proceedings, investigations or regulatory proceedings regarding employment or other regulatory, legal, or contractual matters arising in the ordinary course of business. There is no certainty that the results of these matters will be favorable to the Company. We accrue for known individual matters if we believe it is probable that the matter will result in a loss when ultimately resolved using estimates of the most likely amount of loss. There may be additional losses that have not been accrued, or liabilities may exceed our estimates, which could have a material adverse effect on our business, financial condition, results of operations, and cash flows.
We could be adversely affected by violations of the U.S. Foreign Corrupt Practices Act and similar worldwide anti-bribery and anti-corruption laws and regulations.
The U.S. Foreign Corrupt Practices Act (“FCPA”) and similar anti-bribery and anti-corruption laws and regulations in other jurisdictions generally prohibit companies and their intermediaries from making improper payments to non-U.S. government officials for the purpose of obtaining or retaining business or securing an improper business advantage. The FCPA applies to companies, individual directors, officers, employees and agents. Companies also may be held liable for actions taken by strategic or local partners or representatives. The FCPA also imposes accounting standards and requirements on U.S. corporations and their foreign affiliates, which are intended to prevent the diversion of corporate funds to the payment of bribes and other improper payments. Our policies mandate compliance with these anti-bribery laws. However, we operate in many parts of the world and sell to industries that have experienced corruption to some degree. If we are found to be liable for FCPA or other similar anti-bribery law or regulatory violations, whether due to our or others’ actions or inadvertence, we could be subject to civil and criminal penalties or other sanctions that could have a material adverse impact on our business, financial condition, results of operations and cash flows.
Our netPension and postretirement benefit obligation liabilities may increase,funding and the fair value of our pension plan assets may decrease,expenses are dependent on several economic assumptions, which if changed could require us to make additional and/or unexpected cash contributions to our pension plans, increase the amount of postretirement benefit expenses, affect our liquidity or affect our ability to comply with the terms of our outstanding debt arrangements.
Accounting for retirement, pension and postretirement benefit obligations and related expense requires the use of assumptions, including a weighted-average discount rate, an expected long-term rate of return on assets, a net healthcare cost trend rate, and projected mortality rates, among others. Benefit obligations and benefit costs are sensitive to changes in these assumptions. As a result, assumption changes could result in increases in our obligation amounts and expenses. If interest rates decline, the present value of our postretirement benefit plan liabilities may increase faster than the value of plan assets, resulting in significantly higher unfunded positions in some of our pension plans. As of September 30, 2016,2019, we had $208,812$234,133 in invested pension plan assets. Investment losses may result in decreases to our pension plan assets.
Funding estimates are based on certain assumptions, including discount rates, interest rates, mortality, fair value of assets and expected return on plan assets and are subject to changes in government regulations in the countries in which our employees work. Volatility in the financial markets may impact future discount and interest rate assumptions. Significant changes in investment performance or a change in the portfolio mix of invested assets can result in increases or decreases in the valuation of plan assets or in a change of the expected rate of return on plan assets. Also, new accounting standards on fair value measurement may impact the calculation of future funding levels. We periodically review our assumptions, and any such revision can significantly change the present value of future benefits, and in turn, the funded status of our pension plans and the
resulting periodic pension expense. Changes in our pension benefit obligations and the related net periodic costs or credits may occur as a result of variances of actual results from our assumptions, and we may be required to make additional cash contributions in the future beyond those which have been estimated.
In addition, our existing revolving credit facility and note purchase agreements contain continuing covenants and events of default regarding our pension plans, including provisions regarding the unfunded liabilities related to those pension plans. See the discussion above concerning “Our debt obligations and the restrictive covenants in the agreements governing our debt could limit our ability to operate our business or pursue our business strategies, and could adversely affect our business, financial condition, results of operations, and cash flows.”
To the extent that the present values of benefits incurred for pension obligations are greater than values of the assets supporting those obligations or if we are required to make additional or unexpected contributions to our pension plans for any reason, our ability to comply with the terms of our outstanding debt arrangements, and our business, financial condition, results of operations, and cash flows may be adversely affected.
Our business operations may be adversely affected by information systems interruptions or intrusion.
We are dependent on various information systems throughout our company and third parties to administer, store and support multiple business activities. Furthermore, we may have access to sensitive, confidential or otherwise protected information that may be subject to privacy and security laws and controls. If these systems are damaged, cease to function properly or are subject to cybersecurity attacks, such as unauthorized access, malicious software and other violations, we could experience production downtimes, operational delays, other detrimental impacts on our operations or ability to provide products and services to our customers, the compromising of confidential or otherwise protected information, destruction or corruption of data, security breaches, other manipulation or improper use of our systems or networks, financial losses from remedial actions, loss of business or potential liability, and/or damage to our reputation, any of which could have a material adverse effect on our business, financial condition, results of operations, and cash flows.
Cyber-based risks, in particular, are evolving and include, but are not limited to, both attacks on our information technology (“IT”) infrastructure and attacks on the IT infrastructure of third parties (both on premises and in the cloud) attempting to gain unauthorized access to our confidential or other proprietary information, classified information, or information relating to our employees, customers and other third parties. The threats we face vary from attacks common to most industries to more advanced and persistent, highly organized adversaries, including nation states, which target us and other defense contractors because we protect national security information. If we are unable to protect sensitive information, including complying with evolving data privacy regulations, our customers or governmental authorities could question the adequacy of our threat mitigation and detection processes and procedures, and depending on the severity of the incident, our customers’ data, our employees’ data, our intellectual property, and other third party data (such as subcontractors, suppliers and vendors) could be compromised. As a consequence of their persistence, sophistication and volume, we may not be successful in defending against all such attacks. Due to the evolving nature of these security threats and the national security aspects of much of the data we protect, the impact of any future incident cannot be predicted. While we attempt to mitigate these risks by employing a number of measures, including technical security controls, employee training, comprehensive monitoring of our networks and systems, and maintenance of backup and protective systems, our systems, networks, products, solutions and services remain potentially vulnerable to additional known or unknown threats.
Industry Risks
Unforeseen events may occurOur financial statements are subject to changes in accounting standards that significantly reduce commercial aviation, which could adversely affectimpact our business,profitability or financial conditionposition.
Our financial statements are subject to the application of U.S. GAAP, which are periodically revised and/or expanded. Accordingly, from time to time, we are required to adopt new or revised accounting standards issued by recognized authoritative bodies, including the Financial Accounting Standards Board (“FASB”). Recently, the FASB revised the accounting standards related to revenue recognition and lease accounting. We adopted the new accounting standard related to revenue recognition on October 1, 2018 and adopted the new accounting standard related to lease accounting on October 1, 2019. The impact of accounting pronouncements that have been issued but not yet implemented is disclosed in our annual and quarterly reports on Form 10-K and Form 10-Q to the extent the impact is known. An assessment of proposed standards is not provided, as such proposals are subject to change through the exposure process and, therefore, their effects on our financial statements cannot be fully assessed at this time. It is possible that future accounting standards we are required to adopt could change the current accounting treatment that we apply to our consolidated financial statements and that such changes could have a material adverse effect on our reported results of operations.
A significant portionoperations and financial position. Additionally, any inability by the Company to timely and properly implement such changes could have a material adverse effect on our ability to timely file future financial statements upon adoption of, our business is related to commercial aviation. Global economic downturn and uncertainty in the marketplace typically lead to a general reduction in demand for air transportation services, leading some airlines to withdraw aircraft from service, which negatively affects sales of our aerospace components and services. These economic conditions can similarly affect our sales of systems and components foraccordance with, such new business jet aircraft. The commercial airline industry tends to be cyclical and capital spending by airlines and aircraft manufacturers may be influenced by a variety of factors, including current and future traffic levels, aircraft fuel pricing, labor issues, competition, the retirement of older aircraft, regulatory changes, terrorism and related safety concerns, general economic conditions, worldwide airline profits and backlog levels. In the event these or other economic indicators stagnate or worsen, market demand for our components and systems could be negatively affected by renewed reductions in demand for air transportation services or commercial airlines’ financial difficulties,accounting standards, which could have a material adverse effect on our business and negatively affect our share price.
If we fail to maintain an effective system of internal controls over financial condition,reporting, we may not be able to accurately report our financial results, and current and potential stockholders may lose confidence in our financial reporting.
We are required by the United States Securities and Exchange Commission (“SEC”) to establish and maintain adequate internal controls over financial reporting that provide reasonable assurance regarding the reliability of operations,our financial reporting and cash flows.the preparation of financial statements in accordance with generally accepted accounting principles. We are likewise required, on a quarterly basis, to evaluate the effectiveness of our internal controls and to disclose any changes and material weaknesses in those internal controls.
The U.S. GovernmentIn Part I, Item 4 of our Form 10-Q filed with the SEC on August 12, 2019, we reported that a particular control deficiency constituted a material weakness in internal controls over financial reporting. We have implemented controls and processes to ensure the financial information included in this Form 10-K is complete and accurate, and in the quarter ended September 30, 2019, we remediated the control deficiency reported in our Form 10-Q filed with the SEC on August 12, 2019.
Although we believe these controls and processes have strengthened our internal controls over financial reporting and address the concern that gave rise to the material weakness reported in the Form 10-Q filed with the SEC on August 12, 2019, we cannot be certain that our revised internal control practices will ensure that we maintain adequate internal controls over our financial reporting in future periods. Any failure to maintain such internal controls could adversely impact our ability to report our financial results on a timely and accurate basis. If our financial statements are not accurate, investors may change acquisition priorities and/or reduce spending,not have a complete understanding of our operations. Likewise, if our financial statements are not filed on a timely basis as required by the SEC and NASDAQ, we could face severe consequences from those authorities. In either case, there could result a material adverse effect on our business. Inferior internal controls could also cause investors to lose confidence in our reported financial information, which could adversely affect our business, financial condition and results of operations.
The U.S. Government participates inhave a wide variety of operations, including homeland defense, counterinsurgency, counterterrorism, and other defense-related operations that employ our products and services. U.S. defense spending has historically been cyclical in nature, and defense budgets tend to rise when perceived threats to national security increasenegative effect on the level of concern over the country’s safety. The U.S. Government continues to adjust its funding priorities in response to changes in the perceived threat environment. In addition, defense spending currently faces pressures due to the overall economic and political environment, budget deficits, and competing budget priorities. A decrease in U.S. Government defense spending or changes in the spending allocation could result in one or moretrading price of our programs being reduced, delayed, or terminated. stock.
Increasing emission standards that drive certain product sales may be eased or delayed, which could reduce our competitive advantage.
We sell components and systems that have been designed to meet strict emission standards, including standards that have not yet been implemented but are expected to be implemented soon. If these emission standards are eased, developed products may become unnecessary and/or our future sales could be lower as potential customers select alternative products or delay adoption of our products, which would have a material adverse effect on our business, financial condition, results of operations, and cash flows.
Natural gas prices may increase significantly and disproportionately to other sources of fuels used for power generation, which could reduce our sales and adversely affect our business, financial condition and results of operations.
Commercial producers of electricity use many of our components and systems, most predominately in their power plants that use natural gas as their fuel source. Commercial producers of electricity are often in a position to manage the use of different power plant facilities and make decisions based on operating costs. Compared to other sources of fuels used for power generation, natural gas prices have increased slower than fuel oil, but about the same as coal. This increase in natural gas prices and any future increases, whether in absolute dollars or relative to other fuel costs such as oil, could impact the sales mix of our components and systems, which could have a material adverse effect on our business, financial condition, results of operations, and cash flows.
Long-term reduced commodity prices for oil, natural gas, and other minerals may depress the markets for certain of our products and services, particularly those from our Industrial segment.
Many of our Industrial segment OEM and aftermarket customers and our Aerospace segment rotorcraft product lines’ customers provide goods and services that support various industrial extraction activities, including mining, oil and gas exploration and extraction, and transportation of raw materials from extraction sites to refineries and/or processing facilities. Long-term lower prices for commodities such as oil, natural gas, gold, tin, and various other minerals could reduce exploration activities and place downward pressure on demand for Woodward’sour goods and services that support exploration and extraction activities.
Changes in government subsidy programs and regulatory requirements may result in decreased demand for our products.
The U.S. Government, as well as various foreign governments, provide for various stimulus programs or subsidies, such as grants, loan guarantees and tax incentives, relating to renewable energy, alternative energy, energy efficiency and electric power infrastructure. Some of these programs have expired, which may affect the economic feasibility or timing of future projects. Additionally, while a significant amount of stimulus funds and subsidies are available to support various projects, we cannot predict the timing and scope of any investments to be made by our customers under stimulus funding and subsidies or whether stimulus funding and subsidies will result in increased demand for our products. Investments for renewable energy, alternative energy and electric power infrastructure under stimulus programs and subsidies may not occur, may be less than anticipated or may be delayed, any of which would negatively impact demand for our products.
Other current and potential regulatory initiatives may not result in increased demand for our products. It is not certain whether existing regulatory requirements will create sufficient incentives for new projects, when or if proposed regulatory requirements will be enacted, or whether any potentially beneficial provisions will be included in the regulatory requirement.
Uncertainty with respect to government subsidy programs and regulatory requirements could cause decreased demand for our products as investments are delayed or become economically unfeasible, which could have a material adverse effect on our business, financial condition, results of operations, and cash flows.
technologies at a lower cost. If we are unable to develop competitive technologies, future sales or earnings could be lower than expected, which could have a material adverse effect on our business, financial condition, results of operations,Our stock price may fluctuate and cash flows.
Industry consolidation trends could reduce our sales opportunities, decrease sales prices, and drive down demand for our products.
There has been consolidation and there may be further consolidation in the aerospace, power, and process industries. The consolidation in these industries has resulted in customers with vertically integrated operations, including increased in-sourcing capabilities, which may result in economies of scale for those companies. If our customers continue to seek to control more aspects of vertically integrated projects, cost pressures resulting in further integration or industry consolidation could reduce our sales opportunities, decrease sales prices, and drive down demand for our products, which could have a material adverse effect on our business, financial condition, results of operations, and cash flows.
Investment Risks
The historic market price of our common stock may not be indicative of future market prices.
The market price of our common stock has fluctuated over time. Stock markets in general have experienced extreme price and volume volatility particularly over the past few years. The trading price of our common stock ranged from a high of $63.98$119.20 per share to a low of $39.68$68.40 per share during the twelve months ended September 30, 2016.2019. The following factors, among others, could cause the price of our common stock in the public market to fluctuate significantly:
| ·
| | general economic conditions, particularly in the aerospace, power generation and process and transportation industries;
|
| ·
| | variations in our quarterly results of operation;
|
| ·
| | a change in sentiment in the market regarding our operations or business prospects;
|
| ·
| | the addition or departure of key personnel; and
|
| ·
| | announcements by us or our competitors of new business, acquisitions or joint ventures.
|
general economic conditions, particularly in the aerospace, power generation and process and transportation industries;
variations in our quarterly results of operation and whether or not we meet our guidance or the expectations of analysts and investors;
a change in sentiment in the market regarding our operations or business prospects or the prospects of our competitors and the markets in which we operate;
the addition or departure of key personnel; and
announcements by us or our competitors of new business, acquisitions or joint ventures.
Fluctuations in our stock price often occur without regard to specific operating performance. The price of our common stock could fluctuate based upon the above factors or other factors, including those that have little to do with our company, and these fluctuations could be material.
The typical daily trading volume of our common stock may affect an investor’s ability to sell significant stock holdings in the future without negatively affecting stock price.
As of September 30, 2016,2019, we had 72,960 shares of common stock issued, of which 11,37411,040 shares were held as treasury shares. In addition, stockholders who each own 5% or greater of our shares hold a total of approximately 20%22% of the outstanding shares of our common stock. During the fourth quarter of fiscal year 2016,2019, the average daily trading volume of our stock was approximately 221353 shares. While the level of trading activity will vary each day, our typical daily trading volume is relatively low and represents only a small percentage of total shares of stock outstanding. As a result, a stockholder who sells a significant number of shares of stock in a short period of time could negatively affect our share price.
Certain anti-takeover provisions of our charter documents and under Delaware law could discourage or prevent others from acquiring our company.
Our certificate of incorporation and bylaws contain provisions that:
| ·
| | provide for a classified board;
|
| ·
| | provide that directors may be removed only for cause by holders of at least two-thirds of the outstanding shares of common stock;
|
| ·
| | authorize our board of directors to fill vacant directorships or to increase or decrease the size of our board of directors;
|
| ·
| | permit us to issue, without stockholder approval, up to 10,000 shares of preferred stock, in one or more series and, with respect to each series, to fix the designation, powers, preferences and rights of the shares of the series;
|
| ·
| | require special meetings of stockholders to be called by holders of at least two-thirds of the outstanding shares of common stock;
|
| ·
| | prohibit stockholders from acting by written consent;
|
| ·
| | require advance notice for stockholder proposals and nominations for election to the board of directors to be acted upon at meetings of stockholders; and
|
| ·
| | require the affirmative vote of two-thirds of the outstanding shares of our common stock for amendments to our certificate of incorporation and certain business combinations, including mergers, consolidations, sales of all or substantially all of our assets or dissolution.
|
provide for a classified board;
provide that directors may be removed only for cause by holders of at least two-thirds of the outstanding shares of common stock;
authorize our board of directors to fill vacant directorships or to increase or decrease the size of our board of directors;
permit us to issue, without stockholder approval, up to 10,000 shares of preferred stock, in one or more series and, with respect to each series, to fix the designation, powers, preferences and rights of the shares of the series;
require special meetings of stockholders to be called by holders of at least two-thirds of the outstanding shares of common stock;
prohibit stockholders from acting by written consent;
require advance notice for stockholder proposals and nominations for election to the board of directors to be acted upon at meetings of stockholders; and
require the affirmative vote of two-thirds of the outstanding shares of our common stock for amendments to our certificate of incorporation and certain business combinations, including mergers, consolidations, sales of all or substantially all of our assets or dissolution.
In addition, Section 203 of the Delaware General Corporation Law limits business combinations with owners of more than 15% of our stock that have not been approved by the board of directors. These provisions and other similar provisions make it more difficult for a third party to acquire us without negotiation. Our board of directors could choose not to negotiate a
potential acquisition that it does not believe to be in our best interest. Accordingly, the potential acquirer could be discouraged from offering to acquire us, or could be prevented by the anti-takeover measures, from successfully completing a hostile acquisition.
Item 1B.
UnresolvedUnresolved Staff Comments
None.
Item 2.Properties2Properties
Our principal plants are as follows:
United States
Duarte, California – Aerospace segment manufacturing and engineering
Fort Collins, Colorado (two plants) – Corporate headquarters and Aerospace and Industrial segment manufacturing and engineering
Greenville, South Carolina (leased) –Industrial segment manufacturing and Aerospace and Industrial segments engineering
Loveland, Colorado –Industrial segment manufacturing and Aerospace and Industrial segments engineering
Niles, Illinois – Aerospace segment manufacturing and Aerospace and Industrial segments engineering
Rockford, Illinois (two plants) – Aerospace segment manufacturing and engineering
Santa Clarita, California – Aerospace segment manufacturing and engineering
Zeeland, Michigan – Aerospace segment manufacturing and engineering
Other Countries
Aken, Germany (leased) –Industrial segment manufacturing and engineering
Glatten, Germany – Industrial segment manufacturing
Kempen, Germany –Industrial– Industrial segment manufacturing and engineering
Krakow, Poland –Industrial– Industrial segment manufacturing and Aerospace and Industrial segments engineering
Stuttgart, Germany – (two plants; one leased) Industrial segment engineering
Tianjin, Peoples’ Republic of China (leased) –Industrial segment assembly
In addition to the principal plants listed above, we own or lease other facilities used primarily for sales, service activities, assembly, and/or engineering activities in Brazil, Bulgaria, China, India, Japan, the Netherlands, the Republic of Korea, Russia,Saudi Arabia, the United Kingdom, Germany, and the United States.
InDuring fiscal year 2016, we completed construction2019, the Company finalized the relocation of aits Duarte, California Aerospace segment manufacturing building for our Industrial segment and a corporate headquarters building on a second campusengineering operations to the Company’s newly renovated Drake Campus in Fort Collins, Colorado. This campusThere are currently no operations in the Duarte, California facility, and the sale of the plant and related property is intendedexpected to support the future growth of our Industrial segmentclose by supplementing our existing Colorado manufacturing facilities.March 31, 2020.
Our remaining principal plants are suitable and adequate for the manufacturing and other activities performed at those plants, and we believe our utilization levels are generally high.
Item 3.
LegalLegal Proceedings
Woodward is currently involved in claims, pending or threatened litigation or other legal proceedings, investigations and/or regulatory proceedings arising in the normal course of business, including, among others, those relating to product liability claims, employment matters, worker’s compensation claims, contractual disputes, product warranty claims and alleged violations of various laws and regulations. We accrueWoodward accrues for known individual matters using estimates of the most likely amount of loss where we believeit believes that it is probable the matter will result in a loss when ultimately resolved using estimates of the most likely amount of loss. and such loss is reasonably estimable.
While the outcome of pending claims, legal and regulatory proceedings, and investigations cannot be predicted with certainty, management believes that any liabilities that may result from these claims, proceedings and investigations will not have a material effect on Woodward's liquidity, financial condition, or results of operations.
Item 4.
Mine SafetySafety Disclosures
Not applicable.
PART II
Item 5.Market for Registrant's CommonRegistrant’s Common Equity, Related Stockholder Matters and Issuer Purchases of Equity Securities
Our common stock is listed on The NASDAQ Global Select Market and is traded under the symbol “WWD.” At November 10, 2016,22, 2019, there were approximately 1,000900 holders of record.
The following table sets forth the high and low sales prices of our common stock and dividends paid for the periods indicated.
| | | | | | | | | | | | | | | | | |
| | | | | | | | | | | | | | | | | |
| Fiscal Year Ended September 30, |
| 2016 | | 2015 |
| High | | Low | | Cash Dividends | | High | | Low | | Cash Dividends |
First quarter | $ | 51.34 | | $ | 39.68 | | $ | 0.10 | | $ | 53.13 | | $ | 44.79 | | $ | 0.08 |
Second quarter | $ | 53.50 | | $ | 41.24 | | $ | 0.11 | | $ | 51.43 | | $ | 41.01 | | $ | 0.10 |
Third quarter | $ | 59.60 | | $ | 50.70 | | $ | 0.11 | | $ | 56.55 | | $ | 46.37 | | $ | 0.10 |
Fourth quarter | $ | 63.98 | | $ | 56.00 | | $ | 0.11 | | $ | 55.59 | | $ | 39.82 | | $ | 0.10 |
Performance Graph
The following graph compares the cumulative 10-year total return to stockholders on our common stock relative to the cumulative total returns of the S&P Midcap 400 index and the S&P Industrial MachineryIndustrials index. The graph shows total stockholder return assuming an investment of $100 (with reinvestment of all dividends) was made on September 30, 20062009 in our common stock and in each of the two indexes and tracks relative performance through September 30, 2016.2019. We have used a period of 10 years as we believe that our stock performance should be reviewed over a period that is reflective of our long-term business cycle.
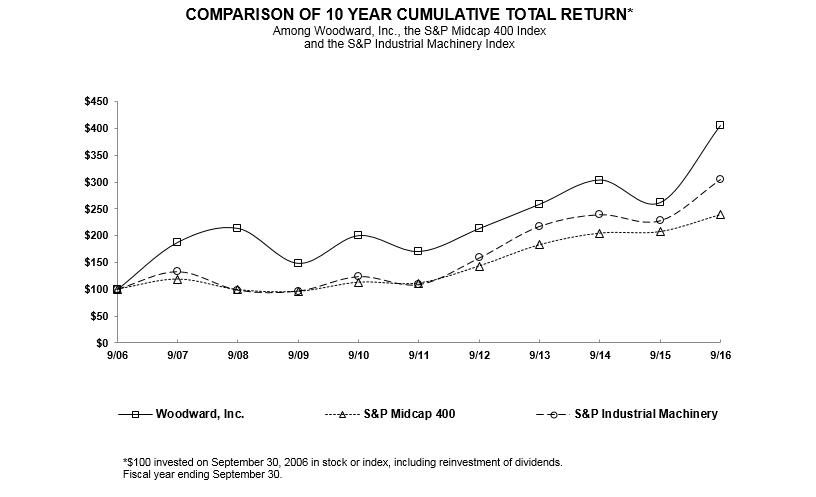
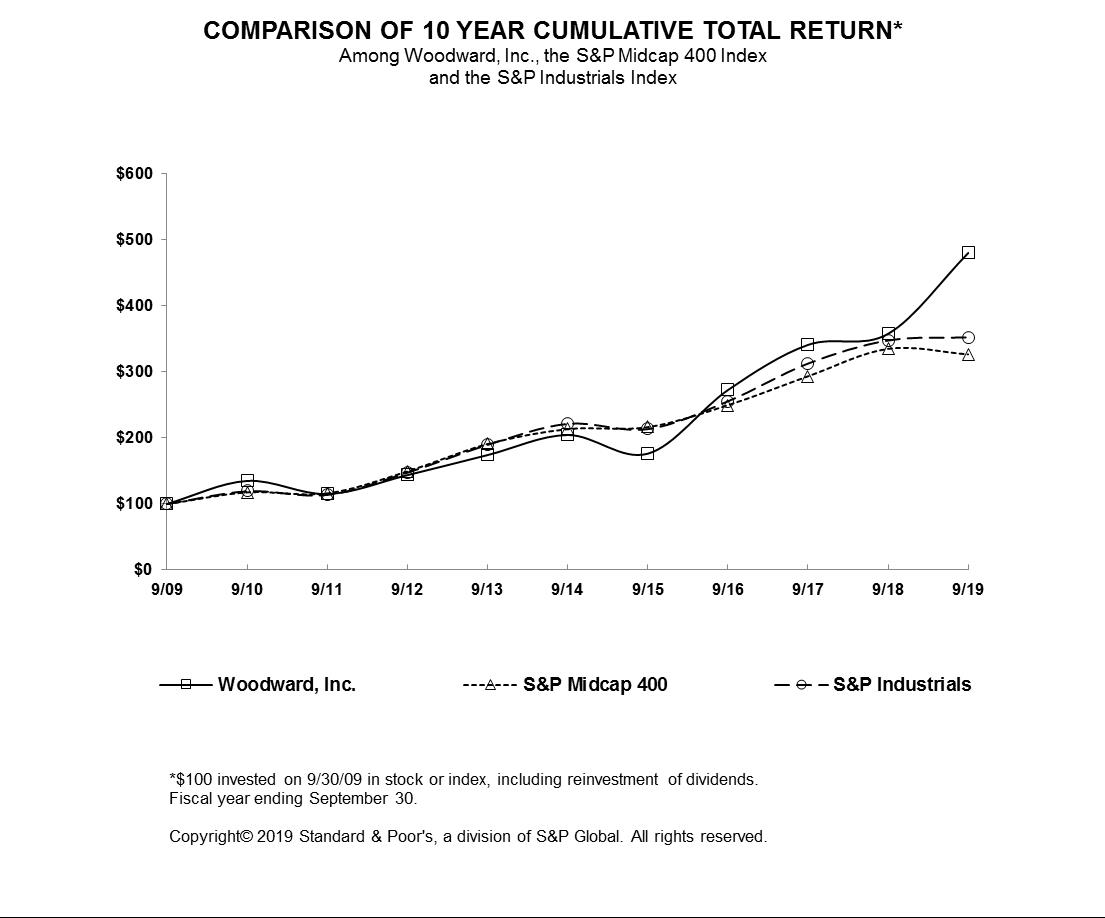
| | | | | | | | | | | | | | | | | | | | | | |
|
|
|
|
|
|
|
|
|
|
|
|
|
|
|
|
|
|
|
|
|
|
| | | | | | | | | | | | | | | | | | | | | | |
|
|
|
|
|
|
|
|
|
|
|
|
|
|
|
|
|
|
|
|
|
|
| | 9/06 | | 9/07 | | 9/08 | | 9/09 | | 9/10 | | 9/11 | | 9/12 | | 9/13 | | 9/14 | | 9/15 | | 9/16 |
| 9/09 |
| 9/10 |
| 9/11 |
| 9/12 |
| 9/13 |
| 9/14 |
| 9/15 |
| 9/16 |
| 9/17 |
| 9/18 |
| 9/19 |
Woodward, Inc. | $ | 100.00 | $ | 187.76 | $ | 213.44 | $ | 148.49 | $ | 200.20 | $ | 170.58 | $ | 213.20 | $ | 258.37 | $ | 303.52 | $ | 261.42 | $ | 404.68 | $ | 100.00 | $ | 134.82 | $ | 114.88 | $ | 143.57 | $ | 173.99 | $ | 204.40 | $ | 176.05 | $ | 272.53 | $ | 340.99 | $ | 357.83 | $ | 480.26 |
S&P Midcap 400 | | 100.00 | | 118.76 | | 98.95 | | 95.87 | | 112.92 | | 111.47 | | 143.29 | | 182.95 | | 204.56 | | 207.42 | | 239.21 |
| 100.00 |
| 117.78 |
| 116.27 |
| 149.46 |
| 190.83 |
| 213.37 |
| 216.35 |
| 249.52 |
| 293.22 |
| 334.88 |
| 326.54 |
S&P Industrial Machinery | | 100.00 | | 132.90 | | 98.09 | | 96.62 | | 123.65 | | 108.58 | | 158.47 | | 217.68 | | 239.49 | | 228.12 | | 305.38 | |
S&P Industrials | |
| 100.00 |
| 119.44 |
| 113.95 |
| 147.68 |
| 189.77 |
| 221.62 |
| 213.53 |
| 255.68 |
| 312.83 |
| 347.81 |
| 352.64 |
The stock price performance included in this graph is not necessarily indicative of future stock price performance.performance
Sales of Unregistered Securities
None.
| | | | | | | | | | |
| | | | | | | | | | |
Issuer Purchases of Equity Securities
(In thousands, except for shares and per share amounts) | | Total Number of Shares Purchased | | Weighted Average Price Paid Per Share | | Total Number of Shares Purchased as Part of Publicly Announced Plans or Programs (1) | | Maximum Number (or Approximate Dollar Value) of Shares that may yet be Purchased under the Plans or Programs at Period End (1) |
July 1, 2016 through July 31, 2016 (2) | | 342 | | $ | 58.54 | | - | | $ | 50,000 |
August 1, 2016 through August 31, 2016 (2) | | 274 | | | 62.72 | | - | | | 50,000 |
September 1, 2016 through September 30, 2016 | | - | | | - | | - | | | 50,000 |
|
|
|
|
|
|
|
|
|
|
|
|
|
|
|
|
|
|
|
|
|
|
Issuer Purchases of Equity Securities
(In thousands, except for shares and per share amounts) |
| Total Number of Shares Purchased |
| Weighted Average Price Paid Per Share |
| Total Number of Shares Purchased as Part of Publicly Announced Plans or Programs (1) |
| Maximum Number (or Approximate Dollar Value) of Shares that may yet be Purchased under the Plans or Programs at Period End (1) |
July 1, 2019 through July 31, 2019 |
| - |
| $ | - |
| - |
| $ | 318,492 |
August 1, 2019 through August 31, 2019 (2) |
| 2,318 |
|
| 107.85 |
| - |
|
| 318,492 |
September 1, 2019 through September 30, 2019 (2) |
| 316 |
|
| 108 |
| - |
|
| 318,492 |
| (1)
|
|
|
| (1) |
| In the second quarterNovember 2016, our board of fiscal year 2015, our Board of Directors authorizeddirectors approved a stock repurchase program for the repurchase of up to $300,000$500,000 of ourWoodward’s outstanding shares of common stock on the open market or in privately negotiated transactions over a three-yearthree year period that ended in November 2019. Upon expiration of that program, the board of directors approved a new stock repurchase program for the repurchase of up to $500,000 of Woodward’s outstanding shares of common stock on the open market or in privately negotiated transactions over a three year period that will end in 2018. November 2022. |
| (2)
|
|
|
| (2) |
| Under a trust established for the purposes of administering the Woodward Executive Benefit Plan, 3422,318 shares of common stock were acquired in July 2016August 2019 on the open market related to the deferral of compensation by certain eligible members of Woodward’s management who irrevocably elected to invest some or all of their deferred compensation in Woodward common stock. In addition, 274316 shares of common stock were acquired in September 2019 on the open market related to the reinvestment of dividends for shares of treasury stock held for deferred compensation in August 2016.compensation. Shares owned by the trust, which is a separate legal entity, are included in "Treasury stock held for deferred compensation" in the Consolidated Balance SheetsSheets. |
Item 6.Selected FinancialFinancial Data
The following selected financial data should be read in conjunction with the Consolidated Financial Statements and related notes which appear in “Item 8 – Financial Statements and Supplementary Data” of this Form 10-K.
| | | | | | | | | | |
|
|
|
|
|
|
|
|
|
|
| | | | | | | | | | |
|
|
|
|
|
|
|
|
|
|
| Year Ended September 30, | Year Ended September 30, |
| 2016 | | 2015 | | 2014 | | 2013 | | 2012 | 2019 |
| 2018 |
| 2017 |
| 2016 |
| 2015 |
| (In thousands except per share amounts) | (In thousands except per share amounts) |
Net sales (1)(2) | $ | 2,023,078 | | $ | 2,038,303 | | $ | 2,001,240 | | $ | 1,935,976 | | $ | 1,865,627 | $ | 2,900,197 |
| $ | 2,325,873 |
| $ | 2,098,685 |
| $ | 2,023,078 |
| $ | 2,038,303 |
Net earnings (4)(7) | | 180,838 | | 181,452 | | 165,844 | | 145,942 | | 141,589 |
| 259,602 |
| 180,378 |
| 200,507 |
| 180,838 |
| 181,452 |
Earnings per share: | | | | | | | | | | |
|
|
|
|
|
|
|
|
|
|
Basic earnings per share | | 2.92 | | 2.81 | | 2.50 | | 2.13 | | 2.06 |
| 4.19 |
| 2.93 |
| 3.27 |
| 2.92 |
| 2.81 |
Diluted earnings per share | | 2.85 | | 2.75 | | 2.45 | | 2.10 | | 2.01 |
| 4.02 |
| 2.82 |
| 3.16 |
| 2.85 |
| 2.75 |
Cash dividends per share | | 0.43 | | 0.38 | | 0.32 | | 0.32 | | 0.31 |
| 0.630 |
| 0.553 |
| 0.485 |
| 0.430 |
| 0.380 |
Income taxes (4)(7) | | 45,648 | | 59,497 | | 61,400 | | 53,629 | | 56,218 |
| 61,010 |
| 39,200 |
| 52,240 |
| 45,648 |
| 59,497 |
Interest expense | | 26,776 | | 24,864 | | 22,804 | | 26,703 | | 26,003 |
| 44,001 |
| 40,465 |
| 35,639 |
| 26,776 |
| 24,864 |
Interest income | | 2,025 | | 787 | | 271 | | 273 | | 542 |
| 1,413 |
| 1,674 |
| 1,725 |
| 2,025 |
| 787 |
Depreciation expense | | 41,550 | | 45,994 | | 43,773 | | 37,254 | | 35,808 |
| 85,982 |
| 71,389 |
| 55,140 |
| 41,550 |
| 45,994 |
Amortization expense | | 27,486 | | 29,241 | | 33,580 | | 36,979 | | 32,809 |
| 56,022 |
| 44,742 |
| 25,777 |
| 27,486 |
| 29,241 |
Capital expenditures | | 175,692 | | 286,612 | | 207,106 | | 141,600 | | 64,900 |
| 99,066 |
| 127,140 |
| 92,336 |
| 175,692 |
| 286,612 |
Weighted-average shares outstanding: | | | | | | | | | | |
|
|
|
|
|
|
|
|
|
|
Basic shares outstanding | | 61,893 | | 64,684 | | 66,432 | | 68,392 | | 68,880 |
| 61,950 |
| 61,493 |
| 61,366 |
| 61,893 |
| 64,684 |
Diluted shares outstanding | | 63,556 | | 66,056 | | 67,776 | | 69,602 | | 70,307 |
| 64,498 |
|
| 63,876 |
| 63,512 |
| 63,556 |
| 66,056 |
|
|
|
|
|
|
|
|
|
|
|
|
|
|
|
| At September 30, |
| 2019 |
| 2018 |
| 2017 |
| 2016 |
| 2015 |
| (Dollars in thousands) |
Working capital | $ | 563,792 |
| $ | 523,619 |
| $ | 593,955 |
| $ | 463,811 |
| $ | 579,211 |
Total assets |
| 3,956,526 |
|
| 3,790,649 |
|
| 2,757,109 |
|
| 2,642,362 |
|
| 2,512,404 |
Long-term debt, less current portion (9) |
| 864,899 |
|
| 1,092,397 |
|
| 580,286 |
|
| 577,153 |
|
| 848,488 |
Total debt (9) |
| 1,084,899 |
|
| 1,246,032 |
|
| 612,886 |
|
| 727,153 |
|
| 850,918 |
Total liabilities (10) |
| 2,229,785 |
|
| 2,252,545 |
|
| 1,385,726 |
|
| 1,429,767 |
|
| 1,359,300 |
Stockholders’ equity |
| 1,726,741 |
|
| 1,538,104 |
|
| 1,371,383 |
|
| 1,212,595 |
|
| 1,153,104 |
Full-time worker members |
| 9,023 |
|
| 8,277 |
|
| 6,829 |
|
| 6,852 |
|
| 6,955 |
26Notes:
1.Woodward adopted Accounting Standards Update (“ASU”) 2014-09, Revenue from Contracts with Customers, and all subsequently issued supplemental and/or clarifying ASUs related to ASU 2014-09 (collectively “ASC 606”) on October 1, 2018 and elected the modified retrospective transition method. The results for periods prior to fiscal year 2019 were not adjusted for the new standard and the cumulative effect of the change in accounting of $38,745 was recognized as a net increase to retained earnings at the date of adoption.
2.On June 1, 2018, Woodward and its wholly-owned subsidiary, Woodward Aken GmbH acquired from Rolls-Royce PLC all of the outstanding shares of stock of L’Orange GmbH, together with its wholly-owned subsidiaries in China and Germany, as well as all of the outstanding equity interests of its affiliate, Fluid Mechanics LLC, and their related operations (collectively, “L’Orange” and subsequent to acquisition, "Woodward L'Orange"). As Woodward L'Orange was acquired during the third quarter of fiscal year 2018, net sales for fiscal year 2019 included sales of $332,009 from Woodward L'Orange and net sales for fiscal year 2018 included $102,905 of sales from Woodward L'Orange during the period June 1, 2018 through September 30, 2018.
3.In fiscal year 2018, Woodward recorded restructuring charges, net of tax, totaling $12,674, the majority of which relate to the Company’s decision to relocate its Duarte, California operations to the Company’s newly renovated Drake Campus in Fort Collins, Colorado.The remaining restructuring charges recognized during the second quarter of fiscal year 2018 consist of workforce management costs related to aligning the Company’s industrial turbomachinery business with current market conditions.
4.In fiscal year 2019, Woodward recorded total charges, net of tax, of $44,286 related to (i) move costs associated with the relocation of our Duarte, California operations to the Company’s newly renovated Drake Campus in Fort Collins, Colorado ("Duarte move related costs"), (ii) the purchase accounting impacts related to the amortization of the Woodward L'Orange backlog intangible, and (iii) charges associated with the impairment of accounts receivable, inventory and certain other assets in connection with the insolvency of Senvion, a significant customer of the Company's renewables business.
| | | | | | | | | | | | | | |
| | | | | | | | | | | | | | |
| At September 30, |
| 2016 | | 2015 | | 2014 | | 2013 | | 2012 |
| (Dollars in thousands) |
Working capital (5) | $ | 463,811 | | $ | 579,211 | | $ | 627,981 | | $ | 498,757 | | $ | 583,607 |
Total assets (5) | | 2,642,362 | | | 2,512,404 | | | 2,358,603 | | | 2,171,539 | | | 1,815,758 |
Long-term debt, less current portion (5) | | 577,153 | | | 848,488 | | | 708,110 | | | 449,152 | | | 382,969 |
Total debt (5) | | 727,153 | | | 850,918 | | | 708,110 | | | 549,152 | | | 390,798 |
Total liabilities (5)(6) | | 1,429,767 | | | 1,359,300 | | | 1,197,659 | | | 1,028,994 | | | 807,643 |
Stockholders’ equity | | 1,212,595 | | | 1,153,104 | | | 1,160,944 | | | 1,142,545 | | | 1,008,115 |
Full-time worker members | | 6,852 | | | 6,955 | | | 6,701 | | | 6,736 | | | 6,650 |
5.In fiscal year 2018, Woodward recorded total charges, net of tax, of $42,018 related to (i) Duarte move related costs (ii) the purchase accounting impacts recognized in cost of goods sold related to the revaluation of the Woodward L’Orange inventory and the amortization of the backlog intangible, (iii) the transaction and integration costs associated with the acquisition of Woodward L'Orange, (iv) cost associated with an at-the-money-forward option, (v) warranty and indemnity insurance costs associated with the acquisition of Woodward L’Orange, and (vi) German real estate transfer tax costs associated with the acquisition of Woodward L’Orange.
Notes:6.In fiscal year 2016, Woodward recorded special charges, net of tax, totaling approximately $10,478 related to its efforts to consolidate facilities, reduce costs and address current market conditions.
| 1.
| | On December 28, 2012, Woodward acquired from GE Aviation Systems LLC (the “Seller”) substantially all of the assets and certain liabilities of the Seller's thrust reverser actuation systems business located in Duarte, California (the “Duarte Business”).
|
| 2.
| | In the first quarter of fiscal year 2016, Woodward recorded special charges totaling approximately $16,100 related to its efforts to consolidate facilities, reduce costs and address current market conditions.
|
| 3.
| | In the third quarter of fiscal year 2013, Woodward recorded a specific charge of $15,707 related to the alignment of its renewable power business to the economic environment and then foreseeable future.
|
| 4.
| | In fiscal year 2016, Woodward recognized a tax benefit of $6,500, or $0.10 per basic and diluted share, related to the retroactive impact of the permanent reinstatement of the U.S. research and experimentation credit (“R&E Credit”) pertaining to fiscal year 2015. In fiscal year 2015, Woodward recognized a tax benefit of $5,818, or $0.09 per basic and diluted share, related to the retroactive impact of the reinstatement of the R&E Credit pertaining to fiscal year 2014. In fiscal year 2013, Woodward recognized a tax benefit of $4,911, or $0.07 per basic and diluted share, related to the retroactive impact of the reinstatement of the R&E Credit pertaining to fiscal year 2012.
|
| 5.
| | In fiscal year 2016, Woodward adopted the following Financial Accounting Standards Board’s (“FASB”) Accounting Standards Updates (“ASU”): ASU 2015-17, “Balance Sheet Classification of Deferred Taxes,” ASU 2015-03, “Simplifying the Presentation of Debt Issuance Costs,” and ASU 2015-15, “Presentation and Subsequent Measurement of Debt Issuance Costs Associated with Line-of-Credit Arrangements.” Retrospective adoption was required for these ASUs and therefore fiscal years 2015, 2014, 2013 and 2012 have been restated to reflect the adoption of these ASUs. See Note 2, New accounting standards in the Notes to the Consolidated Financial Statements in “Item8 – Financial Statements and Supplementary Data” for more information about these ASUs.
|
| 6.
| | 7.In fiscal year 2019, Woodward recognized a tax expense of $10,588, or $0.17 per basic and diluted share, related to final regulations issued by the Internal Revenue Service that modified the one-time repatriation tax on deferred foreign income computation required by the change in U.S. tax regulation in December 2017. In fiscal year 2018, Woodward recognized a tax expense of $10,860, or $0.18 and $0.17 per basic and diluted share, respectively, related to the transition impacts of the change in U.S. tax legislation in December 2017. In fiscal year 2016, Woodward recognized a tax benefit of $6,500, or $0.10 per basic and diluted share, related to the retroactive impact of the permanent reinstatement of the U.S. research and experimentation credit (“R&E Credit”) pertaining to fiscal year 2015. In fiscal year 2015, Woodward recognized a tax benefit of $5,818, or $0.09 per basic and diluted share, related to the retroactive impact of the reinstatement of the R&E Credit pertaining to fiscal year 2014. 8.Interest expense for fiscal years 2018 and 2017 includes an increase of $8,695 and $8,209, respectively, due to the impact of retrospectively applying Accounting Standards Update ("ASU") 2017-07, “Compensation – Retirement Benefits (Topic 715): Improving the Presentation of Net Periodic Pension Cost and Net Periodic Postretirement Benefit Cost." The interest cost component of net periodic benefit costs included in interest expense for fiscal year 2019 was $9,444. 9.In addition to the use of cash on hand, to finance the acquisition of L’Orange, in May 2018 Woodwardissued an aggregate principal amount of $400,000 of senior unsecured notes in a series of private placement transactions and borrowed $167,420 under its existing revolving credit agreement. 10.On January 4, 2016, Woodward and General Electric Company (“GE”), acting through its GE Aviation business unit, consummated the formation of a strategic joint venture between Woodward and GE (the “JV”). Woodward determined that the JV formation was not the culmination of an earnings event because Woodward has significant performance obligations to support the future operations of the JV. Therefore, Woodward recorded the $250,000 consideration received from GE for its purchase of a 50% equity interest in the JV as deferred income. The $250,000 deferred income will be recognized as an increase to net sales in proportion to revenue realized on sales of applicable fuel systems within the scope of the JV in a particular period as a percentage of total revenue expected to be realized by Woodward over the estimated remaining lives of the underlying commercial aircraft engine programs assigned to the JV. As of September 30, 2016, accrued liabilities include $6,552 and other liabilities include $238,187 of unamortized deferred income realized upon the JV formation.
|
Item 7.Management's Discussion and Analysis of Financial Condition and Results of Operations
OVERVIEW
Woodward enhances the global quality of life and sustainability by optimizing energy use through improved efficiency and lower emissions. We are an independent designer, manufacturer, and service provider of energy control and optimization solutions. We design, produce and service reliable, efficient, low-emission, and high-performance energy control products for diverse applications in challenging environments. We have production and assembly facilities in the United States, Europe, Asia and South America, and promote our products and services through our worldwide locations.
Our strategic focus is providing control solutions for the aerospace, industrial and energy markets. The precise and efficient control of energy, including fluid and electrical energy, combustion, and motion, is a growing requirement in the markets we serve. Our customers look to us to optimize the efficiency, emissions and operation of power equipment in both commercial and defense operations. Our core technologies can be leveraged well across our markets and customer applications, enabling us to develop and integrate cost-effective and state-of-the-art fuel, combustion, fluid, actuation and electronic systems. We focus primarily on serving OEMs and equipment packagers, partnering with them to bring superior component and system solutions to their demanding applications. We also provide aftermarket repair, replacement and other service support for our installed products.
Our components and integrated systems optimize performance of commercial aircraft, defense aircraft, ground vehicles and other equipment, gas and steam turbines, wind turbines, including converters and power grid related equipment, industrial diesel, gas, alternative and dual fuel reciprocating engines, and electrical power systems. Our innovative fluid energy,
combustion control, electrical energy, and motion control systems help our customers offer more cost-effective, cleaner, and more reliable equipment.
Management’s discussion and analysis should be read together with the Consolidated Financial Statements and Notes included in this report. Dollar and number of share amounts contained in this discussion and elsewhere in this Annual Report on Form 10-K are in thousands, except per share amounts.
BUSINESS ENVIRONMENT AND TRENDS
We serve the aerospace, industrial and energy markets.
Aerospace Markets
Our aerospace products and systems are primarily used to provide propulsion, actuation and motion control in both commercial and defense fixed-wing aircraft and rotorcraft, as well as in other defense systems.
Commercial and Civil Aircraft – In the commercial aerospace markets, global air traffic continued to grow in fiscal year 2016. Commercial aircraft production has increased with the introduction of new aircraft models and as aircraft operators continue to take delivery of more fuel efficient aircraft and retire older and less efficient aircraft. This trend toward more fuel efficient aircraft favors our product offerings because we have more content on the newer generation of aircraft that have recently entered service or are scheduled to go into production over the next several years. Business and General Aviation market demand – including business jets, turboprops and helicopters – declined in 2016 as a result of global economic conditions and continuing low oil prices.
We have been awarded content on the Airbus A320neo and A330neo, Bell 429, Boeing 737 MAX, 787, 747-8 and 777X, Bombardier CSeries, Comac C919, Irkut MS-21 and a variety of business jet platforms, among others. We continue to explore opportunities on new engine and aircraft programs that are under consideration or have been recently announced.
Defense – The defense industry continues under the minimal-growth regime of the Budget Control Act of 2011 and related procurement reductions and delays. Our involvement with a wide variety of defense programs in fixed-wing aircraft, rotorcraft and weapons systems has provided relative stability for our defense market sales, as some newer programs increase (e.g. F-35 Lightning II and KC-46A Tanker) while some legacy programs are reduced (e.g. F/A-18 E/F Super Hornet and V-22 Osprey). Others are relatively steady (e.g. UH-60 Black Hawk and A-64 Apache helicopter programs). We have significant motion control system content for the refueling boom on the KC-46A, which enters low rate production in 2017. Weapons programs for which we have significant sales include the Joint Direct Attack Munition (“JDAM”), Small Diameter Bomb (“SDB”) and AIM-9X guided tactical weapon systems.
Aftermarket – U.S. government sustainment funds continue to be prioritized to defense aircraft platforms on which we have content, among others. Accordingly, our defense aftermarket has shown improvement in fiscal year 2016, but we expect it to be variable in future periods, as it has been in the past. Variability is generally attributable to the cycling of various upgrade programs, as well as actual usage. Our commercial aftermarket business has increased as our products have been selected for new aerospace platforms and our content has increased across existing platforms. We have experienced the strongest gains in commercial aftermarket related to programs like Airbus A320 and Boeing 777. While some legacy programs have been negatively impacted by the availability of surplus hardware from aircraft retirements (and subsequent disassembly for parts re-use), combined with increasingly tight budget control by airline maintenance departments, we saw moderate growth in fiscal year 2016.
Industrial Markets
Our industrial and energy products are used worldwide in various types of turbine- and reciprocating engine-powered equipment, including electric power generation and distribution systems, ships, locomotives, compressors, pumps, and other mobile and industrial machines.
Industrial Turbines – The turbine market for new capacity, which consists mainly of heavy frames, aero derivatives and steam, was down in fiscal year 2016 compared to fiscal year 2015. Demand continues for turbine aftermarket products and services driven by maintenance and performance requirements. Start reliability, fuel flexibility, and part-load efficiency are all key drivers of the turbine market as the conversion from coal to gas usage continues, and we believe Woodward is well positioned to meet these market needs on the next generation turbines. Though the increasing demand for energy supports long-term growth for turbines, we expect market softness to continue in fiscal year 2017 due to global economic industrial weakness and low oil and gas prices. However, customer share gains and increased scope on the latest generation turbines, as well as continued demand for aftermarket products and services, are anticipated to lessen the impact of market softness in fiscal year 2017.
Reciprocating Engines – Woodward’s key markets for engine control technologies are power generation, natural gas fueled trucks and buses in China, mining, construction, oil and gas, and shipping industries. Most of these markets remained soft or depressed in 2016 due to global economic weakness and low oil and gas prices. In China, government incentives,
natural gas supplies, and other factors have reduced the demand for natural gas-fueled trucks and buses in China and other key markets, which also reduced demand for our control systems used in these applications. We expect customer share gains and increased scope on the latest generation reciprocating engines, as well as continued demand for aftermarket products and services, to have a favorable impact on Woodward in fiscal year 2017. Government emissions requirements across many regions and new engine applications are driving demand for more sophisticated control systems, as is customer demand for improved engine efficiencies and increased reliability. Energy policies in some countries encourage the use of natural gas and other alternative fuels over carbon-rich petroleum fuels, which we expect will drive increased demand for our alternative fuel clean engine control technologies.
Renewable Power – The renewable power industry connected a record 63 gigawatts (“GW”) to the grid in calendar year 2015. This is expected to decelerate in calendar year 2016 to 52.8 GW and grow at a much more modest and stable pace through the next decade. Uncertainty regarding government renewable mandates is subsiding, thereby reducing market volatility in the renewable power industry. In many regions of the world, such as Brazil and India, new renewable generation will be limited by grid connectivity constraints. The updated German Renewable Energy Sources Act (Erneuerbare Energien Gesetz – EEG) is moving away from a feed-in-tariff scheme, to a more sustainable “corridor targets scheme” (2500 MW annually for onshore wind). Currently, capital investment and operating costs for onshore wind continue to substantially decline, driving the levelized cost of energy (“LCOE”) toward parity with most fossil fuel energy sources. In the medium to longer term, we anticipate this trend to continue in the onshore market and emerge in the offshore wind market. The trend for larger turbines (+3 MW onshore and +6 MW offshore) will continue to transform OEM product portfolios and fuel industry consolidation, as weaker companies will not be able to invest rapidly enough to maintain pace with the larger competitors, further reducing the LCOE. Looking forward, we anticipate that integration of renewable energy sources into the grid and increased global energy demand will drive new opportunities for our advanced control and protection solutions.
RESULTS OF OPERATIONS
Joint Venture
On January 4, 2016, Woodward and General Electric Company (“GE”), acting through its GE Aviation business unit, consummated the formation of a strategic joint venture between Woodward and GE. The JV designs, develops and sources the fuel system for specified existing and all future GE commercial aircraft engines that produce thrust in excess of fifty thousand pounds.
As part of the JV formation, Woodward contributed to the JV certain contractual rights and intellectual property applicable to the existing GE commercial aircraft engine programs within the scope of the JV. Woodward has no initial cost basis in the JV because Woodward had no cost basis in the contractual rights and intellectual property contributed to the JV. GE purchased from Woodward a 50% ownership interest in the JV for a $250,000 cash payment to Woodward. In addition, GE will pay contingent consideration to Woodward consisting of fifteen annual payments of approximately $4,894 each year beginning January 4, 2017 subject to certain claw-back conditions. Neither Woodward nor GE contributed any tangible assets to the JV.
Woodward determined that the JV formation was not the culmination of an earnings event because Woodward has significant performance obligations to support the future operations of the JV. Therefore, Woodward recorded the $250,000 consideration received from GE for its purchase of a 50% equity interest in the JV as deferred income. The $250,000 deferred income will be recognized as an increase to net sales in proportion to revenue realized on sales of applicable fuel systems within the scope of the JV in a particular period as a percentage of total revenue expected to be realized by Woodward over the estimated remaining lives of the underlying commercial aircraft engine programs assigned to the JV. Total liabilities include $238,905 as of September 30, 2019, $242,387 as of September 30, 2018, $243,347 as of September 30, 2017, and $244,739 as of September 30, 2016 of unamortized deferred income realized related to the JV.
Item 7.Management’s Discussion and Analysis of Financial Condition and Results of Operations
OVERVIEW
Woodward enhances the global quality of life and GE jointly managesustainability by optimizing energy use through improved efficiency and lower emissions. We are an independent designer, manufacturer, and service provider of control solutions for the JV,aerospace and anyindustrial markets. We design, produce and service reliable, efficient, low-emission, and high-performance energy control products for diverse applications in challenging environments. We have production and assembly facilities in the United States, Europe and Asia, and promote our products and services through our worldwide locations.
Our strategic focus is providing energy control and optimization solutions for the aerospace and industrial markets. The precise and efficient control of energy, including motion, fluid, combustion and electrical energy, is a growing requirement in the markets we serve. Our customers look to us to optimize the efficiency, emissions and operation of power equipment in both commercial and defense operations. Our core technologies leverage well across our markets and customer applications, enabling us to develop and integrate cost-effective and state-of-the-art fuel, combustion, fluid, actuation and electronic systems. We focus primarily on serving OEMs and equipment packagers, partnering with them to bring superior component and system solutions to their demanding applications. We also provide aftermarket repair, maintenance, replacement and other service support for our installed products.
Our components and integrated systems optimize performance of commercial aircraft, defense aircraft, military ground vehicles and other equipment, gas and steam turbines, wind turbines, including converters and power grid related equipment, industrial diesel, gas, bio-diesel and dual-fuel reciprocating engines, and electrical power systems. Our innovative motion,
fluid, combustion and electrical energy control systems help our customers offer more cost-effective, cleaner, and more reliable equipment.
Management’s discussion and analysis should be read together with the Consolidated Financial Statements and Notes included in this report. Dollar and number of share amounts contained in this discussion and elsewhere in this Annual Report on Form 10-K are in thousands, except per share amounts.
L’Orange Acquisition
On April 8, 2018, we entered into a Share Purchase Agreement (the “L’Orange Agreement”) with MTU Friedrichshafen GmbH (“MTU”) and MTU America Inc. (together with MTU, the “Sellers”), both of which were subsidiaries of Rolls-Royce PLC (“Rolls-Royce”). Pursuant to the L’Orange Agreement, we agreed to acquire all of the outstanding shares of stock of L’Orange GmbH, together with its wholly-owned subsidiaries in China and Germany, as well as all of the outstanding equity interests of its affiliate, Fluid Mechanics LLC, and their related operations (collectively, “L’Orange”), for total consideration (including cash consideration and the assumption of certain liabilities) of €700,000, or approximately $811,000 (the “L’Orange Acquisition”). The L’Orange Acquisition closed on June 1, 2018 (the “Closing”) and L’Orange became a wholly-owned subsidiary of the Company. L’Orange has been renamed Woodward L’Orange.
Financial information for L’Orange is reflected in our financial statements from the date of the Closing. As a result of this acquisition, a comparison of results for fiscal year 2019 to fiscal years 2018 and 2017 may not be particularly meaningful. References to “organic” sales relate to net sales of Woodward businesses excluding those attributable to Woodward L’Orange.
BUSINESS ENVIRONMENT AND TRENDS
We serve the aerospace and industrial markets.
Aerospace Markets
Our aerospace products and systems are primarily used to provide propulsion, actuation and motion control in both commercial and defense fixed-wing aircraft, rotorcraft, guided weapons, and other defense systems.
Commercial and Civil Aircraft – In the commercial aerospace markets, global air traffic continued to grow in fiscal year 2019, though below the historically high levels of the recent years. Commercial aircraft production increased as aircraft operators take delivery of next generation aircraft models that are required to meet the growing demand for passenger air travel as well as meet the demand for more fuel efficient and lower emission aircraft. The trend toward the newer generation of aircraft that have recently entered service or are scheduled to go into production over the next several years favors our product offerings because we have more content on those more fuel efficient and lower emission aircraft. We expect production levels to remain strong due to solid order backlogs for the new aircraft models. The business and general aviation market demand improved in fiscal year 2019 as business jet deliveries were slightly up as a result of the introduction of some new models and reduced availability of used aircraft. Turboprop and helicopter deliveries weakened in fiscal year 2019. We expect business jet, turboprop and helicopter deliveries to improve slightly in fiscal year 2020 due to continued low levels of used inventory in the market and the introduction of a number of new aircraft.
We have content on the Airbus A320neo, A330neo, and A380, Bell 429, Boeing 737 MAX, 777, 787, 747-8 and Bombardier CSeries (now majority owned by Airbus and renamed the A220). We have been awarded content on the 777X, Comac C919, Irkut MS-21 and a variety of business jet platforms, among others. We continue to explore opportunities on new engine and aircraft programs that are under consideration or have been recently announced.
The grounding of the Boeing 737 MAX by the Federal Aviation Administration and other regulators, which started in March of 2019, has caused deliveries of that aircraft to be lower than expected in fiscal year 2019. The customer orders and demand for the aircraft has not changed significantly, and we therefore believe that when the aircraft returns to service, these missed deliveries will be fulfilled in future periods. In fiscal year 2019, the grounding had a slightly negative impact on OEM sales, but a more significant decisionsunfavorable impact on initial provisioning sales related to the 737 MAX aircraft and CFM LEAP engine. We estimate the aircraft’s return to service in the second quarter of fiscal year 2020 and we anticipate the recovery of the OEM and initial provisioning sales in the periods following the aircraft’s return to service.
Defense – The defense industry has been strengthening despite the minimal-growth regime of the Budget Control Act of 2011 and related procurement reductions and delays. Although its full impact is uncertain, the National Defense Authorization Act for Fiscal Year 2019, which was signed into law in August 2018, resulted in higher levels of funding for procurement and research and development, and we believe budget increases in recent years will support modest growth in fiscal year 2020. Our involvement with a wide variety of defense programs in fixed-wing aircraft, rotorcraft and weapons systems has provided relative stability for our defense market sales, as some newer programs increase (e.g. F-35 Lightning II
and KC-46A Tanker) while some legacy programs are reduced (e.g. F/A-18 E/F Super Hornet and V-22 Osprey). Other programs are relatively steady (e.g. UH-60 Black Hawk and A-64 Apache helicopter programs). We have significant motion control system content for the refueling boom on the KC-46A, which entered low rate production in late calendar year 2018. Weapons programs for which we have significant sales include the Joint Direct Attack Munition (“JDAM”), Small Diameter Bomb (“SDB”) and AIM-9X guided tactical weapon systems. Although we expect production rates to remain flat to slightly down for these weapons programs in fiscal year 2020, relative to the very strong production rates in recent years, we expect overall demand to remain favorable in the near term.
Aftermarket – Our commercial aftermarket business has increased, as our products have been selected for new aerospace platforms and our content has increased across existing platforms. With the entry into service of the new single aisle aircraft (Boeing 737 MAX and Airbus A320neo), notwithstanding the grounding of the Boeing 737 MAX as described above, we have seen a significant increase in initial provisioning sales to the operators of these new aircraft. As new aircraft production levels increase to accommodate passenger demand and mitigate higher operating costs driven largely by higher fuel costs, we expect airlines will retire older generation aircraft as they reach certain age thresholds (commonly around twenty-five years on average). However, in the past few years, aircraft retirements have decreased because passenger demand has outpaced deliveries of next generation aircraft, forcing older generation legacy aircraft to remain in service longer than anticipated. This has led to increased demand for repairs and spare parts for older engine programs remaining in service. In addition, we have experienced gains in commercial aftermarket related to repairs and spare parts for mature legacy programs with large in-service fleets, such as Airbus A320 and Boeing 777.
Our defense aftermarket has also increased as the combat readiness of existing military programs on which we have content is prioritized by the U.S. Government. Global conflicts and growing international demand for various other military programs continue to drive demand for operations of defense aircraft, including fighter jets, transports and both utility and attack rotorcraft, supported by our products and systems. Although we expect variability, which is generally attributable to the cycling of various maintenance and upgrade programs, as well as actual usage, our outlook for defense aftermarket is strong, as the service lives of existing military programs are extended and there is increased demand for repairs and spare parts for older military aircraft programs remaining in service.
Industrial Markets
Our industrial products are used worldwide in various types of turbine- and reciprocating engine-powered equipment, including wind turbines and electric power generation and distribution systems, ships, locomotives, compressors, pumps, and other mobile and industrial machines.
Industrial Turbines – The demand for industrial gas turbines for power generation, which consists mainly of heavy frames, aero derivatives and steam, stabilized in fiscal year 2019 with some industrial gas turbine sales growth compared to fiscal year 2018, driven primarily by depletion of inventory levels in the market and increased Woodward content on certain newer industrial gas turbines. Start reliability, fuel flexibility, safety, and part-load efficiency are all key drivers of the turbine market as the conversion from coal to natural gas usage continues, and we believe Woodward continues to be well positioned to meet these market needs on the existing and next generation turbines. Though the increasing global demand for energy supports long-term growth for industrial gas turbines, we project only modest growth in the near-term as demand for electricity remains lower due to continuing penetration of renewable power sources and greater efficiency in energy demand and many of the newer industrial gas turbines for which Woodward has been awarded increased content will only start making deliveries in fiscal year 2020.
Reciprocating Engines – Woodward’s key markets for engine control technologies are power generation, transportation (including compressed natural gas (“CNG”) trucks in Asia, mining, and marine shipping), and oil and gas. The recent transition to China 6 regulations led to strong demand for China 5-compliant natural gas trucks in fiscal year 2019 leading up to the implementation. As a result, we expect some variability in the demand for natural gas trucks in China as the market absorbs the large pre-buy activities of China 5-compliant natural gas trucks and as the market transitions to the next generation China 6-complaint natural gas trucks. We continue to expect the market demand for natural gas trucks to remain favorable as the Chinese government continues to implement more stringent emissions standards and encourage natural gas usage under its initiative on air quality improvement. The demand for large reciprocating engines used in oil and gas and distributed power generation applications was healthy in fiscal year 2019, driven by demand for gas compression engines. The strong growth in internet traffic and data storage is also driving demand for data center power generation. We anticipate some softening of the large reciprocating engine market in fiscal year 2020 due to declines in the oil and gas market, as indicated by a recent decrease in rig count. Government emissions requirements across many regions and new engine applications are driving demand for more sophisticated control systems, as is customer demand for improved engine efficiencies and increased reliability. We expect share gains by our customers and increased scope on the latest generation reciprocating engines as energy policies in some countries encourage the use of natural gas and other alternative fuels over
carbon-rich petroleum fuels, which we expect will drive increased demand for our alternative fuel clean engine control technologies.
Renewable Power – The renewable power industry grew significantly in fiscal year 2019, but is expected to grow at a more moderate pace through the next decade. The shift from government subsidies to auction-based schemes, under which projects must bid a price per kilowatt hour to be awarded the project, has driven down market pricing and intensified competition. The resulting price and cost erosion stabilized through the course of fiscal year 2019. Pressure to reduce the levelized costs of energy (“LCOE”) remains high and is expected to continue to drive down capital investment and operating costs for both onshore and offshore wind. Consolidation within the renewables market is expected to continue as renewable power companies focus on global scale and efficiency to compensate for reduced market prices. Additionally, the current technology trend for larger turbines (greater than 4 megawatts onshore and greater than 10 megawatts offshore), shorter platform lifecycles, and demand for faster speed to market, will continue to transform OEM product portfolios. The decline in demand for smaller turbines (2 megawatt class and less) is accelerating, particularly in the European markets. Woodward expects strong market growth in offshore turbines to continue with significant cost reduction in that market driven primarily by cost reductions in the onshore turbine market. While the renewable power market remains robust, Woodward continued to be unfavorably impacted in fiscal year 2019 as vertically integrated OEMs and market consolidation have resulted in customers transitioning to wind turbines with less Woodward content. In addition, the insolvency and subsequent cessation of OEM activities of Senvion, a German wind turbine manufacturer and a significant customer of Woodward’s renewables business, also had an unfavorable impact on the renewables business’ financial results for fiscal year 2019. We anticipate that the increased penetration of renewable energy sources into the grid and increased global energy demand, along with the advancement of storage technologies, will drive new opportunities for our advanced control and protection solutions.
RESULTS OF OPERATIONS
New Accounting Policy
We adopted Accounting Standards Update (“ASU”) 2014-09, Revenue from Contracts with Customers, and all subsequently issued supplemental and/or actionsclarifying ASUs related to ASU 2014-09 (collectively “ASC 606”) on October 1, 2018 and elected the modified retrospective transition method. The results for periods prior to fiscal year 2019 were not adjusted for the new standard and the cumulative effect of the JV requirechange in accounting of $38,745 was recognized as a net increase to retained earnings at the mutual consentdate of both Woodward and GE. Neither Woodward nor GE has a controlling financial interest inadoption.
Overall, the JV, but Woodward does have the ability to significantly influence the operating and financial decisionsnet earnings impact of the JV. Therefore, Woodward is accounting for its remaining 50% ownership interest inadoption of ASC 606, when compared to net earnings under the JV using the equity method of accounting. Other income includes $6,204previous guidance, was not material for the nine-monthsfull fiscal year 2019. However, there has been quarterly variability in fiscal year 2019 in both sales and net earnings resulting from the adoption of ASC 606 as compared to the prior year amounts presented under the previous guidance. The adoption of ASC 606 has no impact on our net cash flows.
In the following discussion and analysis of the results of operations and liquidity, we compare the results for fiscal year ended September 30, 2016 related2019, which were prepared under ASC 606, to Woodward’s equity interest in the earnings ofresults for the JV. During nine-monthsfiscal year ended September 30, 2016, Woodward net sales include $46,9732018, which was prepared under the previous guidance, ASC 605. In instances where the change in accounting resulting from the adoption of salesASC 606 is considered to be significant, we have identified the impact of ASC 606 on the current period results, which management believes improves comparability to the JVprior period results prepared under ASC 605.
The following table sets forth a comparison of select financial results as accounted for under both ASC 606 and ASC 605. The financial results for the fiscal year ended September 30, 2019 are presented under the current guidance of ASC 606 and as if prepared under the previous guidance of ASC 605. We believe this improves the comparability of the financial results between the periods presented. The select financial results are presented on both an as reported basis in accordance with accounting principles generally accepted in the United States of America (“U.S. GAAP”) and on an as adjusted basis, which represents a reduction to salesnon-U.S. GAAP financial measure. The as adjusted non-U.S. GAAP financial measures, which differ from the similarly named financial measure as determined under either ASC 606 or ASC 605, include adjusted net earnings, adjusted earnings per share, and adjusted Industrial segment earnings. A description of $21,391 related to royalties paidthese measures as well as a reconciliation of these non-U.S.GAAP financial measures to the JV by Woodward on sales by Woodward directly to third party aftermarket customers.closest U.S. GAAP financial measures can be found under the caption “Non-U.S. GAAP Measures” in this Item 7 – Management’s Discussion and Analysis of Financial Conditions and Results of Operations.
|
|
|
|
|
|
|
|
|
|
|
|
|
|
|
|
|
|
|
|
|
| As reported (U.S. GAAP) |
|
| As adjusted (Non-U.S. GAAP) |
|
| Year Ended September 30, |
|
| Year Ended September 30, |
|
| 2019 |
| 2018 |
|
| 2019 |
| 2018 |
|
| ASC 606 |
| ASC 605 |
| ASC 605 |
|
| ASC 606 |
| ASC 605 |
| ASC 605 |
Net Sales: |
|
|
|
|
|
|
|
|
|
|
|
|
|
|
|
|
|
|
|
Aerospace segment |
| $ | 1,880,520 |
| $ | 1,761,389 |
| $ | 1,557,988 |
|
| $ | 1,880,520 |
| $ | 1,761,389 |
| $ | 1,557,988 |
Industrial segment |
|
| 1,019,677 |
|
| 1,029,168 |
|
| 767,885 |
|
|
| 1,019,677 |
|
| 1,029,168 |
|
| 767,885 |
Total consolidated net sales |
| $ | 2,900,197 |
| $ | 2,790,557 |
| $ | 2,325,873 |
|
| $ | 2,900,197 |
| $ | 2,790,557 |
| $ | 2,325,873 |
Earnings: |
|
|
|
|
|
|
|
|
|
|
|
|
|
|
|
|
|
|
|
Aerospace segment |
| $ | 389,126 |
| $ | 380,687 |
| $ | 308,553 |
|
| $ | 389,126 |
| $ | 380,687 |
| $ | 308,553 |
Segment earnings as a percent of segment net sales |
|
| 20.7% |
|
| 21.6% |
|
| 19.8% |
|
|
| 20.7% |
|
| 21.6% |
|
| 19.8% |
Industrial segment |
| $ | 93,521 |
| $ | 95,538 |
| $ | 49,894 |
|
| $ | 114,621 |
| $ | 118,951 |
| $ | 84,279 |
Segment earnings as a percent of segment net sales |
|
| 9.2% |
|
| 9.3% |
|
| 6.5% |
|
|
| 11.2% |
|
| 11.6% |
|
| 11.0% |
Consolidated net earnings |
| $ | 259,602 |
| $ | 253,967 |
| $ | 180,378 |
|
| $ | 314,476 |
| $ | 310,480 |
| $ | 245,930 |
Consolidated diluted earnings per share |
| $ | 4.02 |
| $ | 3.94 |
| $ | 2.82 |
|
| $ | 4.88 |
| $ | 4.81 |
| $ | 3.85 |
Operational Highlights
Net sales for fiscal year 20162019 were $2,023,078, a decrease$2,900,197, an increase of 0.7%$574,324, or 24.7%, from $2,038,303$2,325,873 for the prior fiscal year. NetOrganic net sales for the fiscal year 20162019, which excludes $332,009 of net sales attributable to Woodward L’Orange, were negatively impacted by $14,885 related$2,568,188, an increase of 15.5% compared to unfavorable changes in foreign currency exchange rates compared toorganic net sales of $2,222,968 for the prior fiscal year. Organic net sales for the fiscal year 2018 excludes net sales attributable to Woodward L’Orange in the amount of $102,905 for the four months of fiscal 2018 following the Closing. Foreign currency exchange rates had an unfavorable impact on net sales of $24,304 for the fiscal year.
Aerospace segment net sales for the fiscal year 20162019 were up 6.2%20.7% to $1,233,176,$1,880,520, compared to $1,160,883$1,557,988 for the prior fiscal year. Industrial segment net sales for the fiscal year 20162019 were down 10.0%up 32.8% to $789,902,$1,019,677, compared to $877,420$767,885 for the prior fiscal year. Organic Industrial segment net sales, which excludes $332,009 of net sales attributable to Woodward L’Orange, were $687,668, up 3.4% compared to organic Industrial segment net sales of $664,980 for the prior fiscal year. Organic Industrial segment net sales for the fiscal year 2018 excludes four months of net sales attributable to Woodward L’Orange in the amount of $102,905.
Net earnings for the fiscal year 20162019 were $180,838,$259,602, or $2.85$4.02 per diluted share, compared to $181,452,$180,378, or $2.75$2.82 per diluted share, for the prior fiscal year. Adjusted net earnings for the fiscal year 2015. Net2019 were $314,476, or adjusted earnings for fiscal year 2016 included approximately $16,100per share of special charges related to our efforts to consolidate facilities, reduce costs and address current market conditions, which was equal to approximately $9,900
net of tax. Net earnings for fiscal year 2016 were also negatively impacted by approximately $3,000, or $2,000 net of tax, related to unfavorable changes in foreign currency exchange rates$4.88 per diluted share, compared to $245,930, or $3.85 per diluted share, for the prior fiscal year 2015.year.
The effective tax rate in the fiscal year 20162019 was 20.2%19.0%, compared to 24.7%17.9% for the prior fiscal year. The effective tax rate for both periods reflect the transition impacts of the changes in the U.S. federal tax law enacted in December 2017 with additional income tax expense of $10,588 related to the transition impacts recognized in the fiscal year 2019.
Earnings before interest and taxes (“EBIT”) for the fiscal year 2016 was $251,237, down 5.2%2019 were $363,200, an increase of 40.6% from $265,026$258,369 in the prior fiscal year. EBIT for the fiscal year 2015.2019 includes an increase in EBIT of $6,471 as a result of revenue recognized under ASC 606 that would not have been recognized under the previous guidance. Earnings before interest, taxes, depreciation and amortization (“EBITDA”) for the fiscal year 2016 was $320,273, down 5.9%2019 were $505,204, up 34.9% from $340,261$374,500 for the prior fiscal year. EBITDA for the fiscal year 2015.2019 includes an increase in EBITDA of $4,041 as a result of revenue recognized under ASC 606 that would not have been recognized under the previous guidance. Adjusted EBIT and adjusted EBITDA for fiscal year 2016 include the special charges of approximately $16,100 discussed above. EBIT2019 were $423,990 and EBITDA for fiscal year 2016 were negatively impacted by approximately $3,000 related to unfavorable changes in foreign currency exchange rates$544,894, respectively, compared to $334,361 and $432,431, respectively, for the prior fiscal year. For fiscal year 2019, adjusted EBIT and adjusted EBITDA include an increase of $4,158 and $4,849, respectively, as a result of revenue and related costs recognized under ASC 606 that would not have been recognized under the previous guidance.
Aerospace segment earnings as a percent of segment net sales increased to 18.8%were 20.7% in fiscal year 2016 from 16.2%2019, compared to 19.8% in the prior fiscal year. Industrial segment earnings as a percent of segment net sales decreased to 10.4%were 9.2% in the fiscal year 2016 from 14.4%2019, compared to 6.5% in the prior fiscal year. Adjusted Industrial segment earnings as a percentage of segment net sales were 11.2% for the fiscal year 2019, compared to 11.0% for the prior fiscal year. Excluding Industrial segment losses attributable the renewable power systems business of $12,855 for fiscal year 2019 and earnings attributable to the renewable power systems of $2,994 for fiscal year 2018, adjusted segment earnings for fiscal year 2019 were 13.3% of Industrial segment net sales,
compared to 12.0% for fiscal year 2018, in each case excluding net sales attributable to the renewable power systems business.
Organic net sales, organic Industrial segment net sales, constant currency organic Industrial segment net sales, adjusted net earnings, adjusted earnings per share, EBIT, adjusted EBIT, EBITDA, adjusted EBITDA, adjusted Industrial segment earnings, adjusted Industrial segment earnings excluding the renewable power systems business, and Industrial segment net sales excluding net sales attributable to the renewable power systems business are non-U.S. GAAP financial measures. A description of these measures as well as a reconciliation of these non-U.S. GAAP financial measures to the closest U.S. GAAP financial measures can be found under the caption “Non-U.S. GAAP Measures” in this Item 7 – Management’s Discussion and Analysis of Financial Conditions and Results of Operations.
Liquidity Highlights
Net cash provided by operating activities for fiscal year 20162019 was $435,379,$390,608, compared to $295,990$299,292 for fiscal year 2015.2018. The increase in net cash provided by operating activities in fiscal year 2019 compared to fiscal year 2018 is primarily attributable to increased earnings and the after-tax proceeds relatedtiming of certain cash payments for accounts payable in fiscal year 2019, partially offset by increased investment in inventories to the formation of the JV between Woodward and GE (“JV Proceeds”).support an increase in sales.
For fiscal year 2016, adjusted2019, free cash flow, which we define as net cash flows provided byfrom operating activities less payments for property, plant and equipment, and less the JV Proceeds, was $104,687,$291,542, compared to $9,378$172,152 for the fiscal year 2015. The increase is primarily attributable to lower payments for property, plant and equipment in fiscal year 2016 as compared to fiscal year 2015.
On September 23, 2016, Woodward and one2018. (A reconciliation of its wholly owned subsidiaries each entered intofree cash flow, a series of note purchase agreements (the “2016 Note Purchase Agreements”) relatingnon-U.S. GAAP financial measure, to the sale by Woodwardclosest U.S. GAAP financial measure can be found under the caption “Non-U.S. GAAP Measures” in this Item 7 – Management’s Discussion and its wholly owned subsidiaryAnalysis of an aggregate principal amountFinancial Conditions and Results of €160,000 of its unsecured notes to various third parties in a series of private placement transactions. We used the net proceeds from the issuance of these notes to repay amounts outstanding underOperations.)
On June 19, 2019, we amended our revolving credit facility to, among other things, extend the termination date of the revolving loan commitments of the lenders thereunder from April 28, 2020 to June 19, 2024 and modify the option to increase available borrowings from $1,200,000 to $1,500,000, subject to lenders’ participation (the “Amended and Restated Revolving Credit Agreement”). The terms and conditions of the Amended and Restated Revolving Credit Agreement are similar to the prior credit agreement.
At September 30, 2016,2019, we held $81,090$99,073 in cash and cash equivalents, including restricted cash of $1,500, and had total outstanding debt of $729,244$1,084,899 with additional borrowing availability of $835,470,$726,725, net of outstanding letters of credit, under our revolving credit agreement. There wasAt September 30, 2019, we also had additional borrowing capacity of $44,001$7,571 under various foreign lines of credit and foreign overdraft facilities.
Consolidated Statements of Earnings and Other Selected Financial Data
The following tables settable sets forth selected consolidated statements of earnings data as a percentage of net sales for each period indicated:
|
|
|
|
|
|
|
|
|
|
|
|
|
|
|
|
|
|
|
|
|
|
|
|
|
|
|
| Year Ended September 30, |
|
|
| 2019 |
|
| 2018 |
|
|
|
|
| % of Net Sales |
|
|
|
| % of Net Sales |
Net sales |
| $ | 2,900,197 |
| 100 | % |
| $ | 2,325,873 |
| 100 | % |
Costs and expenses: |
|
|
|
|
|
|
|
|
|
|
|
|
Cost of goods sold |
|
| 2,192,654 |
| 75.6 |
|
|
| 1,722,802 |
| 74.1 |
|
Selling, general, and administrative expenses |
|
| 211,205 |
| 7.3 |
|
|
| 193,736 |
| 8.3 |
|
Research and development costs |
|
| 159,107 |
| 5.5 |
|
|
| 148,279 |
| 6.4 |
|
Restructuring charges |
|
| - |
| - |
|
|
| 17,013 |
| 0.7 |
|
Interest expense |
|
| 44,001 |
| 1.5 |
|
|
| 40,465 |
| 1.7 |
|
Interest income |
|
| (1,413) |
| (0.0) |
|
|
| (1,674) |
| (0.1) |
|
Other expense (income), net |
|
| (25,969) |
| (0.9) |
|
|
| (14,326) |
| (0.6) |
|
Total costs and expenses |
|
| 2,579,585 |
| 88.9 |
|
|
| 2,106,295 |
| 90.6 |
|
Earnings before income taxes |
|
| 320,612 |
| 11.1 |
|
|
| 219,578 |
| 9.4 |
|
Income tax expense |
|
| 61,010 |
| 2.1 |
|
|
| 39,200 |
| 1.7 |
|
Net earnings |
| $ | 259,602 |
| 9.0 |
|
| $ | 180,378 |
| 7.8 |
|
Other selectedselect financial data:
|
|
|
|
|
|
|
|
|
|
|
|
| September 30, |
| September 30, |
| 2019 |
| 2018 |
Working capital | $ | 563,792 |
| $ | 523,619 |
Short-term borrowings |
| 220,000 |
|
| 153,635 |
Total debt |
| 1,084,899 |
|
| 1,246,032 |
Total stockholders' equity |
| 1,726,741 |
|
| 1,538,104 |
| | | | | |
| | | | | |
| September 30, | | September 30, |
| 2016 | | 2015 |
Working capital | $ | 463,811 | | $ | 579,211 |
Short-term borrowings and current portion of long-term debt | | 150,000 | | | 2,430 |
Total debt | | 727,153 | | | 850,918 |
Total stockholders' equity | | 1,212,595 | | | 1,153,104 |
Non-U.S. GAAP Financial Measures2019 RESULTS OF OPERATIONS
EBIT, EBITDA, free cash flow, and adjusted free cash flow are financial measures2019 Net Sales Compared to 2018
Consolidated net sales for fiscal year 2019 increased by $574,324, or 24.7%, compared to fiscal year 2018. Net sales for fiscal year 2019 include additional net sales of $109,640 recognized under ASC 606 that would not prepared and presentedhave been recognized under the previous guidance. Net sales for fiscal year 2019 under ASC 606 increased primarily as a result of customer provided inventory required to be included in accordance with accounting principles generally accepted in the United States of Americanet sales (“U.S. GAAP”noncash consideration”). However, we believe these non-U.S. GAAP financial measures provide additional information that enables readersOrganic net sales for fiscal year 2019, which exclude $332,009 of net sales attributable to evaluate our business from the perspective of management.
Earnings based non-U.S. GAAP financial measures
Management uses EBITWoodward L’Orange, increased by 15.5%, compared to evaluate Woodward’s performance without financing and tax related considerations, as these elements may not fluctuate with operating results. Management uses EBITDA in evaluating Woodward’s operating performance, making business decisions, including developing budgets, managing expenditures, forecasting future periods, and evaluating capital structure impacts of various strategic scenarios. Securities analysts, investors and others frequently use EBIT and EBITDA in their evaluation of companies, particularly those with significant property, plant, and equipment, and intangible assets subject to amortization.
EBIT and EBITDAorganic net sales for fiscal year 2018. Organic net sales for the fiscal years ended September 30, 2016, September 30, 2015, and September 30, 2014 were as follows:
| | | | | | | | |
| | | | | | | | |
| Year Ended September 30, |
| 2016 | | 2015 | | 2014 |
Net earnings (U.S. GAAP) | $ | 180,838 | | $ | 181,452 | | $ | 165,844 |
Income taxes | | 45,648 | | | 59,497 | | | 61,400 |
Interest expense | | 26,776 | | | 24,864 | | | 22,804 |
Interest income | | (2,025) | | | (787) | | | (271) |
EBIT (Non-U.S. GAAP) | | 251,237 | | | 265,026 | | | 249,777 |
Amortization of intangible assets | | 27,486 | | | 29,241 | | | 33,580 |
Depreciation expense | | 41,550 | | | 45,994 | | | 43,773 |
EBITDA (Non-U.S. GAAP) | $ | 320,273 | | $ | 340,261 | | $ | 327,130 |
The useyear 2018 exclude net sales attributable to Woodward L’Orange in the amount of these non-U.S. GAAP financial measures is not intended to be considered in isolation of, or as a substitute$102,905 for the financial information prepared and presented in accordance with U.S. GAAP. As EBIT and EBITDA exclude certain financial information compared with net earnings,four months of fiscal 2018 following the most comparable U.S. GAAP financial measure, users of this financial information should consider the information that is excluded. Our calculations of EBIT and EBITDA may differ from similarly titled measures used by other companies, limiting their usefulness as comparative measures.
Cash flow-based non-U.S. GAAP financial measures
Management uses free cash flow, which is defined by the Company as net cash flows provided by operating activities less payments for property, plant and equipment, as well as adjusted free cash flow, which is defined by the Company as free cash flow less the JV Proceeds, in reviewing the financial performance of Woodward’s various business groups and evaluating cash levels. In addition, securities analysts, investors, and others frequently use free cash flow in their evaluation of companies. The use of these non-U.S. GAAP financial measures is not intended to be considered in isolation of, or as substitutes for, the financial information prepared and presented in accordance with U.S. GAAP. Neither free cash flow nor adjusted free cash flow necessarily represent funds available for discretionary use, and neither is necessarily a measure of our ability to fund our cash needs. In particular, the net proceeds received in connection with the formation of the JV was a discrete positive cash flow event not expected to recur. Our calculations of free cash flow and adjusted free cash flow may differ from similarly titled measures used by other companies, limiting its usefulness as a comparative measure.
Free cash flow and adjusted free cash flow for the fiscal years ended September 30, 2016, September 30, 2015, and September 30, 2014 were as follows:
| | | | | | | | |
| | | | | | | | |
| Year Ended September 30, |
| 2016 | | 2015 | | 2014 |
Net cash provided by operating activities (U.S. GAAP) | $ | 435,379 | | $ | 295,990 | | $ | 273,570 |
Payments for property, plant and equipment | | (175,692) | | | (286,612) | | | (207,106) |
Free cash flow (Non-U.S. GAAP) | $ | 259,687 | | $ | 9,378 | | $ | 66,464 |
Less: Gross proceeds from formation of joint venture | | 250,000 | | | - | | | - |
Tax payments related to formation of joint venture | | (95,000) | | | - | | | - |
Net after-tax proceeds from formation of joint venture | | 155,000 | | | - | | | - |
Adjusted free cash flow (Non-U.S. GAAP) | $ | 104,687 | | $ | 9,378 | | $ | 66,464 |
2016 RESULTS OF OPERATIONS
2016 Sales Compared to 2015
ConsolidatedClosing. Organic consolidated net sales infor fiscal year 2016 decreased 0.7% to $2,023,078 from $2,038,303 in fiscal year 2015. 2019 include additional net sales of $113,850 recognized under ASC 606 that would not have been recognized under the previous guidance.
Details of the changes in consolidated net sales are as follows:
|
|
|
|
|
|
|
| | | |
Consolidated net sales for the periodyear ended September 30, 20152018 |
| $
| 2,038,303
|
| $ | 2,325,873 |
Aerospace volume |
|
| 58,399
|
|
| 206,411 |
Industrial volume |
|
| (66,568)
|
|
| 42,539 |
Sales attributable to L'Orange |
|
|
|
|
| 230,492 |
Noncash consideration |
|
|
|
|
| 98,061 |
Effects of changes in price and sales mix |
|
| 7,829
|
|
| 21,125 |
Effects of changes in foreign currency rates |
|
| (14,885)
|
|
| (24,304) |
Consolidated net sales for the periodyear ended September 30, 20162019 |
| $
| 2,023,078
|
| $ | 2,900,197 |
The decreaseincrease in consolidated net sales for fiscal year 2016 was2019 is primarily attributable to the inclusion of a full 12-months of Woodward L’Orange, as well continued weaknessstrength across nearly all of our Industrial segment markets partially offset by increased commercial aftermarket and defense sales in the Aerospace segment, markets.
Ourparticularly commercial and defense original equipment manufacturer (“OEM”) and defense aftermarket sales. Also contributing to the increase in consolidated net sales were negatively impacted by $14,885 in fiscal year 2016 by fluctuations2019 was noncash consideration revenue recognized under ASC 606 that was not recognized in foreign currency exchange rates compared tothe prior year period under the previous guidance, primarily in our Aerospace segment. In the Industrial segment, the increase in organic net sales volumes in fiscal year 2015. Nearly all of the foreign currency impact2019 is primarily attributable to increased sales in our netreciprocating engine business, partially offset by significant sales was realized throughdeclines in our Industrial segment, primarily due to changes in the EUR.renewables business.
Our worldwide sales activities are primarily denominated in USD, EUR, GBP, Japanese Yen (“JPY”), Brazilian Real (“BRL”), and Chinese
Renminbi (“RMB”). As the USD, EUR, GBP, JPY BRL and RMB fluctuate against each other and other currencies, we are exposed to gains or losses on sales transactions. For additional information on foreign currency exchange rate risk, please refer to the risk factor titled “We derive a significant portion of our revenues from non-U.S. sales and are subject to the risks inherent in doing business in other countries” set forth under the caption “Risk Factors” in Part I, Item 1A of this Form 10-K and Item 7A, “Quantitative and Qualitative Disclosures about Market Risk,”
20162019 Costs and Expenses Compared to 20152018
Costs and expenses for fiscal year 2016 include special charges, recorded in the first quarter, totaling approximately $16,100 ($13,300 included in cost of goods sold, $1,700 included in selling, general and administrative expenses, and $1,100 included in research and development costs) related to our efforts to consolidate facilities, reduce costs and address current market conditions. Cost savings realized during fiscal year 2016 related to these charges generally offset the expenses recorded in the first quarter of fiscal year 2016.
Cost of goods soldincreased by $21,822$469,852 to $1,475,540,$2,192,654, or 72.9%75.6% of net sales, for fiscal year 20162019, from $1,453,718,$1,722,802, or 71.3%74.1% of net sales, for fiscal year 2015.2018. The increase in cost of goods sold in fiscal year 2019 as compared to fiscal year 2018 is primarily attributable to the inclusion in fiscal year 2016higher sales volume, additional costs of approximately $13,300 of special charges recorded in the first quarter, as described above. In addition,goods sold attributable to Woodward L’Orange sales, additional cost of goods sold attributable to noncash consideration from customer supplied inventory recognized under ASC 606, higher manufacturing costs related to both increased duecapacity expansion costs to increased salessupport higher production levels and costs associated with the relocation of our Duarte, California operations to the Company’s newly renovated Drake Campus in Fort Collins, Colorado (the “Duarte Relocation”), an increase in variable compensation related to the strong financial performance in the fiscal year, and charges in the amount of $8,227 related to the impairment of inventory manufactured specifically for Senvion, a significant customer of our Aerospace segment and planned new facility start-up expenses for our new Rockford-area and Colorado facilities, partiallyrenewables business that declared insolvency in fiscal year 2019. These costs were slightly offset by the effectspurchase accounting impacts related to the revaluation of lower sales volumethe Woodward L’Orange inventory recognized in our Industrial segment. cost of goods sold for the fiscal year ended September 30 2018.
Gross margin (as measured by net sales less cost of goods sold, divided by net sales) was 27.1%24.4% for fiscal year 2016,2019, compared to 28.7%25.9% for fiscal year 2015. Gross2018. The decrease in gross margin for fiscal year 2016 was lower comparedis primarily attributable to fiscal year 2015, primarilyhigher manufacturing costs related to increased capacity expansion to support increased production levels and costs associated with the inclusionDuarte Relocation, an unfavorable sales mix of lower gross margin products in our Industrial segment, and the noncash consideration recognized under ASC 606. Noncash consideration negatively impacts gross margin as the inventory recognized as net sales under a noncash consideration transaction is reflected in cost of goods sold of approximately $13,300 of special charges inat an amount equal to the first quarter of fiscal year 2016, as well as planned new facility start-up expenses for our new Rockford-area and Colorado facilities.sales value.
Selling, general and administrative expenses decreased increased by $2,044,$17,469, or 1.3%9.0%, to $154,951$211,205 for fiscal year 2016 as2019, compared to $156,995$193,736 for fiscal year 2015.2018. Selling, general and administrative expenses in fiscal year 2019 includes charges in the amount of $4,374 related to the impairment of accounts receivable from Senvion. Fiscal year 2018 included special charges associated with the L’Orange Acquisition. These special charges consisted of transaction and integration costs of $5,208, warranty and indemnity insurance costs of $4,293, and German real estate transfer tax charges of $3,385. Excluding the costs associated with the impairment of accounts receivable from Senvion in fiscal year 2019 and the special charges in fiscal year 2018, selling, general and administrative expenses increased 14.4% in fiscal year 2019 primarily due tothe inclusion of a full 12-months of selling, general and administrative expenses attributable to Woodward L’Orange compared to only four-months in fiscal year 2018, and an increase in certain expenses to support ongoing company growth. Also contributing the higher selling, general and administrative expenses in fiscal year 2019 was an increase in variable compensation related to the strong financial performance in the fiscal year. Selling, general, and administrative expenses as a percentage of net sales was 7.7% for both fiscal year 2016 and fiscal year 2015. The decrease in selling, general and administrative expensesdecreased to 7.3% for fiscal year 2016 was due2019, compared to 8.3% for the inclusion in fiscal year 2015 of expenses associated with our negotiations to enter into the JV agreement with GE for which there is no equivalent expense in fiscal year 2016, as well as normal variability in costs. In fiscal year 2016, these decreases were partially offset by the special charges of $1,700 described above.2018.
Research and development costs decreased increased by $8,315,$10,828, or 6.2%7.3%, to $126,170$159,107 for fiscal year 2016,2019, as compared to $134,485$148,279 for fiscal year 2015.2018. Research and development costs decreased as a percentage of net sales decreased to 6.2%5.5% for fiscal year 20162019, as compared to 6.6%6.4% for fiscal year 2015. 2018.
Research and development costs in fiscal year 20162019 were impacted by variabilityhigher primarily due to the inclusion of a full 12-months of research and development costs attributable to Woodward L’Orange compared to only four-months in the timing of projects and expenses. In addition, fiscal year 2016 includes2018. Also contributing to higher research and developments costs in fiscal year 2019 was an increase in variable compensation related to the special charges of $1,100 described above. strong financial performance in fiscal year 2019. Our research and development activities extend across almost all of our customer base, and we anticipate ongoing variability in research and development due to the timing of customer business needs on current and future programsprograms.
AmortizationRestructuring charges of intangible assets decreased$17,013 recognized in fiscal year 2018 related primarily to $27,486the Duarte Relocation. Also included in the fiscal year 2018 restructuring charges were workforce management costs related to our ongoing effort to align our industrial turbomachinery business, which is part of our Industrial segment, with the then current market conditions. All of the restructuring charges recorded in fiscal year 2018 were recorded as nonsegment expenses. There were no restructuring charges recorded in fiscal year 2019.
Interest expense increased by $3,536, or 8.7%, to $44,001, for fiscal year 2016,2019, compared to $29,241$40,465 for fiscal year 2015. As2018. Interest expense decreased as a percentage of net sales amortization of intangible assets were 1.4% for both fiscal year 2016 and fiscal year 2015. The decrease in amortization expense was primarily related to certain intangible assets becoming fully amortized during fiscal year 2015.
Interest expense increased to $26,776, or 1.3% of net sales,1.5% for fiscal year 2016,2019, as compared to $24,864, or 1.2% of net sales,1.7% for fiscal year 2015.2018. The increase in interest expense was primarily attributable to lower amounts of capitalized interest in fiscal year 2016 as2019 compared to fiscal year 2015, as capital projects have been completed.2018 is primarily due to a full 12-months of interest expense associated with the financing of the L’Orange Acquisition, partially offset by a decrease in interest expense attributable to the cross currency interest rate swap derivatives. Related to the L’Orange Acquisition, on May 31, 2018 we issued an aggregate principal amount of $400,000 of senior unsecured notes in a series of private placement transactions and borrowed $167,420 under our revolving credit agreement to fund the acquisition. Refer to Note 18, Derivative instruments and hedging activities in the Notes to the Consolidated Financial Statements in “Item 8 – Financial Statements and Supplementary Data” for further information on our cross currency interest rate swap derivatives.
Other income, net was$25,969 for fiscal year 2019, compared to $14,326 for fiscal year 2018. The increase in other income, net in in fiscal year 2019 compared to fiscal year is primarily due to an increase of $9,593, compared to fiscal year 2018, in Woodward’s equity interest in the earnings of its joint venture with General Electric Company. Also contributing to the increase between fiscal year 2019 and fiscal year 2018 was the one-time loss of $5,543 on a forward option derivative entered into in fiscal year 2018 to manage our exposure to fluctuations in the Euro prior to the anticipated close of the L’Orange Acquisition. There was no similar expense incurred in fiscal year 2019. Refer to Note 17, Other (income) expense, net in the Notes to the Consolidated Financial Statements in “Item 8 – Financial Statements and Supplementary Data” for further information on the items include in other income, net.
Income taxes were provided at an effective rate on earnings before income taxes of 20.2%19.0% for fiscal year 2016,2019, compared to 24.7%17.9% for fiscal year 2015.2018. The changes in components of our effective tax rate (as a percentage of earnings before income taxes) were attributable to the following:
|
|
|
|
|
|
|
|
|
|
|
|
Effective tax rate atfor the year ended September 30, 20152018 |
| 24.7
|
| 17.9 | % |
Research and experimentation creditCurrent year effect of U.S. federal corporate rate reduction
|
| (3.5)
|
| (3.5) |
|
AdjustmentEffect of prior periodU.S. federal corporate rate reduction on net current year U.S. deferred tax itemsactivity
|
| 1.9
|
| (2.0) |
|
Impact of the Tax Act: |
|
|
|
|
|
Effect of U.S. federal corporate rate reduction on net beginning U.S. deferred tax liability |
| 5.0 |
|
|
|
Transition tax |
| (2.9) |
|
|
|
Increased deferred tax liability associated with anticipated repatriation taxes |
| (3.7) |
|
|
|
Net impact of enactment of the Tax Act |
|
|
| (1.6) |
|
|
|
|
|
|
|
Net excess income tax benefit from stock-based compensation |
| (2.6)
|
| (2.2) |
|
OtherAdjustment of prior period tax items
|
| (0.3)
|
| 5.9 |
|
Taxes on international activities |
|
|
| 2.0 |
|
Domestic production activity deduction |
|
|
| 1.6 |
|
Research and experimentation credit |
|
|
| 1.5 |
|
State and local taxes |
|
|
| 0.5 |
|
Other |
|
|
| (1.1) |
|
Effective tax rate atfor the year ended September 30, 20162019 |
| 20.2
|
| 19.0 | % |
The decreaseincrease in the year-over-year effective tax rate for fiscal year 20162019 compared to fiscal year 2018 is primarily attributable to favorable resolutions of tax matters in the permanent extension, inprior fiscal year 2016,that did not repeat in the current fiscal year, an increase in the U.S. federal corporate income tax on current year foreign earnings, the loss of the domestic production activities deduction in the year and a decrease in the current year of the U.S. research and experimentation credit (“R&E Credit”)as a percent of pretax earnings. Partially offsetting these increases were the decrease in the U.S federal corporate income tax rate from 24.5% for fiscal year 2018 to 21.0% in the current fiscal year and the recognition through earnings ofrelated impact on fiscal year 2018 deferred tax activity that did not repeat in the current fiscal year. Additionally, the fiscal year 2018 net tax expense increase related to the Tax Act was larger than the current fiscal year increase. Finally, the current fiscal year had a larger favorable increase in the net excess income tax benefitbenefits from stockstock-based compensation due to the adoption of ASU 2016-09 (see Note 2, Recent accounting pronouncements, to the Consolidated Financial Statements in “Item 8 – Financial Statements and Supplementary Data”). Additionally, there were fewer favorable resolutions, reviews of tax matters, and lapses of applicable statutes of limitation in fiscal year 2016 as compared to fiscal year 2015.2018.
The total amount of the gross liability for worldwide unrecognized tax benefits reported in other liabilities in the Consolidated Balance Sheets was $23,526$10,305 at September 30, 20162019 and $21,469$8,364 at September 30, 2015.2018. At September 30, 2016,2019, the amount of the liability for unrecognized tax benefits that would impact Woodward’s effective tax rate, if recognized, was $11,426. At this time, we estimate it is reasonably possible that the liability for unrecognized tax benefits will decrease by as much as $8,433 in the next twelve months due to a number of factors including the completion of reviews by tax authorities and the expiration of certain statutes of limitations.$4,411. We accrue for potential interest and penalties related to unrecognized tax benefits in tax expense. Woodward had accrued interest and penalties of $1,273$437 as of September 30, 20162019 and $859$279 as of September 30, 2015.2018.
Woodward’s tax returns are subject to audits by U.S. federal, state, and foreign tax authorities, and these audits are at various stages of completion at any given time. Reviews of tax matters by authorities and lapses of the applicable statutes of limitation may result in changes to tax expense. FiscalWoodward’s fiscal years remaining open to examination in significant foreign jurisdictions include 2008 and thereafter, and for the United StatesU.S. Federal income taxes include fiscal years 20132017 and thereafter. Woodward is currently under examination by the Internal Revenue Service for fiscal year ended September 30, 2014. Woodward is generally subject2017, which included a foreign tax carryback to fiscal year 2016. Woodward’s fiscal years remaining open to examination for significant U.S. state income tax examinations forjurisdictions include fiscal years 20122015 and the periods thereafter.
SEGMENT RESULTS
Woodward serves the aerospace, industrial and energy markets through its two reportable segments – Aerospace and Industrial. Our reportable segments are aggregations of our operating segments. See Note 20, Segment information,closed various audits in foreign jurisdictions in the Notessecond and third quarters of fiscal year 2019. Consequently, fiscal years remaining open to the Consolidated Financial Statements for further information regarding our segments. examination in significant foreign jurisdictions include 2016 and thereafter.
Segment Results
The following table presents sales by segment:
| | | | | | | | | | | | | | | |
|
|
|
|
|
|
|
|
|
|
| | | | | | | | | | | | | | | |
|
|
|
|
|
|
|
|
|
|
| | Year Ended September 30, |
| Year Ended September 30, |
| | 2016 | | 2015 | | 2014 |
| 2019 |
| 2018 |
Net sales: | | | | | | | | | | | | | | | | |
|
|
|
|
|
|
|
|
|
|
|
Aerospace | | $ | 1,233,176 | | 61.0 | % | | $ | 1,160,883 | | 57.0 | % | | $ | 1,084,025 | | 54.2 | % |
| $ | 1,880,520 |
| 64.8 | % |
| $ | 1,557,988 |
| 67.0 | % |
Industrial | | | 789,902 | | 39.0 | | | | 877,420 | | 43.0 | | | | 917,215 | | 45.8 | |
|
| 1,019,677 |
| 35.2 |
|
|
| 767,885 |
| 33.0 |
|
Consolidated net sales | | $ | 2,023,078 | | 100.0 | % | | $ | 2,038,303 | | 100.0 | % | | $ | 2,001,240 | | 100.0 | % |
| $ | 2,900,197 |
| 100.0 | % |
| $ | 2,325,873 |
| 100.0 | % |
| | | | | | | | |
| | | | | | | | |
| Year Ended September 30, |
| 2016 | | 2015 | | 2014 |
Aerospace | $ | 232,166 | | $ | 187,747 | | $ | 159,200 |
Industrial | | 82,237 | | | 126,641 | | | 134,278 |
Total segment earnings | | 314,403 | | | 314,388 | | | 293,478 |
Nonsegment expenses | | (63,166) | | | (49,362) | | | (43,701) |
Interest expense, net | | (24,751) | | | (24,077) | | | (22,533) |
Consolidated earnings before income taxes | | 226,486 | | | 240,949 | | | 227,244 |
Income tax expense | | 45,648 | | | 59,497 | | | 61,400 |
Consolidated net earnings | $ | 180,838 | | $ | 181,452 | | $ | 165,844 |
The following table presents earnings by segment and reconciles segment earnings to consolidated net earnings:
|
|
|
|
|
|
|
|
|
|
|
|
| Year Ended September 30, |
| 2019 |
| 2018 |
Aerospace | $ | 389,126 |
| $ | 308,553 |
Industrial |
| 93,521 |
|
| 49,894 |
Nonsegment expenses |
| (119,447) |
|
| (100,078) |
Interest expense, net |
| (42,588) |
|
| (38,791) |
Consolidated earnings before income taxes |
| 320,612 |
|
| 219,578 |
Income tax expense |
| 61,010 |
|
| 39,200 |
Consolidated net earnings | $ | 259,602 |
| $ | 180,378 |
The following table presents segment earnings as a percent of segment net sales:
| | | | | | | |
|
|
|
|
|
|
| | | | | | | |
|
|
|
|
|
|
| | Year Ended September 30, |
| Year Ended September 30, |
| | 2016 | | 2015 | | 2014 |
| 2019 |
| 2018 |
Aerospace | | 18.8 | % | | 16.2 | % | | 14.7 | % |
| 20.7 | % |
| 19.8 | % |
Industrial | | 10.4 | | 14.4 | | 14.6 | |
| 9.2 |
|
| 6.5 |
|
20162019 Segment Results Compared to 20152018
Aerospace
Aerospace segment net sales increased by $322,532, or 20.7% to $1,880,520 for fiscal year 2019, compared to $1,557,988 for fiscal year 2018. Aerospace segment net sales were $1,233,176 for fiscal year 2016, up 6.2% compared to $1,160,883 for fiscal year 2015.2019 include additional net sales of $119,131 recognized under ASC 606 that would not have been recognized under the previous guidance. The remaining increase in segment net sales for fiscal year 20162019 as compared to fiscal year 20152018, was driven primarily by continued strength across all of our markets in the Aerospace segment, particularly commercial OEM as a result of continued momentum in next generation aircraft production, and defense OEM and aftermarket programs as a result of higher military spending.
Commercial OEM sales increased defense sales for aftermarket and orginal equipment manufacturer (“OEM”), andin fiscal year 2019 as compared to fiscal year 2018, driven by production of next generation narrowbody commercial aircraft on which we have increased commercialcontent. Commercial aftermarket sales partially offset by slightly weaker commercialwere higher in fiscal year 2019 as compared to fiscal year 2018 as a result of increased utilization of existing fleets and the initial provisioning for new platforms, although the grounding of the Boeing 737 MAX led to softer OEM sales.and initial provisioning in the second half of the fiscal year.
U.S. government funds continue to be prioritizedfunding for defense platforms on which we have content.content remains strong. Defense OEM sales for both aftermarket and OEM, continued to increaseincreased in fiscal year 2016, primarily related to conflicts in the Middle East. Sales of smart weapons were particularly strong in fiscal year 2016, as end-customers replenish their stock.
Commercial aftermarket sales were up in fiscal year 20162019 compared to fiscal year 2015,2018, driven primarily by continued strong demand for smart weapons and fixed wing aircraft. Defense aftermarket sales remained strong through fiscal year 2019, with a significant increase in defense aftermarket sales during the fiscal year. Our defense aftermarket has also increased as global passenger traffic growth continuesthe U.S. Government has prioritized the combat readiness of existing military programs on which we have content. Global conflicts and growing international demand for various other military programs continue to drive demand for defense aircraft, utilizationincluding fighter jets, transports and both utility and attack rotorcraft, supported by our market share continuesproducts and systems. We expect some ongoing variability in defense aftermarket sales due to grow. the timing of continued maintenance needs and upgrade programs.
Commercial OEM sales were down slightlyAerospace segment earnings increased by $80,573, or 26.1%, to $389,126 for fiscal year 2016 as2019, compared to $308,553 for fiscal year 2015 due to lower rotorcraft OEM sales, primarily related to lower extraction demands due to depressed oil prices, as well as variability in business jet demand. These decreases were partially offset by increases in large transport OEM sales as aircraft deliveries of narrow-body and wide-body aircraft have continued to increase based on steady airline demand and new product introductions.
2018. Aerospace segment earnings increased by $44,419, or 23.7%, to $232,166 for fiscal year 2016,2019 include an increase in segment earnings of $8,439 as a result of revenue and related costs recognized under ASC 606 that would not have been recognized under the previous guidance. Fluctuations in Aerospace segment earnings as a percentage of additional revenue recognized under ASC 606 are a result of gross margin differences associated with the timing of sales under ASC 606 compared to $187,747 for fiscal year 2015. those under the previous guidance.
The net increase in Aerospace segment earnings for fiscal year 20162019 was due to the following:
|
|
|
|
Earnings for the period ended September 30, 20152018 |
| $ | 187,747 308,553 |
Sales volume |
|
| 26,775 111,996 |
Price, sales mix and productivity |
|
| 13,274 11,889 |
Joint venture earningsProduction capacity expansion costs
|
|
| 6,204 (14,505) |
Other, net |
|
| (1,834)(28,807) |
Earnings for the period ended September 30, 20162019 |
| $ | 232,166 389,126 |
Aerospace segment earnings as a percentage of segment net sales were 18.8%20.7% for fiscal year 2016, compared to 16.2%2019 and 19.8% fiscal year 2018. Excluding the impact of the change in accounting following the adoption of ASC 606, Aerospace segment earnings as a percent of net sales were 21.6% for fiscal year 2015. The increase was2019. Aerospace segment earnings in fiscal year 2019 benefitted primarily attributable tofrom higher sales volume, which included more high-margin aftermarket sales.partially offset by higher manufacturing costs related to increased capacity expansion costs to support higher production levels, and other costs primarily including an increase in variable compensation related to the strong financial performance in the fiscal year.
Industrial
Industrial
Industrial segment net sales decreased increased by 10.0%$251,792, or 32.8%, to $789,902$1,019,677 for fiscal year 2016,2019, compared to $877,420$767,885 for fiscal year 2015. The decrease in segment net sales for fiscal year 2016, as compared to fiscal year 2015 was driven by ongoing weakness across many of our Industrial segment markets. In particular, further deterioration of the natural gas truck market in China and continued weakness in reciprocating engine power generation and other OEM large capital equipment projects. This weakness was primarily due to delayed maintenance and capital infrastructure investments due to slowing economic growth in China and other global markets, as well as continued depressed oil and gas pricing. In addition, the first quarter of fiscal year 2015 had unusually strong sales in the natural gas truck market in Asia, which was not repeated in fiscal year 2016. This weakness was partially offset in fiscal year 2016 by strength in industrial turbomachinery aftermarket sales.
2018. Foreign currency exchange rates had an unfavorable impact on segment net sales of approximately $13,000$21,036 for fiscal year 20162019. Industrial segment net sales for fiscal year 2019 decreased by $9,491 as a result of revenue that was not recognized under ASC 606 that would have been recognized under the previous guidance. Organic Industrial segment net sales for fiscal year 2019, which excludes $332,009 of net sales attributable to Woodward L’Orange, were $687,668, an increase of 3.4% compared to organic Industrial segment net sales of $664,980 for fiscal year 2018. Organic Industrial net sales for fiscal year 2018 excludes net sales attributable to Woodward L’Orange in the amount of $102,905 for the four months of fiscal 2018 following the Closing. On a constant currency basis, organic Industrial segment net sales would have increased approximately 6.6% for fiscal year 2019 compared to fiscal year 2015.
2018. Organic Industrial segment earnings decreased by $44,404, or 35.1%, to $82,237net sales for fiscal year 2016,2019 include additional net sales of $13,700 as a result of revenue recognized under ASC 606 that would not have been recognized under the previous guidance.
The increase in organic Industrial segment net sales fiscal year 2019 was primarily due to increased reciprocating engine sales and industrial gas turbine sales, partially offset by continuing declines in renewables sales. Sales of fuel systems for CNG trucks in Asia drove the increase in sales attributable to our reciprocating engine business in fiscal year 2019 compared to $126,6412018 as the recent transition to China 6 regulations led to strong demand for China 5-compliant natural gas trucks leading up to the implementation. As expected, demand for natural gas trucks in China was lower in the fourth quarter of fiscal year 2019 as the market absorbs the large pre-buy activities of China 5-compliant natural gas trucks and as the market transitions to the next generation China 6-complaint natural gas trucks. We continue to expect the market demand for natural gas trucks to remain favorable as the Chinese government continues to encourage natural gas usage under its initiative on air quality improvement.
The industrial gas turbine business has remained stable with moderate sales growth in fiscal year 2019 compared to fiscal year 2018. Industrial gas turbine sales in fiscal year 2019 continues to benefit from the depletion of inventory levels in the market and increased Woodward content on certain newer industrial gas turbines. Woodward expects modest industrial gas turbine sales growth to continue into fiscal year 2020 with many of the newer industrial gas turbines for which Woodward has been awarded increased content starting to make deliveries in fiscal year 2020.
Our renewables business has been unfavorably impacted by both platform transitions by some of our customers to wind turbines with less Woodward content and the shift from government subsidies to auction-based schemes, which have driven down market pricing and intensified competition. Also contributing to the decrease in renewables sales in fiscal year 2019 was the loss of a significant customer of our renewables business, Senvion, a German wind turbine manufacturer that announced in the second quarter of fiscal year 2019 that it had filed for self-administration insolvency proceedings and is currently in exclusive talks with Siemens Gamesa for the sale of a substantial part of the business of the company.
Industrial segment earnings increased by $43,627, or 87.4%, to $93,521 for fiscal year 2015. 2019, compared to $49,894 for fiscal year 2018. Industrial segment earnings for the fiscal year 2019 include a reduction in segment earnings of $2,017 as a result of revenue and related costs that were not recognized under ASC 606 that would have been recognized under the previous guidance. Adjusted Industrial segment earnings, which exclude certain purchase accounting impacts related to the L’Orange Acquisition, were $114,621 for fiscal year 2019, an increase of 36.0% compared to $84,279 for fiscal year 2018. Adjusted Industrial segment earnings for the fiscal year 2019 include a reduction in adjusted segment earnings of $4,330 as a result of revenue and related costs that were not recognized under ASC 606 that would have been recognized under the previous guidance. Fluctuations in Industrial segment earnings and adjusted Industrial segment earnings as a percentage of additional revenue recognized under ASC 606 are a result of gross margin differences associated with the timing of sales under ASC 606 compared to those under the previous guidance. Excluding Industrial segment losses attributable the renewable power systems business of $12,855 for fiscal year 2019 and earnings attributable to the renewable power systems of $2,994 for fiscal year 2018, adjusted segment earnings for fiscal year 2019 were $127,476, compared to $81,285 for fiscal year 2018.
The decreasenet increase in Industrial segment earnings for fiscal year 20162019 was due to the following:
|
|
|
|
Earnings for the period ended September 30, 20152018 |
| $ | 126,641 49,894 |
Sales volume |
|
| (33,509)19,620 |
Price, sales mix and productivity |
|
| (4,322)(9,188) |
Decrease in research and development expensesImpact of L'Orange Acquisition
|
|
| 6,989 56,449 |
New facility start-up costs
| | | (5,868) |
Effects of changes in foreign currency rates |
|
| (3,169)(4,266) |
Other, net |
|
| (4,525)(18,988) |
Earnings for the period ended September 30, 20162019 |
| $ | 82,237 93,521 |
Industrial segment earnings as a percentage of segment net sales were 10.4%9.2% for fiscal year 2016,2019 compared to 14.4%6.5% for fiscal year 2015. The decrease in segment earnings for year 2016 as compared to fiscal year 2015 was driven by2018. Excluding the impact of lower sales volume, unfavorable product mix, and costs associated with our new facilitythe change in Colorado. In addition, foreign currency exchange rates had an unfavorable impactaccounting following the adoption of $3,169 for fiscal year 2016 compared to fiscal year 2015.
Nonsegment expenses
Nonsegment expenses increased to $63,166 for fiscal year 2016, compared to $49,362 for fiscal year 2015. As a percent of sales, nonsegment expenses increased to 3.1% of net sales for fiscal year 2016, compared to 2.4% of net sales for fiscal year 2015. The increase in nonsegment expenses in fiscal year 2016 as compared to fiscal year 2015 is due to special charges taken in the first quarter of fiscal year 2016 totaling approximately $16,100 related to our efforts to consolidate facilities, reduce costs and address market conditions.
2015 RESULTS OF OPERATIONS
2015 Sales Compared to 2014
Consolidated net sales in fiscal year 2015 increased 1.9% to $2,038,303 from $2,001,240 in fiscal year 2014. Details of the changes in consolidated net sales are as follows:
| | | |
| | | |
Consolidated net sales for the period ended September 30, 2014
| | $
| 2,001,240 |
Aerospace volume
| | | 60,065 |
ASC 606, Industrial volume | | | 25,300 |
Effects of changes in price and sales mix
| | | 17,271 |
Effects of changes in foreign currency rates
| | | (65,573) |
Consolidated net sales for the period ended September 30, 2015
| | $
| 2,038,303 |
The increase in net sales for fiscal year 2015 was primarily attributable to improvements in many of our markets in both the Aerospace and Industrial segments, partially offset by the negative impacts of unfavorable changes in foreign currency exchange rates compared to fiscal year 2014. In Aerospace, we saw improvements in fiscal year 2015 across all markets over fiscal year 2014. In Industrial, we saw increased sales volume of industrial gas turbine systems and wind turbine converters, partially offset by lower sales of natural gas truck systems in Asia.
Changes in selling prices and sales mix were driven primarily by our Aerospace segment markets.
During fiscal year 2015, our net sales were negatively impacted by $65,573 due to unfavorable impacts of fluctuations in foreign currency exchange rates compared to the same period of fiscal year 2014. Nearly all of the negative foreign currency impact to our net sales was realized through our Industrial segment.
2015 Costs and Expenses Compared to 2014
Cost of goods sold increased by $27,879 to $1,453,718, or 71.3% of net sales, for fiscal year 2015 from $1,425,839, or 71.2% of net sales, for fiscal year 2014. The increase in cost of goods sold was primarily attributable to higher sales volumes and planned start-up costs related to our new Aerospace segment facilities, partially offset by the favorable cost impact of fluctuations in foreign currency exchange rates compared to fiscal year 2014.
Gross margin (as measured by net sales less cost of goods sold, divided by net sales) was 28.7% for fiscal year 2015, compared to 28.8% for fiscal year 2014. Gross margin for fiscal year 2015 was consistent with fiscal year 2014 as fixed cost leverage on increases in sales offset planned start-up costs related to our new Aerospace segment facilities.
Selling, general, and administrative expenses increased by $1,656, or 1.1%, to $156,995 for fiscal year 2015 as compared to $155,339 for fiscal year 2014. Selling, general, and administrative expenses decreased as a percentage of net sales to 7.7% for fiscal year 2015 as compared to 7.8% for fiscal year 2014. The slight increase in selling, general, and administrative expenses in fiscal year 2015 was primarily due to normal variability in costs as well as costs associated with the completion of the joint venture agreement between Woodward and GE, partially offset by the favorable cost impact of fluctuations in foreign currency exchange rates compared to the same period of fiscal year 2014.
Research and development costs decreased by $3,520, or 2.6%, to $134,485 for fiscal year 2015, as compared to $138,005 for fiscal year 2014. Research and development costs decreased as a percentage of net sales to 6.6% for fiscal year 2015 as compared to 6.9% for fiscal year 2014. The decrease in research and development costs for fiscal year 2015 as compared to fiscal year 2014 was primarily due to the favorable cost impact of fluctuations in foreign currency exchange rates compared to the same period of fiscal year 2014 in addition to the variability in the timing of projects and related milestones.
Amortization of intangible assets decreased to $29,241 for fiscal year 2015, compared to $33,580 for fiscal year 2014. As a percentage of net sales, amortization of intangible assets decreased to 1.4% for fiscal year 2015, as compared to 1.7% for fiscal year 2014. The decrease in amortization expense was primarily related to some intangible assets becoming fully amortized during fiscal years 2014 and 2015.
Interest expense increased to $24,864, or 1.2% of net sales, for fiscal year 2015, compared to $22,804, or 1.1% of net sales, for fiscal year 2014. The increase in interest expense was primarily attributable to additional interest expense on higher levels of debt in fiscal year 2015 as compared to fiscal year 2014, partially offset by increased capitalized interest in fiscal year 2015 related primarily to interest capitalized to our three significant facility expansion projects.
Income taxes were provided for at an effective rate on earnings before income taxes of 24.7% for fiscal year 2015, compared to 27.0% for fiscal year 2014. The changes in components of our effective tax rate (as a percentage of earnings before income taxes) were attributable to the following:
| | | |
| | | |
Effective tax rate at September 30, 2014
| | 27.0 | %
|
Research and experimentation credit
| | (0.1) | |
Retroactive extension of research and experimentation credit
| | (2.4) | |
Adjustment of prior period tax items
| | 0.8 | |
Taxes on international activities
| | (0.1) | |
Other
| | (0.5) | |
Effective tax rate at September 30, 2015
| | 24.7 | %
|
The decrease in the year-over-year effective tax rate for fiscal year 2015 was primarily attributable to the retroactive impact of the reinstatement of the U.S. research and experimentation credit through December 31, 2014 in fiscal year 2015. In addition, there were fewer favorable resolutions, reviews of tax matters, and lapses of applicable statutes of limitations in fiscal year 2015 as compared to fiscal year 2014.
2015 Segment Results Compared to 2014
Aerospace
Aerospace segment net sales were $1,160,883 for fiscal year 2015, up 7.1% compared to $1,084,025 for fiscal year 2014. Increases in fiscal year 2015 as compared to fiscal year 2014 were driven primarily by increased sales volumes in all of our markets, with the highest increase in commercial OEM and defense aftermarket sales.
Commercial OEM aircraft deliveries of narrow-body and wide-body aircraft continued to increase in fiscal year 2015 based on steady airline demand and new product introductions. Business aviation sales increased primarily due to new aircraft introductions. The commercial aftermarket showed some quarterly variability but was up in fiscal year 2015 compared to fiscal year 2014, as global passenger traffic growth continued to drive aircraft utilization and Woodward’s market share continued to grow.
U.S. government sustainment funds continue to be prioritized to defense aircraft platforms on which we have content and continued to see significant utilization for military operations. Defense sales, for both aftermarket and OEM, increased in fiscal year 2015 as compared to fiscal year 2014, primarily related to conflicts in the Middle East.
Aerospace segment earnings increased by $28,547, or 17.9%, to $187,747 for fiscal year 2015, compared to $159,200 for fiscal year 2014. The net increase in Aerospace segment earnings for fiscal year 2015 was due to the following:
| | | |
| | | |
Earnings for the period ended September 30, 2014
| | $
| 159,200�� |
Sales volume
| | | 28,287 |
Price, sales mix and productivity
| | | 13,548 |
Increases in manufacturing expenses
| | | (15,478) |
Other, net
| | | 2,190 |
Earnings for the period ended September 30, 2015
| | $
| 187,747 |
Aerospace segment earnings as a percentagepercent of net sales were 16.2%9.3% for fiscal year 2015, compared to 14.7% for fiscal year 2014. The increase was primarily attributable to increased sales, partially offset by increased manufacturing expenses primarily related to planned start-up costs related to our new facilities.
Industrial
Industrial segment net sales decreased 4.3% to $877,420 for fiscal year 2015, compared to $917,215 for fiscal year 2014. The decrease in segment net sales for fiscal year 2015 as compared to the same period of fiscal year 2014 was driven primarily by the unfavorable impact of changes in foreign currency exchange rates of approximately $63,700. If foreign currency exchange rates had remained constant between fiscal year 2015 and 2014, sales would have increased in fiscal year 2015 as compared to fiscal year 2014 primarily related to increased sales volume of industrial gas turbine systems and wind turbine converters, partially offset by lower sales of natural gas truck systems in Asia.
Industrial segment earnings decreased by $7,637, or 5.7%, to $126,641 for fiscal year 2015, compared to $134,278 for fiscal year 2014. The net decrease in Industrial segment earnings for fiscal year 2015 was due to the following:
| | | |
| | | |
Earnings for the period ended September 30, 2014
| | $
| 134,278 |
Sales volume
| | | 9,909 |
Price, sales mix and productivity
| | | (3,619) |
Effects of changes in foreign currency rates
| | | (15,480) |
Other, net
| | | 1,553 |
Earnings for the period ended September 30, 2015
| | $
| 126,641 |
2019. Adjusted Industrial segment earnings as a percentage of segment net sales were 14.4%11.2% for fiscal year 2015,2019 compared to 14.6%11.0% for fiscal year 2014.2018. Excluding the impact of the change in accounting following the adoption of ASC 606, adjusted Industrial segment earnings as a percent of segment net sales were 11.6%. The slight decreaseincrease in Industrial segment earnings in fiscal year 2019 was primarily due to earnings attributable to Woodward L’Orange and higher organic sales volume, partially offset by unfavorable sales mix, an unfavorable engine warranty expense, and higher other costs primarily including an increase in variable compensation. Excluding Industrial segment losses attributable the renewable power systems business for fiscal year 2019 and earnings attributable to the renewable power systems for fiscal year 2018, adjusted segment earnings for fiscal year 20152019 were 13.3% of Industrial segment net sales excluding net sales attributable to the renewable power systems business, compared to 12.0% of Industrial segment net sales excluding net sales attributable to the renewable power systems business for fiscal year 2018.
Nonsegment expenses
Nonsegment expenses increased to $119,447 for fiscal year 2019, compared to $100,078 for fiscal year 2018. Included in nonsegment expenses for fiscal year 2019 were charges in the amount of $27,089 related to the relocation of our Duarte, California operations to our newly renovated Drake campus in Fort Collins, Colorado (“Duarte move related costs”) and charges in the amount of $12,601 related to the impairment of accounts receivable, inventory and certain other assets in the fourth quarter of fiscal year 2019 in connection with Senvion, a significant customer of Woodward’s renewables business, which declared insolvency in fiscal year 2019. Included in nonsegment expenses for fiscal year 2018 were certain special charges related to the acquisition of Woodward L’Orange (“L’Orange Acquisition Related Charges”), as well as Duarte move related costs of $6,165. The L’Orange Acquisition Related Charges recognized in fiscal year 2018 included (i) merger and acquisition transaction and integration costs of $5,208, (ii) costs associated with an at-the-money-forward option (the “Forward Option”) of $5,543, (iii) warranty and indemnity insurance costs associated with the L’Orange Acquisition $4,293, and (iv) German real estate transfer tax costs associated with the L’Orange Acquisition of $3,385. Excluding these charges from both 2019 and 2018, nonsegment expenses for fiscal year 2019 were higher compared to fiscal year 2014 was primarily attributable to the unfavorable impact of changes in foreign currency exchange rates, partially offset by the effects of increased sales volume.
Nonsegment expenses
Nonsegment expenses increased to $49,362 for fiscal year 2015, compared to $43,701 for fiscal year 2014. As a percent of sales, nonsegment expenses increased to 2.4% of net sales for fiscal year 2015, compared to 2.2% of net sales for fiscal year 2014. The increase in nonsegment expenses in fiscal year 2015 was2018 primarily due to normal variabilityan increase in costs,variable compensation related to the strong financial performance in the fiscal year, as well as costs associatedan increase in certain expenses to support ongoing company growth.
For a discussion of the 2018 Results of Operations, including a discussion of the financial results for the fiscal year ended September 30, 2018 compared to the fiscal year ended September 30, 2017, refer to Part I, Item 7 of our Form 10-K filed with the completion of the joint venture agreement between Woodward and GE of approximately $2,000.SEC on November 13, 2018.
LIQUIDITYLIQUIDITY AND CAPITAL RESOURCES
Historically, we have satisfied our working capital needs, as well as capital expenditures, product development and other liquidity requirements associated with our operations, with cash flow provided by operating activities and borrowings under our credit facilities. Historically, we have also issued debt to supplement our cash needs, or repay our other indebtedness.indebtedness, or finance our acquisitions. We expect that cash generated from our operating activities, together with borrowings under our revolving credit facility and other borrowing capacity, will be sufficient to fund our continuing operating needs, including capital expansion funding for the foreseeable future. The adoption of ASC 606 does not impact net cash flow from operations nor free cash flow.
Our aggregate cash and cash equivalents were $81,090$99,073 at September 30, 20162019 and $82,202$83,594 at September 30, 2015,2018, and our working capital was $463,811$563,792 at September 30, 20162019 and $579,211$523,619 at September 30, 2015.2018. Of the $81,090 of cash and cash equivalents held at September 30, 2016, $80,7452019, $92,790 was held by our foreign locations. We are not presently aware of any significant restrictions on the repatriation of these funds, although a portion is considered indefinitely reinvested in these foreign subsidiaries. If these funds were needed to fund our operations or satisfy obligations in the United States, then they could be repatriated and their repatriation into the United States may cause us to incur additional U.S. income taxes or foreign withholding taxes. Any additional U.S. taxes could be offset, in part or in whole, by foreign tax credits. The amount of such taxes and application of tax credits would be dependent on the income tax laws and other circumstances at the time these
amounts are repatriated. Based on these variables, it is impractical to determine the income tax liability that might be incurred if these funds were to be repatriated. The additional uncertainty associated with the Tax Act increases the impracticality of determining this income tax liability.
On September 23, 2016, WoodwardWe do not believe the one-time repatriation tax on deferred foreign income resulting from the Tax Act, which is expected to be paid over an eight year period that began in January 2019, will have a significant impact on our cash flows in any individual fiscal year.
Consistent with common business practice in China, our Chinese subsidiaries accept bankers’ acceptance notes from Chinese customers, in settlement of certain customer accounts receivable. Bankers’ acceptance notes are financial instruments issued by Chinese financial institutions as part of financing arrangements between the financial institution and a wholly owned subsidiarycustomer of Woodward entered into the 2016 Note Purchase Agreements relatingfinancial institution. Bankers’ acceptance notes represent a commitment by the issuing financial institution to pay a certain amount of money at a specified future maturity date to the salelegal owner of an aggregate principal amountthe bankers’ acceptance note as of €160,000the maturity date. The maturity date of senior unsecuredbankers’ acceptance notes varies, but it is our policy to only accept bankers’ acceptance notes with maturity dates no more than 180 days from the date of our receipt of such draft. The issuing financial institution is the obligor, not our customers. Upon our acceptance of a bankers’ acceptance note from a customer, such customer has no further obligation to pay us for the related accounts receivable balance. We had bankers’ acceptance notes of $42,171 at September 30, 2019 and $23,191 at September 30, 2018 recorded as non-customer accounts receivable in a series of private placement transactions. Theour Consolidated Balance Sheets. We only accept bankers’ acceptance notes issued underby banks that are believed to be creditworthy and to which the 2016 Note Purchase Agreements have not been registered undercredit risks associated with the Securities Act of 1933, or elsewhere, and they may notbankers’ acceptance notes are believed to be offered or sold in the United States absent registration or an applicable exemption from registration requirements. Holders of the notes under the 2016 Note Purchase Agreements are not entitled to any registration rights. For further discussion of the 2016 Note Purchase Agreements, see Note 12, Credit facilities, short-term borrowings and long-term debt in the Notes to the Consolidated Financial Statements in “Item 8 – Financial Statements and Supplementary Data.” We used the net proceeds from the issuance of the notes to repay amounts outstanding underlow.
On June 19, 2019, we amended our revolving credit agreement.
agreement to, among other things, extend the termination date of the revolving loan commitments of the lenders thereunder from April 28, 2020 to June 19, 2024. Our revolving credit facility, matures in April 2020 andas amended, provides a borrowing capacity of up to $1,000,000 with the option to increase total available borrowings to up to $1,200,000,$1,500,000, subject to lenders’ participation. We can borrow against our $1,000,000 revolving credit facility as long as we are in compliance with all of our debt covenants. Borrowings under the revolving credit facility can be made in U.S. dollars or in foreign currencies other than the U.S. dollar provided that the U.S. dollar equivalent of any foreign currency borrowings and U.S. dollar borrowings does not, in total, exceed the borrowing capacity of the revolving credit facility. Historically, we have used borrowings under our revolving credit facilities to meet certain short-term working capital needs, as well as for strategic uses, including repurchases of our common stock, payments of dividends, acquisitions, and facilitiesfacility expansions. On October 1, 2018, we paid the entire principal balance of $100,000 on our 6.39% Series D Notes and on April 3, 2019, we paid the entire principal balance of $43,000 on our 8.24% unsecured Series F notes using in both instances proceeds from borrowings under our revolving credit facility.
In addition to our revolving credit facility, we have various foreign credit facilities, some of which are tied to net amounts on deposit at certain foreign financial institutions. These foreign credit facilities are reviewed annually for renewal. We use borrowings under these foreign credit facilities to finance certain local operations on a periodic basis. For further discussion of our $1,000,000 revolving credit facility and our other credit facilities, see Note 12, 14, Credit facilities, short-term borrowings and long-term debt in the Notes to the Consolidated Financial Statements in “ItemPart II, Item 8 – Financial Statements and Supplementary Data.”of this Form 10-K.
On October 1, 2015, Woodward paid the entire principal balance of $50,000 on the Series C notes, and on April 4, 2016, Woodward paid the entire principal balance of $57,000 on the Series E notes. The Series C notes and the Series E notes are described at Note 12, Credit facilities, short-term borrowings and long-term debt in the Notes to the Consolidated Financial Statements in “Item 8 – Financial Statements and Supplementary Data.” These payments were made using borrowings on our revolving credit facility.
At September 30, 2016,2019, we had total outstanding debt of $729,244 $1,084,899 consisting of outstanding amounts under our revolving credit facility and various series of unsecured notes due between 20182020 and 2031, with2033, and amounts borrowed under our revolving credit facility. At September 30, 2019, we had additional borrowing availability of $835,470$726,725 under our revolving credit facility, net of outstanding letters of credit, and additional borrowing availability of $44,001$7,571 under various foreign credit facilities. For further discussionfacilities
At September 30, 2019, we had $262,297 of borrowings outstanding under our indebtednessrevolving credit facility, $220,000 of which was classified as short-term borrowings based on our intent and ability to pay this amount in the next twelve months. Of these borrowings, as of September 30, 2019, $242,600 is denominated in U.S. dollars and €18,000 is denominated in Euro. Revolving credit facility and short-term borrowing activity during the fiscal year ended September 30, 2019 were as follows:
|
|
|
|
|
|
Maximum daily balance during the period | $ | 449,802 |
Average daily balance during the period | $ | 358,306 |
Weighted average interest rate on average daily balance |
| 3.54% |
We believe we were in compliance with all our additional borrowing capacity, seedebt covenants as of September 30, 2019. See Note 12, 14, Credit facilities, short-term borrowings and long-term debt in the Notes to the Consolidated Financial Statements in “Item 8 – Financial Statements and Supplementary Data.Supplemental Data,”
At September 30, 2016, we had $156,700 of borrowings outstanding under our revolving credit facility, of which $150,000 was classified as short-term and the remainder was classified as long-term.Revolving credit facility and short-term borrowing activity during the fiscal year ended September 30, 2016 were as follows:
| | |
| | |
Maximum daily balance during the period
| $
| 555,000 |
Average daily balance during the period
| $
| 463,028 |
Weighted average interest rate on average daily balance
| | 1.59% |
We believe we were in compliance with all our debt covenants at September 30, 2016. See Note 12, Credit facilities, short-term borrowings and long-term debt, to the Consolidated Financial Statements in “Item 8 – Financial Statements and Supplementary Data” for more information about our covenants.
In addition to utilizing our cash resources to fund the working capital needs of our business, we evaluate additional strategic uses of our funds, including the repurchase of our common stock, payment of dividends, significant capital expenditures, consideration of strategic acquisitions and other potential uses of cash.
In fiscal year 2018, we entered into the L’Orange Agreement. Pursuant to the L’Orange Agreement, we agreed to acquire all of the outstanding shares of stock of L’Orange. We completed the acquisition of L’Orange on June 1, 2018, for total consideration (including cash consideration and the assumption of certain liabilities) of €700,000, or approximately $811,000. The cash consideration was financed through the use of cash on hand, the issuance of senior unsecured notes and $167,420 borrowed under our revolving credit facility. In connection with these borrowings, we entered into cross currency swap transactions, which effectively lowered the interest rate on each tranche of the senior unsecured notes, and the borrowings under our revolving credit agreement (see Note 8, Derivative instruments and hedging activities in the Notes to the Consolidated Financial Statements in Part II, Item 8 of this Form 10-K for more information).
On April 18, 2018, we entered into the Forward Option at a cost of $5,543 to manage our exposure to fluctuations in the Euro prior to the anticipated close of the L’Orange Acquisition. We did not enter into the Forward Option for trading or speculative purposes. On May 30, 2018, we had the ability to exercise the option to purchase €490,000 on June 1, 2018 using U.S. dollars at a fixed exchange rate of 1.2432. As the spot rate was below 1.2432 on May 30, 2018, we elected not to exercise the option and a loss of $5,543 was recognized on the Forward Option in “other (income) expense, net” in the Consolidated Statements of Earnings in the fiscal year ended September 30, 2018.
Our ability to service our long-term debt, to remain in compliance with the various restrictions and covenants contained in our debt agreements, and to fund working capital, capital expenditures and product development efforts will depend on our ability to generate cash from operating activities, which in turn is subject to, among other things, future operating performance as well as general economic, financial, competitive, legislative, regulatory, and other conditions, some of which may be beyond our control.
On January 4, 2016, we consummated the formation of a strategic joint venture between Woodward and GE. GE purchased from Woodward a 50% ownership interest in the JV for a $250,000 cash payment to Woodward. In addition, GE will pay contingent consideration to Woodward consisting of fifteen annual payments of $4,894 per year beginning January 4, 2017 subject to certain claw-back conditions. The $250,000 cash consideration received from GE on January 4, 2016 is taxable in the U.S. upon receipt. The taxes of approximately $95,000 associated with this cash consideration were paid through estimated payments made during fiscal year 2016.
As previously announced, we completed $125,000 of share repurchases through an accelerated stock repurchase program in second half of fiscal year 2015. This was part of a previously announced $250,000 stock repurchase initiative. In the first quarter of fiscal year 2016, we executed2017, our board of directors terminated our prior stock repurchase program and replaced it with a 10b5-1 plan tonew program for the repurchase of up to $125,000$500,000 of ourWoodward’s outstanding shares of common stock foron the open market or in privately negotiated transactions over a three year period that ended on April 20, 2016. During thein November 2019 (the “2017 Authorization”). In fiscal year ended September 30, 2016,2019, we purchased 2,635repurchased 1,102 shares of our common stock for $125,000$110,311 under the 2017 Authorization pursuant to a 10b5-1 plan, using a portion of the $250,000 received from GE.
For our Aerospace segment,plan. We purchased no stock in fiscal year 2015 we completed construction2018.
Effective upon the expiration of the 2017 Authorization, our board of directors approved a manufacturing and office buildingnew program for the repurchase of up to $500,000 of our outstanding shares of common stock on the open market or in privately negotiated transactions over a second campusthree year period that will end in the greater-Rockford, Illinois area and have since occupied the new facility in anticipation of beginning serial production of new narrow-body product lines beginning in2022.
In fiscal year 2017. This campus is intended2018, we announced our decision to supportrelocate our Duarte, California operations to the expected growth in our Aerospace segment over the next ten years and beyond, as a result of our being awarded a substantial number of new system platforms, particularly on narrow-body aircraft. We have been purchasing production equipment for the second campus and anticipate continuing such purchases as new aircraft platforms ramp up to full production volumes.
We completed construction of a new campus at our corporate headquartersCompany’s newly renovated Drake Campus in Fort Collins, Colorado to support the future growth of our Industrial segment by supplementing our existing Colorado manufacturing facilities and corporate headquarters. We began occupying the new manufacturing facility during the second quarter ofin fiscal year 20162019, we finalized the relocation. There are currently no operations in the Duarte, California facility, and the sale of the plant and related property is expected to close by March 31, 2020. The carrying value of the assets at the Duarte facility in California was $7,769 as of September 30, 2019, all of which we continuehave identified as assets held for sale as of that date. The assets held for sale relate to purchase production equipment for this new campus. the land, building and building improvements, and other assets at the Duarte facility. Based on current market conditions, we expect to record a gain on the eventual sale of these assets.
We believe that cash flows from operations, along with our contractually committed borrowings and other borrowing capability, will continue to be sufficient to fund anticipated capital spending requirements and our operations for the foreseeable future. However, we could be adversely affected if the financial institutions providing our capital requirements refuse to honor their contractual commitments, cease lending, or declare bankruptcy. We believe the lending institutions participating in our credit arrangements are financially stable.
Cash Flows
|
|
|
|
|
|
|
|
| Year Ended September 30, |
| 2019 |
| 2018 |
Net cash provided by operating activities | $ | 390,608 |
| $ | 299,292 |
Net cash used in investing activities |
| (102,527) |
|
| (896,567) |
Net cash (used in) provided by financing activities |
| (265,599) |
|
| 605,998 |
Effect of exchange rate changes on cash and cash equivalents |
| (7,003) |
|
| (12,681) |
Net change in cash and cash equivalents |
| 15,479 |
|
| (3,958) |
Cash and cash equivalents, including restricted cash, at beginning of year |
| 83,594 |
|
| 87,552 |
Cash and cash equivalents, including restricted cash, at end of period | $ | 99,073 |
| $ | 83,594 |
Cash Flows
| | | | | | | | |
| Year Ended |
| September 30, |
| 2016 | | 2015 | | | 2014 |
Net cash provided by operating activities | $ | 435,379 | | $ | 295,990 | | $ | 273,570 |
Net cash used in investing activities | | (173,946) | | | (284,083) | | | (205,829) |
Net cash provided by (used in) financing activities | | (260,993) | | | (34,006) | | | 3,990 |
Effect of exchange rate changes on cash and cash equivalents | | (1,552) | | | (10,986) | | | (5,000) |
Net change in cash and cash equivalents | | (1,112) | | | (33,085) | | | 66,731 |
Cash and cash equivalents at beginning of period | | 82,202 | | | 115,287 | | | 48,556 |
Cash and cash equivalents at end of period | $ | 81,090 | | $ | 82,202 | | $ | 115,287 |
20162019 Cash Flows Compared to 20152018
Net cash flows provided by operating activities for fiscal year 20162019 was $435,379,$390,608, compared to $295,990 in$299,292 for fiscal year 2015.2018. The increase in net cash provided by operating activities in fiscal year 2019 compared to fiscal year 2018 is primarily attributable to increased earnings and the after-tax proceeds relatedtiming of certain cash payments for accounts payable in fiscal year 2019, partially offset by the increased investment in inventories to the formation of the JV between Woodward and GE. support an increase in sales.
Net cash flows used in investing activities for fiscal year 20162019 was $173,946,$102,527, compared to $284,083$896,567 in fiscal year 2015.2018. The decrease in cash used in investing activities compared to the same period of the prior fiscal year is due to decreased payments for capital expenditures. Payments for property, plant and equipment decreased by $110,920 to $175,692 in fiscal year 2016 as compared to $286,612 in fiscal year 2015 related mainly to the development of a second campus in the greater-Rockford, Illinois area, the new facility in Niles, Illinois, and the new campus at our Fort Collins, Colorado headquarters. The manufacturing and office building in the greater-Rockford, Illinois area and the new facility in Niles, Illinois were both completed in fiscal year 2015. Our Fort Collins campus was completed in fiscal year 2016.
Net cash flows used in financing activities for fiscal year 2016 was $260,993, compared to $34,006 in fiscal year 2015. During fiscal year 2016, we had net debt payments of $123,875 compared to net debt borrowings of $143,361 in fiscal year 2015. We utilized $125,000 to repurchase 2,635 shares of our common stock in fiscal year 2016 under our existing stock repurchase program, compared to $157,160 to repurchase 3,128 shares of our common stock in fiscal year 2015.
2015 Cash Flows Compared to 2014
Net cash flows provided by operating activities for fiscal year 2015 was $295,990, compared to $273,570 in fiscal year 2014. The increase is primarily attributable to increased earnings in fiscal year 2015 as compared to fiscal year 2014.
Net cash flows used in investing activities for fiscal year 2015 was $284,083, compared to $205,829 in fiscal year 2014. The increase in cash used in investing activities in fiscal year 2015 as2019 compared to fiscal year 2014 was2018 is primarily due to increasescash used for the acquisition of L’Orange on June 1, 2018 and a decrease in capital expenditures. Paymentspayments for property plant and equipment, increasedpartially offset by $79,506 to $286,612an increase in fiscal year 2015 as compared to $207,106 in fiscal year 2014 related mainly to the developmentnet payments for purchases of a second campus in the greater-Rockford, Illinois area, the new facility in Niles, Illinois, and the new campus at our Fort Collins, Colorado headquarters.short-term investments.
Net cash flows used in financing activities for fiscal year 20152019 was $34,006,$265,599, compared to net cash flows provided by financing activities of $3,990$605,998 in fiscal year 2014. During2018. In fiscal year 2015,2019, we repurchased 1,102 shares of our common stock for $110,311 pursuant to a 10b5-1 plan under the 2017 Authorization. We made no stock repurchases in fiscal year 2018. Also during fiscal year 2019, we had net debt payments of $150,028 and had cash dividends paid of $39,066. The net cash flows provided by financing activities in fiscal year 2018 is primarily the result of the issuance of an aggregate principal amount of $400,000 of long-term debt in May 2018 and borrowings of $167,420 under our revolving credit facility, both of which were used primarily to finance the acquisition of L’Orange. Also during fiscal year 2018, we had net debt borrowings unrelated to the acquisition of $143,361 comparedL’Orange in the amount of $70,486, partially offset by cash dividends paid of $34,003 and payments of $5,543 for the settlement of the Forward Option.
For a discussion of the 2018 Cash Flows Compared to net debt borrowings of $160,002 in fiscal year 2014. We utilized $157,1602017, refer to repurchase 3,128 sharesPart I, Item 7 of our common stock in fiscal year 2015 under our existing stock repurchase program, compared to $141,488 to repurchase 3,272 shares of our common stock in fiscal year 2014.Form 10-K filed with the SEC on November 13, 2018
Off-Balance Sheet Arrangements
As of September 30, 2016,2019, we did not have any off-balance sheet arrangements, as defined in Item 303(a)(4)(ii) of Regulation S-K promulgated by the SEC, that have or are reasonably likely to have a current or future effect on our financial condition, changes in our financial condition, revenues, or expenses, results of operations, liquidity, capital expenditures, or capital resources, that are material to investors.
Contractual Obligations
A summary of our consolidated contractual obligations and commitments as of September 30, 20162019 is as follows:
| | | | | | | | | | | | | | | | | |
| | | | | | | | | | | | | | | | | |
| Year Ending September 30, |
| 2017 | | 2018 | | 2019 | | 2020 | | 2021 | | Thereafter |
| | (in thousands) |
Long-term debt principal | $ | - | | $ | - | | $ | 143,000 | | $ | - | | $ | 100,000 | | $ | 329,544 |
Interest on debt obligations (1) | | 21,224 | | | 21,224 | | | 13,091 | | | 11,290 | | | 8,978 | | | 37,314 |
Operating leases | | 4,755 | | | 3,150 | | | 2,175 | | | 2,003 | | | 1,899 | | | 1,630 |
Capital leases | | 404 | | | 423 | | | 444 | | | 113 | | | - | | | - |
Purchase obligations (2) | | 303,567 | | | 14,642 | | | 685 | | | 639 | | | 93 | | | 10 |
Other (3) | | - | | | - | | | - | | | - | | | - | | | 23,526 |
Total | $ | 329,950 | | $ | 39,439 | | $ | 159,395 | | $ | 14,045 | | $ | 110,970 | | $ | 392,024 |
| (1)
| | Interest obligations on floating rate debt instruments are calculated for future periods using interest rates in effect as of September 30, 2016. See Note 12, Credit facilities, short-term borrowings and long-term debt, to the Consolidated Financial Statements in “Item 8 – Financial Statements and Supplementary Data” for further details on our long-term debt.
|
| (2)
| | Purchase obligations include amounts committed under legally enforceable contracts or purchase orders for goods and services with defined terms as to price, quantity, delivery, and termination liability.
|
| (3)
| | The $23,526 included in other obligations in the “Thereafter” column represents our best reasonable estimate for uncertain tax positions at this time and may change in future periods, as the timing of the payments and whether such payments will actually be required cannot be reasonably estimated.
|
|
|
|
|
|
|
|
|
|
|
|
|
|
|
|
|
|
|
|
|
|
|
|
|
|
|
|
|
|
|
|
|
|
|
|
|
| Year Ending September 30, |
| 2020 |
| 2021 |
| 2022 |
| 2023 |
| 2024 |
| Thereafter |
|
| (in thousands) |
Long-term debt principal | $ | - |
| $ | 100,000 |
| $ | - |
| $ | - |
| $ | 75,000 |
| $ | 650,080 |
Interest on debt obligations (1) |
| 21,752 |
|
| 20,182 |
|
| 17,765 |
|
| 17,478 |
|
| 16,254 |
|
| 61,408 |
Operating leases |
| 6,667 |
|
| 5,119 |
|
| 3,823 |
|
| 2,899 |
|
| 2,378 |
|
| 6,033 |
Capital leases |
| 213 |
|
| 98 |
|
| 33 |
|
| 3 |
|
| - |
|
| - |
Purchase obligations (2) |
| 419,944 |
|
| 13,335 |
|
| 1,155 |
|
| - |
|
| - |
|
| - |
Other (3) |
| - |
|
| - |
|
| - |
|
| - |
|
| - |
|
| 10,305 |
Total | $ | 448,576 |
| $ | 138,734 |
| $ | 22,776 |
| $ | 20,380 |
| $ | 93,632 |
| $ | 727,826 |
(1)Interest obligations on floating rate debt instruments are calculated for future periods using interest rates in effect as of September 30, 2019. See Note 14, Credit facilities, short-term borrowings and long-term debt, in the Notes to the Consolidated Financial Statements in “Item 8 – Financial Statements and Supplementary Data” for further details on our long-term debt.
(2)Purchase obligations include amounts committed under legally enforceable contracts or purchase orders for goods and services with defined terms as to price, quantity, delivery, and termination liability.
(3)The $10,305 included in other obligations in the “Thereafter” column represents our best reasonable estimate for uncertain tax positions at this time and may change in future periods, as the timing of the payments and whether such payments will actually be required cannot be reasonably estimated.
The above table does not reflect the following items:
| ·
| | As of September 30, 2016, there were $156,700 of outstanding borrowings on our revolving credit facility, of which $150,000 were classified as short-term based on our intent and ability to pay this amount in the next twelve months. Our revolving credit facility matures in April 2020.
|
| ·
| | Contributions to our retirement pension benefit plans, which we estimate will total approximately $713 in fiscal year 2017. As of September 30, 2016 our pension plans were underfunded by $24,137 based on projected benefit obligations. Statutory pension contributions in future fiscal years will vary as a result of a number of factors, including actual plan asset returns and interest rates.
|
| ·
| | Contributions to our other postretirement benefit plans, which we estimate will total $4,039 in fiscal year 2017. Other postretirement contributions are made on a “pay-as-you-go” basis as payments are made to healthcare providers, and such contributions will vary as a result of changes in the future cost of postretirement healthcare benefits provided for covered retirees. As of September 30, 2016, our other postretirement benefit plans were underfunded by $35,630 based on projected benefit obligations.
|
| ·
| | Business commitments made to certain customers to perform under long-term product development projects, some of which may result in near-term financial losses. Such losses, if any, are recognized when they become likely to occur.
|
As of September 30, 2019, there were $262,297 of outstanding borrowings on our revolving credit facility, $220,000 of which were classified as short-term based on our intent and ability to pay this amount in the next twelve months. Our revolving credit facility matures in June 2024.
Contributions to our retirement pension benefit plans, which we estimate will total approximately $1,952 in fiscal year 2020. As of September 30, 2019 our pension plans were net underfunded by $62,997 based on projected benefit obligations. Statutory pension contributions in future fiscal years will vary as a result of a number of factors, including actual plan asset returns and interest rates.
Contributions to our other postretirement benefit plans, which we estimate will total $3,237 in fiscal year 2019. Other postretirement contributions are made on a “pay-as-you-go” basis as payments are made to healthcare providers, and such contributions will vary as a result of changes in the future cost of postretirement healthcare benefits provided for covered retirees. As of September 30, 2019, our other postretirement benefit plans were underfunded by $26,671 based on projected benefit obligations.
Business commitments made to certain customers to perform under long-term product development projects, some of which may result in near-term financial losses. Such losses, if any, are recognized when they become likely to occur.
In connection with the sale of the Fuel & Pneumatics product line during fiscal year 2009, Woodward assigned to a subsidiary of the purchaser its rights and responsibilities related to certain contracts with the U.S. Government. Woodward provided to the U.S. Government a customary guarantee of the purchaser’s subsidiary’s obligations under the contracts. The purchaser and its affiliates have agreed to indemnify Woodward for any liability incurred with respect to the guarantee.
Guarantees and letters of credit totaling approximately $8,073$11,242 were outstanding as of September 30, 2016,2019, some of which were secured by parent guarantees from Woodward, or by WoodwardWoodward’s line of credit facilities.
In the event of a change in control of Woodward, as defined in change-in-control agreements with our current corporate officers, we may be required to pay termination benefits to such officers.
New Accounting Standards
From time to time, the Financial Accounting Standards Board (“FASB”)FASB or other standards-setting bodies issue new accounting pronouncements. Updates to the FASB Accounting Standards Codification are communicated through issuance of an Accounting Standards Update.
To understand the impact of recently issued guidance, whether adopted or to be adopted, please review the information provided in Note 2, New accounting standards and Note 3, Revenue, in the Notes to the Consolidated Financial Statements included in “Item 8 – Financial Statements and Supplementary Data. Unless otherwise discussed, we believe that the impact of recently issued guidance, whether
adopted or to be adopted in the future, is not expected to have a material impact on our Consolidated Financial Statements upon adoption.
To understandNon-U.S. GAAP Financial Measures
Organic net sales, organic Industrial segment net sales, constant currency organic Industrial segment net sales, adjusted net earnings, adjusted earnings per share, adjusted Industrial segment earnings, adjusted Industrial segment earnings excluding the renewable power systems business, Industrial segment net sales excluding net sales attributable to the renewable power systems business, EBIT, adjusted EBIT, EBITDA, adjusted EBITDA, and free cash flow are financial measures not prepared and presented in accordance with U.S. GAAP. However, we believe these non-U.S. GAAP financial measures provide additional information that enables readers to evaluate our business from the perspective of management.
Organic net sales and organic Industrial net sales
The Company presents certain sales measures excluding Woodward L’Orange net sales, which it refers to as “organic,” to show the changes to Woodward’s historical business. Management believes this improves comparability to the Company’s performance prior to the L’Orange Acquisition, which occurred in June 2018.
Constant currency organic Industrial segment net sales
The Company presents certain sales measures excluding the impact of recently issued guidance, whether adoptedcurrency exchange rate fluctuations, which is refers to as being presented on a “constant currency basis.” The Company calculates sales measures on a constant currency basis by applying the foreign currency exchange rate in effect during the prior year comparative period to the current year sales measure in its local currency. The sales measures, when calculated on a constant currency basis, are intended to supplement our reported operating results and, when considered in conjunction with the corresponding U.S. GAAP measures, facilitate a better understanding of changes in the metrics from period to period and the core operations of the Company.
Industrial segment net sales excluding net sales attributable to the renewable power systems business
The Company presents adjusted Industrial segment net earnings excluding its renewable power systems business as a percent of Industrial segment net sales excluding net sales attributable to its renewable power systems business. The Company’s calculation of adjusted Industrial segment net earnings excluding its renewable power systems business is discussed below. The Company calculates Industrial segment net sales excluding net sales attributable to its renewable power systems business by removing the net sales of its renewable power systems business from the net sales of its Industrial segment. The Company believes this illustrates how the Industrial segment of the business is performing without the renewable power systems business and provides more comparable year-over-year information with regards to the core sales performance of the Industrial segment.
The reconciliation of Industrial segment net sales excluding net sales attributable to its renewable power systems business, for the fiscal years ended September 30, 2019 and September 30, 2018 is shown in the table below.
|
|
|
|
|
|
|
|
| Year Ended September 30, |
|
| 2019 |
| 2018 |
Industrial segment net sales (U.S. GAAP) |
| $ | 1,019,677 |
| $ | 767,885 |
Renewable power systems net sales |
|
| (58,477) |
|
| (89,261) |
Industrial segment net sales excluding net sales attributable to renewable power systems (Non-U.S. GAAP) |
| $ | 961,200 |
| $ | 678,624 |
|
|
|
|
|
|
|
Earnings based non-U.S. GAAP financial measures
Adjusted net earnings is defined by the Company as net earnings excluding, as applicable, (i) restructuring charges, (ii) Duarte move related costs, (iii) the purchase accounting impacts related to the revaluation of the Woodward L’Orange inventory recognized in cost of goods sold and the amortization of the backlog intangible, (iv) the L’Orange Acquisition transaction and integration costs, (v) cost associated with the Forward Option, (vi) warranty and indemnity insurance costs associated with the acquisition of Woodward L’Orange, (vii) German real estate transfer tax costs associated with the
acquisition of Woodward L’Orange, (viii) costs related to the fourth quarter of fiscal year 2019 impairment of accounts receivable, inventory and certain other assets in connection with Senvion, a significant customer of Woodward renewables business, which declared insolvency in fiscal year 2019, and (ix) the transition impacts of the change in U.S. federal tax legislation in December 2017. The Company believes that these excluded items are short-term in nature, not directly related to the ongoing operations of the business and therefore, the exclusion of them illustrates more clearly how the underlying business of Woodward is performing. The Company uses adjusted net earnings in evaluating the Company’s performance excluding these infrequent or unusual period expenses that are not necessarily indicative of the Company’s operating performance for the period. The Company defines adjusted earnings per share as adjusted net earnings, as defined above, divided by the weighted-average number of diluted shares of common stock outstanding for the period. The Company uses both adjusted net earnings and adjusted earnings per share when comparing operating performance to other periods which may not have similar infrequent or unusual charges.
The reconciliation of net earnings and earnings per share to adjusted net earnings and adjusted earnings per share, respectively, for the fiscal years ended September 30, 2019 and September 30, 2018 are shown in the tables below.
|
|
|
|
|
|
|
|
|
|
|
|
|
|
| Year Ended September 30, |
|
| 2019 |
| 2018 |
|
| Net Earnings |
| Earnings Per Share |
| Net Earnings |
| Earnings Per Share |
Net earnings (U.S. GAAP) |
| $ | 259,602 |
| $ | 4.02 |
| $ | 180,378 |
| $ | 2.82 |
Non-U.S. GAAP adjustments: |
|
|
|
|
|
|
|
|
|
|
|
|
Restructuring charges, net of tax |
|
| - |
|
| - |
|
| 12,674 |
|
| 0.20 |
Duarte move related costs, net of tax |
|
| 20,385 |
|
| 0.32 |
|
| 4,414 |
|
| 0.07 |
Purchase accounting impact, net of tax1 |
|
| 14,964 |
|
| 0.23 |
|
| 24,591 |
|
| 0.38 |
L'Orange Acquisition transaction and integration costs, net of tax |
|
| - |
|
| - |
|
| 3,758 |
|
| 0.06 |
Costs associated with the Forward Option, net of tax |
|
| - |
|
| - |
|
| 3,880 |
|
| 0.06 |
Warranty and indemnity insurance costs associated with the acquisition of Woodward L'Orange, net of tax |
|
| - |
|
| - |
|
| 3,005 |
|
| 0.05 |
German real estate transfer costs associated with the acquisition of Woodward L'Orange, net of tax |
|
| - |
|
| - |
|
| 2,370 |
|
| 0.04 |
Impairment of Senvion related assets, net of tax |
|
| 8,937 |
|
| 0.14 |
|
| - |
|
| - |
Sub-total non-U.S. GAAP adjustments |
|
| 44,286 |
|
| 0.69 |
|
| 54,692 |
|
| 0.86 |
Impact of December 2017 changes to U.S. tax law |
|
| 10,588 |
|
| 0.17 |
|
| 10,860 |
|
| 0.17 |
Total non-U.S. GAAP adjustments |
|
| 54,874 |
|
| 0.86 |
|
| 65,552 |
|
| 1.03 |
Adjusted net earnings (Non-U.S. GAAP) |
| $ | 314,476 |
| $ | 4.88 |
| $ | 245,930 |
| $ | 3.85 |
|
|
|
|
|
|
|
|
|
|
|
|
|
(1)The purchase accounting impacts relate to the revaluation of the Woodward L’Orange inventory recognized in cost of goods sold for the fiscal year ended September 30 2018, and the amortization of the Woodward L’Orange backlog intangible for the fiscal years ended September 30, 2019 and September 30, 2018.
Adjusted Industrial segment earnings is defined by the Company as Industrial segment earnings excluding the purchase accounting impacts related to the revaluation of the L’Orange inventory recognized in cost of goods sold and the amortization of the backlog intangible. The Company believes that these purchase accounting impacts are short-term in nature, not related to the ongoing operations of the Industrial segment business and therefore, the exclusion of them illustrates more clearly how the underlying business of Woodward’s Industrial segment is performing. The Company believes adjusted Industrial segment earnings excluding the renewable power systems business further illustrates how the Industrial segment of the business is performing without the renewable power systems business and provides more comparable year-over-year information with regards to the core performance of the Industrial segment.
The reconciliation of Industrial segment earnings to adjusted Industrial segment earnings and adjusted Industrial segment earnings excluding the renewable power systems business for the fiscal years ended September 30, 2019 and September 30, 2018 are shown in the table below.
|
|
|
|
|
|
|
|
| Year Ended September 30, |
|
| 2019 |
| 2018 |
Industrial segment earnings (U.S. GAAP) |
| $ | 93,521 |
| $ | 49,894 |
Purchase accounting impacts1 |
|
| 21,100 |
|
| 34,385 |
Adjusted Industrial segment earnings (Non-U.S. GAAP) |
|
| 114,621 |
|
| 84,279 |
Renewable power systems losses (earnings) |
|
| 12,855 |
|
| (2,994) |
Adjusted Industrial segment earnings excluding renewable power systems business (Non-U.S. GAAP) |
| $ | 127,476 |
| $ | 81,285 |
|
|
|
|
|
|
|
(1)The purchase accounting impacts relate to the revaluation of the Woodward L’Orange inventory recognized in cost of goods sold for the fiscal year ended September 30 2018, and the amortization of the Woodward L’Orange backlog intangible for the fiscal years ended September 30, 2019 and September 30, 2018.
Management uses EBIT to evaluate Woodward’s performance without financing and tax related considerations, as these elements may not fluctuate with operating results. Management uses EBITDA in evaluating Woodward’s operating performance, making business decisions, including developing budgets, managing expenditures, forecasting future periods, and evaluating capital structure impacts of various strategic scenarios. Securities analysts, investors and others frequently use EBIT and EBITDA in their evaluation of companies, particularly those with significant property, plant, and equipment, and intangible assets subject to amortization. The Company believes that EBIT and EBITDA are useful measures to the investor when measuring operating performance as they eliminate the impact of financing and tax expenses, which are non-operating expenses and may be driven by factors outside of our operations, such as changes in tax laws or regulations, and, in the case of EBITDA, the noncash charges associated with depreciation and amortization. Further, as interest from financing, income taxes, depreciation and amortization can vary dramatically between companies and between periods, management believes that the removal of these items can improve comparability.
Adjusted EBIT and adjusted EBITDA represent further non-U.S. GAAP adjustments to EBIT and EBITDA, in each case adjusted to exclude, as applicable, (i) restructuring charges, (ii) Duarte move related costs, (iii) the purchase accounting impacts related to the revaluation of the Woodward L’Orange inventory recognized in cost of goods sold and the amortization of the backlog intangible, (iv) the Woodward L’Orange acquisition transaction and integration costs, (v) cost associated with the Forward Option, (vi) warranty and indemnity insurance costs associated with the acquisition of Woodward L’Orange, (vii) German real estate transfer tax costs associated with the acquisition of Woodward L’Orange, and (vii) costs related to the fourth quarter of fiscal year 2019 impairment of accounts receivable, inventory and certain other assets in connection with Senvion. As these charges are infrequent or unusual charges that can be variable from period to period and may not fluctuate with operating results, management believes that by removing these charges from EBIT and EBITDA it improves comparability of past, present and future operating results and provides consistency when comparing EBIT and EBITDA between periods.
EBIT and adjusted EBIT for the fiscal years ended September 30, 2019 and September 30, 2018 were as follows:
|
|
|
|
|
|
|
|
|
|
|
|
|
|
|
| Year Ended September 30, |
|
| 2019 |
| 2018 |
Net earnings (U.S. GAAP) |
| $ | 259,602 |
| $ | 180,378 |
Income tax expense |
|
| 61,010 |
|
| 39,200 |
Interest expense |
|
| 44,001 |
|
| 40,465 |
Interest income |
|
| (1,413) |
|
| (1,674) |
EBIT (Non-U.S. GAAP) |
|
| 363,200 |
|
| 258,369 |
Non-U.S. GAAP adjustments: |
|
|
|
|
|
|
Restructuring charges |
|
| - |
|
| 17,013 |
Duarte move related costs |
|
| 27,089 |
|
| 6,165 |
Purchase accounting impacts1 |
|
| 21,100 |
|
| 34,385 |
L'Orange Acquisition transaction and integration costs |
|
| - |
|
| 5,208 |
Costs associated with the Forward Option |
|
| - |
|
| 5,543 |
Warranty and indemnity insurance costs associated with the acquisition of Woodward L'Orange |
|
| - |
|
| 4,293 |
German real estate transfer costs associated with the acquisition of Woodward L'Orange |
|
| - |
|
| 3,385 |
Impairment of Senvion related assets |
|
| 12,601 |
|
| - |
Total non-U.S. GAAP adjustments |
|
| 60,790 |
|
| 75,992 |
Adjusted EBIT (Non-U.S. GAAP) |
| $ | 423,990 |
| $ | 334,361 |
|
|
|
|
|
|
|
(1)The purchase accounting impacts relate to the revaluation of the Woodward L’Orange inventory recognized in cost of goods sold for the fiscal year ended September 30 2018, and the amortization of the Woodward L’Orange backlog intangible for the fiscal years ended September 30, 2019 and September 30, 2018.
EBITDA and adjusted EBITDA for fiscal years ended September 30, 2019 and September 30, 2018 were as follows:
|
|
|
|
|
|
|
|
|
|
|
|
|
|
|
| Year Ended September 30, |
|
| 2019 |
| 2018 |
Net earnings (U.S. GAAP) |
| $ | 259,602 |
| $ | 180,378 |
Income tax expense |
|
| 61,010 |
|
| 39,200 |
Interest expense |
|
| 44,001 |
|
| 40,465 |
Interest income |
|
| (1,413) |
|
| (1,674) |
Amortization of intangible assets |
|
| 56,022 |
|
| 44,742 |
Depreciation expense |
|
| 85,982 |
|
| 71,389 |
EBITDA (Non-U.S. GAAP) |
|
| 505,204 |
|
| 374,500 |
Non-U.S. GAAP adjustments: |
|
|
|
|
|
|
Restructuring charges |
|
| - |
|
| 17,013 |
Duarte move related costs |
|
| 27,089 |
|
| 6,165 |
Purchase accounting impacts1 |
|
| - |
|
| 16,324 |
L'Orange Acquisition transaction and integration costs |
|
| - |
|
| 5,208 |
Costs associated with the Forward Option |
|
| - |
|
| 5,543 |
Warranty and indemnity insurance costs associated with the acquisition of Woodward L'Orange |
|
| - |
|
| 4,293 |
German real estate transfer costs associated with the acquisition of Woodward L'Orange |
|
| - |
|
| 3,385 |
Impairment of Senvion related assets |
|
| 12,601 |
|
| - |
Total non-U.S. GAAP adjustments |
|
| 39,690 |
|
| 57,931 |
Adjusted EBITDA (Non-U.S. GAAP) |
| $ | 544,894 |
| $ | 432,431 |
|
|
|
|
|
|
|
(1)The purchase accounting impacts relate to the revaluation of the L’Orange inventory recognized in cost of goods sold.
The use of these non-U.S. GAAP financial measures is not intended to be adopted, please reviewconsidered in isolation of, or as a substitute for, the financial information prepared and presented in accordance with U.S. GAAP. As adjusted net earnings, adjusted net earnings per share, adjusted Industrial segment earnings, EBIT, adjusted EBIT, EBITDA, and adjusted EBITDA exclude certain financial information compared with net earnings, the most comparable U.S. GAAP financial measure, users of this financial information should consider the information that is excluded. Our calculations of adjusted net earnings, adjusted
net earnings per share, adjusted Industrial segment earnings, EBIT, adjusted EBIT, EBITDA, and adjusted EBITDA may differ from similarly titled measures used by other companies, limiting their usefulness as comparative measures.
Cash flow-based non-U.S. GAAP financial measures
Management uses free cash flow, which is defined by the Company as net cash flows provided by operating activities less payments for property, plant and equipment, in reviewing the financial performance of and cash generation by Woodward’s various business groups and evaluating cash levels. We believe free cash flow is a useful measure for investors because it portrays our Note 2, New accounting standards,ability to grow organically and generate cash from our businesses for purposes such as paying interest on our indebtedness, repaying maturing debt, funding business acquisitions, investing in research and development, purchasing our common stock, and paying dividends. In addition, securities analysts, investors, and others frequently use free cash flow in their evaluation of companies. The use of this non-U.S. GAAP financial measure is not intended to be considered in isolation of, or as substitutes for, the Consolidated Financial Statementsfinancial information prepared and presented in “Item 8 – Financial Statementsaccordance with U.S. GAAP. Free cash flow does not necessarily represent funds available for discretionary use, and Supplementary Data.”is not necessarily a measure of our ability to fund our cash needs. Our calculation of free cash flow may differ from similarly titled measures used by other companies, limiting its usefulness as a comparative measure.
Free cash flow for the fiscal years ended September 30, 2019 and September 30, 2018 were as follows:
|
|
|
|
|
|
|
|
|
|
|
|
|
|
|
|
|
|
| Year Ended September 30, |
| 2019 |
| 2018 |
| 2017 |
Net cash provided by operating activities (U.S. GAAP) | $ | 390,608 |
| $ | 299,292 |
| $ | 307,537 |
Payments for property, plant and equipment |
| (99,066) |
|
| (127,140) |
|
| (92,336) |
Free cash flow (Non-U.S. GAAP) | $ | 291,542 |
| $ | 172,152 |
| $ | 215,201 |
CRITICAL ACCOUNTING POLICIES AND ESTIMATES
The preparation of financial statements and related disclosures in conformity with U.S. GAAP requires us to make judgments, assumptions, and estimates that affect the amounts reported in the Consolidated Financial Statements and accompanying notes. Note1, Operations and summary of significant accounting policies, to the Consolidated Financial Statements describes the significant accounting policies and methods used in the preparation of the Consolidated Financial Statements. The estimates and assumptions described below are those that we consider to be most critical to an understanding of our financial statements because they involve significant judgments and uncertainties. All of these estimates reflect our best judgment about current, and for some estimates, future economic and market conditions and their effects based on information available as of the date of these financial statements. As estimates are updated or actual amounts are known, our critical accounting estimates are revised, and operating results may be affected by the revised estimates. Actual results may differ from these estimates under different assumptions or conditions.
Our management has discussed the development and selection of these critical accounting estimates with the Audit Committee of our Board of Directors, and the Audit Committee has reviewed our disclosures in this Management’s Discussion and Analysis.
Revenue recognition
Effective October 1, 2018, Woodward recognizesadopted the new revenue whenrecognition guidance of ASC 606. For discussion of the following criteria are met:impacts of the adoption of ASC 606 on our revenue recognition policy and related critical accounting estimates, see Note 3, Revenue, to the Notes to the Consolidated Financial Statements included in “Item 8 – Financial Statements and Supplementary Data.”
1) persuasive evidencePurchase Accounting
On June 1, 2018, Woodward completed the acquisition of L'Orange. The allocation of the purchase price to the assets acquired and liabilities assumed was accounted for under the purchase method of accounting in accordance with ASC Topic 805, “Business Combinations.” Assets acquired and liabilities assumed in the transaction were recorded at their estimated acquisition date fair values, while transaction costs associated with the acquisition were expensed as incurred. Woodward’s preliminary allocation as of September 30, 2018 was based on an evaluation of the appropriate fair values and represents management’s best estimate based on available data. For more information on the L’Orange Acquisition see Note 5, Business acquisition, in the Notes to the Consolidated Financial Statements included in “Item 8 – Financial Statements and Supplementary Data.”
Assigning fair values to the assets acquired and liabilities assumed at the date of an arrangement exists,acquisition requires knowledge of current market values, and the values of assets in use, and often requires the application of judgment regarding estimates and assumptions. While the ultimate responsibility resides with management, we retained the services of certified valuation specialists to assist with assigning estimated values to certain acquired assets and assumed liabilities, including intangible assets and other postretirement benefit plan assets and liabilities.
2) deliveryAcquired intangible assets, excluding goodwill, are valued using a discounted cash flow methodology based on future cash flows specific to the type of intangible asset purchased. This methodology incorporates various estimates and assumptions, the most significant being royalty rates, projected revenue growth rates, earnings margins, future tax rates, and forecasted cash flows based on the discount rate and terminal growth rate. Management projects revenue growth rates, earnings margins and cash flows based on the historical operating results of the product has occurredacquired entity adjusted for synergies anticipated to be achieved through integration, expected future performance, operational strategies, and the general macroeconomic environment. We review finite-lived intangible assets for triggering events such as significant changes in operations, customers or services have been rendered,
3) price is fixedfuture revenue that might indicate the need to impair the assets acquired or determinable, and
4) collectability is reasonably assured.
In implementingchange the four criteria stated above, we have found that determining when the risks and rewards of ownership have passed to the customer, which determines whether persuasive evidence of an arrangement exists and if delivery has occurred, may require judgment. The passage of title indicates transferuseful lives of the risks and rewards of ownership from Woodward toassets acquired. We review indefinite-lived intangibles for impairment on an annual basis or more frequently if an event occurs or circumstances change that would more likely than not reduce the customer; however, contract- and customer-specific circumstances are reviewed by management to ensure that transfer of title constitutes the transferfair value of the risksindefinite-lived intangible asset below its carrying value.
Estimated values for acquired property, plant and rewardsequipment are based on current market values and replacement costs of ownership.
Examples of situations requiring management review and judgment, with respectsimilar assets. Estimated values for inventory acquired is subject to the passagereliable estimates, as of the risksacquisition date, of future sales volumes, replacement costs, costs of selling effort, anticipated selling prices, normal profit margins, and rewardsthe percent complete and the costs to complete work-in-process inventory. Estimated values for accounts receivable are subject to reliable estimates of ownership, include:collectability.
Assumed liabilities are valued based on estimates of anticipated expenditures to be incurred to satisfy the assumed obligations, including estimation of any warranty or other contractual liabilities assumed, which require the exercise of professional judgment. Valuation of postretirement benefit plan assets and liabilities is dependent on similar assumptions and estimates as those used to value our non-acquisition postretirement benefit plan assets and liabilities.
Assumed contracts may have favorable or unfavorable terms that must be valued as of the acquisition date. Such valuation is subject to management judgment regarding the evaluation and interpretation of customer-specific contract terms situations where substantive performance obligations exist,in relation to other economic circumstances, such as completion of product testing that remain after product delivery to the customer, situations that require customer acceptance (or in some instances regulatory acceptance)market rates for office space leases.
Assumed acquired tax liabilities for uncertain tax positions are dependent on assessing the past practices of the product,acquisition target based on review of actual tax filings and situations in countries whose laws provide for retentioninformation obtained through due diligence procedures. Evaluation of some formthe validity of titletax positions taken by sellers such that Woodward is ablethe acquisition target are subject to recover goods in the event a customer defaults on payment. management judgment.
Based on management’s determination, if the risks and rewards of ownership have not passed to the customer, revenue is deferred until this requirement is met.Inventory
Inventory
Inventories are valued at the lower of cost or net realizable value. Inventory cost is determined using methods that approximate the first-in, first-out basis. We include product costs, labor and related fixed and variable overhead in the cost of inventories. For discussion of the critical accounting estimates related to inventory provided by customers to Woodward, which will be integrated into final products sold to those customers, see Note 3, Revenue, to the Notes to the Consolidated Financial Statements included in “Item 8 – Financial Statements and Supplementary Data.”
Inventory net realizable values are determined by giving substantial consideration to the expected product selling price. We estimate expected selling prices based on our historical recovery rates, general economic and market conditions, the expected channel of disposition, and current customer contracts and preferences. Actual results may differ from our estimates due to changes in resale or market value and the mix of these factors. Management monitors inventory for events or circumstances, such as negative margins, recent sales history suggesting lower sales value, or changes in customer preferences, which would indicate the net realizable value of inventory is less than the carrying value of inventory, and management records adjustments as necessary. When inventory is written down below cost, such reduced amount is considered the cost for subsequent accounting purposes. Our recording of inventory at the lower of cost or net realizable value has not historically required material adjustments once initially established.
The carrying value of inventory was $461,683$516,836 at September 30, 20162019 and $447,664$549,596 at September 30, 2015.2018. If economic conditions, customer product requirements, or other factors significantly reduce future customer demand for our products from forecast levels, then future adjustments to the carrying value of inventory may become necessary. We attempt to maintain inventory quantities at levels considered necessary to fill firm and expected orders in a reasonable time frame, which we believe mitigates our exposure to future inventory carrying cost adjustments.
Depreciation and amortization
The carrying value of property, plant and equipment was $876,350$1,058,775 at September 30, 20162019 and $756,100$1,060,005 at September 30, 2015.2018. Depreciation expense was $41,550$85,982 in fiscal year 2016, $45,9942019 and $71,389 in fiscal year 2015 and $43,773 in fiscal year 2014.2018. Depreciation of property, plant and equipment is generally computed using the straight-line method, which requires estimates of asset useful lives and ultimate salvage value.
In fiscal year 2015, we completed construction of a manufacturing and office building for our Aerospace segment on a second campus in the greater-Rockford, Illinois area and began occupying the new facility. This campus is intended to support the expected growth in our Aerospace segment over the next ten years and beyond, necessitated as a result of our being awarded a substantial number of new system platforms, particularly on narrow-body aircraft. In addition, in fiscal year 2015, we completed an addition to and renovation of a building in Niles, Illinois that we had acquired in September 2013. Most of our operations that formerly resided in nearby Skokie, Illinois, were relocated to this new facility in fiscal year 2015.
We completed construction of a manufacturing building for our Industrial segment and a corporate headquarters building on a second campus in Fort Collins, Colorado. This campus is intended to support the future growth of our Industrial segment by supplementing our existing Colorado manufacturing facilities. We began occupying the new campus in our second quarter of fiscal year 2016.
Concurrent with and in relation to our significant investment in three new campuses and related equipment, Woodward initiated a comprehensive review of its depreciation lives as required by U.S. GAAP to evaluate the estimates of the useful lives of Woodward assets. This review resulted in estimates of the useful lives of both existing and new assets generally in excess of those utilized prior to fiscal year 2016. The revised estimates were used in fiscal year 2016 and will be used going forward and resulted in a downward adjustment of depreciation on existing assets of approximately $12,000 for fiscal year 2016.
The carrying value of intangible assets with finite lives was $197,650$548,525 at September 30, 20162019 and $225,138$633,548 at September 30, 2015.2018. Amortization expense was $27,486$56,022 in fiscal year 2016, $29,2412019 and $44,742 in fiscal year 2015 and $33,580 in fiscal year 2014.2018. Amortization of intangible assets is generally computed using patterns that reflect the periods over which the economic benefits of the assets are expected to be realized. Impairment losses are recognized if the carrying amount of an intangible is both not estimated to be recoverable and exceeds it fair value.
Reviews for impairment of goodwill and other indefinitely lived intangible assets
At September 30, 2016,2019, we had $555,684$797,853 of goodwill representing 21% of our total assets. At September 30, 2015, we had $556,977 of goodwill, representing 22% of our total assets. The change in the value of goodwill is due to changes in foreign currency exchanges rates between September 30, 2015 and September 30, 2016. Goodwill is tested for impairment at the reporting unit level on an annual basis and more often if an event occurs or circumstances change that would more likely than not reduceindicate the fair value of a reporting unit may be below its carrying amount. On April 9, 2019, German wind turbine manufacturer, Senvion GmbH (“Senvion”), a significant customer of Woodward’s renewables business, announced that it filed for self-administration insolvency proceedings. In conjunction with this, during the three-months ended June 30, 2019, Woodward determined that this action by Senvion represented a triggering event requiring an interim goodwill impairment test of its renewable power systems reporting unit. Based on the results of this interim impairment test, Woodward determined the renewable power systems reporting unit’s goodwill was not impaired as of June 30, 2019.
Based on the relevant U.S. GAAP authoritative guidance, we aggregate components of a single operating segment into a reporting unit, if appropriate. For purposes of performing the impairment tests, we identify reporting units in accordance with U.S. GAAP. The identification of reporting units and consideration of the aggregation criteriaof components into a single reporting unit requires management judgment. The impairment tests consist of comparing the fair value of reporting units, determined using discounted cash flows, with their carrying amount including goodwill. If the carrying amount of the reporting unit exceeds its fair value, we compare the implied fair value of goodwill with its carrying amount. If the carrying amount of goodwill exceeds the implied fair value of goodwill, an impairment loss would be recognized to reduce the carrying amount to its implied fair value. Woodward has not recorded any impairment charges.
During the fourth quarter, Woodward completed its annual goodwill impairment test as of July 31, 20162019 for the fiscal year ended September 30, 2016 during the fourth quarter.2019. At that date, Woodward determined it was appropriate to aggregate certain components of the same operating segment into a single reporting unit. The fair value of each of Woodward’s reporting units was determined using an income approach based on a discounted cash flow method. This method represents a Level 3 input (based upon a fair value hierarchy established by U.S. GAAP) and incorporates various estimates and assumptions, the most significant being projected revenue growth rates, earnings margins, future tax rates and the present value, based on an estimated weighted-average cost of capital (or the discount rate) and terminal growth rate, of forecasted cash flows. Management projects revenue growth rates, earnings margins and cash flows based on each reporting unit’s current operational results, expected performance and operational strategies over a ten-year period. These projections are adjusted to reflect current economic conditions and demand for certain products, and require considerable management judgment.
Forecasted cash flows used in the July 31, 20162019 impairment test were discounted using weighted-average cost of capital assumptions ranging from 8.91%9.35% to 11.49%17.41%. The terminal values of the forecasted cash flows were calculated using the Gordon Growth Model and assumed an annual compound growth rate after ten years of 3.71%3.39%. These inputs, which are unobservable in the market, represent management’s best estimate of what market participants would use in determining the present value of the Company’s forecasted cash flows. Changes in these estimates and assumptions can have a significant impact on the fair value of forecasted cash flows. Woodward evaluated the reasonableness of the reporting units resulting fair values utilizing a market multiple method.
The results of Woodward’s annual goodwill impairment test performed as of July 31, 2016,2019, indicated the estimated fair value of each reporting unit was significantly in excess of its carrying value, and accordingly, no impairment existed. Increasing either the discount rate by 20%, decreasing the growth rate by 20%, or decreasing forecasted cash flow by 20%, would also not have resulted in an impairment charge at July 31, 2016.2019. As of the July 31, 2019 goodwill impairment test, the reporting unit with the closest ratio of estimated fair value to carrying value was our renewable power systems reporting unit. As discussed above, a significant customer of Woodward’s renewables business, Senvion, recently announced that it filed for self-administration insolvency proceedings and is currently in exclusive talks with Siemens Gamesa over the sale of a substantial part of its business consisting of certain services and onshore assets in Europe. Woodward’s July 31, 2019 goodwill analysis indicated a premium of approximately 20% compared to the renewable power system’s carrying value. Woodward is not
aware of any facts, circumstances or triggering events that have arisen indicating that goodwill has been impaired or that the premium of approximately 20% has changed significantly since Woodward’s July 31, 2019 analysis. The carrying value of the Woodward renewable power system reporting unit’s goodwill was $8,108 as of September 30, 2019.
We have one indefinitely lived intangible asset consisting of the Woodward L’Orange tradename. At September 30, 2019, the carrying value of the Woodward L’Orange tradename intangible asset was $63,467, representing 1.6% of our total assets. The Woodward L’Orange tradename intangible asset is tested for impairment on an annual basis and more often if an event occurs or circumstances change that indicate the fair value of the Woodward L’Orange intangible asset may be below its carrying amount. The impairment test consists of comparing the fair value of the Woodward L’Orange tradename intangible asset, determined using discounted cash flows based on the relief from royalty method under the income approach, with its carrying amount. If the carrying amount of the Woodward L’Orange tradename intangible asset exceeds its fair value, an impairment loss would be recognized to reduce the carrying amount to its fair value. Woodward has not recorded any impairment charges.
During the fourth quarter, Woodward completed its annual impairment test of the Woodward L’Orange tradename intangible asset as of July 31, 2019 for the fiscal year ended September 30, 2019. The fair value of the Woodward L’Orange tradename intangible assets was determined using discounted cash flows based on the relief from royalty method under the income approach. This method represents a Level 3 input (based upon a fair value hierarchy established by U.S. GAAP) and incorporates various estimates and assumptions, the most significant being projected revenue growth rates, royalty rates, future tax rates and the present value, based on an estimated weighted-average cost of capital (or the discount rate) and terminal growth rate, of the forecasted cash flow. Management projects revenue growth rates and cash flows based on Woodward L’Orange’s current operational results, expected performance and operational strategies over a ten-year period. These projections are adjusted to reflect current economic conditions and demand for certain products, and require considerable management judgment.
The forecasted cash flow used in the July 31, 2019 impairment test was discounted using weighted-average cost of capital assumption of 10.44%. The terminal value of the forecasted cash flow was calculated using the Gordon Growth Model and assumed an annual compound growth rate after ten years of 3.39%. These inputs, which are unobservable in the market, represent management’s best estimate of what market participants would use in determining the present value of the Company’s forecasted cash flows. Changes in these estimates and assumptions can have a significant impact on the fair value of the forecasted cash flow. The results of impairment test performed as of July 31, 2019 indicated the estimated fair value of the Woodward L’Orange tradename intangible asset was in excess of its carrying value, and accordingly, no impairment existed.
As part of the Company’s ongoing monitoring efforts to assess goodwill and the Woodward L’Orange tradename indefinite lived asset for possible indications of impairment, we will continue to consider a wide variety of factors, including but not limited to the global economic environment and its potential impact on Woodward’s business. There can be no assurance that our estimates and assumptions regarding forecasted cash flows of certain reporting units or the Woodward L’Orange business, the current economic environment, or the other inputs used in forecasting the present value of forecasted cash flows will prove to be accurate projections of future performance.
Postretirement benefits
The Company provides various benefits to certain employees through defined benefit pension plans and other postretirement benefit plans. A September 30 measurement date is used to value plan assets and obligations for all Woodward defined benefit pension and other postretirement benefit plans. Excluding the Woodward HRT Plan, which is only partially frozen to salaried participants, the defined benefit plans in the United States were frozen in fiscal year 2007 and no additional employees may participate in the U.S. plans and no additional service costs will be incurred.
For financial reporting purposes, net periodic benefits expense and related obligations are calculated using a number of significant actuarial assumptions, including anticipated discount rates, rates of compensation increases, long-term return on defined benefit plan investments, and anticipated healthcare cost increases. Based on these actuarial assumptions, at September 30, 2016,2019, our recorded assets and liabilities included a net liability of $24,137$62,997 for our defined benefit pension plans and a net liability of $35,630$26,671 for our other postretirement benefit plans. Changes in net periodic expense or the amounts of recorded assets and liabilities may occur in the future due to changes in these assumptions.
Estimates of the value of postretirement benefit obligations, and related net periodic benefits expense, are dependent on actuarial assumptions, including future interest rates, compensation rates, mortality trends, healthcare cost trends, termination and retirement rates, and returns on defined benefit plan investments.
It should be noted that economic factors and conditions often affect multiple assumptions simultaneously, and the effects of changes in assumptions are not necessarily linear due to factors such as the 10% corridor applied to the larger of the
postretirement benefit obligation or the fair market value of plan assets used to determine the amortization of actuarial net gains or losses.
During fiscal year 2015, the SEC staff expressed its acceptance for companies applying an alternative accounting approach for using discount rates to measure the components of net periodic benefit cost for postretirement benefit plan obligations. Specifically, the SEC staff stated that it would not object to companies’ use of an alternative approach that focuses on measuring the service cost and interest cost components of net periodic benefit cost by using individual spot rates derived from a high-quality corporate bond yield curve and matched with separate cash flows for each future year instead of a single weighted-average discount rate approach. Further, the SEC staff stated it would not object to companies treating the change in approach as a change in estimate. We elected to change our estimate in the determination of discount rate assumptions to determine periodic benefit costs effective for fiscal year 2016 and years thereafter for our defined benefit pension plans in the United Kingdom and Japan, and the other postretirement plan in the United Kingdom. This change in estimate had an insignificant impact on the service cost and interest cost components of net periodic benefit cost in fiscal year 2016.
Mortality assumptions are based on published mortality studies developed primarily based on past experience of the broad population and modified for projected longevity trends. The projected benefit obligations in the United States as of September 30, 20162019 and September 30, 20152018 was based on the Society of Actuaries (“SOA”) RP-2014 Mortality Tables Report projected back to 2006 using the SOA’s Mortality Improvement Scale MP-2014 (“MP-2014”) and projected forward using a custom projection scale based on MP-2014 with a 10-year convergence period and a long-term rate of 0.75%. As of September 30, 20162019 and September 30, 2015,2018, mortality assumptions in Japan were based on the Standard rates 2014, and mortality assumptions for the United Kingdom were based on the Self-administered pension scheme (“SAPS”) S2 “all” tables with a projected 1.5% annual improvement rate. Mortality assumptions in Germany as of September 30, 2019 were based on the Heubeck 2018 G mortality tables and as of September 30, 2018 were based on the Heubeck 2005 G mortality tables.
Primary actuarial assumptions for our defined benefit pension plans were determined as follows:
| ·
| | The discount rate assumption is intended to reflect the rate at which the retirement benefits could be effectively settled based upon the assumed timing of the benefit payments.
|
The discount rate assumption is intended to reflect the rate at which the retirement benefits could be effectively settled based upon the assumed timing of the benefit payments.
In the United States, Woodward uses a bond portfolio matching analysis based on recently traded, non-callable bonds rated AA or better that have at least $50 million outstanding to determine the benefit obligations at year end.
In the United Kingdom, Germany and Japan, Woodward uses a high-quality corporate bond yield curve matched with separate cash flows to develop a single rate to determine the single rate equivalent to settle the entire benefit obligations in each jurisdiction. For the fiscal year endingyears ended September 30, 2016,2019 and 2018, the discount rate used to determine periodic service cost and interest cost components of the overall benefit costs was based on spot rates derived from the same high-quality corporate bond yield curve used to determine the September 30, 20152018 and 2017 benefit obligation, respectively, matched with separate cash flows for each future year. Prior to this change in method, the discount rate used to determine the periodic benefit costs for the years ending September 30, 2015 and 2014 was based on a single rate equivalent.
These rates are sensitive to changes in interest rates.
| | | | | | |
| | | | | | |
| | Change In Discount Rate |
| | 1% increase | | 1% decrease |
Defined benefit pension benefits: | | | | | | |
2017 Net Periodic Benefit Cost | | $ | (1,166) | | $ | 1,614 |
2017 Projected Service and Interest Costs | | | 677 | | | (1,036) |
Accumulated Post Retirement Benefit Obligation as of Sept. 30, 2016 | | | (30,945) | | | 38,324 |
|
|
|
|
|
|
|
|
|
|
|
|
|
|
|
| Change In Discount Rate |
|
| 1% increase |
| 1% decrease |
Defined benefit pension benefits: |
|
|
|
|
|
|
2020 Net Periodic Benefit Cost |
| $ | (1,199) |
| $ | 3,129 |
2020 Projected Service and Interest Costs |
|
| 682 |
|
| (999) |
Accumulated Post Retirement Benefit Obligation as of Sept. 30, 2019 |
|
| (41,601) |
|
| 51,273 |
Compensation increase assumptions, where applicable, are based upon historical experience and anticipated future management actions. An increase in the rate would increase our obligation and expense.
Mortality trends assumptions are based on published actuarial data and are sometimes modified to reflect projected longevity trends. Increases in life expectancy of participants greater than assumed would increase our obligation and expense.
In determining the long-term rate of return on plan assets, we consider the asset investment mix for each plan. For example, fixed-income securities generally have a lower rate of return than equity securities. We assume that the historical long-term compound growth rates of similar equity and fixed-income securities will predict the future returns of investments in the various plan portfolios. We consider the potential impacts of changes in general market conditions, but because our assumptions are based on long-term rates of return, short-term market conditions generally have an insignificant effect on our assumptions. Changes in asset allocations are managed on a plan-by-plan basis, taking into consideration factors such as the average age of the plan participants and the projected timing of future benefit payments.
|
|
|
|
|
|
|
|
|
|
|
|
|
|
|
| Change In Rate of Return on Plan Assets |
|
| 0.5% increase |
| 0.5% decrease |
Defined benefit pension benefits: |
|
|
|
|
|
|
2020 Net Periodic Benefit Cost |
| $ | (1,150) |
| $ | 1,150 |
If, as of the beginning of the year, the net plan gain or loss recognized in accumulated other comprehensive income exceeds 10% of the greater of the plan projected benefit obligation or the market-related value of plan assets, the amortization
| ·
| | Compensation increase assumptions, where applicable, are based upon historical experience and anticipated future management actions. An increase in the rate would increase our obligation and expense.
|
| ·
| | In determining the long-term rate of return on plan assets, we consider the asset investment mix for each plan. For example, fixed-income securities generally have a lower rate of return than equity securities. We assume that the historical long-term compound growth rates of similar equity and fixed-income securities will predict the future returns of investments in the various plan portfolios. We consider the potential impacts of changes in general market conditions, but because our assumptions are based on long-term rates of return, short-term market conditions generally have an insignificant effect on our assumptions. Changes in asset allocations are managed on a plan-by-plan basis, taking into consideration factors such as the average age of the plan participants and the projected timing of future benefit payments.
|
| | | | | | |
| | | | | | |
| | Change In Rate of Return on Plan Assets |
| | 0.5% increase | | 0.5% decrease |
Defined benefit pension benefits: | | | | | | |
2017 Net Periodic Benefit Cost | | $ | (1,024) | | $ | 1,024 |
| ·
| | If, as of the beginning of the year, the net plan gain or loss recognized in accumulated other comprehensive income exceeds 10% of the greater of the plan projected benefit obligation or the market-related value of plan assets, the amortization out of accumulated other comprehensive income into current period expense is that excess divided by the average remaining service period of employees expected to receive benefits under the plan.
|
out of accumulated other comprehensive income into current period expense is that excess divided by the average remaining service period of employees expected to receive benefits under the plan.
Primary actuarial assumptions for our other postretirement benefit plans were determined as follows:
| ·
| | The discount rate assumption is intended to reflect the rate at which the postretirement benefits could be effectively settled based upon the assumed timing of the benefit payments.
|
The discount rate assumption is intended to reflect the rate at which the postretirement benefits could be effectively settled based upon the assumed timing of the benefit payments.
In the United States, Woodward uses a bond portfolio matching analysis based on recently traded, non-callable bonds rated AA or better that have at least $50 million outstanding to determine the benefit obligations at year end.
InOutside the United Kingdom,States, Woodward uses a high-quality corporate bond yield curve matched with separate cash flows to develop a single rate to determine the single rate equivalent to settle the entire benefit obligations in each jurisdiction. For the fiscal year ending September 30, 2016, the discount rate used to determine periodic service cost and interest cost components of the overall benefit costs was based on spot rates derived from the same high-quality corporate bond yield curve used to determine the September 30, 2015 benefit obligation matched with separate cashobligation.
flows for each future year. Prior to this change in method, the discount rate used to determine the periodic benefit costs for the years ending September 30, 2015 and 2014 was based on a single rate equivalent.
These rates are sensitive to changes in interest rates.
|
|
|
|
|
|
|
|
|
|
|
|
|
|
|
| Change In Discount Rate |
|
| 1% increase |
| 1% decrease |
Other postretirement benefits: |
|
|
|
|
|
|
2020 Net Periodic Benefit Cost |
| $ | 121 |
| $ | (186) |
2020 Projected Service and Interest Costs |
|
| 170 |
|
| (205) |
Accumulated Post Retirement Benefit Obligation as of Sept. 30, 2019 |
|
| (2,126) |
|
| 2,465 |
Mortality trends assumptions are based on published actuarial data and are sometimes modified to reflect projected longevity trends. Increases in life expectancy of participants greater than assumed would increase our obligation and expense.
The assumed health care trend rate represents the rate at which health care costs are assumed to increase and is based on historical and expected experience. Changes in our projections of future health care costs due to general economic conditions and those specific to health care (e.g., technology driven cost changes) will impact this trend rate.
| | | | | | |
| | | | | | |
| | Change In Discount Rate |
| | 1% increase | | 1% decrease |
Other postretirement benefits: | | | | | | |
2017 Net Periodic Benefit Cost | | $ | 121 | | $ | 27 |
2017 Projected Service and Interest Costs | | | 204 | | | (250) |
Accumulated Post Retirement Benefit Obligation as of Sept. 30, 2016 | | | (2,975) | | | 3,464 |
| ·
| | Mortality trends assumptions are based on published actuarial data and are sometimes modified to reflect projected longevity trends. Increases in life expectancy of participants greater than assumed would increase our obligation and expense.
|
|
|
|
|
|
|
|
|
| Change In Health Care Cost Trend Rate |
|
| 1% increase |
| 1% decrease |
Effect on projected fiscal year 2020 service and interest cost |
| $ | 74 |
| $ | (65) |
Effect on accumulated postretirement benefit obligation at September 30, 2019 |
|
| 2,417 |
|
| (2,128) |
| ·
| | The assumed health care trend rate represents the rate at which health care costs are assumed to increase and is based on historical and expected experience. Changes in our projections of future health care costs due to general economic conditions and those specific to health care (e.g., technology driven cost changes) will impact this trend rate.
|
| | | | | | | |
| | | | | | | |
| | | Change In Health Care Cost Trend Rate |
| | | 1% increase | | 1% decrease |
Effect on projected fiscal year 2017 service and interest cost | | | $ | 126 | | $ | (110) |
Effect on accumulated postretirement benefit obligation at September 30, 2016 | | | | 3,415 | | | (2,993) |
| ·
| | If, as of the beginning of the year, the net plan gain or loss recognized in accumulated other comprehensive income exceeds 10% of the plan accumulated postretirement benefit obligation, the amortization out of accumulated other comprehensive income into current period expense is that excess divided by the average remaining service period of employees expected to receive benefits under the plan.
|
If, as of the beginning of the year, the net plan gain or loss recognized in accumulated other comprehensive income exceeds 10% of the plan accumulated postretirement benefit obligation, the amortization out of accumulated other comprehensive income into current period expense is that excess divided by the average remaining service period of employees expected to receive benefits under the plan.
Variances from our fiscal year end estimates for these variables could materially affect our recognized postretirement benefit obligation liabilities. On a near-term basis, such changes are unlikely to have a material impact on reported earnings, since such adjustments are recorded to other comprehensive earnings and recognized into expense over a number of years. Significant changes in estimates could, however, materially affect the carrying amounts of benefit obligation liabilities, including accumulated benefit obligations, which could affect compliance with the provisions of our debt arrangements and future borrowing capacity.
Income taxes
We are subject to income taxes in the United States and numerous foreign jurisdictions. Significant judgment is required in evaluating our tax positions and determining our provision for income taxes.
During the ordinary course of business, there are many transactions and calculations for which the ultimate tax determination is uncertain. We establish reserves for tax-related uncertainties based on estimates of whether, and the extent to which, additional taxes will be due. The reserves are established when we believe that certain positions are likely to be challenged and may not be fully sustained on review by tax authorities. We adjust these reserves in light of changing facts and circumstances, such as the closing of a tax audit or refinement of an estimate. Although we believe our reserves are reasonable, no assurance can be given that the final outcome of these matters will be consistent with what is reflected in our historical income tax provisions and accruals. To the extent that the final tax outcome of these matters is different from the amounts recorded, such differences will impact the current provision for income taxes. The provision for income taxes includes the impact of reserve positions and changes to reserves that are considered appropriate. As of September 30, 2016 2019
and September 30, 2015,2018, unrecognized gross tax benefits for which recognition has been deferred were $23,526$10,305 and $21,469,$8,364, respectively.
Significant judgment is also required in determining any valuation allowance recorded against deferred tax assets. The determination of the amount of valuation allowance to be provided on recorded deferred tax assets involves estimates regarding the timing and amount of the reversal of taxable temporary differences, expected future taxable income, and the impact of tax planning strategies. A valuation allowance is established to offset any deferred tax assets if, based upon the available evidence, it is more likely than not that some or all of the deferred tax asset will not be realized. In assessing the need for a valuation allowance, we consider all available evidence including past operating results, estimates of future taxable income, and the feasibility of tax planning strategies. Changes in the relevant facts can significantly impact the judgment or need for valuation
allowances. In the event we change our determination as to the amount of deferred tax assets that can be realized, we will adjust our valuation allowance with a corresponding impact to the provision for income taxes in the period in which such determination is made. Our valuation allowance was $3,317$3,638 as of September 30, 20162019 and $6,804$4,522 as of September 30, 2015.2018.
Our effective tax rates differ from the U.S. statutory rate primarily due to the tax impact of foreign operations, adjustments of valuation allowances, research tax credits, state taxes, and tax audit settlements. In addition to potential local country tax law and policy changes that could impact the provision for income taxes, management’s judgment about and intentions concerning the repatriation of foreign earnings could also significantly impact the provision for income taxes. Management reassesses its judgment regularly, taking into consideration the potential tax impacts of these judgments and intentions.
On December 22, 2017, the United States enacted significant changes to the U.S. tax law following the passage and signing of the Tax Act. The Tax Act included significant changes to existing tax law, including a permanent reduction to the U.S. federal corporate income tax rate from 35% to 21%, a one-time repatriation tax on deferred foreign income (“Transition Tax”), deductions, credits and business-related exclusions. Enactment of the Tax Act resulted in a discrete net charge to Woodward’s income tax expense in the amount of $14,778, which was recorded in the three-months ended December 31, 2017. After adjustments to amounts made throughout fiscal year 2018, the net impact of the enactment of the Tax Act was $10,860. Woodward finalized its assessment of the income tax effects of the Tax Act in the first quarter of fiscal year 2019. On June 14, 2019, the Internal Revenue Service (“IRS”) issued final regulations that modified the Transition Tax computation required by the Tax Act. As a result, in the three-months ended June 30, 2019, Woodward recognized additional income tax expense related to the Transition Tax of $10,588.
Our provision for income taxes is subject to volatility and could be affected by earnings that are different than those anticipated in countries which have lower or higher tax rates; by transfer pricing adjustments; and/or changes in tax laws, regulations, and accounting principles, including accounting for uncertain tax positions, or interpretations thereof. There can be no assurance that these items will remain stable over time. Additionally, with the adoption of ASU 2016-09 (see Note 2, New accounting standards, to the Consolidated Financial Statements in “Item 8 – Financial Statements and Supplementary Data”), Woodward will recordrecords through income tax expense all future excess tax benefits and tax deficiencies from stock options exercised. This new guidance creates unpredictable volatility in the effective tax rate because the additional expense or benefit recognized each quarter is based on the timing of the employee’s election to exercise any vested stock options outstanding, which is outside Woodward’s control, and the market price of Woodward’s shares at the time of exercise, which is subject to market volatility.
In addition, we are subject to examination of our income tax returns by the relevant tax authorities in the jurisdictions in which we are subject to taxes. We regularly assess the likelihood of adverse outcomes resulting from these examinations to determine the adequacy of our provision for income taxes. There can be no assurance that the outcomes from these examinations will not have a significant effect on our operating results, financial condition, and cash flows.
Item 7A.QuantitativeQuantitative and QualitativeQualitative Disclosures About Market Risk
In the normal course of business, we have exposures to interest rate risk from our long-term and short-term debt, and our postretirement benefit plans, and foreign currency exchange rate risk related to our foreign operations and foreign currency transactions.
Interest Rate Risk
We use derivative instruments as risk management tools that involve little complexity, and are not used for trading or speculative purposes. In June 2013, in connection with Woodward’s expected refinancing of current maturities on its existing long-term debt, Woodward entered into a treasury lock agreement with a notional amount of $25,000 that qualified as a cash flow hedge under ASC Topic 815, “Derivatives and Hedging.” The objective of this derivative instrument was to hedge the risk of variability in cash flows attributable to changes in the designated benchmark interest rate over a seven-year period related to the future interest payments on a portion of anticipated future debt issuances.
A portion of our long and short-term debt is sensitive to changes in interest rates. As of September 30, 20162019, our Series J Notes of $50,000 and advances on our revolving credit facility are at interest rates that fluctuate with market rates. A hypothetical 1% increase in the assumed effective interest rates that apply to the variable rate loan outstanding as of September 30, 20162019 and the average borrowings on our revolving credit facility in fiscal year 20162019 would cause our annual interest expense to increase approximately $5,129.$4,125. A hypothetical 0.6%1% decrease in the assumed effective interest rates that apply to the variable rate loan outstanding as of September 30, 20162019 and the average borrowings on our revolving credit facility which would effectively reduce the variable component of the applicable interest rates to 0%, andin fiscal year 2019 would decrease our annual interest expense by approximately $2,840. $4,125.
The discount rate and future return on plan asset assumptions used to calculate the funding status of our retirement benefit plans are also sensitive to changes in interest rates. The weighted average discount rate assumption used to value the defined benefit pension plans as of September 30, 20162020 was 3.65%3.25% in the United States, 2.28%1.74% in the United Kingdom, 0.53% in Japan, and 0.46%0.81% in Japan.Germany. The weighted average discount rate assumption used to value the other postretirement benefit plans was 3.63%3.05%.
In the United States, the discount rate used to determine the periodic benefit costs for the year ending September 30, 20172020 is consistent with the discount rate used to determine the benefit obligation as of September 30, 2016,2019, or 3.65%3.25%. Woodward derives this discount rate from a bond portfolio matching analysis based on recently traded, non-callable bonds rated AA or better that have at least $50 million outstanding.
In the United Kingdom, Japan, and Japan,Germany, Woodward utilizes the spot rate approach to calculate the service cost and interest cost components for determining benefit costs for the year ending September 30, 2017.2020. The weighted average discount rate assumption used to value the service costs for the defined benefit pension plans will be 2.33%1.79% in the United Kingdom, 0.72% in Japan and 0.59%1.01% in Japan.Germany. The weighted average discount rate assumption used to value the interest costs for the defined benefit pension plans will be 2.24%1.59% in the United Kingdom, 0.31% in Japan and 0.45%0.56% in Japan. Germany.
The weighted average discount rate assumption used to value the periodic benefits costs for the other postretirement plans in for the year ending September 30, 20172020 is consistent with the discount rate used to determine the benefit obligation as of September 30, 2016,2019, or 3.65% for the United States and 1.43% for the United Kingdom.3.05%.
The following information illustrates the sensitivity of the net periodic benefit cost and the projected accumulated benefit obligation to a change in the discount rate assumed. Amounts relating to foreign plans are translated at the spot rate on September 30, 2016.2019. It should be noted that economic factors and conditions often affect multiple assumptions simultaneously and the effects of changes in assumptions are not necessarily linear due to factors such as the 10% corridor applied to the larger of the postretirement benefit obligation or the fair market value of plan assets when determining amortization of actuarial net gains or losses.
| | | | | | | | | | |
|
|
|
|
|
|
|
|
|
|
| | | | | | | | | | |
|
|
|
|
|
|
|
|
|
|
| | | | Increase/(Decrease) In |
|
|
| Increase/(Decrease) In |
Assumption | | Change | | 2017 Net Periodic Benefit Cost | | 2017 Projected Service and Interest Costs | | Accumulated Post Retirement Benefit Obligation as of Sept. 30, 2016 |
| Change |
| 2020 Net Periodic Benefit Cost |
| 2020 Projected Service and Interest Costs |
| Accumulated Post Retirement Benefit Obligation as of Sept. 30, 2019 |
Defined benefit pension benefits: | | | | | | | | | | | |
|
|
|
|
|
|
|
|
|
|
|
Change in discount rate | | 1% increase | | $ | (1,166) | | $ | 677 | | $ | (30,945) |
| 1% increase |
| $ | (1,199) |
| $ | 682 |
| $ | (41,601) |
| | 1% decrease | | 1,614 | | | (1,036) | | | 38,324 |
| 1% decrease |
| 3,129 |
|
| (999) |
|
| 51,273 |
Other postretirement benefits: | | | | | | | | | | |
|
|
|
|
|
|
|
|
|
|
Change in discount rate | | 1% increase | | 121 | | | 204 | | | (2,975) |
| 1% increase |
| 121 |
|
| 170 |
|
| (2,126) |
| | 1% decrease | | 27 | | | (250) | | | 3,464 |
| 1% decrease |
| (186) |
|
| (205) |
|
| 2,465 |
Foreign Currency Exchange Rate Risk and Related Hedging Activities
We are impacted by changes in foreign currency exchange rates when we sell product in currencies different from the currency in which product and manufacturing costs were incurred. The functional currencies and our purchasing and sales activities primarily include USD, EUR, RMB, JPY GBP and BRL.GBP. We may also be impacted by changes in the relative buying power of our customers, which may impact sales volumes either positively or negatively. As these currencies fluctuate against each other, and other currencies, we are exposed to foreign currency exchange rate risk on sales, purchasing transactions, and labor. Foreign currency exchange rate risk is reduced through the maintenance of local production facilities in the markets we serve, which we believe creates a natural hedge to our foreign currency exchange rate exposure. For the yearyears ended September 30, 2016,2019 and 2018, the percentages of our net sales denominated in a currency other than the USD were as follows:
| | |
| | |
| | Percentage of Net Sales
|
| | For the Year Ended September 30, 2016
|
Functional currency:
| | |
EUR
| | 12.7% |
RMB
| | 2.4% |
JPY
| | 3.1% |
GBP
| | 1.7% |
BRL
| | 1.0% |
All other foreign currencies
| | 1.3% |
| | 22.2% |
| | |
|
|
|
|
|
|
|
|
|
|
|
| Percentage of Net Sales |
| Percentage of Net Sales |
|
| For the Year Ended September 30, 2019 |
| For the Year Ended September 30, 2018 |
Functional currency: |
|
|
|
|
EUR |
| 16.0% |
| 12.7% |
RMB |
| 5.7% |
| 4.5% |
JPY |
| 2.2% |
| 2.2% |
GBP |
| 2.1% |
| 2.2% |
All other foreign currencies |
| 1.3% |
| 1.6% |
|
| 27.3% |
| 23.2% |
|
|
|
|
|
Currency exchange rates vary daily and often one currency strengthens against the USD while another currency weakens. Because of the complex interrelationship of our worldwide supply chains and distribution channels, it is difficult to quantify the impact of a particular change in exchange rates.
From time to time, we will enter into a foreign currency exchange rate contract to hedge against changes in foreign currency exchange rates on liabilities expected to be settled at a future date. Market risk arises from the potential adverse effects on the value of derivative instruments that result from a change in foreign currency exchange rates. We minimize this market risk by establishing and monitoring parameters that limit the types of, and degree to which we enter into, derivative instruments. We enter into derivative instruments for risk management purposes only. We do not enter into or issue derivatives for trading or speculative purposes. As of September 30, 20162019 and 2015,2018, we had no open foreign currency exchange rate contracts and all previous exchange rate derivative instruments were settled or terminated.
In connection with the incurrence of the additional debt used to finance the L’Orange acquisition, we entered into a cross currency interest rate swap agreement that synthetically converts the $167,420 floating-rate debt under our existing revolving credit agreement to Euro denominated floating-rate debt. A corresponding Euro denominated intercompany loan receivable with identical terms and notional amount as the underlying Euro denominated floating-rate debt, with a reciprocal cross currency interest rate swap, was entered into by Woodward Barbados Financing SRL (“Barbados”), a wholly owned subsidiary of Woodward, and is designated as a fair value hedge. The objective of the derivative instrument is to hedge against the foreign currency exchange risk attributable to the spot remeasurement of the Euro denominated intercompany loan.
In addition, we entered into five cross currency interest rate swap agreements that synthetically converts an aggregate principal amount of $400,000 of fixed-rate debt associated with the private placement notes entered into in May 2018 (the “2018 Notes”) to Euro denominated fixed-rate debt. Five corresponding intercompany loans receivable, with identical terms and amounts of each tranche of the 2018 Notes and reciprocal cross currency interest rate swaps were entered into by Woodward Barbados, which are designated as cash flow hedges. The objective of these derivative instruments is to hedge the risk of variability in cash flows attributable to the foreign currency exchange risk of cash flows for future principal and interest payments associated with the Euro denominated intercompany loans over a fifteen year period.
Changes in the fair values of the cross currency swaps designated as cash flow hedges are recognized in accumulated other comprehensive income (“OCI”) and reclassified to foreign currency transaction gain or loss included in “Selling, general and administrative costs” in Woodward’s Consolidated Statements of Earnings. Reclassifications out of accumulated OCI of the change in fair value occur each reporting period based upon changes in the spot rate remeasurement of the Euro denominated intercompany loan, including associated interest. For the derivative instruments designated as fair value hedges, the change in the fair value related to the cross currency basis spread, or excluded component, of the derivative instrument is recognized in accumulated OCI. The remaining change in the fair value of the derivative instrument is recognized in foreign currency transaction gain or loss included in “Selling, general and administrative costs” in Woodward’s Consolidated Statements of Earnings. The change in the fair value of the derivative instrument in foreign currency
transaction gain or loss offsets the change in the spot remeasurement of the intercompany Euro denominated loan, with the initial cost of the cross currency basis spread recorded in earnings each period through the swap accrual process. In the year ended September 30, 2019, we recognized a gainrelated to the cross currency swaps of $47,759 in accumulated OCI as compared to a loss of $23,000 in the year ended September 30, 2018. The associated earnings reclassification of $31,374 for the year ended September 30, 2019 and $1,539 in the year ended September 30, 2018 were recorded as a foreign currency transaction gain and loss, respectively, included in “Selling, general and administrative costs” in the Consolidated Statements of Earnings. For both the year ended September 30, 3019 and 2018, the gain or loss included in “Selling, general and administrative costs” offset the reciprocal loss or gain recognized on the spot remeasurement of the underlying Euro denominated intercompany loans resulting in a net impact to earnings in the respective periods of zero.
On September 23, 2016, Woodward and Woodward International Holding B.V., a wholly owned subsidiary of Woodward organized under the laws of The Netherlands (the “BV Subsidiary”), entered into the 2016 Note Purchase Agreementsnote purchase agreements relating to the sale by Woodward and the BV Subsidiary of an aggregate principal amount of €160,000 of senior unsecured notes in a
series of private placement transactions. Woodward issued €40,000 aggregate principal amount of Woodward’s Series M Senior Notes due September 23, 2026. Woodward designated the €40,000 Series M Notes as a hedge of a foreign currency exposure of Woodward’s net investment in its EUR denominated functional currency subsidiaries. A foreignForeign exchange lossgains on the Series M Notes of $47 is$2,682 for the fiscal year ended September 30, 2019, a gain of $838 for the fiscal year ended September 30, 2018 and losses of $2,395 for the fiscal year ended September 30, 2017, are included in foreign currency translation adjustments within total comprehensive (losses) earnings for the fiscal year ended September 30, 2016.earnings.
In June 2015, Woodward designated an intercompany loan of 160,000 RMB between two wholly owned subsidiaries as a hedge of a foreign currency exposure of the net investment of the borrower in the lender. In June 2016, the intercompany loan was repaid, resulting in a realized gain of $1,484 that was recognized within total comprehensive earnings, of which $912 was recognized in fiscal year 2016 and $572 was recognized in fiscal year 2015.
In July 2016, Woodward designated a new intercompany loan of 160,000 RMB between the same two wholly owned subsidiaries as a hedge of a foreign currency exposure of the net investment of the borrower in the lender. AIn July 2017, the intercompany loan was repaid, resulting in a realized foreign exchange loss on the loangain of $73 is included in foreign currency translation adjustments$380 that was recognized within total comprehensive earnings, for theof which a gain of $453 was recognized in fiscal year ended September 30, 2016.2017.
For more information on derivative instruments, see Note 6, 8, Derivative instruments and hedging activities, in the Notes to the Consolidated Financial Statements in “Item 8 – Financial Statements and Supplementary Data.”
Our reported financial results of operations, including the reported value of our assets and liabilities, are also impacted by changes in foreign currency exchange rates. The assets and liabilities of substantially all of our subsidiaries outside the United States are translated at period end rates of exchange for each reporting period. Earnings and cash flow statements are translated at weighted-average rates of exchange. Although these translation changes have no immediate cash impact, the translation changes may impact future borrowing capacity, debt covenants, and the overall value of our net assets. In addition, we also have assets and liabilities, specifically accounts receivable, accounts payable and current inter-company receivables and payables, whose carrying amounts approximate their fair value, which are denominated in currencies other than their relevant functional currencies. Foreign currency exchange rate risk is reduced through several means, including the invoicing of customers in the same currency as the source of the products, and the prompt settlement of inter-company balances utilizing a global netting system. We recognized a net foreign currency gainloss of $701$1,018 in fiscal year 2016 and2019, a net foreign currency lossesloss of $1,721$1,608 in fiscal year 20152018, and $1,089a net foreign currency loss of $651 in fiscal year 20142017 in “Selling, general, and administrative expenses” of our Consolidated Statements of Earnings related to these assets and liabilities.
Item 8.Financial StatementsStatements and Supplementary Data
REPORT OF INDEPEND
ENTINDEPENDENT REGISTERED PUBLIC ACCOUNTING FIRM
To the Stockholders and Board of Directors and Stockholders of
Woodward, Inc.
Fort Collins, Colorado
Opinion on the Financial Statements
We have audited the accompanying consolidated balance sheets of Woodward, Inc. and subsidiaries (the "Company") as of September 30, 20162019 and 2015, and2018, the related consolidated statements of earnings, comprehensive earnings, stockholders'stockholders’ equity, and cash flows, for each of the three years in the period ended September 30, 2016. Our audits also included2019, and the financial statementrelated notes and the schedule listed in the Index at Item 15. These financial statements and financial statement schedule are15 (collectively referred to as the responsibility of the Company's management. Our responsibility is to express an opinion on these financial statements and financial statement schedule based on our audits.
We conducted our audits in accordance with the standards of the Public Company Accounting Oversight Board (United States)"financial statements"). Those standards require that we plan and perform the audit to obtain reasonable assurance about whether the financial statements are free of material misstatement. An audit includes examining, on a test basis, evidence supporting the amounts and disclosures in the financial statements. An audit also includes assessing the accounting principles used and significant estimates made by management, as well as evaluating the overall financial statement presentation. We believe that our audits provide a reasonable basis for our opinion.
In our opinion, suchthe consolidated financial statements present fairly, in all material respects, the financial position of Woodward, Inc. and subsidiariesthe Company as of September 30, 20162019 and 2015,2018, and the results of theirits operations and theirits cash flows for each of the three years in the period ended September 30, 2016,2019, in conformity with accounting principles generally accepted in the United States of America. Also, in our opinion, such financial statement schedule, when considered in relation to the basic consolidated financial statements taken as a whole, present fairly, in all material respects, the information set forth therein.
We have also audited, in accordance with the standards of the Public Company Accounting Oversight Board (United States) (PCAOB), the Company's internal control over financial reporting as of September 30, 2016,2019, based on the criteria established in Internal Control — Integrated Framework (2013) issued by the Committee of Sponsoring Organizations of the Treadway Commission and our report dated November 16, 201621, 2019, expressed an unqualified opinion on the Company's internal control over financial reportingWe have audited the accompanying consolidated balance sheets of Woodward, Inc. and subsidiaries (the "Company") as of September 30, 2019 and 2018, the related consolidated statements of earnings, comprehensive earnings, stockholders’ equity, and cash flows, for each of the three years in the period ended September 30, 2019, and the related notes and the schedule listed in the Index at Item 15 (collectively referred to as the "financial statements"). In our opinion, the consolidated financial statements present fairly, in all material respects, the financial position of the Company as of September 30, 2019 and 2018, and the results of its operations and its cash flows for each of the three years in the period ended September 30, 2019, in conformity with accounting principles generally accepted in the United States of America.We have also audited, in accordance with the standards of the Public Company Accounting Oversight Board (United States) (PCAOB), the Company's internal control over financial reporting as of September 30, 2019, based on criteria established in Internal Control — Integrated Framework (2013) issued by the Committee of Sponsoring Organizations of the Treadway Commission and our report dated November 21, 2019, expressed an unqualified opinion on the Company's internal control over financial reporting.We have audited the accompanying consolidated balance sheets of Woodward, Inc. and subsidiaries (the "Company") as of September 30, 2019 and 2018, the related consolidated statements of earnings, comprehensive earnings, stockholders’ equity, and cash flows, for each of the three years in the period ended September 30, 2019, and the related notes and the schedule listed in the Index at Item 15 (collectively referred to as the "financial statements"). In our opinion, the financial statements present fairly, in all material respects, the financial position of the Company as of September 30, 2019 and 2018, and the results of its operations and its cash flows for each of the three years in the period ended September 30, 2019, in conformity with accounting principles generally accepted in the United States of America.
We have also audited, in accordance with the standards of the Public Company Accounting Oversight Board (United States) (PCAOB), the Company's internal control over financial reporting as of September 30, 2019, based on criteria established in Internal Control — Integrated Framework (2013) issued by the Committee of Sponsoring Organizations of the Treadway Commission and our report dated November 25, 2019, expressed an unqualified opinion on the Company's internal control over financial reporting.
Change in Accounting Principle
As discussed in Note 3 to the financial statements, effective October 1, 2018, the Company adopted FASB Accounting Standards Update 2014-09, Revenue from Contracts with Customers (“ASC 606”), using the modified retrospective transition method.As discussed in Note 3 to the financial statements, the Company has changed its method of accounting for Revenue in 2019 due to the adoption of ASU 2014-09, Revenue from Contracts with Customers (“ASC 606”).Basis for Opinion
These financial statements are the responsibility of the Company's management. Our responsibility is to express an opinion on the Company's financial statements based on our audits. We are a public accounting firm registered with the PCAOB and are required to be independent with respect to the Company in accordance with the U.S. federal securities laws and the applicable rules and regulations of the Securities and Exchange Commission and the PCAOB.
We conducted our audits in accordance with the standards of the PCAOB. Those standards require that we plan and perform the audit to obtain reasonable assurance about whether the financial statements are free of material misstatement, whether due to error or fraud. Our audits included performing procedures to assess the risks of material misstatement of the financial statements, whether due to error or fraud, and performing procedures that respond to those risks. Such procedures included examining, on a test basis, evidence regarding the amounts and disclosures in the financial statements. Our audits also included evaluating the accounting principles used and significant estimates made by management, as well as evaluating the overall presentation of the financial statements. We believe that our audits provide a reasonable basis for our opinion.
Critical Audit Matters
The critical audit matters communicated below are matters arising from the current-period audit of the financial statements that were communicated or required to be communicated to the audit committee and that (1) relate to accounts or disclosures that are material to the financial statements and (2) involved our especially challenging, subjective, or complex judgments. The communication of critical audit matters does not alter in any way our opinion on the financial statements, taken as a whole, and we are not, by communicating the critical audit matters below, providing separate opinions on the critical audit matters or on the accounts or disclosures to which they relate.
Revenue — Adoption of ASC 606 — Refer to Note 3 to the financial statements (also see adoption of ASC 606 explanatory paragraph above).
Critical Audit Matter Description
The Company adopted ASC 606 on October 1, 2018 using the modified retrospective transition method. Upon adoption of ASC 606, the Company determined that approximately one-half of its revenues from sales of products and services to customers would be recognized over time, rather than at a point in time, due primarily to the terms of certain customer contracts. As a result of the change to an over time revenue recognition model for these contracts, the Company designed new business policies and procedures, modified existing information systems to assist in the adoption and ongoing application of the new guidance, implemented a new revenue recognition module to supplement and interface with its existing information systems, and designed and applied new internal controls related to impacted information systems, policies, and disclosures.
We identified the adoption of ASC 606 as a critical audit matter because of the changes made to the Company’s policies, processes and controls to record revenue over time, including management’s evaluation of the terms of customer contracts. This required extensive audit effort due to the volume of contracts and a degree of auditor judgment when performing audit procedures due to the changes made to the Company’s policies, processes and controls.
How the Critical Audit Matter Was Addressed in the Audit
Our audit procedures related to over time revenue as a result of the adoption of ASC 606 included the following, among others:
We selected a sample of customer contracts and evaluated management’s interpretation and application of ASC 606, which included assessing the terms of the contracts.
We tested the effectiveness of controls over the adoption of ASC 606 related to revenue recognized over time.
We evaluated the completeness and accuracy of the adjustment to beginning retained earnings and over time revenue recognition throughout the year by assessing whether, for a selection of customer contracts, performance obligations with no alternative use and an enforceable right to payment with a profit were appropriately recognized as revenue over time.
Intangible Assets, net — Tradename — Refer to Notes 1 and 13 to the financial statements.
Critical Audit Matter Description
The Company has one indefinitely lived intangible asset consisting of the Woodward L’Orange tradename (“tradename”). As of September 30, 2019, the carrying value of the tradename is $63.5 million. The tradename is tested for impairment on an annual basis and more often if an event occurs or circumstances change that indicate the fair value of the tradename may be below its carrying amount. The Company completed its annual impairment test of the tradename as of July 31, 2019. The results of impairment test indicated the estimated fair value of the tradename was in excess of its carrying value, and accordingly, no impairment existed.
The fair value of the tradename was determined using discounted cash flows based on the relief from royalty method under the income approach. This method incorporates various estimates and assumptions, the most significant being projected revenue growth rates, royalty rates, and the present value of the forecasted cash flows based on the discount rate and terminal growth rate. The Company projects revenue growth rates and cash flows based on Woodward L’Orange’s current operational results, expected performance and operational strategies over a ten-year period. These projections are adjusted to reflect current economic conditions and demand for certain products and require considerable management judgment. Changes in these estimates and assumptions can have a significant impact on the fair value.
We identified the fair value of the tradename as a critical audit matter because of the significant judgments and assumptions management makes related to the projection of revenue growth rates and the selection of the discount rate, terminal growth rate, and royalty rate. This required a high degree of auditor judgment and an increased extent of effort, including the need to involve our fair value specialists, when performing audit procedures to evaluate the reasonableness of management’s projection of revenue growth rates and selection of the discount rate, terminal growth rate, and royalty rate.
How the Critical Audit Matter Was Addressed in the Audit
Our audit procedures related to the projection of revenue growth rates and selection of the discount rate, terminal growth rate, and royalty rate used in determining the fair value of the tradename included the following, among others:
We tested the effectiveness of controls over the fair value of the tradename, including those over the projection of revenue growth rates and the selection of the discount rate, terminal growth rate, and royalty rate.
With the assistance of our fair value specialists, we evaluated the reasonableness of the discount rate, terminal growth rate, and royalty rate by:
oTesting the source information underlying the determination of the discount rate, terminal growth rate, and royalty rate and recalculating the mathematical accuracy of management’s calculation of the discount rate.
oDeveloping a range of independent estimates over each assumption and comparing those to the discount rate, terminal growth rate, and royalty rate selected by management.
We evaluated the reasonableness of management’s projected revenue growth rates by:
oComparing management’s projections to:
Historical revenue results for Woodward L’Orange
Internal communications to management and the board of directors
Projected information specific to Woodward L’Orange included in Company press releases as well as in analyst and industry reports
oConsidering the impact of changes in the regulatory environment on management’s forecasts.
oConsidering the impact of changes in management’s projections from the July 31, 2019, annual assessment date to September 30, 2019 by comparing actual results for the period to management projections within the original valuation model.
/s/ DELOITTE & TOUCHE LLP
Denver, Colorado
November 25, 2019
We have served as the Company’s auditor since 2008.
WOODWARD, INC.
CONSOLIDATED STATEMENTSSTATEMENTS OF EARNINGS
(In thousands, except per share amounts)
| | | | | | |
|
|
|
|
|
|
| | | | | | |
|
|
|
|
|
|
| | Year Ended September 30, |
| Year Ended September 30, |
| | 2016 | | 2015 | | 2014 |
| 2019 |
| 2018 |
| 2017 |
| | | | | | | | | |
|
|
|
|
|
|
|
|
|
Net sales | | $ | 2,023,078 | | $ | 2,038,303 | | $ | 2,001,240 |
| $ | 2,900,197 |
| $ | 2,325,873 |
| $ | 2,098,685 |
Costs and expenses: | | | | | | | | |
|
|
|
|
|
|
|
|
|
Cost of goods sold | | 1,475,540 | | | 1,453,718 | | | 1,425,839 |
|
| 2,192,654 |
|
| 1,722,802 |
|
| 1,527,568 |
Selling, general and administrative expenses | | 154,951 | | | 156,995 | | | 155,339 |
|
| 211,205 |
|
| 193,736 |
|
| 177,322 |
Research and development costs | | 126,170 | | | 134,485 | | | 138,005 |
|
| 159,107 |
|
| 148,279 |
|
| 126,519 |
Amortization of intangible assets | | 27,486 | | | 29,241 | | | 33,580 | |
Restructuring charges | |
| - |
|
| 17,013 |
|
| - |
Interest expense | | 26,776 | | | 24,864 | | | 22,804 |
|
| 44,001 |
|
| 40,465 |
|
| 35,639 |
Interest income | | (2,025) | | | (787) | | | (271) |
|
| (1,413) |
|
| (1,674) |
|
| (1,725) |
Other (income) expense, net (Note 15) | | | (12,306) | | | (1,162) | | | (1,300) | |
Other (income) expense, net (Note 17) | |
|
| (25,969) |
|
| (14,326) |
|
| (19,385) |
Total costs and expenses | | | 1,796,592 | | | 1,797,354 | | | 1,773,996 |
|
| 2,579,585 |
|
| 2,106,295 |
|
| 1,845,938 |
Earnings before income taxes | | | 226,486 | | | 240,949 | | | 227,244 |
|
| 320,612 |
|
| 219,578 |
|
| 252,747 |
Income tax expense | | | 45,648 | | | 59,497 | | | 61,400 |
|
| 61,010 |
|
| 39,200 |
|
| 52,240 |
Net earnings | | $ | 180,838 | | $ | 181,452 | | $ | 165,844 |
| $ | 259,602 |
| $ | 180,378 |
| $ | 200,507 |
| | | | | | | | | |
|
|
|
|
|
|
|
|
|
Earnings per share (Note 3): | | | | | | | |
Earnings per share (Note 4): | |
|
|
|
|
|
|
|
Basic earnings per share | | $ | 2.92 | | $ | 2.81 | | $ | 2.50 |
| $ | 4.19 |
| $ | 2.93 |
| $ | 3.27 |
Diluted earnings per share | | $ | 2.85 | | $ | 2.75 | | $ | 2.45 |
| $ | 4.02 |
| $ | 2.82 |
| $ | 3.16 |
| | | | | | |
|
|
|
|
|
|
|
Weighted Average Common Shares Outstanding (Note 3): | | | | | | | |
Weighted Average Common Shares Outstanding (Note 4): | |
|
|
|
|
|
|
|
Basic | | | 61,893 | | | 64,684 | | 66,432 |
|
| 61,950 |
|
| 61,493 |
| 61,366 |
Diluted | | | 63,556 | | | 66,056 | | 67,776 |
|
| 64,498 |
|
| 63,876 |
| 63,512 |
Cash dividends per share paid to Woodward common stockholders | | $ | 0.43 | | $ | 0.38 | | $ | 0.32 | |
| | | | | | | |
|
|
|
|
|
|
| |
|
|
|
|
|
|
|
See accompanying Notes to Consolidated Financial Statements
WOODWARD, INC.
CONSOLIDATED STATEMENTS OF COMPREHENSIVE EARNINGS
(In thousands)
| | | | | | | | |
|
|
|
|
|
|
| | | | | | | | |
|
|
|
|
|
|
| Year Ended September 30, | Year Ended September 30, |
| 2016 | | 2015 | | 2014 | 2019 |
| 2018 |
| 2017 |
| | | | | | | | |
|
|
|
|
|
|
|
|
Net earnings | $ | 180,838 | | $ | 181,452 | | $ | 165,844 | $ | 259,602 |
| $ | 180,378 |
| $ | 200,507 |
| |
|
|
|
|
|
|
Other comprehensive earnings: | | | | | | | | |
|
|
|
|
|
|
|
|
Foreign currency translation adjustments | | (6,615) | | | (34,989) | | | (16,003) |
| (16,554) |
|
| (12,985) |
|
| 45 |
Net gain on foreign currency transactions designated as hedges of net investments in a foreign subsidiaries | | 792 | | | 572 | | | - | |
Net gain (loss) on foreign currency transactions designated as hedges of net investments in foreign subsidiaries (Note 8) | |
| 2,682 |
|
| 838 |
| (1,942) |
Taxes on changes on foreign currency translation adjustments | | 1,462 | | | 1,988 | | | 1,080 |
| 476 |
|
| (367) |
|
| 588 |
Foreign currency translation and transactions adjustments, net of tax | |
| (13,396) |
|
| (12,514) |
|
| (1,309) |
| | (4,361) | | | (32,429) | | | (14,923) |
|
|
|
|
|
|
|
|
Reclassification of realized losses on derivatives to earnings | | 21 | | | 99 | | | 99 | |
Unrealized gain (loss) on fair value adjustment of derivative instruments (Note 8) | |
| 47,759 |
|
| (23,000) |
|
| - |
Reclassification of net realized (gains) losses on derivatives to earnings (Note 8) | |
| (31,446) |
|
| 1,467 |
|
| (72) |
Taxes on changes on derivative transactions | | (8) | | | (38) | | | (37) |
| (326) |
|
| 456 |
|
| 28 |
Derivative adjustments, net of tax | |
| 15,987 |
|
| (21,077) |
|
| (44) |
| | 13 | | | 61 | | | 62 |
|
|
|
|
|
|
|
|
Minimum retirement benefit liability adjustments (Note 17): | | | | | | | | | |
Minimum retirement benefit liability adjustments (Note 19): | |
|
|
|
|
|
|
|
|
Net gain (loss) arising during the period | | (19,718) | | | (26,866) | | | 3,746 |
| (43,817) |
|
| 13,805 |
|
| 22,979 |
Prior service cost arising during the period | | - | | | - | | | (3,355) |
| (601) |
|
| - |
|
| - |
Loss (gain) due to settlement or curtailment arising during the period | | 47 | | | - | | | (7,539) | |
Loss due to settlement or curtailment arising during the period | |
| - |
|
| 59 |
|
| - |
Amortization of: | | | | | | | | |
|
|
|
|
|
|
|
|
Prior service benefit | | 226 | | | 225 | | | (66) | |
Prior service cost (benefit) | |
| 704 |
|
| 551 |
|
| (3,470) |
Net loss | | 1,694 | | | 513 | | | 785 |
| 955 |
|
| 985 |
|
| 2,570 |
Foreign currency exchange rate changes on minimum retirement benefit liabilities | | 2,239 | | | 867 | | | 104 |
| 1,318 |
|
| 367 |
|
| (43) |
Taxes on changes on minimum retirement benefit liability adjustments | | 5,613 | | | 9,704 | | | 2,538 |
| 10,531 |
|
| (3,932) |
|
| (8,164) |
| | (9,899) | | | (15,557) | | | (3,787) |
| (30,910) |
|
| 11,835 |
|
| 13,872 |
Total comprehensive earnings | $ | 166,591 | | $ | 133,527 | | $ | 147,196 | $ | 231,283 |
| $ | 158,622 |
| $ | 213,026 |
See accompanying Notes to Consolidated Financial Statements
WOODWARD, INC.
CONSOLIDATEDCONSOLIDATED BALANCE SHEETS
(In thousands, except per share amounts)
| | | | |
|
|
|
|
|
| | | | |
|
|
|
|
|
| September 30, | | September 30, | September 30, |
| September 30, |
| 2016 | | 2015 | 2019 |
| 2018 |
ASSETS | | | | | (a) |
|
|
|
|
|
Current assets: | | | | |
|
|
|
|
|
Cash and cash equivalents | $ | 81,090 | | $ | 82,202 | |
Accounts receivable, less allowance for uncollectible amounts of $2,540 and $3,841, respectively | | 343,768 | | 322,215 | |
Cash and cash equivalents, including restricted cash of $1,500 and $3,635, respectively | | $ | 99,073 |
| $ | 83,594 |
Accounts receivable, less allowance for uncollectible amounts of $7,908 and $3,938, respectively | |
| 591,529 |
|
| 432,003 |
Inventories | | 461,683 | | 447,664 |
| 516,836 |
|
| 549,596 |
Income taxes receivable | | 20,358 | | 21,838 |
| 8,099 |
|
| 6,397 |
Other current assets | | 37,525 | | | 43,500 |
| 55,691 |
|
| 43,207 |
Total current assets | | 944,424 | | | 917,419 |
| 1,271,228 |
|
| 1,114,797 |
Property, plant and equipment, net | | 876,350 | | 756,100 |
| 1,058,775 |
|
| 1,060,005 |
Goodwill | | 555,684 | | 556,977 |
| 797,853 |
|
| 813,250 |
Intangible assets, net | | 197,650 | | 225,138 |
| 611,992 |
|
| 700,883 |
Deferred income tax assets | | 20,194 | | 13,105 |
| 18,161 |
|
| 16,570 |
Other assets | | 48,060 | | | 43,665 |
| 198,517 |
|
| 85,144 |
Total assets | $ | 2,642,362 | | $ | 2,512,404 | $ | 3,956,526 |
| $ | 3,790,649 |
LIABILITIES AND STOCKHOLDERS' EQUITY | | | | | |
|
|
|
|
|
Current liabilities: | | | | |
|
|
|
|
|
Short-term borrowings and current portion of long-term debt | $ | 150,000 | | $ | 2,430 | |
Short-term borrowings | | $ | 220,000 |
| $ | 153,635 |
Accounts payable | | 169,439 | | 173,287 |
| 240,460 |
|
| 226,285 |
Income taxes payable | | 4,547 | | 6,555 |
| 18,849 |
|
| 16,745 |
Accrued liabilities | | 156,627 | | | 155,936 |
| 228,127 |
|
| 194,513 |
Total current liabilities | | 480,613 | | | 338,208 |
| 707,436 |
|
| 591,178 |
Long-term debt, less current portion | | 577,153 | | 848,488 |
| 864,899 |
|
| 1,092,397 |
Deferred income tax liabilities | | 3,777 | | 56,414 |
| 151,362 |
|
| 170,915 |
Other liabilities | | 368,224 | | | 116,190 |
| 506,088 |
|
| 398,055 |
Total liabilities | | 1,429,767 | | | 1,359,300 |
| 2,229,785 |
|
| 2,252,545 |
Commitments and contingencies (Note 19) | | | | | | |
Commitments and contingencies (Note 21) | |
| |
|
| |
Stockholders' equity: | | | | |
|
|
|
|
|
Preferred stock, par value $0.003 per share, 10,000 shares authorized, no shares issued | | - | | - | |
Preferred stock, par value $0.003 per share, 10,000 shares authorized, 0 shares issued | |
| - |
|
| - |
Common stock, par value $0.001455 per share, 150,000 shares authorized, 72,960 shares issued | | 106 | | 106 |
| 106 |
|
| 106 |
Additional paid-in capital | | 141,570 | | 131,231 |
| 207,120 |
|
| 185,705 |
Accumulated other comprehensive losses | | (65,705) | | (51,458) |
| (103,306) |
|
| (74,942) |
Deferred compensation | | 5,089 | | 4,322 |
| 9,382 |
|
| 8,431 |
Retained earnings | | 1,649,506 | | | 1,495,274 |
| 2,224,919 |
|
| 1,966,643 |
| | 1,730,566 | | | 1,579,475 |
| 2,338,221 |
|
| 2,085,943 |
Treasury stock at cost, 11,374 shares and 9,763 shares, respectively | | (512,882) | | (422,049) | |
Treasury stock held for deferred compensation, at cost, 157 shares and 173 shares, respectively | | (5,089) | | | (4,322) | |
Treasury stock at cost, 11,040 shares and 11,203 shares, respectively | |
| (602,098) |
|
| (539,408) |
Treasury stock held for deferred compensation, at cost, 211 shares and 202 shares, respectively | |
| (9,382) |
|
| (8,431) |
Total stockholders' equity | | 1,212,595 | | | 1,153,104 |
| 1,726,741 |
|
| 1,538,104 |
Total liabilities and stockholders' equity | $ | 2,642,362 | | $ | 2,512,404 | $ | 3,956,526 |
| $ | 3,790,649 |
| | | | | |
|
|
|
|
|
(a) Retrospectively adjusted as discussed in Note 2, New accounting standards | | | | | |
See accompanying Notes to Consolidated Financial Statements.
WOODWARD, INC.
CONSOLIDATED STATEMENTS OF CASH FLOWS
(In thousands)
|
|
|
|
|
|
|
|
|
|
|
|
|
|
|
|
|
|
| Year Ended September 30, |
| 2019 |
| 2018 |
| 2017 |
|
|
|
|
|
|
|
|
|
Cash flows from operating activities: |
|
|
|
|
|
|
|
|
Net earnings | $ | 259,602 |
| $ | 180,378 |
| $ | 200,507 |
Adjustments to reconcile net earnings to net cash provided by operating activities: |
|
|
|
|
|
|
|
|
Depreciation and amortization |
| 142,004 |
|
| 116,131 |
|
| 80,917 |
Gain due to curtailment of postretirement plan |
| - |
|
| (330) |
|
| - |
Net loss (gain) on sales of assets |
| 1,925 |
|
| (1,106) |
|
| (3,604) |
Stock-based compensation |
| 18,146 |
|
| 18,229 |
|
| 17,282 |
Deferred income taxes |
| (10,065) |
|
| (30,177) |
|
| 22,772 |
Changes in operating assets and liabilities: |
|
|
|
|
|
|
|
|
Trade accounts receivable |
| 841 |
|
| (6,494) |
|
| (53,151) |
Unbilled receivables (contract assets) |
| (31,353) |
|
| - |
|
| - |
Costs to fulfill a contract |
| (20,656) |
|
| - |
|
| - |
Inventories |
| (49,185) |
|
| (7,660) |
|
| (10,857) |
Accounts payable and accrued liabilities |
| 48,004 |
|
| (2,284) |
|
| 64,659 |
Contract liabilities |
| 29,082 |
|
| (1,596) |
|
| (1,292) |
Income taxes |
| 2,083 |
|
| 35,641 |
|
| 3,323 |
Retirement benefit obligations |
| (3,705) |
|
| (4,653) |
|
| (2,932) |
Other |
| 3,885 |
|
| 3,213 |
|
| (10,087) |
Net cash provided by operating activities | $ | 390,608 |
| $ | 299,292 |
| $ | 307,537 |
|
|
|
|
|
|
|
|
|
Cash flows from investing activities: |
|
|
|
|
|
|
|
|
Payments for purchase of property, plant, and equipment |
| (99,066) |
|
| (127,140) |
|
| (92,336) |
Proceeds from sale of assets |
| 1,010 |
|
| 1,923 |
|
| 3,743 |
Proceeds from sales of short-term investments |
| 22,252 |
|
| 9,088 |
|
| 5,313 |
Payments for purchases of short-term investments |
| (26,723) |
|
| (9,323) |
|
| (8,586) |
Business acquisitions, net of cash acquired |
| - |
|
| (771,115) |
|
| - |
Net cash used in investing activities |
| (102,527) |
|
| (896,567) |
|
| (91,866) |
|
|
|
|
|
|
|
|
|
Cash flows from financing activities: |
|
|
|
|
|
|
|
|
Cash dividends paid |
| (39,066) |
|
| (34,003) |
|
| (29,745) |
Proceeds from sales of treasury stock |
| 36,044 |
|
| 9,132 |
|
| 14,195 |
Payments for repurchases of common stock |
| (110,311) |
|
| - |
|
| (71,751) |
Borrowings on revolving lines of credit and short-term borrowings |
| 1,683,542 |
|
| 1,930,261 |
|
| 1,506,000 |
Payments on revolving lines of credit and short-term borrowings |
| (1,690,035) |
|
| (1,691,934) |
|
| (1,630,100) |
Proceeds from issuance of long-term debt |
| - |
|
| 400,000 |
|
| - |
Payments of long-term debt and capital lease obligations |
| (143,535) |
|
| (421) |
|
| (412) |
Payments of debt financing costs |
| (2,238) |
|
| (1,494) |
|
| - |
Payment for forward option derivative instrument |
| - |
|
| (5,543) |
|
| - |
Net cash (used in) provided by financing activities |
| (265,599) |
|
| 605,998 |
|
| (211,813) |
Effect of exchange rate changes on cash and cash equivalents |
| (7,003) |
|
| (12,681) |
|
| 2,604 |
Net change in cash and cash equivalents |
| 15,479 |
|
| (3,958) |
|
| 6,462 |
Cash and cash equivalents, including restricted cash, at beginning of year |
| 83,594 |
|
| 87,552 |
|
| 81,090 |
Cash and cash equivalents, including restricted cash, at end of period | $ | 99,073 |
| $ | 83,594 |
| $ | 87,552 |
|
|
|
|
|
|
|
|
|
Seeaccompanying Notes to Consolidated Financial Statements
WOODWARD, INC.
CONSOLIDATED STATEMENTS OF CASH FLOWSSTOCKHOLDERS’ EQUITY
(In thousands)thousands, except per share amounts)
| | | | | | | | |
| | | | | | | | |
| Year Ended September 30, |
| 2016 | | 2015 | | 2014 |
Cash flows from operating activities: | | | | | (a) | | | (a) |
Net earnings | $ | 180,838 | | $ | 181,452 | | $ | 165,844 |
Adjustments to reconcile net earnings to net cash provided by operating activities: | | | | | | | | |
Depreciation and amortization | | 69,036 | | | 75,235 | | | 77,353 |
Loss (gain) due to settlements or curtailments of postretirement plan (Note 17) | | 47 | | | - | | | (7,539) |
Impairment of long-lived asset held for sale (Note 9) | | - | | | - | | | 3,138 |
Net (gain) loss on sales of assets | | (4,431) | | | (626) | | | 166 |
Stock-based compensation | | 15,122 | | | 14,255 | | | 11,241 |
Deferred income taxes | | (52,744) | | | 15,504 | | | (6,704) |
Loss on derivatives reclassified from accumulated comprehensive earnings into earnings | | 21 | | | 99 | | | 99 |
Proceeds from formation of joint venture (Note 4) | | 250,000 | | | - | | | - |
Changes in operating assets and liabilities: | | | | | | | | |
Accounts receivable | | (9,190) | | | 14,845 | | | 30,880 |
Inventories | | (17,658) | | | (8,824) | | | (27,788) |
Accounts payable and accrued liabilities | | 17,461 | | | 3,029 | | | 25,804 |
Current income taxes | | (834) | | | (7,487) | | | 9,378 |
Retirement benefit obligations | | (3,416) | | | (4,537) | | | (2,788) |
Other | | (8,873) | | | 13,045 | | | (5,514) |
Net cash provided by operating activities | | 435,379 | | | 295,990 | | | 273,570 |
Cash flows from investing activities: | | | | | | | | |
Payments for purchase of property, plant, and equipment | | (175,692) | | | (286,612) | | | (207,106) |
Net proceeds from sale of assets | | 6,664 | | | 2,529 | | | 1,277 |
Purchases of short-term investments | | (4,918) | | | - | | | - |
Net cash used in investing activities | | (173,946) | | | (284,083) | | | (205,829) |
Cash flows from financing activities: | | | | | | | | |
Cash dividends paid | | (26,606) | | | (24,646) | | | (21,263) |
Proceeds from sales of treasury stock | | 15,892 | | | 8,400 | | | 9,772 |
Payments for repurchases of common stock | | (125,541) | | | (158,762) | | | (143,224) |
Borrowings on revolving lines of credit and short-term borrowings | | 695,000 | | | 999,971 | | | 431,071 |
Payments on revolving lines of credit and short-term borrowings | | (890,896) | | | (856,610) | | | (221,069) |
Proceeds from issuance of long-term debt | | 179,308 | | | - | | | 250,000 |
Payments of long-term debt and capital lease obligations | | (107,287) | | | - | | | (300,000) |
Payments of debt financing costs | | (863) | | | (2,359) | | | (1,297) |
Net cash provided by (used in) financing activities | | (260,993) | | | (34,006) | | | 3,990 |
Effect of exchange rate changes on cash and cash equivalents | | (1,552) | | | (10,986) | | | (5,000) |
Net change in cash and cash equivalents | | (1,112) | | | (33,085) | | | 66,731 |
Cash and cash equivalents at beginning of year | | 82,202 | | | 115,287 | | | 48,556 |
Cash and cash equivalents at end of year | $ | 81,090 | | $ | 82,202 | | $ | 115,287 |
| | | | | | | | |
(a) Retrospectively adjusted as discussed in Note 2, New accounting standards | | | | | | | | |
|
|
|
|
|
|
|
|
|
|
|
|
|
|
|
|
|
|
|
|
|
|
|
|
|
|
|
|
|
|
|
|
|
|
|
|
|
|
|
|
|
|
|
|
|
|
|
|
|
|
|
|
|
|
|
|
|
|
|
|
|
|
|
|
|
|
|
|
|
|
|
|
|
|
|
|
|
|
|
|
|
| Number of shares |
| Stockholders' equity |
|
|
|
|
|
|
|
|
|
|
|
|
|
| Accumulated other comprehensive (loss) earnings |
|
|
|
|
|
|
|
|
|
|
|
|
|
|
|
|
| Common
stock |
| Treasury
stock |
| Treasury
stock held for
deferred
compensation |
| Common
stock |
| Additional
paid-in
capital |
| Foreign
currency
translation
adjustments |
| Unrealized
derivative
gains
(losses) |
| Minimum
retirement
benefit
liability
adjustments |
| Total
accumulated
other
comprehensive
(loss) earnings |
| Deferred compensation |
| Retained
earnings |
| Treasury
stock at
cost |
| Treasury
stock held for
deferred
compensation |
| Total stockholders'
equity |
|
|
|
|
|
|
|
|
|
|
|
|
|
|
|
|
|
|
|
|
|
|
|
|
|
|
|
|
|
|
|
|
|
|
|
|
|
|
|
|
Balances as of October 1, 2016 |
| 72,960 |
| (11,374) |
| (157) |
| $ | 106 |
| $ | 141,570 |
| $ | (25,971) |
| $ | 179 |
| $ | (39,913) |
| $ | (65,705) |
| $ | 5,089 |
| $ | 1,649,506 |
| $ | (512,882) |
| $ | (5,089) |
| $ | 1,212,595 |
Net earnings |
| - |
| - |
| - |
|
| - |
|
| - |
|
| - |
|
| - |
|
| - |
|
| - |
|
| - |
|
| 200,507 |
|
| - |
|
| - |
|
| 200,507 |
Other comprehensive income (loss), net of tax |
| - |
| - |
| - |
|
| - |
|
| - |
|
| (1,309) |
|
| (44) |
|
| 13,872 |
|
| 12,519 |
|
| - |
|
| - |
|
| - |
|
| - |
|
| 12,519 |
Cash dividends paid ($0.4850 per share) |
| - |
| - |
| - |
|
| - |
|
| - |
|
| - |
|
| - |
|
| - |
|
| - |
|
| - |
|
| (29,745) |
|
| - |
|
| - |
|
| (29,745) |
Purchases of treasury stock |
| - |
| (1,056) |
| - |
|
| - |
|
| - |
|
| - |
|
| - |
|
| - |
|
| - |
|
| - |
|
| - |
|
| (73,224) |
|
| - |
|
| (73,224) |
Sales of treasury stock |
| - |
| 466 |
| - |
|
| - |
|
| (2,257) |
|
| - |
|
| - |
|
| - |
|
| - |
|
| - |
|
| - |
|
| 17,925 |
|
| - |
|
| 15,668 |
Common shares issued from treasury stock for benefit plans |
| - |
| 199 |
| - |
|
| - |
|
| 6,501 |
|
| - |
|
| - |
|
| - |
|
| - |
|
| - |
|
| - |
|
| 7,513 |
|
| - |
|
| 14,014 |
Common shares issued from treasury stock to settle employee liabilities |
| - |
| 26 |
| (26) |
|
| - |
|
| 740 |
|
| - |
|
| - |
|
| - |
|
| - |
|
| 1,767 |
|
| - |
|
| 1,027 |
|
| (1,767) |
|
| 1,767 |
Stock-based compensation |
| - |
| - |
| - |
|
| - |
|
| 17,282 |
|
| - |
|
| - |
|
| - |
|
| - |
|
| - |
|
| - |
|
| - |
|
| - |
|
| 17,282 |
Purchases and transfers of stock by/to deferred compensation plan |
| - |
| - |
| (3) |
|
| - |
|
| - |
|
| - |
|
| - |
|
| - |
|
| - |
|
| 298 |
|
| - |
|
| - |
|
| (298) |
|
| - |
Distribution of stock from deferred compensation plan |
| - |
| - |
| - |
|
| - |
|
| - |
|
| - |
|
| - |
|
| - |
|
| - |
|
| (19) |
|
| - |
|
| - |
|
| 19 |
|
| - |
Balances as of September 30, 2017 |
| 72,960 |
| (11,739) |
| (186) |
| $ | 106 |
| $ | 163,836 |
| $ | (27,280) |
| $ | 135 |
| $ | (26,041) |
| $ | (53,186) |
| $ | 7,135 |
| $ | 1,820,268 |
| $ | (559,641) |
| $ | (7,135) |
| $ | 1,371,383 |
|
|
|
|
|
|
|
|
|
|
|
|
|
|
|
|
|
|
|
|
|
|
|
|
|
|
|
|
|
|
|
|
|
|
|
|
|
|
|
|
Balances as of September 30, 2017 |
| 72,960 |
| (11,739) |
| (186) |
| $ | 106 |
| $ | 163,836 |
| $ | (27,280) |
| $ | 135 |
| $ | (26,041) |
| $ | (53,186) |
| $ | 7,135 |
| $ | 1,820,268 |
| $ | (559,641) |
| $ | (7,135) |
| $ | 1,371,383 |
Net earnings |
| - |
| - |
| - |
|
| - |
|
| - |
|
| - |
|
| - |
|
| - |
|
| - |
|
| - |
|
| 180,378 |
|
| - |
|
| - |
|
| 180,378 |
Other comprehensive earnings (loss), net of tax |
| - |
| - |
| - |
|
| - |
|
| - |
|
| (12,514) |
|
| (21,077) |
|
| 11,835 |
|
| (21,756) |
|
| - |
|
| - |
|
| - |
|
| - |
|
| (21,756) |
Cash dividends paid ($0.5525 per share) |
| - |
| - |
| - |
|
| - |
|
| - |
|
| - |
|
| - |
|
| - |
|
| - |
|
| - |
|
| (34,003) |
|
| - |
|
| - |
|
| (34,003) |
Sales of treasury stock |
| - |
| 334 |
| - |
|
| - |
|
| (3,517) |
|
| - |
|
| - |
|
| - |
|
| - |
|
| - |
|
| - |
|
| 12,649 |
|
| - |
|
| 9,132 |
Common shares issued from treasury stock for benefit plans |
| - |
| 202 |
| - |
|
| - |
|
| 7,157 |
|
| - |
|
| - |
|
| - |
|
| - |
|
| - |
|
| - |
|
| 7,584 |
|
| - |
|
| 14,741 |
Stock-based compensation |
| - |
| - |
| - |
|
| - |
|
| 18,229 |
|
| - |
|
| - |
|
| - |
|
| - |
|
| - |
|
| - |
|
| - |
|
| - |
|
| 18,229 |
Purchases and transfers of stock by/to deferred compensation plan |
| - |
| - |
| (17) |
|
| - |
|
| - |
|
| - |
|
| - |
|
| - |
|
| - |
|
| 1,318 |
|
| - |
|
| - |
|
| (1,318) |
|
| - |
Distribution of stock from deferred compensation plan |
| - |
| - |
| 1 |
|
| - |
|
| - |
|
| - |
|
| - |
|
| - |
|
| - |
|
| (22) |
|
| - |
|
| - |
|
| 22 |
|
| - |
Balances as of September 30, 2018 |
| 72,960 |
| (11,203) |
| (202) |
| $ | 106 |
| $ | 185,705 |
| $ | (39,794) |
| $ | (20,942) |
| $ | (14,206) |
| $ | (74,942) |
| $ | 8,431 |
| $ | 1,966,643 |
| $ | (539,408) |
| $ | (8,431) |
| $ | 1,538,104 |
|
|
|
|
|
|
|
|
|
|
|
|
|
|
|
|
|
|
|
|
|
|
|
|
|
|
|
|
|
|
|
|
|
|
|
|
|
|
|
|
Balances as of September 30, 2018 |
| 72,960 |
| (11,203) |
| (202) |
| $ | 106 |
| $ | 185,705 |
| $ | (39,794) |
| $ | (20,942) |
| $ | (14,206) |
| $ | (74,942) |
| $ | 8,431 |
| $ | 1,966,643 |
| $ | (539,408) |
| $ | (8,431) |
| $ | 1,538,104 |
Cumulative effect from adoption of ASC 606 (Note 3) |
| - |
| - |
| - |
|
| - |
|
| - |
|
| (45) |
|
| - |
|
| - |
|
| (45) |
|
| - |
|
| 38,745 |
|
| - |
|
| - |
|
| 38,700 |
Cumulative effect from adoption of ASU 2016-16 (Note 2) |
| - |
| - |
| - |
|
| - |
|
| - |
|
| - |
|
| - |
|
| - |
|
| - |
|
| - |
|
| (1,005) |
|
| - |
|
| - |
|
| (1,005) |
Net earnings |
| - |
| - |
| - |
|
| - |
|
| - |
|
| - |
|
| - |
|
| - |
|
| - |
|
| - |
|
| 259,602 |
|
| - |
|
| - |
|
| 259,602 |
Other comprehensive earnings (loss), net of tax |
| - |
| - |
| - |
|
| - |
|
| - |
|
| (13,396) |
|
| 15,987 |
|
| (30,910) |
|
| (28,319) |
|
| - |
|
| - |
|
| - |
|
| - |
|
| (28,319) |
Cash dividends paid ($0.6300 per share) |
| - |
| - |
| - |
|
| - |
|
| - |
|
| - |
|
| - |
|
| - |
|
| - |
|
| - |
|
| (39,066) |
|
| - |
|
| - |
|
| (39,066) |
Purchases of treasury stock |
| - |
| (1,102) |
| - |
|
| - |
|
| - |
|
| - |
|
| - |
|
| - |
|
| - |
|
| - |
|
| - |
|
| (110,311) |
|
| - |
|
| (110,311) |
Sales of treasury stock |
| - |
| 1,107 |
| - |
|
| - |
|
| (5,904) |
|
| - |
|
| - |
|
| - |
|
| - |
|
| - |
|
| - |
|
| 41,948 |
|
| - |
|
| 36,044 |
Common shares issued from treasury stock for benefit plans |
| - |
| 158 |
| - |
|
| - |
|
| 9,173 |
|
| - |
|
| - |
|
| - |
|
| - |
|
| - |
|
| - |
|
| 5,673 |
|
| - |
|
| 14,846 |
Stock-based compensation |
| - |
| - |
| - |
|
| - |
|
| 18,146 |
|
| - |
|
| - |
|
| - |
|
| - |
|
| - |
|
| - |
|
| - |
|
| - |
|
| 18,146 |
Purchases and transfers of stock by/to deferred compensation plan |
| - |
| - |
| (14) |
|
| - |
|
| - |
|
| - |
|
| - |
|
| - |
|
| - |
|
| 1,193 |
|
| - |
|
| - |
|
| (1,193) |
|
| - |
Distribution of stock from deferred compensation plan |
| - |
| - |
| 5 |
|
| - |
|
| - |
|
| - |
|
| - |
|
| - |
|
| - |
|
| (242) |
|
| - |
|
| - |
|
| 242 |
|
| - |
Balances as of September 30, 2019 |
| 72,960 |
| (11,040) |
| (211) |
| $ | 106 |
| $ | 207,120 |
| $ | (53,235) |
| $ | (4,955) |
| $ | (45,116) |
| $ | (103,306) |
| $ | 9,382 |
| $ | 2,224,919 |
| $ | (602,098) |
| $ | (9,382) |
| $ | 1,726,741 |
|
|
|
|
|
|
|
|
|
|
|
|
|
|
|
|
|
|
|
|
|
|
|
|
|
|
|
|
|
|
|
|
|
|
|
|
|
|
|
|
See accompanying Notes to Consolidated Financial Statements.
WOODWARD, INC.CONSOLIDATED STATEMENTS OF STOCKHOLDERS’ EQUITY
(In thousands)
| | | | | | | | | | | | | | | | | | | | | | | | | | | | | | | | | | | | | | | | | |
| | | | | | | | | | | | | | | | | | | | | | | | | | | | | | | | | | | | | | | | | |
| | Number of shares | | Stockholders' equity |
| | | | | | | | | | | | | | | | Accumulated other comprehensive (loss) earnings | | | | | | | | | | | | | | | |
| | Preferred stock | | Common stock | | Treasury stock | | Treasury stock held for deferred compensation | | Common stock | | Additional paid-in capital | | Foreign currency translation adjustments | | Unrealized derivative gains (losses) | | Minimum retirement benefit liability adjustments | | Total accumulated other comprehensive (loss) earnings | | Deferred compensation | | Retained earnings | | Treasury stock at cost | | Treasury stock held for deferred compensation | | Total stockholders' equity |
| | | | | | | | | | | | | | | | | | | | | | | | | | | | | | | | | | | | | | | | | |
Balances as of October 1, 2013 | | - | | 72,960 | | (4,883) | | (232) | | $ | 106 | | $ | 101,147 | | $ | 25,742 | | $ | 43 | | $ | (10,670) | | $ | 15,115 | | $ | 4,007 | | $ | 1,193,887 | | $ | (167,710) | | $ | (4,007) | | $ | 1,142,545 |
Net earnings | | - | | - | | - | | - | | | - | | | - | | | - | | | - | | | - | | | - | | | - | | | 165,844 | | | - | | | - | | | 165,844 |
Other comprehensive income (loss), net of tax | | - | | - | | - | | - | | | - | | | - | | | (14,923) | | | 62 | | | (3,787) | | | (18,648) | | | - | | | - | | | - | | | - | | | (18,648) |
Cash dividends ($0.32 per share) | | - | | - | | - | | - | | | - | | | - | | | - | | | - | | | - | | | - | | | - | | | (21,263) | | | - | | | - | | | (21,263) |
Purchases of treasury stock | | - | | - | | (3,336) | | - | | | - | | | - | | | - | | | - | | | - | | | - | | | - | | | - | | | (144,510) | | | - | | | (144,510) |
Sales of treasury stock | | - | | - | | 562 | | - | | | - | | | (6,217) | | | - | | | - | | | - | | | - | | | - | | | - | | | 17,276 | | | - | | | 11,059 |
Common shares issued from treasury stock for benefit plans | | - | | - | | 260 | | - | | | - | | | 2,837 | | | - | | | - | | | - | | | - | | | - | | | - | | | 8,356 | | | - | | | 11,193 |
Tax benefit attributable to stock-based compensation | | - | | - | | - | | - | | | - | | | 3,483 | | | - | | | - | | | - | | | - | | | - | | | - | | | - | | | - | | | 3,483 |
Stock-based compensation | | - | | - | | - | | - | | | - | | | 11,241 | | | - | | | - | | | - | | | - | | | - | | | - | | | - | | | - | | | 11,241 |
Purchase of stock by deferred compensation plan | | - | | - | | - | | (8) | | | - | | | - | | | - | | | - | | | - | | | - | | | 370 | | | - | | | - | | | (370) | | | - |
Distribution of stock from deferred compensation plan | | - | | - | | - | | 42 | | | - | | | - | | | - | | | - | | | - | | | - | | | (462) | | | - | | | - | | | 462 | | | - |
Balances as of September 30, 2014 | | - | | 72,960 | | (7,397) | | (198) | | $ | 106 | | $ | 112,491 | | $ | 10,819 | | $ | 105 | | $ | (14,457) | | $ | (3,533) | | $ | 3,915 | | $ | 1,338,468 | | $ | (286,588) | | $ | (3,915) | | $ | 1,160,944 |
Net earnings | | - | | - | | - | | - | | | - | | | - | | | - | | | - | | | - | | | - | | | - | | | 181,452 | | | - | | | - | | | 181,452 |
Other comprehensive income (loss), net of tax | | - | | - | | - | | - | | | - | | | - | | | (32,429) | | | 61 | | | (15,557) | | | (47,925) | | | - | | | - | | | - | | | - | | | (47,925) |
Cash dividends paid ($0.38 per share) | | - | | - | | - | | - | | | - | | | - | | | - | | | - | | | - | | | - | | | - | | | (24,646) | | | - | | | - | | | (24,646) |
Purchases of treasury stock | | - | | - | | (3,193) | | - | | | - | | | - | | | - | | | - | | | - | | | - | | | - | | | - | | | (160,294) | | | - | | | (160,294) |
Sales of treasury stock | | - | | - | | 568 | | - | | | - | | | (6,817) | | | - | | | - | | | - | | | - | | | - | | | - | | | 16,749 | | | - | | | 9,932 |
Common shares issued from treasury stock for benefit plans | | - | | - | | 259 | | - | | | - | | | 4,490 | | | - | | | - | | | - | | | - | | | - | | | - | | | 8,084 | | | - | | | 12,574 |
Tax benefit attributable to stock-based compensation | | - | | - | | - | | - | | | - | | | 6,812 | | | - | | | - | | | - | | | - | | | - | | | - | | | - | | | - | | | 6,812 |
Stock-based compensation | | - | | - | | - | | - | | | - | | | 14,255 | | | - | | | - | | | - | | | - | | | - | | | - | | | - | | | - | | | 14,255 |
Purchases of stock by deferred compensation plan | | - | | - | | - | | (18) | | | - | | | - | | | - | | | - | | | - | | | - | | | 893 | | | - | | | - | | | (893) | | | - |
Distribution of stock from deferred compensation plan | | - | | - | | - | | 43 | | | - | | | - | | | - | | | - | | | - | | | - | | | (486) | | | - | | | - | | | 486 | | | - |
Balances as of September 30, 2015 | | - | | 72,960 | | (9,763) | | (173) | | $ | 106 | | $ | 131,231 | | $ | (21,610) | | $ | 166 | | $ | (30,014) | | $ | (51,458) | | $ | 4,322 | | $ | 1,495,274 | | $ | (422,049) | | $ | (4,322) | | $ | 1,153,104 |
Net earnings | | - | | - | | - | | - | | | - | | | - | | | - | | | - | | | - | | | - | | | - | | | 180,838 | | | - | | | - | | | 180,838 |
Other comprehensive income (loss), net of tax | | - | | - | | - | | - | | | - | | | - | | | (4,361) | | | 13 | | | (9,899) | | | (14,247) | | | - | | | - | | | - | | | - | | | (14,247) |
Cash dividends paid ($0.43 per share) | | - | | - | | - | | - | | | - | | | - | | | - | | | - | | | - | | | - | | | - | | | (26,606) | | | - | | | - | | | (26,606) |
Purchases of treasury stock | | - | | - | | (2,660) | | - | | | - | | | - | | | - | | | - | | | - | | | - | | | - | | | - | | | (126,295) | | | - | | | (126,295) |
Sales of treasury stock | | - | | - | | 732 | | - | | | - | | | (10,137) | | | - | | | - | | | - | | | - | | | - | | | - | | | 26,782 | | | - | | | 16,645 |
Common shares issued from treasury stock for benefit plans | | - | | - | | 317 | | - | | | - | | | 5,319 | | | - | | | - | | | - | | | - | | | - | | | - | | | 8,680 | | | - | | | 13,999 |
Tax benefit attributable to stock-based compensation | | - | | - | | - | | - | | | - | | | 35 | | | - | | | - | | | - | | | - | | | - | | | - | | | - | | | - | | | 35 |
Stock-based compensation | | - | | - | | - | | - | | | - | | | 15,122 | | | - | | | - | | | - | | | - | | | - | | | - | | | - | | | - | | | 15,122 |
Purchases of stock by deferred compensation plan | | - | | - | | - | | (25) | | | - | | | - | | | - | | | - | | | - | | | - | | | 1,269 | | | - | | | - | | | (1,269) | | | - |
Distribution of stock from deferred compensation plan | | - | | - | | - | | 41 | | | - | | | - | | | - | | | - | | | - | | | - | | | (502) | | | - | | | - | | | 502 | | | - |
Balances as of September 30, 2016 | | - | | 72,960 | | (11,374) | | (157) | | $ | 106 | | $ | 141,570 | | $ | (25,971) | | $ | 179 | | $ | (39,913) | | $ | (65,705) | | $ | 5,089 | | $ | 1,649,506 | | $ | (512,882) | | $ | (5,089) | | $ | 1,212,595 |
| | | | | | | | | | | | | | | | | | | | | | | | | | | | | | | | | | | | | | | | | |
See accompanying Notes to Consolidated Financial Statements
WOODWARD, INC.
NOTES TO CONSOLIDATEDCONSOLIDATED FINANCIAL STATEMENTS
(In thousands, except per share amounts)
Note 1. Operations and summarysummary of significant accounting policies
The Consolidated Financial Statements are prepared in accordance with accounting principles generally accepted in the United States of America (“U.S. GAAP”) and include the accounts of Woodward, Inc. and its subsidiaries (collectively “Woodward” or “the Company”). Dollar amounts contained in these Consolidated Financial Statements are in thousands, except per share amounts.
In the first quarter of fiscal year 2016, Woodward changed the name of its Energy segment to Industrial. The term “energy” is largely viewed as “oil and gas” and therefore was not representative of the broader markets Woodward serves in this segment.
Nature of operations
Woodward enhances the global quality of life, creating innovative energy control solutions that optimize the performance, efficiency and emissions of its customers’ products. Woodward is an independent designer, manufacturer, and service provider of energy control and optimization solutions. Woodward designs, produces and services reliable, efficient, low-emission, and high-performance energy control products for diverse applications in challenging environments. Woodward has significant production and assembly facilities in the United States, Europe and Asia, and promotes its products and services through its worldwide locations.
Woodward’s strategic focus is providing energy control and optimization solutions for the aerospace industrial and energyindustrial markets. The precise and efficient control of energy, including motion, fluid, combustion and electrical energy, combustion, and motion, is a growing requirement in the markets itWoodward serves. Woodward’s customers look to it to optimize the efficiency, emissions and operation of power equipment in both commercial and defense operations. Woodward’s core technologies leverage well across its markets and customer applications, enabling it to develop and integrate cost-effective and state-of-the-art fuel, combustion, fluid, actuation and electronic systems. Woodward focuses its solutions and services primarily on serving original equipment manufacturers (“OEMs”) and equipment packagers, partnering with them to bring superior component and system solutions to their demanding applications. Woodward also provides aftermarket repair, maintenance, replacement and other service support for its installed products.
Woodward’s components and integrated systems optimize performance of commercial aircraft, defense aircraft, military ground vehicles and other equipment, gas and steam turbines, wind turbines, including converters and power grid related equipment, industrial diesel, gas, alternativebio-diesel and dual fueldual-fuel reciprocating engines, and electrical power systems. Woodward’s innovative motion, fluid, energy, combustion control,and electrical energy and motion control systems help its customers offer more cost-effective, cleaner, and more reliable equipment.
Summary of significant accounting policies
Principles of consolidation:These Consolidated Financial Statements are prepared in accordance with U.S. GAAP and include the accounts of Woodward and its wholly and majority-owned subsidiaries. Transactions within and between these companies are eliminated.
Use of estimates: The preparation of the Consolidated Financial Statements requires management to make use of estimates and assumptions that affect the reported amount of assets and liabilities, at the date of the financial statements and the reported revenues and expenses recognized during the reporting period, and certain financial statement disclosures. Significant estimates include allowances for uncollectible amounts, net realizable value of inventories, customer rebates earned, useful lives of property and identifiable intangible assets, the evaluation of impairments of property, identifiable intangible assets and goodwill, the provision for income tax and related valuation reserves, the valuation of assets and liabilities acquired in business combinations, assumptions used in the determination of the funded status and annual expense of pension and postretirement employee benefit plans, the valuation of stock compensation instruments granted to employees, and contingencies. Actual results could differ from those estimates.
Foreign currency exchange rates: The assets and liabilities of substantially all subsidiaries outside the United States are translated at fiscal year-end rates of exchange, and earnings and cash flow statements are translated at weighted-average rates of exchange. The exchange rate in effect at the time of the cash flow is used for significant or infrequent cash flows, such as payments for a business acquisition, for which the use of weighted-average rates of exchange would result in a substantially different cash flow. Translation adjustments are accumulated with other comprehensive (loss)(losses) earnings as a separate component of stockholders’ equity and are presented net of tax effects in the Consolidated Statements of Stockholders’ Equity. The effects of changes in foreign currency exchange rates on loans between consolidated subsidiaries that are considered permanent in nature are also accumulated with other comprehensive earnings, net of tax.
The Company is exposed to market risks related to fluctuations in foreign currency exchange rates because some sales transactions, and certain of the assets and liabilities of its domestic and foreign subsidiaries, are denominated in foreign currencies.
Selling, general, and administrative expenses include a net foreign currency gainloss of $701$1,018 in fiscal year 20162019, and net foreign currency losses of $1,721$1,608 in fiscal year 20152018, and $1,089$651 in fiscal year 2014.2017.
Revenue recognition:recognition: Effective October 1, 2018, Woodward recognizesadopted the new revenue upon shipment or deliveryrecognition guidance of products or services and when collectability is reasonably assured. Delivery is upon completion of manufacturing, customer acceptance, and the transferASC 606. For discussion of the risks and rewards of ownership. In countries whose laws provide for retention of some form of title by sellers, enabling recovery of goods in the event of customer default on payment, product delivery is considered to have occurred when the customer has assumed the risks and rewards of ownershipimpacts of the products.adoption of ASC 606 on our revenue recognition policy and related critical accounting estimates, see Note 3, Revenue.
Occasionally, Woodward transfers title of product to customers, but retains substantive performance obligations such as completion of product testing, customer acceptance or in some instances regulatory acceptance. In addition, occasionally customers pay Woodward for products or services prior to Woodward satisfying its performance obligation. Under these circumstances, revenue is deferred until the performance obligations are satisfied. In addition, service revenue is also recognized upon completion of applicable performance obligations.
Certain Woodward products include incidental software or firmware essential to the performance of the product as designed, which are treated as units of accounting associated with the related tangible product with which the software is included. Woodward does not sell software on a standalone basis, although software upgrades, if any, are generally paid for by the customer.
Product freight costs are included in cost of goods sold. Freight costs charged to customers are included in net sales.
Taxes collected from customers and remitted to government authorities are excluded from revenue and are recorded as liabilities until the taxes are remitted to the appropriate U.S. or foreign government authority.
Net sales from service activities were less than 10% of total net sales for fiscal years 2016, 2015 and 2014.
Customer payments: Woodward occasionally agrees to make payments to certain customers in order to participate in anticipated sales activity. Payments made to customers are accounted for as a reduction of revenue unless they are made in exchange for identifiable goods or services with fair values that can be reasonably estimated. Reductions in revenue associated with these customer payments are recognized immediately to the extent that the payments cannot be attributed to anticipated future sales, and are recognized in future periods to the extent that the payments relate to anticipated future sales. Such determinations are based on the facts and circumstances underlying each payment.
Stock-based compensation: Compensation cost relating to stock-based payment awards made to employees and directors is recognized in the financial statements using a fair value method. Non-qualified stock option awards and restricted stock awards are issued under Woodward’s stock-based compensation plans. The cost of such awards, measured at the grant date, is based on the estimated fair value of the award.
Forfeitures are estimated at the time of each grant in order to estimate the portion of the award that will ultimately vest. The estimate is based on Woodward’s historical rates of forfeitures and is updated periodically. The portion of the award that is ultimately expected to vest is recognized as expense over the requisite service periods, which is generally the vesting period of the awards.
Research and development costs: costs: Company funded expenditures related to new product development, and significant product enhancement and/or upgrade activities are expensed as incurred and are separately reported in the Consolidated Statements of Earnings.
Income taxes: Deferred income taxes are provided for the temporary differences between the financial reporting basis and the tax basis of Woodward’s assets, liabilities, and certain unrecognized gains and losses recorded in accumulated other comprehensive (losses) earnings. Woodward provides for taxes that may be payable if undistributed earnings of overseas subsidiaries were to be remitted to the United States, except for those earnings that it considers to be indefinitely invested.
Cash equivalents: Highly liquid investments purchased with an original maturity of three months or less are considered to be cash equivalents.
Cash and cash equivalents are maintained with multiple financial institutions. Generally, these deposits may be redeemed upon demand and are maintained with financial institutions with reputable credit and therefore bear minimal credit risk. Woodward holds cash and cash equivalents at financial institutions in excess of amounts covered by the Federal Depository Insurance Corporation (the “FDIC”), sometimes invests excess cash in money market funds or other highly liquid investments not insured by the FDIC, and holds cash and cash equivalents outside the United States that are not insured by the FDIC.
Accounts receivable: Almost all of Woodward’s sales are made on credit and result in accounts receivable, which are recorded at the amount invoiced and are generally not collateralized. In the normal course of business, not all accounts receivable are collected and, therefore, an allowance for uncollectible amounts is provided equal to the amount that Woodward believes ultimately will not be collected.collected, either from credit risk or other adjustments to the original selling price or anticipated cash discounts. In establishing the amount of the allowance related to the credit risk of accounts receivable, customer-specific information is considered related to delinquent accounts, past loss experience, bankruptcy filings, deterioration in the customer’s operating results or financial position, and current economic conditions. Accounts receivableBad debt losses are deducted from the allowance, and the related accounts receivable balances are written off when the receivables are deemed uncollectible. Recoveries of accounts receivable previously written off are recognized when received. In addition, anThe allowance associated with anticipated future sales returnsother adjustments to the selling price or cash discounts is also established and is included in the allowance for uncollectible amounts. In establishing this amount, both customer-specific information as well as historical experience is considered.
In coordination with its customers and when terms are considered favorable to Woodward, Woodward from time to time transfers ownership to collect amounts due to Woodward for outstanding accounts receivable to third parties in exchange for cash. When the transfer of accounts receivable meets the criteria of Financial Accounting Standards Board (“FASB”) ASC Topic 860-10, “Transfers and Servicing,” and are without recourse, it is recognized as a sale and the accounts receivable is derecognized.
Consistent with common business practice in China, Woodward’s Chinese subsidiary accepts from Chinese customers, in settlement of certain customer accounts receivable, bankers’ acceptance notes issued by Chinese banks that are believed to be creditworthy. Bankers’ acceptance notes are financial instruments issued by Chinese financial institutions as part of financing arrangements between the financial institution and a customer of the financial institution. Bankers’ acceptance notes represent a commitment by the issuing financial institution to pay a certain amount of money at a specified future maturity date to the legal owner of the bankers’ acceptance note as of the maturity date. The maturity date of bankers’ acceptance notes varies, but it is Woodward’s policy to only accept bankers’ acceptance notes with maturity dates no more than 180 days from the date of Woodward’s receipt of such draft. The issuing financial institution is the obligor, not Woodward’s customers. Upon Woodward’s acceptance of a banker’s acceptance note from a customer, such customer has no further obligation to pay Woodward for the related accounts receivable balance. Woodward only accepts bankers’ acceptance notes issued by banks that are believed to be creditworthy and to which the credit risks associated with the bankers’ acceptance notes are believed to be minimal.
For discussion of the impacts of the adoption of ASC 606 on our accounts receivable policy and composition of accounts receivable, see Note 3, Revenue.
Inventories: Inventories are valued at the lower of cost or net realizable value, with cost being determined using methods that approximate a first-in, first-out basis.
For discussion of Woodward’s accounting policy for inventory provided by customers to Woodward, which will be integrated into final products sold to those customers, see Note 3, Revenue.
Short-term investments: From time to time, certain of Woodward’s foreign subsidiaries will invest excess cash in short-term time deposits with a fixed maturity date of longer than three months but less than one year from the date of the deposit. Woodward believes that the investments are with creditworthy financial institutions. Amounts with maturities of less than 365 days are classified as “Other current assets.”
Property, plant, and equipment: Property, plant, and equipment are recorded at cost and are depreciated over the estimated useful lives of the assets. Assets are generally depreciated using the straight-line method. Assets are tested for recoverability whenever events or circumstances indicate the carrying value may not be recoverable.
Estimated lives over which fixed assets are generally depreciated at September 30, 20162019 were as follows:
| | | | | | |
|
|
|
|
|
|
| | | | | | |
|
|
|
|
|
|
Land improvements | | 3 | - | 20 | | years |
| 3 | - | 20 |
| years |
Buildings and improvements | | 3 | - | 40 | | years |
| 3 | - | 40 |
| years |
Leasehold improvements | | 1 | - | 10 | | years |
| 1 | - | 10 |
| years |
Machinery and production equipment | | 3 | - | 20 | | years |
| 3 | - | 20 |
| years |
Computer equipment and software | | 3 | - | 10 | | years |
| 1 | - | 10 |
| years |
Office furniture and equipment | | 3 | - | 13 | | years |
| 3 | - | 10 |
| years |
Other | | 3 | - | 13 | | years |
| 3 | - | 10 |
| years |
Included in computer equipment and software are Woodward’s enterprise resource planning (“ERP”) systems, which have an estimated useful life of 10 years. All other computer equipment and software is generally depreciated over three years to five years.
Concurrent withPurchase accounting:Business combinations are accounted for using the purchase method of accounting. Under the purchase method, assets and in relation to Woodward’s significant investment in three new campuses and related equipment in the greater-Rockford, Illinois area, a new campusliabilities, including intangible assets, are recorded at its corporate headquarters in Fort Collins, Colorado, and a new campus in Niles, Illinois, Woodward initiated a comprehensive review of its depreciation livestheir fair values as required by U.S. GAAP to evaluate the estimates of the useful lives of Woodward assets. This review resulted in estimates of the useful lives of both existing and new assets generallyacquisition date. Acquisition costs in excess of those utilized prioramounts assigned to fiscal year 2016. The revised estimates were used in fiscal year 2016assets acquired and will be used going forward and resulted in a downward adjustment of depreciation on existing assets of approximately $12,000 for fiscal year 2016.liabilities assumed are recorded as goodwill. Transaction-related costs associated with business combinations are expensed as incurred.
Goodwill: Woodward tests goodwill for impairment at the reporting unit level on an annual basis and more often if an event occurs or circumstances change that would more likely than not reduceindicates the fair value of a reporting unit may be below its carrying amount. Based on the relevant U.S. GAAP authoritative guidance, Woodward sometimes aggregates components of a single operating segment into a reporting unit, if appropriate. The impairment tests consist of comparing the implied fair value of each reporting unit with its carrying amount that includes goodwill. If the carrying amount of the reporting unit exceeds its implied fair value, Woodward compares the implied fair value of goodwill with the recorded carrying amount of goodwill. If the carrying amount of goodwill exceeds the implied fair value of goodwill, an impairment loss would be recognized to reduce the carrying amount to its implied fair value. Based on the results of Woodward’s goodwill impairment testing it has recorded no0 impairment charges.charges in the year ended September 30, 2019 or since the goodwill was originally recognized.
Other intangibles: Other intangibles are recognized apart from goodwill whenever an acquired intangible asset arises from contractual or other legal rights, or whenever it is capable of being separated or divided from the acquired entity and
sold, transferred, licensed, rented, or exchanged, either individually or in combination with a related contract, asset, or liability. AllWoodward amortizes the cost of Woodward’sother intangibles have an estimatedover their useful life andlives unless such lives are beingdeemed indefinite. The cost of amortizable other intangibles are amortized over their respective useful life using patterns that reflect the periods over which the economic benefits of the assets are expected to be realized. Amortization expense is allocated to cost of goods sold and selling, general, and administrative expenses based on the nature of the intangible asset. Amortizable other intangible assets are reviewed for impairment whenever an event occurs or circumstances change indicating that the related carrying amount of the other intangible asset may not be recoverable. Impairment losses are recognized if the carrying amount of an intangible is both not recoverable and exceeds its fair value. Woodward has recorded 0 impairment charges related to its other intangibles as of September 30, 2019 or since the other intangibles were originally recorded.
Estimated lives over which intangible assets are amortized at September 30, 20162019 were as follows:
| | | | | | |
|
|
|
|
|
|
| | | | | | |
|
|
|
|
|
|
Customer relationships | | 9 | - | 30 | | years | |
Backlog | |
|
|
| 1 |
| year |
Customer relationships and contracts | |
| 9 | - | 30 |
| years |
Intellectual property | | 10 | - | 17 | | years |
| 10 | - | 17 |
| years |
Process technology | | 8 | - | 30 | | years |
| 8 | - | 30 |
| years |
Other | | 7 | - | 15 | | years |
| 3 | - | 15 |
| years |
Woodward has one other indefinitely lived intangible asset consisting of the Woodward L’Orange tradename. The Woodward L’Orange tradename intangible asset is tested for impairment on an annual basis and more often if an event occurs or circumstances change that indicate the fair value of the Woodward L’Orange intangible asset may be below its carrying amount. The impairment test consists of comparing the fair value of the Woodward L’Orange tradename intangible asset, determined using discounted cash flows, with its carrying amount. If the carrying amount of the Woodward L’Orange intangible asset exceeds its fair value, an impairment loss would be recognized to reduce the carrying amount to its fair value. Woodward has not recorded any impairment charges. Based on the results of the Woodward L’Orange impairment testing, it has recorded 0 impairment charges in the year ended September 30, 2019 or since the intangible asset was originally recognized.
Impairment of long-lived assets: Woodward reviews the carrying amount of its long-lived assets or asset groups to be used in operations whenever events or changes in circumstances indicate that the carrying amount of the assets might not be recoverable. Factors that would necessitate an impairment assessment include a significant adverse change in the extent or manner in which an asset is used, a significant adverse change in legal factors or the business climate that could affect the value of the asset, or a significant decline in the observable market value of an asset, among others.
If such facts indicate a potential impairment, the Company would assess the recoverability of an asset group by determining if the carrying amount of the asset group exceeds the sum of the projected undiscounted cash flows expected to result from the use and eventual disposition of the assets over the remaining economic life of the primary asset in the asset group. If the recoverability test indicates that the carrying amount of the asset group is not recoverable, the Company will estimate the fair value of the asset group using appropriate valuation methodologies, which would typically include an estimate of discounted cash flows. Any impairment would be measured as the difference between the asset groups carrying amount and its estimated fair value. There were no0 impairment charges recorded in fiscal years 20162019, 2018 or 2015. There was an impairment charge of $3,138 recorded in fiscal year 2014 related to a write down to fair value of assets held for sale. 2017.
Investment in marketable equity securities: Woodward holds marketable equity securities related to its deferred compensation program. Based on Woodward’s intentions regarding these instruments, marketable equity securities are classified as trading securities. The trading securities are reported at fair value, with realized gains and losses recognized in “Other (income) expense, net.” The trading securities are included in “Other assets.” The associated obligation to provide benefits under the deferred compensation program is included in “Other liabilities.”
Investments in unconsolidated subsidiaries: Investments in, and operating results of, entities in which Woodward does not have a controlling financial interest or the ability to exercise significant influence over the operations are included in the financial statements using the cost method of accounting. Investments and operating results of entities in which Woodward does not have a controlling interest but does have the ability to exercise significant influence over operations are included in the financial statements using the equity method of accounting.
Deferred compensation: The Company maintains a deferred compensation plan, or “rabbi trust,” as part of its overall compensation package for certain employees.
Deferred compensation obligations will be settled either by delivery of a fixed number of shares of Woodward’s common stock (in accordance with certain eligible members’ irrevocable elections) or in cash. Woodward has contributed shares of its common stock into a trust established for the future settlement of deferred compensation obligations that are payable in shares of Woodward’s common stock. Common stock held by the trust is reflected in the Consolidated Balance Sheet
Sheets as “Treasury stock held for deferred compensation” and the related deferred compensation obligation is reflected as a separate component of equity in amounts equal to the fair value of the common stock at the dates of contribution. These accounts are not adjusted for subsequent changes in the fair value of the common stock. Deferred compensation obligations that will be settled in cash are accounted for on an accrual basis in accordance with the terms of the underlying contract and are reflected in the Consolidated Balance Sheet as “Other liabilities.”
Derivatives: The Company is exposed to various global market risks, including the effect of changes in interest rates, foreign currency exchange rates, changes in certain commodity prices and fluctuations in various producer indices. From time to time, Woodward enters into derivative instruments for risk management purposes only, including derivatives designated as accounting hedges and/or those utilized as economic hedges. Woodward uses interest rate related derivative instruments to manage its exposure to fluctuations of interest rates. Woodward does not enter into or issue derivatives for trading or speculative purposes.
By using derivative and/or hedging instruments to manage its risk exposure, Woodward is subject, from time to time, to credit risk and market risk on those derivative instruments. Credit risk arises from the potential failure of the counterparty to perform under the terms of the derivative and/or hedging instrument. When the fair value of a derivative contract is positive, the counterparty owes Woodward, which creates credit risk for Woodward. Woodward mitigates this credit risk by entering into transactions only with counterparties that ariseare believed to be creditworthy. Market risk arises from transactions entered intothe potential adverse effects on the value of derivative and/or hedging instruments that result from a change in interest rates, commodity prices, or foreign currency exchange rates. Woodward minimizes this market risk by establishing and monitoring parameters that limit the normal coursetypes and degree of business. Themarket risk that may be undertaken.
To mitigate interest rate risk, the Company has historically utilized derivative instruments, such as treasury lock agreements to lock in fixed rates on future debt issuances, which qualify as cash flow or fair value hedges to mitigate the risk of variability in cash flows related to future interest payments attributable to changes in the designated benchmark rate. The Company records all such interest rate hedge instruments on the balance sheetConsolidated Balance Sheets at fair value. Cash flows related to the instrument designated as a qualifying hedge are reflected in the accompanying Consolidated Statements of Cash Flows in the same categories as the cash flows from the items being hedged. Accordingly, cash flows relating to the settlement of interest rate derivatives hedging the forecasted future interest payments on debt have been reflected upon settlement as a component of financing cash flows. The resulting gain or loss from such settlement is deferred to other comprehensive income and reclassified to interest expense over the term of the underlying debt. This reclassification of the deferred gains and losses impacts the interest expense recognized on the underlying debt that was hedged and is therefore reflected as a component of operating cash flows in periods subsequent to settlement. The periodic settlement of interest rate derivatives hedging outstanding variable rate debt is recorded as an adjustment to interest expense and is therefore reflected as a component of operating cash flows.
From time to time, in order to hedge against foreign currency exposure, Woodward designates certain non-derivative financial instrument loans as net investment hedges. Foreign exchange gains or losses on thethese loans are recognized in foreign currency translation adjustments within total comprehensive (losses) earnings. Also, to hedge against the foreign currency exposure attributable to the spot remeasurement its Euro denominated intercompany loans, Woodward has entered into derivative instruments in fair value hedging relationships, and derivative instruments in cash flow hedging relationships to hedge the risk of variability in cash flows attributable to the foreign currency exchange risk of cash flows for future principal and interest payments associated with its Euro denominated intercompany loans.
Further information on net investment hedges and derivative instruments in fair value and cash flow hedging relationships, including the Company’s policy in accounting for these derivatives, can be found at Note 6, 8, Derivative instruments and hedging activities.
Financial instruments: The Company’s financial instruments include cash and cash equivalents, short-term investments, investments in the deferred compensation program, notes receivable from municipalities, investments in term deposits, cross currency interest rate swaps and debt. Because of their short-term maturity, the carrying amount of cash and cash equivalents, and short-term debt approximate fair value. The fair value of investments in the deferred compensation program are adjusted to fair value based on the quoted market prices for the investments in the various mutual funds owned. The fair value of the long-term notes from municipalities are estimated based on a model that discounts future principal and interest payments received at interest rates available to the Company at the end of the period for similarly rated municipalitymunicipal notes of similar maturity. The fair value of term deposits are estimated based on a model that discounts future principal and interest payments received at interest rates available to the Company at the end of the period for similar term deposits with the same maturity in the same jurisdictions. The fair value of the cross currency interest rate swaps are determined using a market approach that is based on observable inputs other than quoted market prices, including contract terms, interest rates, currency rates, and other market factors. The fair value of long-term debt is estimated based on a model that discounts future
principal and interest payments at interest rates available to the Company at the end of the period for similar debt with the same maturity. Further information on the fair value of financial instruments can be found at Note 5, 7, Financial instruments and fair value measurements.
Financial assets and liabilities recorded at fair value in the Consolidated Balance Sheets are categorized based upon a fair value hierarchy established by U.S. GAAP, which prioritizes the inputs used to measure fair value into the following levels:
Level 1: Inputs based on quoted market prices in active markets for identical assets or liabilities at the measurement date.
Level 2: Quoted prices included in Level 1, such as quoted prices for similar assets or liabilities in active markets; quoted prices for identical or similar assets and liabilities in markets that are not active; or other inputs that are observable and can be corroborated by observable market data.
Level 3: Inputs reflect management’s best estimates and assumptions of what market participants would use in pricing the asset or liability at the measurement date. The inputs are unobservable in the market and significant to the valuation of the instruments.
Postretirement benefits: The Company provides various benefits to certain current and former employees through defined benefit pension and postretirement plans. For financial reporting purposes, net periodic benefits expense and related obligations are calculated using a number of significant actuarial assumptions. Changes in net periodic expense and funding status may occur in the future due to changes in these assumptions. The funded status of defined pension and postretirement plans recognized in the statement of financial position is measured as the difference between the fair market value of the plan assets and the benefit obligation. For a defined benefit pension plan, the benefit obligation is the projected benefit obligation; for any other defined benefit postretirement plan, such as a retiree health care plan, the benefit obligation is the accumulated benefit obligation. Any over-funded status is recognized as an asset and any underfunded status is recognized as a liability.
Projected benefit obligation is the actuarial present value as of the measurement date of all benefits attributed by the plan benefit formula to employee service rendered before the measurement date using assumptions as to future compensation levels if the plan benefit formula is based on those future compensation levels. AccumulatedThe accumulated benefit obligation is the actuarial present value of benefits (whether vested or unvested) attributed by the plan benefit formula to employee service rendered before the measurement date and based on employee service and compensation, if applicable, prior to that date. AccumulatedThe accumulated benefit obligation differs from the projected benefit obligation in that it includes no assumption about future compensation levels.
Reclassifications: Certain amounts at the Consolidated Balance Sheet as of September 30, 2018 and the Consolidated Statement of Cash Flows for the years ended September 30, 2018 and 2017 have been reclassified in order to conform to the current year presentation under ASU 2014-09, “Revenue from Contracts with Customers” (see Note 3, Revenue). Certain amounts at the Consolidated Statement of Earnings for the fiscal years ended September 30, 2018 and September 30, 2017 have been reclassified in order to conform to the current year presentation under ASU 2017-07, “Compensation – Retirement Benefits (Topic 715): Improving the Presentation of Net Periodic Pension Cost and Net Periodic Postretirement Benefit Cost” (see Note 2, New accounting standards).
Note 2. New accounting standards
From time to time, the Financial Accounting Standards Board (“FASB”) or other standards setting bodies issue new accounting pronouncements. Updates to the FASB Accounting Standards Codification (“ASC”) are communicated through issuance of an Accounting Standards Update (“ASU”).
In August 2019, the FASB issued ASU 2019-08, “Stock Compensation (Topic 718) and Revenue from Contracts with Customers (Topic 606): Codification Improvements—Share-Based Consideration Payable to a Customer.” This ASU clarifies or improves the disclosure and presentation requirements of a variety of Codification Topics by aligning them with the SEC’s regulations, eliminating redundancies, and making the Codification easier to apply. Woodward adopted in the fourth quarter of fiscal year 2019 to incorporate the simplification in disclosures. Upon adoption, there was no material impact to the Consolidated Financial Statements and related disclosures.
In July 2019, the FASB issued ASU 2019-07, “Amendments to SEC Paragraphs Pursuant to SEC Final Rule Releases No. 33-10532, Disclosure Update and Simplification, and Nos. 33-10231 and 33-10442, Investment Company Reporting Modernization, and Miscellaneous Updates.” This ASU clarifies or improves the disclosure and presentation requirements of a variety of Codification Topics by aligning them with the SEC’s regulations, eliminating redundancies, and making the
Codification easier to apply. Woodward adopted in the fourth quarter of fiscal year 2019 to incorporate the simplification in disclosures. Upon adoption, there was no material impact to the Consolidated Financial Statements and related disclosures.
In August 2018, the FASB issued ASU 2018-14, “Compensation – Retirement Benefits – Defined Benefit Plans – General (Topic 715-20): Disclosure Framework – Changes to the Disclosure Requirements for Defined Benefit Plans.” ASU 2018-14 amends ASC 715 to add, remove, and modify disclosure requirements related to defined benefit pension and other postretirement plans. The ASU’s changes to disclosures aim to improve the effectiveness of ASC 715’s disclosure requirements under the FASB’s disclosure framework project. ASU 2018-14 is effective for public entities for fiscal years beginning after December 15, 2020 (fiscal year 2022 for Woodward). ASU 2018-14 does not impact the interim disclosure requirements of ASC 715. Upon adoption, the amendments in ASU 2018-14 should be applied on a retrospective basis to all periods presented. Early adoption is permitted. Woodward expects to adopt the new and modified disclosures requirements of this new guidance in fiscal year 2022.
In February 2018, the FASB issued ASU 2018-02, “Reporting Comprehensive Income (Topic 220): Reclassification of Certain Tax Effects from Accumulated Other Comprehensive Income.” ASU 2018-02 allows a reclassification from accumulated other comprehensive income to retained earnings for stranded tax effects resulting from the enactment of tax reform under H.R.1, “An Act to Provide for Reconciliation Pursuant to Titles II and V of the Concurrent Resolution on the Budget for Fiscal Year 2018” (the “Tax Act”) (also known as “The Tax Cuts and Jobs Act”), and provides guidance on the disclosure requirements regarding the stranded tax effects. The amendments in ASU 2018-02 are effective for all entities for fiscal years beginning after December 15, 2018 (fiscal year 2020 for Woodward), and interim periods within those fiscal years. Early adoption is permitted. The amendments in ASU 2018-02 may be applied retrospectively in the period of adoption to all periods in which the effect of the change in the United States (“U.S.”) federal corporate income tax rate in the Tax Act is recognized or may be applied as of the beginning of the period of adoption. Woodward is currently assessing the impact of the adoption of the new guidance and has not yet elected the method of adoption it will apply. Woodward expects to adopt the new guidance under ASU 2018-02 in fiscal year 2020. Upon adoption, if Woodward elects to reclassify under ASU 2018-02, a portion of accumulated other comprehensive earnings would be reclassified to retained earnings.
In March 2017, the FASB issued ASU 2017-07, “Compensation – Retirement Benefits (Topic 715): Improving the Presentation of Net Periodic Pension Cost and Net Periodic Postretirement Benefit Cost.” ASU 2017-07 requires that the service cost component of net periodic benefit costs from defined benefit and other postretirement benefit plans be included in the same statement of earnings captions as other compensation costs arising from services rendered by the covered employees during the period. The other components of net benefit cost are presented in the statement of earnings separately from service costs. ASU 2017-07 is effective for fiscal years beginning after December 31, 2017 (fiscal year 2019 for Woodward). Following adoption, only service costs will be eligible for capitalization into manufactured inventories, which should reduce diversity in practice. The amendments of ASU 2017-07 must be applied retrospectively for the presentation of the service cost component and the other components of net periodic benefit costs from defined benefit and other postretirement benefit plans in the statement of earnings and prospectively, on and after the effective date, for the capitalization of the service cost component into manufactured inventories. Woodward adopted the new guidance effective October 1, 2018 and concluded it had no impact on net earnings. As a result of the adoption of ASU 2017-07, only the service component of net periodic benefit costs from defined benefit and other postretirement benefit plans are included in cost of goods sold and selling, general and administrative expenses. All other net periodic benefit costs, other than interest cost, are included in other expense (income), net. The interest cost component of net periodic benefit costs is included in interest expense as Woodward believes it is more similar to the elements within interest expense than other expense (income), net, which combines several elements that are heterogeneous (see Note 17, Other (income) expense, net), thus improving consistency for users of the financial statements.
The following table shows the impact of retrospectively applying this guidance to the Consolidated Statement of Earnings for the fiscal years ended September 30, 2018 and September 30, 2017.
|
|
|
|
|
|
|
|
|
|
|
|
|
|
|
|
|
|
|
|
| Year Ended September 30, 2018 |
| Year Ended September 30, 2017 |
|
| As previously reported |
| Adjustment |
| As recast |
| As previously reported |
| Adjustment |
| As recast |
Net sales |
| $ | 2,325,873 |
| $ | - |
| $ | 2,325,873 |
| $ | 2,098,685 |
| $ | - |
| $ | 2,098,685 |
Costs and expenses: |
|
|
|
|
|
|
|
|
|
|
|
|
|
|
|
|
|
|
Cost of goods sold |
|
| 1,719,675 |
|
| 3,127 |
|
| 1,722,802 |
|
| 1,526,126 |
|
| 1,442 |
|
| 1,527,568 |
Selling, general, and administrative expenses |
|
| 192,757 |
|
| 979 |
|
| 193,736 |
|
| 176,633 |
|
| 689 |
|
| 177,322 |
Research and development costs |
|
| 148,279 |
|
| - |
|
| 148,279 |
|
| 126,519 |
|
| - |
|
| 126,519 |
Restructuring charges |
|
| 17,013 |
|
| - |
|
| 17,013 |
|
| - |
|
| - |
|
| - |
Interest expense |
|
| 31,770 |
|
| 8,695 |
|
| 40,465 |
|
| 27,430 |
|
| 8,209 |
|
| 35,639 |
Interest income |
|
| (1,674) |
|
| - |
|
| (1,674) |
|
| (1,725) |
|
| - |
|
| (1,725) |
Other (income) expense, net |
|
| (1,525) |
|
| (12,801) |
|
| (14,326) |
|
| (9,045) |
|
| (10,340) |
|
| (19,385) |
Total costs and expenses |
|
| 2,106,295 |
|
| - |
|
| 2,106,295 |
|
| 1,845,938 |
|
| - |
|
| 1,845,938 |
Earnings before income taxes |
|
| 219,578 |
|
| - |
|
| 219,578 |
|
| 252,747 |
|
| - |
|
| 252,747 |
Income tax expense |
|
| 39,200 |
|
| - |
|
| 39,200 |
|
| 52,240 |
|
| - |
|
| 52,240 |
Net earnings |
| $ | 180,378 |
| $ | - |
| $ | 180,378 |
| $ | 200,507 |
| $ | - |
| $ | 200,507 |
In October 2016, the FASB issued ASU 2016-16, “Accounting for Income Taxes: Intra-Entity Asset Transfers of Assets Other than Inventory.” The purpose of ASU 2016-16 is to eliminateeliminates the exception, other than for inventory transfers, under current U.S. GAAP under whichexception deferring the tax effects of intra-entityintercompany asset transfers (intercompany sales) are deferred(other than inventory) until the transferred asset is sold to a third party or otherwise recovered through use. Upon adoption of ASU 2016-16, Woodward will recognize the tax expense from the sale of that asset in the seller’s tax jurisdiction when the transfer occurs, even though the pre-tax effects of that transaction are eliminated in consolidation. Any deferred tax asset that arises in the buyer’s jurisdiction would also be recognized at the time of the transfer. ASU 2016-16 is effective for fiscal years beginning after December 15,
2017 (fiscal year 2019 for Woodward), including interim periods within the year of adoption. Early adoption is allowed only inWoodward adopted the first quarter of fiscal year 2017 or the first quarter of fiscal yearnew guidance on October 1, 2018. Modified retrospective adoption is required with any cumulative-effect adjustment recorded to retained earnings as of the beginning of the period of adoption. The cumulative-effect adjustment, if any, would consistcumulative impact of the net impact from (1) the write-off of any unamortized tax expense previously deferred and (2) recognition of any previously unrecognized deferred tax assets, net of any necessary valuation allowances. Woodward is currently assessing the impact this guidance may have on its Consolidated Financial Statements.
In August 2016, the FASB issued ASU 2016-15, “Statement of Cash flows (Topic 230).” ASU 2016-15 is designed to reduce diversity in practice in how certain transactions are classified in the statement of cash flows. As permitted, Woodward adopted ASU 2016-15 as of September 30, 2016, using the retrospective transition method, as required and made an accounting policy election upon adoption to use the cumulative earnings approach to classify distributions received from equity method investments. Woodward received no distributions from equity method investments in fiscal years 2016, 2015 and 2014. The adoption of ASU 2016-15 had no impact on2016-16 of $1,005 was recognized at the reported cash flowsdate of adoption as a decrease to both retained earnings and other current assets in the company for any period presented.Consolidated Balance Sheet. As a result of adoption, Woodward will recognize the tax consequences of intercompany asset transfers in the buyer’s and seller’s tax jurisdictions when the transfer occurs, even though the pre-tax effects of these transactions are eliminated in consolidation.
In June 2016, the FASB issued ASU 2016-13, “Measurement of Credit Losses on Financial Instruments.” ASU 2016-13 adds a current expected credit loss (“CECL”) impairment model to U.S. GAAP that is based on expected losses rather than incurred losses. Modified retrospective adoption is required with any cumulative-effect adjustment recorded to retained earnings as of the beginning of the period of adoption. ASU 2016-13 is effective for fiscal years beginning after December 15, 2019 (fiscal year 2021 for Woodward), including interim periods within the year of adoption. Early adoption is permitted for fiscal years beginning after December 15, 2018 (fiscal year 2020 for Woodward), including interim periods within those fiscal years. Woodward has not determinedexpects to adopt ASU 2016-13 in which period it will adopt the new guidance butfiscal year 2021. Woodward does not expect the application of the CECL impairment model to have a significant impact on Woodward’s allowance for uncollectible amounts for accounts receivable, and the valuation of notes receivable from municipalities.municipalities and unbilled receivables.
In March 2016,May 2019, the FASB issued ASU 2016-09, “Improvements2019-05, “Financial Instruments – Credit Losses (Topic 326): Targeted Transition Relief,” which provides transition relief for entities adopting ASU 2016-13. Specifically, ASU 2019-05 amends ASU 2016-13 to Employee Share-Based Payment Accounting,”allow companies to simplifyirrevocably elect, upon adoption of ASU 2016-13, the fair value option for financial reportinginstruments that (i) were previously recorded at amortized cost and are within the scope of the income tax impacts of share-based compensation arrangements. As early adoption is allowed, Woodwardcredit losses guidance in ASC 326-20, (ii) are eligible for the fair value option under ASC 825-10, and (iii) are not held-to-maturity debt securities. For entities that have adopted ASU 2016-09 during2016-13, the second quarteramendments in ASU 2019-05 are effective for fiscal years beginning after December 15, 2019, including interim periods therein. An entity may early adopt the ASU in any interim period after its issuance if the entity has adopted ASU 2016-13. For all other entities, the effective date will be the same as the effective date of ASU 2016-13. Woodward expects to adopt ASU 2019-05 in fiscal year 2016. Under2021. Woodward does not expect to elect the fair value option for its financial instruments upon the adoption of both ASU 2016-09 Woodward classifies the excess income tax benefits from stock-based compensation arrangements as a discrete item within income tax expense, rather than recognizing such excess income tax benefits in additional paid-in capital. As required by2016-13 and ASU 2016-09, Woodward applied this classification guidance effective as of October 1, 2015.2019-05.
Under ASU 2016-09, excess income tax benefits from stock-based compensation arrangements are classified as cash flow from operations, rather than as cash flow from financing activities. In addition, when Woodward withholds shares from an employee’s exercise of stock options to fund payment by Woodward of the employee’s taxes, the payment is classified as a financing activity. Woodward has elected to apply the cash flow classification guidance of ASU 2016-09 retrospectively to all prior periods presented.
Woodward has elected to continue to estimate the number of stock-based awards expected to vest, as permitted by ASU 2016-09, rather than electing to account for forfeitures as they occur.
The following table shows the impact of retrospectively applying this guidance to the Condensed Consolidated Statement of Earnings and Condensed Consolidated Statement of Cash Flows for the three-months ended December 31, 2015.
| | | | | | | | |
| | | | | | | | |
| Three-Months Ended December 31, 2015 |
| As previously reported | | Adjustment | | As recast |
Statement of Earnings: | | | | | | | | |
Earnings before income taxes | $ | 27,956 | | $ | - | | $ | 27,956 |
Income tax expense | | 2,345 | | | (209) | | | 2,136 |
Net earnings | $ | 25,611 | | $ | 209 | | $ | 25,820 |
| | | | | | | | |
Earnings per share: | | | | | | | | |
Basic earnings per share | $ | 0.41 | | $ | - | | $ | 0.41 |
Diluted earnings per share | $ | 0.40 | | $ | - | | $ | 0.40 |
| | | | | | | | |
Weighted average common shares outstanding: | | | | | | | | |
Basic | | 63,054 | | | - | | | 63,054 |
Diluted | | 64,373 | | | 79 | | | 64,452 |
| | | | | | | | |
Statement of Cash Flows: | | | | | | | | |
Net cash provided by operating activities | $ | 37,112 | | $ | 248 | | $ | 37,360 |
Net cash used in investing activities | | (31,279) | | | - | | | (31,279) |
Net cash used in financing activities | | (1,131) | | | (248) | | | (1,379) |
Effect of exchange rate changes on cash and cash equivalents | | (2,482) | | | - | | | (2,482) |
Net change in cash and cash equivalents | $ | 2,220 | | $ | - | | $ | 2,220 |
The following tables shows the impact of retrospectively applying this guidance to the Consolidated Statements of Cash Flows for the fiscal years ended September 30, 2015 and September 30, 2014.
| | | | | | | | |
| | | | | | | | |
| Fiscal Year Ended September 30, 2015 |
| As previously reported | | Adjustment | | As recast |
Statement of Cash Flows: | | | | | | | | |
Net cash provided by operating activities | $ | 287,429 | | $ | 8,561 | | $ | 295,990 |
Net cash used in investing activities | | (284,083) | | | - | | | (284,083) |
Net cash used in financing activities | | (25,445) | | | (8,561) | | | (34,006) |
Effect of exchange rate changes on cash and cash equivalents | | (10,986) | | | - | | | (10,986) |
Net change in cash and cash equivalents | $ | (33,085) | | $ | - | | $ | (33,085) |
| | | | | | | | |
| | | | | | | | |
| Fiscal Year Ended September 30, 2014 |
| As previously reported | | Adjustment | | As recast |
Statement of Cash Flows: | | | | | | | | |
Net cash provided by operating activities | $ | 268,083 | | $ | 5,487 | | $ | 273,570 |
Net cash used in investing activities | | (205,829) | | | - | | | (205,829) |
Net cash provided by (used in) financing activities | | 9,477 | | | (5,487) | | | 3,990 |
Effect of exchange rate changes on cash and cash equivalents | | (5,000) | | | - | | | (5,000) |
Net change in cash and cash equivalents | $ | 66,731 | | $ | - | | $ | 66,731 |
In February 2016, the FASB issued ASU 2016-02, “Leases (Topic 842)”. In July 2018, the FASB issued ASU 2018-11, “Leases (Topic 842) Targeted Improvements,” (collectively with ASU 2016-02, “ASC 842”) which amends ASU 2016-02 to provide organizations with a new (and optional) transition method permitting the recognition of a cumulative-effect adjustment to retained earnings on the date of adoption, rather than requiring retrospective restatement of prior periods. The purpose of ASU 2016-02ASC 842 is to increase transparency and comparability among organizations by recognizing lease right-of-use (“ROU”) assets and lease liabilities except for short-term leases on the balance sheet, and disclosing key provide additional disclosure
information about leasing arrangements. ASU 2016-02ASC 842 modifies the definition of a lease to clarify that an arrangement contains a lease when such arrangement conveys the right to control the use of an identified asset. ASC 842 is effective for fiscal years beginning after December 15, 2018 (fiscal year 2020 for Woodward), including interim periods within the year of adoption. In transition, Woodward will beadopt ASC 842 on October 1, 2019, the first day of fiscal year 2020. Originally under ASC 842, an organization was required upon adoption to recognize and measure leases beginning in the earliest period presented using a modified retrospective approach; therefore,approach and restate the financial statements for all periods presented. Woodward anticipates restating its Consolidated Financial Statements for the two fiscal years priorexpects to the year of adoption. Early adoption is permitted. Woodward has not determined in which period it will adoptelect the new guidance andtransition method resulting in a cumulative-effect adjustment to retained earnings on October 1, 2019.
Woodward is currently assessing the impact this guidance maywill have on its Consolidated Financial Statements, including which of its existing operating leaseslease arrangements will be impacted by the new guidance. In anticipation of adopting ASC 842 on October 1, 2019, Woodward has developed a comprehensive project plan, established a cross-functional global project team, and engaged third-party subject matter experts. The project plan includes reviewing various forms of leases, analyzing the optional practical expedients available in ASC 842, and updating Woodward’s business processes and controls to meet the requirements of ASU 2016-02, as necessary. Woodward expects the most significant effects of the adoption of ASC 842 will be the recognition of operating lease ROU assets and lease liabilities on its balance sheets and changes to the accounting for the Company’s loss reserve on contractual lease commitments. Rent expense for all operating leases, in fiscal year 2019, none of which was recognized on the balance sheet, was $7,359 in fiscal year 2016, $7,299 in fiscal year 2015, and $10,897 in fiscal year 2014. Future$7,578. As of September 30, 2019, future minimum rental payments required under operating leases, none of which were recognized on the balance sheet, were $15,612 as of September 30, 2016.$26,919.
In November 2015, the FASB issued ASU 2015-17, “Balance Sheet Classification of Deferred Taxes,” to simplify financial reporting and more closely conform U.S. GAAP with International Financial Reporting Standards (“IFRS”). Under ASU 2015-17, Woodward will classify all deferred tax assets and liabilities by taxing jurisdiction, along with any related valuation allowances, as either a single non-current asset or liability on the balance sheet. ASU 2015-17 is effective for fiscal years − and interim periods within those fiscal years − beginning after December 15, 2016 (fiscal year 2018 for Woodward). As early adoption is allowed, Woodward adopted ASU 2015-17 during its second quarter of fiscal year 2016, and retrospectively applied the guidance to its deferred tax assets and liabilities as of September 30, 2015. The table below shows the impact of retrospectively applying this guidance to the Consolidated Balance Sheet deferred tax assets and liabilities as of September 30, 2015. Note 3. Revenue
In April 2015, the FASB issued ASU 2015-03, “Simplifying the Presentation of Debt Issuance Costs.” Under ASU 2015-03, Woodward will present debt issuance costs in the balance sheet as a reduction from the related debt liability rather than as an asset. Amortization of such costs will continue to be reported as interest expense. ASU 2015-03 is effective for fiscal years − and interim periods within those fiscal years − beginning after December 15, 2015 (fiscal year 2017 for Woodward). Early adoption is allowed.
In August 2015, the FASB issued ASU 2015-15, “Presentation and Subsequent Measurement of Debt Issuance Costs Associated with Line-of-Credit Arrangements.” ASU 2015-15 supplements the requirements of ASU 2015-03 by allowing an entity to defer and present debt issuance costs related to a line of credit arrangement as an asset and subsequently amortize the deferred costs ratably over the term of the line of credit arrangement. As early adoption is allowed, Woodward adopted ASU 2015-03 and ASU 2015-15 during its fourth quarter of fiscal year 2016, and retrospectively applied the guidance to its unamortized debt issuance costs as of September 30, 2015. As permitted by ASU 2015-15, Woodward will continue to present debt issuance costs related to line-of-credit arrangements as an asset on its balance sheet.
The table below shows the impact of retrospectively applying ASU 2015-17 and ASU 2015-03 to the Consolidated Balance Sheet as of September 30, 2015.
| | | | | | | | | | | |
| | | | | | | | | | | |
| September 30, 2015 |
| As previously reported | | Adjustment for ASU 2015-17 | | Adjustment for ASU 2015-03 | | As recast |
Current deferred income tax assets | $ | 29,766 | | $ | (29,766) | | $ | - | | $ | - |
Other current assets | | 43,791 | | | - | | | (291) | | | 43,500 |
Total current assets | | 947,476 | | | (29,766) | | | (291) | | | 917,419 |
Noncurrent deferred income tax assets | | 9,388 | | | 3,717 | | | - | | | 13,105 |
Other assets | | 44,886 | | | - | | | (1,221) | | | 43,665 |
Total assets | | 2,539,965 | | | (26,049) | | | (1,512) | | | 2,512,404 |
| | | | | | | | | | | |
Current deferred income tax liabilities | | 14 | | | (14) | | | - | | | - |
Total current liabilities | | 338,222 | | | (14) | | | - | | | 338,208 |
Long-term debt, less current portion | | 850,000 | | | - | | | (1,512) | | | 848,488 |
Noncurrent deferred income tax liabilities | | 82,449 | | | (26,035) | | | - | | | 56,414 |
Total liabilities | | 1,386,861 | | | (26,049) | | | (1,512) | | | 1,359,300 |
Total liabilities and stockholders' equity | | 2,539,965 | | | (26,049) | | | (1,512) | | | 2,512,404 |
| | | | | | | | | | | |
Net deferred tax liabilities | | 43,309 | | | - | | | - | | | 43,309 |
In April 2015, the FASB issued ASU 2015-02, “Consolidation (Topic 810): Amendments to the Consolidation Analysis” in response to stakeholders’ concerns about current accounting for consolidation of certain legal entities and changes the analysis that a reporting entity must perform to determine whether it should consolidate such legal entities. ASU 2015-02 is effective for public business entities for fiscal years − and interim periods within those fiscal years − beginning after December 15, 2015, but early adoption is allowed. Woodward adopted ASU 2015-02 on January 1, 2016, concurrent with the consummation of the joint venture formation described in Note 4, “Joint ventures”. The adoption of ASU 2015-02 had no impact on Woodward’s conclusion that the joint venture described in Note 4 should not be consolidated following the guidanceAdoption of ASC 810, Consolidation. 606
In May 2014, the FASB issued ASU 2014-09, “Revenue from Contracts with Customers” and has subsequently issued several supplemental and/or clarifying ASUs (collectively “ASC 606”). ASC 606 prescribes a single common revenue standard that replaces most existing U.S. GAAP revenue recognition guidance. Woodward adopted ASC 606 outlineson October 1, 2018 and elected the modified retrospective transition method. The results for periods prior to fiscal year 2019 were not adjusted for the new standard and the cumulative effect of the change in accounting of $38,745 was recognized as a five-step model,net increase to retained earnings at the date of adoption.
Woodward has elected to apply the modified retrospective method only to contracts that were not completed as of October 1, 2018. As a practical expedient under ASC 606, Woodward elected to reflect the aggregate effect of all modifications that occurred before the beginning of fiscal year 2019 to contracts for which Woodward will recognizehad not recognized all revenue whenas of October 1, 2018 as part of the adjustment to retained earnings at the date of adoption.
Revenue Recognition Policy
Revenue is recognized on contracts with Woodward’s customers for arrangements in which quantities and pricing are fixed and/or determinable and are generally based on customer purchase orders, often within the framework of a long-term supply arrangement with the customer. Woodward has determined that it is the principal in its sales transactions, as Woodward is primarily responsible for fulfilling the promised performance obligations, has discretion to establish the selling price, and generally assumes the inventory risk. A performance obligation is a promise in a contract with a customer to transfer a distinct product or service to the customer. Woodward recognizes revenue for performance obligations within a customer contract when control of the associated product or service is transferred to the customer. Some of Woodward’s contracts with customers contain a single performance obligation, while other contracts contain multiple performance obligations. Each product within a contract generally represents a separate performance obligation as Woodward does not provide significant installation and integration services, the products do not customize each other, and the products can function independently of each other.
A contract's transaction price is allocated to each distinct performance obligation and recognized as revenue when, or as, the customer obtains control of the associated product or service. When there are satisfied.multiple performance obligations within a contract, Woodward generally uses the observable standalone sales price for each distinct product or service within the contract to allocate the transaction price to the distinct products or services. In instances when a standalone sales price for each product or service is not observable within the contract, Woodward allocates the transaction price to each performance obligation using an estimate of the standalone selling price for each product or service, which is generally based on incurred costs plus a reasonable margin, for each distinct product or service in the contract.
When determining the transaction price of each contract, Woodward considers contractual consideration payable by the customer and variable consideration that may affect the total transaction price. Variable consideration, consisting of early payment discounts, rebates and other sources of price variability, are included in the estimated transaction price based on both customer-specific information as well as historical experience. Woodward’s contracts with customers generally do not include a financing component. Woodward regularly reviews its estimates of variable consideration on the transaction price
and recognizes changes in estimates on a cumulative catch-up basis as if the most current estimate of the transaction price adjusted for variable consideration had been known as of the inception of the contract. In the fiscal year ended September 30, 2019, Woodward did not recognize a significant amount of revenue due to changes in transaction price from performance obligations that were satisfied, or partially satisfied, in prior periods.
Customers sometimes trade in used products in exchange for new or refurbished products. In addition, Woodward’s customers sometimes provide inventory to Woodward which will be integrated into final products sold to those customers. Woodward obtains control of these exchanged products and customer provided inventory, and therefore, both are forms of noncash consideration. Noncash consideration paid by customers on overall sales transactions is additive to the transaction price. Woodward’s net sales and cost of goods sold include the value of such noncash consideration for the same amount, with no resulting impact to earnings before income taxes. Upon receipt of such inventory, Woodward recognizes an inventory asset and a contract liability. Woodward recognized revenue of $98,061 for the fiscal year 2019, related to noncash consideration received from customers. The Aerospace segment recognized $96,762 for the fiscal year ended September 30, 2019, while the Industrial segment recognized $1,299 for the fiscal year ended September 30, 2019.
Sales of Products
Woodward primarily generates revenue through the manufacture and sale of engineered aerospace and industrial products, including revenue derived from maintenance, repair and overhaul (“MRO”) performance obligations performed on products originally manufactured by Woodward and subsequently returned by original equipment manufacturer (“OEM”) or other end-user customers. The majority of Woodward’s costs incurred to satisfy MRO performance obligations are related to replacing and/or refurbishing component parts of the returned products to restore the units back to a condition generally comparable to that of the unit upon its initial sale to an OEM customer. Therefore, Woodward considers almost all of its revenue to be derived from product sales, including those related to MRO.
Revenue from manufactured and MRO products represented 86% and 12%, respectively, of Woodward’s net sales for the fiscal year ended September 30, 2019.
Many Woodward products include embedded software or firmware that is critical to the performance of the product as designed. As the embedded software or firmware is essential to the functioning of the products sold it does not represent a distinct performance obligation separate from the related tangible product in which the software or firmware is embedded. Woodward does not generally sell or license software or firmware on a standalone basis. Software or firmware upgrades, if any, are generally paid for by the customer and treated as separate performance obligations.
The products Woodward sells generally are not subject to risk of return, refund or other similar obligations. Woodward’s sales include product warranty arrangements with customers which are generally assurance-type warranties, rather than service-type warranties. Accordingly, Woodward accounts for warranty related promises to its customers as a guarantee for which a warranty liability is recorded when the related product or service is sold, rather than as a distinct performance obligation accounted for separately from the sale of the underlying product or service. Warranty liabilities are accrued for based on specifically identified warranty issues that are probable to result in future costs, or on a non-specific basis whenever past experience indicates that a normal and predictable pattern exists.
Revenue from shipping and handling activities charged to customers are included in net sales when invoiced to the customer and the related costs are included in cost of goods sold. As a practical expedient under ASC 606, Woodward has elected to account for the costs of shipping and handling activities as a cost to fulfill a contract and not a promised product or service. Shipping and handling costs relating to the sale of products recognized at a point in time are recognized as incurred. Shipping and handling costs relating to the sale of products or services recognized over time are accrued and recognized during the earnings process.
Material Rights and Costs to Fulfill a Contract
Customers sometimes pay consideration to Woodward for product engineering and development activities that do not result in the immediate transfer of distinct products or services to the customer. There is intendedan implicit assumption that without the customer making such advance payments to provide more consistent interpretationWoodward, Woodward’s future sales of products or services to the customer would be at a higher selling price; therefore, such payments create a “material right” to the customer that effectively gives the customer an option to acquire future products or services, at a discount, that are dependent upon the product engineering and applicationdevelopment. Material rights are recorded as contract liabilities and will be recognized when control of the principles outlinedrelated products or services are transferred to the customer.
Woodward capitalizes costs of product engineering and development identified as material rights up to the amount of customer funding as costs to fulfill a contract because the costs incurred up to the amount of the customer funding commitment are recoverable. Due to the uncertainty of the product success and/or demand, fulfillment costs in excess of the customer funding are expensed as incurred. As of September 30, 2019, other assets included $105,206 of capitalized costs to fulfill contracts with customers.
Woodward recognizes the deferred material rights as revenue based on a percentage of actual sales to total estimated lifetime sales of the related developed products as the customers exercise their option to acquire additional products or services at a discount. Woodward amortizes the capitalized costs to fulfill a contract as cost of goods sold proportionally to the recognition of the associated deferred material rights. Estimated total lifetime sales are reviewed at least annually and more frequently when circumstances warrant a modification to the previous estimate. For the fiscal year ended September 30, 2019, Woodward recognized an increase in revenue of $6,017, and cost of goods sold of $9,580, related to changes in estimated total lifetime sales. Other than amounts related to changes in estimate, for the fiscal year ended September 30, 2019, Woodward amortized $376 of costs to fulfill contracts with customers to cost of goods sold and amortized $719 of contract liabilities to revenue.
In 2016, Woodward contributed certain contractual rights and intellectual property to a joint venture with the General Electric Company (“GE”). In exchange for a 50% ownership interest in the joint venture and future rights to purchase products from the joint venture at favorable pricing, GE agreed to pay total consideration of $323,410 to Woodward. Under previous accounting guidance, Woodward concluded that the formation of the joint venture was not the culmination of an earnings event and deferred recognition of the consideration paid until earned in the future. Under ASC 606, Woodward also concluded that the formation of the joint venture was not a culmination of an earnings event and has further concluded that the consideration paid or receivable from GE represents a material right. Accordingly, under both ASC 606 and the previous standard, across filersWoodward concluded it was appropriate to defer the consideration received as a liability and recognized it as an increase to net sales in multiple industries andproportion to revenue realized on sales of applicable fuel systems within the same industries comparedscope of the joint venture. Recognition to current practices, which should improve comparability. Adoptionnet sales in a particular period is determined as a percentage of total revenue expected to be realized by Woodward over the estimated remaining lives of the underlying commercial aircraft engine programs assigned to the joint venture. As of the adoption of ASC 606, Woodward has classified this as a contract liability with both a current and noncurrent portion. For further discussion of Woodward’s joint venture, see Note 6, Joint venture.
Woodward does not record incremental costs of obtaining a contract, as Woodward does not pay sales commissions or incur other incremental costs related to contracts with Woodward’s customers for arrangements in which quantities and pricing are fixed and/or determinable.
Point in time and over time revenue recognition
Approximately one-half of Woodward’s customer contracts are recognized at the point in time when control of the products transfers to the customer, generally upon shipment of products, consistent with Woodward’s historical revenue recognition model. The remaining portion of Woodward’s revenues from sales of products and services to customers is requiredrecognized over time, rather than at a point in time, due primarily to the terms of certain customer contracts and/or the type of performance obligation being satisfied, as described below.
The following table reflects the amount of revenue recognized as point in time or over time for annual reporting periods beginning after December 15, 2017 (fiscalthe fiscal year 2019ended September 30, 2019:
|
|
|
|
|
|
|
|
|
| Year Ended September 30, 2019 |
| Aerospace |
| Industrial |
| Consolidated |
Point in time | $ | 762,042 |
| $ | 634,219 |
| $ | 1,396,261 |
Over time |
| 1,118,478 |
|
| 385,458 |
|
| 1,503,936 |
Total net sales | $ | 1,880,520 |
| $ | 1,019,677 |
| $ | 2,900,197 |
Point in time
Control of the products generally transfers to the customer at a point in time, as the customer does not control the products as they are produced. Woodward exercises judgment and considers the timing of right of payment, transfer of the risk and rewards, transfers of title, transfer of physical possession, and customer acceptance when determining when control of the product transfers to the customer, generally upon shipment of products, consistent with Woodward’s historical revenue recognition model.
Over time
Performance obligations are satisfied and revenue is recognized over time if: (i) the customer receives the benefits as Woodward performs work, if the customer controls the asset as it is being enhanced, or if the product being produced for Woodward),the customer has no alternative use to Woodward; and (ii) Woodward has an enforceable right to payment with a profit. For products being produced for the customer that have no alternative use to Woodward and Woodward has an enforceable right to payment with a profit, and where the products are substantially the same and have the same pattern of transfer to the customer, revenue is recognized as a series of distinct products. As Woodward satisfies MRO performance obligations, revenue is recognized over time, as the customer, rather than Woodward, controls the asset being enhanced. When services are provided, revenue from those services is recognized over time because control is transferred continuously to customers as Woodward performs the work. As a practical expedient, revenue for services that are short-term in nature are recognized using an output method as the customer is invoiced, as the invoiced amount corresponds directly to Woodward’s performance to date on the arrangement.
For services that are not short-term in nature, MRO, and sales of products that have no alternative use to Woodward and an enforceable right to payment with a profit, Woodward uses an actual cost input measure to determine the extent of progress towards completion of the performance obligation. For these revenue streams, revenue is recognized over time as work is performed based on the relationship between actual costs incurred to-date for each contract and the total estimated costs for such contract at completion of the performance obligation (the cost-to-cost method). Woodward has concluded that this measure of progress best depicts the transfer of assets to the customer, because incurred costs are integral to Woodward’s completion of the performance obligation under the specific customer contract and correlate directly to the transfer of control to the customer. Contract costs include labor, material and overhead. Contract cost estimates are based on various assumptions to project the outcome of future events. These assumptions include labor productivity and availability; the complexity of the work to be performed; the cost and availability of materials; the performance of subcontractors; and the availability and timing of funding from the customer. Revenues, including interim periodsestimated fees or profits, are recorded proportionally as costs are incurred.
A change in one or more of these estimates could affect the timing of revenue recognition on these contracts. Woodward reviews and updates its cost estimates regularly. Due to uncertainties inherent in the estimation process, it is reasonably possible that completion costs may be different than those estimated. Such changes in cost estimates and the related impact on the revenue recognized in the period in which the revisions are determined is recorded as a cumulative catch-up adjustment. The production of products and MRO activities are generally shorter-term in nature and therefore, the impacts of changes in estimates for these costs are considered immaterial.
If at any time the estimate of contract profitability indicates an anticipated loss on the contract, Woodward recognizes provisions for estimated losses on uncompleted contracts in the period in which such losses are determined. In situations where the creditworthiness of a customer becomes in doubt, Woodward ceases to recognize the over-time revenue on the associated customer contract.
Occasionally Woodward sells maintenance or service arrangements, extended warranties, or other stand ready services. Woodward recognizes revenue from such arrangements as a series of performance obligations over the time period in which the services are available to the customer.
Contract assets
Customer receivables include amounts billed and currently due from customers as well as unbilled amounts (contract assets) and are included in “Accounts receivable” in Woodward’s Consolidated Balance Sheets. Amounts are billed in accordance with contractual terms, which are generally tied to shipment of the products to the customer, or as work progresses in accordance with contractual terms. Billed accounts receivable are typically due within 60 days.
Consistent with common business practice in China, Woodward’s Chinese subsidiaries accept bankers’ acceptance notes from Chinese customers in settlement of certain customer billed accounts receivable. Bankers’ acceptance notes are financial instruments issued by Chinese financial institutions as part of financing arrangements between the reporting period.financial institution and a customer of the financial institution. Bankers’ acceptance notes represent a commitment by the issuing financial institution to pay a certain amount of money at a specified future maturity date to the legal owner of the bankers’ acceptance note as of the maturity date. The maturity date of bankers’ acceptance notes varies, but it is Woodward’s policy to only accept bankers’ acceptance notes with maturity dates no more than 180 days from the date of Woodward’s receipt of such draft. Woodward may electhas elected to adopt the practical expedient to not adjust the promised amounts of consideration for the effects of a significant financing component at contract inception as the financing component associated with accepting bankers’ acceptance notes has a duration of less than one year. Woodward’s contracts with customers generally have no other financing components.
Unbilled amounts arise when the timing of billing differs from the timing of revenue recognized, such as when contract provisions require revenue to be recognized over time rather than at a point in time. Unbilled amounts primarily relate to performance obligations satisfied over time when the cost-to-cost method is utilized and the revenue recognized exceeds the amount billed to the customer as there is not yet a right to payment in accordance with contractual terms. Unbilled amounts are recorded as a contract asset when the revenue associated with the contract is recognized prior to billing and derecognized when billed in accordance with the terms of the contract.
Accounts receivable consisted of the following:
|
|
|
|
|
|
|
|
| September 30, 2019 |
| September 30, 2018 |
Billed receivables |
|
|
|
|
|
|
Trade accounts receivable |
| $ | 381,942 |
| $ | 403,590 |
Other (Chinese financial institutions) |
|
| 42,171 |
|
| 23,191 |
Less: Allowance for uncollectible amounts |
|
| (7,908) |
|
| (3,938) |
Net billed accounts receivable |
|
| 416,205 |
|
| 422,843 |
Current unbilled receivables (contract assets), net |
|
| 175,324 |
|
| 9,160 |
Total accounts receivable, net |
| $ | 591,529 |
| $ | 432,003 |
As of the October 1, 2018 adoption of ASC 606, Woodward recognized unbilled receivables of $135,668. The remaining change in unbilled receivables was driven by the timing of revenue recognized in excess of billings, primarily in Woodward’s Aerospace segment.
In addition, as of September 30, 2019 “Other assets” on the Consolidated Balance Sheets includes $1,573 of unbilled receivables not expected to be invoiced and collected within a period of twelve months. As of September 30, 2018, there were $763 unbilled receivables not expected to be invoiced and collected within a period of twelve months.
Customer billed receivables are recorded at face amounts, less an allowance for doubtful accounts. In establishing the amount of the allowance related to the credit risk of accounts receivable, customer-specific information is considered related to delinquent accounts, past loss experience, bankruptcy filings, deterioration in the customer’s operating results or financial position, and current economic conditions. Bad debt losses are deducted from the allowance, and the related accounts receivable balances are written off when the receivables are deemed uncollectible. Recoveries of accounts receivable previously written off are recognized when received. In the fiscal year ended September 30, 2019, receivables written off were immaterial. An allowance associated with anticipated other adjustments to the selling price or cash discounts is also established and is included in the allowance for uncollectible amounts. Changes to this allowance are recorded as increases or decreases to net sales as adjustments to the transaction price related to variable consideration. In establishing this amount, both customer-specific information and historical experience are considered.
Unbilled receivables are stated net of adjustments for credit risk and the anticipated impacts of variable consideration on the transaction price, as applicable.
Billed and unbilled accounts receivable from the U.S. Government were less than 10% of total billed and unbilled accounts receivable at September 30, 2019.
Contract liabilities
Advance payments and billings in excess of revenue recognized represent contract liabilities and are recorded as deferred revenues when customers remit contractual cash payments in advance of Woodward satisfying performance obligations under contractual arrangements, including those with performance obligations satisfied over time. Woodward generally receives advance payments from customers related to maintenance or service arrangements, extended warranties, or other stand ready services, which it recognizes over the performance period. Contract liabilities are derecognized when revenue is recognized and the performance obligation is satisfied. Advance payments and billings in excess of revenue recognized are included in deferred revenue, which is classified as current or noncurrent based on the timing of when Woodward expects to recognize revenue. The current portion is included in “Accrued liabilities” and the noncurrent portion is included in “Other liabilities” at Woodward’s Consolidated Balance Sheets.
Contract liabilities consisted of the following:
|
|
|
|
|
|
|
|
|
|
|
|
|
|
| September 30, 2019 |
| September 30, 2018 |
|
|
| Current |
|
| Noncurrent |
|
| Current |
|
| Noncurrent |
Deferred revenue from material rights from GE joint venture formation |
| $ | 8,317 |
| $ | 230,588 |
| $ | 7,087 |
| $ | 235,300 |
Deferred revenue from advance invoicing and/or prepayments from customers |
|
| 4,554 |
|
| 141 |
|
| 2,572 |
|
| - |
Liability related to customer supplied inventory |
|
| 13,396 |
|
| - |
|
| - |
|
| - |
Deferred revenue from material rights related to engineering and development funding |
|
| 1,624 |
|
| 106,436 |
|
| - |
|
| - |
Net contract liabilities |
| $ | 27,891 |
| $ | 337,165 |
| $ | 9,659 |
| $ | 235,300 |
As of the October 1, 2018 butadoption of ASC 606, Woodward recognized current liabilities for the noncash consideration provided to Woodward in the form of customer supplied inventory of $11,951 and current and noncurrent liabilities for deferred revenue from material rights related to engineering and development funding of $664 and $79,347, respectively. All other changes in contract liability balances were due to normal operating activities.
Woodward recognized revenue of $21,658 in the fiscal year ended September 30, 2019 from contract liabilities balances recorded as of October 1, 2018.
Remaining performance obligations
Remaining performance obligations related to the aggregate amount of the total contract transaction price of firm orders for which the performance obligation has not yet been recognized in revenue as of September 30, 2019 was $1,527,437, the majority of which relate to Woodward’s Aerospace segment. Woodward expects to recognize almost all of these remaining performance obligations within two years after September 30, 2019. Firm orders for which the Company does not expect to do so. Uponrecognize future revenue due to credit risk of the customer are excluded from the amount of remaining performance obligations.
Remaining performance obligations related to material rights that have not yet been recognized in revenue as of September 30, 2019 was $424,773, of which $11,119 is expected to be recognized in fiscal year 2020, and the balance is expected to be recognized thereafter. Woodward expects to recognize revenue from performance obligations related to material rights over the life of the underlying programs, which may be as long as forty years.
Financial statement impact of the adoption Woodward must elect to adopt either retrospectively to each prior reporting period presented or usingof ASC 606
The following schedule quantifies the cumulative effect transition method withimpact of adopting ASC 606 on the cumulativeConsolidated Balance Sheet as of October 1, 2018. The effect of initialthe new standard represents the increase (decrease) in the line item based on the adoption recognized at the date of initial application. Woodward has not determined what transition method it will use. Woodward is currently assessing the impact that the futureASC 606:
|
|
|
|
|
|
|
|
|
|
|
| September 30, 2018
as reported |
| Effect of
ASC 606 |
| October 1, 2018
as adjusted |
ASSETS |
|
|
|
|
|
|
|
|
|
Current assets: |
|
|
|
|
|
|
|
|
|
Cash and cash equivalents |
| $ | 83,594 |
| $ | - |
| $ | 83,594 |
Accounts receivable, net (1)(2) |
|
| 432,003 |
|
| 135,668 |
|
| 567,671 |
Inventories (1)(2) |
|
| 549,596 |
|
| (73,606) |
|
| 475,990 |
Income taxes receivable (5) |
|
| 6,397 |
|
| (1,247) |
|
| 5,150 |
Other current assets |
|
| 43,207 |
|
| (154) |
|
| 43,053 |
Total current assets |
|
| 1,114,797 |
|
| 60,661 |
|
| 1,175,458 |
Property, plant and equipment, net |
|
| 1,060,005 |
|
| - |
|
| 1,060,005 |
Goodwill |
|
| 813,250 |
|
| - |
|
| 813,250 |
Intangible assets, net (4) |
|
| 700,883 |
|
| (2,519) |
|
| 698,364 |
Deferred income tax assets (5) |
|
| 16,570 |
|
| (1,185) |
|
| 15,385 |
Other assets (1)(2)(3) |
|
| 85,144 |
|
| 85,865 |
|
| 171,009 |
Total assets |
| $ | 3,790,649 |
| $ | 142,822 |
| $ | 3,933,471 |
|
|
|
|
|
|
|
|
|
|
LIABILITIES AND STOCKHOLDERS' EQUITY |
|
|
|
|
|
|
|
|
|
Current liabilities: |
|
|
|
|
|
|
|
|
|
Short-term borrowings |
| $ | 153,635 |
| $ | - |
| $ | 153,635 |
Accounts payable |
|
| 226,285 |
|
| - |
|
| 226,285 |
Income taxes payable (5) |
|
| 16,745 |
|
| 5,352 |
|
| 22,097 |
Accrued liabilities (2)(3) |
|
| 194,513 |
|
| 14,625 |
|
| 209,138 |
Total current liabilities |
|
| 591,178 |
|
| 19,977 |
|
| 611,155 |
Long-term debt, less current portion |
|
| 1,092,397 |
|
| - |
|
| 1,092,397 |
Deferred income tax liabilities (5) |
|
| 170,915 |
|
| 5,515 |
|
| 176,430 |
Other liabilities (3) |
|
| 398,055 |
|
| 78,630 |
|
| 476,685 |
Total liabilities |
|
| 2,252,545 |
|
| 104,122 |
|
| 2,356,667 |
Stockholders' equity: |
|
|
|
|
|
|
|
|
|
Preferred stock |
|
| - |
|
| - |
|
| - |
Common stock |
|
| 106 |
|
| - |
|
| 106 |
Additional paid-in capital |
|
| 185,705 |
|
| - |
|
| 185,705 |
Accumulated other comprehensive losses |
|
| (74,942) |
|
| (45) |
|
| (74,987) |
Deferred compensation |
|
| 8,431 |
|
| - |
|
| 8,431 |
Retained earnings |
|
| 1,966,643 |
|
| 38,745 |
|
| 2,005,388 |
|
|
| 2,085,943 |
|
| 38,700 |
|
| 2,124,643 |
Treasury stock at cost |
|
| (539,408) |
|
| - |
|
| (539,408) |
Treasury stock held for deferred compensation |
|
| (8,431) |
|
| - |
|
| (8,431) |
Total stockholders' equity |
|
| 1,538,104 |
|
| 38,700 |
|
| 1,576,804 |
Total liabilities and stockholders' equity |
| $ | 3,790,649 |
| $ | 142,822 |
| $ | 3,933,471 |
(1)The adoption of ASC 606 maychanged the revenue recognition practices for a number of revenue generating activities across Woodward’s businesses, although the most significant impacts are concentrated in product being produced for customers that have no alternative use to Woodward and Woodward has an enforceable right to payment with a profit, and MRO. The revenue related to these activities, which previously was accounted for on itsa point in time basis, is now required to use an over time model because the associated contracts meet one or more of the mandatory criteria established in ASC 606, as described above, and are included as current unbilled receivables in “Accounts receivable” and noncurrent unbilled receivables in “Other assets.” The change in the timing of revenue recognized in connection with over time contracts similarly changed the timing of manufacturing cost recognition and certain engineering and development costs, which are reflected as a reduction to inventory.
(2)The value of noncash consideration in the form of exchanged products and other customer provided inventory is reflected in “Inventories,” and in contract liabilities, which are included in “Accrued liabilities.”
(3)Woodward recorded customer funding of product engineering and development identified as material rights as current and noncurrent deferred revenue contract liabilities included in “Accrued liabilities” and “Other liabilities.” The related customer funded product engineering and development costs were capitalized as costs to fulfill a contract, to the extent of the contractually committed customer funded payments, and are recorded as “Other assets.”
(4)
The net book value of the backlog and customer relationships and contracts intangible assets was adjusted concurrent with the change in the timing of the associated revenue, resulting in a reduction in the net book value of these assets as of the date of adoption.
(5)The value of tax assets and tax liabilities was impacted by the change in timing of the recognition of assets and liabilities within tax jurisdictions.
The following schedule quantifies the impact of adopting ASC 606 on the Consolidated Financial Statements by analyzing its current portfolioof Earnings for the fiscal year ended September 30, 2019. The effect of the new standard represent the increase (decrease) in the line item based on the adoption of ASC 606.
|
|
|
|
|
|
|
|
|
|
|
| Year Ended September 30, 2019 |
|
| Under previous standard |
| Effect of
ASC 606 |
| As reported |
Net sales |
| $ | 2,790,557 |
| $ | 109,640 |
| $ | 2,900,197 |
Costs and expenses: |
|
|
|
|
|
|
|
|
|
Cost of goods sold |
|
| 2,088,087 |
|
| 104,567 |
|
| 2,192,654 |
Selling, general, and administrative expenses |
|
| 211,307 |
|
| (102) |
|
| 211,205 |
Research and development costs |
|
| 160,402 |
|
| (1,295) |
|
| 159,107 |
Interest expense |
|
| 44,001 |
|
| - |
|
| 44,001 |
Interest income |
|
| (1,413) |
|
| - |
|
| (1,413) |
Other expense (income), net |
|
| (25,969) |
|
| - |
|
| (25,969) |
Total costs and expenses |
|
| 2,476,415 |
|
| 103,170 |
|
| 2,579,585 |
Earnings before income taxes |
|
| 314,142 |
|
| 6,470 |
|
| 320,612 |
Income tax expense |
|
| 60,175 |
|
| 835 |
|
| 61,010 |
Net earnings |
| $ | 253,967 |
| $ | 5,635 |
| $ | 259,602 |
|
|
|
|
|
|
|
|
|
|
Earnings per share |
|
|
|
|
|
|
|
|
|
Basic earnings per share |
| $ | 4.10 |
| $ | 0.09 |
| $ | 4.19 |
Diluted earnings per share |
| $ | 3.94 |
| $ | 0.08 |
| $ | 4.02 |
|
|
|
|
|
|
|
|
|
|
Weighted Average Common Shares Outstanding (Note 4): |
|
|
|
|
|
|
|
|
|
Basic |
|
| 61,950 |
|
|
|
|
| 61,950 |
Diluted |
|
| 64,498 |
|
|
|
|
| 64,498 |
The adoption of ASC 606 resulted in an increase to net sales and cost of goods sold primarily due to the recognition of noncash consideration in the form of customer supplied inventory and the accelerated recognition of revenue and associated cost of goods sold for over time contracts, includingwhich would have been recognized at a reviewpoint in time under the previous standard. The increases were offset by decreases in revenue and cost of historical accounting policiesgoods sold related to the deferral of amounts due from customers recognized as material rights and practices to identify potential differencesover time contracts recognized as of the date of adoption, both of which would otherwise have been recognized as revenue during the periods under the previous standard.
The following schedule quantifies the impact of adopting ASC 606 on the Consolidated Balance Sheet as of September 30, 2019. The effect of the new standard represents the increase (decrease) in applying the guidanceline item based on the adoption of ASC 606.
|
|
|
|
|
|
|
|
|
|
|
| September 30, 2019
under previous standard |
| Effect of
ASC 606 |
| September 30, 2019
as reported |
ASSETS |
|
|
|
|
|
|
|
|
|
Current assets: |
|
|
|
|
|
|
|
|
|
Cash and cash equivalents |
| $ | 99,073 |
| $ | - |
| $ | 99,073 |
Accounts receivable, net |
|
| 419,471 |
|
| 172,058 |
|
| 591,529 |
Inventories |
|
| 614,941 |
|
| (98,105) |
|
| 516,836 |
Income taxes receivable |
|
| 19,100 |
|
| (11,001) |
|
| 8,099 |
Other current assets |
|
| 54,665 |
|
| 1,026 |
|
| 55,691 |
Total current assets |
|
| 1,207,250 |
|
| 63,978 |
|
| 1,271,228 |
Property, plant and equipment, net |
|
| 1,058,775 |
|
| - |
|
| 1,058,775 |
Goodwill |
|
| 797,853 |
|
| - |
|
| 797,853 |
Intangible assets, net |
|
| 611,992 |
|
| - |
|
| 611,992 |
Deferred income tax assets |
|
| 19,449 |
|
| (1,288) |
|
| 18,161 |
Other assets |
|
| 91,482 |
|
| 107,035 |
|
| 198,517 |
Total assets |
| $ | 3,786,801 |
| $ | 169,725 |
| $ | 3,956,526 |
|
|
|
|
|
|
|
|
|
|
LIABILITIES AND STOCKHOLDERS' EQUITY |
|
|
|
|
|
|
|
|
|
Current liabilities: |
|
|
|
|
|
|
|
|
|
Short-term borrowings |
| $ | 220,000 |
| $ | - |
| $ | 220,000 |
Accounts payable |
|
| 240,460 |
|
| - |
|
| 240,460 |
Income taxes payable |
|
| 15,011 |
|
| 3,838 |
|
| 18,849 |
Accrued liabilities |
|
| 209,907 |
|
| 18,220 |
|
| 228,127 |
Total current liabilities |
|
| 685,378 |
|
| 22,058 |
|
| 707,436 |
Long-term debt, less current portion |
|
| 864,899 |
|
| - |
|
| 864,899 |
Deferred income tax liabilities |
|
| 153,521 |
|
| (2,159) |
|
| 151,362 |
Other liabilities |
|
| 400,197 |
|
| 105,891 |
|
| 506,088 |
Total liabilities |
|
| 2,103,995 |
|
| 125,790 |
|
| 2,229,785 |
Stockholders' equity: |
|
|
|
|
|
|
|
|
|
Preferred stock |
|
| - |
|
| - |
|
| - |
Common stock |
|
| 106 |
|
| - |
|
| 106 |
Additional paid-in capital |
|
| 207,120 |
|
| - |
|
| 207,120 |
Accumulated other comprehensive losses |
|
| (102,863) |
|
| (443) |
|
| (103,306) |
Deferred compensation |
|
| 9,382 |
|
| - |
|
| 9,382 |
Retained earnings |
|
| 2,180,541 |
|
| 44,378 |
|
| 2,224,919 |
|
|
| 2,294,286 |
|
| 43,935 |
|
| 2,338,221 |
Treasury stock at cost |
|
| (602,098) |
|
| - |
|
| (602,098) |
Treasury stock held for deferred compensation |
|
| (9,382) |
|
| - |
|
| (9,382) |
Total stockholders' equity |
|
| 1,682,806 |
|
| 43,935 |
|
| 1,726,741 |
Total liabilities and stockholders' equity |
| $ | 3,786,801 |
| $ | 169,725 |
| $ | 3,956,526 |
The underlying causes of the impacts of the adoption of ASC 606 on the Consolidated Balance Sheet as of September 30, 2019 are consistent with those as of the date of adoption, October 1, 2018, as discussed above.
The following schedule quantifies the impact of adopting ASC 606 on the Consolidated Statement of Cash Flows as of September 30, 2019. The effect of the new standard represents the increase (decrease) in the line item based on the adoption of ASC 606.
|
|
|
|
|
|
|
|
|
|
|
|
| September 30, 2019
under previous standard |
|
| Effect of
ASC 606 |
|
| September 30, 2019
as reported |
Cash flows from operating activities: |
|
|
|
|
|
|
|
|
|
Net earnings |
| $ | 253,967 |
| $ | 5,635 |
| $ | 259,602 |
Adjustments to reconcile net earnings to net cash provided by operating activities: |
|
|
|
|
|
|
|
|
|
Depreciation and amortization |
|
| 144,432 |
|
| (2,428) |
|
| 142,004 |
Net loss on sales of assets |
|
| 1,925 |
|
| - |
|
| 1,925 |
Stock-based compensation |
|
| 18,146 |
|
| - |
|
| 18,146 |
Deferred income taxes |
|
| (2,439) |
|
| (7,626) |
|
| (10,065) |
Changes in operating assets and liabilities: |
|
|
|
|
|
|
|
|
|
Trade accounts receivable |
|
| 6,692 |
|
| (5,851) |
|
| 841 |
Unbilled receivables (contract assets) |
|
| - |
|
| (31,353) |
|
| (31,353) |
Costs to fulfill a contract |
|
| - |
|
| (20,656) |
|
| (20,656) |
Inventories |
|
| (73,250) |
|
| 24,065 |
|
| (49,185) |
Accounts payable and accrued liabilities |
|
| 50,038 |
|
| (2,034) |
|
| 48,004 |
Contract liabilities |
|
| (4,024) |
|
| 33,106 |
|
| 29,082 |
Income taxes |
|
| (6,155) |
|
| 8,238 |
|
| 2,083 |
Retirement benefit obligations |
|
| (3,705) |
|
| - |
|
| (3,705) |
Other |
|
| 4,981 |
|
| (1,096) |
|
| 3,885 |
Net cash provided by operating activities |
| $ | 390,608 |
| $ | - |
| $ | 390,608 |
|
|
|
|
|
|
|
|
|
|
Cash flows from investing activities: |
|
|
|
|
|
|
|
|
|
Payments for purchase of property, plant, and equipment |
|
| (99,066) |
|
| - |
|
| (99,066) |
Proceeds from sale of assets |
|
| 1,010 |
|
| - |
|
| 1,010 |
Proceeds from sales of short-term investments |
|
| 22,252 |
|
| - |
|
| 22,252 |
Payments for purchases of short-term investments |
|
| (26,723) |
|
| - |
|
| (26,723) |
Net cash used in investing activities |
| $ | (102,527) |
| $ | - |
| $ | (102,527) |
|
|
|
|
|
|
|
|
|
|
Cash flows from financing activities: |
|
|
|
|
|
|
|
|
|
Cash dividends paid |
|
| (39,066) |
|
| - |
|
| (39,066) |
Proceeds from sales of treasury stock |
|
| 36,044 |
|
| - |
|
| 36,044 |
Payments for repurchases of common stock |
|
| (110,311) |
|
| - |
|
| (110,311) |
Borrowings on revolving lines of credit and short-term borrowings |
|
| 1,683,542 |
|
| - |
|
| 1,683,542 |
Payments on revolving lines of credit and short-term borrowings |
|
| (1,690,035) |
|
| - |
|
| (1,690,035) |
Payments of long-term debt and capital lease obligations |
|
| (143,535) |
|
| - |
|
| (143,535) |
Payments of debt financing costs |
|
| (2,238) |
|
| - |
|
| (2,238) |
Net cash used in financing activities |
|
| (265,599) |
|
| - |
|
| (265,599) |
Effect of exchange rate changes on cash and cash equivalents |
|
| (7,003) |
|
| - |
|
| (7,003) |
Net change in cash and cash equivalents |
|
| 15,479 |
|
| - |
|
| 15,479 |
Cash and cash equivalents, including restricted cash, at beginning of year |
|
| 83,594 |
|
| - |
|
| 83,594 |
Cash and cash equivalents, including restricted cash, at end of year |
| $ | 99,073 |
| $ | - |
| $ | 99,073 |
Disaggregation of Revenue
Woodward designs, produces and services reliable, efficient, low-emission, and high-performance energy control products for diverse applications in markets throughout the world. Woodward reports financial results for each of its Aerospace and Industrial reportable segments. Woodward further disaggregates its revenue from contracts with customers by primary market and by geographical area as Woodward believes this best depicts how the nature, amount, timing and uncertainty of its revenue and cash flows are affected by economic factors.
Revenue by primary market for the Aerospace reportable segment was as follows:
|
|
|
| Year Ended |
| September 30, 2019 |
Commercial OEM | $ | 659,336 |
Commercial aftermarket |
| 497,795 |
Defense OEM |
| 529,940 |
Defense aftermarket |
| 193,449 |
Total Aerospace segment net sales | $ | 1,880,520 |
Revenue by primary market for the Industrial reportable segment was as follows:
|
|
|
| Year Ended |
| September 30, 2019 |
Reciprocating engines | $ | 751,136 |
Industrial turbines |
| 210,064 |
Renewables |
| 58,477 |
Total Industrial segment net sales | $ | 1,019,677 |
The customers who account for approximately 10% or more of net sales to each of Woodward’s reportable segments for the fiscal year ended September 30, 2019 follow:
|
|
| Customer |
Aerospace | The Boeing Company, General Electric Company, United Technologies |
Industrial | Rolls-Royce, General Electric Company, Weichai Westport |
Net sales by geographic area, as determined based on the location of the customer, were as follows:
|
|
|
|
|
|
|
|
|
| Year Ended September 30, 2019 |
| Aerospace |
| Industrial |
| Consolidated |
United States | $ | 1,415,880 |
| $ | 212,184 |
| $ | 1,628,064 |
Germany |
| 72,907 |
|
| 229,177 |
|
| 302,084 |
Europe, excluding Germany |
| 178,905 |
|
| 252,511 |
|
| 431,416 |
Asia |
| 85,483 |
|
| 293,834 |
|
| 379,317 |
Other countries |
| 127,345 |
|
| 31,971 |
|
| 159,316 |
Total net sales | $ | 1,880,520 |
| $ | 1,019,677 |
| $ | 2,900,197 |
Note 3.4. Earnings per share
Basic earnings per share is computed by dividing net earnings available to common stockholders by the weighted-average number of shares of common stock outstanding for the period.
Diluted earnings per share reflects the weighted-average number of shares outstanding after consideration of the dilutive effect of stock options and restricted stock.
The following is a reconciliation of net earnings to basic earnings per share and diluted earnings per share:
| | | | | | |
|
|
|
|
|
|
| | | | | | |
|
|
|
|
|
|
| | Year Ended September 30, |
| Year Ended September 30, |
| | 2016 | | 2015 | | 2014 |
| 2019 |
| 2018 |
| 2017 |
Numerator: | | | | | | | | | |
|
|
|
|
|
|
|
|
|
Net earnings | | $ | 180,838 | | $ | 181,452 | | $ | 165,844 |
| $ | 259,602 |
| $ | 180,378 |
| $ | 200,507 |
Denominator: | | | | | | | | | |
|
|
|
|
|
|
|
|
|
Basic shares outstanding | | 61,893 | | 64,684 | | 66,432 |
|
| 61,950 |
| 61,493 |
| 61,366 |
Dilutive effect of stock options and restricted stock | | | 1,663 | | | 1,372 | | | 1,344 | |
Dilutive effect of stock options and restricted stock units | |
|
| 2,548 |
|
| 2,383 |
|
| 2,146 |
Diluted shares outstanding | | | 63,556 | | | 66,056 | | | 67,776 |
|
| 64,498 |
|
| 63,876 |
|
| 63,512 |
Income per common share: | | | | | | | | | |
|
|
|
|
|
|
|
|
|
Basic earnings per share | | $ | 2.92 | | $ | 2.81 | | $ | 2.50 |
| $ | 4.19 |
| $ | 2.93 |
| $ | 3.27 |
Diluted earnings per share | | $ | 2.85 | | $ | 2.75 | | $ | 2.45 |
| $ | 4.02 |
| $ | 2.82 |
| $ | 3.16 |
On June 2, 2015, Woodward entered into an accelerated share repurchase agreement (the “ASR Agreement”) with Goldman, Sachs & Co. (“Goldman”) under which Woodward repurchased shares of its common stock for an aggregate purchase price of $125,000. Upon execution of the ASR Agreement, Goldman initially delivered to Woodward 2,048 shares of common stock. Goldman completed the ASR Agreement on September 3, 2015 and delivered 458 additional shares to Woodward. The final number of shares delivered to Woodward was based generally on the average daily volume-weighted average price of Woodward stock during the term of the ASR Agreement of $49.89. The 2,506 shares of common stock delivered by Goldman to Woodward related to the ASR Agreement are reflected in the calculation of basic shares outstanding used in the calculation of earnings per share.
The following stock option grants were outstanding during the fiscal years ended September 30, 2016, 2015,2019, 2018 and 2014,2017, but were excluded from the computation of diluted earnings per share because their inclusion would have been anti-dilutive:anti-dilutive.
| | | | | | |
|
|
|
|
|
|
| | | | | | |
|
|
|
|
|
|
| | Year Ended September 30, |
| Year Ended September 30, |
| | 2016 | | 2015 | | 2014 |
| 2019 |
| 2018 |
| 2017 |
Options | | | - | | | 697 | | | 12 |
|
| 25 |
|
| 760 |
|
| 68 |
Weighted-average option price | | $ | n/a | | $ | 46.55 | | $ | 44.04 |
| $ | 96.54 |
| $ | 78.72 |
| $ | 63.23 |
The weighted-average shares of common stock outstanding for basic and diluted earnings per share included the weighted-average treasury stock shares held for deferred compensation obligations of the following:
|
|
|
|
|
|
|
|
|
|
|
|
|
|
|
|
|
|
|
|
|
| Year Ended September 30, |
|
| 2019 |
| 2018 |
| 2017 |
Weighted-average treasury stock shares held for deferred compensation obligations |
|
| 208 |
|
| 198 |
|
| 180 |
Note 5. Business acquisition
In fiscal year 2018, the Company, and its wholly-owned subsidiary, Woodward Aken GmbH (collectively, the “Purchasers”), entered into a Share Purchase Agreement (the “L’Orange Agreement”) with MTU Friedrichshafen GmbH (“MTU”) and MTU America Inc. (together with MTU, the “Sellers”), both of which were subsidiaries of Rolls-Royce PLC (“Rolls-Royce”). Pursuant to the L’Orange Agreement, the Purchasers agreed to acquire all of the outstanding shares of stock of L’Orange GmbH, together with its wholly-owned subsidiaries in China and Germany, as well as all of the outstanding equity interests of its affiliate, Fluid Mechanics LLC, and their related operations (collectively, “L’Orange”), for total consideration (including cash consideration and the assumption of certain liabilities) of €700,000, or approximately $811,000 based on the foreign currency exchange rate as of the date Woodward executed cross currency swaps in connection with the financing of the transaction as described in Note 8, Derivative instruments and hedging activities. The transactions contemplated by the L’Orange Agreement were completed on June 1, 2018 (the “Closing”) and L’Orange became a subsidiary of the Company. Following the Closing, L’Orange was renamed “Woodward L’Orange.”
In connection with the Closing, MTU and a subsidiary of Rolls-Royce, and Woodward L’Orange, entered into a long-term supply agreement, dated June 1, 2018 (the “LTSA”). Pursuant to the terms of the LTSA, Woodward L’Orange will continue to supply to MTU and its affiliates within Rolls-Royce certain liquid fuel injection systems, injectors, pumps and other associated parts and components for industrial diesel, heavy fuel oil and dual-fuel engines in a manner consistent with the supply of such products prior to the transaction. The LTSA has an initial term that extends through December 31, 2032. During the term of the LTSA, MTU will continue to purchase certain of these products exclusively from Woodward L’Orange, subject to certain limitations specified therein, at pricing negotiated at arms-length.
ASC Topic 805, “Business Combinations” (“ASC 805”), provides a framework to account for acquisition transactions under U.S. GAAP. The purchase price of L’Orange, prepared consistent with the required ASC 805 framework, is allocated as follows:
| | | | | | | | | |
| | | | | | | | | |
| | Year Ended September 30, |
| | 2016 | | 2015 | | 2014 |
Weighted-average treasury stock shares held for deferred compensation obligations | | | 171 | | | 190 | | | 216 |
|
|
|
Cash paid to Sellers | $ | 780,401 |
Less acquired cash and restricted cash |
| (9,286) |
Total purchase price | $ | 771,115 |
The cash consideration was financed through the use of cash on hand, the issuance of an aggregate principal amount of $400,000 of senior unsecured notes in a series of private placement transactions and $167,420 borrowed under Woodward’s revolving credit agreement (see Note 14, Credit facilities, short-term borrowings and long-term debt). In connection with these borrowings, the Company entered into cross currency swap transactions, which effectively lowered the interest rate on each tranche of the senior unsecured notes and the borrowings under the Company’s revolving credit agreement (see Note 8, Derivative instruments and hedging activities).
The allocation of the purchase price to the assets acquired and liabilities assumed was finalized as of June 30, 2019 using the purchase method of accounting in accordance with ASC 805. Assets acquired and liabilities assumed in the transaction were recorded at their acquisition date fair values, while transaction costs associated with the acquisition were expensed as incurred. Woodward’s allocation was based on an evaluation of the appropriate fair values and represents management’s best estimate based on available data.
The following table, which is final as of June 30, 2019, summarizes the estimated fair values of the assets acquired and liabilities assumed at the Closing.
|
|
|
|
|
|
Accounts receivable | $ | 26,538 |
Inventories (1) |
| 72,392 |
Other current assets |
| 1,385 |
Property, plant, and equipment |
| 89,772 |
Goodwill |
| 257,447 |
Intangible assets |
| 573,427 |
Total assets acquired |
| 1,020,961 |
Other current liabilities |
| 41,997 |
Deferred income tax liabilities |
| 166,927 |
Other noncurrent liabilities |
| 40,922 |
Total liabilities assumed |
| 249,846 |
Net assets acquired | $ | 771,115 |
(1)Inventories include a $16,324 adjustment to state work in progress and finished goods inventories at their fair value as of the acquisition date. The entire inventory fair value adjustment was recognized as a noncash increase to cost of goods sold ratably over the estimated inventory turnover period during the fiscal year ended September 30, 2018.
The final purchase price allocation resulted in the recognition of $257,447 of goodwill. Only the portion of goodwill which relates to the U.S. operations of Woodward L’Orange is deductible for tax purposes. The Company has included all of the goodwill in its Industrial segment. The goodwill represents the estimated value of potential expansion with new customers, the opportunity to further develop sales opportunities with new customers, other synergies including supply chain savings expected to be achieved through the integration of Woodward L’Orange with Woodward’s Industrial segment, and intangible assets that do not qualify for separate recognition, such as the value of the assembled Woodward L’Orange workforce that is not included within the estimated value of the acquired backlog and customer relationship intangible assets.
In connection with the acquisition of L’Orange, Woodward assumed the defined benefit pension obligations of the L’Orange defined benefit pension plans (the “Woodward L’Orange Pension Plans”). Woodward’s assumption of the liability associated with the Woodward L’Orange Pension Plans was part of the total consideration paid by Woodward to acquire L’Orange and thus reduced Woodward’s cash payment for the transaction. As of the Closing, the total liability recognized by the Company associated with the Woodward L’Orange Pension Plans was $39,257, of which $1,143 was considered current.
A summary of the intangible assets acquired, weighted-average useful lives, and amortization methods follows:
|
|
|
|
|
|
|
|
|
|
|
|
|
|
|
|
| Estimated Amounts |
| Weighted-Average Useful Life |
| Amortization Method |
Intangible assets with finite lives: |
|
|
|
|
|
|
|
Customer relationships and contracts | $ | 388,705 |
| 22 | years |
| Straight-line |
Process technology |
| 74,260 |
| 22 | years |
| Straight-line |
Backlog |
| 42,932 |
| 1 | year |
| Accelerated |
Other |
| 232 |
| 3 | years |
| Straight-line |
Intangible asset with indefinite life: |
|
|
|
|
|
|
|
Trade name |
| 67,298 |
| Indefinite |
| Not amortized |
Total | $ | 573,427 |
|
|
|
|
|
Pro forma results for Woodward giving effect to the L’Orange acquisition
The following unaudited pro forma financial information presents the combined results of operations of Woodward and Woodward L’Orange as if the acquisition had been completed as of the beginning of the fiscal year prior to the year the acquisition took place, or October 1, 2016. The unaudited pro forma financial information is presented for informational purposes and is not indicative of the results of operations that would have been achieved if the acquisition and related borrowings had taken place on October 1, 2016, nor are they indicative of future results.
The unaudited pro forma financial information for the fiscal year ended September 30, 2019 includes Woodward’s results, including the post-acquisition results of Woodward L’Orange, since June 1, 2018. The unaudited pro forma financial information for the fiscal year ended September 30, 2018 combines Woodward’s results with the pre-acquisition results of L’Orange for the period prior to June 1, 2018, and the post-acquisition results of Woodward L’Orange since June 1, 2018. The unaudited pro forma financial information for the fiscal year ended September 30, 2017 combines Woodward’s results with the pre-acquisition results of Woodward L’Orange for that period.
Prior to the L’Orange acquisition by Woodward, L’Orange was a wholly owned subsidiary of Rolls-Royce, and as such was not a standalone entity for financial reporting purposes. Accordingly, the historical operating results of L’Orange may not be indicative of the results that might have been achieved, historically or in the future, if L’Orange had been a standalone entity.
The unaudited pro forma results for fiscal years ended September 30, 2019, September 30, 2018 and September 30, 2017 are asfollows:
|
|
|
|
|
|
|
|
|
|
|
|
|
|
|
|
|
|
|
|
|
|
|
|
|
|
|
|
|
|
|
|
|
|
|
|
| Year Ended |
| Year Ended |
| Year Ended |
| September 30, 2019 |
| September 30, 2018 |
| September 30, 2017 |
| As reported |
| Pro forma |
| As reported |
| Pro forma |
| As reported |
| Pro forma |
Net sales | $ | 2,900,197 |
| $ | 2,900,197 |
| $ | 2,325,873 |
| $ | 2,549,874 |
| $ | 2,098,685 |
| $ | 2,380,572 |
Net earnings |
| 259,602 |
|
| 267,649 |
|
| 180,378 |
|
| 225,800 |
|
| 200,507 |
|
| 179,220 |
Earnings per share: |
|
|
|
|
|
|
|
|
|
|
|
|
|
|
|
|
|
Basic earnings per share | $ | 4.19 |
| $ | 4.32 |
| $ | 2.93 |
| $ | 3.67 |
| $ | 3.27 |
| $ | 2.92 |
Diluted earnings per share |
| 4.02 |
|
| 4.15 |
|
| 2.82 |
|
| 3.53 |
|
| 3.16 |
|
| 2.82 |
The unaudited pro forma results for all periods presented include adjustments made to account for certain costs and transactions that would have been incurred had the acquisition been completed as of October 1, 2016, including amortization charges for acquired intangible assets, eliminations of intercompany transactions, adjustments for acquisition transaction costs, adjustments for depreciation expense for property, plant, and equipment, and adjustments to interest expense. These adjustments are net of any applicable tax impact and were included to arrive at the pro forma results above.
The operating results of Woodward L’Orange have been included in Woodward’s operating results for the periods subsequent to the completion of the acquisition on June 1, 2018. Woodward L’Orange contributed net sales of $332,009 for the fiscal year ended September 30, 2019, and net sales of $102,905 for the fiscal year ended September 30, 2018. Woodward L’Orange contributed net income before income taxes of $47,246 for the fiscal year ended September 30, 2019, and a net loss before income taxes of $9,334 for the fiscal year ended September 30, 2018.
Woodward incurred acquisition financing related costs of $14,823 for the fiscal year ended September 30, 2019 as compared to $4,904 for the fiscal year ended September 30, 2018. The acquisition financing related costs are included in “Interest expense” in the Consolidated Statements of Earnings.
Note 4.6. Joint venturesventure
On January 4, 2016, Woodward and General Electric Company (“GE”), acting through its GE Aviation business unit, consummated the formation of a strategic joint venture between Woodward and GE (the “JV”). The JV designs, develops to develop, manufacture and sources thesupport fuel systemsystems for specified existing and all future GE commercial aircraft engines that produce thrust in excess of fifty thousand pounds.
As part of the JV formation, Woodward contributed to the JV certain contractual rights and intellectual property applicable to the existing GE commercial aircraft engine programs within the scope of the JV. Woodward hashad no initial cost basis in the JV because Woodward had no cost basis in the contractual rights and intellectual property contributed to the JV. GE purchased from Woodward a 50% ownership interest in the JV for a $250,000 cash payment to Woodward. In addition, GE will pay contingent consideration to Woodward consisting of fifteen annual payments of $4,894 per year, beginningwhich began on January 4, 2017, subject to certain claw-back conditions. During the second quarter of the fiscal years ended September 30, 2019 and September 30, 2018, Woodward received its second and third annual payments of $4,894, respectively, which were recorded as deferred income and included in Net cash provided by operating activities on the Consolidated Statements of Cash Flows. Neither Woodward nor GE contributed any tangible assets to the JV.
Under previous accounting guidance, Woodward determinedconcluded that the formation of the JV formation was not the culmination of an earnings event because Woodward has significant performance obligations to support the future operationsand deferred recognition of the JV. Therefore,consideration paid until earned in the future. Under ASC 606, Woodward recordedalso concluded the $250,000
formation of the JV was not a culmination of an earnings event and has further concluded that the consideration paid or receivable from GE represents a material right. Accordingly, under both ASC 606 and the previous standard, Woodward concluded it was appropriate to defer the consideration received from GE for its purchase ofas a 50% equity interest in the JV as deferred income. The $250,000 deferred income will be recognizedliability and recognize it as an increase to net sales in proportion to revenue realized on sales of applicable fuel systems within the scope of the JVJV. Recognition to net sales in a particular period is determined as a percentage of total revenue expected to be realized by Woodward over the estimated remaining lives of the underlying commercial aircraft engine programs assigned to the JV. AsUnamortized deferred revenue from material rights in connection with the JV formation included accrued liabilities of $8,317 as of September 30, 2016, accrued liabilities include $6,5522019 and $7,087 as of September 30, 2018, and other liabilities include $238,187 of unamortized deferred income realized upon the JV formation.$230,588 as of September 30, 2019 and $235,300 as of September 30, 2018. Amortization of the deferred income (material right) recognized as an increase to sales was $5,261$7,652 for the nine-monthstwelve months ended September 30, 2016.2019, $5,854 for the twelve months ended September 30, 2018, and $6,286 for the twelve months ended September 30, 2017.
The $250,000 cash consideration received from GE on January 4, 2016 is taxable upon receipt for income tax purposes but not currently recognized in earnings for book purposes. Therefore, during the three month period ended March 31, 2016, Woodward recorded a deferred tax asset of $94,125.
Woodward and GE jointly manage the JV and any significant decisions and/or actions of the JV require the mutual consent of both parties. Neither Woodward nor GE has a controlling financial interest in the JV, but both Woodward and GE do have the ability to significantly influence the operating and financial decisions of the JV. Therefore, Woodward is accounting for its 50% ownership interest in the JV using the equity method of accounting. The JV is a related party to Woodward. Other income includes $6,204income of $12,932 for the nine-monthsfiscal year ended September 30, 20162019, income of $3,339 for the fiscal year ended September 30, 2018, and income of $2,568 for the fiscal year ended September 30, 2017 related to Woodward’s equity interest in the earnings of the JV. During the nine-monthstwelve months ended September 30, 2016,2019, Woodward received no cash distributions from the JV of $15,000, which is included in Net cash provided by operating activities on the Consolidated Statements of Cash Flows. Woodward received 0 cash distributions from the JV during the fiscal year ended September 30, 2018, and therefore,$2,500 cash distribution from the JV during the fiscal year ended September 30, 2017. Woodward’s net investment in the JV, which is included in other assets, was $6,204$7,543 as of September 30, 2016.
During the nine-months ended2019 and $9,611 as of September 30, 2016, 2018.
Woodward’s net sales include $46,973$60,955 for the fiscal year ended September 30, 2019 of sales to the JV, compared to $72,511 for the fiscal year ended September 30, 2018, and $70,234 for the fiscal year ended September 30, 2017. Woodward recorded a reduction to sales of $21,391$34,236 for the fiscal year ended September 30, 2019 related to royalties paid to the JV by Woodward on sales by Woodward directly to third party aftermarket customers.customers, compared to $26,023 for the fiscal year ended September 30, 2018 and $26,133 for the fiscal year ended September 30, 2017. The Consolidated Balance SheetSheets include “Accounts receivable” of $5,906 at September 30, 2016, included “Accounts receivable” of $5,3262019, and $10,499 at September 30, 2018, related to amounts the JV owed Woodward, and includedinclude “Accounts payable” of $3,926$4,270 at September 30, 2019, and $2,944 at September 30, 2018, related to amounts Woodward owed the JV.
Upon the October 1, 2018 adoption of ASC 606, Woodward recorded $57,529 of revenue recognized in prior periods for the JV’s engineering and development projects as an increase to contract liabilities in “Other liabilities” and $57,529 of costs recognized in prior periods as costs to fulfill a contract in “Other assets.” Woodward recognized an additional $14,340 during the fiscal year ended September 30, 2019 of contract liabilities in “Other liabilities,” and $14,324 during the fiscal year ended September 30, 2019 of additional costs to fulfill a contract in “Other assets.” In the fiscal year ended September 30, 2019, Woodward recognized a $2,774 reduction in the cost to fulfill a contract in “Other assets” but a reduction of $2,790
in the contract liability in “Other liabilities” related to the termination of a JV engineering and development project previously recognized as a material right.
Note 5.7. Financial instruments and fair value measurements
Financial assets and liabilities recorded at fair value in the Consolidated Balance Sheets are categorized based upon a fair value hierarchy established by U.S. GAAP.
The table below presents information about Woodward’s financial assets and liabilities that are measured at fair value on a recurring basis and indicates the fair value hierarchy of the valuation techniques Woodward utilized to determine such fair value. Woodward had no financial liabilities required to be measured at fair value on a recurring basis as of September 30, 2016 or September 30, 2015.
| | | | | | | | | | | | | | | | |
|
|
|
|
|
|
|
|
|
|
|
|
|
|
|
|
|
| | | | | | | | | | | | | | | | |
|
|
|
|
|
|
|
|
|
|
|
|
|
|
|
|
|
| | At September 30, 2016 | | At September 30, 2015 |
| At September 30, 2019 |
| At September 30, 2018 |
| | Level 1 | | Level 2 | | Level 3 | | Total | | Level 1 | | Level 2 | | Level 3 | | Total |
| Level 1 |
| Level 2 |
| Level 3 |
| Total |
| Level 1 |
| Level 2 |
| Level 3 |
| Total |
Financial assets: | | | | | | | | | | | | | | | | | | | | | | | | |
|
|
|
|
|
|
|
|
|
|
|
|
|
|
|
|
|
|
|
|
|
|
|
|
Cash | | $ | 80,959 | | $ | - | | $ | - | | $ | 80,959 | | $ | 79,517 | | $ | - | | $ | - | | $ | 79,517 |
| $ | 52,971 |
| $ | - |
| $ | - |
| $ | 52,971 |
| $ | 59,838 |
| $ | - |
| $ | - |
| $ | 59,838 |
Investments in money market funds | | 48 | | - | | - | | 48 | | 20 | | - | | - | | 20 | |
Investments in reverse repurchase agreements | | 83 | | - | | - | | 83 | | 2,665 | | - | | - | | 2,665 |
| 886 |
| - |
| - |
| 886 |
|
| 4,582 |
| - |
| - |
| 4,582 |
Investments in Brazilian certificates of deposit | | 7,136 | | - | | - | | 7,136 | | - | | - | | - | | - | |
Investments in term deposits with foreign banks | |
| 45,216 |
| - |
| - |
| 45,216 |
|
| 19,174 |
| - |
| - |
| 19,174 |
Equity securities | | 12,491 | | - | | - | | 12,491 | | 9,883 | | - | | - | | 9,883 |
|
| 20,504 |
| - |
| - |
| 20,504 |
|
| 19,730 |
| - |
| - |
| 19,730 |
Cross currency interest rate swaps | |
|
| - |
|
| 24,758 |
|
| - |
|
| 24,758 |
|
| - |
|
| - |
|
| - |
|
| - |
Total financial assets | | $ | 100,717 | | $ | - | | $ | - | | $ | 100,717 | | $ | 92,085 | | $ | - | | $ | - | | $ | 92,085 |
| $ | 119,577 |
| $ | 24,758 |
| $ | - |
| $ | 144,335 |
| $ | 103,324 |
| $ | - |
| $ | - |
| $ | 103,324 |
| |
|
|
|
|
|
|
|
|
|
|
|
|
|
|
|
|
|
|
|
|
|
|
|
|
Financial liabilities: | |
|
|
|
|
|
|
|
|
|
|
|
|
|
|
|
|
|
Cross currency interest rate swaps | |
| $ | - |
| $ | - |
| $ | - |
| $ | - |
| $ | - |
| $ | 23,000 |
| $ | - |
| $ | 23,000 |
Total financial liabilities | |
| $ | - |
| $ | - |
| $ | - |
| $ | - |
| $ | - |
| $ | 23,000 |
| $ | - |
| $ | 23,000 |
| |
|
|
|
|
|
|
|
|
|
|
|
|
|
|
|
|
|
|
|
|
|
|
|
|
Investments in money market funds: Woodward sometimes invests excess cash in money market funds not insured by the Federal Depository Insurance Corporation (“FDIC”). Woodward believes that the investments in money market funds are on deposit with creditworthy financial institutions and that the funds are highly liquid. The investments in money market funds are reported in “Cash and cash equivalents” at fair value, with realized gains from interest income recognized in earnings. The fair values of Woodward’s investments in money market funds are based on the quoted market prices for the net asset value of the various money market funds.
Investments in reverse repurchase agreements: Woodward sometimes invests excess cash in reverse repurchase agreements. Under the terms of Woodward’s reverse repurchase agreements, Woodward purchases an interest in a pool of securities and is granted a security interest in those securities by the counterparty to the reverse repurchase agreement. At an agreed upon date, generally the next business day, the counterparty repurchases Woodward’s interest in the pool of securities at a price equal to what Woodward paid to the counterparty plus a rate of return determined daily per the terms of the reverse repurchase agreement. Woodward believes that the investments in these reverse repurchase agreements are with creditworthy financial institutions and that the funds invested are highly liquid. The investments in reverse repurchase
agreements are reported at fair value, with realized gains from interest income recognized in earnings, and are included in “Cash and cash equivalents.”equivalents” in the Consolidated Balance Sheets. Since the investments are generally overnight, the carrying value is considered to be equal to the fair value as the amount is deemed to be a cash deposit with no risk of change in value as of the end of each fiscal quarter.
Investments in Brazilian certificates of deposit:term deposits with foreign banks: Woodward’s Brazilian subsidiaryforeign subsidiaries sometimes investsinvest excess cash in Brazilian certificates of deposit insured by the Brazilian Credit Guarantee Fund. Woodward’s investments in Brazilian certificates of deposit can be entered into a pre-determined fixed or floating interest rate but, unlike certificates of deposit in the United States, can be withdrawn at any time, after 30 days, with notice given to thevarious highly liquid financial institution holding the deposit.instruments that Woodward believes that the investments in Brazilian certificates of deposit are with creditworthy financial institutions and that the funds are highly liquid. Theinstitutions. Such investments in Brazilian certificates of deposit are reported in “Cash and cash equivalents” at fair value, with realized gains from interest income recognized in earnings. The carrying value of Woodward’s investments in Brazilian certificates of depositterm deposits with foreign banks are considered to be equal to the fair value given the highly liquid nature of the investments. As of September 30, 2018, $3,635 of the term deposits with foreign banks were restricted in use as they were pledged collateral for short-term borrowings. The restriction lapsed during the first quarter of fiscal year 2019 when the related short-term borrowings were paid.
Equity securities: Woodward holds marketable equity securities, through investments in various mutual funds, related to its deferred compensation program. Based on Woodward’s intentions regarding these instruments, marketable equity securities are classified as trading securities. The trading securities are reported at fair value, with realized gains and losses recognized in “Other (income) expense, net.”net” on the Consolidated Statements of Earnings. The trading securities are included in “Other assets.”assets” in the Consolidated Balance Sheets. The fair values of Woodward’s trading securities are based on the quoted market prices for the net asset value of the various mutual funds.
AccountsCross currency interest rate swaps: Woodward holds cross currency interest rate swaps, which are accounted for at fair value. The swaps in an asset position are included in “Other assets,” and swaps in a liability position are included in “Other liabilities” in the Consolidated Balance Sheets. The fair values of Woodward’s cross currency interest rate swaps are determined using a market approach that is based on observable inputs other than quoted market prices, including contract terms, interest rates, currency rates, and other market factors. As of September 30, 2019, swaps in an asset position in the amount of $24,758 were included in “Other assets” in the Consolidated Balance Sheets. As of September 30, 2018, swaps in a liability position in the amount of $23,000 were included in “Other liabilities” in the Consolidated Balance Sheets.
Trade accounts receivable, accounts payable, the current portion of long-term debt, and short-term debtborrowings are not remeasured to fair value, as the carrying cost of each approximates its respective fair value. The estimated fair values and carrying costs of other financial instruments that are not required to be remeasured at fair value in the Consolidated Balance Sheets were as follows:
| | | | | | | | | | |
|
|
|
|
|
|
|
|
|
|
| | | | | | | | | | |
|
|
|
|
|
|
|
|
|
|
| | | | At September 30, 2016 | | At September 30, 2015 |
|
|
| At September 30, 2019 |
| At September 30, 2018 |
| | Fair Value Hierarchy Level | | Estimated Fair Value | | Carrying Cost | | Estimated Fair Value | | Carrying Cost |
| Fair Value Hierarchy Level |
| Estimated Fair Value |
| Carrying Cost |
| Estimated Fair Value |
| Carrying Cost |
Assets: | | | | | | | | | | | | | | |
|
|
|
|
|
|
|
|
|
|
|
|
|
|
Notes receivable from municipalities | | 2 | | $ | 17,501 | | $ | 15,849 | | $ | 16,112 | | $ | 15,638 |
| 2 |
| $ | 13,100 |
| $ | 12,346 |
| $ | 13,458 |
| $ | 13,462 |
Investments in short-term time deposits | | 2 | | | 4,882 | | | 4,918 | | | - | | | - |
| 2 |
|
| 13,468 |
|
| 13,509 |
|
| 8,883 |
|
| 8,874 |
Liabilities: | | | | | | | | | | | | | | |
|
|
|
|
|
|
|
|
|
|
|
|
|
|
Short-term borrowings | | 2 | | | (150,000) | | | (150,000) | | | (2,430) | | | (2,430) | |
Long-term debt, excluding current portion | | 2 | | $ | (617,857) | | $ | (579,244) | | $ | (873,734) | | $ | (850,000) | |
Long-term debt | |
| 2 |
| $ | (928,618) |
| $ | (867,377) |
| $ | (1,094,987) |
| $ | (1,095,292) |
In fiscal years 2014 and 2013, Woodward received long-term notes from municipalities within the states of Illinois and Colorado in connection with certain economic incentives related to Woodward’s development of a second campus in the greater-Rockford, Illinois area for its Aerospace segment and Woodward’s development of a new campus at its corporate headquarters in Fort Collins, Colorado, Woodward received long-term notes from municipalities within the states of Illinois and Colorado. The fair value of the long-term notes was estimated based on a model that discounted future principal and interest payments received at an interest rate available to the Company at the end of the period for similarly rated municipal notes of similar maturity, which is a level 2 input as defined by the U.S. GAAP fair value hierarchy. The interest rates used to estimate the fair value of the long-term notes were 2.2%1.7% at September 30, 20162019 and 3.0%3.1% at September 30, 2015.2018.
From time to time, certain of Woodward’s foreign subsidiaries will invest excess cash in short-term time deposits with a fixed maturity date of longer than three months but less than one year from the date of the deposit. Woodward believes that the investments are with creditworthy financial institutions. The fair value of the investments in short-term time deposits was estimated based on a model that discounted future principal and interest payments to be received at an interest rate available to the foreign subsidiary entering into the investment for similar short-term time deposits of similar maturity. This iswas determined to be a level 2 input as defined by the U.S. GAAP fair value hierarchy. The interest raterates used to estimate the fair value of the short-term time deposits was 6.9%5.7% at September 30, 2016. There were no investments in short-term time deposits2019 and 6.3% at September 30, 2015. 2018.
The fair value of long-term debt was estimated based on a model that discounted future principal and interest payments at interest rates available to the Company at the end of the period for similar debt of the same maturity, which is a level 2 input as defined by the U.S. GAAP fair value hierarchy. The weighted-average interest rates used to estimate the fair value of long-term debt were 1.9%2.5% at September 30, 20162019 and 2.8%3.5% at September 30, 2015.2018.
Note 6.8. Derivative instruments and hedging activities
Derivative instruments not designated or qualifying as hedging instruments
On April 18, 2018, Woodward has exposures relatedentered into an at-the-money forward option at a cost of $5,543 (the “Forward Option”) whereby, on May 30, 2018, Woodward had the ability to global market risks, including the effectexercise its option to purchase €490,000 on June 1, 2018 using U.S. dollars at a fixed exchange rate of changes in interest rates, foreign currency exchange rates, changes in certain commodity prices and fluctuations in various producer indices. From time to time, Woodward enters1.2432. The Forward Option was entered into derivative instruments for risk management purposes only, including derivatives designated as accounting hedges and/or those utilized as economic hedges. Woodward uses interest rate related derivative instruments to manage itsWoodward’s exposure to fluctuations in the Euro prior to the anticipated close of interest rates.the L’Orange Agreement, which provided for payment in Euros. Woodward doesdid not enter into or issue derivativesthe Forward Option for trading or speculative purposes. As the spot rate was below 1.2432 on May 30, 2018, Woodward elected not to exercise the option and a loss of $5,543 was recognized on the Forward Option in “Other (income) expense, net” in the Consolidated Statements of Earnings in the fiscal year ended September 30, 2018. The Forward Option expired on June 1, 2018.
By using derivative and/or hedging instrumentsIn May 2018, Woodward entered into cross currency interest rate swap agreements that synthetically convert $167,420 of floating-rate debt under Woodward’s then existing revolving credit agreement to manage its risk exposure,Euro denominated floating-rate debt in conjunction with the L’Orange acquisition (the “Floating-Rate Cross Currency Swap”). Also in May 2018, Woodward is subject, from timeentered into cross currency interest rate swap agreements that synthetically convert an aggregate principal amount of $400,000 of fixed-rate debt associated with the 2018 Note Purchase Agreement (as defined in Note 14, Credit facilities short-term borrowings and long-term debt) to time, to credit riskEuro denominated fixed-rate debt (the “Fixed-Rate Cross Currency Swaps”). The cross currency interest rate swaps, which effectively reduce the interest rate on the underlying fixed and market risk on those derivative instruments. Credit risk arises from the potential failure of the counterparty to perform floating-rate debt
under the 2018 Notes (as defined in Note 14, Credit facilities short-term borrowings and long-term debt) and Woodward’s then existing revolving credit agreement, respectively, is recorded as a reduction to “Interest expense” in Woodward’s Consolidated Statements of Earnings.
Derivatives instruments in fair value hedging relationships
Concurrent with the entry into the Floating-Rate Cross Currency Swap, a corresponding Euro denominated intercompany loan receivable with identical terms and notional amount as the underlying Euro denominated floating-rate debt, with a reciprocal cross currency interest rate swap, was entered into by Woodward Barbados Financing SRL (“Barbados”), a wholly owned subsidiary of Woodward, and is designated as a fair value hedge under the criteria prescribed in ASC Topic 815, Derivatives and Hedging (“ASC 815”). The objective of the derivative and/instrument is to hedge against the foreign currency exchange risk attributable to the spot remeasurement of the Euro denominated intercompany loan.
Only the change in the fair value related to the cross currency basis spread, or hedging instrument. Whenexcluded component, of the derivative instrument is recognized in accumulated other comprehensive (losses) earnings (“accumulated OCI”). The remaining change in the fair value of athe derivative contractinstrument is positive,recognized in foreign currency transaction gain or loss included in “Selling, general and administrative expenses” in Woodward’s Consolidated Statements of Earnings. The change in the counterparty owes Woodward, which creates credit risk for Woodward. Woodward mitigates this credit risk by entering into transactions with only creditworthy counterparties. Market risk arises fromfair value of the potential adverse effectsderivative instrument in foreign currency transaction gain or loss offsets the change in the spot remeasurement of the intercompany Euro denominated loan. Hedge effectiveness is assessed based on the fair value changes of the derivative and/or hedginginstrument, after excluding any fair value changes related to the cross currency basis spread. The initial cost of the cross currency basis spread is recorded in earnings each period through the swap accrual process. There is no credit-risk-related contingent features associated with the floating-rate cross currency interest rate swap.
Derivative instruments that result from a change in interest rates, commodity prices, or foreign currency exchange rates. Woodward minimizes this market risk by establishing and monitoring parameters that limit the types and degree of market risk that may be undertaken.
Other than the cash flow hedges and net investment hedges discussed below, Woodward did not enter into any derivatives or hedging transactions during the fiscal years ended September 30, 2016, September 30, 2015 and September 30, 2014.
Derivatives in cash flow hedging relationships
In conjunction with the entry into the Fixed-Rate Cross Currency Swaps, 5 corresponding intercompany loans receivable, with identical terms and amounts of each tranche of the underlying aggregate principal amount of $400,000 of fixed-rate debt, and reciprocal cross currency interest rate swaps were entered into by Barbados, which are designated as cash flow hedges under the criteria prescribed in ASC 815. The objective of these derivative instruments is to hedge the risk of variability in cash flows attributable to the foreign currency exchange risk of cash flows for future principal and interest payments associated with the Euro denominated intercompany loans over a fifteen year period.
Changes in the fair values of the derivative instruments are recognized in accumulated OCI and reclassified to foreign currency transaction gain or loss included in “Selling, general and administrative expenses” in Woodward’s Consolidated Statements of Earnings. Reclassifications out of accumulated OCI of the change in fair value occur each reporting period based upon changes in the spot rate remeasurement of the Euro denominated intercompany loans, including associated interest. Hedge effectiveness is assessed based on the fair value changes of the derivative instruments and deemed to be highly effective in offsetting exposure to variability in foreign exchange rates. There are no credit-risk-related contingent features associated with these fixed-rate cross currency interest rate swaps.
In June 2013, in connection with Woodward’s expected refinancing of current maturities on its then existing long-term debt, Woodward entered into a treasury lock agreement with a notional amount of $25,000 that qualified as a cash flow hedge under ASC Topic 815, “Derivatives and Hedging.”815. The objective of this derivative instrument was to hedge the risk of variability in cash flows attributable to changes in the designated benchmark interest rate over a seven-yearseven year period related to the future principal and interest payments on a portion of anticipated future debt issuances. The treasury lock agreement was settledterminated in August 2013 and the resulting gain of $507 was recorded as a reduction to accumulated OCI, net of tax, and is being recognized as a reduction ofdecrease to interest expense over a seven-yearseven year period. The unrecognized portion of the gain is recorded in accumulated other comprehensive (losses) earnings, net of tax.
In March 2009, Woodward entered into LIBOR lock agreements that qualified as cash flow hedges under authoritative guidance for derivatives and hedging. The objective of this derivative instrument was to hedge the risk of variability in cash flows over a seven-year period related to future interest payments of a portion of anticipated future debt issuances attributable to changes in the designated benchmark interest rate associated with the then expected issuance of long-term debt to acquire HR Textron Inc. (“HRT”). The discontinuance of the LIBOR lock agreements resulted in a loss that was being recognized as an increase of interest expense over a seven-year period on the hedged Series E and F Notes, which were issued on April 3, 2009, using the effective interest method. The unrecognized portion of the loss was recorded in accumulated other comprehensive (losses) earnings, net of tax. The unrecognized portion of the loss was fully amortized to interest expense during the second quarter of fiscal year 2016, and as of September 30, 2016 there was no unrecognized loss associated with this cash flow hedge in Woodward’s Consolidated Balance Sheet.
In September 2008, the Company entered into treasury lock agreements that qualified as cash flow hedges under authoritative guidance for derivatives and hedging. The objective of this derivative instrument was to hedge the risk of variability in cash flows related to future interest payments of a portion of the anticipated future debt issuances attributable to changes in the designated benchmark interest rate associated with the expected issuance of long-term debt to acquire Techni-Core, Inc. (“Techni-Core”) and MPC Products Corporation (“MPC Products” and, together with Techni-Core, “MPC”). The discontinuance of these treasury lock agreements resulted in a gain that was being recognized as a reduction of interest expense over a seven-year period on the hedged Series C and D Notes, which were issued on October 1, 2008, using the effective interest method. The unrecognized portion of the gain was recorded in accumulated other comprehensive (losses) earnings, net of tax. The unrecognized portion of the gain was fully amortized to interest expense during the fourth quarter of fiscal year 2015, and as of September 30, 2015 there was no unrecognized gain associated with this cash flow hedge in Woodward’s Consolidated Balance Sheet.
The remaining unrecognized gains and losses in Woodward’s Consolidated Balance Sheets associated with derivative instruments that were previously entered into by Woodward, which are classified in accumulated other comprehensive (losses) earnings (“accumulated OCI”), were net gains of $290 as of September 30, 2016 and $269 as of September 30, 2015.
The following table discloses the impact of derivative instruments in cash flow hedging relationships on Woodward’s Consolidated Statements of Earnings, recognized in interest expense:
| | | | | | | | | |
| | | | | | | | | |
| | Year Ended September 30, |
| | 2016 | | 2015 | | 2014 |
Amount of (income) expense recognized in earnings on derivative | | $ | 21 | | $ | 99 | | $ | 99 |
Amount of (gain) loss recognized in accumulated OCI on derivative | | | - | | | - | | | - |
Amount of (gain) loss reclassified from accumulated OCI into earnings | | | 21 | | | 99 | | | 99 |
| | | | | | | | | |
Based on the carrying value of the realized but unrecognized gains on terminated derivative instruments designated as cash flow hedges as of September 30, 2016, Woodward expects to reclassify $72 of net unrecognized gains on terminated derivative instruments from accumulated other comprehensive (losses) earningsOCI to earnings during the next twelve months.
NetDerivatives instruments in net investment hedgeshedging relationships
On September 23, 2016, Woodward and Woodward International Holding B.V., a wholly owned subsidiary of Woodward organized under the laws of The Netherlands (the “BV Subsidiary”), each entered into a note purchase agreement (the “2016 Note Purchase Agreements”Agreement”) relating to the sale by Woodward and the BV Subsidiary of an aggregate principal amount of €160,000 of senior unsecured notes in a series of private placement transactions. Woodward issued €40,000 aggregate principal amount of Woodward’s Series M Senior Notes due September 23, 2026.2026 (the “Series M Notes”). Woodward designated the €40,000 Series M Notes as a hedge of a foreign currency exposure of Woodward’s net investment in its Euro denominated functional currency subsidiaries. A foreign exchange loss onRelated to the Series M Notes, of $47 is included in foreign currency translation adjustments within total comprehensive (losses) earnings are net foreign exchange gains of $2,682 for the fiscal year ended September 30, 2016.
In June 2015, Woodward designated an intercompany loan2019, compared to net foreign exchanges gains of 160,000 Renminbi (“RMB”) between two wholly owned subsidiaries as a hedge of a foreign currency exposure of$838 for the net investment of the borrower in the lender. In June 2016, the intercompany loan was repaid, resulting in a realized gain of $1,484 that was recognized within total comprehensive (losses) earnings, of which $912 was recognized in fiscal year 2016ended September 30, 2018 and $572 was recognized innet foreign exchange losses of $2,395 for the fiscal year 2015.ended September 30, 2017.
In July 2016, Woodward designated a newan intercompany loan of 160,000 RMB between two wholly owned subsidiaries as a hedge of a foreign currency exposure of the net investment of the borrower in the lender. Foreign exchange losses onIn July 2017, the intercompany loan was repaid, resulting in a realized gain of $73 for the three-months ended September 30, 2016 are included in foreign currency translation adjustments$380 that was recognized within total comprehensive (losses) earnings. earnings, of which a gain of $453 was recognized in fiscal year 2017.
Impact of derivative instruments designated as qualifying hedging instruments
The following table discloses the impact of derivative instruments designated as qualifying hedging instruments on Woodward’s Consolidated Statements of Earnings:
|
|
|
|
|
|
|
|
|
|
|
|
|
|
|
|
|
|
|
|
|
|
|
|
|
|
|
| Year ended September 30, 2019 |
Derivatives in: |
| Location |
| Amount of (Income) Expense Recognized in Earnings on Derivative |
| Amount of (Gain) Loss Recognized in Accumulated OCI on Derivative |
| Amount of (Gain) Loss Reclassified from Accumulated OCI into Earnings |
Cross currency interest rate swap agreement designated as fair value hedges |
| Selling, general and administrative expenses |
| $ | (9,394) |
| $ | (8,317) |
| $ | (8,356) |
Cross currency interest rate swap agreements designated as cash flow hedges |
| Selling, general and administrative expenses |
|
| (23,018) |
|
| (39,442) |
|
| (23,018) |
Treasury lock agreement designated as cash flow hedge |
| Interest expense |
|
| (72) |
|
| - |
|
| (72) |
|
|
|
| $ | (32,484) |
| $ | (47,759) |
| $ | (31,446) |
|
|
|
|
|
|
|
|
|
|
|
|
|
|
|
| Year ended September 30, 2018 |
Derivatives in: |
| Location |
| Amount of (Income) Expense Recognized in Earnings on Derivative |
| Amount of (Gain) Loss Recognized in Accumulated OCI on Derivative |
| Amount of (Gain) Loss Reclassified from Accumulated OCI into Earnings |
Cross currency interest rate swap agreement designated as fair value hedges |
| Selling, general and administrative expenses |
| $ | 472 |
| $ | 1,034 |
| $ | 472 |
Cross currency interest rate swap agreements designated as cash flow hedges |
| Selling, general and administrative expenses |
|
| 1,067 |
|
| 21,966 |
|
| 1,067 |
Treasury lock agreement designated as cash flow hedge |
| Interest expense |
|
| (72) |
|
| - |
|
| (72) |
|
|
|
| $ | 1,467 |
| $ | 23,000 |
| $ | 1,467 |
|
|
|
|
|
|
|
|
|
|
|
|
|
|
|
| Year ended September 30, 2017 |
Derivatives in: |
| Location |
| Amount of (Income) Expense Recognized in Earnings on Derivative |
| Amount of (Gain) Loss Recognized in Accumulated OCI on Derivative |
| Amount of (Gain) Loss Reclassified from Accumulated OCI into Earnings |
Cross currency interest rate swap agreement designated as fair value hedges |
| Selling, general and administrative expenses |
| $ | - |
| $ | - |
| $ | - |
Cross currency interest rate swap agreements designated as cash flow hedges |
| Selling, general and administrative expenses |
|
| - |
|
| - |
|
| - |
Treasury lock agreement designated as cash flow hedge |
| Interest expense |
|
| (72) |
|
| - |
|
| (72) |
|
|
|
| $ | (72) |
| $ | - |
| $ | (72) |
The remaining unrecognized gains and losses in Woodward’s Consolidated Balance Sheets associated with derivative instruments that were previously entered into by Woodward, which are classified in accumulated OCI were net gains of $5,004 as of September 30, 2019 and net losses of $21,315 as of September 30, 2018.
Note 7.9. Supplemental statement of cash flows information
| | | | | | |
|
|
|
|
|
|
| | | | |
|
|
|
|
| | Year Ended September 30, |
| Year Ended September 30, |
| | 2016 | | 2015 | | 2014 |
| 2019 |
| 2018 |
| 2017 |
Interest paid, net of amounts capitalized | | $ | 34,500 | | $ | 32,608 | | $ | 27,922 |
| $ | 39,909 |
| $ | 29,677 |
| $ | 27,752 |
Income taxes paid | | 99,468 | | 51,218 | | 66,477 |
|
| 68,112 |
| 44,831 |
| 33,926 |
Income tax refunds received | | 2,350 | | 689 | | 2,303 |
|
| 1,454 |
| 1,976 |
| 997 |
Non-cash activities: | | | | | | |
|
|
|
|
|
|
|
Purchases of property, plant and equipment on account | | 10,705 | | 23,966 | | 13,437 |
|
| 8,737 |
| 11,982 |
| 17,327 |
Property, plant and equipment acquired by capital lease | | 1,653 | | - | | - | |
Common shares issued from treasury to settle benefit plan obligations (Note 18) | | 13,999 | | 12,574 | | | 11,193 | |
Notes receivable from municipalities for economic development initiatives | | - | | - | | | 6,596 | |
Impact of the adoption of ASC 606 (Note 3) | |
| 38,700 |
| - |
| - |
Impact of the adoption of ASU 2016-16 (Note 2) | |
| 1,005 |
| - |
| - |
Common shares issued from treasury to settle employee liabilities | |
| - |
| - |
| 1,767 |
Common shares issued from treasury to settle benefit obligations (Note 20) | |
| 14,846 |
| 14,741 |
|
| 14,014 |
Cashless exercise of stock options | | 753 | | 1,532 | | | 1,286 |
| - |
| - |
|
| 1,473 |
Note 10. Inventories
|
|
|
|
|
|
|
|
|
|
|
|
|
|
|
| September 30, |
| September 30, |
|
| 2019 |
| 2018 |
Raw materials |
| $ | 134,878 |
| $ | 80,999 |
Work in progress |
|
| 133,885 |
|
| 118,010 |
Component parts (1) |
|
| 287,128 |
|
| 298,820 |
Finished goods |
|
| 59,051 |
|
| 51,767 |
Customer supplied inventory (2) |
|
| 13,396 |
|
| - |
On-hand inventory for which control has transferred to the customer (2) |
|
| (111,502) |
|
| - |
|
| $ | 516,836 |
| $ | 549,596 |
(1)Component parts include items that can be sold separately as finished goods or included in the manufacture of other products.
(2)On October 1, 2018, the Company adopted ASC 606, which resulted in the recording of certain customer supplied inventory and the reduction of certain on-hand inventory for which control has transferred to the customer. Refer to Note 8. Inventories3, Revenue, for further details.
| | | | | | |
| | | | | | |
| | September 30, | | September 30, |
| | 2016 | | 2015 |
Raw materials | | $ | 54,246 | | $ | 63,896 |
Work in progress | | | 109,756 | | | 91,501 |
Component parts (1) | | | 249,307 | | | 248,047 |
Finished goods | | | 48,374 | | | 44,220 |
| | $ | 461,683 | | $ | 447,664 |
| (1)
| | Component parts include items that can be sold separately as finished goods or included in the manufacture of other products.
|
Note 9.11. Property, plant, and equipment
| | | | |
|
|
|
|
| | | | |
|
|
|
|
| | September 30, | | September 30, |
| September 30, |
| September 30, |
| | 2016 | | 2015 |
| 2019 |
| 2018 |
Land and land improvements | | $ | 87,696 | | $ | 79,311 |
| $ | 94,976 |
| $ | 94,146 |
Buildings and building improvements | | 527,704 | | 372,160 |
|
| 587,541 |
| 565,065 |
Leasehold improvements | | 15,213 | | 16,907 |
|
| 17,446 |
| 17,954 |
Machinery and production equipment | | 484,315 | | 365,040 |
|
| 731,159 |
| 668,986 |
Computer equipment and software | | 117,984 | | 118,154 |
|
| 124,201 |
| 124,788 |
Office furniture and equipment | | 29,344 | | 20,939 |
| 39,934 |
| 31,533 |
Other | | 18,969 | | 18,325 |
|
| 19,346 |
| 19,366 |
Construction in progress | | | 88,909 | | | 252,763 |
|
| 57,624 |
|
| 103,036 |
| | | 1,370,134 | | | 1,243,599 |
|
| 1,672,227 |
|
| 1,624,874 |
Less accumulated depreciation | | | (493,784) | | | (487,499) |
|
| (613,452) |
|
| (564,869) |
Property, plant and equipment, net | | $ | 876,350 | | $ | 756,100 | |
Property, plant, and equipment, net | |
| $ | 1,058,775 |
| $ | 1,060,005 |
IncludedIn fiscal year 2018, the Company announced its decision to relocate its Duarte, California operations to the Company’s newly renovated Drake Campus in Fort Collins, Colorado, and in fiscal year 2019, Woodward finalized the relocation. There are currently no operations in the Duarte, California facility, and the sale of the plant and related property is expected to close by March 31, 2020. The carrying value of the assets at the Duarte facility was $7,769 as of September 30, 2019, all of which the Company identified as assets held for sale as of that date. At September 30, 2018, the Company identified assets held for sale of $8,306. The majority of the assets held for sale are included in “Land and land improvements” and “Buildings and buildings improvements” arewhich relate to the land, building and building improvements, and other assets at the Duarte
facility. The assets held for sale of $681 at September 30, 2015 related to Woodward’s Industrial segment. The sale of these assets was completed on April 15, 2016.
During the quarter ended September 30, 2014, Woodward recorded an impairment charge of $3,138, which isare included in cost of goods sold inunallocated corporate property, plant and equipment. Based on current market conditions, the Consolidated Statement of Earnings, relatedCompany expects to record a gain on the write down to fair value of certain assets held for sale. During the quarter ended March 31, 2015, Woodward completed theeventual sale of these assets.
AtThe Company assessed whether the decision to relocate from its Duarte facility could indicate a potential impairment of the assets at the Duarte facility and concluded that the assets were not impaired as of September 30, 2016, included2019.
Included in “Construction in progress” are costs of $21,195 at September 30, 2019 and $32,248 at September 30, 2018 associated with new equipment purchases for the greater-Rockford, Illinois campus and costs of $239 at September 30, 2019 and $3,967 at September 30, 2018 associated with new equipment purchases and the renovation of the Drake Campus.
Included in “Office furniture and equipment” and “Other” is $1,653$1,562 at September 30, 2019 and $1,650 at September 30, 2018, of gross assets acquired on capital leases, and accumulated depreciation included $322$1,483 at September 30, 2019 and $1,158 at September 30, 2018 of amortization associated with the capital lease assets.
In fiscal year 2015, Woodward completed and placed into service a manufacturing and office building on a second campus in the greater-Rockford, Illinois area and has occupied the new facility in anticipation of beginning serial production of new narrow-body product lines beginning in fiscal year 2017 for its Aerospace segment. This campus is intended to support Woodward’s expected growth in its Aerospace segment over the next ten years and beyond, required as a result of Woodward being awarded a substantial number of new system platforms, particularly on narrow-body aircraft. Included in “Construction in progress” are costs of $26,741 at September 30, 2016 and $47,629 at September 30, 2015 associated with new equipment purchases for the second campus, including capitalized interest of $341 at September 30, 2016 and $499 at September 30, 2015.
During fiscal year 2016, Woodward completed and placed into service a new campus at its corporate headquarters in Fort Collins, Colorado to support the future growth of its Industrial segment by supplementing its existing Colorado manufacturing facilities and corporate headquarters. Woodward began occupying the new campus during its second quarter of fiscal year 2016. Approximately $160,000 of assets were placed in service during the nine-months ended September 30, 2016, and were recorded to “Buildings and building improvements.” Included in “Construction in progress” are $247 at
September 30, 2016 and $151,669 at September 30, 2015 associated with the construction of the new campus and related new equipment purchases, including capitalized interest of $0 at September 30, 2016 and $5,205 at September 30, 2015.
Concurrent with and in relation to Woodward’s significant investment in three new campuses and related equipment in the greater-Rockford, Illinois area, the new campus at its corporate headquarters in Fort Collins, Colorado (both discussed above), and the new campus in Niles, Illinois that was completed in fiscal year 2015, Woodward initiated a comprehensive review of its depreciation lives as required by U.S. GAAP to evaluate the estimates of the useful lives of Woodward assets. This review resulted in estimates of the useful lives of both existing and new assets generally in excess of those utilized prior to fiscal year 2016. The revised estimates were used in fiscal year 2016 and will be used going forward and result in a downward adjustment of depreciation on existing assets of approximately $12,000 for fiscal year 2016.
For the fiscal years ended September 30, 2016, 2015,2019, 2018, and 2014,2017, Woodward had depreciation expense as follows:
| | | | | | | | | |
| | | | | | | | | |
| | Year Ended September 30, |
| | 2016 | | 2015 | | 2014 |
Depreciation expense | | $ | 41,550 | | $ | 45,994 | | $ | 43,773 |
|
|
|
|
|
|
|
|
|
|
|
|
|
|
|
|
|
|
|
|
|
| Year Ended September 30, |
|
| 2019 |
| 2018 |
| 2017 |
Depreciation expense |
| $ | 85,982 |
| $ | 71,389 |
| $ | 55,140 |
For the fiscal years ended September 30, 2016, 2015,2019, 2018, and 2014,2017, Woodward capitalized interest that would have otherwise been included in interest expense of the following:
| | | | | | | | | |
| | | | | | | | | |
| | Year Ended September 30, |
| | 2016 | | 2015 | | 2014 |
Capitalized interest | | $ | 5,455 | | $ | 8,995 | | $ | 7,282 |
|
|
|
|
|
|
|
|
|
|
|
|
|
|
|
|
|
|
|
|
|
| Year Ended September 30, |
|
| 2019 |
| 2018 |
| 2017 |
Capitalized interest |
| $ | 779 |
| $ | 2,187 |
| $ | 2,008 |
Note 12. Goodwill
|
|
|
|
|
|
|
|
|
|
|
|
|
|
|
|
|
|
|
|
|
|
|
|
|
|
|
| September 30, 2018 |
| Additions |
| Effects of Foreign Currency Translation |
| September 30, 2019 |
Aerospace |
| $ | 455,423 |
| $ | - |
| $ | - |
| $ | 455,423 |
Industrial |
|
| 357,827 |
|
| - |
|
| (15,397) |
|
| 342,430 |
Consolidated |
| $ | 813,250 |
| $ | - |
| $ | (15,397) |
| $ | 797,853 |
|
|
|
|
|
|
|
|
|
|
|
|
|
|
| September 30, 2017 |
| Additions |
| Effects of Foreign Currency Translation |
| September 30, 2018 |
Aerospace |
| $ | 455,423 |
| $ | - |
| $ | - |
| $ | 455,423 |
Industrial |
|
| 101,122 |
|
| 257,447 |
|
| (742) |
|
| 357,827 |
Consolidated |
| $ | 556,545 |
| $ | 257,447 |
| $ | (742) |
| $ | 813,250 |
On June 1, 2018, Woodward completed the acquisition of L’Orange (see Note 5, Business acquisition), which resulted in the recognition of $257,447 in goodwill in the Company’s Industrial segment.
Note 10. Goodwill
| | | | | | | | | |
| | | | | | | | | |
| | September 30, 2015 | | Effects of Foreign Currency Translation | | September 30, 2016 |
Aerospace | | $ | 455,423 | | $ | - | | $ | 455,423 |
Industrial | | | 101,554 | | | (1,293) | | | 100,261 |
Consolidated | | $ | 556,977 | | $ | (1,293) | | $ | 555,684 |
| | | | | | | | | |
| | September 30, 2014 | | Effects of Foreign Currency Translation | | September 30, 2015 |
Aerospace | | $ | 455,423 | | $ | - | | $ | 455,423 |
Industrial | | | 104,301 | | | (2,747) | | | 101,554 |
Consolidated | | $ | 559,724 | | $ | (2,747) | | $ | 556,977 |
Woodward tests goodwill for impairment at the reporting unit level on an annual basis and more often ifor at any time there is an event occurs or circumstances change that would more likely than not reduce the fair value of a reporting unit below its carrying amount.indication goodwill may be impaired, commonly referred to as triggering events. Woodward completed its annual goodwill impairment test as of July 31, 20162019 during the quarter ended September 30, 2016.2019. At that date, Woodward determined it was appropriate to aggregate certain components of the same operating segment into a single reporting unit. The fair value of each of Woodward’s reporting units was determined using a discounted cash flow method. This method represents a level 3 input and incorporates various estimates and assumptions, the most significant being projected revenue growth rates, earnings margins, future tax rates, and the present value, based on an estimated weighted-average cost of capital (or the discount rate) and terminal growth rate, of forecasted cash flows. Management projects revenue growth rates, earnings margins and cash flows based on each reporting unit’s current operational results, expected performance and operational strategies over a ten-year period. These projections are adjusted to reflect current economic conditions and demand for certain products, and require considerable management judgment.
Forecasted cash flows used in the July 31, 20162019 impairment test were discounted using weighted-average cost of capital assumptions ranging from 8.91%9.35% to 11.49%17.41%. The terminal values of the forecasted cash flows were calculated using the Gordon Growth Model and assumed an annual compound growth rate after ten years of 3.71%3.39%. These inputs, which are
unobservable in the market, represent management’s best estimate of what market participants would use in determining the present value of the Company’s forecasted cash flows. Changes in these estimates and assumptions can have a significant impact on the fair value of forecasted cash flows. Woodward evaluated the reasonableness of the reporting units’ resulting fair values utilizing a market multiple method.
As discussed at Note 21, Commitments and contingencies, on April 9, 2019, German wind turbine manufacturer, Senvion GmbH (“Senvion”), a significant customer of Woodward’s renewables business, announced that it filed for self-administration insolvency proceedings. In conjunction with this, during the three-months ended June 30, 2019, Woodward determined that this action by Senvion represented a triggering event requiring an interim goodwill impairment test of its renewable power systems reporting unit. Based on the results of this interim impairment test, Woodward determined the renewable power systems reporting unit’s goodwill was not impaired as of June 30, 2019.
The results of Woodward’s goodwill impairment tests performed as of July 31, 20162019 did not indicate impairment of any of Woodward’s reporting units. As of the July 31, 2019 goodwill impairment test, the reporting unit with the closest ratio of estimated fair value to carrying value was our renewable power systems reporting unit, due primarily to the loss of Senvion as a customer. Woodward’s July 31, 2019 goodwill analysis indicated a premium of approximately 20% compared to the renewable power system’s carrying value. Woodward is not aware of any facts, circumstances or triggering events that have arisen indicating that goodwill has been impaired or that the premium of approximately 20% has changed significantly since Woodward’s July 31, 2019 analysis.
Note 11.13. Intangible assets, net
| | | | | | | | | | | | |
|
|
|
|
|
|
|
|
|
|
|
|
|
| | | | | | | | | | | | |
|
|
|
|
|
|
|
|
|
|
|
|
|
| September 30, 2016 | | September 30, 2015 | September 30, 2019 |
| September 30, 2018 |
| Gross Carrying Value | | Accumulated Amortization | | Net Carrying Amount | | Gross Carrying Value | | Accumulated Amortization | | Net Carrying Amount | Gross Carrying Value |
| Accumulated Amortization |
| Net Carrying Amount |
| Gross Carrying Value |
| Accumulated Amortization |
| Net Carrying Amount |
Intangible assets with finite lives: | |
|
|
|
|
|
|
|
|
|
|
|
|
|
|
|
|
|
Customer relationships and contracts: | | | | | | | | | | | | | | | | | |
|
|
|
|
|
|
|
|
|
|
|
|
|
|
|
|
|
Aerospace | $ | 282,225 | | $ | (134,158) | | $ | 148,067 | | $ | 282,225 | | $ | (116,232) | | $ | 165,993 | $ | 281,683 |
| $ | (181,995) |
| $ | 99,688 |
| $ | 281,683 |
| $ | (166,719) |
| $ | 114,964 |
Industrial | | 40,969 | | | (33,509) | | | 7,460 | | | 41,409 | | | (32,891) | | | 8,518 |
| 407,683 |
|
| (43,986) |
|
| 363,697 |
|
| 429,880 |
|
| (35,856) |
|
| 394,024 |
Total | $ | 323,194 | | $ | (167,667) | | $ | 155,527 | | $ | 323,634 | | $ | (149,123) | | $ | 174,511 | $ | 689,366 |
| $ | (225,981) |
| $ | 463,385 |
| $ | 711,563 |
| $ | (202,575) |
| $ | 508,988 |
| | | | | | | | | | | | | | | | | |
|
|
|
|
|
|
|
|
|
|
|
|
|
|
|
|
|
Intellectual property: | | | | | | | | | | | | |
|
|
|
|
|
|
|
|
|
|
|
|
|
|
|
|
|
Aerospace | $ | - | | $ | - | | $ | - | | $ | - | | $ | - | | $ | - | $ | - |
| $ | - |
| $ | - |
| $ | - |
| $ | - |
| $ | - |
Industrial | | 19,435 | | | (17,876) | | | 1,559 | | | 19,445 | | | (16,921) | | | 2,524 |
| 19,201 |
|
| (18,705) |
|
| 496 |
|
| 19,448 |
|
| (18,587) |
|
| 861 |
Total | $ | 19,435 | | $ | (17,876) | | $ | 1,559 | | $ | 19,445 | | $ | (16,921) | | $ | 2,524 | $ | 19,201 |
| $ | (18,705) |
| $ | 496 |
| $ | 19,448 |
| $ | (18,587) |
| $ | 861 |
| | | | | | | | | | | | | | | | | |
|
|
|
|
|
|
|
|
|
|
|
|
|
|
|
|
|
Process technology: | | | | | | | | | | | | |
|
|
|
|
|
|
|
|
|
|
|
|
|
|
|
|
|
Aerospace | $ | 76,605 | | $ | (43,229) | | $ | 33,376 | | $ | 76,605 | | $ | (37,411) | | $ | 39,194 | $ | 76,371 |
| $ | (59,913) |
| $ | 16,458 |
| $ | 76,372 |
| $ | (54,874) |
| $ | 21,498 |
Industrial | | 22,965 | | | (16,200) | | | 6,765 | | | 22,924 | | | (14,621) | | | 8,303 |
| 92,820 |
|
| (24,926) |
|
| 67,894 |
|
| 97,154 |
|
| (20,373) |
|
| 76,781 |
Total | $ | 99,570 | | $ | (59,429) | | $ | 40,141 | | $ | 99,529 | | $ | (52,032) | | $ | 47,497 | $ | 169,191 |
| $ | (84,839) |
| $ | 84,352 |
| $ | 173,526 |
| $ | (75,247) |
| $ | 98,279 |
| | | | | | | | | | | | | | | | | |
|
|
|
|
|
|
|
|
|
|
|
|
|
|
|
|
|
Backlog: | |
|
|
|
|
|
|
|
|
|
|
|
|
|
|
|
|
|
Aerospace | | $ | - |
| $ | - |
| $ | - |
| $ | - |
| $ | - |
| $ | - |
Industrial | |
| 40,500 |
|
| (40,500) |
|
| - |
|
| 42,955 |
|
| (18,006) |
|
| 24,949 |
Total | | $ | 40,500 |
| $ | (40,500) |
| $ | - |
| $ | 42,955 |
| $ | (18,006) |
| $ | 24,949 |
| |
|
|
|
|
|
|
|
|
|
|
|
|
|
|
|
|
|
Other intangibles: | | | | | | | | | | | | |
|
|
|
|
|
|
|
|
|
|
|
|
|
|
|
|
|
Aerospace | | $ | - |
| $ | - |
| $ | - |
| $ | - |
| $ | - |
| $ | - |
Industrial | |
| 1,541 |
|
| (1,249) |
|
| 292 |
|
| 1,629 |
|
| (1,158) |
|
| 471 |
Total | | $ | 1,541 |
| $ | (1,249) |
| $ | 292 |
| $ | 1,629 |
| $ | (1,158) |
| $ | 471 |
| |
|
|
|
|
|
|
|
|
|
|
|
|
|
|
|
|
|
Intangible asset with indefinite life: | |
|
|
|
|
|
|
|
|
|
|
|
|
|
Tradename: | |
|
|
|
|
|
|
|
|
|
|
|
|
|
|
|
|
|
Aerospace | $ | - | | $ | - | | $ | - | | $ | 1,400 | | $ | (1,300) | | $ | 100 | $ | - |
| $ | - |
| $ | - |
| $ | - |
| $ | - |
| $ | - |
Industrial | | 1,246 | | | (823) | | | 423 | | | 1,248 | | | (742) | | | 506 |
| 63,467 |
|
| - |
|
| 63,467 |
|
| 67,335 |
|
| - |
|
| 67,335 |
Total | $ | 1,246 | | $ | (823) | | $ | 423 | | $ | 2,648 | | $ | (2,042) | | $ | 606 | $ | 63,467 |
| $ | - |
| $ | 63,467 |
| $ | 67,335 |
| $ | - |
| $ | 67,335 |
| | | | | | | | | | | | | | | | | |
|
|
|
|
|
|
|
|
|
|
|
|
|
|
|
|
|
Total intangibles: | | | | | | | | | | | | |
|
|
|
|
|
|
|
|
|
|
|
|
|
|
|
|
|
Aerospace | $ | 358,830 | | $ | (177,387) | | $ | 181,443 | | $ | 360,230 | | $ | (154,943) | | $ | 205,287 | $ | 358,054 |
| $ | (241,908) |
| $ | 116,146 |
| $ | 358,055 |
| $ | (221,593) |
| $ | 136,462 |
Industrial | | 84,615 | | | (68,408) | | | 16,207 | | | 85,026 | | | (65,175) | | | 19,851 |
| 625,212 |
|
| (129,366) |
|
| 495,846 |
|
| 658,401 |
|
| (93,980) |
|
| 564,421 |
Consolidated Total | $ | 443,445 | | $ | (245,795) | | $ | 197,650 | | $ | 445,256 | | $ | (220,118) | | $ | 225,138 | $ | 983,266 |
| $ | (371,274) |
| $ | 611,992 |
| $ | 1,016,456 |
| $ | (315,573) |
| $ | 700,883 |
Indefinite lived intangible assets
The Woodward L’Orange tradename intangible asset is tested for impairment on an annual basis and more often if an event occurs or circumstances change that indicate the fair value of the Woodward L’Orange intangible asset may be below its carrying amount. The impairment test consists of comparing the fair value of the Woodward L’Orange tradename intangible asset, determined using discounted cash flows based on the relief from royalty method under the income approach, with its carrying amount. If the carrying amount of the Woodward L’Orange tradename intangible asset exceeds its fair value, an impairment loss would be recognized to reduce the carrying amount to its fair value. Woodward has not recorded any impairment charges for this asset.
During the fourth quarter, Woodward completed its annual impairment test of the Woodward L’Orange tradename intangible asset as of July 31, 2019 for the fiscal year ended September 30, 2019. The fair value of the Woodward L’Orange tradename intangible assets was determined using discounted cash flows based on the relief from royalty method under the income approach. This method represents a Level 3 input (based upon a fair value hierarchy established by U.S. GAAP) and incorporates various estimates and assumptions, the most significant being projected revenue growth rates, royalty rates, future tax rates and the present value, based on an estimated weighted-average cost of capital (or the discount rate) and terminal growth rate, of the forecasted cash flow. Management projects revenue growth rates and cash flows based on Woodward L’Orange’s current operational results, expected performance and operational strategies over a ten-year period.
These projections are adjusted to reflect current economic conditions and demand for certain products, and require considerable management judgment.
The forecasted cash flow used in the July 31, 2019 impairment test was discounted using weighted-average cost of capital assumption of 10.44%. The terminal value of the forecasted cash flow was calculated using the Gordon Growth Model and assumed an annual compound growth rate after ten years of 3.39%. These inputs, which are unobservable in the market, represent management’s best estimate of what market participants would use in determining the present value of the Company’s forecasted cash flows. Changes in these estimates and assumptions can have a significant impact on the fair value of the forecasted cash flow. The results of impairment test performed as of July 31, 2019 indicated the estimated fair value of the Woodward L’Orange tradename intangible asset was in excess of its carrying value, and accordingly, no impairment existed.
Finite lived intangible assets
For the fiscal years ended September 30, 2016, September 30, 2015,2019, 2018, and September 30, 2014,2017, Woodward recorded amortization expense associated with intangibles of the following:
| | | | | | | | |
| | | | | | | | |
| Year Ended September 30, |
| 2016 | | 2015 | | 2014 |
Amortization expense | $ | 27,486 | | $ | 29,241 | | $ | 33,580 |
|
|
|
|
|
|
|
|
|
|
|
|
|
|
|
|
|
|
| Year Ended September 30, |
| 2019 |
| 2018 |
| 2017 |
Amortization expense | $ | 56,022 |
| $ | 44,742 |
| $ | 25,777 |
Future amortization expense associated with intangibles is expected to be:
| | | | |
|
|
|
|
| | | | |
|
|
|
|
Year Ending September 30: | | | | |
|
|
|
|
2017 | | | | $ | 25,808 | |
2018 | | | | 24,984 | |
2019 | | | | 23,148 | |
2020 | | | | 20,360 |
|
|
| $ | 39,713 |
2021 | | | | 18,399 |
|
|
| 40,649 |
2022 | |
|
|
| 38,451 |
2023 | |
|
|
| 37,393 |
2024 | |
|
|
| 33,616 |
Thereafter | | | | | 84,951 |
|
|
|
| 358,703 |
| | | | $ | 197,650 |
|
|
| $ | 548,525 |
Note 12.14. Credit facilities, short-term borrowings and long-term debt
As of September 30, 2016,2019, Woodward’s short-term borrowings and availability under its various short-term credit facilities follows:
| | | | | | | | |
|
|
|
|
|
|
|
|
| | | | | | | | |
|
|
|
|
|
|
|
|
| Total availability | | Outstanding letters of credit and guarantees | | Outstanding borrowings | | Remaining availability | Total availability |
| Outstanding letters of credit and guarantees |
| Outstanding borrowings |
| Remaining availability |
Revolving credit facility | $ | 1,000,000 | | $ | (7,830) | | $ | (156,700) | | $ | 835,470 | $ | 1,000,000 |
| $ | (10,978) |
| $ | (262,297) |
| $ | 726,725 |
Foreign lines of credit and overdraft facilities | | 44,001 | | - | | - | | 44,001 |
| 7,571 |
| - |
| - |
|
| 7,571 |
Foreign performance guarantee facilities | | 8,567 | | | (243) | | | - | | | 8,324 |
| 496 |
|
| (264) |
|
| - |
|
| 232 |
| $ | 1,052,568 | | $ | (8,073) | | $ | (156,700) | | $ | 887,795 | $ | 1,008,067 |
| $ | (11,242) |
| $ | (262,297) |
| $ | 734,528 |
Revolving credit facility
Woodward maintains a $1,000,000 revolving credit facility established under a revolving credit agreement among Woodward, a syndicate of lenders and Wells Fargo Bank, National Association, as administrative agent (the “Revolving Credit Agreement”). The Revolving Credit Agreement providesprovided for the option to increase available borrowings to up to $1,200,000, subject to lenders’ participation. Borrowings underOn June 19, 2019, Woodward amended the Revolving Credit Agreement (the “Amended and Restated Revolving Credit Agreement”) to, among other things, (i) increase the option to increase available borrowings from $1,200,000 to $1,500,000, (ii) continue the commitments of the lenders thereunder to make revolving loans in an aggregate principal amount of up to $1,000,000, or $1,500,000 subject to lenders’ participation, (iii) extend the termination date of the revolving loan commitments of all the lenders from April 28, 2020 to June 19, 2024, and (iv) subject to conforming changes to the Company’s existing note purchase agreements, modify the definition of “EBITDA” to add-back acquisition related transaction costs associated with permitted acquisitions and increase the minimum consolidated net worth covenant from $800,000 to $1,156,000 plus (a) 50% of Woodward’s positive net income for the prior fiscal year and (b) 50% of Woodward’s net cash proceeds resulting from certain issuances of stock, subject to certain adjustments. Borrowings under the Amended and Restated Revolving Credit Agreement can be made by Woodward and certain of its foreign subsidiaries in
U.S. dollars or in foreign currencies other than the U.S. dollar and generally bear interest at LIBOR plus 0.85%0.875% to 1.65%1.75%. The Revolving Credit Agreement matures in April 2020. Under the Amended and Restated Revolving Credit Agreement, there were $156,700$262,297 in principal amount of borrowings outstanding as of September 30, 2016,2019, at an effective interest rate of 1.77%3.01%. Under the prior Revolving Credit Agreement, there were $350,000$266,541 in principal amount of borrowings outstanding as of September 30, 2015,2018, at an effective interest rate of 1.44%3.48%. As of September 30, 2016, $150,000 of the borrowings under the Revolving Credit Agreement were classified as short-term based on Woodward’s intent
The Amended and ability to pay this amount in the next twelve months. As of September 30, 2015, the entire outstanding balance on the Revolving Credit Agreement was classified as long-term debt.
TheRestated Revolving Credit Agreement contains certain covenants customary with such agreements, which are generally consistent with the covenants applicable to Woodward’s long-term debt agreements as well as the preceding Revolving Credit Agreement, and contains customary events of default, including certain cross default provisions related to Woodward’s other outstanding debt arrangements in excess of $60,000, the occurrence of which would permit the lenders to accelerate the amounts due thereunder. In addition, the Amended and Restated Revolving Credit Agreement includes the following financial covenants: (i) a maximum permitted leverage ratio of consolidated net debt to consolidated earnings before interest, taxes, depreciation, stock-based compensation, and amortization, plus any usual non-cash charges to the extent deducted in computing net income and transaction costs associated with permitted acquisitions (incurred within six-months of the permitted acquisition), minus any usual non-cash gains to the extent added in computing net income (“Leverage Ratio”) for Woodward and its consolidated subsidiaries of 3.5 to 1.0, which ratio, subject to certain restrictions, may increase to 4.0 to 1.0 for the fiscal quarter (and the immediately following fiscal quarter)each period of four consecutive quarters during which a permitted acquisition occurs, and to 3.75 to 1.0 for the following two succeeding fiscal quarters, and (ii) a minimum consolidated net worth of $800,000$1,156,000 plus (a) 50% of Woodward’s positive net income for the prior fiscal year and (b) 50% of Woodward’s net cash proceeds resulting from certain issuances of stock, subject to certain adjustments.
Woodward’s obligations under the Amended and Restated Revolving Credit Agreement are guaranteed by Woodward FST, Inc., Woodward MPC, Inc., and Woodward HRT, Inc., each of which is a wholly owned subsidiary of Woodward.
Short-term borrowings
A Chinese subsidiaryAs of Woodward has a local uncommitted credit facility withSeptember 30, 2019, $220,000 of the Hong Kong and Shanghai Banking Company under which it has the ability to borrow up to either $22,700, or the local currency equivalent of $22,700. Any cash borrowings under the local Chinese credit facility are secured by a parent guarantee from Woodward. The Chinese subsidiary may utilize the local facility for cashAmended and Restated Revolving Credit Agreement were classified as short-term borrowings, to support its operating cash needs. Local currency borrowings on the Chinese credit facility are charged interest at the prevailing interest rate offered by the People’s Bankand as of China on the date of borrowing, plus a margin equal to 15% of that prevailing rate. U.S. dollar borrowings on the credit facility are charged interest at the lender’s cost of borrowing rate at the date of borrowing, plus 3%. The local credit facility expires in November 2016. The Chinese subsidiary had no outstanding cash borrowings against the local credit facility at September 30, 2016 and September 30, 2015.
A Brazilian subsidiary2018, $150,000 of Woodward has a local uncommitted credit facility with the Banco J.P. Morgan S.A. under which it has the ability to borrow up to 52,000 Brazilian Real. Any cash borrowings under the local Brazilian credit facility are secured by a parent guarantee from Woodward. The Brazilian subsidiary may utilizeRevolving Credit Agreement were classified as short-term borrowings based on Woodward’s intent and ability to pay this amount in the local facility to support its operating cash needs. Local currencynext twelve months.
Short-term borrowings on the Brazilian credit facility are charged interest at the lender’s cost of borrowing rate at the date of borrowing, plus 1.75%. The local credit facility expires on January 16, 2017. The Brazilian
subsidiary had no outstanding cash borrowings at September 30, 2016 and $2,430 of outstanding cash borrowings at September 30, 2015 against the local credit facility.
Woodward also has other foreign lines of credit and foreign overdraft facilities at various financial institutions, which are generally reviewed annually for renewal and are subject to the usual terms and conditions applied by the financial institutions. Pursuant to the terms of the related facility agreements, Woodward’s foreign performance guarantee facilities are limited in use to providing performance guarantees to third parties. There were no0 borrowings outstanding as of September 30, 2016 and September 30, 2015 on Woodward’s other foreign lines of credit and foreign overdraft facilities.facilities as of both September 30, 2019 and September 30, 2018. Woodward had 0 other short-term borrowings as of September 30, 2019 and other short-term borrowings of $3,635 as of September 30, 2018, which were repaid during the first quarter of fiscal year 2019.
Long-term debt
| | | | | | |
| | | | | | |
| | September 30, | | September 30, |
| | 2016 | | 2015 |
Revolving credit facility - Floating rate (LIBOR plus 0.85% - 1.65%), due April 2020, unsecured | | $ | 156,700 | | $ | 350,000 |
Series C notes – 5.92%, due October 2015; unsecured | | | - | | | 50,000 |
Series D notes – 6.39%, due October 2018; unsecured | | | 100,000 | | | 100,000 |
Series E notes – 7.81%, due April 2016; unsecured | | | - | | | 57,000 |
Series F notes – 8.24%, due April 2019; unsecured | | | 43,000 | | | 43,000 |
Series G notes – 3.42%, due November 2020; unsecured | | | 50,000 | | | 50,000 |
Series H notes – 4.03%, due November 2023; unsecured | | | 25,000 | | | 25,000 |
Series I notes – 4.18%, due November 2025; unsecured | | | 25,000 | | | 25,000 |
Series J notes – Floating rate (LIBOR plus 1.25%), due November 2020; unsecured | | | 50,000 | | | 50,000 |
Series K notes – 4.03%, due November 2023; unsecured | | | 50,000 | | | 50,000 |
Series L notes – 4.18%, due November 2025; unsecured | | | 50,000 | | | 50,000 |
Series M notes – 1.12% due September 2026; unsecured | | | 44,886 | | | - |
Series N notes – 1.31% due September 2028; unsecured | | | 86,406 | | | - |
Series O notes – 1.57% due September 2031; unsecured | | | 48,252 | | | - |
Total debt | | | 729,244 | | | 850,000 |
Less: Current portion of long-term debt | | | (150,000) | | | - |
Unamortized debt issuance costs | | | (2,091) | | | (1,512) |
Long-term debt, excluding current portion | | $ | 577,153 | | $ | 848,488 |
|
|
|
|
|
|
|
|
|
|
|
|
|
|
|
| September 30, |
| September 30, |
|
| 2019 |
| 2018 |
Long-term portion of revolving credit facility - Floating rate (LIBOR plus 0.875% - 1.75%), due June 19, 2024; unsecured |
| $ | 42,297 |
| $ | 116,541 |
Series D notes – 6.39%, due October 1, 2018; unsecured |
|
| - |
|
| 100,000 |
Series F notes – 8.24%, due April 3, 2019; unsecured |
|
| - |
|
| 43,000 |
Series G notes – 3.42%, due November 15, 2020; unsecured |
|
| 50,000 |
|
| 50,000 |
Series H notes – 4.03%, due November 15, 2023; unsecured |
|
| 25,000 |
|
| 25,000 |
Series I notes – 4.18%, due November 15, 2025; unsecured |
|
| 25,000 |
|
| 25,000 |
Series J notes – Floating rate (LIBOR plus 1.25%), due November 15, 2020; unsecured |
|
| 50,000 |
|
| 50,000 |
Series K notes – 4.03%, due November 15, 2023; unsecured |
|
| 50,000 |
|
| 50,000 |
Series L notes – 4.18%, due November 15, 2025; unsecured |
|
| 50,000 |
|
| 50,000 |
Series M notes – 1.12% due September 23, 2026; unsecured |
|
| 43,770 |
|
| 46,437 |
Series N notes – 1.31% due September 23, 2028; unsecured |
|
| 84,257 |
|
| 89,393 |
Series O notes – 1.57% due September 23, 2031; unsecured |
|
| 47,053 |
|
| 49,921 |
Series P notes – 4.27% due May 30, 2025; unsecured |
|
| 85,000 |
|
| 85,000 |
Series Q notes – 4.35% due May 30, 2027; unsecured |
|
| 85,000 |
|
| 85,000 |
Series R notes – 4.41% due May 30, 2029; unsecured |
|
| 75,000 |
|
| 75,000 |
Series S notes – 4.46% due May 30, 2030; unsecured |
|
| 75,000 |
|
| 75,000 |
Series T notes – 4.61% due May 30, 2033; unsecured |
|
| 80,000 |
|
| 80,000 |
Unamortized debt issuance costs |
|
| (2,478) |
|
| (2,895) |
Total long-term debt |
|
| 864,899 |
|
| 1,092,397 |
Less: Current portion of long-term debt |
|
| - |
|
| - |
Long-term debt, less current portion |
| $ | 864,899 |
| $ | 1,092,397 |
The Notes
In October 2008, Woodward entered into a note purchase agreement relating to the Series C and D Notes, (the “2008 Notes”). due on October 1, 2018. On October 1, 2018, Woodward paid the entire principal balance of $100,000 on the Series D Notes using proceeds from borrowings under its revolving credit facility.
In April 2009, Woodward entered into a note purchase agreement relating to the Series E and F Notes, (the “2009 Notes”).which were due on April 3, 2019. On April 3, 2019, Woodward paid the entire principal balance of $43,000 on the Series F Notes using proceeds from borrowings under its revolving credit facility.
On October 1, 2013, Woodward entered into a note purchase agreement relating to the sale by Woodward of an aggregate principal amount of $250,000 of its senior unsecured notes in a series of private placement transactions.
Woodward issued the Series G, H and I Notes (the “First Closing Notes”) on October 1, 2013. Woodward issued the Series J, K and L Notes (the “Second Closing Notes”, and together with the 2008Series D Notes, 2009the Series F Notes and the First Closing Notes, collectively the “USD Notes”) on November 15, 2013.
On September 23, 2016, Woodward and the BV Subsidiary each entered into note purchase agreements (the “2016 Note Purchase Agreements”) relating to the sale by Woodward and the BV Subsidiary of an aggregate principal amount of €160,000 of senior unsecured notes in a series of private placement transactions. Woodward issued €40,000 aggregate principal amount of Woodward’s Series M Senior Notes (the “Series M Notes”).Notes. The BV Subsidiary issued (a) €77,000 aggregate principal amount of the BV Subsidiary’s Series N Senior Notes (the “Series N Notes”) and (b) €43,000 aggregate principal amount of the BV Subsidiary’s Series O Senior Notes (the “Series O Notes” and together with the Series M Notes and the Series N Notes, the “2016 Notes”).
On May 31, 2018, Woodward entered into a note purchase agreement (the “2018 Note Purchase Agreement”) relating to the sale by Woodward of an aggregate principal amount of $400,000 of senior unsecured notes comprised of (a) $85,000 aggregate principal amount of its Series P Senior Notes (the “Series P Notes”), (b) $85,000 aggregate principal amount of its Series Q Senior Notes (the “Series Q Notes”), (c) $75,000 aggregate principal amount of its Series R Senior Notes (the “Series R Notes”), (d) $75,000 aggregate principal amount of its Series S Senior Notes (the “Series S Notes”), and (e) $80,000 aggregate principal amount of its Series T Senior Notes (the “Series T Notes”, and together with the Series P Notes, the Series Q Notes, the Series R Notes, and the Series S Notes, the “2018 Notes,” and, together with the USD Notes collectively,and 2016 Notes, the “Notes”). , in a series of private placement transactions.
In connection with the issuance of the 2018 Notes, the Company entered into cross currency swap transactions in respect of each tranche of the 2018 Notes, which effectively reduced the interest rates on the Series P Notes to 1.82% per annum, the Series Q Notes to 2.15% per annum, the Series R Notes to 2.42% per annum, the Series S Notes to 2.55% per annum and the Series T Notes to 2.90% per annum (see Note 8, Derivative instruments and hedging activities).
Interest on the 2008 Notes, theremaining First Closing Notes, and the Series K and L Notes is payable semi-annually on April 1 and October 1 of each year until all principal is paid. Interest on the 20092016 Notes is payable semi-annually on April 15March 23 and October 15September 23 of each year, until all principal is paid. Interest on the 2016 Notes will be payable semi-annually on March 23 and September 23 of each year, commencing on March 23, 2017, until all principal is paid. Interest on the Series J Notes is
payable quarterly on January 1, April 1, July 1 and October 1 of each year until all principal is paid. As of September 30, 2016,2019, the Series J Notes bore interest at an effective rate of 2.06%3.37%.
On October 1, 2015, Woodward paid the entire principal balance of $50,000 Interest on the Series C notes using borrowings under the Revolving Credit Agreement. On April 4, 2016, Woodward paid the entire2018 Notes is payable semi-annually on May 30 and November 30 of each year until all principal balance of $57,000 on the Series E notes using borrowings under the Revolving Credit Agreement.is paid.
None of the Notes were registered under the Securities Act of 1933 and they may not be offered or sold in the United States absent registration or an applicable exemption from registration requirements. Holders of the Notes do not have any registration rights.
All of the issued Notes are held by multiple institutions.
Woodward’s payment and performance obligations under the Notes, including without limitation the obligations for payment of all principal, interest and any applicable prepayment compensation amount, are guaranteed by (i) Woodward FST, Inc., Woodward MPC, Inc., and Woodward HRT, Inc., each of which is a wholly owned subsidiary of Woodward, and (ii) in the case of the BV Subsidiary’s Series N and O Notes, by Woodward. Woodward’s obligations under the Notes rank equal in right of payment with all of Woodward’s other unsecured unsubordinated debt, including its outstanding debt under its revolving credit facility.
The USD Notes and the 2016 Notes contain restrictive covenants customary for such financings, including, among other things, covenants that place limits on Woodward’s ability to incur liens on assets, incur additional debt (including a leverage or coverage based maintenance test), transfer or sell Woodward’s assets, merge or consolidate with other persons and enter into material transactions with affiliates. Under the financial covenants contained in the note purchase agreement governing each series of the USD Notes, Woodward’s priority debt may not exceed, at any time, 25% of its consolidated net worth. Woodward’s Leverage Ratio cannot exceed 4.0 to 1.0 during any material acquisition period, or 3.5 to 1.0 at any other time on a rolling four quarter basis. In the event that Woodward’s Leverage Ratio exceeds 3.5 to 1.0 during any material acquisition period, the interest rate on each series of Notes will increase. Further forFor the USD Notes,Series G, H, I, J, K, L, M, N, and O notes, Woodward’s consolidated net worth must at all times equal or exceed $800,000, plus 50% of Woodward’s consolidated net earnings for each fiscal year beginning with the fiscal year ending September 30, 2014 and for the 2016 Notes, Woodward’s consolidated net worth must at all times equal or exceed $1,046,619$1,156,000 plus 50% of Woodward’s positive net income for each completed fiscal year beginning with the fiscal year ending September 30, 2016. For the 2018 Notes, Woodward’s consolidated net worth must at all times equal or exceed $1,156,000 plus (i) 50% of Woodward’s positive net income for each completed fiscal year beginning with the fiscal year ending September 30, 2018 and (ii) 50% of the net cash proceeds received by Woodward on or after May 31, 2018 from the issuance of capital stock, other than issuances pursuant to employee stock option or ownership plans.
Woodward,The Company, at its option, is permitted at any time to prepay all or any part of the then-outstanding principal amount of any series of the Notes at 100% of the principal amount of the series of the Notes to be prepaid (but, in the case of partial prepayment, not less than $1,000 for each the USD Notes and the 2018 Notes and not less than €1,000 for the 2016 Notes), together with interest accrued on such amount to be prepaid to the date of payment,prepayment, plus any applicable prepayment compensation amount. The prepayment compensation amount, as to the USD Notes and 2018 Notes, other than the Series J Notes, is computed by discounting the remaining scheduled payments of interest and principal of the USD Notes and/or 2018 Notes being prepaid at a discount rate equal to the sum of 50 basis points and the yield to maturity of U.S. Treasury securities having a maturity equal to the remaining average life of the USD Notes and/or 2018 Notes being prepaid. The prepayment compensation amount, as to the Series J Notes, generally is computed as a percentage of the principal amount of the Series J Notes equal to (a) 2%, on or prior to November 15, 2014, (b) 1%, after November 15, 2014 and on or prior to November 15, 2015, and (c) 0% after November 15, 2015. The prepayment compensation amount as to the 2016 Notes that is not subject to a swap agreement is computed by discounting the remaining scheduled payments of interest and principal of such notes being prepaid at a discount rate equal to the sum of 50 basis points and the yield to maturity of the German Bund having a maturity equal to the remaining average life of the 2016 Notes being prepaid. The prepayment compensation amount as to a 2016 NoteNotes that is subject to a swap agreement entered into by the holder of such note under which the holder will receive payment in U.S. dollars in exchange for scheduled Euro payments of principal and interest on the Euro denominated 2016 Notes, adjusted for theoretical holder returns foregone on hypothetical reinvestments in U.S. Treasury securities (the “Swapped Notes”) is equal to the excess of an amount equal to the remaining scheduled payments to be paid in respect of such called principal under such swap agreement discounted at a rate equal to 50 basis points and the yield to maturity of U.S. Treasury securities having a maturity equal to the remaining average life of the Swapped Notes being prepaid over the amount of payments in U.S. dollars that would be paid to the holder of the Swapped Note in respect of the called principal
under the swap agreement, which amount will be increased or reduced, as applicable, in an amount equal to any net gain or loss realized by the holder of such Swapped Note on swap transactions under such swap agreement as a result of such prepayment.
Required future principal payments of the Notes as of September 30, 20162019 are as follows:
| | |
|
|
| | |
|
|
Year Ending September 30: | | |
|
|
|
2017 | | $ | - | |
2018 | | - | |
2019 | | 143,000 | |
2020 | | - |
| $ | - |
2021 | | 100,000 |
| 100,000 |
2022 | |
| - |
2023 | |
| - |
2024 | |
| 75,000 |
Thereafter | | | 329,544 |
|
| 650,080 |
| | $ | 572,544 |
| $ | 825,080 |
Certain financial and other covenants under Woodward'sWoodward’s debt agreements contain customary restrictions on the operation of its business. Management believes that Woodward was in compliance with the covenants under the long-term debt agreements at September 30, 2016.2019.
Debt Issuance Costs
Amounts recognized as interest expense from the amortization of debt issuance costs were $1,094 in fiscal year 2019, $1,256 in fiscal year 2018, and $1,130 in fiscal year 2017. Unamortized debt issuance costs associated with the Notes of $2,478 as of September 30, 2019 and $2,895 as of September 30, 2018 were recorded as a reduction in “Long-term debt, less current portion” in the Consolidated Balance Sheets. In connection with the 2016 Note Purchase Agreements, in fiscal year 2016, Woodward incurred $863 in financing costs, which are deferredAmended and will be amortized using the straight-line method over the life of the agreement.
In connection with theRestated Revolving Credit Agreement, in fiscal year 2015, Woodward incurred $2,359$2,238 in financingdebt issuance costs, which are deferred and are being amortized using the straight-line method over the life of the agreement. As of April 28, 2015,June 19, 2019, the date the Amended and Restated Revolving Credit Agreement was entered into, Woodward also had $2,014 remaining$802 of deferred financingdebt issuance costs remaining that were incurred in connection with the priorthen existing revolving credit agreement, which have been combined with the financingdeferred debt issuance costs associated with the Amended and Restated Revolving Credit Agreement and are being amortized using the straight-line method over the life of the Amended and Restated Revolving Credit Agreement.
In connection with the 2013 Note Purchase Agreement, in fiscal year 2014, Woodward incurred $1,297 in financing costs, which are deferred and will be amortized using the straight-line method over the life of the agreement.
Amounts recognized as interest expense from the amortization of debt issuance costs were $1,165 in fiscal year 2016, $1,114 in fiscal year 2015, and $1,014 in fiscal year 2014. Unamortized debt issuance costs of $2,840 associated with the 2016 Notes and USD Notes of $2,091these revolving credit agreements as of September 30, 20162019 and $1,512$1,385 as of September 30, 2015 have been recorded as a reduction in “Long-term debt, less current portion” at the Consolidated Balance Sheets. Unamortized debt issuance costs associated with the Revolving Credit Agreement of $3,134 as of September 30, 2016 and $4,009 as of September 30, 2015 have been2018 were recorded as “Other assets” atin the Consolidated Balance Sheets. Amortization of debt issuance costs is included in operating activities in the Consolidated Statements of Cash Flows.
Note 13.15. Accrued liabilities
|
|
|
|
|
|
|
|
|
|
|
|
| At September 30, |
| 2019 |
| 2018 |
Salaries and other member benefits | $ | 115,649 |
| $ | 88,643 |
Warranties |
| 27,309 |
|
| 20,130 |
Interest payable |
| 13,808 |
|
| 18,611 |
Accrued retirement benefits |
| 3,587 |
|
| 3,571 |
Current portion of loss reserve on contractual lease commitments |
| 1,245 |
|
| 1,245 |
Net current contract liabilities (Note 3) |
| 27,891 |
|
| 9,659 |
Restructuring charges |
| 507 |
|
| 16,522 |
Taxes, other than income |
| 15,708 |
|
| 21,128 |
Other |
| 22,423 |
|
| 15,004 |
| $ | 228,127 |
| $ | 194,513 |
Warranties
| | | | | |
| | | | | |
| At September 30, |
| 2016 | | 2015 |
Salaries and other member benefits | $ | 87,197 | | $ | 90,472 |
Warranties | | 15,993 | | | 13,741 |
Interest payable | | 9,071 | | | 12,526 |
Current portion of acquired performance obligations and unfavorable contracts (1) | | 2,910 | | | 6,651 |
Accrued retirement benefits | | 2,505 | | | 2,481 |
Current portion of loss reserve on contractual lease commitments | | 1,840 | | | - |
Current portion of deferred income from JV formation (Note 4) | | 6,552 | | | - |
Deferred revenues | | 5,779 | | | 10,004 |
Taxes, other than income | | 14,580 | | | 8,723 |
Other | | 10,200 | | | 11,338 |
| $ | 156,627 | | $ | 155,936 |
| (1)
| | In connection with Woodward’s acquisition of GE Aviation Systems LLC’s (the “Seller”) thrust reverser actuation systems business located in Duarte, California (the “Duarte Acquisition”) in fiscal year 2013, Woodward assumed current and long-term performance obligations for contractual commitments that are expected to result in future economic losses. In addition, Woodward assumed current and long-term performance obligations for services to be
|
provided to the Seller and others, partially offset by current and long-term assets related to contractual payments due from the Seller. The current portion of both obligations is included in Accrued liabilities.
|
Warranties
Provisions of Woodward’s sales agreements include product warranties customary to these types of agreements. Accruals are established for specifically identified warranty issues that are probable to result in future costs. Warranty costs are accrued as revenue is recognized on a non-specific basis whenever past experience indicates a normal and predictable pattern exists. Changes in accrued product warranties were as follows:
| | | | | | |
|
|
|
|
|
|
| | | | | | |
|
|
|
|
|
|
| Twelve-Months Ended September 30, | Twelve-Months Ended September 30, |
| 2016 | | 2015 | | 2014 | 2019 |
| 2018 |
| 2017 |
Warranties, beginning of period | $ | 13,741 | | $ | 16,916 | | $ | 15,224 | $ | 20,130 |
| $ | 13,597 |
| $ | 15,993 |
Increases due to acquisition of L'Orange | |
| - |
|
| 6,045 |
|
| - |
Impact from adoption of ASC 606 (Note 3) | |
| 705 |
|
| - |
|
| - |
Expense, net of recoveries | | 9,902 | | 10,117 | | 10,700 |
| 14,559 |
| 5,158 |
|
| 9,135 |
Reductions for settling warranties | | (7,802) | | (12,416) | | (8,448) |
| (7,540) |
| (4,413) |
|
| (11,692) |
Foreign currency exchange rate changes | | 152 | | | (876) | | | (560) |
| (545) |
|
| (257) |
|
| 161 |
Warranties, end of period | $ | 15,993 | | $ | 13,741 | | $ | 16,916 | $ | 27,309 |
| $ | 20,130 |
| $ | 13,597 |
Loss reserve on contractual lease commitments
In connection with the construction of a new production facility in Niles, Illinois, Woodward vacated a leased facility in Skokie, Illinois. During the first quarter of fiscal year 2016 Woodward fully vacated the Skokie facilityIllinois, and therefore recorded a charge of $8,165 to recognize a loss reserve againston the estimated remaining contractual lease commitments, lesscommitment, net of anticipated sublease income. During the third quarter of fiscal year 2017, Woodward entered into another sublease agreement with a third party related to a portion of the vacated Skokie facility. Woodward recorded a reduction in the loss reserve associated with the vacated Skokie facility of $2,322 related to the anticipated sublease income it will receive.
The summary for the activity in the loss reserve during the twelve-monthsfiscal years ended September 30, 20162019, 2018, and 2017 is as follows:
| | | | | |
p | |
|
|
|
|
|
|
| | | | |
|
|
|
|
|
|
| Twelve-Months Ended September 30, | Twelve-Months Ended September 30, |
| 2016 | | 2015 | 2019 |
| 2018 |
|
| 2017 |
Loss reserve on contractual lease commitments, beginning of period | $ | 2,464 | | $ | 3,212 | $ | 3,931 |
| $ | 5,270 |
| $ | 9,242 |
Additions | | 8,165 | | | 39 | |
Reductions | | (1,387) | | | (787) | |
Payments | |
| (932) |
|
| (1,339) |
|
| (1,650) |
Non-cash adjustments | |
| - |
|
| - |
|
| (2,322) |
Loss reserve on contractual lease commitments, end of period | $ | 9,242 | | $ | 2,464 | $ | 2,999 |
| $ | 3,931 |
| $ | 5,270 |
Other liabilities included $7,402$1,754 and $2,686 of accrued loss reserve on contractual lease commitments thatas of September 30, 2019 and September 30, 2018, respectively, which are not expected to be settled or paid within twelve months as of the respective balance sheet date, net of expected sublease income.
Restructuring charges
In fiscal year 2018, the Company recorded restructuring charges totaling $17,013, the majority of which relate to the Company’s decision to relocate its Duarte, California operations to the Company’s newly renovated Drake Campus in Fort Collins, Colorado. The Duarte facility, which manufactures thrust reverser actuation systems, is part of the Company’s Aerospace segment. The remaining restructuring charges recognized during the fiscal year ended September 30, 2016.2018 consist of workforce management costs related to aligning the Company’s industrial turbomachinery business, which is part of the Company’s Industrial segment, with the then current market conditions. All of the restructuring charges recorded during the
fiscal year ended September 30, 2018 were recorded as nonsegment expenses and are expected to be paid within one year of the balance sheet date.
The summary of activity in accrued restructuring charges during the fiscal years ended September 30, 2019 and September 30, 2018 is as follows:
|
|
|
|
|
|
|
|
|
|
|
|
|
|
|
|
|
|
| Period Activity |
|
|
|
| Balances as of October 1, 2018 |
|
| Charges (gains) |
| Cash receipts (payments) |
| Non-cash activity |
| Balances as of September 30, 2019 |
Workforce management costs associated with: |
|
|
|
|
|
|
|
|
|
|
|
|
|
|
Duarte plant relocation | $ | 12,504 |
| $ | - |
| $ | (8,685) |
| $ | (3,379) |
| $ | 440 |
Industrial turbomachinery business realignment |
| 4,018 |
|
| - |
|
| (3,760) |
|
| (191) |
|
| 67 |
Total | $ | 16,522 |
| $ | - |
| $ | (12,445) |
| $ | (3,570) |
| $ | 507 |
|
|
|
|
|
|
|
|
|
|
|
|
|
|
|
|
|
|
| Period Activity |
|
|
|
| Balances as of October 1, 2017 |
|
| Charges (gains) |
| Cash receipts (payments) |
| Non-cash activity |
| Balances as of September 30, 2018 |
Workforce management costs associated with: |
|
|
|
|
|
|
|
|
|
|
|
|
|
|
Duarte plant relocation | $ | - |
| $ | 12,504 |
| $ | - |
| $ | - |
| $ | 12,504 |
Industrial turbomachinery business realignment |
| - |
|
| 4,509 |
|
| (491) |
|
| - |
|
| 4,018 |
Total | $ | - |
| $ | 17,013 |
| $ | (491) |
| $ | - |
| $ | 16,522 |
T
Note 14.16. Other liabilities
| | | | | | |
| | | | | | |
| | At September 30, |
| | 2016 | | 2015 |
Net accrued retirement benefits, less amounts recognized within accrued liabilities | | $ | 70,479 | | $ | 55,259 |
Noncurrent portion of deferred income from JV formation (1) | | | 238,187 | | | - |
Total unrecognized tax benefits, net of offsetting adjustments | | | 17,239 | | | 15,394 |
Acquired unfavorable contracts (2) | | | 3,148 | | | 4,656 |
Deferred economic incentives (3) | | | 16,196 | | | 19,163 |
Loss reserve on contractual lease commitments (4) | | | 7,402 | | | 2,464 |
Other | | | 15,573 | | | 19,254 |
| | $ | 368,224 | | $ | 116,190 |
|
|
|
|
|
|
|
|
|
|
|
|
|
|
|
| At September 30, |
|
| 2019 |
| 2018 |
Net accrued retirement benefits, less amounts recognized within accrued liabilities |
| $ | 111,257 |
| $ | 90,722 |
Total unrecognized tax benefits |
|
| 10,644 |
|
| 8,582 |
Noncurrent income taxes payable (1) |
|
| 20,251 |
|
| 12,494 |
Deferred economic incentives (2) |
|
| 11,535 |
|
| 13,038 |
Loss reserve on contractual lease commitments (3) |
|
| 1,754 |
|
| 2,686 |
Cross currency swap derivative liability (4) |
|
| - |
|
| 23,000 |
Net noncurrent contract liabilities (5) |
|
| 337,165 |
|
| 235,300 |
Other |
|
| 13,482 |
|
| 12,233 |
|
| $ | 506,088 |
| $ | 398,055 |
(1)See Note 18, Income taxes for more information on the noncurrent income taxes payable.
(2)Woodward receives certain economic incentives from various state and local authorities related to capital expansion projects. Such amounts are initially recorded as deferred credits and are being recognized as a reduction to pre-tax expense over the economic lives of the related capital expansion projects. (3)See Note 15, Accrued liabilities for more information on the loss reserve on contractual lease commitments. (4)See Note 7, Financial instruments and fair value measurements for more information on the cross currency swap derivative liability. (5)See Note 3, Revenue, for more information on net noncurrent contract liabilities.
| (1)
| | See Note 4, Joint venture for more information on the deferred income from JV formation.
|
| (2)
| | In connection with the Duarte business acquisition in fiscal year 2013, Woodward assumed current and long-term performance obligations for contractual commitments that are expected to result in future economic losses. The long-term portion of the acquired unfavorable contracts is included in Other liabilities.
|
| (3)
| | Woodward receives certain economic incentives from various state and local authorities related to capital expansion projects. Such amounts are initially recorded as deferred credits and are being recognized as a reduction to pre-tax expense over the economic lives of the related capital expansion projects.
|
| (4)
| | See Note 13, Accrued liabilites for more information on the loss reserve on contractual lease commitments.
|
Note 15.17. Other (income) expense, net
| | | | | | | | | |
| | | | | | | | | |
| | Year Ended September 30, |
| | 2016 | | 2015 | | 2014 |
Equity interest in the earnings of the JV (Note 4) | | $ | (6,204) | | $ | - | | $ | - |
Net (gain) loss on sales of assets | | | (4,431) | | | (626) | | | 166 |
Rent income | | | (315) | | | (485) | | | (565) |
Net (gain) loss on investments in deferred compensation program | | | (1,062) | | | 33 | | | (794) |
Other | | | (294) | | | (84) | | | (107) |
| | $ | (12,306) | | $ | (1,162) | | $ | (1,300) |
|
|
|
|
|
|
|
|
|
|
|
|
|
|
|
|
|
|
|
|
|
| Year Ended September 30, |
|
| 2019 |
| 2018 |
| 2017 |
Equity interest in the earnings of the JV (Note 6) |
| $ | (12,932) |
| $ | (3,339) |
| $ | (2,568) |
Net loss (gain) on sales of assets |
|
| 1,925 |
|
| (1,106) |
|
| (3,604) |
Rent income |
|
| (245) |
|
| (170) |
|
| (254) |
Net gain on investments in deferred compensation program |
|
| (942) |
|
| (1,661) |
|
| (1,833) |
Loss on forward option derivative instrument (Note 8) |
|
| - |
|
| 5,543 |
|
| - |
Other components of net periodic pension and other postretirement benefit, excluding service cost and interest expense |
|
| (12,965) |
|
| (12,801) |
|
| (10,340) |
Other |
|
| (810) |
|
| (792) |
|
| (786) |
|
| $ | (25,969) |
| $ | (14,326) |
| $ | (19,385) |
Note 16.18. Income taxes
Income taxes consisted of the following:
| | | | | | | | | |
|
|
|
|
|
|
|
|
|
| | | | | | | | | |
|
|
|
|
|
|
|
|
|
| | | Year Ended September 30, |
|
| Year Ended September 30, |
| | | 2016 | | 2015 | | 2014 |
|
| 2019 |
| 2018 |
| 2017 |
Current: | Current: | | | | | | | | | | Current: |
|
|
|
|
|
|
|
|
|
| Federal | | $ | 81,127 | | $ | 23,923 | | $ | 48,327 | Federal |
| $ | 40,173 |
| $ | 39,979 |
| $ | 17,872 |
| State | | 6,067 | | | 3,108 | | | 5,752 | State |
| 2,402 |
|
| 3,697 |
|
| 1,379 |
| Foreign | | 9,689 | | | 18,343 | | | 16,594 | Foreign |
| 34,660 |
|
| 25,968 |
|
| 15,118 |
Deferred: | Deferred: | | | | | | | | | Deferred: |
|
|
|
|
|
|
|
|
| Federal | | (40,801) | | | 19,236 | | | (4,378) | Federal |
| (2,015) |
|
| (10,519) |
|
| 16,907 |
| State | | (9,054) | | | 751 | | | (2,966) | State |
| (2,948) |
|
| (3,784) |
|
| (2,561) |
| Foreign | | | (1,380) | | | (5,864) | | | (1,929) | Foreign |
|
| (11,262) |
|
| (16,141) |
|
| 3,525 |
| | | $ | 45,648 | | $ | 59,497 | | $ | 61,400 |
|
| $ | 61,010 |
| $ | 39,200 |
| $ | 52,240 |
Earnings before income taxes by geographical area consisted of the following:
| | | | | | | | |
|
|
|
|
|
|
|
|
| | | | | | | | |
|
|
|
|
|
|
|
|
| | Year Ended September 30, |
| Year Ended September 30, |
| | 2016 | | 2015 | | 2014 |
| 2019 |
| 2018 |
| 2017 |
United States | | $ | 175,146 | | $ | 172,315 | | $ | 148,837 |
| $ | 211,267 |
| $ | 181,671 |
| $ | 192,220 |
Other countries | | | 51,340 | | | 68,634 | | | 78,407 |
|
| 109,345 |
|
| 37,907 |
|
| 60,527 |
| | $ | 226,486 | | $ | 240,949 | | $ | 227,244 |
| $ | 320,612 |
| $ | 219,578 |
| $ | 252,747 |
Significant components of deferred income taxes presented in the Consolidated Balance Sheets are related to the following:
| | | | | | |
|
|
|
|
|
|
| | | | | | |
|
|
|
|
|
|
| | | At September 30, |
|
| At September 30, |
| | | 2016 | | 2015 |
|
| 2019 |
| 2018 |
Deferred tax assets: | Deferred tax assets: | | | | | | | Deferred tax assets: |
|
|
|
|
|
|
| Defined benefit plans, other postretirement | | $ | 13,017 | | $ | 12,878 | Defined benefit plans, other postretirement |
| $ | 6,535 |
| $ | 6,844 |
| Foreign net operating loss carryforwards | | 5,255 | | | 6,537 | Foreign net operating loss carryforwards |
| 6,836 |
|
| 6,071 |
| Inventory | | 27,332 | | | 21,651 | Inventory |
| 51,740 |
|
| 23,549 |
| Deferred and stock-based compensation | | 34,388 | | | 31,310 | Stock-based and other compensation |
| 45,839 |
|
| 39,903 |
| Defined benefit plans, pension | | 8,955 | | | 4,217 | Defined benefit plans, pension |
| 11,399 |
|
| 2,187 |
| Deferred revenue | | 92,213 | | | - | Deferred revenue net of unbilled receivables |
| 32,310 |
|
| 60,177 |
| Other reserves | | 13,968 | | | 9,289 | Other reserves |
| 11,571 |
|
| 10,154 |
| Tax credits and incentives | | 7,744 | | | 9,162 | Tax credits and incentives |
| 13,580 |
|
| 12,512 |
| Other | | 7,411 | | | 5,963 | Other |
| 5,611 |
|
| 9,887 |
| Valuation allowance | | | (3,317) | | | (6,804) | Valuation allowance |
|
| (3,638) |
|
| (4,522) |
| Total deferred tax assets, net of valuation allowance | | | 206,966 | | | 94,203 | Total deferred tax assets, net of valuation allowance |
|
| 181,783 |
|
| 166,762 |
Deferred tax liabilities: | Deferred tax liabilities: | | | | | | | Deferred tax liabilities: |
|
|
|
|
|
|
| Goodwill and intangibles - net | | (99,030) | | | (98,906) | Goodwill and intangibles - net |
| (212,926) |
|
| (231,223) |
| Property, plant and equipment | | (88,986) | | | (34,625) | Property, plant and equipment |
| (97,469) |
|
| (85,459) |
| Other | | | (2,533) | | | (3,981) | Other |
|
| (4,589) |
|
| (4,425) |
| Total deferred tax liabilities | | | (190,549) | | | (137,512) | Total deferred tax liabilities |
|
| (314,984) |
|
| (321,107) |
Net deferred tax assets (liabilities) | | $ | 16,417 | | $ | (43,309) | |
Net deferred tax liabilities | | Net deferred tax liabilities |
| $ | (133,201) |
| $ | (154,345) |
Woodward has recorded a net operating loss (“NOL”) deferred tax asset of $5,255$6,836 as of September 30, 20162019 and $6,537$6,071 as of September 30, 2015.2018. A portion of these NOL carryforwards will startstarted to expire in 20182019 and are currently offset by a valuation allowance, while the remaining portionallowance. Woodward has an indefinite carryforward period and has noplaced valuation allowanceallowances against it.all other NOL carryforwards that are less than 50 percent likely to be realized.
Deferred tax assets are reduced by a valuation allowance if, based on the weight of available evidence, it is more likely than not that some portion or all of the deferred tax assets will not be realized. Both positive and negative evidence are considered in forming Woodward’s judgment as to whether a valuation allowance is appropriate, and more weight is given to evidence that can be objectively verified. Valuation allowances are reassessed whenever there are changes in circumstances that may cause a change in judgment. The change in the valuation allowance was primarily the result of current year earnings and projected future earnings in a wholly-owned subsidiary that hadthe expiration of net operating losses that are no longer subject toat a full valuation allowance.wholly owned subsidiary.
At September 30, 2016,2019, Woodward has not provided for taxes on undistributed foreign earnings of $335,881$293,538 that it considered indefinitely reinvested. These earnings could become subject to income taxes if they are remitted as dividends, are loaned to Woodward or any of Woodward’s subsidiaries located in the United States, or if Woodward sells its stock in the foreign subsidiaries. Any additional U.S. taxes could be offset, in part or in whole, by foreign tax credits. The amount of such taxes and application of tax credits would be dependent on the income tax laws and other circumstances at the time these amounts are repatriated. Based on these variables, it is impractical to determine the income tax liability that might be incurred if these funds were to be repatriated.
On October 14, 2016,December 22, 2017 the U.S. Treasuryenacted the Tax Act. The Tax Act included significant changes to prior tax law, including a permanent reduction to the U.S federal corporate income tax rate of 35% to 21%, a one-time repatriation tax on deferred foreign income (“Transition Tax”), deemed inclusions of foreign low tax earnings, limitations on certain deductions, adjusted foreign tax credits, and business-related exclusions.
Enactment of the Tax Act during December 2017 resulted in a net change to Woodward’s income tax expense in the amount of $14,778, which was recorded in the three-months ended December 31, 2017. After adjustments to amounts made throughout fiscal year 2018, the net impact of the enactment of the Tax Act was $10,860. Woodward finalized its assessment of the income tax effects of the Tax Act in the first quarter of fiscal year 2019.
On June 14, 2019, the Internal Revenue Service (“IRS”) issued final regulations that could potentially affectmodified the classificationTransition Tax computation required by the Tax Act. As a result, in the three-months ended June 30, 2019, Woodward recognized additional income tax expense related to the Transition Tax of debt$10,588.
The permanent reduction to the U.S. federal corporate income tax rate from 35% to 21% was effective January 1, 2018 (the “Effective Date”). When a U.S. federal tax rate change occurs during a taxpayer’s fiscal year, taxpayers are required to compute a weighted daily average rate for the fiscal year of enactment. As a result of the Tax Act, Woodward calculated a U.S. federal statutory corporate income tax rate of 24.5% for the fiscal year ending September 30, 2018 and equity investments within a controlled groupapplied this rate
in computing the income tax provision for the fiscal year ended September 30, 2018. The U.S. federal statutory corporate income tax rate of companies (referred24.5% is the weighted daily average rate between the pre-enactment U.S. federal statutory tax rate of 35% applicable to asWoodward’s 2018 fiscal year prior to the Section 385 Regulations). At this time, Woodward does not anticipate that these rules will have a significant impact on Woodward’sEffective Date and the post-enactment U.S. federal statutory tax rate.rate of 21% applicable to the 2018 fiscal year after the Effective Date. The U.S. federal statutory rate is 21% for the fiscal year ended September 30, 2019.
The following is a reconciliation of the U.S. Federal statutory tax rate of 35 percent21.0% in the fiscal year ended September 30, 2019, 24.5% in fiscal year ended September 30, 2018 and 35% in the fiscal year ended September 30, 2017 to Woodward’s effective income tax rate:
| |
|
|
|
|
|
|
|
|
|
| | | | | | | | | |
|
|
|
|
|
|
|
|
|
| | | | | | | | | |
|
| Year Ending September 30, |
| | Year Ending September 30, |
|
| 2019 |
| 2018 |
| 2017 |
Percent of pretax earnings | | 2016 | | 2015 | | 2014 |
|
|
|
|
|
|
|
|
|
Statutory tax rate | | 35.0 | % | | 35.0 | % | | 35.0 | % |
| 21.0 | % |
| 24.5 | % |
| 35.0 | % |
State income taxes, net of federal tax benefit | | 0.4 | | | 1.2 | | | 1.3 | |
| (0.1) |
|
| (0.5) |
|
| (0.3) |
|
Taxes on international activities | | (2.2) | | | (3.8) | | | (3.7) | |
| 0.2 |
|
| (1.8) |
|
| (7.6) |
|
Research credit | | (3.6) | | | (0.8) | | | (0.7) | |
| (3.3) |
|
| (4.8) |
|
| (3.2) |
|
Retroactive extension of research credit | | (3.2) | | | (2.4) | | | - | | |
Net excess income tax benefit from stock-based compensation | | (2.6) | | | - | | | - | |
| (3.5) |
|
| (1.4) |
|
| (1.4) |
|
Domestic production activities deduction | | (2.1) | | | (1.6) | | | (1.3) | |
| - |
|
| (1.6) |
|
| (1.5) |
|
Adjustments of prior period tax items | | (0.2) | | | (2.1) | | | (2.9) | |
| 0.9 |
|
| (5.0) |
|
| (0.9) |
|
Effect of U.S. federal corporate rate reduction on net beginning U.S. deferred tax liability | |
| - |
|
| (5.0) |
|
| - |
|
Transition Tax | |
| 3.3 |
|
| 6.2 |
|
| - |
|
Increased deferred tax liability associated with anticipated repatriation taxes | |
| - |
|
| 3.7 |
|
| - |
|
Effect of U.S. federal corporate rate reduction on net current year U.S. deferred tax activity | |
| - |
|
| 2.0 |
|
| - |
|
Other items, net | | (1.3) | | | (0.8) | | | (0.7) | |
| 0.5 |
|
| 1.6 |
|
| 0.6 |
|
Effective tax rate | | 20.2 | % | | 24.7 | % | | 27.0 | % |
| 19.0 | % |
| 17.9 | % |
| 20.7 | % |
In determining the tax amounts in Woodward’s financial statements, estimates are sometimes used that are subsequently adjusted in the actual filing of tax returns or by updated calculations. In addition, Woodward occasionally has resolutions of tax items with tax authorities related to prior years due to the conclusion of audits and the lapse of applicable statutes of limitations. Such adjustments are included in the “Adjustments of prior period tax items” line in the above table. The majority of these adjustments are related to the conclusion of audits, effective settlement, and lapse of applicable statutes of limitations in various tax jurisdictions.
On December 18, 2015,The increase in the Protecting Americans from Tax Hikes (PATH) Acteffective tax rate for fiscal year 2019 compared to fiscal year 2018 is primarily attributable to favorable resolutions of 2015 was enacted, which permanently extendedtax matters in the R&E Credit. As a result,prior fiscal year that did not repeat in the current fiscal year, an increase in the U.S. federal corporate income taxes fortax on current year foreign earnings, the loss of the domestic production activities deduction in the year ended September 30, 2016 includedand a decrease in the current year of the U.S. research and experimentation credit as a percent of pretax earnings. Partially offsetting these increases were the decrease in the U.S federal corporate income tax rate from 24.5% for fiscal year 2018 to 21.0% in the current fiscal year and the related impact on fiscal year 2018 deferred tax activity that did not repeat in the current fiscal year. Additionally, the fiscal year 2018 net benefittax expense increase related to the retroactive impact fromTax Act was larger than the last three quarters ofcurrent fiscal year 2015 ofincrease. Finally, the R&E Credit pursuant to the Protecting Americans from Tax Hikes Act. In addition, income taxes for the year ended September 30, 2016 included a net benefit related to the full year impact ofcurrent fiscal year 2016 of the R&E Credit.
On December 19, 2014, the Tax Increase Prevention Act of 2014 was enacted, which retroactively extended the R&E Credit through December 31, 2014. Ashad a result, income taxes for the year ended September 30, 2015 included a net benefit related to the retroactive impact from the last three quarters of fiscal year 2014 of the R&E Credit pursuant to the Tax Increase Prevention Act.
As disclosed in Note 2, New accounting standards, Woodward adopted ASU 2016-09 in its second quarter of fiscal year 2016 resultinglarger favorable increase in the recognition through earnings of a net excess income tax benefitbenefits from stock-based compensation. compensation compared to fiscal year 2018.
A reconciliation of the beginning and ending amounts of gross unrecognized tax benefits follows:
| | | | | | | | |
|
|
|
|
|
|
|
|
|
| | | | | | | | |
|
|
|
|
|
|
|
|
|
| | Year Ending September 30, |
| Year Ending September 30, |
| | 2016 | | 2015 | | 2014 |
| 2019 |
| 2018 |
| 2017 |
Beginning balance | | $ | 21,469 | | $ | 22,687 | | $ | 22,694 |
| $ | 8,364 |
| $ | 20,132 |
| $ | 23,526 |
Additions to current year tax positions | | 3,588 | | | 2,234 | | | 8,830 |
|
| 1,930 |
|
| 2,675 |
|
| 2,560 |
Reductions to prior year tax positions | | (2,292) | | | (7,785) | | | (9,684) |
|
| - |
|
| (14,458) |
|
| (5,753) |
Additions to prior year tax positions | | 761 | | | 5,124 | | | 1,844 |
|
| 11 |
|
| 15 |
|
| 3,501 |
Lapse of applicable statute of limitations | | - | | | (791) | | | (997) |
|
| - |
|
| - |
|
| (3,702) |
Ending balance | | $ | 23,526 | | $ | 21,469 | | $ | 22,687 |
| $ | 10,305 |
| $ | 8,364 |
| $ | 20,132 |
Included in the balance of unrecognized tax benefits were $11,426$4,411 as of September 30, 20162019 and $10,494$3,288 as of September 30, 20152018 of tax benefits that, if recognized, would affect the effective tax rate. At this time, Woodward estimates thatdoes not estimate it is reasonably possible that the liability for unrecognized tax benefits will decrease by as much as $8,433 in the next twelve months due to the completion of reviews by tax authorities, lapses of statutes, and the settlement of tax positions.months. Woodward accrues for potential interest and penalties related to unrecognized tax benefits and all other interest and penalties related to
related to tax payments in tax expense. Woodward had accrued gross interest and penalties of $1,273$437 as of September 30, 20162019 and $859$279 as of September 30, 2015.2018.
Woodward’s tax returns are subject to audits by U.S. federal, state, and foreign tax authorities, and these audits are at various stages of completion at any given time. Reviews of tax matters by authorities and lapses of the applicable statutes of limitationslimitation may result in changes to tax expense. Fiscal years remaining open to examination in significant foreign jurisdictions include 2008 and forward. Woodward’s fiscal years remaining open to examination in the United Statesfor U.S. Federal income taxes include fiscal years 20132017 and thereafter. Woodward is currently under examination by the Internal Revenue Service for fiscal year ended September 30, 2014. Woodward has concluded U.S. federal income2017, which included a foreign tax examinations throughcarryback to fiscal year 2012. Woodward is generally subject2016. Woodward’s fiscal years remaining open to examination for significant U.S. state income tax examinations forjurisdictions include fiscal years 20122015 and thereafter. Woodward closed various audits in foreign jurisdictions in the periodssecond and third quarters of fiscal year 2019. Consequently, fiscal years remaining open to examination in significant foreign jurisdictions include 2016 and thereafter.
Note 17.19. Retirement benefits
Woodward provides various retirement benefits to eligible members of the Company, including contributions to various defined contribution plans, pension benefits associated with defined benefit plans, postretirement medical benefits and postretirement life insurance benefits. Eligibility requirements and benefit levels vary depending on employee location.
Defined contribution plans
Most of the Company’s U.S. employees are eligible to participate in the U.S. defined contribution plan. The U.S. defined contribution plan allows employees to defer part of their annual income for income tax purposes into their personal 401(k) accounts. The Company makes matching contributions to eligible employee accounts, which are also deferred for employee personal income tax purposes. Certain foreignnon-U.S. employees are also eligible to participate in foreignsimilar non-U.S. plans.
Most of Woodward’s U.S. employees with at least two years of service receive an annual contribution of Woodward stock, equal to 5% of their eligible prior year wages, to their personal Woodward Retirement Savings Plan accounts. In the second quarterquarters of fiscal years 2016, 20152019, 2018, and 2014,2017, Woodward fulfilled its annual Woodward stock contribution obligation using shares held in treasury stock by issuing 317a total of 158 shares of common stock for a total value of $13,999$14,846 in fiscal year 2016, 2592019, 202 total shares of common stock for a total value of $12,574 $14,741 in fiscal year 2015,2018, and 260199 shares of common stock for a total value of $11,193$14,014 in fiscal year 2014. 2017. The Woodward Retirement Savings Plan (the “WRS Plan”) held 4,4883,623 shares of Woodward stock as of September 30, 20162019 and 4,8873,955 shares as of September 30, 2015.2018. The shares held in the WRS Plan participate in dividends and are considered issued and outstanding for purposes of calculating basic and diluted earnings per share. Accrued liabilities included obligations to contribute shares of Woodward common stock to the WRS Plan of $11,314$11,701 as of September 30, 20162019 and $11,342$11,475 as of September 30, 2015.2018.
The amount of expense associated with defined contribution plans was as follows:
| | | | | | | | | |
| | | | | | | | | |
| | | Year Ended September 30, |
| | 2016 | | 2015 | | 2014 |
Company costs | | $ | 31,893 | | $ | 30,933 | | $ | 24,921 |
|
|
|
|
|
|
|
|
|
|
|
|
|
|
|
|
|
|
|
|
|
|
| Year Ended September 30, |
|
| 2019 |
| 2018 |
| 2017 |
Company costs |
| $ | 35,510 |
| $ | 34,084 |
| $ | 32,008 |
Defined benefit plans
Woodward has defined benefit plans that provide pension benefits for certain retired employees in the United States, the United Kingdom, Japan, and Japan.Germany. Woodward also provides other postretirement benefits to its employees including postretirement medical benefits and life insurance benefits. Postretirement medical benefits are provided to certain current and retired employees and their covered dependents and beneficiaries in the United States and the United Kingdom. Life insurance benefits are provided to certain retirees in the United States under frozen plans, which are no longer available to current employees. A September 30 measurement date is utilized to value plan assets and obligations for all of Woodward’s defined benefit pension and other postretirement benefit plans.
DuringOn October 26, 2018, the third quarterHigh Court of fiscal year 2016, Woodward openedJustice in the United Kingdom (the “High Court”) issued a lump-sum buy-out window for certain former U.S. employees and/or their dependents eligibleruling (the “Court Ruling”) requiring defined benefit plan sponsors in the United Kingdom to receive postretirementequalize benefits payable to men and women under its United Kingdom defined benefit pension payments for past employment servicesplans by amending those plans to increase the pension benefits payable to participants that accrued such benefits during the period from 1990 to 1997. In the Court Ruling, the High Court also provided details on acceptable alternative methods of amending plans to equalize the pension benefits. Although final guidance around the appropriate equalization methodology to be used has not yet been issued, Woodward has concluded that Court Ruling is applicable to its defined benefit pension plan in the United Kingdom and has made the necessary plan amendments. Woodward’s current estimate of the impact of the Court Ruling in the amount of $601 has been reflected in the United Kingdom defined benefit pension plan’s obligation and assets as of September 30, 2019 and will be amortized as a net
prior service cost beginning in fiscal year 2020. Woodward does not expect any changes to the Company. Eligible pension plan participants may electestimate resulting from final guidance around the appropriate equalization methodology to receive a one-time lump-sum payment or an immediate annuity in lieu of future pension benefit payments. Pension benefit payments under the lump-sum buy-out options were $5,008 during the fourth quarter of fiscal year 2016. Woodward estimates that pension benefit payments under the lump-sum buy-out options may be up to approximately $700 during fiscal year 2017. Such lump-sum paymentsused will be material to the United Kingdom defined benefit pension plan’s obligation and assets.
In connection with the acquisition of L’Orange on June 1, 2018, Woodward assumed the unfunded defined benefit pension obligations of the L’Orange defined benefit pension plans in Germany (the “L’Orange Pension Plans”). Woodward’s assumption of the liability associated with the L’Orange Pension Plans was part of the total consideration paid from available pension plan assets.
Effective June 30, 2015,by Woodward to acquire L’Orange and thus reduced Woodward’s cash payment for the Company terminatedtransaction. Woodward has completed its valuation of the defined benefit pension plan for employees at its Duarte, California manufacturing facility (the “Duarte Pension Plan”). The plan, which was established in fiscal year 2013 in connection with the December 2012 acquisition of the Duarte business, was amended in fiscal year 2013 to cease all future benefit accruals
under the plan and was at that time closed to new entrants. Regulatory approval of the plan termination was received in the fourth quarter of fiscal year 2016. In exchange for the freeze and termination of the plan, which were agreed upon through negotiations with the applicable employee union, the employees were provided replacement benefits through full participation in the Woodward U.S. defined contribution plan. Woodward recorded settlement costs of $47 in fiscal year 2016 in connection with cash payouts to the beneficiaries of the plan and associated termination costs. As of September 30, 2016 Woodward had no liabilityobligations associated with the DuarteL’Orange Pension Plan.
In additionPlans and determined the value of the associated unfunded obligation was $39,257, of which $1,143 was considered current as of the June 1, 2018 acquisition date. The L’Orange Pension Plans had expenses of $2,004 and $673 and Woodward made $782 and $219 of contributions to the DuarteL’Orange Pension Plan, excludingPlans to pay participant benefits during the years ended September 30, 2019 and September 30, 2018, respectively. The L’Orange Pension Plans are unfunded.
Excluding the Woodward HRT Plan, which is only partially frozen to salaried participants, the defined benefit plans in the United States were frozen in fiscal year 2007 and no additional employees may participate in the U.S. plans and no additional service costs will be incurred.
Pension plansPlans
The actuarial assumptions used in measuring the net periodic benefit cost and plan obligations of retirement pension benefits were as follows:
| | | | | | | | |
|
|
|
|
|
|
|
|
| | | | | | | | |
|
|
|
|
|
|
|
|
| 2016 | | 2015 | | 2014 | 2019 |
| 2018 |
| 2017 |
United States: | | | | | | | | |
|
|
|
|
|
|
|
|
Weighted-average assumptions to determine benefit obligation at September 30: | | | | | | | | |
|
|
|
|
|
|
|
|
Discount rate | 3.65 | % | | 4.39 | % | | 4.40 | % | 3.25 | % |
| 4.35 | % |
| 3.80 | % |
Rate of compensation increase | n/a | | | n/a | | | 3.50 | | |
Weighted-average assumptions to determine periodic benefit costs for years ended September 30: | | | | | | | | |
|
|
|
|
|
|
|
|
Discount rate | 4.39 | | | 4.40 | | | 5.15 | | 4.35 |
|
| 3.80 |
|
| 3.65 |
|
Rate of compensation increase | n/a | | | n/a | | | 3.50 | | |
Long-term rate of return on plan assets | 7.62 | | | 7.62 | | | 7.62 | | 7.39 |
|
| 7.39 |
|
| 7.38 |
|
The discount rate assumption is intended to reflect the rate at which the retirement benefits could be effectively settled based upon the assumed timing of the benefit payments.
In the United States, Woodward uses a bond portfolio matching analysis based on recently traded, non-callable bonds rated AA or better that have at least $50 million outstanding to determine the benefit obligations at year end.
| | | | | | | | |
|
|
|
|
|
|
|
|
| | | | | | | | |
|
|
|
|
|
|
|
|
| 2016 | | 2015 | | 2014 | 2019 |
| 2018 |
| 2017 |
United Kingdom: | | | | | | | | |
|
|
|
|
|
|
|
|
Weighted-average assumptions to determine benefit obligation at September 30: | | | | | | | | |
|
|
|
|
|
|
|
|
Discount rate | 2.28 | % | | 3.75 | % | | 4.10 | % | 1.74 | % |
| 2.68 | % |
| 2.56 | % |
Rate of compensation increase | 3.40 | | | 3.40 | | | 3.50 | | 3.50 |
|
| 3.60 |
|
| 3.60 |
|
Weighted-average assumptions to determine periodic benefit costs for years ended September 30: | | | | | | | | |
|
|
|
|
|
|
|
|
Discount rate - service cost | 3.86 | | | 4.10 | | | 4.50 | | 2.70 |
|
| 2.58 |
|
| 2.33 |
|
Discount rate - interest cost | 3.63 | | | 4.10 | | | 4.50 | | 2.51 |
|
| 2.36 |
|
| 2.24 |
|
Rate of compensation increase | 3.40 | | | 3.50 | | | 3.50 | | 3.60 |
|
| 3.60 |
|
| 3.40 |
|
Long-term rate of return on plan assets | 5.00 | | | 5.50 | | | 5.50 | | 4.75 |
|
| 4.75 |
|
| 4.75 |
|
|
|
|
|
|
|
|
|
|
|
|
|
|
|
|
|
|
|
| 2019 |
| 2018 |
| 2017 |
Japan: |
|
|
|
|
|
|
|
|
Weighted-average assumptions to determine benefit obligation at September 30: |
|
|
|
|
|
|
|
|
Discount rate | 0.53 | % |
| 0.62 | % |
| 0.58 | % |
Rate of compensation increase | 2.00 |
|
| 2.00 |
|
| 2.00 |
|
Weighted-average assumptions to determine periodic benefit costs for years ended September 30: |
|
|
|
|
|
|
|
|
Discount rate - service cost | 0.80 |
|
| 0.72 |
|
| 0.59 |
|
Discount rate - interest cost | 0.42 |
|
| 0.38 |
|
| 0.45 |
|
Rate of compensation increase | 2.00 |
|
| 2.00 |
|
| 2.02 |
|
Long-term rate of return on plan assets | 2.50 |
|
| 2.50 |
|
| 2.50 |
|
| | | | | | | | |
|
|
|
|
|
|
|
|
| | | | | | | | |
|
|
|
|
|
|
|
|
| 2016 | | 2015 | | 2014 | 2019 |
| 2018 |
| 2017 |
Japan: | | | | | | | | | |
Germany: | |
|
|
|
|
|
|
|
|
Weighted-average assumptions to determine benefit obligation at September 30: | | | | | | | | |
|
|
|
|
|
|
|
|
Discount rate | 0.46 | % | | 0.97 | % | | 1.10 | % | 0.81 | % |
| 1.87 | % |
| n/a |
|
Rate of compensation increase | 2.02 | | | 2.00 | | | 2.00 | | 2.50 |
|
| 2.50 |
|
| n/a |
|
Weighted-average assumptions to determine periodic benefit costs for years ended September 30: | | | | | | | | |
|
|
|
|
|
|
|
|
Discount rate - service cost | 1.27 | | | 1.10 | | | 1.25 | | 2.06 |
|
| 2.05 |
|
| n/a |
|
Discount rate - interest cost | 0.59 | | | 1.10 | | | 1.25 | | 1.53 |
|
| 1.49 |
|
| n/a |
|
Rate of compensation increase | 2.00 | | | 2.00 | | | 2.00 | | 2.50 |
|
| 2.50 |
|
| n/a |
|
Long-term rate of return on plan assets | 3.00 | | | 3.00 | | | 3.00 | | |
In the United Kingdom, Germany and Japan, Woodward uses a high-quality corporate bond yield curve matched with separate cash flows to develop a single rate to determine the single rate equivalent to settle the entire benefit obligations in each jurisdiction. For the fiscal yearyears ended September 30, 2016,2019 and 2018, the discount rate used to determine periodic service cost and interest cost components of the overall benefit costs was based on spot rates derived from the same high-quality corporate bond yield curve used to determine the September 30, 20152018 and 2017 benefit obligation, respectively, matched with separate cash flows for each future year. Prior to this change in method, the discount rate used to determine the periodic benefit costs for the years ending September 30, 2015 and 2014 was based on a single rate equivalent.
| | | | | | | | |
| | | | | | | | |
| 2016 | | 2015 | | 2014 |
Switzerland: | | | | | | | | |
Weighted-average assumptions to determine benefit obligation at September 30: | | | | | | | | |
Discount rate | n/a | | | n/a | | | n/a | |
Rate of compensation increase | n/a | | | n/a | | | n/a | |
Weighted-average assumptions to determine periodic benefit costs for years ended September 30: | | | | | | | | |
Discount rate | n/a | | | n/a | | | 2.25 | % |
Rate of compensation increase | n/a | | | n/a | | | 2.00 | |
Long-term rate of return on plan assets | n/a | | | n/a | | | 2.25 | |
In Switzerland, Woodward used high quality swap rates plus a credit spread of 0.20% in fiscal year 2013 as high quality swaps are available in Switzerland at various durations and trade at higher volumes than bonds. Woodward’s assumed rate in Switzerland did not differ significantly from this benchmark. As of September 30, 2014 Woodward no longer sponsors a defined benefit plan is Switzerland.
Compensation increase assumptions, where applicable, are based upon historical experience and anticipated future management actions.
In determining the long-term rate of return on plan assets, Woodward assumes that the historical long-term compound growth rates of equity and fixed-income securities will predict the future returns of similar investments in the plan portfolio. Investment management and other fees paid out of the plan assets are factored into the determination of asset return assumptions.
Mortality assumptions are based on published mortality studies developed primarily based on past experience of the broad population and modified for projected longevity trends. The projected benefit obligations in the United States as of September 30, 20162019 and September 30, 20152018 were based on the Society of Actuaries (“SOA”) RP-2014 Mortality Tables Report projected back to 2006 using the SOA’s Mortality Improvement Scale MP-2014 (“MP-2014”) and projected forward using a custom projection scale based on MP-2014 with a 10-year convergence period and a long-term rate of 0.75%. As of September 30, 20162019 and September 30, 2015,2018, mortality assumptions in Japan were based on the Standard rates 2014 and mortality assumptions for the United Kingdom pension scheme were based on the Self-administered pension scheme (“SAPS”) S2 “all” tables with a projected 1.5% annual improvement rate. As of September 30, 2019 and mortality assumptions in Germany were based on the Heubeck 2018 G mortality tables whereas at September 30, 2018 mortality assumptions in Germany were based on Heubeck 2005 G mortality tables.
Net periodic benefit costs consist of the following components reflected as expense in Woodward’s Consolidated StatementsStatement of Earnings:
| | | | | | | | | | | | | | | | | | | | | | | | | |
|
|
|
|
|
|
|
|
|
|
|
|
|
|
|
|
|
|
|
|
|
|
|
|
|
| | | | | | | | | | | | | | | | | | | | | | | | | |
|
|
|
|
|
|
|
|
|
|
|
|
|
|
|
|
|
|
|
|
|
|
|
|
|
| | Year Ended September 30, |
| Year Ended September 30, |
| | United States | | Other Countries | | Total |
| United States |
| Other Countries |
| Total |
| | 2016 | | 2015 | | 2014 | | 2016 | | 2015 | | 2014 | | 2016 | | 2015 | | 2014 |
| 2019 |
| 2018 |
| 2017 |
| 2019 |
| 2018 |
| 2017 |
| 2019 |
| 2018 |
| 2017 |
Service cost | | $ | 1,695 | | $ | 2,018 | | $ | 3,516 | | $ | 749 | | $ | 784 | | $ | 988 | | $ | 2,444 | | $ | 2,802 | | $ | 4,504 |
| $ | 1,451 |
| $ | 1,643 |
| $ | 1,675 |
| $ | 2,036 |
| $ | 1,124 |
| $ | 1,133 |
| $ | 3,487 |
| $ | 2,767 |
| $ | 2,808 |
Interest cost | | 5,236 | | 5,956 | | | 6,382 | | | 1,637 | | | 2,128 | | | 2,410 | | | 6,873 | | | 8,084 | | | 8,792 |
| 6,384 |
| 6,004 |
|
| 5,757 |
|
| 1,906 |
|
| 1,526 |
|
| 1,208 |
|
| 8,290 |
|
| 7,530 |
|
| 6,965 |
Expected return on plan assets | | (10,140) | | (10,647) | | | (9,813) | | | (2,659) | | | (3,032) | | | (3,070) | | | (12,799) | | | (13,679) | | | (12,883) |
| (11,986) |
| (11,614) |
|
| (10,529) |
|
| (2,638) |
|
| (2,780) |
|
| (2,605) |
|
| (14,624) |
|
| (14,394) |
|
| (13,134) |
Amortization of: | | | | | | | | | | | | | | | | | | | | | | | | | |
|
|
|
|
|
|
|
|
|
|
|
|
|
|
|
|
|
|
|
|
|
|
|
|
|
Net losses | | 1,292 | | 396 | | | 330 | | | 246 | | | 190 | | | 655 | | | 1,538 | | | 586 | | | 985 |
| 617 |
| 598 |
|
| 1,854 |
|
| 283 |
|
| 291 |
|
| 514 |
|
| 900 |
|
| 889 |
|
| 2,368 |
Net prior service (benefit) cost | | 384 | | 383 | | | 97 | | | - | | | - | | | (4) | | | 384 | | | 383 | | | 93 | |
Settlement loss | | 47 | | - | | | - | | | - | | | - | | | - | | | 47 | | | - | | | - | |
Curtailment gain | | | - | | | - | | | (6,624) | | | - | | | - | | | (915) | | | - | | | - | | | (7,539) | |
Net prior service cost | |
| 709 |
| 709 |
|
| 383 |
|
| - |
|
| - |
|
| - |
|
| 709 |
|
| 709 |
|
| 383 |
Net periodic (benefit) cost | | $ | (1,486) | | $ | (1,894) | | $ | (6,112) | | $ | (27) | | $ | 70 | | $ | 64 | | $ | (1,513) | | $ | (1,824) | | $ | (6,048) |
| $ | (2,825) |
| $ | (2,660) |
| $ | (860) |
| $ | 1,587 |
| $ | 161 |
| $ | 250 |
| $ | (1,238) |
| $ | (2,499) |
| $ | (610) |
The settlement loss in “United States” in the year ended September 30, 2016 pertained to cash payouts to the beneficiaries of the Duarte Pension Plan and associated termination costs.
The curtailment gain in “United States” in the year ended September 30, 2014 pertained to amendments made to one of Woodward’s plans that resulted in a freeze to the benefits of certain U.S. employees in California.
The curtailment gain in “Other Countries” in the year ended September 30, 2014 pertained to workforce reductions related to the closure of Woodward’s Swiss facility in connection with the realignment of the renewable power business that occurred in the third quarter of fiscal year 2013.
The following tables provide a reconciliation of the changes in the projected benefit obligation and fair value of assets for the defined benefit pension plans:
| | | | | | | | | | | | |
|
|
|
|
|
|
|
|
|
|
|
|
| | | | | | | | | | | | |
|
|
|
|
|
|
|
|
|
|
|
|
|
| | At or for the Year Ended September 30, |
| At or for the Year Ended September 30, |
| | United States | | Other Countries | | Total |
| United States |
| Other Countries |
| Total |
| | 2016 | | 2015 | | 2016 | | 2015 | | 2016 | | 2015 |
| 2019 |
| 2018 |
| 2019 |
| 2018 |
| 2019 |
| 2018 |
Changes in projected benefit obligation: | | | | | | | | | | | | | | | | | | |
|
|
|
|
|
|
|
|
|
|
|
|
|
|
|
|
|
|
Projected benefit obligation at beginning of year | | $ | 145,870 | | $ | 137,740 | | $ | 62,231 | | $ | 63,535 | | $ | 208,101 | | $ | 201,275 |
| $ | 150,032 |
| $ | 161,130 |
| $ | 103,485 |
| $ | 66,369 |
| $ | 253,517 |
| $ | 227,499 |
Plan amendment | |
| - |
| - |
|
| 601 |
| - |
| 601 |
| - |
Obligation assumed in L'Orange acquisition | |
| - |
| - |
|
| - |
| 39,257 |
| - |
| 39,257 |
Service cost | | 1,695 | | 2,018 | | 749 | | 784 | | 2,444 | | 2,802 |
|
| 1,451 |
| 1,643 |
|
| 2,036 |
| 1,124 |
| 3,487 |
| 2,767 |
Interest cost | | 5,236 | | 5,956 | | 1,637 | | 2,128 | | 6,873 | | 8,084 |
|
| 6,384 |
| 6,004 |
|
| 1,906 |
| 1,526 |
| 8,290 |
| 7,530 |
Net actuarial losses | | 17,786 | | 4,206 | | 17,190 | | 2,715 | | 34,976 | | 6,921 | |
Net actuarial losses (gains) | |
|
| 23,841 |
| (13,128) |
|
| 22,174 |
| (383) |
| 46,015 |
| (13,511) |
Contribution by participants | | 47 | | 28 | | 20 | | 23 | | 67 | | 51 |
|
| - |
| 34 |
|
| 9 |
| 9 |
| 9 |
| 43 |
Benefits paid | | (9,789) | | (4,078) | | (2,656) | | (2,424) | | (12,445) | | (6,502) |
|
| (6,113) |
| (5,651) |
|
| (3,181) |
| (2,888) |
| (9,294) |
| (8,539) |
Settlements | | 47 | | - | | - | | - | | 47 | | - | |
Foreign currency exchange rate changes | | | - | | | - | | | (7,114) | | | (4,530) | | | (7,114) | | | (4,530) |
|
| - |
|
| - |
|
| (5,495) |
|
| (1,529) |
|
| (5,495) |
|
| (1,529) |
Projected benefit obligation at end of year | | $ | 160,892 | | $ | 145,870 | | $ | 72,057 | | $ | 62,231 | | $ | 232,949 | | $ | 208,101 |
| $ | 175,595 |
| $ | 150,032 |
| $ | 121,535 |
| $ | 103,485 |
| $ | 297,130 |
| $ | 253,517 |
| | | | | | | | | | | | | | | | | | |
|
|
|
|
|
|
|
|
|
|
|
|
|
|
|
|
|
|
Changes in fair value of plan assets: | | | | | | | | | | | | |
|
|
|
|
|
|
|
|
|
|
|
|
|
Fair value of plan assets at beginning of year | | $ | 135,590 | | $ | 142,090 | | $ | 60,663 | | $ | 63,071 | | $ | 196,253 | | $ | 205,161 |
| $ | 165,342 |
| $ | 160,332 |
| $ | 62,380 |
| $ | 64,380 |
| $ | 227,722 |
| $ | 224,712 |
Actual return (loss) on plan assets | | 19,859 | | (2,535) | | 10,202 | | 2,975 | | 30,061 | | 440 | |
Actual return on plan assets | |
|
| 11,327 |
| 10,627 |
|
| 5,121 |
| 1,407 |
| 16,448 |
| 12,034 |
Contributions by the Company | | 226 | | 85 | | 773 | | 1,483 | | 999 | | 1,568 |
|
| - |
| - |
|
| 1,697 |
| 994 |
| 1,697 |
| 994 |
Contributions by plan participants | | 47 | | 28 | | 20 | | 23 | | 67 | | 51 |
|
| - |
| 34 |
|
| 9 |
| 9 |
| 9 |
| 43 |
Benefits paid | | (9,789) | | (4,078) | | (2,656) | | (2,424) | | (12,445) | | (6,502) |
|
| (6,113) |
| (5,651) |
|
| (3,181) |
| (2,888) |
| (9,294) |
| (8,539) |
Settlements | | (47) | | - | | - | | - | | (47) | | - | |
Foreign currency exchange rate changes | | | - | | | - | | | (6,076) | | | (4,465) | | | (6,076) | | | (4,465) |
|
| - |
|
| - |
|
| (2,449) |
|
| (1,522) |
|
| (2,449) |
|
| (1,522) |
Fair value of plan assets at end of year | | $ | 145,886 | | $ | 135,590 | | $ | 62,926 | | $ | 60,663 | | $ | 208,812 | | $ | 196,253 |
| $ | 170,556 |
| $ | 165,342 |
| $ | 63,577 |
| $ | 62,380 |
| $ | 234,133 |
| $ | 227,722 |
Net underfunded status at end of year | | $ | (15,006) | | $ | (10,280) | | $ | (9,131) | | $ | (1,568) | | $ | (24,137) | | $ | (11,848) | |
Net (under)/over funded status at end of year | |
| $ | (5,039) |
| $ | 15,310 |
| $ | (57,958) |
| $ | (41,105) |
| $ | (62,997) |
| $ | (25,795) |
At September 30, 2016,2019, the Company’s defined benefit pension plans in the United Kingdom, Japan and Germany represented $59,896$58,494, $11,110 and $51,931 of the total projected benefit obligation, and in Japan represented $12,161 of the total projected benefit obligation.respectively. At September 30, 2016,2019, the United Kingdom and Japan pension plan assets represented $50,914$52,105 and $11,472 of the total fair value of all plan assets, respectively. The German pension plans are unfunded and Japan represented $12,012 of the total fair value ofhave no plan assets.
The accumulated benefit obligations of the Company’s defined benefit pension plans at September 30, 20162019 was $160,892$175,595 in the United States, $56,389 in the United Kingdom, $10,081 in Japan, and $68,801$51,908 in Other Countries,Germany, and at September 30, 20152018 was $145,870$150,032 in the United States, $50,594 in the United Kingdom, $9,975 in Japan and $59,742$40,358 in Other Countries.Germany.
|
|
|
|
|
|
|
|
|
|
|
|
|
|
|
|
|
|
|
|
|
|
|
|
|
|
|
| Plans with accumulated benefit obligation in excess of plan assets |
| Plans with accumulated benefit obligation less than plan assets |
|
| At September 30, |
| At September 30, |
|
| 2019 |
| 2018 |
| 2019 |
| 2018 |
Projected benefit obligation |
| $ | (286,495) |
| $ | (65,938) |
| $ | (10,635) |
| $ | (187,579) |
Accumulated benefit obligation |
|
| (284,368) |
|
| (65,915) |
|
| (9,605) |
|
| (184,864) |
Fair value of plan assets |
|
| 222,661 |
|
| 23,385 |
|
| 11,472 |
|
| 204,337 |
The following tables provide the amounts recognized in the statement of financial position and accumulated other comprehensive losses for the defined benefit pension plans:
| |
|
|
|
|
|
|
|
|
|
|
|
|
| | | | | | | | | | | | |
|
|
|
|
|
|
|
|
|
|
|
|
| | | | | | | | | | | | |
|
|
|
|
|
|
|
|
|
|
|
|
| | At or for the Year Ended September 30, |
| At or for the Year Ended September 30, |
| | United States | | Other Countries | | Total |
| United States |
| Other Countries |
| Total |
| | 2016 | | 2015 | | 2016 | | 2015 | | 2016 | | 2015 |
| 2019 |
| 2018 |
| 2019 |
| 2018 |
| 2019 |
| 2018 |
Amounts recognized in statement of financial position
consist of: | | | | | | | | | | | | | | | | | | |
|
|
|
|
|
|
|
|
|
|
|
|
|
|
|
|
|
|
Other non-current assets | | $ | - | | $ | - | | $ | - | | $ | 694 | | $ | - | | $ | 694 |
| $ | - |
| $ | 17,068 |
| $ | 838 |
| $ | 1,090 |
| $ | 838 |
| $ | 18,158 |
Accrued liabilities | |
| - |
| - |
| (1,539) |
| (1,322) |
| (1,539) |
| (1,322) |
Other non-current liabilities | | | (15,006) | | | (10,280) | | | (9,131) | | (2,262) | | (24,137) | | (12,542) |
|
| (5,039) |
|
| (1,758) |
|
| (57,256) |
| (40,873) |
| (62,295) |
| (42,631) |
Net underfunded status at end of year | | $ | (15,006) | | $ | (10,280) | | $ | (9,131) | | $ | (1,568) | | $ | (24,137) | | $ | (11,848) | |
Net (under)/over funded status at end of year | |
| $ | (5,039) |
| $ | 15,310 |
| $ | (57,957) |
| $ | (41,105) |
| $ | (62,996) |
| $ | (25,795) |
| | | | | | | | | | | | | | | | | | |
|
|
|
|
|
|
|
|
|
|
|
|
|
|
|
|
|
|
Amounts recognized in accumulated other
comprehensive losses consist of: | | | | | | | | | | | | | |
Amounts recognized in accumulated other
comprehensive income consist of: | |
|
|
|
|
|
|
|
|
|
|
|
|
Unrecognized net prior service cost | | $ | 3,857 | | $ | 4,241 | | $ | - | | $ | - | | $ | 3,857 | | $ | 4,241 |
| $ | 5,750 |
| $ | 6,459 |
| $ | 579 |
| $ | - |
| $ | 6,329 |
| $ | 6,459 |
Unrecognized net losses | | | 33,682 | | | 26,861 | | | 20,795 | | | 13,618 | | | 54,477 | | | 40,479 |
|
| 28,167 |
|
| 4,285 |
|
| 32,641 |
|
| 14,529 |
|
| 60,808 |
|
| 18,814 |
Total amounts recognized | | | 37,539 | | | 31,102 | | | 20,795 | | | 13,618 | | | 58,334 | | | 44,720 |
|
| 33,917 |
|
| 10,744 |
|
| 33,220 |
|
| 14,529 |
|
| 67,137 |
|
| 25,273 |
Deferred taxes | | | (14,305) | | | (11,890) | | | (7,303) | | | (4,817) | | | (21,608) | | | (16,707) |
|
| (11,577) |
|
| (5,892) |
|
| (10,029) |
|
| (5,081) |
|
| (21,606) |
|
| (10,973) |
Amounts recognized in accumulated other comprehensive losses | | $ | 23,234 | | $ | 19,212 | | $ | 13,492 | | $ | 8,801 | | $ | 36,726 | | $ | 28,013 | |
Amounts recognized in accumulated other comprehensive income | |
| $ | 22,340 |
| $ | 4,852 |
| $ | 23,191 |
| $ | 9,448 |
| $ | 45,531 |
| $ | 14,300 |
The following table reconciles the changes in accumulated other comprehensive losses for the defined benefit pension plans:
| | | | | | | | | | | | |
|
|
|
|
|
|
|
|
|
|
|
|
| | | | | | | | | | | | |
|
|
|
|
|
|
|
|
|
|
|
|
| | Year Ended September 30, |
| Year Ended September 30, |
| | United States | | Other Countries | | Total |
| United States |
| Other Countries |
| Total |
| | 2016 | | 2015 | | 2016 | | 2015 | | 2016 | | 2015 |
| 2019 |
| 2018 |
| 2019 |
| 2018 |
| 2019 |
| 2018 |
Accumulated other comprehensive losses at beginning of year | | $ | 31,102 | | $ | 14,491 | | $ | 13,618 | | $ | 11,902 | | $ | 44,720 | | $ | 26,393 |
| $ | 10,744 |
| $ | 24,192 |
| $ | 14,529 |
| $ | 14,198 |
| $ | 25,273 |
| $ | 38,390 |
Net loss | | 8,160 | | 17,390 | | 9,646 | | 2,771 | | 17,806 | | 20,161 | |
Loss due to settlement or curtailment arising during the period | | (47) | | - | | - | | - | | (47) | | - | |
Net loss (gain) | |
|
| 24,499 |
| (12,141) |
| 19,691 |
| 990 |
| 44,190 |
| (11,151) |
Prior service cost due to plan amendment | |
|
| - |
|
| - |
|
| 601 |
|
| - |
|
| 601 |
| $ | - |
Amortization of: | | | | | | | | | | | | |
|
|
|
|
|
|
|
|
|
|
|
|
|
Net losses | | (1,292) | | (396) | | (246) | | (190) | | (1,538) | | (586) |
|
| (617) |
| (598) |
| (283) |
| (292) |
| (900) |
| (890) |
Prior service cost | | (384) | | (383) | | - | | - | | (384) | | (383) |
|
| (709) |
| (709) |
| - |
| - |
| (709) |
| (709) |
Foreign currency exchange rate changes | | | - | | | - | | | (2,223) | | | (865) | | | (2,223) | | | (865) |
|
| - |
|
| - |
|
| (1,318) |
|
| (367) |
|
| (1,318) |
|
| (367) |
Accumulated other comprehensive losses at end of year | | $ | 37,539 | | $ | 31,102 | | $ | 20,795 | | $ | 13,618 | | $ | 58,334 | | $ | 44,720 |
| $ | 33,917 |
| $ | 10,744 |
| $ | 33,220 |
| $ | 14,529 |
| $ | 67,137 |
| $ | 25,273 |
The amounts expected to be amortized from accumulated other comprehensive losses and reported as a component of net periodic benefit cost during fiscal year 20172020 are as follows:
| | | | | | |
|
|
|
|
|
|
| | | | | | |
|
|
|
|
|
|
|
| | United States | | Other Countries | | Total |
| United States |
| Other Countries |
| Total |
Prior service cost | | $ | 383 | | $ | - | | $ | 383 |
| $ | 936 |
| $ | 22 |
| $ | 958 |
Net actuarial losses | | 1,854 | | 533 | | 2,387 |
| 1,430 |
|
| 1,017 |
| 2,447 |
Pension benefit payments are made from the assets of the pension plans. The German pension plans are unfunded, therefore, benefit payments are made from Company contributions into these plans as required to meet the payment obligations. Using foreign exchange rates as of September 30, 20162019 and expected future service assumptions, it is anticipated that the future benefit payments will be as follows:
| | | | | | | | | |
| | | | | | | | | |
Year Ending September 30, | | United States | | Other Countries | | Total |
2017 | | $ | 6,344 | | $ | 2,315 | | $ | 8,659 |
2018 | | | 6,319 | | | 2,249 | | | 8,568 |
2019 | | | 6,980 | | | 2,847 | | | 9,827 |
2020 | | | 7,589 | | | 2,311 | | | 9,900 |
2021 | | | 8,127 | | | 2,442 | | | 10,569 |
2022 – 2026 | | | 46,705 | | | 12,791 | | | 59,496 |
|
|
|
|
|
|
|
|
|
|
|
|
|
|
|
|
|
|
|
|
Year Ending September 30, |
| United States |
| Other Countries |
| Total |
2020 |
| $ | 7,170 |
| $ | 3,631 |
| $ | 10,801 |
2021 |
|
| 7,823 |
|
| 3,363 |
|
| 11,186 |
2022 |
|
| 8,383 |
|
| 3,239 |
|
| 11,622 |
2023 |
|
| 8,924 |
|
| 3,805 |
|
| 12,729 |
2024 |
|
| 9,385 |
|
| 3,695 |
|
| 13,080 |
2025 – 2029 |
|
| 51,139 |
|
| 19,494 |
|
| 70,633 |
Woodward expects its pension plan contributions in fiscal year 20172020 will be $425$657 in the United Kingdom, $234 in Japan and $288$1,061 in Japan.Germany. Woodward expects to have no pension plan contributions in fiscal year 20172020 in the United States.
Pension plan assets
The overall investment objective of the pension plan assets is to earn a rate of return over time which, when combined with Company contributions, satisfies the benefit obligations of the pension plans and maintains sufficient liquidity to pay benefits.
As the timing and nature of the plan obligations varies for each Company sponsored pension plan, investment strategies have been individually designed for each pension plan with a common focus on maintaining diversified investment portfolios that provide for long-term growth while minimizing the risk to principal associated with short-term market behavior. The strategy for each of the plans balances the requirements to generate returns, using investments expected to produce higher returns, such as equity securities, with the need to control risk within the pension plans using less volatile investment assets, such as debt securities. A strategy of more equity-oriented allocation is adopted for those plans which have a longer-term investment plan based on the timing of the associated benefit obligations.
A pension oversight committee is assigned by the Company to each pension plan. Among other responsibilities, each committee is responsible for all asset class allocation decisions. Asset class allocations, which are reviewed by the respective pension committee on at least an annual basis, are designed to meet or exceed certain market benchmarks and align with each plan’s investment objectives. In evaluating the asset allocation choices, consideration is given to the proper long-term level of risk for each plan, particularly with respect to the long-term nature of each plan’s liabilities, the impact of asset allocation on investment results and the corresponding impact on the volatility and magnitude of plan contributions and expense and the impact certain actuarial techniques may have on the plans’ recognition of investment experience. From time to time, the plans may move outside the prescribed asset class allocation in order to meet significant liabilities with respect to one or more individuals approaching retirement.
Risks associated with the plan assets include interest rate fluctuation risk, market fluctuation risk, risk of default by debt issuers and liquidity risk. To manage these risks, the assets are managed by established, professional investment firms and performance is evaluated regularly by the Company’s pension oversight committee against specific benchmarks and each plan’s investment objectives. Liability management and asset class diversification are central to the Company’s risk management approach and overall investment strategy.
The assets of the U.S. plans are invested in actively managed mutual funds. The assets of the plans in Japan and the plan in the United Kingdom and Japan are invested in actively managed pooled investment funds. Each individual mutual fund or pooled investment fund has been selected based on the investment strategy of the related plan, which mirrors a specific asset class within the associated target allocation. The plans in Germany are unfunded and have no plan assets. Pension plan assets at September 30, 20162019 and 20152018 do not include any direct investment in Woodward’s common stock.
The asset allocations are monitored and rebalanced regularly by investment managers assigned to the individual pension plans. The actual allocations of pension plan assets and target allocation ranges by asset class, are as follows:
| | | | | | | | | | | | |
|
|
|
|
|
|
|
|
|
|
|
|
| | | | | | | | | | | | |
|
|
|
|
|
|
|
|
|
|
|
|
| | At September 30, |
| At September 30, |
| | 2016 | | 2015 |
| 2019 |
| 2018 |
| | Percentage of Plan Assets | | Target Allocation Ranges | | Percentage of Plan Assets | | Target Allocation Ranges |
| Percentage of Plan Assets |
| Target Allocation Ranges |
| Percentage of Plan Assets |
| Target Allocation Ranges |
United States: | | | | | | | | | | | | |
|
|
|
|
|
|
|
|
|
|
|
|
Asset Class | | | | | | | | | | | | |
|
|
|
|
|
|
|
|
|
|
|
|
Equity Securities | | 56.4% | | 40.8% | - | 80.8% | | 58.2% | | 40.7% | - | 80.7% |
| 60.6% |
| 41.4% | - | 81.4% |
| 65.1% |
| 41.5% | - | 81.5% |
Debt Securities | | 39.0% | | 29.2% | - | 49.2% | | 41.5% | | 29.3% | - | 49.3% |
| 37.9% |
| 28.6% | - | 48.6% |
| 33.1% |
| 28.5% | - | 48.5% |
Other | | 4.6% | | 0.0% | | 0.3% | | 0.0% |
| 1.5% |
| 0.0% |
| 1.8% |
| 0.0% |
| | 100.0% | | | | | | 100.0% | | | | |
| 100.0% |
|
|
|
|
| 100.0% |
|
|
|
|
United Kingdom: | | | | | | | | | | | | |
|
|
|
|
|
|
|
|
|
|
|
|
Asset Class | | | | | | | | | | | | |
|
|
|
|
|
|
|
|
|
|
|
|
Equity Securities | | 34.7% | | 25.0% | - | 45.0% | | 36.0% | | 40.0% | - | 70.0% |
| 41.6% |
| 30.0% | - | 60.0% |
| 44.8% |
| 30.0% | - | 60.0% |
Debt Securities | | 65.2% | | 40.0% | - | 80.0% | | 63.8% | | 35.0% | - | 65.0% |
| 57.8% |
| 45.0% | - | 70.0% |
| 54.8% |
| 45.0% | - | 70.0% |
Other | | 0.1% | | 0.0% | | 0.2% | | 0.0% |
| 0.6% |
| 0.0% |
| 0.4% |
| 0.0% |
| | 100.0% | | | | | | 100.0% | | | | |
| 100.0% |
|
|
|
|
| 100.0% |
|
|
|
|
Japan: | | | | | | | | | | | | |
|
|
|
|
|
|
|
|
|
|
|
|
Asset Class | | | | | | | | | | | | |
|
|
|
|
|
|
|
|
|
|
|
|
Equity Securities | | 40.0% | | 36.0% | - | 44.0% | | 38.6% | | 36.0% | - | 44.0% |
| 41.4% |
| 36.0% | - | 44.0% |
| 41.0% |
| 36.0% | - | 44.0% |
Debt Securities | | 59.1% | | 55.0% | - | 63.0% | | 60.4% | | 55.0% | - | 63.0% |
| 57.7% |
| 55.0% | - | 63.0% |
| 58.1% |
| 55.0% | - | 63.0% |
Other | | 0.9% | | 0.0% | - | 2.0% | | 1.0% | | 0.0% | - | 2.0% |
| 0.9% |
| 0.0% | - | 2.0% |
| 0.9% |
| 0.0% | - | 2.0% |
| | 100.0% | | | | | | 100.0% | | | | |
| 100.0% |
|
|
|
|
| 100.0% |
|
|
|
|
Actual allocations to each asset class can vary from target allocations due to periodic market value fluctuations, investment strategy changes, and the timing of benefit payments and contributions.
The following table presents Woodward’s pension plan assets using the fair value hierarchy established by U.S. GAAP as of September 30, 20162019 and September 30, 2015.2018.
| | | | | | | | | | | | | | | | | | | | | |
|
|
|
|
|
|
|
|
|
|
|
|
|
|
|
|
|
| | | | | | | | | | | | | | | | | | | | | |
|
|
|
|
|
|
|
|
|
|
|
|
|
|
|
|
|
| | At September 30, 2016 |
| At September 30, 2019 |
| | Level 1 | | Level 2 | | Level 3 | | | |
| Level 1 |
| Level 2 |
| Level 3 |
|
|
|
| | United States | | Other Countries | | United States | | Other Countries | | United States | | Other Countries | | Total |
| United States |
| Other Countries |
| United States |
| Other Countries |
| United States |
| Other Countries |
| Total |
Asset Category: | | | | | | | | | | | | | | | | | | | | | |
|
|
|
|
|
|
|
|
|
|
|
|
|
|
|
|
|
|
|
|
|
Cash and cash equivalents | | $ | 6,741 | | $ | 163 | | $ | - | | $ | - | | $ | - | | $ | - | | $ | 6,904 |
| $ | 2,568 |
| $ | 418 |
| $ | - |
| $ | - |
| $ | - |
| $ | - |
| $ | 2,986 |
Mutual funds: | | | | | | | | | | | | | | | | | | | | | |
|
|
|
|
|
|
|
|
|
|
|
|
|
|
|
|
|
U.S. corporate bond fund | | | 56,813 | | | - | | | - | | | - | | | - | | | - | | | 56,813 |
|
| 64,514 |
|
| - |
| - |
|
| - |
| - |
|
| - |
| 64,514 |
U.S. equity large cap fund | | | 48,506 | | | - | | | - | | | - | | | - | | | - | | | 48,506 |
|
| 56,829 |
|
| - |
| - |
|
| - |
| - |
|
| - |
| 56,829 |
International equity large cap growth fund | | | 33,834 | | | - | | | - | | | - | | | - | | | - | | | 33,834 |
|
| 46,645 |
|
| - |
| - |
|
| - |
| - |
|
| - |
| 46,645 |
Pooled funds: | | | | | | | | | | | | | | | | | | | | | |
|
|
|
|
|
|
|
|
|
|
|
|
|
|
|
|
|
Japanese equity securities | | | - | | | - | | | - | | | 2,536 | | | - | | | - | | | 2,536 |
|
| - |
|
| - |
| - |
|
| 2,518 |
| - |
|
| - |
| 2,518 |
International equity securities | | | - | | | - | | | - | | | 2,258 | | | - | | | - | | | 2,258 |
|
| - |
|
| - |
| - |
|
| 2,226 |
| - |
|
| - |
| 2,226 |
Japanese fixed income securities | | | - | | | - | | | - | | | 5,321 | | | - | | | - | | | 5,321 |
|
| - |
|
| - |
| - |
|
| 4,915 |
| - |
|
| - |
| 4,915 |
International fixed income securities | | | - | | | - | | | - | | | 1,777 | | | - | | | - | | | 1,777 |
|
| - |
|
| - |
| - |
|
| 1,710 |
| - |
|
| - |
| 1,710 |
Global target return equity/bond fund | |
|
| - |
|
| - |
| - |
|
| 12,488 |
| - |
|
| - |
| 12,488 |
Index linked U.K. equity fund | | | - | | | - | | | - | | | 7,982 | | | - | | | - | | | 7,982 |
|
| - |
|
| - |
| - |
|
| 3,738 |
| - |
|
| - |
| 3,738 |
Index linked international equity fund | | | - | | | - | | | - | | | 9,694 | | | - | | | - | | | 9,694 |
|
| - |
|
| - |
| - |
|
| 5,438 |
| - |
|
| - |
| 5,438 |
Index linked U.K. corporate bonds fund | | | - | | | - | | | - | | | 16,180 | | | - | | | - | | | 16,180 |
|
| - |
|
| - |
| - |
|
| 16,737 |
| - |
|
| - |
| 16,737 |
Index linked U.K. government securities fund | | | - | | | - | | | - | | | 5,009 | | | - | | | - | | | 5,009 |
|
| - |
|
| - |
| - |
|
| 5,491 |
| - |
|
| - |
| 5,491 |
Index linked U.K. long-term government securities fund | | | - | | | - | | | - | | | 11,998 | | | - | | | - | | | 11,998 |
|
| - |
|
| - |
|
| - |
|
| 7,898 |
|
| - |
|
| - |
|
| 7,898 |
Total assets | | $ | 145,894 | | $ | 163 | | $ | - | | $ | 62,755 | | $ | - | | $ | - | | $ | 208,812 |
| $ | 170,556 |
| $ | 418 |
| $ | - |
| $ | 63,159 |
| $ | - |
| $ | - |
| $ | 234,133 |
| | | | | | | | | | | | | | | | | | | | | |
|
|
|
|
|
|
|
|
|
|
|
|
|
|
|
|
|
|
|
|
|
| | At September 30, 2015 |
| At September 30, 2018 |
| | Level 1 | | Level 2 | | Level 3 | | | |
| Level 1 |
| Level 2 |
| Level 3 |
|
|
|
| | United States | | Other Countries | | United States | | Other Countries | | United States | | Other Countries | | Total |
| United States |
| Other Countries |
| United States |
| Other Countries |
| United States |
| Other Countries |
| Total |
Asset Category: | | | | | | | | | | | | | | | | | | | | | |
|
|
|
|
|
|
|
|
|
|
|
|
|
|
|
|
|
|
|
|
|
Cash and cash equivalents | | $ | 467 | | $ | 201 | | $ | - | | $ | - | | $ | - | | $ | - | | $ | 668 |
| $ | 2,908 |
| $ | 317 |
| $ | - |
| $ | - |
| $ | - |
| $ | - |
| $ | 3,225 |
Mutual funds: | | | | | | | | | | | | | | | | | | | | | |
|
|
|
|
|
|
|
|
|
|
|
|
|
|
|
|
|
U.S. corporate bond fund | | | 56,210 | | | - | | | - | | | - | | | - | | | - | | | 56,210 |
|
| 54,699 |
|
| - |
| - |
|
| - |
| - |
|
| - |
| 54,699 |
U.S. equity large cap fund | | | 47,517 | | | - | | | - | | | - | | | - | | | - | | | 47,517 |
|
| 60,176 |
|
| - |
| - |
|
| - |
| - |
|
| - |
| 60,176 |
International equity large cap growth fund | | | 31,396 | | | - | | | - | | | - | | | - | | | - | | | 31,396 |
|
| 47,559 |
|
| - |
| - |
|
| - |
| - |
|
| - |
| 47,559 |
Pooled funds: | | | | | | | | | | | | | | | | | | | | | |
|
|
|
|
|
|
|
|
|
|
|
|
|
|
|
|
|
Japanese equity securities | | | - | | | - | | | - | | | 2,116 | | | - | | | - | | | 2,116 |
|
| - |
|
| - |
| - |
|
| 2,506 |
| - |
|
| - |
| 2,506 |
International equity securities | | | - | | | - | | | - | | | 1,982 | | | - | | | - | | | 1,982 |
|
| - |
|
| - |
| - |
|
| 2,214 |
| - |
|
| - |
| 2,214 |
Japanese fixed income securities | | | - | | | - | | | - | | | 4,805 | | | - | | | - | | | 4,805 |
|
| - |
|
| - |
| - |
|
| 4,968 |
| - |
|
| - |
| 4,968 |
International fixed income securities | | | - | | | - | | | - | | | 1,624 | | | - | | | - | | | 1,624 |
|
| - |
|
| - |
| - |
|
| 1,730 |
| - |
|
| - |
| 1,730 |
Global target return equity/bond fund | |
|
| - |
|
| - |
| - |
|
| 12,495 |
| - |
|
| - |
| 12,495 |
Index linked U.K. equity fund | | | - | | | - | | | - | | | 8,687 | | | - | | | - | | | 8,687 |
|
| - |
|
| - |
| - |
|
| 4,326 |
| - |
|
| - |
| 4,326 |
Index linked international equity fund | | | - | | | - | | | - | | | 9,336 | | | - | | | - | | | 9,336 |
|
| - |
|
| - |
| - |
|
| 5,973 |
| - |
|
| - |
| 5,973 |
Index linked U.K. corporate bonds fund | | | - | | | - | | | - | | | 16,613 | | | - | | | - | | | 16,613 |
|
| - |
|
| - |
| - |
|
| 16,121 |
| - |
|
| - |
| 16,121 |
Index linked U.K. government securities fund | | | - | | | - | | | - | | | 4,716 | | | - | | | - | | | 4,716 |
|
| - |
|
| - |
| - |
|
| 4,913 |
| - |
|
| - |
| 4,913 |
Index linked U.K. long-term government securities fund | | | - | | | - | | | - | | | 10,583 | | | - | | | - | | | 10,583 |
|
| - |
|
| - |
|
| - |
|
| 6,817 |
|
| - |
|
| - |
|
| 6,817 |
Total assets | | $ | 135,590 | | $ | 201 | | $ | - | | $ | 60,462 | | $ | - | | $ | - | | $ | 196,253 |
| $ | 165,342 |
| $ | 317 |
| $ | - |
| $ | 62,063 |
| $ | - |
| $ | - |
| $ | 227,722 |
Cash and cash equivalents: equivalents: Cash and cash equivalents held by the Company'sCompany’s pension plans are held on deposit with creditworthy financial institutions. The fair value of the cash and cash equivalents are based on the quoted market price of the respective currency in which the cash is maintained.
Pension assets invested in mutual funds: The assets of the Company’s U.S. pension plans are invested in various mutual funds which invest in both equity and debt securities. The fair value of the mutual funds is determined based on the quoted market price of each fund.
Pension assets invested in pooled funds: The assets of the Company’s Japan and United Kingdom pension plans are invested in pooled investment funds, which include both equity and debt securities. The assets of the United Kingdom pension plan are invested in index-linked pooled funds which aim to replicate the movements of an underlying market index to which the fund is linked. Fair value of the pooled funds is based on the net asset value of shares held by the plan as reported by the fund sponsors. All pooled funds held by plans outside of the United States are considered to be invested in international equity and debt securities. Although the underlying securities may be largely domestic to the plan holding the investment assets, the underlying assets are considered international from the perspective of the Company.
There were no transfers into or out of Level 3 assets in fiscal years 20162019 or 2015.2018.
Other postretirement benefit plans
Woodward provides other postretirement benefits to its employees including postretirement medical benefits and life insurance benefits. Postretirement medical benefits are provided to certain current and retired employees and their covered dependents and beneficiaries in the United States and the United Kingdom. Benefits include the option to elect company provided medical insurance coverage to age 65 and a Medicare supplemental plan after age 65. Life insurance benefits are also provided to certain retirees in the United States under frozen plans which are no longer available to current employees. A September 30 measurement date is utilized to value plan assets and obligations for Woodward’s other postretirement benefit plans.
The postretirement medical benefit plans, other than the plan assumed in an acquisition in fiscal year 2009, were frozen in fiscal year 2006 and no additional employees may participate in the plans. Generally, employees who had attained age 55 and had rendered 10 or more years of service before the plans were frozen were eligible for these postretirement medical benefits.
Certain participating retirees are required to contribute to the plans in order to maintain coverage. The plans provide postretirement medical benefits for approximately 800695 retired employees and their covered dependents and beneficiaries and may provide future benefits to approximately 208 active employees and their covered dependents and beneficiaries, upon retirement, if the employees elect to participate. All the postretirement medical plans are fully insured for retirees who have attained age 65.
The actuarial assumptions used in measuring the net periodic benefit cost and plan obligations of postretirement benefits were as follows:
| | | | | | | | |
|
|
|
|
|
|
|
|
| | | | | | | | |
|
|
|
|
|
|
|
|
| 2016 | | 2015 | | 2014 | 2019 |
| 2018 |
| 2017 |
Weighted-average discount rate used to determine benefit obligation at September 30 | 3.63 | % | | 4.01 | % | | 4.40 | % | 3.05 | % |
| 4.30 | % |
| 3.78 | % |
Weighted-average discount rate used to determine net periodic benefit cost for years ended September 30 | 4.01 | | | 4.40 | | | 5.14 | | 4.30 |
|
| 3.80 |
|
| 3.63 |
|
The discount rate assumption is intended to reflect the rate at which the postretirement benefits could be effectively settled based upon the assumed timing of the benefit payments.
In the United States, Woodward used a bond portfolio matching analysis based on recently traded, non-callable bonds rated AA or better that have at least $50 million outstandingto determine the benefit obligations at year end.
In the United Kingdom, Woodward uses a high-quality corporate bond yield curve matched with separate cash flows to develop a single rate to determine the single rate equivalent to settle the entire benefit obligations in each jurisdiction. For the fiscal year ended September 30, 2016, the discount rate used to determine periodic service cost and interest cost components of the overall benefit costs was based on spot rates derived from the same high-quality corporate bond yield curve used to determine the September 30, 2015 benefit obligation matched with separate cash flows for each future year. Prior to this change in method, the discount rate used to determine the periodic benefit costs for the years ending September 30, 2015 and 2014 was based on a single rate equivalent.
Mortality assumptions are based on published mortality studies developed primarily based on past experience of the broad population and modified for projected longevity trends. The projected benefit obligations in the United States as of September 30, 20162019 and September 2015 was30, 2018 mortality assumptions were based on the SOA’s RP-2014 Mortality Tables Report projected back to 2006
using the SOA’s MP-2014 and projected forward using a custom projection scale based on MP-2014 with a 10-year convergence period and a long-term rate of 0.75%. As of September 30, 20162019 and September 30, 2015,2018, mortality assumptions for the United Kingdom postretirement medical plan were based on the SAPS S2 “all” tables with a projected 1.5% annual improvement rate.
Assumed healthcare cost trend rates at September 30, were as follows:
| | | | | | | | |
|
|
|
|
|
|
|
|
| | | | | | | | |
|
|
|
|
|
|
|
|
| | | | 2016 | | 2015 |
|
|
| 2019 |
| 2018 |
Health care cost trend rate assumed for next year | | | | 7.00 | % | | 7.00 | % |
|
|
| 6.25 | % |
| 6.50 | % |
Rate to which the cost trend rate is assumed to decline | | | | | | | | |
|
|
|
|
|
|
|
|
(the ultimate trend rate) | | | | 5.00 | % | | 5.00 | % |
|
|
| 5.00 | % |
| 5.00 | % |
Year that the rate reaches the ultimate trend rate | | | | 2025 | | | 2024 | |
|
|
| 2025 |
|
| 2025 |
|
Healthcare costs have generally trended upward in recent years, sometimes by amounts greater than 5%. Assumed health care cost trend rates have a significant effect on the amounts reported for postretirement medical plans. A one-percentage-point change in assumed health care cost trend rates would have the following effects:
| | | | | | | |
| | | | | | | |
| | | Change In Health Care Cost Trend Rate |
| | | 1% increase | | 1% decrease |
Effect on projected fiscal year 2017 service and interest cost | | | $ | 126 | | $ | (110) |
Effect on accumulated postretirement benefit obligation at September 30, 2016 | | | | 3,415 | | | (2,993) |
|
|
|
|
|
|
|
|
|
|
|
|
|
|
|
|
|
|
| Change In Health Care Cost Trend Rate |
|
|
| 1% increase |
| 1% decrease |
Effect on projected fiscal year 2020 service and interest cost |
|
| $ | 74 |
| $ | (65) |
Effect on accumulated postretirement benefit obligation at September 30, 2019 |
|
|
| 2,417 |
|
| (2,128) |
Net periodic benefit costs consist of the following components reflected as expense in Woodward’s Consolidated Statements of Earnings:
| | | | | | |
|
|
|
|
|
|
| | | | | | |
|
|
|
|
|
|
| | Year Ended September 30, |
| Year Ended September 30, |
| | 2016 | | 2015 | | 2014 |
| 2019 |
| 2018 |
| 2017 |
Service cost | | $ | 22 | | $ | 30 | | $ | 47 |
| $ | 5 |
| $ | 7 |
| $ | 14 |
Interest cost | | 1,048 | | 1,233 | | 1,432 |
|
| 1,154 |
|
| 1,165 |
|
| 1,244 |
Amortization of: | | | | | | |
|
|
|
|
|
|
|
|
|
Net (gains) losses | | 156 | | (73) | | (200) | |
Net losses | |
|
| 55 |
|
| 94 |
|
| 201 |
Net prior service benefit | | | (158) | | | (158) | | | (158) |
|
| (5) |
|
| (158) |
|
| (158) |
Curtailment gain | |
|
| - |
|
| (330) |
|
| - |
Net periodic cost | | $ | 1,068 | | $ | 1,032 | | $ | 1,121 |
| $ | 1,209 |
| $ | 778 |
| $ | 1,301 |
The following table provides a reconciliation of the changes in the accumulated postretirement benefit obligation and fair value of assets for the postretirement benefits for the fiscal years ended September 30:
| | | | |
|
|
|
|
| | | | |
|
|
|
|
| | Year Ended September 30, |
| Year Ended September 30, |
| | 2016 | | 2015 |
| 2019 |
| 2018 |
Changes in accumulated postretirement benefit obligation: | | | | | | |
|
|
|
|
|
|
Accumulated postretirement benefit obligation at beginning of year | | $ | 34,927 | | $ | 29,225 |
| $ | 27,985 |
| $ | 32,252 |
Service cost | | | 22 | | | 30 |
|
| 5 |
|
| 7 |
Interest cost | | | 1,048 | | | 1,233 |
|
| 1,154 |
|
| 1,165 |
Premiums paid by plan participants | | | 1,299 | | | 1,613 |
|
| 1,192 |
|
| 1,311 |
Net actuarial losses | | | 1,912 | | | 6,705 | |
Net actuarial gains | |
|
| (373) |
|
| (2,716) |
Benefits paid | | | (3,503) | | | (3,848) |
|
| (3,292) |
|
| (3,707) |
Curtailment | |
|
| - |
|
| (330) |
Foreign currency exchange rate changes | | | (75) | | | (31) |
|
| - |
|
| 3 |
Accumulated postretirement benefit obligation at end of year | | $ | 35,630 | | $ | 34,927 |
| $ | 26,671 |
| $ | 27,985 |
Changes in fair value of plan assets: | | | | | | |
|
|
|
|
|
|
Fair value of plan assets at beginning of year | | $ | - | | $ | - |
| $ | - |
| $ | - |
Contributions by the Company | | | 2,204 | | | 2,235 | |
Contributions by the company | |
|
| 2,100 |
|
| 2,396 |
Premiums paid by plan participants | | | 1,299 | | | 1,613 |
|
| 1,192 |
|
| 1,311 |
Benefits paid | | | (3,503) | | | (3,848) |
|
| (3,292) |
|
| (3,707) |
Fair value of plan assets at end of year | | $ | - | | $ | - |
| $ | - |
| $ | - |
Net underfunded status at end of year | | $ | (35,630) | | $ | (34,927) | |
Funded status at end of year | |
| $ | (26,671) |
| $ | (27,985) |
The following tables provide the amounts recognized in the statement of financial position and accumulated other comprehensive losses for the postretirement plans:
| | | | |
|
|
|
|
| | | | |
|
|
|
|
| | Year Ended September 30, |
| Year Ended September 30, |
| | 2016 | | 2015 |
| 2019 |
| 2018 |
Amounts recognized in statement of financial position consist of: | | | | | | |
|
|
|
|
|
|
Accrued liabilities | | $ | (2,505) | | $ | (2,481) |
| $ | (2,048) |
| $ | (2,249) |
Other non-current liabilities | | | (33,125) | | | (32,446) |
|
| (24,623) |
|
| (25,736) |
Funded status at end of year | | $ | (35,630) | | $ | (34,927) |
| $ | (26,671) |
| $ | (27,985) |
| | | | | | |
|
|
|
|
|
|
Amounts recognized in accumulated other comprehensive losses consist of: | | | | | | | |
Unrecognized net prior service benefit | | $ | (318) | | $ | (477) | |
Unrecognized net losses | | | 5,484 | | | 3,745 | |
Amounts recognized in accumulated other comprehensive income consist of: | |
|
|
|
|
|
|
Unrecognized net prior service (benefit) cost | |
| $ | 4 |
| $ | (1) |
Unrecognized net (gains) losses | |
|
| (3) |
|
| 425 |
Total amounts recognized | | | 5,166 | | | 3,268 |
|
| 1 |
|
| 424 |
Deferred taxes | | | (1,979) | | | (1,267) |
|
| (414) |
|
| (518) |
Amounts recognized in accumulated other comprehensive losses | | $ | 3,187 | | $ | 2,001 | |
Amounts recognized in accumulated other comprehensive income | |
| $ | (413) |
| $ | (94) |
Woodward pays plan benefits from its general funds; therefore, there are no segregated plan assets as of September 30, 20162019 or September 30, 2015. 2018.
The accumulated benefit obligations of the Company’s postretirement plans were $35,630$26,671 at September 30, 20162019 and $34,927$27,985 at September 30, 2015.2018.
The following table reconciles the changes in accumulated other comprehensive losses (earnings) for the other postretirement benefit plans:
| | | | | | |
| | | | | | |
| | Year Ended September 30, |
| | 2016 | | 2015 |
Accumulated other comprehensive losses (earnings) at beginning of year | | $ | 3,268 | | $ | (3,666) |
Net (gain) loss | | | 1,912 | | | 6,705 |
Amortization of: | | | | | | |
Net gains (losses) | | | (156) | | | 73 |
Prior service benefit (cost) | | | 158 | | | 158 |
Foreign currency exchange rate changes | | | (16) | | | (2) |
Accumulated other comprehensive losses at end of year | | $ | 5,166 | | $ | 3,268 |
|
|
|
|
|
|
|
|
|
|
|
|
|
|
|
| Year Ended September 30, |
|
| 2019 |
| 2018 |
Accumulated other comprehensive losses at beginning of year |
| $ | 424 |
| $ | 3,074 |
Net gain |
|
| (373) |
|
| (2,654) |
Curtailment arising during the period |
|
| - |
|
| (59) |
Amortization of: |
|
|
|
|
|
|
Net losses |
|
| (55) |
|
| (95) |
Prior service benefit |
|
| 5 |
|
| 158 |
Accumulated other comprehensive losses at end of year |
| $ | 1 |
| $ | 424 |
Using foreign currency exchange rates as of September 30, 20162019 and expected future service, it is anticipated that the future Company contributions to pay benefits, excluding participate contributions, will be as follows:
| | | |
| | | |
Year Ending September 30, | | | |
2017 | | $ | 4,039 |
2018 | | | 4,066 |
2019 | | | 4,096 |
2020 | | | 4,080 |
2021 | | | 4,060 |
2022 – 2026 | | | 19,306 |
|
|
|
|
|
|
|
|
Year Ending September 30, |
|
|
|
2020 |
| $ | 3,237 |
2021 |
|
| 3,220 |
2022 |
|
| 3,183 |
2023 |
|
| 3,125 |
2024 |
|
| 3,061 |
2025 – 2029 |
|
| 13,891 |
Multiemployer defined benefit plans
Woodward operates two multiemployer defined benefit plans for certain employees in both the Netherlands and Japan. The amounts of contributions associated with the multiemployer defined benefit plans were as follows:
| | | | | | | | | |
| | | | | | | | | |
| | | Year Ended September 30, |
| | 2016 | | 2015 | | 2014 |
Company contributions | | $ | 475 | | $ | 600 | | $ | 728 |
|
|
|
|
|
|
|
|
|
|
|
|
|
|
|
|
|
|
|
|
|
|
| Year Ended September 30, |
|
| 2019 |
| 2018 |
| 2017 |
Company contributions |
| $ | 252 |
| $ | 334 |
| $ | 292 |
The plan in the Netherlands is a quasi-mandatory plan that covers all of Woodward’s employees in the Netherlands and is part of the Dutch national pension system.
The Company may elect to withdraw from its multiemployer plan in Japan, although it has no plans to do so. If the Company elects to withdraw from the Japanese plan, it would incur an immaterial one-time contribution cost. Changes in Japanese regulations could trigger reorganization of or abolishment of the Japanese multiemployer plan, which could impact future funding levels.
Note 18.20. Stockholders’ equity
Common Stock
Holders of Woodward’s common stock are entitled to receive dividends when and as declared by Woodward’s Boardboard of Directorsdirectors and have the right to one vote per share on all matters requiring stockholder approval.
Dividends declared and paid during the 2016, 20152019, 2018 and 20142017 fiscal years were:
| | | | | | |
|
|
|
|
|
|
| | | | | | |
|
|
|
|
|
|
| | Year Ended September 30, |
| Year Ended September 30, |
| | 2016 | | 2015 | | 2014 |
| 2019 |
| 2018 |
| 2017 |
Dividends declared and paid | | $ | 26,606 | | $ | 24,646 | | $ | 21,263 |
| $ | 39,066 |
| $ | 34,003 |
| $ | 29,745 |
Dividend per share amount | | 0.43 | | 0.38 | | 0.32 |
|
| 0.6300 |
|
| 0.5525 |
| 0.4850 |
Stock repurchase program
In the secondfirst quarter of fiscal year 2015,2017, Woodward’s Boardboard of Directorsdirectors terminated the Company’s prior stock repurchase program and replaced it with a new program for the repurchase of up to $300,000$500,000 of Woodward’s outstanding
shares of common stock on the open market or in privately negotiated transactions over a three-yearthree year period that will endended in 2018November 2019 (the “2015“2017 Authorization”).
In the third quarter of fiscal year 2015,2019, Woodward entered into an ASR Agreement with Goldman under which Woodward repurchasedpurchased 1,102 shares of its common stock for an aggregate purchase price of $125,000. A total of 2,506 shares of$110,311 under the 2017 Authorization pursuant to a 10b5-1 plan. Woodward repurchased 0 common stock were repurchased pursuant to the ASR Agreement under the 2015 Authorization.
In the first quarter of2017 Authorization in fiscal year 2016, Woodward executed a 10b5-1 plan to repurchase up to $125,000 of its common stock for a period that ended on April 20, 2016. During2018. In fiscal year 2016,2017, Woodward purchased 2,6351,027 shares of its common stock for $125,000$71,197, of which 491 shares were purchased pursuant to thea 10b5-1 plan underand 536 shares were purchased pursuant to a 10b-18 plan.
Effective upon the 2015 Authorization.expiration of the 2017 Authorization, Woodward’s board of directors approved a new program for the repurchase of up to $500,000 of Woodward’s outstanding shares of common stock on the open market or in privately negotiated transactions over a three year period that will end in 2022.
Stock-based compensation
Non-qualified stock option awards and restricted stock awards are granted to key management members and directors of the Company. The grant date for these awards is used for the measurement date. Vesting would be accelerated in the event of retirement, disability, or death of a participant, or change in control of the Company, as defined in the individual stock option agreements. These awards are valued as of the measurement date and are amortized on a straight-line basis over the requisite vesting period for all awards, including awards with graded vesting. Stock for exercised stock options and for restricted stock awards is issued from treasury stock shares.
Provisions governing outstanding stock option awards are included in the 2017 Omnibus Incentive Plan, as amended from time to time (the “2017 Plan”) and the 2006 Omnibus Incentive Plan (the “2006 Plan”) and the 2002 Stock Option, as applicable.
The 2017 Plan (the “2002 Plan”). The 2002 Plan provided that no further grants would be made after December 31, 2006. The 2006 Plan, which was approved by Woodward’s stockholders in January 2017 and became effective January 25, 2006, expired in fiscal year 2016. No further grants will be made under either the 2002 Plan or the 2006 Plan. A proposal foris a successor plan to the 2006 Plan. As of September 14, 2016, the effective date of the 2017 Plan, will be submitted byWoodward’s board of directors delegated authority to administer the Company for stockholder approval at2017 Plan to the compensation committee of the board of directors (the “Committee”), including, but not limited to, the power to determine the recipients of awards and the terms of those awards. On January 25, 2017 Annual Stockholder Meeting.
Stock-based compensation expense recognized was as follows:
| | | | | | | | | |
| | | | | | | | | |
| | Year Ended September 30, |
| | 2016 | | 2015 | | 2014 |
Employee stock-based compensation expense | | $ | 15,122 | | $ | 14,255 | | $ | 11,241 |
Stock options
Woodward’s 2006 Plan, which was approved by30, 2019, Woodward’s stockholders provided for the grant of up to 7,410approved an additional 1,400 shares of Woodward’s common stock including into be made available for future grants. Under the form2017 Plan, there were approximately 1,783 shares of Woodward’s common stock options to its employees and directors. Equity awards under the 2006 Plan includeavailable for future grants as of stockSeptember 30, 2019.
Stock options to Woodward employees and directors.
Woodward believes that these stock options align the interests of its employees and directors with thosethe interests of its stockholders. Stock option awards are granted with an exercise price equal to the market price of Woodward’s stock at the date of grant,the grants are awarded, a ten-yearten year term, and generally have a four-yearfour year vesting schedule at a rate of 25% per year.
The fair value of options granted wasis estimated onas of the grant date of grant using the Black-Scholes-Merton option-valuation model using the assumptions in the following table. Woodward calculates the expected term, which represents the average period of time that stock options granted are expected to be outstanding, based upon historical experience of plan participants. Expected volatility is based on historical volatility using daily stock price observations. The estimated dividend yield is based upon Woodward’s historical dividend practice and the market value of its common stock. The risk-free rate is based on the U.S. treasury yield curve, for periods within the contractual life of the stock option, at the time of grant.
| | | | | | | | | | | | | |
|
|
|
|
|
|
|
|
|
|
|
|
|
| | | | | | | | | | | | | |
|
|
|
|
|
|
|
|
|
|
|
|
|
| Year Ended September 30, | Year Ended September 30, |
| 2016 | | 2015 | | 2014 | 2019 |
| 2018 |
| 2017 |
Weighted-average exercise price per share | | $ | 79.84 |
|
| 78.91 |
|
| 62.74 |
|
Weighted-average grant date market value of Woodward stock | | $ | 79.84 |
|
| 78.91 |
|
| 69.45 |
|
Expected term (years) | | 6.3 | - | 8.7 | | | 6.2 | - | 8.8 | | | 5.8 | - | 8.6 | |
| 6.5 | - | 8.7 |
| 6.4 | - | 8.7 |
| 6.0 | - | 8.7 |
|
Estimated volatility | | 34.5% | - | 35.1% | | 36.5% | | 38.5% | |
| 25.7% | - | 31.0% |
| 29.1% | - | 32.7% |
| 30.6% | - | 33.7% |
|
Estimated dividend yield | | 1.0% | | 0.7% | | 0.8% | |
| 0.6% | - | 0.8% |
| 0.6% |
| 0.8% |
| 0.7% |
|
Risk-free interest rate | | 1.7% | - | 2.0% | | 2.0% | - | 2.3% | | 1.7% | - | 2.5% | |
| 1.5% | - | 3.1% |
| 2.1% | - | 2.8% |
| 2.0% | - | 2.5% |
|
The weighted average grant date fair value of options granted follows:
| | | | | | | | | |
| | | | | | | | | |
| | Year Ended September 30, |
| | 2016 | | 2015 | | 2014 |
Weighted-average grant date fair value of options | | $ | 13.39 | | $ | 17.02 | | $ | 15.63 |
|
|
|
|
|
|
|
|
|
|
|
|
|
|
|
|
|
|
|
|
|
| Year Ended September 30, |
|
| 2019 |
| 2018 |
| 2017 |
Weighted-average grant date fair value of options |
| $ | 24.12 |
| $ | 25.66 |
| $ | 24.98 |
The following is a summary of the activity for stock option awards during the fiscal year ended September 30, 2016:2019:
| | | | |
|
|
|
|
| | | | |
|
|
|
|
| | Number | | Weighted-Average Exercise Price |
| Number |
| Weighted-Average Exercise Price Per Share |
Balance at September 30, 2015 | | | 4,641 | | $ | 32.28 | |
Balance at September 30, 2018 | |
|
| 5,611 |
| $ | 45.42 |
Options granted | | 1,055 | | 40.26 |
| 924 |
| 79.84 |
Options exercised | | (732) | | 22.74 |
| (1,102) |
| 32.71 |
Options forfeited | | | (20) | | 42.75 |
| (44) |
| 68.51 |
Balance at September 30, 2016 | | | 4,944 | | 35.35 | |
Options expired | |
|
| (2) |
| 72.58 |
Balance at September 30, 2019 | |
|
| 5,387 |
| 53.73 |
Exercise prices of stock options outstanding as of September 30, 20162019 range from $18.49$25.57 to $46.55.$116.10.
Changes in non-vested stock options during the fiscal year ended September 30, 20162019 were as follows:
| | | | |
|
|
|
|
| | | | |
|
|
|
|
| | Number | | Weighted-Average Grant Date Fair Value |
| Number |
| Weighted-Average Grant Date Fair Value Per Share |
Balance at September 30, 2015 | | | 1,724 | | $ | 15.92 | |
Balance at September 30, 2018 | |
|
| 1,988 |
| $ | 21.64 |
Options granted | | 1,055 | | 13.39 |
| 924 |
| 24.12 |
Options vested | | (684) | | 15.15 |
| (800) |
| 19.81 |
Options forfeited | | | (20) | | 15.08 |
|
| (44) |
| 22.91 |
Balance at September 30, 2016 | | | 2,075 | | 14.90 | |
Balance at September 30, 2019 | |
|
| 2,068 |
| 23.43 |
Information about stock options that have vested, or are expected to vest, and are exercisable at September 30, 20162019 was as follows:
| | | | | | | | |
|
|
|
|
|
|
|
|
| | | | | | | | |
|
|
|
|
|
|
|
|
| | Number | | Weighted- Average Exercise Price | | Weighted- Average Remaining Life in Years | | Aggregate Intrinsic Value |
| Number |
| Weighted- Average Exercise Price |
| Weighted- Average Remaining Life in Years |
| Aggregate Intrinsic Value |
Options outstanding | | | 4,944 | | $ | 35.35 | | | 6.1 | | $ | 134,129 |
|
| 5,387 |
| $ | 53.73 |
|
| 5.9 |
| $ | 291,465 |
Options vested and exercisable | | 2,869 | | 30.87 | | 4.6 | | 90,702 |
|
| 3,320 |
| 42.43 |
| 4.5 |
| 217,114 |
Options vested and expected to vest | | 4,856 | | 35.23 | | 6.0 | | 132,321 |
|
| 5,297 |
| 53.30 |
| 5.8 |
| 288,839 |
Other information follows:
| | | | | | |
|
|
|
|
|
|
| | | | | | |
|
|
|
|
|
|
| | Year Ended September 30, |
| Year Ended September 30, |
| | 2016 | | 2015 | | 2014 |
| 2019 |
| 2018 |
| 2017 |
Total fair value of stock options vested | | $ | 10,374 | | $ | 9,656 | | $ | 9,459 |
| $ | 15,863 |
| $ | 13,944 |
| $ | 11,639 |
Total intrinsic value of options exercised | | 23,178 | | 18,876 | | 14,549 |
| 70,866 |
| 16,690 |
| 16,416 |
Cash received from exercises of stock options | | 15,892 | | 8,400 | | 9,772 |
| 36,044 |
| 9,132 |
| 14,196 |
Excess tax benefit realized from exercise of stock options | | 6,472 | | 6,959 | | 3,751 |
| 13,416 |
| 3,524 |
| 4,383 |
Restricted stock units
Restricted Stock
Instock units have been granted to certain employees of L’Orange (at acquisition) and other current Woodward members in key management positions. Each restricted stock unit entitles the first quarterholder to one share of fiscalthe Company’s common stock upon vesting. The restricted stock units were granted with a two year 2014, Woodward granted an awardvesting schedule and vest on the one and two year anniversaries of 24 sharesthe grant date at a rate of 50% per year. The restricted stock units do not participate in dividends during the vesting period. The fair value of restricted stock to its Chief Executive Officer and President, Thomas A. Gendron. Subject to Mr. Gendron’s continued employment byunits granted were estimated using the Company, these sharesclosing price of restrictedWoodward common stock will vest 100% following the end of the Company’s fiscal year 2017 if a specified cumulative earnings per share (“EPS”) target is met or exceeded for fiscal years 2014 through 2017. If this EPS target is not met, all shares of restricted stock will be forfeited by Mr. Gendron.
The shares of restricted stock were awarded to Mr. Gendron pursuant to a form restricted stock agreement approved by Woodward’s Compensation Committee (the “Committee”) of the Board of Directors. The restricted stock agreement generally provides that: if the recipient of a restricted stock award is terminated from the Company for any reason other than death or disability during the restricted period, all shares of restricted stock will be immediately forfeited; if the recipient dies or becomes permanently disabled prior to the recipient’s termination and during the restricted period, all restrictions will lapse and the shares of restricted stock will fully vest immediately; similarly, in the event of a Change in Control (as defined in the form of restricted stock agreement) of the Company during the restricted period and prior to the recipient’s termination
for any reason, all restrictions will lapse and the shares of restricted stock will fully vest immediately; during the restricted period, a recipient may exercise full voting rights with respect to the shares of restricted stock; dividends on the shares of restricted stock will accrue, but will not be paid, during the restricted period; and all dividends accrued during the restricted period will be paid upon any vesting of the shares of restricted stock, without payment of interest, provided that if the shares of restricted stock are forfeited for any reason, all accrued dividends will likewise be forfeited. The form of restricted stock agreement also includes adjustment provisions in the event the Company engages in certain recapitalization or similar transactions or in the event of a change of law or regulation. Upon vesting, shares become freely transferrable.grant date.
A summary of the activity for restricted stock awardsunits in the fiscal year ended September 30, 2016 follows:2019:
|
|
|
|
|
|
|
|
|
|
|
|
|
|
|
|
| Number |
| Weighted-Average Grant Date Fair Value per Unit |
Balance at September 30, 2018 |
|
| 10 |
| $ | 82.71 |
Units granted |
|
| 4 |
|
| 102.94 |
Units vested |
|
| (5) |
|
| 82.71 |
Units forfeited |
|
| - |
|
| n/a |
Balance at September 30, 2019 |
|
| 9 |
|
| 91.55 |
Stock-based compensation expense
| | | | | | |
| | | | | | |
| | Number | | Fair Value per Share |
Balance at September 30, 2015 | | | 24 | | $ | 39.43 |
Shares granted | | | - | | | n/a |
Shares vested | | | - | | | n/a |
Shares forfeited | | | - | | | n/a |
Balance at September 30, 2016 | | | 24 | | | 39.43 |
Woodward recognizes stockstock-based compensation expense on a straight-line basis over the requisite service period. Pursuant to the form stock option agreements used by the Company, with terms approved by the administrator of the applicable plan, the requisite service period can be less than the four-yearfour year vesting period due tobased on grantee’s retirement eligibility. As such, the recognition of stock-based compensation expense associated with some stock option grants can be accelerated to a period of less than four years, including immediate recognition of stock-based compensation expense on the date of grant.
Stock-based compensation expense recognized was as follows:
|
|
|
|
|
|
|
|
|
|
|
|
|
|
|
|
|
|
|
|
|
| Year Ended September 30, |
|
| 2019 |
| 2018 |
| 2017 |
Employee stock-based compensation expense |
| $ | 18,146 |
| $ | 18,229 |
| $ | 17,282 |
At September 30, 2016,2019, there was approximately $8,067$12,713 of total unrecognized compensation costexpense related to non-vested stock-based compensation arrangements, including both stock options and restricted stock awards, granted under the 2002 Plan and the 2006 Plan (for which no further grants will be made under either plan).awards. The pre-vesting forfeiture rates for purposes of determining stock-based compensation costexpense recognized were estimated to be 0% for members of Woodward’s board of directors and 9% for all others. The remaining unrecognized compensation cost is expected to be recognized over a weighted-average period of approximately 2.12.2 years.
Note 19.21. Commitments and contingencies
Woodward has entered into operating leases for certain facilities, equipment, and equipmentsoftware with terms in excess of one year under agreements that expire at various dates.dates. Some leases require the payment of property taxes, insurance, and maintenance costs in addition to rental payments. Woodward has also entered into capital leases for equipment with terms in excess of one year under agreements that expire at various dates. Future minimum payments required under these leases excluding available option renewals, are as follows:
| | | | |
|
|
|
|
| | | | |
|
|
|
|
Year Ending September 30, | Operating Leases | | Capital Leases | Operating Leases |
| Capital
Leases |
2017 | $ | 4,755 | | $ | 404 | |
2018 | | 3,150 | | 423 | |
2019 | | 2,175 | | 444 | |
2020 | | 2,003 | | 113 | $ | 6,667 |
| $ | 213 |
2021 | | 1,899 | | - |
| 5,119 |
|
| 98 |
2022 | |
| 3,823 |
|
| 33 |
2023 | |
| 2,899 |
|
| 3 |
2024 | |
| 2,378 |
|
| - |
Thereafter | | 1,630 | | | - |
| 6,033 |
|
| - |
Total | $ | 15,612 | | $ | 1,384 | $ | 26,919 |
| $ | 347 |
Rent expense for all operating leases totaled:follows:
| | | | | | | | |
| | | | | | | | |
| Year Ended September 30, |
| 2016 | | 2015 | | 2014 |
Rent expense | $ | 7,359 | | $ | 7,299 | | $ | 10,897 |
Ut now |
|
|
|
|
|
|
|
|
|
|
|
|
|
|
|
|
|
| Year Ended September 30, |
| 2019 |
| 2018 |
| 2017 |
Rent expense | $ | 7,578 |
| $ | 8,348 |
| $ | 8,302 |
Woodward enters into unconditional purchase obligation arrangements (i.e. issuance of purchase orders, obligations to transfer funds in the future for fixed or minimum quantities of goods or services at fixed or minimum prices, such as "take-or-
pay""take-or-pay" contracts) in the normal course of business to ensure that adequate levels of sourced product are available to Woodward. Future minimum unconditional purchase obligations are as follows:
| | |
|
|
| | |
|
|
Year Ending September 30, | | |
|
|
2017 | $ | 303,567 | |
2018 | | 14,642 | |
2019 | | 685 | |
2020 | | 639 | $ | 419,944 |
2021 | | 93 |
| 13,335 |
2022 | |
| 1,155 |
2023 | |
| - |
2024 | |
| - |
Thereafter | | 10 |
| - |
Total | $ | 319,636 | $ | 434,434 |
| | |
|
|
The U.S. Government, and other governments, may terminate any of Woodward’s government contracts (and, in general, subcontracts) at their convenience, as well as for default based on specified performance measurements. If any of Woodward’s government contracts were to be terminated for convenience, the Company generally would be entitled to receive payment for work completed and allowable termination or cancellation costs. If any of Woodward’s government contracts were to be terminated for Woodward’s default, the U.S. Government generally would pay only for the work accepted, and could require Woodward to pay the difference between the original contract price and the cost to re-procure the contract items, net of the work accepted from the original contract. The U.S. Government could also hold Woodward liable for damages resulting from the default.
Woodward is currently involved in claims, pending or threatened litigation or other legal proceedings, investigations and/or regulatory proceedings arising in the normal course of business, including, among others, those relating to product liability claims, employment matters, worker’s compensation claims, contractual disputes, product warranty claims and alleged violations of various laws and regulations. Woodward accrues for known individual matters using estimates of the most likely amount of loss where it believes that it is probable the matter will result in a loss when ultimately resolved using estimates of the most likely amount of loss. and such loss is reasonably estimable.
Legal costs are expensed as incurred and are classified in “Selling, general and administrative expenses” on the Consolidated Statements of Earnings.
Woodward is partially self-insured in the United States for healthcare and worker’s compensation up to predetermined amounts, above which third party insurance applies. Management regularly reviews the probable outcome of theserelated claims and proceedings, the expenses expected to be incurred, the availability and limits of the insurance coverage, and the established accruals for liabilities.
While the outcome of pending claims, legal and regulatory proceedings, and investigations cannot be predicted with certainty, management believes that any liabilities that may result from these claims, proceedings and investigations will not have a material effect on Woodward'sWoodward’s liquidity, financial condition, or results of operations.
In the event of a change in control of Woodward, as defined in change-in-control agreements with its current corporate officers, Woodward may be required to pay termination benefits to any such officers.officer if such officer’s employment is terminated within two years following the change of control.
On April 9, 2019, Senvion, a German wind turbine manufacturer and a significant customer of Woodward’s renewables business, announced that it filed for self-administration insolvency proceedings and declared it would be exploring options for the sale or partial liquidation of the company. On September 16, 2019, Senvion agreed on exclusive talks with Siemens Gamesa over the sale of a substantial part of its business consisting of certain services and onshore assets in Europe. Concurrent with this announcement, Woodward management concluded that the remainder of the Senvion business would not emerge from insolvency and therefore, in the fourth quarter of fiscal year 2019, Woodward impaired all of its accounts receivable from Senvion as well as inventory and certain other current assets held specifically for Senvion programs. The total amount of the impairment charged to both selling, general and administrative and cost of goods sold in the fourth quarter of fiscal year 2019 was $12,601.
Note 20.22. Segment information
Woodward serves the aerospace industrial and energyindustrial markets through its two2 reportable segments - Aerospace and Industrial. When appropriate, Woodward’s reportable segments are aggregations of Woodward’s operating segments. Woodward uses operating segment information internally to manage its business, including the assessment of operating segment performance and decisions for the allocation of resources between operating segments. Woodward L’Orange has been included in Woodward’s Industrial segment results since the Closing.
In the first quarter of fiscal year 2016, Woodward changed the name of its Energy segment to Industrial. The term “energy” is largely viewed as “oil and gas” and therefore was not representative of the broader markets Woodward serves in this segment.
The accounting policies of the reportable segments are the same as those of the Company. Woodward evaluates segment profit or loss based on internal performance measures for each segment in a given period. In connection with that assessment, Woodward generally excludes matters such as certain charges for restructuring, costs, interest income and expense, certain gains and losses from asset dispositions, or other non-recurring and/or non-operationally related expenses.
A summary of consolidated net sales and earnings by segment follows:
|
|
|
|
|
|
|
|
|
|
|
|
|
|
|
|
|
|
| Year Ended September 30, |
| 2019 |
| 2018 |
| 2017 |
Segment external net sales: |
|
|
|
|
|
|
|
|
Aerospace | $ | 1,880,520 |
| $ | 1,557,988 |
| $ | 1,342,339 |
Industrial |
| 1,019,677 |
|
| 767,885 |
|
| 756,346 |
Total consolidated net sales | $ | 2,900,197 |
| $ | 2,325,873 |
| $ | 2,098,685 |
Segment earnings: |
|
|
|
|
|
|
|
|
Aerospace (2) | $ | 389,126 |
| $ | 308,553 |
| $ | 264,362 |
Industrial (2) |
| 93,521 |
|
| 49,894 |
|
| 80,659 |
Nonsegment expenses (1)(2) |
| (119,447) |
|
| (100,078) |
|
| (58,359) |
Interest Expense, net (2) |
| (42,588) |
|
| (38,791) |
|
| (33,915) |
Consolidated earnings before income taxes | $ | 320,612 |
| $ | 219,578 |
| $ | 252,747 |
|
|
|
|
|
|
|
|
|
(1)Nonsegment expenses for the fiscal year ended September 30, 2018 includes restructuring charges of $17,013. See Note 15, Accrued liabilities for further details.
(2)Segment earnings includes the impact of retrospectively applying ASU 2017-07. See Note 2, New Accounting Standards for further details.
| | | | | | | | |
| | | | | | | | |
| Year Ended September 30, |
| 2016 | | 2015 | | 2014 |
Segment external net sales: | | | | | | | | |
Aerospace | $ | 1,233,176 | | $ | 1,160,883 | | $ | 1,084,025 |
Industrial | | 789,902 | | | 877,420 | | | 917,215 |
Total consolidated net sales | $ | 2,023,078 | | $ | 2,038,303 | | $ | 2,001,240 |
Segment earnings: | | | | | | | | |
Aerospace | $ | 232,166 | | $ | 187,747 | | $ | 159,200 |
Industrial | | 82,237 | | | 126,641 | | | 134,278 |
Total segment earnings | | 314,403 | | | 314,388 | | | 293,478 |
Nonsegment expenses | | (63,166) | | | (49,362) | | | (43,701) |
Interest expense, net | | (24,751) | | | (24,077) | | | (22,533) |
Consolidated earnings before income taxes | $ | 226,486 | | $ | 240,949 | | $ | 227,244 |
| | | | | | | | |
Segment assets consist of accounts receivable, inventories, property, plant, and equipment, net, goodwill, and other intangibles, net. A summary of consolidated total assets, consolidated depreciation and amortization, and consolidated capital expenditures follows:
| | | | | | |
|
|
|
|
|
|
| | | | | | |
|
|
|
|
|
|
| Year Ended September 30, | Year Ended September 30, |
| 2016 | | 2015 | | 2014 | 2019 |
| 2018 |
| 2017 |
Segment assets: | | | | | | | | |
|
|
|
|
|
|
|
|
Aerospace | $ | 1,637,522 | | $ | 1,566,421 | | $ | 1,440,355 | $ | 1,900,657 |
| $ | 1,805,892 |
| $ | 1,722,789 |
Industrial | | 705,169 | | | 653,848 | | | 610,345 |
| 1,561,441 |
|
| 1,642,462 |
|
| 695,264 |
Total segment assets | | 2,342,691 | | | 2,220,269 | | | 2,050,700 | |
Unallocated corporate property, plant and equipment, net | | 89,988 | | 85,834 | | 72,992 |
| 114,887 |
|
| 102,083 |
|
| 104,755 |
Other unallocated assets | | 209,683 | | | 206,301 | | | 234,911 |
| 379,541 |
|
| 240,212 |
|
| 234,301 |
Consolidated total assets | $ | 2,642,362 | | $ | 2,512,404 | | $ | 2,358,603 | $ | 3,956,526 |
| $ | 3,790,649 |
| $ | 2,757,109 |
| | | | | | | | |
|
|
|
|
|
|
|
|
Segment depreciation and amortization: | | | | | | |
|
|
|
|
|
|
Aerospace | $ | 40,825 | | $ | 46,488 | | $ | 46,895 | $ | 60,710 |
| $ | 54,828 |
| $ | 47,277 |
Industrial | | 20,412 | | | 20,768 | | | 22,672 |
| 71,173 |
|
| 51,695 |
|
| 24,421 |
Total segment depreciation and amortization | | 61,237 | | | 67,256 | | | 69,567 | |
Unallocated corporate amounts | | 7,799 | | | 7,979 | | | 7,786 |
| 10,121 |
|
| 9,608 |
|
| 9,219 |
Consolidated depreciation and amortization | $ | 69,036 | | $ | 75,235 | | $ | 77,353 | $ | 142,004 |
| $ | 116,131 |
| $ | 80,917 |
| | | | | | | | |
|
|
|
|
|
|
|
|
Segment capital expenditures: | | | | | | |
|
|
|
|
|
|
Aerospace | $ | 90,749 | | $ | 150,021 | | $ | 134,307 | $ | 56,525 |
| $ | 98,358 |
| $ | 62,812 |
Industrial | | 62,065 | | | 113,292 | | | 55,780 |
| 30,195 |
|
| 17,109 |
|
| 12,189 |
Total segment capital expenditures | | 152,814 | | | 263,313 | | | 190,087 | |
Unallocated corporate amounts | | 22,878 | | | 23,299 | | | 17,019 |
| 12,346 |
|
| 11,673 |
|
| 17,335 |
Consolidated capital expenditures | $ | 175,692 | | $ | 286,612 | | $ | 207,106 | $ | 99,066 |
| $ | 127,140 |
| $ | 92,336 |
Sales to General ElectricThe Boeing Company (“Boeing”) were made by Woodward’s Aerospace segment and totaled approximately 15% of net sales in fiscal year 2019, 12% of net sales in fiscal year 2018, and 11% of net sales in fiscal year 2017. Sales to GE were made by both of Woodward’s reportable segments and totaled approximately 17%14% of net sales in fiscal year 2016, 18%2019, and 16% of net sales in both fiscal year 2015,years 2018 and 15% of net sales in fiscal year 2014. 2017.
Accounts receivable from General ElectricBoeing totaled approximately 14% of accounts receivable at September 30, 20162019 and 15%14% of accounts receivable at September 30, 2015.2018. Accounts receivable from GE totaled approximately 8% of accounts receivable at both September 30, 2019 and September 30, 2018.
U.S. Government related sales from Woodward’s reportable segments were as follows:
| | | | | | |
|
|
|
|
|
|
| | | | | | |
|
|
|
|
|
|
| Direct U.S. Government Sales | | Indirect U.S. Government Sales | | Total U.S. Government Related Sales | Direct U.S. Government Sales |
| Indirect U.S. Government Sales |
| Total U.S. Government Related Sales |
Year ended September 30, 2016 | | | | | | | | | |
Fiscal year ended September 30, 2019 | |
|
|
|
|
|
|
|
|
Aerospace | $ | 103,026 | | $ | 310,952 | | $ | 413,978 | $ | 118,334 |
| $ | 545,306 |
| $ | 663,640 |
Industrial | | 6,550 | | | 9,845 | | | 16,395 |
| 4,491 |
|
| 13,810 |
|
| 18,301 |
Total net external sales | $ | 109,576 | | $ | 320,797 | | $ | 430,373 | $ | 122,825 |
| $ | 559,116 |
| $ | 681,941 |
Percentage of total net sales | | 5% | | | 16% | | | 21% |
| 4% |
|
| 19% |
|
| 23% |
| | | | | | | | |
|
|
|
|
|
|
|
|
Year ended September 30, 2015 | | | | | | | |
Fiscal year ended September 30, 2018 | |
|
|
|
|
|
|
Aerospace | $ | 92,322 | | $ | 258,391 | | $ | 350,713 | $ | 84,252 |
| $ | 429,386 |
| $ | 513,638 |
Industrial | | 4,836 | | | 8,839 | | | 13,675 |
| 2,547 |
|
| 8,658 |
|
| 11,205 |
Total net external sales | $ | 97,158 | | $ | 267,230 | | $ | 364,388 | $ | 86,799 |
| $ | 438,044 |
| $ | 524,843 |
Percentage of total net sales | | 5% | | | 13% | | | 18% |
| 4% |
|
| 19% |
|
| 23% |
| | | | | | | | |
|
|
|
|
|
|
|
|
Year ended September 30, 2014 | | | | | | | |
Fiscal year ended September 30, 2017 | |
|
|
|
|
|
|
Aerospace | $ | 76,982 | | $ | 254,806 | | $ | 331,788 | $ | 106,685 |
| $ | 362,536 |
| $ | 469,221 |
Industrial | | 2,517 | | | 5,588 | | | 8,105 |
| 3,726 |
|
| 10,814 |
|
| 14,540 |
Total net external sales | $ | 79,499 | | $ | 260,394 | | $ | 339,893 | $ | 110,411 |
| $ | 373,350 |
| $ | 483,761 |
Percentage of total net sales | | 4% | | | 13% | | | 17% |
| 5% |
|
| 18% |
|
| 23% |
| | | | | | | | |
|
|
|
|
|
|
|
|
Accounts receivable from the U.S. Government totaled approximately 2%5% of accounts receivable at September 30, 20162019 and 3% of accounts receivable at September 30, 2015.2018.
The customers who account for approximately 10% or more ofFor net sales to each of Woodward’s reportable segmentsby geographical area for the fiscal year ended September 30, 2016 follow:
| | |
| | |
| | Customer
|
Aerospace
| | Boeing, United Technologies
|
Industrial
| | General Electric
|
2019, refer to Note 3, Revenue. Net sales by geographical area for the years ended September 30, 2018 and 2017, as determined by the location of the customer invoiced, were as follows:
| | | | | | | | |
| | | | | | | | |
| Year Ended September 30, |
| 2016 | | 2015 | | 2014 |
United States | $ | 1,118,833 | | $ | 1,054,895 | | $ | 1,025,149 |
Europe (1) | | 537,901 | | | 569,322 | | | 519,721 |
Asia | | 228,683 | | | 241,875 | | | 299,755 |
Other countries | | 137,661 | | | 172,211 | | | 156,615 |
Consolidated net sales | $ | 2,023,078 | | $ | 2,038,303 | | $ | 2,001,240 |
| | | | | | | | |
| (1)
| | As a percentage of consolidated net sales, net sales to customers in Germany accounted for 10% for the year ended September 30, 2016, 10% for the year ended September 30, 2015 and 9% for the year ended September 30, 2014.
|
|
|
|
|
|
|
|
| Year Ended September 30, |
| 2018 |
| 2017 |
United States | $ | 1,350,708 |
| $ | 1,211,902 |
Germany |
| 230,834 |
|
| 173,180 |
Europe, excluding Germany |
| 323,109 |
|
| 305,545 |
Asia |
| 283,031 |
|
| 288,252 |
Other countries |
| 138,191 |
|
| 119,806 |
Consolidated net sales | $ | 2,325,873 |
| $ | 2,098,685 |
|
|
|
|
|
|
Property, plant, and equipment, net by geographical area, as determined by the physical location of the assets, were as follows:
|
|
|
|
|
|
|
|
|
|
|
|
| At September 30, |
| 2019 |
| 2018 |
United States | $ | 926,370 |
| $ | 922,734 |
Germany |
| 107,975 |
|
| 111,595 |
Other countries |
| 24,430 |
|
| 25,676 |
Consolidated property, plant and equipment, net | $ | 1,058,775 |
| $ | 1,060,005 |
| | | | | |
| | | | | |
| At September 30, |
| 2016 | | 2015 |
United States | $ | 826,225 | | $ | 704,686 |
Germany | | 24,468 | | | 25,634 |
Other countries | | 25,657 | | | 25,780 |
Consolidated property, plant and equipment, net | $ | 876,350 | | $ | 756,100 |
Note 21.23. Supplemental quarterly financial data (Unaudited)(unaudited)
Quarterly results for the fiscal years ended September 30, 20162019 and September 30, 20152018 follow:
| | | | | | | | | | | |
| | | | | | | | | | | |
| 2016 Fiscal Quarters |
| First (1) | | Second | | Third | | Fourth |
Net sales | $ | 445,110 | | $ | 479,382 | | $ | 507,664 | | $ | 590,922 |
Gross margin (2) | | 111,733 | | | 133,243 | | | 136,942 | | | 165,620 |
Earnings before income taxes | | 27,956 | | | 54,366 | | | 63,408 | | | 80,756 |
Net earnings | | 25,820 | | | 40,824 | | | 51,047 | | | 63,147 |
Earnings per share | | | | | | | | | | | |
Basic earnings per share | | 0.41 | | | 0.66 | | | 0.83 | | | 1.03 |
Diluted earnings per share | | 0.40 | | | 0.65 | | | 0.81 | | | 0.99 |
Cash dividends per share | | 0.10 | | | 0.11 | | | 0.11 | | | 0.11 |
| | | | | | | | | | | |
| 2015 Fiscal Quarters |
| First | | Second | | Third | | Fourth |
Net sales | $ | 487,646 | | $ | 493,222 | | $ | 494,810 | | $ | 562,625 |
Gross margin (2) | | 143,886 | | | 137,620 | | | 143,389 | | | 159,690 |
Earnings before income taxes | | 57,072 | | | 57,591 | | | 57,559 | | | 68,727 |
Net earnings | | 43,784 | | | 43,855 | | | 43,753 | | | 50,060 |
Earnings per share | | | | | | | | | | | |
Basic earnings per share | | 0.67 | | | 0.67 | | | 0.68 | | | 0.79 |
Diluted earnings per share | | 0.66 | | | 0.66 | | | 0.66 | | | 0.77 |
Cash dividends per share | | 0.08 | | | 0.10 | | | 0.10 | | | 0.10 |
|
|
|
|
|
|
|
|
|
|
|
|
|
|
|
|
|
|
|
|
|
|
|
|
| 2019 Fiscal Quarters |
| First |
| Second |
| Third |
| Fourth |
Net sales (1)(2) | $ | 652,811 |
| $ | 758,844 |
| $ | 752,005 |
| $ | 736,537 |
Gross margin (2)(3)(4)(5) |
| 160,637 |
|
| 192,003 |
|
| 189,489 |
|
| 165,414 |
Earnings before income taxes (2)(4)(5)(6) |
| 61,515 |
|
| 90,168 |
|
| 92,314 |
|
| 76,615 |
Net earnings (2)(4)(5)(6)(9) |
| 49,120 |
|
| 77,579 |
|
| 66,107 |
|
| 66,796 |
Earnings per share |
|
|
|
|
|
|
|
|
|
|
|
Basic earnings per share (2)(4)(5)(6)(9) |
| 0.79 |
|
| 1.25 |
|
| 1.07 |
|
| 1.08 |
Diluted earnings per share (2)(4)(5)(6)(9) |
| 0.77 |
|
| 1.20 |
|
| 1.02 |
|
| 1.03 |
Cash dividends per share |
| 0.1425 |
|
| 0.1625 |
|
| 0.1625 |
|
| 0.1625 |
|
|
|
|
|
|
|
|
|
|
|
|
| 2018 Fiscal Quarters |
| First |
| Second |
| Third |
| Fourth |
Net sales (1) | $ | 470,148 |
| $ | 548,249 |
| $ | 588,117 |
| $ | 719,359 |
Gross margin (3)(5) |
| 122,521 |
|
| 146,090 |
|
| 159,444 |
|
| 175,016 |
Earnings before income taxes (5)(6)(7)(8) |
| 37,487 |
|
| 48,647 |
|
| 54,417 |
|
| 79,027 |
Net earnings (5)(6)(7)(8)(9) |
| 18,260 |
|
| 38,489 |
|
| 49,117 |
|
| 74,512 |
Earnings per share |
|
|
|
|
|
|
|
|
|
|
|
Basic earnings per share (5)(6)(7)(8)(9) |
| 0.30 |
|
| 0.63 |
|
| 0.80 |
|
| 1.21 |
Diluted earnings per share (5)(6)(7)(8)(9) |
| 0.29 |
|
| 0.60 |
|
| 0.77 |
|
| 1.16 |
Cash dividends per share |
| 0.1250 |
|
| 0.1425 |
|
| 0.1425 |
|
| 0.1425 |
Notes:
| 1.
| | Results for the first quarter of fiscal year 2016 include special charges totaling approximately $16,100 related to Woodward's efforts to consolidate facilities, reduce costs and address current market conditions.
|
| 2.
| | Gross margin represents net sales less cost of goods sold excluding amortization expense.
|
1.On June 1, 2018, Woodward acquired L’Orange. Net sales attributable to L’Orange were $87,680, $87,986, $78,517, and $77,826 in the first through fourth quarters of fiscal year 2019, respectively, as compared to $24,878 and$78,027 in the third and fourth quarters of fiscal year 2018, respectively.
Quarterly2.Woodward adopted ASC 606 on October 1, 2018 and elected the modified retrospective transition method. The quarterly results by segmentfor periods prior to fiscal year 2019 were not adjusted for the new standard. Subsequent to the adoption of ASC 606, Woodward’s management identified an inconsistency in the application of ASC 606. The inconsistency resulted in errors that were cumulatively not material in determining the percentage of completion calculation on over time product revenue recognition, which caused the Condensed Consolidated Financial Statements for the quarters ended December 31, 2018 and March 31, 2019, as well as the cumulative impact of the adoption of ASC 606 on the Condensed Consolidated Balance Sheet as of October 1, 2018, to be misstated by amounts that management concluded were not material (“ASC 606 adoption errors”). To correct the errors for the three-months ended December 31, 2018 and for the three and six-months ended March 31, 2019, Woodward made an out-of-period correction in the three-months ended June 30, 2019. The correction resulted in increases to net sales of $13,614, earnings before income taxes of $8,041, net earnings of $6,037, and diluted earnings per share of $0.09 for the three-months ended June 30, 2019, the majority of which relates to Woodward’s Aerospace segment.
3.Gross margin represents net sales less cost of goods sold.
4.Results for the fourth quarter of fiscal years ended September 30, 2016year 2019 include pre-tax, non-cash charges of $12,601 related to the impairment of receivables, inventory and September 30, 2015 follow:certain other assets in connection with Senvion, a significant customer of Woodward renewables business, which declared insolvency in fiscal year 2019.
| | | | | | | | | | | |
| | | | | | | | | | | |
| 2016 Fiscal Quarters |
| First | | Second | | Third | | Fourth |
Segment external net sales: | | | | | | | | | | | |
Aerospace | $ | 268,599 | | $ | 290,690 | | $ | 308,582 | | $ | 365,305 |
Industrial | | 176,511 | | | 188,692 | | | 199,082 | | | 225,617 |
Total | $ | 445,110 | | $ | 479,382 | | $ | 507,664 | | $ | 590,922 |
Segment earnings: | | | | | | | | | | | |
Aerospace | $ | 43,486 | | $ | 50,578 | | $ | 57,726 | | $ | 80,376 |
Industrial | | 21,551 | | | 19,469 | | | 21,963 | | | 19,254 |
Total | $ | 65,037 | | $ | 70,047 | | $ | 79,689 | | $ | 99,630 |
Earnings reconciliation: | | | | | | | | | | | |
Total segment earnings | $ | 65,037 | | $ | 70,047 | | $ | 79,689 | | $ | 99,630 |
Nonsegment expenses (1) | | (30,620) | | | (9,888) | | | (10,369) | | | (12,289) |
Interest expense, net | | (6,461) | | | (5,793) | | | (5,912) | | | (6,585) |
Consolidated earnings before income taxes | $ | 27,956 | | $ | 54,366 | | $ | 63,408 | | $ | 80,756 |
| | | | | | | | | | | |
| 2015 Fiscal Quarters |
| First | | Second | | Third | | Fourth |
Segment external net sales: | | | | | | | | | | | |
Aerospace | $ | 255,770 | | $ | 281,426 | | $ | 288,480 | | $ | 335,207 |
Industrial | | 231,876 | | | 211,796 | | | 206,330 | | | 227,418 |
Total | $ | 487,646 | | $ | 493,222 | | $ | 494,810 | | $ | 562,625 |
Segment earnings: | | | | | | | | | | | |
Aerospace | $ | 35,793 | | $ | 45,628 | | $ | 46,362 | | $ | 59,964 |
Industrial | | 39,268 | | | 27,224 | | | 30,619 | | | 29,530 |
Total | $ | 75,061 | | $ | 72,852 | | $ | 76,981 | | $ | 89,494 |
Earnings reconciliation: | | | | | | | | | | | |
Total segment earnings | $ | 75,061 | | $ | 72,852 | | $ | 76,981 | | $ | 89,494 |
Nonsegment expenses | | (12,167) | | | (10,153) | | | (13,564) | | | (13,478) |
Interest expense, net | | (5,822) | | | (5,108) | | | (5,858) | | | (7,289) |
Consolidated earnings before income taxes | $ | 57,072 | | $ | 57,591 | | $ | 57,559 | | $ | 68,727 |
Notes:
| 1.
| | The results for Nonsegement expenses for the first quarter of fiscal year 2016 include special charges totaling approximately $16,100 related to Woodward's efforts to consolidate facilities, reduce costs and address current market conditions.
|
5.Results for the first through third quarters of fiscal year 2019 include pre-tax non-cash charges of $9,511, $8,985, $2,604, respectively, as compared to the third and fourth quarters of fiscal year 2018, which include pre-tax non-cash charges of $8,299 and $26,086, respectively. These costs are associated with the purchase accounting impacts related to the revaluation of the L’Orange inventory recognized in cost of goods sold and the amortization of the backlog intangible.
6.Results for the first through fourth quarters of fiscal year 2019 include, Duarte move related costs of $6,963, $9,161, $7,035, and $3,930, respectively. Results for the second, third and fourth quarters of fiscal year 2018, include, as applicable, pre-tax Duarte move related costs and L’Orange acquisition transaction and integration costs of $1,525, $5,134 and $4,714, respectively.
7.
Results for the third quarter of fiscal year 2018 include the (i) pre-tax cost associated with an at-the-money forward option of $5,543, (ii) pre-tax warranty and indemnity insurance costs associated with the acquisition of L’Orange of $4,293, and (iii) pre-tax German real estate transfer tax costs associated with the acquisition of L’Orange of $3,385.
8.The second quarter of fiscal year 2018 includes pre-tax restructuring charges totaling $17,013, the majority of which relate to the Company’s decision to relocate its Duarte, California operations to the Company’s newly renovated Drake Campus in Fort Collins, Colorado. The remaining restructuring charges recognized during the quarter consist of workforce management costs related to aligning the Company’s industrial turbomachinery business with current market conditions.
9.In the first and third quarters of fiscal year 2018, Woodward recognized a tax expense of $14,778 and $3,671, respectively, and tax benefit of $7,589 in the fourth quarter of fiscal year 2018, related to the transition impacts of the change in U.S. tax legislation in December 2017. In the third quarter of fiscal year 2019, Woodward recognized additional income tax expense of $10,588 related to the repatriation tax on deferred foreign income related to the December 2017 U.S. Tax legislation.
|
|
|
|
|
|
|
|
|
|
|
|
|
|
|
|
|
|
|
|
|
|
|
|
| 2019 Fiscal Quarters |
| First |
| Second |
| Third |
| Fourth |
Segment external net sales: |
|
|
|
|
|
|
|
|
|
|
|
Aerospace (1) | $ | 392,887 |
| $ | 482,954 |
| $ | 498,775 |
| $ | 505,904 |
Industrial (2) |
| 259,924 |
|
| 275,890 |
|
| 253,230 |
|
| 230,633 |
Total | $ | 652,811 |
| $ | 758,844 |
| $ | 752,005 |
| $ | 736,537 |
Segment earnings: |
|
|
|
|
|
|
|
|
|
|
|
Aerospace | $ | 72,854 |
| $ | 101,722 |
| $ | 103,238 |
| $ | 111,312 |
Industrial (3) |
| 29,169 |
|
| 27,128 |
|
| 26,240 |
|
| 10,984 |
Nonsegment expenses (4)(5) |
| (29,001) |
|
| (27,496) |
|
| (26,713) |
|
| (36,237) |
Interest expense, net (8) |
| (11,507) |
|
| (11,186) |
|
| (10,451) |
|
| (9,444) |
Consolidated earnings before income taxes | $ | 61,515 |
| $ | 90,168 |
| $ | 92,314 |
| $ | 76,615 |
|
|
|
|
|
|
|
|
|
|
|
|
| 2018 Fiscal Quarters |
| First |
| Second |
| Third |
| Fourth |
Segment external net sales: |
|
|
|
|
|
|
|
|
|
|
|
Aerospace | $ | 305,905 |
| $ | 386,343 |
| $ | 404,612 |
| $ | 461,128 |
Industrial (2) |
| 164,243 |
|
| 161,906 |
|
| 183,505 |
|
| 258,231 |
Total | $ | 470,148 |
| $ | 548,249 |
| $ | 588,117 |
| $ | 719,359 |
Segment earnings: |
|
|
|
|
|
|
|
|
|
|
|
Aerospace | $ | 45,241 |
| $ | 74,656 |
| $ | 83,887 |
| $ | 104,769 |
Industrial (3) |
| 19,781 |
|
| 10,687 |
|
| 10,943 |
|
| 8,483 |
Nonsegment expenses (5)(6)(7) |
| (19,026) |
|
| (28,344) |
|
| (30,699) |
|
| (22,009) |
Interest expense, net (8) |
| (8,509) |
|
| (8,352) |
|
| (9,714) |
|
| (12,216) |
Consolidated earnings before income taxes | $ | 37,487 |
| $ | 48,647 |
| $ | 54,417 |
| $ | 79,027 |
Notes:
1.To correct the ASC 606 adoption errors for the three-months ended December 31, 2018 and for the three and six-months ended March 31, 2019, Woodward made an out-of-period correction in the three-months ended June 30, 2019. The correction resulted in increases to net sales of $13,614, earnings before income taxes of $8,041, net earnings of $6,037, and diluted earnings per share of $0.09 for the three-months ended June 30, 2019, the majority of which relates to Woodward’s Aerospace segment.
2.Net Industrial segment sales attributable to L’Orange were $87,680, $87,986, $78,517, and $77,825 in the first through fourth quarters of fiscal year 2019, respectively, as compared to $24,878 and $78,027 in the third and fourth quarters of fiscal year 2018, respectively.
3.Industrial segment earnings for the first through third quarters of fiscal year 2019 include pre-tax non-cash charges of $9,511, $8,985, $2,604, respectively, as compared to the third and fourth quarters of fiscal year 2018, which include pre-tax non-cash charges of $8,299 and $26,086, respectively. These costs are associated with the purchase accounting impacts related to the revaluation of the L’Orange inventory recognized in cost of goods sold and the amortization of the backlog intangible.
4.
Nonsegment expenses for the fourth quarter of fiscal year 2019 include pre-tax, non-cash charges of $12,601 related to the impairment of receivables, inventory and certain other assets in connection with Senvion.
5.Nonsegment expenses for the first through fourth quarters of fiscal year 2019 include, Duarte move related costs of $6,963, $9,161, $7,035, and $3,930, respectively. Results for the second, third and fourth quarters of fiscal year 2018, include, as applicable, pre-tax Duarte move related costs and L’Orange acquisition transaction and integration costs of $1,525, $5,134 and $4,714, respectively.
6.Nonsegment expenses for the third quarter of fiscal year 2018 include (i) pre-tax cost associated with an at-the-money-forward option of $5,543, (ii) pre-tax warranty and indemnity insurance costs associated with the acquisition of L’Orange of $4,293, and (iii) pre-tax German real estate transfer tax costs associated with the acquisition of L’Orange of $3,385.
7.Nonsegment expenses for the second quarter of fiscal year 2018 include restructuring charges totaling $17,013, the majority of which relate to the Company’s decision to relocate its Duarte, California operations to the Company’s newly renovated Drake Campus in Fort Collins, Colorado. The remaining restructuring charges recognized during the quarter consist of workforce management costs related to aligning the Company’s industrial turbomachinery business with current market conditions.
8.Related to the L’Orange Acquisition, on May 31, 2018 Woodward issued an aggregate principal amount of $400,000 of senior unsecured notes in a series of private placement transactions and borrowed $167,420 under our revolving credit agreement to fund the acquisition.
Item 9.Changes in and Disagreements Disagreements with Accountants on Accounting and Financial Disclosure
There have been no disagreements or any reportable events requiring disclosure under Item 304(b) of Regulation S-K.
Item 9A.ControlsControls and Procedures
Evaluation of Disclosure Controls and Procedures
We have established disclosure controls and procedures, which are designed to ensure that information required to be disclosed in reports filed or submitted under the Securities Exchange Act of 1934, as amended (the “Act”) is recorded, processed, summarized, and reported within the time periods specified in the SEC’s rules and forms. These disclosure controls and procedures include, without limitation, controls and procedures designed to ensure that information required to be disclosed in the reports that we file or submit under the Act is accumulated and communicated to management, including our Principal Executive Officer (Thomas A. Gendron, Chairman of the Board, Chief Executive Officer and President) and Principal Financial and Accounting Officer (Robert F. Weber, Jr.,(Jonathan W. Thayer, Vice Chairman, Corporate Operations and Chief Financial Officer and Treasurer)Officer), as appropriate, to allow timely decisions regarding required disclosures.
Thomas A. Gendron and Robert F. Weber, Jr.,Jonathan W. Thayer evaluated the effectiveness of our disclosure controls and procedures as of the end of the period covered by this Form 10-K. Based on their evaluations, they concluded that our disclosure controls and procedures were effective as of September 30, 2016.2019.
Changes in Internal Controls
Beginning with the third quarter of fiscal year 2019, we included the internal controls of Woodward L’Orange in our assessment of the effectiveness of Woodward’s internal controls over financial reporting. We acquired L’Orange on June 1, 2018 as discussed in Note 5, Business acquisition, in the Notes to the Consolidated Financial Statements included in Part II, Item 8 of this Form 10-K. Woodward L’Orange was excluded from Woodward’s annual report on internal control over financial reporting for the fiscal year ended September 30, 2018 in accordance with the general guidance issued by the SEC regarding exclusion of certain acquired businesses. Woodward L’Orange has been included in the assessment of Woodward’s internal controls over financial reporting as of September 30, 2019.
Other than the material weakness remediation, described below, and the inclusion of Woodward L’Orange internal controls, there have been no changes in our internal control over financial reporting identified in management’s evaluation pursuant to Rules 13a-15(d) or 15d-15(d) of the Exchange Act during the period covered by this Annual Report on Form 10-K that materially affected, or are reasonably likely to materially affect, our internal control over financial reporting.
Background
In the third quarter of the Company’s fiscal year 2019, management identified that a control did not operate effectively at certain operational locations within one enterprise resource planning system, including a control activity over the completeness of the underlying information specific to deriving the revenue related accounting entries for the adoption of and subsequent reporting under ASU 2014-09 “Revenue from Contracts with Customers” (“ASC 606”), which the Company adopted on October 1, 2018. The control that was not operating effectively was the result of a deficiency in the Information and Communication and Control Activities components of internal control and was determined to be a material weakness in internal control over financial reporting, as management concluded there was a reasonable possibility that a material misstatement of the Company’s financial statements would not have been prevented or detected on a timely basis.
Management’s Remediation Efforts
During the fourth quarter of fiscal year 2019, management executed its remediation plan including: (i) confirming the effective design of our controls around the application of ASC 606, (ii) improving the implementation of our controls around the application of ASC 606, particularly those areas subject to interpretation or technical application, to include more detailed reviews of underlying data and calculations resulting from a configuration change to an automated revenue recognition module used to capture over time revenue within the impacted enterprise resource planning system, (iii) enhancing communication between management at various operational locations to emphasize the importance of validation of underlying data and calculations used, (iv) improving our monitoring of communication between management at various operational locations, and (v) testing the operational effectiveness of our remediation efforts. Management believes that as a result of the measures described above the material weakness has been fully remediated and no longer exists as of September 30, 2019.
Management’s Annual Report on Internal Control Over Financial Reporting
We are responsible for establishing and maintaining adequate internal control over financial reporting for the Company. We have evaluated the effectiveness of internal control over financial reporting using the criteria established in Internal Control - Integrated Framework (2013) issued by the Committee of Sponsoring Organizations of the Treadway Commission (COSO) and, based on that evaluation, have concluded that the Company’s internal control over financial reporting was effective as of September 30, 2016,2019, the end of the Company’s most recent fiscal year.
Deloitte & Touche LLP, an independent registered public accounting firm, conducted an audit of Woodward’s internal control over financial reporting as of September 30, 2016,2019 as stated in their report included in “Item 9A. – Controls and Procedures.”
Internal control over financial reporting is a process designed by, or under the supervision of, our principal executive and principal financial officers, or persons performing similar functions, and effected by our Board of Directors, management, and other personnel, to provide reasonable assurance regarding the reliability of our financial reporting and the preparation of our financial statements for external purposes in accordance with generally accepted accounting principles. Internal control over financial reporting includes those policies and procedures that:
| ·
| | Pertain to the maintenance of records that, in reasonable detail, accurately and fairly reflect the transactions and dispositions of the assets of the Company;
|
| ·
| | Provide reasonable assurance that transactions are recorded as necessary to permit preparation of financial statements in accordance with generally accepted accounting principles, and that receipts and expenditures of the Company are being made only in accordance with authorization of management and directors of the Company; and
|
| ·
| | Provide reasonable assurance regarding prevention or timely detection of unauthorized acquisition, use or disposition of the Company’s assets that could have a material effect on the financial statements.
|
There•Pertain to the maintenance of records that, in reasonable detail, accurately and fairly reflect the transactions and dispositions of the assets of the Company;
•Provide reasonable assurance that transactions are recorded as necessary to permit preparation of financial statements in accordance with generally accepted accounting principles, and that receipts and expenditures of the Company are being made only in accordance with authorization of management and directors of the Company; and
•Provide reasonable assurance regarding prevention or timely detection of unauthorized acquisition, use or disposition of the Company’s assets that could have a material effect on the financial statements.
In connection with management’s assessment of the Company’s internal control over financial reporting during the third quarter of fiscal year 2019, management concluded a material weakness existed in the operating effectiveness of internal controls related to the adoption of and subsequent reporting under ASU 2014-09 “Revenue from Contracts with Customers” (ASC 606), which the Company adopted on October 1, 2018. In the fourth quarter of fiscal year 2019, management executed its remediation plan with respect to the identified material weakness and believes as a result of the measures taken, the material weakness has been fully remediated and no longer exists as of September 30, 2019.
Other than the measures taken to remediate the material weakness detected in the third quarter of 2019, there have been no changes in our internal control over financial reporting during the fourth fiscal quarter ended September 30, 20162019 that have materially affected, or are reasonably likely to materially affect, our internal control over financial reporting. As of September 30, 2019, in anticipation of our adoption of the new lease standard, ASC Topic 842, “Leases” (“ASC 842”), we are in the process of finalizing certain changes to our policies, procedures, information systems and the related internal control activities, to monitor and maintain appropriate internal controls over financial reporting. These changes in policies, procedures and information systems and the related internal control activities will become effective as of the first quarter of our fiscal year 2020.
REPORT OF INDEPENDENT REGISTERED PUBLIC ACCOUNTING FIRM
To the Stockholders and Board of Directors and Stockholders of
Woodward, Inc.
Fort Collins, Colorado
Opinion on the Internal Control over Financial Reporting
We have audited the internal control over financial reporting of Woodward, Inc. and subsidiaries (the "Company"“Company”) as of September 30, 2016,2019, based on criteria established in Internal Control — Integrated Framework (2013) issued by the Committee of Sponsoring Organizations of the Treadway Commission. Commission (COSO). In our opinion, the Company maintained, in all material respects, effective internal control over financial reporting as of September 30, 2019, based on criteria established in Internal Control — Integrated Framework (2013) issued by COSO.
We have also audited, in accordance with the standards of the Public Company Accounting Oversight Board (United States) (PCAOB), the consolidated financial statements as of and for the year ended September 30, 2019, of the Company and our report dated November 25, 2019, expressed an unqualified opinion on those financial statements.
Basis for Opinion
The Company'sCompany’s management is responsible for maintaining effective internal control over financial reporting and for its assessment of the effectiveness of internal control over financial reporting, included in the accompanying Management’s Annual Report on Internal Control Over Financial Reporting. Our responsibility is to express an opinion on the Company'sCompany’s internal control over financial reporting based on our audit. We are a public accounting firm registered with the PCAOB and are required to be independent with respect to the Company in accordance with the U.S. federal securities laws and the applicable rules and regulations of the Securities and Exchange Commission and the PCAOB.
We conducted our audit in accordance with the standards of the Public Company Accounting Oversight Board (United States).PCAOB. Those standards require that we plan and perform the audit to obtain reasonable assurance about whether effective internal control over financial reporting was maintained in all material respects. Our audit included obtaining an understanding of internal control over financial reporting, assessing the risk that a material weakness exists, testing and evaluating the design and operating effectiveness of internal control based on the assessed risk, and performing such other procedures as we considered necessary in the circumstances. We believe that our audit provides a reasonable basis for our opinion.
Definition and Limitations of Internal Control over Financial Reporting
A company'scompany’s internal control over financial reporting is a process designed by, or under the supervision of, the company's principal executive and principal financial officers, or persons performing similar functions, and effected by the company's board of directors, management, and other personnel to provide reasonable assurance regarding the reliability of financial reporting and the preparation of financial statements for external purposes in accordance with generally accepted accounting principles. A company'scompany’s internal control over financial reporting includes those policies and procedures that (1) pertain to the maintenance of records that, in reasonable detail, accurately and fairly reflect the transactions and dispositions of the assets of the company; (2) provide reasonable assurance that transactions are recorded as necessary to permit preparation of financial statements in accordance with generally accepted accounting principles, and that receipts and expenditures of the company are being made only in accordance with authorizations of management and directors of the company; and (3) provide reasonable assurance regarding prevention or timely detection of unauthorized acquisition, use, or disposition of the company'scompany’s assets that could have a material effect on the financial statements.
Because of theits inherent limitations, of internal control over financial reporting including the possibility of collusion or improper management override of controls, material misstatements due to error or fraud may not be preventedprevent or detected on a timely basis.detect misstatements. Also, projections of any evaluation of the effectiveness of the internal control over financial reporting to future periods are subject to the risk that the controls may become inadequate because of changes in conditions, or that the degree of compliance with the policies or procedures may deteriorate.
In our opinion, the Company maintained, in all material respects, effective internal control over financial reporting as of September 30, 2016, based on the criteria established in Internal Control — Integrated Framework (2013) issued by the Committee of Sponsoring Organizations of the Treadway Commission.
We have also audited, in accordance with the standards of the Public Company Accounting Oversight Board (United States), the consolidated financial statements and financial statement schedule as of and for the year ended September 30, 2016 of the Company and our report dated November 16, 2016 expressed an unqualified opinion on those financial statements and financial statement schedule.
/s/ DELOITTE & TOUCHE LLP
Denver, Colorado
November 16, 201625, 2019
Item 9B.
Other InformationInformation
None.
None.
PART III
Item 10.Directors, Executive OfficersOfficers and Corporate Governance
The information required by this item relating to our directors and nominees, regarding compliance with Section 16(a) of the Securities Act of 1934, and regarding our Audit Committee is included under the captions “Board of Directors,” “Board Meetings and Committees – Audit Committee” (including information with respect to audit committee financial experts), “Stock Ownership of Management,” and “Section 16(a) Beneficial Ownership Reporting Compliance” in our Proxy Statement related to the Annual Meeting of Stockholders to be held January 25, 201729, 2020 and is incorporated herein by reference. There have been no material changes to the procedures by which security holders may recommend nominees to our board of directors.
The information required by this item relating to the identities and background of our executive officers and other corporate officers is included under the caption “Executive Officers of the Registrant” in Item 1 of this report.
We have adopted a code of ethics that applies to all of our employees, including our principal executive officer and our principal financial and accounting officer. This code of ethics is posted on our Website. The Internet address for our Website is www.woodward.com,, and the code of ethics may be found from our main Web page by clicking first on “Investors” and then on “Corporate Governance,” and then on “Woodward Codes of Business Conduct and Ethics.”
We intend to satisfy any disclosure requirement under Item 5.05 of Form 8-K regarding an amendment to, or waiver from, a provision of this code of ethics by posting such information to our Website, at the address and location specified above.
Item 11.
ExecutiveExecutive Compensation
Information regarding executive compensation is under the captions “Board Meetings and Committees – Director Compensation,” “Board Meetings and Committees – Compensation Committee Interlocks and Insider Participation,” “Compensation Discussion and Analysis,” “Compensation Committee Report, on Compensation Discussion and Analysis,” “Executive Compensation” and “Board Meetings and Committees – Compensation Committee – Risk Assessment” in our Proxy Statement, for the Annual Meeting of Stockholders to be held January 25, 2017, and is incorporated herein by reference, except the section captioned “Compensation Committee Report on Compensation Discussion and Analysis” is hereby “furnished” and not “filed” with this Form 10-K.
Item 12.
Security Ownership of Certain BeneficialBeneficial Owners and Management and Related Stockholder Matters
Information regarding security ownership of certain beneficial owners and management and related stockholder matters is under the tables captioned “Stock Ownership of Management,” “Persons Owning More Than Five Percent of Woodward Stock,” and “Executive Compensation – Equity Compensation Plan Information” in our Proxy Statement, for the Annual Meeting of Stockholders to be held January 25, 2017, and is incorporated herein by reference.
Item 13.
Certain Relationships andand Related Transactions, and Director Independence
The information set forth under “Board Meetings and Committees – Related Person Transaction Policies and Procedures,” “Board of Directors” and “Audit Committee Report to Stockholders” in our Proxy Statement for the Annual Meeting of the Stockholders to be held January 25, 2017and is incorporated herein by reference except the section captioned “Audit Committee Report” is hereby “furnished” and not “filed” with this Form 10-K.
Item 14.
Principal Accountant Fees and Services
Information regarding principal accountant fees and services is under the captions “Audit Committee Report to Stockholders – Audit Committee’s Policy on Pre-Approval of Services Provided by Independent Registered Public Accounting Firm” and “Audit Committee Report to Stockholders – Fees Paid to Independent Registered Public Accounting Firm” in our Proxy Statement, for the Annual Meeting of Stockholders to be held January 25, 2017, and is incorporated herein by reference.
PART IV
Item 15.ExhibitsExhibits and Financial Statement Schedules
|
|
|
|
|
|
|
|
| Page Number in Form 10-K |
(a) | (1) | Consolidated Financial Statements: |
|
|
|
| Report of Independent Registered Public Accounting Firm |
| 5062
|
|
| Consolidated Statements of Earnings for the fiscal years ended September 30, 2016, 2015,2019, 2018, and 20142017 |
| 5165
|
|
| Consolidated Statements of Comprehensive Earnings for the fiscal years ended September 30, 2016, 2015,2019, 2018, and 20142017 |
| 5267
|
|
| Consolidated Balance Sheets at September 30, 20162019 and 20152018 |
| 5367
|
|
| Consolidated Statements of Cash Flows for the fiscal years ended September 30, 2016, 2015,2019, 2018, and 20142017 |
| 5468
|
|
| Consolidated Statements of Stockholders’ Equity for the fiscal years ended September 30, 2016, 2015,2019, 2018, and 20142017 |
| 5569
|
|
| Notes to Consolidated Financial Statements |
| 5670
|
|
|
|
|
|
(a) | (2) | Consolidated Financial Statement Schedule: |
|
|
|
| Valuation and Qualifying Accounts |
| 110142
|
Financial statements and schedules other than those listed above are omitted for the reason that they are not applicable, are not required, or the information is included in the financial statements or the footnotes.
|
|
|
(a) | (3) | Exhibits Filed as Part of This Report: |
‡ | 3.12.1
| Share Purchase Agreement relating to the sale and purchase of all shares in L’Orange GmbH and Fluid Mechanics LLC dated April 8, 2018, filed as Exhibit 2.1 to Quarterly Report on Form 10-Q, filed on August 8, 2018 |
‡ | 3.1 | Restated Certificate of Incorporation, as amended October 3, 2007, filed as Exhibit 3(i)(a) to Annual Report on Form 10-K filed November 20, 2008 |
‡ | 3.2 | Bylaws of Woodward, Inc., as amended and restated on November 10, 2015, filed as Exhibit 3.2 to Annual Report on Form 10-K filed November 12, 2015 |
‡ | 3.3 | Certificate of Amendment of Certificate of Incorporation, dated January 23, 2008, filed as Exhibit 3(i)(b) to Annual Report on Form 10-K filed November 20, 2008 |
‡ | 3.4 | Certificate of Amendment of the Restated Certificate of Incorporation, dated January 26, 2011, filed as Exhibit 3.1 to Current Report on Form 8-K filed January 28, 2011 |
†‡ | 10.1 | Long-Term Management Incentive Compensation Plan, filed as Exhibit 10(c) to Annual Report on Form 10-K filed December 22, 2000 |
*†‡
| 10.2 | Summary Description of the Woodward Variable Incentive Plan, filed as Exhibit 10.2 to Annual Report on Form 10-K filed November 16, 2016 |
†‡ | 10.3 | 2002 Stock Option Plan, effective January 1, 2002, filed as Exhibit 10(iii) to Quarterly Report on Form 10-Q filed May 9, 2002 |
†‡ | 10.4 | Form of Outside Director Stock Purchase Agreement with James L. Rulseh, filed as Exhibit 10(j) to Annual Report on Form 10-K filed December 9, 2002 |
†‡ | 10.5 | 2006 Omnibus Incentive Plan, effective January 25, 2006, filed as Exhibit 4.1 to Registration Statement on Form S-8 filed April 28, 2006 |
†‡ | 10.6 | Amendment No. 1 to the Woodward, Inc. 2006 Omnibus Incentive Plan, effective as of January 26, 2011, filed as Exhibit 10.10 to Annual Report on Form 10-K filed November 16, 2011 |
†‡ | 10.7 | Material Definitive Agreement with A. Christopher Fawzy, filed as Exhibit 10.12 to Quarterly Report on Form 10-Q filed July 25, 2007 |
†‡ | 10.8 | Form of Non-Qualified Stock Option Agreement, filed as Exhibit 99.2 to Current Report on Form 8-K filed November 21, 2007 |
†‡ | 10.9 | Form of Non-Qualified Stock Option Agreement, filed as Exhibit 10.12 to Annual Report on Form 10-K filed November 15, 2012 |
†‡ | 10.10 | Form of Non-Qualified Stock Option Agreement, filed as Exhibit 10.13 to Annual Report on Form 10-K filed November 14, 2013 |
†‡ | 10.11 | Form of Restricted Stock Agreement, filed as Exhibit 10.1 to Quarterly Report on Form 10-Q filed January 22, 2014 |
†‡
| 10.12 | 2017 Omnibus Incentive Plan, effective September 14, 2016, filed as Exhibit 10.1 to Quarterly Report on Form 10-Q filed January 25, 2017 |
†‡ | 10.13 | Form of Non-Qualified Stock Option Agreement, filed as Exhibit 10.2 to Quarterly Report on Form 10-Q filed January 25, 2017 |
‡ | 10.14 | Credit Agreement, dated as of July 10, 2013, by and among the Company, the foreign subsidiary borrowers party thereto, the institutions party thereto as lenders, and Wells Fargo Bank, National Association, as administrative agent, filed as Exhibit 10.1 to Current Report on Form 8-K filed July 16, 2013 |
‡ | 10.1310.15
| Amendment No. 1 to Credit Agreement, dated April 28, 2015, and the conformed Credit Agreement by and among the Company, certain foreign subsidiary borrowers of the Company from time to time parties thereto, the institutions from time to time parties thereto, as lenders, Wells Fargo Bank, National Association, as administrative agent, filed as Exhibit 10.1 to Quarterly Report on Form 10-Q filed July 20,21, 2015 |
†‡ | 10.1410.16
| Chad Preiss Promotion Letter dated October 1, 2008, filed as Exhibit 10.19 to Annual Report on Form 10-K filed November 20, 2008 |
‡ | 10.1510.17
| Note Purchase Agreement, dated October 1, 2008, by and among the Company and the purchasers named therein, filed as Exhibit 10.2 to Current Report on Form 8-K filed October 7, 2008 |
‡ | 10.1610.18
| Amendment No. 1 to 2008 Note Purchase Agreement, dated as of October 1, 2013, by and among the Company and the noteholders named therein, filed as Exhibit 10.2 to Current Report on Form 8-K filed October 4, 2013 |
‡ | 10.1710.19
| Note Purchase Agreement, dated April 3, 2009, by and among the Company and the purchasers named therein, filed as Exhibit 10.2 to Current Report on Form 8-K filed April 8, 2009 |
‡ | 10.1810.20
| Amendment No. 1 to 2009 Note Purchase Agreement, dated as of October 1, 2013, by and among the Company and the noteholders named therein, filed as Exhibit 10.3 to Current Report on Form 8-K filed October 4, 2013 |
‡ | 10.1910.21
| Note Purchase Agreement, dated October 1, 2013, by and among the Company and the purchasers named therein, filed as Exhibit 10.1 to Current Report on Form 8-K filed October 4, 2013 |
*‡
| 10.2010.22
| Note Purchase Agreement, dated September 23, 2016, by and among the Company and the purchasers named therein, filed as Exhibit 10.20 to Annual Report on Form 10-K filed November 16, 2016 |
*‡
| 10.2110.23
| Note Purchase Agreement, dated September 23, 2016, by and among Woodward International Holding B.V. and the purchasers named therein, filed as Exhibit 10.21 to Annual Report on Form 10-K filed November 16, 2016 |
†‡ | 10.2210.24
| Asset Purchase Agreement, dated as of December 27, 2012, by and among the Company, Woodward HRT, Inc. GE Aviation Systems LLC and General Electric Company, filed as Exhibit 10.1 to Current Report on Form 8-K filed December 28, 2012
|
†‡
| 10.23
| Form of Change in Control Agreement for the Company’s principal executive officer and other executive officers other than the Company’s principal financial officer, filed as Exhibit 10.25 to Annual Report on Form 10-K filed November 12, 2014 |
†‡ | 10.2410.25
| Form of Change in Control Agreement for the Company’s principal financial officer, filed as Exhibit 10.26 to Annual Report on Form 10-K filed November 12, 2014 |
†‡ | 10.2510.26
| Executive Benefit Plan, as amended and restated as of September 18, 2013, filed as Exhibit 10.31 to Annual Report on Form 10-K filed November 14, 2013 |
†‡ | 10.2610.27
| James D. Rudolph Promotion Letter, dated February 10, 2011, filed as Exhibit 10.1 to Quarterly Report on Form 10-Q filed April 27, 2011
|
†‡
| 10.27
| Mr. Martin V. Glass employment letter, dated April 27, 2011, filed as Exhibit 10.1 to Quarterly Report on Form 10-Q filed July 26, 2011
|
†‡
| 10.28
| Sagar Patel employment letter, dated June 17, 2011, filed as Exhibit 10.2 to Quarterly Report on Form 10-Q filed July 26, 2011 |
†‡ | 10.2910.28
| Woodward Retirement Savings Plan, as amended and restated effective as of January 1, 2016, filed as Exhibit 10.1 to Quarterly Report on Form 10-Q filed February 9, 2016 |
†‡ | 10.3010.29
| Thomas G. Cromwell employment offer letter, dated January 30, 2019, filed as exhibit 10.1 to Quarterly Report on Form 10-Q filed May 8, 2019 |
†‡ | 10.30 | Jonathan W. Thayer employment offer letter, dated November 8, 2018, filed as exhibit 10.1 to Quarterly Report on Form 10-Q filed February 8, 2019 |
‡ | 10.31 | Purchase and Sale Agreement between Woodward, Inc. and General Electric Company dated January 4, 2016 filed as Exhibit 2.1 to Current Report on Form 8-K filed January 8, 2016 |
‡ | 10.3110.32
| Amended and Restated Limited Liability Company Agreement of Convergence Fuel Systems, LLC, dated January 4, 2016 filed as Exhibit 10.1 to Current Report on Form 8-K filed January 8, 2016 |
‡ | 10.3210.33
| Accelerated Share Repurchase (ASR) Master Confirmation Agreement dated June 2, 2015, filed as Exhibit 10.3 to Quarterly Report on Form 10-Q filed July 20,21, 2015 |
‡ | 10.3310.34
| Accelerated Share Repurchase (ASR) Supplemental Confirmation Agreement dated June 2, 2015, filed as Exhibit 10.4 to Quarterly Report on Form 10-Q filed July 20,21, 2015 |
*‡
| 21.110.35
| SubsidiariesFrame Development and Purchase Agreement between MTU Friedrichshafen GmbH and L’Orange GmbH, filed as Exhibit 10.1 to Quarterly Report on Form 10-Q, filed August 8, 2018
|
*‡
| 23.110.36
| Note Purchase Agreement, dated May 31, 2018, by and among Woodward, Inc. and the purchasers named therein, filed as Exhibit 10.1 to Current Report on Form 8-K, filed June 4, 2018 |
‡ | 10.37 | Amendment No. 1 to 2013 Note Purchase Agreement, dated as of May 31, 2018, by and among Woodward, Inc. and the noteholders names therein, filed as Exhibit 10.2 of the Company’s Current Report on Form 8-K, filed June 4, 2018 |
‡ | 10.38 | Amendment No. 1 to 2016 Series M Note Purchase Agreement, dated as of May 31, 2018, by and among Woodward, Inc. and the noteholders names therein filed as Exhibit 10.3 of the Company’s Current Report on Form 8-K, filed June 4, 2018 |
‡ | 10.39 | Amendment No. 1 to 2016 Series N and O Note Purchase Agreement, dated as of May 31, 2018, by and among Woodward International Holding B.V., Woodward, Inc. and the noteholders names therein, filed as Exhibit 10.4 of the Company’s Current Report on Form 8-K, filed June 4, 2018 |
‡ | 10.40 | Amended and Restated Credit Agreement dated June 19, 2019, by and among the Company, certain foreign subsidiaries borrowers of the Company from time to time parties thereto, the institutions from time to time party thereto, as lenders, Wells Fargo Bank, National Association, as administrative agent, filed as Exhibit 10.1 on Form 10-Q, filed August 12, 2019 |
†* | 10.41 | Form of Restricted Stock Unit Agreement, filed as Exhibit 10.39 on Form 10-K, filed November 13, 2018 |
†* | 10.42 | Form of Non-Qualified Stock Option Agreement filed as Exhibit 10.40 on Form 10-K, filed November 13, 2018 |
* | 10.43 | Outside Director Compensation Policy |
* | 21.1 | Subsidiaries |
* | 23.1 | Consent of Independent Registered Public Accounting Firm |
* | 31.1 | Rule 13a-14(a)/15d-14(a) certification of Thomas A. Gendron |
* | 31.2 | Rule 13a-14(a)/15d-14(a) certification of Robert F. Weber, Jr.Jonathan W. Thayer |
* | 32.1 | Section 1350 certifications |
*
| 101.INS
| XBRL Instance Document.
|
* | 101.SCH101.INS
| Inline XBRL Instance Document. |
* | 101.SCH | Inline XBRL Taxonomy Extension Schema Document |
* | 101.CAL | Inline XBRL Taxonomy Extension Calculation Linkbase Document |
* | 101.DEF | Inline XBRL Taxonomy Extension Definition Linkbase Document |
* | 101.LAB | Inline XBRL Taxonomy Extension Label Linkbase Document |
* | 101.PRE | Inline XBRL Taxonomy Extension Presentation Linkbase Document |
* | 104 | Cover Page Interactive Data File (formatted as Inline XBRL and Contained in Exhibit 101) |
| Attached as Exhibit 101 to this report are the following materials from Woodward, Inc.’s Annual Report on Form 10-K for the year ended September 30, 2016,2019 formatted in Inline XBRL (eXtensible Business Reporting Language): (i) the Consolidated Statements of Earnings, (ii) the Consolidated Statements of Comprehensive Earnings, (iii) the Consolidated Balance Sheets, (iv) the Consolidated Statements of Cash Flows, (v) the Consolidated Statements of Stockholders’ Equity, and (vi) the Notes to the Consolidated Financial Statements. |
|
|
† ‡ | Management contract or compensatory plan or arrangement. Incorporated by reference as an exhibit to this Report (file number 000-08408, unless otherwise indicated). |
* | Filed as an exhibit to this Report. |
Item 16.Form 10-K Summary
Not applicable.
SIGNATURES
SIGNATURES
Pursuant to the requirements of Section 13 or 15(d) of the Securities Exchange Act of 1934, the registrant has duly caused this report to be signed on its behalf by the undersigned, thereunto duly authorized.
|
|
|
|
|
|
| WOODWARD, INC. |
Date: November 16, 201625, 2019 |
|
| /s/ Thomas A. Gendron |
|
|
| Thomas A. Gendron |
|
|
| Chairman of the Board, Chief Executive Officer, and President (Principal Executive Officer) |
|
|
|
|
Date: November 16, 201625, 2019 |
|
| /s/ Robert F. Weber, Jr.Jonathan W. Thayer |
|
|
| Robert F. Weber, Jr.Jonathan W. Thayer
|
|
|
| Vice Chairman, Corporate Operations and Chief Financial Officer and Treasurer (Principal Financial and Accounting Officer) |
Pursuant to the requirements of the Securities Exchange Act of 1934, this report has been signed below by the following persons on behalf of the registrant and in the capacities and on the dates indicated.
|
|
|
|
|
Signature |
| Title |
| Date |
/s/ John D. Cohn |
| Director |
| November 16, 201625, 2019 |
John D. Cohn |
|
|
|
|
/s/ Paul Donovan |
| Director |
| November 16, 201621, 2019 |
Paul Donovan |
|
|
|
|
/s/ Eileen P. Drake |
| Director |
| November 25, 2019 |
Eileen P. Drake |
|
|
|
|
/s/ Thomas A. Gendron |
| Chairman of the Board |
| November 16, 201625, 2019 |
Thomas A. Gendron |
| and Director |
|
|
/s/ John A. HalbrookDaniel G. Korte |
| Director |
| November 16, 201625, 2019 |
John A. HalbrookDaniel G. Korte
|
|
|
|
|
/s/ Mary L. Petrovich |
| Director |
| November 16, 201625, 2019 |
Mary L. Petrovich |
|
|
|
|
/s/ Larry E. Rittenberg
| | Director
| | November 16, 2016
|
Larry E. Rittenberg
| | | | |
/s/ James R. Rulseh
| | Director
| | November 16, 2016
|
James R. Rulseh
| | | | |
/s/ Ronald M. Sega |
| Director |
| November 16, 201625, 2019 |
Ronald M. Sega |
|
|
|
|
/s/ Gregg C. Sengstack |
| Director |
| November 16, 201625, 2019 |
Gregg C. Sengstack |
|
|
| |
/s/ Jonathan W. Thayer
| | Director
| | November 16, 2016
|
Jonathan W. Thayer
| | | |
|
WOODWARD, INC. AND SUBSIDIARIES
SCHEDULE II – VALUATION AND QUALIFYING ACCOUNTS
For the years ended September 30, 2016, 2015,2019, 2018, and 20142017
(in thousands)
|
|
|
|
|
|
|
|
|
|
|
|
|
|
|
|
|
|
|
|
|
|
|
|
|
|
|
|
|
|
|
|
Column A |
| Column B |
| Column C |
| Column D |
| Column E |
|
|
|
|
| Additions |
|
|
|
|
|
|
Description |
| Balance at Beginning of Year |
| Charged to Costs and Expenses |
| Charged to Other Accounts (a) |
| Deductions (b) |
| Balance at End of Year |
Fiscal year 2019 |
|
|
|
|
|
|
|
|
|
|
|
|
|
|
|
Allowance for uncollectible accounts |
| $ | 3,938 |
| $ | 4,899 |
| $ | 251 |
| $ | (1,180) |
| $ | 7,908 |
Deferred tax asset valuation allowance |
|
| 4,522 |
|
| 19 |
|
| - |
|
| (903) |
|
| 3,638 |
Fiscal year 2018 |
|
|
|
|
|
|
|
|
|
|
|
|
|
|
|
Allowance for uncollectible accounts |
|
| 3,776 |
|
| 207 |
|
| 466 |
|
| (511) |
|
| 3,938 |
Deferred tax asset valuation allowance |
|
| 3,714 |
|
| 73 |
|
| 553 |
|
| 182 |
|
| 4,522 |
Fiscal year 2017 |
|
|
|
|
|
|
|
|
|
|
|
|
|
|
|
Allowance for uncollectible accounts |
|
| 2,540 |
|
| 1,063 |
|
| 449 |
|
| (276) |
|
| 3,776 |
Deferred tax asset valuation allowance |
|
| 3,317 |
|
| 77 |
|
| - |
|
| 320 |
|
| 3,714 |
Notes:
| | | | | | | | | | | | | | | |
| | | | | | | | | | | | | | | |
Column A | | Column B | | Column C | | Column D | | Column E |
| | | | | Additions | | | | | | |
Description | | Balance at Beginning of Year | | Charged to Costs and Expenses | | Charged to Other Accounts (a) | | Deductions (b) | | Balance at End of Year |
Fiscal year 2016 | | | | | | | | | | | | | | | |
Allowance for uncollectible accounts | | $ | 3,841 | | $ | 255 | | $ | 233 | | $ | (1,789) | | $ | 2,540 |
Deferred tax asset valuation allowance | | | 6,804 | | | 53 | | | - | | | (3,540) | | | 3,317 |
Fiscal year 2015 | | | | | | | | | | | | | | | |
Allowance for uncollectible accounts | | | 7,078 | | | 364 | | | 487 | | | (4,088) | | | 3,841 |
Deferred tax asset valuation allowance | | | 9,486 | | | 209 | | | - | | | (2,891) | | | 6,804 |
Fiscal year 2014 | | | | | | | | | | | | | | | |
Allowance for uncollectible accounts | | | 8,872 | | | 1,283 | | | 916 | | | (3,993) | | | 7,078 |
Deferred tax asset valuation allowance | | | 11,783 | | | 271 | | | - | | | (2,568) | | | 9,486 |
(a)Includes recoveries of accounts previously written off.
Notes:
(b)Represents accounts receivable written off against the allowance for uncollectible accounts and releases of valuation reserves to income tax expense. Also included are foreign currency exchange rate adjustments. Currency translation adjustments resulted in a increase in the reserves of $112 in fiscal year 2019, an increase in the reserves of $96 in fiscal year 2018, and an increase in the reserves of $64 in fiscal year 2017.
| (a)
| | Includes recoveries of accounts previously written off.
|
| (b)
| | Represents accounts receivable written off against the allowance for collectible accounts and releases of valuation reserves to income tax expense. Also included are foreign currency exchange rate adjustments. Currency translation adjustments resulted in an increase in the reserves of $77 in fiscal year 2016, a decrease in the reserve of $934 in fiscal year 2015, and a decrease in the reserve of $704 in fiscal year 2014.
|