0000200406jnj:Wholesaler2Memberjnj:WholesalerConcentrationRiskMemberus-gaap:SalesRevenueNetMember2022-01-032023-01-01 UNITED STATES
SECURITIES AND EXCHANGE COMMISSION
Washington, D.C. 20549
FORM 10-K
| | | | | |
| ☑ | ANNUAL REPORT PURSUANT TO SECTION 13 OF THE SECURITIES EXCHANGE ACT OF 1934 |
THE SECURITIES EXCHANGE ACT OF 1934For the fiscal year ended December 31, 2023
| | | | | |
| ☐ | |
ForTransition Report Pursuant to Section 13 or 15(d) of the fiscal year ended December 31, 2017 | Commission file number 1-3215Securities Exchange Act of 1934for the transition period from to |
JOHNSONCommission file number 1-3215
Johnson & JOHNSONJohnson
(Exact name of registrant as specified in its charter)
| | | | | | | | |
| New Jersey | | 22-1024240 |
| | |
New Jersey | | 22-1024240 |
| (State of incorporation) | | (I.R.S. Employer Identification No.) |
One Johnson & Johnson Plaza New Brunswick, New Jersey | | 08933 |
| (Address of principal executive offices) | | (Zip Code) |
One Johnson & Johnson Plaza
New Brunswick, New Jersey 08933
(Address of principal executive offices)
Registrant’s telephone number, including area code: (732) 524-0400
SECURITIES REGISTERED PURSUANT TO SECTION 12(b) OF THE ACT
| | | | | | | | |
| | |
| Title of each class | Trading Symbol | Name of each exchange on which registered |
| Common Stock, Par Value $1.00 | JNJ | New York Stock Exchange |
4.75% Notes Due November 2019 | | New York Stock Exchange |
0.250% Notes Due January 2022 | | New York Stock Exchange |
| 0.650% Notes Due May 2024 | JNJ24C | New York Stock Exchange |
| 5.50% Notes Due November 2024 | JNJ24BP | New York Stock Exchange |
| 1.150% Notes Due November 2028 | JNJ28 | New York Stock Exchange |
| 1.650% Notes Due May 2035 | JNJ35 | New York Stock Exchange |
Indicate by check mark if the registrant is a well-known seasoned issuer, as defined in Rule 405 of the Securities Act. Yes þ No o
Indicate by check mark if the registrant is not required to file reports pursuant to Section 13 or Section 15(d) of the Exchange Act. Yes o No þ
Indicate by check mark whether the registrant (1) has filed all reports required to be filed by Section 13 or 15(d) of the Exchange Act during the preceding 12 months (or for such shorter period that the registrant was required to file such reports), and (2) has been subject to such filing requirements for the past 90 days. Yes þ No o
Indicate by check mark whether the registrant has submitted electronically and posted on its corporate website, if any, every Interactive Data File required to be submitted and posted pursuant to Rule 405 of Regulation S-T during the preceding 12 months (or for such shorter period that the registrant was required to submit and post such files). Yes þ No o
Indicate by check mark if disclosure of delinquent filers pursuant to Item 405 of Regulation S-K is not contained herein, and will not be contained, to the best of registrant’s knowledge, in definitive proxy or information statements incorporated by reference in Part III of this Form 10-K or any amendment to this Form 10-K. o
Indicate by check mark whether the registrant is a large accelerated filer, an accelerated filer, a non-accelerated filer, a smaller reporting company, or emerging growth company. See the definitions of “large accelerated filer,” “accelerated filer”, “smaller reporting company,"” and "emerging“emerging growth company"company” in Rule 12b-2 of the Exchange Act.
| | | | | | | | | | | |
| | | | |
| Large accelerated filerþ | ☑ | Accelerated filero | ☐ |
| Non-accelerated filero | ☐ | (Do not check if a smaller reporting company) | |
| Smaller reporting companyo | ☐ |
Emerging growth companyo | ☐ | | |
If an emerging growth company, indicate by check mark if the registrant has elected not to use the extended transition period for complying with any new or revised financial accounting standards provided pursuant to Section 13(a) of the Exchange Act. o
Indicate by check mark whether the registrant has filed a report on and attestation to its management's assessment of the effectiveness of its internal control over financial reporting under Section 404(b) of the Sarbanes-Oxley Act (15 U.S.C. 7262(b)) by the registered public accounting firm that prepared or issued its audit report. Yes ☑ No o
If securities are registered pursuant to Section 12(b) of the Act, indicate by check mark whether the financial statements of the registrant included in the filing reflect the correction of an error to previously issued financial statements. o
Indicate by check mark whether any of those error corrections are restatements that required a recovery analysis of incentive-based compensation received by any of the registrant’s executive officers during the relevant recovery period pursuant to §240.10D-1(b). o
Indicate by check mark whether the registrant is a shell company (as defined in Rule 12b-2 of the Exchange Act). Yes o☐ No þ
The aggregate market value of the Common Stock held by non-affiliates computed by reference to the price at which the Common Stock was last sold as of the last business day of the registrant’s most recently completed second fiscal quarter was approximately $355$430 billion.
On February 16, 2018,9, 2024, there were 2,682,901,5532,408,767,228 shares of Common Stock outstanding.
DOCUMENTS INCORPORATED BY REFERENCE
| | | | | |
| |
Parts I andPart III: | Portions of the registrant’s proxy statement for its 20182024 annual meeting of shareholders filed within 120 days after the close of the registrant’s fiscal year (the "Proxy Statement"“Proxy Statement”), are incorporated by reference to this report on Form 10-K (this "Report"“Report”). |
| | | | | | | | | | | |
| Item | Page |
| | | |
|
| 1 | | | |
| | | | |
| | | | |
| | | | |
| | | | |
| | | | |
| | | |
| | | | |
| | | | |
| | | | |
| | | | |
| | | |
| | | | |
| 1A. | | | |
| 1B. | | | |
| 1C. | | | |
| 2 | | | |
| 3 | | | |
| 4 | | | |
| | | | |
|
|
| 5 | | | |
| 6 | | | |
| 7 | | | |
| 7A. | | | |
| 8 | | | |
| 9 | | | |
| 9A. | | | |
| 9B. | | | |
| 9C. | | | |
|
|
| 10 | | | |
| 11 | | | |
| 12 | | | |
| 13 | | | |
| 14 | | | |
|
|
| 15 | | | | |
| 16 | | | | |
| | | | |
| | | | |
|
| | |
| Item | | Page |
| | | |
|
| 1 | | |
| | | |
| | | |
| | | |
| | | |
| | | |
| | | |
| | | |
| | | |
| | | |
| | | |
| | | |
| | | |
| 1A. | | |
| 1B. | | |
| 2 | | |
| 3 | | |
| 4 | | |
| | | |
| |
|
| 5 | | |
| 6 | | |
| 7 | | |
| 7A. | | |
| 8 | | |
| 9 | | |
| 9A. | | |
| 9B. | | |
| |
|
| 10 | | |
| 11 | | |
| 12 | | |
| 13 | | |
| 14 | | |
| |
|
| 15 | | |
| 16 | | |
| | | |
| | | |
Cautionary note regarding forward-looking statements
CAUTIONARY NOTE REGARDING FORWARD-LOOKING STATEMENTS
This Annual Report on Form 10-K and Johnson & Johnson'sJohnson’s other publicly available documents contain "forward-looking statements"“forward-looking statements” within the meaning of the safe harbor provisions of the U.S.United States Private Securities Litigation Reform Act of 1995. Management and representatives of Johnson & Johnson and its subsidiaries (the "Company")Company) also may from time to time make forward-looking statements. Forward-looking statements do not relate strictly to historical or current facts and reflect management’s assumptions, views, plans, objectives and projections about the future. Forward-looking statements may be identified by the use of words such as “plans,” “expects,” “will,” “anticipates,” “estimates” and other words of similar meaning in conjunction with, among other things: discussions of future operations; expected operating results and financial performance; impact of planned acquisitions and dispositions; impact and timing of restructuring initiatives, including associated cost savings and other benefits; the Company’s strategy for growth; product development;development activities; regulatory approvals; market position and expenditures.
Because forward-looking statements are based on current beliefs, expectations and assumptions regarding future events, they are subject to uncertainties, risks and changes that are difficult to predict and many of which are outside of the Company'sCompany’s control. Investors should realize that if underlying assumptions prove inaccurate, or known or unknown risks or uncertainties materialize, the Company’s actual results and financial condition could vary materially from expectations and projections expressed or implied in its forward-looking statements. Investors are therefore cautioned not to rely on these forward-looking statements. Risks and uncertainties include, but are not limited to:
Risks related to product development, market success and competition
Risks Related to Product Development, Market Success and Competition
•Challenges and uncertainties inherent in innovation and development of new and improved products and technologies on which the Company’s continued growth and success depend, including uncertainty of clinical outcomes, additional analysis of existing clinical data, obtaining regulatory approvals, health plan coverage and customer access, and initial and continued commercial success;
•Challenges to the Company’s ability to obtain and protect adequate patent and other intellectual property rights for new and existing products and technologies in the U.S.United States and other important markets;
•The impact of patent expirations, typically followed by the introduction of competing biosimilars and genericsgeneric, biosimilar or other products and resulting revenue and market share losses;
•Increasingly aggressive and frequent challenges to the Company’s patents by competitors and others seeking to launch competing generic, biosimilar or other products and increased receptivity of courts, the United States Patent and Trademark Office and other decision makers to such challenges, potentially resulting in loss of market exclusivity and rapid decline in sales for the relevant product;product sooner than expected;
•Competition in research and development of new and improved products, processes and technologies, which can result in product and process obsolescence;
•Competition to reach agreement with third parties for collaboration, licensing, development and marketing agreements for products and technologies;
•Competition based on the basis of cost-effectiveness, product performance, technological advances and patents attained by competitors; and
•Allegations that the Company’s products infringe the patents and other intellectual property rights of third parties, which could adversely affect the Company’s ability to sell the products in question and require the payment of money damages and future royalties.
Risks Relatedrelated to Product Liability, Litigationproduct liability, litigation and Regulatory Activityregulatory activity
•Product efficacy or safety concerns, whether or not based on scientific evidence, potentially resulting in product withdrawals, recalls, regulatory action on the part of the U.S.United States Food and Drug Administration (U.S. FDA) (or international counterparts), declining sales, reputational damage, increased litigation expense and share price impact;
•The impact, including declining sales and reputational damage;
Impactdamage, of significant litigation or government action adverse to the Company, including product liability claims and allegations related to pharmaceutical marketing practices and contracting strategies;
•The impact of an adverse judgment or settlement and the adequacy of reserves related to legal proceedings, including patent litigation, product liability, personal injury claims, securities class actions, government investigations, employment and other legal proceedings;
•Increased scrutiny of the health carehealthcare industry by government agencies and state attorneys general resulting in investigations and prosecutions, which carry the risk of significant civil and criminal penalties, including, but not limited to, debarment from government business;
•Failure to meet compliance obligations in the McNEIL-PPC, Inc. Consent Decree or the Corporate Integrity Agreements of the Johnson & Johnson Pharmaceutical Affiliates, or any other compliance agreements with governments or government agencies, which could result in significant sanctions;
•Potential changes to applicable laws and regulations affecting U.S.United States and international operations, including relating to: approval of new products; licensing and patent rights; sales and promotion of health carehealthcare products; access to, and reimbursement and pricing for, health carehealthcare products and services; environmental protectionprotection; and sourcing of raw materials;
•Compliance with local regulations and laws that may restrict the Company’s ability to manufacture or sell its products in relevant markets, including requirements to comply with medical device reporting regulations and other requirements such as the European Union’s Medical Devices Regulation;
•Changes in domestic and international tax laws and regulations, increasing audit scrutiny by tax authorities around the world and exposures to additional tax liabilities potentially in excess of existing reserves; and
Issuance•The issuance of new or revised accounting standards by the Financial Accounting Standards Board and regulations by the Securities and Exchange Commission.
Risks Relatedrelated to the Company’s Strategic Initiativesstrategic initiatives, healthcare market trends and the realization of benefits from the separation of the Company’s Consumer Health Care Market TrendsBusiness
•Pricing pressures resulting from trends toward health carehealthcare cost containment, including the continued consolidation among health carehealthcare providers and other market participants, trends toward managed care, the shift toward governments increasingly becoming the primary payerspayors of health carehealthcare expenses, and significant new entrants to the health carehealthcare markets seeking to reduce costs;costs and government pressure on companies to voluntarily reduce costs and price increases;
•Restricted spending patterns of individual, institutional and governmental purchasers of health carehealthcare products and services due to economic hardship and budgetary constraints;
•Challenges to the Company’s ability to realize its strategy for growth including through externally sourced innovations, such as development collaborations, strategic acquisitions, licensing and marketing agreements, and the potential heightened costs of any such external arrangements due to competitive pressures;
•The potential that the expected strategic benefits and opportunities from any planned or completed acquisition or divestiture by the Company including the integration of Actelion Ltd., may not be realized or may take longer to realize than expected; and
•The potential that the expected benefits and opportunities related to past and futureongoing restructuring actions may not be realized or may take longer to realize than expected, including dueexpected;
•The Company’s ability to any required consultation procedures relatingdivest the Company’s remaining ownership interest in Kenvue Inc. (Kenvue) and realize the anticipated benefits from the separation; and
•Kenvue's ability to restructuring of workforce.succeed as a standalone publicly traded company.
Risks Relatedrelated to Economic Conditions, Financial Marketseconomic conditions, financial markets and Operating Internationallyoperating internationally
Impact•The risks associated with global operations on the Company and its customers and suppliers, including foreign governments in countries in which the Company operates;
•The impact of inflation and fluctuations in interest rates and currency exchange rates and the potential effect of such fluctuations on revenues, expenses and resulting margins;
•Potential changes in export/import and trade laws, regulations and policies of the U.S., U.K.United States and other countries, including any increased trade restrictions or tariffs and potential drug reimportation legislation;
•The impact on international operations from financial instability in international economies, sovereign risk, possible imposition of governmental controls and restrictive economic policies, and unstable international governments and legal systems;
•The impact of global public health crises and pandemics;
•Changes to global climate, extreme weather and natural disasters that could affect demand for the Company'sCompany’s products and services, cause disruptions in manufacturing and distribution networks, alter the availability of goods and services within the supply chain, and affect the overall design and integrity of the Company'sCompany’s products and operations;
•The impact of global or economic changes or events, including global tensions and war; and
•The impact of armed conflicts and terrorist attacks in the U.S.United States and other parts of the world, including social and economic disruptions and instability of financial and other markets.
Risks Relatedrelated to Supply Chainsupply chain and Operationsoperations
•Difficulties and delays in manufacturing, internally, through third-party providers or otherwise within the supply chain, that may lead to voluntary or involuntary business interruptions or shutdowns, product shortages, withdrawals or suspensions of products from the market, and potential regulatory action;
•Interruptions and breaches of the Company'sCompany’s information technology systems andor those of the Company'sCompany’s vendors, which could result in reputational, competitive, operational or other business harm as well as financial costs and regulatory action; and
•Reliance on global supply chains and production and distribution processes that are complex and subject to increasing regulatory requirements that may adversely affect supply, sourcing and pricing of materials used in the Company’s products.products; and
•The potential that the expected benefits and opportunities related to restructuring actions may not be realized or may take longer to realize than expected, including due to any required approvals from applicable regulatory authorities.
Investors also should carefully read the Risk Factorsrisk factors described in Item 1A of this Annual Report on Form 10-K for a description of certain risks that could, among other things, cause the Company’s actual results to differ materially from those expressed in its forward-looking statements. Investors should understand that it is not possible to predict or identify all such factors and should not consider the risks described above and in Item 1A to be a complete statement of all potential risks and uncertainties. The Company does not undertake to publicly update any forward-looking statement that may be made from time to time, whether as a result of new information or future events or developments.
PARTPart I
General
Johnson & Johnson and its subsidiaries (the Company) have approximately 134,000131,900 employees worldwide engaged in the research and development, manufacture and sale of a broad range of products in the health carehealthcare field. Johnson & Johnson is a holding company, which has more than 260with operating companies conducting business in virtually all countries of the world. The Company’s primary focus is products related to human health and well-being. Johnson & Johnson was incorporated in the State of New Jersey in 1887.
The Executive Committee of Johnson & Johnson is the principal management group responsible for the strategic operations and allocation of the resources of the Company. This Committee oversees and coordinates the activities of the Company's threetwo business segments: Consumer, PharmaceuticalInnovative Medicine (previously referred to as Pharmaceutical) and Medical Devices.MedTech. Within the strategic parameters provided by the Committee, senior management groups at U.S. and international operating companies are each responsible for their own strategic plans and the day-to-day operations of those companies. Each subsidiary within the business segments is, with limited exceptions, managed by residents of the country where located.
Segments of Businessbusiness
TheFollowing the completion of the separation of the Consumer Health business (Kenvue) in August 2023, the Company is now organized into threetwo business segments: Consumer, PharmaceuticalInnovative Medicine and Medical Devices.MedTech. Additional information required by this item is incorporated herein by reference to the narrative and tabular descriptions of segments and operating results under: “ItemItem 7. Management’s Discussiondiscussion and Analysisanalysis of Resultsresults of Operationsoperations and Financial Condition”financial condition of this Report; and Note 18 “Segments17 Segments of Businessbusiness and Geographic Areas”geographic areas of the Notesnotes to Consolidated Financial Statementsconsolidated financial statements included in Item 8 of this Report.
ConsumerInnovative Medicine
The Consumer segment includes a broad range of products used in the baby care, oral care, beauty, over-the-counter pharmaceutical, women’s health and wound care markets. Baby Care includes the JOHNSON’S® line of products. Oral Care includes the LISTERINE® product line. Major brands in Beauty include the AVEENO®; CLEAN & CLEAR®; DABAO™; JOHNSON’S® Adult; LE PETITE MARSEILLAIS®; NEUTROGENA®; RoC® and OGX® product lines. Over-the-counter medicines include the broad family of TYLENOL® acetaminophen products; SUDAFED® cold, flu and allergy products; BENADRYL® and ZYRTEC® allergy products; MOTRIN® IB ibuprofen products; and the PEPCID® line of acid reflux products. Major brands in Women’s Health outside of North America are STAYFREE® and CAREFREE® sanitary pads and o.b.® tampon brands. Wound Care brands include the BAND-AID® Brand Adhesive Bandages and NEOSPORIN® First Aid product lines. These products are marketed to the general public and sold both to retail outlets and distributors throughout the world.
Pharmaceutical
The PharmaceuticalInnovative Medicine segment is focused on sixthe following therapeutic areas: Immunology (e.g., rheumatoid arthritis, psoriatic arthritis, inflammatory bowel disease and psoriasis), Infectious Diseases and Vaccines (e.g., HIV/AIDS), Neuroscience (e.g., mood disorders, neurodegenerative disorders and schizophrenia), Oncology (e.g., prostate cancer, hematologic malignancies, lung cancer and hematologic malignancies)bladder cancer), Cardiovascular and Metabolism (e.g., thrombosis, diabetes and diabetes)macular degeneration) and Pulmonary Hypertension (e.g., Pulmonary Arterial Hypertension), a new therapeutic area, which was established with the acquisition of Actelion in June 2017.. Medicines in this segment are distributed directly to retailers, wholesalers, distributors, hospitals and health carehealthcare professionals for prescription use. Key products in the PharmaceuticalInnovative Medicine segment include: REMICADE® (infliximab), a treatment for a number of immune-mediated inflammatory diseases; SIMPONI® (golimumab), a subcutaneous treatment for adults with moderate to severe rheumatoid arthritis, active psoriatic arthritis, active ankylosing spondylitis and moderately active to severely active ulcerative colitis; SIMPONI ARIA® (golimumab), an intravenous treatment for adults with moderate to severe rheumatoid arthritis;arthritis, active psoriatic arthritis and active ankylosing spondylitis and active polyarticular juvenile idiopathic arthritis (pJIA) in people 2 years of age and older; STELARA® (ustekinumab), a treatment for adults and children with moderate to severe plaque psoriasis, for adults with active psoriatic arthritis, for adults with moderately to severely active Crohn's disease and treatment of moderately to severely active ulcerative colitis; TREMFYA (guselkumab), a treatment for adults with moderate to severe plaque psoriasis and active psoriatic arthritis, and for adults with moderately to severely active Crohn's disease;arthritis; EDURANT® (rilpivirine) and, PREZISTA® (darunavir) and PREZCOBIX®/PREZCOBIX/REZOLSTA® (darunavir/cobicistat), antiretroviral medicines for the treatment of human immunodeficiency virus (HIV-1)(HIV) in combination with other antiretroviral products;products and SYMTUZA (darunavir/cobicistat/emtricitabine/tenofovir alafenamide), a once-daily single tablet regimen for the treatment of HIV; CONCERTA® (methylphenidate HCl) extended-release tablets CII, a treatment for attention deficit hyperactivity disorder; INVEGA SUSTENNA®/SUSTENNA/XEPLION® (paliperidone palmitate), for the treatment of schizophrenia and schizoaffective disorder in adults; INVEGA TRINZA®/TRINZA/TREVICTA® (paliperidone palmitate), for the treatment of schizophrenia in patients after they have been adequately treated with INVEGA SUSTENNA® for at least four months; RISPERDAL CONSTA® (risperidone long-acting injection)SPRAVATO (Esketamine), a nasal spray, used along with an oral antidepressant, to treat adults with treatment-resistant depression (TRD) and depressive symptoms in adults with major depressive disorder (MDD) with suicidal thoughts or actions; CARVYKTI (ciltacabtagene autoleucel), a chimeric antigen receptor (CAR)-T-cell therapy for the treatment of schizophrenia andpatients with relapsed/refractory multiple myeloma; ZYTIGA (abiraterone
acetate), a treatment for patients with prostate cancer; ERLEADA (apalutamide), a next-generation androgen receptor inhibitor for the maintenance treatment of Bipolar 1 Disorder in adults; VELCADE® (bortezomib)patients with prostate cancer; IMBRUVICA (ibrutinib), a treatment for certain B-cell malignancies, or blood cancers and chronic graft versus host disease; DARZALEX (daratumumab), a treatment for multiple myeloma; DARZALEX FASPRO (daratumumab and hyaluronidase-fihj), a treatment for multiple myeloma and for use in combination with rituximab, cyclophosphamide, doxorubicin and prednisone for the treatment of adult patients with previously untreated mantle cell lymphoma; ZYTIGA® (abiraterone
acetate), used in combination with prednisone as a treatment for metastatic castration-resistant prostate cancer; IMBRUVICA® (ibrutinib), an oral, once-daily therapy approved for use in treating certain B-cell malignancies, or blood cancers, and Waldenström's Macroglobulinemia; DARZALEX® (daratumumab), for the treatment of relapsed/refractory multiple myeloma; PROCRIT®/ EPREX®, to stimulate red blood cell production;light chain (AL) Amyloidosis; XARELTO® (rivaroxaban), an oral anticoagulant for the prevention of deep vein thrombosis (DVT), which may lead to pulmonary embolism (PE) in patients undergoing hip or knee replacement surgery, to reduce the risk of stroke and systemic embolism in patients with nonvalvular atrial fibrillation, and for the treatment and reduction of risk of recurrence of DVT and PE; INVOKANA® (canagliflozin)PE to reduce the risk of major cardiovascular events in patients with coronary artery disease (CAD) and peripheral artery disease (PAD), for the treatment and secondary prevention of adults with type 2 diabetes; INVOKAMET®/VOKANAMET® (canagliflozin/metformin HCl), a combination therapy of fixed doses of canagliflozinthromboembolism in pediatric patients, and metformin hydrochloride for thromboprophylaxis in pediatric patients following the treatment of adults with type 2 diabetes; and INVOKAMET® XR (canagliflozin/metformin hydrochloride extended-release), a once-daily, fixed-dose combination therapy of canagliflozin and metformin hydrochloride extended-release, for the treatment of adults with type 2 diabetes;Fontan procedure; OPSUMIT® (macitentan) as monotherapy or in combination, indicated for the long-term treatment of pulmonary arterial hypertension (PAH); UPTRAVI® (selexipag), the only approved oral and intravenous, selective IP receptor agonist targeting a prostacyclin pathway in PAH. Many of these medicines were developed in collaboration with strategic partners or are licensed from other companies and maintain active lifecycle development programs.
Medical DevicesMedTech
The Medical DevicesMedTech segment includes a broad rangeportfolio of products used in the orthopaedic,Interventional Solutions, Orthopaedics, Surgery and Vision categories. Interventional Solutions include electrophysiology products (Biosense Webster) to treat heart rhythm disorders, the heart recovery portfolio (Abiomed) which includes technologies to treat severe coronary artery disease requiring high-risk PCI or AMI cardiogenic shock, and Neurovascular care (Cerenovus) that treats hemorrhagic and ischemic stroke. The Orthopaedics portfolio (DePuy Synthes) includes products and enabling technologies that support Hips, Knees, Trauma, and Spine, Sports & Other. The Surgery portfolios include advanced and general surgery cardiovascular, diabetes caretechnologies (Ethicon), as well as solutions that focus on breast aesthetics (Mentor), and eye health fields.Ear, Nose and Throat (Acclarent) procedures. Johnson & Johnson Vision products include ACUVUE Brand contact lenses and TECNIS intraocular lenses for cataract surgery. These products are distributed to wholesalers, hospitals and retailers, and used principallypredominantly in the professional fields by physicians, nurses, hospitals, eye care professionals and clinics. They include orthopaedic products; general surgery, biosurgical, endomechanical and energy products; electrophysiology products to treat cardiovascular disease; sterilization and disinfection products to reduce surgical infection; diabetes care products, such as blood glucose monitoring; and vision care products such as disposable contact lenses and ophthalmic products related to cataract and laser refractive surgery.
Geographic Areasareas
The business of Johnson & Johnson is conducted by more than 260 operating companies locatedand its subsidiaries (the Company) have approximately 131,900 employees worldwide engaged in more than 60 countries, including the U.S., which sellresearch and development, manufacture and sale of a broad range of products in the healthcare field. The Company conducts business in virtually all countries throughoutof the world. world with the primary focus on products related to human health and well-being.
The products made and sold in the international business include many of those described above under “– Segments of Business – Consumer,” “– Pharmaceutical”Innovative Medicine and “– Medical Devices.”MedTech. However, the principal markets, products and methods of distribution in the international business vary with the country and the culture. The products sold in international business include those developed in the U.S. and by subsidiaries abroad.
Investments and activities in some countries outside the U.S. are subject to higher risks than comparable U.S. activities because the investment and commercial climate may be influenced by financial instability in international economies, restrictive economic policies and political and legal system uncertainties.
Raw Materialsmaterials
Raw materials essential to the Company's business are generally readily available from multiple sources. Where there are exceptions, the temporary unavailability of those raw materials would not likely have a material adverse effect on the financial results of the Company.
Patents
The Company's subsidiaries have made a practice of obtaining patent protection on their products and processes where possible. They own, or are licensed under, a significant number of patents in the U.S. and other countries relating to their products, product uses, formulations and manufacturing processes, which in the aggregate are believed to be of material importance to the Company in the operation of its businesses. The Company’s subsidiaries face patent challenges from third parties, including challenges seeking to manufacture and market generic and biosimilar versions of the Company's key
pharmaceutical products prior to expiration of the applicable patents covering those products. Significant legal proceedings and claims involving the Company's patent and other intellectual property are described in Note 21, “Legal Proceedings—19 Legal proceedings—Intellectual Property”property of the Notes to Consolidated Financial Statements included in Item 8 of this Report.
Sales of the Company’s largest product, REMICADE® (infliximab),STELARA (ustekinumab) accounted for approximately 8.3%12.8% of the Company's total net trade salesrevenues for fiscal 2017.
There are two sets of2023. Accordingly, the patents related specifically to REMICADE®. The first set of patents is co-owned bythis product are believed to be material to the Company. Janssen Biotech, Inc., a wholly-owned subsidiary of Johnson & Johnson, owns patents specifically related to STELARA. The latest expiring United States composition of matter patent expired in 2023. As a result of settlements and NYU Langone Medical Center (NYU).other agreements with third parties, the Company does not anticipate the launch of a biosimilar version of STELARA before January 1, 2025 in the United States. The latest expiring European composition of matter patent (Supplementary Protection Certificate) expires in 2024.
Sales of the Company’s second largest product, collectively DARZALEX (daratumumab) and DARZALEX FASPRO (daratumumab and hyaluronidase-fihj), accounted for approximately 11.4% of the Company's total revenues for fiscal 2023. Accordingly, the patents related to this product are believed to be material to the Company. Genmab A/S owns two patent families related to DARZALEX, and Janssen Biotech, Inc. has an exclusive license to NYU's interests in the patents. These patents have expired in all countries outside the United States.In the United States, the one remainingthose patent which expires in September 2018, stands rejected following
reexamination proceedings instituted by a third partyfamilies. The two patent families both expire in the United States Patentin 2029, and Trademark Office (USPTO). The patent has also been held invalid by the Federal District Court in the District of Massachusetts. In January 2018, the U.S. Court of Appeals for the Federal Circuit affirmed the invalidity of the remaining patent.
The second set of patents specifically related to REMICADE® was granted to The Kennedy Institute of Rheumatology in Europe, Canada, Australia and the United States.compound patent protection in select countries extends to 2031/2032. Janssen Biotech, Inc. has licenses (exclusive for human anti-TNF antibodies and semi-exclusive for non-human anti-TNF antibodies) to these patents, which expired in 2017 outside of the United States and will expire in August 2018 in the United States. Certain of these patents have been successfully challenged and invalidated, and others are under review in variousowns a separate patent offices around the world and are also subject to litigation in Canada.
The Company does not expect that any extensions will be available for the above described patents specificallyportfolio related to REMICADE®. In the United States, a biosimilar version of REMICADE® was introduced in 2016, and additional competitors continue to enter the market. For a more extensive description of legal matters regarding the patents related to REMICADE®, see Note 21 “Legal Proceedings – Intellectual Property – Pharmaceutical – REMICADE® Related Cases” of the Notes to Consolidated Financial Statements included in Item 8 of this Report.DARZALEX FASPRO.
In addition to competing in the immunology market with REMICADE®, the Company is currently marketing STELARA® (ustekinumab), SIMPONI® (golimumab), SIMPONI ARIA® (golimumab) and TREMFYA® (guselkumab), next generation immunology products with remaining patent lives of up to six years.
Trademarks
The Company’s subsidiaries have made a practice of selling their products under trademarks and of obtaining protection for these trademarks by all available means. These trademarks are protected by registration in the U.S. and other countries where such products are marketed. The Company considers these trademarks in the aggregate to be of material importance in the operation of its businesses.
Seasonality
Worldwide sales do not reflect any significant degree of seasonality; however, spending has typically been heavier in the fourth quarter of each year than in other quarters. This reflects increased spending decisions, principally for advertising and research and development activity.
Competition
In all of their product lines, the Company's subsidiaries compete with companies both locally and globally. Competition exists in all product lines without regard to the number and size of the competing companies involved. Competition in research, both internally and externally sourced, involving the development and the improvement of new and existing products and processes, is particularly significant. The development of new and innovative products, as well as protecting the underlying intellectual property of the Company’s product portfolio, is important to the Company's success in all areas of its business. The competitive environment requires substantial investments in continuing research. In addition, the development and maintenance of customer demand for the Company’s consumer products involve significant expenditures for advertising and promotion.
Research and Development
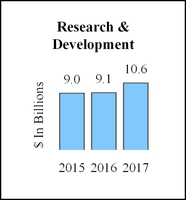
Research activities represent a significant part of the Company’s businesses. Research and development expenditures relate to the processes of discovering, testing and developing new products, upfront payments and milestones, improving existing products, as well as demonstrating product efficacy and regulatory compliance prior to launch. The Company remains committed to investing in research and development with the aim of delivering high quality and innovative products. Worldwide costs of research and development activities amounted to $10.6 billion, $9.1 billion and $9.0 billion for fiscal years 2017, 2016 and 2015, respectively. Research facilities are located in the United States, Belgium, Brazil, Canada, China, France, Germany, Israel, Japan, the Netherlands, Switzerland and the United Kingdom with additional R&D support in over 30 other countries.
Environment
The Company is subject to a variety of U.S.environmental laws and international environmental protection measures.regulations in the United States and other jurisdictions. The Company believes that its operations comply in all material respects with applicable environmental laws and regulations. The Company’s compliance with these requirements did not change during the past year, and is not expected to have a material effect upon its capital expenditures, cash flows, earnings or competitive position.
Regulation
The Company’s businesses are subject to varying degrees of governmental regulation in the countries in which operations are conducted, and the general trend is toward increasingly stringent regulation.regulation and enforcement. The Company is subject to costly and complex U.S. and foreign laws and governmental regulations and any adverse regulatory action may materially adversely affect the Company's financial condition and business operations. In the U.S., the drug, devicepharmaceutical product and cosmeticmedical technology industries have long been subject to regulation by various federal and state agencies, primarily as to product safety, efficacy, manufacturing, advertising, labeling and safety reporting. The exercise of broad regulatory powers by the U.S. Food and Drug Administration (the U.S. FDA) continues to result in increases in the amounts of testing and documentation required for U.S. FDA approval of new drugs and devices and a corresponding increase in the expense of product introduction. Similar trends are also evident in major markets outside of the U.S.
The new medical device regulatory framework and the newevolving privacy, data localization, and emerging cyber security laws and regulations in Europearound the world are examples of such increased regulation.
The costs Within the U.S., an increasing number of humanU.S. States have enacted comprehensive privacy laws and federal regulators (e.g., the U.S. FDA, FTC and HHS) continue to stress the intersection of health and privacy as a compliance and enforcement priority. In the EU, multiple directives and laws (including NIS2, EHDS, the Data Act, the Cyber Resilience Act, and the AI Act) are rapidly changing privacy and cybersecurity compliance requirements while introducing new enforcement risks. In addition, China has introduced broad personal information protection and data security regulations, with more anticipated, thereby increasing China’s scrutiny of company compliance and data transfer practices. With other jurisdictions enacting similar privacy laws, local data protection authorities will force greater accountability on the collection, access and use of personal data in the healthcare industry. These laws can also restrict transfers of data across borders, potentially impacting how data-driven health care have beensolutions are developed and continue to bedeployed globally in a subject of study, investigation and regulation by governmental agencies and legislative bodies around the world. In the U.S., attention has been focused on drug prices and profits and programs that encourage doctors to write prescriptions for particular drugs, or to recommend, use or purchase particular medical devices. Payers have becomecompliant manner. Moreover, as a more potent force in the market place and increased attention is being paid to drug and medical device pricing, appropriate drug and medical device utilization and the quality and costs of health care generally.
U.S. government agencies continue to implement the extensive requirementsresult of the Patient Protectionbroad scale release and Affordable Care Act (the ACA). These have both positiveavailability of Artificial Intelligence (AI) technologies such as generative AI, a global trend towards more comprehensive and negative impactsnuanced regulation (e.g., White House’s Executive Order on the U.S. healthcare industry with much remaining uncertain asSafe, Secure, and Trustworthy Development and Use of Artificial Intelligence; the EU AI Act) to how various provisionsensure the ethical use, privacy, and security of the ACA,AI is underway that includes standards for transparency, accountability, and potential modificationfairness, which will require compliance developments or repeal of ACA provisions, will ultimately affect the industry.enhancements.
The regulatory agencies under whose purview the Company operates have administrative powers that may subject it to actions such as product withdrawals, recalls, seizure of products and other civil and criminal sanctions. In some cases, the Company’s subsidiaries may deem it advisable to initiate product recalls.recalls regardless of whether it has been required or directed to.
The U.S. FDA and regulatory agencies around the globe are also increasing their enforcement activities. If the U.S. FDA were to conclude that we are not in compliance with applicable laws or regulations, or that any of our pharmaceutical products or medical technologies are ineffective or pose an unreasonable health risk, the U.S. FDA could ban such products, detain or seize adulterated or misbranded products, order a recall, repair, replacement, or refund of such products, refuse to grant pending applications for marketing authorization or require certificates of foreign governments for exports, and/or require us to notify health professionals and others that the products present unreasonable risks of substantial harm to the public health. The U.S. FDA may also assess civil or criminal penalties against us, our officers or employees and impose operating restrictions on a company-wide basis, or enjoin and/or restrain certain conduct resulting in violations of applicable law. The U.S. FDA may also recommend prosecution to the U.S. Department of Justice. Any adverse regulatory action, depending on its magnitude, may restrict us from effectively marketing and selling our products and limit our ability to obtain future clearances or approvals, and could result in a substantial modification to our business practices and operations. Equivalent enforcement mechanisms exist in different countries in which we conduct business.
The costs of human healthcare have been and continue to be a subject of study, investigation and regulation by governmental agencies and legislative bodies around the world. In the U.S., attention has been focused by states, regulatory agencies and Congress on prices, profits, overutilization and the quality and costs of healthcare generally. Laws and regulations have been enacted to require adherence to strict compliance standards and prevent fraud and abuse in the healthcare industry. There is increased focus on interactions and financial relationships between healthcare companies and healthcare providers. Various state and federal transparency laws and regulations require disclosures of payments and other transfers of value made to certain healthcare practitioners, including physicians, teaching hospitals, and certain non-physician practitioners. Federal and foreign laws governing international business practices require strict compliance with anti-bribery standards and certain prohibitions with respect to payments to any foreign government official. Payors and Pharmacy Benefit Managers (PBMs) are a potent force in the marketplace, and increased attention is being paid to the impact of PBM practices on healthcare cost and access in the U.S.
Our business has been and continues to be affected by federal and state legislation that alters the pricing, coverage, and reimbursement landscape. At the federal level, in August 2022, President Biden signed into law the Inflation Reduction Act
(IRA), which includes provisions that effectively authorize the government to establish prices for certain high-spend single-source drugs and biologics reimbursed by the Medicare program, starting in 2026 for Medicare Part D drugs and 2028 for Medicare Part B drugs. On August 29, 2023, the Centers for Medicare & Medicaid Services (“CMS”) published the first “Selected Drug” list, which includes XARELTO and STELARA as well as IMBRUVICA, which is developed in collaboration and co-commercialized in the U.S. with Pharmacyclics LLC, an AbbVie company. The Selected Drug list also included other medicines targeting disease states that are prevalent in the Medicare population. There remains uncertainty, however, regarding how the federal government will establish prices for the selected products, as the IRA specifies a ceiling price but not a minimum price. In any event, we anticipate that the selected products will be subjected to a government-established price for the Medicare population.
The IRA also contains provisions that impose rebates if certain prices increase at a rate that outpaces the rate of inflation, beginning October 1, 2022, for Medicare Part D drugs and January 1, 2023, for Medicare Part B drugs. Separate IRA provisions redesign the Medicare Part D benefit in various ways, including by shifting a greater portion of costs to manufacturers within certain coverage phases and replacing the Part D coverage gap discount program with a new manufacturer discounting program. Failure to comply with IRA provisions may subject manufacturers to various penalties, including civil monetary penalties.
In July 2023, Janssen Pharmaceuticals, Inc. (Janssen) filed litigation against the U.S. Department of Health and Human Services as well as the Centers for Medicare and Medicaid Services challenging the constitutionality of the Inflation Reduction Act’s (IRA) Medicare Drug Price Negotiation Program. The litigation requests a declaration that the IRA violates Janssen’s rights under the First Amendment and the Fifth Amendment to the Constitution and therefore that Janssen is not subject to the IRA’s mandatory pricing scheme. The impact of the IRA on our business and the broader pharmaceutical industry remains uncertain, as litigation filed by Janssen and other pharmaceutical companies remains ongoing and CMS has yet to publicly announce the maximum fair price for each of the selected drugs.
Additionally, we expect continued scrutiny on drug pricing and government price reporting from Congress, agencies, and other bodies at the federal and state levels, which may result in additional regulations or other mechanisms to increase pricing transparency and controls.
There are a number of additional bills pending in Congress and healthcare reform proposals at the state level that would affect drug pricing, including in the Medicare and Medicaid programs. This changing legal landscape has both positive and negative impacts on the U.S. healthcare industry with much remaining uncertain as to how various provisions of federal and state law, and potential modification or repeal of these laws, will ultimately affect the industry. The IRA and any other federal or state legislative change could affect the pricing and market conditions for our products.
In addition, business practices in the health carehealthcare industry have come under increased scrutiny, particularly in the United States,U.S., by government agencies and state attorneys general, and resulting investigations and prosecutions carry the risk of significant civil and criminal penalties. Of note is the increased enforcement activity by data protection authorities in various jurisdictions, particularly in the European Union, where significant fines have been levied on companies for data breaches, violations of privacy requirements, and unlawful cross-border data transfers. In the U.S., the Federal Trade Commission has stepped up enforcement of data privacy with several significant settlements (including settlements concerning the downstream sharing of personal information and use and disclosure of personal health data) and there have been a material increase in class-action lawsuits linked to the collection and use of biometric data and use of tracking technologies.
Further, the Company relies on global supply chains, and production and distribution processes, that are complex, areand subject to increasing regulatory requirements and may be faced with unexpected changes such as those resulting from Brexit, that may affect sourcing, supply and pricing of materials used in the Company's products. These processes also are subject to complex and lengthy regulatory approvals.
Employees and human capital management
As of December 31, 2023, the number of employees was approximately:
| | | | | |
| 2023 |
Employees1 | 134,400 | |
Full-time equivalent (FTE) positions2 | 131,900 | |
1“Employee” is defined as an individual working full-time or part-time, excluding fixed term employees, interns and co-op employees. Employee data may not include full population from more recently acquired companies and individuals on long-term disability are excluded. Contingent workers, contractors and subcontractors are also excluded.
2FTE represents the total number of full-time equivalent positions and does not reflect the total number of individual employees as some work part-time.
Employees by region (in percentages)
Strategy
The Company believes that its employees are critical to its continued success and are an essential element of its long-term strategy. Management is responsible for ensuring that its policies and processes reflect and reinforce the Company's desired corporate culture, including policies and processes related to strategy, risk management, and ethics and compliance. The Company’s human capital management strategy is built on three fundamental focus areas:
•Attracting and recruiting the best talent
•Developing and retaining talent
•Empowering and inspiring talent
Underpinning these focus areas are ongoing efforts to cultivate and foster a culture built on diversity, equity and inclusion (DEI), innovation, health, well-being and safety, where the Company's employees are encouraged to succeed both professionally and personally while helping the Company achieve its business goals.
Culture and employee engagement
At the Company, employees are guided by Our Credo which sets forth the Company's responsibilities to patients, consumers, customers, healthcare professionals, employees, communities and shareholders. Employees worldwide must adhere to the Company’s Code of Business Conduct which sets basic requirements and serves as a foundation for the Company policies, procedures and guidelines, all of which provide additional guidance on expected employee behaviors in every market where it operates. The Company conducts global surveys that offer its employees the ability to provide feedback and valuable insight to help address potential human resources risks and identify opportunities to improve. In 2023, 94% of global employees across 76 countries participated in Our Credo Survey which was offered in 36 languages.
Growth and development
To lead in the changing healthcare landscape, it is crucial that the Company continue to attract and retain top talent. In 2023, the Company's voluntary turnover rate was 7%. The Company believes that its employees must be equipped with the right knowledge and skills and be provided with opportunities to grow and develop in their careers. Accordingly, professional development programs and educational resources are available to all employees. The Company's objective is to foster a learning culture that helps shape each person’s unique career path while creating a robust pipeline of talent to deliver on the Company’s long-term strategies. In furtherance of this objective, the Company deploys a global approach to ensure development is for everyone, regardless of where they are on their career journey. To prioritize learning, the Company recently held Johnson & Johnson's first Global Learning Day. Employees were encouraged to set aside a full day to explore skill-building courses across five areas: leadership, business skills, digital upskilling, DEI, and well-being, on J&J Learn, the Company's new learning platform.
Diversity, equity, and inclusion (DEI)
The Company is committed to workplace diversity and to cultivating, fostering, and advancing a culture of equity and inclusion. The Company’s evidenced-based global enterprise Diversity, Equity and Inclusion strategy recognizes how DEI accelerates the Company's ability to meet the changing needs of the communities the Company serves in, as outlined in Our Credo. The Company’s DEI Vision is: Be yourself, change the world. The Company's DEI Mission is: Make diversity, equity and inclusion how we work everyday. The Company's enterprise DEI Strategy is aligned to the DEI Vision and Mission and rests on four core pillars:
•Build a workforce of individuals with diverse backgrounds, cultures, abilities and perspectives
•Foster a culture of inclusion where every individual belongs
•Transform talent and business processes to achieve equitable opportunities for all
•Drive innovation and growth with our business to serve diverse markets around the world
The Company's DEI strategy is guided by internal and external insights, global best practices and continual employee feedback and recognizes that while diversity changes by location, inclusion is the same everywhere.
Compensation and benefits
As part of the Company's total rewards philosophy, the Company offers competitive compensation and benefits to attract and retain top talent. The Company is committed to fairness and equitable treatment in its compensation and benefits for employees at all levels. The Company observes legal minimum wage provisions and exceeds them where possible. The Company's total rewards offerings include an array of programs to support its employees' well-being, including annual performance incentive opportunities, pension and retirement savings programs, health and welfare benefits, paid time off, leave programs, flexible work schedules and employee assistance programs. In recognition of the Company’s commitment to help employees balance their personal and professional responsibilities, the Company enhanced its caregiver, bereavement, and volunteer paid leave benefits, effective July 2023.
Health, wellness and safety
The Company’s investment in employee health, well-being and safety is built on its conviction that advancing health for humanity starts with advancing the health of its employees. With the right awareness, focus, practices and tools, the Company ensures that all its employees around the world, as well as temporary contractors and visitors to the Company's sites, can work safely. The Company has continuously expanded health and well-being programs throughout the Company and across the globe, incorporating new thinking and technologies to keep its offerings best-in-class and to help employees achieve their personal health goals. The programs and practices the Company advances for total health—physical, mental, emotional and financial—ensure employee health protection for emerging health risks. The Company continues to address our employees needs through J&J Flex, a hybrid model that empowers the Company’s office-based employees to find the right productivity and balance of in-person and remote work.
Available Informationinformation
The Company’s main corporate website address is www.jnj.com. Copies of the Company’s Quarterly Reports on Form 10-Q, Annual Report on Form 10-K and Current Reports on Form 8-K filed or furnished to the U.S. Securities and Exchange Commission (the SEC), and any amendments to the foregoing, will be provided without charge to any shareholder submitting a written request to the Secretary at the principal executive offices of thewww.jnj.com. The Company or by calling 1-800-950-5089. All of the Company’smakes its SEC filings are also available on the Company’s website at www.investor.jnj.com/sec.cfmfinancials/sec-filings, as soon as reasonably practicable after having been electronically filed or furnished to the SEC. AllThe Company's SEC filings are also available at the SEC’s website at www.sec.gov.
Investors and the public should note that the Company also announces information at www.factsaboutourprescriptionopioids.com,www.factsabouttalc.com and www.LLTManagementInformation.com. We use these websites to communicate with investors and the public about our products, litigation and other matters. It is possible that the information we post to these websites could be deemed to be material information. Therefore, we encourage investors and others interested in the Company to review the information posted to these websites in conjunction with www.jnj.com, the Company's SEC filings, press releases, public conference calls and webcasts.
In addition, the Amended and Restated Certificate of Incorporation, By-Laws, the written charters of the Audit Committee, the Compensation & Benefits Committee, the Nominating & Corporate Governance Committee, the Regulatory Compliance & Government AffairsSustainability Committee, the Science & Technology Committee and the Science, Technology & Sustainability Committeeany special committee of the Board of Directors and the Company’s Principles of Corporate Governance, Code of Business Conduct (for employees), Code of Business Conduct & Ethics for Members of the Board of Directors and Executive Officers, and other corporate governance materials, are available at www.investor.jnj.com/gov.cfm governance/corporate-governance-overviewon the Company's website and will be provided without charge to any shareholder submitting a written request, as provided above. The information on the Company’s website www.jnj.com, www.factsaboutourprescriptionopioids.com,www.factsabouttalc.comand www.LLTManagementInformation.comis not, and will not be deemed, a part of this Report or incorporated into any other filings the Company makes with the SEC.
Item 1A. Risk factors
An investment in the Company’s common stock or debt securities involves risks and uncertainties. The Company faces a number ofseeks to identify, manage and mitigate risks to our business, but uncertainties and risks that are difficult to predict and many of which are outside of the Company's control.Company’s control and cannot therefore be eliminated. In addition to the other information in this report and the Company’s other filings with the SEC, investors should consider carefully the factors set forth below. Investors should be aware that it is not possible to predict or identify all such factors and that the following is not meant to be a complete discussion of all potential risks or uncertainties. If known or unknown risks or uncertainties materialize, the Company’s business, results of operations or financial condition could be adversely affected, potentially in a material way.
The Company’s largest product, REMICADE® (infliximab), is experiencing biosimilar competition, which will result in a reduction in U.S. sales of REMICADE®.
The Company has experienced significant challenges to patents covering its largest product, REMICADE® (infliximab) (accounting for approximately 8.3% of the Company’s total net trade sales for fiscal 2017), and continues to assert certain patentsRisks related to the product. In the United States, a biosimilar version of REMICADE® was introduced in 2016,our business, industry and additional competitors continue to enter the market. Sales of infliximab biosimilars in the U.S. market will result in a continued reduction in U.S. sales of REMICADE®.
Global sales in the Company’s pharmaceutical and medical devices segments may be negatively impacted by healthcare reforms and increasing pricing pressures.
Sales of the Company’s pharmaceutical and medical device products are significantly affected by reimbursements by third-party payers such as government healthcare programs, private insurance plans and managed care organizations. As part of various efforts to contain healthcare costs, these payers are putting downward pressure on prices at which products will be reimbursed. In the United States, increased purchasing power of entities that negotiate on behalf of Medicare, Medicaid, and private sector beneficiaries, in part due to continued consolidation among health care providers, could result in further pricing pressures. In addition, increased political scrutiny could result in additional pricing pressures. Outside the United States, numerous major markets, including the EU and Japan, have pervasive government involvement in funding healthcare and, in that regard, directly or indirectly impose price controls, limit access to, or reimbursement for, the Company’s products, or reduce the value of its intellectual property protection.
The Company is subject to significant legal proceedings that can result in significant expenses, fines and reputational damage.
In the ordinary course of business, Johnson & Johnson and its subsidiaries are subject to numerous claims and lawsuits involving various issues such as patent disputes, product liability and claims that their product sales, marketing and pricing practices violate various antitrust, unfair trade practices and/or consumer protection laws. The most significant of these proceedings are described in Note 21, “Legal Proceedings” under Notes to the Consolidated Financial Statements included in Item 8 of this Report. While the Company believes it has substantial defenses in these matters, it is not feasible to predict the ultimate outcome of litigation. The Company could in the future be required to pay significant amounts as a result of settlements or judgments in these matters, potentially in excess of accruals. The resolution of, or increase in accruals for, one or more of these matters in any reporting period could have a material adverse effect on the Company's results of operations and cash flows for that period. Furthermore, as a result of cost and availability factors, effective November 1, 2005, the Company ceased purchasing third-party product liability insurance.
Product reliability, safety and effectiveness concerns can have significant negative impacts on sales and results of operations, lead to litigation and cause reputational damage.
Concerns about product safety, whether raised internally or by litigants, regulators or consumer advocates, and whether or not based on scientific evidence, can result in safety alerts, product recalls, governmental investigations, regulatory action on the part of the FDA (or its counterpart in other countries), private claims and lawsuits, payment of fines and settlements, declining sales and reputational damage. These circumstances can also result in damage to brand image, brand equity and consumer trust in the Company’s products. Product recalls have in the past, and could in the future, prompt government investigations and inspections, the shutdown of manufacturing facilities, continued product shortages and related sales declines, significant remediation costs, reputational damage, possible civil penalties and criminal prosecution.
Changes in tax laws or exposures to additional tax liabilities could negatively impact the Company’s operating results.
Changes in tax laws or regulations could negatively impact the Company’s effective tax rate and results of operations. On December 22, 2017, the U.S. enacted The Tax Cuts and Jobs Act (the TCJA), which resulted in the revaluation of the Company’s U.S. related deferred tax assets and liabilities and had an impact on the Company’s Consolidated Statement of Earnings. The TCJA introduces significant changes to U.S. corporate income tax law that will have a meaningful impact on the
Company’s provision for income taxes. Accounting for the income tax effects of the TCJA requires significant judgments to be made in interpreting its provisions. Due to the timing of the enactment and the complexity involved in applying the provisions of the TCJA, the Company made reasonable estimates of the effects and recorded provisional amounts in the financial statements for fiscal year 2017. These provisional amounts are based on the Company’s initial analysis of the TCJA as of January 18, 2018. Anticipated guidance from the U.S. Treasury about implementing the TCJA, and the potential for additional guidance from the Securities and Exchange Commission or the Financial Accounting Standards Board related to the TCJA, may result in adjustments to these estimates which could materially affect the Company’s financial position and results of operations as well as the effective tax rate in the period in which the adjustments are made.
The government in Switzerland is currently considering tax reform legislation, which could have a material impact on the Company’s effective tax rate if enacted into law.
The Company conducts business and files tax returns in numerous countries and is addressing tax audits and disputes with many tax authorities. In connection with the Organization for Economic Cooperation and Development Base Erosion and Profit Shifting (BEPS) project, companies are required to disclose more information to tax authorities on operations around the world, which may lead to greater audit scrutiny of profits earned in other countries. The Company regularly assesses the likely outcomes of its tax audits and disputes to determine the appropriateness of its tax reserves. However, any tax authority could take a position on tax treatment that is contrary to the Company’s expectations, which could result in tax liabilities in excess of reserves.
The Company may not be able to successfully secure and defend intellectual property rights essential to the Company’s businesses.
The Company owns or licenses a significant number of patents and other proprietary rights, determined by patent offices, courts and lawmakers in various countries, relating to its products and manufacturing processes. These rights are essential to the Company’s businesses and materially important to the Company’s results of operations. Public policy, both within and outside the U.S., has become increasingly unfavorable toward intellectual property rights. The Company cannot be certain that it will obtain adequate patent protection for new products and technologies in the U.S. and other important markets or that such protections, once granted, will last as long as originally anticipated.
Competitors routinely challenge the validity or extent of the Company’s owned or licensed patents and proprietary rights through litigation, interferences, oppositions and other proceedings. These proceedings absorb resources and can be protracted as well as unpredictable. In addition, challenges that the Company’s products infringe the patents of third parties could result in the need to pay past damages and future royalties and adversely affect the competitive position and sales of the products in question.
The Company has faced increasing patent challenges from third parties seeking to manufacture and market generic and biosimilar versions of the Company's key pharmaceutical products prior to expiration of the applicable patents covering those products. In the United States, manufacturers of generic versions of innovative human pharmaceutical products may challenge the validity, or claim non-infringement, of innovator products through the Abbreviated New Drug Application, or ANDA, process with the FDA. The Biologics Price Competition and Innovation Act (BPCIA), enacted in 2010, which created a new regulatory pathway for the approval by the FDA of biosimilar alternatives to innovator-developed biological products, also created mechanisms for biosimilar applicants to challenge the patents on the innovator biologics. The inter partes review (IPR) process with the USPTO, created under the 2011 America Invents Act, is also being used by competitors to challenge patents held by the Company’s subsidiaries. For example, the key patent for ZYTIGA® is currently subject to patent litigation, and the USPTO has issued a decision invalidating that patent in a related IPR action.
In the event the Company is not successful in defending its patents against such challenges, or upon the “at-risk” launch (despite pending patent infringement litigation) by the generic or biosimilar firm of its product, the Company can lose a major portion of revenues for the referenced product in a very short period of time. Current legal proceedings involving the Company’s patents and other intellectual property rights are described in Note 21, “Legal Proceedings—Intellectual Property” of the Notes to the Consolidated Financial Statements included in Item 8 of this Report.
The Company’s businesses operate in highly competitive product markets and competitive pressures could adversely affect the Company’s earnings.
The Company faces substantial competition in all threeits two operating segments and in all geographic markets. The Company’s businesses compete with companies of all sizes on the basis of cost-effectiveness, technological innovations, intellectual property rights, product performance, real or perceived product advantages, pricing and availability and rate of reimbursement. The Company also competes with other market participants in securing rights to acquisitions, collaborations and licensing
agreements with third parties. Competition for rights to product candidates and technologies may result in significant investment and acquisition costs and onerous agreement terms for the Company. Competitors’ development of more effective or less costly products, and/or their ability to secure patent and other intellectual property rights and successfully market products ahead of the Company, could negatively impact sales of the Company’s existing products as well as its ability to bring new products to market despite significant prior investment in the related product development. The Company may also experience operational and financial risk in connection with acquisitions if we are unable to fully identify potential risks and liabilities associated with acquired businesses or products, successfully integrate operations and employees, and successfully identify and realize synergies with existing businesses while containing acquisition-related strain on our management, operations and financial resources.
For the Company’s pharmaceuticalInnovative Medicine businesses, loss of patent exclusivity for a product often is followed by a substantial reduction in sales as competitors gain regulatory approval for generic and other competing products and enter the market. Similar competition can be triggered by the loss of exclusivity for a biological product. For the Company’s medical deviceMedTech businesses, technological innovation, product quality, reputation and customer service are especially important to competitiveness. Development by other companies of new or improved products, processes and technologies could threaten to make the Company’s products or technologies less desirable, less economical or obsolete. The Company’s consumer businessesbusiness and operations will be negatively impacted if we are unable to introduce new products or technological advances that are safe, more effective, more effectively marketed or otherwise outperform those of our competitors.
Interruptions and delays in manufacturing operations could adversely affect the Company’s business, sales and reputation.
The Company’s manufacturing of products requires the timely delivery of sufficient amounts of complex, high-quality components and materials. The Company’s subsidiaries operate 61 manufacturing facilities as well as sourcing from thousands of suppliers around the world. The Company has in the past, and may in the future, face intense competitionunanticipated interruptions and delays in manufacturing through its internal or external supply chain. Manufacturing disruptions can occur for many reasons including regulatory action, production quality deviations or safety issues, labor disputes, labor shortages, site-specific incidents (such as fires), natural disasters such as hurricanes and other severe weather events, raw material shortages, political unrest, terrorist attacks and epidemics or pandemics. Such delays and difficulties in manufacturing can result in product shortages, declines in sales and reputational impact as well as significant remediation and related costs associated with addressing the shortage.
The Company relies on third parties to manufacture and supply certain of our products. Any failure by or loss of a third-party manufacturer or supplier could result in delays and increased costs, which may adversely affect our business.
The Company relies on third parties to manufacture and supply certain of our raw materials, component parts and products. We depend on these third-party manufacturers to allocate to us a portion of their manufacturing capacity sufficient to meet our needs, to produce products of acceptable quality and at acceptable manufacturing yields and to deliver those products to us on a timely basis and at acceptable prices. However, we cannot guarantee that these third-party manufacturers will be able to meet our near-term or long-term manufacturing requirements, which could result in lost sales and have an adverse effect on our business.
Other risks associated with our reliance on third parties to manufacture these products include reliance on the third party for regulatory compliance and quality assurance, misappropriation of the Company’s intellectual property, limited ability to manage our inventory, possible breach of the manufacturing agreement by the third party and the possible termination or nonrenewal of the manufacturing agreement by the third party at a time that is costly or inconvenient for us. Moreover, if any of our third-party manufacturers suffers any damage to facilities, loses benefits under material agreements, experiences power outages, encounters financial difficulties, is unable to secure necessary raw materials from its suppliers or suffers any other brandedreduction in efficiency, the Company may experience significant business disruption. In the event of any such disruption, the Company would need to seek and source other qualified third-party manufacturers, likely resulting in further delays and increased costs which could affect our business adversely.
Counterfeit versions of our products could harm our patients and retailers’ private-label brands.have a negative impact on our revenues, earnings, reputation and business.
Our industry continues to be challenged by the vulnerability of distribution channels to illegal counterfeiting and the presence of counterfeit products in a growing number of markets and over the Internet. Third parties may illegally distribute and sell counterfeit versions of our products, which do not meet our rigorous manufacturing and testing standards. To distributors and patients, counterfeit products may be visually indistinguishable from the authentic version. Counterfeit medicines pose a risk to patient health and safety because of the conditions under which they are manufactured – often in unregulated, unlicensed, uninspected and unsanitary sites – as well as the lack of regulation of their contents.
The industry’s failure to mitigate the threat of counterfeit medicines could adversely impact our business and reputation by impacting patient confidence in our authentic products, potentially resulting in lost sales, product recalls, and an increased threat of litigation. In addition, diversion of our products from their authorized market into other channels may result in reduced revenues and negatively affect our profitability.
Global health crises, pandemics, epidemics, or other outbreaks could adversely disrupt or impact certain aspects of the Company’s business, results of operations and financial condition.
We are subject to risks associated with global health crises, epidemics, pandemics and other outbreaks (such incident(s), a health crisis or health crises). For example, the COVID-19 pandemic adversely impacted certain aspects of the Company’s business, results of operations and financial condition, including lower sales and reduced customer demand and usage of certain of our products. The spread of any health crises may cause the Company to modify its business practices, and take further actions as may be required by government authorities or as the Company determines are in the best interests of our patients, customers, employees and business partners under such circumstances. While the Company has robust business continuity plans in place across our global supply chain network designed to help mitigate the impact of health crises, these efforts may not completely prevent our business from being adversely affected in the event of a health crisis. Health crises could adversely impact the Company’s operations, including, among other things, our manufacturing operations, supply chain, third-party suppliers, sales and marketing, and clinical trial operations. Any of these factors could adversely affect the Company’s business, financial results, and global economic conditions generally.
Risks related to government regulation and legal proceedings
Global sales in the Company’s Innovative Medicine and MedTech segments may be negatively impacted by healthcare reforms and increasing pricing pressures.
Sales of the Company’s Innovative Medicine and MedTech products are significantly affected by reimbursements by third-party payors such as government healthcare programs, private insurance plans and managed care organizations. As part of various efforts to contain healthcare costs, these payors are putting downward pressure on prices at which products will be reimbursed. In the U.S., increased purchasing power of entities that negotiate on behalf of Medicare, Medicaid, and private sector beneficiaries, in part due to continued consolidation among healthcare providers, could result in further pricing pressures. In addition, recent legislation and ongoing political scrutiny on pricing, coverage and reimbursement could result in additional pricing pressures. Specifically, the Inflation Reduction Act of 2022 (IRA) may subject certain products to government-established pricing, potentially impose rebates, and subject manufacturers who fail to adhere to the government's interpretations of the law to penalties. Further, increased third-party utilization of the 340B Federal Drug Discount Program from expanded interpretations of the statute may have a negative impact on the Company's financial performance. Outside the U.S., numerous major markets, including the EU, United Kingdom, Japan and China, have pervasive government involvement in funding healthcare and, in that regard, directly or indirectly impose price controls, limit access to, or reimbursement for, the Company’s products, or reduce the value of its intellectual property protection.
We are subject to an increasing number of costly and complex governmental regulations in the countries in which operations are conducted which may materially adversely affect the Company’s financial condition and business operations.
As described in Item 1. Business, the Company is subject to an increasing number of extensive government laws and regulations, investigations and legal action by national, state and local government agencies in the U.S. and other countries in which it operates. For example, changes to the U.S. FDA’s timing or requirements for approval or clearance of our products may have a negative impact on our ability to bring new products to market. New laws and regulations may also impose deadlines on the Company, or its third-party suppliers, manufacturers or other partners and providers, for which there may be insufficient time to implement changes to comply with such new regulations and may result in manufacturing delays or other supply chain constraints. If the Company failsis unable to sufficiently differentiateidentify ways to mitigate these delays or constraints, there may be an adverse effect on sales and access to our products.
The Company is subject to significant legal proceedings that can result in significant expenses, fines and reputational damage.
In the ordinary course of business, Johnson & Johnson and its subsidiaries are subject to numerous claims and lawsuits involving various issues such as product liability, patent disputes and claims that their product sales, marketing and pricing practices violate various antitrust, unfair trade practices and/or consumer protection laws. The Company’s more significant legal proceedings are described in Note 19 Legal proceedings under Notes to the Consolidated Financial Statements included in Item 8 of this Report. Litigation, in general, and securities, derivative action, class action and multi-district litigation, in particular, can be expensive and disruptive. Some of these matters may include thousands of plaintiffs, may involve parties seeking large and/or indeterminate amounts, including punitive or exemplary damages, and may remain unresolved for several years. For example, the Company is a defendant in numerous lawsuits arising out of the use of body powders containing talc, primarily JOHNSON’S Baby Powder, and the Company’s sale, manufacturing and marketing of opioids. While the Company believes it has substantial defenses in these matters, it is not feasible to predict the ultimate outcome of litigation. The Company could in the future be required to pay significant amounts as a result of settlements or judgments in these matters, potentially in excess of accruals, including matters where the Company could be held jointly and severally liable among other defendants. The resolution of, or increase in accruals for, one or more of these matters in any reporting period could have a material adverse effect on the Company’s results of operations and cash flows for that period. The Company does not purchase third-party product liability insurance; however, the Company utilizes a wholly owned captive insurance company subject to certain limits.
Product reliability, safety and effectiveness concerns can have significant negative impacts on sales and results of operations, lead to litigation and cause reputational damage.
Concerns about product safety, whether raised internally or by litigants, regulators or consumer advocates, and whether or not based on scientific evidence, can result in safety alerts, product recalls, governmental investigations, regulatory action on the part of the U.S. FDA (or its counterpart in other countries), private claims and lawsuits, payment of fines and settlements, declining sales and reputational damage. These circumstances can also result in damage to brand image, brand equity and consumer trust in the Company’s products. Product recalls have in the past, and could in the future, prompt government investigations and inspections, the shutdown of manufacturing facilities, continued product shortages and related sales declines, significant remediation costs, reputational damage, possible civil penalties and criminal prosecution.
The Company faces significant regulatory scrutiny, which imposes significant compliance costs and exposes the Company to government investigations, legal actions and penalties.
The rapid increase in new government laws and regulations imposes significant compliance costs to the Company and a failure of the Company to timely implement changes to comply with these new laws may expose the Company to investigations, legal actions or penalties. Regulatory issues regarding compliance with current Good Manufacturing Practices (cGMP) (and comparable quality regulations in foreign countries) by manufacturers of drugs and devices can lead to fines and penalties, product recalls, product shortages, interruptions in production, delays in new product approvals and litigation. In addition, the marketing, pricing and sale of the Company’s products are subject to regulation, investigations and legal actions including under the Federal Food, Drug, and Cosmetic Act, the Medicaid Rebate Program, federal and state false claims acts, state unfair trade practices acts and consumer protection laws. Scrutiny of healthcare industry business practices by government agencies and state attorneys general in the U.S., and any resulting investigations and prosecutions, carry risk of significant civil and criminal penalties including, but not limited to, debarment from participation in government healthcare programs. Any such debarment could have a material adverse effect on the Company’s business and results of operations. The most significant current investigations and litigation brought by government agencies are described in Note 19 Legal proceedings—Government proceedings under Notes to the Consolidated Financial Statements included in Item 8 of this Report.
Changes in tax laws or exposures to additional tax liabilities could negatively impact the Company’s operating results.
Changes in tax laws or regulations around the world, including in the U.S. and as led by the Organization for Economic Cooperation and Development, such as the recent enactment by certain EU and non-EU countries, and the anticipated enactment by additional countries, of a global minimum tax, could negatively impact the Company’s effective tax rate and results of operations. A change in statutory tax rate or certain international tax provisions in any country would result in the revaluation of the Company’s deferred tax assets and liabilities related to that particular jurisdiction in the period in which the new tax law is enacted. This change would result in an expense or benefit recorded to the Company’s Consolidated Statement of Earnings. The Company closely monitors these proposals as they arise in the countries where it operates. Changes to tax laws or regulations may occur at any time, and any related expense or benefit recorded may be material to the fiscal quarter and year in which the law change is enacted.
See Note 8 Income taxes under Notes to the Consolidated Financial Statements included in Item 8 of this Report for additional information.
The Company conducts business and files tax returns in numerous countries and is addressing tax audits and disputes with many tax authorities. In connection with various government initiatives, companies are required to disclose more information to tax authorities on operations around the world, which may lead to greater audit scrutiny of profits earned in other countries. The Company regularly assesses the likely outcomes of its tax audits and disputes to determine the appropriateness of its tax reserves. However, any tax authority could take a position on tax treatment that is contrary to the Company’s expectations, which could result in tax liabilities in excess of reserves.
Risks related to our intellectual property
The Company faces increased challenges to intellectual property rights central to its business.
The Company owns or licenses a significant number of patents and other proprietary rights relating to its products and manufacturing processes. These rights are essential to the Company’s businesses and materially important to the Company’s results of operations. Public policy, both within and outside the U.S., has become increasingly unfavorable toward intellectual property rights. The Company cannot be certain that it will obtain adequate patent protection for new products and technologies in the United States and other important markets or that such protections, once granted, will last as long as originally anticipated.
Competitors routinely challenge the validity or extent of the Company’s owned or licensed patents and proprietary rights through litigation, interferences, oppositions and other proceedings, such as inter partes review (IPR) proceedings before the United States Patent & Trademark Office (USPTO). These proceedings absorb resources and can be protracted as well as unpredictable. In addition, challenges that the Company’s products infringe the patents of third parties could result in an injunction and/or the need to pay past damages and future royalties and adversely affect the competitive position and sales of the products in question.
The Company has faced increasing patent challenges from third parties seeking to manufacture and market its brand name consumergeneric and biosimilar versions of the Company’s key pharmaceutical products this could adversely affect revenues and profitabilityprior to expiration of the applicable patents covering those products. In the U.S., manufacturers of generic versions of innovative human pharmaceutical products may challenge the validity, or claim non-infringement, of innovator products through the Abbreviated New Drug Application, or ANDA, process with the U.S. FDA and related ANDA litigation. The Biologics Price Competition and Innovation Act (BPCIA), enacted in 2010, which created a new regulatory pathway for the approval by the U.S. FDA of biosimilar alternatives to innovator-developed biological products, also created mechanisms for biosimilar applicants to challenge the patents on the innovator biologics. The IPR process with the USPTO is also being used by competitors to challenge patents asserted in litigation.
In the event the Company is not successful in defending its patents against such challenges, or upon the “at-risk” launch by the generic or biosimilar firm of its product, the Company can lose a major portion of revenues for the referenced product in a very short period of time. Current legal proceedings involving the Company’s patents and other intellectual property rights are described in Note 19 Legal proceedings—Intellectual property under Notes to the Consolidated Financial Statements included in Item 8 of this Report.
Risks related to product development, regulatory approval and commercialization
Significant challenges or delays in the Company’s innovation, development and developmentimplementation of new products, technologies and indications could have an adverse impact on the Company’s long-term success.
The Company’s continued growth and success depends on its ability to innovate and develop new and differentiated products and services that address the evolving health carehealthcare needs of patients, providers and consumers. Development of successful products and technologies is also necessary to offset revenue losses when the Company’s existing products lose market share due to various factors such as competition and loss of patent exclusivity. New products introduced within the past five years accounted for approximately 22%25% of 20172023 sales. The Company cannot be certain when or whether it will be able to develop, license or otherwise acquire companies, products and technologies, whether particular product candidates will be granted regulatory approval, and, if approved, whether the products will be commercially successful.
The Company pursues product development through internal research and development as well as through collaborations, acquisitions, joint ventures and licensing or other arrangements with third parties. In all of these contexts, developing new products, particularly pharmaceutical and biotechnology products and medical devices, requires significant investment of resources over many years. Only a very few biopharmaceutical research and development programs result in commercially viable products. The process depends on many factors including the ability toto: discern patients’ and health carehealthcare providers’ future needs; develop promising new compounds, strategies and technologies; achieve successful clinical trial results; secure effective intellectual property protection; obtain regulatory approvals on a timely basis; and, if and when they reach the market, successfully differentiate the Company’s products from competing products and approaches to treatment. New products or enhancements to existing products may not be accepted quickly or significantly in the marketplace due to product and price competition, changes in customer preferences or healthcare purchasing patterns, resistance by healthcare providers or uncertainty over third-party reimbursement. Even following initial regulatory approval, the success of a product can be adversely impacted by safety and efficacy findings in larger real worldreal-world patient populations, as well as market entry of competitive products.
The Company faces increasing regulatory scrutiny which imposes significant compliance costsleverages the use of data science, machine learning and exposesother forms of AI and emerging technologies across varying parts of its business and operations, and the Company to government investigations, legal actionsintroduction and penalties.
Likeincorporation of AI may result in unintended consequences or other companiesnew or expanded risks and liabilities. AI technology is continuously evolving, and the AI technologies we develop and adopt may become obsolete earlier than planned. Our investments in these technologies may not result in the healthcare industry,benefits we anticipate or enable us to obtain or maintain a competitive advantage. The application of machine learning and AI in our business is emerging and evolving alongside new laws and regulations that may entail significant costs or ultimately limit our ability to continue the Company is subjectuse of these technologies. These technologies also carry inherent risks related to extensive regulation, investigationsdata privacy and legal action, by national, statesecurity further described below.
Risks related to financial and local government agencies in the United States and other countries in which they operate. Regulatory issues regarding compliance with Good Manufacturing Practices (cGMP) (and comparable quality regulations in foreign countries) by manufacturers of drugs, devices and consumer products can lead to fines and penalties, product recalls, product shortages, interruptions in production, delays in new product approvals and litigation. In addition, the marketing, pricing and sale of the Company’s products are subject to regulation, investigations and legal actions including under the Federal Food, Drug, and Cosmetic Act, the Medicaid Rebate Program, federal and state false claims acts, state unfair trade practices acts and consumer protection laws. Increased scrutiny of health care industry business practices in recent years by government agencies and state attorneys general in the U.S., and any resulting investigations and prosecutions, carry risk of significant civil and criminal penalties including, but not limited to, debarment from participation in government healthcare programs. Any such debarment could have a material adverse effect on the Company’s business and results of operations. The most significant current investigations and litigation brought by government agencies are described in Note 21, “Legal Proceedings-Government Proceedings” under Notes to the Consolidated Financial Statements included in Item 8 of this Report.
economic market conditions
The Company faces a variety of financial, economic, legal, social and political risks associated with conducting business internationally.
The Company’s extensive operations and business activity outsidethroughout the U.S.world are accompanied by certain financial, economic, legal, social and political risks, including those listed below.
Foreign Currency Exchangecurrency exchange: In fiscal 2017,2023, approximately 48%45% of the Company’s sales occurred outside of the U.S., with approximately 22%24% in Europe, 8%5% in the Western Hemisphere, excluding the U.S., and 18%16% in the Asia-Pacific and Africa region. Changes in non-U.S. currencies relative to the U.S. dollar impact the Company’s revenues and expenses. While the Company uses financial instruments to mitigate the impact of fluctuations in currency exchange rates on its cash flows, unhedged exposures continue to be subject to currency fluctuations. In addition, the weakening or strengthening of the U.S. dollar may result in significant favorable or unfavorable translation effects when the operating results of the Company’s non-U.S. business activity are translated into U.S. dollars.
Inflation and Currency Devaluation Riskscurrency devaluation risks: The Company faces challenges in maintaining profitability of operations in economies experiencing high inflation rates. TheSpecifically, the Company has accounted for operations in Argentina, Turkey and Venezuela as highly inflationary, as the prior three-year cumulative inflation rate surpassed 100%. While the Company strives to maintain profit margins in these areas through cost reduction programs, productivity improvements and periodic price increases, it might experience operating losses as a result of continued inflation. In addition, the impact of currency devaluations in
countries experiencing high inflation rates or significant currency exchange fluctuations could negatively impact the Company’s operating results.
Illegal Importationimportation of Pharmaceutical Productspharmaceutical products: The illegal importation of pharmaceutical products from countries where government price controls or other market dynamics result in lower prices may adversely affect the Company’s sales and profitability in the U.S. and other countries in which the Company operates. With the exception of limited quantities of prescription drugs for personal use, foreign imports of pharmaceutical products are illegal under current U.S. law. However, the volume of illegal imports continues to rise as the ability of patients and other customers to obtain the lower-priced imports has grown significantly.
Anti-BriberyAnti-bribery and Other Regulations: other regulations: The Company is subject to various federal and foreign laws that govern its international business practices with respect to payments to government officials. Those laws include the U.S. Foreign Corrupt Practices Act (FCPA), which prohibits U.S. publicly traded companies from promising, offering, or giving anything of value to foreign officials with the corrupt intent of influencing the foreign official for the purpose of helping the Company obtain or retain business or gain any improper advantage. The Company’s business is heavily regulated and therefore involves significant interaction with foreign officials. Also, in many countries outside the U.S., the health carehealthcare providers who prescribe human pharmaceuticals are employed by the government and the purchasers of human pharmaceuticals are government entities; therefore, the Company’s interactions with these prescribers and purchasers are subject to regulation under the FCPA. In addition to the U.S. application and enforcement of the FCPA, various jurisdictions in which the Company operates have laws and regulations, including the U.KU.K. Bribery Act 2010, aimed at preventing and penalizing corrupt and anticompetitive behavior. Enforcement activities under these laws could subject the Company to additional administrative and legal proceedings and actions, which could include claims for civil penalties, criminal sanctions, and administrative remedies, including exclusion from health carehealthcare programs.
Other Legal, Socialfinancial, economic, legal, social and Political Riskspolitical risks. Other risks inherent in conducting business globally include:
•local and regional economic environments and policies in the markets that we serve, including interest rates, monetary policy, inflation, economic growth, recession, commodity prices, and currency controls or other limitations on the ability to expatriate cash;
•protective economic policies taken by governments, such as trade protection measures, increased antitrust reporting requirements and enforcement activity, and import/export licensing requirements;
•compliance with local regulations and laws including, in some countries, regulatory requirements restricting the Company’s ability to manufacture or sell its products in the relevant market;
•diminished protection of intellectual property and contractual rights in certain jurisdictions;
•potential nationalization or expropriation of the Company’s foreign assets;
•political or social upheavals, economic instability, repression, or human rights issues; and
•geopolitical events, including natural disasters, disruptions to markets due to war, armed conflict, terrorism, social upheavalsepidemics or pandemics.
InterruptionsDue to the international nature of the Company's business, geopolitical or economic changes or events, including global tensions and delays in manufacturing operationswar, could adversely affect our business, results of operations or financial condition.
As described above, the Company’sCompany has extensive operations and business salesactivity throughout the world. Global tensions, conflict and/or war among any of the countries in which we conduct business or distribute our products may result in foreign currency volatility, decreased demand for our products in affected countries, and reputation.
The Company’s manufacturechallenges to our global supply chain related to increased costs of materials and other inputs for our products requiresand suppliers. Most recently, we have experienced, and expect to continue to experience, impacts to the timely delivery of sufficient amounts of complex, high-quality components and materials. The Company's subsidiaries operate 125 manufacturing facilitiesbusiness resulting from the Russia-Ukraine war, rising conflict in the Middle East as well as sourcingincreasing tensions between the U.S. and China. In response to heightened conflict, such as the Russia-Ukraine war, governments may impose export controls and broad financial and economic sanctions. Our business and operations may be further impacted by the imposition of trade protection measures or other policies adopted by any country that favor domestic companies and technologies over foreign competitors. Additional sanctions or other measures may be imposed by the global community, including but not limited to limitations on our ability to file, prosecute and maintain patents, trademarks and other intellectual property rights. Furthermore, in some countries, such as in Russia, action may be taken that allows companies and individuals to exploit inventions owned by patent holders from hundreds of suppliers around the world. The Company hasUnited States and many other countries without consent or compensation and we may not be able to prevent third parties from practicing the Company's inventions in Russia or from selling or importing products in and into Russia.
Weak financial performance, failure to maintain a satisfactory credit rating or disruptions in the past,financial markets could adversely affect our liquidity, capital position, borrowing costs and access to capital markets.
We currently maintain investment grade credit ratings with Moody’s Investors Service and Standard & Poor’s Ratings Services. Rating agencies routinely evaluate us, and their ratings of our long-term and short-term debt are based on a number of factors. Any downgrade of our credit ratings by a credit rating agency, whether as a result of our actions or factors which are beyond our control, can increase the cost of borrowing under any indebtedness we may incur, reduce market capacity for our commercial paper or require the posting of additional collateral under our derivative contracts. There can be no assurance that we will be able to maintain our credit ratings, and any additional actual or anticipated changes or downgrades in the future, face unanticipated interruptionsour credit ratings, including any announcement that our ratings are under review for a downgrade, may have a negative impact on our liquidity, capital position and delaysaccess to capital markets.
Other risks
Our business depends on our ability to recruit and retain talented, highly skilled employees and a diverse workforce.
Our continued growth requires us to recruit and retain talented employees representing diverse backgrounds, experiences, and skill sets. The market for highly skilled workers and leaders in manufacturing through its internal or external supply chain. Manufacturing disruptions can occur for many reasons including regulatory action, production quality deviations or safety issues, labor disputes, site-specific incidents (such as fires), natural disasters such as hurricanesour industry is extremely competitive and other severe weather events, raw material shortages, political unrestour ability to compete depends on our ability to hire, develop and terrorist attacks. Such
delaysmotivate highly skilled personnel in all areas of our organization. Maintaining our brand and difficulties in manufacturing can result in product shortages, declines in sales and reputational impactreputation, as well as significant remediationa diverse, equitable and relatedinclusive work environment enables us to attract top talent. If we are less successful in our recruiting efforts, or if we cannot retain highly skilled workers and key leaders, our ability to develop and deliver successful products and services may be adversely affected. In addition, effective succession planning is important to our long-term success. Any unsuccessful implementation of our succession plans or failure to ensure effective transfer of knowledge and smooth transitions involving key employees could adversely affect our business, financial condition, or results of operations.
Climate change or legal, regulatory or market measures to address climate change may negatively affect our business and results of operations.
Climate change resulting from increased concentrations of carbon dioxide and other greenhouse gases in the atmosphere could present risks to our operations, including an adverse impact on global temperatures, weather patterns and the frequency and severity of extreme weather and natural disasters. Natural disasters and extreme weather conditions, such as a hurricane, tornado, earthquake, wildfire or flooding, may pose physical risks to our facilities and disrupt the operation of our supply chain. The impacts of the changing climate on water resources may result in water scarcity, limiting our ability to access sufficient high-quality water in certain locations, which may increase operational costs.
Concern over climate change may also result in new or additional legal or regulatory requirements designed to reduce greenhouse gas emissions and/or mitigate the effects of climate change on the environment. If such laws or regulations are more stringent than current legal or regulatory obligations, we may experience disruption in, or an increase in the costs associated with addressingsourcing, manufacturing and distribution of our products, which may adversely affect our business, results of operations or financial condition. Further, the shortage.impacts of climate change have an influence on customer preferences, and failure to provide climate-friendly products could potentially result in loss of market share.
An information security incident, including a cybersecurity breach, could have a negative impact toon the Company’s business or reputationreputation.
To meet business objectives, the Company relies on both internal information technology (IT) systems and networks, and those of third parties and their vendors, to process and store sensitive data, including confidential research, business plans, financial information, intellectual property, and personal data that may be subject to legal protection.protection, and ensure the continuity of the Company’s supply chain and operations. The extensive information security and cybersecurity threats, which affect companies globally, pose a risk to the security and availability of these ITsystems and networks, including customer products that are connected to or rely on such systems and networks, and the confidentiality, integrity, and availability of the Company’s sensitive data. The Company continually assesses these threats and makes investments to increase internal protection, detection, and response capabilities, as well as ensure the Company’s third partythird-party providers have required capabilities and controls, to address this risk. Because of the frequently changing attack techniques, along with the increased volume and sophistication of the attacks, there is the potential for the Company to be adversely impacted. This impact could result in reputational, competitive, operational or other business harm as well as financial costs and regulatory action. Also, increasing use of AI could increase these risks. The Company maintains cybersecurity insurance in the event of an information security or cyber incident; however, the coverage may not be sufficient to cover all financial, legal, business or reputational losses.
As a result of increased global tensions, the Company expects there will continue to be, an increased risk of information security or cybersecurity incidents, including cyberattacks perpetrated by adversaries of countries where the Company maintains operations. Given the potential sophistication of these attacks, the Company may not be able to address the threat of information security or cybersecurity incidents proactively or implement adequate preventative measures and we may not be able to detect and address any such disruption or security breach promptly, or at all, which could adversely affect our business, results of operations or financial condition. Moreover, these threats could also impact our third-party partners resulting in compromise of the Company's IT systems, networks and data which could negatively affect the Company.
A breach of privacy laws or unauthorized access, loss or misuse of personal data could have a negative impact on the Company’s business or reputation.
The Company is subject to privacy and data protection laws across the globe that impose broad compliance obligations on the collection, use, storage, access, transfer and protection of personal data. Breach of such requirements could result in substantial fines, penalties, private right of actions, claims and damage to our reputation and business. New privacy laws are expected in other territories, together with greater privacy enforcement by governmental authorities globally, particularly on data localization requirements and international data flows. The Company has established privacy compliance programs and controls that our businesses worldwide are required to comply with, but with many technology and data-driven initiatives being prioritized across the Company and involving multiple vendors and third parties, there are potential risks of controls imposed on cross border data flows, unauthorized access, and loss of personal data through internal and external threats that could impact our business operations and research activities.
The Company may be unable to achieve some or all of the anticipated strategic and financial benefits following the separation of Kenvue Inc. (Kenvue), including with respect to the Company’s remaining ownership interest.
The Company incurred significant expenses in connection with the Kenvue separation (the Separation). In addition, the Company may not be able to achieve the full strategic and financial benefits that are expected to result from the Separation. The anticipated benefits of the Separation were based on a number of assumptions, some of which may prove incorrect. The Company holds a 9.5% ownership interest in Kenvue. The Company cannot predict the trading price of shares of Kenvue’s common stock and the market value of the Kenvue shares are subject to market volatility and other factors outside of the Company’s control. The Company intends to divest its ownership interest in Kenvue, but there can be no assurance regarding the ultimate timing of such divestiture. Unanticipated developments could delay, prevent or otherwise adversely affect the divestiture, including but not limited to financial market conditions.
The Separation could result in substantial tax liability.
The Company received a private letter ruling from the IRS as to the tax-free nature of the Separation under the U.S. Internal Revenue Code of 1986, as amended. Notwithstanding the private letter ruling and opinions of tax advisors, if the IRS determines that certain steps of the transaction did not qualify for tax-free treatment for U.S. federal income tax purposes, the resulting tax liability to the Company and its shareholders could be substantial. The Separation may also not qualify for tax-free treatment in other countries around the world, and as a result may trigger substantial tax liability to the Company.
Item 1B. Unresolved staff comments
Not applicable.
Item 1C. Cybersecurity
Risk management and strategy
The Company has documented cybersecurity policies and standards, assesses risks from cybersecurity threats, and monitors information systems for potential cybersecurity issues. To protect the Company’s information systems from cybersecurity threats, the Company uses various security tools supporting protection, detection, and response capabilities. The Company maintains a cybersecurity incident response plan to help ensure a timely, consistent response to actual or attempted cybersecurity incidents impacting the Company.
The Company also identifies and assesses third-party risks within the enterprise, and through the Company's use of third-party service providers, across a range of areas including data security and supply chain through a structured third-party risk management program.
The Company maintains a formal information security training program for all employees that includes training on matters such as phishing and email security best practices. Employees are also required to complete mandatory training on data privacy.
To evaluate and enhance its cybersecurity program, the Company periodically utilizes third-party experts to undertake maturity assessments of the Company’s information security program.
To date, the Company is not aware of any cybersecurity incident that has not experienced anyhad or is reasonably likely to have a material impact toon the Company’s business or operations resulting from information or cybersecurity attacks;operations; however, because of the frequently changing attack techniques, along with the increased volume and sophistication of the attacks, there is the potential for the Company to be adversely impacted. This impact could result in reputational, competitive, operational or other business harm as well as financial costs and regulatory action. Refer to the risk factor captioned An information security incident, including a cybersecurity breach, could have a negative impact to the Company’s business or reputation in Part I, Item 1A. Risk factors for additional description of cybersecurity risks and potential related impacts on the Company.
Governance - management’s responsibility
The Company takes a risk-based approach to cybersecurity and has implemented cybersecurity controls designed to address cybersecurity threats and risks. The Chief Information Officer (CIO), who is a member of the Company’s Executive Committee, and the Chief Information Security Officer (CISO) are responsible for assessing and managing cybersecurity risks, including the prevention, mitigation, detection, and remediation of cybersecurity incidents.
The Company’s CISO, in coordination with the CIO, is responsible for leading the Company’s cybersecurity program and management of cybersecurity risk. The current CISO has over twenty-five years of experience in information security, and his background includes technical experience, strategy and architecture focused roles, cyber and threat experience, and various leadership roles.
Governance - board oversight
The Company’s Board of Directors oversees the overall risk management process, including cybersecurity risks, directly and through its committees. The Regulatory Compliance & Sustainability Committee (RCSC) of the board is primarily responsible for oversight of risk from cybersecurity threats and oversees compliance with applicable laws, regulations and Company policies related to, among others, privacy and cybersecurity.
RCSC meetings include discussions of specific risk areas throughout the year including, among others, those relating to cybersecurity. The CISO provides at least two updates each year to RCSC on cybersecurity matters. These reports include an overview of the cybersecurity threat landscape, key cybersecurity initiatives to improve the Company’s risk posture, changes in the legal and regulatory landscape relative to cybersecurity, and overviews of certain cybersecurity incidents that have occurred within the Company and within the industry.
| |
Item 1B. | UNRESOLVED STAFF COMMENTS |
Not applicable.
Item 2.PROPERTIES Properties
The Company's subsidiaries operate 12561 manufacturing facilities occupying approximately 21.99.8 million square feet of floor space. The manufacturing facilities are used by the industry segments of the Company’s business approximately as follows: | | | | | |
| Segment | Square Feet
(in thousands) |
| Innovative Medicine | | | 5,026 |
SegmentMedTech | | Square Feet
(in thousands)
4,782 |
Consumer | | 6,787 |
|
Pharmaceutical | | 7,304 |
|
Medical Devices | | 7,782 |
|
| Worldwide Total | | 21,873 |
9,808 |
Within the United States, sevenU.S., five facilities are used by the ConsumerInnovative Medicine segment sixand 18 by the Pharmaceutical segment and 27 by the Medical DevicesMedTech segment. Outside of the United States, 30U.S., 13 facilities are used by the ConsumerInnovative Medicine segment 16and 25 by the Pharmaceutical segment and 39 by the Medical DevicesMedTech segment.
The locations of the manufacturing facilities by major geographic areas of the world are as follows:
| | | Geographic Area | | Number of Facilities | | Square Feet (in thousands) | Geographic Area | Number of
Facilities | Square Feet
(in thousands) |
| United States | | 40 |
| | 6,300 |
| United States | 23 | 2,973 |
| Europe | | 37 |
| | 7,939 |
| Europe | 20 | 4,900 |
| Western Hemisphere, excluding U.S. | | 14 |
| | 2,800 |
| Western Hemisphere, excluding U.S. | 5 | 692 |
| Africa, Asia and Pacific | | 34 |
| | 4,834 |
| Africa, Asia and Pacific | 13 | 1,243 |
| Worldwide Total | | 125 |
| | 21,873 |
| Worldwide Total | 61 | 9,808 |
In addition to the manufacturing facilities discussed above, the Company maintains numerous office and warehouse facilities throughout the world. Research facilities are also discussed in Item 1 of this Report under “Business – Research and Development.”
The Company's subsidiaries generally seek to own, rather than lease, their manufacturing facilities, although some, principally in non-U.S. locations, are leased. Office and warehouse facilities are often leased. The Company also engages contract manufacturers.
The Company is committed to maintaining all of its properties in good operating condition.
McNEIL-PPC, Inc. (now Johnson & Johnson Consumer Inc.) (McNEIL-PPC) continues to operate under a consent decree, signed in 2011 with the FDA, which governs certain McNeil Consumer Healthcare manufacturing operations, and requires McNEIL-PPC to remediate the facilities it operates in Lancaster, Pennsylvania, Fort Washington, Pennsylvania, and Las Piedras, Puerto Rico (the "Consent Decree"). Following FDA inspections in 2015, McNEIL-PPC received notifications from the FDA that all three manufacturing facilities are in conformity with applicable laws and regulations, and commercial production has restarted.
Under the Consent Decree, after receiving notice from the FDA of being in compliance with applicable laws and regulations, each of the three facilities is subject to a five-year audit period by a third-party cGMP expert. Thus, a third-party expert will continue to reassess the sites at various times until at least 2020.
For information regarding lease obligations, see Note 16 “Rental Expense and Lease Commitments” of the Notes to Consolidated Financial Statements included in Item 8 of this Report. Segment information on additions to property, plant and equipment is contained in Note 18 “Segments17 Segments of Businessbusiness and Geographic Areas”geographic areas of the Notes to Consolidated Financial Statements included in Item 8 of this Report.
Item 3. Legal proceedings
The information called for by this item is incorporated herein by reference to the information set forth in Note 21 “Legal Proceedings”19 Legal proceedings of the Notes to Consolidated Financial Statements included in Item 8 of this Report.
In addition, Johnson & Johnson and its subsidiaries are from time to time party to government investigations, inspections or other proceedings relating to environmental matters, including their compliance with applicable environmental laws.
Item 4. Mine safety disclosures
Not applicable.
| | | | | |
Item 4.18 | MINE SAFETY DISCLOSURES |
Not applicable.
EXECUTIVE OFFICERS OF THE REGISTRANTExecutive officers of the registrant
Listed below are the executive officers of the Company. There are no family relationships between any of the executive officers, and there is no arrangement or understanding between any executive officer and any other person pursuant to which the executive officer was selected. At the annual meeting of the Board of Directors, the executive officers are elected by the Board to hold office for one year and until their respective successors are elected and qualified, or until earlier resignation or removal.
Information with regard to the directors of the Company, including information for Alex Gorsky, who is also an executive officer, is incorporated herein by reference to the material captioned “Item 1. Election of Directors” in the Proxy Statement.
| | | | | | | | |
| Name | Age | Position |
| Vanessa Broadhurst | | | | |
Name | | Age | | Position |
Dominic J. Caruso | | 60 | 55 | Member, Executive Committee; Executive Vice President; Chief Financial Officer (a)
|
Joaquin Duato | | 55 | | Member, Executive Committee; Executive Vice President, Worldwide Chairman, Pharmaceuticals(b)Global Corporate Affairs(a) |
| Joaquin Duato | 61 | Chairman of the Board; Chief Executive Officer(b) |
| Peter M. Fasolo, Ph.D. | | 55 | 61 | Member, Executive Committee; Executive Vice President, Chief Human Resources Officer(c) |
Alex GorskyElizabeth Forminard | 53 | 57 | | Chairman, Board of Directors; Chairman,Member, Executive Committee; Chief Executive OfficerVice President, General Counsel(d) |
Jorge MesquitaWilliam N. Hait, M.D., Ph. D. | | 56 | 74 | Member, Executive Committee; Executive Vice President, Chief External Innovation and Medical Officer(e) |
| John C. Reed, M.D., Ph.D. | 65 | Member, Executive Committee; Executive Vice President, Innovative Medicine, R&D(f) |
| Tim Schmid | 54 | Member, Executive Committee; Executive Vice President, Worldwide Chairman, Consumer(d)MedTech(g) |
Sandra E. PetersonJames Swanson | | 59 | 58 | Member, Executive Committee; Executive Vice President, Group Worldwide Chairman(e)
|
Paulus Stoffels | | 56 | | Member, Executive Committee; Executive Vice President, Chief ScientificInformation Officer(f)(h) |
Michael H. UllmannJennifer L. Taubert | | 59 | 60 | Member, Executive Committee; Executive Vice President, General Counsel(g)Worldwide Chairman, Innovative Medicine(i) |
| |
(a)Kathryn E. Wengel | Mr. D. J. Caruso joined the Company in 1999 when the Company acquired Centocor, Inc., where he was Senior58 | Member, Executive Committee; Executive Vice President, Finance. Mr. Caruso was named Vice President, Finance of Ortho-McNeil Pharmaceutical, Inc., a subsidiary of the Company, in 2001, and Vice President, Group Finance of the Company’s Medical Devices and Diagnostics Group in 2003. In 2005, Mr. Caruso was named Vice President of the Company’s Group Finance organization. Mr. Caruso became a member of theChief Technical Operations & Risk Officer(j) |
| Joseph J. Wolk | 57 | Member, Executive Committee and Vice President, Finance and Chief Financial Officer in 2007. In April 2016, he was namedCommittee; Executive Vice President, Chief Financial Officer. Mr. Caruso has responsibility for financial and investor relations activities, as well as the Company’s procurement organization.Officer(k) |
| |
(b) | Mr. J. Duato joined the Company in 1989 with Janssen-Farmaceutica S.A. (Spain) and in 1997 became Managing Director of Janssen-Cilag S.p.A. (Italy). In 2000, he led Ortho Biotech Europe before relocating to the United States in 2002 to serve as Vice President, and, in 2005, President of Ortho Biotech Inc. In 2008, he was named Company Group Chairman, Ortho-Clinical Diagnostics, and in 2009, Company Group Chairman, Pharmaceuticals, where he oversaw pharmaceutical product launches and the major therapeutic franchises in Canada, the United States and Latin America. In 2011, he was named Worldwide Chairman, Pharmaceuticals, responsible for the global commercial businesses of the Janssen Pharmaceutical Companies, including functional support for the research & development organizations. In April 2016, Mr. Duato became a member of the Executive Committee and was named Executive Vice President, Worldwide Chairman, Pharmaceuticals. |
(a)Ms. V. Broadhurst was named Executive Vice President, Global Corporate Affairs and appointed to the Executive Committee in 2022. Ms. Broadhurst rejoined the Company in 2017 and was appointed Company Group Chairman, Global Commercial Strategy Organization in 2018. From 2013 to 2017, she held General Manager roles at Amgen in Inflammation & Cardiovascular, and Cardiovascular & Bone. Prior to her roles at Amgen, she served in various leadership roles at the Company from 2005-2013.
(b)Mr. J. Duato became Chairman of the Board of Directors in January 2023 subsequent to his appointments as Chief Executive Officer and Director in January 2022. Mr. Duato was appointed to the Executive Committee in 2016 when he was named Executive Vice President, Worldwide Chairman, Pharmaceuticals and subsequently served as Vice Chairman of the Executive Committee. Mr. Duato first joined the Company in 1989 with Janssen-Farmaceutica S.A. (Spain), a subsidiary of the Company, and held executive positions of increasing responsibility in all business sectors and across multiple geographies and functions.
(c)Dr. P. M. Fasolo was appointed to the Executive Committee in 2011 and was named Executive Vice President, Chief Human Resources Officer in 2016. He first joined the Company in 2004 as Worldwide Vice President, Human Resources in the MedTech segment, and subsequently served as the Company’s Chief Talent Officer. He left Johnson & Johnson in 2007 to join Kohlberg Kravis Roberts & Co. as Chief Talent Officer and returned to the Company in 2010 as the Vice President, Global Human Resources.
(d)Ms. E. Forminard was appointed as Executive Vice President, General Counsel and a member of the Executive Committee in October 2022. Ms. Forminard joined the Company in 2006, serving in roles of increasing responsibility including General Counsel Medical Devices & Diagnostics, General Counsel Consumer Group & Supply Chain, Worldwide Vice President Corporate Governance, and in her immediate past role as General Counsel Pharmaceuticals.
(e)Dr. W. Hait was appointed Executive Vice President, Chief External Innovation, Medical Safety and Global Public Health Officer, and a member of the Executive Committee in 2022. He first joined the Company in 2007 and has served in a number of leadership roles including
Global Head, Janssen Research & Development from 2011 to 2018 and Global Head, Johnson & Johnson Global External Innovation from 2018 to 2022.
| |
(c) | Dr. P. M. Fasolo joined the Company in 2004 as Vice President, Worldwide Human Resources for Cordis Corporation, a subsidiary of the Company, and was subsequently named Vice President, Global Talent Management for the Company. He left Johnson & Johnson in 2007 to join Kohlberg Kravis Roberts & Co. as Chief Talent Officer. Dr. Fasolo returned to the Company in 2010 as the Vice President, Global Human Resources, and in 2011, he became a member of the Executive Committee. In April 2016, he was named Executive Vice President, Chief Human Resources Officer. Mr. Fasolo has responsibility for global talent, recruiting, diversity, compensation, benefits, employee relations and all aspects of human resources for the Company. |
| |
(d) | Mr. J. Mesquita joined the Company in 2014 as Worldwide Chairman, Consumer. Prior to joining the Company, he served in various marketing and leadership capacities across Latin America, including roles in Oral Care and Beauty at The Procter & Gamble Company from 1984 to 2013. In April 2016, Mr. Mesquita became a member of the Executive Committee and was named as Executive Vice President, Worldwide Chairman, Consumer. |
| |
(e) | Ms. S. E. Peterson joined the Company in 2012 as Group Worldwide Chairman and a member of the Executive Committee. Prior to joining the Company, Ms. Peterson was Chairman and Chief Executive Officer of Bayer CropScience AG in Germany, previously serving as President and Chief Executive Officer of Bayer Medical Care and President of Bayer HealthCare AG's Diabetes Care Division. Before joining Bayer in 2005, Ms. Peterson held a number of leadership roles at Medco Health Solutions (previously known as Merck-Medco). In April 2016, Ms. Peterson was named Executive Vice President, Group Worldwide Chairman of Johnson & Johnson. Ms. Peterson is responsible for the Company’s consumer-facing businesses, including the consumer family of companies and the consumer medical device businesses; the Company’s medical device businesses; and for supply chain, quality, information technology, and design across the enterprise. |
| |
(f) | Dr. P. Stoffels joined the Company in 2002 with the acquisition of Tibotec Virco NV, where he was Chief Executive Officer of Virco NV and Chairman of Tibotec NV. In 2005, he was appointed Company Group Chairman, Global Virology. In 2006, he assumed the role of Company Group Chairman, Pharmaceuticals, with responsibility for worldwide research and development for the Central Nervous System and Internal Medicine Franchises. Dr. Stoffels was appointed Global Head, Research & Development, Pharmaceuticals in 2009, and in 2011, became Worldwide Chairman, Pharmaceuticals, with responsibility for the Company's therapeutic pipeline through global research and development and strategic business development. In 2012, Dr. Stoffels was appointed Chief Scientific Officer, with responsibility for enterprise-wide innovation and product safety, and became a member of the Executive Committee. In April 2016, Dr. Stoffels was named Executive Vice President, Chief Scientific Officer. He is responsible for the Company’s innovation pipeline across the pharmaceutical, medical devices and consumer segments and steers the Company’s global public health strategy. |
| |
(g) | Mr. M. H. Ullmann joined the Company in 1989 as a corporate attorney in the Law Department. He was appointed Corporate Secretary in 1999 and served in that role until 2006. During that time, he also held various management positions in the Law Department. In 2006, he was named General Counsel, Medical Devices and Diagnostics and was appointed Vice President, General Counsel and became a member of the Executive Committee in 2012. In April 2016, Mr. Ullmann was named Executive Vice President, General Counsel. Mr. Ullmann has worldwide responsibility for legal, government affairs & policy, global security, aviation and health care compliance & privacy. |
(f)Dr. J. C. Reed joined the Company in 2023 as Executive Vice President, Innovative Medicine, R&D and a member of the Executive Committee. Prior to joining the Company, Dr. Reed held executive leadership positions at Sanofi (2018-2022) and Roche (2013-2018), serving on their respective executive committees. He also served as CEO of Sanford-Burnham Medical Research Institute (now Sanford Burnham Prebys) where he established multiple therapeutic area-aligned research centers and platform technology centers.
(g)Mr. T. Schmid was named as Executive Vice President, Worldwide Chairman, MedTech and appointed to the Executive Committee in October 2023. He joined the Company in 1993 and has served in leadership positions throughout Johnson & Johnson MedTech, including Chief Strategic Customer Officer and President of Ethicon, and most recently served as Company Group Chairman MedTech Asia Pacific from 2018-2023.
(h)Mr. J. Swanson was appointed Executive Vice President, Chief Information Officer and a member of the Executive Committee in 2022. He rejoined the Company in 2019 as Chief Information Officer of Johnson & Johnson from Bayer Crop Science, where he served as a member of the Executive Leadership Team and as Chief Information Officer and Head of Digital Transformation. From 1996 to 2005, Mr. Swanson held positions of increasing responsibility at the Company, including Project Manager, Director IT, Sr. Director IT and Vice President, Chief Information Officer.
(i)Ms. J. L. Taubert was appointed Executive Vice President, Worldwide Chairman, Innovative Medicine (formerly Pharmaceuticals) and a member of the Executive Committee in 2018. She joined the Company in 2005 as Worldwide Vice President and held several executive positions of increasing responsibility in the Pharmaceuticals sector, including Company Group Chairman, North America, and Company Group Chairman, The Americas from 2012-2018.
(j)Ms. K. E. Wengel was appointed Executive Vice President, Chief Technical Operations & Risk Officer in 2023, subsequent to her appointment to the Executive Committee in 2018 when she was named as Executive Vice President, Chief Global Supply Chain Officer. Ms. Wengel first joined the Company in 1988 as Project Engineer and Engineering Supervisor at Janssen, a subsidiary of the Company. During her tenure with the Company, she has held a variety of strategic leadership and executive positions, including in roles within operations, quality, engineering, new products, information technology, and other technical and business functions.
(k)Mr. J. J. Wolk was appointed Executive Vice President, Chief Financial Officer and a member of the Executive Committee in July 2018. He first joined the Company in 1998 as Finance Manager, Business Development for Ortho-McNeil, a subsidiary of the Company. During his tenure at the Company, he has held a variety of senior leadership roles in several segments and functions across the Company's subsidiaries, including Vice President, Finance and Chief Financial Officer of the Janssen Pharmaceutical Companies, and Vice President, Investor Relations.
PARTPart II
| |
Item 5. | MARKET FOR REGISTRANT’S COMMON EQUITY, RELATED STOCKHOLDER MATTERS AND ISSUER PURCHASES OF EQUITY SECURITIES |
Item 5. Market for registrant’s common equity, related stockholder matters and issuer purchases of equity securities
As of February 16, 2018,9, 2024, there were 147,484118,772 record holders of common stock of the Company. Additional information called for by this item is incorporated herein by reference to the following sections of this Report: “Item 7. Management’s Discussion and Analysis of Results of Operations and Financial Condition – Liquidity and Capital Resources – Dividends” and “— Other Information — Common Stock Market Prices”; Note 1716 “Common Stock, Stock Option Plans and Stock Compensation Agreements” of the Notes to Consolidated Financial Statements included in Item 8; and Item 12 “Security Ownership of Certain Beneficial Owners and Management and Related Stockholder Matters – Equity Compensation Plan Information”.Information.”
Issuer Purchasespurchases of Equity Securitiesequity securities
On October 13, 2015,September 14, 2022, the Company announced that its Board of Directors approved a share repurchase program, authorizing the Company to purchase up to $10.0$5.0 billion of the Company's Common Stock. Share repurchases take place on the open market from time to time based on market conditions. As of July 2, 2017, $10.0 billion was repurchased under the program and theThe repurchase program was completed.completed during the fiscal first quarter of 2023.
The following table provides information with respect to common stock purchases by the Company during the fiscal fourth quarter of 2017.2023. Common stock purchases on the open market are made as part of a systematic plan to meet the needs of the Company’s compensation programs. The repurchases below also include the stock-for-stock option exercises that settled in the fiscal fourth quarter. |
| | | | | | | | | | | |
| Period | | Total Number of Shares Purchased(1) | | Avg. Price Paid Per Share | | Total Number of Shares (or Units) Purchased as Part of Publicly Announced Plans or Programs(2) | | Maximum Number (or Approximate Dollar Value) of Shares (or Units) that May Yet Be Purchased Under the Plans or Programs |
| October 2, 2017 through October 29, 2017 | | 335,583 |
| | $ | 141.89 |
| | - | | - |
| October 30, 2017 through November 26, 2017 | | 2,139,701 |
| | 139.98 |
| | - | | - |
| November 27, 2017 through December 31, 2017 | | 3,318,630 |
| | 141.06 |
| | - | | - |
| Total | | 5,793,914 |
| | | |
| | |
| | | | | | | | | | | | | | | | | | | | | | | | | | |
| Fiscal Period | | Total Number of Shares Purchased(1) | | Avg. Price
Paid Per Share | | Total Number of Shares (or
Units) Purchased as Part
of Publicly Announced
Plans or Programs | | Maximum Number (or Approximate
Dollar Value) of Shares (or Units)
that May Yet Be Purchased Under
the Plans or Programs |
| October 2, 2023 through October 29, 2023 | | — | | — | | — | | — |
| October 30, 2023 through November 26, 2023 | | 125,000 | | $147.61 | | — | | — |
| November 27, 2023 through December 31, 2023 | | 1,265,000 | | $156.76 | | — | | — |
| Total | | 1,390,000 | | | | — | | |
| |
(1)
| During the fiscal fourth quarter of 2017, the Company repurchased an aggregate of 5,793,914(1)During the fiscal fourth quarter of 2023, the Company repurchased an aggregate of 1,390,000 shares of Johnson & Johnson Common Stock in open-market transactions as part of a systematic plan to meet the needs of the Company’s compensation programs. |
| |
(2)
| As of July 2, 2017, the share repurchase program was completed with an aggregate of 86,592,946 shares purchased for a total of $10.0 billion since the inception of the repurchase program announced on October 13, 2015. |
| |
Item 6. | SELECTED FINANCIAL DATA |
Summary of Operations and Statistical Data 2007-2017
|
| | | | | | | | | | | | | | | | | | | | | | | | | | | | | |
| (Dollars in Millions Except Per Share Amounts) | 2017 | | 2016 | | 2015 | | 2014 | | 2013 | | 2012 | | 2011 | | 2010 | | 2009 | | 2008 | | 2007 |
| Sales to customers — U.S. | $39,863 | | 37,811 | | 35,687 | | 34,782 |
| | 31,910 |
| | 29,830 |
| | 28,908 |
| | 29,450 |
| | 30,889 |
| | 32,309 |
| | 32,444 |
|
| Sales to customers — International | 36,587 | | 34,079 | | 34,387 | | 39,549 |
| | 39,402 |
| | 37,394 |
| | 36,122 |
| | 32,137 |
| | 31,008 |
| | 31,438 |
| | 28,651 |
|
| Total sales | 76,450 | | 71,890 | | 70,074 | | 74,331 |
| | 71,312 |
| | 67,224 |
| | 65,030 |
| | 61,587 |
| | 61,897 |
| | 63,747 |
| | 61,095 |
|
| Cost of products sold | 25,354 | | 21,685 | | 21,536 | | 22,746 |
| | 22,342 |
| | 21,658 |
| | 20,360 |
| | 18,792 |
| | 18,447 |
| | 18,511 |
| | 17,751 |
|
| Selling, marketing and administrative expenses | 21,420 | | 19,945 | | 21,203 | | 21,954 |
| | 21,830 |
| | 20,869 |
| | 20,969 |
| | 19,424 |
| | 19,801 |
| | 21,490 |
| | 20,451 |
|
| Research and development expense | 10,554 | | 9,095 | | 9,046 | | 8,494 |
| | 8,183 |
| | 7,665 |
| | 7,548 |
| | 6,844 |
| | 6,986 |
| | 7,577 |
| | 7,680 |
|
| In-process research and development | 408 | | 29 | | 224 | | 178 |
| | 580 |
| | 1,163 |
| | — |
| | — |
| | — |
| | 181 |
| | 807 |
|
| Interest income | (385) | | (368) | | (128) | | (67 | ) | | (74 | ) | | (64 | ) | | (91 | ) | | (107 | ) | | (90 | ) | | (361 | ) | | (452 | ) |
| Interest expense, net of portion capitalized | 934 | | 726 | | 552 | | 533 |
| | 482 |
| | 532 |
| | 571 |
| | 455 |
| | 451 |
| | 435 |
| | 296 |
|
| Other (income) expense, net | 183 | | 484 | | (2,064) | | (70 | ) | | 2,498 |
| | 1,626 |
| | 2,743 |
| | (768 | ) | | (526 | ) | | (1,015 | ) | | 534 |
|
| Restructuring | 309 | | 491 | | 509 | | — |
| | — |
| | — |
| | 569 |
| | — |
| | 1,073 |
| | — |
| | 745 |
|
| | 58,777 | | 52,087 | | 50,878 | | 53,768 |
| | 55,841 |
| | 53,449 |
| | 52,669 |
| | 44,640 |
| | 46,142 |
| | 46,818 |
| | 47,812 |
|
| Earnings before provision for taxes on income | $17,673 | | 19,803 | | 19,196 | | 20,563 |
| | 15,471 |
| | 13,775 |
| | 12,361 |
| | 16,947 |
| | 15,755 |
| | 16,929 |
| | 13,283 |
|
| Provision for taxes on income | 16,373 | | 3,263 | | 3,787 | | 4,240 |
| | 1,640 |
| | 3,261 |
| | 2,689 |
| | 3,613 |
| | 3,489 |
| | 3,980 |
| | 2,707 |
|
| Net earnings | 1,300 | | 16,540 | | 15,409 | | 16,323 |
| | 13,831 |
| | 10,514 |
| | 9,672 |
| | 13,334 |
| | 12,266 |
| | 12,949 |
| | 10,576 |
|
| Add: Net loss attributable to noncontrolling interest | — | | — | | — | | — |
| | — |
| | 339 |
| | — |
| | — |
| | — |
| | — |
| | — |
|
| Net earnings attributable to Johnson & Johnson | 1,300 | | 16,540 | | 15,409 | | 16,323 |
| | 13,831 |
| | 10,853 |
| | 9,672 |
| | 13,334 |
| | 12,266 |
| | 12,949 |
| | 10,576 |
|
| Percent of sales to customers | 1.7% | | 23.0 | | 22.0 | | 22.0 |
| | 19.4 |
| | 16.1 |
| | 14.9 |
| | 21.7 |
| | 19.8 |
| | 20.3 |
| | 17.3 |
|
Diluted net earnings per share of common stock (1) | $0.47 | | 5.93 | | 5.48 | | 5.70 |
| | 4.81 |
| | 3.86 |
| | 3.49 |
| | 4.78 |
| | 4.40 |
| | 4.57 |
| | 3.63 |
|
| Percent return on average shareholders’ equity | 2.0% | | 23.4 | | 21.9 | | 22.7 |
| | 19.9 |
| | 17.8 |
| | 17.0 |
| | 24.9 |
| | 26.4 |
| | 30.2 |
| | 25.6 |
|
| Percent increase (decrease) over previous year: | | | | | | | | | | | | | |
| | |
| | |
| | |
| | |
|
| Sales to customers | 6.3% | | 2.6 | | (5.7) | | 4.2 |
| | 6.1 |
| | 3.4 |
| | 5.6 |
| | (0.5 | ) | | (2.9 | ) | | 4.3 |
| | 14.6 |
|
| Diluted net earnings per share | (92.1)% | | 8.2 | | (3.9) | | 18.5 |
| | 24.6 |
| | 10.6 |
| | (27.0 | ) | | 8.6 |
| | (3.7 | ) | | 25.9 |
| | (2.7 | ) |
| Supplementary balance sheet data: | | | | | | | | | | | | | |
| | |
| | |
| | |
| | |
|
| Property, plant and equipment, net | 17,005 | | 15,912 | | 15,905 | | 16,126 |
| | 16,710 |
| | 16,097 |
| | 14,739 |
| | 14,553 |
| | 14,759 |
| | 14,365 |
| | 14,185 |
|
| Additions to property, plant and equipment | 3,279 | | 3,226 | | 3,463 | | 3,714 |
| | 3,595 |
| | 2,934 |
| | 2,893 |
| | 2,384 |
| | 2,365 |
| | 3,066 |
| | 2,942 |
|
| Total assets | 157,303 | | 141,208 | | 133,411 | | 130,358 |
| | 131,754 |
| | 121,347 |
| | 113,644 |
| | 102,908 |
| | 94,682 |
| | 84,912 |
| | 80,954 |
|
| Long-term debt | 30,675 | | 22,442 | | 12,857 | | 15,122 |
| | 13,328 |
| | 11,489 |
| | 12,969 |
| | 9,156 |
| | 8,223 |
| | 8,120 |
| | 7,074 |
|
| Operating cash flow | 21,056 | | 18,767 | | 19,569 | | 18,710 |
| | 17,414 |
| | 15,396 |
| | 14,298 |
| | 16,385 |
| | 16,571 |
| | 14,972 |
| | 15,022 |
|
| Common stock information | | | | | | | | | | | | | |
| | |
| | |
| | |
| | |
|
| Dividends paid per share | $3.32 | | 3.15 | | 2.95 | | 2.76 |
| | 2.59 |
| | 2.40 |
| | 2.25 |
| | 2.11 |
| | 1.93 |
| | 1.795 |
| | 1.62 |
|
| Shareholders’ equity per share | 22.43 | | 26.02 | | 25.82 | | 25.06 |
| | 26.25 |
| | 23.33 |
| | 20.95 |
| | 20.66 |
| | 18.37 |
| | 15.35 |
| | 15.25 |
|
| Market price per share (year-end close) | $139.72 | | 115.21 | | 102.72 | | 105.06 |
| | 92.35 |
| | 69.48 |
| | 65.58 |
| | 61.85 |
| | 64.41 |
| | 58.56 |
| | 67.38 |
|
Average shares outstanding (millions) | | | | | | | | | | | | | | | | | | | | | |
| — basic | 2,692.0 | | 2,737.3 | | 2,771.8 | | 2,815.2 |
| | 2,809.2 |
| | 2,753.3 |
| | 2,736.0 |
| | 2,751.4 |
| | 2,759.5 |
| | 2,802.5 |
| | 2,882.9 |
|
| — diluted | 2,745.3 | | 2,788.9 | | 2,812.9 | | 2,863.9 |
| | 2,877.0 |
| | 2,812.6 |
| | 2,775.3 |
| | 2,788.8 |
| | 2,789.1 |
| | 2,835.6 |
| | 2,910.7 |
|
| Employees (thousands) | 134.0 | | 126.4 | | 127.1 | | 126.5 |
| | 128.1 |
| | 127.6 |
| | 117.9 |
| | 114.0 |
| | 115.5 |
| | 118.7 |
| | 119.2 |
|
(1) Attributable to Johnson & Johnson Common Stock in open-market transactions, all of which were purchased as part of a systematic plan to meet the needs of the Company’s compensation programs.
Item 6. Reserved
Item 7. Management’s discussion and analysis of results of operations and financial condition
| |
Item 7. | MANAGEMENT’S DISCUSSION AND ANALYSIS OF RESULTS OF OPERATIONS AND FINANCIAL CONDITION |
Organization and Business Segmentsbusiness segments
Description of the Companycompany and Business Segmentsbusiness segments
Johnson & Johnson and its subsidiaries (the Company) have approximately 134,000131,900 employees worldwide engaged in the research and development, manufacture and sale of a broad range of products in the health carehealthcare field. The Company conducts business in virtually all countries of the world with the primary focus on products related to human health and well-being.
The Company is organized into threetwo business segments: Consumer, PharmaceuticalInnovative Medicine and Medical Devices.MedTech. The Consumer segment includes a broad range of products used in the baby care, oral care, beauty, over-the-counter pharmaceutical, women’s health and wound care markets. These products are marketed to the general public and sold both to retail outlets and distributors throughout the world. The PharmaceuticalInnovative Medicine segment is focused on sixthe following therapeutic areas, including immunology, infectiousImmunology, Infectious diseases, neuroscience, oncology, pulmonary hypertension,Neuroscience, Oncology, Pulmonary Hypertension, and cardiovascularCardiovascular and metabolicMetabolic diseases. Products in this segment are distributed directly to retailers, wholesalers, distributors, hospitals and health carehealthcare professionals for prescription use. The Medical DevicesMedTech segment includes a broad rangeportfolio of products used in the orthopaedic, surgery, cardiovascular, diabetes careOrthopaedic, Surgery, Interventional Solutions and vision care fields whichVision fields. These products are distributed to wholesalers, hospitals and retailers, and used principally in the professional fields by physicians, nurses, hospitals, eye care professionals and clinics.
The Executive Committee of Johnson & Johnson is the principal management group responsible for the strategic operations and allocation of the resources of the Company. This Committee oversees and coordinates the activities of the Consumer, PharmaceuticalInnovative Medicine and Medical DevicesMedTech business segments.
In all of its product lines, the Company competes with other companies both locally and globally, throughout the world. Competition exists in all product lines without regard to the number and size of the competing companies involved. Competition in research, involving the development and the improvement of new and existing products and processes, is particularly significant. The development of new and innovative products, as well as protecting the underlying intellectual property of the Company's product portfolio, is important to the Company’s success in all areas of its business. The competitive environment requires substantial investments in continuing research. In addition, the development and maintenance of customer demand for the Company’s consumer products involves significant expenditures for advertising and promotion.
Management’s Objectivesobjectives
With “Our Credo” as the foundation, the Company’s purpose is to blend heart, science and ingenuity to profoundly change the trajectory ofimpact health for humanity. The Company, believes health is committedeverything. The Company's strength in healthcare innovation empowers us to bringing its full breadthbuild a world where complex diseases are prevented, treated, and depth to ensure health for people todaycured, where treatments are smarter and for future generations. United around this common ambition,less invasive, and solutions are personal. Through the Company's expertise in Innovative Medicine and MedTech, the Company is poiseduniquely positioned to fulfill its purposeinnovate across the full spectrum of healthcare solutions today to deliver the breakthroughs of tomorrow, and successfully meet the demands of the rapidly evolving markets in which it competes.profoundly impact health for humanity.
The Company is broadly based in human healthcare, and is committed to creating value by developing accessible, high quality, innovative products and services. New products introduced within the past five years accounted for approximately 22%25% of 20172023 sales. In 2017, $10.62023, $15.1 billion was invested in research and development and $35.2 billion spent on acquisitions, reflecting management’s commitment to create life-enhancing innovations and to create value through partnerships that will profoundly change the trajectoryimpact of health for humanity.
A critical driver of the Company’s success is the 134,000 diversediversity of its 131,900 employees that work across more than 260 operating companies, which are located in more than 60 countries.worldwide. Employees are empowered and inspired to lead with the Company’s Our Credo and purpose as guides. This allows every employee to use the Company’s reach and size to advance the Company'sCompany’s purpose, and to also lead with agility and urgency. Leveraging the extensive resources across the enterprise enables the Company to innovate and execute with excellence. This ensures the Company can remain focused on addressing the unmet needs of society every day and invest for an enduring impact, ultimately delivering value to its patients, consumers and healthcare professionals, employees, communities and shareholders.
Acquisitions*
(net of cash acquired)
 *Includes acquisitions of in process research and development assets that were not accounted for as a business combination
Results of Operationsoperations
Analysis of Consolidated Salesconsolidated sales
For discussion on results of operations and financial condition pertaining to the fiscal years 2022 and 2021 see the Company’s Annual Report on Form 10-K for the fiscal year ended January 1, 2023, Item 7. Management's discussion and analysis of results of operations and financial condition. Prior periods disclosed herein were recast to reflect the continuing operations of the Company.
In 2017,2023, worldwide sales increased 6.3%6.5% to $76.5$85.2 billion as compared to an increase of 2.6%1.6% in 2016 and a decrease of 5.7% in 2015.2022. These sales changes consisted of the following:
| | | | | | | | | | | | | | | | |
| Sales increase/(decrease) due to: | | 2023 | | 2022 | | |
| Volume | | 6.8 | % | | 8.3 | % | | |
| Price | | 0.6 | | | (1.8) | | | |
| Currency | | (0.9) | | | (4.9) | | | |
| Total | | 6.5 | % | | 1.6 | % | | |
|
| | | | | | | | | |
| Sales increase/(decrease) due to: | | 2017 | | 2016 | | 2015 |
| Volume | | 8.0 | % | | 3.2 | % | | 1.2 | % |
| Price | | (2.0 | ) | | 0.7 |
| | 0.6 |
|
| Currency | | 0.3 |
| | (1.3 | ) | | (7.5 | ) |
| Total | | 6.3 | % | | 2.6 | % | | (5.7 | )% |
In 2017, theThe net impact of acquisitions and divestitures on the worldwide sales growth was a positive impact of 3.6%. In 2016, acquisitions1.5% in 2023 and divestitures had a negativeno impact of 1.1% on the worldwide sales growth and competitive products to the Company's Hepatitis C products, OLYSIO®/SOVRIAD® (simeprevir) and INCIVO® (telaprevir), had a negative impact of 0.8% on the worldwide sales growth. Operations in Venezuela negatively impacted the worldwide sales growth 0.3%. In 2015, the introduction of competitive products to the Company's Hepatitis C products, OLYSIO®/SOVRIAD® (simeprevir) and INCIVO® (telaprevir), had a negative impact of 2.7% on the worldwide sales growth. In 2015, the impact of acquisitions and divestitures on the worldwide sales growth was negative 2.0%.2022.
Sales by U.S. companies were $39.9$46.4 billion in 2017, $37.82023 and $42.0 billion in 2016 and $35.7 billion in 2015.2022. This represents increases of 5.4%10.6% in 2017, 6.0%2023 and 3.3% in 2016 and 2.6% in 2015.2022. Sales by international companies were $36.6$38.7 billion in 2017, $34.12023 and $38.0 billion in 2016 and $34.4 billion in 2015.2022. This represents an increase of 7.4%1.9% in 2017,2023 and decreasesa decrease of 0.9%0.2% in 2016, and 13.1% in 2015.2022.
The five-year compound annual growth rates for worldwide, U.S. and international sales were 2.6%4.7%, 6.0%5.2% and (0.4)%4.1%, respectively. The ten-year compound annual growth rates for worldwide, U.S. and international sales were 2.3%4.2%, 2.1%5.7% and 2.5%2.6%, respectively.
In 2017,2023, sales by companies in Europe achieved growthexperienced a decline of 8.6%1.2% as compared to the prior year, includingwhich included an operational growthdecline of 7.2%2.2% and a positive currency impact of 1.4%1.0%. In fiscal 2023, the net impact of the Covid-19 Vaccine and the loss of exclusivity of Zytiga on the European regions change in operational sales was a negative 9.8%. Sales by companies in the Western Hemisphere, (excludingexcluding the U.S.), achieved growth of 5.4%10.7% as compared to the prior year, includingwhich included operational growth of 2.8%15.8%, and a positivenegative currency impact of 2.6%5.1%. Sales by companies in the Asia-Pacific, Africa region achieved growth of 6.7%3.9% as compared to the prior year, including operational growth of 7.5% partially offset by9.5% and a negative currency impact of 0.8%5.6%.
The 2016 sales growth percentage as compared to the prior year was negatively impacted by approximately 1.3% from additional shipping days in 2015. (See Note 1 to the Consolidated Financial Statements for Annual Closing Date details). While the additional week in 2015 added a few days to sales, it also added a full week's worth of operating costs; therefore, the net earnings impact was negligible.
In 2017,2023, the Company had twoutilized three wholesalers distributing products for all threeboth segments that represented approximately 14.0%18.2%, 15.1% and 10.0%14.2% of the total consolidated revenues. In 2016,2022, the Company had twothree wholesalers distributing products for all threeboth segments that represented approximately 13.5%18.9%, 15.0% and 10.7% of the total consolidated revenues. In 2015, the Company had one wholesaler distributing products for all three segments that represented approximately 12.5%13.8% of the total consolidated revenues.
2023 Sales by geographic region (in billions)
2023 Sales by segment (in billions)
Note: values may have been rounded
Analysis of Salessales by Business Segmentsbusiness segments
Consumer SegmentInnovative Medicine segment(1)
ConsumerInnovative Medicine segment sales in 20172023 were $13.6$54.8 billion, an increase of 2.2%4.2% from 2016,2022, which included 1.3% operational growth of 4.8% and a positivenegative currency impact of 0.9%0.6%. U.S. Consumer segment sales were $5.6$31.2 billion, an increase of 2.7%9.0%. International sales were $8.0$23.6 billion, an increasea decrease of 1.9%1.5%, which included 0.4%an operational growthdecline of 0.2% and a positivenegative currency impact of 1.5%1.3%. In 2017,2023, acquisitions and divestitures had a net positivenegative impact of 1.8%0.1% on the operational sales growth of the worldwide ConsumerInnovative Medicine segment.
Major Consumer Franchise Sales: |
| | | | | | | | | | | | | | | | |
| | | | | | | | | % Change |
| (Dollars in Millions) | | 2017 | | 2016 | | 2015 | | ’17 vs. ’16 | | ’16 vs. ’15 |
| Beauty | | $ | 4,200 |
| | 3,897 |
| | 3,633 |
| | 7.8 | % | | 7.3 |
|
| OTC | | 4,126 |
| | 3,977 |
| | 3,895 |
| | 3.7 |
| | 2.1 |
|
| Baby Care | | 1,916 |
| | 2,001 |
| | 2,157 |
| | (4.2 | ) | | (7.2 | ) |
| Oral Care | | 1,531 |
| | 1,568 |
| | 1,580 |
| | (2.4 | ) | | (0.8 | ) |
| Women’s Health | | 1,050 |
| | 1,067 |
| | 1,200 |
| | (1.6 | ) | | (11.1 | ) |
| Wound Care/Other | | 779 |
| | 797 |
| | 1,042 |
| | (2.3 | ) | | (23.5 | ) |
| Total Consumer Sales | | $ | 13,602 |
| | 13,307 |
| | 13,507 |
| | 2.2 | % | | (1.5 | ) |
The Beauty franchise sales of $4.2 billion increased 7.8% as compared to the prior year. Growth was primarily driven by the inclusion of sales from the recent acquisitions, Vogue International LLC and Dr. Ci: Labo, as well as sales growth of NEUTROGENA® products.
The Over-the-Counter (OTC) franchise sales of $4.1 billion increased 3.7% as compared to the prior year. Growth was primarily driven by analgesic products in the U.S., upper respiratory products outside the U.S., sales from the recent acquisition of Rhinocort and anti-smoking aids.
The Baby Care franchise sales were $1.9 billion in 2017, a decrease of 4.2% compared to the prior year, primarily due to competitive pressure.
The Oral Care franchise sales were $1.5 billion in 2017, a decrease of 2.4% as compared to the prior year, primarily driven by category declines and competitive pressure partially offset by new product launches outside the U.S.
The Women’s Health franchise sales were $1.1 billion in 2017, a decrease of 1.6% as compared to the prior year, primarily due to category declines in EMEA and share loss in Brazil.
The Wound Care/Other franchise sales were $0.8 billion in 2017, a decrease of 2.3% as compared to the prior year, primarily due to private label competitive pressure in the U.S. partially offset by BAND-AID® new product launches outside the U.S.
Consumer segment sales in 2016 were $13.3 billion, a decrease of 1.5% from 2015, which included 1.5% operational growth offset by a negative currency impact of 3.0%. U.S. Consumer segment sales were $5.4 billion, an increase of 3.8%. International sales were $7.9 billion, a decrease of 4.8%, which included 0.1% operational growth offset by a negative currency impact of 4.9%. In 2016, the impact of acquisitions and divestitures on the Consumer segment operational sales growth was negative 0.5%. In 2016, the Consumer segment operational sales growth was negatively impacted 1.2% by operations in Venezuela and negatively impacted by 1.1% due to additional shipping days in 2015.
Major Innovative Medicine therapeutic area sales:
| | | | | | | | | | | | | | | | | | | | | | | | | | | | | | | | | | | | |
| (Dollars in Millions) | | 2023 | | 2022 | | | | Total
Change | | Operations
Change | | Currency
Change | | |
| Total Immunology | | $18,052 | | $16,935 | | | | 6.6 | % | | 7.1 | % | | (0.5) | % | | |
| REMICADE | | 1,839 | | 2,343 | | | | (21.5) | | | (20.7) | | | (0.8) | | | |
| SIMPONI/SIMPONI ARIA | | 2,197 | | 2,184 | | | | 0.6 | | | 2.4 | | | (1.8) | | | |
| STELARA | | 10,858 | | 9,723 | | | | 11.7 | | | 11.9 | | | (0.2) | | | |
| TREMFYA | | 3,147 | | 2,668 | | | | 17.9 | | | 18.3 | | | (0.4) | | | |
| Other Immunology | | 11 | | 17 | | | | (33.8) | | | (33.8) | | | — | | | |
| Total Infectious Diseases | | 4,418 | | 5,449 | | | | (18.9) | | | (19.8) | | | 0.9 | | | |
| COVID-19 VACCINE | | 1,117 | | 2,179 | | | | (48.8) | | | (50.1) | | | 1.3 | | | |
| EDURANT/rilpivirine | | 1,150 | | 1,008 | | | | 14.1 | | | 11.5 | | | 2.6 | | | |
| PREZISTA/ PREZCOBIX/REZOLSTA/SYMTUZA | | 1,854 | | 1,943 | | | | (4.6) | | | (4.9) | | | 0.3 | | | |
| Other Infectious Diseases | | 297 | | 318 | | | | (6.7) | | | (3.6) | | | (3.1) | | | |
| Total Neuroscience | | 7,140 | | 6,893 | | | | 3.6 | | | 5.4 | | | (1.8) | | | |
| CONCERTA/methylphenidate | | 783 | | 644 | | | | 21.6 | | | 24.9 | | | (3.3) | | | |
| INVEGA SUSTENNA/XEPLION/INVEGA TRINZA/TREVICTA | | 4,115 | | 4,140 | | | | (0.6) | | | 0.0 | | (0.6) | | | |
| SPRAVATO | | 689 | | 374 | | | | 84.1 | | | 84.0 | | | 0.1 | | | |
Other Neuroscience(2) | | 1,553 | | 1,734 | | | | (10.4) | | | (5.9) | | | (4.5) | | | |
| Total Oncology | | 17,661 | | 15,983 | | | | 10.5 | | | 11.2 | | | (0.7) | | | |
| CARVYKTI | | 500 | | 133 | | | | * | | * | | * | | |
| DARZALEX | | 9,744 | | 7,977 | | | | 22.2 | | | 22.9 | | | (0.7) | | | |
| ERLEADA | | 2,387 | | 1,881 | | | | 26.9 | | | 27.5 | | | (0.6) | | | |
| IMBRUVICA | | 3,264 | | 3,784 | | | | (13.7) | | | (13.2) | | | (0.5) | | | |
| ZYTIGA /abiraterone acetate | | 887 | | 1,770 | | | | (49.9) | | | (48.4) | | | (1.5) | | | |
| Other Oncology | | 879 | | 438 | | | | * | | * | | * | | |
| Total Pulmonary Hypertension | | 3,815 | | 3,417 | | | | 11.6 | | | 12.9 | | | (1.3) | | | |
| OPSUMIT | | 1,973 | | 1,783 | | | | 10.6 | | | 11.6 | | | (1.0) | | | |
| UPTRAVI | | 1,582 | | 1,322 | | | | 19.7 | | | 20.4 | | | (0.7) | | | |
| Other Pulmonary Hypertension | | 260 | | 313 | | | | (16.7) | | | (12.0) | | | (4.7) | | | |
| Total Cardiovascular / Metabolism / Other | | 3,671 | | 3,887 | | | | (5.5) | | | (5.5) | | | 0.0 | | |
| XARELTO | | 2,365 | | 2,473 | | | | (4.4) | | | (4.4) | | | — | | | |
Other(3) | | 1,306 | | 1,414 | | | | (7.6) | | | (7.4) | | | (0.2) | | | |
| Total Innovative Medicine Sales | | $54,759 | | 52,563 | | | | 4.2 | % | | 4.8 | % | | (0.6) | % | | |
Pharmaceutical Segment
Pharmaceutical segment sales in 2017 were $36.3 billion, an increase of 8.3% from 2016, which included operational growth of 8.0% and a positive currency impact of 0.3%. U.S. sales were $21.5 billion, an increase of 6.7%. International sales were $14.8 billion, an increase of 10.8%, which included 10.1% operational growth and a positive currency impact of 0.7%. In 2017, acquisitions and divestitures had a net positive impact of 3.8% on the operational sales growth of the worldwide Pharmaceutical segment. Adjustments to previous reserve estimates, as compared to the prior year, negatively impacted the reported Pharmaceutical segment operational growth by approximately 1.8%, primarily in the Immunology and Cardiovascular/Metabolism/Other therapeutic areas.
Major Pharmaceutical Therapeutic Area Sales:* |
| | | | | | | | | | | | | | | | |
| | | | | | | | | % Change |
| (Dollars in Millions) | | 2017 | | 2016 | | 2015 | | ’17 vs. ’16 | | ’16 vs. ’15 |
| Total Immunology | | $ | 12,244 |
| | 11,968 |
| | 10,402 |
| | 2.3 | % | | 15.1 |
|
REMICADE® | | 6,315 |
| | 6,966 |
| | 6,561 |
| | (9.3 | ) | | 6.2 |
|
SIMPONI®/SIMPONI ARIA® | | 1,833 |
| | 1,745 |
| | 1,328 |
| | 5.0 |
| | 31.4 |
|
STELARA® | | 4,011 |
| | 3,232 |
| | 2,474 |
| | 24.1 |
| | 30.6 |
|
| Other Immunology | | 85 |
| | 25 |
| | 39 |
| | ** |
| | (35.9 | ) |
| Total Infectious Diseases | | 3,154 |
| | 3,208 |
| | 3,656 |
| | (1.7 | ) | | (12.3 | ) |
EDURANT®/rilpivirine | | 714 |
| | 573 |
| | 410 |
| | 24.6 |
| | 39.8 |
|
PREZISTA®/ PREZCOBIX®/REZOLSTA®/SYMTUZA® | | 1,821 |
| | 1,851 |
| | 1,810 |
| | (1.6 | ) | | 2.3 |
|
| Other Infectious Diseases | | 619 |
| | 784 |
| | 1,436 |
| | (21.0 | ) | | (45.4 | ) |
| Total Neuroscience | | 5,986 |
| | 6,085 |
| | 6,259 |
| | (1.6 | ) | | (2.8 | ) |
CONCERTA®/methylphenidate | | 791 |
| | 863 |
| | 821 |
| | (8.3 | ) | | 5.1 |
|
INVEGA SUSTENNA®/XEPLION®/TRINZA®/TREVICTA® | | 2,569 |
| | 2,214 |
| | 1,830 |
| | 16.0 |
| | 21.0 |
|
RISPERDAL CONSTA® | | 805 |
| | 893 |
| | 970 |
| | (9.9 | ) | | (7.9 | ) |
| Other Neuroscience | | 1,821 |
| | 2,115 |
| | 2,638 |
| | (13.9 | ) | | (19.8 | ) |
| Total Oncology | | 7,258 |
| | 5,807 |
| | 4,695 |
| | 25.0 |
| | 23.7 |
|
DARZALEX® | | 1,242 |
| | 572 |
| | 20 |
| | ** |
| | ** |
|
IMBRUVICA® | | 1,893 |
| | 1,251 |
| | 689 |
| | 51.3 |
| | 81.6 |
|
VELCADE® | | 1,114 |
| | 1,224 |
| | 1,333 |
| | (9.0 | ) | | (8.2 | ) |
ZYTIGA® | | 2,505 |
| | 2,260 |
| | 2,231 |
| | 10.8 |
| | 1.3 |
|
| Other Oncology | | 504 |
| | 500 |
| | 422 |
| | 0.8 |
| | 18.5 |
|
| Pulmonary Hypertension | | 1,327 |
| | — |
| | — |
| | *** |
| | *** |
|
OPSUMIT® | | 573 |
| | — |
| | — |
| | *** |
| | *** |
|
TRACLEER® | | 403 |
| | — |
| | — |
| | *** |
| | *** |
|
UPTRAVI® | | 263 |
| | — |
| | — |
| | *** |
| | *** |
|
| Other | | 88 |
| | — |
| | — |
| | *** |
| | *** |
|
| Cardiovascular / Metabolism / Other | | 6,287 |
| | 6,396 |
| | 6,418 |
| | (1.7 | ) | | (0.3 | ) |
XARELTO® | | 2,500 |
| | 2,288 |
| | 1,868 |
| | 9.3 |
| | 22.5 |
|
INVOKANA®/ INVOKAMET® | | 1,111 |
| | 1,407 |
| | 1,308 |
| | (21.0 | ) | | 7.6 |
|
PROCRIT®/EPREX® | | 972 |
| | 1,105 |
| | 1,068 |
| | (12.0 | ) | | 3.5 |
|
| Other | | 1,704 |
| | 1,596 |
| | 2,174 |
| | 6.8 |
| | (26.6 | ) |
| Total Pharmaceutical Sales | | $ | 36,256 |
| | 33,464 |
| | 31,430 |
| | 8.3 | % | | 6.5 |
|
* Prior year amounts have been reclassified to conform to current year presentation.
** Percentage greater than 100% or not meaningful
***Products acquired from Actelion on June 16, 2017(1)Previously referred to as Pharmaceutical
(2)Inclusive of RISPERDAL CONSTA which was previously disclosed separately
(3)Inclusive of INVOKANA which was previously disclosed separately
Immunology products achieved sales of $12.2$18.1 billion in 2017,2023, representing an increase of 2.3%6.6% as compared to the prior year. Increased sales of STELARA (ustekinumab) were primarily driven by patient mix, market growth, and continued strength in Inflammatory Bowel Disease. Growth of TREMFYA(guselkumab) was due to market growth, continued strength in PsO/PsA (Psoriasis and Psoriatic Arthritis) and patient mix. Additionally, SIMPONI/SIMPONI ARIA growth was driven by strong uptake of STELARA® (ustekinumab), the launch of TREMFYA® (guselkumab) and sales growth of SIMPONI®/SIMPONI ARIA® (golimumab) outside the U.S. Lower sales of REMICADE® (infliximab) were due to increased discounts/rebates and biosimilar competition.
The patents for REMICADE® (infliximab)in certain countries in Europe expired in February 2015. Biosimilar versions of REMICADE® have been introduced in the United States and certain markets outside the United States resulting in a reduction in sales of REMICADE® in those markets. Additional biosimilar competition will likely result in a further reduction in REMICADE® sales in markets outside the United States. In the United States, a biosimilar version of REMICADE® was introduced in 2016, and additional competitors continue to enter the market. Continued infliximab biosimilar competition in the U.S. market will result in a further reduction in U.S. sales of REMICADE®.REMICADE.
Sales of STELARA in the United States were approximately $7.0 billion in fiscal 2023. Third parties have filed abbreviated Biologics License Applications with the FDA seeking approval to market biosimilar versions of STELARA. The Company continues to assert REMICADE® related patent rights. See Note 21 tohas settled certain litigation under the Consolidated Financial Statements forBiosimilar Price Competition and Innovation Act of 2009. As a descriptionresult of legal matters regardingthese settlements and other agreements with separate third parties, the REMICADE® patents.Company does not anticipate the launch of a biosimilar version of STELARA until January 1, 2025 in the United States.
Infectious disease products sales were $3.2$4.4 billion in 2023, a decline of 1.7% from 2016. Lower sales18.9% as compared to the prior year primarily driven by a decline in COVID-19 vaccine revenue and loss of OLYSIO® (simeprevir), vaccines andexclusivity of PREZISTA® (darunavir/cobicistat) were partially offset by sales growth of EDURANT®/rilpivirine, PREZCOBIX®/REZOLSTA® and the launch of SYMTUZA®.
Neuroscience products sales were $6.0 billion, a decrease of 1.6% from 2016. Lower sales of RISPERDAL CONSTA® (risperidone) and CONCERTA®/methylphenidate as well as the impact of divestitures were partially offset by strong sales of INVEGA SUSTENNA®/XEPLION®/ TRINZA®/TREVICTA®(paliperidone palmitate) long-acting injectables.
Oncology products achieved sales of $7.3$7.1 billion in 2017,2023, representing an increase of 25.0%3.6% as compared to the prior year. ContributorsThe growth of SPRAVATO (esketamine) was driven by ongoing launches as well as increased physician confidence and patient demand. Growth was partially offset by declines in RISPERDAL/RISPERDAL CONSTA and the paliperidone long-acting injectables outside the U.S. due to the growthXEPLION loss of exclusivity in the European Union.
Oncology products were strongachieved sales of $17.7 billion in 2023, representing an increase of 10.5% as compared to the prior year. Sales of DARZALEX® (daratumumab) and IMBRUVICA® (ibrutinib)were driven by continued share gains in all regions and market growth. Growth of ERLEADA (apalutamide) was due to continued share gains and market growth and salesin Metastatic Castration Resistant Prostate Cancer. Sales of ZYTIGA® (abiraterone acetate)CARVYKTI (ciltacabtagene autoleucel) were driven by market growth. Several generic companies are challenging the remaining patent for ZYTIGA®ongoing launch, share gains and capacity improvement. Additionally, sales from the launch of TECVAYLI (teclistamab-cqyv) and TALVEY (talquetamab-tgvs), included in the USPTO and in the United States District Court for the District of New Jersey. The Company is appealing a decision by the USPTO invalidating this patent, and the parties are awaiting a decision on a motion for summary judgment of non-infringement filed by the generic companies. In the event that the rulings are unfavorableOther Oncology, contributed to the Company, a generic launch is expectedgrowth. Growth was partially offset by ZYTIGA (abiraterone acetate) due to follow. If there is a launchloss of a generic version of ZYTIGA® following FDA approval, it will result in a reduction in U.S. sales,exclusivity and such reduction could occur in a short period of time. In 2017, the Company reported U.S. sales of $1.2 billion for ZYTIGA®. See Note 21IMBRUVICA (ibrutinib) due to the Consolidated Financial Statements for a description of legal matters regarding ZYTIGA®.global competitive pressures.
Pulmonary Hypertension is a new therapeutic area which was established with the acquisitionproducts sales were $3.8 billion, representing an increase of Actelion Ltd on June 16, 2017. See Note 2011.6% as compared to the Consolidated Financial Statements for additional details regarding the acquisition.prior year. Sales growth was due to favorable patient mix, share gains and market growth from UPTRAVI (selexipag) and OPSUMIT (macitentan) partially offset by declines in Other Pulmonary Hypertension.
Cardiovascular/Metabolism/Other products sales were $6.3$3.7 billion, a decline of 1.7%5.5% as compared to the prior year attributableyear. The decline of XARELTO (rivaroxaban) sales was primarily driven by unfavorable patient mix and access changes.
The Company maintains a policy that no end customer will be permitted direct delivery of product to lower salesa location other than the billing location. This policy impacts contract pharmacy transactions involving non-grantee 340B covered entities for most of INVOKANA®/INVOKAMET® (canagliflozin) in the U.S. primarily dueCompany’s drugs, subject to an increase in pricemultiple exceptions. Both grantee and non-grantee covered entities can maintain certain contract pharmacy arrangements under policy exceptions. The Company has been and will continue to offer 340B discounts to covered entities on all of its covered outpatient drugs, and it believes its policy will improve its ability to identify inappropriate duplicate discounts and market share decline drivendiversion prohibited by competitive pressure.the 340B statute. The 340B Drug Pricing Program is a U.S. federal government program requiring drug manufacturers to provide significant discounts on covered outpatient drugs to covered entities. This was partially offset bypolicy had discount implications which positively impacted sales growth of XARELTO®(rivaroxaban) due to increased market growth and market share, as well as sales of non-PAH (pulmonary arterial hypertension) products from the Actelion acquisition.
customers in 2023.
During 2017,2023, the Company advanced its pipeline with several regulatory submissions and approvals for new drugs and additional indications for existing drugs as follows:
| | | | | | | | | | | | | | | | | |
Product Name
(Chemical Name) | Indication | US
Approval | EU
Approval | US
Filing | EU
Filing |
| AKEEGA (Niraparib and Abiraterone Acetate) | First-And-Only Dual Action Tablet for the Treatment of Patients with BRCA-Positive Metastatic Castration-Resistant Prostate Cancer (MAGNITUDE) | • | • | | |
| BALVERSA (erdafitinib) | Treatment of Patients with Locally Advanced or Metastatic Urothelial Carcinoma and Selected Fibroblast Growth Factor Receptor Gene Alterations (THOR) | | | • | • |
| CARVYKTI (ciltacabtagene autoleucel) | Treatment for Relapsed and Refactor multiple myeloma with 1-3 PL (CARTITUDE-4) | | | • | • |
| EDURANT (rilpivirine) | Treatment for pediatric patients (2-12 years old) with HIV | | | • | • |
ERLEADA
(apalutamide) | Tablet reduction | • | • | | |
| OPSUMIT (macitentan) | Treatment for pediatric pulmonary arterial hypertension | | | | • |
| OPSYNVI (mecitentan/tadalafil STCT) | Treatment for pulmonary arterial hypertension | | | • | • |
| RYBREVANT (amivantamab) | In Combination with Chemotherapy for the First-Line Treatment of Adult Patients with Advanced Non-Small Cell Lung Cancer with Activating EGFR Exon 20 Insertion Mutations (PAPILLON) | | | • | • |
| RYBREVANT / lazertinib | Treatment for Non-Small Cell Lung Cancer 2L (MARIPOSA) | | | • | • |
| RYBREVANT / lazertinib | Treatment for Non-Small Cell Lung Cancer 2L (MARIPOSA-2) | | | • | • |
| TECVAYLI (teclistamab) | Treatment of Patients with Relapsed Refractory Multiple Myeloma Biweekly Dosing | | • | | |
| TALVEY (talquetamab) | Treatment of Patients with Relapsed and Refractory Multiple Myeloma | • | • | | |
| | | | | |
| 2023 Annual Report | | | | | |
Product Name (Chemical Name) | Indication | US Approv | EU Approv | US Filing | EU Filing |
apalutamide | An oral androgen receptor inhibitor for men with non-metastatic castration-resistant prostate cancer | | | ü | |
DARZALEX® (daratumumab)
| In combination with lenalidomide and dexamethasone, or bortezomib and dexamethasone, for the treatment of patients with multiple myeloma who have received at least one prior therapy | | ü | | |
| In combination with pomalidomide and dexamethasone, or bortezomib and dexamethasone, for the treatment of patients with multiple myeloma who have received at least two prior therapies | ü | | | |
| Frontline multiple myeloma transplant ineligible patients in combination with bortezomib, melphalan, and prednisone | | | ü | ü |
IMBRUVICA® (ibrutinib)
| Treatment for adult patients with chronic graft-versus-host-disease after failure of one or more lines of systemic therapy | ü | | | |
| Marginal zone lymphoma | ü | | | |
INVOKANA® (canagliflozin)
| Reduce the risk of death in type 2 diabetes with established, or risk for, cardiovascular disease. (CANVAS/CANVAS-R ) | | | ü | ü |
JULUCA® (rilpivirine and dolutegravir)
| Single-tablet, two-drug regimen of dolutegravir and rilpivirine for the maintenance treatment of HIV-1 infection | ü | | | ü |
SIMPONI ARIA® (golimumab)
| Treatment of adults living with active psoriatic arthritis and the treatment of adults living with active ankylosing spondylitis | ü | | | |
STELARA® (ustekinumab)
| Treatment of adolescents (12 to 17 years of age) with moderate to severe plaque psoriasis | ü | | | |
SYMTUZA® (darunavir/cobicistat/ emtricitabine/tenofovir alafenamide)
| Single tablet regimen for HIV in treatment naïve patients and treatment experienced patients | | ü | ü | |
TREMFYA® (guselkumab)
| Treatment of adults living with moderate to severe plaque psoriasis | ü | ü | | |
XARELTO® (rivaroxaban)
| A 10 mg once-daily dose for reducing the continued risk for recurrent venous thromboembolism after completing at least six months of initial anticoagulation therapy | ü | | | |
| For two new vascular indications: reducing the risk of major cardiovascular events and reducing the risk of acute limb ischemia in patients with PAD | | | ü | |
ZYTIGA® (abiraterone acetate)
| Prostate Cancer Newly Diagnosed Hormone Naïve Metastatic | | ü | ü | 27 |
PharmaceuticalMedTech segment
The MedTech segment sales in 20162023 were $33.5$30.4 billion, an increase of 6.5%10.8% from 2015,2022, which included operational growth of 7.4% partially offset by12.4% and a negative currency impact of 0.9%1.6%. U.S. sales were $20.1$15.3 billion, an increase of 9.8%. International sales were $13.3 billion, an increase of 1.8%, which included 4.0% operational growth partially offset by a negative currency impact of 2.2%. In 2016, acquisitions, divestitures and competitive products to the Company's Hepatitis C products, OLYSIO®/SOVRIAD® (simeprevir) and INCIVO® (telaprevir), had a negative impact of 2.5% on the operational growth of the Pharmaceutical segment. In 2016, the Pharmaceutical segment operational growth was negatively impacted by 1.5% due to additional shipping days in 2015. The Pharmaceutical segment operational growth for 2016, as compared to the prior year, was not impacted by adjustments to previous reserve estimates as both periods included approximately $0.5 billion of adjustments.
Medical Devices Segment
The Medical Devices segment sales in 2017 were $26.6 billion, an increase of 5.9% from 2016, which included an operational increase of 5.7% and a positive currency impact of 0.2%. U.S. sales were $12.8 billion, an increase of 4.5%14.2% as compared to the prior year. International sales were $13.8$15.1 billion, an increase of 7.1%7.7% as compared to the prior year, with anwhich included operational increasegrowth of 6.7%10.6% and a positivenegative currency impact of 0.4%2.9%. In 2017,2023, the net impact of acquisitions and divestitures had a net positive impact of 4.2% on the MedTech segment worldwide operational sales growth ofwas a positive 4.6% primarily related to the Medical Devices segment as compared to 2016.Abiomed acquisition.
Major Medical Devices Franchise Sales:MedTech franchise sales:
| | | | | | | | | | | % Change |
| (Dollars in Millions) | | 2017 | | 2016 | | 2015 | | ’17 vs. ’16 | | ’16 vs. ’15 |
| (Dollars in Millions) | |
| (Dollars in Millions) | |
| Surgery | |
| Surgery | |
| Surgery | | $ | 9,559 |
| | 9,296 |
| | 9,217 |
| | 2.8 | % | | 0.9 |
|
| Advanced | | 3,756 |
| | 3,517 |
| | 3,275 |
| | 6.8 |
| | 7.4 |
|
| Advanced | |
| Advanced | |
| General | | 4,463 |
| | 4,362 |
| | 4,482 |
| | 2.3 |
| | (2.7 | ) |
| Specialty | | 1,340 |
| | 1,417 |
| | 1,460 |
| | (5.4 | ) | | (2.9 | ) |
| General | |
| General | |
| Orthopaedics | |
| Orthopaedics | |
| Orthopaedics | | 9,258 |
| | 9,334 |
| | 9,262 |
| | (0.8 | ) | | 0.8 |
|
| Hips | | 1,394 |
| | 1,361 |
| | 1,332 |
| | 2.4 |
| | 2.2 |
|
| Hips | |
| Hips | |
| Knees | |
| Knees | |
| Knees | | 1,523 |
| | 1,524 |
| | 1,496 |
| | (0.1 | ) | | 1.9 |
|
| Trauma | | 2,616 |
| | 2,569 |
| | 2,528 |
| | 1.8 |
| | 1.6 |
|
| Spine & Other | | 3,725 |
| | 3,880 |
| | 3,906 |
| | (4.0 | ) | | (0.7 | ) |
| Vision Care | | 4,063 |
| | 2,785 |
| | 2,608 |
| | 45.9 |
| | 6.8 |
|
| Trauma | |
| Trauma | |
| Spine, Sports & Other | |
| Spine, Sports & Other | |
| Spine, Sports & Other | |
| Interventional Solutions | |
| Interventional Solutions | |
| Interventional Solutions | |
| Electrophysiology | |
| Electrophysiology | |
| Electrophysiology | |
| Abiomed | |
| Abiomed | |
| Abiomed | |
| Other Interventional Solutions | |
| Other Interventional Solutions | |
| Other Interventional Solutions | |
| Vision | |
| Vision | |
| Vision | |
| Contact Lenses/Other | |
| Contact Lenses/Other | |
| Contact Lenses/Other | | 3,036 |
| | 2,785 |
| | 2,608 |
| | 9.0 |
| | 6.8 |
|
| Surgical | | 1,027 |
| | — |
| | — |
| | * | | * |
| Cardiovascular | | 2,096 |
| | 1,849 |
| | 2,036 |
| | 13.4 |
| | (9.2 | ) |
| Diabetes Care | | 1,615 |
| | 1,789 |
| | 1,928 |
| | (9.7 | ) | | (7.2 | ) |
| Diagnostics | | 1 |
| | 66 |
| | 86 |
| | ** | | ** |
| Total Medical Devices Sales | | $ | 26,592 |
| | $ | 25,119 |
| | 25,137 |
| | 5.9 | % | | (0.1 | ) |
| Surgical | |
| Surgical | |
| | Total MedTech Sales | |
| | Total MedTech Sales | |
| | Total MedTech Sales | |
*Products acquired from Abbott Medical Optics (AMO) on February 27, 2017
** On June 30, 2014, the Company divested the Ortho-Clinical Diagnostics business (the Diagnostics Franchise)
Percentage greater than 100% or not meaningful
The Surgery franchise sales were $9.6$10.0 billion in 2017,2023, representing an increase of 2.8%3.6% from 2016. Growth2022. The growth in Advanced Surgery was primarily driven by endocutter, energy, includingBiosurgery global procedure growth and strength of the acquisitionportfolio as well as uptake of Megadyne Medical Products, Inc.,new products in Endocutters and biosurgery products. GrowthEnergy. The growth was partially offset by competitive pressures and volume-based procurement impacts in Endocutters and Energy. The growth in General Surgery was primarily driven by suturesincreased procedures coupled with technology penetration and salesbenefits from the acquisition of Torax Medical, Inc. The sales decline in Specialty Surgery was primarily due to lower sales of aesthetic, Advanced Sterilization and Sterilmed products.differentiated Wound Closure portfolio.
The Orthopaedics franchise sales were $9.3$8.9 billion in 2017, a decrease2023, representing an increase of 0.8%4.1% from 2016.2022. The declinegrowth in Spine & Otherhips reflects global procedure growth and continued strength of the portfolio partially offset by volume-based procurement impacts and Russia sanctions. The growth in knees was primarily duedriven by procedures, benefits from recent product additions to the Codman Neurosurgery divestiture, share loss in U.S. Spine, pricingATTUNE portfolio and competitive pressures.pull through related to the VELYS Robotic assisted solution. This was partially offset by salesstocking dynamics, primarily outside the U.S. The growth in Trauma was driven by global procedures and the adoption of trauma, sports medicinerecently launched products. This was partially offset by volume-based procurement impacts. The growth in Spine, Sports & Other was primarily driven by Digital Solutions, Shoulders, Sports and Craniomaxillofacial products partially offset by Russia sanctions and supply constraints, primarily outside the U.S. hips.
The Vision CareInterventional Solutions franchise achieved sales of $4.1$6.4 billion in 2017,2023, representing an increase of 45.9%47.7% from 2016. Growth was driven by2022, which includes sales from the acquisition of AMO, with the majority of AMO sales in the surgical category, andAbiomed acquired on December 22, 2022. Electrophysiology grew by double digits due to global procedure growth, new product launchesperformance and commercial execution. This was partially offset by the impacts of volume-based procurement in China. Abiomed sales reflect the contact lenses category.strength of all commercialized regions and continued adoption of Impella 5.5 and Impella RP.
The CardiovascularVision franchise achieved sales were $2.1of $5.1 billion in 2023, representing an increase of 13.4%4.6% from 2016. Strong2022. The Contact Lenses/Other growth was primarily driven by the continued strong performance in the electrophysiology businessACUVUE OASYS 1-Day family including recent launches and commercial execution. This was drivenpartially offset by market growthimpacts of U.S. stocking dynamics, Russia sanctions, impacts from strategic portfolio decisions and continued uptake of the THERMOCOOL SMARTTOUCH® Contact ForceSensing Catheter.
supply challenges. The Diabetes Care franchise sales were $1.6 billion, a decrease of 9.7% from 2016. The decline was primarily due to price declines and competitive pressures. Additionally, in the fourth quarter of 2017, the Company announced its decision to exit the Animas insulin pump business. Animas has selected Medtronic plc to facilitate a seamless transition for patients, caregivers and healthcare providers. The Company is continuing to evaluate potential strategic options for LifeScan, Inc. and determine the best opportunity to drive future growth and maximize shareholder value.
The Medical Devices segment sales in 2016 were $25.1 billion, a decrease of 0.1% from 2015, which included an operational increase of 0.9% and a negative currency impact of 1.0%. U.S. sales were $12.3 billion, an increase of 1.1% as compared to the prior year. International sales were $12.9 billion, a decrease of 1.2% as compared to the prior year, with an operational increase of 0.7% and a negative currency impact of 1.9%. In 2016, acquisitions and divestitures had a negative
impact of 1.8% on the worldwide operational growth of the Medical Devices segment as compared to 2015. In 2016, the Medical Devices segmentSurgical operational growth was negatively impactedprimarily driven by 0.9% due to additional shipping days in 2015.cataract procedure growth, continued strength of recent innovations and reduction of prior year stocking outside the U.S. This was partially offset by softer Refractive and premium IOL markets and Russia sanctions.
Analysis of Consolidated Earnings Before Provisionconsolidated earnings before provision for Taxestaxes on Incomeincome
Consolidated earnings before provision for taxes on income decreased to $17.7 billion in 2017, as compared to $19.8 billion in 2016, a decrease of 10.8%. The decrease was primarily attributable to higher amortization expense and other charges related to recent acquisitions, higher selling, marketing and administrative costs due to investments in new product launches and higher research and development costs due to general portfolio progression and collaborations.
Consolidated earnings before provision for taxes on income increased to $19.8 billion in 2016, as compared to $19.2 billion in 2015, an increase of 3.2%. The increase was primarily attributable to higher sales volume, favorable mix in the business and lower selling, marketing and administrative costs. This was partially offset by higher net litigation expense of $0.7$15.1 billion and a higher restructuring charge of $0.1$19.4 billion as compared to 2015. Additionally,for the fiscal year 2015 included higher gains on the sale of assets/businesses as compared to 2016.
years 2023 and 2022, respectively. As a percent to sales, consolidated earnings before provision for taxes on income was 17.7% and 24.2%, in 2017 was 23.1% versus 27.5%2023 and 2022, respectively.
Earnings before provision for taxes
(Dollars in 2016.billions. Percentages in chart are as a percent to total sales)
Cost of Products Sold and Selling, Marketing and Administrative Expenses: Cost of products sold and selling, marketing and administrative expensesexpenses:
Selling, marketing & administrative
(Dollars in billions. Percentages in chart are as a percent to total sales)
Cost of products sold:
Cost of products sold increased as a percent to sales
were as follows:driven by: |
| | | | | | | | | |
| % of Sales | | 2017 | | 2016 | | 2015 |
| Cost of products sold | | 33.2 | % | | 30.2 | % | | 30.7 |
|
| Percent point increase/(decrease) over the prior year | | 3.0 |
| | (0.5 | ) | | 0.1 |
|
| Selling, marketing and administrative expenses | | 28.0 | % | | 27.7 | % | | 30.3 |
|
| Percent point increase/(decrease) over the prior year | | 0.3 |
| | (2.6 | ) | | 0.8 |
|
partially offset by
In 2017, cost of products sold as a percent to sales increased to 33.2% from 30.2% as compared to•Favorable patient mix and lower one-time COVID-19 vaccine manufacturing related exit costs in 2023 in the same period a year ago. Innovative Medicine business
The unfavorable increase was primarily driven by $2.3 billion of higher amortization expense and charges for inventory step-up related to the recent acquisitions, primarily Actelion. Intangibleintangible asset amortization expense of $3.0 billion was included in cost of products sold was $4.5 billion and $3.9 billion for 2017 as compared to $1.2 billion in 2016. There was an increase in the percent to sales of selling, marketingfiscal years 2023 and administrative expenses in 2017 as compared to the prior year, primarily due to investments in new product launches partially offset by favorable mix.2022, respectively.
In 2016, cost of products sold
Selling, Marketing and Administrative expense:
Selling, Marketing and Administrative Expenses decreased slightly as a percent to sales decreased to 30.2% from 30.7% as compared todriven by:
•Leveraging in Selling and Marketing expenses both the same period a year ago. Favorable mix in the businessInnovative Medicine and cost improvement programs was MedTech businesses
partially offset by the unfavorable impact of transactional currency. Intangible asset amortization expense of $1.2 billion was included
•An increase in cost of products sold for 2016 and 2015. There was a decrease in the percent to sales of selling, marketing and administrative expenses in 2016 compared to the prior year, primarily due to cost management in all the segments and favorable mix.costs
Research and Development Expense:
Research and development expense by segment of business was as follows: |
| | | | | | | | | | | | | | | | | | | | |
| | | 2017 | | 2016 | | 2015 |
| (Dollars in Millions) | | Amount | | % of Sales* | | Amount | | % of Sales* | | Amount | | % of Sales* |
| Consumer | | $ | 584 |
| | 4.3 | % | | $ | 580 |
| | 4.4 | % | | 625 |
| | 4.6 |
|
| Pharmaceutical | | 8,360 |
| | 23.1 |
| | 6,967 |
| | 20.8 |
| | 6,821 |
| | 21.7 |
|
| Medical Devices | | 1,610 |
| | 6.1 |
| | 1,548 |
| | 6.2 |
| | 1,600 |
| | 6.4 |
|
| Total research and development expense | | $ | 10,554 |
| | 13.8 | % | | $ | 9,095 |
| | 12.7 | % | | 9,046 |
| | 12.9 |
|
| Percent increase/(decrease) over the prior year | | 16.0 | % | | |
| | 0.5 | % | | |
| | 6.5 |
| | |
|
|
| |
* | As a percent to segment sales |
| | | | | | | | | | | | | | | | | | | | | |
| | 2023 | | 2022 | | |
| (Dollars in Millions) | Amount | % of Sales* | | Amount | % of Sales* | | | | |
| Innovative Medicine | $11,963 | | 21.8 | % | | $11,642 | | 22.1 | % | | | | |
| MedTech | 3,122 | | 10.3 | | | 2,493 | | 9.1 | | | | | |
| Total research and development expense | $15,085 | | 17.7 | % | | $14,135 | | 17.7 | % | | | | |
| Percent increase/(decrease) over the prior year | 6.7 | % | | | (1.0 | %) | | | | | |
| *As a percent to segment sales | | | | | | | | | |
Research and development activities represent a significant part of the Company's business. These expenditures relate to the processes of discovering, testing and developing new products, upfront payments and developmental milestones, improving existing products, as well as ensuring product efficacy and regulatory compliance prior to launch. The Company remains committed to investing in research and development with the aim of delivering high quality and innovative products. In 2017, worldwide costs of research
Research and development activities increased by 16.0% compared to 2016. The increaseDevelopment was flat as a percent ofto sales was primarily driven by:
•Higher milestone payments in the pharmaceutical segment due to general portfolio progression as well as collaborative agreements entered into with Idorsia Ltd. and Legend Biotech. In 2016, worldwide costs ofInnovative Medicine business
•Acquired in-process research and& development activities increased by 0.5% compared to
2015 but decreased as a percent of sales. The decrease as a percent of sales was attributable to higher overall salesasset from the Laminar acquisition in the Pharmaceutical segment. The increased dollar spendMedTech business in the Pharmaceutical segment was for investment spending to advancefiscal year 2023
offset by
•Portfolio prioritization in the pipeline.Innovative Medicine business
In-Process Research and Development Impairments (IPR&D): In 2017,the fiscal year 2023, the Company recorded a charge of approximately $0.3 billion which included $0.2 billion related to market dynamics associated with a non-strategic asset (M710) acquired as part of the acquisition of Momenta Pharmaceuticals in 2020, In the fiscal year 2022, the Company recorded an IPR&Dintangible asset impairment charge of $0.4approximately $0.8 billion primarilyrelated to an in-process research and development asset, bermekimab (JnJ-77474462), an investigational drug for the discontinuationtreatment of certain development projects related to NoviraAtopic Dermatitis (AD) and Hidradenitis Suppurativa (HS). Additional information regarding efficacy of the AD indication and HS indication became available which was acquired in 2015. The product development was canceled due to safety concerns. In 2016,led the Company recorded an IPR&D chargeto the decision to terminate the development of $29 millionbermekimab for both AD and HS. The Company acquired all rights to bermekimab from XBiotech, Inc. in the discontinuation of a development program related to Crucell. In 2015, the Company recorded an IPR&D charge of $0.2 billion primarily for the discontinuation of certain development projects related to Covagen.fiscal year 2020.
Other (Income) Expense, Net: Other (income) expense, net is the account where the Company records gains and losses related to the sale and write-down of certain investments in equity securities held by Johnson & Johnson Innovation - JJDC, Inc. (JJDC), changes in the fair value of securities, investment (income)/loss related to employee benefit programs, gains and losses on divestitures, certain transactional currency gains and losses, acquisition-relatedacquisition and divestiture related costs, litigation accruals and settlements, as well as royalty income. The change in other
Other (income) expense, net for the fiscal year 20172023 was a favorable change of $0.3 billion due to higher gains of $0.7 billion on the sale of assets/businesses, primarily the Codman Neurosurgery and COMPEED® divestitures, a gain of $0.2 billion related to monetization of future royalty receivables and a higher gain of $0.3 billion related to the sale of certain investments in equity securities as compared to the prior year. This was partially offsetunfavorable by higher litigation expense of $0.4 billion, $0.3 billion of acquisition costs related to Actelion and AMO, an asset impairment charge of $0.2 billion primarily related to the insulin pump business and a higher restructuring related charge of $0.2 billion as compared to the fiscal year 2016.
The change in other (income) expense, net for the fiscal year 2016 was an unfavorable change of $2.5$5.8 billion as compared to the prior year primarily due to higher gains on the salefollowing:
| | | | | | | | | | | |
| (Dollars in Billions)(Income)/Expense | 2023 | 2022 | Change |
Litigation related(1) | $6.9 | 0.9 | 6.0 |
Changes in the fair value of securities(2) | 0.6 | 0.7 | (0.1) |
| COVID-19 vaccine manufacturing exit related costs | 0.4 | 0.7 | (0.3) |
Acquisition, Integration and Divestiture related(3) | 0.3 | 0.2 | 0.1 |
| Employee benefit plan related | (1.4) | (1.2) | (0.2) |
| Other | (0.2) | (0.5) | 0.3 |
| Total Other (Income) Expense, Net | $6.6 | 0.8 | 5.8 |
(1)2023 was primarily related to the approximately $7.0 billion charge for talc (See Note 19 to the Consolidated Financial Statements for more details) and favorable intellectual property related litigation settlements of assets/businessesapproximately $0.3 billion. 2022 was primarily related to pelvic mesh.
(2)The fiscal 2023 includes $0.4 billion related to the unfavorable change in the fair value of the remaining stake in Kenvue and $0.4 billion related to the partial impairment of Idorsia convertible debt and the change in the fair value of the Idorsia equity securities held.
(3)2023 primarily related to the impairment of Ponvory and one-time integration costs related to the acquisition of Abiomed. 2022 was primarily costs related to the acquisition of Abiomed.
Interest (Income) Expense: Interest income in the fiscal year 2015 as compared to 2016. The fiscal year of 2016 included gains of $0.6 billion from the divestitures of the controlled substance raw material and API business, certain anesthetic products in Europe and certain non-strategic Consumer brands versus gains of $2.6 billion recorded in 2015 primarily from the divestiture of the Cordis business, the U.S. divestiture of NUCYNTA® andthe SPLENDA® brand. Additionally, the fiscal year of 2016 included higher litigation expense of $0.72023 was $1.3 billion as compared to 2015. This was partially offset by a $0.3interest income of $0.5 billion intangible asset write-down related to Acclarent included in the fiscal year 2015.
2022 primarily due to higher rates of interest earned on cash balances. Interest (Income) Expense: Interest incomeexpense in 2017 increased slightlythe fiscal year 2023 was $0.8 billion as compared to 2016interest expense of $0.3 billion in the fiscal year 2022 primarily due to higher average interest rates partially offset by lower cash, cash equivalents and marketable securities balances during the period.on debt balances. Cash, cash equivalents and marketable securities totaled $18.3$22.9 billion at the end of 2017,2023, and averaged $30.1$22.6 billion as compared to the $40.1 billion average cash balance in 2016. The decrease in the balance of cash, cash equivalents and marketable securities was due to the usetotal of cash for general corporate purposes including acquisitions, primarily the Actelion acquisition for $29.6$22.3 billion net of cash acquired.
Interest expenseand $26.9 billion average balance in 2017 was higher as compared to 2016. The average debt balance was $30.9 billion in 2017 versus $23.5 billion in 2016.2022. The total debt balance at the end of 20172023 was $34.6$29.3 billion with an average debt balance of $34.5 billion as compared to $27.1$39.6 billion at the end of 2016. The higher2022 and an average debt balance of approximately $7.5 billion was primarily due to increased borrowings.$36.7 billion. The Company increased borrowings in February and November of 2017, capitalizing on favorable terms in the capital markets. The proceeds of the borrowings were used for general corporate purposes, including the completion of the stock repurchase program.
Interest income in 2016 increased by $0.2 billion as compared to 2015 due to a higherlower average balance of cash, cash equivalents and marketable securities and higher interest rates. Cash, cash equivalents and marketable securities totaled $41.9 billion at the end of 2016, and averaged $40.1 billion as comparedwas primarily due to the $35.7 billion average cash balanceacquisition of Abiomed in 2015.
Interest expense in 2016 was higher as compared to 2015.late December of 2022. The lower average debt balance was $23.5 billion in 2016 versus $19.3 billion in 2015. The total debt balance at the end of 2016 was $27.1 billion as compared to $19.9 billion at the end of 2015. The higher debt balance of approximately $7.2 billion was primarily due to increased borrowings in February and Maythe repayment of 2016. The Company increased borrowings, capitalizing on favorable terms in the capital markets. The proceeds of the borrowings were used for general corporate purposes, primarily the stock repurchase program.
commercial paper.
Income Before Taxbefore tax by Segmentsegment
Income (loss) before tax by segment of business were as follows: | | | | | | | | | | | | | | | | | | | | | | | | | | |
| | Income Before Tax | | Segment Sales | | Percent of Segment Sales |
| (Dollars in Millions) | 2023 | 2022 | | 2023 | 2022 | | 2023 | 2022 |
| Innovative Medicine | $18,246 | 15,647 | | 54,759 | 52,563 | | 33.3 | % | 29.8 | |
| MedTech | 4,669 | 4,447 | | 30,400 | 27,427 | | 15.4 | | 16.2 | |
Segment earnings before tax(1) | 22,915 | 20,094 | | 85,159 | 79,990 | | 26.9 | | 25.1 | |
Less: Expenses not allocated to segments(2) | 7,853 | 735 | | | | | | |
| Worldwide income before tax | $15,062 | 19,359 | | 85,159 | 79,990 | | 17.7 | % | 24.2 | |
(1)See Note 17 to the Consolidated Financial Statements for more details.
(2)Amounts not allocated to segments include interest (income) expense and general corporate (income) expense. Fiscal 2023 includes an approximately $7.0 billion charge related to talc matters and the approximately $0.4 billion unfavorable change in the fair value of the retained stake in Kenvue.
|
| | | | | | | | | | | | | | | | | | | |
| | | Income Before Tax | | Segment Sales | | Percent of Segment Sales |
| (Dollars in Millions) | | 2017 | | 2016 | | 2017 | | 2016 | | 2017 | | 2016 |
| Consumer | | $ | 2,524 |
| | 2,441 |
| | $ | 13,602 |
| | 13,307 |
| | 18.6 | % | | 18.3 |
| Pharmaceutical | | 11,083 |
| | 12,827 |
| | 36,256 |
| | 33,464 |
| | 30.6 |
| | 38.3 |
| Medical Devices | | 5,392 |
| | 5,578 |
| | 26,592 |
| | 25,119 |
| | 20.3 |
| | 22.2 |
Total (1) | | 18,999 |
| | 20,846 |
| | 76,450 |
| | 71,890 |
| | 24.9 |
| | 29.0 |
Less: Expenses not allocated to segments (2) | | 1,326 |
| | 1,043 |
| | | | | | |
| | |
| Earnings before provision for taxes on income | | $ | 17,673 |
| | 19,803 |
| | $ | 76,450 |
| | 71,890 |
| | 23.1 | % | | 27.5 |
| | | | | |
(1)
2023 Annual Report | See Note 18 to the Consolidated Financial Statements for more details.31 |
| |
(2)
| Amounts not allocated to segments include interest (income) expense and general corporate (income) expense. |
Increase in 2017 was primarily due to higher interest expense of $0.2 billion on higher debt balance.
Innovative Medicine segment:
Consumer Segment:In 2017,2023, the ConsumerInnovative Medicine segment income before tax as a percent to sales was 18.6%,33.3% versus 18.3%29.8% in 2016.2022. The increase in the income before tax as a percent of sales was primarily driven by the following:
•Lower one-time COVID-19 Vaccine related exit costs of $0.7 billion in 20172023 versus $1.5 billion in 2022
•Lower In-process research & development impairments of $0.2 billion in 2023 versus $0.8 billion in 2022
•Unfavorable changes in the fair value of securities in 2023 of $0.4 billion as compared to 2016 was attributable to higher gains on divestitures, primarily the divestiture$0.7 billion in 2022
•Lower litigation related expense of COMPEED®$0.2 billion
•Leveraging in 2017. This was selling and marketing expenses
•R&D Portfolio prioritization
partially offset by higher selling, marketing and administrative expenses as compared to
•Restructuring charges of $0.5 billion in 2023 versus $0.1 billion in 2022
•Impairment of Ponvory in 2023
•Higher milestone payments in 2023
MedTech segment:
In 2023, the prior year due to increased advertising and promotional spending and slightly higher amortization expense in 2017 related to acquisitions. Additionally, the fiscal year 2016 was negatively impacted by operations in Venezuela.
In 2016, the ConsumerMedTech segment income before tax as a percent to sales was 18.3%,15.4% versus 13.2%16.2% in 2015, primarily driven by favorable selling, marketing and administrative expenses due to cost management and higher gross profit margins from cost improvement projects and favorable mix. This was partially offset by higher gains in 2015 related to divestitures, primarily the divestiture of the SPLENDA® brand. Additionally, operations in Venezuela negatively impacted the Consumer segment income before tax in 2016 as compared to 2015.
Pharmaceutical Segment: In 2017, the Pharmaceutical segment income before tax as a percent to sales was 30.6% versus 38.3% in 2016. The decrease in the income before tax as a percent of sales was primarily due to $2.3 billion of higher amortization expense and other costs related to the Actelion acquisition, higher research and development expense, a higher IPR&D charge of $0.4 billion related to Novira and lower gains on divestitures as compared to the prior year. Additionally, the fiscal year 2016 included a positive adjustment of $0.5 billion to previous reserve estimates. This was partially offset by a gain of $0.2 billion related to monetization of future royalty receivables, a higher gain of $0.2 billion related to the sale of certain investments in equity securities and favorable product mix in 2017.
In 2016, the Pharmaceutical segment income before tax as a percent to sales was 38.3% versus 37.3% in 2015. The increase in income before tax was primarily due tostrong sales volume growth and favorable selling, marketing and administrative expenses due to cost management. Additionally, the fiscal year 2015, had higher gains of $0.7 billion related to divestitures partially offset by a higher IPR&D charge of $0.2 billion as compared to 2016. The fiscal year of 2016 included the gains from the divestitures of the controlled substance raw material and API business and certain anesthetic products in Europe versus the gains recorded in 2015 from the U.S. divestiture of NUCYNTA®.
Medical Devices Segment: In 2017, the Medical Devices segment income before tax as a percent to sales was 20.3% versus 22.2% in 2016.2022. The decrease in the income before tax as a percent to sales was primarily due to $0.3 billion of higherdriven by the following:
•Higher amortization expense of $0.5 billion in 2023 related to Abiomed
•Expense of $0.4 billion for an acquired in process research and other development asset from the Laminar acquisition in 2023
•Commodity inflation in 2023
partially offset by
•Income from litigation settlements of $0.1 billion in 2023 versus expense of $0.6 billion in 2022
•Lower integration/acquisition costs related to AMO, $0.3 billion of higher litigation, an asset impairment chargeAbiomed of $0.2 billion primarily related to the insulin pump business, $0.1in 2023 versus $0.3 billion of higher restructuringin 2022
•Leveraging in selling and investmentsmarketing expenses in new product launches as compared to2023
Restructuring: In the fiscal year 2016.2023, the Company completed a prioritization of its research and development (R&D) investment within the Innovative Medicine segment to focus on the most promising medicines with the greatest benefit to patients. This was partially offset by $0.8 billion higher gains in 2017 related to divestitures, primarily the divestiture of Codman Neurosurgery.
In 2016, the Medical Devices segment income before tax as a percent to sales was 22.2% versus 27.2% in 2015. The decreaseresulted in the income before tax as a percent to sales wasexit of certain programs within therapeutic areas. The R&D program exits are primarily due to lower gainsin infectious diseases and vaccines including the discontinuation of $1.4 billion related to divestitures, higher litigation expense of $0.8 billionits respiratory syncytial virus (RSV) adult vaccine program, hepatitis and a higherHIV development. The pre-tax restructuring charge of $0.1approximately $0.5 billion as comparedin the fiscal year 2023, of which $449 million was recorded in Restructuring and $30 million was recorded in Cost of products sold on the Consolidated Statement of Earnings, included the termination of partnered and non-partnered program costs and asset impairments.
In the fiscal year 2023, the Company initiated a restructuring program of its Orthopaedics franchise within the MedTech segment to 2015. This was partially offsetstreamline operations by an intangible asset write-downexiting certain markets, product lines and distribution network arrangements. The pre-tax restructuring expense of $0.3 billion in the fiscal year 2023, of which $40 million was recorded in Restructuring and $279 million was recorded in Cost of products sold on the Consolidated Statement of Earnings, primarily included inventory and instrument charges related to Acclarent in 2015market and favorable selling, marketing and administrative expenses in 2016.product exits.
Restructuring:In the first quarter of 2016, the Company announced restructuring actions in its Medical Devices segment. The restructuring actions are expected to result in annualized pre-tax cost savings of $800 million to $1.0 billion, the majority of which is expected to be realized by the end of 2018. Approximately $500 million in savings were realized in 2017. The savings will provide the Company with added flexibility and resources to fund investment in new growth opportunities and innovative solutions for customers and patients. The Company estimates that, in connection with its plans, it will record pre-tax restructuring related charges of approximately $2.0 billion to $2.4 billion. In 2017,2022, the Company recorded a pre-tax charge of $760 million,$0.4 billion related to a restructuring program of which $88 million is includedits Global Supply Chain. The Global Supply Chain program was announced in costthe second quarter of products sold2018 and $363 million is includedwas completed in other (income) expense. In 2016, the Company recorded a pre-tax chargefiscal fourth quarter of $685 million, of which $45 million is included in cost of products sold and $149 million is included in other (income) expense. In 2015, the Company recorded a pre-tax charge of $590 million, of which $81 million was included in cost of products sold. Restructuring related charges of $2.0 billion have been recorded since the restructuring was announced. 2022.
See Note 2220 to the Consolidated Financial Statements for additional details related to the restructuring.restructuring programs.
Provision for Taxes on Income: The worldwide effective income tax rate from continuing operations was 92.6%11.5% in 2017, 16.5%2023 and 15.4% in 2016 and 19.7% in 2015. The 20172022.
On December 15, 2022, the European Union (EU) Member States formally adopted the EU’s Pillar Two Directive, which generally provides for a minimum effective tax rate increasedof 15%, as established by 76.1%the Organization for Economic Co-operation and Development (OECD) Pillar Two Framework that was supported by over 130 countries worldwide. As of December 31, 2023, several EU and non-EU countries have enacted Pillar 2 legislation with an initial effective date of January 1, 2024, with other aspects of the law effective in 2025 or later. The Company is estimating that as result of this legislation the 2024 effective tax rate will increase by approximately 1.5% or 150 basis points compared to 2016, primarily driven by the enactment of the Tax Cutsfiscal 2023. Further legislation, guidance and Jobs Act (TCJA)regulations that may be issued in the United States in December 2017. The enactment of the TCJA resulted in a provisional tax charge in the fourth quarter of 2017, of approximately $13.0 billion or approximately 73.3 percentage point increasefiscal 2024, as well as other business events, may impact this estimate.
For discussion related to the effective tax rate. Seefiscal 2023 provision for taxes refer to Note 8 to the Consolidated Financial Statements for additional details related to the TCJA.Statements.
The remainder of the increase in the tax rate for 2017 was related to the remeasurement of the Company’s deferred tax assets in Belgium, as a result of changes in the Belgian statutory corporate tax rate, enacted in December 2017, offset by a tax benefit for the closure of the Company’s Animas insulin pump business.
The government in Switzerland is currently considering tax reform legislation, which could have a material impact on the Company’s effective tax rate if enacted into law.
The decrease in the 2016 effective tax rate, as compared to 2015 was primarily attributable to the Company adopting a new accounting standard for the reporting of additional tax benefits on share-based compensation that vested or were exercised during the fiscal year. The remainder of the change in the effective tax rate was primarily related to the lower earnings before taxes in the United States and the settlement of several uncertain tax positions in 2016 versus 2015.
The decrease in the 2015 effective tax rate, as compared to 2014 was primarily attributable to the increases in taxable income in lower tax jurisdictions relative to higher tax jurisdictions and a tax benefit resulting from a restructuring of international affiliates.
Liquidity and Capital Resourcescapital resources
Liquidity & Cash Flowscash flows
Cash and cash equivalents were $17.8$21.9 billion at the end of 20172023 as compared to $19.0$14.1 billion at the end of 2016. 2022.
The primary sources and uses of cash that contributed to the $1.2$7.8 billion decrease were approximately $21.1 billion of cash generated from operating activities and $0.3 billion due to the effect on exchange rate changes on cash and cash equivalents offset by $14.9 billion net cash used by investing activities and $7.7 billion net cash used by financing activities. increase were:
| | | | | |
| (Dollars in billions) |
| $14.1 | Q4 2022 Cash and cash equivalents balance |
| 22.8 | cash generated from operating activities |
| 0.9 | net cash from investing activities |
| (15.8) | net cash used by financing activities |
| (0.1) | effect of exchange rate and rounding |
| $21.9 | Q4 2023 Cash and cash equivalents balance |
In addition, the Company had $0.5$1.1 billion in marketable securities at the end of 2017fiscal year 2023 and $22.9$9.4 billion at the end of 2016.fiscal year 2022. See Note 1 to the Consolidated Financial Statements for additional details on cash, cash equivalents and marketable securities.
Cash flow from operations of $21.1$22.8 billion was the result of:
| | | | | |
| (Dollars In billions) |
| $35.2 | Net Earnings |
| (14.9) | gain on the Kenvue separation, net gain on sale of assets/businesses and the deferred tax provision partially offset by non-cash expenses and other adjustments primarily for depreciation and amortization, stock-based compensation, asset write-downs and charge for purchase of in process research and development assets |
| 5.6 | an increase in current and non-current liabilities |
| (3.5) | an increase in other current and non-current assets |
| 2.3 | an increase in accounts payable and accrued liabilities |
| (1.9) | an increase in accounts receivable and inventories |
| |
| $22.8 | Cash flow from operations |
Cash flow from investing activities of $1.3 billion of net earnings and $9.8 billion of non-cash expenses and other adjustments for depreciation and amortization, stock-based compensation, assets write-downs and deferred tax provision, reduced by $1.3 billion from net gains on sale of assets/businesses and $1.0 billion related to an increase in accounts receivable and an increase in other current and non-current assets. Additional sources of operating cash flow of $12.3 billion resulted from an increase in accounts payable and accrued liabilities, a decrease in inventories and an increase in other current and non-current liabilities. The increase in accrued liabilities and non-current liabilities is primarily due to the 2017 U.S. tax legislation (TCJA). The U.S. tax of $10.1 billion is payable over 8 years. Additionally, foreign taxes of $3.4 billion, net were recorded in the deferred tax provision.
Investing activities use of $14.9 billion was for acquisitions, net of cash acquired of $35.2 billion (primarily the acquisitions of Actelion and AMO for approximately $29.6 billion and $4.3 billion, respectively) and additions to property, plant and equipment of $3.3 billion. This was partially offset by proceeds from the net sale of investments primarily marketable securities of $22.0 billion and $1.8 billion of proceeds from the disposal of assets/businesses (primarily the divestitures of Codman Neurosurgery and COMPEED®).
Financing activities use of $7.7$0.9 billion was primarily due to:
| | | | | |
| (Dollars in billions) |
| $(4.5) | additions to property, plant and equipment |
| |
| 0.4 | proceeds from the disposal of assets/businesses, net |
| (0.5) | purchases of in-process research and development assets |
| 8.5 | net sales of investments |
| (3.0) | credit support agreements activity, net |
| |
| $0.9 | Net cash from investing activities |
Cash flow used for dividends to shareholdersfinancing activities of $8.9 billion, $6.4 billion for the repurchase of common stock and $0.2 billion of other financing. Financing activities also included sources of $6.8 billion from net proceeds of short and long-term debt and $1.1 billion of proceeds from stock options exercised/employee withholding tax on stock awards, net.
On October 13, 2015, the Company announced that its Board of Directors approved a share repurchase program, authorizing the Company to purchase up to $10.0 billion of the Company's shares of common stock. As of July 2, 2017, $10.0$15.8 billion was repurchased under the program and the program was completed. Shares acquired are available for general corporate purposes.primarily due to:
| | | | | |
| (Dollars in billions) |
| $(11.8) | | dividends to shareholders |
| (5.1) | 25repurchase of common stock |
| (10.8) | net repayment from short and long term debt |
| 1.1 | proceeds from stock options exercised/employee withholding tax on stock awards, net |
| (0.2) | Credit support agreements activity, net |
| 8.0 | Proceeds of short and long-term debt, net of issuance cost, related to the debt that transferred to Kenvue at separation |
| 4.2 | proceeds from Kenvue initial public offering |
| (1.1) | Cash transferred to Kenvue at separation |
| (0.1) | other and rounding |
| $(15.8) | Net cash used for financing activities |
As of December 31, 2017,2023, the Company's notes payable and long-term debt was in excess of cash, cash equivalents and marketable securities. In 2017,As of December 31, 2023, the Company continuednet debt position was $6.4 billion as compared to have accessthe prior year of $17.4 billion. The debt balance at the end of 2023 was $29.3 billion as compared to liquidity through the commercial paper market. Additionally, as a result of the TCJA,$39.6 billion in 2022. Considering recent market conditions, the Company has access tore-evaluated its operating cash outside the U.S. at a significantly reduced cost.flows and liquidity profile and does not foresee any significant incremental risk. The Company anticipates that operating cash flows, the ability to raise funds from external sources, borrowing capacity from existing committed credit facilities and access to the commercial paper markets will continue to provide sufficient resources to fund operating needs, including the Company's remaining balance to be paid on the agreement to settle opioid litigation for approximately $2.1 billion and the next twelve months. Theestablishment of the approximately $9 billion reserve for talc matters (See Note 19 to the Consolidated Financial Statements for additional details). In addition, the Company monitors the global capital markets on an ongoing basis and from time to time may raise capital when market conditions are favorable.
On May 8, 2023, Kenvue, completed an initial public offering (the IPO) resulting in the issuance of 198,734,444 shares of its common stock, par value $0.01 per share (the Kenvue Common Stock), at an initial public offering of $22.00 per share for net proceeds of $4.2 billion. The excess of the net proceeds from the IPO over the net book value of the Johnson & Johnson divested interest was $2.5 billion and was recorded to additional paid-in capital. As of the closing of the IPO, Johnson & Johnson owned approximately 89.6% of the total outstanding shares of Kenvue Common Stock and at July 2, 2023, the non-controlling interest of $1.3 billion associated with Kenvue was reflected in equity attributable to non-controlling interests in the consolidated balance sheet.
On August 23, 2023, Johnson & Johnson completed the disposition of an additional 80.1% ownership of Kenvue Common Stock through an exchange offer, which resulted in Johnson & Johnson acquiring 190,955,436 shares of the Company’s common stock in exchange for 1,533,830,450 shares of Kenvue Common Stock. The $31.4 billion of Johnson & Johnson common stock received in the exchange offer is recorded in Treasury stock. Following the exchange offer, the Company filedowns 9.5% of the total outstanding shares of Kenvue Common Stock that was recorded in other assets within continuing operations at the fair market value of $4.3 billion as of August 23, 2023 and $3.9 billion as of December 31, 2023.
Johnson & Johnson divested net assets of $11.6 billion as of August 23, 2023, and the accumulated other comprehensive loss attributable to the Consumer Health business at that date was $4.3 billion. Additionally, at the date of the exchange offer,
Johnson & Johnson decreased the non-controlling interest by $1.2 billion to record the deconsolidation of Kenvue. This resulted in a new shelf registrationgain on February 27, 2017 which will enable itthe exchange offer of $21.0 billion that was recorded in Net earnings from discontinued operations, net of taxes in the consolidated statements of earnings for the fiscal third quarter of 2023. This one-time gain includes a gain of $2.8 billion on the Kenvue Common Stock retained by Johnson & Johnson. The gain on the exchange offer qualifies as a tax-free transaction for U.S. federal income tax purposes.
On September 14, 2022, the Company announced that its Board of Directors approved a share repurchase program, authorizing the Company to issue debt securities on a timely basis.purchase up to $5.0 billion of the Company’s Common Stock. In the fiscal firstyear 2022, approximately $2.5 billion was repurchased under the program. In the fiscal year 2023, $2.5 billion has been repurchased and fourth quartersthe repurchase program was completed.
The following table summarizes the Company’s material contractual obligations and their aggregate maturities as of 2017,December 31, 2023: To satisfy these obligations, the Company issued bonds for a total of $9.0 billion for general corporate purposes, including the completion of the stock repurchase program. intends to use cash from operations.
| | | | | | | | | | | | | | | | | |
| (Dollars in Millions) | Tax Legislation (TCJA) | Debt Obligations | Interest on
Debt Obligations | | | | Total |
| 2024 | $2,029 | 1,469 | 843 | | | | 4,341 |
| 2025 | 2,536 | 1,700 | 789 | | | | 5,025 |
| 2026 | — | 1,997 | 744 | | | | 2,741 |
| 2027 | — | 2,320 | 736 | | | | 3,056 |
| 2028 | — | 2,325 | 691 | | | | 3,016 |
| After 2028 | — | 17,539 | 8,706 | | | | 26,245 |
| Total | $4,565 | 27,350 | 12,509 | | | | 44,424 |
For additional details on borrowings,tax matters, see Note 78 to the Consolidated Financial Statements.
Financing and Market Riskmarket risk
The Company uses financial instruments to manage the impact of foreign exchange rate changes on cash flows. Accordingly, the Company enters into forward foreign exchange contracts to protect the value of certain foreign currency assets and liabilities and to hedge future foreign currency transactions primarily related to product costs. Gains or losses on these contracts are offset by the gains or losses on the underlying transactions. A 10% appreciation of the U.S. Dollar from the December 31, 20172023 market rates would increase the unrealized value of the Company’s forward contracts by $167 million.$0.1 billion. Conversely, a 10% depreciation of the U.S. Dollar from the December 31, 20172023 market rates would decrease the unrealized value of the Company’s forward contracts by $197 million.$0.1 billion. In either scenario, the gain or loss on the forward contract would be offset by the gain or loss on the underlying transaction, and therefore, would have no impact on future anticipated earnings and cash flows.
The Company hedges the exposure to fluctuations in currency exchange rates, and the effect on certain assets and liabilities in foreign currency, by entering into currency swap contracts. A 1% change in the spread between U.S. and foreign interest rates on the Company’s interest rate sensitive financial instruments would either increase or decrease the unrealized value of the Company’s swap contracts by approximately $69 million.$1.6 billion. In either scenario, at maturity, the gain or loss on the swap contract would be offset by the gain or loss on the underlying transaction, and therefore, would have no impact on future anticipated cash flows.
The Company does not enter into financial instruments for trading or speculative purposes. Further, the Company has a policy of only entering into contracts with parties that have at least an investment grade credit rating. The counter-partiescounterparties to these contracts are major financial institutions and there is no significant concentration of exposure with any one counter-party.counterparty. Management believes the risk of loss is remote. The Company entered into credit support agreements (CSA) with certain derivative counterparties establishing collateral thresholds based on respective credit ratings and netting agreements. See Note 6 to the Consolidated Financial Statements for additional details on credit support agreements.
The Company invests in both fixed rate and floating rate interest earning securities which carry a degree of interest rate risk. The fair market value of fixed rate securities may be adversely impacted due to a rise in interest rates, while floating rate securities may produce less income than predicted if interest rates fall. A 1% (100 basis points) change in spread on the Company’s interest rate sensitive investments would either increase or decrease the unrealized value of cash equivalents and current marketable securities by approximately $8 million.less than $0.8 billion.
The Company has access to substantial sources of funds at numerous banks worldwide. In September 2017,2023, the Company secured a new 364-day Credit Facility. Total credit available to the Company approximatesFacility of $10 billion, which expires on September 13, 2018.5, 2024. The Company early terminated the additional 364-day revolving Credit Facility of $10 billion, which had an expiration of November 21, 2023. Interest charged on borrowings under the credit line agreement is based on either bids provided by banks, the primeSecured Overnight Financing Rate (SOFR) Reference Rate or other applicable market rate or London Interbank Offered Rates (LIBOR),as allowed plus applicable margins. Commitment fees under the agreement are not material.
Total borrowings at the end of 20172023 and 20162022 were $34.6$29.3 billion and $27.1$39.6 billion, respectively. The increasedecrease in borrowings between 2017 and 2016the debt balance was a resultdue to the repayment of financing for the Company's share repurchase program and general corporate purposes.commercial paper. In 2017,2023, net debt (cash and current marketable securities, net of debt) was $16.3$6.4 billion compared to net cashdebt of $14.8$17.4 billion in 2016.2022. Total debt represented 36.5%30.0% of total capital (shareholders’ equity and total debt) in 20172023 and 27.8%34.0% of total capital in 2016.2022. Shareholders’ equity per share at the end of 20172023 was $22.43$28.57 compared to $26.02$29.39 at year-end 2016, a decrease of 13.8%.2022.
A summary of borrowings can be found in Note 7 to the Consolidated Financial Statements.
Contractual Obligations and Commitments
The Company’s contractual obligations are primarily for the recently enacted tax legislation, leases, debt and unfunded retirement plans. There are no other significant obligations. To satisfy these obligations, the Company will use cash from operations. The following table summarizes the Company’s contractual obligations and their aggregate maturities as of December 31, 2017 (see Notes 7, 8, 10 and 16 to the Consolidated Financial Statements for further details):
|
| | | | | | | | | | | | | | | | | | | |
| (Dollars in Millions) | | Tax Legislation (TCJA) | | Debt Obligations | | Interest on
Debt Obligations | | Unfunded
Retirement Plans | | Operating Leases | | Total |
| 2018 | | $ | 1,614 |
| | 1,499 |
| | 1,002 |
| | 88 |
| | 227 |
| | 4,430 |
|
| 2019 | | 807 |
| | 2,752 |
| | 949 |
| | 89 |
| | 184 |
| | 4,781 |
|
| 2020 | | 807 |
| | 1,105 |
| | 883 |
| | 94 |
| | 143 |
| | 3,032 |
|
| 2021 | | 807 |
| | 1,797 |
| | 840 |
| | 100 |
| | 106 |
| | 3,650 |
|
| 2022 | | 1,513 |
| | 2,189 |
| | 796 |
| | 108 |
| | 76 |
| | 4,682 |
|
| After 2022 | | 4,538 |
| | 22,832 |
| | 9,659 |
| | 651 |
| | 103 |
| | 37,783 |
|
| Total | | $ | 10,086 |
| | 32,174 |
| | 14,129 |
| | 1,130 |
| | 839 |
| | 58,358 |
|
For tax matters, see Note 8 to the Consolidated Financial Statements. For other retirement plan and post-employment medical benefit information, see Note 10 to the Consolidated Financial Statements. The table does not include activity related to business combinations.
Dividends
The Company increased its dividend in 20172023 for the 55th61st consecutive year. Cash dividends paid were $3.32$4.70 per share in 2017 compared with dividends of $3.152023 and $4.45 per share in 2016, and $2.95 per share in 2015. The dividends were distributed as follows:
|
| | | | | | | | | |
| | 2017 | | 2016 | | 2015 |
| First quarter | $ | 0.80 |
| | 0.75 |
| | 0.70 |
|
| Second quarter | 0.84 |
| | 0.80 |
| | 0.75 |
|
| Third quarter | 0.84 |
| | 0.80 |
| | 0.75 |
|
| Fourth quarter | 0.84 |
| | 0.80 |
| | 0.75 |
|
| Total | $ | 3.32 |
| | 3.15 |
| | 2.95 |
|
On January 2, 2018,2024, the Board of Directors declared a regular quarterly cash dividend of $0.84$1.19 per share, payable on March 13, 2018,5, 2024 to shareholders of record as of February 27, 2018. The Company expects to continue the practice of paying regular cash dividends.20, 2024.
Other Informationinformation
Critical Accounting Policiesaccounting policies and Estimatesestimates
Management’s discussion and analysis of results of operations and financial condition are based on the Company’s consolidated financial statements that have been prepared in accordance with accounting principles generally accepted in the U.S. (GAAP). The preparation of these financial statements requires that management make estimates and assumptions that affect the amounts reported for revenues, expenses, assets, liabilities and other related disclosures. Actual results may or may not differ from these estimates. The Company believes that the understanding of certain key accounting policies and estimates are essential in achieving more insight into the Company’s operating results and financial condition. These key accounting policies include revenue recognition, income taxes, legal and self-insurance contingencies, valuation of long-lived assets, assumptions used to determine the amounts recorded for pensions and other employee benefit plans and accounting for stock based awards.
Revenue Recognition:The Company recognizes revenue from product sales when obligations under the terms of a contract with the customer are satisfied; generally, this occurs with the transfer of control of the goods to customers. The Company's global payment terms are shipped or delivered, and title and risk of loss passtypically between 30 to the customer.90 days. Provisions for certain rebates, sales incentives, trade promotions, coupons, product returns, and discounts to customers and governmental clawback provisions are accounted for as reductionsvariable consideration and recorded as a reduction in sales in the same period the related sales are recorded. See Note 1 to the Consolidated Financial Statements for the Accounting Standards Update related to revenue which will be adopted in 2018.sales.
Product discounts granted are based on the terms of arrangements with direct, indirect and other market participants, as well as market conditions, including prices charged by competitors.consideration of competitor pricing. Rebates which include the Medicaid rebate provision, are estimated based on contractual terms, historical experience, patient outcomes, trend analysis and projected market conditions in the various markets served. The Company evaluates market conditions for products or groups of products primarily through the analysis of wholesaler and other third-party sell-through and market research data, as well as internally generated information.
Sales returns are estimated and recorded based on historical sales and returns information. Products that exhibit unusual sales or return patterns due to dating, competition or other marketing matters are specifically investigated and analyzed as part of the accounting for sales return accruals.
Sales returns allowances represent a reserve for products that may be returned due to expiration, destruction in the field, or in specific areas, product recall. The sales returns reserve is based on historical return trends by product and by market as a percent to gross sales. In accordance with the Company’s accounting policies, the Company generally issues credit to customers for returned goods. The Company’s sales returns reserves are accounted for in accordance with the U.S. GAAP guidance for revenue recognition when right of return exists. Sales returns reserves are recorded at full sales value. Sales returns in the Consumer and PharmaceuticalInnovative Medicine segments are almost exclusively not resalable. Sales returns for certain franchises in the Medical DevicesMedTech segment are typically resalable but are not material. The Company infrequently exchanges products from inventory for returned products. The sales returns reserve for the total Company has been approximatelyless than 1.0% of annual net trade sales during the fiscal reporting years 2017, 20162023, 2022 and 2015.2021.
Promotional programs, such as product listing allowances and cooperative advertising arrangements, are recorded in the year incurred. Continuing promotional programssame period as related sales and include coupons and volume-based sales incentive programs. The redemption cost of consumer coupons is based on historical redemption experience by product and value. Volume-based incentive programs are based on the estimated sales volumes for the incentive period and are recorded as products are sold. The Company also earns service revenue for co-promotion of certain products. For all years presented, service revenues were approximately 1% or less of the total revenues and are included in sales to customers. These arrangements are evaluated to determine the appropriate amounts to be deferred or recorded as a reduction of revenue. The Company also earns profit-share payments through collaborative arrangements of certain products, which are included in sales to customers. Profit-share payments were less than 2.0% of the total revenues in fiscal year 2023 and less than 3.0% of the total revenues in fiscal year 2022 and 2021 are included in sales to customers.
In addition, the Company enters into collaboration arrangements that contain multiple revenue generating activities. Amounts due from collaborative partners for these arrangements are recognized as each activity is performed or delivered, based on the relative selling price. Upfront fees received as part of these arrangements are deferred and recognized over the performance period. See Note 1 to the Consolidated Financial Statements for additional disclosures on collaborations.
Reasonably likely changes to assumptions used to calculate the accruals for rebates, returns and promotions are not anticipated to have a material effect on the financial statements. The Company currently discloses the impact of changes to assumptions in the quarterly or annual filing in which there is a material financial statement impact.
Below are tables that show the progression of accrued rebates, returns, promotions, reserve for doubtful accounts and reserve for cash discounts by segment of business for the fiscal years ended December 31, 20172023 and January 1, 2017.2023.
Innovative Medicine segment
Consumer Segment | | | | | | | | | | | | | | |
| (Dollars in Millions) | Balance at Beginning of Period | Accruals | Payments/ Credits(2) | Balance at End of Period |
| 2023 | | | | |
Accrued rebates (1) | $12,289 | 47,523 | (45,151) | 14,661 |
| Accrued returns | 649 | 332 | (347) | 634 |
| Accrued promotions | 1 | 12 | (7) | 6 |
| Subtotal | $12,939 | 47,867 | (45,505) | 15,301 |
| Reserve for doubtful accounts | 44 | 0 | (11) | 33 |
| Reserve for cash discounts | 110 | 1,386 | (1,385) | 111 |
| Total | $13,093 | 49,253 | (46,901) | 15,445 |
| | | | |
| 2022 | | | | |
Accrued rebates (1) | $10,331 | 43,026 | (41,068) | 12,289 |
| Accrued returns | 520 | 444 | (315) | 649 |
| Accrued promotions | 3 | 5 | (7) | 1 |
| Subtotal | $10,854 | 43,475 | (41,390) | 12,939 |
| Reserve for doubtful accounts | 50 | 0 | (6) | 44 |
| Reserve for cash discounts | 94 | 1,281 | (1,265) | 110 |
| Total | $10,998 | 44,756 | (42,661) | 13,093 |
(1)Includes reserve for customer rebates of $165 million at December 31, 2023 and $203 million at January 1, 2023, recorded as a contra asset.
(2)Includes prior period adjustments
|
| | | | | | | | | | | | | |
| (Dollars in Millions) | | Balance at
Beginning of Period | | Accruals | | Payments/Credits | | Balance at
End of Period |
| 2017 | | |
| | |
| | |
| | |
|
Accrued rebates (1) | | $ | 136 |
| | 638 |
| | (588 | ) | | 186 |
|
| Accrued returns | | 65 |
| | 128 |
| | (125 | ) | | 68 |
|
| Accrued promotions | | 358 |
| | 2,148 |
| | (2,025 | ) | | 481 |
|
| Subtotal | | $ | 559 |
| | 2,914 |
| | (2,738 | ) | | 735 |
|
| Reserve for doubtful accounts | | 24 |
| | 10 |
| | (3 | ) | | 31 |
|
| Reserve for cash discounts | | 25 |
| | 205 |
| | (207 | ) | | 23 |
|
| Total | | $ | 608 |
| | 3,129 |
| | (2,948 | ) | | 789 |
|
| | | | | | | | | |
| 2016 | | |
| | |
| | |
| | |
|
Accrued rebates(1) | | $ | 139 |
| | 615 |
| | (618 | ) | | 136 |
|
| Accrued returns | | 54 |
| | 111 |
| | (100 | ) | | 65 |
|
| Accrued promotions | | 412 |
| | 1,908 |
| | (1,962 | ) | | 358 |
|
| Subtotal | | $ | 605 |
| | 2,634 |
| | (2,680 | ) | | 559 |
|
| Reserve for doubtful accounts | | 18 |
| | 12 |
| | (6 | ) | | 24 |
|
| Reserve for cash discounts | | 17 |
| | 209 |
| | (201 | ) | | 25 |
|
| Total | | $ | 640 |
| | 2,855 |
| | (2,887 | ) | | 608 |
|
| |
(1)
| Includes reserve for customer rebates of $48 million at December 31, 2017 and $37 million at January 1, 2017, recorded as a contra asset. |
|
| | | | | | | | | | | | | |
| (Dollars in Millions) | | Balance at
Beginning of Period | | Accruals | | Payments/Credits(2) | | Balance at
End of Period |
| 2017 | | |
| | |
| | |
| | |
|
Accrued rebates (1) | | $ | 3,420 |
| | 16,447 |
| | (15,005 | ) | | 4,862 |
|
| Accrued returns | | 334 |
| | 256 |
| | (228 | ) | | 362 |
|
| Accrued promotions | | — |
| | 69 |
| | (34 | ) | | 35 |
|
| Subtotal | | $ | 3,754 |
| | 16,772 |
| | (15,267 | ) | | 5,259 |
|
| Reserve for doubtful accounts | | 38 |
| | 40 |
| | (1 | ) | | 77 |
|
| Reserve for cash discounts | | 58 |
| | 714 |
| | (717 | ) | | 55 |
|
| Total | | $ | 3,850 |
| | 17,526 |
| | (15,985 | ) | | 5,391 |
|
| | | | | | | | | |
| 2016 | | |
| | |
| | |
| | |
|
Accrued rebates (1) | | $ | 3,451 |
| | 12,306 |
| | (12,337 | ) | | 3,420 |
|
| Accrued returns | | 404 |
| | 140 |
| | (210 | ) | | 334 |
|
| Accrued promotions | | 11 |
| | 10 |
| | (21 | ) | | — |
|
| Subtotal | | $ | 3,866 |
| | 12,456 |
| | (12,568 | ) | | 3,754 |
|
| Reserve for doubtful accounts | | 46 |
| | 2 |
| | (10 | ) | | 38 |
|
| Reserve for cash discounts | | 63 |
| | 613 |
| | (618 | ) | | 58 |
|
| Total | | $ | 3,975 |
| | 13,071 |
| | (13,196 | ) | | 3,850 |
|
| |
(1)
| Includes reserve for customer rebates of $90 million at December 31, 2017 and $102 million at January 1, 2017, recorded as a contra asset. |
MedTech segment
| | | | | | | | | | | | | | |
| (Dollars in Millions) | Balance at
Beginning of
Period | Accruals | Payments/
Credits | Balance at
End of
Period |
| 2023 | | | | |
Accrued rebates(1) | $1,470 | 6,241 | (6,256) | 1,455 |
| Accrued returns | 134 | 555 | (564) | 125 |
| Accrued promotions | 43 | 74 | (92) | 25 |
| Subtotal | $1,647 | 6,870 | (6,912) | 1,605 |
| Reserve for doubtful accounts | 125 | 33 | (25) | 133 |
| Reserve for cash discounts | 9 | 96 | (100) | 5 |
| Total | $1,781 | 6,999 | (7,037) | 1,743 |
| | | | |
| 2022 | | | | |
Accrued rebates(1) | $1,446 | 6,131 | (6,107) | 1,470 |
| Accrued returns | 134 | 531 | (531) | 134 |
| Accrued promotions | 54 | 102 | (113) | 43 |
| Subtotal | $1,634 | 6,764 | (6,751) | 1,647 |
| Reserve for doubtful accounts | 148 | 6 | (29) | 125 |
| Reserve for cash discounts | 10 | 99 | (100) | 9 |
| Total | $1,792 | 6,869 | (6,880) | 1,781 |
Medical Devices Segment(1)Includes reserve for customer rebates of $740 million at December 31, 2023 and $802 million at January 1, 2023, recorded as a contra asset.
|
| | | | | | | | | | | | | |
| (Dollars in Millions) | | Balance at
Beginning of Period | | Accruals | | Payments/Credits | | Balance at
End of Period |
| 2017 | | |
| | |
| | |
| | |
|
Accrued rebates(1) | | $ | 1,500 |
| | 6,407 |
| | (6,287 | ) | | 1,620 |
|
| Accrued returns | | 127 |
| | 729 |
| | (704 | ) | | 152 |
|
| Accrued promotions | | 32 |
| | 135 |
| | (84 | ) | | 83 |
|
| Subtotal | | $ | 1,659 |
| | 7,271 |
| | (7,075 | ) | | 1,855 |
|
| Reserve for doubtful accounts | | 190 |
| | 27 |
| | (34 | ) | | 183 |
|
| Reserve for cash discounts | | 16 |
| | 389 |
| | (390 | ) | | 15 |
|
| Total | | $ | 1,865 |
| | 7,687 |
| | (7,499 | ) | | 2,053 |
|
| | | | | | | | | |
| 2016 | | |
| | |
| | |
| | |
|
Accrued rebates(1) | | $ | 1,189 |
| | 5,700 |
| | (5,389 | ) | | 1,500 |
|
| Accrued returns | | 239 |
| | 518 |
| | (630 | ) | | 127 |
|
| Accrued promotions | | 47 |
| | 78 |
| | (93 | ) | | 32 |
|
| Subtotal | | $ | 1,475 |
| | 6,296 |
| | (6,112 | ) | | 1,659 |
|
| Reserve for doubtful accounts | | 204 |
| | 21 |
| | (35 | ) | | 190 |
|
| Reserve for cash discounts | | 20 |
| | 430 |
| | (434 | ) | | 16 |
|
| Total | | $ | 1,699 |
| | 6,747 |
| | (6,581 | ) | | 1,865 |
|
| |
(1)
| Includes reserve for customer rebates of $501 million at December 31, 2017 and $430 million at January 1, 2017, recorded as a contra asset. |
Income Taxes: Income taxes are recorded based on amounts refundable or payable for the current year and include the results of any difference between U.S. GAAP accounting and tax reporting, recorded as deferred tax assets or liabilities. The Company estimates deferred tax assets and liabilities based on enacted tax regulations and rates. Future changes in tax laws and rates may affect recorded deferred tax assets and liabilities.
The Company has unrecognized tax benefits for uncertain tax positions. The Company follows U.S. GAAP, which prescribes a recognition threshold and measurement attribute for the financial statement recognition and measurement of a tax position taken or expected to be taken in a tax return. Management believes that changes in these estimates would not have a material effect on the Company's results of operations, cash flows or financial position.
In the fourth quarter of 2017, the United States enacted the TCJA, which includes provisions for a tax on all previously undistributed earnings in foreign jurisdictions. The Company has provisionally booked a $10.1 billion chargerecorded deferred tax liabilities on theseall undistributed earnings in 2017. Additionally, the Company has provisionally recorded a $4.5 billion deferred tax liability for foreign local and withholding taxes, offset by a $1.1 billion deferred tax asset for U.S. foreign tax credits, for repatriation of substantially all undistributed foreign earnings.prior to December 31, 2017 from its international subsidiaries. The Company is currently evaluating the remaining undistributed foreign earnings for which it has not provided deferred taxes for foreign local and withholding tax, as theseon the undistributed earnings subsequent to January 1, 2018 from certain international subsidiaries where the earnings are considered to be indefinitely reinvested. The Company intends to continue to reinvest these earnings in those international operations. If the Company decides at a later date to repatriate these earnings to the U.S., the Company would be required to provide for the net tax effects on these amounts. The Company estimates that the tax effect of this repatriation would be approximately $0.5 billion under currently enacted tax laws and regulations and at current currency exchange rates. This amount does not include the possible benefit of these unrecorded deferred taxes is not expected to be material.U.S. foreign tax credits, which may substantially offset this cost.
See Note 1 and Note 8 to the Consolidated Financial Statements for further information regarding income taxes.
Legal and Self Insurance Contingencies:The Company records accruals for various contingencies, including legal proceedings and product liability claims as these arise in the normal course of business. The accruals are based on management’s judgment as to the probability of losses and, where applicable, actuarially determined estimates. The Company has self insurance through a wholly-owned captive insurance company. In addition to accruals in the self insurance program, claims that exceed the insurance coverage are accrued when losses are probable and amounts can be reasonably estimated.
The Company follows the provisions of U.S. GAAP when recording litigation related contingencies. A liability is recorded when a loss is probable and can be reasonably estimated. The best estimate of a loss within a range is accrued; however, if no estimate in the range is better than any other, the minimum amount is accrued.
See Notes 1 and 2119 to the Consolidated Financial Statements for further information regarding product liability and legal proceedings.
Long-Lived and Intangible Assets: The Company assesses changes, both qualitatively and quantitatively, in economic conditions and makes assumptions regarding estimated future cash flows in evaluating the value of the Company’s property, plant and equipment, goodwill and intangible assets. As these assumptions and estimates may change over time, it may or may not be necessary for the Company to record impairment charges.
Employee Benefit Plans: The Company sponsors various retirement and pension plans, including defined benefit, defined contribution and termination indemnity plans, which cover most employees worldwide. These plans are based on assumptions for the discount rate, expected return on plan assets, mortality rates, expected salary increases, health carehealthcare cost trend rates and attrition rates. See Note 10 to the Consolidated Financial Statements for further details on these rates and the effect a rate change to the health care cost trend would have on the Company’s results of operations.rates.
Stock Based Compensation: The Company recognizes compensation expense associated with the issuance of equity instruments to employees for their services. Based on the type of equity instrument, the fair value is estimated on the date of grant using either the Black-Scholes option valuation model or a combination of both the Black-Scholes option valuation model and Monte Carlo valuation model, and is expensed in the financial statements over the service period. The input assumptions used in determining fair value are the expected life, expected volatility, risk-free rate and expected dividend yield. For performance share units, the fair market value is calculated for each of the threetwo component goals at the date of grant.grant: adjusted operational earnings per share and relative total shareholder return. The fair values for the sales and earnings per share goalsgoal of each performance share unit werewas estimated on the date of grant using the fair market value of the shares at the time of the award, discounted for dividends, which are not paid on the performance share units during the vesting period. The fair value for the relative total shareholder return goal of each performance share unit was estimated on the date of grant using the Monte Carlo valuation model. See Note 1716 to the Consolidated Financial Statements for additional information.
New Accounting Pronouncementsaccounting pronouncements
Refer to Note 1 to the Consolidated Financial Statements for recently adopted accounting pronouncements and recently issued accounting pronouncements not yet adopted as of December 31, 2017.2023.
Economic and Market Factorsmarket factors
The Company is aware that its products are used in an environment where, for more than a decade, policymakers, consumers and businesses have expressed concerns about the rising cost of health care.healthcare. In response to these concerns, the Company has a long-standing policy of pricing products responsibly. For the period 20072013 - 2017,2023, in the United States,U.S., the weighted average compound annual growth rate of the Company’s net price increases for health carehealthcare products (prescription and over-the-counter drugs, hospital and professional products) was below the U.S. Consumer Price Index (CPI).
The Company operates in certain countries where the economic conditions continue to present significant challenges. The Company continues to monitor these situations and take appropriate actions. Inflation rates continue to have an effect on worldwide economies and, consequently, on the way companies operate. The Company has accounted for operations in Argentina, Venezuela and Turkey (beginning in the fiscal second quarter of 2022) as highly inflationary, as the prior three-year cumulative inflation rate surpassed 100%. This did not have a material impact to the Company's results in the period. In the face of increasing costs, the Company strives to maintain its profit margins through cost reduction programs, productivity improvements and periodic price increases.
In June 2016,December 2023, the United Kingdom (U.K.) held a referendum in which voters approved an exit fromArgentine government devalued the European Union (E.U.), commonly referred to as “Brexit” and in March 2017 the U.K. formally started the process for the U.K. to leave the E.U. Given the lack of comparable precedent, it is unclear what financial, trade, regulatory and legal implications the withdrawal of the U.K. from the E.U. will have. Brexit creates global political and economic uncertainty, which may cause, among other consequences, volatility in exchange rates and interest rates, additional cost containmentpeso by third-party payors and changes in regulations. However,approximately 50%. During 2023, the Company currently does not believe that these and otherrecorded a charge of approximately $130 million related effects will have a material impact onto operations in Argentina due to the Company’s consolidated financial position or operating results.application of highly inflationary accounting. As of December 31, 2017,2023, the Company’s Argentine subsidiaries represented less than 1.0% of the Company's consolidated assets, liabilities, revenues and profits from continuing operations; therefore, the effect of a change in the exchange rate is not expected to have a material adverse effect on the Company's 2024 full-year results.
In July 2023, Janssen Pharmaceuticals, Inc. (Janssen) filed litigation against the U.S. Department of Health and Human Services as well as the Centers for Medicare and Medicaid Services challenging the constitutionality of the Inflation Reduction Act’s (IRA) Medicare Drug Price Negotiation Program. The litigation requests a declaration that the IRA violates Janssen’s rights under the First Amendment and the Fifth Amendment to the Constitution and therefore that Janssen is not subject to the IRA’s mandatory pricing scheme.
Russia-Ukraine War
Although the long-term implications of Russia’s invasion of Ukraine are difficult to predict at this time, the financial impact of the conflict in the fiscal year 2023, including accounts receivable or inventory reserves, was not material. As of and for each of the fiscal years ending December 31, 2023 and January 1, 2023, the business of the Company’s U.K.Russian subsidiaries represented less than 3%1% of both the Company’s consolidated assets and represented 1% of revenues. The Company does not maintain Ukraine subsidiaries subsequent to the Kenvue separation.
In early March of 2022, the Company took steps to suspend all advertising, enrollment in clinical trials, and any additional investment in Russia. The Company continues to supply products relied upon by patients for healthcare purposes.
Conflict in the Middle East
Although the long-term implications of Israel's conflict are difficult to predict at this time, the financial impact of the conflict in the fiscal twelve months revenues, respectively.year 2023, including accounts receivable or inventory reserves, was not material. As of and for the fiscal year ending December 31, 2023, the business of the Company’s Israel subsidiaries represented 1% of the Company’s consolidated assets and represented less than 1% of revenues.
The Company is exposed to fluctuations in currency exchange rates. A 1% change in the value of the U.S. Dollar as compared to all foreign currencies in which the Company had sales, income or expense in 20172023 would have increased or decreased the translation of foreign sales by approximately $360 million$0.4 billion and net income by $105 million.approximately $0.2 billion.
Governments around the world consider various proposals to make changes to tax laws, which may include increasing or decreasing existing statutory tax rates. In connection with various government initiatives, companies are required to disclose more information to tax authorities on operations around the world, which may lead to greater audit scrutiny of profits earned in other countries. A change in statutory tax rate in any country would result in the revaluation of the Company’s deferred tax assets and liabilities related to that particular jurisdiction in the period in which the new tax law is enacted. This change would result in an expense or benefit recorded to the Company’s Consolidated Statement of Earnings. The Company closely monitors these proposals as they arise in the countries where it operates. Changes to the statutory tax rate may occur at any time, and any related expense or benefit recorded may be material to the fiscal quarter and year in which the law change is enacted.
The Company faces various worldwide health carehealthcare changes that may continue to result in pricing pressures that include health carehealthcare cost containment and government legislation relating to sales, promotions, pricing and reimbursement of health carehealthcare products.
Changes in the behavior and spending patterns of purchasers of health carehealthcare products and services, including delaying medical procedures, rationing prescription medications, reducing the frequency of physician visits and foregoing health carehealthcare insurance coverage as a result of the current global economic downturn, may continue to impact the Company’s businesses.
The Company also operates in an environment increasingly hostile to intellectual property rights. Firms have filed Abbreviated New Drug Applications or Biosimilar Biological Product Applications with the U.S. FDA or otherwise challenged the coverage and/or validity of the Company's patents, seeking to market generic or biosimilar forms of many of the Company’s key pharmaceutical products prior to expiration of the applicable patents covering those products. In the event the Company is not successful in defending the patent claims challenged in the resulting lawsuits, generic or biosimilar versions of the products at issue will be introduced to the market, resulting in the potential for substantial market share and revenue losses for those products, and which may result in a non-cash impairment charge in any associated intangible asset. There is also a risk that one or more competitors could launch a generic or biosimilar version of the product at issue following regulatory approval even though one or more valid patents are in place. For further information, see the discussion on “REMICADE® Related Cases” and “Litigation Against Filers of Abbreviated New Drug Applications” in Note 21 to the Consolidated Financial Statements.
Legal Proceedingsproceedings
Johnson & Johnson and certain of its subsidiaries are involved in various lawsuits and claims regarding product liability, intellectual property, commercial, employment, indemnification and other matters; governmental investigations; and other legal proceedings that arise from time to time in the ordinary course of business.
The Company records accruals for loss contingencies associated with these legal matters when it is probable that a liability will be incurred and the amount of the loss can be reasonably estimated. As of December 31, 2023, the Company has determined that the liabilities associated with certain litigation matters are probable and can be reasonably estimated. The Company has accrued for certain litigationthese matters and continueswill continue to monitor each related legal issue and adjust accruals foras might be warranted based on new information and further developments in accordance with Accounting Standards Codification (ASC) 450-20-25.ASC 450-20-25, Contingencies. For these and other litigation and regulatory matters currently discloseddiscussed below for which a loss is probable or reasonably possible, the Company is unable to estimate the possible loss or range of loss beyond the amounts already accrued. Amounts accrued for legal contingencies often result from a complex series of judgments about future events and uncertainties that rely heavily on estimates and assumptions.assumptions including timing of related payments. The ability to make such estimates and judgments can be affected by various factors including, among other things, whether damages sought in the proceedings are unsubstantiated or indeterminate; scientific and legal discovery has not commenced or is not complete; proceedings are in early stages; matters present legal uncertainties; there are significant facts in dispute; procedural or jurisdictional issues; the uncertainty and unpredictability of the number of potential claims; ability to achieve comprehensive multi-party settlements; complexity of related cross-claims and counterclaims; and/or there are numerous parties involved. To the extent adverse awards, judgments or verdicts have been rendered against the Company, the Company does not record an accrual until a loss is determined to be probable and can be reasonably estimated.
In the Company's opinion, based on its examination of these matters, its experience to date and discussions with counsel, the ultimate outcome of legal proceedings, net of liabilities accrued in the Company's balance sheet, is not expected to have a material adverse effect on the Company's financial position. However, the resolution of, or increase in accruals for, one or more of these matters in any reporting period may have a material adverse effect on the Company's results of operations and cash flows for that period.
See Note 2119 to the Consolidated Financial Statements included in Item 8 of this report for further information regarding legal proceedings.
Common Stock Market Pricesstock
The Company’s Common Stock is listed on the New York Stock Exchange under the symbol JNJ. As of February 16, 2018,9, 2024, there were 147,484118,772 record holders of Common Stock of the Company. The composite
Item 7A. Quantitative and qualitative disclosures about market
price ranges for Johnson & Johnson Common Stock during 2017 and 2016 were:risk
|
| | | | | | | | | | | | | |
| | 2017 | | 2016 |
| | High | | Low | | High | | Low |
| First quarter | $ | 129.00 |
| | 110.76 |
| | $ | 109.56 |
| | 94.28 |
|
| Second quarter | 137.00 |
| | 120.95 |
| | 121.54 |
| | 107.88 |
|
| Third quarter | 137.08 |
| | 129.05 |
| | 126.07 |
| | 117.04 |
|
| Fourth quarter | 144.35 |
| | 130.02 |
| | 122.50 |
| | 109.32 |
|
| Year-end close | $139.72 | | $115.21 |
| |
Item 7A. | QUANTITATIVE AND QUALITATIVE DISCLOSURES ABOUT MARKET RISK |
The information called for by this item is incorporated herein by reference to “ItemItem 7. Management’s Discussiondiscussion and Analysisanalysis of Resultsresults of Operationsoperations and Financial Conditionfinancial condition - Liquidity and Capital Resourcescapital resources - Financing and Market Risk”market risk of this Report; and Note 1 “SummarySummary of Significant Accounting Policiessignificant accounting policies - Financial Instruments”instruments of the Notes to Consolidated Financial Statements included in Item 8 of this Report.
Item 8. FINANCIAL STATEMENTS AND SUPPLEMENTARY DATAFinancial statements and supplementary data
Index to audited Consolidated Financial Statements
| | | | | |
| 2023 Annual Report | |
Index to Audited Consolidated Financial Statements |
| |
| |
| |
| |
| |
| |
| |
| 43 |
JOHNSONJohnson & JOHNSON AND SUBSIDIARIES
CONSOLIDATED BALANCE SHEETS
Johnson and subsidiaries consolidated balance sheets
At December 31, 20172023 and January 1, 2017
2023
(Dollars in Millions Except Share and Per Share Amounts) (Note 1)
| | | | 2017 | | 2016 |
| 2023 | | | 2023 | 2022 |
| Assets | | | |
| Current assets | |
| Current assets | |
| Current assets | |
| | |
| |
| Cash and cash equivalents (Notes 1 and 2) | $ | 17,824 |
| | 18,972 |
| Cash and cash equivalents (Notes 1 and 2) | $21,859 | 12,889 |
| Marketable securities (Notes 1 and 2) | 472 |
| | 22,935 |
| Marketable securities (Notes 1 and 2) | 1,068 | 9,392 |
Accounts receivable trade, less allowances for doubtful accounts $291 (2016, $252) | 13,490 |
| | 11,699 |
|
| Accounts receivable trade, less allowances $166 (2022, $169) | | Accounts receivable trade, less allowances $166 (2022, $169) | 14,873 | 14,039 |
| Inventories (Notes 1 and 3) | 8,765 |
| | 8,144 |
| Inventories (Notes 1 and 3) | 11,181 | 10,268 |
| | Prepaid expenses and other receivables | 2,537 |
| | 3,282 |
|
| Prepaid expenses and other receivables | |
| Prepaid expenses and other receivables | | 4,514 | 2,876 |
| Current assets of discontinued operations (Note 21) | | Current assets of discontinued operations (Note 21) | — | 5,830 |
| Total current assets | 43,088 |
| | 65,032 |
| Total current assets | 53,495 | 55,294 |
| Property, plant and equipment, net (Notes 1 and 4) | 17,005 |
| | 15,912 |
| Property, plant and equipment, net (Notes 1 and 4) | 19,898 | 17,982 |
| Intangible assets, net (Notes 1 and 5) | 53,228 |
| | 26,876 |
| Intangible assets, net (Notes 1 and 5) | 34,175 | 38,489 |
| Goodwill (Notes 1 and 5) | 31,906 |
| | 22,805 |
| Goodwill (Notes 1 and 5) | 36,558 | 36,047 |
| Deferred taxes on income (Note 8) | 7,105 |
| | 6,148 |
| Deferred taxes on income (Note 8) | 9,279 | 8,947 |
| Other assets | 4,971 |
| | 4,435 |
| Other assets | 14,153 | 9,212 |
| Noncurrent assets of discontinued operations (Note 21) | | Noncurrent assets of discontinued operations (Note 21) | — | 21,407 |
| Total assets | $ | 157,303 |
| | 141,208 |
| Total assets | $167,558 | 187,378 |
| Liabilities and Shareholders’ Equity | |
| | |
| Liabilities and Shareholders’ Equity | |
| Current liabilities | |
| | |
| Current liabilities | |
| Loans and notes payable (Note 7) | $ | 3,906 |
| | 4,684 |
| Loans and notes payable (Note 7) | $3,451 | 12,756 |
| Accounts payable | 7,310 |
| | 6,918 |
| Accounts payable | 9,632 | 9,889 |
| Accrued liabilities | 7,304 |
| | 5,635 |
| Accrued liabilities | 10,212 | 10,719 |
| Accrued rebates, returns and promotions | 7,210 |
| | 5,403 |
| Accrued rebates, returns and promotions | 16,001 | 13,579 |
| Accrued compensation and employee related obligations | 2,953 |
| | 2,676 |
| Accrued compensation and employee related obligations | 3,993 | 3,049 |
| Accrued taxes on income (Note 8) | 1,854 |
| | 971 |
| Accrued taxes on income (Note 8) | 2,993 | 2,220 |
| Current liabilities of discontinued operations (Note 21) | | Current liabilities of discontinued operations (Note 21) | — | 3,590 |
| Total current liabilities | 30,537 |
| | 26,287 |
| Total current liabilities | 46,282 | 55,802 |
| Long-term debt (Note 7) | 30,675 |
| | 22,442 |
| Long-term debt (Note 7) | 25,881 | 26,886 |
| Deferred taxes on income (Note 8) | 8,368 |
| | 2,910 |
| Deferred taxes on income (Note 8) | 3,193 | 3,991 |
| Employee related obligations (Notes 9 and 10) | 10,074 |
| | 9,615 |
| Employee related obligations (Notes 9 and 10) | 7,149 | 6,542 |
| Long-term taxes payable (Note 8) | 8,472 |
| | — |
|
| Long-term taxes payable (Note 1) | | Long-term taxes payable (Note 1) | 2,881 | 4,306 |
| Other liabilities | 9,017 |
| | 9,536 |
| Other liabilities | 13,398 | 10,146 |
| Noncurrent liabilities of discontinued operations (Note 21) | | Noncurrent liabilities of discontinued operations (Note 21) | — | 2,901 |
| Total liabilities | 97,143 |
| | 70,790 |
| Total liabilities | 98,784 | 110,574 |
| Commitments and Contingencies (Note 19) | | Commitments and Contingencies (Note 19) | |
| Shareholders’ equity | |
| | |
| Shareholders’ equity | |
| Preferred stock — without par value (authorized and unissued 2,000,000 shares) | — |
| | — |
| Preferred stock — without par value (authorized and unissued 2,000,000 shares) | — |
| Common stock — par value $1.00 per share (Note 12) (authorized 4,320,000,000 shares; issued 3,119,843,000 shares) | 3,120 |
| | 3,120 |
| Common stock — par value $1.00 per share (Note 12) (authorized 4,320,000,000 shares; issued 3,119,843,000 shares) | 3,120 |
| Accumulated other comprehensive income (loss) (Note 13) | (13,199 | ) | | (14,901 | ) | Accumulated other comprehensive income (loss) (Note 13) | (12,527) | (12,967) |
| Retained earnings | 101,793 |
| | 110,551 |
|
| | 91,714 |
| | 98,770 |
|
| Less: common stock held in treasury, at cost (Note 12) (437,318,000 shares and 413,332,000 shares) | 31,554 |
| | 28,352 |
|
| Retained earnings and Additional-paid-in-capital | | Retained earnings and Additional-paid-in-capital | 153,843 | 128,345 |
| Less: common stock held in treasury, at cost (Note 12) (712,765,000 shares and 506,246,000 shares) | | Less: common stock held in treasury, at cost (Note 12) (712,765,000 shares and 506,246,000 shares) | 75,662 | 41,694 |
| Total shareholders’ equity | 60,160 |
| | 70,418 |
| Total shareholders’ equity | 68,774 | 76,804 |
| Total liabilities and shareholders’ equity | $ | 157,303 |
| | 141,208 |
| Total liabilities and shareholders’ equity | $167,558 | 187,378 |
See Notes to Consolidated Financial Statements
JOHNSONJohnson & JOHNSON AND SUBSIDIARIES
CONSOLIDATED STATEMENTS OF EARNINGS
Johnson and subsidiaries consolidated statements of earnings
(Dollars and Shares in Millions Except Per Share Amounts) (Note 1)
| | | | 2017 | | 2016 | | 2015 |
| 2023 | | | 2023 | 2022 | 2021 |
| Sales to customers | $ | 76,450 |
| | 71,890 |
| | 70,074 |
| Sales to customers | $85,159 | 79,990 | 78,740 |
| Cost of products sold | 25,354 |
| | 21,685 |
| | 21,536 |
| Cost of products sold | 26,553 | 24,596 | 23,402 |
| Gross profit | 51,096 |
| | 50,205 |
| | 48,538 |
| Gross profit | 58,606 | 55,394 | 55,338 |
| Selling, marketing and administrative expenses | 21,420 |
| | 19,945 |
| | 21,203 |
| Selling, marketing and administrative expenses | 21,512 | 20,246 | 20,118 |
| Research and development expense | 10,554 |
| | 9,095 |
| | 9,046 |
| Research and development expense | 15,085 | 14,135 | 14,277 |
| In-process research and development | 408 |
| | 29 |
| | 224 |
|
| In-process research and development impairments | | In-process research and development impairments | 313 | 783 | 900 |
| Interest income | (385 | ) | | (368 | ) | | (128 | ) | Interest income | (1,261) | (490) | (53) |
| Interest expense, net of portion capitalized (Note 4) | 934 |
| | 726 |
| | 552 |
| Interest expense, net of portion capitalized (Note 4) | 772 | 276 | 183 |
| Other (income) expense, net | 183 |
| | 484 |
| | (2,064 | ) | Other (income) expense, net | 6,634 | 810 | 526 |
| Restructuring (Note 22) | 309 |
| | 491 |
| | 509 |
|
| Restructuring (Note 20) | | Restructuring (Note 20) | 489 | 275 | 209 |
| Earnings before provision for taxes on income | 17,673 |
| | 19,803 |
| | 19,196 |
| Earnings before provision for taxes on income | 15,062 | 19,359 | 19,178 |
| Provision for taxes on income (Note 8) | 16,373 |
| | 3,263 |
| | 3,787 |
| Provision for taxes on income (Note 8) | 1,736 | 2,989 | 1,377 |
| Net earnings from continuing operations | | Net earnings from continuing operations | 13,326 | 16,370 | 17,801 |
| Net earnings from discontinued operations, net of tax (Note 21) | | Net earnings from discontinued operations, net of tax (Note 21) | 21,827 | 1,571 | 3,077 |
| Net earnings | $ | 1,300 |
| | 16,540 |
| | 15,409 |
| Net earnings | $35,153 | 17,941 | 20,878 |
| | | | | | |
| Net earnings per share (Notes 1 and 15) | | | | | |
| Net earnings per share (Notes 1 and 15) | |
| Net earnings per share (Notes 1 and 15) | |
| | Continuing operations - basic | |
| | Continuing operations - basic | |
| | Continuing operations - basic | | $5.26 | 6.23 | 6.76 |
| Discontinued operations - basic | | Discontinued operations - basic | $8.62 | 0.60 | 1.17 |
| Total net earnings per share - basic | | Total net earnings per share - basic | $13.88 | 6.83 | 7.93 |
| | Continuing operations - diluted | |
| Continuing operations - diluted | |
| Continuing operations - diluted | | $5.20 | 6.14 | 6.66 |
| Discontinued operations - diluted | | Discontinued operations - diluted | $8.52 | 0.59 | 1.15 |
| Total net earnings per share - diluted | | Total net earnings per share - diluted | $13.72 | 6.73 | 7.81 |
| | Average shares outstanding (Notes 1 and 15) | |
| Average shares outstanding (Notes 1 and 15) | |
| Average shares outstanding (Notes 1 and 15) | |
| Basic | |
| Basic | |
| Basic | $ | 0.48 |
| | 6.04 |
| | 5.56 |
| 2,533.5 | 2,625.2 | 2,632.1 |
| Diluted | $ | 0.47 |
| | 5.93 |
| | 5.48 |
| Diluted | 2,560.4 | 2,663.9 | 2,674.0 |
| Cash dividends per share | $ | 3.32 |
| | 3.15 |
| | 2.95 |
|
| Average shares outstanding (Notes 1 and 15) | | | | | |
| Basic | 2,692.0 |
| | 2,737.3 |
| | 2,771.8 |
|
| Diluted | 2,745.3 |
| | 2,788.9 |
| | 2,812.9 |
|
See Notes to Consolidated Financial Statements
JOHNSONJohnson & JOHNSON AND SUBSIDIARIES
CONSOLIDATED STATEMENTS OF COMPREHENSIVE INCOME
Johnson and subsidiaries consolidated statements of comprehensive income
(Dollars in Millions) (Note 1)
| | | | | | | | | | | |
| 2023 | 2022 | 2021 |
| Net earnings | $35,153 | 17,941 | 20,878 |
| | | |
| Other comprehensive income (loss), net of tax | | | |
| Foreign currency translation | (3,221) | (1,796) | (1,079) |
| | | |
| Securities: | | | |
| Unrealized holding gain (loss) arising during period | 26 | (24) | (4) |
| Reclassifications to earnings | — | — | — |
| Net change | 26 | (24) | (4) |
| | | |
| Employee benefit plans: | | | |
| Prior service credit (cost), net of amortization | (149) | (160) | (169) |
| Gain (loss), net of amortization | (1,183) | 1,854 | 4,318 |
| Consumer settlement/ curtailment | 23 | — | — |
| Effect of exchange rates | (90) | 111 | 106 |
| Net change | (1,399) | 1,805 | 4,255 |
| | | |
| Derivatives & hedges: | | | |
| Unrealized gain (loss) arising during period | 422 | 454 | (199) |
| Reclassifications to earnings | (569) | (348) | (789) |
| Net change | (147) | 106 | (988) |
| | | |
| Other comprehensive income (loss) | (4,741) | 91 | 2,184 |
| | | |
| Comprehensive income | $30,412 | 18,032 | 23,062 |
| | | |
| | | |
| | | |
| | | |
| | | |
|
| | | | | | | | | |
| | 2017 | | 2016 | | 2015 |
| Net earnings | $ | 1,300 |
| | 16,540 |
| | 15,409 |
|
| | | | | | |
| Other comprehensive income (loss), net of tax | | | | | |
| Foreign currency translation | 1,696 |
| | (612 | ) | | (3,632 | ) |
| | | | | | |
| Securities: | | | | | |
| Unrealized holding gain (loss) arising during period | 159 |
| | (52 | ) | | 471 |
|
| Reclassifications to earnings | (338 | ) | | (141 | ) | | (124 | ) |
| Net change | (179 | ) | | (193 | ) | | 347 |
|
| | | | | | |
| Employee benefit plans: | | | | | |
| Prior service credit (cost), net of amortization | 2 |
| | 21 |
| | (60 | ) |
| Gain (loss), net of amortization | 29 |
| | (862 | ) | | 931 |
|
| Effect of exchange rates | (201 | ) | | 159 |
| | 148 |
|
| Net change | (170 | ) | | (682 | ) | | 1,019 |
|
| | | | | | |
| Derivatives & hedges: | | | | | |
| Unrealized gain (loss) arising during period | (4 | ) | | (359 | ) | | (115 | ) |
| Reclassifications to earnings | 359 |
| | 110 |
| | (62 | ) |
| Net change | 355 |
| | (249 | ) | | (177 | ) |
| | | | | | |
| Other comprehensive income (loss) | 1,702 |
| | (1,736 | ) | | (2,443 | ) |
| | | | | | |
| Comprehensive income | $ | 3,002 |
| | 14,804 |
| | 12,966 |
|
| | | | | | |
|
|
|
The tax effects in other comprehensive income for the fiscal years ended 2017, 2016 and 2015 respectively: Securities; $96 million, $104 million and $187 million, Employee Benefit Plans; $83 million, $346 million and $519 million, Derivatives & Hedges; $191 million, $134 million and $95The tax effects in other comprehensive income for the fiscal years 2023, 2022 and 2021 respectively: Foreign Currency Translation; $797 million, $460 million and $346 million; Employee Benefit Plans: $289 million, $461 million and $1,198 million, Derivatives & Hedges: $39 million, $30 million and $263 million. |
|
See Notes to Consolidated Financial Statements
Amounts presented have not been recast to exclude discontinued operations
JOHNSONJohnson & JOHNSON AND SUBSIDIARIES
CONSOLIDATED STATEMENTS OF EQUITY
Johnson and subsidiaries consolidated statements of equity
(Dollars in Millions) (Note 1)
|
| | | | | | | | | | | | | | | |
| | Total | | Retained Earnings | | Accumulated Other Comprehensive Income | | Common Stock Issued Amount | | Treasury Stock Amount |
| Balance, December 28, 2014 | $ | 69,752 |
| | 97,245 |
| | (10,722 | ) | | 3,120 |
| | (19,891 | ) |
| Net earnings | 15,409 |
| | 15,409 |
| | |
| | |
| | |
|
| Cash dividends paid | (8,173 | ) | | (8,173 | ) | | |
| | |
| | |
|
| Employee compensation and stock option plans | 1,920 |
| | (577 | ) | | |
| | |
| | 2,497 |
|
| Repurchase of common stock | (5,290 | ) | |
|
| | |
| | |
| | (5,290 | ) |
| Other | (25 | ) | | (25 | ) | | | | | | |
| Other comprehensive income (loss), net of tax | (2,443 | ) | | | | (2,443 | ) | | |
| | |
|
| Balance, January 3, 2016 | 71,150 |
| | 103,879 |
| | (13,165 | ) | | 3,120 |
| | (22,684 | ) |
| Net earnings | 16,540 |
| | 16,540 |
| | |
| | |
| | |
|
| Cash dividends paid | (8,621 | ) | | (8,621 | ) | | |
| | |
| | |
|
| Employee compensation and stock option plans | 2,130 |
| | (1,181 | ) | | |
| | |
| | 3,311 |
|
| Repurchase of common stock | (8,979 | ) | |
|
| | |
| | |
| | (8,979 | ) |
| Other | (66 | ) | | (66 | ) | | | | | | |
| Other comprehensive income (loss), net of tax | (1,736 | ) | | |
| | (1,736 | ) | | |
| | |
|
| Balance, January 1, 2017 | 70,418 |
| | 110,551 |
| | (14,901 | ) | | 3,120 |
| | (28,352 | ) |
| Net earnings | 1,300 |
| | 1,300 |
| | |
| | |
| | |
|
| Cash dividends paid | (8,943 | ) | | (8,943 | ) | | |
| | |
| | |
|
| Employee compensation and stock option plans | 2,077 |
| | (1,079 | ) | | |
| | |
| | 3,156 |
|
| Repurchase of common stock | (6,358 | ) | |
|
| | |
| | |
| | (6,358 | ) |
| Other | (36 | ) | | (36 | ) | | | | | | |
| Other comprehensive income (loss), net of tax | 1,702 |
| | |
| | 1,702 |
| | |
| | |
|
| Balance, December 31, 2017 | $ | 60,160 |
| | 101,793 |
| | (13,199 | ) | | 3,120 |
| | (31,554 | ) |
| | | | | | | | | | | | | | | | | |
| Total | Retained
Earnings and Additional paid-in capital | Accumulated
Other
Comprehensive
Income (Loss) | Common Stock
Issued
Amount | Treasury
Stock
Amount |
| Balance, January 3, 2021 | $63,278 | 113,890 | (15,242) | 3,120 | (38,490) |
| | | | | |
| Net earnings | 20,878 | 20,878 | | | |
| Cash dividends paid ($4.19 per share) | (11,032) | (11,032) | | | |
| Employee compensation and stock option plans | 2,171 | (676) | | | 2,847 |
| Repurchase of common stock | (3,456) | | | | (3,456) |
| | | | | |
| Other comprehensive income (loss), net of tax | 2,184 | | 2,184 | | |
| Balance, January 2, 2022 | 74,023 | 123,060 | (13,058) | 3,120 | (39,099) |
| | | | | |
| Net earnings | 17,941 | 17,941 | | | |
| Cash dividends paid ($4.45 per share) | (11,682) | (11,682) | | | |
| Employee compensation and stock option plans | 2,466 | (974) | | | 3,440 |
| Repurchase of common stock | (6,035) | | | | (6,035) |
| | | | | |
| Other comprehensive income (loss), net of tax | 91 | | 91 | | |
| Balance, January 1, 2023 | 76,804 | 128,345 | (12,967) | 3,120 | (41,694) |
| | | | | |
| Net earnings | 35,153 | 35,153 | | | |
| Cash dividends paid ($4.70 per share) | (11,770) | (11,770) | | | |
| Employee compensation and stock option plans | 2,193 | (336) | | | 2,529 |
| Repurchase of common stock | (5,054) | | | | (5,054) |
| Other | (25) | | | | (25) |
| Kenvue Separation /IPO (Note 21) | (23,786) | 2,451 | 5,181 | | (31,418) |
| Other comprehensive income (loss), net of tax | (4,741) | | (4,741) | | |
| Balance, December 31, 2023 | $68,774 | 153,843 | (12,527) | 3,120 | (75,662) |
See Notes to Consolidated Financial Statements
JOHNSONJohnson & JOHNSON AND SUBSIDIARIES
CONSOLIDATED STATEMENTS OF CASH FLOWS
Johnson and subsidiaries consolidated statements of cash flows
(Dollars in Millions) (Note 1)
| | | | | | | | | | | |
| 2023 | 2022 | 2021 |
| Cash flows from operating activities | | | |
| Net earnings | $35,153 | 17,941 | 20,878 |
| Adjustments to reconcile net earnings to cash flows from operating activities: | | | |
| Depreciation and amortization of property and intangibles | 7,486 | 6,970 | 7,390 |
| Stock based compensation | 1,162 | 1,138 | 1,135 |
| | | |
| Asset write-downs | 1,295 | 1,216 | 989 |
| | | |
| Charge for purchase of in-process research and development assets | 483 | — | — |
| Gain on Kenvue separation | (20,984) | — | — |
| Net gain on sale of assets/businesses | (117) | (380) | (617) |
| | | |
| Deferred tax provision | (4,194) | (1,663) | (2,079) |
| Credit losses and accounts receivable allowances | — | (17) | (48) |
| Changes in assets and liabilities, net of effects from acquisitions and divestitures: | | | |
| Increase in accounts receivable | (624) | (1,290) | (2,402) |
| Increase in inventories | (1,323) | (2,527) | (1,248) |
| Increase in accounts payable and accrued liabilities | 2,346 | 1,098 | 2,437 |
| (Increase)/Decrease in other current and non-current assets | (3,480) | 687 | (1,964) |
| Increase/(Decrease) in other current and non-current liabilities | 5,588 | (1,979) | (1,061) |
| Net cash flows from operating activities | 22,791 | 21,194 | 23,410 |
| Cash flows from investing activities | | | |
| Additions to property, plant and equipment | (4,543) | (4,009) | (3,652) |
| Proceeds from the disposal of assets/businesses, net | 358 | 543 | 711 |
| Acquisitions, net of cash acquired (Note 18) | — | (17,652) | (60) |
| Purchases of in-process research and development assets (Note 18) | (470) | — | — |
| Purchases of investments | (10,906) | (32,384) | (30,394) |
| Sales of investments | 19,390 | 41,609 | 25,006 |
| Credit support agreements activity, net | (2,963) | (249) | 214 |
| Other (including capitalized licenses and milestones) | 12 | (229) | (508) |
| Net cash from/(used) by investing activities | 878 | (12,371) | (8,683) |
| Cash flows from financing activities | | | |
| Dividends to shareholders | (11,770) | (11,682) | (11,032) |
| Repurchase of common stock | (5,054) | (6,035) | (3,456) |
| Proceeds from short-term debt | 13,743 | 16,134 | 1,997 |
| Repayment of short-term debt | (22,973) | (6,550) | (1,190) |
| Proceeds from long-term debt, net of issuance costs | — | 2 | 5 |
| Repayment of long-term debt | (1,551) | (2,134) | (1,802) |
| Proceeds from the exercise of stock options/employee withholding tax on stock awards, net | 1,094 | 1,329 | 1,036 |
| Credit support agreements activity, net | (219) | (28) | 281 |
|
| | | | | | | | | |
| | 2017 | | 2016 | | 2015 |
| Cash flows from operating activities | |
| | |
| | |
| Net earnings | $ | 1,300 |
| | 16,540 |
| | 15,409 |
|
| Adjustments to reconcile net earnings to cash flows from operating activities: | |
| | |
| | |
| Depreciation and amortization of property and intangibles | 5,642 |
| | 3,754 |
| | 3,746 |
|
| Stock based compensation | 962 |
| | 878 |
| | 874 |
|
| Venezuela adjustments | — |
| | — |
| | 122 |
|
| Asset write-downs | 795 |
| | 283 |
| | 624 |
|
| Net gain on sale of assets/businesses | (1,307 | ) | | (563 | ) | | (2,583 | ) |
| Deferred tax provision | 2,406 |
| | (341 | ) | | (270 | ) |
| Accounts receivable allowances | 17 |
| | (11 | ) | | 18 |
|
| Changes in assets and liabilities, net of effects from acquisitions and divestitures: | |
| | |
| | |
| Increase in accounts receivable | (633 | ) | | (1,065 | ) | | (433 | ) |
| Decrease/(Increase) in inventories | 581 |
| | (249 | ) | | (449 | ) |
| Increase in accounts payable and accrued liabilities | 2,725 |
| | 656 |
| | 287 |
|
| Increase in other current and non-current assets | (411 | ) | | (529 | ) | | (103 | ) |
| Increase/(Decrease) in other current and non-current liabilities | 8,979 |
| | (586 | ) | | 2,327 |
|
| Net cash flows from operating activities | 21,056 |
| | 18,767 |
| | 19,569 |
|
| Cash flows from investing activities | |
| | |
| | |
| Additions to property, plant and equipment | (3,279 | ) | | (3,226 | ) | | (3,463 | ) |
| Proceeds from the disposal of assets/businesses, net | 1,832 |
| | 1,267 |
| | 3,464 |
|
| Acquisitions, net of cash acquired (Note 20) | (35,151 | ) | | (4,509 | ) | | (954 | ) |
| Purchases of investments | (6,153 | ) | | (33,950 | ) | | (40,828 | ) |
| Sales of investments | 28,117 |
| | 35,780 |
| | 34,149 |
|
| Other (primarily intangibles) | (234 | ) | | (123 | ) | | (103 | ) |
| Net cash used by investing activities | (14,868 | ) | | (4,761 | ) | | (7,735 | ) |
| Cash flows from financing activities | | | |
| | |
| Dividends to shareholders | (8,943 | ) | | (8,621 | ) | | (8,173 | ) |
| Repurchase of common stock | (6,358 | ) | | (8,979 | ) | | (5,290 | ) |
| Proceeds from short-term debt | 869 |
| | 111 |
| | 2,416 |
|
| Retirement of short-term debt | (1,330 | ) | | (2,017 | ) | | (1,044 | ) |
Proceeds from long-term debt, net of issuance costs | 8,992 |
| | 12,004 |
| | 75 |
|
| Retirement of long-term debt | (1,777 | ) | | (2,223 | ) | | (68 | ) |
| Proceeds from the exercise of stock options/employee withholding tax on stock awards, net | 1,062 |
| | 1,189 |
| | 1,005 |
|
| Other | (188 | ) | | (15 | ) | | (57 | ) |
| Net cash used by financing activities | (7,673 | ) | | (8,551 | ) | | (11,136 | ) |
| Effect of exchange rate changes on cash and cash equivalents | 337 |
| | (215 | ) | | (1,489 | ) |
| (Decrease)/Increase in cash and cash equivalents | (1,148 | ) | | 5,240 |
| | (791 | ) |
| Cash and cash equivalents, beginning of year (Note 1) | 18,972 |
| | 13,732 |
| | 14,523 |
|
| Cash and cash equivalents, end of year (Note 1) | $ | 17,824 |
| | 18,972 |
| | 13,732 |
|
| | | | | | |
| Supplemental cash flow data | |
| | |
| | |
|
| Cash paid during the year for: | |
| | |
| | |
|
| Interest | $ | 960 |
| | 730 |
| | 617 |
|
| Interest, net of amount capitalized | 866 |
| | 628 |
| | 515 |
|
| Income taxes | 3,312 |
| | 2,843 |
| | 2,865 |
|
| | | | | | |
| | 2023 | | | 2023 | 2022 | 2021 |
| Proceeds of short and long-term debt, net of issuance cost, related to the debt that transferred to Kenvue at separation | | Proceeds of short and long-term debt, net of issuance cost, related to the debt that transferred to Kenvue at separation | 8,047 | — |
| Proceeds from Kenvue initial public offering | | Proceeds from Kenvue initial public offering | 4,241 | — |
| Cash transferred to Kenvue at separation | | Cash transferred to Kenvue at separation | (1,114) | — |
| Other | | Other | (269) | 93 | 114 |
| Net cash used by financing activities | | Net cash used by financing activities | (15,825) | (8,871) | (14,047) |
| Effect of exchange rate changes on cash and cash equivalents | | Effect of exchange rate changes on cash and cash equivalents | (112) | (312) | (178) |
| Increase/(Decrease) in cash and cash equivalents | | Increase/(Decrease) in cash and cash equivalents | 7,732 | (360) | 502 |
| Cash and cash equivalents from continuing operations, beginning of period | | Cash and cash equivalents from continuing operations, beginning of period | 12,889 | 13,309 | 12,697 |
| Cash and cash equivalents from discontinued operations, beginning of period | | Cash and cash equivalents from discontinued operations, beginning of period | 1,238 | 1,178 | 1,288 |
| Cash and cash equivalents, beginning of year (Note 1) | | Cash and cash equivalents, beginning of year (Note 1) | 14,127 | 14,487 | 13,985 |
| | Cash and cash equivalents from continuing operations, end of period | |
| Cash and cash equivalents from continuing operations, end of period | |
| Cash and cash equivalents from continuing operations, end of period | | 21,859 | 12,889 | 13,309 |
| Cash and cash equivalents from discontinued operations, end of period | | Cash and cash equivalents from discontinued operations, end of period | — | 1,238 | 1,178 |
| Cash and cash equivalents, end of year (Note 1) | | Cash and cash equivalents, end of year (Note 1) | $21,859 | 14,127 | 14,487 |
| | Supplemental cash flow data | |
| Supplemental cash flow data | |
| Supplemental cash flow data | | |
| Cash paid during the year for: | | Cash paid during the year for: | |
| Interest | | Interest | $1,836 | 982 | 990 |
| Interest, net of amount capitalized | | Interest, net of amount capitalized | 1,766 | 933 | 941 |
| Income taxes, inclusive of discontinued operations | | Income taxes, inclusive of discontinued operations | 8,574 | 5,223 | 4,768 |
| | Supplemental schedule of non-cash investing and financing activities | |
| Supplemental schedule of non-cash investing and financing activities | |
| Supplemental schedule of non-cash investing and financing activities | | |
| Treasury stock issued for employee compensation and stock option plans, net of cash proceeds/ employee withholding tax on stock awards | | Treasury stock issued for employee compensation and stock option plans, net of cash proceeds/ employee withholding tax on stock awards | $1,435 | 2,114 | 1,811 |
| | | Supplemental schedule of non-cash investing and financing activities | |
| | |
| | |
|
| Treasury stock issued for employee compensation and stock option plans, net of cash proceeds/ employee withholding tax on stock awards | $ | 2,062 |
| | 2,043 |
| | 1,486 |
|
| Conversion of debt | 16 |
| | 35 |
| | 16 |
|
| Acquisitions | |
| | Acquisitions | |
| | | | | | |
| Acquisitions | |
| | |
| | |
| |
| Fair value of assets acquired | $ | 36,937 |
| | 4,586 |
| | 1,174 |
| Fair value of assets acquired | $— | 18,710 | 61 |
| Fair value of liabilities assumed and noncontrolling interests | (1,786 | ) | | (77 | ) | | (220 | ) |
| Net cash paid for acquisitions | $ | 35,151 |
| | 4,509 |
| | 954 |
|
| Fair value of liabilities assumed | | Fair value of liabilities assumed | — | (1,058) | (1) |
| Net cash paid for acquisitions (Note 18) | | Net cash paid for acquisitions (Note 18) | $— | 17,652 | 60 |
See Notes to Consolidated Financial Statements
Amounts presented have not been recast to exclude discontinued operations.
Notes to Consolidated Financial Statements
NOTES TO CONSOLIDATED FINANCIAL STATEMENTS1. Summary of significant accounting policies
| |
1. | Summary of Significant Accounting Policies |
Principles of Consolidationconsolidation
The consolidated financial statements include the accounts of Johnson & Johnson and its subsidiaries (the Company). Intercompany accounts and transactions are eliminated. Columns and rows within tables may not add due to rounding. Percentages have been calculated using actual, non-rounded figures.
Description of the Companycompany and Business Segmentsbusiness segments
The Company has approximately 134,000131,900 employees worldwide engaged in the research and development, manufacture and sale of a broad range of products in the health carehealthcare field. The Company conducts business in virtually all countries of the world and its primary focus is on products related to human health and well-being.
Kenvue IPO/separation and discontinued operations
On May 8, 2023, Kenvue, completed an initial public offering (the IPO) resulting in the issuance of 198,734,444 shares of its common stock, par value $0.01 per share (the “Kenvue Common Stock”), at an initial public offering of $22.00 per share for net proceeds of $4.2 billion. The excess of the net proceeds from the IPO over the net book value of the Johnson & Johnson divested interest was $2.5 billion and was recorded to additional paid-in capital. As of the closing of the IPO, Johnson & Johnson owned approximately 89.6% of the total outstanding shares of Kenvue Common Stock and at July 2, 2023, the non-controlling interest of $1.3 billion associated with Kenvue was reflected in equity attributable to non-controlling interests in the consolidated balance sheet in the fiscal second quarter of 2023.
On August 23, 2023, Johnson & Johnson completed the disposition of an additional 80.1% ownership of the shares of Kenvue through an exchange offer. Following the exchange offer, the Company owns 9.5% of the shares of Kenvue which are accounted for as an equity investment carried at fair value within continuing operations. The historical results of the Consumer Health business (which previously represented the Consumer Health business segment) are reflected as discontinued operations in the Company’s Consolidated Financial Statements through the date of the exchange offer (see Note 21 for additional details). Unless otherwise indicated, the information in the notes to the Consolidated Financial Statements refer only to Johnson & Johnson’s continuing operations.
Business segments
Following the completion of the exchange offer, the Company is organized into threetwo business segments: Consumer, PharmaceuticalInnovative Medicine and Medical Devices.MedTech. The Consumer segment includes a broad range of products used in the baby care, oral care, beauty, over-the-counter pharmaceutical, women’s health and wound care markets. These products are marketed to the general public and sold both to retail outlets and distributors throughout the world. The PharmaceuticalInnovative Medicine segment is focused on sixthe following therapeutic areas, including immunology, infectiousImmunology, Infectious diseases, neuroscience, oncology, pulmonary hypertension,Neuroscience, Oncology, Pulmonary Hypertension, and cardiovascularCardiovascular and metabolicMetabolic diseases. Products in this segment are distributed directly to retailers, wholesalers, distributors, hospitals and health carehealthcare professionals for prescription use. The Medical DevicesMedTech segment includes a broad rangeportfolio of products used in the orthopaedic, surgery, cardiovascular, diabetes careOrthopaedic, Surgery, Interventional Solutions and vision care fields, whichVision fields. These products are distributed to wholesalers, hospitals and retailers, and used principally in the professional fields by physicians, nurses, hospitals, eye care professionals and clinics.
New accounting standards
Accounting StandardRecently adopted accounting standards
ASU 2022-04: Liabilities-Supplier Finance Programs (Topic 405-50) – Disclosure of Supplier Finance Program Obligations
The Company adopted the standard as of the beginning of fiscal year 2023, which requires that a buyer in 2016a supplier finance program disclose additional information about the program for financial statement users.
DuringThe Company has agreements for supplier finance programs with third-party financial institutions. These programs provide participating suppliers the fiscal second quarter of 2016,ability to finance payment obligations from the Company adopted Accounting Standards Update (ASU) 2016-09 Compensation - Stock Compensation: Improvements to Employee Share Based Payment Accounting forwith the reporting of additional tax benefits on share-based compensation that vested or were exercised during the fiscal year.third-party financial institutions. The update requires all excess tax benefits and deficiencies to be recognized asCompany is not a reduction or an increaseparty to the provision for taxes on income. Previously,arrangements between the Company recorded these benefits directlysuppliers and the third-party financial institutions. The Company’s obligations to Retained Earnings.its suppliers, including amounts due, and scheduled payment dates (which have general payment terms of 90 days), are not affected by a participating supplier’s decision to participate in the program.
As of both December 31, 2023, and January 1, 2023, $0.7 billion were valid obligations under the program. The tax benefit for the Company was $353 million for the fiscal year 2016. The standard does not permit retroactive presentation of this benefit to prior fiscal yearsobligations are presented as Accounts payable on the Consolidated Statement of Earnings.
New Accounting StandardsBalance Sheets.
Recently Adopted Accounting Standardsissued accounting standards
Not adopted as of December 31, 2023
ASU 2016-07: Simplifying the Transition2023-07: Segment Reporting (Topic 280) – Improvements to the Equity Method of Accounting
The amendments in the update eliminate the requirement that when an investment qualifies for the use of the equity method as a result of an increase in the level of ownership interest or degree of influence, an investor must adjust the investment, results of operations, and retained earnings retroactively on a step by step basis as if the equity method had been in effect during all previous periods that the investment had been held. The amendments in this update are effective for all entities for fiscal years, and interim periods within those fiscal years, beginning after December 15, 2016. The amendments should be applied prospectively upon their effective date to increases in the level of ownership interest or degree of influence that result in the application of the equity method. The adoption of this standard did not have a material impact on the presentation of the Company's consolidated financial statements.
ASU 2015-11: Simplifying the Measurement of InventoryReportable Segment Disclosures
This update requires inventory to be measured at the lower of cost or net realizable value. Net realizable value is the estimated selling prices in the ordinary course of business, less reasonably predictable costs of completion, disposal and transportation. This update is effective for the Company for allexpanded annual and interim periods beginning after December 15, 2016. The amendments in this update should be applied prospectively. This update did not have any material impact ondisclosures for significant segment expenses that are regularly provided to the Company’s consolidated financial statements.
Recently Issued Accounting Standards
Not Adopted aschief operating decision maker and included within each reported measure of December 31, 2017
ASU 2018-02: Reclassification of Certain Tax Effects from Accumulated Other Comprehensive Income
This update allows a reclassification from accumulated other comprehensive income to retained earnings for stranded tax effects resulting from the Tax Cuts and Job Act enacted in December 2017.segment profit or loss. This update will be effective for the Company for fiscal years beginning after December 15, 20182023, and interimis to be applied retrospectively to all periods within those fiscal years.presented in the financial statements. Early adoption is permitted. The Company does not expectAs this accounting standard to have a material impact on the Company's consolidated financial statements.
ASU 2017-12: Targeted Improvements to Accounting for Hedging Activities
This update makes more financial and nonfinancial hedging strategies eligible for hedge accounting. It also amends the presentation and disclosure requirements and changes how companies assess effectiveness. This update will be effective for the Company for fiscal years beginning after December 15, 2018, and interim periods within those fiscal years. Early adoption is permitted upon its issuance. The Company is currently assessing the impact of the future adoption of this standard on its financial statements.
ASU 2017-07: Improving the Presentation of Net Periodic Pension Cost and Net Periodic Postretirement Benefit Cost
This update requires that an employer disaggregate the service cost component from the other components of net periodic benefit cost (“NPBC”). In addition, only the service cost component will be eligible for capitalization. This update is effective for the Company for all annual and interim periods beginning after December 15, 2017. Early adoption is permitted as of the beginning of an annual period for which financial statements (interim or annual) have not been issued or made available for issuance. The amendments in this Update should be applied retrospectively for the presentation of the service cost component and the other components of NPBC in the income statement and prospectively, on and after the effective date, for the capitalization of the service cost component of NPBC in assets. The Company is assessing the retroactive restatement methodology and impact to the individual line items on Consolidated Statement of Earnings. The Company does not expect there to be a material impact to net earnings.
ASU 2017-01: Clarifying the Definition of a Business
This update narrows the definition of a business by providing a screen to determine when an integrated set of assets and activities is not a business. The screen specifies that an integrated set of assets and activities is not a business if substantially all of the fair value of the gross assets acquired or disposed of is concentrated in a single or a group of similar identifiable assets. This update will be effective for the Company for annual periods beginning after December 15, 2017, including interim periods within those annual periods. Early adoption is permitted. This update should be applied prospectively. The Company does not expect this standard to have a material impact on the Company's consolidated financial statements.
ASU 2016-16: Income Taxes: Intra-Entity Transfers of Assets Other Than Inventory
This update removes the current exception in US GAAP prohibiting entities from recognizing current and deferred income tax expenses or benefits related to transfer of assets, other than inventory, within the consolidated entity. The current exception to defer the recognition of any tax impact on the transfer of inventory within the consolidated entity untilimpacts disclosures, it is sold to a third party remains unaffected. The amendments in this update are effective for public entities for annual reporting periods beginning after December 15, 2017. The results from a preliminary assessment indicate that the adoption of the standard will not have a significant impact on the Company’s financial results. The Company expects to record net adjustments to deferred taxes of approximately $2.0 billion, a decrease to Other Assets of approximately $0.7 billion and an increase to retained earnings of approximately $1.3 billion.
ASU 2016-02: Leases
This update requires the recognition of lease assets and lease liabilities on the balance sheet for all lease obligations and disclosing key information about leasing arrangements. This update requires the recognition of lease assets and lease liabilities by lessees for those leases classified as operating leases under current generally accepted accounting principles. This update will be effective for the Company for all annual and interim periods beginning after December 15, 2018, including interim periods within those fiscal years. Early application is permitted. The Company anticipates that most of its operating leases will result in the recognition of additional assets and the corresponding liabilities on its Consolidated Balance Sheets, however does not expect the standard to have a material impact on the financial position. The actual impact will depend on the Company's lease portfolio at the time of adoption. The Company continues to assess all implications of the standard and related financial disclosures.
ASU 2016-01: Financial Instruments: Recognition and Measurement of Financial Assets and Financial Liabilities
The amendments in this update supersede the guidance to classify equity securities with readily determinable fair values into different categories (that is, trading or available-for-sale) and require equity securities to be measured at fair value with changes in the fair value recognized through net income. The standard amends financial reporting by providing relevant information about an entity’s equity investments and reducing the number of items that are recognized in other comprehensive income. This update will be effective for the Company for annual periods beginning after December 15, 2017, and interim periods within those annual periods. The adoption of this standard will not have a material impact on the Company's consolidated financial statements.Company’s Consolidated Financial Statements.
ASU 2014-09: Revenue from Contracts with Customers2023-09: Income Taxes (Topic 740) - Improvements to Income Tax Disclosures
The amendments replace substantially all current U.S. GAAP guidance on this topicThis update standardizes categories for the effective tax rate reconciliation, requires disaggregation of income taxes and eliminate industry-specific guidance. Early adoption of this standardadditional income tax-related disclosures. This update is permitted but not beforerequired to be effective for the original effective dateCompany for all annual periods and interim reporting
fiscal periods beginning after December 15, 2017. The Company will adopt the2024. As this accounting standard using the modified retrospective method. The adoption of this standardonly impacts disclosures, it will not have a material impact on the Company's consolidated financial statements including the additional disclosure requirements.Company’s Consolidated Financial Statements.
Cash Equivalentsequivalents
The Company classifies all highly liquid investments with stated maturities of three months or less from date of purchase as cash equivalents and all highly liquid investments with stated maturities of greater than three months from the date of purchase as current marketable securities. The Company has a policy of making investments only with commercial institutions that have at least an investment grade credit rating. The Company invests its cash primarily in government securities and obligations, corporate debt securities, money market funds and reverse repurchase agreements (RRAs).
RRAs are collateralized by deposits in the form of Government Securities and Obligations for an amount not less than 102% of their value. The Company does not record an asset or liability as the Company is not permitted to sell or repledge the associated collateral. The Company has a policy that the collateral has at least an A (or equivalent) credit rating. The Company utilizes a third party custodian to manage the exchange of funds and ensure that collateral received is maintained at 102% of the value of the RRAs on a daily basis. RRAs with stated maturities of greater than three months from the date of purchase are classified as marketable securities.
Investments
Investments classified as held to maturity investments are reported at amortized cost and realized gains or losses are reported in earnings. Investments classified as available-for-sale debt securities are carried at estimated fair value with unrealized gains and losses recorded as a component of accumulated other comprehensive income. Available-for-sale securities available for current operations are classified as current assetsassets; otherwise, they are classified as long term. Management determines the appropriate classification of its investment in debt and equity securities at the time of purchase and re-evaluates such determination at each balance sheet date. The Company periodically reviews its investments in equity securities for impairment and adjusts these investments to their fair value when a decline in market value is deemed to be other than temporary. If losses on these securities are considered to be other than temporary, the loss is recognized in earnings.through earnings, as required.
Property, Plantplant and Equipmentequipment and Depreciationdepreciation
Property, plant and equipment are stated at cost. The Company utilizes the straight-line method of depreciation over the estimated useful lives of the assets:
| | | | | |
| |
| Building and building equipment | 20 - 30 years |
| Land and leasehold improvements | 10 - 20 years |
| Machinery and equipment | 2 - 13 years |
The Company capitalizes certain computer software and development costs, included in machinery and equipment, when incurred in connection with developing or obtaining computer software for internal use. Capitalized software costs are amortized over the estimated useful lives of the software, which generally range from 3 to 8 years.
The Company reviews long-lived assets to assess recoverability using undiscounted cash flows. When certain events or changes in operating or economic conditions occur, an impairment assessment may be performed on the recoverability of the
carrying value of these assets. If the asset is determined to be impaired, the loss is measured based on the difference between the asset’s fair value and its carrying value. If quoted market prices are not available, the Company will estimate fair value using a discounted value of estimated future cash flows.
Revenue Recognitionrecognition
The Company recognizes revenue from product sales when obligations under the terms of a contract with the customer are satisfied; generally, this occurs with the transfer of control of the goods to customers. The Company's global payment terms are shipped or delivered and title and risk of loss passtypically between 30 to the customer.90 days. Provisions for certain rebates, sales incentives, trade promotions, coupons, product returns, and discounts to customers and governmental clawback provisions are accounted for as reductionsvariable consideration and recorded as a reduction in sales insales. The liability is recognized within Accrued rebates, returns, and promotions on the same period the related sales are recorded.consolidated balance sheet.
Product discounts granted are based on the terms of arrangements with direct, indirect and other market participants, as well as market conditions, including prices charged by competitors.consideration of competitor pricing. Rebates which include Medicaid, are estimated based on contractual terms, historical experience, patient outcomes, trend analysis and projected market conditions in the various markets served. A significant portion of the liability related to rebates is from the sale of the Company's pharmaceutical products within the U.S., primarily the Managed Care, Medicare and Medicaid programs, which amounted to $11.5 billion and $9.6 billion as of December 31, 2023 and January 1, 2023, respectively. The Company evaluates market conditions for products or groups of products primarily through the analysis of wholesaler and other third-party sell-through and market research data, as well as internally generated information.
Sales returns are generally estimated and recorded based on historical sales and returns information. Products that exhibit unusual sales or return patterns due to dating, competition or other marketing matters are specifically investigated and analyzed as part of the accounting for sales returnsreturn accruals.
Sales returns allowances represent a reserve for products that may be returned due to expiration, destruction in the field, or in specific areas, product recall. The sales returns reserve is based on historical return trends by product and by market as a percent to gross sales. In accordance with the Company’s accounting policies, the Company generally issues credit to customers for
returned goods. The Company’s sales returns reserves are accounted for in accordance with the U.S. GAAP guidance for revenue recognition when right of return exists. Sales returns reserves are recorded at full sales value. Sales returns in the Consumer and PharmaceuticalInnovative Medicine segments are almost exclusively not resalable. Sales returns for certain franchises in the Medical DevicesMedTech segment are typically resalable but are not material. The Company infrequently exchanges products from inventory for returned products. The sales returns reserve for the total Company has been approximatelyless than 1.0% of annual net trade sales to customers during each of the fiscal reporting years 2017, 20162023, 2022 and 2015.2021.
Promotional programs, such as product listing allowances and cooperative advertising arrangements, are recorded in the year incurred. Continuing promotional programssame period as related sales and include coupons and volume-based sales incentive programs. The redemption cost of consumer coupons is based on historical redemption experience by product and value. Volume-based incentive programs are based on the estimated sales volumes for the incentive period and are recorded as products are sold. The Company also earns service revenue for co-promotion of certain products and includes it in sales to customers. These arrangements are evaluated to determine the appropriate amounts to be deferred or recorded as a reduction of revenue. The Company also earns profit-share payments through collaborative arrangements of certain products, which are included in sales to customers. Profit-share payments were less than 2.0% of the total revenues in fiscal year 2023 and less than 3.0% of the total revenues in the fiscal years 2022 and 2021 and are included in sales to customers.
See Note 17 to the Consolidated Financial Statements for further disaggregation of revenue.
Shipping and Handlinghandling
Shipping and handling costs incurred were $1,042 million, $974 million$0.9 billion, $0.8 billion and $996 million$0.8 billion in 2017, 2016fiscal years 2023, 2022 and 2015,2021, respectively, and are included in selling, marketing and administrative expense. The amount of revenue received for shipping and handling is less than 0.5%1.0% of sales to customers for all periods presented.
Inventories
Inventories are stated at the lower of cost or net realizable value determined by the first-in, first-out method.
Intangible Assetsassets and Goodwillgoodwill
The authoritative literature on U.S. GAAP requires that goodwill and intangible assets with indefinite lives be assessed annually for impairment. The Company completed theits annual impairment test for 20172023 in the fiscal fourth quarter. Future impairment
tests will be performed annually in the fiscal fourth quarter, or sooner if warranted. Purchased in-process research and development is accounted for as an indefinite lived intangible asset until the underlying project is completed, at which point the intangible asset will be accounted for as a definite lived intangible asset, or abandoned, at which pointasset. If warranted the intangible asset willpurchased in-process research and development could be written off or partially impaired.impaired depending on the underlying program.
Intangible assets that have finite useful lives continue to be amortized over their useful lives, and are reviewed for impairment when warranted by economic conditions. See Note 5 for further details on Intangible Assets and Goodwill.
Financial Instrumentsinstruments
As required by U.S. GAAP, all derivative instruments are recorded on the balance sheet at fair value. Fair value is the exit
price that would be received to sell an asset or paid to transfer a liability. Fair value is a market-based measurement determined using assumptions that market participants would use in pricing an asset or liability. The authoritative literature establishes a three-level hierarchy to prioritize the inputs used in measuring fair value, with Level 1 having the highest priority and Level 3 having the lowest. Changes in the fair value of derivatives are recorded each period in current earnings or other comprehensive income, depending on whether the derivative is designated as part of a hedge transaction, and if so, the type of hedge transaction.
The Company documents all relationships between hedged items and derivatives. The overall risk management strategy includes reasons for undertaking hedge transactions and entering into derivatives. The objectives of this strategy are: (1) minimize foreign currency exposure’s impact on the Company’s financial performance; (2) protect the Company’s cash flow from adverse movements in foreign exchange rates; (3) ensure the appropriateness of financial instruments; and (4) manage the enterprise risk associated with financial institutions. See Note 6 for additional information on Financial Instruments.
Leases
The Company determines whether an arrangement is a lease at contract inception by establishing if the contract conveys the right to control the use of identified property, plant, or equipment for a period of time in exchange for consideration. Right of Use (ROU) Assets and Lease Liabilities for operating leases are included in Other assets, Accrued liabilities, and Other liabilities on the consolidated balance sheet. The ROU Assets represent the right to use an underlying asset for the lease term and lease liabilities represent an obligation to make lease payments arising from the lease. Commitments under finance leases are not significant, and are included in Property, plant and equipment, Loans and notes payable, and Long-term debt on the consolidated balance sheet.
ROU Assets and Lease Liabilities are recognized at the lease commencement date based on the present value of all minimum lease payments over the lease term. The Company uses its incremental borrowing rate based on the information available at commencement date in determining the present value of lease payments, when the implicit rate is not readily determinable. Lease terms may include options to extend or terminate the lease. These options are included in the lease term when it is reasonably certain that the Company will exercise that option. Operating lease expense is recognized on a straight-line basis over the lease term. The Company has elected the following policy elections on adoption: use of portfolio approach on leases of assets under master service agreements, exclusion of short term leases on the balance sheet, and not separating lease and non-lease components.
The Company primarily has operating lease for space, vehicles, manufacturing equipment and data processing equipment. The ROU asset pertaining to leases from continuing operation was $1.0 billion in both fiscal years 2023 and 2022. The lease liability from continuing operations was $1.1 billion in both fiscal years 2023 and 2022. The operating lease costs from continuing operations were $0.2 billion in fiscal years 2023, 2022 and 2021. Cash paid for amounts included in the measurement of lease liabilities from continuing operations were $0.2 billion in fiscal years 2023, 2022 and 2021.
Product Liabilityliability
Accruals for product liability claims are recorded, on an undiscounted basis, when it is probable that a liability has been incurred and the amount of the liability can be reasonably estimated based on existing information and actuarially determined estimates where applicable. The accruals are adjusted periodically as additional information becomes available. The Company accrues an estimate of the legal defense costs needed to defend each matter when those costs are probable and can be reasonably estimated.
As a result of cost and availability factors, effective November 1, 2005, To the extent adverse verdicts have been rendered against the Company, ceased purchasing third-party product liability insurance. the Company does not record an accrual until a loss is determined to be probable and can be reasonably estimated.
The Company has self insurance through a wholly-owned captive insurance company. In addition to accruals in the self insurance program, claims that exceed the insurance coverage are accrued when losses are probable and amounts can be reasonably estimated.
Research and Developmentdevelopment
Research and development expenses are expensed as incurred.incurred in accordance with ASC 730, Research and Development. Upfront and milestone payments made to third parties in connection with research and development collaborations are expensed as incurred up to the point of regulatory approval.
Payments made to third parties subsequent to regulatory approval are capitalized and amortized over the remaining useful life of the related product. Amounts capitalized for such payments are included in other intangibles, net of accumulated amortization.
The Company enters into collaborative arrangements, typically with other pharmaceutical or biotechnology companies, to develop and commercialize drug candidates or intellectual property. These arrangements typically involve two (or more) parties who are active participants in the collaboration and are exposed to significant risks and rewards dependent on the commercial success of the activities. These collaborations usually involve various activities by one or more parties, including research and development, marketing and selling and distribution. Often, these collaborations require upfront, milestone and royalty or profit share payments, contingent upon the occurrence of certain future events linked to the success of the asset in development. Amounts due from collaborative partners related to development activities are generally reflected as a reduction of research and development expense because the performance of contract development services is not central to the Company’s operations. In general, the income statement presentation for these collaborations is as follows:
| | | | | | | | |
| | |
| Nature/Type of Collaboration | | Statement of Earnings Presentation |
| Third-party sale of product & profit share payments received | | Sales to customers |
| Royalties/milestones paid to collaborative partner (post-regulatory approval)* | | Cost of products sold |
| Royalties received from collaborative partner | | Other income (expense), net |
| Upfront payments & milestones paid to collaborative partner (pre-regulatory approval) | | Research and development expense |
| Research and development payments to collaborative partner | | Research and development expense |
| Research and development payments received from collaborative partner or government entity | | Reduction of Research and development expense |
|
| |
| * | Milestones are capitalized as intangible assets and amortized to cost of products sold over the useful life. |
For all years presented, there was no individual project that represented greater than 5% of the total annual consolidated research and development expense.
The Company has a number of products and compounds developed in collaboration with strategic partners including XARELTO,®, co-developed with Bayer HealthCare AG and IMBRUVICA,®, developed in collaboration and co-marketed with Pharmacyclics LLC, an AbbVie company.
Separately, the Company has a number of licensing arrangements for products and compounds including DARZALEX, licensed from Genmab A/S.
Advertising
Costs associated with advertising are expensed in the year incurred and are included in selling, marketing and administrative expenses. Advertising expenses worldwide, which comprised television, radio, print media and Internet advertising, were $2.5$0.5 billion, $2.4$0.7 billion and $2.5$1.2 billion in 2017, 2016fiscal years 2023, 2022 and 2015,2021, respectively.
Income Taxestaxes
Income taxes are recorded based on amounts refundable or payable for the current year and include the results of any difference between U.S. GAAP accounting and tax reporting, recorded as deferred tax assets or liabilities. The Company
estimates deferred tax assets and liabilities based on enacted tax regulations and rates. Future changes in tax laws and rates may affect recorded deferred tax assets and liabilities in the future.
The Company has unrecognized tax benefits for uncertain tax positions. The Company follows U.S. GAAP which prescribes a recognition threshold and measurement attribute for the financial statement recognition and measurement of a tax position taken or expected to be taken in a tax return. Management believes that changes in these estimates would not have a material effect on the Company's results of operations, cash flows or financial position.
In the fourth quarter of 2017, the United States enacted into law new U.S. tax legislation, the U.S. Tax Cuts and Jobs Act (TCJA). This law included provisions for a comprehensive overhaul of the corporate income tax code, including a reduction of the statutory corporate tax rate from 35% to 21%, effective on January 1, 2018. The TCJA which includes provisionsincluded a provision for a tax on all previously undistributed earnings of U.S. companies located in foreign jurisdictions. Undistributed earnings in the form of cash and cash equivalents were taxed at a rate of 15.5% and all other earnings were taxed at a rate of 8.0%. This tax is payable over 8 years and will not accrue interest. These payments began in 2018 and will continue through 2025. The remaining balance at the end of the 2023 was approximately $4.5 billion, of which $2.5 billion is classified as noncurrent and reflected as “Long-term taxes payable” on the Company’s balance sheet.
The TCJA also includes provisions for a tax on global intangible low-taxed income (GILTI). GILTI is described as the excess of a U.S. shareholder’s total net foreign income over a deemed return on tangible assets, as provided by the TCJA. In January 2018, the FASB issued guidance that allows companies to elect as an accounting policy whether to record the tax effects of GILTI in the period the tax liability is generated (i.e., “period cost”) or provide for deferred tax assets and liabilities related to basis differences that exist and are expected to effect the amount of GILTI inclusion in future years upon reversal (i.e., “deferred method”). The Company has provisionally booked a $10.1 billion chargeelected to account for GILTI under the deferred method. The deferred tax amounts recorded are based on thesethe evaluation of temporary differences that are expected to reverse as GILTI is incurred in future periods.
The Company has recorded deferred tax liabilities on all undistributed earnings in 2017. Additionally, the Company has provisionally recorded a $4.5 billion deferred tax liability for foreign local and withholding taxes, offset by a $1.1 billion deferred tax asset for U.S. foreign tax credits, for repatriation of substantially all undistributed foreign earnings.prior to December 31, 2017 from its international subsidiaries. The Company is currently evaluating the remaining undistributed foreign earnings for which it has not provided deferred taxes for foreign local and withholding tax, as theseon the undistributed earnings subsequent to January 1, 2018 from certain international subsidiaries where the earnings are considered to be indefinitely reinvested. The Company intends to continue to reinvest these earnings in those international operations. If the Company decides at a later date to repatriate these earnings to the U.S., the Company would be required to provide for the net tax effects on these amounts. The Company estimates that the tax effect of this repatriation would be approximately $0.5 billion under currently enacted tax laws and regulations and at current currency exchange rates. This amount does not include the possible benefit of these unrecorded deferred taxes is not expected to be material.U.S. foreign tax credits, which may substantially offset this cost.
See Note 8 to the Consolidated Financial Statements for further information regarding income taxes.
Net Earnings Per Shareearnings per share
Basic earnings per share is computed by dividing net earnings available to common shareholders by the weighted average number of common shares outstanding for the period. Diluted earnings per share reflects the potential dilution that could occur if securities were exercised or converted into common stock using the treasury stock method.
Use of Estimatesestimates
The preparation of consolidated financial statements in conformity with accounting principles generally accepted in the U.S. requires management to make estimates and assumptions that affect the amounts reported. Estimates are used when accounting for sales discounts, rebates, allowances and incentives, product liabilities, income taxes, withholding taxes, depreciation, amortization, employee benefits, contingencies and intangible asset and liability valuations. Actual results may or may not differ from those estimates.
The Company follows the provisions of U.S. GAAP when recording litigation related contingencies. A liability is recorded when a loss is probable and can be reasonably estimated. The best estimate of a loss within a range is accrued; however, if no estimate in the range is better than any other, the minimum amount is accrued.
Annual Closing Dateclosing date
The Company follows the concept of a fiscal year, which ends on the Sunday nearest to the end of the month of December. Normally each fiscal year consists of 52 weeks, but every five or six years the fiscal year consists of 53 weeks,, and therefore includes additional shipping days, as was the case in 2015,fiscal year 2020, and will be the case again in 2020.fiscal year 2026.
Certain prior period amounts have been reclassified to conform to current year presentation.
| | | | | |
2.2023 Annual Report | Cash, Cash Equivalents and Current Marketable Securities55 |
2. Cash, cash equivalents and current marketable securities
At the end of 2017the fiscal year 2023 and 2016,2022, cash, cash equivalents and current marketable securities were comprised of:comprised: | | | | | | | | | | | | | | | | | | | | | | | | | | | | | | | | | | |
| (Dollars in Millions) | | 2023 |
| Carrying
Amount | | | | Unrecognized
Loss | | Estimated
Fair Value | Cash & Cash
Equivalents | | Current
Marketable
Securities |
| Cash | | $3,340 | | | | — | | 3,340 | | 3,340 | | — |
| | | | | | | | | | | | |
Non-U.S. Sovereign Securities(1) | | 522 | | | | — | | 522 | | 174 | | 348 |
| U.S. Reverse repurchase agreements | | 4,377 | | | | — | | 4,377 | | 4,377 | | — |
| | | | | | | | | | | | |
Corporate debt securities(1) | | 338 | | | | — | | 338 | | 189 | | 149 |
| Money market funds | | 4,814 | | | | — | | 4,814 | | 4,814 | | — |
Time deposits(1) | | 662 | | | | — | | 662 | | 662 | | — |
| Subtotal | | $14,053 | | | | — | | 14,053 | | 13,556 | | 497 |
| | | | | | | | | | | | |
| U.S. Gov't Securities | | $8,562 | | | | — | | 8,562 | | 8,259 | | 303 |
| U.S. Gov't Agencies | | 71 | | | | (1) | | 70 | | — | | 70 |
| Other Sovereign Securities | | 5 | | | | — | | 5 | | 1 | | 4 |
| Corporate and other debt securities | | 237 | | | | — | | 237 | | 43 | | 194 |
| | | | | | | | | | | | |
Subtotal available for sale(2) | | $8,875 | | | | (1) | | 8,874 | | 8,303 | | 571 |
| | | | | | | | | | | | |
| Total cash, cash equivalents and current marketable securities | | | | | | | | | | $21,859 | | 1,068 |
| | | | | | | | | | | | | | | | | | | | | | | | | | | | | | | | | | |
| (Dollars in Millions) | | 2022 |
| Carrying Amount | | | | Unrecognized Loss | | Estimated Fair Value | Cash & Cash Equivalents | | Current Marketable Securities |
| Cash | | $3,691 | | | | — | | 3,691 | | 3,691 | | — |
| | | | | | | | | | | | |
| | | | | | | | | | | | |
| U.S. Reverse repurchase agreements | | 1,419 | | | | — | | 1,419 | | 1,419 | | — |
| | | | | | | | | | | | |
Corporate debt securities(1) | | 873 | | | | (1) | | 872 | | — | | 873 |
| Money market funds | | 5,368 | | | | — | | 5,368 | | 5,368 | | — |
Time deposits(1) | | 443 | | | | — | | 443 | | 443 | | — |
| Subtotal | | 11,794 | | | | (1) | | 11,793 | | 10,921 | | 873 |
| | | | | | | | | | | | |
| U.S. Gov't Securities | | $9,959 | | | | (28) | | 9,931 | | 1,922 | | 8,009 |
| U.S. Gov't Agencies | | 210 | | | | (5) | | 205 | | — | | 205 |
| | | | | | | | | | | | |
| Corporate and other debt securities | | 352 | | | | (1) | | 351 | | 46 | | 305 |
| | | | | | | | | | | | |
Subtotal available for sale(2) | | $10,521 | | | | (34) | | 10,487 | | 1,968 | | 8,519 |
| | | | | | | | | | | | |
| Total cash, cash equivalents and current marketable securities | | | | | | | | | | $12,889 | | 9,392 |
|
| | | | | | | | | | | | | | | |
| (Dollars in Millions) | | 2017 |
| | | Carrying Amount | | | Estimated Fair Value | | Cash & Cash Equivalents | | Current Marketable Securities |
| Cash | | $ | 2,929 |
| | | 2,929 |
| | $ | 2,929 |
| | — |
|
U.S. Gov't Securities(1) | | — |
| | | — |
| | — |
| | — |
|
Other Sovereign Securities(1) | | 279 |
| | | 279 |
| | 219 |
| | 60 |
|
| U.S. Reverse repurchase agreements | | 4,025 |
| | | 4,025 |
| | 4,025 |
| | — |
|
| Other Reverse repurchase agreements | | — |
| | | — |
| | — |
| | — |
|
Corporate debt securities(1) | | 289 |
| | | 289 |
| | 244 |
| | 45 |
|
| Money market funds | | 4,288 |
| | | 4,288 |
| | 4,288 |
| | — |
|
Time deposits(1) | | 1,176 |
| | | 1,176 |
| | 1,175 |
| | 1 |
|
| Subtotal | | $ | 12,986 |
| | | 12,986 |
| | 12,880 |
| | 106 |
|
| | | | | | | | | | |
| | | | | | | | | | |
| Gov't Securities | | $ | 4,864 |
| | | 4,864 |
| | 4,833 |
| | 31 |
|
| Other Sovereign Securities | | 186 |
| | | 186 |
| | 80 |
| | 106 |
|
| Corporate debt securities | | 260 |
| | | 260 |
| | 31 |
| | 229 |
|
Subtotal available for sale(2) | | $ | 5,310 |
| | | 5,310 |
| | 4,944 |
| | 366 |
|
| | | | | | | | | | |
| Total cash, cash equivalents and current marketable securities | |
|
| | | | | $ | 17,824 |
| | 472 |
|
In 2017, the carrying amount was the same as the estimated fair value.
|
| | | | | | | | | | | | | | | | | | | | |
| (Dollars in Millions) | | 2016 |
| | | Carrying Amount | | Unrecognized Gain | | Unrecognized Loss | | Estimated Fair Value | | Cash Equivalents | | Current Marketable Securities |
| Cash | | $ | 1,979 |
| | — |
| | — |
| | 1,979 |
| | 1,979 |
| | — |
|
U.S. Gov't Securities(1) | | 10,832 |
| | — |
| | (1 | ) | | 10,831 |
| | 2,249 |
| | 8,583 |
|
Other Sovereign Securities(1) | | 1,299 |
| | — |
| | — |
| | 1,299 |
| | 120 |
| | 1,179 |
|
| U.S. Reverse repurchase agreements | | 6,103 |
| | — |
| | — |
| | 6,103 |
| | 6,103 |
| | — |
|
| Other Reverse repurchase agreements | | 240 |
| | — |
| | — |
| | 240 |
| | 240 |
| | — |
|
Corporate debt securities(1) | | 754 |
| | — |
| | — |
| | 754 |
| | — |
| | 754 |
|
| Money market funds | | 7,187 |
| | — |
| | — |
| | 7,187 |
| | 7,187 |
| | — |
|
Time deposits(1) | | 1,094 |
| | — |
| | — |
| | 1,094 |
| | 1,094 |
| | — |
|
| Subtotal | | $ | 29,488 |
| | — |
| | (1 | ) | | 29,487 |
| | 18,972 |
| | 10,516 |
|
| | | | | | | | | | | | | |
| | | | | Unrealized Gain | | Unrealized Loss | | | | | | |
| Gov't Securities | | $ | 10,277 |
| | 5 |
| | (51 | ) | | 10,231 |
| | — |
| | 10,231 |
|
| Other Sovereign Securities | | 90 |
| | — |
| | — |
| | 90 |
| | | | 90 |
|
| Corporate debt securities | | 1,777 |
| | 1 |
| | (12 | ) | | 1,766 |
| | — |
| | 1,766 |
|
| Equity investments | | 34 |
| | 298 |
| | — |
| | 332 |
| | | | 332 |
|
Subtotal available for sale(2) | | $ | 12,178 |
| | 304 |
| | (63 | ) | | 12,419 |
| | — |
| | 12,419 |
|
| | | | | | | | | | | | | |
| Total cash, cash equivalents and current marketable securities | | | | | | | | | | $ | 18,972 |
| | 22,935 |
|
(1)Held to maturity investments are reported at amortized cost and realized gains or losses are reported in earnings.
(2)Available for sale debt securities are reported at fair value with unrealized gains and losses reported net of taxes in other comprehensive income.
Fair value of government securities and obligations and corporate debt securities were estimated using quoted broker prices and significant other observable inputs.
The contractual maturities of the available for sale debt securities at December 31,
20172023 are as follows:
| | | (Dollars in Millions) | | Cost Basis | | Fair Value | (Dollars in Millions) | Cost Basis | | Fair Value |
| Due within one year | | $ | 5,214 |
| | 5,214 |
| Due within one year | | $8,865 | | 8,864 |
| Due after one year through five years | | 96 |
| | 96 |
| Due after one year through five years | | 10 |
| Due after five years through ten years | | — |
| | — |
| Due after five years through ten years | | — |
| Total debt securities | | $ | 5,310 |
| | 5,310 |
| Total debt securities | | $8,875 | | 8,874 |
The Company invests its excess cash in both deposits with major banks throughout the world and other high-quality money market instruments. The Company has a policy of making investments only with commercial institutions that have at least an investment grade credit rating.
3. Inventories
At the end of 2017fiscal years 2023 and 2016,2022, inventories were comprised of:comprised:
| | | | | | | | | | | | | | |
| (Dollars in Millions) | | 2023 | | 2022 |
| Raw materials and supplies | | $2,355 | | 1,719 |
| Goods in process | | 1,952 | | 1,577 |
| Finished goods | | 6,874 | | 6,972 |
| Total inventories | | $11,181 | | 10,268 |
4. Property, plant and equipment
|
| | | | | | | |
| (Dollars in Millions) | | 2017 | | 2016 |
| Raw materials and supplies | | $ | 1,140 |
| | 952 |
|
| Goods in process | | 2,317 |
| | 2,185 |
|
| Finished goods | | 5,308 |
| | 5,007 |
|
| Total inventories | | $ | 8,765 |
| | 8,144 |
|
| |
4. | Property, Plant and Equipment |
At the end of 2017fiscal years 2023 and 2016,2022, property, plant and equipment at cost and accumulated depreciation were:
| | | | | | | | | | | | | | |
| (Dollars in Millions) | | 2023 | | 2022 |
| Land and land improvements | | $795 | | 784 |
| Buildings and building equipment | | 12,375 | | 11,470 |
| Machinery and equipment | | 28,979 | | 26,603 |
| Construction in progress | | 5,627 | | 4,677 |
| Total property, plant and equipment, gross | | $47,776 | | 43,534 |
| Less accumulated depreciation | | 27,878 | | 25,552 |
| Total property, plant and equipment, net | | $19,898 | | 17,982 |
|
| | | | | | | |
| (Dollars in Millions) | | 2017 | | 2016 |
| Land and land improvements | | $ | 829 |
| | 753 |
|
| Buildings and building equipment | | 11,240 |
| | 10,112 |
|
| Machinery and equipment | | 25,949 |
| | 23,554 |
|
| Construction in progress | | 3,448 |
| | 3,354 |
|
| Total property, plant and equipment, gross | | $ | 41,466 |
| | 37,773 |
|
| Less accumulated depreciation | | 24,461 |
| | 21,861 |
|
| Total property, plant and equipment, net | | $ | 17,005 |
| | 15,912 |
|
The Company capitalizes interest expense as part of the cost of construction of facilities and equipment. Interest expense capitalized in 2017, 2016fiscal years 2023, 2022 and 20152021 was $94$70 million, $102$49 million and $102$49 million, respectively.
Depreciation expense, including the amortization of capitalized interest in 2017, 2016fiscal years 2023, 2022 and 20152021 was $2.6 billion, $2.5$2.4 billion and $2.5$2.4 billion, respectively.
Upon retirement or other disposal of property, plant and equipment, the costs and related amounts of accumulated depreciation or amortization are eliminated from the asset and accumulated depreciation accounts, respectively. The difference, if any, between the net asset value and the proceeds are recorded in earnings.
| | | | | |
5.2023 Annual Report | Intangible Assets and Goodwill57 |
5. Intangible assets and goodwill
At the end of 2017fiscal years 2023 and 2016,2022, the gross and net amounts of intangible assets were:
| | | | | | | | | | | | | | |
| (Dollars in Millions) | | 2023 | | 2022 |
| Intangible assets with definite lives: | | | | |
| Patents and trademarks — gross | | $40,417 | | 39,388 |
| Less accumulated amortization | | (24,808) | | (20,616) |
| Patents and trademarks — net | | $15,609 | | 18,772 |
| Customer relationships and other intangibles — gross | | $20,322 | | 19,764 |
| Less accumulated amortization | | (12,685) | | (11,363) |
Customer relationships and other intangibles — net(1) | | $7,637 | | 8,401 |
| Intangible assets with indefinite lives: | | | | |
| Trademarks | | $1,714 | | 1,630 |
| Purchased in-process research and development | | 9,215 | | 9,686 |
| Total intangible assets with indefinite lives | | $10,929 | | 11,316 |
| Total intangible assets — net | | $34,175 | | 38,489 |
|
| | | | | | | |
| (Dollars in Millions) | | 2017 | | 2016 |
| Intangible assets with definite lives: | | |
| | |
|
| Patents and trademarks — gross | | $ | 36,427 |
| | 10,521 |
|
| Less accumulated amortization | | 7,223 |
| | 5,076 |
|
| Patents and trademarks — net | | $ | 29,204 |
| | 5,445 |
|
| Customer relationships and other intangibles — gross | | $ | 20,204 |
| | 17,615 |
|
| Less accumulated amortization | | 7,463 |
| | 6,515 |
|
| Customer relationships and other intangibles — net | | $ | 12,741 |
| | 11,100 |
|
| Intangible assets with indefinite lives: | | |
| | |
|
| Trademarks | | $ | 7,082 |
| | 6,888 |
|
| Purchased in-process research and development | | 4,201 |
| | 3,443 |
|
| Total intangible assets with indefinite lives | | $ | 11,283 |
| | 10,331 |
|
| Total intangible assets — net | | $ | 53,228 |
| | 26,876 |
|
Goodwill as of December 31, 20172023 and January 1, 2017,2023, as allocated by segment of business, was as follows:
| | | | | | | | | | | | | | | | | | | | | | | |
| (Dollars in Millions) | | | Innovative
Medicine | | MedTech | | Total |
| Goodwill at January 2, 2022 | | | $10,580 | | 14,856 | | 25,436 |
| Goodwill, related to acquisitions | | | — | | 11,056 | | 11,056 |
| Goodwill, related to divestitures | | | — | | — | | — |
| Currency translation/other | | | (396) | | (49) | | (445) |
| Goodwill at January 1, 2023 | | | 10,184 | | 25,863 | | 36,047 |
| Goodwill, related to acquisitions | | | — | | — | | — |
| Goodwill, related to divestitures | | | — | | — | | — |
| Currency translation/other | | | 223 | | 288 | * | 511 |
| Goodwill at December 31, 2023 | | | $10,407 | | 26,151 | | 36,558 |
|
| | | | | | | | | | | | | |
| (Dollars in Millions) | | Consumer | | Pharmaceutical | | Medical Devices | | Total |
| Goodwill at January 3, 2016 | | $ | 7,240 |
| | 2,889 |
| | 11,500 |
| | 21,629 |
|
| Goodwill, related to acquisitions | | 1,362 |
| | — |
| | 210 |
| | 1,572 |
|
| Goodwill, related to divestitures | | (63 | ) | | (12 | ) | | — |
| | (75 | ) |
| Currency translation/other | | (276 | ) | | (37 | ) | | (8 | ) | | (321 | ) |
| Goodwill at January 1, 2017 | | $ | 8,263 |
| | 2,840 |
| | 11,702 |
| | 22,805 |
|
| Goodwill, related to acquisitions | | 102 |
| | 6,161 |
| | 2,200 |
| | 8,463 |
|
| Goodwill, related to divestitures | | (74 | ) | | (1 | ) | | (102 | ) | | (177 | ) |
| Currency translation/other | | 584 |
| | 109 |
| | 122 |
| | 815 |
|
| Goodwill at December 31, 2017 | | $ | 8,875 |
| | 9,109 |
| | 13,922 |
| | 31,906 |
|
*Includes purchase price allocation adjustments for Abiomed
The weighted average amortization periodsperiod for patents and trademarks andis approximately 11 years. The weighted average amortization period for customer relationships and other intangible assets are 12 years and 23 years, respectively.is approximately 19 years. The amortization expense of amortizable assets included in costCost of products sold was $3.0$4.5 billion, $1.2$3.9 billion and $1.2$4.2 billion before tax, for the fiscal years ended December 31, 2017,2023, January 1, 20172023 and January 3, 2016,2, 2022, respectively. The estimated amortization expense for the five succeeding years approximates $4.4 billion before tax, per year. Intangible asset write-downs are included in Other (income) expense, net.
The primary driver of the increaseestimated amortization expense related to intangible assets and goodwillfor approved products, before tax, for the five succeeding years is related to the Actelion acquisition in the fiscal second quarter of 2017, which resulted in the recording of $25.0 billion to intangible assets and $6.2 billion to goodwill. The intangible assets and goodwill amounts related to the Actelion acquisition are based on the preliminary purchase price allocation. Additionally, the Abbott Medical Optics (AMO) acquisition in the fiscal first quarter of 2017, resulted in the recording of $2.3 billion to intangible assets and $1.7 billion to goodwill. The intangible assets and goodwill amounts related to the AMO acquisition are based on the final purchase price allocation.approximately:
| | | | | | | | | | | | | | | | | | | | | | | | | | |
| (Dollars in Millions) | | | | | | |
| 2024 | | 2025 | | 2026 | | 2027 | | 2028 |
| $4,300 | | 3,500 | | 2,900 | | 2,300 | | 1,600 |
See Note 2018 to the Consolidated Financial Statements for additional details related to acquisitions and divestitures.
| | | | | |
6.58 | Fair Value Measurements |
6. Fair value measurements
The Company uses forward foreign exchange contracts to manage its exposure to the variability of cash flows, primarily related to the foreign exchange rate changes of future intercompany products and third-party purchases of materials denominated in a foreign currency. The Company uses cross currency interest rate swaps to manage currency risk primarily related to borrowings. The Company also uses equity collar contracts to manage exposure to market risk associated with certain equity investments. All threeBoth types of derivatives are designated as cash flow hedges.
Additionally, the Company primarily uses interest rate swaps as an instrument to manage interest rate risk related to fixed rate borrowings. These derivatives are designated as fair value hedges. The Company uses cross currency interest rate swaps and forward foreign exchange contracts designated as net investment hedges. Additionally, the Company uses forward foreign exchange contracts to offset its exposure to certain foreign currency assets and liabilities. These forward foreign exchange contracts are not designated as hedges and therefore, changes in the fair values of these derivatives are recognized in earnings, thereby offsetting the current earnings effect of the related foreign currency assets and liabilities.
The Company does not enter into derivative financial instruments for trading or speculative purposes, or that contain credit risk related contingent features. During the fiscal second quarter of 2017, theThe Company entered intomaintains credit support agreements (CSA) with certain derivative counterparties establishing collateral thresholds based on respective credit ratings and netting agreements. As of December 31, 2017,2023 and January 1, 2023, the total amount of cash collateral paid by the Company under the credit support agreements (CSA)CSA amounted to $162 million net. For equity collar contracts, the Company pledged the underlying hedged marketable equity securities$4.0 billion and $0.8 billion net respectively, related to the counter-party as collateral.net investment and cash flow hedges. On an ongoing basis, the Company monitors counter-party credit ratings. The Company considers credit non-performance risk to be low, because the Company primarily enters into agreements with commercial institutions that have at least an investment grade credit rating. Refer to the table on significant financial assets and liabilities measured at fair value contained in this footnote for receivables and payables with these commercial institutions. As of December 31, 2017,2023, the Company had notional amounts outstanding for forward foreign exchange contracts, cross currency interest rate swaps and interest rate swaps of $34.5$42.9 billion, $2.3$39.7 billion and $1.1$10.0 billion, respectively. As of January 1, 2017,2023, the Company had notional amounts outstanding for forward foreign exchange contracts, cross currency interest rate swaps and interest rate swaps and equity collar contracts of $36.0$41.5 billion, $2.3 billion, $1.8$36.2 billion and $0.3$10.0 billion, respectively.
All derivative instruments are recorded on the balance sheet at fair value. Changes in the fair value of derivatives are recorded each period in current earnings or other comprehensive income, depending on whether the derivative is designated as part of a hedge transaction, and if so, the type of hedge transaction.
The designation as a cash flow hedge is made at the entrance date of the derivative contract. At inception, all derivatives are expected to be highly effective. Foreign exchange contracts designated as cash flow hedges are accounted for under the forward method and all gains/losses associated with these contracts will be recognized in the income statement when the hedged item impacts earnings. Changes in the fair value of a derivative that is designated as a cash flow hedge and is highly effectivethese derivatives are recorded in accumulated other comprehensive income until the underlying transaction affects earnings, and are then reclassified to earnings in the same account as the hedged transaction.
Gains and losses associated with interest rate swaps and changes in fair value of hedged debt attributable to changes in interest rates are recorded to interest expense in the period in which they occur. Gains and losses on net investment hedges are accounted for through the currency translation account.account within accumulated other comprehensive income. The portion excluded from effectiveness testing is recorded through interest (income) expense using the spot method. On an ongoing basis, the Company assesses whether each derivative continues to be highly effective in offsetting changes of hedged items. If and when a derivative is no longer expected to be highly effective, hedge accounting is discontinued. Hedge ineffectiveness, if any, is included in current period earnings in Other (income) expense, net for forward foreign exchange contracts, cross currency interest rate swaps, net investment hedges and equity collar contracts. For interest rate swaps designated as fair value hedges, hedge ineffectiveness, if any, is included in current period earnings within interest expense. For the current reporting period, hedge ineffectiveness associated with interest rate swaps was not material.
During the fiscal second quarter of 2016, theThe Company designated its Euro denominated notes issued in May 2016 with due dates ranging from 2022 to 2035 as a net investment hedge of the Company's investments in certain of its international subsidiaries that use the Euro as their functional currency in order to reduce the volatility caused by changes in exchange rates.
The change in the carrying value due to remeasurement of these Euro notes resulted in a $597 million unrealized pretax loss for the fiscal year ended December 31, 2017, reflected in foreign currency translation adjustment, within the Consolidated Statements of Comprehensive Income. The change in the carrying value due to remeasurement of these Euro notes resulted in a cumulative $222 million unrealized pretax loss from hedge inception through the fiscal year ended December 31, 2017, reflected in foreign currency translation adjustment, within the Consolidated Statements of Comprehensive Income.
As of December 31, 2017,2023, the balance of deferred net gainsloss on derivatives included in accumulated other comprehensive income was $70$377 million after-tax. For additional information, see the Consolidated Statements of Comprehensive Income and Note 13. The Company expects that substantially all of the amounts related to forward foreign exchange contracts will be reclassified into earnings over the next 12 months as a result of transactions that are expected to occur over that period. The maximum length of time over which the Company is hedging transaction exposure is 18 months, excluding interest rate contracts and net investment hedges and equity collar contracts.hedges. The amount ultimately realized in earnings may differ as foreign exchange rates change. Realized gains and losses are ultimately determined by actual exchange rates at maturity of the derivative.
The following table is a summary of the activity related to derivatives designated as cash flowand hedges for the fiscal years ended December 31, 20172023 and January 1, 2017:2023, net of tax:
| | | | | | | | | | | | | | | | | | | | | | | | | | | | | | | | | | | |
| |
| December 31, 2023 | | January 1, 2023 |
| (Dollars in Millions) | Sales | Cost of Products Sold | R&D Expense | Interest (Income) Expense | Other (Income) Expense | | Sales | Cost of Products Sold | R&D Expense | Interest (Income) Expense | Other (Income) Expense |
| | | | | | | | | | | |
| | | | | | | | | | | |
| The effects of fair value, net investment and cash flow hedging: | | | | | | | | | | | |
| Gain (Loss) on fair value hedging relationship: | | | | | | | | | | | |
| Interest rate swaps contracts: | | | | | | | | | | | |
| Hedged items | $— | — | — | (930) | — | | — | — | — | (1,098) | — |
| Derivatives designated as hedging instruments | — | — | — | 930 | — | | — | — | — | 1,098 | — |
| | | | | | | | | | | |
| Gain (Loss) on net investment hedging relationship: | | | | | | | | | | | |
| Cross currency interest rate swaps contracts: | | | | | | | | | | | |
| Amount of gain or (loss) recognized in income on derivative amount excluded from effectiveness testing | $— | — | — | 130 | — | | — | — | — | 140 | — |
| Amount of gain or (loss) recognized in AOCI | — | — | — | 130 | — | | — | — | — | 140 | — |
| | | | | | | | | | | |
| Gain (Loss) on cash flow hedging relationship: | | | | | | | | | | | |
| Forward foreign exchange contracts: | | | | | | | | | | | |
| Amount of gain or (loss) reclassified from AOCI into income | 7 | 186 | (37) | — | 8 | | (72) | (271) | 149 | — | (23) |
| | | | | | | | | | | |
| | | | | | | | | | | |
| | | | | | | | | | | |
| Amount of gain or (loss) recognized in AOCI | 10 | 447 | (18) | — | 9 | | 5 | 319 | 61 | — | (113) |
| | | | | | | | | | | |
| Cross currency interest rate swaps contracts: | | | | | | | | | | | |
| Amount of gain or (loss) reclassified from AOCI into income | — | — | — | 275 | — | | — | — | — | 425 | — |
| | | | | | | | | | | |
| Amount of gain or (loss) recognized in AOCI | $— | — | — | (156) | — | | — | — | — | 42 | — |
| | | | | | | | | | | |
As of December 31, 2023 and January 1, 2023, the following amounts were recorded on the consolidated balance sheet related to cumulative basis adjustment for fair value hedges
|
| | | | | | | | | | | | | | | | | | | |
| (Dollars in Millions) | | Gain/(Loss)
Recognized In Accumulated OCI(1) | | Gain/(Loss) Reclassified From
Accumulated OCI Into Income(1) | | Gain/(Loss) Recognized In
Other Income/Expense(2) |
| Cash Flow Hedges by Income Statement Caption | | 2017 | | 2016 | | 2017 | | 2016 | | 2017 | | 2016 |
Sales to customers (3) | | $ | 49 |
| | (65 | ) | | (31 | ) | | (47 | ) | | (1 | ) | | (1 | ) |
Cost of products sold (3) | | 96 |
| | (212 | ) | | (159 | ) | | (3 | ) | | (10 | ) | | (15 | ) |
Research and development expense (3) | | (199 | ) | | (76 | ) | | (165 | ) | | (90 | ) | | 5 |
| | — |
|
Interest (income)/Interest expense, net (4) | | 110 |
| | 66 |
| | 83 |
| | 37 |
| | — |
| | — |
|
Other (income) expense, net (3) (5) | | (60 | ) | | (72 | ) | | (87 | ) | | (7 | ) | | — |
| | 2 |
|
| Total | | $ | (4 | ) | | (359 | ) | | (359 | ) | | (110 | ) | | (6 | ) | | (14 | ) |
All amounts shown in the table above are net of tax.
| |
(3)
| Forward foreign exchange contracts |
| |
(4)
60 | Cross currency interest rate swaps |
| |
(5)
| Includes equity collar contracts |
| | | | | | | | | | | | | | | | | | | | | | | | | | |
| Line item in the Consolidated Balance Sheet in which the hedged item is included | | Carrying Amount of the Hedged Liability | | Cumulative Amount of Fair Value Hedging Adjustment Included in the Carrying Amount of the Hedged Liability |
| | | | | | | | |
| (Dollars in Millions) | | December 31, 2023 | | January 1, 2023 | | December 31, 2023 | | January 1, 2023 |
| | | | | | | | |
| Long-term Debt | | $8,862 | | $8,665 | | $(1,216) | | $(1,435) |
| | | | | | | | |
The following table is the effect of derivatives not designated as hedging instrument for the fiscal years ended December 31, 2023 and January 1, 2023:
| | | | | | | | | | | | | | | | | | | | |
| (Dollars in Millions) | | Location of Gain /(Loss) Recognized in Income on Derivative | | Gain/(Loss)
Recognized In
Income on Derivative |
| Derivatives Not Designated as Hedging Instruments | | | | December 31, 2023 | | January 1, 2023 |
| Foreign Exchange Contracts | | Other (income) expense | | $(60) | | 94 |
The following table is the effect of net investment hedges for the fiscal years ended December 31, 2023 and January 1, 2023:
| | | | | | | | | | | | | | | | | | | | | | | | | | | | | | | | |
| | Gain/(Loss)
Recognized In
Accumulated OCI | | Location of Gain or (Loss) Reclassified from Accumulated Other Comprehensive Income Into Income | | Gain/(Loss) Reclassified From
Accumulated OCI
Into Income |
| (Dollars in Millions) | | December 31, 2023 | | January 1, 2023 | | | | December 31, 2023 | | January 1, 2023 |
| Debt | | $(131) | | 197 | | Interest (income) expense | | — | | — |
| Cross Currency interest rate swaps | | $642 | | 766 | | Interest (income) expense | | — | | — |
The Company holds equity investments with readily determinable fair values and equity investments without readily determinable fair values. The Company measures equity investments that do not have readily determinable fair values at cost minus impairment, if any, plus or minus changes resulting from observable price changes in orderly transactions for the identical or a similar investment of the same issuer.
The following table is a summary of the activity related to equity investments for the fiscal years ended December 31, 2023 and January 1, 2023:
| | | | | | | | | | | | | | | | | | | | | | | | | | | | | | | | |
| | January 1, 2023 | | | | | | December 31, 2023 |
| (Dollars in Millions) | | Carrying Value | | Changes in Fair Value Reflected in Net Income(1) | | Sales/ Purchases/Other(2) | | Carrying Value | | Non Current Other Assets |
| Equity Investments with readily determinable value * | | $576 | | (368) | | 4,265 | | 4,473 | | 4,473 |
| | | | | | | | | | |
| Equity Investments without readily determinable value | | $613 | | 1 | | 82 | | 696 | | 696 |
| | | | | | | | | | | | | | | | | | | | | | | | | | | | | | | | |
| | January 2, 2022 | | | | | | January 1, 2023 |
| (Dollars in Millions) | | Carrying Value | | Changes in Fair Value Reflected in Net Income(1) | | Sales/ Purchases/Other(2) | | Carrying Value | | Non Current Other Assets |
| Equity Investments with readily determinable value | | $1,884 | | (538) | | (770) | | 576 | | 576 |
| | | | | | | | | | |
| Equity Investments without readily determinable value | | $413 | | 93 | | 107 | | 613 | | 613 |
(1)Recorded in Other Income/Expense
(2)Other includes impact of currency
* Includes the 9.5% remaining stake in Kenvue and the $0.4 billion unfavorable change in fair value of the investment between separation date and the end of the fiscal year.
For the fiscal years ended December 31, 20172023 and January 1, 2017, a loss of $52023 for equity investments without readily determinable market values, $1 million and $56$51 million,, respectively, was recognizedof the changes in Other (income) expense,fair value reflected in net relatingincome were the result of impairments. There were offsetting impacts of $27 million and $142 million, respectively, of changes in the fair value reflected in net income due to forward foreign exchange contracts not designated as hedging instruments.changes in observable prices and gains on the disposal of investments.
Fair value is the exit price that would be received to sell an asset or paid to transfer a liability. Fair value is a market-based measurement determined using assumptions that market participants would use in pricing an asset or liability. The authoritative literature establishesIn accordance with ASC 820, a three-level hierarchy to prioritize the inputs used in measuring fair value. The levels within the hierarchy are described below with Level 1 having the highest priority and Level 3 having the lowest.
The fair value of a derivative financial instrument (i.e., forward foreign exchange contracts, interest rate contracts) is the aggregation by currency of all future cash flows discounted to its present value at the prevailing market interest rates and subsequently converted to the U.S. Dollar at the current spot foreign exchange rate. The Company does not believe that fair values of these derivative instruments materially differ from the amounts that could be realized upon settlement or maturity, or that the changes in fair value will have a material effect on the Company’s results of operations, cash flows or financial position. The Company also holds equity investments which are classified as Level 1 and debt securities which are classified as Level 2. The Company did not have any otherholds acquisition related contingent liabilities based upon certain regulatory and commercial events, which are classified as Level 3, whose values are determined using discounted cash flow methodologies or similar techniques for which the determination of fair value requires significant financial assetsjudgment or liabilities which would require revised valuations under this standard that are recognized at fair value.
estimations.
The following three levels of inputs are used to measure fair value:
Level 1 — Quoted prices in active markets for identical assets and liabilities.
Level 2 — Significant other observable inputs.
Level 3 — Significant unobservable inputs.
The Company’s significant financial assets and liabilities measured at fair value as of the fiscal year ended December 31, 20172023 and January 1, 20172023 were as follows:
| | | | | | | | | | | | | | | | | | | | | | | | | | | | | | | | |
| | 2023 | | 2022 |
| (Dollars in Millions) | | Level 1 | | Level 2 | | Level 3 | | Total | | Total(1) |
| Derivatives designated as hedging instruments: | | | | | | | | | | |
| Assets: | | | | | | | | | | |
| Forward foreign exchange contracts | | $— | | 539 | | — | | 539 | | 629 |
Interest rate contracts (2) | | — | | 988 | | — | | 988 | | 1,534 |
| | | | | | | | | | |
| Total | | $— | | 1,527 | | — | | 1,527 | | 2,163 |
| Liabilities: | | | | | | | | | | |
| Forward foreign exchange contracts | | — | | 624 | | — | | 624 | | 511 |
Interest rate contracts (2) | | — | | 5,338 | | — | | 5,338 | | 2,778 |
| | | | | | | | | | |
| | | | | | | | | | |
| Total | | $— | | 5,962 | | — | | 5,962 | | 3,289 |
| Derivatives not designated as hedging instruments: | | | | | | | | | | |
| Assets: | | | | | | | | | | |
| Forward foreign exchange contracts | | $— | | 64 | | — | | 64 | | 38 |
| Liabilities: | | | | | | | | | | |
| Forward foreign exchange contracts | | — | | 75 | | — | | 75 | | 68 |
| Available For Sale Other Investments: | | | | | | | | | | |
Equity investments(3) | | 4,473 | | — | | — | | 4,473 | | 576 |
Debt securities(4) | | — | | 8,874 | | — | | 8,874 | | 10,487 |
| Other Liabilities | | | | | | | | | | |
Contingent Consideration(5) | | $ | | | | 1,092 | | 1,092 | | 1,120 |
| | | | | | | | | | | | | | |
| Gross to Net Derivative Reconciliation | | 2023 | | 2022 |
| (Dollars in Millions) | | | | |
| Total Gross Assets | | $1,591 | | 2,201 |
| Credit Support Agreements (CSA) | | (1,575) | | (2,176) |
| Total Net Asset | | 16 | | 25 |
| | | | |
| Total Gross Liabilities | | 6,037 | | 3,357 |
| Credit Support Agreements (CSA) | | (5,604) | | (3,023) |
| Total Net Liabilities | | $433 | | 334 |
| | | | |
|
| | | | | | | | | | | | | | | | |
| | | 2017 | | 2016 |
| (Dollars in Millions) | | Level 1 | | Level 2 | | Level 3 | | Total | | Total (1) |
| Derivatives designated as hedging instruments: | | |
| | |
| | |
| | |
| | |
|
| Assets: | | |
| | |
| | |
| | |
| | |
|
Forward foreign exchange contracts (7) | | $ | — |
| | 342 |
| | — |
| | 342 |
| | 747 |
|
Interest rate contracts (2)(4) (7) | | — |
| | 7 |
| | — |
| | 7 |
| | 31 |
|
| Total | | — |
| | 349 |
| | — |
| | 349 |
| | 778 |
|
| Liabilities: | | |
| | |
| | |
| | |
| | |
|
Forward foreign exchange contracts (7) | | — |
| | 314 |
| | — |
| | 314 |
| | 723 |
|
Interest rate contracts (3)(4) (7) | | — |
| | 15 |
| | — |
| | 15 |
| | 382 |
|
| Equity collar contracts | | — |
| | — |
| | — |
| | — |
| | 57 |
|
| Total | | — |
| | 329 |
| | — |
| | 329 |
| | 1,162 |
|
| Derivatives not designated as hedging instruments: | | |
| | |
| | |
| | |
| | |
|
| Assets: | | |
| | |
| | |
| | |
| | |
|
Forward foreign exchange contracts (7) | | — |
| | 38 |
| | — |
| | 38 |
| | 34 |
|
| Liabilities: | | |
| | |
| | |
| | |
| | |
|
Forward foreign exchange contracts (7) | | — |
| | 38 |
| | — |
| | 38 |
| | 57 |
|
| Available For Sale Other Investments: | | | | | | | | | | |
Equity investments(5) | | 751 |
| | — |
| | — |
| | 751 |
| | 1,209 |
|
Debt securities(6) | | $ | — |
| | 5,310 |
| | — |
| | 5,310 |
| | 12,087 |
|
| |
(1)
| 2016 assets and liabilities are all classified as Level 2 with the exception of equity investments of $1,209 million, which are classified as Level 1.
|
| |
(2)
| Includes $7 million and $23 million of non-current assets for the fiscal years ending December 31, 2017 and January 1, 2017, respectively.
|
| |
(3)
| Includes $9 million and $382 million of non-current liabilities for the fiscal years ending December 31, 2017 and January 1, 2017, respectively.
|
| |
(4)
| Includes cross currency interest rate swaps and interest rate swaps. |
Summarized information about changes in liabilities for contingent consideration is as follows:
| |
(5)
| Classified as non-current other assets. The carrying amount of the equity investments were $394 million and $520 million as of December 31, 2017 and January 1, 2017, respectively. The unrealized gains were $367 million and $757 million as of December 31, 2017 and January 1, 2017, respectively. The unrealized losses were $10 million and $68 million as of December 31, 2017 and January 1, 2017, respectively. |
| |
(6)
| Classified as cash equivalents and current marketable securities. |
| |
(7)
| Includes collateral exchanged on the credit support agreements on derivatives. |
| | | | | | | | | | | | | | | | | |
| | 2023 | 2022 | 2021 |
| (Dollars in Millions) | | | | |
| Beginning Balance | | $1,120 | 533 | 633 |
| Changes in estimated fair value | | 29 | (194) | (52) |
Additions (6) | | — | 792 | — |
| Payments/Other | | (57) | (11) | (48) |
Ending Balance (5) | | $1,092 | 1,120 | 533 |
| | | | |
(1)2022 assets and liabilities are all classified as Level 2 with the exception of equity investments of $576 million, which are classified as Level 1 and contingent consideration of $1,120 million, classified as Level 3.
(2)Includes cross currency interest rate swaps and interest rate swaps.
(3)Classified as non-current other assets.
(4)Classified as cash equivalents and current marketable securities.
(5)Includes $1,092 million, $1,116 million and $520 million, classified as non-current other liabilities as of December 31, 2023, January 1, 2023 and January 2, 2022, respectively. Includes $4 million and $13 million classified as current liabilities as of January 1, 2023 and January 2, 2022, respectively.
(6)In fiscal year 2022, the Company recorded $704 million of contingent consideration related to Abiomed.
See Notes 2 and 7 for financial assets and liabilities held at carrying amount on the Consolidated Balance Sheet.
7. Borrowings
The components of long-term debt are as follows: | | | | | | | | | | | | | | | | | | | | | | | | | | | | | |
| (Dollars in Millions) | | 2023 | | Effective
Rate
% | | 2022 | | Effective
Rate
% | |
| 6.73% Debentures due 2023 | | $— | | — | % | | $250 | | 6.73 | % | |
| 3.375% Notes due 2023 | | — | | — | | | 801 | | 3.17 | | |
| 2.05% Notes due 2023 | | — | | — | | | 500 | | 2.09 | | |
0.650% Notes due 2024 (750MM Euro 1.1090)(2)/(750MM Euro 1.0651)(3) | | 831 | (2) | 0.68 | | | 792 | (3) | 0.68 | | |
5.50% Notes due 2024 (500MM 1.2756 GBP )(2)/(500MM GBP 1.2037)(3) | | 637 | (2) | 6.75 | | | 600 | (3) | 6.75 | | |
| 2.625% Notes due 2025 | | 750 | | 2.63 | | | 749 | | 2.63 | | |
| 0.55% Notes due 2025 | | 950 | | 0.57 | | | 918 | | 0.57 | | |
| 2.46% Notes due 2026 | | 1,997 | | 2.47 | | | 1,996 | | 2.47 | | |
| 2.95% Notes due 2027 | | 900 | | 2.96 | | | 877 | | 2.96 | | |
| 0.95% Notes due 2027 | | 1,419 | | 0.96 | | | 1,394 | | 0.96 | | |
1.150% Notes due 2028
(750MM Euro 1.1090)(2)/(750MM Euro 1.0651)(3) | | 828 | (2) | 1.21 | | | 794 | (3) | 1.21 | | |
| 2.90% Notes due 2028 | | 1,497 | | 2.91 | | | 1,496 | | 2.91 | | |
| 6.95% Notes due 2029 | | 298 | | 7.14 | | | 298 | | 7.14 | | |
| 1.30% Notes due 2030 | | 1,630 | | 1.30 | | | 1,607 | | 1.30 | | |
| 4.95% Debentures due 2033 | | 499 | | 4.95 | | | 498 | | 4.95 | | |
| 4.375% Notes due 2033 | | 854 | | 4.24 | | | 854 | | 4.24 | | |
1.650% Notes due 2035
(1.5B Euro 1.1090)(2)/(1.5B Euro 1.0651)(3) | | 1,652 | (2) | 1.68 | | | 1,591 | (3) | 1.68 | | |
| 3.587% Notes due 2036 | | 864 | | 3.59 | | | 842 | | 3.59 | | |
| 5.95% Notes due 2037 | | 994 | | 5.99 | | | 993 | | 5.99 | | |
| 3.625% Notes due 2037 | | 1,357 | | 3.64 | | | 1,336 | | 3.64 | | |
| 5.85% Debentures due 2038 | | 697 | | 5.85 | | | 697 | | 5.85 | | |
| 3.400% Notes due 2038 | | 993 | | 3.42 | | | 992 | | 3.42 | | |
| 4.50% Debentures due 2040 | | 541 | | 4.63 | | | 540 | | 4.63 | | |
| 2.10% Notes due 2040 | | 849 | | 2.14 | | | 828 | | 2.14 | | |
| 4.85% Notes due 2041 | | 297 | | 4.89 | | | 297 | | 4.89 | | |
| 4.50% Notes due 2043 | | 496 | | 4.52 | | | 496 | | 4.52 | | |
| 3.73% Notes due 2046 | | 1,977 | | 3.74 | | | 1,976 | | 3.74 | | |
| 3.75% Notes due 2047 | | 832 | | 3.76 | | | 812 | | 3.76 | | |
| 3.500% Notes due 2048 | | 743 | | 3.52 | | | 743 | | 3.52 | | |
| 2.250% Notes due 2050 | | 826 | | 2.29 | | | 808 | | 2.29 | | |
| 2.450% Notes due 2060 | | 1,073 | | 2.49 | | | 1,055 | | 2.49 | | |
| Other | | 69 | | — | | | 7 | | — | | |
| Subtotal | | 27,350 | (4) | 2.98 | % | (1) | 28,437 | (4) | 3.04 | % | (1) |
| Less current portion | | 1,469 | | | | 1,551 | | | |
| Total long-term debt | | $25,881 | | | | $26,886 | | | |
(1)Weighted average effective rate.
|
| | | | | | | | | | | | | | |
| (Dollars in Millions) | | 2017 | | Effective Rate % | | 2016 | | Effective Rate % | |
| 5.55% Debentures due 2017 | | $ | — |
| | — |
| | 1,000 |
| | 5.55 | |
| 1.125% Notes due 2017 | | — |
| | — |
| | 699 |
| | 1.15 | |
| 5.15% Debentures due 2018 | | 900 |
| | 5.18 |
| | 899 |
| | 5.18 | |
| 1.65% Notes due 2018 | | 597 |
| | 1.70 |
| | 600 |
| | 1.70 | |
4.75% Notes due 2019 (1B Euro 1.1947)(2)/(1B Euro 1.0449)(3) | | 1,192 |
| (2) | 5.83 |
| | 1,041 |
| (3) | 5.83 | |
| 1.875% Notes due 2019 | | 496 |
| | 1.93 |
| | 499 |
| | 1.93 | |
| 0.89% Notes due 2019 | | 300 |
| | 1.75 |
| | 299 |
| | 1.20 | |
| 1.125% Notes due 2019 | | 699 |
| | 1.13 |
| | 699 |
| | 1.13 | |
| 3% Zero Coupon Convertible Subordinated Debentures due 2020 | | 60 |
| | 3.00 |
| | 84 |
| | 3.00 | |
| 2.95% Debentures due 2020 | | 547 |
| | 3.15 |
| | 546 |
| | 3.15 | |
| 1.950% Notes due 2020 | | 499 |
| | 1.99 |
| | — |
| | — | |
| 3.55% Notes due 2021 | | 448 |
| | 3.67 |
| | 447 |
| | 3.67 | |
| 2.45% Notes due 2021 | | 349 |
| | 2.48 |
| | 348 |
| | 2.48 | |
| 1.65% Notes due 2021 | | 998 |
| | 1.65 |
| | 997 |
| | 1.65 | |
0.250% Notes due 2022 (1B Euro 1.1947)(2)/(1B Euro 1.0449)(3) | | 1,191 |
| (2) | 0.26 |
| | 1,041 |
| (3) | 0.26 | |
| 2.25% Notes due 2022 | | 995 |
| | 2.31 |
| | — |
| | — | |
| 6.73% Debentures due 2023 | | 250 |
| | 6.73 |
| | 249 |
| | 6.73 | |
| 3.375% Notes due 2023 | | 806 |
| | 3.17 |
| | 807 |
| | 3.17 | |
| 2.05% Notes due 2023 | | 498 |
| | 2.09 |
| | 497 |
| | 2.09 | |
0.650% Notes due 2024 (750MM Euro 1.1947)(2)/(750MM Euro 1.0449)(3) | | 891 |
| (2) | 0.68 |
| | 779 |
| (3) | 0.68 | |
5.50% Notes due 2024 (500MM GBP 1.3444)(2)/(500MM GBP 1.2237)(3) | | 666 |
| (2) | 6.75 |
| | 605 |
| (3) | 6.75 | |
| 2.625% Notes due 2025 | | 747 |
| | 2.63 |
| | — |
| | — | |
| 2.45% Notes due 2026 | | 1,990 |
| | 2.47 |
| | 1,989 |
| | 2.47 | |
| 2.95% Notes due 2027 | | 995 |
| | 2.96 |
| | — |
| | — | |
1.150% Notes due 2028 (750MM Euro 1.1947)(2)/(750MM Euro 1.0449)(3) | | 887 |
| (2) | 1.21 |
| | 775 |
| (3) | 1.21 | |
| 2.900% Notes due 2028 | | 1,492 |
| | 2.91 |
| | — |
| | — | |
| 6.95% Notes due 2029 | | 296 |
| | 7.14 |
| | 296 |
| | 7.14 | |
| 4.95% Debentures due 2033 | | 498 |
| | 4.95 |
| | 497 |
| | 4.95 | |
| 4.375% Notes due 2033 | | 856 |
| | 4.24 |
| | 857 |
| | 4.24 | |
1.650% Notes due 2035 (1.5B Euro 1.1947)(2)/(1.5B Euro 1.0449)(3) | | 1,774 |
| (2) | 1.68 |
| | 1,549 |
| (3) | 1.68 | |
| 3.55% Notes due 2036 | | 987 |
| | 3.59 |
| | 987 |
| | 3.59 | |
| 5.95% Notes due 2037 | | 991 |
| | 5.99 |
| | 990 |
| | 5.99 | |
| 3.625% Notes due 2037 | | 1,486 |
| | 3.64 |
| | — |
| | — | |
| 5.85% Debentures due 2038 | | 696 |
| | 5.85 |
| | 695 |
| | 5.85 | |
| 3.400% Notes due 2038 | | 990 |
| | 3.42 |
| | — |
| | — | |
| 4.50% Debentures due 2040 | | 538 |
| | 4.63 |
| | 537 |
| | 4.63 | |
| 4.85% Notes due 2041 | | 296 |
| | 4.89 |
| | 296 |
| | 4.89 | |
| 4.50% Notes due 2043 | | 495 |
| | 4.52 |
| | 495 |
| | 4.52 | |
(2)Translation rate at December 31, 2023.
(3)Translation rate at January 1, 2023. |
| | | | | | | | | | | | | | |
| 3.70% Notes due 2046 | | 1,971 |
| | 3.74 |
| | 1,970 |
| | 3.74 | |
| 3.75% Notes due 2047 | | 990 |
| | 3.76 |
| | — |
| | — | |
| 3.500% Notes due 2048 | | 742 |
| | 3.52 |
| | — |
| | — | |
| Other | | 75 |
| | — |
| | 77 |
| | — | |
| Subtotal | | 32,174 |
| (4) | 3.19 | % | (1) | 24,146 |
| (4) | 3.33 | (1 | ) |
| Less current portion | | 1,499 |
| | |
| | 1,704 |
| | | |
| Total long-term debt | | $ | 30,675 |
| | |
| | 22,442 |
| | | |
| |
(1)
| Weighted average effective rate. |
| |
(2)
| Translation rate at December 31, 2017.
|
| |
(3)
| Translation rate at January 1, 2017.
|
| |
(4)
| The excess of the fair value over the carrying value of debt was $2.0 billion in 2017 and $1.6 billion in 2016. |
(4)The excess of the carrying value over the fair value of debt was $1.0 billion and $1.6 billion at the end of fiscal year 2023 and fiscal year 2022, respectively.
Fair value of the long-term debt was estimated using market prices, which were corroborated by quoted broker prices and significant other observable inputs.
The Company has access to substantial sources of funds at numerous banks worldwide. In September 2017,2023, the Company secured a new 364-day Credit Facility. Total credit available to the Company approximatesFacility of $10 billion, which expires on September 13, 2018.5, 2024. The Company early terminated the additional 364-day revolving Credit Facility of $10 billion, which had an expiration of November 21, 2023. Interest charged on borrowings under the credit line agreementsagreement is based on either bids provided by banks, the prime rateTerm SOFR Reference Rate or London Interbank Offered Rates (LIBOR),other applicable market rates as allowed under the terms of the agreement, plus applicable margins. Commitment fees under the agreements are not material.
Throughout 2017,fiscal years 2023 and 2022, the Company continued to have access to liquidity through the commercial paper market. Short-term borrowings and the current portion of long-term debt amounted to approximately $3.9$3.5 billion and $12.8 billion at the end of 2017, of which $2.3 billion was borrowed under the Commercial Paper Program, $1.5 billion is thefiscal years 2023 and 2022, respectively. The current portion of the long term debt was $1.5 billion and $1.6 billion in 2023 and 2022, respectively, and the remainder principally representsis commercial paper and local borrowing by international subsidiaries.
Throughout 2016, the Company continued to have access to liquidity through theThe current debt balance as of December 31, 2023 includes $2.0 billion of commercial paper market. Short-term borrowingswhich has a weighted average interest rate of 5.37% and thea weighted average maturity of approximately two months. The current portiondebt balance as of long-term debt amounted toJanuary 1, 2023 includes $11.2 billion of commercial paper which has a weighted average interest rate of 4.23% and a weighted average maturity of approximately $4.7 billion at the end of 2016, of which $2.7 billion was borrowed under the Commercial Paper Program, $1.7 billion is the current portion of the long term debt, and the remainder principally represents local borrowing by international subsidiaries.
two months.
Aggregate maturities of long-term debt obligations commencing in 20182024 are:
| | | | | | | | | | | | | | | | | | | | | | | | | | | | | | | | |
| (Dollars in Millions) | | | | | | | | |
| 2024 | | 2025 | | 2026 | | 2027 | | 2028 | | After 2028 |
| $1,469 | | 1,700 | | 1,997 | | 2,320 | | 2,325 | | 17,539 |
|
| | | | | | | | | | |
| (Dollars in Millions) | | | | | | | | |
| 2018 | | 2019 | | 2020 | | 2021 | | 2022 | | After 2022 |
| $1,499 | | 2,752 | | 1,105 | | 1,797 | | 2,189 | | 22,832 |
Tax Cuts and Jobs Act (TCJA) and SEC Staff Accounting Bulletin 118 (SAB 118)
On December 22, 2017, the United States enacted into law new U.S. tax legislation, referred to as the TCJA. This law includes provisions for a comprehensive overhaul of the corporate income tax code, including a reduction of the statutory corporate tax rate from 35% to 21%, effective on January 1, 2018. This new legislation also eliminated or reduced certain corporate income tax deductions as well as introduced new provisions that taxed certain foreign income not previously taxed by the United States. The TCJA also includes a provision for a tax on all previously undistributed earnings of U.S. companies located in foreign jurisdictions. Undistributed earnings in the form of cash and cash equivalents is taxed at a rate of 15.5% and all other earnings are taxed at a rate of 8.0%. This tax is payable over 8 years and will not accrue interest.
In December 2017, the SEC provided regulatory guidance for accounting of the impacts of the TCJA, referred to as SAB 118. Under the guidance in SAB 118, the income tax effects, which the accounting under ASC 740 is incomplete, are reported as a provisional amount based on a reasonable estimate. The reasonable estimate is subject to adjustment during a "measurement period", not to exceed one year, until the accounting is complete. The estimate is also subject to the finalization of management’s analysis related to certain matters, such as developing interpretations of the provision of the TCJA, changes to certain estimates and amounts related to the earnings and profits of certain subsidiaries and the filing of tax returns.
As a result of the enactment of the TCJA, the Company recorded a provisional tax cost of $13.0 billion in the fourth quarter of 2017. This provisional charge was assessed as of January 18, 2018 and consisted of:
a $10.1 billion charge on previously undistributed foreign earnings as of December 31, 2017
a $4.5 billion deferred tax liability for foreign local and withholding taxes offset by a $1.1 billion deferred tax asset for U.S. foreign tax credits, for repatriation of substantially all those earnings
a $0.6 billion tax benefit relating to the remeasurement of U.S. deferred tax assets and liabilities and the impact of the TCJA on tax reserves, and
a $0.1 billion charge for U.S. state and local taxes on the repatriation of these foreign earnings.
In determining this charge, the Company utilized the most recent information and guidance available related to the calculation of the tax liability and the impact to its deferred tax assets and liabilities, including those recorded for foreign local and withholding taxes that the Company assessed as of January 18, 2018. The provisional charge may require further adjustments and changes to the Company’s estimates as new guidance is made available. Revisions to the provisional charge may be material to the Company's financial results.
The TCJA also includes provisions for a tax on global intangible low-taxed income (GILTI). GILTI is described as the excess of a U.S. shareholder’s total net foreign income over a deemed return on tangible assets, as provided by the TCJA. In January 2018, in response to inquiries by companies, the FASB issued guidance that allows companies to elect as an accounting policy whether to treat the GILTI tax as a period cost or to recognize deferred tax assets and liabilities when basis differences exist that are expected to affect the amount of GILTI inclusion upon reversal. The Company has provisionally elected to treat GILTI as a period expense pending further analysis of this new tax provision.
The provision for taxes on income consists of:
| | | | | | | | | | | | | | | | | | |
| (Dollars in Millions) | 2023 | | 2022 | | 2021 | |
| Currently payable: | | | | | | |
| U.S. taxes | $2,705 | | 2,274 | | 1,338 | |
| | | | | | |
| International taxes | 3,090 | | 2,295 | | 2,069 | |
| Total currently payable | 5,795 | | 4,569 | | 3,407 | |
| Deferred: | | | | | | |
| U.S. taxes | (3,440) | | (1,990) | | 565 | |
| | | | | | |
| International taxes | (619) | | 410 | | (2,595) | |
| Total deferred | (4,059) | | (1,580) | | (2,030) | |
| Provision for taxes on income | $1,736 | | 2,989 | | 1,377 | |
|
| | | | | | | | | | |
| (Dollars in Millions) | | 2017 | | 2016 | | 2015 |
| Currently payable: | | | | | | |
| U.S. taxes | | $ | 11,969 |
| | 1,896 |
| | 2,748 |
|
| International taxes | | 1,998 |
| | 1,708 |
| | 1,309 |
|
| Total currently payable | | 13,967 |
| | 3,604 |
| | 4,057 |
|
| Deferred: | | | | | | |
| U.S. taxes | | (1,956 | ) | | 294 |
| | 37 |
|
| International taxes | | 4,362 |
| | (635 | ) | | (307 | ) |
| Total deferred | | 2,406 |
| | (341 | ) | | (270 | ) |
| Provision for taxes on income | | $ | 16,373 |
| | 3,263 |
| | 3,787 |
|
A comparison of income tax expense at the U.S. statutory rate of 35%21% in 2017, 2016fiscal years 2023, 2022 and 2015,2021, to the Company’s effective tax rate is as follows:
| | | | | | | | | | | | | | | | | |
| (Dollars in Millions) | 2023 | | 2022 | | 2021 |
| U.S. | $(2,033) | | 4,606 | | 4,275 |
| International | 17,095 | | 14,753 | | 14,903 |
| Earnings before taxes on income: | $15,062 | | 19,359 | | 19,178 |
| Tax rates: | | | | | |
| U.S. statutory rate | 21.0 | % | | 21.0 | | | 21.0 | |
International operations(1) | (8.1) | | | (5.0) | | | (19.1) | |
| | | | | |
| | | | | |
| | | | | |
| U.S. Tax Settlements | (3.0) | | | — | | | — | |
U.S. taxes on international income(2) | (0.3) | | | (1.1) | | | 8.9 | |
| Tax benefits from loss on capital assets | — | | | — | | | (1.6) | |
| Tax benefits on share-based compensation | (0.8) | | | (1.4) | | | (1.2) | |
| | | | | |
| | | | | |
| All other | 2.7 | | | 1.9 | | | (0.8) | |
| Effective Rate | 11.5 | % | | 15.4 | | | 7.2 | |
|
| | | | | | | | | | |
| (Dollars in Millions) | | 2017 | | 2016 | | 2015 |
| U.S. | | $ | 4,865 |
| | 7,457 |
| | 8,179 |
|
| International | | 12,808 |
| | 12,346 |
| | 11,017 |
|
| Earnings before taxes on income: | | $ | 17,673 |
| | 19,803 |
| | 19,196 |
|
| Tax rates: | | | | | | |
| U.S. statutory rate | | 35.0 | % | | 35.0 |
| | 35.0 |
|
International operations (1) | | (12.8 | ) | | (17.2 | ) | | (15.4 | ) |
| Research and orphan drug tax credits | | (0.4 | ) | | (0.4 | ) | | (0.2 | ) |
| U.S. state and local | | 0.6 |
| | (0.1 | ) | | 0.4 |
|
| U.S. manufacturing deduction | | (0.8 | ) | | (0.6 | ) | | (0.6 | ) |
| U.S. tax on international income | | 0.7 |
| | 1.3 |
| | 0.2 |
|
| Tax benefits on share based compensation | | (2.1 | ) | | (1.8 | ) | | — |
|
| U.S. tax benefit on asset/business disposals | | (0.8 | ) | | — |
| | — |
|
| All other | | (0.1 | ) | | 0.3 |
| | 0.3 |
|
| TCJA impact | | 73.3 |
| (2) | — |
| | — |
|
| Effective Rate | | 92.6 | % | | 16.5 | % | | 19.7 | % |
(1) For all periods presented the Company has subsidiaries operating in Puerto Rico under various tax incentives. In 2017, International operations reflectsreflect the impacts of operations in jurisdictions with statutory tax rates different than the United States,U.S., particularly Ireland, Switzerland, Belgium and Puerto Rico, which is a
favorable impact on the effective tax rate as compared with the 35.0% U.S. statutory rate.
(2)Includes the impact of the GILTI tax, the Foreign-Derived Intangible Income deduction and other foreign income that is taxable under the U.S. tax code. The 2023 and 2022 amount includes the impact of certain provisions of the 2017 TCJA that became effective in fiscal 2022. The 2023 amount also includes the impact of certain foreign subsidiaries deferred tax cost relatedremeasurements for legislative elections and the 2021 amounts include the reorganization of international subsidiaries further described below.
The fiscal year 2023 effective tax rate decreased 3.9% as compared to the revaluationfiscal year 2022 effective tax rate as the Company recorded certain non-recurring favorable tax items in fiscal year 2023 when compared to the prior fiscal year.
In the fiscal fourth quarter of deferred2023, the Company settled the U.S. Internal Revenue Service audit for tax balances relatedyears 2013 through 2016 which resulted in a favorable impact to the rate of 3.0%. This settlement was partially offset by the Company recording a $0.4 billion decrease in expected U.S. foreign tax credits, an unfavorable effective rate impact of 2.6%, which has been reflected as a current tax expense in U.S. taxes on international income on the Company’s effective tax rate reconciliation.
In the fiscal year 2023, the Company had certain non-recurring impacts as a result of legislative tax elections made in certain international subsidiaries which resulted in a change in the Belgian statutoryCompany’s tax basis in certain assets resulting in deferred tax re-measurements. The net impact of these non-recurring items is a net benefit of 3.4% to the Company’s annual effective tax rate, increasingcomprised of the following items:
•approximately $0.3 billion of tax provisionbenefit on local deferred tax assets to record the remeasurement of the increased tax basis, this benefit has been reflected as International operations on the Company’s effective tax rate reconciliation. This benefit was offset by approximately 3.4%.$0.1 billion of U.S. deferred tax expense on the GILTI deferred tax liability resulting from the remeasurement of these deferred tax assets. This has been reflected in the “U.S. tax on international income” on the Company’s effective tax rate reconciliation.
(2) Includes•approximately $0.3 billion of U.S. statedeferred tax benefit on the GILTI deferred tax as a result of an international subsidiary making an election to change the treatment of a local deferred tax asset to a refundable tax credit. This has been reflected in the U.S. taxes on international income on the Company’s effective tax rate reconciliation.
The Company’s 2023 and local taxes provisionally recorded as part TCJA provisional charge which was approximately 0.6%2022 tax rates benefited from certain provisions of the totalTax Cuts and Jobs Act of 2017 that became effective in fiscal 2022.The Company also had lower income in higher tax jurisdictions vs. fiscal year 2022, primarily in the U.S. where the Company recorded an approximately $7.0 billion charge related to talc matters in the United States at an effective tax rate of 21.1% (for further information see Note 19 to the Consolidated Financial Statements).
The 2017fiscal year 2022 effective tax rate increased by 76.1%8.2% as compared to 2016, primarily driven by the enactmentfiscal year 2021 effective tax rate as the Company recorded certain non-recurring favorable tax items in fiscal year 2021 which resulted in an unfavorable impact to the Company’s fiscal 2022 effective tax rate when compared to the prior fiscal year. These items are described below. The Company’s 2022 tax rate also benefited from the impairment of bermekimab for AD IPR&D and changes in the fair value of securities in the Company’s investment portfolio, both recorded at the U.S. statutory rate.
In the fiscal year 2021, the Company reorganized the ownership structure of certain wholly-owned international subsidiaries. As part of this reorganization, the Company increased the tax basis of certain assets to fair value in accordance with applicable local regulations. The net impact of this restructuring was approximately $0.6 billion net benefit or 3.2% benefit to the Company’s annual effective tax rate, comprised of the TCJA in the United States in December 2017. The enactmentfollowing items:
•approximately $2.3 billion of the TCJA resulted in a provisionallocal deferred tax charge in the fourth quarter of 2017, of approximately $13.0 billion or approximately 73.3 percentage point increaseassets to the effective tax rate.
The remainder of the increase in the tax rate for 2017 was related torecord the remeasurement of the Company’s deferred tax basis of these assets in Belgium,to fair value, this benefit has been reflected as a result of changes in the Belgian statutory corporate tax rate enacted in December 2017, offset by a tax benefit for the closure ofInternational operations on the Company’s Animas insulin pump business.
The decrease in the 2016 effective tax rate as compared to 2015 was primarily attributablereconciliation.
•approximately $1.7 billion of U.S. deferred tax expense relating to the Company adopting a new accounting standard forGILTI deferred tax liability resulting from the reportingremeasurement of additionalthese deferred tax benefitsassets. This expense has been reflected as U.S. taxes on share-based compensation that vested or were exercised duringinternational income on the Company’s effective tax rate reconciliation.
Also, in the fiscal year. The remainderfourth quarter of 2021, the change inCompany recognized a loss on certain U.S. affiliates related to the previously impaired book value of certain intangibles, which reduced the 2021 effective tax rate by approximately 1.6% which is reflected as a Tax benefits from loss on capital assets on the effective tax rate was primarily relatedreconciliation. Additionally other fiscal 2021 impacts to the lower earnings before taxes in rate were primarily driven by litigation and acquisition related items as follows:
•the United States and the settlementCompany accrued additional legal expenses, of several uncertain tax positions in 2016 versus 2015.
The decrease in the 2015approximately $1.6 billion for talc at an effective tax rate as compared to 2014 was primarily attributableof 23.5% and $0.8 billion for Risperdal Gynecomastia settlements at an effective tax rate of 16.4% (See Note 19 to the increasesConsolidated Financial Statements for more details).
•the Company recorded a partial IPR&D charge of $0.9 billion for the Ottava intangible asset (acquired with the Auris Health acquisition in taxable income in lower tax jurisdictions relative to higher tax jurisdictions and a tax benefit resulting from a restructuring2019) at an effective rate of international affiliates.22.4%.
The items noted above reflect the key drivers of the rate reconciliation.
Temporary differences and carryforwards for 2017at the end of fiscal years 2023 and 20162022 were as follows:
| | | | | | | | | | | | | | | | | | | | | | | | | | | | | |
| | 2023 Deferred Tax | | 2022 Deferred Tax | |
| (Dollars in Millions) | | Asset | | Liability | | Asset | | Liability | |
| Employee related obligations | | $586 | | | | 685 | | | |
| Stock based compensation | | 686 | | | | 632 | | | |
| Depreciation of property, plant and equipment | | | | (902) | | | | (845) | |
| Goodwill and intangibles | | | | (1,252) | | | | (1,737) | |
| R&D capitalized for tax | | 3,595 | | | | 2,611 | | | |
| Reserves & liabilities | | 3,816 | | | | 2,733 | | | |
Income reported for tax purposes(1) | | 359 | | | | 2,026 | | | |
Net realizable operating loss carryforwards(2) | | 996 | | | | 1,319 | | | |
| Undistributed foreign earnings | | 1,801 | | (1,695) | | 1,517 | | (1,604) | |
| Global intangible low-taxed income | | | | (2,731) | | | | (3,628) | |
| Miscellaneous international | | 831 | | | | 861 | | (66) | |
| Miscellaneous U.S. | | | | (4) | | 452 | | | |
| Total deferred income taxes | | $12,670 | | (6,584) | | 12,836 | | (7,880) | |
|
| | | | | | | | | | | | | |
| | | 2017 Deferred Tax | | 2016 Deferred Tax |
| (Dollars in Millions) | | Asset | | Liability | | Asset | | Liability |
| Employee related obligations | | $ | 2,259 |
| |
|
| | 2,958 |
| |
|
|
| Stock based compensation | | 507 |
| |
|
| | 749 |
| |
|
|
| Depreciation | |
|
| | (9 | ) | |
|
| | (219 | ) |
| Non-deductible intangibles | |
|
| | (6,506 | ) | |
|
| | (6,672 | ) |
| International R&D capitalized for tax | | 1,307 |
| |
|
| | 1,264 |
| |
|
|
| Reserves & liabilities | | 1,718 |
| |
|
| | 1,857 |
| |
|
|
| Income reported for tax purposes | | 1,316 |
| |
|
| | 1,309 |
| |
|
|
| Net operating loss carryforward international | | 762 |
| |
|
| | 717 |
| |
|
|
| Undistributed foreign earnings | | 1,101 |
| | (4,457 | ) | | | | |
| Miscellaneous international | | 755 |
| | (194 | ) | | 1,135 |
| | (15 | ) |
| Miscellaneous U.S. | | 177 |
| |
|
| | 155 |
| |
|
|
| Total deferred income taxes | | $ | 9,902 |
| | (11,166 | ) | | 10,144 |
| | (6,906 | ) |
(2)Net of valuation allowances of $1.1 billion and $0.8 billion in 2023 and 2022. The change in the valuation allowance from 2022 to 2023 was driven by approximately $0.1 billion from acquisition related activity and the remainder was due to normal operations during the fiscal year.
The Company has wholly-owned international subsidiaries that have cumulative net losses. The Company believes that it is more likely than not that these subsidiaries will realizegenerate future taxable income sufficient to utilize these deferred tax assets. However, in certain jurisdictions, valuation allowances have been recorded against deferred tax assets for loss carryforwards that are not more likely than not to be realized.
The following table summarizes the activity related to unrecognized tax benefits:benefits for continuing operations:
|
| | | | | | | | | | |
| (Dollars in Millions) | | 2017 | | 2016 | | 2015 |
| Beginning of year | | $ | 3,041 |
| | 3,080 |
| | 2,465 |
|
| Increases related to current year tax positions | | 332 |
| | 348 |
| | 570 |
|
| Increases related to prior period tax positions | | 232 |
| | 11 |
| | 182 |
|
| Decreases related to prior period tax positions | | (416 | ) | (1) | (338 | ) | | (79 | ) |
| Settlements | | (2 | ) | | (37 | ) | | (4 | ) |
| Lapse of statute of limitations | | (36 | ) | | (23 | ) | | (54 | ) |
| End of year | | $ | 3,151 |
| | 3,041 |
| | 3,080 |
|
| | | | | | | | | | | | | | | | | | | | |
| (Dollars in Millions) | | 2023 | | 2022 | | 2021 |
| Beginning of year | | $3,716 | | 3,210 | | 3,260 |
| Increases related to current year tax positions | | 239 | | 523 | | 242 |
| Increases related to prior period tax positions | | 244 | | 143 | | 23 |
| Decreases related to prior period tax positions | | (781) | | (148) | | (128) |
| Settlements | | (880) | | (1) | | (187) |
| Lapse of statute of limitations | | (53) | | (11) | | — |
| End of year | | $2,485 | | 3,716 | | 3,210 |
As of this decrease is related toDecember 31, 2023 the TCJA
TheCompany had approximately $2.5 billion of unrecognized tax benefits of $3.2 billion at December 31, 2017, if recognized, would affect the Company’s annual effective tax rate.benefits. The Company conducts business and files tax returns in numerous countries and currently has tax audits in progress with a number of tax authorities. The IRSWith respect to the United States the Internal Revenue Service has completed its audit for theall tax years through 2009 and is currently auditing the tax years 2010-2012. 2016.
In other major jurisdictions where the Company conducts business, the years that remain open generallyto tax audits go back to the year 2004.2008. The Company believes it is possible that some tax audits may be completed by tax authorities in some
jurisdictions over the next twelve months.months by taxing authorities in some jurisdictions, including in the United States. However, the Company is not able to provide a reasonably reliable estimate of the timing of any other future tax payments relating toor change in uncertain tax positions.positions, if any.
The Company classifies liabilities for unrecognized tax benefits and related interest and penalties as long-term liabilities. Interest expense and penalties related to unrecognized tax benefits are classified as income tax expense. The Company recognized after tax interest expense of $60$99 million, $7$136 million and $44$42 million in 2017, 2016fiscal years 2023, 2022 and 2015,2021, respectively. The total amount of accrued interest was $436$264 million and $344$637 million in 2017fiscal years 2023 and 2016,2022, respectively.
9. Employee related obligations | |
9. | Employee Related Obligations |
At the end of 2017fiscal 2023 and 2016,fiscal 2022, employee related obligations recorded on the Consolidated Balance Sheets were:
| | | | | | | | | | | | | | |
| (Dollars in Millions) | | 2023 | | 2022 |
| Pension benefits | | $3,129 | | 2,475 |
| Postretirement benefits | | 1,963 | | 1,728 |
| Postemployment benefits | | 2,527 | | 2,832 |
| Deferred compensation | | 68 | | 100 |
| Total employee obligations | | 7,687 | | 7,135 |
| Less current benefits payable | | 538 | | 593 |
| Employee related obligations — non-current | | $7,149 | | 6,542 |
|
| | | | | | | |
| (Dollars in Millions) | | 2017 | | 2016 |
| Pension benefits | | $ | 5,343 |
| | 4,710 |
|
| Postretirement benefits | | 2,331 |
| | 2,733 |
|
| Postemployment benefits | | 2,250 |
| | 2,050 |
|
| Deferred compensation | | 475 |
| | 534 |
|
| Total employee obligations | | 10,399 |
| | 10,027 |
|
| Less current benefits payable | | 325 |
| | 412 |
|
| Employee related obligations — non-current | | $ | 10,074 |
| | 9,615 |
|
Prepaid employee related obligations of $526$4,992 million and $227$4,581 million for 20172023 and 2016,2022, respectively, are included in Other assets on the Consolidated Balance Sheets.
| | | | | |
10.2023 Annual Report | Pensions and Other Benefit Plans69 |
10. Pensions and other benefit plans
The Company sponsors various retirement and pension plans, including defined benefit, defined contribution and termination indemnity plans, which cover most employees worldwide. The Company also provides post-retirement benefits, primarily health care,healthcare, to all eligible U.S. retired employees and their dependents.
Many international employees are covered by government-sponsored programs and the cost to the Company is not significant.
Retirement planIn the U.S, non-union pension benefits for employees hired before January 1, 2015 are primarily based on the employee’s compensation during the last three to five years before retirement and the number of years of service. Due to an amendment of the formula used to calculate benefits of theservice (the Final Average Pay formula). U.S. Defined Benefit Plan that occurred in 2014,pension benefits for employees hired on or after January 1, 2015,2014, are primarily calculated using a different formula based on employee compensation over total years of service.service (the Retirement Value formula).
In January 2021, the Company announced that, effective on January 1, 2026, all eligible U.S. non-union employees, regardless of hire date, will earn benefits under the Retirement Value formula. This amendment does not affect the benefits accrued under the Final Average Pay formula for service before January 1, 2026.
International subsidiaries have plans under which funds are deposited with trustees, annuities are purchased under group contracts, or reserves are provided.
The Company does not typically fund retiree health carehealthcare benefits in advance but may do so at its discretion. The Company alsoand has the right to modify these plans in the future.
In 20172023 and 20162022 the Company used December 31, 20172023 and December 31, 2016,2022, respectively, as the measurement date for all U.S. and international retirement and other benefit plans.
Net periodic benefit costs for the Company’s defined benefit retirement plans and other benefit plans for 2017, 20162023, 2022 and 20152021 include the following components:
| | | | | | | | | | | | | | | | | | | | | | | | | | | | | | | | | | | | | | |
| | Retirement Plans | | Other Benefit Plans |
| (Dollars in Millions) | | 2023 | | 2022 | | 2021 | | 2023 | | 2022 | | 2021 |
| Service cost | | $893 | | 1,319 | | 1,412 | | 264 | | 320 | | 309 |
| Interest cost | | 1,437 | | 908 | | 768 | | 214 | | 104 | | 80 |
| Expected return on plan assets | | (2,716) | | (2,756) | | (2,644) | | (7) | | (8) | | (7) |
| Amortization of prior service cost | | (184) | | (184) | | (181) | | (2) | | (5) | | (31) |
| | | | | | | | | | | | |
| Recognized actuarial losses (gains) | | (199) | | 650 | | 1,251 | | 23 | | 122 | | 151 |
| Curtailments and settlements | | 93 | | 1 | | 1 | | (5) | | — | | — |
| Net periodic benefit cost (credit) | | $(676) | | (62) | | 607 | | 487 | | 533 | | 502 |
|
| | | | | | | | | | | | | | | | | | | |
| | | Retirement Plans | | Other Benefit Plans |
| (Dollars in Millions) | | 2017 | | 2016 | | 2015 | | 2017 | | 2016 | | 2015 |
| Service cost | | $ | 1,080 |
| | 949 |
| | 1,037 |
| | 247 |
| | 224 |
| | 257 |
|
| Interest cost | | 927 |
| | 927 |
| | 988 |
| | 159 |
| | 158 |
| | 186 |
|
| Expected return on plan assets | | (2,041 | ) | | (1,962 | ) | | (1,809 | ) | | (6 | ) | | (6 | ) | | (7 | ) |
| Amortization of prior service cost (credit) | | 2 |
| | 1 |
| | 2 |
| | (30 | ) | | (34 | ) | | (33 | ) |
| Recognized actuarial losses | | 609 |
| | 496 |
| | 745 |
| | 138 |
| | 135 |
| | 201 |
|
| Curtailments and settlements | | 17 |
| | 11 |
| | 8 |
| | — |
| | — |
| | — |
|
| Net periodic benefit cost | | $ | 594 |
| | 422 |
| | 971 |
| | 508 |
| | 477 |
| | 604 |
|
Amounts expected to be recognized inThe service cost component of net periodic benefit cost is presented in the coming yearsame line items on the Consolidated Statement of Earnings where other employee compensation costs are reported, including Cost of products sold, Research and development expense, Selling, marketing and administrative expenses, and Net earnings from discontinued operations, net of taxes if related to the separation of Kenvue. All other components of net periodic benefit cost are presented as part of Other (income) expense, net on the Consolidated Statement of Earnings, with the exception of certain amounts for curtailments and settlements, which are reported in Net earnings from discontinued operations, net of taxes if related to the Company’s defined benefit retirement plans and other post-retirement plans:separation of Kenvue (as noted above).
|
| | | |
(Dollars in Millions) | |
Amortization of net transition obligation | $ | — |
|
Amortization of net actuarial losses | 931 |
|
Amortization of prior service credit | 30 |
|
Unrecognized gains and losses for the U.S. pension plans are amortized over the average remaining future service for each plan. For plans with no active employees, they are amortized over the average life expectancy. The amortization of gains and losses for the other U.S. benefit plans is determined by using a 10% corridor of the greater of the market value of assets or the accumulated postretirement benefit obligation. Total unamortized gains and losses in excess of the corridor are amortized over the average remaining future service.
Prior service costs/benefits for the U.S. pension plans are amortized over the average remaining future service of plan participants at the time of the plan amendment. Prior service cost/benefit for the other U.S. benefit plans is amortized over the average remaining service to full eligibility age of plan participants at the time of the plan amendment.
The following table represents the weighted-average actuarial assumptions:
| | | | | Retirement Plans | | Other Benefit Plans |
| | Retirement Plans | | | | Retirement Plans | | Other Benefit Plans |
| Worldwide Benefit Plans | | 2017 | | 2016 | | 2015 | | 2017 | | 2016 | | 2015 | Worldwide Benefit Plans | | 2023 | | 2022 | | 2021 | | 2023 | | 2022 | | 2021 |
| Net Periodic Benefit Cost | | | |
| Service cost discount rate | |
| Service cost discount rate | |
| Service cost discount rate | | 3.59 | % | | 3.98 | | 3.78 | | 4.63 | | 4.77 | | 4.31 |
| Interest cost discount rate | | 3.98 | % | | 4.24 | | 3.78 | | 3.94 | | 4.10 | | 4.31 |
| Rate of increase in compensation levels | | 4.01 | % | | 4.02 | | 4.05 | | 4.31 | | 4.32 | | 4.11 |
| Expected long-term rate of return on plan assets | | 8.43 | % | | 8.55 | | 8.53 | |
| | | | |
| Benefit Obligation | | | |
| | Benefit Obligation | |
| | Benefit Obligation | |
| Discount rate | |
| Discount rate | |
| Discount rate | | 3.30 | % | | 3.78 | | 4.11 | | 3.78 | | 4.42 | | 4.63 |
| Rate of increase in compensation levels | | 3.99 | % | | 4.02 | | 4.01 | | 4.30 | | 4.29 | | 4.28 |
The Company’s discount rates are determined by considering current yield curves representing high quality, long-term fixed income instruments. The resulting discount rates are consistent with the duration of plan liabilities. For the fiscal year 2016, the Company changed itsThe Company's methodology in determining service and interest cost from the single weighted average discount rate approach touses duration specific spot rates along that yield curve to the plans’plans' liability cash flows, which management has concluded is a more precise estimate. Prior to this change in methodology, the Company measured service and interest costs utilizing a single weighted-average discount rate derived from the yield curve used to measure the plan obligations. The Company has accounted for this change as a change in accounting estimate and, accordingly, has accounted for it on a prospective basis. This change does not impact the benefit obligation and did not have a material impact to the 2016 full year results.flows.
The expected rates of return on plan asset assumptions represent the Company's assessment of long-term returns on diversified investment portfolios globally. The assessment is determined using projections from external financial sources, long-term historical averages, actual returns by asset class and the various asset class allocations by market.
The following table displays the assumed health carehealthcare cost trend rates, for all individuals:
| | | | | | | | | | | | | | |
| Healthcare Plans | | 2023 | | 2022 |
| Healthcare cost trend rate assumed for next year | | 13.90 | % | * | 5.96 | % |
| Rate to which the cost trend rate is assumed to decline (ultimate trend) | | 4.00 | % | | 3.99 | % |
| Year the rate reaches the ultimate trend rate | | 2048 | | | 2047 | |
|
| | | | | | |
| Health Care Plans | | 2017 | | 2016 |
| Health care cost trend rate assumed for next year | | 6.33 | % | | 6.32 | % |
| Rate to which the cost trend rate is assumed to decline (ultimate trend) | | 4.55 | % | | 4.50 | % |
| Year the rate reaches the ultimate trend rate | | 2038 |
| | 2038 |
|
A one-percentage-point change in assumed health care cost trend rates would have the following effect:
|
| | | | | | | |
| | | One-Percentage- | | One-Percentage- |
| (Dollars in Millions) | | Point Increase | | Point Decrease |
| Health Care Plans | | |
| | |
|
| Total interest and service cost | | $ | 29 |
| | (23 | ) |
| Post-retirement benefit obligation | | $ | 355 |
| | (291 | ) |
The following table sets forth information related to the benefit obligation and the fair value of plan assets at fiscal year-end 20172023 and 20162022 for the Company’s defined benefit retirement plans and other post-retirement plans:
| | | | | | | | | | | | | | | | | | | | | | | | | | |
| | Retirement Plans | | Other Benefit Plans |
| (Dollars in Millions) | | 2023 | | 2022 | | 2023 | | 2022 |
| Change in Benefit Obligation | | | | | | | | |
| Projected benefit obligation — beginning of year | | $29,390 | | 41,272 | | 4,192 | | 4,874 |
| Service cost | | 893 | | 1,319 | | 264 | | 320 |
| Interest cost | | 1,437 | | 908 | | 214 | | 104 |
| Plan participant contributions | | 73 | | 67 | | — | | — |
| Amendments | | (6) | | 7 | | — | | — |
Actuarial (gains) losses(1) | | 2,068 | | (12,159) | | 469 | | (704) |
Divestitures & acquisitions(2) | | (352) | | — | | 1 | | — |
| Curtailments, settlements & restructuring | | (238) | | (7) | | (332) | | — |
Benefits paid from plan(3) | | (2,122) | | (1,220) | | (702) | | (393) |
| Effect of exchange rates | | 601 | | (797) | | 2 | | (9) |
| Projected benefit obligation — end of year | | $31,744 | | 29,390 | | 4,108 | | 4,192 |
|
| | | | | | | | | | | | | |
| | | Retirement Plans | | Other Benefit Plans |
| (Dollars in Millions) | | 2017 | | 2016 | | 2017 | | 2016 |
| Change in Benefit Obligation | | | | | | | | |
| Projected benefit obligation — beginning of year | | $ | 28,116 |
| | 25,855 |
| | 4,605 |
| | 4,669 |
|
| Service cost | | 1,080 |
| | 949 |
| | 247 |
| | 224 |
|
| Interest cost | | 927 |
| | 927 |
| | 159 |
| | 158 |
|
| Plan participant contributions | | 60 |
| | 54 |
| | — |
| | — |
|
| Amendments | | (7 | ) | | (48 | ) | | (17 | ) | | — |
|
| Actuarial (gains) losses | | 2,996 |
| | 2,302 |
| | (166 | ) | | (73 | ) |
| Divestitures & acquisitions | | 201 |
| | (24 | ) | | 88 |
| | — |
|
| Curtailments, settlements & restructuring | | (35 | ) | | (25 | ) | | 2 |
| | — |
|
| Benefits paid from plan* | | (1,050 | ) | | (1,210 | ) | | (351 | ) | | (378 | ) |
| Effect of exchange rates | | 933 |
| | (664 | ) | | 15 |
| | 5 |
|
| Projected benefit obligation — end of year | | $ | 33,221 |
| | 28,116 |
| | 4,582 |
| | 4,605 |
|
| Change in Plan Assets | | | | | | | | |
| Plan assets at fair value — beginning of year | | $ | 23,633 |
| | 22,254 |
| | 75 |
| | 74 |
|
| Actual return on plan assets | | 4,274 |
| | 2,286 |
| | 12 |
| | 7 |
|
| Company contributions | | 664 |
| | 838 |
| | 545 |
| | 372 |
|
| Plan participant contributions | | 60 |
| | 54 |
| | — |
| | — |
|
| Settlements | | (32 | ) | | (25 | ) | | — |
| | — |
|
| Divestitures & acquisitions | | 173 |
| | (24 | ) | | — |
| | — |
|
| Benefits paid from plan assets* | | (1,050 | ) | | (1,210 | ) | | (351 | ) | | (378 | ) |
| Effect of exchange rates | | 682 |
| | (540 | ) | | — |
| | — |
|
| Plan assets at fair value — end of year | | $ | 28,404 |
| | 23,633 |
| | 281 |
| | 75 |
|
| Funded status — end of year | | $ | (4,817 | ) | | (4,483 | ) | | (4,301 | ) | | (4,530 | ) |
| Amounts Recognized in the Company’s Balance Sheet consist of the following: | | | | | | | | |
| Non-current assets | | $ | 526 |
| | 227 |
| | — |
| | — |
|
| Current liabilities | | (92 | ) | | (86 | ) | | (228 | ) | | (315 | ) |
| Non-current liabilities | | (5,251 | ) | | (4,624 | ) | | (4,073 | ) | | (4,215 | ) |
| Total recognized in the consolidated balance sheet — end of year | | $ | (4,817 | ) | | (4,483 | ) | | (4,301 | ) | | (4,530 | ) |
| Amounts Recognized in Accumulated Other Comprehensive Income consist of the following: | | | | | | | | |
| Net actuarial loss | | $ | 8,140 |
| | 7,749 |
| | 1,500 |
| | 1,804 |
|
| Prior service cost (credit) | | (25 | ) | | (12 | ) | | (137 | ) | | (150 | ) |
| Unrecognized net transition obligation | | — |
| | — |
| | — |
| | — |
|
| Total before tax effects | | $ | 8,115 |
| | 7,737 |
| | 1,363 |
| | 1,654 |
|
| | | | | | | | | |
| Accumulated Benefit Obligations — end of year | | $ | 29,793 |
| | 25,319 |
| | | | |
| | | | | | | | | |
*In 2016, the Company offered a voluntary lump-sum payment option below a pre-determined threshold for certain eligible former employees who are vested participants of the U.S. Qualified Defined Benefit Pension Plan. The distribution of the lump-sums was completed by the end of fiscal 2017. The amounts distributed in 2017 and 2016 were approximately $127 million and $420 million, respectively. These distributions from the plan did not have a material impact on the Company’s financial position.
|
| | | | | | | | | |
| | | | | | | | | | | | | | | | | | | | | | | | | | |
| Change in Plan Assets | | | | | | | | |
| Plan assets at fair value — beginning of year | | $31,496 | | 41,909 | | 78 | | 102 |
| Actual return (loss) on plan assets | | 3,951 | | (8,663) | | 16 | | (17) |
| Company contributions | | 268 | | 261 | | 694 | | 386 |
| Plan participant contributions | | 73 | | 67 | | — | | — |
| Settlements | | (176) | | (5) | | — | | — |
Divestitures & acquisitions(2) | | (509) | | — | | — | | — |
Benefits paid from plan assets(3) | | (2,122) | | (1,220) | | (702) | | (393) |
| Effect of exchange rates | | 626 | | (853) | | — | | — |
| Plan assets at fair value — end of year | | $33,607 | | 31,496 | | 86 | | 78 |
| Funded status — end of year | | $1,863 | | 2,106 | | (4,022) | | (4,114) |
| Amounts Recognized in the Company’s Balance Sheet consist of the following: | | | | | | | | |
| Non-current assets | | $4,992 | | 4,581 | | — | | — |
| Current liabilities | | (119) | | (127) | | (416) | | (461) |
| Non-current liabilities | | (3,010) | | (2,348) | | (3,606) | | (3,653) |
| Total recognized in the consolidated balance sheet — end of year | | $1,863 | | 2,106 | | (4,022) | | (4,114) |
| Amounts Recognized in Accumulated Other Comprehensive Income consist of the following: | | | | | | | | |
| Net actuarial loss | | $4,962 | | 3,948 | | 354 | | 239 |
| Prior service cost (credit) | | (1,236) | | (1,417) | | (6) | | (7) |
| Unrecognized net transition obligation | | — | | — | | — | | |
| Total before tax effects | | $3,726 | | 2,531 | | 348 | | 232 |
| | | | | | | | |
| Accumulated Benefit Obligations — end of year | | $30,139 | | 27,797 | | | | |
| | | | | | | | |
(1)The actuarial (gains)/losses for retirement plans in 2023 and 2022 were primarily driven by changes in the discount rates. (2)Primarily driven by the Kenvue separation. (3)Includes approximately $800 million transferred to a group annuity contract issued by a third-party insurer for the U.S. Salaried Pension Plan. |
| | Retirement Plans | | Other Benefit Plans |
| (Dollars in Millions) | | 2023 | | 2022 | | 2023 | | 2022 |
| Amounts Recognized in Net Periodic Benefit Cost and Other Comprehensive Income | | | | | | | | |
| Net periodic benefit cost (credit) | | $(676) | | (62) | | 487 | | 533 |
| Net actuarial (gain) loss | | 711 | | (793) | | 136 | | (751) |
| Amortization of net actuarial loss | | 199 | | (655) | | (22) | | (121) |
| Prior service cost (credit) | | (2) | | 7 | | — | | — |
| Amortization of prior service (cost) credit | | 185 | | 183 | | 2 | | 5 |
| Effect of exchange rates | | 103 | | (140) | | — | | (1) |
| Total loss/(income) recognized in other comprehensive income, before tax | | $1,195 | | (1,398) | | 116 | | (868) |
| Total recognized in net periodic benefit cost and other comprehensive income | | $519 | | (1,460) | | 603 | | (335) |
| | | | | | | | |
|
| | | | | | | | | | | | | |
| | | Retirement Plans | | Other Benefit Plans |
| (Dollars in Millions) | | 2017 | | 2016 | | 2017 | | 2016 |
| Amounts Recognized in Net Periodic Benefit Cost and Other Comprehensive Income | | | | | | | | |
| Net periodic benefit cost | | $ | 594 |
| | 422 |
| | 508 |
| | 477 |
|
| Net actuarial (gain) loss | | 740 |
| | 1,965 |
| | (169 | ) | | (72 | ) |
| Amortization of net actuarial loss | | (609 | ) | | (496 | ) | | (138 | ) | | (135 | ) |
| Prior service cost (credit) | | (7 | ) | | (48 | ) | | (17 | ) | | — |
|
| Amortization of prior service (cost) credit | | (2 | ) | | (1 | ) | | 30 |
| | 34 |
|
| Effect of exchange rates | | 256 |
| | (218 | ) | | 3 |
| | (1 | ) |
| Total loss/(income) recognized in other comprehensive income, before tax | | $ | 378 |
| | 1,202 |
| | (291 | ) | | (174 | ) |
| Total recognized in net periodic benefit cost and other comprehensive income | | $ | 972 |
| | 1,624 |
| | 217 |
| | 303 |
|
The Company plans to continue to fund its U.S. Qualified Plans to comply with the Pension Protection Act of 2006. International Plans are funded in accordance with local regulations. Additional discretionary contributions are made when deemed appropriate to meet the long-term obligations of the plans. For certain plans, funding is not a common practice, as funding provides no economic benefit. Consequently, the Company has several pension plans that are not funded.
In 2017,2023, the Company contributed $72$135 million and $592$133 million to its U.S. and international pension plans, respectively.
The following table displays the funded status of the Company's U.S. Qualified & Non-Qualified pension plans and international funded and unfunded pension plans at December 31, 20172023 and December 31, 2016,2022, respectively:
| | | | | | | | | | | | | | | | | | | | | | | | | | | | | | | | | | | |
| U.S. Plans | | International Plans |
| Qualified Plans | | Non-Qualified Plans | | Funded Plans | | Unfunded Plans |
| (Dollars in Millions) | 2023 | 2022 | | 2023 | 2022 | | 2023 | 2022 | | 2023 | 2022 |
| Plan Assets | $22,298 | 20,937 | | — | — | | 11,309 | 10,559 | | — | — |
| Projected Benefit Obligation | 19,152 | 18,394 | | 2,037 | 1,937 | | 10,431 | 8,982 | | 124 | 77 |
| Accumulated Benefit Obligation | 18,557 | 17,696 | | 1,982 | 1,872 | | 9,498 | 8,166 | | 102 | 63 |
| Over (Under) Funded Status | | | | | | | | | | | |
| Projected Benefit Obligation | $3,146 | 2,543 | | (2,037) | (1,937) | | 878 | 1,577 | | (124) | (77) |
| Accumulated Benefit Obligation | 3,741 | 3,241 | | (1,982) | (1,872) | | 1,811 | 2,393 | | (102) | (63) |
|
| | | | | | | | | | | | | | | | | |
| | U.S. Plans | International Plans |
| | Qualified Plans | Non-Qualified Plans | Funded Plans | Unfunded Plans |
| (Dollars in Millions) | 2017 | 2016 | 2017 | 2016 | 2017 | 2016 | 2017 | 2016 |
| Plan Assets | $ | 18,681 |
| 16,057 |
| — |
| — |
| 9,723 |
| 7,576 |
| — |
| — |
|
| Projected Benefit Obligation | 19,652 |
| 16,336 |
| 2,257 |
| 1,905 |
| 10,863 |
| 9,502 |
| 449 |
| 373 |
|
| Accumulated Benefit Obligation | 17,654 |
| 14,759 |
| 1,849 |
| 1,568 |
| 9,893 |
| 8,663 |
| 397 |
| 329 |
|
| Over (Under) Funded Status | | | | | | | | |
| Projected Benefit Obligation | $ | (971 | ) | (279 | ) | (2,257 | ) | (1,905 | ) | (1,140 | ) | (1,926 | ) | (449 | ) | (373 | ) |
| Accumulated Benefit Obligation | 1,027 |
| 1,298 |
| (1,849 | ) | (1,568 | ) | (170 | ) | (1,087 | ) | (397 | ) | (329 | ) |
Plans with accumulated benefit obligations in excess of plan assets have an accumulated benefit obligation, projected benefit obligation and plan assets of $3.8$5.8 billion, $4.6$6.1 billion and $0.7$3.1 billion, respectively, at the end of 2017,2023, and $8.8$2.7 billion,, $9.9 $2.7 billion and $5.6$0.3 billion,, respectively, at the end of 2016.
2022.
The following table displays the projected future benefit payments from the Company’s retirement and other benefit plans:
| | | (Dollars in Millions) | | 2018 | | 2019 | | 2020 | | 2021 | | 2022 | | 2023-2027 | (Dollars in Millions) | | 2024 | | 2025 | | 2026 | | 2027 | | 2028 | | 2029-2033 |
| Projected future benefit payments | | | | | | | | | | | | |
| Retirement plans | | $ | 970 |
| | 1,007 |
| | 1,057 |
| | 1,131 |
| | 1,190 |
| | 7,062 |
|
| Retirement plans | |
| Retirement plans | | | $1,481 | | 1,473 | | 1,549 | | 1,647 | | 1,745 | | 10,133 |
| | Other benefit plans | | $ | 322 |
| | 312 |
| | 306 |
| | 301 |
| | 297 |
| | 1,395 |
|
| | Other benefit plans | |
| | Other benefit plans | | | $427 | | 438 | | 396 | | 411 | | 428 | | 2,360 |
The following table displays the projected future minimum contributions to the unfunded retirement plans. These amounts do not include any discretionary contributions that the Company may elect to make in the future.
|
| | | | | | | | | | | | | | | | | | | |
| (Dollars in Millions) | | 2018 | | 2019 | | 2020 | | 2021 | | 2022 | | 2023-2027 |
| Projected future contributions | | $ | 88 |
| | 89 |
| | 94 |
| | 100 |
| | 108 |
| | 651 |
|
| | | | | | | | | | | | | | | | | | | | | | | | | | | | | | | | | | | | | | |
| (Dollars in Millions) | | 2024 | | 2025 | | 2026 | | 2027 | | 2028 | | 2029-2033 |
| Projected future contributions | | $122 | | 126 | | 133 | | 139 | | 145 | | 787 |
Each pension plan is overseen by a local committee or board that is responsible for the overall administration and investment of the pension plans. In determining investment policies, strategies and goals, each committee or board considers factors including, local pension rules and regulations; local tax regulations; availability of investment vehicles (separate accounts, commingled accounts, insurance funds, etc.); funded status of the plans; ratio of actives to retirees; duration of liabilities; and other relevant factors including: diversification, liquidity of local markets and liquidity of base currency. A majority of the Company’s pension funds are open to new entrants and are expected to be on-going plans. Permitted investments are primarily liquid and/or listed, with little reliance on illiquid and non-traditional investments such as hedge funds.
The Company’s retirement plan asset allocation at the end of 20172023 and 20162022 and target allocations for 20182024 are as follows:
|
| | | | | | | | | |
| | | Percent of Plan Assets | | Target Allocation |
| | | 2017 | | 2016 | | 2018 |
| Worldwide Retirement Plans | | | | | | |
| Equity securities | | 76 | % | | 75 | % | | 73 | % |
| Debt securities | | 24 |
| | 25 |
| | 27 |
|
| Total plan assets | | 100 | % | | 100 | % | | 100 | % |
| | | | | | | | | | | | | | | | | | | | |
| | Percent of
Plan Assets | | Target
Allocation |
| | 2023 | | 2022 | | 2024 |
| Worldwide Retirement Plans | | | | | | |
| Equity securities | | 58 | % | | 62 | % | | 58 | % |
| Debt securities | | 42 | | | 38 | | | 42 | |
| Total plan assets | | 100 | % | | 100 | % | | 100 | % |
Determination of Fair Valuefair value of Plan Assetsplan assets
The Plan has an established and well-documented process for determining fair values. Fair value is based upon quoted market prices, where available. If listed prices or quotes are not available, fair value is based upon models that primarily use, as inputs, market-based or independently sourced market parameters, including yield curves, interest rates, volatilities, equity or debt prices, foreign exchange rates and credit curves.
While the Plan believes its valuation methods are appropriate and consistent with other market participants, the use of different methodologies or assumptions to determine the fair value of certain financial instruments could result in a different estimate of fair value at the reporting date.
Valuation Hierarchyhierarchy
The authoritative literature establishes a three-level hierarchy to prioritize the inputs used in measuring fair value. The levels within the hierarchy are described in the table below with Level 1 having the highest priority and Level 3 having the lowest.
The Net Asset Value (NAV) is based on the value of the underlying assets owned by the fund, minus its liabilities, and then divided by the number of shares outstanding.
A financial instrument’s categorization within the valuation hierarchy is based upon the lowest level of input that is significant to the fair value measurement.
Following is a description of the valuation methodologies used for the investments measured at fair value.
•Short-term investment funds — Cash and quoted short-term instruments are valued at the closing price or the amount held on deposit by the custodian bank. Other investments are through investment vehicles valued using the Net Asset Value (NAV)NAV provided by the administrator of the fund. The NAV is based on the value of the underlying assets owned by the fund, minus its liabilities, and then divided by the number of shares outstanding. The NAV is a quoted price in a market that is not active and classified as Level 2.
•Government and agency securities — A limited number of these investments are valued at the closing price reported on the major market on which the individual securities are traded. Where quoted prices are available in an active market, the investments are classified within Level 1 of the valuation hierarchy. If quoted market prices are not available for the specific security, then fair values are estimated by using pricing models, quoted prices of securities with similar characteristics or discounted cash flows. When quoted market prices for a security are not available in an active market, they are classified as Level 2.
•Debt instruments — A limited number of these investments are valued at the closing price reported on the major market on which the individual securities are traded. Where quoted prices are available in an active market, the investments are classified as Level 1. If quoted market prices are not available for the specific security, then fair values are estimated by using pricing models, quoted prices of securities with similar characteristics or discounted cash flows and are classified as Level 2. Level 3 debt instruments are priced based on unobservable inputs.
•Equity securities — Equity securities are valued at the closing price reported on the major market on which the individual securities are traded. Substantially all common stock isequity securities are classified within Level 1 of the valuation hierarchy.
•Commingled funds — These investment vehicles are valued using the NAV provided by the fund administrator. The NAV is based on the value of the underlying assets owned by the fund, minus its liabilities, and then divided by the number of shares outstanding. Assets in the Level 2 category have a quoted market price.
Insurance contracts — The instruments are issued by insurance companies. The fair value is based on negotiated value and the underlying investments held in separate account portfolios as well as considering the credit worthiness of the issuer. The underlying investments are government, asset-backed and fixed income securities. In general, insurance contracts are classified as Level 3 as there are no quoted prices nor other observable inputs for pricing.
•Other assets — Other assets are represented primarily by limited partnerships and real estate investments, as well as commercial loans and commercial mortgages thatpartnerships. These investment vehicles are not classified as corporate debt.valued using the NAV provided by the fund administrator. Other assets that are exchange listed and actively traded are classified as Level 1, while inactively traded assets are classified as Level 2.
The following table sets forth the Retirement Plans' investments measured at fair value as of December 31, 20172023 and December 31, 2016:2022:
| | | | | | | | | | | | | | | | | | | | | | | | | | | | | | | | | | | | | | | | | | | | | | | | | | | | | | | | | | | | | | |
| | Quoted Prices
in Active
Markets for
Identical Assets | | Significant
Other
Observable
Inputs | | Significant Unobservable Inputs(1) | | Investments Measured at Net Asset Value | | | | |
| | (Level 1) | | (Level 2) | | (Level 3) | | | | | | Total Assets |
| (Dollars in Millions) | | 2023 | | 2022 | | 2023 | | 2022 | | 2023 | | 2022 | | 2023 | | 2022 | | 2023 | | 2022 |
| Short-term investment funds | | $12 | | 26 | | 829 | | 13 | | — | | — | | — | | — | | 841 | | 39 |
| Government and agency securities | | — | | — | | 5,985 | | 5,863 | | — | | — | | — | | — | | 5,985 | | 5,863 |
| Debt instruments | | — | | — | | 3,899 | | 3,681 | | — | | — | | — | | — | | 3,899 | | 3,681 |
| Equity securities | | 7,764 | | 8,846 | | — | | 2 | | — | | — | | — | | — | | 7,764 | | 8,848 |
| Commingled funds | | — | | — | | 4,967 | | 4,362 | | 43 | | 56 | | 6,672 | | 6,096 | | 11,682 | | 10,514 |
| | | | | | | | | | | | | | | | | | | | |
| Other assets | | — | | — | | 49 | | 33 | | 92 | | 12 | | 3,295 | | 2,506 | | 3,436 | | 2,551 |
| Investments at fair value | | $7,776 | | 8,872 | | 15,729 | | 13,954 | | 135 | | 68 | | 9,967 | | 8,602 | | 33,607 | | 31,496 |
|
| | | | | | | | | | | | | | | | | | | | | | | | | | | | | | | |
| | | Quoted Prices in Active Markets for Identical Assets | | Significant Other Observable Inputs | | Significant Unobservable Inputs(a) | | Investments Measured at Net Asset Value | | | | |
| | | (Level 1) | | (Level 2) | | (Level 3) | | | | | | Total Assets |
| (Dollars in Millions) | | 2017 | | 2016 | | 2017 | | 2016 | | 2017 | | 2016 | | 2017 | | 2016 | | 2017 | | 2016 |
| Short-term investment funds | | $ | 429 |
| | 145 |
| | 427 |
| | 652 |
| | — |
| | — |
| | — |
| | — |
| | 856 |
| | 797 |
|
| Government and agency securities | | — |
| | — |
| | 3,094 |
| | 2,655 |
| | — |
| | — |
| | — |
| | — |
| | 3,094 |
| | 2,655 |
|
| Debt instruments | | — |
| | — |
| | 2,013 |
| | 1,237 |
| | — |
| | — |
| | — |
| | — |
| | 2,013 |
| | 1,237 |
|
| Equity securities | | 13,848 |
| | 11,433 |
| | — |
| | 12 |
| | — |
| | — |
| | — |
| | — |
| | 13,848 |
| | 11,445 |
|
| Commingled funds | | — |
| | — |
| | 1,780 |
| | 1,316 |
| | 57 |
| | — |
| | 6,158 |
| | 5,767 |
| | 7,995 |
| | 7,083 |
|
| Insurance contracts | | — |
| | — |
| | — |
| | — |
| | 199 |
| | 24 |
| | — |
| | — |
| | 199 |
| | 24 |
|
| Other assets | | — |
| | — |
| | 121 |
| | — |
| | — |
| | — |
| | 278 |
| | 392 |
| | 399 |
| | 392 |
|
| Investments at fair value | | $ | 14,277 |
| | 11,578 |
| | 7,435 |
| | 5,872 |
| | 256 |
| | 24 |
| | 6,436 |
| | 6,159 |
| | 28,404 |
| | 23,633 |
|
(a)(1)The activity for the Level 3 assets is not significant for all years presented.
The Company's Other Benefit Plans are unfunded except for U.S. commingled funds (Level 2) of $81$86 million and $75$78 million and U.S. short-term investment funds (Level 2) of $200 million and $0 at December 31, 20172023 and December 31, 2016,2022, respectively.
The fair value of Johnson & Johnson Common Stock directly held in plan assets was $938$14 million (3.3%(0.0% of total plan assets) at December 31, 20172023 and $847$21 million (3.6% (0.1% of total plan assets) at December 31, 2016.2022.
The Company has voluntary 401(k) savings plans designed to enhance the existing retirement programs covering eligible employees. The Company matches a percentage of each employee’s contributions consistent with the provisions of the plan for which he/shethe employee is eligible. Total Company matching contributions to the plans were $214$263 million, $191$257 million and $187$239 million in 2017, 2016fiscal years 2023, 2022 and 2015,2021, respectively.
12. Capital and treasury stock
| |
12. | Capital and Treasury Stock |
Changes in treasury stock were:
| | | | | | | | | | | | | | |
| | Treasury Stock |
| (Amounts in Millions Except Treasury Stock Shares in Thousands) | | Shares | | Amount |
| Balance at January 3, 2021 | | 487,331 | | $38,490 |
| Employee compensation and stock option plans | | (17,399) | | (2,847) |
| Repurchase of common stock | | 20,946 | | 3,456 |
| Balance at January 2, 2022 | | 490,878 | | 39,099 |
| Employee compensation and stock option plans | | (20,007) | | (3,440) |
| Repurchase of common stock | | 35,375 | | 6,035 |
| Balance at January 1, 2023 | | 506,246 | | 41,694 |
| Employee compensation and stock option plans | | (15,521) | | (2,529) |
| Repurchase of common stock | | 31,085 | | 5,079 |
| Kenvue share exchange (Note 21) | | 190,955 | | 31,418 |
| Balance at December 31, 2023 | | 712,765 | | $75,662 |
|
| | | | | | | |
| | | Treasury Stock |
| (Amounts in Millions Except Treasury Stock Shares in Thousands) | | Shares | | Amount |
| Balance at December 28, 2014 | | 336,620 |
| | $ | 19,891 |
|
| Employee compensation and stock option plans | | (24,413 | ) | | (2,497 | ) |
| Repurchase of common stock | | 52,474 |
| | 5,290 |
|
| Balance at January 3, 2016 | | 364,681 |
| | 22,684 |
|
| Employee compensation and stock option plans | | (30,839 | ) | | (3,311 | ) |
| Repurchase of common stock | | 79,490 |
| | 8,979 |
|
| Balance at January 1, 2017 | | 413,332 |
| | 28,352 |
|
| Employee compensation and stock option plans | | (25,508 | ) | | (3,156 | ) |
| Repurchase of common stock | | 49,494 |
| | 6,358 |
|
| Balance at December 31, 2017 | | 437,318 |
| | $ | 31,554 |
|
Aggregate shares of common stock issued were approximately 3,119,843,000 shares at the end of 2017, 2016fiscal years 2023, 2022 and 2015.2021.
Cash dividends paid were $3.32$4.70 per share in 2017,fiscal year 2023, compared with dividends of $3.15$4.45 per share in 2016,fiscal year 2022, and $2.95$4.19 per share in 2015.fiscal year 2021.
On October 13, 2015,January 2, 2024, the Company announced that its Board of Directors approveddeclared a regular cash dividend of $1.19 per share, repurchase program, authorizing the Companypayable on March 5, 2024 to purchase up to $10.0 billionshareholders of the Company's shares of common stock. This share repurchase program was completedrecord as of July 2, 2017.February 20, 2024.
On July 21, 2014,September 14, 2022, the Company announced that its Board of Directors approved a share repurchase program, authorizing the Company to purchase up to $5.0 billion of the Company's shares of common stock. This shareThe repurchase program was completed on April 28, 2015.during the fiscal first quarter of 2023.
| | | | | |
13.76 | Accumulated Other Comprehensive Income (Loss) |
13. Accumulated other comprehensive income (loss)
Components of other comprehensive income (loss) consist of the following:
|
| | | | | | | | | | | | | | | | |
| (Dollars in Millions) | | Foreign
Currency Translation | | Gain/(Loss) On Securities | | Employee Benefit Plans | | Gain/
(Loss) On
Derivatives & Hedges | | Total
Accumulated
Other
Comprehensive Income (Loss) |
| December 28, 2014 | | $ | (4,803 | ) | | 257 |
| | (6,317 | ) | | 141 |
| | (10,722 | ) |
| Net 2015 changes | | (3,632 | ) | | 347 |
| | 1,019 |
| | (177 | ) | | (2,443 | ) |
January 3, 2016
| | (8,435 | ) | | 604 |
| | (5,298 | ) | | (36 | ) | | (13,165 | ) |
| Net 2016 changes | | (612 | ) | | (193 | ) | | (682 | ) | | (249 | ) | | (1,736 | ) |
January 1, 2017
| | (9,047 | ) | | 411 |
| | (5,980 | ) | | (285 | ) | | (14,901 | ) |
| Net 2017 changes | | 1,696 |
| | (179 | ) | | (170 | ) | | 355 |
| | 1,702 |
|
| December 31, 2017 | | $ | (7,351 | ) | | 232 |
| | (6,150 | ) | | 70 |
| | (13,199 | ) |
| | | | | | | | | | | | | | | | | | | | | | | | | | | | | | | | |
| (Dollars in Millions) | Foreign
Currency
Translation | | Gain/
(Loss) On
Securities | | Employee
Benefit Plans | | Gain/
(Loss) On
Derivatives
& Hedges | | Total
Accumulated
Other
Comprehensive
Income (Loss) |
| January 3, 2021 | | $(8,938) | | 1 | | (6,957) | | 652 | | (15,242) |
| | | | | | | | | | |
| Net 2021 changes | | (1,079) | | (4) | | 4,255 | | (988) | | 2,184 |
| January 2, 2022 | | (10,017) | | (3) | | (2,702) | | (336) | | (13,058) |
| | | | | | | | | | |
| Net 2022 changes | | (1,796) | | (24) | | 1,805 | | 106 | | 91 |
| January 1, 2023 | | (11,813) | | (27) | | (897) | | (230) | | (12,967) |
| Net 2023 changes | | (3,221) | | 26 | | (1,399) | | (147) | | (4,741) |
| Kenvue Separation/IPO | | 4,885 | | | | 296 | * | | | 5,181 |
| December 31, 2023 | | $(10,149) | | (1) | | (2,000) | | (377) | | (12,527) |
Amounts in accumulated other comprehensive income are presented net of the related tax impact. Foreign currency translation is not adjusted for income taxes where it relates to permanent investments in international subsidiaries. For additional details on comprehensive income see the Consolidated Statements of Comprehensive Income.
Details on reclassifications out of Accumulated Other Comprehensive Income:
Gain/(Loss) On Securities - reclassifications released to Other (income) expense, net.
Employee Benefit Plans - reclassifications are included in net periodic benefit cost. See Note 10 for additional details.
Gain/(Loss) On Derivatives & Hedges - reclassifications to earnings are recorded in the same account as the hedged transaction. See Note 6 for additional details.
* Includes impact of curtailments and settlements in connection with separation from Kenvue.
14. International currency translation
| |
14. | International Currency Translation |
For translation of its subsidiaries operating in non-U.S. Dollar currencies, the Company has determined that the local currencies of its international subsidiaries are the functional currencies except those in highly inflationary economies, which are defined as those which have had compound cumulative rates of inflation of 100% or more during the past three years,, or where a substantial portion of its cash flows are not in the local currency. For the majority of the Company's subsidiaries the local currency is the functional currency.
In consolidating international subsidiaries, balance sheet currency effects are recorded as a component of accumulated other comprehensive income. The other current and non-current assets line within the Statement of Cash flows includes the impact of foreign currency translation. This equity account includes the results of translating certain balance sheet assets and liabilities at current exchange rates and some accounts at historical rates, except for those located in highly inflationary economies.economies (Argentina and Venezuela). Beginning in the fiscal second quarter of 2022, the Company also accounted for operations in Turkey as highly inflationary. The translation of balance sheet accounts for highly inflationary economies are reflected in the operating results.
A rollforward of the changes during 2017, 2016fiscal years 2023, 2022 and 20152021 for foreign currency translation adjustments is included in Note 13.
Net currency transaction gains and losses included in Other (income) expense were losses of $366 million, $286 million and $216 million $289 millionin fiscal years 2023, 2022 and $104 million in 2017, 2016 and 2015,2021, respectively.
| | | | | |
15.2023 Annual Report | Earnings Per Share77 |
15. Earnings per share
The following is a reconciliation of basic net earnings per share to diluted net earnings per share for the fiscal years ended December 31, 2017, 2023, January 1, 20172023 and January 3, 2016:2, 2022:
|
| | | | | | | | | | |
| (In Millions Except Per Share Amounts) | | 2017 | | 2016 | | 2015 |
| Basic net earnings per share | | $ | 0.48 |
| | 6.04 |
| | 5.56 |
|
| Average shares outstanding — basic | | 2,692.0 |
| | 2,737.3 |
| | 2,771.8 |
|
| Potential shares exercisable under stock option plans | | 139.7 |
| | 142.4 |
| | 141.5 |
|
| Less: shares repurchased under treasury stock method | | (87.3 | ) | | (92.1 | ) | | (102.6 | ) |
| Convertible debt shares | | 0.9 |
| | 1.3 |
| | 2.2 |
|
| Adjusted average shares outstanding — diluted | | 2,745.3 |
| | 2,788.9 |
| | 2,812.9 |
|
| Diluted net earnings per share | | $ | 0.47 |
| | 5.93 |
| | 5.48 |
|
The diluted net earnings per share calculation included the dilutive effect of convertible debt that is offset by the related reduction in interest expense of $1 million after-tax for year 2017, $2 million for year 2016 and $3 million for year 2015. | | | | | | | | | | | | | | | | | | | | |
| (In Millions Except Per Share Amounts) | | 2023 | | 2022 | | 2021 |
| Basic net earnings per share from continuing operations | | $5.26 | | 6.23 | | 6.76 |
| Basic net earnings per share from discontinued operations | | 8.62 | | 0.60 | | 1.17 |
| Total net earnings per share - basic | | 13.88 | | 6.83 | | 7.93 |
| Average shares outstanding — basic | | 2,533.5 | | 2,625.2 | | 2,632.1 |
| Potential shares exercisable under stock option plans | | 94.1 | | 140.1 | | 138.0 |
| Less: shares repurchased under treasury stock method | | (67.2) | | (101.4) | | (96.1) |
| Adjusted average shares outstanding — diluted | | 2,560.4 | | 2,663.9 | | 2,674.0 |
| Diluted net earnings per share from continuing operations | | 5.20 | | 6.14 | | 6.66 |
| Diluted net earnings per share from discontinuing operations | | 8.52 | | 0.59 | | 1.15 |
| Total net earnings per share - diluted | | $13.72 | | 6.73 | | 7.81 |
The diluted net earnings per share calculation for 2017, 2016fiscal year 2023 excluded 43 million shares related to stock options, as the exercise price of these options was greater than the average market value of the Company's stock.
The diluted net earnings per share calculation for the fiscal years 2022 and 20152021 included all shares related to stock options, as the exercise price of allthese options was less than the average market value of the Company's stock.
| |
16. | Rental Expense and Lease Commitments |
Rentals of space, vehicles, manufacturing equipment16. Common stock, stock option plans and office and data processing equipment under operating leases were approximately $372 million, $330 million and $316 million in 2017, 2016 and 2015, respectively.stock compensation agreements
The approximate minimum rental payments required under operating leases that have initial or remaining non-cancelable lease terms in excess of one year atAt December 31, 2017 are:
(Dollars in Millions)
|
| | | | | | | | | | | | |
| 2018 | | 2019 | | 2020 | | 2021 | | 2022 | | After 2022 | | Total |
| $227 | | 184 | | 143 | | 106 | | 76 | | 103 | | 839 |
Commitments under capital leases are not significant.
| |
17. | Common Stock, Stock Option Plans and Stock Compensation Agreements |
At December 31, 2017,2023, the Company had 2one stock-based compensation plans.plan. The shares outstanding are for contracts under the Company's 20052012 Long-Term Incentive Plan and the 20122022 Long-Term Incentive Plan. The 20052012 Long-Term Incentive Plan expired on April 26, 2012.2022. All awards (stock options, and restricted shares units and performance share units) granted subsequent to that date were under the 20122022 Long-Term Incentive Plan. Under the 20122022 Long-Term Incentive Plan, the Company may issue up to 650150 million shares of common stock, plus anyof which up to 110 million shares canceled, expired, forfeited,of common stock may be issued subject to stock options or notstock appreciation rights and up to 40 million shares of common stock may be issued fromsubject to full value awards. Awards will generally be counted on a 1-for-1 basis against the 2005 Long-Term Incentive Plan subsequent to April 26, 2012.share reserve, provided that if more than 40 million full value awards are granted, each full value award in excess of 40 million will be counted on a 5-for-1 basis against the share reserve. Shares available for future grants under the 20122022 Long-Term Incentive Plan were 389130 million at the end of 2017.fiscal year 2023.
The compensation cost that has been charged against income for these plans was $962$1,087 million, $878$1,028 million and $874$1,038 million for 2017, 2016fiscal years 2023, 2022 and 2015,2021, respectively. The total income tax benefit recognized in the income statement for share-based compensation costs was $275$221 million, $256$177 million and $253$199 million for 2017, 2016fiscal years 2023, 2022 and 2015,2021, respectively. AnThe Company also recognized additional tax
benefit of $353 million was recognized in 2016 due to the adoption of a new accounting standard for the reporting of additionalincome tax benefits on share-based compensation.of $126 million, $267 million and $213 million for fiscal years 2023, 2022 and 2021, respectively, for which options were exercised or restricted shares were vested. The total unrecognized compensation cost was $798$907 million, $749$866 million and $744$775 million for 2017, 2016fiscal years 2023, 2022 and 2015,2021, respectively. The weighted average period for this cost to be recognized was 1.761.80 years, 1.091.80 years and 0.981.78 years for 2017, 2016,fiscal years 2023, 2022, and 2015,2021, respectively. Share-based compensation costs capitalized as part of inventory were insignificant in all periods.
The Company settles employee benefit equity issuances with treasury shares. Treasury shares are replenished through market purchases throughout the year for the number of shares used to settle employee benefit equity issuances.
Stock Optionsoptions
Stock options expire 10 years from the date of grant and vest over service periods that range from 6 months to 4 years. All options areyears.
Options granted under the 2012 Long-Term Incentive Plan were granted at the average of the high and low prices of the Company’s Common Stock on the New York Stock Exchange on the date of grant. Options granted under the 2022 Long-Term incentive Plan were granted at the closing price of the Company’s Common Stock on the New York Stock Exchange on the date of grant.
The fair value of each option award was estimated on the date of grant using the Black-Scholes option valuation model that uses the assumptions noted in the following table. For 2017, 20162023, 2022, and 20152021 grants, expected volatility represents a blended rate of 10-year weekly historical overall volatility rate, and a 5-week average implied volatility rate based on at-the-money traded Johnson & Johnson options with a life of 2 years. For all grants, historical data is used to determine the expected life of the option. The risk-free rate was based on the U.S. Treasury yield curve in effect at the time of grant.
The average fair value of options granted was $13.38, $10.01$27.85, $23.23 and $10.68,$20.86, in 2017, 2016fiscal years 2023, 2022 and 2015,2021, respectively. The fair value was estimated based on the weighted average assumptions of: | | | | | | | | | | | | | | | | | |
| 2023 | | 2022 | | 2021 |
| Risk-free rate | 3.74 | % | | 1.98 | % | | 0.83 | % |
| Expected volatility | 17.69 | % | | 18.00 | % | | 18.59 | % |
| Expected life (in years) | 7.0 | | 7.0 | | 7.0 |
| Expected dividend yield | 2.90 | % | | 2.70 | % | | 2.50 | % |
|
| | | | | | | | |
| | 2017 | | 2016 | | 2015 |
| Risk-free rate | 2.25 | % | | 1.51 | % | | 1.77 | % |
| Expected volatility | 15.30 | % | | 15.76 | % | | 15.48 | % |
| Expected life (in years) | 7.0 |
| | 7.0 |
| | 7.0 |
|
| Expected dividend yield | 2.90 | % | | 3.10 | % | | 2.90 | % |
A summary of option activity under the Plan as of December 31, 2017, January 1, 2017 and January 3, 2016, and changes during the years ending on those dates2023, is presented below: | | | | | | | | | | | | | | | | | | | | |
| (Shares in Thousands) | | Outstanding
Shares | | Weighted
Average Exercise
Price | | Aggregate
Intrinsic
Value
(Dollars in Millions) |
| | | | | | |
| | | | | | |
| | | | | | |
| | | | | | |
| | | | | | |
| | | | | | |
| | | | | | |
| | | | | | |
| Shares at January 1, 2023 | | 118,672 | | $134.95 | | $4,949 |
| Options granted | | 16,320 | | 162.75 | | |
| Options exercised | | (12,386) | | 109.48 | | |
| Options canceled/forfeited* | | (10,368) | | 155.62 | | |
| Shares at December 31, 2023 | | 112,238 | | $139.88 | | $2,239 |
|
| | | | | | | | | | | |
| (Shares in Thousands) | | Outstanding Shares | | Weighted Average Exercise Price | | Aggregate Intrinsic Value (Dollars in Millions) |
| Shares at December 28, 2014 | | 115,712 |
| | $ | 70.37 |
| | $ | 4,014 |
|
| Options granted | | 20,484 |
| | 100.06 |
| | |
| Options exercised | | (16,683 | ) | | 62.53 |
| | |
| Options canceled/forfeited | | (2,996 | ) | | 82.22 |
| | |
| Shares at January 3, 2016 | | 116,517 |
| | 76.41 |
| | 3,065 |
|
| Options granted | | 22,491 |
| | 101.87 |
| | |
| Options exercised | | (22,547 | ) | | 65.66 |
| | |
| Options canceled/forfeited | | (3,006 | ) | | 92.83 |
| | |
| Shares at January 1, 2017 | | 113,455 |
| | 83.16 |
| | 3,636 |
|
| Options granted | | 19,287 |
| | 115.67 |
| | |
| Options exercised | | (18,975 | ) | | 70.87 |
| | |
| Options canceled/forfeited | | (2,461 | ) | | 101.40 |
| | |
| Shares at December 31, 2017 | | 111,306 |
| | $ | 90.48 |
| | $ | 5,480 |
|
The total intrinsic value of options exercised was $1,060$729 million, $980$1,228 million and $644$919 million in 2017, 2016fiscal years 2023, 2022 and 2015,2021, respectively.
*includes 7,689 shares of options cancelled as a result of the conversion of Johnson & Johnson stock options held by Kenvue employees into Kenvue stock options
The following table summarizes stock options outstanding and exercisable at December 31, 2017:2023:
| | | | | | | | | | | | | | | | | | | | | | | | | | | | | | | | |
| (Shares in Thousands) | | Outstanding | | Exercisable |
| Exercise Price Range | | Options | | Average Life(1) | | Weighted
Average
Exercise Price | | Options | | Weighted
Average
Exercise Price |
| $90.44 - $101.87 | | 20,774 | | 1.4 | | $99.21 | | 20,774 | | $99.21 |
| $115.67 - $129.51 | | 19,368 | | 3.6 | | 122.49 | | 19,368 | | 122.49 |
| $131.94 - $151.41 | | 27,391 | | 5.6 | | 142.84 | | 26,676 | | 142.61 |
| $162.70 - $162.75 | | 13,928 | | 9.1 | | 162.75 | | 6 | | 162.75 |
| $164.62 - $165.89 | | 30,777 | | 7.6 | | 165.29 | | 174 | | 165.12 |
| | | 112,238 | | 5.5 | | $139.88 | | 66,998 | | $123.39 |
|
| | | | | | | | | | | | |
| (Shares in Thousands) | | Outstanding | | Exercisable |
| Exercise Price Range | | Options | | Average Life(1) | | Average Exercise Price | | Options | | Average Exercise Price |
| $52.13-$62.20 | | 12,148 |
| | 1.7 | | $60.37 | | 12,148 |
| | $60.37 |
$62.62-$65.62
| | 9,548 |
| | 3.0 | | $63.91 | | 9,547 |
| | $63.91 |
$66.07-$72.54
| | 14,816 |
| | 5.0 | | $72.53 | | 14,816 |
| | $72.53 |
| $90.44-$100.48 | | 35,035 |
| | 6.6 | | $95.48 | | 15,843 |
| | $90.49 |
| $101.87-$115.67 | | 39,759 |
| | 8.6 | | $108.35 | | 67 |
| | $105.91 |
| | | 111,306 |
| | 6.3 | | $90.48 | | 52,421 |
| | $73.61 |
(1) Average contractual life remaining in years.
Stock options outstanding at January 1, 20172023 and January 3, 20162, 2022 were 113,455118,672 and an average life of 6.25.8 years and 116,517117,361 and an average life of 5.95.8 years, respectively. Stock options exercisable at January 1, 20172023 and January 3, 20162, 2022 were 50,41463,661 at an average price of $65.77$113.06 and 48,34562,742 at an average price of $62.26,$104.42, respectively.
Restricted Share Unitsshare units and Performance Share Unitsperformance share units
The Company grants restricted share units which vest over service periods that range from 6 months to 3 years.years. The Company also grants performance share units, which are paid in shares of Johnson & Johnson Common Stock after the end of a three-yearthree-year performance period. Whether any performance share units vest, and the amount that does vest, is tied to the completion of service periods that range from 6 months to 3 years and the achievement, over a three-year period, of threePerformance shares were granted with two equally-weighted goals that directly align with or help drive long-term total shareholder return: operational sales, adjusted operational earnings per share and relative total shareholder return. The number of shares actually earned at the end of the three-year period will vary, based only on actual performance, from 0% to 200% of the target number of performance share units granted. In the fourth quarter of 2017, the Company modified the restricted share units that are scheduled to vest between January 1, 2018 and March 15, 2018. This modification guaranteed a minimum aggregate value, below the market value of the total expected payout amount, for all awards expected to vest during this period. The amount that was committed was not material to the Company’s overall financial position.granted.
A summary of the restricted share units and performance share units activity under the Plans as of December 31, 20172023 is presented below:
| | | | | | | | | | | | | | |
| (Shares in Thousands) | | Outstanding
Restricted Share Units | | Outstanding
Performance Share Units |
| | | | |
| | | | |
| | | | |
| | | | |
| | | | |
| | | | |
| | | | |
| | | | |
| Shares at January 1, 2023 | | 13,616 | | 2,357 |
| Granted | | 5,910 | | 828 |
| Issued | | (4,329) | | (785) |
| Canceled/forfeited/adjusted* | | (2,259) | | (363) |
| Shares at December 31, 2023 | | 12,938 | | 2,037 |
*includes 1,421 shares of restricted share units and 264 shares of performance share units cancelled as a result of the conversion of Johnson & Johnson restricted share units and performance share units held by Kenvue employees into Kenvue restricted share units |
| | | | | | |
| (Shares in Thousands) | | Outstanding Restricted Share Units | | Outstanding Performance Share Units |
| Shares at January 1, 2017 | | 21,061 |
| | 2,415 |
|
| Granted | | 7,248 |
| | 1,276 |
|
| Issued | | (7,205 | ) | | (1,361 | ) |
| Canceled/forfeited/adjusted | | (943 | ) | | 295 |
|
| Shares at December 31, 2017 | | 20,161 |
| | 2,625 |
|
The average fair value of the restricted share units granted was $107.69, $92.45$152.63, $153.67 and $91.65$152.62 in 2017, 2016fiscal years 2023, 2022 and 2015,2021, respectively, using the fair market value at the date of grant. The fair value of restricted share units was discounted for dividends, which are not paid on the restricted share units during the vesting period. The fair value of restricted share units issued was $596.5$605 million, $587.7$591 million and $597.6$611 million in 2017, 20162023, 2022 and 2015,2021, respectively.
The weighted average fair value of the performance share units granted was $114.13, $105.30$145.17, $170.46 and $93.54$179.35 in 2017, 2016fiscal years 2023, 2022 and 2015,2021, calculated using the weighted average fair market value for each of the three component goals at the date of grant.
The fair values for the sales and earnings per share goals of each performance share unit were estimated on the date of grant using the fair market value of the shares at the time of the award discounted for dividends, which are not paid on the performance share units during the vesting period. The fair value for the relative total shareholder return goal of each performance share unit was estimated on the date of grant using the Monte Carlo valuation model. The fair value of performance share units issued was $132.5$140 million, $127.7$94 million and $16.7$83 million in 2017, 2016fiscal years 2023, 2022 and 2015,2021, respectively.
| |
18. | Segments of Business and Geographic Areas |
17. Segments of business and geographic areas
Following the separation of the Consumer Health business in the fiscal third quarter of 2023, the Company is now organized into two business segments: Innovative Medicine (formerly referred to as Pharmaceutical) and MedTech. The segment results have been recast for all periods to reflect the continuing operations of the Company.
| | | | | | | | | | | | | | | | | | | | | | | | | | | | | | | | |
| | | Sales to Customers | | % Change |
| (Dollars in Millions) | | 2023 | | 2022 | | 2021 | | ’23 vs. ’22 | | ’22 vs. ’21 |
| | | | | | | | | | |
INNOVATIVE MEDICINE(1) | | | | | | | | | | |
| Immunology | | | | | | | | | | |
| U.S. | | $11,539 | | 11,036 | | 10,843 | | 4.6 | % | | 1.8 | |
| International | | 6,513 | | 5,899 | | 5,907 | | 10.4 | | | (0.1) | |
| Worldwide | | 18,052 | | 16,935 | | 16,750 | | 6.6 | | | 1.1 | |
REMICADE | | | | | | | | | | |
| U.S. | | 1,143 | | 1,417 | | 2,019 | | (19.3) | | | (29.8) | |
| U.S. Exports | | 147 | | 204 | | 236 | | (28.0) | | | (13.6) | |
| International | | 549 | | 722 | | 935 | | (23.9) | | | (22.8) | |
| Worldwide | | 1,839 | | 2,343 | | 3,190 | | (21.5) | | | (26.6) | |
SIMPONI / SIMPONI ARIA | | | | | | | | | | |
| U.S. | | 1,124 | | 1,166 | | 1,127 | | (3.6) | | | 3.5 | |
| International | | 1,073 | | 1,017 | | 1,148 | | 5.4 | | | (11.4) | |
| Worldwide | | 2,197 | | 2,184 | | 2,276 | | 0.6 | | | (4.0) | |
STELARA | | | | | | | | | | |
| U.S. | | 6,966 | | 6,388 | | 5,938 | | 9.0 | | | 7.6 | |
| International | | 3,892 | | 3,335 | | 3,196 | | 16.7 | | | 4.4 | |
| Worldwide | | 10,858 | | 9,723 | | 9,134 | | 11.7 | | | 6.5 | |
TREMFYA | | | | | | | | | | |
| U.S. | | 2,147 | | 1,844 | | 1,503 | | 16.5 | | | 22.7 | |
| International | | 999 | | 824 | | 624 | | 21.2 | | | 32.0 | |
| Worldwide | | 3,147 | | 2,668 | | 2,127 | | 17.9 | | | 25.4 | |
OTHER IMMUNOLOGY | | | | | | | | | | |
| U.S. | | 11 | | 17 | | 21 | | (33.8) | | | (18.4) | |
| International | | 0 | | 0 | | 3 | | — | | | * |
| Worldwide | | 11 | | 17 | | 24 | | (33.8) | | | (28.2) | |
| | | | | | | | | | |
| Infectious Diseases | | | | | | | | | | |
| U.S. | | 1,500 | | 1,680 | | 2,249 | | (10.7) | | | (25.3) | |
| International | | 2,918 | | 3,769 | | 3,576 | | (22.6) | | | 5.4 | |
| Worldwide | | 4,418 | | 5,449 | | 5,825 | | (18.9) | | | (6.5) | |
COVID-19 VACCINE | | | | | | | | | | |
| U.S. | | 0 | | 120 | | 634 | | * | | (81.1) | |
| International | | 1,117 | | 2,059 | | 1,751 | | (45.8) | | | 17.6 | |
| Worldwide | | 1,117 | | 2,179 | | 2,385 | | (48.8) | | | (8.6) | |
| | | | | | | | | | |
|
| | | | | | | | | | |
| | | Sales to Customers |
| (Dollars in Millions) | | 2017 | | 2016 | | 2015 |
| Consumer — | | | | | | |
| United States | | $ | 5,565 |
| | 5,420 |
| | 5,222 |
|
| International | | 8,037 |
| | 7,887 |
| | 8,285 |
|
| Total | | 13,602 |
| | 13,307 |
| | 13,507 |
|
| Pharmaceutical — | | | | | | |
| United States | | 21,474 |
| | 20,125 |
| | 18,333 |
|
| International | | 14,782 |
| | 13,339 |
| | 13,097 |
|
| Total | | 36,256 |
| | 33,464 |
| | 31,430 |
|
| Medical Devices — | | | | | | |
| United States | | 12,824 |
| | 12,266 |
| | 12,132 |
|
| International | | 13,768 |
| | 12,853 |
| | 13,005 |
|
| Total | | 26,592 |
| | 25,119 |
| | 25,137 |
|
| Worldwide total | | $ | 76,450 |
| | 71,890 |
| | 70,074 |
|
| | | | | | | | | | | | | | | | | | | | | | | | | | | | | | | | |
| | | Sales to Customers | | % Change |
| (Dollars in Millions) | | 2023 | | 2022 | | 2021 | | ’23 vs. ’22 | | ’22 vs. ’21 |
EDURANT / rilpivirine | | | | | | | | | | |
| U.S. | | 35 | | 36 | | 41 | | (3.7) | | | (10.8) | |
| International | | 1,115 | | 972 | | 953 | | 14.8 | | | 2.0 | |
| Worldwide | | 1,150 | | 1,008 | | 994 | | 14.1 | | | 1.5 | |
PREZISTA / PREZCOBIX / REZOLSTA / SYMTUZA | | | | | | | | | | |
| U.S. | | 1,446 | | 1,494 | | 1,508 | | (3.2) | | | (1.0) | |
| International | | 408 | | 449 | | 575 | | (9.2) | | | (21.9) | |
| Worldwide | | 1,854 | | 1,943 | | 2,083 | | (4.6) | | | (6.7) | |
OTHER INFECTIOUS DISEASES | | | | | | | | | | |
| U.S. | | 19 | | 30 | | 66 | | (34.5) | | | (55.5) | |
| International | | 278 | | 289 | | 297 | | (3.8) | | | (2.6) | |
| Worldwide | | 297 | | 318 | | 363 | | (6.7) | | | (12.3) | |
| | | | | | | | | | |
| Neuroscience | | | | | | | | | | |
| U.S. | | 4,065 | | 3,570 | | 3,347 | | 13.9 | | | 6.7 | |
| International | | 3,076 | | 3,323 | | 3,641 | | (7.5) | | | (8.7) | |
| Worldwide | | 7,140 | | 6,893 | | 6,988 | | 3.6 | | | (1.4) | |
CONCERTA / methylphenidate | | | | | | | | | | |
| U.S. | | 230 | | 151 | | 172 | | 52.5 | | | (12.5) | |
| International | | 554 | | 493 | | 495 | | 12.2 | | | (0.4) | |
| Worldwide | | 783 | | 644 | | 667 | | 21.6 | | | (3.5) | |
INVEGA SUSTENNA / XEPLION / INVEGA TRINZA / TREVICTA | | | | | | | | | | |
| U.S. | | 2,897 | | 2,714 | | 2,550 | | 6.7 | | | 6.5 | |
| International | | 1,218 | | 1,426 | | 1,472 | | (14.6) | | | (3.1) | |
| Worldwide | | 4,115 | | 4,140 | | 4,022 | | (0.6) | | | 3.0 | |
SPRAVATO | | | | | | | | | | |
| U.S. | | 589 | | 328 | | 198 | | 79.7 | | | 65.7 | |
| International | | 100 | | 46 | | 26 | | * | | 76.9 | |
| Worldwide | | 689 | | 374 | | 224 | | 84.1 | | | 67.0 | |
OTHER NEUROSCIENCE(2) | | | | | | | | | | |
| U.S. | | 349 | | 376 | | 427 | | (7.3) | | | (11.9) | |
| International | | 1,204 | | 1,358 | | 1,647 | | (11.3) | | | (17.5) | |
| Worldwide | | 1,553 | | 1,734 | | 2,074 | | (10.4) | | | (16.4) | |
| | | | | | | | | | |
| Oncology | | | | | | | | | | |
| U.S. | | 8,462 | | 6,930 | | 5,958 | | 22.1 | | | 16.3 | |
| International | | 9,199 | | 9,052 | | 8,590 | | 1.6 | | | 5.4 | |
| Worldwide | | 17,661 | | 15,983 | | 14,548 | | 10.5 | | | 9.9 | |
| | | | | | | | | | |
|
| | | | | | | | | | | | | | | | | |
| | | Income Before Tax | | Identifiable Assets |
| (Dollars in Millions) | | 2017 (3) | | 2016 (4) | | 2015 (5) | | 2017 | | 2016 |
| Consumer | | $ | 2,524 |
| | 2,441 |
| | 1,787 |
| | $ | 25,030 |
| | 23,971 |
|
| Pharmaceutical | | 11,083 |
| | 12,827 |
| | 11,734 |
| | 59,450 |
| | 27,477 |
|
| Medical Devices | | 5,392 |
| | 5,578 |
| | 6,826 |
| | 45,413 |
| | 39,773 |
|
| Total | | 18,999 |
| | 20,846 |
| | 20,347 |
| | 129,893 |
| | 91,221 |
|
Less: Expense not allocated to segments (1) | | 1,326 |
| | 1,043 |
| | 1,151 |
| | | | |
General corporate (2) | | | | | | | | 27,410 |
| | 49,987 |
|
| Worldwide total | | $ | 17,673 |
| | 19,803 |
| | 19,196 |
| | $ | 157,303 |
| | 141,208 |
|
| | | | | | | | | | | | | | | | | | | | | | | | | | | | | | | | |
| | | Sales to Customers | | % Change |
| (Dollars in Millions) | | 2023 | | 2022 | | 2021 | | ’23 vs. ’22 | | ’22 vs. ’21 |
| | | | | | | | | | |
CARVYKTI | | | | | | | | | | |
| U.S. | | 469 | | 133 | | — | | * | | * |
| International | | 30 | | — | | — | | * | | * |
| Worldwide | | 500 | | 133 | | — | | * | | * |
DARZALEX | | | | | | | | | | |
| U.S. | | 5,277 | | 4,210 | | 3,169 | | 25.4 | | | 32.8 | |
| International | | 4,467 | | 3,767 | | 2,854 | | 18.6 | | | 32.0 | |
| Worldwide | | 9,744 | | 7,977 | | 6,023 | | 22.2 | | | 32.4 | |
ERLEADA | | | | | | | | | | |
| U.S. | | 1,065 | | 968 | | 813 | | 10.0 | | | 19.2 | |
| International | | 1,322 | | 913 | | 478 | | 44.8 | | | * |
| Worldwide | | 2,387 | | 1,881 | | 1,291 | | 26.9 | | | 45.7 | |
IMBRUVICA | | | | | | | | | | |
| U.S. | | 1,051 | | 1,390 | | 1,747 | | (24.4) | | | (20.4) | |
| International | | 2,214 | | 2,394 | | 2,622 | | (7.5) | | | (8.7) | |
| Worldwide | | 3,264 | | 3,784 | | 4,369 | | (13.7) | | | (13.4) | |
| | | | | | | | | | |
| | | | | | | | | | |
| | | | | | | | | | |
| | | | | | | | | | |
ZYTIGA /abiraterone acetate | | | | | | | | | | |
| U.S. | | 50 | | 74 | | 119 | | (32.1) | | | (37.8) | |
| International | | 837 | | 1,696 | | 2,178 | | (50.7) | | | (22.1) | |
| Worldwide | | 887 | | 1,770 | | 2,297 | | (49.9) | | | (22.9) | |
OTHER ONCOLOGY | | | | | | | | | | |
| U.S. | | 549 | | 156 | | 110 | | * | | 41.8 | |
| International | | 330 | | 283 | | 458 | | 16.9 | | | (38.2) | |
| Worldwide | | 879 | | 438 | | 568 | | * | | (22.9) | |
| | | | | | | | | | |
| Pulmonary Hypertension | | | | | | | | | | |
| U.S. | | 2,697 | | 2,346 | | 2,365 | | 15.0 | | | (0.8) | |
| International | | 1,117 | | 1,071 | | 1,085 | | 4.3 | | | (1.3) | |
| Worldwide | | 3,815 | | 3,417 | | 3,450 | | 11.6 | | | (1.0) | |
OPSUMIT | | | | | | | | | | |
| U.S. | | 1,292 | | 1,132 | | 1,147 | | 14.1 | | | (1.3) | |
| International | | 681 | | 651 | | 672 | | 4.6 | | | (3.2) | |
| Worldwide | | 1,973 | | 1,783 | | 1,819 | | 10.6 | | | (2.0) | |
UPTRAVI | | | | | | | | | | |
| U.S. | | 1,326 | | 1,104 | | 1,056 | | 20.1 | | | 4.5 | |
| International | | 255 | | 218 | | 181 | | 17.3 | | | 20.4 | |
| Worldwide | | 1,582 | | 1,322 | | 1,237 | | 19.7 | | | 6.9 | |
OTHER PULMONARY HYPERTENSION | | | | | | | | | | |
| U.S. | | 79 | | 110 | | 163 | | (28.6) | | | (32.3) | |
| International | | 182 | | 202 | | 232 | | (10.3) | | | (12.8) | |
| Worldwide | | 260 | | 313 | | 395 | | (16.7) | | | (20.8) | |
| | | | | | | | | | |
|
| | | | | | | | | | | | | | | | | | | | |
| | | Additions to Property, Plant & Equipment | | Depreciation and Amortization |
| (Dollars in Millions) | | 2017 | | 2016 | | 2015 | | 2017 | | 2016 | | 2015 |
| Consumer | | $ | 485 |
| | 486 |
| | 544 |
| | $ | 674 |
| | 608 |
| | 559 |
|
| Pharmaceutical | | 936 |
| | 927 |
| | 1,063 |
| | 2,416 |
| | 886 |
| | 929 |
|
| Medical Devices | | 1,566 |
| | 1,472 |
| | 1,631 |
| | 2,216 |
| | 1,928 |
| | 1,945 |
|
| Segments total | | 2,987 |
| | 2,885 |
| | 3,238 |
| | 5,306 |
| | 3,422 |
| | 3,433 |
|
| General corporate | | 292 |
| | 341 |
| | 225 |
| | 336 |
| | 332 |
| | 313 |
|
| Worldwide total | | $ | 3,279 |
| | 3,226 |
| | 3,463 |
| | $ | 5,642 |
| | 3,754 |
| | 3,746 |
|
| | | | | | | | | | | | | | | | | | | | | | | | | | | | | | | | |
| | | Sales to Customers | | % Change |
| (Dollars in Millions) | | 2023 | | 2022 | | 2021 | | ’23 vs. ’22 | | ’22 vs. ’21 |
| Cardiovascular / Metabolism / Other | | | | | | | | | | |
| U.S. | | 2,906 | | 3,042 | | 3,192 | | (4.5) | | | (4.7) | |
| International | | 765 | | 845 | | 927 | | (9.4) | | | (8.9) | |
| Worldwide | | 3,671 | | 3,887 | | 4,119 | | (5.5) | | | (5.6) | |
XARELTO | | | | | | | | | | |
| U.S. | | 2,365 | | 2,473 | | 2,438 | | (4.4) | | | 1.4 | |
| International | | — | | — | | — | | — | | | — | |
| Worldwide | | 2,365 | | 2,473 | | 2,438 | | (4.4) | | | 1.4 | |
| | | | | | | | | | |
| | | | | | | | | | |
| | | | | | | | | | |
| | | | | | | | | | |
OTHER(3) | | | | | | | | | | |
| U.S. | | 541 | | 569 | | 754 | | (5.0) | | | (24.5) | |
| International | | 765 | | 845 | | 927 | | (9.4) | | | (8.8) | |
| Worldwide | | 1,306 | | 1,414 | | 1,682 | | (7.6) | | | (15.9) | |
| | | | | | | | | | |
| TOTAL INNOVATIVE MEDICINE | | | | | | | | | | |
| U.S. | | 31,169 | | 28,604 | | 27,954 | | 9.0 | | | 2.3 | |
| International | | 23,590 | | 23,959 | | 23,726 | | (1.5) | | | 1.0 | |
| Worldwide | | 54,759 | | 52,563 | | 51,680 | | 4.2 | | | 1.7 | |
| | | | | | | | | | |
| MEDTECH | | | | | | | | | | |
| | | | | | | | | | |
| | | | | | | | | | |
| | | | | | | | | | |
| | | | | | | | | | |
| | | | | | | | | | |
| | | | | | | | | | |
| | | | | | | | | | |
| | | | | | | | | | |
| Interventional Solutions | | | | | | | | | | |
| U.S. | | 3,633 | | 2,169 | | 1,836 | | 67.5 | | | 18.2 | |
| International | | 2,717 | | 2,131 | | 2,135 | | 27.5 | | | (0.2) | |
| Worldwide | | 6,350 | | 4,300 | | 3,971 | | 47.7 | | | 8.3 | |
ELECTROPHYSIOLOGY | | | | | | | | | | |
| U.S. | | 2,458 | | 2,036 | | 1,730 | | 20.7 | | | 17.7 | |
| International | | 2,230 | | 1,901 | | 1,893 | | 17.3 | | | 0.4 | |
| Worldwide | | 4,688 | | 3,937 | | 3,623 | | 19.1 | | | 8.7 | |
ABIOMED(4) | | | | | | | | | | |
| U.S. | | 1,066 | | 31 | | — | | * | | * |
| International | | 240 | | — | | — | | * | | * |
| Worldwide | | 1,306 | | 31 | | — | | * | | * |
OTHER INTERVENTIONAL SOLUTIONS | | | | | | | | | | |
| U.S. | | 109 | | 102 | | 106 | | 6.7 | | | (3.8) | |
| International | | 247 | | 230 | | 242 | | 7.3 | | | (5.0) | |
| Worldwide | | 356 | | 332 | | 348 | | 7.1 | | | (4.6) | |
| Orthopaedics | | | | | | | | | | |
| U.S. | | 5,525 | | 5,321 | | 5,126 | | 3.8 | | | 3.8 | |
| International | | 3,417 | | 3,267 | | 3,462 | | 4.6 | | | (5.6) | |
| Worldwide | | 8,942 | | 8,587 | | 8,588 | | 4.1 | | | 0.0 | |
HIPS | | | | | | | | | | |
| U.S. | | 996 | | 943 | | 878 | | 5.6 | | | 7.3 | |
| International | | 564 | | 571 | | 602 | | (1.2) | | | (5.1) | |
| Worldwide | | 1,560 | | 1,514 | | 1,480 | | 3.0 | | | 2.3 | |
| | | | | | | | | | |
|
| | | | | | | | | | | | | | | | | |
| | | Sales to Customers | | Long-Lived Assets (6) |
| (Dollars in Millions) | | 2017 | | 2016 | | 2015 | | 2017 | | 2016 |
| United States | | $ | 39,863 |
| | 37,811 |
| | 35,687 |
| | $ | 38,556 |
| | 36,934 |
|
| Europe | | 17,126 |
| | 15,770 |
| | 15,995 |
| | 56,677 |
| | 21,996 |
|
| Western Hemisphere excluding U.S. | | 6,041 |
| | 5,734 |
| | 6,045 |
| | 2,990 |
| | 2,961 |
|
| Asia-Pacific, Africa | | 13,420 |
| | 12,575 |
| | 12,347 |
| | 2,773 |
| | 2,512 |
|
| Segments total | | 76,450 |
| | 71,890 |
| | 70,074 |
| | 100,996 |
| | 64,403 |
|
| General corporate | | | | | | | | 1,143 |
| | 1,190 |
|
| Other non long-lived assets | | | | | | | | 55,164 |
| | 75,615 |
|
| Worldwide total | | $ | 76,450 |
| | 71,890 |
| | 70,074 |
| | $ | 157,303 |
| | 141,208 |
|
| | | | | | | | | | | | | | | | | | | | | | | | | | | | | | | | |
| | | Sales to Customers | | % Change |
| (Dollars in Millions) | | 2023 | | 2022 | | 2021 | | ’23 vs. ’22 | | ’22 vs. ’21 |
KNEES | | | | | | | | | | |
| U.S. | | 896 | | 851 | | 787 | | 5.3 | | | 8.2 | |
| International | | 559 | | 508 | | 538 | | 10.2 | | | (5.7) | |
| Worldwide | | 1,456 | | 1,359 | | 1,325 | | 7.1 | | | 2.6 | |
TRAUMA | | | | | | | | | | |
| U.S. | | 1,949 | | 1,882 | | 1,819 | | 3.6 | | | 3.5 | |
| International | | 1,030 | | 989 | | 1,066 | | 4.1 | | | (7.2) | |
| Worldwide | | 2,979 | | 2,871 | | 2,885 | | 3.8 | | | (0.5) | |
SPINE, SPORTS & OTHER | | | | | | | | | | |
| U.S. | | 1,684 | | 1,645 | | 1,642 | | 2.4 | | | 0.2 | |
| International | | 1,263 | | 1,198 | | 1,256 | | 5.4 | | | (4.6) | |
| Worldwide | | 2,947 | | 2,843 | | 2,898 | | 3.7 | | | (1.9) | |
| Surgery | | | | | | | | | | |
| U.S. | | 4,031 | | 3,897 | | 3,867 | | 3.4 | | | 0.8 | |
| International | | 6,006 | | 5,793 | | 5,945 | | 3.7 | | | (2.6) | |
| Worldwide | | 10,037 | | 9,690 | | 9,812 | | 3.6 | | | (1.2) | |
ADVANCED | | | | | | | | | | |
| U.S. | | 1,833 | | 1,784 | | 1,761 | | 2.8 | | | 1.3 | |
| International | | 2,837 | | 2,785 | | 2,861 | | 1.9 | | | (2.6) | |
| Worldwide | | 4,671 | | 4,569 | | 4,622 | | 2.2 | | | (1.1) | |
GENERAL | | | | | | | | | | |
| U.S. | | 2,198 | | 2,113 | | 2,105 | | 4.0 | | | 0.4 | |
| International | | 3,168 | | 3,008 | | 3,085 | | 5.3 | | | (2.5) | |
| Worldwide | | 5,366 | | 5,121 | | 5,190 | | 4.8 | | | (1.3) | |
| Vision | | | | | | | | | | |
| U.S. | | 2,086 | | 1,990 | | 1,857 | | 4.8 | | | 7.2 | |
| International | | 2,986 | | 2,859 | | 2,831 | | 4.5 | | | 1.0 | |
| Worldwide | | 5,072 | | 4,849 | | 4,688 | | 4.6 | | | 3.4 | |
CONTACT LENSES / OTHER | | | | | | | | | | |
| U.S. | | 1,626 | | 1,522 | | 1,398 | | 6.8 | | | 8.9 | |
| International | | 2,076 | | 2,022 | | 2,043 | | 2.7 | | | (1.0) | |
| Worldwide | | 3,702 | | 3,543 | | 3,440 | | 4.5 | | | 3.0 | |
SURGICAL | | | | | | | | | | |
| U.S. | | 460 | | 468 | | 459 | | (1.8) | | | 2.0 | |
| International | | 910 | | 837 | | 788 | | 8.6 | | | 6.2 | |
| Worldwide | | 1,370 | | 1,306 | | 1,248 | | 4.9 | | | 4.6 | |
| TOTAL MEDTECH | | | | | | | | | | |
| U.S. | | 15,275 | | 13,377 | | 12,686 | | 14.2 | | | 5.4 | |
| International | | 15,125 | | 14,050 | | 14,374 | | 7.7 | | | (2.3) | |
| Worldwide | | 30,400 | | 27,427 | | 27,060 | | 10.8 | | | 1.4 | |
| | | | | | | | | | |
| | | | | | | | | | | | | | | | | | | | | | | | | | | | | | | | |
| | | Sales to Customers | | % Change |
| (Dollars in Millions) | | 2023 | | 2022 | | 2021 | | ’23 vs. ’22 | | ’22 vs. ’21 |
| WORLDWIDE | | | | | | | | | | |
| | | | | | | | | | |
| U.S. | | 46,444 | | 41,981 | | 40,640 | | 10.6 | | | 3.3 | |
| International | | 38,715 | | 38,009 | | 38,100 | | 1.9 | | | (0.2) | |
| Worldwide | | $85,159 | | 79,990 | | 78,740 | | 6.5 | % | | 1.6 | |
*Percentage greater than 100% or not meaningful
(1)Previously referred to as Pharmaceutical
(2)Inclusive of RISPERDAL CONSTA which was previously disclosed separately
(3) Inclusive of INVOKANA which was previously disclosed separately
(4) Acquired on December 22, 2022
| | | | | | | | | | | | | | | | | | | | | | | | | | | | | | | | |
| | | Income Before Tax | | Identifiable Assets |
| (Dollars in Millions) | | 2023 (3) | | 2022 (4) | | 2021 (5) | | 2023 | | 2022 |
| Innovative Medicine | | $18,246 | | 15,647 | | 17,750 | | $58,324 | | 58,436 |
| MedTech | | 4,669 | | 4,447 | | 4,208 | | 74,710 | | 70,956 |
| Total | | 22,915 | | 20,094 | | 21,958 | | 133,034 | | 129,392 |
Less: Expense not allocated to segments (1) | | 7,853 | | 735 | | 2,780 | | | | |
| Discontinued operations | | | | | | | | — | | 27,237 |
General corporate (2) | | | | | | | | 34,524 | | 30,749 |
| Worldwide total | | $15,062 | | 19,359 | | 19,178 | | $167,558 | | 187,378 |
| | | | | | | | | | | | | | | | | | | | | | | | | | | | | | | | | | | | | | |
| | Additions to Property,
Plant & Equipment | | Depreciation and
Amortization |
| (Dollars in Millions) | | 2023 | | 2022 | | 2021 | | 2023 | | 2022 | | 2021 |
| Innovative Medicine | | $1,653 | | 1,374 | | 1,198 | | $3,847 | | 3,687 | | 4,029 |
| MedTech | | 2,372 | | 2,120 | | 1,933 | | 2,943 | | 2,302 | | 2,286 |
| Segments total | | 4,025 | | 3,494 | | 3,131 | | 6,790 | | 5,989 | | 6,315 |
| Discontinued operations | | 162 | | 303 | | 314 | | 383 | | 641 | | 739 |
| General corporate | | 356 | | 212 | | 207 | | 313 | | 340 | | 336 |
| Worldwide total | | $4,543 | | 4,009 | | 3,652 | | $7,486 | | 6,970 | | 7,390 |
| | | | | | | | | | | | | | | | | | | | | | | | | | | | | | | | |
| | | Sales to Customers | | Long-Lived Assets (6) |
| (Dollars in Millions) | | 2023 | | 2022 | | 2021 | | 2023 | | 2022 |
| United States | | $46,444 | | 41,981 | | 40,640 | | $54,832 | | 58,750 |
| Europe | | 20,410 | | 20,664 | | 20,595 | | 31,616 | | 29,878 |
| Western Hemisphere excluding U.S. | | 4,549 | | 4,108 | | 3,927 | | 1,491 | | 1,289 |
| Asia-Pacific, Africa | | 13,756 | | 13,237 | | 13,578 | | 1,500 | | 1,520 |
| Segments total | | 85,159 | | 79,990 | | 78,740 | | 89,439 | | 91,437 |
| Discontinued operations | | | | | | | | — | | 27,237 |
| General corporate | | | | | | | | 1,192 | | 1,081 |
| Other non long-lived assets | | | | | | | | 76,927 | | 67,623 |
| Worldwide total | | $85,159 | | 79,990 | | 78,740 | | $167,558 | | 187,378 |
See Note 1 for a description of the segments in which the Company operates.
Export sales are not significant. In 2017,fiscal year 2023, the Company utilized three wholesalers distributing products for both segments that represented approximately 18.2%, 15.1% and 14.2% of the total consolidated revenues. In fiscal year 2022, the Company had twothree wholesalers distributing products for both segments that represented approximately 18.9%, 15.0% and 13.8% of the total consolidated revenues. In fiscal year 2021, the Company had three wholesalers distributing products for all three segments that represented approximately 14.0%16.6%, 12.6%, and 10.0%12.6% of the total consolidated revenues. In 2016,
(1)Amounts not allocated to segments include interest (income)/expense and general corporate (income)/expense. Fiscal 2023 includes an approximately $7 billion charge related to talc matters (See Note 19, Legal proceedings, for additional details) and $0.4 billion related to the unfavorable change in the fair value of the retained stake in Kenvue.
(2)General corporate includes cash, cash equivalents and marketable securities.
(3)Innovative Medicine includes:
•One-time COVID-19 Vaccine manufacturing exit related costs of $0.7 billion
•A restructuring related charge of $0.5 billion
•Unfavorable changes in the fair value of securities of $0.4 billion
•Favorable litigation related items of $0.1 billion
•Loss on divestiture $0.2 billion.
•An intangible asset impairment charge of approximately $0.2 billion related to market dynamics associated with a non-strategic asset (M710) acquired as part of the acquisition of Momenta Pharmaceuticals in 2020.
MedTech includes:
•Acquired in process research and development asset of $0.4 billion related to the Laminar acquisition in 2023
•A restructuring related charge of $0.3 billion
•Acquisition and integration related costs of $0.2 billion primarily related to the acquisition of Abiomed
•A Medical Device Regulation charge of $0.3 billion
•Income from litigation settlements of $0.1 billion
(4)Innovative Medicine includes:
•One-time COVID-19 Vaccine manufacturing exit related costs of $1.5 billion
•An intangible asset impairment charge of approximately $0.8 billion related to an in-process research and development asset, bermekimab (JnJ-77474462), an investigational drug for the treatment of Atopic Dermatitis (AD) and Hidradenitis Suppurativa (HS) acquired with the acquisition of XBiotech, Inc. in the fiscal year 2020. Additional information regarding efficacy of the AD and HS indications became available which led the Company had two wholesalers distributing productsto the decision to terminate the development of bermekimab for all three segments that representedAD and HS
•Litigation expense of $0.1 billion
•Unfavorable changes in the fair value of securities of $0.7 billion
•A restructuring related charge of $0.1 billion
MedTech includes:
•Litigation expense of $0.6 billion primarily for pelvic mesh related costs
•A restructuring related charge of $0.3 billion
•Acquisition and integration related costs of $0.3 billion primarily related to the acquisition of Abiomed
•A Medical Device Regulation charge of $0.3 billion
(5)Innovative Medicine includes:
•Litigation expense of $0.6 billion, primarily related to Risperdal Gynecomastia
•Divestiture gains of $0.6 billion
•Gains of $0.5 billion related to the change in the fair value of securities
•A restructuring related charge of $0.1 billion
MedTech includes:
•An in-process research and development expense of $0.9 billion related to Ottava
•A restructuring related charge of $0.3 billion
•A Medical Device Regulation charge of $0.2 billion
•Litigation expense of $0.1 billion
(6)Long-lived assets include property, plant and equipment, net for fiscal years 2023, and 2022 of $19,898 and $17,982, respectively, and intangible assets and goodwill, net for fiscal years 2023 and 2022 of $70,733 and $74,536, respectively.
18. Acquisitions and divestitures
In the fiscal first quarter of 2024, the Company announced it has entered into a definitive agreement to acquire Ambrx Biopharma, Inc., or Ambrx (Nasdaq: AMAM), a clinical-stage biopharmaceutical company with a proprietary synthetic biology technology platform to design and develop next-generation antibody drug conjugates (ADCs), in an all-cash merger transaction for a total equity value of approximately 13.5% and 10.7%$2.0 billion, or $1.9 billion net of estimated cash acquired. The Company will acquire all of the total consolidated revenues. In 2015,outstanding shares of Ambrx’s common stock for $28.00 per share through a merger of Ambrx with a subsidiary of the Company. The closing of the transaction is expected to occur in the first half of 2024, subject to receipt of Ambrx shareholder approval, as well as clearance under the Hart-Scott-Rodino Antitrust Improvements Act and other customary closing conditions. The Company expects that the transaction will be accounted for as a business combination and the results of operations will be included in the Innovative Medicine segment as of the acquisition date.
During the fiscal year 2023, the Company had one wholesaler distributing products for all three segmentsdid not make any acquisitions that representedqualified as a business combination.
During the fiscal year 2023, there were asset acquisitions of in-process research and development of approximately 12.5%$0.5 billion in cash, primarily consisting of the total consolidated revenues.
| |
(1)
| Amounts not allocated to segments include interest (income) expense and general corporate (income) expense. |
| |
(2)
| General corporate includes cash, cash equivalents and marketable securities. |
| |
(3)
| The Pharmaceutical segment includes $797 million for Actelion acquisition related costs, an in-process research and development expense of $396 million and net litigation expense of $117 million. The Medical Devices segment includes net litigation expense of $1,139 million, a restructuring related charge of $760 million, an asset impairment of $215 million primarily related to the insulin pump business and $140 million for AMO acquisition related costs. The Medical Devices segment includes a gain of $0.7 billion from the divestiture of Codman Neurosurgery. The Consumer segment includes a gain of $0.5 billion from the divestiture of COMPEED®.
|
| |
(4)
| Includes net litigation expense of $806 million and a restructuring related charge of $685 million in the Medical Devices segment. The Pharmaceutical segment includes a positive adjustment of $0.5 billion to previous reserve estimates, an in-process research and development expense of $29 million, and gains from the divestitures of the controlled substance raw material and active pharmaceutical ingredient (API) business and certain anesthetic products in Europe. |
| |
(5)
| The Medical Devices segment includes a restructuring related charge of $590 million, an intangible asset write-down of $346 million related to Acclarent, Synthes integration costs of $196 million and $148 million expense for the cost associated with the DePuy ASRTM Hip program. Includes $224 million of in-process research and development expense, comprised of $214 million and $10 million in the Pharmaceutical and Medical Devices segments, respectively. Includes net litigation expense of $141 million comprised of $136 million in the Pharmaceutical segment and $5 million in the Medical Devices segment, which included the gain from the litigation settlement agreement with Guidant for $600 million. The Medical Devices Segment includes a gain of $1.3 billion from the divestiture of the Cordis business. The Pharmaceutical segment includes a gain of $981 million from the U.S. divestiture of NUCYNTA® and a positive adjustment of $0.5 billion to previous reserve estimates, including Managed Medicaid rebates. The Consumer segment includes a gain of $229 million from the divestiture of SPLENDA® brand.
|
| |
(6)
| Long-lived assets include property, plant and equipment, net for 2017, and 2016 of $17,005 and $15,912, respectively, and intangible assets and goodwill, net for 2017 and 2016 of $85,134 and $49,681, respectively. |
acquisition of Laminar Inc. for $0.4 billion which was closed on November 30, 2023. Laminar Inc. is a privately-held medical device company focused on eliminating the left atrial appendage (LAA) in patients with non-valvular atrial fibrillation (AFib).
| |
19. | Selected Quarterly Financial Data (unaudited) |
Selected unaudited quarterly financial data forDuring the years 2017 and 2016 are summarized below:
|
| | | | | | | | | | | | | | | | | | | | | | | | | |
| | | 2017 | | 2016 |
| (Dollars in Millions Except Per Share Data) | | First Quarter (1) | | Second Quarter (2) | | Third Quarter (3) | | Fourth Quarter (4) | | First Quarter (5) | | Second Quarter (6) | | Third Quarter (7) | | Fourth Quarter (8) |
| Segment sales to customers | | |
| | |
| | |
| | |
| | |
| | |
| | |
| | |
|
| Consumer | | $ | 3,228 |
| | 3,478 |
| | 3,356 |
| | 3,540 |
| | 3,195 |
| | 3,419 |
| | 3,261 |
| | 3,432 |
|
| Pharmaceutical | | 8,245 |
| | 8,635 |
| | 9,695 |
| | 9,681 |
| | 8,178 |
| | 8,654 |
| | 8,400 |
| | 8,232 |
|
| Medical Devices | | 6,293 |
| | 6,726 |
| | 6,599 |
| | 6,974 |
| | 6,109 |
| | 6,409 |
| | 6,159 |
| | 6,442 |
|
| Total sales | | 17,766 |
| | 18,839 |
| | 19,650 |
| | 20,195 |
| | 17,482 |
| | 18,482 |
| | 17,820 |
| | 18,106 |
|
| Gross profit | | 12,380 |
| | 13,016 |
| | 12,748 |
| | 12,952 |
| | 12,153 |
| | 13,146 |
| | 12,334 |
| | 12,572 |
|
| Earnings before provision for taxes on income | | 5,575 |
| | 4,748 |
| | 4,790 |
| | 2,560 |
| | 5,294 |
| | 4,904 |
| | 5,281 |
| | 4,324 |
|
| Net earnings (loss) | | 4,422 |
| | 3,827 |
| | 3,764 |
| | (10,713 | ) | | 4,457 |
| | 3,997 |
| | 4,272 |
| | 3,814 |
|
| Basic net earnings (loss) per share | | $ | 1.63 |
| | 1.42 |
| | 1.40 |
| | (3.99 | ) | | 1.62 |
| | 1.46 |
| | 1.56 |
| | 1.41 |
|
| Diluted net earnings (loss) per share | | $ | 1.61 |
| | 1.40 |
| | 1.37 |
| | (3.99 | ) | | 1.59 |
| | 1.43 |
| | 1.53 |
| | 1.38 |
|
| |
(1)
| The first quarter of 2017 includes a restructuring charge of $121 million after-tax ($161 million before-tax) and an AMO acquisition related cost of $251 million after-tax ($38 million before-tax). |
| |
(2)
| The second quarter of 2017 includes a net litigation expense of $352 million after-tax ($493 million before-tax), Actelion acquisition related costs of $199 million after-tax ($213 million before-tax) a restructuring charge of $101 million after-tax ($128 million before-tax) and an asset impairment charge of $125 million after-tax ($182 million before-tax). |
| |
(3)
| The third quarter of 2017 includes a net litigation expense of $97 million after-tax ($118 million before-tax), Actelion acquisition related costs of $255 million after-tax ($367 million before-tax) and a restructuring charge of $136 million after-tax ($187 million before-tax). |
| |
(4)
| The fourth quarter of 2017 includes a net litigation expense of $506 million after-tax ($645 million before-tax), Actelion acquisition related costs of $313 million after-tax ($217 million before-tax), a restructuring charge of $237 million after-tax ($284 million before-tax), an in-process research and development expense of $266 million after-tax ($408 million before-tax) and an after-tax benefit of $116 million related to the insulin pump business. Additionally, the fourth quarter of 2017 includes a provisional charge of $13.6 billion for recently enacted tax legislation. |
| |
(5)
| The first quarter of 2016 includes a restructuring charge of $120 million after-tax ($137 million before-tax) and net litigation expense of $56 million after-tax ($66 million before-tax). |
| |
(6)
| The second quarter of 2016 includes a restructuring charge of $97 million after-tax ($141 million before-tax) and net litigation expense of $493 million after-tax ($600 million before-tax). |
| |
(7)
| The third quarter of 2016 includes a restructuring charge of $76 million after-tax ($109 million before-tax) and net litigation expense of $46 million after-tax ($55 million before-tax). |
| |
(8)
| The fourth quarter of 2016 includes a restructuring charge of $251 million after-tax ($298 million before-tax) and net litigation expense of $80 million after-tax ($96 million before-tax). |
| |
20. | Business Combinations and Divestitures |
Certainfiscal year 2022, certain businesses were acquired for $35,151 million$17.7 billion in cash and $1,786 million$1.1 billion of liabilities assumed during 2017.assumed. These acquisitions were accounted for using the acquisition method and, accordingly, results of operations have been included in the financial statements from their respective dates of acquisition.
The 2017 acquisitions primarily included: Actelion Ltd an established leading franchise of differentiated, innovative products for pulmonary arterial hypertension (PAH); Abbott Medical Optics (AMO), a wholly-owned subsidiary of Abbott Laboratories, which included ophthalmic products related to: cataract surgery, laser refractive surgery and consumer eye health; Neuravi Limited, a privately-held medical device company that develops and markets medical devices for neurointerventional therapy; TearScience Inc., a manufacturer of products dedicated to treating meibomian gland dysfunction; Sightbox, Inc., a privately-held company that developed a subscription vision care service that connects consumers with eye care professionals and a supply of contact lenses; Torax Medical, Inc., a privately-held medical device company that manufactures and markets the LINX™ Reflux Management System for the surgical treatment of gastroesophageal reflux disease and Megadyne Medical Products, Inc., a privately-held medical device company that develops, manufactures and markets electrosurgical tools.
The excess of purchase price over the estimated fair value of tangible assets acquired amounted to $34,379 million and has been assigned to identifiable intangible assets, with any residual recorded to goodwill. Of this amount, approximately $1,139 million has been identified as the value of IPR&D primarily associated with the acquisition of Actelion Ltd. The value of the IPR&D was calculated using cash flow projections discounted for the inherent risk in the projects.
During 2017, the Company completed the acquisition of Actelion Ltd through an all cash tender offer in Switzerland for $280 per share, amounting to $29.6$17.3 billion net of cash acquired. As part of the transaction, immediately prior to the completion of the acquisition, Actelion spun out its drug discovery operations and early-stage clinical development assets into a newly created Swiss biopharmaceutical company, Idorsia Ltd. The shares of Idorsia are listed on the SIX Swiss Exchange (SIX). The Company currently holds 9.9% of the shares of Idorsia and has rights to an additional 22.1% of Idorsia equity through a convertible loan with a principal amount of approximately $0.5 billion. The convertible loan may be converted into Idorsia shares as follows: (i) up to an aggregate shareholding of 16% of Idorsia shares as a result of certain shareholders holding more than 20% of the issued Idorsia shares, and (ii) up to the balance of the remaining amount within 20 business days of the maturity date of the convertible loan, which has a 10 year term, or if Idorsia undergoes a change of control transaction. The investment in Idorsia was recorded as a cost method investment in Other assets in the Company's consolidated Balance Sheet. The Company also exercised the option acquired on ACT-132577, a product within Idorsia being developed for resistant hypertension currently in phase 2 of clinical development. The Company has also entered into an agreement to provide Idorsia with a Swiss franc denominated credit facility of approximately $250 million. As of December 31, 2017, Idorsia has not made any draw-downs under the credit facility. Actelion has entered into a transitional services agreement with Idorsia. Actelion has established a leading franchise of differentiated, innovative products for pulmonary arterial hypertension (PAH) that are highly complementary to the existing portfolio of the Company. The addition of Actelion’s specialty in-market medicines and late-stage products is consistent with the Company's efforts to grow in attractive and complementary therapeutic areas and serve patients with serious illnesses and significant unmet medical need.
The Company is still finalizing the allocation of the purchase price to the individual assets acquired and liabilities assumed. The allocation of the purchase price included in the current period balance sheet is based on the best estimate of management and is preliminary and subject to change. To assist management in the allocation, the Company engaged valuation specialists to prepare appraisals. The Company will finalize the amounts recognized as the information necessary to complete the analysis is obtained. The Company expects to finalize these amounts as soon as possible but no later than one year from the acquisition date.
The following table presents the preliminary amounts recognized for assets acquired and liabilities assumed for Actelion as of the acquisition date as well as the adjustments made up to December 31, 2017:
|
| | | | | |
| (Dollars in Millions) | June 16, 2017 | December 31, 2017 |
| Cash & Cash equivalents | $ | 469 |
| 469 |
|
Inventory(1) | 759 |
| 759 |
|
| Accounts Receivable | 485 |
| 485 |
|
| Other current assets | 93 |
| 93 |
|
| Property, plant and equipment | 104 |
| 104 |
|
| Goodwill | 5,986 |
| 6,161 |
|
| Intangible assets | 25,010 |
| 25,010 |
|
| Deferred Taxes | 3 |
| 99 |
|
| Other non-current assets | 19 |
| 19 |
|
| Total Assets Acquired | 32,928 |
| 33,199 |
|
| | | |
| Current liabilities | 531 |
| 956 |
|
| Deferred Taxes | 1,960 |
| 1,776 |
|
| Other non-current liabilities | 383 |
| 413 |
|
| Total Liabilities Assumed | 2,874 |
| 3,145 |
|
| | | |
| Net Assets Acquired | $ | 30,054 |
| 30,054 |
|
(1) Includes adjustment of $642 million to write-up the acquired inventory to its estimated fair value.
Subsequent to the date of acquisition there was an adjustment of $0.2 billion to the deferred taxes and $0.4 billion to the current liabilities with the offset to goodwill.
The assets acquired are recorded in the Pharmaceutical segment. The acquisition of Actelion resulted in approximately $6.2 billion of goodwill. The goodwill is primarily attributable to synergies expected to arise from the acquisition. The goodwill is not expected to be deductible for tax purposes.
The purchase price allocation to the identifiable intangible assets is as follows:
|
| | | | |
| (Dollars in Millions) | | |
| Intangible assets with definite lives: | | |
| Patents and trademarks | | $ | 24,230 |
|
| Total amortizable intangibles | | 24,230 |
|
| | | |
| In-process research and development | | 780 |
|
| Total intangible assets | | $ | 25,010 |
|
The patents and trademarks acquired are comprised of developed technology with a weighted average life of 9 years and was primarily based on the patent life of the marketed products. The intangible assets with definite lives were assigned asset lives ranging from 4 to 10 years. The in-process research and development intangible assets were valued for technology programs for unapproved products.
The value of the IPR&D was calculated using probability adjusted cash flow projections discounted for the risk inherent in such projects. The discount rate applied was 9%.
The acquisition was accounted for using the acquisition method and, accordingly, the results of operations of Actelion were reported in the Company's financial statements beginning on June 16, 2017, the date of acquisition. For the year ended December 31, 2017 total sales and a net loss for Actelion from the date of acquisition were $1.4 billion and $1.4 billion, respectively.
The following table provides pro forma results of operations for the fiscal year ended December 31, 2017 and January 1, 2017, as if Actelion had been acquired as of January 4, 2016. The pro forma results include the effect of certain purchase accounting adjustments such as the estimated changes in depreciation and amortization expense on the acquired tangible and intangible assets. However, pro forma results do not include any anticipated cost savings or other effects of the planned
integration of Actelion. Accordingly, such amounts are not necessarily indicative of the results if the acquisition had occurred on the dates indicated or which may occur in the future.
|
| | | | |
| | Unaudited Pro forma Consolidated Results |
| (Dollars in Millions Except Per Share Data) | 2017 | 2016 |
| | | |
| Net Sales | 77,681 |
| 74,339 |
|
| Net Earnings | 1,509 |
| 13,916 |
|
| Diluted Net Earnings per Common Share | 0.55 |
| 4.99 |
|
In 2017, the Company recorded Actelion acquisition related costs before tax of approximately $0.8 billion, which was recorded in Other (income)/expense and Cost of products sold.
During 2017, the Company acquired Abbott Medical Optics (AMO), a wholly-owned subsidiary of Abbott Laboratories, for $4.3 billion, net of cash acquired. The acquisition included ophthalmic products related to: cataract surgery, laser refractive surgery and consumer eye health. The net purchase price was primarily recorded as amortizable intangible assets for $2.3 billion and goodwill for $1.7 billion. The weighted average life of total amortizable intangibles, the majority being customer relationships, is approximately 14.4 years. The goodwill is primarily attributable to synergies expected to arise from the business acquisition and is not deductible for tax purposes. The intangible assets and goodwill amounts are based on the final purchase price allocation. The assets acquired were recorded in the Medical Devices segment.
Certain businesses were acquired for $4,509 million in cash and $77 million of liabilities assumed during 2016. These acquisitions were accounted for using the acquisition method and, accordingly, results of operations have been included in the financial statements from their respective dates of acquisition.
The 2016 acquisitions primarily included: Vogue International LLC, a privately-held company focused on the marketing, development and distribution of salon-influenced and nature inspired hair care and other personal products; NeuWave Medical, Inc., a privately-held medical device company that manufactures and markets minimally invasive soft tissue microwave ablation systems; NeoStrata Company, Inc., a global leader in dermocosmetics, and the global rights for the commercialization of RHINOCORT® allergy spray outside the United States.
The excess of purchase price over the estimated fair value of tangible assets acquired amounted to $4,077 million and has been assigned to identifiable intangible assets, with any residual recorded to goodwill.
The fiscal year 2022 acquisitions primarily included Abiomed, Inc. (Abiomed). The remaining acquisitions were not material.
On December 22, 2022, the Company completed the acquisition of Abiomed, a leading, first-to-market provider of cardiovascular medical technology with a first-in-kind portfolio for the treatment of coronary artery disease and heart failure which also has an extensive innovation pipeline of life-saving technologies. The transaction broadens the Company’s position as a growing cardiovascular innovator, advancing the standard of care in heart failure and recovery, one of healthcare’s largest areas of unmet need. The transaction was accounted for as a business combination and the results of operations were included in the MedTech segment as of the date of the acquisition. The acquisition was completed through a tender offer for all outstanding shares. The consideration paid in the acquisition consisted of an upfront payment of $380.00 per share in cash, amounting to $17.1 billion, net of cash acquired, as well as a non-tradeable contingent value right (“CVR”) entitling the holder to receive up to $35.00 per share in cash (which with respect to the CVRs total approximately $1.6 billion in the aggregate) if certain commercial and clinical milestones are achieved. The corresponding enterprise value (without taking into account the CVRs) of approximately $16.5 billion includes cash, cash equivalents and marketable securities acquired.
The milestones of the CVR consist of:
a.$17.50 per share, payable if net sales for Abiomed products exceeds $3.7 billion during Johnson & Johnson’s fiscal second quarter of 2027 through fiscal first quarter of 2028, or if this threshold is not met during this period and is subsequently met during any rolling four quarter period up to the end of Johnson & Johnson’s fiscal first quarter of 2029, $8.75 per share;
b.$7.50 per share payable upon FDA premarket application approval of the use of Impella® products in ST-elevated myocardial infarction (STEMI) patients without cardiogenic shock by January 1, 2028; and
c.$10.00 per share payable upon the first publication of a Class I recommendation for the use of Impella® products in high risk PCI or STEMI with or without cardiogenic shock within four years from their respective clinical endpoint publication dates, but in all cases no later than December 31, 2029.
During the fiscal fourth quarter of 2023, the Company finalized the purchase price allocation. In the fiscal 2023, there were purchase price allocation adjustments netting to approximately $0.2 billion with an offsetting increase to goodwill. The fair value of the acquisition was allocated to assets acquired of $20.1 billion (net of $0.3 billion cash acquired), primarily to goodwill for Vogue International LLC of $3.3$11.1 billion, was primarily recorded as amortizable intangible assets for $2.3$6.6 billion, IPR&D for $1.1 billion, marketable securities of $0.6 billion and
liabilities assumed of $3.0 billion, which includes the fair value of the contingent consideration mentioned above for $0.7 billion and goodwill for $1.1deferred taxes of $2.0 billion. The weighted average life for the $2.3 billion of total amortizable intangibles is approximately 22 years. The trademark asset values were determined to have definite lives ranging from 10 to 22 years, with the majority being 22 years. The goodwill is primarily attributable to synergies expected to arise from the business acquisitioncommercial acceleration and expansion of the portfolio and is not expected to be deductible for tax purposes. The assets acquired werecontingent consideration was recorded in the Consumer segment.
Certain businesses were acquired for $954 million in cashOther Liabilities and $220 million of liabilities assumed during 2015. The assumed liabilities primarily represent theadjusted to fair value through the fiscal year end 2023 on the Consolidated Balance Sheet.
The amortizable intangible assets were primarily comprised of already in-market products of the contingent considerationImpella® platform with an average weighted life of $210 million. These acquisitions14 years. The IPR&D assets were accountedvalued for using the acquisition method and, accordingly, results of operations have been included in the financial statements from their respective dates of acquisition.
The 2015 acquisitions primarily included: XO1 Limited, a privately-held biopharmaceutical company developing an anti-thrombin antibody and Novira Therapeutics, Inc., a privately held clinical-stage biopharmaceutical company developing innovative therapiestechnology programs for curative treatment of chronic hepatitis B virus infection.
The excess of purchase price over the estimated fair value of tangible assets acquired amounted to $1,173 million and has been assigned to identifiable intangible assets, with any residual recorded to goodwill. Of this amount, approximately $839 million has been identified as the value of IPR&D primarily associated with the acquisitions of XO1 Limited and Novira Therapeutics, Inc.unapproved products. The value of the IPR&D was calculated using probability-adjusted cash flow projections discounted for the risk inherent risk in thesuch projects.
The IPR&D related to the acquisition of XO1 Limited of $360 million is associated with a recombinant human antibody developed to mimic the activity of a human antibody which appears to produce an anticoagulated state without predisposition to bleeding. A probability of success factor of 36.0% was usedranged from 52% to reflect inherent clinical and regulatory risk.70%. The discount rate applied was 11.75%9.5%.
The IPR&D related to the acquisition of Novira Therapeutics, Inc. of $396 million is associated with its lead candidate NVR 3-778 which is an investigational small molecule, direct-acting antiviral, for oral administration in patients with HBV that inhibits the HBV core or capsid protein. A probability of success factor of 51.0% was used to reflect inherent clinical and regulatory risk. The discount rate applied was 16.0%. During 2017,In 2023, the Company recorded a charge for the impairmentacquisition related costs before tax of the IPR&D related to the acquisition of Novira Therapeutics, Inc. The impairmentapproximately $0.2 billion, which was the result of the cancellation of product development due to safety concerns.
primarily recorded in Other (income)/expense. In 2012,2022, the Company completed therecorded acquisition related costs before tax of Synthes, Inc. for a purchase price of $20.2approximately $0.3 billion, which was recorded in cash and stock. In connection with the acquisition of Synthes, Inc.Other (income)/expense.
During fiscal year 2021, the Company entered into two accelerated share repurchase (ASR) agreements. In 2013, the Company settled the remaining liabilities under the ASR agreements. While the Company believesdid not make any material acquisitions that the transactions under each ASR agreement andqualified as a series of related internal transactions were consummated in a tax efficient manner in accordance with applicable law, it is possible that the Internal Revenue Service could assert one or more contrary positions to challenge the transactions from a tax perspective. If challenged, an amount up to the total purchase price for the Synthes shares could be treated as subject to applicable U.S. tax at approximately the statutory rate to the Company, plus interest.business combination.
With the exception of the Actelion Ltd acquisition, supplemental pro forma information for 2017, 2016 and 2015 inIn accordance with U.S. GAAP standards related to business combinations, and goodwill and other intangible assets, supplemental pro forma information for fiscal years 2023, 2022 and 2021 is not provided, as the impact of the aforementioned acquisitions did not have a material effect on the Company’s results of operations, cash flows or financial position.operations.
Divestitures
During the fiscal first quarter of 2017,year 2023, the Company announced it is engagingexecuted divestitures resulting in a process to evaluate potential strategic options for the Johnson & Johnson Diabetes Care Companies, specifically LifeScan, Inc., Animas Corporation, and Calibra Medical, Inc. Strategic options may include the formation of operating partnerships, joint venturesapproximately $0.2 billion in proceeds resulting in gains or strategic alliances, a sale of the businesses, or other alternatives either separately or together. During thelosses that were not material. At fiscal second quarter of 2017,year end 2023, the Company recorded an impairment chargeheld assets, primarily intangibles, on its Consolidated Balance Sheet that it expects to divest of $0.2approximately $0.3 billion primarily related to the insulin pump business. Acclarent and Ponvory.
During the fiscal fourth quarter of 2017,year 2022, the Company announced its decision to exitdid not make any material divestitures.
During fiscal year 2021, in separate transactions, the Animas insulin pump business.Company divested two brands outside the U.S. within the Innovative Medicine segment. The Company is continuing to evaluate potential strategic options for LifeScan, Inc. and determine the best opportunity to drive future growth and maximize shareholder value. There were no assets held for sale asrecognized a pre-tax gain recorded in Other (income) expense, net, of December 31, 2017 related to the announcement.
During 2017, the Company divestitures primarily included: the Codman Neurosurgery business, to Integra LifeSciences Holdings Corporation and the divestiture of COMPEED® to HRA Pharma. In 2017, the pre-tax gains on the divestitures were approximately $1.3 billion.
During 2016, the Company divestitures included: the controlled substance raw material and active pharmaceutical ingredient (API) business; certain anesthetic products in Europe; and certain non-strategic Consumer brands. In 2016, the pre-tax gains on the divestitures were approximately $0.6 billion.
During 2015, the Company divestitures included: the Cordis business to Cardinal Health; the SPLENDA® brand to Heartland Food Products Group; and the U.S. license rights to NUCYNTA® (tapentadol), NUCYNTA®ER (tapentadol extended-release tablets), and NUCYNTA® (tapentadol) oral solution. In 2015, the pre-tax gains on the divestitures were approximately $2.6 billion.
19. Legal proceedings
Johnson & Johnson and certain of its subsidiaries are involved in various lawsuits and claims regarding product liability,liability; intellectual property, commercialproperty; commercial; indemnification and other matters; governmental investigations; and other legal proceedings that arise from time to time in the ordinary course of their business.
The Company records accruals for loss contingencies associated with these legal matters when it is probable that a liability
will be incurred, and the amount of the loss can be reasonably estimated. As of December 31, 2017,2023, the Company has determined that the liabilities associated with certain litigation matters are probable and can be reasonably estimated. The Company has accrued for these matters and will continue to monitor each related legal issue and adjust accruals as might be warranted based on new information and further developments in accordance with ASC 450-20-25.450-20-25, Contingencies. For these and other litigation and regulatory matters discussed below for which a loss is probable or reasonably possible, the Company is unable to estimate the possible loss or range of loss beyond the amounts already accrued. Amounts accrued for legal contingencies often result from a complex series of judgments about future events and uncertainties that rely heavily on estimates and assumptions.assumptions including timing of related payments. The ability to make such estimates and judgments can be affected by various factors including, among other things, whether damages sought in the proceedings are unsubstantiated or indeterminate; scientific and legal discovery has not commenced or is not complete; proceedings are in early stages; matters present legal uncertainties; there are significant facts in dispute; procedural or jurisdictional issues; the uncertainty and unpredictability of the number of potential claims; ability to achieve comprehensive multi-party settlements; complexity of related cross-claims and counterclaims; and/or there are numerous parties involved.
To the extent adverse awards, judgments or verdicts have been rendered against the Company, the Company does not record an accrual until a loss is determined to be probable and can be reasonably estimated.
In the Company'sCompany’s opinion, based on its examination of these matters, its experience to date and discussions with counsel, the ultimate outcome of legal proceedings, net of liabilities accrued in the Company'sCompany’s balance sheet, is not expected to have a material adverse effect on the Company'sCompany’s financial position. However, the resolution of, or increase in accruals for, one or more of these matters in any reporting period may have a material adverse effect on the Company'sCompany’s results of operations and cash flows for that period.
Matters concerning talc
A significant number of personal injury claims alleging that talc causes cancer have been asserted against Johnson & Johnson Consumer Inc., its successor LTL Management LLC (now known as LLT Management LLC) and the Company arising out of the use of body powders containing talc, primarily JOHNSON’S Baby Powder.
In talc cases that previously have gone to trial, the Company has obtained a number of defense verdicts, but there also have been verdicts against the Company, many of which have been reversed on appeal. In June 2020, the Missouri Court of Appeals reversed in part and affirmed in part a July 2018 verdict of $4.7 billion in Ingham v. Johnson & Johnson, et al., No. ED 207476 (Mo. App.), reducing the overall award to $2.1 billion. An application for transfer of the case to the Missouri Supreme Court was subsequently denied and in June 2021, a petition for certiorari, seeking a review of the Ingham decision by the United States Supreme Court, was denied. In June 2021, the Company paid the award, which, including interest, totaled approximately $2.5 billion. The facts and circumstances, including the terms of the award, were unique to the Ingham decision and not representative of other claims brought against the Company. The Company continues to believe that it has strong legal grounds to contest the other talc verdicts that it has appealed. Notwithstanding the Company’s confidence in the safety of its talc products, in certain circumstances the Company has settled cases.
In October 2021, Johnson & Johnson Consumer Inc. (Old JJCI) implemented a corporate restructuring (the 2021 Corporate Restructuring). As a result of that restructuring, Old JJCI ceased to exist and three new entities were created: (a) LTL Management LLC, a North Carolina limited liability company (LTL or Debtor); (b) Royalty A&M LLC, a North Carolina limited liability company and a direct subsidiary of LTL (RAM); and (c) the Debtor’s direct parent, Johnson & Johnson Consumer Inc., a New Jersey company (New JJCI). The Debtor received certain of Old JJCI’s assets and became solely responsible for the talc-related liabilities of Old JJCI, including all liabilities related in any way to injury or damage, or alleged injury or damage, sustained or incurred in the purchase or use of, or exposure to, talc, including talc contained in any product, or to the risk of, or responsibility for, any such damage or injury, except for any liabilities for which the exclusive remedy is provided under a workers’ compensation statute or act (the Talc-Related Liabilities).
In October 2021, notwithstanding the Company’s confidence in the safety of its talc products, the Debtor filed a voluntary petition with the United States Bankruptcy Court for the Western District of North Carolina, Charlotte Division, seeking relief under chapter 11 of the Bankruptcy Code (the LTL Bankruptcy Case). All litigation against LTL, Old JJCI, New JJCI, the Company, other of their corporate affiliates, identified retailers, insurance companies, and certain other parties (the Protected Parties) was stayed, although LTL did agree to lift the stay on a small number of appeals where appeal bonds had been filed. The LTL Bankruptcy Case was transferred to the United States Bankruptcy Court for the District of New Jersey. Claimants filed motions to dismiss the LTL Bankruptcy Case and, following a multiple day hearing, the New Jersey Bankruptcy Court denied those motions in March 2022.
The claimants subsequently filed notices of appeal as to the denial of the motions to dismiss the LTL Bankruptcy Case and the extension of the stay to the Protected Parties. On January 30, 2023, the Third Circuit reversed the Bankruptcy Court’s ruling and remanded to the Bankruptcy Court to dismiss the LTL bankruptcy.
LTL filed a petition for rehearing of the Third Circuit’s decision, which was denied in March 2023. LTL subsequently filed a motion in the Third Circuit to stay the mandate directing the New Jersey Bankruptcy Court to dismiss the LTL bankruptcy pending filing and disposition of a petition for writ of certiorari to the United States Supreme Court. The Third Circuit denied the motion to stay the mandate and issued the mandate.
In April 2023, the New Jersey Bankruptcy Court dismissed the LTL Bankruptcy Case, effectively lifting the stay as to all parties and returning the talc litigation to the tort system. LTL re-filed in the United States Bankruptcy Court for the District of New Jersey seeking relief under chapter 11 of the Bankruptcy Code (the LTL 2 Bankruptcy Case). As a result of the new filing, all talc claims against LTL were again automatically stayed pursuant to section 362 of the Bankruptcy Code. Additionally, the New Jersey Bankruptcy Court issued a temporary restraining order staying all litigation as to LTL, Old JJCI, New JJCI, the Company, identified retailers, and certain other parties (the New Protected Parties).
Also in April 2023, the New Jersey Bankruptcy Court issued a decision that granted limited injunctive relief to the Company and the New Protected Parties (the LTL 2 Preliminary Injunction). The LTL 2 Preliminary Injunction remained in force until late August 2023, following the Bankruptcy Court’s extension of the initial LTL 2 Preliminary Injunction in June 2023. Under the LTL 2 Preliminary Injunction, except for in those cases filed in the federal court ovarian cancer multi-district litigation, discovery in all personal injury and wrongful death matters was permitted to proceed.
Furthermore, in April 2023, the Talc Claimants' Committee filed a motion to dismiss the LTL 2 Bankruptcy followed by similar motions from other claimants. Hearings on the motions to dismiss occurred in June 2023. On July 28, 2023, the court dismissed the LTL 2 Bankruptcy case and, the same day, the Company stated its intent to appeal the decision and to continue its efforts to obtain a resolution of the talc claims. In September 2023, the Bankruptcy Court entered an order granting LTL leave to seek a direct appeal to the Third Circuit Court of Appeals. In October 2023, the Third Circuit granted LTL’s petition for a direct appeal. Briefing is ongoing.
Following the dismissal of LTL 2, new lawsuits were filed and cases across the country that had been stayed were reactivated. The majority of the cases are pending in federal court, organized in a multi-district litigation (MDL) in the United States District Court for the District of New Jersey. In the MDL, case-specific discovery is proceeding with an expectation that a trial will occur in early 2025. Separately, discovery and pre-trial activity is underway in various individually filed and set cases around the country, with most activity for such cases centralized in New Jersey and California.
In the original bankruptcy case, the Company agreed to provide funding to LTL for the payment of amounts the New Jersey Bankruptcy Court determines are owed by LTL and the establishment of a $2 billion trust in furtherance of this purpose. The Company established a reserve for approximately $2 billion in connection with the aforementioned trust. During the bankruptcy proceedings LTL had been de-consolidated by the Company. In the LTL 2 Bankruptcy Case, the Company had agreed to contribute an additional amount which, when added to the prior $2 billion, would be a total reserve of approximately $9 billion payable over 25 years (nominal value approximately $12 billion discounted at a rate of 4.41%), to resolve all the current and future talc claims. The approximate $9 billion reserve encompasses actual and contemplated settlements, of which approximately one-third is recorded as a current liability. The recorded amount remains the Company’s best estimate of probable loss after the dismissal.
The parties have not yet reached a resolution of all talc matters and the Company is unable to estimate the possible loss or range of loss beyond the amount accrued.
A class action advancing claims relating to industrial talc was filed against the Company and others in New Jersey state court in May 2022 (the Edley Class Action). The Edley Class Action asserts, among other things, that the Company fraudulently defended past asbestos personal injury lawsuits arising from exposure to industrial talc mined, milled, and manufactured before January 6, 1989 by the Company’s then wholly owned subsidiary, Windsor Minerals, Inc., which is currently a debtor in the Imerys Bankruptcy described hereafter. The Company removed the Edley Class Action to federal court in the District of New Jersey. In October 2022, the Company filed motions to dismiss and to deny certification of a class to pursue the Edley Class Action in the New Jersey District Court. Argument on the motions was heard in November 2023. Thereafter, the Company resolved this matter.
In February 2019, the Company’s talc supplier, Imerys Talc America, Inc. and two of its affiliates, Imerys Talc Vermont, Inc. and Imerys Talc Canada, Inc. (collectively, Imerys) filed a voluntary petition for relief under chapter 11 of the United States Code (the Bankruptcy Code) in the United States Bankruptcy Court for the District of Delaware (Imerys Bankruptcy). The Imerys Bankruptcy relates to Imerys’s potential liability for personal injury from exposure to talcum powder sold by Imerys. In its bankruptcy, Imerys alleges it has claims against the Company for indemnification and rights to joint insurance proceeds. In its bankruptcy, Imerys proposed a chapter 11 plan (the Imerys Plan) that contemplated all talc-related claims against it being channeled to a trust along with its alleged indemnification rights against the Company. Following confirmation and consummation of the plan, the trust would pay talc claims pursuant to proposed trust distribution procedures (the TDP) and then seek indemnification from the Company.
In February 2021, Cyprus Mines Corporation (Cyprus), which had owned certain Imerys talc mines, filed a voluntary petition for relief under chapter 11 of the Bankruptcy Code and filed its Disclosure Statement and Plan (the Cyprus Plan). The Cyprus Plan contemplates a settlement with Imerys and talc claimants where Cyprus would make a monetary contribution to a trust established under the Imerys Plan in exchange for an injunction against talc claims asserted against it and certain affiliated parties.
The Imerys Plan proceeded to solicitation in early 2021. However, the Imerys Plan did not receive the requisite number of votes to be confirmed after the Bankruptcy Court ruled certain votes cast in favor of the Imerys Plan should be disregarded. Imerys subsequently canceled its confirmation hearing.
Imerys, the Imerys Tort Claimants’ Committee, and the Imerys Future Claimants’ Representative, along with Cyprus, the Cyprus Tort Claimants’ Committee, and the Cyprus Future Claimants’ Representative (collectively the Mediation Parties) have been engaged in mediation since shortly after the confirmation hearing was canceled in October 2021. In September 2023, the Bankruptcy Court entered an order extending the term of the mediation among the Mediation Parties through the end of December 2023. The Bankruptcy Court also authorized Imerys and Cyprus to proceed with mediation with certain of their insurers through the end of December 2023.
In September 2023, Imerys and Cyprus filed amended plans of reorganization. The amended plans contemplate a similar construct as the prior Imerys and Cyprus Plans, including all talc claims against Imerys and Cyprus (and certain other protected parties) being channeled to a trust along with Imerys’s and Cyprus’s alleged indemnification rights against the Company. In January 2024, Imerys and Cyprus filed revised TDP. In February 2024, Imerys and Cyprus filed certain motions related to their Disclosure Statement.
In February 2018, a securities class action lawsuit was filed against the Company and certain named officers in the United States District Court for the District of New Jersey, alleging that the Company violated the federal securities laws by failing to disclose alleged asbestos contamination in body powders containing talc, primarily JOHNSON’S Baby Powder, and that purchasers of the Company’s shares suffered losses as a result. In April 2019, the Company moved to dismiss the complaint. In
December 2019, the Court denied, in part, the motion to dismiss. In April 2021, briefing on Plaintiff’s motion for class certification was completed. The case was stayed in May 2022 pursuant to the LTL Bankruptcy Case and was reopened in May 2023. In December 2023, the Court granted Plaintiff’s motion for class certification. In January 2024, Defendants filed a petition with the Third Circuit under Federal Rule of Civil Procedure 23(f) for permission to appeal the Court’s order granting class certification. Fact discovery is proceeding.
A lawsuit was brought against the Company in the Superior Court of California for the County of San Diego alleging violations of California’s Consumer Legal Remedies Act (CLRA) relating to JOHNSON’S Baby Powder. In that lawsuit, the plaintiffs allege that the Company violated the CLRA by failing to provide required Proposition 65 warnings. In July 2019, the Company filed a notice of removal to the United States District Court for the Southern District of California and plaintiffs filed a second amended complaint shortly thereafter. In October 2019, the Company moved to dismiss the second amended complaint for failure to state a claim upon which relief may be granted. In response to those motions, plaintiffs filed a third amended complaint. In December 2019, the Company moved to dismiss the third amended complaint for failure to state a claim upon which relief may be granted. In April 2020, the Court granted the motion to dismiss but granted leave to amend. In May 2020, plaintiffs filed a Fourth Amended Complaint but indicated that they would be filing a motion for leave to file a fifth amended complaint. Plaintiffs filed a Fifth Amended Complaint in August 2020. The Company moved to dismiss the Fifth Amended Complaint for failure to state a claim upon which relief may be granted. In January 2021, the Court issued an Order and opinion ruling in the Company’s favor and granting the motion to dismiss with prejudice. In February 2021, Plaintiffs filed a Notice of Appeal with the Ninth Circuit. Plaintiffs filed their opening brief in July 2021. The company filed its responsive brief in October 2021. After the Notice of Suggestion of Bankruptcy was filed with the Ninth Circuit, a stay was imposed, and the Court held the reply deadline in abeyance. In September 2023, the stay lifted. With briefing complete, the Court is expected to either schedule oral argument or issue its decision at any time.
In June 2014, the Mississippi Attorney General filed a complaint in Chancery Court of The First Judicial District of Hinds County, Mississippi against the Company and Johnson & Johnson Consumer Companies, Inc. (now known as Johnson & Johnson Consumer Inc.) (collectively, JJCI). The complaint alleges that JJCI violated the Mississippi Consumer Protection Act by failing to disclose alleged health risks associated with female consumers’ use of talc contained in JOHNSON’S Baby Powder and JOHNSON’S Shower to Shower (a product divested in 2012) and seeks injunctive and monetary relief. In February 2022, the trial court set the case for trial to begin in February 2023. However, in October 2022, the LTL bankruptcy court issued an order staying the case. In March 2023, the Third Circuit issued the mandate to dismiss the LTL Bankruptcy Case and in April 2023, the New Jersey Bankruptcy Court dismissed the LTL Bankruptcy Case, effectively lifting the stay as to this matter. The State requested a new trial setting. Later in April 2023, the trial court set a new trial date for April 2024. The Company filed summary judgment and Daubert motions. The State filed a limited Daubert motion. The parties agreed to the Court's request for mediation. A pretrial conference is set for February 2024 and trial is scheduled for April 2024. However, the Company is actively engaged in resolution discussions concerning this matter.
In January 2020, the State of New Mexico filed a consumer protection case alleging that the Company deceptively marketed and sold its talcum powder products by making misrepresentations about the safety of the products and the presence of carcinogens, including asbestos. In March 2022, the New Mexico court denied the Company’s motion to compel the State of New Mexico to engage in discovery of state agencies and denied the Company’s request for interlocutory appeal of that decision. The Company then filed a Petition for Writ of Superintending Control and a Request for a Stay to the New Mexico Supreme Court on the issue of the State of New Mexico’s discovery obligations. In April 2022, in view of the efforts to resolve talc-related claims in the LTL Bankruptcy Case, the Company and the State agreed to a 60-day stay of all matters except for the pending writ before the New Mexico Supreme Court, which expired in June 2022. Thereafter, the Company moved to enjoin prosecution of the case in the LTL Bankruptcy Case. In October 2022, the bankruptcy court issued an order staying the case. In December 2022, the State filed an appeal to the Third Circuit concerning the stay order. Separately, in September 2022, the New Mexico Supreme Court granted the Company's request for a stay pending further briefing on the scope of the State of New Mexico’s discovery obligations. In March 2023, the Third Circuit issued the mandate to dismiss the LTL Bankruptcy Case and in April 2023, the New Jersey Bankruptcy Court dismissed the LTL Bankruptcy Case, effectively lifting the stay as to this matter. While the State notified the New Mexico Supreme Court of the lifted stay of litigation in April 2023, the Court has not taken any action since being notified of the lifting of the stay and it remains in effect.
Forty-two states and the District of Columbia (including Mississippi and New Mexico) have commenced a joint investigation into the Company’s marketing of its talcum powder products. At this time, the multi-state group has not asserted any claims against the Company. Five states have issued Civil Investigative Demands seeking documents and other information. The Company has produced documents to Arizona, North Carolina, Texas, and Washington and entered into confidentiality agreements. The Company has not received any follow up requests from those states. In March 2022, each of the forty-two states agreed to mediation of their claims in the LTL Bankruptcy Case. In July 2022, New Mexico and Mississippi indicated they would no longer voluntarily submit to further mediation in the LTL Bankruptcy and would proceed with their respective cases in state court. In March 2023, the mediation was terminated. In January 2024, the Company reached an agreement in principle with the multi-state group of state Attorneys General, subject to ongoing negotiation of non-monetary terms. The unique procedural history and status of the New Mexico and Mississippi matters specifically have been discussed above.
In addition, the Company has received inquiries, subpoenas, and requests to produce documents regarding talc matters and the LTL Bankruptcy Case from various governmental authorities. The Company has produced documents and responded to inquiries, and will continue to cooperate with government inquiries.
Matters concerning opioids
Beginning in 2014 and continuing to the present, the Company and Janssen Pharmaceuticals, Inc. (JPI), along with other pharmaceutical companies, have been named in close to 3,500 lawsuits related to the marketing of opioids, including DURAGESIC, NUCYNTA and NUCYNTA ER. The majority of the cases have been filed by state and local governments. Similar lawsuits have also been filed by private plaintiffs and organizations, including but not limited to the following: individual plaintiffs on behalf of children born with Neonatal Abstinence Syndrome (NAS); hospitals; and health insurers/payors.
To date, the Company and JPI have litigated two of the cases to judgment and have prevailed in both, either at trial or on appeal.
In October 2019, the Company announced a proposed agreement in principle with a negotiating committee of state Attorneys General to settle all remaining government opioid litigation claims nationwide. Under the final national settlement agreement, which was announced in July 2021, the Company agreed to pay up to $5.0 billion to resolve all opioid lawsuits and future opioid claims by states, cities, counties, local school districts and other special districts, and tribal governments, contingent on sufficient participation by eligible government entities, and with credits back for entities that declined or were ineligible to participate. In July 2021, the Company announced that the terms of the agreement to settle the state and subdivision claims had been finalized and approximately 60% of the all-in settlement was paid by the end of fiscal 2023. The expected payment schedule provides that approximately $0.7 billion of payments are to be paid by the end of fiscal 2024. The agreement is not an admission of liability or wrongdoing, and it provides for the release of all opioid-related claims against the Company, JPI, and their affiliates (including the Company’s former subsidiaries Tasmanian Alkaloids Pty, Ltd. and Noramco, Inc.). As of January 2024, the Company and JPI have settled or otherwise resolved the opioid claims advanced by all government entity claimants except the City of Baltimore, a number of school districts and other claimants.
The Company and JPI continue to defend the cases brought by the remaining government entity litigants as well as the cases brought by private litigants, including NAS claimants, hospitals, and health insurers/payors. Counting the private litigant cases, there are approximately 35 remaining opioid cases against the Company and JPI in various state courts, 430 remaining cases in the Ohio MDL, and 4 additional cases in other federal courts. Some of these cases have been dismissed and are being appealed by the plaintiffs and certain others are scheduled for trial in 2024 or 2025.
In addition, the Province of British Columbia filed suit against the Company and its Canadian affiliate Janssen Inc., and many other industry members, in Canada, and is seeking to have that action certified as an opt in class action on behalf of other provincial/territorial and the federal governments in Canada. Additional proposed class actions have been filed in Canada against the Company and Janssen Inc., and many other industry members, by and on behalf of people who used opioids (for personal injuries), municipalities and First Nations bands. These actions allege a variety of claims related to opioid marketing practices, including false advertising, unfair competition, public nuisance, consumer fraud violations, deceptive acts and practices, false claims and unjust enrichment. An adverse judgment in any of these lawsuits could result in the imposition of large monetary penalties and significant damages including, punitive damages, cost of abatement, substantial fines, equitable remedies and other sanctions.
From June 2017 through December 2019, the Company’s Board of Directors received a series of shareholder demand letters alleging breaches of fiduciary duties related to the marketing of opioids. The Board retained independent counsel to investigate the allegations in the demands, and in April 2020, independent counsel delivered a report to the Board recommending that the Company reject the shareholder demands and take the steps that are necessary or appropriate to secure dismissal of related derivative litigation. The Board unanimously adopted the recommendations of the independent counsel’s report.
In November 2019, one of the shareholders who sent a demand filed a derivative complaint against the Company as the nominal defendant and certain current and former directors and officers as defendants in the Superior Court of New Jersey. The complaint alleges breaches of fiduciary duties related to the marketing of opioids, and that the Company has suffered damages as a result of those alleged breaches. A series of additional derivative complaints making similar allegations against the same and similar defendants were filed in New Jersey state and federal courts in 2019 and 2020. By 2022, all but two state court cases had been voluntarily dismissed. In February 2022, the state court granted the Company’s motion to dismiss one of the two cases, and the shareholder that brought the second case filed a notice of dismissal. The shareholder whose complaint was dismissed filed a motion for reconsideration. In May 2022, the state court held oral argument on the motion for reconsideration and subsequently denied the motion. The shareholder has appealed the state court’s dismissal order.
Product liability
The Company and certain of its subsidiaries are involved in numerous product liability claims and lawsuits involving multiple products. Claimants in these cases seek substantial compensatory and, where available, punitive damages. While the Company believes it has substantial defenses, it is not feasible to predict the ultimate outcome of litigation. From time to time, even if it has substantial defenses, the Company considers isolated settlements based on a variety of circumstances. The Company has
established accrued for these matters and will continue to monitor each related legal issue and adjust accruals for product liability claimsas might be warranted based on new information and lawsuitsfurther developments in complianceaccordance with ASC 450-20 based on currently available information, which in some cases may be limited.450-20-25, Contingencies. The Company accrues an estimate of the legal defense costs needed to defend each matter when those costs are probable and can be reasonably estimated. For certain of these matters, the Company has accrued additional amounts such as estimated costs associated with settlements, damages and other losses. To the extent adverse verdicts have been rendered against the Company, the Company does not record an accrual until a loss is determined to be probable and can be reasonably estimated. Product liability accruals can represent projected product liability for thousands of claims around the world, each in different litigation environments and with different fact patterns. Changes to the accruals may be required in the future as additional information becomes available.
The table below contains the most significant of these cases include:and provides the DePuy ASR™ XL Acetabular System and DePuy ASR™ Hip Resurfacing System; the PINNACLE® Acetabular Cup System; pelvic meshes; RISPERDAL®; XARELTO® ; body powders containing talc, primarily JOHNSONS® Baby Powder; and INVOKANA®. Asapproximate number of December 31, 2017,plaintiffs in the U.S. there were approximately 2,000 plaintiffsUnited States with direct claims in pending lawsuits regarding injuries allegedly due to the DePuy ASR™ XL Acetabular System and DePuy ASR™ Hip Resurfacing System, 10,000 with respect to the PINNACLE® Acetabular Cup System, 53,600 with respect to pelvic meshes, 13,700 with respect to RISPERDAL®, 22,900 with respect to XARELTO®, 6,610 with respect to body powders containing talc; and 1,100 with respect to INVOKANA®.relevant product or product category as of December 31, 2023:
| | | | | | | | |
| Product or product category | | Number of plaintiffs |
| Body powders containing talc, primarily JOHNSON’S Baby Powder | | 59,140 | |
| DePuy ASR XL Acetabular System and DePuy ASR Hip Resurfacing System | | 160 | |
| PINNACLE Acetabular Cup System | | 920 | |
| Pelvic meshes | | 6,720 | |
| ETHICON PHYSIOMESH Flexible Composite Mesh | | 370 | |
| RISPERDAL | | 200 | |
| ELMIRON | | 2,150 | |
In August 2010, DePuy Orthopaedics, Inc. (DePuy) announced a worldwide voluntary recall of its ASR™ XL Acetabular System and DePuy ASR™ Hip Resurfacing System used in hip replacement surgery. Claims for personal injury have been made against DePuy and Johnson & Johnson. The number of pending lawsuits is expected to fluctuate as certain lawsuits are settled or dismissed and additional lawsuits are filed. There may be additional claims that have not yet been filed.
MedTech
DePuy ASR XL Acetabular System and ASR Hip Resurfacing System
In August 2010, DePuy Orthopaedics, Inc. (DePuy) announced a worldwide voluntary recall of its ASR XL Acetabular System and DePuy ASR Hip Resurfacing System (ASR Hip) used in hip replacement surgery. Claims for personal injury have been made against DePuy and the Company. Cases filed in federal courts in the United States have been organized as a multi-district litigation in the United States District Court for the Northern District of Ohio. Litigation has also been filed in countries outside of the United States, primarily in the United Kingdom, Canada, Australia, Ireland, Germany, India and Italy. In November 2013, DePuy reached an agreement with a Court-appointed committee of lawyers representing ASR Hip System plaintiffs to establish a program to settle claims with eligible ASR Hip patients in the United States who had surgery to replace their ASR Hips, known as revision surgery, as of August 31, 2013. DePuy reached additional agreements in February 2015 and March 2017, which further extended the settlement program to include ASR Hip patients who had revision surgeries after August 31, 2013 and prior to February 15, 2017. This settlement program has resolved more than 10,000 claims, with more expected from the recent extension, thereforethereby bringing to resolution significant ASR Hip litigation activity in the United States. However, lawsuits in the United States remain, and the settlement program does not address litigation outside of the United States. In Australia, a class action settlement was reached that resolved the claims of the majority of ASR Hip patients in that country. In Canada, the Company has reached agreements to settle the class actions filed in that country. The Company continues to receive information with respect to potential additional costs associated with this recall on a worldwide basis. The Company has established accruals for the costs associated with the United States settlement program and DePuy ASR™ Hip-related product liability litigation.
DePuy PINNACLE Acetabular Cup System
Claims for personal injury have also been made against DePuy Orthopaedics, Inc. and Johnson & Johnsonthe Company (collectively, DePuy) relating to the PINNACLE® Acetabular Cup System used in hip replacement surgery. The number of pending productProduct liability lawsuits continuescontinue to increase,be filed, and the Company continues to receive information with respect to potential costs and the anticipated number of cases. CasesMost cases filed in federal courts in the United States have been organized as a multi-district litigation in the United States
District Court for the Northern District of Texas.Texas (Texas MDL). Beginning on June 1, 2022, the Judicial Panel on Multidistrict Litigation ceased transfer of new cases into the Texas MDL, and there are now cases pending in federal court outside the Texas MDL. Litigation also has also been filed in some state courts and in countries outside of the United States, primarily in the United Kingdom. In the United Kingdom, a trial is ongoing regarding common issues of liability and a decision is expected inStates. During the first halfquarter of 2018.2019, DePuy established a United States settlement program to resolve these cases. As part of the settlement program, adverse verdicts have been settled. The Company has established an accrual for defense costs in connection with product liability litigation associated with the PINNACLE® Acetabular Cup System.System and the related settlement program.
Ethicon Pelvic Mesh
Claims for personal injury have been made against Ethicon, Inc. (Ethicon) and Johnson & Johnsonthe Company arising out of Ethicon'sEthicon’s pelvic mesh devices used to treat stress urinary incontinence and pelvic organ prolapse. The Company continues to receive information with respect to potential costs and additional cases. Cases filed in federal courts in the United States havehad been organized as a multi-district litigation (MDL) in the United States District Court for the Southern District of West Virginia. In March 2021, the MDL Court entered an order closing the MDL. The MDL Court has remanded cases for trial to the jurisdictions where the case was originally filed and additional pelvic mesh lawsuits have been filed, and remain, outside of the MDL. The Company has settled or otherwise resolved athe majority of the United States cases and the estimated costs associated with these settlements and the remaining cases are reflected in the Company'sCompany’s accruals. In addition, class actions and individual personal injury cases or claims seeking damages for alleged injury resulting from Ethicon’s pelvic mesh devices have been commenced in various countries outside of the United States, including claims and cases in the United Kingdom, the Netherlands, Belgium, France, Ireland, Italy, Spain and Belgium,Slovenia and class actions in Israel, Australia, Canada and Canada, seeking damages for alleged injury resulting from Ethicon'sSouth Africa. In November 2019, the Federal Court of Australia issued a judgment regarding its findings with respect to liability in relation to the three Lead Applicants and generally in relation to the design, manufacture, pre and post-market assessments and testing, and supply and promotion of the devices in Australia used to treat stress urinary incontinence and pelvic organ prolapse. In September 2022, after exhausting its appeals, the Company reached an in-principle agreement to resolve the two pelvic mesh devices. Inclass actions in Australia and in March 2023 the Federal Court approved the settlement. The class actions in Canada were discontinued in 2020 as a trialresult of a settlement of a group of cases and an agreement to resolve the Israeli class action issues is ongoing and a decision is expectedwas reached in 2018.May 2021. The parties in the Israeli class action are currently finalizing the terms of the settlement. A motion to approve the settlement was filed with the Court. The Company has established accruals with respect to product liability litigation associated with Ethicon'sEthicon’s pelvic mesh products.
Ethicon Physiomesh
Following a June 2016 worldwide market withdrawal of Ethicon Physiomesh Flexible Composite Mesh (Physiomesh), claims for personal injury have been made against Ethicon, Inc. (Ethicon) and the Company alleging personal injury arising out of the use of this hernia mesh device. Cases filed in federal courts in the United States have been organized as a multi-district litigation (MDL) in the United States District Court for the Northern District of Georgia. A multi-county litigation (MCL) also has been formed in New Jersey state court and assigned to Atlantic County for cases pending in New Jersey. In addition to the matters in the MDL and MCL, there are additional lawsuits pending in the United States District Court for the Southern District of Ohio, which are part of the MDL for polypropylene mesh devices manufactured by C.R. Bard, Inc., and lawsuits pending in two New Jersey MCLs formed for Proceed/Proceed Ventral Patch and Prolene Hernia systems, and lawsuits pending outside the United States. In May 2021, Ethicon and lead counsel for the plaintiffs entered into a term sheet to resolve approximately 3,600 Physiomesh cases (covering approximately 4,300 plaintiffs) pending in the MDL and MCL at that time. A master settlement agreement (MSA) was entered into in September 2021 and includes 3,729 cases in the MDL and MCL. All deadlines and trial settings in those proceedings are currently stayed pending the completion of the settlement agreement. Of the cases subject to the MSA, 3,390 have been dismissed with prejudice. Ethicon has received releases from 3,584 plaintiffs, and releases continue to be submitted as part of the settlement process. Post-settlement cases in the Physiomesh MDL and MCL are subject to docket control orders requiring early expert reports and discovery requirements. In May 2023, Ethicon entered an additional settlement to resolve the claims of 292 Physiomesh claimants. That settlement is proceeding, and releases are being returned. As of December 31, 2023, there were 5 Physiomesh cases in the MDL and 3 in the New Jersey MCL which are not included in either settlement and which remain subject to the docket control orders.
Claims have also been filed against Ethicon and the Company alleging personal injuries arising from the PROCEED Mesh and PROCEED Ventral Patch hernia mesh products. In March 2019, the New Jersey Supreme Court entered an order consolidating these cases pending in New Jersey as an MCL in Atlantic County Superior Court. Additional cases have been filed in various federal and state courts in the United States, and in jurisdictions outside the United States.
Ethicon and the Company also have been subject to claims for personal injuries arising from the PROLENE Polypropylene Hernia System. In January 2020, the New Jersey Supreme Court created an MCL in Atlantic County Superior Court to handle such cases. Cases involving this product have also been filed in other federal and state courts in the United States.
In October 2022, an agreement in principle, subject to various conditions, was reached to settle the majority of the pending cases involving Proceed, Proceed Ventral Patch, Prolene Hernia System and related multi-layered mesh products, as well as a number of unfiled claims. All litigation activities in the two New Jersey MCLs are stayed pending effectuation of the proposed settlement. Future cases that are filed in the New Jersey MCLs will be subject to docket control orders requiring early expert reports and discovery requirements.
The Company has established accruals with respect to product liability litigation associated with Ethicon Physiomesh Flexible Composite Mesh, PROCEED Mesh and PROCEED Ventral Patch, and PROLENE Polypropylene Hernia System products.
Innovative Medicine
RISPERDAL
Claims for personal injury have been made against Janssen Pharmaceuticals, Inc. and Johnson & Johnsonthe Company arising out of the use of RISPERDAL,®, and related compounds, indicated for the treatment of schizophrenia, acute manic or mixed episodes associated with bipolar I disorder and irritability associated with autism, and related compounds.autism. Lawsuits primarily have been primarily filed in state courts in Pennsylvania, California, and Missouri. Other actions are pending in various courts in the United States and Canada. Product liability lawsuits continue to be filed, and the Company continues to receive information with respect to potential costs and the anticipated number of cases. The Company has successfully defended a number of these cases but there have been verdicts against the Company, including a verdict in October 2019 of $8.0 billion of punitive damages related to one plaintiff, which the trial judge reduced to $6.8 million in January 2020. In September 2021, the Company entered into a settlement in principle with the counsel representing plaintiffs in this matter and in substantially all of the outstanding cases in the United States. The costs associated with this and other settlements are reflected in the Company’s accruals.
ELMIRON
Claims for personal injury have been made against a number of Johnson & Johnson companies, including Janssen Pharmaceuticals, Inc. and the Company, arising out of the use of ELMIRON, a prescription medication indicated for the relief of bladder pain or discomfort associated with interstitial cystitis. These lawsuits, which allege that ELMIRON contributes to the development of permanent retinal injury and vision loss, have been filed in both state and federal courts across the United States. In December 2020, lawsuits filed in federal courts in the United States, including putative class action cases seeking medical monitoring, were organized as a multi-district litigation in the United States District Court for the District of New Jersey. All cases in the multi-district litigation are in active discussions regarding resolution, and as a result, all activity is stayed. In addition, cases have been filed in various state courts of New Jersey, which have been coordinated in a multi-county litigation in Bergen County, as well as the Court of Common Pleas in Philadelphia, which have been coordinated and granted mass tort designation. No activity has taken place in the New Jersey state court litigation; however, three bellwether trials have been set in Philadelphia for March, April and May 2024. In addition, three class action lawsuits have been filed in Canada. Product liability lawsuits continue to be filed, and the Company continues to receive information with respect to potential costs and the anticipated number of cases. The Company has established an accrualaccruals for defense and indemnity costs associated with respect toELMIRON related product liability litigation associated with RISPERDAL®.litigation.
Intellectual property
Claims for personal injury arising out of the use of XARELTO®, an oral anticoagulant, have been made against Janssen Pharmaceuticals, Inc. (JPI); Johnson & Johnson; and JPI's collaboration partner for XARELTO® Bayer AG and certain of its affiliates. The number of pending product liability lawsuits continues to increase, and the Company continues to receive information with respect to potential costs and the anticipated number of cases. Cases filed in federal courts in the United States have been organized as a multi-district litigation in the United States District Court for the Eastern District of Louisiana. In addition, cases have been filed in state courts across the United States. Many of these cases have been consolidated into a state mass tort litigation in Philadelphia, Pennsylvania; and there are coordinated proceedings in Delaware, California and Missouri. Class action lawsuits also have been filed in Canada. The Company has established an accrual for defense costs in connection with product liability litigation associated with XARELTO®.
Claims for personal injury have been made against Johnson & Johnson Consumer Inc. and Johnson & Johnson arising out of the use of body powders containing talc, primarily JOHNSONS® Baby Powder. The number of pending product liability lawsuits continues to increase, and the Company continues to receive information with respect to potential costs and the anticipated number of cases. Lawsuits have been primarily filed in state courts in Missouri, New Jersey and California. Cases filed in federal courts in the United States have been organized as a multi-district litigation in the United States District Court for the District of New Jersey. The Company has established an accrual for defense costs in connection with product liability litigation associated with body powders containing talc.
Claims for personal injury have been made against a number of Johnson & Johnson companies, including Janssen Pharmaceuticals, Inc. and Johnson & Johnson, arising out of the use of INVOKANA®, a prescription medication indicated to improve glycemic control in adults with Type 2 diabetes. The number of pending product liability lawsuits continues to increase, and the Company continues to receive information with respect to potential costs and the anticipated number of cases. Cases filed in federal courts in the United States have been organized as a multi-district litigation in the United States District Court for the District of New Jersey. Cases have also been filed in state courts in Pennsylvania, California and New Jersey. Class action lawsuits have been filed in Canada. The Company has established an accrual with respect to product liability litigation associated with INVOKANA®.
INTELLECTUAL PROPERTY
Certain subsidiaries of Johnson & Johnsonthe Company are subject, from time to time, to legal proceedings and claims related to patent, trademark and other intellectual property matters arising out of their businesses. Many of these matters involve challenges to the coverage and/or validity of the patents on various products and allegations that certain of the Company’s products infringe the patents of third parties. Although these subsidiaries believe that they have substantial defenses to these challenges and allegations with respect to all significant patents, there can be no assurance as to the outcome of these matters. A loss in any of these cases could adversely affect the ability of these subsidiaries to sell their products, result in loss of sales due to loss of market exclusivity, require the payment of past damages and future royalties, and may result in a non-cashnon-cash impairment charge for any associated intangible asset. The most significant of these matters are described below.
Medical Devices
In June 2009, Rembrandt Vision Technologies, L.P. (Rembrandt) filed a patent infringement lawsuit against Johnson & Johnson Vision Care, Inc. (JJVCI) in the United States District Court for the Eastern District of Texas alleging that JJVCI's manufacture and sale of its ACUVUE® ADVANCE and ACUVUE OASYS® Hydrogel Contact Lenses infringed Rembrandt’s United States Patent No. 5,712,327 and seeking monetary relief. The case was transferred to the United States District Court for the Middle District of Florida, where a trial in May 2012 resulted in a verdict of non-infringement that was subsequently upheld on appeal. In July 2014, Rembrandt sought a new trial based on alleged new evidence, which the District Court denied. In April 2016, the Court of Appeals overturned that ruling and remanded the case to the District Court for a new trial. A new trial was held in August 2017, and the jury returned a verdict of non-infringement in favor of JJVCI. Rembrandt has appealed the verdict to the United States Court of Appeals for the Federal Circuit.
In March 2013, Medinol Ltd. (Medinol) filed a patent infringement lawsuit against Cordis Corporation (Cordis) and Johnson & Johnson in the United States District Court for the Southern District of New York alleging that Cordis’s sales of the CYPHER™ and CYPHER SELECT™ stents made in the United States since 2005 willfully infringed four of Medinol's patents directed to the geometry of articulated stents. Medinol is seeking damages and attorneys’ fees. After trial in January 2014, the District Court dismissed the case, finding Medinol unreasonably delayed bringing its claims (the laches defense). In September 2014,
the District Court denied a motion by Medinol to vacate the judgment and grant it a new trial. Medinol appealed the decision to the United States Court of Appeals for the Federal Circuit, then dismissed the appeal in order to file a petition for review with the United States Supreme Court. In March 2017, the United States Supreme Court held that the laches defense is not available in patent cases and remanded this case to the United States Court of Appeals for the Federal Circuit to consider Medinol's appeal of whether Medinol is entitled to seek a new trial. Cordis was divested in 2015, and the Company retained any liability that may result from this case.
In November 2016, MedIdea, L.L.C. (MedIdea) filed a patent infringement lawsuit against DePuy Orthopaedics, Inc. in the United States District Court for the Northern District of Illinois alleging infringement by the ATTUNE® Knee System. MedIdea alleges infringement of United States Patent Nos. 6,558,426 (’426); 8,273,132; 8,721,730 and 9,492,280 relating to posterior stabilized knee systems. Specifically, MedIdea alleges that the SOFCAMTM Contact feature of the ATTUNE® posterior stabilized knee products infringes the patents-in-suit. MedIdea is seeking monetary damages and injunctive relief. In June 2017, the case was transferred to the United States District Court for the District of Massachusetts. In December 2017, DePuy Synthes Products, Inc. filed a Petition for Inter Partes Review with the United States Patent and Trademark Office, seeking to invalidate the ’426 patent.
In December 2016, Ethicon Endo-Surgery, Inc. and Ethicon Endo-Surgery, LLC (now known as Ethicon LLC) sued Covidien, Inc. in the United States District Court for the District of Massachusetts seeking a declaration that United States Patent Nos. 6,585,735 (the ’735 patent); 7,118,587; 7,473,253; 8,070,748 and 8,241,284 (the ’284 patent), are either invalid or not infringed by Ethicon’s ENSEAL® X1 Large Jaw Tissue Sealer product. In April 2017, Covidien LP, Covidien Sales LLC, and Covidien AG (collectively, Covidien) answered and counterclaimed, denying the allegations, asserting willful infringement of the ’735 patent, the ’284 patent and United States Patent Nos. 8,323,310; 9,084,608; 9,241,759 and 9,113,882, and seeking damages and an injunction. Covidien filed a motion for preliminary injunction, which was denied in October 2017. Trial is scheduled for September, 2019.
In November 2017, Board of Regents, The University of Texas System and Tissuegen, Inc. filed a lawsuit in the United States District Court for the Western District of Texas against Ethicon, Inc. and Ethicon US, LLC alleging the manufacture and sale of VICRYL® Plus Antibacterial Sutures and MONOCRYL® Plus Antibacterial Sutures infringe plaintiffs’ United States Patent Nos. 6,596,296 and 7,033,603 directed to implantable polymer drug releasing biodegradable fibers containing a therapeutic agent.
Pharmaceutical
In April 2016, MorphoSys AG, a German biotech company, filed a patent infringement lawsuit against Janssen Biotech, Inc. (JBI), Genmab U.S. Inc. and Genmab A/S (collectively, Genmab) in the United States District Court for the District of Delaware. MorphoSys alleges that JBI’s manufacture and sale of DARZALEX® (daratumumab) willfully infringes MorphoSys’ United States Patent Nos. 8,263,746, 9,200,061 and 9,785,590. MorphoSys is seeking money damages. JBI licenses patents and the commercial rights to DARZALEX® from Genmab. Trial in the case is scheduled to commence in February 2019.
In August 2016, Sandoz Ltd and Hexal AG (collectively, Sandoz) filed a lawsuit in the English High Court against G.D. Searle LLC (a Pfizer company) and Janssen Sciences Ireland UC (JSI) alleging that Searle’s supplementary protection certificate SPC/GB07/038 (SPC), which is exclusively licensed to JSI, is invalid and should be revoked. Janssen-Cilag Limited sells PREZISTA® (darunavir) in the United Kingdom pursuant to this license. In October 2016, Searle and JSI counterclaimed against Sandoz for threatened infringement of the SPC based on statements of its plans to launch generic darunavir in the United Kingdom. Sandoz admitted that its generic darunavir product would infringe the SPC if it is found valid. Searle and JSI are seeking an order enjoining Sandoz from marketing its generic darunavir before the expiration of the SPC. Following a trial in April 2017, the Court entered a decision holding that the SPC is valid and granting a final injunction. Sandoz has appealed the Court’s decision and the injunction will be stayed pending the appeal. In January 2018, the Court referred the issue on appeal to the Court of Justice for the European Union (CJEU) and stayed the proceedings pending the CJEU’s ruling on the issue.
REMICADE® Related Cases
United States Proceedings
In September 2013, Janssen Biotech, Inc. (JBI) and NYU Langone Medical Center (NYU) received an Office Action from the United States Patent and Trademark Office (USPTO) rejecting the claims in United States Patent No. 6,284,471 relating to REMICADE® (infliximab) (the ’471 patent) in a reexamination proceeding instituted by a third party. The ’471 patent expires in September 2018 and is co-owned by JBI and NYU, with NYU having granted JBI an exclusive license to NYU’s rights under the patent. Following several office actions by the patent examiner, including two further rejections, and responses by
JBI, the USPTO issued a further action maintaining its rejection of the ’471 patent. JBI filed a notice of appeal to the USPTO’s Patent Trial and Appeal Board (the Board), which issued a decision in November 2016 upholding the examiner's rejection. In January 2018, the United States Court of Appeals for the Federal Circuit affirmed the Board's decision.
In August 2014, Celltrion Healthcare Co. Ltd. and Celltrion Inc. (collectively, Celltrion) filed an application with the United States Food and Drug Administration (FDA) for approval to make and sell its own infliximab biosimilar. In March 2015, JBI filed a lawsuit in the United States District Court for the District of Massachusetts against Celltrion and Hospira Healthcare Corporation (Hospira), which has exclusive marketing rights for Celltrion's infliximab biosimilar in the United States, seeking, among other things, a declaratory judgment that their biosimilar product infringes or potentially infringes several JBI patents, including the ’471 patent and United States Patent No. 7,598,083 (the ’083 patent). In August 2016, the District Court granted both Celltrion's and Hospira's motions for summary judgment of invalidity of the ’471 patent. JBI appealed those decisions to the United States Court of Appeals for the Federal Circuit. In January 2018, the Federal Circuit dismissed the appeal as moot based on its affirmance of the Board’s reexamination decision.
In June 2016, JBI filed two additional patent infringement lawsuits asserting the ’083 patent, one against Celltrion and Hospira in the United States District Court for the District of Massachusetts and the other against HyClone Laboratories, Inc., the manufacturer of the cell culture media that Celltrion uses to make its biosimilar product, in the United States District Court for the District of Utah. Although the ’083 patent is already asserted in the existing lawsuit against Celltrion, the additional lawsuit expands the claims to include the sale in the United States of Celltrion's biosimilar product manufactured with cell culture media made in the United States. This additional lawsuit against Celltrion has been consolidated with the existing lawsuit discussed above. Hospira has moved to dismiss all counts of the lawsuit related to the ’083 patent as to it. Celltrion's motion to dismiss all counts of the lawsuit related to the ’083 patent for failure to join all the co-owners of the '083 patent as plaintiffs was denied in October 2017. Trial is scheduled to begin in July 2018. TheInnovative Medicine - litigation against HyClone in Utah is stayed pending the outcomefilers of the Massachusetts actions.
The FDA approved Celltrion’s infliximab biosimilar for sale in the United States in April 2016. Hospira's parent company, Pfizer Inc., launched Celltrion's infliximab biosimilar in the United States in late 2016.
In April 2017, JBI received notice that the FDA approved a marketing application submitted by Samsung Bioepis Co. Ltd. (Samsung) for the sale of its infliximab biosimilar in the United States. In May 2017, JBI filed a patent infringement lawsuit against Samsung in the United States District Court for the District of New Jersey alleging that the sale of its biosimilar product may infringe three of JBI’s patents. In July 2017, Samsung launched its biosimilar product (commercialized by Merck) in the United States. In November 2017, JBI voluntarily dismissed this lawsuit.
Litigation Against Filers of Abbreviated New Drug Applicationsabbreviated new drug applications (ANDAs)
The following summarizesCompany’s subsidiaries have brought lawsuits pending against generic companies that have filed Abbreviated New Drug Applications (ANDAs)ANDAs with the U.S. FDA or undertaken(or similar regulatory processeslawsuits outside of the United States,States) seeking to market generic formsversions of products sold by various subsidiaries of Johnson & Johnsonthe Company prior to expiration of the applicable patents covering those products. These ANDAslawsuits typically include allegations of non-infringement and/or invalidity and unenforceabilityof patents listed in FDA’s publication “Approved Drug Products with Therapeutic Equivalence Evaluations” (commonly known as the Orange Book). In each of these lawsuits, the Company’s subsidiaries are seeking an order enjoining the defendant from marketing a generic version of a product before the expiration of the applicable patents.relevant patents (Orange Book Listed Patents). In the event the Company’s subsidiaries are not successful in these actions,an action, or theany automatic statutory 30-month stays of the ANDAs expirestay expires before the United States District Courtcourt rulings are obtained, the third-partygeneric companies involved willwould have the ability, upon regulatory approval, of the FDA, to introduce generic versions of thetheir products at issue to the market, resulting in the potential for substantial market share and revenue losses for thosethe applicable products, and which may result in a non-cash impairment charge in any associated intangible asset. In addition, from time to time, the Company’s subsidiaries may settle these types of actions
and such settlements can involve the introduction of generic versions of the products at issue to the market prior to the expiration of the relevant patents.
The inter partes reviewInter Partes Review (IPR) process with the United States Patent and Trademark Office (USPTO), created under the 2011 America Invents Act, is also being used at times by generic companies in conjunction with these ANDAs and lawsuits to challenge patents held by the Company’s subsidiaries.applicable patents.
XARELTO
ZYTIGA®
In July 2015,Beginning in March 2021, Janssen Biotech,Pharmaceuticals, Inc., Janssen Oncology, Inc.; Bayer Pharma AG; Bayer AG; and Janssen Research & Development, LLC (collectively, Janssen) and BTG International Ltd. (BTG) initiated aBayer Intellectual Property GmbH filed patent infringement lawsuitlawsuits in the United States District Court for the District of New Jerseydistrict courts against a number of generic companies (and certain of their affiliates and/or suppliers)manufacturers who have filed ANDAs seeking approval to market a generic versionversions of ZYTIGA® 250mgXARELTO before the expiration of United States Patent No. 8,822,438 (the ’438 patent).certain Orange Book Listed Patents. The generic companies currently include Amneal Pharmaceuticals, LLC and Amneal Pharmaceuticals of New York, LLC (collectively, Amneal); Apotexfollowing entities are named defendants: Dr. Reddy’s Laboratories, Inc. and Apotex Corp. (collectively, Apotex); Citron Pharma LLC (Citron); Dr. Reddy’s Laboratories, Ltd. and Dr. Reddy’s Laboratories,; Lupin Limited; Lupin Pharmaceuticals, Inc. (collectively, Dr. Reddy’s); Taro Pharmaceutical Industries Ltd.; Taro Pharmaceuticals U.S.A., Inc.; Teva Pharmaceuticals USA, Inc.; Mylan Pharmaceuticals Inc.; Mylan Inc.; Mankind Pharma Limited; Apotex Inc.; Apotex Corp.; Auson Pharmaceuticals Inc.; Macleods Pharmaceuticals Ltd; Macleods Pharma USA, Inc.; Indoco Remedies Limited; FPP Holding Company LLC; Umedica Laboratories Pvt. Ltd.; Aurobindo Pharma Limited; Aurobindo Pharma USA, Inc.; Cipla Ltd.; Cipla USA Inc.; and Mylan Inc.
(collectively, Mylan); ParInvaGen Pharmaceuticals, Inc. The following U.S. patents are included in one or more cases: 9,539,218 and Par Pharmaceutical Companies,10,828,310.
U.S. Patent No. 10,828,310 was also under consideration by the USPTO in an IPR proceeding. In July 2023, the USPTO issued a final written decision finding the claims of the patent invalid. In September 2023, Bayer Pharma AG filed an appeal to the U.S. Court of Appeals for the Federal Circuit.
OPSUMIT
Beginning in January 2023 Actelion Pharmaceuticals Ltd and Actelion Pharmaceuticals US, Inc. (collectively, Par);filed patent infringement lawsuits in United States district courts against generic manufacturers who have filed ANDAs seeking approval to market generic versions of OPSUMIT before expiration of certain Orange Book Listed Patents. The following entities are named defendants: Sun Pharmaceutical Industries Ltd.Limited; Sun Pharmaceutical Industries, Inc.; MSN Laboratories Private Limited; MSN Pharmaceuticals Inc.; and Mylan Pharmaceuticals Inc. The following U.S. patents are included in one or more cases: 7,094,781; and 10,946,015. In November 2023, the Company entered into a confidential settlement agreement with MSN Laboratories Private Limited and MSN Pharmaceuticals Inc. In December 2023, the Company entered into a confidential settlement agreement with Sun Pharmaceutical Industries Limited and Sun Pharmaceuticals Industries, Inc. (collectively, Sun);
INVEGA SUSTENNA
Beginning in January 2018, Janssen Pharmaceutica NV and Janssen Pharmaceuticals, Inc. filed patent infringement lawsuits in United States district courts against generic manufacturers who have filed ANDAs seeking approval to market generic versions of INVEGA SUSTENNA before expiration of the Orange Book Listed Patent. The following entities are named defendants: Teva Pharmaceuticals USA, Inc. (Teva); Wockhardt Bio A.G.Mylan Laboratories Limited; Pharmascience Inc.; Wockhardt USA LLCMallinckrodt PLC; Specgx LLC; Tolmar, Inc.; and Wockhardt Ltd. (collectively, Wockhardt); West-Ward Pharmaceutical Corp. (West-Ward) and Hikma Pharmaceuticals, LLC (Hikma). InAccord Healthcare, Inc. The following U.S. patent is included in one or more cases: 9,439,906.
Beginning in February 2018, the court heard oral arguments on a motion for summary judgment of non-infringement filed by certain defendants. The parties await a decision. If the decision is unfavorable, the stay could be lifted and a generic version of ZYTIGA® could enter the market.
Janssen and BTG also initiated patent infringement lawsuits in the United States District Court for the District of New Jersey against Amerigen Pharmaceuticals Limited (Amerigen) in May 2016, and Glenmark Pharmaceuticals, Inc. in June 2016, each of whom filed an ANDA seeking approval to market its generic version of ZYTIGA® before the expiration of the ’438 patent.
In August 2015, Janssen and BTG filed an additional jurisdictional protective lawsuit against the Mylan defendants in the United States District Court for the Northern District of West Virginia, which has been stayed.
In August 2017, Janssen and BTG initiated a patent infringement lawsuit in the United States District Court for the District of New Jersey against Teva, who filed an ANDA seeking approval to market a generic version of ZYTIGA® 500mg before the expiration of the ’438 patent.
In January 2018, Janssen dismissed its lawsuit against Sun after it withdrew its ANDA.
In each of the above lawsuits, Janssen is seeking an order enjoining the defendants from marketing their generic versions of ZYTIGA® before the expiration of the ’438 patent.
Several generic companies including Amerigen, Argentum Pharmaceuticals LLC (Argentum), Mylan, Wockhardt, Actavis, Amneal, Dr. Reddy’s, Sun, Teva, West-Ward and Hikma filed Petitions for Inter Partes Review (IPR) with the USPTO, seeking to invalidate the ’438 patent. In January 2018, the USPTO issued decisions invalidating the '438 patent, and Janssen is appealing this decision. The IPR decisions are not binding on the district court in the pending litigation.
In October 2017, Janssen Inc. and Janssen Oncology, Inc. (collectively, Janssen)Pharmaceutica NV initiated two Noticesa Statement of ApplicationClaim under Section 6 of the Patented Medicines (Notice of Compliance) Regulations against Teva Canada Limited (Teva) and the Minister of Health in Canada in response to Teva's filing Abbreviated New Drug Submissions (ANDS) andgeneric manufacturers who have filed ANDSs seeking approval to market generic versions of ZYTIGA® 250mg and ZYTIGA® 500mgINVEGA SUSTENNA before the expiration of Canadian Patent No. 2,661,422.
In November 2017, Janssen initiated a Notice of Application under Section 6 of the Patented Medicines (Notice of Compliance) Regulations againstlisted patent. The following entities are named defendants: Pharmascience Inc. and Apotex Inc. (Apotex) and the Minister of HealthThe following Canadian patent is included in Canadaone or more cases: 2,655,335.
INVEGA TRINZA
Beginning in response to Apotex’s filing of an Abbreviated New Drug Submission (ANDS) seeking approval to market a generic version of ZYTIGA® before the expiration of Canadian Patent No. 2,661,422.
In each of these Notices of Application,September 2020, Janssen is seeking an order prohibiting the Minister of Health from issuing a Notice of Compliance with respect to Teva's and Apotex's ANDS before the expiration of Janssen's patent.
COMPLERA®
In August and September 2015,Pharmaceuticals, Inc., Janssen Pharmaceutica NV, and Janssen Sciences Ireland UC (collectively, Janssen) and Gilead Sciences, Inc. and Gilead Sciences Ireland UC (collectively, Gilead) initiated patent infringement lawsuits in the United States District Courts for the District of Delaware and the District of West Virginia, respectively, against Mylan, Inc. and Mylan Pharmaceuticals, Inc. (collectively, Mylan), who filed an ANDA seeking approval to market a generic version of COMPLERA® before the expiration of United States Patent Nos. 8,841,310, 7,125,879 and 8,101,629. In July 2017, the West Virginia lawsuit was dismissed without prejudice by stipulation of the parties.
In the Delaware lawsuit, Janssen and Gilead amended their complaint to add claims for patent infringement with respect to United States Patent Nos. 8,080,551; 7,399,856; 7,563,922; 8,101,752 and 8,618,291. In November 2017, the parties entered into a settlement agreement.
XARELTO®
Beginning in October 2015, Janssen Pharmaceuticals, Inc. (JPI) and Bayer Pharma AG and Bayer Intellectual Property GmbH (collectively, Bayer)Research & Development, LLC filed patent infringement lawsuits in the United States District Court for the District of Delawaredistrict courts against a number of generic companiesmanufacturers who have filed ANDAs seeking approval to market generic versions of XARELTO®INVEGA TRINZA before expiration
of Bayer’s United States Patent Nos. 7,157,456 , 7,585,860 and 7,592,339 relating to XARELTO®. JPI is the exclusive sublicensee of the asserted patents.Orange Book Listed Patent. The following generic companiesentities are named defendants: Aurobindo Pharma LimitedMylan Laboratories Limited; Mylan Pharmaceuticals Inc.; and Aurobindo Pharma USA, Inc. (collectively, Aurobindo); Breckenridge Pharmaceutical, Inc. (Breckenridge); InvaGen Pharmaceuticals Inc. (InvaGen); Micro Labs USAMylan Institutional LLC. The following U.S. patent is included in one or more cases: 10,143,693. In May 2023, the District Court issued a decision finding that Mylan’s proposed generic product infringes the asserted patent and that the patent is not invalid. Mylan has appealed the verdict.
SYMTUZA
Beginning in November 2021, Janssen Products, L.P., Janssen Sciences Ireland Unlimited Company, Gilead Sciences, Inc. and Micro Labs Ltd (collectively, Micro); Mylan Pharmaceuticals Inc. (Mylan); Prinston Pharmaceuticals, Inc.; Sigmapharm Laboratories, LLC (Sigmapharm); Torrent Pharmaceuticals, Limited and Torrent Pharma Inc. (collectively, Torrent). All defendants except Mylan and Sigmapharm have agreed to have their cases stayed and to be bound by the outcome of any final judgment rendered against any of the other defendants. Trial is scheduled for March 2018.
Beginning in April 2017, JPI and Bayer Intellectual Property GmbH and Bayer AG (collectively, Bayer AG)Gilead Sciences Ireland UC filed patent infringement lawsuits in the United States District Court for the District of Delawaredistrict courts against a number of generic companiesmanufacturers who have filed ANDAs seeking approval to market generic versions of XARELTO®SYMTUZA before expiration of Bayer AG’s United States Patent No. 9,539,218 (’218) relating to XARELTO®.certain Orange Book Listed Patents. The following generic companiesentities are named defendants: Alembic Pharmaceuticals Limited, Alembic Global Holding SA and AlembicLupin Limited; Lupin Pharmaceuticals, Inc.; Aurobindo; Breckenridge; InvaGen; Lupin LimitedMSN Laboratories
Private Ltd.; MSN Life Sciences Private Ltd.; MSN Pharmaceuticals Inc.; Apotex Inc.; and LupinApotex Corp. The following U.S. patents are included in one or more cases: 10,039,718 and 10,786,518.
ERLEADA
Beginning in May 2022, Aragon Pharmaceuticals, Inc., Janssen Biotech, Inc. (collectively, Lupin); Micro; Mylan; Sigmapharm; Taro Pharmaceutical Industries Ltd.Janssen), Sloan Kettering Institute for Cancer Research (SKI) and Taro Pharmaceuticals U.S.A., Inc. (collectively, Taro) and Torrent. Lupin has counterclaimed for a declaratory judgment of noninfringement and invalidity of United States Patent No. 9,415,053, but Lupin dismissed its counterclaims after it was provided a covenant not to sue on that patent. Aurobindo, Taro, Torrent and Micro have agreed to have their cases stayed and to be bound by the outcome of any final judgment rendered against any of the other defendants. The ’218 cases have been consolidated for discovery and trial, and are currently set for trial in April 2019.
In each of these lawsuits, JPI is seeking an order enjoining the defendants from marketing their generic versions of XARELTO® before the expiration of the relevant patents.
PREZISTA®
In September 2017, Janssen Sciences Ireland UC and Janssen Products, L.P. (collectively, Janssen) initiated a patent infringement lawsuit in the United States District Court for the District of New Jersey against Aurobindo Pharma Ltd. and Aurobindo Pharma USA Inc. (collectively, Aurobindo), who filed an ANDA seeking approval to market a generic version of PREZISTA® before the expiration of United States Patent Nos. 8,518,987; 7,700,645; 7,126,015; and 7,595,408. In January 2018, the parties entered into a settlement agreement.
In November 2017, Janssen Inc. initiated Notices of Application under Section 6 of the Patented Medicines (Notice of Compliance) Regulations against Apotex Inc. (Apotex) and the Minister of Health in Canada in response to Apotex’s filing of an Abbreviated New Drug Submission (ANDS) seeking approval to market a generic version of PREZISTA® before the expiration of Canadian Patent Nos. 2,485,834 and 2,336,160, which is owned by the United States and the Board of TrusteesRegents of the University of Illinois. Janssen is seeking an order prohibiting the Minister of Health from issuing a Notice of Compliance with respect to Apotex's ANDS before the expiration of the relevant patents.
RISPERDAL CONSTA®
In November 2016, the United States Patent and Trademark Office (USPTO) instituted an Inter Partes Review filed by Luye Pharma Group Ltd., Luye Pharma (USA) Ltd., Sandong Luye Pharmaceutical Co., Ltd. and Nanjing Luye Pharmaceutical Co., Ltd., seeking to invalidate United States Patent No. 6,667,061 relating to RISPERDAL CONSTA®. Janssen Pharmaceuticals, Inc. markets RISPERDAL CONSTA® pursuant to a license from Alkermes Pharma Ireland Ltd. In November 2017, the USPTO issued a decision upholding the validity of the patent.
INVOKANA®/INVOKAMET®
Beginning in July 2017, Janssen Pharmaceuticals, Inc., Janssen Research & Development, LLC, Cilag GmbH International and Janssen Pharmaceutica NV (collectively, Janssen) and Mitsubishi Tanabe Pharma Corporation (MTPC)California filed patent infringement lawsuits in the United States District Court for the District of New Jersey, the United States District Court for the District of Colorado and the United States District Court for the District of Delawaredistrict courts against a number of generic companiesmanufacturers who have filed ANDAs seeking approval to market generic versions of INVOKANA® and/or INVOKAMET® ERLEADA before expiration of MTPC’s United States Patent Nos. 7,943,582 and/or 8,513,202 relating to INVOKANA® and INVOKAMET®. Janssen is the exclusive licensee of the asserted patents.certain Orange Book Listed Patents. The following generic companiesentities are named defendants: ApotexLupin Limited; Lupin Pharmaceuticals, Inc. and Apotex Corp. (Apotex); Zydus Worldwide DMCC; Zydus Pharmaceuticals (USA), Inc.; Zydus Lifesciences Limited; Sandoz Inc.; Eugia Pharma Specialities Limited; Aurobindo Pharma USA, Inc. (Aurobindo); Macleods Pharmaceuticals Ltd.Auromedics Pharma LLC; Hetero Labs Limited Unit V; and MacLeods Pharma USA, Inc.; InvaGen Pharmaceuticals, Inc. (InvaGen); Prinston Pharmaceuticals Inc.; Dr. Reddy’s Laboratories, Inc. and Dr. Reddy’s Laboratories Ltd; Hetero USA, Inc., Hetero Labs The following U.S. patents are included in one or more cases: 9,481,663; 9,884,054; 10,052,314 (which reissued as RE49,353); 10,702,508; 10,849,888; 8,445,507; 8,802,689; 9,388,159; 9,987,261; and RE49,353. In December 2023, Janssen and SKI voluntarily dismissed their case against Lupin Limited Unit-V and Hetero Labs Limited; MSN Laboratories Private Ltd. and MSN Pharmaceuticals, Inc.; Laurus Labs Ltd.; Indoco Remedies Ltd.; Zydus Pharmaceuticals (USA) Inc. (Zydus); Sandoz, Inc. (Sandoz); Teva Pharmaceuticals USA, Inc.; and Lupin Ltd. and Lupin Pharmaceuticals, Inc.
UPTRAVI
Beginning in July 2017, JanssenNovember 2022, Actelion Pharmaceuticals US Inc., Actelion Pharmaceuticals Ltd and MTPCNippon Shinyaku Co., Ltd. filed patent infringement lawsuits in the United States District Court for the District of New Jersey and the United States District Court for the District of Coloradodistrict courts against Sandoz and InvaGen,generic manufacturers who have filed ANDAs seeking approval to market generic versions of INVOKANA® and/or INVOKAMET® UPTRAVI intravenous before expiration of MTPC’scertain Orange Book Listed Patents. The following entities are named defendants: Alembic Pharmaceuticals Limited, Alembic Pharmaceuticals Inc.; Lupin Ltd.; Lupin Pharmaceuticals, Inc.; Cipla Limited; Cipla USA Inc.; MSN Laboratories Private Ltd.; and MSN Pharmaceuticals Inc. The following U.S. patents are included in one or more cases: 8,791,122 and 9,284,280. In November 2023, the Company entered into a confidential settlement agreement with Alembic Pharmaceuticals Limited and Alembic Pharmaceuticals Inc.
SPRAVATO
Beginning in May 2023, Janssen Pharmaceuticals, Inc. and Janssen Pharmaceutica NV filed patent infringement lawsuits in United States Patent No. 7,943,788 (the '788 patent) relating to INVOKANA® and INVOKAMET® anddistrict courts against Zydus,generic manufacturers who have filed ANDAs seeking approval to market generic versions of INVOKANA® and INVOKAMET® SPRAVATO before expiration of certain Orange Book Listed Patents. The following entities are named defendants: Sandoz Inc.; Hikma Pharmaceuticals Inc. USA; Hikma Pharmaceuticals PLC; and Alkem Laboratories Ltd. The following U.S. patents are included in one or more cases: 10,869,844; 11,173,134; 11,311,500; and 11,446,260.
STELARA
In November 2023, Biocon Biologics Inc. filed a Petition for Inter Partes Review with the '788 patent, MTPC's United StatesUSPTO seeking review of U.S. Patent No. 8,222,219 relating10,961,307 related to INVOKANA® and INVOKAMET® and MTPC’s United States Patent No. 8,785,403 relating to INVOKAMET®, andmethods of treating ulcerative colitis with ustekinumab.
MedTech
In March 2016, Abiomed, Inc. (Abiomed) filed a declaratory judgment action against Aurobindo, who filed an ANDA seeking approval to market a generic version of INVOKANA® before expiration of the ’788 patent and the ’219 patent relating to INVOKANA®. Janssen is the exclusive licensee of the asserted patents. In October 2017, the Colorado lawsuits against Sandoz were dismissed. In December 2017, the Delaware lawsuits against Apotex and Teva were dismissed.
In each of these lawsuits, Janssen and MTPC are seeking an order enjoining the defendants from marketing their generic versions of INVOKANA® and/or INVOKAMET® before the expiration of the relevant patents.
VELETRI®
In July 2017, Actelion Pharmaceuticals Ltd. (Actelion) initiated a patent infringement lawsuitMaquet Cardiovascular LLC (Maquet) in the United StatesU.S. District Court for the District of New Jersey against Sun Pharmaceutical Industries, Inc.Massachusetts seeking a declaration that the Impella does not infringe certain Maquet patents, currently U.S. Patent Nos. 7,022,100 (’100); 8,888,728; 9,327,068; 9,545,468; 9,561,314; and Sun Pharmaceutical Industries Limited (collectively, Sun Pharmaceutical), who filed an ANDA seeking approval to market a generic version9,597,437. Maquet counterclaimed for infringement of VELETRI® beforeeach of those patents. After claim construction, Maquet alleged infringement of only the expiration’100 patent. In September 2021, the court granted Abiomed’s motion for summary judgment of United States Patent No. 8,598,227. Actelion is seeking an order enjoining Sun Pharmaceutical from marketing its generic version of VELETRI® before the expirationnon-infringement of the patent. Trial is scheduled to commence’100 patent, and in June 2019.September 2023, the district court entered final judgment in favor of Abiomed on all patents-in-suit. Maquet appealed.
OPSUMIT®
In January 2018, Actelion Pharmaceuticals Ltd (Actelion) initiated a patent infringement lawsuit in the United States District Court for the District of New Jersey against Zydus Pharmaceuticals (USA) Inc. (Zydus) and Amneal Pharmaceuticals LLC (Amneal), who filed an ANDA seeking approval to market a generic version of OPSUMIT® before the expiration of United States Patent No. 7,094,781. In the lawsuit, Actelion is seeking an order enjoining Zydus and Amneal from marketing generic versions of OPSUMIT® before the expiration of the patent.
INVEGA SUSTENNA®
In January 2018, Janssen Pharmaceutica NV and Janssen Pharmaceuticals, Inc. (collectively, Janssen) initiated a patent infringement lawsuit in the United States District Court for the District of New Jersey against Teva Pharmaceuticals USA, Inc. (Teva), who filed an ANDA seeking approval to market a generic version of INVEGA SUSTENNA® before the expiration of United States Patent No. 9,439,906. In the lawsuit, Janssen is seeking an order enjoining Teva from marketing a generic version of INVEGA SUSTENNA® before the expiration of the patent.
IMBRUVICA®
Beginning in January 2018, Pharmacyclics LLC (Pharmacyclics) and Janssen Biotech, Inc. (Janssen) filed patent infringement lawsuits in the United States District Court for the District of Delaware against a number of generic companies who filed ANDAs seeking approval to market generic versions of IMBRUVICA® before expiration of Pharmacyclics’ United States Patent Nos. 8,008,309, 7,514,444, 8,697,711, 8,735,403, 8,957,079, 9,181,257, 8,754,091, 8,497,277, 8,925,015, 8,476,284, 8,754,090, 8,999,999, 9,125,889, 9,801,881, 9,801,883, 9,814,721, 9,795,604, 9,296,753, 9,540,382, 9,713,617 and/or 9,725,455 relating to IMBRUVICA®. Janssen is the exclusive licensee of the asserted patents. The following generic companies are named defendants: Cipla Limited and Cipla USA Inc. (Cipla); Fresenius Kabi USA, LLC, Fresenius Kabi USA, Inc., and Fresenius Kabi Oncology Limited (Fresenius Kabi); Sandoz Inc. and Lek Pharmaceuticals d.d. (Sandoz); Shilpa Medicare Limited (Shilpa); Sun Pharma Global FZE and Sun Pharmaceutical Industries Limited (Sun); Teva Pharmaceuticals USA, Inc. and Teva Pharmaceutical Industries Limited (Teva); and Zydus Worldwide DMCC and Cadila Healthcare Limited (Zydus).
In each of the lawsuits, Pharmacyclics and Janssen are seeking an order enjoining the defendants from marketing generic versions of IMBRUVICA® before the expiration of the relevant patents.
GOVERNMENT PROCEEDINGSGovernment proceedings
Like other companies in the pharmaceutical and medical devicestechnologies industries, Johnson & Johnsonthe Company and certain of its subsidiaries are subject to extensive regulation by national, state and local government agencies in the United States and other countries in which they operate. As a result, interaction withSuch regulation has been the basis of government agencies is ongoing.investigations and litigations. The most significant litigation brought by, and investigations conducted by, government agencies are listed below. It is possible that criminal charges and substantial fines and/or civil penalties or damages could result from government investigations or litigation.
MedTech
Average Wholesale Price (AWP) Litigation
In July 2018, the Public Prosecution Service in Rio de Janeiro and representatives from the Brazilian antitrust authority CADE inspected the offices of more than 30 companies including Johnson & Johnson do Brasil Indústria e Comércio de Produtos para Saúde Ltda. The authorities appear to be investigating allegations of possible anti-competitive behavior and severalpossible improper payments in the medical device industry. The Company continues to respond to inquiries regarding the Foreign
Corrupt Practices Act from the United States Department of its pharmaceutical subsidiaries (theJustice and the United States Securities and Exchange Commission.
In July 2023, the U.S. Department of Justice (“DOJ”) issued Civil Investigative Demands to the Company, Johnson & Johnson Surgical Vision, Inc., and Johnson & Johnson Vision Care, Inc. (collectively, “J&J Vision”) in connection with a civil investigation under the False Claims Act relating to free or discounted intraocular lenses and equipment used in eye surgery, such as phacoemulsification and laser systems. J&J AWP Defendants), alongVision has begun producing documents and information responsive to the Civil Investigative Demands. J&J Vision is in ongoing discussions with numerous other pharmaceutical companies,the DOJ regarding its inquiry.
Innovative Medicine
In July 2016, the Company and Janssen Products, LP were named as defendants inserved with a series of lawsuits in state and federal courts involving allegations thatqui tam complaint pursuant to the pricing and marketing of certain pharmaceutical products amounted to fraudulent and otherwise actionable conduct because, among other things, the companies allegedly reported an inflated Average Wholesale Price (AWP) for the drugs at issue. Payors alleged that they used those AWPs in calculating provider reimbursement levels. The plaintiffs in these cases included three classes of private persons or entities that paid for any portion of the purchase of the drugs at issue based on AWP, and state government entities that made Medicaid payments for the drugs at issue based on AWP. Many of these cases, both federal actions and state actions removed to federal court, were consolidated for pre-trial purposes in a multi-district litigationFalse Claims Act filed in the United States District Court for the District of Massachusetts, where all claims against the J&J AWP Defendants were ultimately dismissed. The J&J AWP Defendants also prevailed in a case brought by the Commonwealth of Pennsylvania. Other AWP cases have been resolved through court order or settlement. Two cases remain pending. In a case brought by Illinois, the parties are awaiting assignment of a trial date. In New Jersey a putative class action based upon AWP allegations is pending against Centocor, Inc. and Ortho Biotech Inc. (both now Janssen Biotech, Inc.), Johnson & Johnson and ALZA Corporation.
Opioids Litigation
Beginning in 2014 and continuing to the present, Johnson & Johnson and Janssen Pharmaceuticals, Inc. (JPI), along with other pharmaceutical companies, have been named in numerous lawsuits brought by certain state and local governments related to the marketing of opioids, including DURAGESIC®, NUCYNTA® and NUCYNTA® ER. To date, complaints against pharmaceutical companies, including Johnson & Johnson and JPI, have been filed in state court by the state Attorneys General in Louisiana, Mississippi, Missouri, New Mexico, Ohio and Oklahoma. Complaints against the manufacturers also have been filed in state or federal court by city, county and local government agencies in the following states: Arkansas; California; Connecticut; Florida; Georgia; Illinois; Kentucky; Louisiana; Mississippi; Missouri; Nevada; New Hampshire; New Jersey; New Mexico; New York; Ohio; Oklahoma; Oregon; Pennsylvania; Tennessee; Texas; Washington and West Virginia. These actions allege a variety of claims related to opioids marketing practices, including false advertising, unfair competition, public nuisance, consumer fraud violations, deceptive acts and practices, false claims and unjust enrichment. The suits generally seek penalties and/or injunctive and monetary relief. These cases are in early stages of litigation. In October 2017, Johnson & Johnson and JPI were both served with a motion to consolidate 66 pending matters into a federal Multi District Litigation in the Southern District of Ohio. In December 2017, the MDL was approved in the Northern District of Ohio and there are approximately 190 cases that have been transferred to the MDL.
Johnson & Johnson, JPI and other pharmaceutical companies have also received subpoenas or requests for information related to opioids marketing practices from the following state Attorneys General: Alaska, Indiana, New Hampshire, New Jersey, Tennessee and Washington. In September 2017, Johnson & Johnson and JPI were contacted by the Texas and Colorado Attorney General’s Offices on behalf of approximately 38 states regarding a multi-state Attorney General investigation. The multi-state coalition served Johnson & Johnson and JPI with subpoenas as part of the investigation. Johnson & Johnson and JPI have also received requests for information from the ranking minority member of the United States Senate Committee on Homeland Security and Governmental Affairs regarding the sales, marketing, and educational strategies related to the promotion of opioids use.
Other
In August 2012, DePuy Orthopaedics, Inc., DePuy, Inc. (now DePuy Synthes, Inc.), and Johnson & Johnson Services, Inc. received an informal request from the United States Attorney's Office for the District of Massachusetts and the Civil Division of the United States Department of Justice (the United States) for the production of materials relating to the DePuy ASR™ XL Hip device. In July 2014, the United States notified the United States District Court for the District of Massachusetts that it had declined to intervene in a qui tam case filed pursuant to the False Claims Act against the companies. In February 2016, the District Court granted the companies’ motion to dismiss with prejudice, unsealed the qui tam complaint, and denied the qui tam relators’ request for leave to file a further amended complaint. The qui tam relators appealed the case to the United States Court of Appeals for the First Circuit. In July 2017, the First Circuit affirmed the District Court’s dismissal in part, reversed in part, and affirmed the decision to deny the relators’ request to file a third amended complaint. The relators’ remaining claims are now pending before the District Court.
Since October 2013, a group of State Attorneys General have issued Civil Investigative Demands relating to the development, sales and marketing of several of DePuy Orthopaedics, Inc.'s hip products. The states are seeking monetary and injunctive relief, and DePuy Orthopaedics, Inc. has entered into a tolling agreement with the states. In July 2014, the Oregon Department of Justice, which was investigating these matters independently of the other states, announced a settlement of its ASR™ XL Hip device investigationwith the State of Oregon.
In October 2012, Johnson & Johnson was contacted by the California Attorney General's office regarding a multi-state Attorney General investigation of the marketing of surgical mesh products for hernia and urogynecological purposes by Johnson & Johnson's subsidiary, Ethicon, Inc. (Ethicon). Johnson & Johnson and Ethicon have since entered into a series of tolling agreements with the 47 states and the District of Columbia participating in the multi-state investigation and have responded to Civil Investigative Demands served by certain of the participating states. The states are seeking monetary and injunctive relief. In May 2016, California and Washington filed civil complaints against Johnson & Johnson, Ethicon Inc. and Ethicon US, LLC alleging violations of their consumer protection statutes. Similar complaints were filed against the companies by Kentucky in August 2016 and by Mississippi in October 2017. Johnson & Johnson and Ethicon have entered into a new tolling agreement with the remaining 43 states and the District of Columbia.
In December 2012, Therakos, Inc. (Therakos), formerly a subsidiary of Johnson & Johnson and part of the Ortho-Clinical Diagnostics, Inc. (OCD) franchise, received a letter from the civil division of the United States Attorney's Office for the Eastern District of Pennsylvania informing Therakos that the United States Attorney's Office was investigating the sales and marketing of Uvadex® (methoxsalen) and the Uvar Xts® and Cellex® Systems during the period 2000 to the present. The United States Attorney's Office requested that OCD and Johnson & Johnson preserve documents that could relate to the investigation. Therakos was subsequently acquired by an affiliate of Gores Capital Partners III, L.P. in January 2013, and OCD was divested in June 2014. Following the divestiture of OCD, Johnson & Johnson retains OCD’s portion of any liability that may result from the investigation for activity that occurred prior to the sale of Therakos. In March 2014 and March 2016, the United States Attorney’s Office requested that Johnson & Johnson produce certain documents, and Johnson & Johnson is cooperating with those requests.
In June 2014, the Mississippi Attorney General filed a complaint in Chancery Court of The First Judicial District of Hinds County, Mississippi against Johnson & Johnson and Johnson & Johnson Consumer Companies, Inc. (now Johnson & Johnson Consumer Inc.) (JJCI). The complaint alleges that defendants failed to disclose alleged health risks associated with female consumers' use of talc contained in JOHNSON'S® Baby Powder and JOHNSON'S® Shower to Shower (a product no longer sold by JJCI) and seeks injunctive and monetary relief. The parties have agreed to adjourn the trial date and currently expect the trial to be re-scheduled to the fall of 2018.
In March 2016, Janssen Pharmaceuticals, Inc. (JPI) received a Civil Investigative Demand from the United States Attorney’s Office for the Southern District of New York related to JPI’s contractual relationships with pharmacy benefit managers over the
period from January 1, 2006 to the present with regard to certain of JPI's pharmaceutical products. The demand was issued in connection with an investigation under the False Claims Act.
In January 2017, Janssen Pharmaceuticals, Inc. (JPI) received a Civil Investigative Demand from the United States Department of Justice relating to allegations concerning the sales and marketing practices of OLYSIO®. In December 2017, Johnson & Johnson and JPI were served with a whistleblower lawsuit filed in the United States District Court for the Central District of California alleging the off-label promotion of OLYSIO®two HIV products, PREZISTA and additional products, including NUCYNTA®, XARELTO®, LEVAQUIN®INTELENCE, and REMICADE®. At this time,anti-kickback violations in connection with the promotion of these products. The complaint was filed under seal in December 2012. The federal and state governments have declined to intervene, and the lawsuit which is related to the Civil Investigative Demand, is being prosecuted by a former company employee. JPI filed a motion to dismissthe relators. The Court denied summary judgment on all claims in the United States District Court for the Central District of CaliforniaDecember 2021. Daubert motions were granted in part and denied in part in January 2018.
In February 2017, Johnson & Johnson received a subpoena from the United States Attorney's Office for the District of Massachusetts seeking the production of records pertaining to payments to any 501(c)(3) charitable organization that provides financial assistance to Medicare patients. Multiple pharmaceutical companies have publicly reported receipt of subpoenas and ongoing inquiries similar to this one2022, and the one described below.case is proceeding to trial. Trial is scheduled for May 2024.
Actelion Pharmaceuticals US, Inc. (Actelion US), received a subpoena in May 2016, with follow-up requests in June and December 2016, from the United States Attorney's Office for the District of Massachusetts. The subpoena seeks the production of records pertaining to Actelion US’ payments to 501(c)(3) charitable organizations that provide financial assistance to Medicare patients.
In March 2017, Janssen Biotech, Inc. (JBI) received a Civil Investigative Demand from the United States Department of Justice regarding a False Claims Act investigation concerning management and advisory services provided to rheumatology and gastroenterology practices that purchased REMICADE® or SIMPONI ARIA®.
ARIA. In April and September 2017, Johnson & Johnson received subpoenas fromAugust 2019, the United States AttorneyDepartment of Justice notified JBI that it was closing the investigation. Subsequently, the United States District Court for the District of Massachusetts seeking documents broadly relatingunsealed a qui tam False Claims Act complaint, which was served on the Company. The Department of Justice had declined to pharmaceutical copayment support programs for DARZALEX®, OLYSIO®, REMICADE®, SIMPONI®, STELARA® intervene in the qui tam lawsuit in August 2019. The Company filed a motion to dismiss, which was granted in part and ZYTIGA®. The subpoenas also seek documents relating to Average Manufacturer Price and Best Price reporting to the Center for Medicare and Medicaid Services related to those products, as well as rebate payments to state Medicaid agencies.
In June 2017, Johnson & Johnson received a subpoena from the United States Attorney's Office for the District of Massachusetts seeking information regarding practices pertaining to the sterilization of DePuy Synthes, Inc. spinal implants at three hospitalsdenied in Boston as well as interactions of Company employees with physicians at these hospitals. Johnson & Johnsonpart. Discovery is producing documents in response to this subpoena.
underway.
From time to time, Johnson & Johnsonthe Company has received requests from a variety of United States Congressional Committees to produce information relevant to ongoing congressional inquiries. It is the policy of Johnson & Johnson to cooperate with these inquiries by producing the requested information.
GENERAL LITIGATIONGeneral litigation
In June 2009, followingThe Company or its subsidiaries are also parties to various proceedings brought under the public announcement that Ortho-Clinical Diagnostics, Inc. (OCD) had received a grand jury subpoena fromComprehensive Environmental Response, Compensation, and Liability Act, commonly known as Superfund, and comparable state, local or foreign laws in which the United States Department of Justice, Antitrust Division, in connection with an investigation that has since been closed, multiple class action complaints were filed against OCD by direct purchasers seeking damages for alleged price fixing. These cases were consolidated for pre-trial purposes inprimary relief sought is the United States District CourtCompany’s agreement to implement remediation activities at designated hazardous waste sites or to reimburse the government or third parties for the Eastern District of Pennsylvaniacosts they have incurred in performing remediation as In re Blood Reagent Antitrust Litigation. Following the appeal and reversal of its initial grant of a motion for class certification, on remand, the District Court in October 2015 again granted a motion by the plaintiffs for class certification. In July 2017, the Court issued an opinion granting in part and denying in part OCD's motion for summary judgment. The Court granted summary judgment concerning allegations of price fixing in 2005 and 2008, and denied summary judgment concerning allegations of price fixing in 2001. Trial has been set for June 2018. OCD was divested in 2014 and Johnson & Johnson retained any liability that may result from these cases.
In June 2011, DePuy Orthopaedics, Inc. (DePuy) filed suit against Orthopaedic Hospital (OH) in the United States District Court for the Northern District of Indiana seeking a declaratory judgment that DePuy did not owe OH royalties under a 1999 development agreement. In January 2012, OH filed a breach of contract case in California federal court, which was later consolidated with the Indiana case. In February 2014, OH brought suit for patent infringement relating to the same technology, and that action was also consolidated with the Indiana case. In August 2017, the court denied DePuy’s motions for summary judgment. A trial date has not been set.
In September 2011, Johnson & Johnson, Johnson & Johnson Inc. and McNeil Consumer Healthcare Division of Johnson & Johnson Inc. received a Notice of Civil Claim filed by Nick Field in the Supreme Court of British Columbia, Canada (the BC Civil Claim). The BC Civil Claim is a putative class action brought on behalf of persons who reside in British Columbia and who purchased during the period between September 20, 2001 and in or about December 2010 one or more various McNeil infants' or children's over-the-counter medicines that were manufactured at the Fort Washington, Pennsylvania facility. The BC Civil Claim alleges that the defendants violated the BC Business Practices and Consumer Protection Act, and other Canadian statutes and common laws, by selling medicines that were allegedly not safe and/or effective or did not comply with Canadian Good Manufacturing Practices. The class certification hearing scheduled for October 2015 was adjourned, and the Court entered a Consent Order of Dismissal in November 2017 concluding this action. In addition, in April 2016, a putative class action was filed against Johnson & Johnson, Johnson & Johnson Sales and Logistics Company, LLC and McNeil PPC, Inc. (now known as Johnson & Johnson Consumer, Inc.) in New Jersey Superior Court, Camden County on behalf of persons who reside in the state of New Jersey who purchased various McNeil over-the-counter products from December 2008 through the present. The complaint alleges violations of the New Jersey Consumer Fraud Act. Following the grant of a motion to dismiss and the filing of an amended complaint, in May 2017, the Court denied a motion to dismiss the amended complaint. Discovery is underway.
In May 2014, two purported class actions were filed in federal court, one in the United States District Court for the Central District of California and one in the United States District Court for the Southern District of Illinois, against Johnson & Johnson and Johnson & Johnson Consumer Companies, Inc. (now Johnson & Johnson Consumer Inc.) (JJCI) alleging violations of state consumer fraud statutes based on nondisclosure of alleged health risks associated with talc contained in JOHNSON'S® Baby Powder and JOHNSON'S® Shower to Shower (a product no longer sold by JJCI). Both cases seek injunctive relief and monetary damages; neither includes a claim for personal injuries. In October 2016, both cases were transferred to the United States District Court for the District Court of New Jersey as part of a newly created federal multi-district litigation. In July 2017, the Court granted Johnson & Johnson's and JJCI’s motion to dismiss one of the cases. The plaintiff has appealed. In September 2017, the plaintiff in the second case voluntarily dismissed their complaint.
In August 2014, United States Customs and Border Protection (US CBP) issued a Penalty Notice against Janssen Ortho LLC (Janssen Ortho), assessing penalties for the alleged improper classification of darunavir ethanolate (the active pharmaceutical ingredient in PREZISTA®) in connection with its importation into the United States. In October 2014, Janssen Ortho submitted a Petition for Relief in response to the Penalty Notice. In May 2015, US CBP issued an Amended Penalty Notice assessing substantial penalties and Janssen Ortho filed a Petition for Relief in July 2015.
In March and April 2015, over 30 putative class action complaints were filed by contact lens patients in a number of courts around the United States against Johnson & Johnson Vision Care, Inc. (JJVCI) and other contact lens manufacturers, distributors, and retailers, alleging vertical and horizontal conspiracies to fix the retail prices of contact lenses. The complaints allege that the manufacturers reached agreements with each other and certain distributors and retailers concerning the prices at which some contact lenses could be sold to consumers. The plaintiffs are seeking damages and injunctive relief. All of the class action cases were transferred to the United States District Court for the Middle District of Florida in June 2015. The plaintiffs filed a consolidated class action complaint in November 2015. In June 2016, the Court denied motions to dismiss filed by JJVCI and other defendants. Discovery is ongoing. In March 2017, the plaintiffs filed a motion for class certification.
In August 2015, two third-party payors filed a purported class action in the United States District Court for the Eastern District of Louisiana against Janssen Research & Development, LLC, Janssen Ortho LLC, Janssen Pharmaceuticals, Inc., Ortho-McNeil-Janssen Pharmaceuticals, Inc. and Johnson & Johnson (as well as certain Bayer entities), alleging that the defendants improperly marketed and promoted XARELTO® as safer and more effective than less expensive alternative medications while failing to fully disclose its risks. The complaint seeks damages.
In May 2017, a purported class action was filed in the United States District Court for the Western District of Washington against Lifescan Inc., Johnson & Johnson, other diabetes test strip manufacturers and certain Pharmacy Benefit Managers (PBMs). The complaint alleges that consumers paid inflated prices for glucose monitor test strips as a consequence of undisclosed rebates and other incentives paid by manufacturers to PBMs. The complaint includes RICO, ERISA, and state consumer protection claims. The complaint seeks equitable relief and damages. In November 2017, the case was ordered transferred to United States District Court for the District of New Jersey.
In May 2017, Lonza Sales AG (Lonza) filed a Request for Arbitration with the London Court of International Arbitration against Janssen Research & Development, LLC (Janssen). Lonza alleges that Janssen breached a 2005 agreement between the parties by sublicensing certain Lonza technology used in the manufacture of daratumumab without Lonza’s consent. Lonza seeks monetary damages.
In September 2017, Strategic Products Group, Inc. (SPG) filed an antitrust complaint against Lifescan, Inc. and Lifescan Scotland, Ltd. (collectively, Lifescan) in the United States District Court for the Northern District of Florida (Pensacola Division). SPG, the exclusive distributor of Unistrip blood glucose meter test strips, alleges that Lifescan has monopolized or is attempting to monopolize the market for blood glucose meter test strips compatible with certain Lifescan meters. The complaint seeks damages.
In September 2017, Pfizer, Inc. (Pfizer) filed an antitrust complaint against Johnson & Johnson and Janssen Biotech, Inc. (collectively Janssen) in United States District Court for the Eastern District of Pennsylvania. Pfizer alleges that Janssen has violated federal antitrust laws through its contracting strategies for REMICADE®. The complaint seeks damages and injunctive relief. In November 2017, Janssen moved to dismiss the complaint.
Beginning in September 2017, multiple purported class actions were filed against Johnson & Johnson and Janssen Biotech, Inc. (collectively Janssen) alleging that Janssen’s REMICADE® contracting strategies violated federal and state antitrust and consumer laws and seeking damages and injunctive relief. In November 2017, the cases were consolidated for pre-trial purposes in United States District Court for the Eastern District of Pennsylvania as In re Remicade Antitrust Litigation.
such sites.
In October 2017, certain United States service members and their families brought a complaint against a number of pharmaceutical and medical devices companies, including Johnson & Johnson and certain of its subsidiaries in United States District Court for the District of Columbia, alleging that the defendants violated the United States Anti-Terrorism Act. The complaint alleges that the defendants provided funding for terrorist organizations through their sales practices pursuant to pharmaceutical and medical device contracts with the Iraqi Ministry of Health.
Andover Healthcare, Inc. In July 2020, the District Court dismissed the complaint. In January 2022, the United States Court of Appeals for the District of Columbia Circuit reversed the District Court’s decision. In June 2023, defendants filed a Lanham act casepetition for a writ of certiorari to the United States Supreme Court.
In February 2024, a putative class action was filed against the Company, the Pension & Benefits Committee of Johnson & Johnson, Consumer Inc.and certain named officers and employees, in April 2017 in the United StatedStates District Court for the District of Massachusetts. Andover assertsNew Jersey. The complaint alleges that defendants breached fiduciary duties under the claim “not made with natural rubber latex” on COACH® Sports Wrap, BAND-AID® Brand SECURE-FLEX® Wrap and BAND-AID® Brand HURT-FREE® Wrap is false. AndoverEmployee Retirement Income Security Act (ERISA) by allegedly mismanaging the Company’s prescription-drug benefits program. The complaint seeks actual damages and pre-judgment interest thereon, disgorgementother relief.
MedTech
In October 2020, Fortis Advisors LLC (Fortis), in its capacity as representative of profits, treblethe former stockholders of Auris Health Inc. (Auris), filed a complaint against the Company, Ethicon Inc., and certain named officers and employees (collectively, Ethicon) in the Court of Chancery of the State of Delaware. The complaint alleges breach of contract, fraud, and other causes of action against Ethicon in connection with Ethicon’s acquisition of Auris in 2019. The complaint seeks damages attorney’s fees and injunctiveother relief. TheIn December 2021, the Court granted in part and denied ain part defendants’ motion to dismiss an answercertain causes of action. All claims against the individual defendants were dismissed. The trial was filedheld in January 2024 and discoverythe decision is underway. pending.
Innovative Medicine
In June 2019, the United States Federal Trade Commission (FTC) issued a Civil Investigative Demand to the Company and Janssen Biotech, Inc. (collectively, Janssen) in connection with its investigation of whether Janssen’s REMICADE contracting practices violate federal antitrust laws. The Company has produced documents and information responsive to the Civil Investigative Demand. Janssen is in ongoing discussions with the FTC staff regarding its inquiry.
In February 2018, a securities class action lawsuit was filed against2022, the United States Federal Trade Commission (FTC) issued Civil Investigative Demands to Johnson & Johnson and Janssen Biotech, Inc. (collectively, Janssen) in connection with its investigation of whether advertising practices for REMICADE violate federal law. Janssen has produced documents and information responsive to the Civil Investigative Demands. Janssen is in ongoing discussions with the FTC staff regarding the inquiry.
In June 2022, Genmab A/S filed a Notice for Arbitration with International Institute for Conflict Prevention and Resolution (CPR) against Janssen Biotech, Inc. seeking milestones and an extended royalty term for Darzalex FASPRO. In April 2023, the Arbitration Panel ruled in Janssen's favor and dismissed Genmab’s claims. In January 2024, Genmab’s appeal of this dismissal was denied.
In October 2018, two separate putative class actions were filed against Actelion Pharmaceutical Ltd., Actelion Pharmaceuticals U.S., Inc., and Actelion Clinical Research, Inc. (collectively Actelion) in United States District Court for the District of Maryland and United States District Court for the District of Columbia. The complaints allege that Actelion violated state and federal antitrust and unfair competition laws by allegedly refusing to supply generic pharmaceutical manufacturers with samples of TRACLEER. TRACLEER is subject to a Risk Evaluation and Mitigation Strategy required by the U.S. Food and Drug Administration, which imposes restrictions on distribution of the product. In January 2019, the plaintiffs dismissed the District of Columbia case and filed a consolidated complaint in the United States District Court for the District of New JerseyMaryland.
In December 2023, a putative class action lawsuit was filed against the Company and Janssen Biotech Inc. (collectively “Janssen”) in the United States District Court for the Eastern District of Virginia. The complaint alleges that Janssen violated federal and state antitrust laws and other state laws by delaying biosimilar competition with STELARA through the Janssen's enforcement of patent rights covering STELARA. The complaint seeks damages and other relief.
In June 2022, Janssen Pharmaceuticals, Inc. filed a Demand for Arbitration against Emergent Biosolutions Inc. et al. (EBSI) with the American Arbitration Association, alleging that Johnson & Johnson violatedEBSI breached the federal Securities laws by failing to adequately discloseparties’ Manufacturing Services Agreement for thealleged asbestos contamination in body powders containing talc, primarily JOHNSONS® Baby Powder. Company’s COVID-19 vaccine. In July 2022, Emergent filed its answering statement and counterclaims. The lawsuit was assigned to the District Court Judge managing the personal injury multi-district litigation.hearing is scheduled for July 2024.
Johnson & Johnson or its subsidiaries are also parties to a number of proceedings brought under the Comprehensive Environmental Response, Compensation, and Liability Act, commonly known as Superfund, and comparable state, local or foreign laws in which the primary relief sought is the cost of past and/or future remediation.
22.20. Restructuring
TheIn fiscal 2023, the Company announcedcommenced restructuring actions inwithin its Medical DevicesInnovative Medicine and MedTech segments. The amounts and details of the current year programs are included below.
In fiscal 2023, the Company completed a prioritization of its research and development (R&D) investment within its Innovative Medicine segment to better servefocus on the needsmost promising medicines with the greatest benefit to patients. This resulted in the exit of patientscertain programs within certain therapeutic areas. The R&D program exits are primarily in infectious diseases and customersvaccines including the discontinuation of its respiratory syncytial virus (RSV) adult vaccine program, hepatitis and HIV development. Pre-tax Restructuring expenses of $479 million in today’s evolving healthcare marketplace.the fiscal year 2023, included the termination of partnered and non-partnered development program costs and asset impairments. The estimated costs of these total activities is between $500 million - $600 million and is expected to be completed by the end of fiscal year 2024.
In fiscal 2023, the Company is undertaking actionsinitiated a restructuring program of its Orthopaedics franchise within the MedTech segment to strengthen its go-to-market model, accelerate the pace of innovation, further prioritize key platforms and geographies, and streamline operations while maintaining high quality standards.
by exiting certain markets, product lines and distribution network arrangements. The Company estimates that, in connection with its plans, it will record pre-tax restructuring expense of $319 million in the fiscal year 2023 primarily included inventory and instrument charges related charges of approximately $2.0 billion to $2.4 billion. In 2017, the Company recorded a pre-tax charge of $760 million, of which $88 million was included in cost of products soldmarket and $363 million was included in other (income) expense. See table below for additional details. Total projectproduct exits. The estimated costs of $2.0 billion have been recorded since the restructuring has been announced.total program are between $700 million - $800 million and is expected to be completed by the end of fiscal year 2025.
Additionally, as part of the plan, the Company expects that the restructuring actions will result in position eliminations of approximately 4 to 6 percent of the Medical Devices segment’s global workforce over the next 15 months. Approximately 2,400 positions have been eliminated of which 1,700 received separation payments since the restructuring announcement.
The Company estimates that approximately one-half of the cumulative pre-tax costs will result in cash outlays, including approximately $400 million of employee severance. Approximately one half of the cumulative pre-tax costs are non-cash, relating primarily to facility rationalization, inventory write-offs and intangible asset write-offs.
The following table summarizes the severance charges and the associated spending under this initiative throughrestructuring expenses for the fiscal year ended 2017:2023:
| | | | | | | |
| (Pre-tax Dollars in Millions) | | 2023 |
Innovative Medicine Segment(1) | | | $479 |
MedTech Segment(2) | | | 319 |
| Total Programs | | | $798 |
(1)Included $449 million in Restructuring and $30 million in Cost of products sold on the Consolidated Statement of Earnings
(2)Included $40 million in Restructuring and $279 million in Cost of products sold on the Consolidated Statement of Earnings
Restructuring reserves as of December 31, 2023 and January 1, 2023 were insignificant.
|
| | | | | | | | | |
(Dollars in Millions)
| Severance | Asset Write-offs | Other** | Total |
| 2015 restructuring charge | $ | 484 |
| 86 |
| 20 |
| 590 |
|
| | | | | |
| 2015 activity | | (86 | ) | (3 | ) | (89 | ) |
| | | | | |
| Reserve balance, January 3, 2016 | 484 |
| — |
| 17 |
| 501 |
|
| | | | | |
| 2016 activity | (104 | ) | — |
| (16 | ) | (120 | ) |
| | | | | |
| Reserve balance, January 1, 2017 | 380 |
| — |
| 1 |
| 381 |
|
| | | | | |
| Current year activity: | | | | |
| Charges | | 194 |
| 656 |
| 850 |
|
| Cash payments | (61 | ) | | (619 | ) | (680 | ) |
| Settled non cash | | (194 | ) | | (194 | ) |
| Accrual adjustment | (90 | ) | | | (90 | ) |
| | | | | |
| Reserve balance, December 31, 2017* | $ | 229 |
| — |
| 38 |
| 267 |
|
| | | | | |
21. Kenvue separation and discontinued operations
On May 8, 2023, Kenvue, completed an initial public offering (the IPO) resulting in the issuance of 198,734,444 shares of its common stock, par value $0.01 per share (the “Kenvue Common Stock”), at an initial public offering of $22.00 per share for severance are expected to be substantially paid outnet proceeds of $4.2 billion. The excess of the net proceeds from the IPO over the next 18 monthsnet book value of the Johnson & Johnson divested interest was $2.5 billion and was recorded to additional paid-in capital. As of the closing of the IPO, Johnson & Johnson owned approximately 89.6% of the total outstanding shares of Kenvue Common Stock and at July 2, 2023, the non-controlling interest of $1.3 billion associated with Kenvue was reflected in accordanceequity attributable to non-controlling interests in the consolidated balance sheet in the fiscal second quarter of 2023.
On August 23, 2023, Johnson & Johnson completed the disposition of an additional 80.1% ownership of Kenvue Common Stock through an exchange offer, which resulted in Johnson & Johnson acquiring 190,955,436 shares of the Company’s common stock in exchange for 1,533,830,450 shares of Kenvue Common Stock. The $31.4 billion of Johnson & Johnson common stock received in the exchange offer is recorded in Treasury stock. Following the exchange offer, the Company owns 9.5% of the total outstanding shares of Kenvue Common Stock that was recorded in other assets within continuing operations at the fair market value of $4.3 billion as of August 23, 2023. Subsequent changes are reflected in other income/expense and amounted to $0.4 billion expense through December 31, 2023.
Johnson & Johnson divested net assets of $11.6 billion as of August 23, 2023, and the accumulated other comprehensive loss attributable to the Consumer Health business at that date was $4.3 billion. Additionally, at the date of the exchange offer, Johnson & Johnson decreased the non-controlling interest by $1.2 billion to record the deconsolidation of Kenvue. This resulted in a non-cash gain on the exchange offer of $21.0 billion that was recorded in Net earnings from discontinued operations, net of taxes in the consolidated statements of earnings for the fiscal third quarter of 2023. This one-time gain includes a gain of $2.8 billion on the Kenvue Common Stock retained by Johnson & Johnson. The gain on the exchange offer qualifies as a tax-free transaction for U.S. federal income tax purposes.
Also in connection with the Company's plansseparation, Johnson & Johnson and local laws.Kenvue entered into a separation agreement and also entered into various other agreements that provide for certain transactions to effect the transfer of the assets and liabilities of the Consumer Health business to Kenvue and to govern various interim and ongoing relationships between Kenvue and Johnson & Johnson following the completion of the Kenvue IPO, including transition services agreements (TSAs), transition manufacturing agreements (TMAs), trademark agreements, intellectual property agreements, an employee matters agreement, and a tax matters agreement. Under the TSAs, Johnson & Johnson will provide Kenvue various services and, similarly, Kenvue will provide Johnson & Johnson various services. The provision of services under the TSAs generally will terminate within 24 months following the Kenvue IPO. Additionally, Johnson & Johnson and Kenvue entered into TMAs pursuant to which Johnson & Johnson will manufacture and supply to Kenvue certain products and, similarly, Kenvue will manufacture and supply to Johnson & Johnson certain products. The terms of the TMAs range in initial duration from 3 months to 5 years.
**Other includes project expense suchAmounts related to the TSAs and TMAs included in the consolidated statements of earnings were immaterial for the fiscal year 2023. Additionally, the amounts due to and from Kenvue for the above agreements was not material as salaries for employees supportingof December 31, 2023.
The results of the initiativeConsumer Health business (previously reported as a separate business segment), as well as the associated gain, have been reflected as discontinued operations in the Company’s consolidated statements of earnings as Net earnings from discontinued operations, net of taxes. Prior periods have been recast to reflect this presentation. As a result of the separation of Kenvue, Johnson & Johnson incurred separation costs of $986 million, $1,089 million and consulting expenses.
$67 million in the fiscal years 2023, 2022 and 2021, respectively, which are also included in Net earnings from discontinued operations, net of taxes. These costs were primarily related to external advisory, legal, accounting, contractor and other incremental costs directly related to separation activities. In the fiscal 2022, as part of the planned separation of the Company’s Consumer Health business, the Company recognized approximately $0.5 billion in net incremental tax costs. As of January 1, 2023, the assets and liabilities associated with the Consumer Health business were classified as assets and liabilities of discontinued operations in the consolidated balance sheets.
Details of Net Earnings from Discontinued Operations, net of taxes are as follows:
| | | | | | | | | | | | | | | | |
| | | | |
| (Dollars in Millions) | | | | 2023(1) | 2022 | 2021 |
| Sales to customers | | | | $10,036 | 14,953 | 15,035 |
| Cost of products sold | | | | 4,369 | 6,494 | 6,452 |
| Gross profit | | | | 5,667 | 8,459 | 8,583 |
| Selling, marketing and administrative expenses | | | | 3,085 | 4,519 | 4,542 |
| Research and development expense | | | | 258 | 468 | 437 |
| Interest Income | | | | (117) | — | — |
| Interest expense, net of portion capitalized | | | | 199 | — | — |
| Other (income) expense, net | | | | 1,092 | 1,060 | (37) |
| (Gain) on separation of Kenvue | | | | (20,984) | — | — |
| Restructuring | | | | — | 46 | 43 |
| Earnings from Discontinued Operations Before Provision for Taxes on Income | | | | 22,134 | 2,366 | 3,598 |
| Provision for taxes on income | | | | 307 | 795 | 521 |
| Net earnings from Discontinued Operations | | | | $21,827 | 1,571 | 3,077 |
(1)The Company ceased consolidating the results of the Consumer Health business on August 23, 2023, the date of the exchange offer, but continued to reflect any separation costs incurred as part of discontinued operations through the end of the fiscal fourth quarter.
The following table presents depreciation, amortization and capital expenditures of the discontinued operations related to Kenvue:
| | | | | | | | | | | |
| | |
| (Dollars in Millions) | 2023(1) | 2022 | 2021 |
| Depreciation and Amortization | $383 | 641 | 739 |
| Capital expenditures | $162 | 303 | 314 |
Details of assets and liabilities of discontinued operations were as follows:
| | | | | | |
| January 1, 2023 | |
| Assets | | |
| Cash and cash equivalents | $1,238 | |
| Accounts receivable trade, less allowances for doubtful accounts | 2,121 | |
| Inventories | 2,215 | |
| | |
| Prepaid expenses and other receivables | 256 | |
| Total current assets of discontinued operations | 5,830 | |
| Property, plant and equipment, net | 1,821 | |
| Intangible assets, net | 9,836 | |
| Goodwill | 9,184 | |
| Deferred taxes on income | 176 | |
| Other assets | 390 | |
| Total noncurrent assets of discontinued operations | $21,407 | |
| | |
| Liabilities | | |
| Loans and notes payable | $15 | |
| Accounts payable | 1,814 | |
| Accrued liabilities including accrued taxes on income | 644 | |
| Accrued rebates, returns and promotions | 838 | |
| Accrued compensation and employee related obligations | 279 | |
| Total current liabilities of discontinued operations | 3,590 | |
| Long-term debt | 2 | |
| Deferred taxes on income | 2,383 | |
| Employee related obligations | 225 | |
| | |
| Other liabilities | 291 | |
| Total noncurrent liabilities of discontinued operations | $2,901 | |
22. Selected quarterly financial data (unaudited)
Selected unaudited quarterly financial data has been recast for discontinued operations for the years 2023 and 2022 and is summarized below:
| | | | | | | | | | | | | | | | | | | | | | | | | | | | | |
| | 2023 | | 2022 |
| (Dollars in Millions Except Per Share Data) | First Quarter(1) | Second Quarter | Third Quarter(2) | Fourth Quarter(3) | | First Quarter(4) | Second Quarter | Third Quarter | Fourth Quarter(5) |
| Segment sales to customers | | | | | | | | | |
| Innovative Medicine | $13,413 | 13,731 | 13,893 | 13,722 | | 12,869 | 13,317 | 13,214 | 13,163 |
| MedTech | 7,481 | 7,788 | 7,458 | 7,673 | | 6,971 | 6,898 | 6,782 | 6,776 |
| Total sales | 20,894 | 21,519 | 21,351 | 21,395 | | 19,840 | 20,215 | 19,996 | 19,939 |
| Gross profit | 14,207 | 15,057 | 14,745 | 14,597 | | 13,822 | 13,893 | 13,824 | 13,855 |
| Earnings (Loss) before provision for taxes on income | (1,287) | 6,306 | 5,217 | 4,826 | | 5,203 | 5,144 | 5,172 | 3,840 |
| Net earnings (loss) from continuing operations | (491) | 5,376 | 4,309 | 4,132 | | 4,571 | 4,262 | 4,310 | 3,227 |
| Net earnings (loss) from discontinued operations, net of tax | 423 | (232) | 21,719 | (83) | | 578 | 552 | 148 | 293 |
| Net earnings (loss) | (68) | 5,144 | 26,028 | 4,049 | | 5,149 | 4,814 | 4,458 | 3,520 |
| Basic net earnings(loss) per share: | | | | | | | | | |
| Basic net earnings (loss) per share from continuing operations | (0.19) | 2.07 | 1.71 | 1.71 | | 1.74 | 1.62 | 1.64 | 1.24 |
| Basic net earnings (loss) per share from discontinued operations | 0.16 | (0.09) | 8.61 | (0.03) | | 0.22 | 0.21 | 0.06 | 0.11 |
| Basic net earnings (loss) per share | (0.03) | 1.98 | 10.32 | 1.68 | | 1.96 | 1.83 | 1.70 | 1.35 |
| Diluted net earnings (loss) per share: | | | | | | | | | |
| Diluted net earnings (loss) per share from continuing operations | (0.19) | 2.05 | 1.69 | 1.70 | | 1.71 | 1.60 | 1.62 | 1.22 |
| Diluted net earnings (loss) per share from discontinued operations | 0.16 | (0.09) | 8.52 | (0.03) | | 0.22 | 0.20 | 0.06 | 0.11 |
| Diluted net earnings (loss) per share | (0.03) | 1.96 | 10.21 | 1.67 | | 1.93 | 1.80 | 1.68 | 1.33 |
(1)The fiscal first quarter of 2023 includes a $6.9 billion charge related to talc matters.
(2)The fiscal third quarter of 2023 includes; a non-cash gain on the exchange offer of $21.0 billion that was recorded in Net earnings from discontinued operations, net of taxes; $0.6 billion related to the unfavorable change in the fair value of the retained stake in Kenvue and $0.4 billion related to the partial impairment of Idorsia convertible debt and the change in the fair value of the Idorsia equity securities held.
(3)The fourth quarter of 2023 includes favorable changes in the fair value of securities of $0.4 billion
(4)In the fiscal first quarter of 2022, the Company recorded an intangible asset impairment charge of approximately $0.6 billion related to an in-process research and development asset, bermekimab (JnJ-77474462).
(5)The fiscal fourth quarter of 2022 includes one-time COVID-19 Vaccine related exit costs of $0.8 billion.
Report of Independent Registered Public Accounting Firmindependent registered public accounting firm
To the Shareholders and Board of Directors and Shareholders of Johnson & Johnson
Opinions on the Financial Statementsfinancial statements and Internal Controlinternal control over Financial Reportingfinancial reporting
We have audited the accompanying consolidated balance sheets of Johnson & Johnson and its subsidiaries (the “Company”) as of December 31, 20172023 and January 1, 2017,2023, and the related consolidated statements of earnings, of comprehensive income, of equity and of cash flows for each of the three fiscal years in the period ended December 31, 2017,2023, including the related notes (collectively referred to as the “consolidated financial statements”). We also have audited the Company's internal control over financial reporting as of December 31, 2017,2023, based on criteria established in Internal Control - Integrated Framework (2013) issued by the Committee of Sponsoring Organizations of the Treadway Commission (COSO).
In our opinion, the consolidated financial statements referred to above present fairly, in all material respects, the financial position of the Company as of December 31, 20172023 and January 1, 2017, 2023, and the results of itsoperations and itscash flows for each of the three fiscal years in the period ended December 31, 20172023 in conformity with accounting principles generally accepted in the United States of America. Also in our opinion, the Company maintained, in all material respects, effective internal control over financial reporting as ofDecember 31, 20172023, based on criteria established in Internal Control - Integrated Framework(2013)issued by the COSO.
Change in Accounting Principle
As discussed in Note 1 to the consolidated financial statements, the Company changed the manner in which it accounts for and presents certain elements of share based payments in 2016.
Basis for Opinions
opinions
The Company's management is responsible for these consolidated financial statements, for maintaining effective internal control over financial reporting, and for its assessment of the effectiveness of internal control over financial reporting, included in the accompanying Management'sManagement’s Report on Internal Control overOver Financial Reporting. Our responsibility is to express opinions on the Company’s consolidated financial statements and on the Company's internal control over financial reporting based on our audits. We are a public accounting firm registered with the Public Company Accounting Oversight Board (United States) ("PCAOB")(PCAOB) and are required to be independent with respect to the Company in accordance with the U.S. federal securities laws and the applicable rules and regulations of the Securities and Exchange Commission and the PCAOB.
We conducted our audits in accordance with the standards of the PCAOB. Those standards require that we plan and perform the audits to obtain reasonable assurance about whether the consolidated financial statements are free of material misstatement, whether due to error or fraud, and whether effective internal control over financial reporting was maintained in all material respects.
Our audits of the consolidated financial statements included performing procedures to assess the risks of material misstatement of the consolidated financial statements, whether due to error or fraud, and performing procedures that respond to those risks. Such procedures included examining, on a test basis, evidence regarding the amounts and disclosures in the consolidated financial statements. Our audits also included evaluating the accounting principles used and significant estimates made by management, as well as evaluating the overall presentation of the consolidated financial statements. Our audit of internal control over financial reporting included obtaining an understanding of internal control over financial reporting, assessing the risk that a material weakness exists, and testing and evaluating the design and operating effectiveness of internal control based on the assessed risk. Our audits also included performing such other procedures as we considered necessary in the circumstances. We believe that our audits provide a reasonable basis for our opinions.
As described in Management’s Report on Internal Control over Financial Reporting, management has excluded Abbott Medical OpticsDefinition and Actelion Ltd. from its assessmentlimitations of internal control over financial reporting as of December 31, 2017, because they were acquired by the Company in purchase business combinations during 2017. We have also excluded Abbott Medical Optics and Actelion Ltd. from our audit of internal control over financial reporting. Abbott Medical Optics and Actelion Ltd. are wholly-owned subsidiaries whose total assets and total revenues excluded from management’s assessment and our audit of internal control over financial reporting represent approximately 1% and 1% of total assets, respectively and approximately 1% and 2% of total revenues, respectively, of the related consolidated financial statement amounts as of and for the year ended December 31, 2017.
Definition and Limitations of Internal Control over Financial Reporting
A company’s internal control over financial reporting is a process designed to provide reasonable assurance regarding the reliability of financial reporting and the preparation of financial statements for external purposes in accordance with generally accepted accounting principles. A company’s internal control over financial reporting includes those policies and procedures that (i) pertain to the maintenance of records that, in reasonable detail, accurately and fairly reflect the transactions and dispositions of the assets of the company; (ii) provide reasonable assurance that transactions are recorded as necessary to permit preparation of financial statements in accordance with generally accepted accounting principles, and that receipts and expenditures of the company are being made only in accordance with authorizations of management and directors of the company; and (iii) provide reasonable assurance regarding prevention or timely detection of unauthorized acquisition, use, or disposition of the company’s assets that could have a material effect on the financial statements.
Because of its inherent limitations, internal control over financial reporting may not prevent or detect misstatements. Also, projections of any evaluation of effectiveness to future periods are subject to the risk that controls may become inadequate because of changes in conditions, or that the degree of compliance with the policies or procedures may deteriorate.
Critical audit matters
The critical audit matters communicated below are matters arising from the current period audit of the consolidated financial statements that were communicated or required to be communicated to the audit committee and that (i) relate to accounts or disclosures that are material to the consolidated financial statements and (ii) involved our especially challenging, subjective, or complex judgments. The communication of critical audit matters does not alter in any way our opinion on the consolidated financial statements, taken as a whole, and we are not, by communicating the critical audit matters below, providing separate opinions on the critical audit matters or on the accounts or disclosures to which they relate.
U.S. pharmaceutical rebate reserves – managed care, medicare and medicaid
As described in Note 1 to the consolidated financial statements, the Company recognizes revenue from product sales when obligations under the terms of a contract with the customer are satisfied. Rebates and discounts provided to customers are accounted for as variable consideration and recorded as a reduction in sales. The liability for such rebates and discounts is recognized within Accrued Rebates, Returns, and Promotions on the consolidated balance sheet. A significant portion of the liability related to rebates is from the sale of pharmaceutical goods within the U.S., primarily the Managed Care, Medicare and Medicaid programs, which amounted to $11.5 billion as of December 31, 2023. For significant rebate programs, which include the U.S. Managed Care, Medicare and Medicaid rebate programs, rebates and discounts estimated by management are based on contractual terms, historical experience, patient outcomes, trend analysis, and projected market conditions in the U.S. pharmaceutical market.
The principal considerations for our determination that performing procedures relating to U.S. pharmaceutical rebate reserves - Managed Care, Medicare and Medicaid is a critical audit matter are the significant judgment by management due to the significant measurement uncertainty involved in developing these reserves and the high degree of auditor judgment, subjectivity and audit effort in performing procedures and evaluating the assumptions related to contractual terms, historical experience, patient outcomes, trend analysis, and projected market conditions in the U.S. pharmaceutical market.
Addressing the matter involved performing procedures and evaluating audit evidence in connection with forming our overall opinion on the consolidated financial statements. These procedures included testing the effectiveness of controls relating to U.S. pharmaceutical rebate reserves - Managed Care, Medicare and Medicaid, including controls over the assumptions used to estimate these rebates. These procedures also included, among others, (i) developing an independent estimate of the rebates by utilizing third party information on price and market conditions in the U.S. pharmaceutical market, the terms of the specific rebate programs, and the historical experience and trend analysis of actual rebate claims paid; (ii) testing rebate claims processed by the Company, including evaluating those claims for consistency with the contractual and mandated terms of the Company’s rebate arrangements; and (iii) comparing the independent estimates to management’s estimates.
Litigation contingencies – talc
As described in Notes 1 and 19 to the consolidated financial statements, the Company records accruals for loss contingencies associated with legal matters, including talc, when it is probable that a liability will be incurred and the amount of the loss can be reasonably estimated. To the extent adverse awards, judgments, or verdicts have been rendered against the Company, management does not record an accrual until a loss is determined to be probable and can be reasonably estimated. For these matters, management is unable to estimate the possible loss or range of loss beyond the amounts accrued. Amounts accrued for legal contingencies often result from a complex series of judgments about future events and uncertainties that rely heavily on estimates and assumptions including timing of related payments. The ability to make such estimates and judgments can be affected by various factors, including, among other things, whether damages sought in the proceedings are unsubstantiated or indeterminate; scientific and legal discovery has not commenced or is not complete; proceedings are in early stages; matters present legal uncertainties; there are significant facts in dispute; procedural or jurisdictional issues; the uncertainty and unpredictability of the number of potential claims; ability to achieve comprehensive multi-party settlements; complexity of related cross-claims and counterclaims; and/or there are numerous parties involved. Management continues to believe that the Company has strong legal grounds to contest the talc verdicts it has appealed. Notwithstanding management’s confidence in the safety of the Company’s talc products, in certain circumstances the Company has settled cases. The Company has recognized a total provision of approximately $9 billion, of which approximately one-third is recorded as a current liability and which encompasses actual and contemplated settlements. The recorded amount remains the Company's best estimate of probable loss after the dismissal. The parties have not yet reached a full resolution of all talc matters and the Company is unable to estimate the possible loss or range of loss beyond the remaining amount accrued.
The principal considerations for our determination that performing procedures relating to the talc litigation is a critical audit matter are the significant judgment by management when assessing the likelihood of a loss being incurred, when determining whether a reasonable estimate of the loss or range of loss for the future and existing talc claims can be made, and when determining the timing of any settlement payments, which in turn led to a high degree of auditor judgment, subjectivity and effort in performing procedures and evaluating management’s assessment of the loss contingencies associated with this litigation.
Addressing the matter involved performing procedures and evaluating audit evidence in connection with forming our overall opinion on the consolidated financial statements. These procedures included testing the effectiveness of controls relating to management’s evaluation of the talc litigation, including controls over determining whether a loss is probable and whether the amount of loss can be reasonably estimated, as well as financial statement disclosures. These procedures also included, among others, (i) gaining an understanding of the Company’s process around the accounting and reporting for the talc litigation; (ii) obtaining and evaluating certain executed settlement agreements related to the talc litigation (iii) discussing the status of significant known actual and potential litigation and settlements activity with the Company’s in-house legal counsel, as well as external counsel when deemed necessary; (iv) obtaining and evaluating the letters of audit inquiry with internal and external legal counsel for significant litigation; (v) evaluating the reasonableness of management’s assessment regarding whether an unfavorable outcome is reasonably possible or probable and reasonably estimable; and (vi) evaluating the sufficiency of the Company’s litigation contingencies disclosures.
/s/ PricewaterhouseCoopers LLP
Florham Park, New Jersey
February 21, 2018
16, 2024
We have served as the Company’s auditor since at least 1920. We have not determinedbeen able to determine the specific year we began serving as auditor of the Company.
Management’s Reportreport on Internal Control Over Financial Reporting
internal control over financial reporting
Under Section 404 of the Sarbanes-Oxley Act of 2002, management is required to assess the effectiveness of the Company’s internal control over financial reporting as of the end of each fiscal year and report, based on that assessment, whether the Company’s internal control over financial reporting is effective.
Management of the Company is responsible for establishing and maintaining adequate internal control over financial reporting. The Company’s internal control over financial reporting is designed to provide reasonable assurance as to the reliability of the Company’s financial reporting and the preparation of external financial statements in accordance with generally accepted accounting principles.
Internal controls over financial reporting, no matter how well designed, have inherent limitations. Therefore, internal control over financial reporting determined to be effective can provide only reasonable assurance with respect to financial statement preparation and may not prevent or detect all misstatements. Moreover, projections of any evaluation of effectiveness to future periods are subject to the risk that controls may become inadequate because of changes in conditions, or that the degree of compliance with the policies or procedures may deteriorate.
The Company’s management has assessed the effectiveness of the Company’s internal control over financial reporting as of December 31, 2017.2023. In making this assessment, the Company used the criteria established by the Committee of Sponsoring Organizations of the Treadway Commission (COSO) in “Internal Control-Integrated Framework (2013).” These criteria are in the areas of control environment, risk assessment, control activities, information and communication, and monitoring. The Company’s assessment included extensive documenting, evaluating and testing the design and operating effectiveness of its internal controls over financial reporting.
The Company acquired Abbott Medical Optics (AMO), a wholly-owned subsidiary of Abbott Laboratories and Actelion Ltd. and its consolidated subsidiaries (Actelion) in February and June 2017, respectively. Actelion's total assets, excluding intangible assets and goodwill, and total revenues represented approximately 1% and 2%, respectively, of the related consolidated financial statements as of and for the period ended December 31, 2017. AMO's total assets, excluding intangible assets and goodwill, and total revenues represented approximately 1% and 1%, respectively, of the related consolidated financial statements as of and for the period ended December 31, 2017. As the acquisitions occurred in the fiscal year 2017, the scope of the Company's assessment of the design and effectiveness of internal control over financial reporting for the fiscal year 2017 excluded the above mentioned acquisitions. This exclusion is in accordance with the SEC's general guidance that an assessment of a recently acquired business may be omitted from the scope in the year of acquisition.
Based on the Company’s processes and assessment, as described above, management has concluded that, as of December 31, 2017,2023, the Company’s internal control over financial reporting was effective.
The effectiveness of the Company’s internal control over financial reporting as of December 31, 20172023 has been audited by PricewaterhouseCoopers LLP, an independent registered public accounting firm, as stated in their report, which appears herein.
| | | | | |
/s/ J. Duato | /s/ J. J. Wolk |
| Joaquin Duato | | Joseph J. Wolk |
/s/ Alex Gorsky | | /s/ Dominic J. Caruso |
Alex Gorsky | | Dominic J. Caruso |
| Chairman, Board of Directors | | Executive Vice President, Chief Financial Officer |
| Chief Executive Officer | |
Shareholder Return Performance Graphsreturn performance graphs
Set forth below are line graphs comparing the cumulative total shareholder return on the Company’s Common Stock for periods of five years and ten years ending December 31, 2017,2023, against the cumulative total return of the Standard & Poor’s 500 Stock Index, the Standard & Poor’s Pharmaceutical Index and the Standard & Poor’s Health CareHealthcare Equipment Index. The graphs and tables assume that $100 was invested on December 31, 20122018 and December 31, 20072013 in each of the Company’s Common Stock, the Standard & Poor’s 500 Stock Index, the Standard & Poor’s Pharmaceutical Index and the Standard & Poor’s Health CareHealthcare Equipment Index and that all dividends were reinvested.
5 Year Shareholder Return Performance J&J vs. Indices
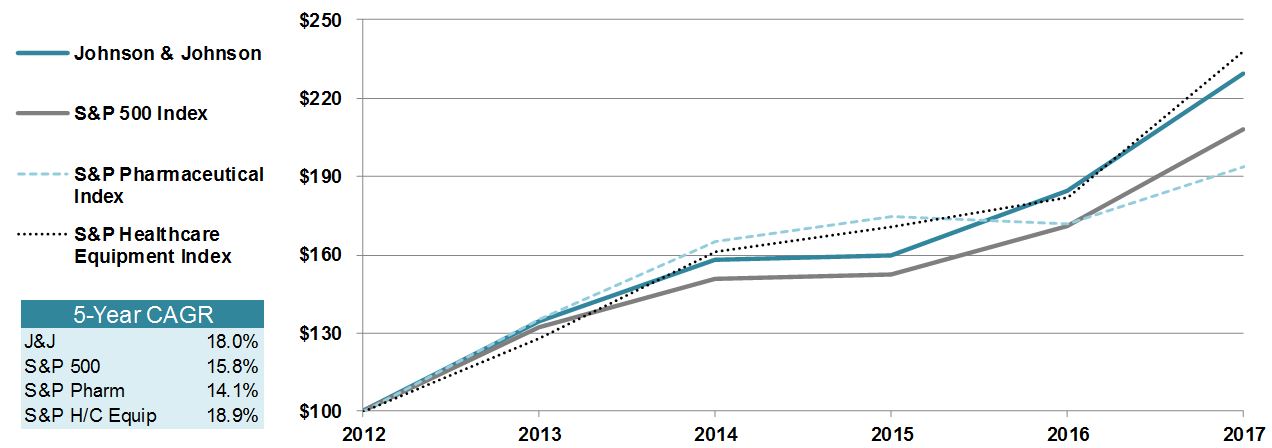
| | | | | |
| Johnson & Johnson |
| S&P 500 Index |
| S&P Pharmaceutical Index |
| S&P Healthcare Equipment Index |
| | | | | |
| 5-year CAGR |
| J&J | 6.8 | % |
| S&P 500 | 15.7 | % |
| S&P Pharm | 11.1 | % |
| S&P H/C Equip | 9.9 | % |
| | | | | | | | | | | | | | | | | | | | | | | | | | | | | | | | | | | |
| 2018 | | 2019 | | 2020 | | 2021 | | 2022 | | 2023 |
| Johnson & Johnson | $100.00 | | $116.21 | | $128.82 | | $143.57 | | $152.14 | | $139.05 |
| S&P 500 Index | $100.00 | | $131.47 | | $155.65 | | $200.29 | | $163.98 | | $207.04 |
| S&P Pharmaceutical Index | $100.00 | | $115.09 | | $123.75 | | $155.62 | | $168.77 | | $169.33 |
| S&P Healthcare Equipment Index | $100.00 | | $129.32 | | $152.12 | | $181.56 | | $147.32 | | $160.64 |
|
| | | | | | |
| | 2012 | 2013 | 2014 | 2015 | 2016 | 2017 |
| Johnson & Johnson | $100.00 | $134.62 | $157.95 | $159.78 | $184.26 | $229.23 |
| S&P 500 Index | $100.00 | $132.37 | $150.48 | $152.55 | $170.78 | $208.05 |
| S&P Pharmaceutical Index | $100.00 | $135.23 | $165.27 | $174.84 | $172.10 | $193.74 |
| S&P Healthcare Equipment Index | $100.00 | $127.69 | $161.24 | $170.88 | $181.96 | $238.17 |
10 Year Shareholder Return Performance J&J vs. Indices
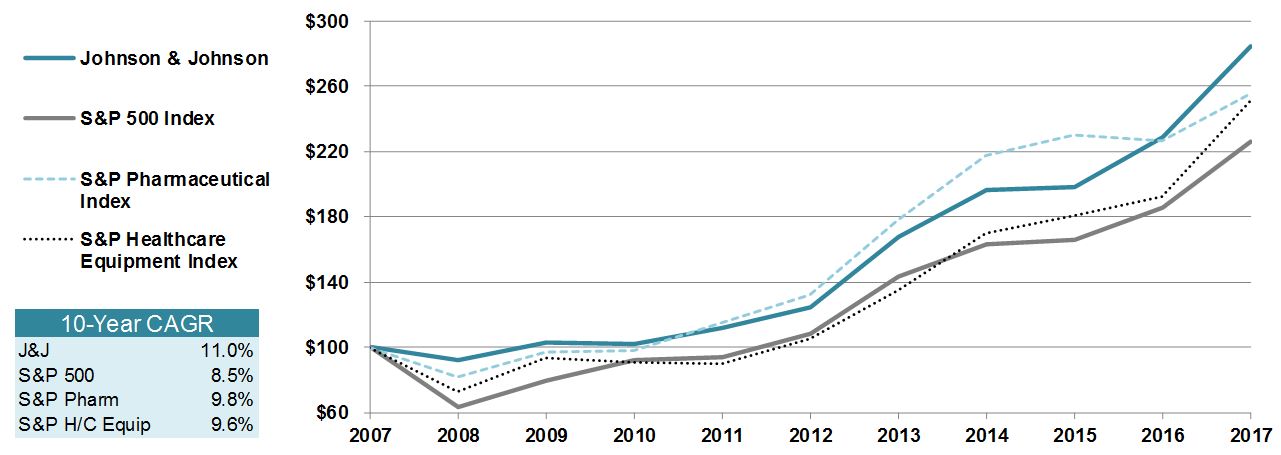
| | | | | |
| Johnson & Johnson |
| S&P 500 Index |
| S&P Pharmaceutical Index |
| S&P Healthcare Equipment Index |
| | | | | |
| 10-year CAGR |
| J&J | 8.4 | % |
| S&P 500 | 12.0 | % |
| S&P Pharm | 10.1 | % |
| S&P H/C Equip | 13.3 | % |
| | | | | | | | | | | | | | | | | | | | | | | | | | | | | | | | | | | |
| 2013 | 2014 | 2015 | 2016 | 2017 | 2018 | 2019 | 2020 | 2021 | 2022 | 2023 |
| Johnson & Johnson | $100.00 | $117.34 | $118.69 | $136.88 | $170.29 | $161.54 | $187.73 | $208.10 | $231.92 | $245.76 | $224.62 |
| S&P 500 Index | $100.00 | $113.67 | $115.23 | $129.00 | $157.15 | $150.24 | $197.53 | $233.85 | $300.91 | $246.37 | $311.06 |
| S&P Pharmaceutical Index | $100.00 | $122.22 | $129.29 | $127.27 | $143.27 | $154.86 | $178.23 | $191.64 | $240.99 | $261.37 | $262.23 |
| S&P Healthcare Equipment Index | $100.00 | $126.28 | $133.82 | $142.50 | $186.53 | $216.82 | $280.39 | $329.83 | $393.66 | $319.42 | $348.30 |
|
| | | | | | | | | | | |
| | 2007 | 2008 | 2009 | 2010 | 2011 | 2012 | 2013 | 2014 | 2015 | 2016 | 2017 |
| Johnson & Johnson | $100.00 | $92.23 | $102.63 | $102.03 | $112.13 | $124.27 | $167.28 | $196.28 | $198.55 | $228.97 | $284.85 |
| S&P 500 Index | $100.00 | $63.00 | $79.66 | $91.66 | $93.59 | $108.56 | $143.70 | $163.36 | $165.60 | $185.40 | $225.85 |
| S&P Pharmaceutical Index | $100.00 | $81.80 | $97.03 | $97.78 | $115.15 | $131.76 | $178.18 | $217.77 | $230.37 | $226.77 | $255.27 |
| S&P Healthcare Equipment Index | $100.00 | $72.36 | $93.19 | $90.66 | $89.94 | $105.47 | $134.67 | $170.06 | $180.22 | $191.91 | $251.20 |
Item 9. Changes in and disagreements with accountants on accounting and financial disclosure
| |
Item 9. | CHANGES IN AND DISAGREEMENTS WITH ACCOUNTANTS ON ACCOUNTING AND FINANCIAL DISCLOSURE |
Not applicable.
| |
Item 9A. | CONTROLS AND PROCEDURES |
Disclosure Controls and Procedures.procedures
Disclosure controls and procedures. At the end of the period covered by this Report, the Company evaluated the effectiveness of the design and operation of its disclosure controls and procedures. The Company’s disclosure controls and procedures are designed to ensure that information required to be disclosed by the Company in the reports that it files or submits under the Exchange Act is recorded, processed, summarized and reported within the time periods specified in the SEC’s rules and forms. Disclosure controls and procedures include, without limitation, controls and procedures designed to ensure that information required to be disclosed by the Company in the reports that it files or submits under the Exchange Act is accumulated and communicated to the Company’s management, including its principal executive and principal financial officers, or persons performing similar functions, as appropriate to allow timely decisions regarding required disclosure. Alex Gorsky,Joaquin Duato, Chairman and Chief Executive Officer, and DominicJoseph J. Caruso,Wolk, Executive Vice President, Chief Financial Officer, reviewed and participated in this evaluation. Based on this evaluation, Messrs. GorskyDuato and CarusoWolk concluded that, as of the end of the period covered by this Report, the Company’s disclosure controls and procedures were effectiveeffective.
Reports on Internal Control Over Financial Reporting.internal control over financial reporting. The information called for by this item is incorporated herein by reference to "Management’s ReportManagement’s report on Internal Control Over Financial Reporting",internal control over financial reporting, and the attestation regarding internal controls over financial reporting included in the "Reportreport of Independent Registered Public Accounting Firm"independent registered public accounting firm included in Item 8 of this Report.
Changes in Internal Control Over Financial Reporting.internal control over financial reporting. During the fiscal quarter ended December 31, 2017,2023, there were no changes in the Company’s internal control over financial reporting identified in connection with the evaluation required under Rules 13a-15 and 15d-15 under the Exchange Act that have materially affected, or are reasonably likely to materially affect, the Company’s internal control over financial reporting. The Company continues to monitor and assess the effectiveness of the design and operation of its disclosure controls and procedures.
The Company is implementing a multi-year, enterprise-wide initiative to integrate, simplify and standardize processes and systems for the human resources, information technology, procurement, supply chain and finance functions. These are enhancements to support the growth of the Company’s financial shared service capabilities and standardize financial systems. This initiative is not in response to any identified deficiency or weakness in the Company’s internal control over financial reporting. In response to this initiative, the Company has and will continue to align and streamline the design and operation of its financial control environment.
| |
Item 9B. | OTHER INFORMATION |
Item 9B. Other information
Securities trading plans of Directors and Executive Officers. During the fiscal fourth quarter of 2023, none of our directors or officers (as defined in Rule 16a-1(f) of the Exchange Act) informed us of the adoption or termination of a “Rule 10b5-1 trading arrangement” or “non-Rule 10b5-1 trading arrangement,” each as defined in Item 408 of Regulation S-K.
Item 9C. Disclosure regarding foreign jurisdictions that prevent inspections
Not applicable.
Part III
| |
Item 10. | DIRECTORS, EXECUTIVE OFFICERS AND CORPORATE GOVERNANCE |
Item 10. Directors, executive officers and corporate governance
The information called for by this item is incorporated herein by reference to the discussion of the Audit Committee under the caption “ItemItem 1. Election of Directors - Board Committees”;committees; and the material under the captions “ItemItem 1. Election of Directors”Directors and, “Stock Ownership and Section 16 Compliance –if applicable, Delinquent Section 16(a) Beneficial Ownership Reporting Compliance”reporting in the Proxy Statement; and the material under the caption “Executive Officers of the Registrant” in Part I of this Report.
The Company’s Code of Business Conduct, which covers all employees (including the Chief Executive Officer, Chief Financial Officer and Controller), meets the requirements of the SEC rules promulgated under Section 406 of the Sarbanes-Oxley Act of 2002. The Code of Business Conduct is available on the Company’s website at www.jnj.com/code-of-business-conduct, and copies are available to shareholders without charge upon written request to the Secretary at the Company’s principal executive offices. Any substantive amendment to the Code of Business Conduct or any waiver of the Code granted to the Chief Executive Officer, the Chief Financial Officer or the Controller will be posted on the Company’s website at www.investor.jnj.com/gov.cfmwww.jnj.com/code-of-business-conduct within five business days (and retained on the website for at least one year).
In addition, the Company has adopted a Code of Business Conduct & Ethics for Members of the Board of Directors and Executive Officers. The Code of Business Conduct & Ethics for Members of the Board of Directors and Executive Officers is available on the Company’s website at www.investor.jnj.com/gov/boardconduct.cfmgovernance/corporate-governance-overview/code-of-business-conduct--ethics, and copies are available to shareholders without charge upon written request to the Secretary at the Company’s principal executive offices. Any substantive amendment to the Code or any waiver of the Code granted to any member of the Board of Directors or any executive officer will be posted
on the Company’s website at www.investor.jnj.com/gov.cfmgovernance/corporate-governance-overview/code-of-business-conduct--ethics within five business days (and retained on the website for at least one year).
| |
Item 11. | EXECUTIVE COMPENSATION |
Item 11. Executive compensation
The information called for by this item is incorporated herein by reference to the material under the captions “ItemItem 1. Election of Directors – Director compensation, and Item 2. Compensation” “Compensation Committee Report,” “Compensation Discussionreport, Compensation discussion and Analysis”analysis and “Executive Compensation Tables”Executive compensation tables in the Proxy Statement.
The material incorporated herein by reference to the material under the caption “CompensationCompensation Committee Report”report in the Proxy Statement shall be deemed furnished, and not filed, in this Report and shall not be deemed incorporated by reference into any filing under the Securities Act of 1933, as amended, or the Securities Exchange Act of 1934, as amended, as a result of this furnishing, except to the extent that the Company specifically incorporates it by reference.
| |
Item 12. | SECURITY OWNERSHIP OF CERTAIN BENEFICIAL OWNERS AND MANAGEMENT AND RELATED STOCKHOLDER MATTERS |
Item 12. Security ownership of certain beneficial owners and management and related stockholder matters
The information called for by this item is incorporated herein by reference to the material under the caption “ItemItem 1. Stock Ownership and Section 16 Compliance”ownership in the Proxy Statement; and Note 17 “Common Stock, Stock Option Plans16 Common stock, stock option plans and Stock Compensation Agreements”stock compensation agreements of the Notes to Consolidated Financial Statements in Item 8 of this Report.
Equity Compensation Plan Informationcompensation plan information
The following table provides certain information as of December 31, 20172023 concerning the shares of the Company’s Common Stock that may be issued under existing equity compensation plans. | | | | | | | | | | | |
| Plan Category | Number of
Securities to
be Issued Upon
Exercise of
Outstanding
Options and Rights | Weighted Average
Exercise Price of
Outstanding Options
and Rights | Number of Securities Remaining Available for Future Issuance Under Equity Compensation Plans(2)(3) |
Equity Compensation Plans Approved by Security Holders(1) | 127,211,785 | $123.41 | 130,112,007 |
| Equity Compensation Plans Not Approved by Security Holders | — | — | — |
| Total | 127,211,785 | $123.41 | 130,112,007 |
(1)Included in this category are the following equity compensation plans which have been approved by the Company’s shareholders: 2012 Long-Term Incentive Plan and 2022 Long-Term Incentive Plan.
(2)This column excludes shares reflected under the column “Number of Securities to be Issued Upon Exercise of Outstanding Options and Rights.”
(3)The 2012 Long-Term Incentive Plan expired April 26, 2022. All options and restricted shares granted subsequent to that date were under the 2022 Long-Term Incentive Plan.
Item 13. Certain relationships and related transactions, and director independence
|
| | | | | | | | | |
| Plan Category | Number of Securities to be Issued Upon Exercise of Outstanding Options and Rights | | Weighted Average Exercise Price of Outstanding Options and Rights | | Number of Securities Remaining Available for Future Issuance Under Equity Compensation Plans(2)(3) |
Equity Compensation Plans Approved by Security Holders(1) | 134,091,342 |
| |
| $75.11 |
| | 389,083,761 |
|
| Equity Compensation Plans Not Approved by Security Holders | - |
| | - |
| | - |
|
| Total | 134,091,342 |
| |
| $75.11 |
| | 389,083,761 |
|
| |
(1)
| Included in this category are the following equity compensation plans which have been approved by the Company’s shareholders: 2005 Long-Term Incentive Plan and 2012 Long-Term Incentive Plan. |
| |
(2)
| This column excludes shares reflected under the column “Number of Securities to be Issued Upon Exercise of Outstanding Options and Rights.” |
| |
(3)
| The 2005 Long-Term Incentive Plan expired April 26, 2012. All options and restricted shares granted subsequent to that date were under the 2012 Long-Term Incentive Plan. |
| |
Item 13. | CERTAIN RELATIONSHIPS AND RELATED TRANSACTIONS, AND DIRECTOR INDEPENDENCE |
The information called for by this item is incorporated herein by reference to the material under the captions “ItemItem 1. Election of Directors - Related person transactions & Director Independence” and “Related Person Transactions”independence in the Proxy Statement.
| |
Item 14. | PRINCIPAL ACCOUNTANT FEES AND SERVICES |
Item 14. Principal accountant fees and services
The information called for by this item is incorporated herein by reference to the material under the caption “ItemItem 3. Ratification of Appointmentappointment of Independent Registered Public Accounting Firm”independent registered public accounting firm in the Proxy Statement.
PARTPart IV
| |
Item 15. | EXHIBITS AND FINANCIAL STATEMENT SCHEDULES |
Item 15. Exhibits and financial statement schedules
The following documents are filed as part of this report:
1.Financial Statements
Consolidated Balance Sheetsbalance sheets at end of Fiscal Years 2017fiscal years 2023 and 20162022
Consolidated Statementsstatements of Earningsearnings for fiscal years 2023, 2022 and 2021
Consolidated statements of comprehensive income for Fiscal Years 2017, 20162023, 2022 and 2015 2021
Consolidated Statementsstatements of Comprehensive Incomeequity for Fiscal Years 2017, 2016fiscal years 2023, 2022 and 20152021
Consolidated Statementsstatements of Equitycash flows for Fiscal Years 2017, 2016fiscal years 2023, 2022 and 2015
Consolidated Statements of Cash Flows for Fiscal Years 2017, 2016 and 20152021
Notes to Consolidated Financial Statements
Report of Independent Registered Public Accounting Firmindependent registered public accounting firm
All schedules are omitted because they are not applicable or the required information is included in the financial statements or notes.
2.Exhibits Requiredrequired to be Filedfiled by Itemitem 60l of Regulationregulation S-K
The information called for by this item is incorporated herein by reference to the Exhibit Index in this Report.
Item 16. FORMForm 10-K SUMMARYsummary
Registrants may voluntarily include a summary of information required by Form 10-K under this Item 16. The Company has elected not to include such summary information.
SIGNATURESSignatures
Pursuant to the requirements of Section 13 of the Securities Exchange Act of 1934, the registrant has duly caused this Report to be signed on its behalf by the undersigned, thereunto duly authorized.
Date: February 21, 201816, 2024
| | |
|
| JOHNSON & JOHNSON |
| (Registrant) |
| | | | | |
| By | /s/ J. Duato |
| |
By | /s/ A. Gorsky |
| A. Gorsky,J. Duato, Chairman Board of Directors,
the Board and Chief Executive Officer |
Pursuant to the requirements of the Securities Exchange Act of 1934, this report has been signed below by the following persons on behalf of the registrant and in the capacities and on the dates indicated. | | | | | | | | |
| Signature | Title | Date |
| | |
/s/ J. Duato | Chairman of the Board | | | February 16, 2024 |
SignatureJ. Duato | | Title | | Date |
| | | | |
/s/ A. Gorsky | | Chairman, Board of Directors | | February 21, 2018 |
A. Gorsky | | Chief Executive Officer
(Principal Executive Officer)
| |
| | |
/s/ J. J. Wolk | | |
| | | | |
/s/ D. J. Caruso | | Chief Financial Officer | | February 21, 201816, 2024 |
D. J. CarusoJ. Wolk | | (Principal Financial Officer) | | |
| | | | |
/s/ R. A. KapustaJ. Decker Jr. | | Controller and Chief Accounting Officer | | February 21, 201816, 2024 |
R. A. KapustaJ. Decker Jr. | | (Principal Accounting Officer) | |
| | |
/s/ D. Adamczyk | Director | February 16, 2024 |
| D. Adamczyk | | | | |
| | |
/s/ M. C. Beckerle | Director | Director | | February 21, 201816, 2024 |
| M. C. Beckerle | | | | |
| | | | |
/s/ D. S. Davis | Director | Director | | February 21, 201816, 2024 |
| D. S. Davis | | |
| | |
/s/ J. A. Doudna | Director | | February 16, 2024 |
| J. A. Doudna | | | | |
/s/ I. E. L. Davis | | Director | | February 21, 2018 |
I. E. L. Davis | | | | |
| | | | | | | | |
| Signature | Title | Date |
| | |
/s/ M. A. Hewson | Director | | | February 16, 2024 |
SignatureM. A. Hewson | | |
| | |
/s/ P. A. Johnson | TitleDirector | | DateFebruary 16, 2024 |
| P. A. Johnson | | |
| | |
/s/ H. Joly | Director | | February 16, 2024 |
| H. Joly | | |
| | |
/s/ M. B. McClellan | Director | Director | | February 21, 2018
16, 2024 |
| M. B. McClellan | | | | |
| | | | |
/s/ A. M. Mulcahy | Director | Director | | February 21, 2018
16, 2024 |
| A. M. Mulcahy | | |
| | |
/s/ M. A. Weinberger | Director | | February 16, 2024 |
| M. A. Weinberger | | |
| | |
/s/ N. Y. West | Director | | February 16, 2024 |
| N. Y. West | | |
| | |
/s/ W. D. PerezE. A. Woods | Director | Director | | February 21, 2018
16, 2024 |
W. D. PerezE. A. Woods | | | | |
| | | | |
/s/ C. Prince | | Director | | February 21, 2018
|
C. Prince | | | | |
| | | | |
/s/ A. E. Washington | | Director | | February 21, 2018
|
A. E. Washington | | | | |
| | | | |
/s/ R. A. Williams | | Director | | February 21, 2018
|
R. A. Williams | | | | |
EXHIBIT INDEX
Exhibit index
| | | | | | | | |
| Reg. S-K | | |
| Exhibit Table | | Description |
Reg. S-K | | |
Exhibit Table | | Description |
| Item No. | | of Exhibit |
| | Agreement and Plan of Merger, dated as of October 31, 2022, by and among Johnson & Johnson, Athos Merger Sub, Inc. and ABIOMED, Inc. – Incorporated herein by reference to Exhibit 2.1 of the Registrant’s Form 8-K Current Report filed November 1, 2022.† |
| | Restated Certificate of Incorporation effective February 19, 2016 — Incorporated herein by reference to Exhibit 3(i) of the Registrant’s Form 10-K Annual Report for the fiscal year ended January 3, 2016. |
| | By-LawsCertificate of Amendment to the Company, as amendedCertificate of Incorporation of Johnson & Johnson effective January 26, 2016April 30, 2020 — Incorporated herein by reference to Exhibit 3.1 of the Registrant's Form 8-K Current Report filed April 29, 2020. |
| | By-Laws of the Company, as amended effective June 9, 2020 — Incorporated herein by reference to Exhibit 3.1 of the Registrant’s Form 8-K Current Report filed January 26, 2016.June 10, 2020. |
| 4(a) | | Upon the request of the Securities and Exchange Commission, the Registrant will furnish a copy of all instruments defining the rights of holders of long-term debt of the Registrant. |
| | 2005 Long-Term Incentive PlanDescription of Securities Registered Pursuant to Section 12 of the Securities Exchange Act of 1934 — Incorporated herein by reference to Exhibit 4 of the Registrant’s S-8 Registration Statement filed with the Commission on May 10, 2005 (file no. 333-124785).* |
| | Form of Stock Option Certificate under the 2005 Long-Term Incentive Plan — Incorporated herein by reference to Exhibit 10.14.1 of the Registrant’s Form 8-K Current Report filed January 13, 2012.*August 12, 2020. |
| | 2012 Long-Term Incentive Plan — Incorporated herein by reference to Appendix A of the Registrant’s Proxy Statement filed with the Commission on March 15, 2017 .*2012.* |
| | Form of Stock Option Certificate under the 2012 Long-Term Incentive Plan — Incorporated herein by reference to Exhibit 10.2 of the Registrant’s Form 10-Q Quarterly Report for the quarter ended April 1, 2012.* |
| | Form of Restricted Share Unit Certificate andunder the 2012 Long-Term Incentive Plan — Incorporated herein by reference to Exhibit 10.3 of the Registrant’s Form 10-Q Quarterly Report for the quarter ended April 1, 2012.* |
| | Form of Performance Share Unit Certificate under the 2012 Long-Term Incentive Plan — Incorporated herein by reference to Exhibits 10.2, 10.3 andExhibit 10.4 of the Registrant’s Form 10-Q Quarterly Report filed May 7,for the quarter ended April 1, 2012.* |
| | Johnson & Johnson ExecutiveGlobal NonQualified Stock Option Award Agreement under the 2012 Long-Term Incentive Plan (as amended) — Incorporated herein by reference to Exhibit 10(f)10.1 of the Registrant’s Form 10-K Annual10-Q Quarterly Report for the fiscal yearquarter ended December 31, 2000.April 1, 2018.* |
| | Global Restricted Share Unit Award Agreement under the 2012 Long-Term Incentive Plan — Incorporated herein by reference to Exhibit 10.2 of the Registrant’s Form 10-Q Quarterly Report for the quarter ended April 1, 2018.* |
| | Global Performance Share Unit Award Agreement under the 2012 Long-Term Incentive Plan — Incorporated herein by reference to Exhibit 10.3 of the Registrant’s Form 10-Q Quarterly Report for the quarter ended April 1, 2018.* |
| | Global Restricted Share Unit Award Agreement granted to John Reed on May 1, 2023 under the 2022 Long-Term Incentive Plan — Filed with this document.* |
| | Domestic Deferred Compensation (Certificate of Extra Compensation) Plan — Incorporated herein by reference to Exhibit 10(g) of the Registrant’s Form 10-K Annual Report for the year ended December 28, 2003.* |
| | Amendments to the Certificate of Extra Compensation Plan effective as of January 1, 2009 — Incorporated herein by reference to Exhibit 10(j) of the Registrant’s Form 10-K Annual Report for the year ended December 28, 2008.* |
| | 2009 Certificates of Long-Term Performance Plan — Incorporated herein by reference to Exhibit 10.1 of the Registrant’s Form 10-Q Quarterly Report for the quarter ended September 27, 2009.* |
| | Amended and Restated Deferred Fee Plan for Directors (Amended as of January 17, 2012) — Incorporated herein by reference to Exhibit 10(k) of the Registrant's Form 10-K Annual Report for the fiscal year ended January 1, 2012.* |
| | | | | | | | |
| Reg. S-K | | |
| Exhibit Table | | Description |
| Item No. | | of Exhibit |
| | The Johnson & Johnson Executive Income Deferral Plan (AmendedAmended and Restated)Restated Effective January 1, 2010 — Incorporated herein by reference to Exhibit 10.1 of the Registrant’s Form 10-Q Quarterly Report for the quarter ended September 30, 2012.* |
| | The Johnson & Johnson Excess Savings Plan (amended and restated as of January 1, 2022) — Incorporated herein by reference to Exhibit 10(j)10(l) of the Registrant’s Form 10-K Annual Report for the fiscal year ended December 29, 1996.January 1, 2023.* |
| | Amendments to theExcess Benefit Plan of Johnson & Johnson Excess Savings Plan effectiveand Affiliated Companies (amended and restated as of January 1, 20092020) — Incorporated hereinincorporated by reference to Exhibit 10(p) of the Registrant’s Form 10-K Annual Report for the fiscal year ended December 28, 2008.* |
10(m)** | | Excess Benefit Plan (Supplemental Retirement Plan) — Incorporated herein by reference to Exhibit 10(h)10(n) of the Registrant’s Form 10-K Annual Report for the fiscal year ended January 3, 1993.2021.* |
| | Amendments to the Excess Benefit Plan of Johnson & Johnson and Affiliated Companies effective as of January 1, 2009 — Incorporated herein by reference to Exhibit 10(r) of the Registrant’s Form 10-K Annual Report for the fiscal year ended December 28, 2008.* |
| | Amendment to the Excess Benefit Plan of Johnson & Johnson and Affiliated Companies, effective as of January 1, 2015 — Incorporated herein by reference to Exhibit 10(q) of the Registrant’s Form 10-K Annual Report for the fiscal year ended December 28, 2014.* |
| 10(p)** | | Executive Life Plan Agreement — Incorporated herein by reference to Exhibit 10(i) of the Registrant’s Form 10-K Annual Report for the fiscal year ended January 3, 1993.* |
| | Executive Life Plan Agreement Closure Letter — Incorporated herein by reference to Exhibit 10.1 of the Registrant’s Form 10-Q Quarterly Report for the quarter ended March 29, 2015.* |
| | Employment Agreement for Dr. Paulus Stoffels -2022 Long-Term Incentive Plan — Incorporated herein by reference to Exhibit 10.2Appendix A of the Registrant’s Form 10-Q Quarterly Report for the quarter ended September 30, 2012.Proxy Statement filed on March 16, 2022.* |
| | Summary of Employment Arrangements for Sandra E. Peterson — Incorporated herein by reference to Exhibit 10(t) of the Registrant's Form 10-K Annual Report for the year ended December 30, 2012.* |
| | Severance Pay Plan of Johnson & Johnson and U.S. Affiliated Companies, Amended and Restated as of October 1, 2014 — Incorporated herein by reference to Exhibit 10.1 of the Registrant's Form 10-Q Quarterly Report for the quarter ended September 28, 2014.* |
|
| | |
Reg. S-K | | |
Exhibit Table | | Description |
Item No. | | of Exhibit |
| | First Amendment to the Severance Pay Plan of Johnson & Johnson and U.S. Affiliated Companies (as amended and restated effective October 1, 2014) — Incorporated herein by reference to Exhibit 10.1 of the Registrant's Form 10-Q Quarterly Report for the quarter ended June 28, 2015.* |
| | Second Amendment to the Severance Pay Plan of Johnson & Johnson and U.S. Affiliated Companies (as amended and restated effective October 1, 2014) — Incorporated herein by reference to Exhibit 10(x) of the Registrant's Form 10-K Annual Report for the fiscal year ended January 3, 2016.* |
| | Contingent Value Rights Agreement, dated as of December 22, 2022, by and between Johnson & Johnson and American Stock Transfer & Trust Company, LLC – Incorporated herein by reference to Exhibit 10.1 of the Registrant’s Form 8-K Current Report filed December 22, 2022.† |
| | StatementSeparation Agreement, dated as of ComputationMay 3, 2023, by and between Johnson & Johnson and Kenvue Inc. |
| | Tax Matters Agreement, dated as of RatioMay 3, 2023, by and between Johnson & Johnson and Kenvue Inc. |
| | Employee Matters Agreement, dated as of EarningsMay 3, 2023, by and between Johnson & Johnson and Kenvue Inc. |
| | Intellectual Property Agreement, dated as of May 3, 2023, by and between Johnson & Johnson and Kenvue Inc. |
| | Trademark Phase-Out License Agreement, dated as of April 3, 2023, by and between Johnson & Johnson and Johnson & Johnson Consumer Inc. |
| | Transition Services Agreement, dated as of May 3, 2023, by and between Johnson & Johnson and Kenvue Inc. |
| | Transition Manufacturing Agreement, dated as of May 3, 2023, by and between Johnson & Johnson and Kenvue Inc. |
| | Registration Rights Agreement, dated as of May 3, 2023, by and between Johnson & Johnson and Kenvue Inc. |
| | Johnson & Johnson Deferred Compensation Plan* |
| | Global Performance Share Unit Award Agreement* |
| | | | | | | | |
| Reg. S-K | | |
| Exhibit Table | | Description |
| Item No. | | of Exhibit |
| | Global Restricted Share Unit Award Agreement* |
| | Global Nonqualified Stock Option Award Agreement* |
| | Amendment One to Fixed Chargesthe Johnson & Johnson Excess Savings Plan (amended and restated effective as of January 1, 2022) — Incorporated herein by reference to Exhibit 10.1 of the Registrant’s Form 10-Q Quarterly Report for the quarter ended October 1, 2023.* |
| | Johnson & Johnson Executive Incentive Plan (Amended as of September 7, 2023) — Incorporated herein by reference to Exhibit 10.2 of the Registrant’s Form 10-Q Quarterly Report for the quarter ended October 1, 2023.* |
| | Johnson & Johnson Stock Trading Policy for Directors, Executive Officers and Insiders (Amended as of April 27, 2023) — Filed with this document. |
| | Subsidiaries -— Filed with this document. |
| | Consent of Independent Registered Public Accounting Firm — Filed with this document. |
| | Certification of Chief Executive Officer Pursuant to Section 302 of the Sarbanes-Oxley Act — Filed with this document. |
| | Certification of Chief Financial Officer Pursuant to Section 302 of the Sarbanes-Oxley Act — Filed with this document. |
| | Certification of Chief Executive Officer Pursuant to Section 906 of the Sarbanes-Oxley Act — Furnished with this document. |
| | Certification of Chief Financial Officer Pursuant to Section 906 of the Sarbanes-Oxley Act — Furnished with this document. |
101 | | Johnson & Johnson Clawback Policy (effective as of August 8, 2023) — Filed with this document. |
| Exhibit 101: | | |
| EX-101.INS | | Instance Document - the instance document does not appear in the Interactive Data File because its XBRL (Extensible Business Reporting Language) The following materials from this Report fortags are embedded within the fiscal year ended December 31, 2017, formattedInline XBRL document |
| EX-101.SCH | | Inline XBRL Taxonomy Extension Schema |
| EX-101.CAL | | Inline XBRL Taxonomy Extension Calculation Linkbase |
| EX-101.LAB | | Inline XBRL Taxonomy Extension Label Linkbase |
| EX-101.PRE | | Inline XBRL Taxonomy Extension Presentation Linkbase |
| EX-101.DEF | | Inline XBRL Taxonomy Extension Definition Document |
| Exhibit 104: | | Cover Page Interactive Data File––the cover page interactive data file does not appear in Extensive Business Reporting Language (XBRL): (i) Consolidated Balance Sheets, (ii) Consolidated Statements of Earnings, (iii) Consolidated Statements of Comprehensive Income, (iv) Consolidated Statements of Equity, (v) Consolidated Statements of Cash Flows, and (vi) Notes to the Consolidated Financial Statements.Interactive Data File because its XBRL tags are embedded within the Inline XBRL document. |
| | | | | |
| * | |
* | Management contract or compensatory plan. |
| ** | Paper filing. |
| † | Certain exhibits and schedules have been omitted pursuant to Item 601(b)(2)(ii) or 601(b)(10)(iv) of Regulation S-K, as applicable. |
A copy of any of the Exhibits listed above will be provided without charge to any shareholder submitting a written request specifying the desired exhibit(s) to the Secretary at the principal executive offices of the Company.
Pursuant to Item 601(b)(4)(iii)(A) of Regulation S-K, the Company has not filed as exhibits to this Form 10-K certain long-term debt instruments, including indentures, under which the total amount of securities authorized does not exceed 10% of the total assets of the Company and its subsidiaries on a consolidated basis. The Company hereby agrees to furnish a copy of any such instrument to the SEC upon request.