UNITED STATES SECURITIES AND EXCHANGE COMMISSION
Washington, D.C.D. C. 20549

ANNUAL REPORT ON FORM 10-K RELATING TO VOTING TRUST INTERESTSWITH RESPECT TO SHARES OF COMMON STOCK OF
GRAYBAR ELECTRIC COMPANY, INC.
Filed pursuant to Section 13 or 15(d) of the
Securities Exchange Act of 1934
FOR THE FISCAL YEAR ENDED DECEMBER 31, 2010
Names and Addresses of all Voting Trustees (as of March 8, 2011)
:
xL. R. Giglio
| ANNUAL REPORT PURSUANT TO SECTION 13 OR 15(d) OF THE SECURITIES EXCHANGE ACT OF 193434 North Meramec Avenue
|
| P.O. Box 7231 |
| St. Louis, Missouri 63177 |
T. S. Gurganous | 34 North Meramec Avenue |
| P.O. Box 7231 |
| St. Louis, Missouri 63177 |
R. D. Offenbacher | 34 North Meramec Avenue |
| P.O. Box 7231 |
| St. Louis, Missouri 63177 |
R. A. Reynolds, Jr. | 34 North Meramec Avenue |
| P.O. Box 7231 |
| St. Louis, Missouri 63177 |
Address to which communications to the Voting Trustees should be sent:
R. A. Reynolds, Jr.
c/o Graybar Electric Company, Inc.
P.O. Box 7231
St. Louis, Missouri 63177
Title of the securities deposited under the Voting Trust Agreement:
Common Stock, par value $1.00 per share
Exact name of the issuer of such securities, as specified in its charter:
Graybar Electric Company, Inc.
State or other jurisdiction in whichI.R.S. Employer
such issuer was incorporated or organized: Identification No.:
New York 13-0794380
Address of such issuer's principal executive offices:
34 North Meramec Avenue
P.O. Box 7231
St. Louis, Missouri 63177
If the Voting Trust Interests are registered on any national securities exchange,
state the name of each such exchange:
None
EXPLANATORY NOTE
The Annual Report Relating to Voting Trust Interests, filed by the Voting Trustees under a Voting Trust Agreement, dated as of March 16, 2007, among holders of the Common Stock of Graybar Electric Company, Inc. ("Graybar"), was filed for years prior to 1982 on Form 16-K, which was discontinued by the Securities and Exchange Commission (the "Commission") pursuant to Securities Exchange Act Release No. 34-18524, effective May 24, 1982 (the "Release"). In the Release, the Commission indicated that although Form 16-K was being discontinued, voting trusts would continue to be required to file annual reports. Specific requirements respecting the form of such annual reports were to be determined on a case-by-case basis.
In response to inquiries to the Deputy Chief Counsel of the Commission's Division of Corporation Finance, Graybar has been informed that the Voting Trustees should file an Annual Report on Form 10-K (as the only appropriate form under Section 13 of the Securities Exchange Act of 1934), but that because the requirements of Form 10-K are generally not applicable to elicit information relevant to voting trusts, the information previously required by rescinded Form 16-K should continue to be provided in this Annual Report. For this reason, the item numbers and information in this Annual Report correspond to the item numbers and disclosure required in the past by rescinded Form 16-K and used in the Annual Report Relating to Voting Trust Interests filed with the Commission by voting trustees in years prior to 1982.
2
INFORMATION REGARDING VOTING TRUST
PART I
Item 1. Deposit and Withdrawal of Securities (1)(2)(3)
Amount Amount
deposited withdrawn Amount Percentage of
during during held at class held at
year year(4) end of yearend of year
1,215,268 435,716 8,616,503 81.5%
(1) The securities consist of shares of Common Stock, par value $1.00 per share (the "Common Stock"), of Graybar Electric Company, Inc. ("Graybar").
(2)The 1997 Voting Trust terminated on March 31, 2007. 5,170,086 shares
of Common Stock were deposited into the 2007 Voting Trust at its inception.
(3) Shares deposited and withdrawn during the year only cover shares that were deposited and withdrawn with respect to the 2007 Voting Trust.
(4) The 435,716 shares of Common Stock withdrawn from the Voting Trust in 2010 represent shares purchased by Graybar from employees, retirees or their estates in accordance with Graybar's repurchase rights under its amended Restated Certificate of Incorporation. The shares so purchased were placed in Graybar's treasury.
Item 2. Exercise of Voting Rights.
The Voting Trustees did not exercise voting rights under the Voting Trust Agreement during the fiscal year with respect to any matter, except that the Voting Trustees voted the shares of Common Stock held by them for (i) the election of 13 directors, (ii) the approval of the amendment of the restated certificate of incorporation to increase the authorized shares of Common Stock from 15,000,000 to 20,000,000, and (3) the approval of the Graybar Three-Year Common Stock Purchase Plan.
Item 3. Exercise of Other Powers.
The Voting Trustees exercised no powers under the Voting Trust Agreement, other than voting rights and the distribution of dividends upon the underlying securities, during the fiscal year.
3
Item 4. Ownership of Voting Trust Certificates and Other Securities.
The following table presents information, as of March 8, 2011, as to Voting Trust Interests owned of record by each individual Voting Trustee. As of March 8, 2011, no Voting Trustee owned any securities of Graybar other than those deposited under the Voting Trust Agreement nor any securities of Graybar's subsidiaries. No other person owns of record, or is known by the Voting Trustees to own beneficially, more than five percent of the Voting Trust Interests.
Name and address of owner | | Name of issuer and title of class | | Type of ownership | | Amount owned as of March 8, 2011 | | Percent of class owned |
| | | | | | |
| For the fiscal year ended December 31, 2010
|
L. R. Giglio | | Voting Trust Interests (A) | | Direct | | 18,934(B) | | .197%(C) |
34 North Meramec Avenue | | | | | | | | |
P.O. Box 7231 | | | | | | | | |
St. Louis, Missouri 63177 | | | | | | | | |
| | | OR
| | | | | |
T. S. Gurganous | | Voting Trust Interests (A) | | Direct | | 19,547(B) | | .204%(C) |
34 North Meramec Avenue | | | | | | | | |
P.O. Box 7231 | | | | | | | | |
St. Louis, Missouri 63177 | | | | | | | | |
| | | | | | | | |
¨R. D. Offenbacher
| TRANSITION REPORT PURSUANT TO SECTION 13 OR 15(d) OF THE SECURITIES EXCHANGE ACT OF 1934
| Voting Trust Interests (A) | | Direct | | 24,117(B) | | .252%(C) |
34 North Meramec Avenue | | | | | | | | |
P.O. Box 7231 | | | | | | | | |
St. Louis, Missouri 63177 | | | | | | | | |
| For the transition period from __________ to __________
|
| | | | | | |
| Commission File Number 000-00255
|
| | | | | | | | | |
GRAYBAR ELECTRIC COMPANY, INC.
|
(Exact name of registrant as specified in its charter)
|
|
New York
| 13-0794380
|
(State or other jurisdiction of incorporation or organization)
| (I.R.S. Employer Identification No.)
|
|
34 North Meramec Avenue, St. Louis, Missouri
| 63105
|
(Address of principal executive offices)
| (Zip Code)
|
|
(314) 573 – 9200
|
(Registrant’s telephone number, including area code)
|
| |
Securities registered pursuant to Section 12(b) of the Act: None
|
| |
Securities registered pursuant to Section 12(g) of the Act: Common Stock – Par Value $1.00 Per Share with a
Stated Value of $20.00
|
|
|
Indicate by check mark if the registrant is a well-known seasoned issuer, as defined in Rule 405 of the Securities Act.
|
YES¨ NOx
|
|
Indicate by check mark if the registrant is not required to file reports pursuant to Section 13 or Section 15(d) of the Act.
|
YES¨ NOx
|
|
Indicate by check mark whether the registrant (1) has filed all reports required to be filed by Section 13 or 15(d) of the Securities Exchange Act of 1934 during the preceding 12 months (or for such shorter period that the registrant was required to file such reports), and (2) has been subject to such filing requirements for the past 90 days.
|
YESx NO¨
|
Indicate by check mark whether the registrant has submitted electronically and posted on its corporate Website, if any, every Interactive Data File required to be submitted and posted pursuant to Rule 405 of Regulation S-T (§ 232.405 of this chapter) during the preceding 12 months (or for such shorter period that the registrant was required to submit and post such files).
|
YES¨ NO¨
|
|
Indicate by check mark if disclosure of delinquent filers pursuant to Item 405 of Regulation S-K (§ 229.405 of this chapter) is not contained herein, and will not be contained, to the best of registrant’s knowledge, in definitive proxy or information statements incorporated by reference in Part III of this Form 10-K or any amendment to this Form 10-K.x
|
|
Indicate by check mark whether the registrant is a large accelerated filer, an accelerated filer, a non-accelerated filer or a smaller reporting company. See the definitions of “large accelerated filer”, “accelerated filer” and “smaller reporting company” in Rule 12b-2 of the Exchange Act.
|
Large accelerated filer¨ Accelerated filer¨
|
Non-accelerated filerx (Do not check if a smaller reporting company) Smaller reporting company¨
|
| |
Indicate by check mark whether the registrant is a shell company (as defined in Rule 12b-2 of the Exchange Act).
|
YES¨ NOx
|
The aggregate stated value of the Common Stock beneficially owned with respect to rights of disposition by persons who are not affiliates (as defined in Rule 405 under the Securities Act of 1933) of the registrant on June 30, 2010, was approximately $208,528,100. Pursuant to a Voting Trust Agreement, dated as of March 16, 2007, approximately 82% of the outstanding shares of Common Stock are held of record by four Voting Trustees who are each directors or officers of the registrant and who collectively exercise the voting rights with respect to such shares. The registrant is 100% owned by its active and retired employees, and there is no public trading market for the registrant’s Common Stock. See Item 5 of this Annual Report on Form 10-K.
|
|
The number of shares of Common Stock outstanding at March4, 2011 was11,713,506.
|
|
DOCUMENTS INCORPORATED BY REFERENCE
|
Portions of the documents listed below have been incorporated by reference into the indicated Part of this Annual Report on Form 10-K: Information Statement relating to the 2011 Annual Meeting of Shareholders – Part III, Items 10-14
|
| | |
Graybar Electric Company, Inc. and Subsidiaries
Annual Report on Form 10-K
For the Fiscal Year Ended December 31, 2010
Table of Contents
2
PART I
The following discussion should be read in conjunction with the accompanying audited consolidated financial statements of Graybar Electric Company, Inc. (“Graybar” or the “Company”), the notes thereto, and Management’s Discussion and Analysis of Financial Condition and Results of Operations as of and for the year ended December 31, 2010, included in this Annual Report on Form 10-K. The results shown herein are not necessarily indicative of the results to be expected in any future periods.
Certain statements, other than purely historical information, including estimates, projections, statements relating to the Company’s business plans, objectives, and expected operating results, and the assumptions upon which those statements are based, are “forward-looking statements” within the meaning of the Private Securities Litigation Reform Act of 1995 (the “PSLRA”), Section 27A of the Securities Act of 1933, and Section 21E of the Securities Exchange Act of 1934 (the “Exchange Acts”). These forward-looking statements generally are identified by the words “believes”, “projects”, “expects”, “anticipates”, “estimates”, “intends”, “strategy”, “plan”, “may”, “will”, “would”, “will be”, “will continue”, “will likely result”, and other similar expressions. The Company intends such forward-looking statements to be covered by the safe-harbor provisions for forward-looking statements contained in the PSLRA. Forward-looking statements are based on current expectations and assumptions that are subject to risks and uncertainties that may cause actual results to differ materially from the forward-looking statements. The Company’s ability to predict results or the actual effect of future plans or strategies is inherently uncertain. Factors which could have a material adverse impact on the Company’s operations and future prospects on a consolidated basis include, but are not limited to: general economic conditions, particularly in the residential, commercial, and industrial building construction industries, volatility in the prices of industrial metal commodities, disruptions in the Company’s sources of supply, a sustained interruption in the operation of the Company’s information systems, adverse legal proceedings or other claims, and the inability, or limitations on the Company’s ability, to raise debt or equity capital. These risks and uncertainties should also be considered in evaluating forward-looking statements and undue reliance should not be placed on such statements. The Company undertakes no obligation to update or revise publicly any forward-looking statements, whether as a result of new information, future events or otherwise, unless otherwise required by applicable securities law. Further information concerning the Company, including additional factors that could materially impact our financial results, is included herein and in our other filings with the United States Securities and Exchange Commission (the “SEC” or “Commission”). Actual results and the timing of events could differ materially from the forward-looking statements as a result of certain factors, a number of which are outlined in Item 1A., “Risk Factors”, of this Annual Report on Form 10-K for the year ended December 31, 2010.
All dollar amounts are stated in thousands ($000s) in the following discussion except for per share data.
Item 1. Business
The Company
Graybar Electric Company, Inc. is engaged in the distribution of electrical, communications and data networking (“comm/data”) products, and the provision of related supply chain management and logistics services, primarily to electrical and comm/data contractors, industrial plants, federal, state and local governments, commercial users, telephone companies, and power utilities in North America. All products sold by the Company are purchased by the Company from others. The Company’s business activity is primarily with customers in the United States of America (“US”). Graybar also has subsidiary operations with distribution facilities in Canada and Puerto Rico.
The Company was incorporated under the laws of the State of New York on December 11, 1925 to purchase the wholesale distribution business of Western Electric Company, Incorporated. Graybar is one hundred percent (100%) owned by its active and retired employees, and there is no public trading market for its common stock. The location of the principal executive offices of the Company is 34 North Meramec Avenue St. Louis, Missouri 63105 and its telephone number is (314) 573-9200.
The Company maintains an internet website at http://www.graybar.com. Graybar’s filings with the SEC, including its Annual Reports on Form 10-K, Quarterly Reports on Form 10-Q, Current Reports on Form 8-K and amendments to those reports, are accessible free of charge on our website within the “About Us” page under “SEC Filings” as soon as reasonably practicable after we file the reports with the SEC. Additionally, a copy of the Company’s SEC filings can be obtained at the SEC’s Public Reference Room at 100 F Street, N.E., Washington, D.C. 20549 on official business days or by calling the SEC at 1-800-SEC-0330. A copy of our electronically filed materials can also be obtained athttp://www.sec.gov.
Suppliers
Graybar distributes approximately one million products (“stockkeeping units” or “SKUs”) purchased primarily from nearly 4,100 manufacturers and suppliers through the Company’s network of distribution facilities. The relationship between the Company and its suppliers is customarily a nonexclusive national or regional distributorship, terminable upon 30 to 90 days notice by either party. The Company maintains long-standing relationships with a number of its principal suppliers.
3
The Company purchased approximately fifty-three percent (53%) of the products it sold during 2010 from its top 25 suppliers. However, the Company generally deals with more than one supplier for any product category and there are alternative sources of comparable products available for nearly all product categories.
Products
The Company stocks approximately 90,000 of the products it distributes and, therefore, is able to supply its customers locally with a wide variety of electrical and comm/data products. The products distributed by the Company consist primarily of wire and cable, lighting fixtures, power distribution equipment, comm/data products for wide and local area networks, conduit, boxes and fittings, wiring devices, motor controls, industrial automation, lamps, industrial enclosures, station apparatus, tools and test equipment, and transformers.
Order Backlog
On December 31, 2010 and 2009, the Company had orders on hand that totaled $604,233 and $526,608, respectively. The Company expects that approximately eighty-nine percent (89%) of the orders it had on hand at December 31, 2010 will be filled within the twelve-month period ending December 31, 2011. Generally, orders placed by customers and accepted by the Company have resulted in sales. However, customers from time to time request cancellation and the Company has historically allowed such cancellations.
Sales And Distribution
Graybar sells its products primarily through a network of sales offices and distribution facilities located in thirteen geographical districts throughout the US. The Company operates multiple distribution facilities in each district, each of which carries an inventory of products and operates as a wholesale distributor for the territory in which it is located. Some districts have sales offices that do not carry an inventory of product. In addition, the Company maintains seven national zone warehouses and seven district service centers containing inventories of both standard and specialized products. Both the national zone warehouses and district service centers replenish local inventories carried at the Company’s US distribution facilities and make shipments directly to customers. The Company also has subsidiary operations with distribution facilities located in Canada and Puerto Rico.
The sales and distribution facilities operated by the Company at December 31, 2010 are shown below:
US Locations
| | | |
District
| Number of Sales and
Distribution Facilities*
|
| National Zone Warehouses
|
Boston
| 11
| | Austell, GA
|
California
| 21
| | Fresno, CA
|
Dallas
| 13
| | Joliet, IL
|
Chicago
| 19
| | Richmond, VA
|
Minneapolis
| 17
| | Springfield, MO
|
New York
| 12
| | Stafford, TX
|
Atlanta
| 20
| | Youngstown, OH
|
Phoenix
| 11
| | |
Pittsburgh
| 19
| | |
Richmond
| 18
| | |
Seattle
| 12
| | |
St. Louis
| 15
| | |
Tampa
| 19
| | |
*Includes District Service Centers
| | |
| | | |
International Locations
|
| | |
| Number of
Distribution Facilities
| | |
| | | |
Graybar Electric Canada, Ltd.
Halifax, Nova Scotia, Canada
| 30
| | |
| | | |
Graybar International, Inc.
Carolina, Puerto Rico
| 1
| | |
When the specialized nature or size of a particular shipment warrants, the Company has products shipped directly from its suppliers to the place of use, otherwise, orders are filled from the Company’s inventory. On a dollar volume basis, approximately fifty-six percent (56%) and fifty-five percent (55%) of customer orders were filled from the Company’s inventory in 2010 and 2009, respectively, and the remainder were shipped directly from the supplier to the place of use.
4
The Company generally finances its inventory through the collection of trade receivables and trade accounts payable terms with its suppliers. The Company’s short-term borrowing facilities are also used to finance inventory when necessary. Historically, the Company has not used long-term borrowings to finance inventory.
The Company distributes its products to approximately 120,000 customers, which fall into three principal classes. The following list shows the estimated percentage of the Company’s total sales attributable to each of these classes for the last three years:
| | Percentage of Sales For the Years Ended December 31, |
Class of Customers | | 2010 | 2009 | 2008 |
Electrical Contractors | 45.2% | 46.0% | 48.1% |
Data and Voice Communications | 20.6% | 20.5% | 19.4% |
Commercial & Industrial | 19.4% | 18.5% | 18.6% |
At December 31, 2010, the Company employed approximately 2,800 persons in sales capacities. Approximately 1,200 of these sales personnel were outside sales representatives working to generate sales with current and prospective customers. The remainder of the sales personnel were sales and marketing managers, inside sales representatives, and advertising, quotation, and counter personnel.
Competition
The Company believes that it is one of the four largest wholesale distributors of electrical and comm/data products in the US. This market is highly competitive, and the Company estimates that the five largest wholesale distributors account for approximately twenty-eight percent (28%) of the total market. The balance of the market is made up of several thousand independent distributors operating on a local, regional, or national basis and manufacturers who sell their products directly to end users.
The Company’s pricing structure for the products it sells reflects the costs associated with the services that it provides and its prices are generally competitive. The Company believes that, while price is an important customer consideration, it is the service that Graybar is able to provide customers that distinguishes the Company from many of its competitors, whether they are distributors or manufacturers selling direct. Graybar views its ability to quickly supply its customers with a broad range of electrical and comm/data products through conveniently located distribution facilities as a competitive advantage that customers value. However, if a customer is not looking for one distributor to provide a wide range of products and does not require prompt delivery or other services, a competitor of the Company that does not provide these benefits may be in a position to offer a lower price.
Foreign Sales
Sales by the Company to customers in foreign countries were made primarily by Company subsidiaries in Canada and Puerto Rico and accounted for approximately six percent (6%), five percent (5%), and five percent (5%), of consolidated revenues in 2010, 2009, and 2008, respectively. Limited export activities are handled primarily from Company facilities in Texas, Arizona and California. Long-lived assets located outside the US represented approximately two percent (2%), one percent (1%), and one percent (1%) of the Company’s consolidated assets at the end of 2010, 2009, and 2008, respectively. The Company does not have significant foreign currency exposure and does not believe there are any other significant risks attendant to its foreign operations.
Employees
At December 31, 2010, the Company employed approximately 7,000 persons on a full-time basis. Approximately 110 of these persons were covered by union contracts. The Company has not had a material work stoppage and considers its relations with its employees to be good.
Item 1A. Risk Factors
Our liquidity, financial condition, and results of operations are subject to various risks, including, but not limited to, those discussed below. The risks outlined below are those that we believe are currently the most significant, although additional risks not presently known to us or that we currently deem less significant may also impact our liquidity, financial condition, and results of operations.
5
Our sales fluctuate with general economic conditions, particularly in the residential, commercial, and industrial building construction industries. Our operating locations are widely distributed geographically across the US and, to a lesser extent, Canada. Customers for both electrical and comm/data products are similarly diverse – we have approximately 120,000 customers and our largest customer accounts for only five percent (5%) of our total revenue. While our geographic and customer concentrations are relatively low, our results of operations are, nonetheless, dependent on favorable conditions in both the general economy and the construction industry. In addition, conditions in the construction industry are greatly influenced by the availability of project financing and the cost of borrowing.
The Company’s results of operations are impacted by changes in commodity prices, primarily copper and steel. Many of the products sold by the Company are subject to wide and frequent price fluctuations because they are composed primarily of copper or steel, two industrial metal commodities that have been subject to extreme price volatility during the past several years. Examples of such products include copper wire and cable and steel conduit, enclosures, and fittings. The Company’s gross margin rate, or mark-up percentage, on these products is relatively constant over time, though not necessarily in the short term. Therefore, as the cost of these products to the Company declines, pricing to our customers decreases by a similar percentage. This impacts our results of operations by lowering both revenue and gross margin. Rising copper and steel prices have the opposite effect, increasing both revenue and gross margin, assuming the quantities of the affected products sold remain constant.
The impact of commodity price fluctuations on the value of our merchandise inventory is reduced by the Company’s use of the last-in, first-out (“LIFO”) inventory cost method, which matches current product costs to current revenues.
We purchase one hundred percent (100%) of the products we sell to our customers from other parties. As a wholesale distributor, our business and financial results are dependent on our ability to purchase products from manufacturers not controlled by our Company that we, in turn, sell to our customers. Approximately fifty-three percent (53%) of our purchases are made from only 25 manufacturers. A sustained disruption in our ability to source product from one or more of the largest of these vendors might have a material impact on our ability to fulfill customer orders resulting in lost revenue and, in rare cases, damages for late or non-delivery.
Our daily activities are highly dependent on the uninterrupted operation of our information systems. We are a recognized industry leader for our use of information technology in all areas of our business – sales, customer service, inventory management, finance, accounting, and human resources. We maintain redundant information systems as part of our disaster recovery program and are able to operate in many respects using a paper-based system to help mitigate a complete interruption in our information processing capabilities. Nonetheless, our information systems remain vulnerable to natural disasters, wide-area telecommunications or power utility outages, terrorist or cyber-attack, or other major disruptions. A sustained interruption in the functioning of our information systems, however unlikely, could lower operating income by negatively impacting revenue, expenses, or both.
We are subject to legal proceedings and other claims arising out of the conduct of our business. These proceedings and claims relate to public and private sector transactions, product liability, contract performance, and employment matters. On the basis of information currently available to us, we do not believe that existing proceedings and claims will have a material impact on our financial position or results of operations. However, litigation is unpredictable, and we could incur judgments or enter into settlements for current or future claims that could adversely affect our financial position or our results of operations in a particular period.
More specifically, with respect to asbestos litigation, as of December 31, 2010, approximately 2,500 individual cases and 146 class actions are pending that allege actual or potential asbestos-related injuries resulting from the use of or exposure to products allegedly sold by us. Additional claims will likely be filed against us in the future. Our insurance carriers have historically borne virtually all costs and liability with respect to this litigation and are continuing to do so. Accordingly, our future liability with respect to pending and unasserted claims is dependent on the continued solvency of our insurance carriers. Other factors that could impact this liability are: the number of future claims filed against us; the defense and settlement costs associated with these claims; changes in the litigation environment, including changes in federal or state law governing the compensation of asbestos claimants; adverse jury verdicts in excess of historic settlement amounts; and bankruptcies of other asbestos defendants. Because any of these factors may change, our future exposure is unpredictable and it is possible that we may incur costs that would have a material adverse impact on our liquidity, financial position or results of operations in future periods.
Our financing arrangements and loan agreements contain financial covenants and certain other restrictions on our activities and those of our subsidiaries. Our senior unsecured notes, revolving credit facility, and trade receivable securitization program impose contractual limits on our ability, and the ability of most of our subsidiaries, to make investments (including in our common stock), pay dividends, incur debt, dispose of property, and issue equity securities. In addition, we are required to maintain acceptable financial ratios relating to debt leverage, interest coverage, net worth, asset performance, and certain other customary covenants. Our failure to comply with these obligations may cause an event of default triggering an acceleration of the debt owed to our creditors or limit our ability to obtain additional credit under these facilities. While we expect to remain in compliance with the terms of our credit agreements, our failure to do so could have a negative impact on our ability to borrow funds and maintain acceptable levels of cash flow from financing activities.
6
The value of our common stock is dependent primarily upon the regular payment of dividends, which are paid at the discretion of the Board of Directors. The repurchase price for our common stock under the Company’s purchase option is the same as the issue price. Accordingly, as long as Graybar exercises its option to purchase, appreciation in the value of an investment in our common stock is dependent solely on the Company’s ability and willingness to declare dividends. Although cash dividends have been paid on the common stock each year since 1929, as with any corporation’s common stock, payment of dividends is subject to the discretion of the Board of Directors.
There is no public trading market for our common stock. The Company’s common stock is one hundred percent (100%) owned by its active and retired employees. Common stock may not be sold by the holder thereof, except after first offering it to the Company. The Company has always exercised this purchase option in the past and expects that it will continue to do so. As a result, no public trading market for our common stock exists, nor is one expected to develop. This lack of a public trading market for the Company’s common stock may limit Graybar’s ability to raise large amounts of equity capital.
Item 1B. Unresolved Staff Comments
Not applicable.
Item 2. Properties
As of December 31, 2010, the Company had seven national zone warehouses ranging in size from approximately 160,000 to 240,000 square feet. The lease arrangement used to finance three of the national zone warehouses is discussed in Note 9 of the Notes to the Consolidated Financial Statements, located in Item 8., “Financial Statements and Supplementary Data”, of this Annual Report on Form 10-K. Of the remaining four national zone warehouses, two are owned and two are leased. The remaining lease terms on these two leased facilities are approximately three and six years.
The Company also had seven district service centers ranging in size from 116,000 to 210,000 square feet as of December 31, 2010. Three of the seven district service centers are owned and the others are leased. The remaining lease terms on the leased district service centers are between three and nine years.
Graybar operates in thirteen geographical districts, each of which maintains multiple distribution facilities that consist primarily of warehouse space. A small portion of each distribution facility is used for offices. Some districts have sales offices that do not carry an inventory of products. The number of distribution and sales facilities, excluding service centers, in a district varies from ten to twenty and totals 200 for all districts. The facilities range in size from approximately 1,000 to 180,000 square feet, with the average being approximately 33,000 square feet. The Company owns 117 of these distribution facilities and leases 83 of them for varying terms, with the majority having a remaining lease term of less than five years.
The Company maintains thirty distribution facilities in Canada, of which nineteen are owned and eleven are leased. The majority of the leased facilities have a remaining lease term of less than five years. The facilities range in size from approximately 1,000 to 60,000 square feet. In November 2010, the Company purchased nine facilities from a related party in Canada that were previously leased. The Company also has a 22,000 square foot facility in Puerto Rico, the lease on which expires in 2014.
The Company’s headquarters are located in St. Louis, Missouri in an 88,000 square foot building owned by the Company. The Company also leases a 200,000 square foot operations and administration center in St. Louis. The Company has options to purchase this facility in 2011, 2016, and at the expiration of the lease in 2021.
As of December 31, 2010, the Company had granted mortgages or other security interests on twenty-two buildings securing $44,445 in debt. Seven of the twenty-two facilities are subject to security interests totaling $28,720 under a lease arrangement with an independent lessor. The other fifteen facilities are subject to first mortgages securing fixed- and variable-rate notes, of which $15,725 in principal remains outstanding.
Item 3. Legal Proceedings
There are presently no pending legal proceedings that are expected to have a material impact on the Company or its subsidiaries.
Item 4. Removed and Reserved
7
Supplemental Item. Executive Officers of the Registrant
The following table lists the name, age as of March 1, 2011, position, offices and certain other information with respect to the executive officers of the Company. The term of office of each executive officer will expire upon the appointment of his or her successor by the Board of Directors.
Name
| Age
| Business experience last five years
|
M. J. Beagen
| 54
| Employed by Company in 1980; Vice President and Controller, September 2005 to present.
|
D. B. D’Alessandro
| 50
| Employed by Company in 1983; Senior Vice President and Chief Financial Officer, May 2005 to present.
|
M. W. Geekie
| 49
| Employed by Emerson Electric Company, Process Management Group, Assistant General Counsel, May 2000 to July 2005; Employed by XTRA Corporation, General Counsel and Secretary, August 2005 to February 2008; Employed by Company in 2008; Deputy General Counsel, February 2008 to August 2008; Senior Vice President, Secretary and General Counsel, August 2008 to present.
|
L. R. Giglio
| 56
| Employed by Company in 1978; Senior Vice President, Operations, April 2002 to present.
|
K. M. Mazzarella
| 50
| Employed by Company in 1980; Senior Vice President, Human Resources and Strategic Planning, December 2005 to April 2008; Senior Vice President – Sales and Marketing, Comm/Data, April 2008 to February 2010; Senior Vice President – Sales and Marketing, March 2010 to present; Executive Vice President, Chief Operating Officer, December 2010 to present.
|
R. D. Offenbacher
| 60
| Employed by Company in 1968; Senior Vice President – Sales and Marketing, February 2004 to April 2008; Senior Vice President – Sales and Marketing, Electrical, April 2008 to February 2010; Senior Vice President – U.S. Business, March 2010 to present.
|
B. L. Propst
| 41
| Employed by Company in 2002; Senior Corporate Counsel, March 2004 to March 2008; Vice President –Human Resources, April 2008 to June 2009; Senior Vice President –Human Resources, June 2009 to present.
|
J. N. Reed
| 53
| Employed by Company in 1980; Vice President and Treasurer, April 2000 to present.
|
R. A. Reynolds, Jr.
| 62
| Employed by Company in 1972; President and Chief Executive Officer, July 2000 to present; Chairman of the Board, April 2001 to present.
|
On January 10, 2011, R. D. Offenbacher, an officer, director, and Senior Vice President – U.S. Business of the Company announced his intention to retire as an officer and director, and from his employment with the Company, effective April 1, 2011. R. C. Lyons, Tampa District Vice President and a director of the company, will replace Mr. Offenbacher as an officer and Senior Vice President – U.S. Business effective April 1, 2011.
8
PART II
Item 5. Market for the Registrant’s Common Equity, Related Stockholder Matters and Issuer Purchases of Equity Securities
The Company’s capital stock is one hundred percent (100%) owned by its active and retired employees, and there is no public trading market for its common stock. Since 1928, substantially all of the issued and outstanding shares of common stock have been held of record by voting trustees under successive voting trust agreements. Under applicable state law, a voting trust may not have a term greater than ten years. The 2007 Voting Trust Agreement expires by its terms on March 15, 2017. At December 31, 2010, approximately eighty-two percent (82%) of the common stock was held in this voting trust. The participation of shareholders in the voting trust is voluntary at the time the voting trust is created but is irrevocable during its term. Shareholders who elect not to participate in the voting trust hold their common stock as shareholders of record.
No shareholder may sell, transfer, or otherwise dispose of shares of common stock or the voting trust interests issued with respect thereto (“common stock”, “common shares”, or “shares”) without first offering the Company the option to purchase such shares at the price at which the shares were issued. The Company also has the option to purchase at the issue price the common stock of any holder who dies or ceases to be an employee of the Company for any cause other than retirement on a Company pension. The Company has always exercised its purchase option and expects to continue to do so. All outstanding shares of the Company have been issued at $20.00 per share.
The following table sets forth information regarding purchases of common stock by the Company, all of which were made pursuant to the foregoing provisions:
Issuer Purchases of Equity Securities |
Period | Total Number ofShares Purchased | Average Price Paid Per Share | Total Number of Shares Purchased as Part of Publicly Announced Plans or Programs |
October 1 to October 31, 2010 | 53,692 | $20.00 | N/A |
November 1 to November 30, 2010 | 38,522 | $20.00 | N/A |
December 1 to December 31, 2010 | 26,755 | $20.00 | N/A |
Total | 118,969 | $20.00 | N/A |
Capital Stock at December 31, 2010 |
Title of Class | Number of Security Holders | Number of Shares (A) |
Voting Trust Interests issued with respect to Common Stock | 4,902 | 9,475,978 |
Common Stock | 1,055 | 2,143,998 |
Total | 5,957 | 11,619,976 |
(A) Adjusted for the declaration of a ten percent (10%) stock dividend in 2010, shares related to which wereissued on February 4, 2011.
Dividend Data (in dollars per share) | Year Ended
December 31, |
Period | 2010 | 2009 |
First Quarter | $0.30 | $0.30 |
Second Quarter | 0.30 | 0.30 |
Third Quarter | 0.30 | 0.30 |
Fourth Quarter | 1.10 | 1.10 |
Total | $2.00 | $2.00 |
On December 9, 2010, a ten percent (10%) stock dividend was declared to shareholders of record on January 3, 2011. Shares representing this dividend were issued on February 4, 2011.
On December 10, 2009, a ten percent (10%) stock dividend was declared to shareholders of record on January 4, 2010. Shares representing this dividend were issued on February 1, 2010.
9
Company Performance
The following graph shows a five-year comparison of cumulative total shareholders’ returns for the Company’s common stock, the Standard & Poor’s 500 Composite Stock Index, and a Comparable Company Index of companies selected by the Company as being representative of the Company’s line of business.
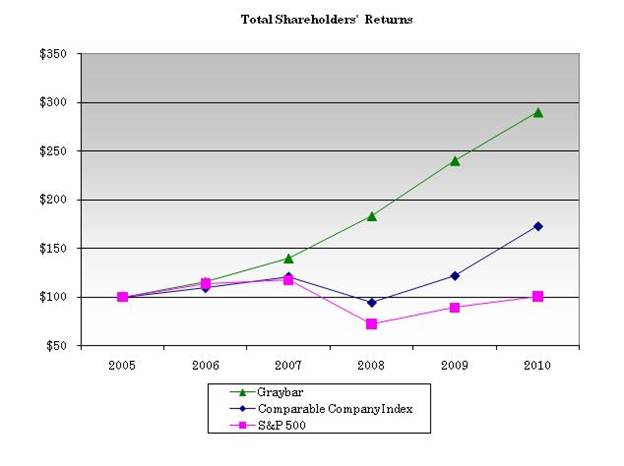
| | 2005 | | 2006 | | 2007 | | 2008 | | 2009 | | 2010 |
Graybar | $ | 100.00 | $ | 115.55 | $ | 139.55 | $ | 183.14 | $ | 240.34 | $ | 290.27 |
Comparable Company Index | $ | 100.00 | $ | 109.31 | $ | 121.11 | $ | 94.18 | $ | 121.91 | $ | 172.95 |
S&P 500 | $ | 100.00 | $ | 113.62 | $ | 117.63 | $ | 72.36 | $ | 89.33 | $ | 100.75 |
The comparison above assumes $100.00 invested on December 31, 2005 and reinvestment of dividends (including the $1.10 per share cash dividend paid by the Company on January 3, 2006).
The companies included in the Comparable Company Index are Anixter International Inc., Applied Industrial Technologies, Inc., W. W. Grainger, Inc., Interline Brands, Inc., Owens & Minor, Inc., Park-Ohio Holdings Corp., Watsco, Inc., and WESCO International, Inc.
The market value of the Company’s stock, in the absence of a public trading market, assumes continuation of the Company’s practice of issuing and purchasing offered securities at $20.00 per share.
10
Item 6. Selected Financial Data
This summary should be read in conjunction with the accompanying consolidated financial statements and the notes to the consolidated financial statements included in Item 8., “Financial Statements and Supplementary Data”, of this Annual Report on Form 10-K.
Five Year Summary of Selected Consolidated Financial Data
(Stated in thousands except for per share data)
For the Years Ended December 31, | | | 2010 | | | 2009 | | | 2008 | | | 2007 | | | 2006 | |
Gross Sales | | $ | 4,634,231 | | $ | 4,395,718 | | $ | 5,423,122 | | $ | 5,279,653 | | $ | 5,028,827 | |
Cash Discounts | | | (17,854 | ) | | (17,836 | ) | | (22,968 | ) | | (21,352 | ) | | (19,684 | ) |
Net Sales | | $ | 4,616,377 | | $ | 4,377,882 | | $ | 5,400,154 | | $ | 5,258,301 | | $ | 5,009,143 | |
Gross Margin | | $ | 866,641 | | $ | 854,950 | | $ | 1,045,219 | | $ | 1,032,318 | | $ | 961,451 | |
Net Income attributable toGraybar Electric Company, Inc. | | $ | 41,998 | | $ | 37,277 | | $ | 87,400 | | $ | 83,421 | | $ | 57,388 | |
Average common shares outstanding (A) | | | 11,647 | | | 11,708 | | | 11,636 | | | 11,453 | | | 11,224 | |
Net Income attributable to Graybar Electric Company, Inc. per share of Common Stock (A) | | $ | 3.61 | | $ | 3.18 | | $ | 7.51 | | $ | 7.28 | | $ | 5.11 | |
Cash Dividends per share of Common Stock | | $ | 2.00 | | $ | 2.00 | | $ | 2.00 | | $ | 2.00 | | $ | 2.00 | |
Total assets | | $ | 1,519,438 | | $ | 1,431,953 | | $ | 1,556,199 | | $ | 1,532,028 | | $ | 1,508,246 | |
Total liabilities (B) | | $ | 960,631 | | $ | 893,784 | | $ | 1,048,608 | | $ | 1,048,649 | | $ | 1,061,476 | |
Shareholders’ equity (B) | | $ | 558,807 | | $ | 538,169 | | $ | 507,591 | | $ | 483,379 | | $ | 446,770 | |
Working capital | | $ | 415,724 | | $ | 424,993 | | $ | 431,126 | | $ | 394,291 | | $ | 415,465 | |
Long-term debt | | $ | 64,859 | | $ | 80,959 | | $ | 113,633 | | $ | 115,419 | | $ | 203,869 | |
(A)All periods adjusted for the declaration of a ten percent (10%) stock dividend declared in December 2010, a ten percent (10%) stock dividend declared in December 2009, a twenty percent (20%) stock dividend declared in December 2008, a twenty percent (20%) stock dividend declared in December 2007, and a ten percent (10%) stock dividend declared in December 2006. Prior to these adjustments, the average common shares outstanding for the years ended December 31, 2009, 2008, 2007, and 2006 were 10,644, 9,617, 7,888, and 6,442, respectively.
(B)All periods adjusted for the January 1, 2009 adoption of accounting and disclosure requirements under generally accepted accounting principles in the US (“US GAAP”) issued by the FASB regarding noncontrolling interests in consolidated financial statements.
Item 7. Management’s Discussion and Analysis of Financial Condition and Results of Operations
Management’s Discussion and Analysis provides a narrative on the Company’s results of operations, financial condition, liquidity, and cash flows for the three-year period ended December 31, 2010. This discussion should be read in conjunction with the accompanying consolidated financial statements and the notes to the consolidated financial statements included in Item 8., “Financial Statements and Supplementary Data”, of this Annual Report on Form 10-K.
Business Overview
General economic conditions in the Company’s North American trading area improved throughout the year ended December 31, 2010. Capital expenditures on business equipment during 2010 increased significantly over 2009 levels. Spending on building construction during the year ended December 31, 2010, however, remained constrained by tight credit availability and muted demand for new facilities. Preliminary economic reports indicate that the multi-year decline in building construction ended during the fourth quarter of 2010, however, and early projections for 2011 are for positive growth in this sector of the economy.
Growth in the Company’s net sales accelerated throughout the year, finishing with a 14.9% increase during the fourth quarter of 2010, compared to the same period of 2009. Net sales for the year ended December 31, 2010 increased 5.4%, compared to the year ended December 31, 2009. Price inflation driven by rising commodity prices, particularly copper, contributed significantly to the Company’s sales growth. Gross margin increased 1.4% for the year ended December 31, 2010, compared to the same period of 2009, though the Company’s gross margin as a percent of sales declined to 18.8% in 2010 from 19.5% in 2009.
The Company expects moderate growth in net sales, improved gross margin as a percent of net sales, and increased net income for 2011.
11
Consolidated Results of Operations
The following table sets forth certain information relating to the operations of the Company stated in thousands of dollars and as a percentage of net sales for the years ended December 31, 2010, 2009, and 2008:
| | | 2010 | | | 2009 | | | 2008 | |
| | | Dollars | | | Percent | | | Dollars | | | Percent | | | Dollars | | | Percent | |
Net Sales | | $ | 4,616,377 | | | 100.0 | % | $ | 4,377,882 | | | 100.0 | % | $ | 5,400,154 | | | 100.0 | % |
Cost of merchandise sold | | | (3,749,736 | ) | | (81.2 | ) | | (3,522,932 | ) | | (80.5 | ) | | (4,354,935 | ) | | (80.7 | ) |
Gross Margin | | | 866,641 | | | 18.8 | | | 854,950 | | | 19.5 | | | 1,045,219 | | | 19.3 | |
Selling, general and administrative expenses | | | (753,988 | ) | | (16.3 | ) | | (745,886 | ) | | (17.0 | ) | | (857,970 | ) | | (15.9 | ) |
Depreciation and amortization | | | (39,725 | ) | | (0.9 | ) | | (39,352 | ) | | (0.9 | ) | | (37,980 | ) | | (0.7 | ) |
Other income, net | | | 4,608 | | | 0.1 | | | 2,786 | | | 0.1 | | | 2,856 | | | 0.1 | |
Income from Operations | | | 77,536 | | | 1.7 | | | 72,498 | | | 1.7 | | | 152,125 | | | 2.8 | |
Interest expense, net | | | (8,062 | ) | | (0.2 | ) | | (9,967 | ) | | (0.2 | ) | | (12,539 | ) | | (0.2 | ) |
Income before provision for income taxes | | | 69,474 | | | 1.5 | | | 62,531 | | | 1.5 | | | 139,586 | | | 2.6 | |
Provision for income taxes | | | (27,181 | ) | | (0.6 | ) | | (25,089 | ) | | (0.6 | ) | | (52,026 | ) | | (1.0 | ) |
Net Income | | | 42,293 | | | 0.9 | | | 37,442 | | | 0.9 | | | 87,560 | | | 1.6 | |
Net income attributable to
noncontrolling interests | | | (295 | ) | | -- | | | (165 | ) | | -- | | | (160 | ) | | -- | |
Net Income attributable toGraybar Electric Company, Inc. | | $ | 41,998 | | | 0.9 | % | $ | 37,277 | | | 0.9 | % | $ | 87,400 | | | 1.6 | % |
2010 Compared to 2009
Net sales totaled $4,616,377 for the year ended December 31, 2010, compared to $4,377,882 for the year ended December 31, 2009, an increase of $238,495 or 5.4%. Net sales to the electrical and comm/data market sectors during the year ended December 31, 2010 increased 3.1% and 11.4%, respectively, compared to the year ended December 31, 2009.
Gross margin increased $11,691, or 1.4%, to $866,641 from $854,950, due to higher net sales for the year ended December 31, 2010, compared to the year ended December 31, 2009. The Company’s gross marginas a percent ofnet sales was 18.8% for the year ended December 31, 2010, down from 19.5% in 2009, primarily due to price competition and rising product costs.
Selling, general and administrative expenses increased $8,102, or 1.1%, to $753,988, for the year ended December 31, 2010, compared to $745,886 for the year ended December 31, 2009, mainly due to higher employee compensation costs. Selling, general and administrative expenses as a percentage of net sales for the year ended December 31, 2010 were 16.3%, down from 17.0% in 2009.
Depreciation and amortization expenses for the year ended December 31, 2010 increased $373, or 0.9%, to $39,725 from $39,352 for the year ended December 31, 2009. This increase was due primarily to an increase in information technology assets. Depreciation and amortization expenses as a percentage of net sales remained flat at 0.9% for the year ended December 31, 2010, compared to the year ended December 31, 2009.
Other income, net consists primarily of gains on the disposal of property, trade receivable interest charges to customers, and other miscellaneous income items related to the Company’s business activities. Other income, net totaled $4,608 for the year ended December 31, 2010, compared to $2,786 for the year ended December 31, 2009. Gains on the sale of real and personal property, net of losses, were $1,177 for the year ended December 31, 2010, compared to gains on the disposal of property of $524 for the year ended December 31, 2009. Other income, net for the year ended December 31, 2009, included property impairment losses of $(576), primarily on assets that were held for sale.
Income from operations totaled $77,536 for the year ended December 31, 2010, an increase of $5,038, or 6.9%, from $72,498 for the year ended December 31, 2009. The increase was due to higher net sales, gross margin, and other income, net, partially offset by increases in selling, general and administrative expenses and depreciation and amortization expenses.
Interest expense, net declined $1,905, or 19.1%, to $8,062 for the year ended December 31, 2010 from $9,967 for the year ended December 31, 2009. This reduction was mainly due to a lower level of outstanding long-term debt during the year ended December 31, 2010, compared to 2009.
The increase in income from operations and lower interest expense, net resulted in income before provision for income taxes of $69,474 for the year ended December 31, 2010, an increase of $6,943, or 11.1%, compared to $62,531 for the year ended December 31, 2009.
12
The Company’s total provision for income taxes increased $2,092, or 8.3%, to $27,181 for the year ended December 31, 2010 from $25,089 the year ended December 31, 2009, as a result of higher income before provision for income taxes. The Company’s effective tax rate was 39.1% for the year ended December 31, 2010, down from 40.1% for the year ended December 31, 2009. The effective tax rates for the years ended December 31, 2010 and 2009 were higher than the 35.0% US federal statutory rate primarily due to state and local income taxes.
Net income attributable to Graybar Electric Company, Inc. for the year ended December 31, 2010 increased $4,721, or 12.7%, to $41,998 from $37,277 for the year ended December 31, 2009.
2009 Compared to 2008
Net sales totaled $4,377,882 for the year ended December 31, 2009, compared to $5,400,154 for the year ended December 31, 2008, a decrease of $1,022,272 or 18.9%. Net sales to the electrical and comm/data market sectors during the year ended December 31, 2009 decreased 20.8% and 15.7%, respectively, compared to the year ended December 31, 2008.
Gross margin decreased $190,269, or 18.2%, to $854,950 from $1,045,219, due to lower net sales for the year ended December 31, 2009, compared to the year ended December 31, 2008. The Company’s gross marginas a percent ofnet sales was 19.5% for the year ended December 31, 2009, compared to 19.3% in 2008.
Selling, general and administrative expenses decreased $112,084, or 13.1%, to $745,886, for the year ended December 31, 2009, compared to $857,970 for the year ended December 31, 2008, mainly due to lower employee compensation and benefit costs. Selling, general and administrative expenses as a percentage of net sales for the year ended December 31, 2009 were 17.0%, up from 15.9% in 2008.
Depreciation and amortization expenses for the year ended December 31, 2009 increased $1,372, or 3.6%, to $39,352 from $37,980 for the year ended December 31, 2008. This increase was due primarily to an increase in information technology assets. Depreciation and amortization expenses as a percentage of net sales increased to 0.9% for the year ended December 31, 2009, compared to 0.7% of net sales for the year ended December 31, 2008.
Other income, net consists primarily of gains on the disposal of property, trade receivable interest charges to customers, and other miscellaneous income items related to the Company’s business activities. Other income, net totaled $2,786 for the year ended December 31, 2009, compared to $2,856 for the year ended December 31, 2008. Other income, net includes property impairment losses of $(576) for the year ended December 31, 2009, compared to property impairment losses of $(340) in the prior year. The impairment losses were primarily on assets that were held for sale and expected to be disposed of within twelve months. Gains on the sale of real and personal property, net of losses, were $524 for the year ended December 31, 2009, compared to losses on the disposal of property of $(108) for the year ended December 31, 2008.
Income from operations totaled $72,498 for the year ended December 31, 2009, a decrease of $79,627, or 52.3%, from $152,125 for the year ended December 31, 2008. The decrease was due to lower net sales and gross margin, higher depreciation and amortization expenses, and lower other income, net, partially offset by decreases in selling, general and administrative expenses.
Interest expense, net declined $2,572, or 20.5%, to $9,967 for the year ended December 31, 2009 from $12,539 for the year ended December 31, 2008. This reduction was mainly due to a lower level of outstanding long-term debt during the year ended December 31, 2009, compared to 2008.
The decrease in income from operations and lower interest expense, net resulted in income before provision for income taxes of $62,531 for the year ended December 31, 2009, a decrease of $77,055, or 55.2%, compared to $139,586 for the year ended December 31, 2008.
The Company’s total provision for income taxes decreased $26,937, or 51.8%, to $25,089 for the year ended December 31, 2009 from $52,026forthe year ended December 31, 2008, as a result of lower income before provision for income taxes. The Company’s effective tax rate increased to 40.1% for the year ended December 31, 2009, up from 37.3% for the year ended December 31, 2008. The Company settled income tax-related issues during the year ended December 31, 2008, and approximately $2,600 of unrecognized tax benefits related to uncertain tax positions were released, producing a lower effective tax rate for that period. The effective tax rates for the years ended December 31, 2009 and 2008 were higher than the 35.0% US federal statutory rate primarily due to state and local income taxes.
Net income attributable to Graybar Electric Company, Inc. for the year ended December 31, 2009 decreased $50,123, or 57.3%, to $37,277 from $87,400 for the year ended December 31, 2008.
13
Financial Condition and Liquidity
The Company has historically funded its working capital requirements using cash flows generated by the collection of trade receivables and trade accounts payable terms with its suppliers, supplemented by short-term bank lines of credit. Capital assets are financed primarily by common stock sales to the Company’s employees and long-term debt.
Cash Flow Information For the Years Ended December 31, | | 2010 | | | 2009 | | | 2008 | |
Net cash (used) provided by operations | $ | (10,240 | ) | $ | 114,365 | | $ | 148,628 | |
Net cash used by investing activities | | (29,120 | ) | | (25,012 | ) | | (45,045 | ) |
Net cash used by financing activities | | (42,148 | ) | | (55,932 | ) | | (39,307 | ) |
Net (Decrease) Increase in Cash | $ | (81,508 | ) | $ | 33,421 | | $ | 64,276 | |
Operating Activities
Net cash used by operations was $10,240 for the year ended December 31, 2010, compared to net cash provided by operations of $114,365 for the year ended December 31, 2009. Negative cash flows from operations for the year ended December 31, 2010 were primarily attributable to increases in trade receivables of $100,812 and merchandise inventory of $80,728 resulting from accelerating net sales growth during the second half of 2010, partially offset by increases in trade accounts payable of $69,076 and accrued payroll and benefit costs of $28,572.
Trade receivables increased during 2010, due primarily to a 5.4% increase in net sales for the year ended December 31, 2010, compared to the year ended December 31, 2009. As a result of this sales increase, the average number of days of sales outstanding at December 31, 2010, measured using annual sales, increased significantly, compared to the average number of days at December 31, 2009. Average days of sales outstanding for the three month period ended December 31, 2010, increased modestly, compared to the same three month period of 2009. Average inventory turnover decreased significantly for the year ended December 31, 2010, compared to the same period of 2009. Merchandise inventory turnover for the three month period ended December 31, 2010, declined moderately, compared to the same three month period of 2009.
Current assets exceeded current liabilities by $415,724 at December 31, 2010, a decrease of $9,269, or 2.2%, from $424,993 at December 31, 2009.
Investing Activities
Net cash used by investing activities totaled $29,120 for the year ended December 31, 2010, compared to $25,012 for the year ended December 31, 2009. Capital expenditures for property were $33,624 and $27,263, and proceeds from the disposal of property were $3,880 and $1,633, for the years ended December 31, 2010 and 2009, respectively. The proceeds received resulted primarily from the sale of real property in 2010 and 2009. Cash received from the Company’s investment in affiliated company was $624 and $618, for the years ended December 31, 2010 and 2009, respectively, and relates to the Company’s membership in Graybar Financial Services, LLC.
Financing Activities
Net cash used by financing activities totaled $42,148 for the year ended December 31, 2010, compared to $55,932 for the year ended December 31, 2009.
Cash provided by short-term borrowings was $4,463 for the year ended December 31, 2010, compared to cash used to decrease short-term borrowings of $5,217 for the year ended December 31, 2009. The Company made payments on long-term debt, including current portion, of $32,160 and capital lease obligations of $1,968 during the year ended December 31, 2010. The Company made payments on long-term debt, including current portion, of $32,085 and capital lease obligations of $801 during the year ended December 31, 2009.
Cash provided by the sale of common stock amounted to $9,799 and $11,392, and purchases of treasury stock were $10,448 and $11,901, for the years ended December 31, 2010 and 2009, respectively. Cash paid to purchase noncontrolling interest stock was $151 and $109, and there was no cash provided by the sale of noncontrolling interest stock for the year ended December 31, 2010, compared to $464 for the year ended December 31, 2009. Cash dividends paid were $20,211 and $17,675, for the years ended December 31, 2010 and 2009, respectively.
Cash and cash equivalents were $82,356 at December 31, 2010, a decrease of $81,508, or 49.7%, from $163,864 at December 31, 2009.
Liquidity
The Company has a revolving credit agreement with a group of thirteen banks at an interest rate based on the London Interbank Offered Rate (“LIBOR”) that consists of an unsecured $200,000 five-year facility expiring in May 2012. There were no amounts outstanding under this credit agreement at December 31, 2010 and 2009.
14
At December 31, 2009, the Company had a $100,000 trade receivable securitization program that was scheduled to expire in October 2010. Prior to expiration, the Company amended the trade receivable securitization program agreement, effective as of October 8, 2010, to extend the program to October 2011. The trade receivable securitization program provides for the sale of certain of the Company’s trade receivables on a revolving basis to Graybar Commerce Corporation (“GCC”), a wholly-owned, bankruptcy-remote, special-purpose subsidiary. GCC sells an undivided interest in the trade receivables to an unrelated multi-seller commercial paper conduit. In the event that a dislocation in the market for the conduit’s receivables-backed commercial paper develops and the conduit is unable to purchase the undivided interest offered by GCC, the agent bank for the trade receivable securitization program is obligated to purchase the undivided interest in the trade receivables from GCC under the terms of the program.
The Company accounts for the securitization as an on-balance sheet financing arrangement because the Company has maintained effective control of the trade receivables through a call option that gives GCC the unilateral right to repurchase the undivided interests. Accordingly, the trade receivables and related debt are included in the accompanying consolidated balance sheets. GCC has granted a security interest in its trade receivables to the commercial paper conduit. There were no borrowings outstanding under the trade receivable securitization program at December 31, 2010 and 2009.
At December 31, 2010, the Company had available to it unused lines of credit amounting to $307,308, compared to $310,504 at December 31, 2009. These lines are available to meet the short-term cash requirements of the Company and certain committed lines of credit have annual fees of up to 67 basis points (0.67%) and 92 basis points (0.92%) of the committed lines of credit as of December 31, 2010 and 2009, respectively.
Short-term borrowings outstanding during the years ended December 31, 2010 and 2009 ranged from a minimum of $10,786 and $11,189 to a maximum of $20,962 and $65,858, respectively. Short-term borrowings outstanding atDecember 31, 2010 and 2009 totaled $19,695 and $15,232, respectively, and were drawn by the Company’s Canadian subsidiary against a bank line of credit secured by all personal property of that subsidiary.
The revolving credit agreement, the trade receivable securitization program, and certain other note agreements contain various covenants that limit the Company’s ability to make investments, pay dividends, incur debt, dispose of property, and issue equity securities. The Company is also required to maintain certain financial ratios as defined in the agreements. The Company was in compliance with all covenants under these agreements as of December 31, 2010 and 2009.
The Company has a lease agreement with an independent lessor, which provides $28,720 of financing for five of the Company’s distribution facilities. The agreement carries a five-year term expiring July 2013. The financing structure used with this lease qualifies as a silo of a variable interest entity. In accordance with US GAAP, the Company, as the primary beneficiary, consolidates the silo in its financial statements.
As of December 31, 2010, the consolidated silo included in the Company’s consolidated financial statements had a net property balance of $15,775, long-term debt of $27,715, and a noncontrolling interest of $1,005. At December 31, 2009, the consolidated silo included in the Company’s consolidated financial statements had a net property balance of $16,299, long-term debt of $27,715, and a noncontrolling interest of $1,005.
Under the terms of the lease agreement, the amount guaranteed by the Company as the residual fair value of the property subject to the lease arrangement was $28,720 at December 31, 2010 and 2009.
Contractual Obligations and Commitments
The Company has the following contractual obligations as of December 31, 2010:
| | | | Payments due by period |
Contractual obligations | | Total | | 2011 | | 2012 and 2013 | | 2014 and 2015 | | After 2015 |
Long-term debt obligations | $ | 102,907 | $ | 35,107 | $ | 57,521 | $ | 10,279 | $ | -- |
Capital lease obligations | | 6,951 | | 3,007 | | 3,371 | | 573 | | -- |
Operating lease obligations | | 96,875 | | 19,640 | | 29,214 | | 18,033 | | 29,988 |
Purchase obligations | | 542,669 | | 542,669 | | -- | | -- | | -- |
Total | $ | 749,402 | $ | 600,423 | $ | 90,106 | $ | 28,885 | $ | 29,988 |
Long-term debt and capital lease obligations consist of both principal and interest payments.
Purchase obligations consist of open purchase orders issued in the normal course of business. Many of thesepurchaseobligations may be cancelled with limited or no financial penalties.
15
The table above does not include $63,616 of accrued, unfunded pension cost, $88,044 of accrued, unfunded employment-related benefits cost, of which $79,762 is related to the Company’s postretirement benefit plan, and $3,843 in contingent payments for uncertain tax positions because it is not certain when these obligations will be settled or paid.
The Company also expects to make contributions totaling approximately $40,800 to its defined benefit pension plan during 2011 that are not included in the table. The Company contributed $40,763 to its defined benefit pension plan in 2010.
Critical Accounting Policies
The consolidated financial statements are prepared in accordance with US GAAP, which require the Company to make estimates and assumptions (see Note 2 in notes to the consolidated financial statements located in Item 8., “Financial Statements and Supplementary Data”, of this Annual Report on Form 10-K). The Company believes the following accounting policies have the potential to have a more significant impact on its financial statements either because of the significance of the financial statement item to which they relate or because they involve a higher degree of judgment and complexity.
Revenue Recognition
Revenue is recognized when evidence of a customer arrangement exists, prices are fixed and determinable, product title, ownership and risk of loss transfers to the customer, and collectability is reasonably assured. Revenues recognized are primarily for product sales, but also include freight and handling charges. The Company’s standard shipping terms are FOB shipping point, under which, product title passes to the customer at the time of shipment. The Company does, however, fulfill some customer orders based on shipping terms of FOB destination, whereby title passes to the customer at the time of delivery. The Company also earns revenue for services provided to customers for supply chain management and logistics services. Service revenue, which accounts for less than one percent (1%) of net sales, is recognized when services are rendered and completed. Revenue is reported net of all taxes assessed by governmental authorities as a result of revenue-producing transactions, primarily sales tax.
Allowance for Doubtful Accounts
The Company performs ongoing credit evaluations of its customers, and a significant portion of its trade receivables is secured by mechanic’s lien or payment bond rights. The Company maintains allowances to reflect the expected uncollectability of trade receivables based on past collection history, the economic environment, and specific risks identified in the receivables portfolio. Although actual credit losses have historically been within management’s expectations, additional allowances may be required if the financial condition of the Company’s customers were to deteriorate.
Income Taxes
The Company recognizes deferred tax assets and liabilities to reflect the future tax consequences of events that have been recognized in the financial statements or tax returns. Uncertainty exists regarding tax positions taken in previously filed tax returns still subject to examination and positions expected to be taken in future returns. A deferred tax asset or liability results from the temporary difference between an item’s carrying value as reflected in the financial statements and its tax basis, and is calculated using enacted applicable tax rates. The Company assesses the likelihood that its deferred tax assets will be recovered from future taxable income and, to the extent it believes that recovery is not likely, a valuation allowance is established. Changes in the valuation allowance, when recorded, are included in the provision for income taxes in the consolidated financial statements. The Company classifies interest expense and penalties as part of its provision for income taxes based upon applicable federal and state interest/underpayment percentages.
Merchandise Inventory
The Company values its inventories at the lower of cost (determined using the last-in, first-out (“LIFO”) cost method) or market. LIFO accounting is a method of accounting that, compared with other inventory accounting methods, generally provides better matching of current costs with current revenues. In assessing the ultimate realization of inventories, the Company makes judgments as to its return rights to suppliers and future demand requirements. If actual future demand, market conditions, or supplier return provisions are less favorable than those projected by management, additional inventory write-downs may be required.
Pension and Postretirement Benefits Plans
The Company’s pension and postretirement benefits obligations and expenses are determined based on the selection of certain assumptions developed by the Company and used by actuaries in calculating such amounts. For the Company’s pension obligation, the most significant assumptions are the expected long-term rate of return on plan assets and the discount rate used to discount plan liabilities. For the Company’s postretirement benefits plan liability, the most significant assumption is the interest rate used to discount the plan obligations.
16
The following tables present key assumptions used to measure the pension and postretirement benefit obligation at December 31:
| Pension Benefits | | | Postretirement Benefits |
| | 2010 | | | 2009 | | | | 2010 | | | 2009 | |
Discount rate | | 5.50 | % | | 5.75 | % | | | 4.75 | % | | 5.00 | % |
Expected return on plan assets | | 6.25 | % | | 6.25 | % | | | -- | | | -- | |
While management believes that the assumptions selected by the Company are appropriate, differences in actual experience or changes in assumptions may affect the Company’s pension and postretirement benefits obligations and future pension and postretirement benefits expense. For example, holding all other assumptions constant, a one percent (1%) decrease in the discount rate used to calculate both pension expense for 2010 and the pension liability as of December 31, 2010 would have increased pension expense by $3,934 and the pension liability by $37,989, respectively. Similarly, a one percent (1%) decrease in the discount rate would have increased 2010 postretirement benefits expense by $138 and the December 31, 2010 postretirement benefits liability by $6,292.
A decrease in the expected long-term rate of return on plan assets could result in higher pension expense and increase or accelerate the Company’s contributions to thedefined benefitpension plan in future years. As an example, holding all other assumptions constant, a one percent (1%) decrease in the assumed rate of return on plan assets would have increased 2010 pension expense by $3,501.
Supplier Volume Incentives
The Company’s agreements with many of its suppliers provide for the Company to earn volume incentives based on purchases during the agreement period. These agreements typically provide for the incentives to be paid quarterly or annually in arrears. The Company estimates amounts to be received from suppliers at the end of each reporting period based on the earnout level that the Company believes is probable of being achieved. The Company records the incentive ratably over the year as a reduction of cost of merchandise sold as the related inventory is sold. Changes in the estimated amount of incentives are treated as changes in estimate and are recognized in earnings in the period in which the change in estimate occurs. In the event that the operating performance of the Company’s suppliers were to decline, however, there can be no assurance that amounts earned would be paid or that the volume incentives would continue to be included in future agreements.
New Accounting Standards
No new accounting standards that were issued or became effective during 2010 have had or are expected to have a material impact on the Company’s consolidated financial statements.
In January 2010, the FASB issued Accounting Standards Update No. 2010-06, “Improving Disclosures about Fair Value Measurements”. The Update amends the guidance on fair value measurements that requires companies to disclose separately the amount of significant transfers in and out of Level 1 and Level 2 fair value measurements and describe the reasons for the transfers. In addition, the Update requires companies to present separately information about purchases, sales, issuances and settlements in the reconciliation for fair value measurements using significant unobservable inputs, that is, Level 3 assets in the fair value hierarchy. The disclosures related to Level 1 and Level 2 fair value measurements are effective for interim and annual reporting periods beginning after December 15, 2009, while the disclosures related to Level 3 assets are effective for interim and annual reporting periods beginning after December 15, 2010. The Company adopted this standard as of January 1, 2010, except for the disclosures about purchases, sales, issuances, and settlements in the rollforward activity in Level 3 fair value measurements. These disclosures had no impact on the Company’s results of operations, financial position, or cash flows.
The Patient Protection and Affordable Care Act and the Health Care and Education Reconciliation Act of 2010
The Patient Protection and Affordable Care Act and the Health Care and Education Reconciliation Act of 2010 (collectively the "Acts") were enacted by the US Congress in March 2010. The Acts have both short- and long-term implications for benefit plan standards. Implementation of this legislation is planned to occur in phases, with some plan standard changes taking effect beginning in 2010 and other changes becoming effective through 2018.
In the short term, the Company’s healthcare costs are expected to increase due to the Acts’ raising of the maximum eligible age for covered dependents to receive benefits, the elimination of the lifetime dollar limits per covered individual, and restrictions on annual dollar limits on essential benefits per covered individual, among other standard requirements. In the long term, the Company’s healthcare costs may increase due to the enactment of the excise tax on “high cost” healthcare plans.
17
The Company continues to evaluate the impact, if any, the Acts will have on its financial statements as new regulations under the Acts are issued. The Company expects the general trend in healthcare costs to continue to rise and the effects of the Acts, and any future legislation, could materially impact the cost of providing healthcare benefits for many employers, including the Company.
Item 7A. Quantitative and Qualitative Disclosures About Market Risk
Market risk is the risk of loss arising from adverse changes in market rates and prices, including interest rates, foreign currency exchange rates, commodity prices and equity prices. The Company’s primary exposures to market risk are interest rate risk associated with debt obligations, foreign currency exchange rate risk, and commodity risk.
Interest Rate Risk
The Company’s interest expense is sensitive to changes in the general level of interest rates. Changes in interest rates have different impacts on the fixed-rate and variable-rate portions of the Company’s debt portfolio. A change in market interest rates on the fixed-rate portion of the debt portfolio impacts the fair value of the financial instrument, but has no impact on interest incurred or cash flows. A change in market interest rates on the variable-rate portion of the debt portfolio impacts the interest incurred and cash flows, but does not impact the fair value of the financial instrument. To mitigate the cash flow impact of interest rate fluctuations on the cost of financing its capital assets, the Company generally maintains a significant portion of its long-term debt as fixed-rate in nature.
Based on $56,074 in variable-rate debt outstanding at December 31, 2010, a one percent (1%) increase in interest rates would increase the Company’s interest expense by $561 per annum.
The following table provides information about financial instruments that are sensitive to changes in interest rates. The table presents principal payments on debt and related weighted-average interest rates by expected maturity dates.
| | | | | | | | | | | | | | | December 31, 2010 |
Debt Instruments | | 2011 | | 2012 | | 2013 | | 2014 | | 2015 | | After 2015 | | | Total | | Fair Value |
Long-term, | | | | | | | | | | | | | | | | | |
fixed-rate debt | $ | 31,756 | | 13,514 | | 12,580 | | 831 | | 1,990 | | -- | | $ | 60,671 | $ | 57,856 |
Weighted-average interest rate | | 6.85 | % | 6.15 | % | 6.06 | % | 4.54 | % | 5.57 | % | -- | | | | | |
| | | | | | | | | | | | | | | | | |
Long-term, | | | | | | | | | | | | | | | | | |
variable-rate debt | $ | 435 | | 435 | | 28,150 | | 435 | | 6,924 | | -- | | $ | 36,379 | $ | 36,379 |
Weighted-average interest rate | | 4.25 | % | 4.25 | % | 1.88 | % | 4.25 | % | 4.25 | % | -- | | | | | |
| | | | | | | | | | | | | | | | | |
Short-term, variable- rate borrowings | $ | 19,695 | | -- | | -- | | -- | | -- | | -- | | $ | 19,695 | $ | 19,695 |
Weighted-average interest rate | | 3.35 | % | -- | | -- | | -- | | -- | | -- | | | | | |
The fair value of long-term debt is estimated by discounting cash flows using current borrowing rates available for debt of similar maturities.
The Company entered into a swap agreement to manage interest rates on amounts due under a leveraged lease arrangement in September 2000. The swap agreement, which expires in July 2013, is based on a notional amount of $28,720. The agreement calls for an exchange of interest payments, with the Company being paid a LIBOR-based floating rate and paying a fixed rate of 6.92%. There is no exchange of the notional amount upon which the payments are based. The fair value of the swap agreement at December 31, 2010 and 2009 was approximately $(4,706) and $(4,969), respectively. The negative value of this agreement reflects the current low level of interest rates compared to market interest rates in September 2000, when the agreement was entered into. A one percent (1%) increase in LIBOR for all maturities through July 2013 would have increased the fair value of the swap agreement by approximately $866 and $902 as of December 31, 2010 and 2009, respectively.
18
Foreign Currency Exchange Rate Risk
The functional currency for the Company’s Canadian subsidiary is the Canadian dollar. Accordingly, its balance sheet amounts are translated at the exchange rates in effect at year-end and its income and expenses are translated using average exchange rates prevailing during the year. Currency translation adjustments are included in accumulated other comprehensive loss. Exposure to foreign currency exchange rate fluctuations is not material.
Commodity Risk
The Company has a moderate level of primary exposure to commodity price risk on wire and cable, steel conduit, and many other products that contain copper or steel or both. Graybar does not purchase commodities directly, however.
CAUTIONARY STATEMENT ABOUT FORWARD-LOOKING STATEMENTS:
Management’s Discussion and Analysis of Financial Condition and Results of Operations as of and for the year ended December 31, 2010, included in our Annual Report on Form 10-K for such period as filed with the SEC, should be read in conjunction with our accompanying audited consolidated financial statements and the notes thereto.
Certain statements, other than purely historical information, including estimates, projections, statements relating to the Company’s business plans, objectives, and expected operating results, and the assumptions upon which those statements are based, are “forward-looking statements” within the meaning of the Private Securities Litigation Reform Act of 1995, Section 27A of the Securities Act of 1933, and Section 21E of the Securities Exchange Act of 1934. These forward-looking statements generally are identified by the words “believes”, “projects”, “expects”, “anticipates”, “estimates”, “intends”, “strategy”, “plan”, “may”, “will”, “would”, “will be”, “will continue”, “will likely result”, and similar expressions. The Company intends such forward-looking statements to be covered by the safe-harbor provisions for forward-looking statements contained in the Private Securities Litigation Reform Act of 1995. Forward-looking statements are based on current expectations and assumptions that are subject to risks and uncertainties that may cause actual results to differ materially from the forward-looking statements. The Company’s ability to predict results or the actual effect of future plans or strategies is inherently uncertain. Factors which could have a material adverse impact on the Company’s operations and future prospects on a consolidated basis include, but are not limited to: general economic conditions, particularly in the residential, commercial, and industrial building construction industries, volatility in the prices of industrial metal commodities, disruptions in the Company’s sources of supply, a sustained interruption in the operation of the Company’s information systems, adverse legal proceedings or other claims, and the inability, or limitations on the Company’s ability, to raise debt or equity capital. These risks and uncertainties should also be considered in evaluating forward-looking statements and undue reliance should not be placed on such statements. The Company undertakes no obligation to update or revise publicly any forward-looking statements, whether as a result of new information, future events or otherwise. Further information concerning our business, including additional factors that could materially impact our financial results, is included herein and in our other filings with the SEC. Actual results and the timing of events could differ materially from the forward-looking statements as a result of certain factors, a number of which are outlined in Item 1A., “Risk Factors”, of this Annual Report on Form 10-K for the year ended December 31, 2010.
Item 8. Financial Statements and Supplementary Data
19
REPORT OF INDEPENDENT REGISTERED PUBLIC ACCOUNTING FIRM
The Board of Directors and Shareholders
Graybar Electric Company, Inc.
We have audited the accompanying consolidated balance sheets of Graybar Electric Company, Inc. (the Company) as of December 31, 2010 and 2009, and the related consolidated statements of income, changes in shareholders’ equity, and cash flows for each of the three years in the period ended December 31, 2010. These financial statements are the responsibility of the Company’s management. Our responsibility is to express an opinion on these financial statements based on our audits.
We conducted our audits in accordance with the standards of the Public Company Accounting Oversight Board (United States). Those standards require that we plan and perform the audit to obtain reasonable assurance about whether the financial statements are free of material misstatement. We were not engaged to perform an audit of the Company’s internal control over financial reporting. Our audits included consideration of internal control over financial reporting as a basis for designing audit procedures that are appropriate in the circumstances, but not for the purpose of expressing an opinion on the effectiveness of the Company’s internal control over financial reporting. Accordingly, we express no such opinion. An audit also includes examining, on a test basis, evidence supporting the amounts and disclosures in the financial statements, assessing the accounting principles used and significant estimates made by management, and evaluating the overall financial statement presentation. We believe that our audits provide a reasonable basis for our opinion.
In our opinion, the financial statements referred to above present fairly, in all material respects, the consolidated financial position of Graybar Electric Company, Inc. at December 31, 2010 and 2009, and the consolidated results of its operations and its cash flows for each of the three years in the period ended December 31, 2010, in conformity with U.S. generally accepted accounting principles.
/s/ Ernst & Young LLP
St. Louis, Missouri
March 8, 2011
20
Graybar Electric Company, Inc. and Subsidiaries
Consolidated Statements of Income
| | For the Years Ended December 31, | |
(Stated in thousands except per share data) | | 2010 | | | 2009 | | | 2008 | |
Net Sales | $ | 4,616,377 | | $ | 4,377,882 | | $ | 5,400,154 | |
Cost of merchandise sold | | (3,749,736 | ) | | (3,522,932 | ) | | (4,354,935 | ) |
Gross Margin | | 866,641 | | | 854,950 | | | 1,045,219 | |
Selling, general and administrative expenses | | (753,988 | ) | | (745,886 | ) | | (857,970 | ) |
Depreciation and amortization | | (39,725 | ) | | (39,352 | ) | | (37,980 | ) |
Other income, net | | 4,608 | | | 2,786 | | | 2,856 | |
Income from Operations | | 77,536 | | | 72,498 | | | 152,125 | |
Interest expense, net | | (8,062 | ) | | (9,967 | ) | | (12,539 | ) |
Income before provision for income taxes | | 69,474 | | | 62,531 | | | 139,586 | |
Provision for income taxes | | (27,181 | ) | | (25,089 | ) | | (52,026 | ) |
Net Income | | 42,293 | | | 37,442 | | | 87,560 | |
Net income attributable to noncontrolling interests | | (295 | ) | | (165 | ) | | (160 | ) |
Net Income attributable to Graybar Electric Company, Inc. | $ | 41,998 | | $ | 37,277 | | $ | 87,400 | |
Net Income attributable to Graybar Electric Company, Inc. per share of Common Stock (A) | $ | 3.61 | | $ | 3.18 | | $ | 7.51 | |
(A) Adjusted for the declaration of a 10 percent (10%) stock dividend in December 2010, shares related to which were issued in February 2011. Prior to the adjustment, the average common shares outstanding were 10,644 and 10,579 for the years ended December 31, 2009 and 2008, respectively.
The accompanying Notes to Consolidated Financial Statements are an integral part of the Consolidated Financial Statements.
21
Graybar Electric Company, Inc. and Subsidiaries
Consolidated Balance Sheets
| | | | | | December 31, | |
(Stated in thousands except share and per share data) | | | | | | 2010 | | | | 2009 | |
ASSETS | | | | | | | | | | | |
Current Assets | | | | | | | | | | | |
Cash and cash equivalents | | | | | $ | 82,356 | | | $ | 163,864 | |
Trade receivables (less allowances of $7,299 and $6,217, respectively) | | | 678,212 | | | | 577,400 | |
Merchandise inventory | | | | | | 390,350 | | | | 309,622 | |
Other current assets | | | | | | 15,891 | | | | 27,353 | |
Total Current Assets | | | | | | 1,166,809 | | | | 1,078,239 | |
Property, at cost | | | | | | | | | | | |
Land | | | | | | 49,890 | | | | 47,743 | |
Buildings | | | | | | 349,781 | | | | 337,781 | |
Furniture and fixtures | | | | | | 176,814 | | | | 172,753 | |
Software | | | | | | 76,906 | | | | 76,906 | |
Capital leases | | | | | | 10,214 | | | | 5,205 | |
Total Property, at cost | | | | | | 663,605 | | | | 640,388 | |
Less – accumulated depreciation and amortization | | | (362,793 | ) | | | (336,686 | ) |
Net Property | | | | | | 300,812 | | | | 303,702 | |
Other Non-current Assets | | | | | | 51,817 | | | | 50,012 | |
Total Assets | | | | | $ | 1,519,438 | | | $ | 1,431,953 | |
LIABILITIES | | | | | | | | | | | |
Current Liabilities | | | | | | | | | | | |
Short-term borrowings | | | | | $ | 19,695 | | | $ | 15,232 | |
Current portion of long-term debt | | | | | | 32,191 | | | | 36,068 | |
Trade accounts payable | | | | | | 520,355 | | | | 451,279 | |
Accrued payroll and benefit costs | | | | | | 95,511 | | | | 66,939 | |
Other accrued taxes | | | | | | 15,248 | | | | 15,378 | |
Dividends payable | | | | | | 11,686 | | | | 10,660 | |
Other current liabilities | | | | | | 56,399 | | | | 57,690 | |
Total Current Liabilities | | | | | | 751,085 | | | | 653,246 | |
Postretirement Benefits Liability | | | | | | 72,462 | | | | 66,336 | |
Pension Liability | | | | | | 62,816 | | | | 77,699 | |
Long-term Debt | | | | | | 64,859 | | | | 80,959 | |
Other Non-current Liabilities | | | | | | 9,409 | | | | 15,544 | |
Total Liabilities | | | | | | 960,631 | | | | 893,784 | |
SHAREHOLDERS’ EQUITY | | | | | | | | | | | |
| Shares at December 31, | | | | | | | | |
Capital Stock | 2010 | | 2009 | | | | | | | | |
Common, stated value $20.00 per share | | | | | | | | | | | |
Authorized | 20,000,000 | | 15,000,000 | | | | | | | | |
Issued to voting trustees | 9,498,347 | | 8,638,604 | | | | | | | | |
Issued to shareholders | 2,148,384 | | 1,984,686 | | | | | | | | |
In treasury, at cost | (26,755 | ) | (24,808 | ) | | | | | | | |
Outstanding Common Stock | 11,619,976 | | 10,598,482 | | | 232,400 | | | | 211,970 | |
Common shares subscribed | 565,844 | | 502,875 | | | 11,317 | | | | 10,058 | |
Less subscriptions receivable | (565,844 | ) | (502,875 | ) | | (11,317 | ) | | | (10,058 | ) |
Retained Earnings | | 423,602 | | | | 423,920 | |
Accumulated Other Comprehensive Loss | | (102,343 | ) | | | (102,599 | ) |
Total Graybar Electric Company, Inc. Shareholders’ Equity | | 553,659 | | | | 533,291 | |
Noncontrolling Interests | | 5,148 | | | | 4,878 | |
Total Shareholders’ Equity | | 558,807 | | | | 538,169 | |
Total Liabilities and Shareholders’ Equity | $ | 1,519,438 | | | $ | 1,431,953 | |
The accompanying Notes to Consolidated Financial Statements are an integral part of the Consolidated Financial Statements.
22
Graybar Electric Company, Inc. and Subsidiaries
Consolidated Statements of Cash Flows
| | For the Years Ended December 31, | |
(Stated in thousands) | | 2010 | | | 2009 | | | 2008 | |
Cash Flows from Operations | | | | | | | | | |
Net Income | $ | 42,293 | | $ | 37,442 | | $ | 87,560 | |
Adjustments to reconcile net income to cash provided by operations: | | | | | | | | | |
Depreciation and amortization | | 39,725 | | | 39,352 | | | 37,980 | |
Deferred income taxes | | 10,627 | | | 941 | | | 1,654 | |
Net (gains) losses on disposal of property | | (1,177 | ) | | (524 | ) | | 108 | |
Losses on impairment of property | | -- | | | 576 | | | 340 | |
Net income attributable to noncontrolling interests | | (295 | ) | | (165 | ) | | (160 | ) |
Changes in assets and liabilities: | | | | | | | | | |
Trade receivables | | (100,812 | ) | | 82,378 | | | 43,091 | |
Merchandise inventory | | (80,728 | ) | | 64,191 | | | 23,263 | |
Other current assets | | 11,462 | | | 3,520 | | | (10,738 | ) |
Other non-current assets | | (2,429 | ) | | (1,397 | ) | | (12,048 | ) |
Trade accounts payable | | 69,076 | | | (60,218 | ) | | (3,538 | ) |
Accrued payroll and benefit costs | | 28,572 | | | (53,645 | ) | | 3,301 | |
Other current liabilities | | (11,662 | ) | | 13,529 | | | (13,397 | ) |
Other non-current liabilities | | (14,892 | ) | | (11,615 | ) | | (8,788 | ) |
Total adjustments to net income | | (52,533 | ) | | 76,923 | | | 61,068 | |
Net cash (used) provided by operations | | (10,240 | ) | | 114,365 | | | 148,628 | |
Cash Flows from Investing Activities | | | | | | | | | |
Proceeds from disposal of property | | 3,880 | | | 1,633 | | | 448 | |
Capital expenditures for property | | (33,624 | ) | | (27,263 | ) | | (46,121 | ) |
Investment in affiliated company | | 624 | | | 618 | | | 628 | |
Net cash used by investing activities | | (29,120 | ) | | (25,012 | ) | | (45,045 | ) |
Cash Flows from Financing Activities | | | | | | | | | |
Net increase (decrease) in short-term borrowings | | 4,463 | | | (5,217 | ) | | 1,248 | |
Repayment of long-term debt | | (32,160 | ) | | (32,085 | ) | | (31,894 | ) |
Proceeds from long-term debt | | 8,528 | | | -- | | | 4,009 | |
Principal payments under capital leases | | (1,968 | ) | | (801 | ) | | (451 | ) |
Sales of common stock | | 9,799 | | | 11,392 | | | 10,866 | |
Purchases of treasury stock | | (10,448 | ) | | (11,901 | ) | | (8,413 | ) |
Sales of noncontrolling interests’ common stock | | -- | | | 464 | | | -- | |
Purchases of noncontrolling interests’ common stock | | (151 | ) | | (109 | ) | | (99 | ) |
Dividends paid | | (20,211 | ) | | (17,675 | ) | | (14,573 | ) |
Net cash used by financing activities | | (42,148 | ) | | (55,932 | ) | | (39,307 | ) |
Net (Decrease) Increase in Cash | | (81,508 | ) | | 33,421 | | | 64,276 | |
Cash, Beginning of Year | | 163,864 | | | 130,443 | | | 66,167 | |
Cash, End of Year | $ | 82,356 | | $ | 163,864 | | $ | 130,443 | |
| | | | | | | | | |
Supplemental Cash Flow Information: | | | | | | | | | |
Non-cash Investing and Financing Activities: | | | | | | | | | |
Acquisition of equipment under capital leases | $ | 5,009 | | $ | 2,792 | | $ | -- | |
Cash Paid During the Year for: | | | | | | | | | |
Interest, net of amounts capitalized | $ | 8,562 | | $ | 10,470 | | $ | 13,527 | |
Income taxes, net of refunds | $ | 15,037 | | $ | 19,965 | | $ | 44,656 | |
The accompanying Notes to Consolidated Financial Statements are an integral part of the Consolidated Financial Statements.
23
Graybar Electric Company, Inc. and Subsidiaries
Consolidated Statements of Changes in Shareholders’ Equity
| Graybar Electric Company, Inc. Shareholders’ Equity | | | | | | |
(Stated in thousands) | | CommonStock | | | RetainedEarnings | | | Accumulated Other Comprehensive Loss | | | NoncontrollingInterests | | | TotalShareholders’Equity | |
Balance, December 31, 2007 | $ | 158,633 | | $ | 386,217 | | $ | (65,899 | ) | $ | 4,428 | | $ | 483,379 | |
Net income | | | | | 87,400 | | | | | | 160 | | | 87,560 | |
Foreign currency translation | | | | | | | | (8,839 | ) | | (561 | ) | | (9,400 | ) |
Unrealized loss from interest rate swap (net of tax of $906) | | | | | | | | (1,423 | ) | | | | | (1,423 | ) |
Pension and postretirement benefits liability adjustment (net of tax of $24,644) | | | | | | | | (38,708 | ) | | | | | (38,708 | ) |
Comprehensive income | | | | | | | | | | | | | | 38,029 | |
Stock issued | | 10,866 | | | | | | | | | | | | 10,866 | |
Stock purchased | | (8,413 | ) | | | | | | | | (99 | ) | | (8,512 | ) |
Dividends declared | | 32,170 | | | (48,341 | ) | | | | | | | | (16,171 | ) |
Balance, December 31, 2008 | $ | 193,256 | | $ | 425,276 | | $ | (114,869 | ) | $ | 3,928 | | $ | 507,591 | |
Net income | | | | | 37,277 | | | | | | 165 | | | 37,442 | |
Foreign currency translation | | | | | | | | 6,955 | | | 430 | | | 7,385 | |
Unrealized gain from interest rate swap (net of tax of $557) | | | | | | | | 875 | | | | | | 875 | |
Pension and postretirement benefits liability adjustment (net of tax of $2,827) | | | | | | | | 4,440 | | | | | | 4,440 | |
Comprehensive income | | | | | | | | | | | | | | 50,142 | |
Stock issued | | 11,392 | | | | | | | | | 464 | | | 11,856 | |
Stock purchased | | (11,901 | ) | | | | | | | | (109 | ) | | (12,010 | ) |
Dividends declared | | 19,223 | | | | (38,633 | ) | | | | | | | | (19,410 | ) |
Balance, December 31, 2009 | $ | 211,970 | | | $ | 423,920 | | $ | (102,599 | ) | $ | 4,878 | | $ | 538,169 | |
Net income | | | | | 41,998 | | | | | | 295 | | | 42,293 | |
Foreign currency translation | | | | | | | | 2,681 | | | 126 | | | 2,807 | |
Unrealized gain from interest rate swap (net of tax of $102) | | | | | | | | 161 | | | | | | 161 | |
Pension and postretirement benefits liability adjustment (net of tax of $1,646) | | | | | | | | (2,586 | ) | | | | | (2,586 | ) |
Comprehensive income | | | | | | | | | | | | | | 42,675 | |
Stock issued | | 9,799 | | | | | | | | | | | | 9,799 | |
Stock purchased | | (10,448 | ) | | | | | | | | (151 | ) | | (10,599 | ) |
Dividends declared | | 21,079 | | | (42,316 | ) | | | | | | | | (21,237 | ) |
Balance, December 31, 2010 | $ | 232,400 | | $ | 423,602 | | $ | (102,343 | ) | $ | 5,148 | | $ | 558,807 | |
The accompanying Notes to Consolidated Financial Statements are an integral part of the Consolidated Financial Statements.
24
Graybar Electric Company, Inc. and Subsidiaries
Notes to Consolidated Financial Statements
as of December 31, 2010 and 2009 and
for the Years Ended December 31, 2010, 2009, and 2008
(Stated in thousands except share and per share data)
1. DESCRIPTION OF THE BUSINESS
Graybar Electric Company, Inc. (“Graybar” or the “Company”) is a New York corporation, incorporated in 1925. The Company is engaged in the distribution of electrical, communications and data networking (“comm/data”) products and the provision of related supply chain management and logistics services, primarily to electrical and comm/data contractors, industrial plants, federal, state and local governments, commercial users, telephone companies, and power utilities in North America. All products sold by the Company are purchased by the Company from others. The Company’s business activity is primarily with customers in the United States of America (“US”). Graybar also has subsidiary operations with distribution facilities in Canada and Puerto Rico.
2. SUMMARY OF SIGNIFICANT ACCOUNTING POLICIES
The Company’s significant accounting policies conform to generally accepted accounting principles in the US (“US GAAP”) and are applied on a consistent basis among all years presented, and are described below.
Principles of Consolidation
The consolidated financial statements include the accounts of Graybar Electric Company, Inc. and its subsidiary companies. All material intercompany balances and transactions have been eliminated. The ownership interests that are held by owners other than the Company in subsidiaries consolidated by the Company are accounted for and reported as noncontrolling interests.
In accordance with the accounting standards issued by the Financial Accounting Standards Board (“FASB”) in December 2007, and contained in the FASB’s Accounting Standards Codification (“ASC” or the “Codification”) effective January 1, 2009, the Company’s minority interests were recharacterized as noncontrolling interests and are reported as a separate component of shareholders’ equity. No purchases or sales of equity interests resulted in a change in control and such transactions were, therefore, accounted for as equity transactions. Net income attributable to the noncontrolling interests is separately identified in the consolidated statements of income.
The Company has reclassified its noncontrolling interests to shareholders’ equity for all periods presented. The Company also adjusted its net income to include the net income attributable to the noncontrolling interests. Consolidated comprehensive income was also adjusted to include the comprehensive income attributable to the noncontrolling interests.
Reclassifications
Certain reclassifications have been made to prior year financial information to conform to the December 31, 2010 presentation.
Subsequent Events
The Company has evaluated subsequent events through the time of the filing of this Annual Report on Form 10-K with the United States Securities and Exchange Commission (“SEC” or the “Commission”). No material subsequent events have occurred since December 31, 2010 that require recognition or disclosure in these financial statements.
Revenue Recognition
Revenue is recognized when evidence of a customer arrangement exists, prices are fixed and determinable, product title, ownership and risk of loss transfers to the customer, and collectability is reasonably assured. Revenues recognized are primarily for product sales, but also include freight and handling charges. The Company’s standard shipping terms are FOB shipping point, under which, product title passes to the customer at the time of shipment. The Company does, however, fulfill some customer orders based on shipping terms of FOB destination, whereby title passes to the customer at the time of delivery. The Company also earns revenue for services provided to customers for supply chain management and logistics services. Service revenue, which accounts for less than one percent (1%) of net sales, is recognized when services are rendered and completed. Revenue is reported net of all taxes assessed by governmental authorities as a result of revenue-producing transactions, primarily sales tax.
25
Outgoing Freight Expenses
The Company records certain outgoing freight expenses as a component of selling, general and administrative expenses. These costs totaled $35,683, $32,947, and $47,574 for the years ended December 31, 2010, 2009, and 2008, respectively.
Estimates
The preparation of financial statements in accordance with US GAAP requires management to make estimates and assumptions that affect the reported amounts of assets, liabilities, revenues and expenses and the disclosure of contingent assets and liabilities. Actual results could differ from these estimates.
Cash and Cash Equivalents
The Company accounts for cash on hand, deposits in banks, and other short-term, highly liquid investments with an original maturity of three months or less as cash and cash equivalents.
Allowance for Doubtful Accounts
The Company performs ongoing credit evaluations of its customers, and a significant portion of its trade receivables is secured by mechanic’s lien or payment bond rights. The Company maintains allowances to reflect the expected uncollectability of trade receivables based on past collection history, the economic environment, and specific risks identified in the receivables portfolio. Although actual credit losses have historically been within management’s expectations, additional allowances may be required if the financial condition of the Company’s customers were to deteriorate.
The following table summarizes the activity in the allowances for cash discounts and doubtful accounts:
| | | Beginning Balance | | | Provision (Charged to Expense) | | | Deductions | | | Ending Balance |
For the Year Ended December 31, 2010 | | | | | | | | | | | | |
Allowance for cash discounts | | $ | 1,201 | | $ | 17,854 | | $ | (17,682 | ) | $ | 1,373 |
Allowance for doubtful accounts | | | 5,016 | | | 6,401 | | | (5,491 | ) | | 5,926 |
Total | | $ | 6,217 | | $ | 24,255 | | $ | (23,173 | ) | $ | 7,299 |
| | | | | | | | | | | | |
For the Year Ended December 31, 2009 | | | | | | | | | | | | |
Allowance for cash discounts | | $ | 1,515 | | $ | 17,836 | | $ | (18,150 | ) | $ | 1,201 |
Allowance for doubtful accounts | | | 6,048 | | | 7,581 | | | (8,613 | ) | | 5,016 |
Total | | $ | 7,563 | | $ | 25,417 | | $ | (26,763 | ) | $ | 6,217 |
| | | | | | | | | | | | |
For the Year Ended December 31, 2008 | | | | | | | | | | | | |
Allowance for cash discounts | | $ | 1,545 | | $ | 22,968 | | $ | (22,998 | ) | $ | 1,515 |
Allowance for doubtful accounts | | | 6,703 | | | 4,453 | | | (5,108 | ) | | 6,048 |
Total | | $ | 8,248 | | $ | 27,421 | | $ | (28,106 | ) | $ | 7,563 |
Merchandise Inventory
The Company’s inventory is stated at the lower of cost (determined using the last-in, first-out (“LIFO”) cost method) or market. LIFO accounting is a method of accounting that, compared with other inventory accounting methods, generally provides better matching of current costs with current revenues. Had the first-in, first-out (“FIFO”) method been used, merchandise inventory would have been approximately $129,888 and $107,655 greater than reported under the LIFO method at December 31, 2010 and 2009, respectively. In 2009 and 2008, the Company liquidated portions of previously created LIFO layers, resulting in decreases in cost of merchandise sold of $(16,685) and $(4,554), respectively. The Company did not liquidate any portion of previously created LIFO layers in 2010.
The Company makes provisions for obsolete or slow-moving inventories as necessary to reflect reductions in inventory value. Reserves for excess and obsolete inventories were $4,500 and $3,900 at December 31, 2010 and 2009, respectively. The change in the reserves for excess and obsolete inventories, included in cost of merchandise sold, was $600, $(700), and $(800) for the years ended December 31, 2010, 2009, and 2008, respectively.
Supplier Volume Incentives
The Company’s agreements with many of its suppliers provide for the Company to earn volume incentives based on purchases during the agreement period. These agreements typically provide for the incentives to be paid quarterly or annually in arrears. The Company estimates amounts to be received from suppliers at the end of each reporting period based on the earnout level that the Company believes is probable of being achieved. The Company records the incentiveratably over the year as a reduction of cost of merchandise sold as the related inventory is sold. Changes in the estimated amount of incentives are treated as changes in estimate and are recognized in earnings in the period in which the change in estimate occurs. In the event that the operating performance of the Company’s suppliers were to decline, however, there can be no assurance that amounts earned would be paid or that the volume incentives would continue to be included in future agreements.
26
Property and Depreciation
The Company provides for depreciation and amortization using the straight-line method over the following estimated useful asset lives:
Classification
| Estimated Useful Asset Life
|
Buildings
| 42 years
|
Leasehold improvements
| Over the shorter of the asset’s life or the lease term
|
Furniture, fixtures, equipment and software
| 3 to 14 years
|
Assets held under capital leases
| Over the shorter of the asset’s life or the lease term
|
Depreciation expense was $25,273, $25,222, and $25,101 in 2010, 2009, and 2008, respectively.
At the time property is retired, or otherwise disposed of, the asset and related accumulated depreciation are removed from the accounts, and any resulting gain or loss is credited or charged to other income, net.
Assets held under capital leases, consisting primarily of information technology equipment, are recorded in property with the corresponding obligations carried in long-term debt. The amount capitalized is the present value at the beginning of the lease term of the aggregate future minimum lease payments. Assets held under leases which were capitalized during the year ended December 31, 2010 and 2009 were $5,009 and $2,792, respectively.
Maintenance and repairs are expensed as incurred. Major renewals and improvements that extend the life of property are capitalized.
The Company capitalizes interest expense on major construction and development projects while in progress. Interest capitalized in 2010, 2009, and 2008 was $120, $269, and $82, respectively.
The Company capitalizes qualifying internal and external costs incurred to develop or obtain software for internal use during the application development stage. Costs incurred during the pre-application development and post-implementation stages are expensed as incurred. The Company capitalized software and software development costs of $3,375 and $3,307 in 2010 and 2009, respectively, and the amounts are recorded in furniture and fixtures.
Unamortized software totaled $2,487 and $12,436 at December 31, 2010 and 2009, respectively. The estimated useful life of capitalized software is eight years.
The Company reviews long-lived assets held and used for impairment whenever events or changes in circumstances indicate that the carrying amount of the asset may not be recoverable. For assets classified as to be held and used, impairment may occur if projected undiscounted cash flows are not adequate to cover the carrying value of the assets. In such cases, additional analysis is conducted to determine the amount of the loss to be recognized. The impairment loss is calculated as the difference between the carrying amount of the asset and its estimated fair value. The analysis requires estimates of the amount and timing of projected cash flows and, where applicable, selection of an appropriate discount rate. Such estimates are critical in determining whether any impairment charge should be recorded and the amount of such charge if an impairment loss is deemed necessary. For assets held for sale, impairment occurs whenever the net book value of the property listed for sale exceeds the expected selling price less estimated selling expenses.
The Company did not record any impairment charges in 2010. The Company recorded impairment losses totaling $(576) and $(340) to account for the expected losses on those assets to be held and used where the carrying amount exceeded the estimated fair value of the assets and for the sale of properties classified as held for sale for the years ended December 31, 2009 and 2008, respectively. The impairment losses are included in other income, net in the consolidated statements of income for the years ended December 31, 2009 and 2008.
Credit Risk
Financial instruments that potentially expose the Company to concentrations of credit risk consist primarily of trade receivables. The Company performs ongoing credit evaluations of its customers, and a significant portion of its trade receivables is secured by mechanic’s lien or payment bond rights. The Company maintains allowances for potential credit losses and such losses historically have been within management’s expectations.
27
Fair Value
The Company endeavors to utilize the best available information in measuring fair value. US GAAP has established a fair value hierarchy, which prioritizes the inputs used in measuring fair value. The tiers in the hierarchy include: Level 1, defined as observable inputs such as quoted prices in active markets; Level 2, defined as inputs other than quoted prices in active markets that are either directly or indirectly observable; and Level 3, defined as unobservable inputs for which little or no market data exists, therefore requiring an entity to develop its own data inputs and assumptions. The Company has used fair value measurements to value its pension plan assets and interest rate swap.
Derivative Financial Instruments
The Company is party to an interest rate swap agreement that effectively converts its variable rate interest payments to a fixed rate on amounts due under a certain lease arrangement. The Company’s interest rate swap agreement is designated as a cash flow hedge and is required to be measured at fair value on a recurring basis.
The Company endeavors to utilize the best available information in measuring fair value. The interest rate swap is valued based on quoted data from the counterparty, corroborated with indirectly observable market data, which, combined, are deemed to be a Level 2 input in the fair value hierarchy. At December 31, 2010 and 2009, the Company recorded a liability of $(4,706) and $(4,969), respectively, in other current liabilities on the consolidated balance sheet for the fair value of the swap. The effective portion of the related gains or losses on the swap is deferred in accumulated other comprehensive loss. No ineffectiveness was recorded in the consolidated statements of income during 2010, 2009, and 2008. The loss (net of tax) reclassified from accumulated other comprehensive loss to interest expense related to the effective portion of the interest rate swap was $847 and $781 during the years ended December 31, 2010 and 2009, respectively.Unrealized gains (losses) (net of tax) of $161, $875, and $(1,423) related to the swap were recorded in accumulated other comprehensive loss during the years ended December 31, 2010, 2009, and 2008, respectively. The amount of loss (net of tax) expected to be reclassified from accumulated other comprehensive loss to interest expense over the next twelve months is $1,159.At December 31, 2010 and 2009, cumulative unrealized net losses related to the swap of $(2,876) and $(3,037) (net of tax) were recorded in accumulated other comprehensive loss. These deferred amounts are recognized in interest expense, net in the period in which the related interest payments being hedged are recognized in expense.
Foreign Currency Exchange Rate
The functional currency for the Company’s Canadian subsidiary is the Canadian dollar. Accordingly, its balance sheet amounts are translated at the exchange rates in effect at year-end and its statements of income amounts are translated at the average rates of exchange prevailing during the year. Currency translation adjustments are included in accumulated other comprehensive loss.
Goodwill
The Company’s goodwill and indefinite-lived intangible assets are not amortized, but rather tested annually for impairment. Goodwill is reviewed annually in the fourth quarter and/or when circumstances or other events might indicate that impairment may have occurred. The annual impairment test involves a comparison of the estimated fair value of a reporting unit to its carrying amount. The fair value is determined using a variety of assumptions including estimated future cash flows of the reporting unit and applicable discount rates. As of December 31, 2010, the Company has completed its annual impairment test and concluded that there is no impairment of the Company’s goodwill. At December 31, 2010 and 2009, the Company had $6,680 of goodwill included in other non-current assets in its consolidated balance sheets.
Income Taxes
The Company recognizes deferred tax assets and liabilities to reflect the future tax consequences of events that have been recognized in the financial statements or tax returns. Uncertainty exists regarding tax positions taken in previously filed tax returns still subject to examination and positions expected to be taken in future returns. A deferred tax asset or liability results from the temporary difference between an item’s carrying value as reflected in the financial statements and its tax basis, and is calculated using enacted applicable tax rates. The Company assesses the likelihood that its deferred tax assets will be recovered from future taxable income and, to the extent it believes that recovery is not likely, a valuation allowance is established. Changes in the valuation allowance, when recorded, are included in the provision for income taxes in the consolidated financial statements. The Company classifies interest expense and penalties as part of its provision for income taxes based upon applicable federal and state interest/underpayment percentages.
Other Postretirement Benefits
The Company accounts for postretirement benefits other than pensions by accruing the costs of benefits to be provided over the employees’ period of active service. These costs are determined on an actuarial basis. The Company’s consolidated balance sheets reflect the funded status of postretirement benefits.
28
Pension Plan
The Company sponsorsa noncontributorydefined benefit pension plan accounted for by accruing the cost to provide the benefits over the employees’ period of active service. These costs are determined on an actuarial basis. The Company’s consolidated balance sheets reflect the funded status of thedefined benefitpension plan.
Variable Interest Entities
Effective January 1, 2010, the Company adopted new accounting guidance that modified the consolidation model in previous guidance and expanded the disclosures related to variable interest entities (“VIE”). The adoption of this new accounting guidance had no impact on the Company’s financial statements.
An entity is considered to be a VIE if its total equity investment at risk is not sufficient to permit the entity to finance its activities without additional subordinated financial support or if its equity investors, as a group, lack the characteristics of having a controlling financial interest. A reporting company is required to consolidate a VIE as its primary beneficiary when it has both the power to direct the activities of the VIE that most significantly impact the VIE's economic performance and the obligation to absorb losses or the right to receive benefits from the VIE that could potentially be significant to the VIE.
The Company has a lease agreement with an independent lessor that is considered to be a VIE. The agreement provides $28,720 of financing for five of the Company’s distribution facilities and carries a five-year term expiring July 2013. The financing structure used with this lease qualifies as a silo of a VIE. Graybar, as lessee, retains the power to direct the operational activities that most significantly impact the economic performance of the VIE and has an obligation to absorb losses and the right to receive benefits from the sale of the real property held by the VIE lessor. Therefore, the Company is the primary beneficiary of this VIE, and accordingly, consolidates the silo in its financial statements.
New Accounting Standards
No new accounting standards that were issued or became effective during 2010 have had or are expected to have a material impact on the Company’s consolidated financial statements.
In January 2010, the FASB issued Accounting Standards Update No. 2010-06, “Improving Disclosures about Fair Value Measurements”. The Update amends the guidance on fair value measurements that requires companies to disclose separately the amount of significant transfers in and out of Level 1 and Level 2 fair value measurements and describe the reasons for the transfers. In addition, the Update requires companies to present separately information about purchases, sales, issuances, and settlements in the reconciliation for fair value measurements using significant unobservable inputs, that is, Level 3 assets in the fair value hierarchy. The disclosures related to Level 1 and Level 2 fair value measurements are effective for interim and annual reporting periods beginning after December 15, 2009, while the disclosures related to Level 3 assets are effective for interim and annual reporting periods beginning after December 15, 2010. The Company adopted this standard as of January 1, 2010, except for the disclosures about purchases, sales, issuances, and settlements in the rollforward activity in Level 3 fair value measurements. These disclosures had no impact on the Company’s results of operations, financial position, or cash flows.
The Patient Protection and Affordable Care Act and the Health Care and Education Reconciliation Act of 2010
The Patient Protection and Affordable Care Act and the Health Care and Education Reconciliation Act of 2010 (collectively the "Acts") were enacted by the US Congress in March 2010. The Acts have both short- and long-term implications for benefit plan standards. Implementation of this legislation is planned to occur in phases, with some plan standard changes taking effect beginning in 2010 and other changes becoming effective through 2018.
In the short term, the Company’s healthcare costs are expected to increase due to the Acts’ raising of the maximum eligible age for covered dependents to receive benefits, the elimination of the lifetime dollar limits per covered individual, and restrictions on annual dollar limits on essential benefits per covered individual, among other standard requirements. In the long term, the Company’s healthcare costs may increase due to the enactment of the excise tax on “high cost” healthcare plans.
The Company continues to evaluate the impact, if any, the Acts will have on its financial statements as new regulations under the Acts are issued. The Company expects the general trend in healthcare costs to continue to rise and the effects of the Acts, and any future legislation, could materially impact the cost of providing healthcare benefits for many employers, including the Company.
29
3. INCOME TAXES
The Company determines its deferred tax assets and liabilities based upon the difference between the financial statement and tax bases of its assets and liabilities calculated using enacted applicable tax rates. The Company then assesses the likelihood that its deferred tax assets will be recovered from future taxable income and, to the extent it believes that recovery is not likely, a valuation allowance is established. Changes in the valuation allowance, when recorded, are included in the provision for income taxes in the consolidated financial statements.
The Company’s unrecognized tax benefits of $3,843 and $3,754 as of December 31, 2010 and 2009, respectively, are uncertain tax positions that would impact the Company’s effective tax rate if recognized. The Company is periodically engaged in tax return examinations, reviews of statute of limitations periods, and settlements surrounding income taxes. The Company does not anticipate a material change in unrecognized tax benefits during the next twelve months.
The Company’s uncertain tax benefits, and changes thereto, during 2010 and 2009 were as follows:
| | 2010 | | | | 2009 | |
Balance at January 1: | $ | 3,754 | | | $ | 3,874 | |
Additions based on tax positions related to current year | | 699 | | | | 650 | |
Additions based on tax positions of prior years | | 119 | | | | -- | |
Reductions for tax positions of prior years | | (693 | ) | | | (770 | ) |
Settlements | | (36 | ) | | | -- | |
Balance at December 31: | $ | 3,843 | | | $ | 3,754 | |
The Company classifies interest expense and penalties as part of its provision for income taxes based upon applicable federal and state interest/underpayment percentages. The Company has accrued $1,107 and $1,103 in interest and penalties in its statement of financial position at December 31, 2010 and 2009, respectively. Interest was computed on the difference between the provision for income taxes recognized in accordance with US GAAP and the amount of benefit previously taken or expected to be taken in the Company’s federal, state, and local income tax returns.
The Company’s federal income tax returns for the tax years 2007 and forward are available for examination by the United States Internal Revenue Service (“IRS”). The Company closed an examination conducted by the IRS of its 2007 federal income tax return during the fourth quarter of 2009. The results of this examination were included in the 2009 provision for income taxes. The examination outcome did not have a material effect on the Company’s financial results or its effective tax rate. The Company has not agreed to extend its federal statute of limitations for the 2007 tax year as of December 31, 2010. The federal statute of limitations for the 2007 tax year will expire on September 15, 2011. The Company’s state income tax returns for 2006 through 2010 remain subject to examination by various state authorities with the latest period closing on December 31, 2015. The Company has not extended the statutes of limitations for any state jurisdictions with respect to years prior to 2006. Such statutes of limitations will expire on or before November 15, 2011 unless extended.
The provisions for income taxes recorded in the consolidated statements of income are as follows:
For the Year Ended December 31, | | | 2010 | | | 2009 | | | 2008 | |
Federal income tax | | | | | | | | | | |
Current | | $ | 14,366 | | $ | 21,633 | | $ | 44,127 | |
Deferred | | | 9,428 | | | 777 | | | 4,930 | |
| | | | | | | | | | |
State income tax | | | | | | | | | | |
Current | | | 2,189 | | | 2,515 | | | 6,245 | |
Deferred | | | 1,198 | | | 164 | | | (3,276 | ) |
Provision for income taxes | | $ | 27,181 | | $ | 25,089 | | $ | 52,026 | |
Deferred income taxes are provided based upon differences between the financial statement and tax bases of assets and liabilities. The following deferred tax assets (liabilities) were recorded at December 31:
Assets (Liabilities) | | | 2010 | | | 2009 | |
Postretirement benefits | | $ | 31,027 | | $ | 29,837 | |
Payroll accruals | | | 2,577 | | | 3,176 | |
Bad debt reserves | | | 2,544 | | | 2,132 | |
Other deferred tax assets | | | 13,472 | | | 11,709 | |
Pension | | | 19,092 | | | 24,716 | |
Inventory | | | -- | | | 3,098 | |
Subtotal | | | 68,712 | | | 74,668 | |
less: valuation allowances | | | (2,778 | ) | | (2,492 | ) |
Deferred tax assets | | | 65,934 | | | 72,176 | |
| | | | | | | |
Fixed assets | | | (22,098 | ) | | (17,212 | ) |
Inventory | | | (1,744 | ) | | -- | |
Computer software | | | (968 | ) | | (4,837 | ) |
Other deferred tax liabilities | | | (4,521 | ) | | (4,482 | ) |
Deferred tax liabilities | | | (29,331 | ) | | (26,531 | ) |
Net deferred tax assets | | $ | 36,603 | | $ | 45,645 | |
30
Deferred tax assets included in other current assets were $1,838 and $14,126 at December 31, 2010 and 2009, respectively. Deferred tax assets included in other non-current assets were $34,765 and $31,519 at December 31, 2010 and 2009, respectively. The Company’s deferred tax assets include foreign net operating losses of $517 and $231 as of December 31, 2010 and 2009 that expire in 2017 and 2016, respectively. The Company’s deferred tax assets also include state net operating loss carryforwards of $2,819 and $2,091 as of December 31, 2010 and 2009, respectively, that expire between 2010 and 2030. The Company’s deferred tax assets also include capital loss carryforwards of $2,261 and $2,261 as of December 31, 2010 and 2009, respectively, that expire in 2014. Due to uncertainty surrounding their ultimate utilization, full valuation allowances against these foreign net operating loss and capital loss carryforwards have been established.
A reconciliation between the “statutory” federal income tax rate and the effective tax rate in the consolidated statements of income is as follows:
For the Years Ended December 31, | 2010 | | | 2009 | | | 2008 | |
“Statutory” federal tax rate | 35.0 | % | | 35.0 | % | | 35.0 | % |
State and local income taxes, | | | | | | | | |
net of federal benefit | 2.7 | | | 2.3 | | | 1.5 | |
Other, net | 1.4 | | | 2.8 | | | 0.8 | |
Effective tax rate | | 39.1 | % | | 40.1 | % | | 37.3 | % |
| | | | | | | | | |
4. CAPITAL STOCK
The Company’s capital stock is one hundred percent (100%) owned by its active and retired employees, and there is no public trading market for its common stock. Shares of common stock or the voting trust interests issued with respect thereto (“common stock”, “common shares”, or “shares”) may not be sold by the holder thereof, except after first offering them to the Company. The Company may buy any common shares so offered at the price at which they were issued ($20.00 per share) with appropriate adjustments for current dividends.
At the Company’s annual meeting of shareholders on June 10, 2010, the shareholders approved an amendment to the Company’s Restated Certificate of Incorporation to increase the number of authorized shares of common stock from 15,000,000 to 20,000,000 shares. The amendment was effective August 2010.
During 2010, the Company offered to eligible employees and qualified retirees the right to subscribe to 841,500 shares of common stock at $20.00 per share in accordance with the provisions of the Company’s Three-Year Common Stock Purchase Plan dated June 10, 2010. This resulted in the subscription of 565,844 shares ($11,317). Subscribers under the Plan elected to make payments under one of the following options: (i) all shares subscribed for on or before January 14, 2011; or (ii) all shares subscribed for in installments paid through payroll deductions (or in certain cases where a subscriber is no longer on the Company’s payroll, through direct monthly payments) over an eleven-month period.
Common shares were delivered to subscribers as of January 14, 2011, in the case of shares paid for prior to January 14, 2011. Shares will be issued and delivered to subscribers on a quarterly basis, as of the tenth day of March, June, September, and December, to the extent full payments for shares are made in the case of subscriptions under the installment method.
Shown below is a summary of shares purchased and retired by the Company during the three years ended December 31:
| Shares of Common Stock |
| Purchased | Retired |
2010 | 522,405 | 520,458 |
2009 | 595,073 | 602,926 |
2008 | 420,634 | 422,454 |
The Company amended its Certificate of Incorporation to authorize a new class of 10,000,000 shares of Delegated Authority Preferred Stock (“preferred stock”), par value one cent ($0.01), on June 10, 2004. The preferred stock may be issued in one or more series, with the designations, relative rights, preferences, and limitations of shares of each such series being fixed by a resolution of the Board of Directors of the Company. There were no shares of preferred stock outstanding at December 31, 2010 and 2009.
On December 9, 2010, the Company declared a ten percent (10%) common stock dividend. Each shareholder was entitled to one share of common stock for every ten shares held as of January 3, 2011. The stock was issued February 4, 2011. On December 10, 2009, the Company declared a ten percent (10%) common stock dividend. Each shareholder wasentitled to one share of common stock for every ten shares held as of January 4, 2010. The stock was issued on February 1, 2010. On December 11, 2008, the Company declared a twenty percent (20%) common stock dividend. Each shareholder was entitled to one share of common stock for every five shares held as of January 5, 2009. The stock was issued February 2, 2009.
31
5. NET INCOME PER SHARE OF COMMON STOCK
The per share computations for periods presented have been adjusted to reflect the new number of shares as of December 31, 2010, as a result of the stock dividend declared on December 9, 2010 payable to shareholders of record on January 3, 2011. Shares representing this dividend were issued on February 4, 2011. The computation of net income per share of common stock is based on the average number of common shares outstanding during each year, adjusted in all periods presented for the declaration of a ten percent (10%) stock dividend declared in 2010, a ten percent (10%) stock dividend declared in 2009, and a twenty percent (20%) stock dividend in 2008. The average number of shares used in computing net income per share of common stock at December 31, 2010, 2009, and 2008 was 11,646,785, 11,708,040, and 11,636,415, respectively.
6. LONG-TERM DEBT AND BORROWINGS UNDER SHORT-TERM CREDIT AGREEMENTS
| | December 31, | |
Long-term Debt | | 2010 | | 2009 | |
7.49% senior note, unsecured, due in annual installments of $14,286 beginning in July 2005 through July 2011 | $ | 14,286 | $ | 28,571 | |
Variable rate lease arrangement, secured by facilities, due July 2013 | | 27,715 | | 27,715 | |
6.59% senior note, unsecured, due in semiannual installments of $3,750 beginning in October 2003 through April 2013 | | 18,750 | | | |
| | 26,250 |
7.36% senior note, unsecured, due in semiannual installments of $3,095 beginning in May 2001 through November 2010, with a final payment of $3,094 due in May 2011 | | 3,094 | | | |
| | 9,285 |
6.65% senior note, unsecured, due in annual installments of $3,636 beginning in June 2003 through June 2013 | | 10,909 | | | |
| | 14,545 |
5.57% note, secured by facility, due in monthly installments of principal and interest of $32
through December 2014, with a final payment of $2,000 due in January 2015 | | 2,977 | | | |
| | 3,041 |
5.79% note, secured by facility, due in monthly installments of principal and interest of $37 through October 2013, with a final payment of $3,444 due November 2013 | | 4,083 | | 4,088 | |
6.48% capital lease, secured by equipment, due in monthly installments of principal and interest of $47 beginning in January 2007 through December 2011 | | 544 | | | |
| | 1,060 |
Variable rate note, secured by facilities, due in monthly installments of $36 through October 2015, with a final payment of $6,583 due in November 2015 | | 8,664 | | -- | |
2.64% to 4.97% capital leases, secured by equipment, various maturities | | 6,028 | | 2,472 | |
| $ | 97,050 | $ | 117,027 | |
Less current portion | | (32,191 | ) | (36,068 | ) |
Long-term Debt | $ | 64,859 | $ | 80,959 | |
Long-term Debt matures as follows: | | |
2011 | $ | 32,191 |
2012 | | 13,949 |
2013 | | 40,730 |
2014 | | 1,266 |
2015 | | 8,914 |
After 2015 | | -- |
| $ | 97,050 |
The net book value of property securing various long-term debt instruments was $40,429 and $28,305 at December 31, 2010 and 2009, respectively.
The Company’s borrowings under short-term credit agreements typically consist of issuances of commercial paper under the trade receivable securitization program and draws against both a revolving credit agreement and bank lines of credit.
The Company has a revolving credit agreement with a group of thirteen banks at an interest rate based on the London Interbank Offered Rate (“LIBOR”) that consists of an unsecured $200,000 five-year facility expiring in May 2012. There were no amounts outstanding under this credit agreement at December 31, 2010 and 2009.
At December 31, 2009, the Company had a $100,000 trade receivable securitization program that was scheduled to expire in October 2010. Prior to expiration, the Company amended the trade receivable securitization program agreement, effective as of October 8, 2010, to extend the program to October 2011. The trade receivable securitization program provides for the sale of certain of the Company’s trade receivables on a revolving basis to Graybar Commerce Corporation (“GCC”), a wholly-owned, bankruptcy-remote, special-purpose subsidiary. GCC sells an undivided interest in the trade receivables to anunrelated multi-seller commercial paper conduit. In the event that a dislocation in the market for the conduit’s receivables-backed commercial paper develops and the conduit is unable to purchase the undivided interest offered by GCC, the agent bank for the trade receivable securitization program is obligated to purchase the undivided interest in the trade receivables from GCC under the terms of the program.
32
The Company accounts for the securitization as an on-balance sheet financing arrangement because the Company has maintained effective control of the trade receivables through a call option that gives GCC the unilateral right to repurchase the undivided interests. Accordingly, the trade receivables and related debt are included in the accompanying consolidated balance sheets. GCC has granted a security interest in its trade receivables to the commercial paper conduit. There were no borrowings outstanding under the trade receivable securitization program at December 31, 2010 and 2009.
At December 31, 2010, the Company had available to it unused lines of credit amounting to $307,308, compared to $310,504 at December 31, 2009. These lines are available to meet the short-term cash requirements of the Company and certain committed lines of credit have annual fees of up to 67 basis points (0.67%) and 92 basis points (0.92%) of the committed lines of credit as of December 31, 2010 and 2009, respectively.
Short-term borrowings outstanding during 2010 and 2009 ranged from a minimum of $10,786 and $11,189 to a maximum of $20,962 and $65,858, respectively. Short-term borrowings outstanding at December 31, 2010 and 2009 totaled $19,695 and $15,232, respectively, and were drawn by the Company’s Canadian subsidiary against a bank line of credit secured by all personal property of that subsidiary. The average daily amount of borrowings outstanding under short-term credit agreements during 2010 and 2009 amounted to approximately $16,000 and $18,000 at weighted-average interest rates of 2.94% and 2.19%, respectively. The weighted-average interest rate for amounts outstanding at December 31, 2010 was 3.35%.
The revolving credit agreement, the trade receivable securitization program, and certain other note agreements contain various covenants that limit the Company’s ability to make investments, pay dividends, incur debt, dispose of property, and issue equity securities. The Company is also required to maintain certain financial ratios as defined in the agreements. The Company was in compliance with all covenants as of December 31, 2010 and 2009.
The carrying amount of the Company’s outstanding long-term, fixed-rate debt exceeded its fair value by $2,815 and $4,590 at December 31, 2010 and 2009, respectively. The fair value of the long-term, fixed-rate debt is estimated by using yields obtained from independent pricing sources for similar types of borrowings. The fair value of the Company’s variable-rate short- and long-term debt approximates its carrying value at December 31, 2010 and 2009, respectively.
7. PENSION AND OTHER POSTRETIREMENT BENEFITS
The Company has a noncontributory defined benefit pension plan covering substantially all full-time employees. The plan provides retirement benefits based on an employee’s average earnings and years of service. Employees become one hundred percent (100%) vested after three years of service regardless of age. The Company’s plan funding policy is to make contributions provided that the total annual contributions will not be less than Employee Retirement Income Security Act (ERISA) and the Pension Protection Act of 2006 minimums or greater than the maximum tax-deductible amount, to review contribution and funding strategy on a regular basis, and to allow discretionary contributions to be made by the Company from time to time. The assets of thedefined benefitpension plan are invested primarily in fixed income and equity securities, money market funds, and other investments.
The Company provides certain postretirement health care and life insurance benefits to retired employees. Substantially all of the Company’s employees may become eligible for postretirement medical benefits if they reach the age and service requirements of the retiree medical plan and retire on a service pension under thedefined benefitpension plan. Benefits are provided through insurance coverage with premiums based on the benefits paid during the year. The Company funds postretirement benefits on a pay-as-you-go basis, and accordingly, there were no assets held in the postretirement benefits plan at December 31, 2010 and 2009.
The following table sets forth information regarding the Company’s pension and other postretirement benefits as of December 31, 2010 and 2009:
| Pension Benefits | | | Postretirement Benefits | |
| | 2010 | | | 2009 | | | | 2010 | | | 2009 | |
Projected benefit obligation | $ | (396,008 | ) | $ | (376,651 | ) | | $ | (79,762 | ) | $ | (74,336 | ) |
Fair value of plan assets | | 332,392 | | | 298,352 | | | | -- | | | -- | |
Funded status | $ | (63,616 | ) | $ | (78,299 | ) | | $ | (79,762 | ) | $ | (74,336 | ) |
The accumulated benefit obligation for the Company’sdefined benefitpension plan was $336,457 and $309,594 at December 31, 2010 and 2009, respectively.
33
Amounts recognized in the consolidated balance sheet for the years ended December 31 consist of the following:
| Pension Benefits | | | Postretirement Benefits | |
| | 2010 | | | 2009 | | | | 2010 | | | 2009 | |
Current accrued benefit cost | $ | (800 | ) | $ | (600 | ) | | $ | (7,300 | ) | $ | (8,000 | ) |
Non-current accrued benefit cost | | (62,816 | ) | | (77,699 | ) | | | (72,462 | ) | | (66,336 | ) |
Net amount recognized | $ | (63,616 | ) | $ | (78,299 | ) | | $ | (79,762 | ) | $ | (74,336 | ) |
Amounts recognized in accumulated other comprehensive loss for the years ended December 31, net of tax, consist of the following:
| Pension Benefits | | | Postretirement Benefits | |
| | 2010 | | | 2009 | | | | 2010 | | | 2009 | |
Net actuarial loss | $ | 96,542 | | $ | 97,656 | | | $ | 20,881 | | $ | 17,656 | |
Prior service cost (gain) | | 4,116 | | | 4,974 | | | | (10,523 | ) | | (11,856 | ) |
Accumulated other comprehensive loss | $ | 100,658 | | $ | 102,630 | | | $ | 10,358 | | $ | 5,800 | |
Amounts estimated to be amortized from accumulated other comprehensive loss into net periodic benefit costs in 2011, net of tax, consist of the following:
| Pension Benefits | | | Postretirement Benefits | |
Net actuarial loss | $ | 7,454 | | | | | | $ | 1,222 | | | | |
Prior service cost (gain) | | 856 | | | | | | | (1,344 | ) | | | |
Accumulated other comprehensive loss | $ | 8,310 | | | | | | $ | (122 | ) | | | |
Weighted-average assumptions used to determine the actuarial present value of the pension and postretirement benefit obligations as of December 31 are:
| Pension Benefits | | | Postretirement Benefits | |
| | 2010 | | | 2009 | | | | 2010 | | | 2009 | |
Discount rate | | 5.50 | % | 5.75 | % | | | 4.75 | % | 5.00 | % |
Rate of compensation increase | | 4.25 | % | 4.00 | % | | | -- | | | -- | |
Health care cost trend on covered charges | | -- | | -- | | | | 8% / 5 | % | 7% / 5 | % |
For measurement of the postretirement benefit obligation, an 8.00% annual rate of increase in the per capita cost of covered health care benefits was assumed at December 31, 2010. This rate is assumed to decrease to 5.00% at January 1, 2019 and remain at that level thereafter.
The following presents information regarding the plans for the years ended December 31:
| Pension Benefits | | | Postretirement Benefits | |
| | 2010 | | | 2009 | | | | 2010 | | | 2009 | |
Employer contributions | $ | 40,763 | | $ | 35,097 | | | $ | 8,631 | | $ | 8,703 | |
Participant contributions | $ | -- | | $ | -- | | | $ | 2,342 | | $ | 2,209 | |
Benefits paid | $ | (35,011 | ) | $ | (30,881 | ) | | $ | (10,973 | ) | $ | (10,912 | ) |
The Company expects to make contributions totaling $40,800 to itsdefined benefitpension plan during 2011.
Estimated futuredefined benefitpension and other postretirement benefit plan payments to plan participants for the years ending December 31 are as follows:
Year | | Pension Benefits | | Postretirement Benefits |
2011 | | $ | 29,300 | | | $ | 7,300 | |
2012 | | | 28,800 | | | | 7,500 | |
2013 | | | 29,600 | | | | 7,800 | |
2014 | | | 30,500 | | | | 7,900 | |
2015 | | | 30,900 | | | | 8,000 | |
After 2015 | | | 166,100 | | | | 40,000 | |
The investment objective of the Company’sdefined benefitpension plan is to ensure that there are sufficient assets to fund regular pension benefits payable to employees over the long-term life of the plan. The Company’sdefined benefitpension plan seeks to allocate plan assets in a manner that is closely duration-matched with the actuarial projected cash flow liabilities, consistent with prudent standards for preservation of capital, tolerance of investment risk, and maintenance of liquidity.
34
Asset allocation information for the defined benefit pension plan at December 31, 2010 and 2009 is as follows:
Investment | | 2010 Actual Allocation | | | 2010
Target Allocation Range | | | 2009 Actual Allocation | | | 2009 Target Allocation Range | |
Equity securities-US | | 8 | % | | 3-15 | % | | 7 | % | | 3-15 | % |
Equity securities-International | | 7 | % | | 3-15 | % | | 10 | % | | 3-15 | % |
Fixed income investments-US | | 57 | % | | 35-75 | % | | 63 | % | | 35-75 | % |
Fixed income investments-International | | 11 | % | | 3-15 | % | | 5 | % | | 3-15 | % |
Absolute return | | 10 | % | | 5-15 | % | | 7 | % | | 5-15 | % |
Real assets | | 4 | % | | 3-10 | % | | 5 | % | | 3-10 | % |
Private equity | | 1 | % | | 0-3 | % | | 1 | % | | 0-3 | % |
Short-term investments | | 2 | % | | 0-3 | % | | 2 | % | | 0-3 | % |
Total | | 100 | % | | 100 | % | | 100 | % | | 100 | % |
The following is a description of the valuation methodologies used for assets held by thedefined benefitpension plan measured at fair value:
Equity securities
Equity securities and certain commingled equity funds are valued at the closing price reported on the active market on which the individual securities are traded. Other equity mutual funds are valued by the fund manager based on the fair value of the underlying assets held by the fund.
Fixed income investments
Government, government agency, and certain corporate bonds are valued using the closing price reported on the active market on which the securities are traded. Investments in mortgage-backed securities are valued using models with readily observable market data as inputs, adjusted for potentially lower trading activity in the market for mortgage-backed securities. Commingled institutional fixed income funds are valued by the fund manager based on the fair value of the underlying assets held by the fund.
Absolute return
Investments in absolute return funds utilize a hedge “fund of funds” approach. Units of the funds are not available on any active exchange. Valuations are based on unobservable inputs and reported at estimated fair value as determined by the fund manager.
Real Assets
Real asset investments are made primarily in real estate investments trusts and natural resource funds. Fund values are primarily determined by the fund manager and are based on the valuation of the underlying investments, which include inputs such as cost, discounted future cash flows, independent appraisals and market-based comparable data.
Private equity
Private equity investments are valued by the fund manager based on the fair value of the underlying assets held by the fund.
Short-term investments
Short-term investments are carried at cost, which approximates fair value, and are listed at Level 3 in the fair value hierarchy since they are not traded on listed exchanges and the valuation methodology uses significant assumptions that are not directly observable.
The methods described above may produce fair value calculations that may not be indicative of net realizable value or reflective of future fair values. Furthermore, while the Company believes itsdefined benefitpension plan valuation methods are appropriate and consistent with other market participants, the use of different methodologies or assumptions to determine the fair value of certain financial instruments could result in a different fair value measurement at the reporting date.
There have been no changes in the methodologies used by the Company to determine fair value at December 31, 2010 or 2009.
35
The following tables set forth by level within the fair value hierarchy, thedefined benefitpension plan assets measured at fair value as of December 31, 2010 and 2009:
December 31, 2010 | |
Investment | | Quoted Prices in
Active Markets for
Identical Inputs
(Level 1) | | Significant Other
Observable Inputs (Level 2) | | Significant
Unobservable
Inputs (Level 3) | | Total | |
Equity securities - US | | | | | | | | | |
Corporate stocks | | $ | 12,454 | | $ | -- | | $ | -- | $ | 12,454 | |
Mutual funds | | 5,431 | | 7,782 | | -- | | 13,213 | |
Equity securities - International | | | | | | | | | |
Corporate stocks | | 165 | | -- | | -- | | 165 | |
Mutual funds | | 21,212 | | 3,518 | | -- | | 24,730 | |
Fixed income investments - US | | | | | | | | | |
Corporate debt | | 91,684 | | -- | | -- | | 91,684 | |
US government debt | | 21,933 | | -- | | -- | | 21,933 | |
Mutual funds | | 17,569 | | 57,257 | | -- | | 74,826 | |
Fixed income investments - International | | | | | | | | | |
Corporate debt | | 20,548 | | -- | | -- | | 20,548 | |
Commingled funds | | -- | | -- | | 16,091 | | 16,091 | |
Absolute return | | -- | | -- | | 31,838 | | 31,838 | |
Real assets | | -- | | 4,714 | | 10,130 | | 14,844 | |
Private equity | | -- | | -- | | 4,006 | | 4,006 | |
Short-term investments | | -- | | -- | | 6,060 | | 6,060 | |
Total | | $ | 190,996 | | $ | 73,271 | | $ | 68,125 | $ | 332,392 | |
December 31, 2009 | |
Investment | | Quoted Prices in
Active Markets for
Identical Inputs (Level 1) | | Significant Other
Observable Inputs (Level 2) | | Significant
Unobservable
Inputs (Level 3) | | Total | |
Equity securities - US | | $ | 7,069 | | $ | 14,448 | | $ | -- | $ | 21,517 | |
Equity securities - International | | -- | | 29,827 | | -- | | 29,827 | |
Fixed income investments - US | | 112,541 | | 75,858 | | -- | | 188,399 | |
Fixed income investments - International | | -- | | -- | | 15,119 | | 15,119 | |
Absolute return | | -- | | -- | | 20,978 | | 20,978 | |
Real assets | | 3,880 | | -- | | 9,486 | | 13,366 | |
Private equity | | -- | | -- | | 3,317 | | 3,317 | |
Short-term investments | | -- | | -- | | 5,829 | | 5,829 | |
Total | | $ | 123,490 | | $ | 120,133 | | $ | 54,729 | $ | 298,352 | |
The tables below set forth a summary of changes in the fair value of the defined benefitpension plan Level 3 assets for the years ended December 31, 2010 and 2009:
December 31, 2010 | |
| | Fixed Income Investments – International | | | Absolute Return | | | Real Assets | | | Private Equity | | | Short-term investments | | Total | |
Balance, beginning of year | $ | 15,119 | | $ | 20,978 | | $ | 9,486 | | $ | 3,317 | | $ | 5,829 | $ | 54,729 | |
Realized gains/(losses) | | 19 | | | (521 | ) | | (7 | ) | | 91 | | | -- | | (418 | ) |
Unrealized gains/(losses) | | 1,048 | | | 1,236 | | | 703 | | | 227 | | | -- | | 3,214 | |
Purchases, sales, issuances
and settlements (net) | | (95 | ) | | 10,145 | | | (52 | ) | | 371 | | | 231 | | 10,600 | |
Balance, end of year | $ | 16,091 | | $ | 31,838 | | $ | 10,130 | | $ | 4,006 | | $ | 6,060 | $ | 68,125 | |
36
December 31, 2009 | |
| | Fixed Income Investments – International | | | Absolute Return | | | Real Assets | | | Private Equity | | | Short-term investments | | Total | | |
Balance, beginning of year | $ | 14,095 | | $ | 19,212 | | $ | 12,559 | | $ | 3,040 | | $ | 28,330 | $ | 77,236 | | |
Realized gains/(losses) | | 7 | | | (3 | ) | | (4 | ) | | 96 | | | -- | | 96 | | |
Unrealized gains/(losses) | | 1,104 | | | 1,775 | | | (3,013 | ) | | (341 | ) | | -- | | (475 | ) | |
Purchases, sales, issuances
and settlements (net) | | (87 | ) | | (6 | ) | | (56 | ) | | 522 | | | (22,501 | ) | (22,128 | ) | |
Balance, end of year | $ | 15,119 | | $ | 20,978 | | $ | 9,486 | | $ | 3,317 | | $ | 5,829 | $ | 54,729 | | |
The net periodic benefit cost for the years ended December 31, 2010, 2009, and 2008 included the following components:
| Pension Benefits | | Postretirement Benefits |
| | 2010 | | | 2009 | | | 2008 | | | | 2010 | | | 2009 | | | 2008 | |
Service cost | $ | 15,502 | | $ | 15,710 | | $ | 15,019 | | | $ | 2,086 | | $ | 1,931 | | $ | 2,056 | |
Interest cost | | 21,763 | | | 21,572 | | | 20,069 | | | | 3,918 | | | 4,168 | | | 4,461 | |
Expected return on plan assets | | (20,691 | ) | | (19,495 | ) | | (21,259 | ) | | | -- | | | -- | | | -- | |
Amortization of: | | | | | | | | | | | | | | | | | | | |
Net actuarial loss | | 11,325 | | | 10,181 | | | 9,860 | | | | 2,045 | | | 1,439 | | | 2,101 | |
Prior service cost (gain) | | 1,405 | | | 1,248 | | | 1,262 | | | | (2,181 | ) | | (2,456 | ) | | (2,457 | ) |
Curtailment loss (gain) | | -- | | | 542 | | | -- | | | | -- | | | (2,452 | ) | | -- | |
Net periodic benefit cost | $ | 29,304 | | $ | 29,758 | | $ | 24,951 | | | $ | 5,868 | | $ | 2,630 | | $ | 6,161 | |
In 2009, as a result of reductions in its workforce, the Company recorded a $(542) curtailment loss and a $2,452 curtailment gain in the income statement for thedefined benefitpension plan and postretirement benefits plan, respectively.
Weighted-average assumptions used to determine net periodic benefit cost for the years ended December 31 were:
| Pension Benefits | | Postretirement Benefits | |
| | 2010 | | | 2009 | | | 2008 | | | | 2010 | | | 2009 | | | 2008 | |
Discount rate | | 5.75 | % | 6.00 | % | 6.00 | % | | 5.00 | % | 6.00 | % | 5.75 | % |
Expected return on plan assets | | 6.25 | % | 6.25 | % | 8.00 | % | | -- | | -- | | -- | |
Rate of compensation increase | | 4.00 | % | 3.80 | % | 4.25 | % | | -- | | -- | | -- | |
Health care cost trend on covered charges | | -- | | -- | | -- | | | 7% / 5 | % | 8% / 5 | % | 9% / 5 | % |
| | | | | | | | | | | | | | | | | | | |
The expected return on plan assets assumption for thedefined benefitpension plan is a long-term assumption and was determined after evaluating input from both the plan’s actuary and pension fund investment advisors, consideration of historical rates of return on plan assets, and anticipated rates of return on the various classes of assets in which the plan invests. The Company has elected to use an expected long-term rate of return on plan assets of 6.25%. The Company anticipates that its investment managers will continue to generate long-term returns consistent with its assumed rate, despite periodic fluctuations in market performance.
For measurement of the postretirement benefits net periodic cost, a 7.00% annual rate of increase in per capita cost of covered health care benefits was assumed for 2010. The rate was assumed to decrease 1.00% per year to 5.00% at January 1, 2012 and to remain at that level thereafter.
8. PROFIT SHARING AND SAVINGS PLAN
The Company provides a defined contribution profit sharing and savings plan covering substantially all of its full-time employees. Annual contributions by the Company to the profit-sharing portion of the plan are at the discretion of management and are generally based on the profitability of the Company. Cost recognized by the Company under the profit-sharing portion of the plan was $31,576, $27,645, and $53,889 for the years ended December 31, 2010, 2009 and 2008, respectively. Employees may also make voluntary contributions to the savings portion of the plan subject to limitations imposed by federal tax law, ERISA, and the Pension Protection Act of 2006.
9. COMMITMENTS AND CONTINGENCIES
The Company has a lease agreement with an independent lessor, that is considered to be a VIE. The agreement provides $28,720 of financing for five of the Company’s distribution facilities and carries a five-year term expiring July 2013. The financing structure used with this lease qualifies as a silo of a VIE. Graybar, as lessee, retains the power to direct the operational activities that most significantly impact the economic performance of the VIE and has an obligation to absorblosses and the right to receive benefits from the sale of the real property held by the VIE lessor. Therefore, the Company is the primary beneficiary of this VIE, and accordingly, consolidates the silo in its financial statements.
37
As of December 31, 2010, the consolidated silo included in the Company’s consolidated financial statements had a net property balance of $15,775, long-term debt of $27,715, and a noncontrolling interest of $1,005. At December 31, 2009, the consolidated silo included in the Company’s consolidated financial statements had a net property balance of $16,299, long-term debt of $27,715, and a noncontrolling interest of $1,005.
Under the terms of the lease agreement, the amount guaranteed by the Company as the residual fair value of the property subject to the lease arrangement was $28,720 at December 31, 2010 and 2009.
Rental expense was $25,684, $27,185, and $29,104 in 2010, 2009, and 2008, respectively. Future minimum rental payments required under operating leases that have either initial or remaining noncancelable lease terms in excess of one year as of December 31, 2010 are as follows:
For the Years Ending December 31, | | Minimum Rental Payments |
2011 | | $ | 19,640 | |
2012 | | | 16,480 | |
2013 | | | 12,734 | |
2014 | | | 10,316 | |
2015 | | | 7,717 | |
After 2015 | | | 29,988 | |
The Company entered into a swap agreement to manage interest rates on amounts due under the lease arrangement discussed above in September 2000. The swap agreement, which expires in July 2013, is based on a notional amount of $28,720. The agreement calls for an exchange of interest payments with the Company receiving payments on a LIBOR-based floating rate and making payments based on a fixed rate of 6.92%. There is no exchange of the notional amount upon which the payments are based. As discussed in Note 2 to the consolidated financial statements, the swap is designated as a completely effective cash flow hedge of the variable interest payments due under the lease. The fair value of the swap was $(4,706) and $(4,969) at December 31, 2010 and 2009, respectively, and is recorded in other current liabilities in the consolidated balance sheet.
The Company and its subsidiaries are subject to various claims, disputes, administrative, and legal matters incidental to the Company’s past and current business activities. As a result, contingencies arise resulting from an existing condition, situation, or set of circumstances involving an uncertainty as to the realization of a possible loss.
The Company accounts for loss contingencies in accordance with US GAAP. Estimated loss contingencies are accrued only if the loss is probable and the amount of the loss can be reasonably estimated. With respect to a particular loss contingency, it may be probable that a loss has occurred but the estimate of the loss is a wide range. If the Company deems some amount within the range to be a better estimate than any other amount within the range, that amount shall be accrued. However, if no amount within the range is a better estimate than any other amount, the minimum amount of the range is accrued. While the Company believes that none of these claims, disputes, administrative, and legal matters will have a material adverse effect on its financial position, these matters are uncertain and the Company cannot at this time determine whether the financial impact, if any, of these matters will be material to its results of operations in the period in which such matters are resolved or a better estimate becomes available.
10. ACCUMULATED OTHER COMPREHENSIVE INCOME (LOSS)
The components of accumulated other comprehensive loss as of December 31 are as follows:
| | | 2010 | | | | 2009 | |
Currency translation | | $ | 11,549 | | | $ | 8,868 | |
Unrealized loss from interest rate swap | | | (2,876 | ) | | | (3,037 | ) |
Pension liability | | | (100,658 | ) | | | (102,630 | ) |
Postretirement benefits liability | | | (10,358 | ) | | | (5,800 | ) |
Accumulated other comprehensive loss | | $ | (102,343 | ) | | $ | (102,599 | ) |
38
11. QUARTERLY FINANCIAL INFORMATION (UNAUDITED)
Quarterly financial information for 2010 and 2009, adjusted for the declaration of stock dividends of ten percent (10%) in 2010 and 2009, is as follows:
| 2010 |
For the Quarter Ended | | March 31, | | June 30, | | September 30, | | December 31, |
Net sales | $ | 1,001,174 | $ | 1,130,771 | $ | 1,249,306 | $ | 1,235,126 |
Gross margin | $ | 194,659 | $ | 209,541 | $ | 233,995 | $ | 228,446 |
Net income attributable to the Company | $ | 3,526 | $ | 9,508 | $ | 19,843 | $ | 9,121 |
Net income attributable to the Company per share of common stock (A) | $ | 0.30 | $ | 0.82 | $ | 1.71 | $ | 0.78 |
(A)All periods adjusted for a ten percent (10%) stock dividend declared in December 2010. Prior to these adjustments, the average common shares outstanding for the first, second and third quarters of 2010 were 10,646,511, 10,585,178, and 10,574,117 respectively.
| 2009 |
For the Quarter Ended | | March 31, | | June 30, | | September 30, | | December 31, |
Net sales | $ | 1,057,548 | $ | 1,121,592 | $ | 1,124,107 | $ | 1,074,635 |
Gross margin | $ | 207,239 | $ | 217,916 | $ | 215,825 | $ | 213,970 |
Net income attributable to the Company | $ | 2,485 | $ | 8,321 | $ | 10,019 | $ | 16,452 |
Net income attributable to the Company per share of common stock (B) | $ | 0.21 | $ | 0.71 | $ | 0.85 | $ | 1.41 |
(B) All periods adjusted for ten percent (10%) stock dividends declared in December 2010 and December 2009. Prior to these adjustments, the average common shares outstanding for the first, second, third, and fourth quarters of 2009 were 9,748,124, 9,688,326, 9,660,951, and 9,626,045, respectively.
Item 9. Changes in and Disagreements With Accountants on Accounting and Financial Disclosure
None.
Item 9A. Controls and Procedures
Evaluation of Disclosure Controls and Procedures
The Company’s disclosure controls and procedures (as defined in Exchange Act Rules 13a-15(e) and 15d-15(e)) are designed to ensure that information required to be disclosed in the reports that the Company files and submits under the Exchange Act is accumulated and communicated to Company management, including the Company’s Principal Executive Officer and Principal Financial Officer, as appropriate to allow timely decisions regarding required disclosure.
An evaluation of the effectiveness of the design and operation of the Company's disclosure controls and procedures as of December 31, 2010 was performed under the supervision and with the participation of the Company’s management. Based on that evaluation, the Company's management, including the Principal Executive Officer and Principal Financial Officer, concluded that the Company's disclosure controls and procedures were effective as of December 31, 2010 to ensure that information required to be disclosed in the reports filed or submitted by the Company under the Exchange Act is recorded, processed, summarized and reported within the time periods specified in the Securities and Exchange Commission's rules and forms.
Management of the Company, including its Principal Executive Officer and Principal Financial Officer, does not expect that its disclosure controls will prevent or detect all errors. A control system, no matter how well designed and operated, can provide only reasonable, and not absolute, assurance that the control system’s objective will be met. Because of the inherent limitations in all control systems, no evaluation of controls can provide absolute assurance that all control issues, if any, have been detected. These inherent limitations include the realities that disclosure requirements may be misinterpreted and judgments in decision-making may be inexact.
Management’s Report on Internal Control Over Financial Reporting
Management of the Company is responsible for establishing and maintaining adequate internal control over financial reporting, as such term is defined in Exchange Act Rules 13a-15(f) and 15d-15(f). All internal control systems, no matter how well designed, have inherent limitations. Therefore, even those systems determined to be effective can provide only reasonable assurance with respect to financial statement preparation and presentation.
39
Management of the Company conducted an evaluation of the effectiveness of the Company’s internal control over financial reporting based on the framework inInternal Control – Integrated Framework,issued by the Committee of Sponsoring Organizations of the Treadway Commission (“COSO”). Based on that evaluation, management of the Company concluded that the Company's internal control over financial reporting was effective as of December 31, 2010.
Changes in Internal Control Over Financial Reporting
There were no changes in the Company's internal control over financial reporting that have occurred during the Company's last fiscal quarter that have materially affected, or are likely to materially affect, the Company's internal control over financial reporting.
Item 9B. Other Information
Not applicable.
40
PART III
Item 10. Directors, Executive Officers and Corporate Governance
The information with respect to the directors of the Companywho are nominees for election at the 2011 annual meeting of shareholders that isrequired to be included pursuant to this Item 10 will be included under the caption “Proposal 1– Nominees for Election as Directors” and “Information About the Board of Directors and Corporate Governance Matters” in the Company’s Information Statement relating to the 2011 Annual Meeting (the “Information Statement”) to be filed with the SEC pursuant to Rule 14c-5 under the Exchange Act, and is incorporated herein by reference.
Certain information regarding executive officersand directors who are not nominated for election at the 2011 annual meeting of shareholders, namely R. D. Offenbacher, that isrequired by this Item is set forth as a Supplementary Item at the end of Part I hereof. On January 10, 2011, R. D. Offenbacher, an officer, director, and Senior Vice President - U.S. Business of the Company announced his intention to retire as an officer and director, and from his employment with the Company, effective April 1, 2011. R. D. Offenbacher's extensive sales and management experience and industry knowledge enable him to provide valuable input to the Board on strategic initiatives proposed by the Company, especially with respect to sales and strategy in the electrical market.
The information with respect to the Company’s audit committee and audit committee financial expert, and nominating committee required to be included pursuant to this Item 10 will be included under the caption “Information About the Board of Directors and Corporate Governance Matters” in the Company’s Information Statement and is incorporated herein by reference.
The Company has adopted a code of ethics that applies to the Principal Executive Officer, Principal Financial Officer and Principal Accounting Officer (“Covered Officers”). This code of ethics is appended to the Company’s business conduct guidelines for all employees. The business conduct guidelines and specific code for Covered Officers may be accessed at the “About Us” page under “Code of Ethics” at the Company’s website at http://www.graybar.com and is also available in print without charge upon written request addressed to the Secretary of the Company at its principal executive offices.
Item 11. Executive Compensation
The information with respect to executive compensation, the Company’s advisory compensation committee, and thecompensation committee interlocks and insider participation required to be included pursuant to this Item 11 will be included under the captions “Information About the Board of Directors and Corporate Governance Matters” and “Compensation Discussion and Analysis” in the Information Statement and is incorporated herein by reference.
Item 12. Security Ownership of Certain Beneficial Owners and Management and Related Stockholder Matters
The information with respect to the security ownership of beneficial owners of more than five percent (5%) of the Common Stock and of directors and executive officers of the Company required to be included pursuant to this Item 12, will be included under the captions “Beneficial Ownership of More Than 5% of the Outstanding Common Stock” and “Beneficial Ownership of Management” in the Information Statement and is incorporated herein by reference.
Item 13. Certain Relationships and Related Transactions, and Director Independence
At the date of this report, other than as described under the caption “Transactions with Director” in the Information Statement, there are no reportable transactions, business relationships or indebtedness of the type required to be included pursuant to this Item 13 between the Company and the beneficial owner of more than five percent (5%) of the Common Stock, the directors or nominees for director of the Company, the executive officers of the Company or the members of the immediate families of such individuals. If there is any change in that regard prior to the filing of the Information Statement, such information will be included under such caption in the Information Statement and shall be incorporated by reference.
The information with respect to director independence and to corporate governance required to be included pursuant to this Item 13 will be included under the caption “Proposal 1: Nominees for Election as Directors” and “Information about the Board of Directors and Corporate Governance Matters” in the Information Statement and is incorporated herein by reference.
Item 14. Principal Accounting Fees and Services
The information with respect to principal accounting fees and services required to be included pursuant to this Item 14 will be included under the caption “Relationship with Independent Registered Public Accounting Firm” in the Company’s Information Statement and is incorporated herein by reference.
41
PART IV
Item 15.
| Exhibits, Financial Statement Schedules
|
| | | | |
P.O. Box 7231 | (a)
| Documents filed as part of this report:
|
| | | | | |
St. Louis, Missouri 63177 | The following financial statements and Report of Independent Registered Public Accounting Firm are included on the indicated pages in this 2010 Annual Report on Form 10-K.
|
| | | | | | |
_____________________
(A) Issued under the Voting Trust Agreement dated as of March 16, 2007.
(B) The number of shares of Common Stock to which such Voting Trust Interests relate.
(C) As of March 8, 2011, the Voting Trustees together held of record, with shared power to vote,
9,588,246 shares of Common Stock, or 81.9% of the outstanding shares of Common Stock.
4
Item 5. Business Experience of Voting Trustees.
The information with respect to the business experience of the Voting Trustees required to be included pursuant to this Item 5 is included in the Supplemental Item under the caption “Executive Officers of the Registrant”, in the Company’s Annual Report on Form 10-K for the period ended December 31, 2010 or will be included under the caption "Directors -- Nominees for Election as Directors" in Graybar's Information Statement relating to the 2011 Annual Meeting of Shareholders (the "Information Statement"), to be filed with the Commission pursuant to Rule 14c-5 under the Securities Exchange Act of 1934, each of which is incorporated herein by reference.
Item 6. Business and Professional Connection of Voting
Trustees with Issuer, Affiliates and Underwriters.
The information with respect to the business and professional connections of each Voting Trustee with Graybar and any of its affiliates is included in the Supplemental Item under the caption “Executive Officers of the Registrant”, in the Company’s Annual Report on Form 10-K for the period ended December 31, 2010 or will be included under the caption "Directors -- Nominees for Election as Directors" in the Information Statement, each of which is incorporated herein by reference.
Item 7. Other Activities of Voting Trustees.
Except as described in this Annual Report, the Voting Trustees did not perform any other activities during the fiscal year.
Item 8. Representation of Other Persons by Voting Trustees.
The Voting Trustees represented no persons other than holders of Voting Trust Interests during the fiscal year.
5
Item 9. Remuneration of Voting Trustees.
The following table presents information as to the aggregate remuneration received by each Voting Trustee for services in all capacities during the fiscal year from Graybar and its subsidiaries. No Voting Trustee received any remuneration from any person or persons for acting as Voting Trustee.
Name of | 1.
| Index to Financial StatementsCapacities in
| | Cash Compensation |
Voting | | which Compensation | | Salaries, Bonuses |
Trustee | | (i)
Received | Consolidated Statements of Income for each of the three years ended December 31, 2010 (page 21).
|
| | | |
| | (ii)
| Consolidated Balance Sheets, as of December 31, 2010 and 2009Directors’ Fees(1) (page 22).
|
| | | |
| | (iii)
| Consolidated Statements of Cash Flows for each of the three years ended December 31, 2010 (page 23).
|
| | | |
| | (iv)
| Consolidated Statements of Changes in Shareholders’ Equity for each of the three years ended December 31, 2010 (page 24).
|
| | | |
| | (v)
| Notes to Consolidated Financial Statements (pages 25 to39).
|
| | | |
| | (vi)
| Report of Independent Registered Public Accounting Firm (page 20).
|
| | | |
| 2.
| Index to Financial Schedules
|
| | | |
| | All schedules are omitted because of the absence of the conditions under which they are required or because the required information is set forth in the financial statements and the accompanying notes thereto.
|
| | | |
| 3.
| Exhibits
| |
| | | |
| | The following exhibits required to be filed as part of this Annual Report on Form 10-K have been included:
|
| | | |
| (3)
| (i)
| Articles of Incorporation
|
| | | |
| | | Restated Certificate of Incorporation, as amended, filed as Exhibit 3.1 to the Company’s Quarterly Report on Form 10-Q for the Quarter ended June 30, 2010 (Commission File No.000-00255) and incorporated herein by reference.
|
| | | |
| | (ii)
| Bylaws
|
| | | |
| | | By-laws as amended through December 10, 2009 filed as Exhibit (3)(ii) to the Company’s Current Report on Form 8-K dated December 16, 2009 (Commission File No. 000-00255) and incorporated herein by reference.
|
| | | |
| (4) and (9)
| Voting Trust Agreement
|
| | |
| | Voting Trust Agreement dated as of March 16, 2007, a form which is attached as Annex A to the Prospectus dated January 18, 2007, constituting a part of the Company’s Registration Statement on Form S-1 (Registration No. 333-139992) and incorporated herein by reference.
|
| | | |
| | The Company hereby agrees to furnish to the Commission upon request a copy of each instrument omitted pursuant to Item 601(b)(4)(iii)(A) of Regulation S-K.
|
| | | |
| | (i)
| Management Incentive Plan*
|
| | | |
| | (ii)
| Graybar Electric Company, Inc. Supplemental Benefit Plan, amended and restated, entered into between the Company and certain employees effective January 1, 2009, filed as Exhibit 99.1 to the Company’s Current Report on Form 8-K dated December 11, 2008 (Commission File No. 000-00255) and incorporated herein by reference.*
|
| | | |
| | (iii)
| Form of Deferral Agreement under Graybar Electric Company, Inc. Supplemental Benefit Plan, filed as Exhibit 99.2 to the Company’s Current Report on Form 8-K dated December 11, 2008 (Commission File No. 000-00255) and incorporated herein by reference.*
|
| | | |
| | (iv)
| Receivables Sale Agreement, dated June 30, 2000, between Graybar Electric Company, Inc. and Graybar Commerce Corporation filed as Exhibit 10.1 to the Company’s Quarterly Report on Form 10-Q for the period ended June 30, 2003 (Commission File No. 000-00255) and incorporated herein by reference; Amendment to Receivables Sale Agreement, dated August 15, 2006, filed as Exhibit 10(x) to the Company’s Registration Statement on Form S-1 (Registration No. 333-137249) and incorporated herein by reference; Amendment to Receivables Sale Agreement, dated of June 11, 2010, filed as Exhibit 10(ii) to Company’s Current Report on Form 8-K dated June 11, 2010 (Commission File No. 000-00255) and incorporated herein by reference.
|
| | | |
| | (v)
| Receivables Purchase Agreement, dated June 30, 2000, among Graybar Commerce Corporation, as Seller, Graybar Electric Company, Inc., as Servicer, Falcon Asset Securitization Corporation and Bank One, NA, as Agent, and other financial institutions named therein, filed as Exhibit 10.2 to the Company’s Quarterly Report on Form 10-Q for the period ending June 30, 2003 (Commission File No. 000-00255); Amendment to Receivables Purchase Agreement dated July 12, 2000, filed as Exhibit 10(xi) to the Company’s Registration Statement on Form S-1/A, filed on October 24, 2006 (Registration No. 333-137249); Amendments to Receivables Purchase Agreement dated January 1, 2001, June 22, 2001, August 29, 2001, October 26, 2001, December 31, 2001, October 23, 2002, and December 23, 2002, filed as Exhibit 10.2 to the Company’s Quarterly Report on Form 10-Q for the period ended June 30, 2003 (Commission File No. 000-00255) and incorporated herein by reference; Amendment to Receivables Purchase Agreement dated October 22, 2003, filed as Exhibit 10(v) to the Company’s Registration Statement on Form S-2 (Registration No. 333-118575) and incorporated herein by reference; Amendment to Receivables Purchase Agreement, dated September 26, 2005, filed as Exhibit 10(v) to the Company’s Annual Report on Form 10-K for the year ended December 31, 2005; Amendment to Receivables Purchase Agreement dated August 15, 2006, filed as Exhibit 10(ix) to the Company’s Registration Statement on Form S-1 (Registration No. 333-137249) and incorporated herein by reference; Amendment to Receivables Purchase Agreement dated September 25, 2009, and signed September 30, 2009, filed as Exhibit 10(v) to the Company’s Current Report on Form 8-K filed October 6, 2009 (Commission File No. 000-00255) and incorporated herein by reference; Amendment to Receivables Purchase Agreement dated October 9, 2009, and signed October 14, 2009, filed as Exhibit 10 to the Company’s Current Report on Form 8-K filed October 15, 2009 (Commission File No. 000-00255) and incorporated herein by reference; Amendment to Receivables Purchase Agreement, dated as of June 11, 2010, filed as Exhibit 10(i) to the Company’s Current Report on Form 8-K dated June 11, 2010 (Commission File No. 000-00255) and incorporated herein by reference; Amendment to Receivables Purchase Agreement, dated as of October 8, 2010, filed as Exhibit 10.1 to the Company’s Current report on Form 8-K dated October 8, 2010 as filed with the Commission on October 8, 2010 (Commission File No. 000-00255) and incorporated herein by reference;
|
| | | | | |
L. R. Giglio | | Director and Senior | | | $ 530,605 |
| | Vice President - | | |
| | Operations | | |
| | | | |
T. S. Gurganous | | Director and | | | $ 385,342 |
| | District Vice President | | |
| | | | |
R. D. Offenbacher | | Director and | | | $ 545,850 |
| | Senior Vice President - | | |
| | US Business | | |
| | | | |
R. A. Reynolds, Jr. | | Director, Chairman of | | | $ 1,450,006 |
| | The Board, President and | | |
| | Chief Executive Officer | | |
(1)Includes meeting fees of $300 per meeting for attendance at directors’ meetings of Graybar and remuneration paid March 11, 2011 under Graybar’s Management Incentive Plan with respect to services rendered during 2010. Excludes change in pension value, any nonqualified deferred compensation earnings, amounts contributed by Graybar to the qualified and non-qualified profit sharing and savings plans, perquisites and other personal benefits, and other miscellaneous items, as will be included in the Summary Compensation Table of the Information Statement.
426
Item 12. Lists of Exhibits Filed.
| | (vi)
(4) Instruments defining the rights of security holders, including indentures. Voting Trust Agreement dated as of March 16, 2007, a form which is attached as Annex A to the Prospectus, dated January 18, 2007, constituting a part of the Registration Statement on Form S-1 (Registration No. 333-139992), is incorporated herein by reference. | Five-Year Credit Agreement, dated May 8, 2007, among Graybar Electric Company, Inc., Bank of America N.A., as Agent, and other banks named therein, filed as Exhibit 10.1 to the Company’s Quarterly Report on Form 10-Q for the period ended March 31, 2007 (Commission File No. 000-00255) and incorporated herein by reference.
| |
| |
| (21)
| List of subsidiaries of the Company
|
| | | |
| (31.1)
| Certification Pursuant to Section 302 of the Sarbanes-Oxley Act of 2002 – Principal Executive Officer.
|
| | | |
| (31.2)
| Certification Pursuant to Section 302 of the Sarbanes-Oxley Act of 2002 – Principal Financial Officer.
|
| | | |
| (32.1)
| Certification Pursuant to 18 U.S.C. Section 1350, as Adopted Pursuant to Section 906 of the Sarbanes-Oxley Act of 2002 – Principal Executive Officer.
|
| | | |
| (32.2)
| Certification Pursuant to 18 U.S.C. Section 1350, as Adopted Pursuant to Section 906 of the Sarbanes-Oxley Act of 2002 – Principal Financial Officer.
|
| | |
| | *Compensation arrangement
|
| | | | | | | |
437
SIGNATURES
Pursuant to the requirements of Section 13 or 15(d) the Securities Exchange Act of 1934, the registrant has duly caused this Annual Report on Form 10-K to be signed on its behalf by the undersigned, thereunto duly authorized, as of the 8th day of March 2011.
| GRAYBAR ELECTRIC COMPANY, INC.
| |
| | |
| | |
| By
| /s/ R. A. REYNOLDS, JR.
| |
| | (R. A. Reynolds, Jr., Chairman of the Board and President)
| |
Pursuant to the requirements of the Securities Exchange Act of 1934, as amended, this Annual Report on Form 10-K, amended as prescribed by the Commission, has been signed below by the following persons, on behalfas Voting Trustees, as of March 23, 2011, said Voting Trustees being invested with the power to bind all of the Registrant inVoting Trustees.
As trustees under the capacities indicated, onVoting Trust Agreement
dated as of March 8, 2011.16, 2007.
/s/
By /S/ L. R. GIGLIO L. R. GIGLIO /S/ T. S. GURGANOUS T. S. GURGANOUS /S/ R. D. OFFENBACHER R. D. OFFENBACHER /S/ R. A. REYNOLDS, JR. R. A. REYNOLDS, JR. | | Director, Chairman of the Board and President
|
(R. A. Reynolds, Jr.)
| | (Principal Executive Officer)
|
| | |
| | |
/s/ D. B. D’ALESSANDRO
| | Director
|
(D. B. D’Alessandro)
| | (Principal Financial Officer)
|
| | |
| | |
/s/ MARTIN J. BEAGEN
| | Vice President and Controller
|
(Martin J. Beagen)
| | (Principal Accounting Officer)
|
| | |
| | |
/s/ R. A. COLE
| | Director
|
(R. A. Cole)
| | |
| | |
| | |
/s/ M. W. GEEKIE
| | Director
|
(M. W. Geekie)
| | |
| | |
| | |
/s/ L. R. GIGLIO
| | Director
|
(L. R. Giglio)
| | |
| | |
| | |
/s/ T. S. GURGANOUS
| | Director
|
(T. S. Gurganous)
| | |
| | |
| | |
/s/ R. R. HARWOOD
| | Director
|
(R. R. Harwood)
| | |
| | |
| | |
/s/ F. H. HUGHES
| | Director
|
(F. H. Hughes)
| | |
| | |
| | |
/s/ R. C. LYONS
| | Director
|
(R. C. Lyons)
| | |
| | |
448
SIGNATURES CONTINUED
EXHIBIT INDEX |
| | |
| | |
/s/ K. M. MAZZARELLA
| | Director
|
(K. M. Mazzarella)
| | |
| | |
| | |
/s/ R. D. OFFENBACHER
| | Director
|
(R. D. Offenbacher)
| | |
| | |
| | |
/s/ B. L. PROPST
| | Director
|
(B. L. Propst)
| | |
| | |
| | |
| | |
| | |
| | |
45
Index to Exhibits
| |
| | | |
| (3)
| (i)
| Articles of Incorporation
|
| | | |
| | | Restated Certificate of Incorporation, as amended, filed as Exhibit 3.1 to the Company’s Quarterly Report on Form 10-Q for the Quarter ended June 30, 2010 (Commission File No.000-00255) and incorporated herein by reference.
|
| | | |
| | (ii)
| | Bylaws
|
| | | | |
| | | | By-laws as amended through December 10, 2009 filed as Exhibit (3)(ii) to the Company’s Current Report on Form 8-K dated December 16, 2009 (Commission File No. 000-00255) and incorporated herein by reference.
|
| | | |
| (4) and (9)
| Voting Trust Agreement
|
| | |
| | Voting Trust Agreement dated as of March 16, 2007, a form which is attached as Annex A to the Prospectus dated January 18, 2007, constituting a part of the Company’s Registration Statement on Form S-1 (Registration No. 333-139992) and incorporated herein by reference.
|
| | |
| | The Company hereby agrees to furnish to the Commission upon request a copy of each instrument omitted pursuant to Item 601(b)(4)(iii)(A) of Regulation S-K.
|
| | | |
| (10)
| Material Contracts
| |
| | | | |
| | (i)
| Management Incentive Plan*
| |
| | | |
| | (ii)
| Graybar Electric Company, Inc. Supplemental Benefit Plan, amended and restated, entered into between the Company and certain employees effective January 1, 2009, filed as Exhibit 99.1 to the Company’s Current Report on Form 8-K dated December 11, 2008 (Commission File No. 000-00255) and incorporated herein by reference.*
| |
| | | |
| | (iii)
| Form of Deferral Agreement under Graybar Electric Company, Inc. Supplemental Benefit Plan, filed as Exhibit 99.2 to the Company’s Current Report on Form 8-K dated December 11, 2008 (Commission File No. 000-00255) and incorporated herein by reference.*
| |
| | | |
| | (iv)
| Receivables Sale Agreement, dated June 30, 2000, between Graybar Electric Company, Inc. and Graybar Commerce Corporation filed as Exhibit 10.1 to the Company’s Quarterly Report on Form 10-Q for the period ended June 30, 2003 (Commission File No. 000-00255) and incorporated herein by reference; Amendment to Receivables Sale Agreement, dated August 15, 2006, filed as Exhibit 10(x) to the Company’s Registration Statement on Form S-1 (Registration No. 333-137249) and incorporated herein by reference; Amendment to Receivables Sale Agreement, dated of June 11, 2010, filed as Exhibit 10(ii) to Company’s Current Report on Form 8-K dated June 11, 2010 (Commission File No. 000-00255) and incorporated herein by reference.
| |
| | | |
| | (v)
| Receivables Purchase Agreement, dated June 30, 2000, among Graybar Commerce Corporation, as Seller, Graybar Electric Company, Inc., as Servicer, Falcon Asset Securitization Corporation and Bank One, NA, as Agent, and other financial institutions named therein, filed as Exhibit 10.2 to the Company’s Quarterly Report on Form 10-Q for the period ending June 30, 2003 (Commission File No. 000-00255); Amendment to Receivables Purchase Agreement dated July 12, 2000, filed as Exhibit 10(xi) to the Company’s Registration Statement on Form S-1/A, filed on October 24, 2006 (Registration No. 333-137249); Amendments to Receivables Purchase Agreement dated January 1, 2001, June 22, 2001, August 29, 2001, October 26, 2001, December 31, 2001, October 23, 2002, and December 23, 2002, filed as Exhibit 10.2 to the Company’s Quarterly Report on Form 10-Q for the period ended June 30, 2003 (Commission File No. 000-00255) and incorporated herein by reference; Amendment to Receivables Purchase Agreement dated October 22, 2003, filed as Exhibit 10(v) to the Company’s Registration Statement on Form S-2 (Registration No. 333-118575) and incorporated herein by reference; Amendment to Receivables Purchase Agreement, dated September 26, 2005, filed as Exhibit 10(v) to the Company’s Annual Report on Form 10-K for the year ended December 31, 2005; Amendment to Receivables Purchase Agreement dated August 15, 2006, filed as Exhibit 10(ix) to the Company’s Registration Statement on Form S-1 (Registration No. 333-137249) and incorporated herein by reference; Amendment to Receivables Purchase Agreement dated September 25, 2009, and signed September 30, 2009, filed as Exhibit 10(v) to the Company’s Current Report on Form 8-K filed October 6, 2009 (Commission File No. 000-00255) and incorporated herein by reference; Amendment to Receivables Purchase Agreement dated October 9, 2009, and signed October 14, 2009, filed as Exhibit 10 to the Company’s Current Report on Form 8-K filed October 15, 2009 (Commission File No. 000-00255) and incorporated herein by reference; Amendment to Receivables Purchase Agreement, dated as of June 11, 2010, filed as Exhibit 10(i) to the Company’s Current Report on Form 8-K dated June 11, 2010 (Commission File No. 000-00255) and incorporated herein by reference; Amendment to Receivables Purchase Agreement, dated as of October 8, 2010, filed as Exhibit 10.1 to the Company’s Current report on Form 8-K dated October 8, 2010 as filed with the Commission on October 8, 2010 (Commission File No. 000-00255) and incorporated herein by reference;
| |
| | | | | | | | |
46
| | (vi)
| Five-Year Credit Agreement, dated May 8, 2007, among Graybar Electric Company, Inc., Bank of America N.A., as Agent, and other banks named therein, filed as Exhibit 10.1 to the Company’s Quarterly Report on Form 10-Q for the period ended March 31, 2007 (Commission File No. 000-00255) and incorporated herein by reference.
| |
| |
| (21)
| List of subsidiaries of the Company
|
| | | |
| (31.1)
| Certification Pursuant to Section 302 of the Sarbanes-Oxley Act of 2002 – Principal Executive Officer.
|
| | | |
| (31.2)
| Certification Pursuant to Section 302 of the Sarbanes-Oxley Act of 2002 – Principal Financial Officer.
|
| | | |
| (32.1)
| Certification Pursuant to 18 U.S.C. Section 1350, as Adopted Pursuant to Section 906 of the Sarbanes-Oxley Act of 2002 – Principal Executive Officer.
|
| | | |
| (32.2)
| Certification Pursuant to 18 U.S.C. Section 1350, as Adopted Pursuant to Section 906 of the Sarbanes-Oxley Act of 2002 – Principal Financial Officer.
|
| | |
| | *Compensation arrangement
|
| | | | | | | |
(4) Instruments defining the rights of security holders, including indentures.
Voting Trust Agreement dated as of March 16, 2007, a form which is attached as Annex A to the Prospectus, dated January 18, 2007, constituting a part of the Registration Statement on Form S-1 (Registration No. 333-139992), is incorporated herein by reference.
47