TABLE OF CONTENTS
| ITEM | PAGE | |||||||
| PART I | ||||||||
| 1 | ||||||||
| 1A | ||||||||
| 1B | ||||||||
| 1C | Cybersecurity | |||||||
| 2 | ||||||||
| 3 | ||||||||
| 4 | ||||||||
| * | Information About Our Executive Officers | |||||||
| PART II | ||||||||
| 5 | ||||||||
| 6 | ||||||||
| 7 | ||||||||
| 7A | ||||||||
| 8 | ||||||||
| 9 | ||||||||
| 9A | ||||||||
| 9B | ||||||||
| 9C | ||||||||
| PART III | ||||||||
| 10 | ||||||||
| 11 | ||||||||
| 12 | ||||||||
| 13 | ||||||||
| 14 | ||||||||
| PART IV | ||||||||
| 15 | ||||||||
| 16 | ||||||||
II-1 | ||||||||
II-3 | ||||||||
| * | Included pursuant to the General Instruction to Item 401 of Regulation S-K. | |||||||
| ITEM | PAGE | |
| PART I | ||
| 1 | ||
| 1A | ||
| 1B | ||
| 2 | ||
| 3 | ||
| 4 | ||
| * | ||
| PART II | ||
| 5 | ||
| 6 | ||
| 7 | ||
| 7A | ||
| 8 | ||
| 9 | ||
| 9A | ||
| 9B | ||
| PART III | ||
| 10 | ||
| 11 | ||
| 12 | ||
| 13 | ||
| 14 | ||
| PART IV | ||
| 15 | ||
| 16 | ||
| Exhibit Index | II-1 | |
II-3 | ||
| * | Included pursuant to Instruction 3 to Item 401(b) of Regulation S-K. | |
WHERE YOU CAN FIND MORE INFORMATION
We file annual, quarterly and current reports, proxy statements and other information with the SEC. You can inspect, readU.S. Securities and copy these reports, proxy statements and other information at the SEC's Public Reference Room, which is located at 100 F Street, N.E., Washington, D.C. 20549. You can obtain information regarding the operation of the SEC's Public Reference Room by calling the SEC at 1-800-SEC-0330.Exchange Commission (the SEC). The SEC also maintains a website at www.sec.gov on which you may access electronic copies of our SEC filings.
Our corporate headquarters areis located at 1133 Westchester Avenue, White Plains, NY 10604100 Washington Boulevard, 6th Floor, Stamford, Connecticut 06902 and the telephone number of this location is (914) 641-2000.
FORWARD-LOOKING AND CAUTIONARY STATEMENTS
Some of the information included herein includes forward-looking statements intended to qualify for the safe harbor from liability established by the Private Securities Litigation Reform Act of 1995. These forward-looking statements are not historical facts, but rather represent only a belief regarding future events based on current expectations, estimates, assumptions and projections about our business, future financial results, the industry in which we operate, and other legal, regulatory and economic developments. These forward-looking statements include, but are not limited to, future strategic plans and other statements that describe the company’s business strategy, outlook, objectives, plans, intentions or goals, and any discussion of future events and future operating or financial performance.
We use words such as “anticipate,” “estimate,” “expect,” “project,” “intend,” “plan,” “believe,” “target,” “future,” “may,” “will,” “could,” “should,” “potential,” “continue,” “guidance” and other similar expressions to identify forward-looking statements. Forward-looking statements are uncertain and, by their nature, many are inherently unpredictable and outside of ITT’s control, and are subject to known and unknown risks, uncertainties and other important factors that could cause actual results to differ materially from those expressed or implied in, or reasonably inferred from, such forward-looking statements.
Where in any forward-looking statement we express an expectation or belief as to future results or events, such expectation or belief is based on current plans and expectations of our management, expressed in good faith and believed to have a reasonable basis. However, we cannot provide any assurance that the expectation or belief will occur or that anticipated results will be achieved or accomplished.
Among the factors that could cause our results to differ materially from those indicated by forward-looking statements are risks and uncertainties inherent in our business including, without limitation:
•uncertain global economic and capital markets conditions, which have been influenced by heightened geopolitical tensions, inflation, changes in monetary policies, the threat of a possible global economic recession, trade disputes between the U.S. and its trading partners, political and social unrest, and the availability and fluctuations in prices of energy and commodities, including steel, oil, copper and tin;
•fluctuations in interest rates and the impact of such fluctuations on customer behavior and on our cost of debt;
•fluctuations in foreign currency exchange rates and the impact of such fluctuations on our revenues, customer demand for our products and on our hedging arrangements;
•volatility in raw material prices and our suppliers’ ability to meet quality and delivery requirements;
•risk of liabilities from recent mergers, acquisitions, or venture investments, and past divestitures and spin-offs;
•our inability to hire or retain key personnel;
•failure to compete successfully and innovate in our markets;
•failure to manage the distribution of products and services effectively;
•failure to protect our intellectual property rights or violations of the intellectual property rights of others;
•the extent to which there are quality problems with respect to manufacturing processes or finished goods;
•the risk of cybersecurity breaches or failure of any information systems used by the Company, including any flaws in the implementation of any enterprise resource planning systems;
•loss of or decrease in sales from our most significant customers;
•risks due to our operations and sales outside the U.S. and in emerging markets, including the imposition of tariffs and trade sanctions;
•fluctuations in demand or customers’ levels of capital investment, maintenance expenditures, production, and market cyclicality;
•the risk of material business interruptions, particularly at our manufacturing facilities;
•risks related to government contracting, including changes in levels of government spending and regulatory and contractual requirements applicable to sales to the U.S. government;
•fluctuations in our effective tax rate, including as a result of changing tax laws and other possible tax reform legislation in the U.S. and other jurisdictions;
•changes in environmental laws or regulations, discovery of previously unknown or more extensive contamination, or the failure of a potentially responsible party to perform;
•failure to comply with the U.S. Foreign Corrupt Practices Act (or other applicable anti-corruption legislation), export controls and trade sanctions; and
•risk of product liability claims and litigation.
Refer to Item 1A, Risk Factors for more information on factors that could cause actual results or events to differ materially from those anticipated and disclosed within this Annual Report on Form 10-K, our Quarterly Reports on Form 10-Q and in other documents we file from time to time with the SEC.
The forward-looking statements included in this Annual Report on Form 10-K speak only as of the date of this report. We undertake no obligation (and expressly disclaim any obligation) to update any forward-looking statements, whether written or oral or as a result of new information, future events or otherwise.
PART I
| ITEM 1. | DESCRIPTION OF BUSINESS | ||||
(In millions,Amounts reported in this Annual Report on Form 10-K, except per share amounts, are stated in millions unless otherwise stated)
COMPANY OVERVIEW
ITT is a diversified manufacturer of highly engineered critical components and customized technology solutions primarily for the transportation, industrial and oil and gasenergy markets. We manufacture components that are integral to the operation of equipment, systems and manufacturing processes in these key markets. Our products provide enablingenable functionality for applications where reliability and performance are critically important to our customers and the users of their products.
We are a global company with approximately 10,000 employees in approximately 35 countries and 2017 revenue of $2.6 billion, which we derived from sales in more than 100 countries. In 2017, 67% of our sales were outside the U.S., including 33% from emerging markets. Accordingly, approximately half of our manufacturing facilities are outside of the U.S. in order to achieve strategic proximity to customers, further increase global sales and market share, and lower costs.
| 2023 COMPANY SNAPSHOT | |||||
| • $3.3 billion of sales across approx. 125 countries | • Approx. 10,600 employees in 37 countries | ||||
| • Global presence with 67% of revenue outside the U.S. | • Balanced and diversified portfolio | ||||


MT is a global manufacturer of highly engineered and durable brake pads, shock absorbers and damping technologies for the automotive and rail markets. IP is a global manufacturer of industrial pumps, valves, and monitoring and control systems, and provides aftermarket services for the energy, chemical and petrochemical, pharmaceutical, general industrial, mining, pulp and paper, food and beverage, and biopharmaceutical markets. CCT is a global designer and manufacturer of harsh-environment connectors and critical energy absorption and flow control components, primarily for the aerospace, defense and industrial markets. For additional segment information, see Segment Information section.
Business Model and Strategy
Our businesses share a common, repeatable operating model centered on our engineering aptitude.capabilities. Each business applies its technology and engineering expertise to solve some of theour customers' most pressing challenges of our customers.challenges. Our applied engineering provides a specialtechnological applications foster an ongoing business fitrelationship with our customers given the critical nature of their applications. This in turnwhich provides us with unique insight into our customers' requirements and enableswhile enabling us to develop solutions to better assist our customers to achieve their business goals. Our technology and customer intimacy together produceprovide opportunities to capture recurring revenue streams, aftermarket opportunities and long-lived platforms from original equipment manufacturers (OEMs).
We possess strong leading brands, such as Goulds Pumps, Bornemann, Engineered Valves, Cannon, VEAM, BIW Connector Systems, KONI, Axtone, Wolverine, Enidine, Aerospace Controls,create long-term stakeholder value through our four strategic priorities of customer centricity, operational excellence, effective capital deployment, and ITT, in many of our niche markets. These brands are associated with quality, reliability, durability,sustainability and engineering excellence.innovation. Our brands extend internationally and participate in emerging markets including China, Mexico, Brazil, Saudi Arabia, and Russia.
Our operational focus centers on the principles of Lean Six Sigma (herein referred to as Lean) to reduce costssafety, quality, on-time delivery and cycle times while improving overall productivity, quality, and safetyproductivity. We are on a continuing basis. We have also movedjourney to establish a higher performance culture that goes beyond the factory floor to improve the efficiency and effectiveness of otherall critical processes in the value chain to become a truly lean enterprise. This initiative encompasseschain. These initiatives encompass not only core Lean problem solving and continuous improvement principles,
1
but also leadership, talent and cultural aspects. For additional information, refer to Human Capital Management below.
Primary Businesses and Brands
Our brands have a strong international presence across many emerging markets, including China, India, Mexico, Brazil and Saudi Arabia. Below is a list of the key brands in each segment.
| OUR KEY BRANDS | |||||||||||
| MT | • ITT Friction TechnologiesTM | • KONI® | • Wolverine Advanced Materials® | ||||||||
• Axtone® | • NovitekTM | • GALT.® | |||||||||
| IP | • Goulds PumpsTM | • Bornemann® | • Engineered Valves® | ||||||||
• PRO Services® | • C'treat® | • i-ALERT® | |||||||||
• Rheinhütte Pumpen® | • HabonimTM | ||||||||||
| CCT | • Cannon® | • VEAM® | • BIW Connector Systems® | ||||||||
• Aerospace ControlsTM | • Enidine® | • Compact AutomationTM | |||||||||
• Neo-Dyn® Process Controls | • Conoflow® | • Micro-ModeTM | |||||||||
Environmental, Social & Governance
Environmental, social & governance (ESG) practices play an essential role in our business and are firmly rooted in how we conduct our operations and in our daily decisions. Our products, manufacturing processes and innovations reflect our drive to help make the world and the communities we serve more sustainable. We believe ingraining ESG priorities into our strategy will drive long-term growth and shareholder value and help our customers meet their ESG goals and, furthermore, is simply the right thing to do.
Environmental
We recognize climate change is a global crisis and we are committed to doing our part to reduce the environmental impact of our operations. Our approach to environmental stewardship falls into three categories:
▪Development of innovative products that help customers reduce their greenhouse gas (GHG) emissions, achieve their sustainability goals and comply with emissions reduction regulations;
▪Investment in technologies to reduce CO2 emissions, waste sent to landfills and water usage and increase our energy supply security through solar installations; and
▪Development of a credible path to carbon neutrality through our Reduce–Avoid–Offset framework, in which we seek to reduce our carbon footprint and commit to using renewable energy sources.
We partner with our customers to solve challenging problems and deliver best-in-class solutions. ITT's products enable our customers to operate more efficiently, reduce their total cost of ownership and produce sustainable, environmentally friendly technologies and processes.
At the same time, it is a business imperative for us to ensure our operations are efficient, sustainable and environmentally conscious. In 2021, we launched our Reduce–Avoid–Offset framework as part of our development of a credible plan to carbon neutrality. After developing the framework, we announced a goal of reducing our global Scope 1 and 2 GHG emissions for all of ITT by 10% by the end of 2026, compared to 2021. In 2022, we launched a pilot program at our three most energy-intensive locations geared towards more precise measurement and analysis of Scope 1 and 2 GHG emissions. In 2023, we expanded the pilot program to sites in Czechia and Mexico. As part
2
of this, we are also in the process of collecting and measuring preliminary Scope 3 emissions to further understand the source of our emissions and how to most accurately reduce them.
We are subject to stringent federal, state, local, and foreign environmental laws and regulations concerning air emissions, water discharges and waste disposal. In the U.S., these include, but are not limited to, the Federal Clean Air Act, the Clean Water Act, the Resource, Conservation and Recovery Act, and the Comprehensive Environmental Response, Compensation and Liability Act. We closely monitor our environmental responsibilities, together with trends in environmental laws. Separate from our Reduce–Avoid–Offset framework, we have established an internal program to assess compliance with applicable environmental requirements at our facilities. The program, which includes periodic audits of many of our locations, including our major operating facilities, is designed to identify problems in a timely manner, correct potential deficiencies and maintain continued regulatory compliance. ITT's environmental liabilities are, for the most part, not associated with current operating facilities (only two of ITT's 26 locations with current environmental obligations are associated with active operating sites). Additionally, ITT’s diligent approach to remediation has resulted in a reduction in the number of ongoing environmental remediation matters by approximately 50% over the past eight years.
Environmental laws and regulations are subject to change, and the nature and timing of such changes, if any, is difficult to predict. To minimize our exposure, we have purchased insurance protection against certain environmental risks arising from our business activities. As actual costs incurred at identified sites in future periods may vary from our current estimates given the inherent uncertainties in evaluating environmental exposures, it is not possible to reasonably predict the outcome of these uncertainties or any resulting impact on our financial statements.
For additional information regarding environmental matters, see "Critical Accounting Estimates" within Item 7, Management's Discussion and Analysis, and Note 19, Commitments and Contingencies, to the Consolidated Financial Statements.
Social
We recognize that sustainable performance goals.and growth are made possible only through the efforts of our dynamic, diverse team of approximately 10,600 ITTers globally. Given this, one of our most important commitments as a company is to create an engaging, inspiring place to work and drive actions that enable every individual's full potential and performance. Refer to the "Human Capital Management" section below for further information.
Our Board of Directors (the “Board”) is composed of highly experienced and diverse individuals. The role of the Board is to oversee the affairs of the Company, including those pertaining to ESG, and to ensure the overall success of the business. ITT's Board believes in strong corporate governance and is committed to sound principles and practices. Meanwhile, our ethics and compliance and enterprise risk management programs, and ongoing shareholder engagement, help us to understand key risks and market trends as an organization and deploy resources appropriately to meet our current and future needs. ITT has been an early adopter of many of the most significant governance advances over the last two decades, including majority voting for uncontested director elections, proxy access bylaws, an independent Board Chair and shareholder rights to call a special meeting.
Human Capital Management
We believe that sustainable performance and growth are made possible only through the efforts of our dynamic and diverse team of employees. In order to continue innovating in the industries and key end markets we serve, ITT remains committed to attracting and retaining top talent globally. We strive to make ITT an inclusive and safe workplace for all, and to create a higher performance culture with opportunities and training for all employees to develop and grow professionally and personally. In addition, we offer competitive compensation, benefits, and health and wellness programs.
As of December 31, 2023, we had approximately 10,600 employees located in 37 countries, including approximately 2,850 employees in the U.S. As of December 31, 2023, approximately 20% of our U.S. employees are represented by unions. No one unionized facility in the U.S. accounted for more than 15% of ITT's total revenues. In addition, many of our employees outside the U.S. are covered by collective agreements or represented
3
by works councils or other groups. We continually focus on building strong relationships with our employees. and we have not experienced any material strikes or work stoppages in the past several years.
Diversity, Equity and Inclusion
Diversity, equity and inclusion (DEI) are key business priorities for ITT and core to our values as a company. We are committed to fostering an inclusive culture that is fueled by diverse ideas and perspectives, and to leveraging these differences in ways that positively impact our performance, the engagement of our people and the global communities in which we operate. We demonstrate our commitment to DEI through actions and we align our efforts to our strategic workplace and marketplace goals. This includes creating an environment where all ITTers can fully engage, achieve their potential and freely share ideas to guide us toward innovative thinking and better business decisions and solutions. It also includes driving practices and programs to build and support diverse representation in our employee population, including diversity with regard to race, religion, gender, disability, nationality, age, sexual orientation, ethnic background and more. We firmly believe we will create more success by fostering diversity of thought and continuously learning from each other's ideas, opinions and experiences. We also believe that by creating a diverse environment, we will sustain and propel our success in the global marketplace to create long-term sustainable value for all our stakeholders. For additional information about the actions we are taking to drive our DEI strategy along with our diversity goals please refer to our 2023 Sustainability Update. Our 2022 Sustainability Report and our 2021 Sustainability Supplement, both of which can be found on our website at www.itt.com/sustainability, also provide information and the history of our DEI journey. In addition, to provide additional transparency regarding our commitment to diversity, our most recent Employment Information Report (EEO-1 report) is available on our website at www.itt.com/our-people/eeo-1-report. We will post our 2023 EEO-1 report to this website when it becomes available.
Health, Safety and Well-being
At ITT, the health, safety, and well-being of our employees is our number one priority. Our Environmental, Safety, Health and Security Council provides for the systemic control of workplace risks and drives continual improvement of environmental and occupational safety and health protocols at all of our sites around the world. We challenge ourselves to continually reduce injury frequency and severity by engaging employees in our “Accept Only Zero” safety accountability system and fostering an environment where employees take responsibility for their actions and have access to tools and training to work safely together. Despite these comprehensive measures, accidents still occur. In such cases, we report the accident, its root cause and any corrective measures taken in ITT’s company-wide accident reporting and tracking tool. Accident reporting and analysis helps ITT gauge the effectiveness of our safety initiatives and procedures across all sites, and it helps us find creative solutions to mitigate risks to our employees at our sites.
Talent Development
In order to foster a higher-performance culture, we are committed to maintaining effective strategies to support recruiting and hiring, onboarding and training, compensation planning, performance management and professional development. We invest significant resources to develop our talent in order to remain a worldwide leader in the manufacturing of highly engineered customized products and solutions. We focus on providing meaningful, equitable career development pathways and support to help ITTers realize their career aspirations. Our development philosophy is built around a “know-do” framework which includes both formal training and experiential learning. Tailored learning programs, coaching and mentoring elevate both technical and other skills (the “know”) while challenging, well-planned work experiences and global assignments prepare ITTers for current and future roles (the “do”). Successful employee development is also supported by thoughtful plans built in partnership between employees and their managers. Our development planning tools and processes ensure targeted, concrete action planning, and we promote continuous feedback and regular check-ins.
Compensation and Benefits
We provide flexible compensation and benefits programs to help meet the needs of our employees and their families. In addition to base salaries, we offer numerous benefits for eligible employees, including annual bonuses, stock awards, an employee stock purchase plan, a 401(k) Plan, healthcare and insurance benefits, health savings and flexible spending accounts, paid time off, family leave, flexible work schedules, retirement benefits, employee assistance programs and tuition reimbursement. ITT’s pay and recognition practices leverage data to ensure our employees receive competitive, equitable salaries supported by evaluations of roles, experience, performance and union or works council agreements in select areas. Our variable incentive plans reinforce pay for performance and our strong belief in meritocracy. The majority of our employees are eligible for either a performance-based bonus or a statutory profit-sharing payment. The bonus plans align employee compensation with financial or operational results and individual performance. With respect to stock awards, we have used discretionary equity-based grants
4
with time-based vesting conditions to facilitate the retention of key personnel, particularly those identified as high-performing talent.
SEGMENT INFORMATION
See Note 3, Segment Information, to the Consolidated Financial Statements for financial information about each of our segments.
Motion Technologies (MT)
The Motion Technologies segment commonly referred to as MT, is a manufacturer of brakingbrake pads, shims, shock absorbers, and energy absorption components and sealing technologies primarily for the transportation industry, including passenger cars and trucks, light- and heavy-duty commercial and military vehicles, buses and rail.trains. MT consists of threethe following primary business units,units: ITT Friction Technologies, Wolverine Advanced Materials, KONI, and KONI.Axtone.
Friction manufactures a range of brake pads installed as original equipment (OE) pads on passenger cars (both internal combustion engine vehicles and light-electric vehicles) and heavy-dutylight commercial vehicles. Demandvehicles for MT's products stem from a variety of end customers and automotive platforms around the world. OE brake pads are sold either directly to original equipment manufacturers (OEMs)OEMs or to Tier-1 brake manufacturers. Our OE brake pads are designed to meet customer specifications and environmental regulations, and to satisfy an array of performance standards and geographic applications.across multiple geographies. Most automobileautomotive OEM platforms (car model)models) require specific brake pad formulations and have demanding quality, delivery and volume schedules.
Friction anticipated the industry transition towards copper-free brake pads and is a recognized industry leader in the paradigm shift towards new brake pad formulations that are designed, developed and tested specifically for electric vehicles (EVs). Success in developing brake pads for EVs has led Friction to win multiple EV platform awards with established and new OEMs.
Friction Technologies also manufactures aftermarket brake pads designed for the automotive service and repairs market. This market consists of both OE dealers, also referred to as original equipment sparesservice (OES) networks, and independent aftermarket (AM) networks. Brake pads sold within the OES network generally match the specifications of an original auto platform OE brake pad while ourand are sold either directly to OEMs or to Tier-1 brake manufacturers, such as Continental AG (Continental), or indirectly through independent distributor channels. Our catalog of AM pads featuresold in independent aftermarket networks features technology designed to provide a range of braking performance levels. Within the service and repairs market, pads are sold either directly to OE manufacturers or Tier-1 brake manufacturers (such as Continental or TRW) or indirectly through independent distributor channels.
Wolverine Advanced Materials (Wolverine)
Wolverine is a manufacturer of customizedcustom damping technologies for automotive braking systems (for both internal combustion engine vehicles and EVs) and specialized gasket sealing solutions for harsh operating environments across a rangeenvironments. Wolverine sells its products, which consist primarily of industries.brake shims and gaskets, to Tier-2 brake pad suppliers (including Friction) and to Tier-1 manufacturers. Brake shims are thin metal and rubber adhesive dampeners that fit onto the brake pad and against the brake caliper to prevent excessive noise and vibration. Gaskets are an anti-vibration solution and a sealing solution that prevent fluid spillage within applications tosuch as engines, transmissions, exhaust systems, fuel systems and a variety of pneumatic systems. These products are sold either as coils of rubber-coated sheet metal or stamped into finished component parts.
KONI &and Axtone
The KONI and Axtone businesses are organized into threeservice four main product groups:end markets: railway rolling stock;stock for freight and passenger trains; car &and racing; and bus, truck & trailer.and trailer; and defense.
Railway Rolling Stockprovides a wide range of equipment for passenger rail, locomotives, freight cars, high speed trains and light rail. Offerings include customized energy absorption solutions, hydraulic shock absorbers (primary, lateral, and inter-car), yaw dampers, springs, visco-elastic and hydraulic buffers, coupler components and coupler components.crash mitigation equipment. Revenue opportunities forfrom our rail damping systems areis balanced between OE and AMaftermarket customers. Sales are made either directly to train manufacturers and train operators carrying out scheduled train maintenance programs or indirectly through distributors. KONI and Axtone are lifetime partners of rail customers, also offering repair and overhauling capabilities for their products.
Car &and Racing features performance shock absorbers often using our Frequency Selective Damping (FSD) technology. FSD products generally have beenare used by car and racing enthusiasts who desire to modify their cars for increased handling performance and comfort, and are now also being incorporated into OEM platform designs.comfort. KONI aftermarket car shock absorbers are sold all overaround the world,
5
directly to customers and through a distribution network that markets KONI products into specific geographies or customer groups. KONI shock absorbers are also incorporated into new OEM platform designs and sold to Tier-1 shock absorber manufacturers.
Bus, Truck &and Trailer,and Defense manufactures hydraulic and hydro-pneumatic shock absorbers and bus dampers, for sale to both OEM and AMaftermarket customers.
MT has a global manufacturing footprint with advanced automation capabilities, with production facilities in Western Europe, Eastern Europe, China, North America and North America.India.
MT competes in markets primarily served by large and well-established national and global companies. Key competitive drivers within the brake pad businessand brake shim businesses include technical expertise, formulation development capabilities, scale production, product performance, high-quality standards, customer intimacy, reputation and the ability to meet demanding delivery and volume schedules in a reducedlimited amount of time. We have well-established, long-term relationships with our OE and OES brake pad customers usually require long-lasting and well-established relationships, based on mutual trust, local proximity and a wide range of cooperative activities, startingranging from the design, to the sampling, prototyping and testing phases of brake pads. Within the independent AM pads market,
MT is a leading European providerglobal leader in a highly fragmented global market.
rail suspension components, freight coupling devices currently used in Europe and crash absorption systems. Competitive drivers in theMT's rail damping systems business include customer intimacy, price, technical expertise and product performance. Rail damping systemsMT's rail products are considered critical components because of safety requirements and thus they have to beare designed specifically designed according to manyfor different train applications and must satisfy strict compliance requirements.
MT's sales to Continental, a supplier to the automotive industry and MT's largest customer, represented 16% of MT's 2023 revenue. Automaker requests to use ITT brake pads in their Continental-produced braking systems (calipers) typically account for approximately half of MT's revenue from Continental. These automaker requests are generally formalized through supply agreements signed directly between MT and the automakers. The remainder of MT's sales to Continental is through a long-term agreement to supply Continental with aftermarket parts.
Industrial Process (IP)
The Industrial Process segment is an OEM and an aftermarket parts and service provider of industrial pumps, valves, plant optimization and remote monitoring systems and services. IP's products serve an extensive base of customers ranging from large multi-national companies and engineering, procurement and construction (EPC) firms to regional distributors and various other end-users. IP has a global manufacturing footprint with significant operations in the United States, South Korea, Saudi Arabia, Mexico and Germany. IP's customers operate in global infrastructure and natural resource markets such as energy, chemical and petrochemical, pharmaceutical, biopharmaceutical, general industrial, mining, pulp and paper, food and beverage, and power generation. IP's marketplace-recognized brands include Goulds PumpsTM, Bornemann®, Rheinhütte Pumpen®, Engineered Valves®, PRO Services®, C'treat®, i-ALERT® and HabonimTM.
Industrial Pumps
Industrial pumps are used by a wide array of customers and applications primarily in the chemical, energy, mining, general industrial, pharmaceutical and power generation markets. IP designs and manufactures configured-to-order and standards-based industrial pumps that are highly engineered and customized to customer needs. These products include a broad portfolio of centrifugal and twin screw positive displacement pumps that meet the following industry-recognized standards: American Petroleum Institute (API), American National Standards Institute (ANSI), ATmosphere EXplosible, European Directive 2014/34/EC (ATEX), IEC standards (IECEx) and International Organization for Standardization (ISO). Our project pumps are generally part of larger and more complex capital projects, have longer lead times than baseline pumps and are generally managed by EPC firms.
Valves
Valves are manufactured to handle a wide variety of process conditions and solve unique challenges in the biopharmaceutical, chemical, mining, power generation, pulp and paper, and general industrial markets. Our portfolio of valve products includes knife-gate valves, ball valves, hygienic and industrial diaphragm valves, and valve actuators, marketed under the brand names EnviZion®, Cam-LineTM, Cam-Tite®, Dia-Flo®, Fabri-Valve®, Pure-Flo®, Skotch®, and HabonimTM. Also included within our portfolio is the Integrated Sensing Platform (ISP), which is a leadernext-generation linear position sensing technology for EnviZion® and Pure-Flo® hygienic diaphragm valves, developed specifically for the toughest applications in the rail dampers componentbiopharmaceutical and sanitary industries.
6
Aftermarket
Our aftermarket solutions, which represented approximately 45% of IP's revenue in 2023, provide customers with replacement parts, services and plant optimization solutions that reduce total cost of ownership of pumps and rotating equipment. In addition to providing standard repairs, IP also develops engineered solutions for specific customer process issues. Examples include innovative technologies like PumpSmart® Control & Protection Technology and i-ALERT® Equipment Health Monitoring Devices, which remotely control and monitor pumps and other rotating equipment in an industrial environment.
Other Information
IP markets its products via a global and diversified sales channel structure. Sales to independent distributors, who service end-users, account for approximately one-third of IP's revenue. We also sell directly to end-users through our customer-focused direct sales and service organization. In addition, we have focused channels dedicated to supporting EPC firms as their needs are often distinct from those of distribution and end-user customers.
The pump and valve markets we serve are highly competitive and fragmented. For most of our products, there are many regional competitors and a limited number of larger global peers. Primary customer purchase decision drivers include price, lead time and on-time performance, brand recognition, quality, breadth of product and service offerings, commercial terms, technical support and localization. Pricing can be very competitive for large projects because completed projects generate ongoing profitable aftermarket opportunities for the complete rail damper system in Europe and continues to gain market share in China.
OE provider.
Connect & Control Technologies (CCT)
Connector Products
The connector product portfolio includes high performance electricalhigh-performance connectors of the following types: Circular, Rectangular, Radio Frequency, Fiber Optic, D-sub Miniature, Micro-Miniature and cable assemblies. Brands include Cannon®, VEAM®, Micro-ModeTM, and BIW Connector Systems®, which deliver solutions to enable the transfer of data, signal,signals and power intofor various end-user markets including aerospace, defense, industrial, transportation, medical and oil and gas.energy. These brands are known for high-performance, high-reliability solutions which withstand high vibrationstemperatures and pressure and are resistant to dirt and fluids.corrosive environments. In certain harsh environment niche markets, our connector products are considered market leaders because of theirour technological capabilities, cost performance and global footprint.
Products for the commercial aerospace and defense markets include industry standards-based connectors and late-stage customized solutions for most segments of the commercial aviation and defense industries.solutions. These products are designed to withstand the extreme shock, exposure, and vibrationconditions in harsh environments that are typical in aviation and military applications and where reliability and safety are critical factors.
Products for the industrial markets include connectors for industrial production and transportation equipment, industrial electronics and instruments, and other industrial and medical applications. Products for the transportation markets include connectors for high-speed, mainline, metro and lightelectric vehicle charging station applications, passenger rail and heavy-duty vehicles, and electric vehicle applications.vehicles.
Products for the oil and gasenergy markets include connectors that provide power for electric submersible pumps in oil and gas wells, reservoir monitoring instruments and electrical downhole heaters. Oil and gasSpecific product applications include electrical power penetrationspenetrators for wellheads, packers and pods that are able to accommodate any sizevarious sizes and provide for multiple sealing strategies and ratings.
Control Products
The control product portfolio providesconsists of highly engineered actuation, fuel management, noise andflow control, energy absorption, and environmental control, system applications, with a specialized set of design and application engineering skills and capabilities that enables CCT to engineer differentiated customcomposite component solutions for unique applications for the aerospace, and defense and industrial markets.
Control products for the aerospace and defense markets consist of fuelinclude actuators, valves, pumps and water pumps, valves, electro-mechanical rotary and linear actuators, and pressure, temperature, limit, and flow switches for various aircraft systems. These products also include stowage binflow control applications, rate controls, rotary hinge dampers and actuators, seat recline locks and control cables, electromechanical seat actuation, a variety of engineered elastomer isolators to protect equipmentfor aircraft interiors, elastomeric
7
bearings for rotorcraft vibration isolation, heaters, hoses, and keep the interior of the aircraft quiet, certain energy absorption products and other aerospace components. Other control productscomposite ducting for this market include environmental control systems, such as climate control and ice protection heaters, composite conveyance ductingadvanced composites for engine applications. Brands include Aerospace Controls® and acoustically engineered inlets and exhausts for auxiliary power units.Enidine®.
Control products for the industrial markets include large and small bore shock absorbers, linearwire ropes and rotary actuators for factory and warehouse automation, regulators and switches for process control instrumentation, such as highapplications, seismic isolators and low pressurelarge bore shocks for protection of critical infrastructure, and regulators for natural gas vehicles. Brands include Enidine®, Compact AutomationTM, Turn-Act®, Neo-Dyn®and flow, temperature,Conoflow®.
Other Information
CCT has a global production footprint, including facilities in the United States, Mexico, Germany, Italy, China and pressure switches. The shock absorbersJapan, which provide close geographic proximity to key customers. CCT competes with a large number of companies in highly fragmented industries, ranging from large public multi-national corporations to small privately-held local firms, depending on the product line and actuators serveregion. CCT's ability to compete successfully depends upon numerous factors including quality, price, lead time, performance, brand recognition, customer service, innovation, application expertise and previous installation history. In addition, collaboration with customers to deliver a wide range of applications in a diverse setproduct offerings has allowed CCT to compete effectively, to cultivate and maintain strong customer relationships and to expand into new markets. CCT products are sold directly and indirectly through numerous channels, including distributors. CCT has long-lasting relationships with distributors, as many have been selling certain CCT products for decades. Sales to distributors represented approximately 30% of end-markets including production, packaging,CCT's 2023 revenue.
OTHER COMPANY INFORMATION
Key Components and factory automation. The process control products primarily serve the chemical, petrochemical, and energy segments of the industrial market.
Raw Materials
All of our businesses require various OEM products, manufactured components and raw materials;materials, the availability and prices of which may fluctuate. The principal OEM products and manufactured components assembled into our products include motors, castings, mechanical seals, machined castings, metal fabrications and miscellaneous metal, plastic, or electronic components. The primary raw
| MANUFACTURED COMPONENTS ASSEMBLED INTO OUR PRODUCTS | |||||
• Motors | • Castings | ||||
• Mechanical Seals | • Machined Castings | ||||
• Metal Fabrications | • Miscellaneous Metal, Plastic, and Electronic Components | ||||
| PRIMARY RAW MATERIALS | |||||||||||
• Steel | • Gold | • Copper | • Nickel | ||||||||
| • Iron | • Aluminum | • Tin | • Rubber | ||||||||
| • Specialty Alloys, including Titanium | |||||||||||
Raw materials used in manufacturing our products include steel, gold, copper, nickel, iron, aluminum, tin, and rubber, as well as specialty alloys, including titanium. Materials are purchased in various forms, such as sheet, bar, rod and wire stock, pellets and metal powders.
We also use various specialty resins and adhesives. Raw materials, supplies and product subassemblies are purchased from third-party suppliers, contract manufacturers and commodity dealers. For most of our products, we have existing alternate sources of supply or such materials are readily available. InHowever, in some instances we depend on a single source of supply, manufacturing or assembly or participate in commodity markets that may be subject to a limited number of suppliers.
Our operating results are generally exposed to fluctuations in the prices and supply constraints of raw materials and commodities due to inflation, supply chain disruptions, foreign currency fluctuations, and tariffs imposed by the U.S. and other countries. We continually monitor the business conditions of our supply chain to maintain our market position and to avoid potential supply disruptions. ThereThese supply chain challenges have been noresulted in shortages of materials, including commodities such as steel, and other components that we use in our production processes. In 2023, decreased availability of raw material shortages thatmaterials and component parts adversely affected our ability to deliver products to our customers. Because of the rising demand for raw materials globally, we have had a material adverse impact onexperienced increases in prices, particularly in the first half of the year, which impacted our business as a whole,financial results. See Item 7, Management's Discussion and weAnalysis for additional information. We have been able to develop a robustmitigate the impact of this inflation via fixed-price supply chain such that we do not anticipate shortages of such materials in the future.
8
have a negative impact on gross margin and can periodically create a disruption to production and delivery.our results. We also acquire certain inventory in anticipation of supply constraints or enter into longer-term pricing commitments with vendors to improve the priority, price and availability of supply. We evaluate hedging opportunities to mitigate or minimize the risk of operating margin erosion resulting from the volatility of commodity prices. The challenges associated with supply chain disruptions and inflation are expected to continue in 2024, and we are unable to reasonably predict when they will be resolved. As a result, we cannot provide assurance that we will not be adversely affected by materials price volatility or the availability of supplies to meet customer demand in the future.
Manufacturing Methods
•Build-to-order consists of assembling a group of products with the same pre-defined specifications, generally for our OEM customers. Engineer-to-order consists of assembling a customized system according to a customer’s individual order specifications. In both cases, we offer design, integration, test and other production value-added services. We employ build-to-order capabilities to maximize manufacturing and logistics efficiencies by producing high volumes of basic product configurations. Engineering products-to-order
•Engineer-to-order consists of assembling a customized system according to a customer’s individual order specifications. Engineer-to-order permits the configuration of units to meet the customized requirements of our customers.
In both cases, we offer design, integration, test and other production value-added services. Our inventory management and distribution practices in both build-to-order and engineer-to-order seek to improve customer delivery performance and minimize inventory holding periods, and improve customer delivery performance.
periods.
Intellectual Property
Research and Development
Research and Development (R&D) is a key element ofto our engineering culturestrategy and is generally focused on the design and development of products and solutions that anticipate customer needs and emerging trends. Our approach tohighly engineered solutions. R&D often begins by workingfocuses on developing competitive solutions to address clear needs in the market segments we serve. In addition, we work closely with our customers to address their needs by engineering solutions to fit their particular application, thus enabling our customers to achieve their specific goals. For example, during 2023, we have been piloting new smart motor technologies that reduce energy and GHG emissions for flow machines in harsh industrial environments. We believe R&D is a problem, then engineering a solutionsource of competitive advantage and, in recent years, we have invested in new product innovation, including opening new innovation centers in Italy and China to the particular customer need. As a result,support our R&D is based on taking technology quicklyefforts. We plan to continue with these efforts in the tangible phase, increasing the competitive offering, and increasing the customer service experience through engineered application solutions. During 2017, 2016 and 2015, we recognizedfuture. R&D expensesas a percentage of $93.7, $80.8, and $78.9, respectively, which were 3.6%, 3.4%, and 3.2%,sales was approximately 3% during each of revenues, respectively.the past three years.
Cyclicality and Seasonality
Many of the businesses in which we operate are subject to specific industry and general economic cycles. We consider our connector products in our CCT segment to be an early cycleearly-cycle business, meaning it generally is impacted more in the early portion of an economic cycle, while thecycle. Our automotive and aerospace components businesses tend to be impacted in the middle portion of the cycle, and theour industrial pump business typically is impacted late in the economic cycle.
Our businesses experience limited seasonal variations, with demand generally lower during summer months (our third quarter) mainly attributable to manufacturing shutdowns and the planned industrial maintenance activities of our customers.variations. Revenue impacts from the limited seasonal variations are typically mitigated by our backlog of orders that allowallows us to adjust levels of production across the summer months.different periods.
9
General Developments of the Business
| Date of Transaction | Type | Segment | Business Acquired | Description | ||||||||||
| May 2, 2023 | Acquisition | CCT | Micro-Mode Products, Inc. | Specialty designer and manufacturer of high-bandwidth radio frequency (RF) connectors for harsh environment defense and space applications. | ||||||||||
| December 29, 2023 | Divestiture | CCT | Matrix Composites, Inc. | Manufacturer of precision composite components in the aerospace and defense market. | ||||||||||
| January 19, 2024 | Acquisition | IP | Svanehøj Group A/S | Supplier of pumps and related aftermarket services with leading positions in cryogenic applications for the marine sector. | ||||||||||
Other than as described herein, as the 2011 spin-off) of its Defensethere have been no significant developments since our previous Form 10-K filing. See Note 22, Acquisitions, Investments, and Information Solutions business, Exelis Inc. (Exelis), and its water-related businesses, Xylem Inc. (Xylem) by way of a distribution of all of the issued and outstanding shares of Exelis common stock and Xylem common stock, on a pro rata basis, to ITT shareholders of record on October 17, 2011. The 2011 spin-off was made pursuant to a Distribution Agreement, dated October 25, 2011, among ITT, Exelis and Xylem (the Distribution Agreement). Following the 2011 spin-off, ITT did not own any shares of common stock of Exelis or Xylem. On May 29, 2015, Exelis was acquired by Harris Corporation (Harris).
10
| ITEM 1A. | RISK FACTORS | ||||
We are subject to a wide range of factors that could materially affect future developments and performance. Because of these factors, past performance may not be a reliable indicator of future results. Set forth below and elsewhereYou should carefully consider, together with the other information contained in this document are descriptions ofAnnual Report on Form 10-K, the risks and uncertainties that could cause our actual results to differ materially from the results contemplated by the forward-looking statements contained in this document. The most significant factors affecting our business and operations include the following:
Our operating results have been, and our abilitymay continue to maintain liquidity or procure capital may be, adversely affected by unfavorable or uncertain global economicmacroeconomic and capital market conditions.
Because a significant portion of our sales are to customers operating outside the U.S., our financial results have experiencedbeen, and expect tomay continue to experience volatilitybe, adversely impacted by foreign currency fluctuations, which are influenced by changes in revenues, operating resultsglobal macroeconomic conditions. The primary foreign currencies to which we have exposure are the Euro, Chinese renminbi, Czech koruna, Polish zloty, South Korean won, Saudi riyal, Mexican peso, and profitability. We have undertaken measures to reduceIsraeli new shekel. Any significant change in the impactvalue of this volatility through diversificationcurrencies of markets and expansion of geographic regionsthe countries in which we operate. The end markets we serve include automotive, aerospace, oil and gas, industrial, mining, chemical, and defense, each of which is impacted by specific industry and general economic cycles. Important factors impacting our businesses include, but are not limiteddo business relative to the overall strengthvalue of the global economyU.S. dollar could reduce our revenue and adversely impact our customers’ confidenceability to sell products or control costs. In addition, our international subsidiaries report their results of operations and financial position in their respective local currencies (i.e., functional currencies), which are then translated into U.S. dollars for financial reporting purposes. As the relationship between these foreign currencies and the U.S. dollar changes, our financial results have been, and may continue to be, adversely affected upon translation. From time to time, we enter into derivative contracts to hedge some of our foreign currency exposures. However, our hedging strategy may fail to reduce our exposure and could even result in an unfavorable impact on our financial results. Refer to Note 21, Derivative Financial Instruments, for further information.
During 2023, global macroeconomic conditions industrial spending, tax rates, interest rates, the availabilitycontinued to be influenced by a number of commercial financing, and regulations in the jurisdictions in which we operate. Instability in the global credit markets andfactors, including heightened geopolitical environment in many parts of the world may put pressure on global economic conditions. If global economic and market conditions, or economic conditions in key markets or regions deteriorate, we may experience material impacts on our financial statements.
prolonged and perhaps unknown period of time. Restrictive credit marketsThese factors have resulted and may alsocontinue to result in customers extending terms for payment or failing to timely pay accounts when due and may result in ourus having higher customer receivables with increased risk of default. We have experienced and may continue to experience volatility in revenues, operating results and profitability primarily as a result of these uncertain global macroeconomic conditions.
Our business has been, and may alsocontinue to be, adversely affected by raw material price volatility, a limited number of suppliers and the inability of suppliers to meet quality and delivery requirements.
Our business relies on third-party suppliers for raw materials, components and contract manufacturing services to produce our products. Commodity prices and the prices for other raw materials necessary for production have fluctuated, and may continue to fluctuate, and in 2023 increases in raw material costs negatively impacted our financial results.We are not always able to pass along raw material and component price increases to our customers which has impacted, and may continue to impact, our sales growth and profitability.
11
In addition, the supply of raw materials to ITT and to its component parts suppliers has been, and may continue to be, interrupted for a variety of reasons affecting our suppliers, including congested shipping ports around the world, production interruptions, heightened geopolitical tensions, including related to the Russia-Ukraine and Israel-Palestine conflicts, global pandemics, the impaired financial condition of a particular supplier, capacity constraints, labor disputes or shortages, the ability to meet regulatory requirements and commitments to other purchasers. For most of our products, we have existing alternate sources of supply, or the required materials have historically been readily available. In limited instances, we depend on a single source of supply, manufacturing or assembly, or participate in commodity markets that may be subject to a limited number of suppliers. Although we believe we could obtain and qualify alternative sources for most sole and limited source supplier materials if necessary, the transition to an alternative source could be complex, costly, and protracted, especially if the change requires us to redesign our systems or re-qualify our products. In 2023, decreased availability of raw materials and component parts adversely affected our ability to deliver products to our customers and resulted in increased backlog.
Any further delay in our suppliers’ abilities to provide us with sufficient quality or flow of materials or any supplier price increases, or any decreased availability of raw materials or commodities, could further impair our ability to deliver products to our customers and may impact our profitability.
Recent mergers, acquisitions or venture investments could present operational challenges and past divestitures and spin-offs may expose us to potential liabilities, all of which could adversely affect our results of operations and financial position.
We regularly review our portfolio of businesses and pursue growth through the acquisition of other companies, assets and product lines that either complement or expand our existing businesses. In addition, from time to time, we make minority investments in other early-stage companies, and we risk losing part or all of our capital in any such investment. Refer to Note 22, Acquisitions, Investments, and Divestitures, for further information regarding acquisitions and investments made during the year. Although we conduct what we believe to be a prudent level of investigation regarding the operating and financial condition of the businesses we acquire, a level of risk remains regarding the actual operating condition of these businesses. Until we actually assume operating control of these businesses and their operations, we may not be able to ascertain the actual value or understand the potential liabilities of, or challenges facing, the acquired businesses and their operations. Acquisitions involve a number of risks and present financial, managerial and operational challenges that could have a material adverse effect on our reputation, financial results and business. These include the possibility that:
•an acquired business could under-perform relative to our expectations;
•we could fail to realize the expected synergies of an acquisition;
•we could experience difficulties in the integration of technology, operations, personnel and financial and other systems;
•we could have acquired substantial undisclosed liabilities;
•there could be insufficient internal controls over financial activities or financial reporting at an acquired company that could impact us on a consolidated basis;
•management attention could be diverted from other businesses;
•an acquired business may have been impacted by a previous security breach where system/data integrity was compromised, or data was stolen without the seller's awareness;
•we could lose key employees of the acquired businesses;
•we could experience increased capital requirements; and
•the acquisition could result in customer dissatisfaction.
We have divested a number of businesses, including as part of spin-offs in 1995 and 2011 and our sale of InTelCo Management LLC (InTelCo), the entity holding asbestos-related assets and liabilities, in 2021. With respect to some of these former businesses, we have contractually agreed to indemnify the counterparties against, or otherwise retain, certain liabilities including certain product liability claims and environmental matters. Even without ongoing contractual indemnification obligations, we could be exposed to liabilities arising out of such divestitures. In addition, the counterparties to those divestitures may have agreed to indemnify us or assume certain liabilities relating to those divestitures. However, there can be no assurance that the indemnity or assumption of liability by the counterparties will be sufficient to protect us against the full amount of these liabilities or that a counterparty will be able to fully satisfy its obligations. Third parties also could seek to hold us responsible for any of the liabilities that a counterparty agreed to assume. Even if we ultimately succeed in recovering any amounts for which we were initially held liable, we may be temporarily required to bear these losses ourselves.
12
The industries in which we operate are experiencing a skilled labor shortage and if we are unable to hire and retain key personnel, including engineering talent and senior management talent, our ability to manage inventory levelsoperate or grow our business could be negatively impacted.
The manufacturing industry is currently experiencing a skilled labor shortage. This shortage has created difficulties for the Company in attracting and maintain current levelsretaining factory employees, in meeting customer demand and in controlling labor costs. We currently have a significant number of profitability. If, for any reason,open positions, and we lose accessexpect this to remain so in 2024. A failure to attract or retain engineering and other highly skilled personnel could adversely affect our operating results, our ability to deliver products and services to our currently available linescustomers and our ability to grow our business. Our future success will continue to depend, to a significant extent, on our ability to attract or retain engineers, senior management, our skilled labor source and other key personnel, which will depend on our ability to offer competitive compensation, training, flexibility and other benefits that our current and prospective employees desire.
Failure to provide high quality and reliable products, innovate or respond to competitors in our markets or protect our intellectual property rights could adversely impact our business and financial results.
We believe product performance, reliability and innovation, application expertise, enforcement of credit,intellectual property rights, brand reputation, and price are principal points of competition in our markets.
We manufacture key components that are integral to the operation of systems and manufacturing processes in the markets we serve. The reliability and performance of our products are critically important to our customers and the users of their products. Accordingly, quality is extremely important to us and our customers due to the potentially costly consequences of product failure. Our quality certifications, including products manufactured to military specifications, are critical to the marketing success of our goods and services. Our success in part depends on our ability to attract and retain skilled engineers and to manufacture to exact tolerances precision-engineered components, subassemblies and finished devices from multiple materials. If our components fail to meet these standards or fail to adapt to evolving standards, we could damage our reputation as a manufacturer of high-quality components, which could hurt our ability to remain competitive and result in a loss of customers, market share or product sales.
Maintaining and improving our competitive position will require continued investment by us in manufacturing, research and development, engineering, marketing, customer service and support, and our distribution networks. Insufficient investment in these areas may result in a failure to maintain our competitive position. In addition, our existing competitors, or potential new competitors, may develop products that are cheaper and/or superior to our products, or may develop more efficient or effective methods of providing products and services or may adapt more quickly than we do to new technologies or evolving customer requirements. These pressures may result in us having to take actions, such as adjusting the prices of certain products, in order to stay competitive.
Obtaining, maintaining and enforcing our proprietary rights is another factor that is critical to the success of our business and our ability to remain competitive. For certain products and manufacturing processes, we rely on patents, trademarks, trade secrets, non-disclosure agreements and other contracts to protect these rights. These contracts may be breached, or may not prevent competitors from independently developing or selling similar products. In addition, during the normal course of business, we could unintentionally infringe or violate the proprietary rights of others. Intellectual property litigation could be time consuming for management and could result in significant legal expenses to either pursue claims against others, or to defend ourselves. If we are unable to protect our patents, trademarks, or other proprietary rights, or if we infringe or violate the rights of others, our ability to remain competitive could be adversely impacted.
If we are requiredunable to raise additional capital,maintain our competitive position, our business, results of operations or financial condition could be materially adversely affected.
Our operations could be disrupted, and our business could be materially and adversely affected by our inability to prevent, detect or adequately respond to cybersecurity breaches.
The efficient operation of our business is dependent on information technology (IT) systems, some of which are owned or managed by third parties. In the ordinary course of business, we collect and store confidential information, including proprietary business information belonging to us, our customers, suppliers, business partners and other third parties, as well as personally identifiable information of our employees and others.
Our information technology systems and those of our third-party service providers may be susceptible to damage, disruptions or shutdowns due to power outages, hardware failures, telecommunication failures, cybersecurity incidents and user errors that may affect our operations. Although we actively manage the risks to our information technology systems that are within our control, we can provide no assurance that our actions or those of
13
our third-party service providers will always be successful in eliminating or mitigating risks to our systems, networks or data. Even the most well-protected information technology systems are vulnerable to internal and external cybersecurity incidents including, but not limited to, those by employees and by computer hackers and other threat actors utilizing techniques such as phishing, ransomware or denial of service attacks. We have experienced cybersecurity incidents in the past which have not had a material impact on our operations or financial results. If we experience a future disruption in our information technology systems, it could result in the loss of sales and customers and significant incremental costs, which could materially adversely affect our business. In addition, as a provider of products and services to government and commercial customers, and particularly as a government contractor, we are subject to a heightened risk of cybersecurity incidents caused by computer viruses, illegal break-ins or hacking, sabotage, or acts of vandalism, including by foreign governments, hackers and cyber terrorists. Furthermore, information technology security threats are increasing in sophistication, intensity and frequency. A cybersecurity incident may occur, including breaches that we may be unable to do so,detect in a timely manner. The unavailability of our information technology systems, the failure of these systems to perform as anticipated for any reason, or any significant breach of security could cause significant disruption to our business or could result in decreased performance and increased costs.
We continue to monitor data security regulations in the jurisdictions in which we operate. The processing and storage of certain information is increasingly subject to privacy and data security regulations, and many such regulations are country-specific. The interpretation and application of data protection laws in the U.S., Europe, and elsewhere are uncertain, evolving and may be able to do so only on unfavorable terms. Deteriorating market conditions could also indicate an impairment in the value of our goodwillinconsistent across jurisdictions. Compliance with these various laws may be onerous and intangible assets in one or more of our reporting units which would require us to recognizeincur substantial costs or to change our business practices in a non-cash chargemanner that adversely affects our business, while failure to comply with such laws may subject us to substantial penalties.
If we are unable to protect sensitive information, our customers or governmental authorities could question the adequacy of our security processes and procedures and our compliance with evolving privacy and data security regulations and government cybersecurity requirements for government contractors, potentially causing us to lose business. A breach could also result in the loss of our intellectual property, potentially impacting our long-term capability to compete for sales of affected products. In addition, a breach of security of our information technology systems could result in litigation, regulatory action and potential liability, as well as increased costs to implement further information security measures. If we are unable to prevent, detect or adequately respond to cybersecurity incidents, our operations could be disrupted, our reputation could be harmed, and our business could be materially and adversely affected.
The Company’s ability to manage its business and monitor results is highly dependent upon information and communication systems, and a failure of these systems, including flaws in the implementation of any enterprise resource planning (ERP) systems, could adversely impact our business or financial results.
The Company is dependent upon a variety of information technology IT systems, including ERP and communication systems, to operate its business. Over the past several years, we have been implementing new ERP systems at many of our sites, including within our shared services subsidiary, and we expect these ERP implementations to continue for the next several years. These ERP implementations have required and will continue to require significant investment in capital and deployment of human resources. Potential flaws in implementing ERP systems or in the failure of any portion or module of the ERP systems may pose risks to our Statementability to operate successfully and efficiently. In addition, failure to implement the appropriate internal controls with respect to new ERP systems may result in the ERP systems producing inaccurate or unreliable information. Any disruptions, delays or deficiencies in the design or implementation of Operations. We test both goodwillthe new ERP systems or related internal controls, or in the performance of legacy IT systems, could adversely affect the Company’s ability to effectively manage its business, which could adversely affect the Company’s reputation, competitive position and intangible assetsfinancial results.
A significant portion of our revenue is derived from a single customer. Loss of this customer, a loss of business with this customer, or a reduction in this customer's market share, could adversely impact our financial results.
Sales to Continental, a supplier to the automotive industry and ITT's largest customer, were approximately 7% of our total revenue in 2023. Requests by automakers to use ITT brake pads in their Continental-produced braking systems (calipers) typically account for impairmentapproximately half of MT's revenue from Continental. These automaker requests are generally formalized through supply agreements signed directly between MT and the automakers. The remainder of MT's sales to Continental in 2023 was generated from a 10-year agreement to supply Continental with aftermarket parts, which expired on an annual basisDecember 31, 2023. A new 10-year agreement, effective January 1, 2024, and whenever eventsextending through December 31, 2033, was signed in March 2023. The loss of this customer, or changesa reduction in circumstances indicatethis
14
customer's market share could have a material adverse effect on our business, results of operations or financial condition.
Due to our operations and sales outside of the carrying value of an asset may not be recoverable.
Our international operations, including U.S. exports, comprise a growing portion of our operations and are a strategic focus for continued future growth. Our strategy calls for increasing sales in overseas markets, including emerging markets such as Mexico, South America, China, Russia, and the Middle East.East have been increasing. In 2017,both 2023 and 2022, approximately 67% of our total sales were to customers operating outside of the United States. Our sales from international operations and export sales are subject into varying degrees toof risks inherent toin doing business outside of the United States. These risks include the following, some of which could be impacted by changesfollowing:
•war or geopolitical instability in international trade agreements between the United States and other countries:regions where we operate;
•fluctuations in foreign exchange rates;
•possibility of unfavorable circumstances arising from host country laws or regulations;
•restrictions, regulations, or tax liabilities on currency repatriation;
•potential negative consequences from changes to taxation policies;
•the disruption of operations from labor and political disturbances;
•our ability to hire and maintain qualified staff in these regions; and
•changes in tarifftariffs and trade barriers, sanctioned countries and individuals, and import and export licensing requirements.
Under the previous administration, the U.S. government undertook a series of actions to increase tariffs on certain goods imported into the U.S., including steel and aluminum, and in response certain governments imposed retaliatory tariffs on various goods. These tariffs have negatively impacted demand for our products as well as the cost of certain parts and materials that we purchase from vendors located overseas, particularly in China. We have been mitigating, and will continue attempting to mitigate, the impact of tariffs by lowering input costs through efficient utilization of our global manufacturing footprint, supplier and customer negotiations, and diversification strategies. However, we expect that any new or continued trade disputes or increased tensions between the U.S. and other uncertainties,countries, and any governmental actions, including challengesincreases of existing tariffs or the imposition of new tariffs, in response to our abilitythose trade disputes or increased tensions, may continue to protect our intellectual property, pressure on the pricing ofadversely impact demand for our products and risks of political instability.our financial results.
The cost of compliance with increasingly complex and often conflicting regulations worldwide can also impair our flexibility in modifying product, marketing, pricing or other strategies for growing our businesses, as well as our ability to improve productivity and maintain acceptable profit margins.
Our business is impacted by our customers' levels of capital investment, and maintenance expenditures, particularly in the oilproduction, and gas, chemical, and mining markets.market cyclicality.
Demand for certain of our industrial products and services dependdepends on the levellevels of capital investment, and planned maintenance expenditures, and/or production of our customers. Our customers' levels of capital expenditures depends,customers which, in turn, depend on general economic conditions, availability of credit, economic conditions within their respective industries, supply and demand shocks, workforce strikes or employee absenteeism, volatility in commodity prices, expectations of future market behavior. Additionally, volatility in commodity prices can negatively affect the level of these activitiesbehavior and can result in postponement of capital spending decisions or the delay or cancellation of existing orders.their liquidity and financial position. The ability of our customers to finance capital investment, and maintenance, and/or production may also be affected by factors independent of the conditions in their industries, such as the condition of global credit and capital markets.
Our customer's businesses, particularly those in the oil and gas,energy, chemical and mining industries, which representrepresented approximately 10%, 6%9%, and 3%4%, respectively, of our 20172023 revenue, are to varying degrees cyclical and have experienced, orand may in the future experience, periodic downturns of varying severity. For example, the volatility of
15
the energy market has generally been dependent upon the prevailing view of future gas and oil prices, which are influenced by numerous supply and demand factors, including availability and cost of capital, global and domestic economic conditions, environmental regulations, policies of the Organization of the Petroleum Exporting Countries (OPEC) countries and Russia and other factors. Our customers in these industries, particularly those whose demand for our products and services is primarily profit-driven, historically have tended to delay large capital projects, including expensive maintenance and upgrades, during economic downturns. Additionally, fluctuating energy demand forecasts and lingering uncertainty concerning commodity pricing and other macroeconomic factors canmay cause our customers to be more conservative in their capital planning, which maycould reduce demand for our products and services. Reduced demand for our products and services, could result in the delay or cancellation of existing orders, or lead to excess manufacturing capacity, which unfavorably impacts our absorption of fixed manufacturing costs. This reduced demand may also erode average selling prices in our industry. Any of these results could adversely affect our business and financial results.
A material business interruption, particularly at one of our manufacturing facilities, could negatively impact our ability to generate sales and meet customer demand.
If operations at one or more of our manufacturing facilities were to be disrupted or damaged as a result of war (including related to Russia-Ukraine, Israel-Palestine, and China-Taiwan), an epidemic or pandemic (including, without limitation, COVID-19), changing weather or climate conditions (including increases in turn,storm intensity, sea-level rise, melting of permafrost and temperature extremes on facilities or operations; and changes in the availability or quality of water, or other natural resources on which our business and financial results.
not be sufficient to resolve the issues in a timely manner. A significant interruption in production capability could also require us to make substantial payments due to non-performance. We also have insurance for certain covered losses which we believe to be adequate to offset a significant portion of the costs for reconstruction of facilities and equipment, as well as certain financial losses resulting from production interruptions or shutdowns. However, any recovery under our salesinsurance policies would be subject to deductibles and, depending on the coverage, may not offset the lost revenues or increased expenses that may be experienced during the disruption of operations.
Increased scrutiny from investors, lenders and other market participants regarding our environmental, social and governance or sustainability responsibilities could expose us to additional costs and adversely impact our reputation, business, financial performance and growth.
There is an increasing focus from certain investors, customers and other key stakeholders on corporate responsibility, specifically related to ESG matters, including companies' contribution to climate change and loss of biodiversity. Some investors have used, and may continue to use, ESG criteria to guide their investment strategies and, in some cases, have chosen, and may continue to choose, not to invest in ITT, or to divest their holdings of ITT if they believe our policies relating to corporate responsibility are inadequate.
The ESG factors by which companies’ corporate responsibility practices are assessed have been evolving and may continue to customers operating outsideevolve. Additionally, requirements on U.S. public companies and companies with European operations with regards to ESG compliance have been increasing and may continue to increase, including, but not limited to, the U.S.SEC's proposal to require extensive climate-related disclosures and the European Union's Corporate Sustainability Reporting Directive (CSRD), therefore,which could additionally require third-party assurance disclosures. These evolving standards and regulations have caused us, and may continue causing us, to undertake costly initiatives to satisfy such new criteria. If we are exposedunable to fluctuations in foreign currency exchange rates. The primary currenciessatisfy new corporate responsibility criteria, investors may conclude our policies are inadequate and choose not to which we have exposure are the Euro, Chinese renminbi, Czech koruna, South Korean won, Polish zloty, British pound, and Mexican peso. From time to time, we may enter into derivative contracts to hedge some of these foreign currency exposures. However, our hedging strategy may fail to reduce our exposure or could result in unfavorable impact to our operating results.
In addition, as we identify ESG topics for voluntary disclosure and work to align with the recommendations of the Financial Stability Board’s Task Force on Climate-Related Financial Disclosures (TCFD) and Sustainability Accounting Standards Board (SASB) standards and our own assessment of priority of ESG issues, we have expanded and, in the future, may continue to expand our disclosures in these higher costs fromareas. Statements about our customers through product price increases. Further, our ability to realize financial benefits from Lean activitiesESG initiatives and goals, and progress against those goals, may not be able to mitigate fully or in part these manufacturing and operating cost increases and, as a result, could negatively impact our profitability.
16
Legal and our revenue and results of operations could be materially adversely affected. Aside from specific customer standards, our success in part depends on our ability to manufacture to exact tolerances precision-engineered components, subassemblies, and finished devices from multiple materials. If our components fail to meet these standards or fail to adapt to evolving standards, our reputation as a manufacturer of high-quality components will be harmed, our competitive advantage could be damaged, and we could lose customers, market share or our ability to sell certain products.
Regulatory Risks
We are subject to risks related to government contracting, including changes in levels of government spending and regulatory and contractual requirements applicable to sales to the U.S. government.
Our Connect & Control TechnologiesCCT and Motion TechnologiesMT segments derive a portion of their revenue from sales to U.S. government customers and higher tier contractors who sell to the U.S. government. GovernmentThe government's expenditures are subject to political and budgetary fluctuations and constraints, which may result in significant unexpected changes in levels of demand for our products. In addition, the award, administration and performance of government contracts are subject to regulatory and contractual requirements that differ significantly from the terms and conditions that apply to contracts with our non-governmental customers. We have in the past and may in the future be subject to audits and investigations to evaluate our compliance with these requirements. If we are found to have failed to comply with requirements applicable to government contractors, we may be subject to various actions, including but not limited to fines or penalties, reductions in the value of our government contracts, restrictions on the sale of certain products to the government, or suspension or debarment from government contracting. Failure to comply with applicable requirements also could harm our reputation and our ability to compete for future government contracts or sell equivalent commercial equivalent products. Any of these outcomes
If we are not able to meet the requirements for government contractors, we may lose orders, which could have a material adverse effect on our business, financial condition and results of operations and financial condition.
Changes in our effective tax rates as a result of changes in the realizability of our deferred tax assets, the geographic mix of earnings, tax examinations or disputes, tax authority rulings or changes in the tax laws may adversely affect our financial results.
The Company is subject to income taxes in the U.S. and in various foreign jurisdictions. We exercise significant judgment in calculating our provision for income taxes and other tax liabilities. In the ordinary course of our business, there are many transactions and calculations where the ultimate tax determination is uncertain. Furthermore, changesChanges in domestic or foreign income tax laws and regulations, or their interpretation, could result in higher or lower income tax rates assessed or changes in the taxability of certain income or the deductibility of certain expenses, thereby affecting our income tax expense and profitability.
Any significant increase in our future effective tax rates could reduce net income in future periods. Given the global nature of our business, a number of factors may increase our future effective tax rates, including:
including changes in the geographic mix of our profits among jurisdictions with differing statutory income tax rates;
sustainability of historical income tax rates in the jurisdictions in which we conduct business;
changes in tax laws applicable to us;
expiration, renewal or application of tax holidays;
the resolution of issues arising from tax audits with various tax authorities; or
changes in the valuation of our deferred tax assets, deferred tax liabilities and deferred tax asset valuation allowances.
The amount of income taxes and other taxes we have paid are subject to ongoing audits by U.S. federal, state, and local tax authorities and by non-U.S. authorities. If these audits result in assessments different from amounts paid or reserved, future financial results may include unfavorable tax adjustments. We are currently under routine examination by the U.S. Internal Revenue Service and other U.S. and non-U.S. tax authorities, and we may be subject to additional examinations in the future. The tax authorities may disagree with our tax treatment of certain material items and thereby increase our tax liability. Failure to sustain our position in these matters could result in a material adverse effect on our financial statements.
profit shifting. On December 20, 2021, the OECD released the Model GloBE Rules for Pillar Two defining a 15% global minimum tax rate for large multinational corporations. The efficient operation of our business is dependent on computer hardwareOECD continues to release additional guidance and software systems. While we believe we have taken many steps to protect our information systems, even the most well-protected information systemscountries are vulnerable to internal and external security breaches including, but not limited to, those by computer hackers and cyber terrorists utilizing techniques such as phishing, ransomware or denial of service attacks. Furthermore, information technology security threats are increasing in sophistication and frequency. While we actively manage the risks to our information systems that are within our control, we can provide no assurance that our actions will be successful in eliminating or mitigating risks to our systems, networks or data. The unavailability of our information systems, the failure of these systems to perform as anticipated for any reason or any significant breach of security could cause significant disruption to our business or could result in decreased performance and increased overhead costs, causing an adverse effect on our reputation, business, financial condition and results of operations. A breach could also result in the loss of our intellectual property, potentially impacting our long-term capability to compete on sales for affected products. In addition, a breach of security of our information systems could result in litigation, regulatory action and potential liability, as well as increased costs to implement further information security measures.
Pillar Two expected by calendar year 2024. We regularly review our portfolio of businessesare continuing to evaluate the Model GloBE Rules for Pillar Two and pursue growth through the acquisition of other companies, assets and product lines that either complement or expand our existing business. Although we conduct what we believe to be a prudent level of investigation regarding the operating and financial condition of the businesses we purchase, a level of risk remains regarding the actual operating condition of these businesses. Until we actually assume operating control of these business assetsrelated legislation, and their operations, we may not be able to ascertainpotential impact on future periods. Enactment of this regulation in its current form could increase the actual value or understandamount of global corporate income tax paid by the potential liabilities of the acquired entities and their operations. Acquisitions involve a number of risks and present financial, managerial and operational challenges thatCompany.These increases could have a material adverse effect on our reputation and business, including that an acquired business could under-perform relative toeffective tax rate. As the effects of a change in U.S. or foreign tax law must be recognized in the period in which the new legislation is enacted, should new legislation be signed into law, our expectations, the failure to realize expected synergies, integration of technology, operations, personnel and financial and other systems, the possibility that we have acquired substantial undisclosed liabilities, potentially insufficient internal controls over financial activities or financial reporting at an acquired company that could impact us on a consolidated basis, diversion of management attention from other businesses, loss of key employees of the acquired businesses, and customer dissatisfaction or performance.
On August 16, 2022, the U.S. government enacted the Inflation Reduction Act of 2022 (the Inflation Reduction Act) into law. The Inflation Reduction Act includes a new corporate alternative minimum tax (the Corporate AMT) of
17
15% on the adjusted financial statement income (AFSI) of corporations with an average AFSI exceeding $1.0 billion over a three-year period. The Corporate AMT was effective for the Company beginning in key economic indicators, volatility2023. Given the AFSI threshold, the Corporate AMT was not applicable to the Company in 2023, but the financial markets,Corporate AMT may have potential impacts on our future legislationU.S. tax expense, cash taxes and other governmental regulatory actions.
Changes in environmental laws or regulations, the discovery of previously unknown or more extensive contamination or the failure of a potentially responsible party to perform may adversely affect our financial results.
We are subject to a variety of federal, state, local and foreign laws, rules and regulations related to the use, storage, handling, discharge or disposal of certain toxic, volatile or otherwise hazardous chemicals, gases and other substances used in manufacturing our products, as well as laws related to greenhouse gas emissions (including cap-and-trade laws). These laws could require us to incur substantial expenses. Environmental laws and regulations allow for the assessment of substantial fines and criminal sanctions as well as facility shutdowns to address violations and may require the installation of costly pollution control equipment or operational changes to limit emissions or discharges. The discovery of previously unknown or more extensive contamination at a site which the Company previously operated or currently operates could suddenly subject the Company to costly remediation efforts. We also could be affected directly or indirectly through impacts on our customers and suppliers by changes in environmental laws or regulations, including, for example, those imposed in response to vapor intrusion or climate change concerns.
Failure to comply with the U.S. Foreign Corrupt Practices Act or other applicable anti-corruption legislation, as well as export controls and trade sanctions, could result in fines or criminal penalties.
We operate in a number of countries throughout the world, including countries known to have a reputation for corruption. We are committed to doing business in accordance with applicable anti-corruption laws. We are subject, however, to the riskHowever, we cannot provide assurance that we, our affiliated entities,internal controls will always protect us from reckless or the respective officers, directors,criminal acts committed by our employees, agents or business partners that would violate U.S. and/or applicable non-U.S. laws, including anti-bribery, competition, trade sanctions and agents of ITT, may take action determined to be in violation of such anti-corruptionregulation, and other laws including but not limited to, the U.S. Foreign Corrupt Practices Act of 1977 and the U.K. Bribery Act of 2010, as well as trade sanctions administered by the Office of Foreign Assets Control, (OFAC), the U.S. Department of State and the U.S. Department of Commerce. Any such violation could result in substantial fines, sanctions, civil and/or criminal penalties, suspension or debarment from government contracts or curtailment of operations in certain jurisdictions, and might adversely affect our business, financial condition or results of operations or financial position. In addition, actual or alleged violations could damage our reputation and ability to do business. Furthermore, detecting, investigating, and resolving actual or alleged violations is expensive and can consume significant time and attention of our senior management.
Even the allegation or appearance of our employees, agents or business partners acting improperly or illegally could damage our reputation and result in significant expenditures in investigating and responding to such actions.
We are subject to laws, regulations and potential liabilityclaims relating to claims, complaints and proceedings, including those related to product and other matters.
Our business exposes us to potential product liability risks that are inherent in the design, manufacture, and marketing of products for the markets we serve. In addition, many of the devices we manufacture and sell are critical components designed to be used in harsh environments for long periods of time where the cost of failure is high. Component failures, manufacturing defects, design flaws, or inadequate disclosure of product-related risks or product-related information could result in an unsafe condition or injury to, or death of, an end-user of our products. The occurrence of such a problem could result in product liability claims or a recall of, or safety alert relating to, one or more of our products which could ultimately result, in certain cases, in the removal of such products from the marketplace and claims regarding costs associated therewith. Product liability claims or product recalls in the future, regardless of their ultimate outcome, could have a materialan adverse effect on our business and reputation and on our ability to attract and retain customers for our products.
18
Anti-takeover provisions in our organizational documents and Indiana law could delay or prevent a change in control.
Certain provisions of our articles of incorporation and by-laws may delay or prevent a merger or acquisition that a shareholder may consider favorable. For example, the articles of incorporation authorize our Board of Directors to issue one or more series of preferred stock. In addition, the articles of incorporation and by-laws, among other things, do not permit action by written consent of the shareholders. TheseSuch provisions may also discourage acquisition proposals or delay or prevent a change in control, which could harm our stock price. Indiana law also imposes some restrictions on mergers and other business combinations between any holder of 10% or more of our outstanding common stock and us as well as certain restrictions on the voting rights of "control shares" of an "issuing public corporation."
| ITEM 1B. | UNRESOLVED STAFF COMMENTS | ||||
None.
| ITEM | CYBERSECURITY | ||||
Cybersecurity Risk Management and Strategy
We have developed and implemented a cybersecurity risk management program intended to protect the confidentiality, integrity, and availability of our critical systems and information. Our cybersecurity risk management program includes a cybersecurity incident response plan.
We design and assess our program based on the National Institute of Standards and Technology Cybersecurity Framework (NIST CSF). This does not imply that we meet any particular technical standards, specifications, or requirements, only that we use the NIST CSF as a guide to help us identify, assess, and manage the cybersecurity risks that are relevant to our business.
Our cybersecurity risk management program is integrated into, and forms an integral part of, our overall enterprise risk management program, and shares common methodologies, reporting channels and governance processes that apply across the enterprise risk management program to other legal, compliance, strategic, operational, and financial risk areas.
We have established a proactive approach to identify and manage material cybersecurity threats which includes, but is not limited to, the following:
•Security policies and practices aligned with NIST Special Publication 800-171, Revision 2 (NIST 800-171 Rev 2) and the organization’s enterprise risk management requirements;
•Annual cybersecurity reporting and strategic update to ITT's Board of Directors;
•Enterprise-wide centralized Security Information and Event Management (SIEM);
•Regular red-team attack simulations led by industry-leading third-party cybersecurity firms;
•Continuous internal and external facing vulnerability management scanning;
•Threat intelligence feeds from various external sources (fee and non-fee based);
•Threat hunting;
•Strategically deployed artificial intelligence-based threat detection technology;
•Cyber risk assessment and classification processes;
•Cyber threat tabletop simulation exercises;
•Cyber Incident Response Plan processes;
•Externally led, targeted threat hunting exercises;
•Engagement of forensic cybersecurity and data analysis firms (as needed) to conduct independent validation assessments if a breach is suspected and/or validated;
•Engagements with third party consultants to build, design, and improve cyber risk management tools and processes;
•Third-party technology and service provider risk evaluation process; and
•Cybersecurity insurance coverage.
During 2023, there were no cybersecurity incidents that had a material effect on the Company. Furthermore, we have not identified risks from known cybersecurity threats, including as a result of any prior cybersecurity incidents, that have materially affected us to date, including our business, business strategy, results of operations, or financial condition. For a discussion of prospective risks related to potential cybersecurity incidents, please refer to Item 1A, Risk Factors.
20
Cybersecurity Governance
Our Board considers cybersecurity risk as part of its risk oversight function and has delegated to the Audit Committee oversight of cybersecurity and other information technology risks. The Audit Committee oversees management’s implementation of our cybersecurity risk management program and discusses with management the Company's cybersecurity and other information technology risks, controls, and procedures.
The Board receives annual reports from management on our cybersecurity risks and strategic updates. These reports are designed to provide the Board a view into the progress of previous efforts, an update on existing and new material risks, and an overview of proposed or planned cybersecurity-related projects, and foster a discussion of cyber threats trending within the industry and their applicability to the organization. If a new material risk is identified, or if the Company is impacted by a material security incident, the Audit Committee and the full Board of Directors are notified and apprised of developments.
ITT employs a team of certified cybersecurity professionals responsible for assessing and managing cybersecurity risks, led by the Chief Information Security Officer (CISO), who altogether make up ITT’s Cyber Security Operations Center (CSOC). The qualifications of our cybersecurity team include the following industry-recognized certifications: Certified Ethical Hacker (C|EH), Security+, GIAC Incident Handler Certification (GCIH), and GIAC Foundational Cybersecurity Technologies (GFACT). Additionally, our cybersecurity team possesses several Federal Emergency Management Agency (FEMA) and Department of Homeland Security (DHS) certificates pertaining to cybersecurity. The CSOC monitors the global ITT landscape for cyber threats, provides prevention strategies, initiates incident response for detected intrusions, and prescribes proactive and reactive mitigation strategies. The CSOC serves as the cornerstone for protecting, assessing, and managing cybersecurity risks for the enterprise, which includes, but is not limited to, back office processes, critical manufacturing processes, intellectual property, and sensitive data. The CISO reports to the Chief Information Officer (CIO), who in turn reports to the Chief Financial Officer (CFO). The combined expertise and qualifications of our cybersecurity team enable us to effectively monitor, assess, and respond to cybersecurity threats.
Management is actively informed about, and monitors, cybersecurity incidents, including their prevention, detection, mitigation, and remediation, through defined processes and reporting mechanisms. This proactive approach includes the alignment of security policies and practices with NIST 800-171 Rev 2 and the organization's enterprise risk management requirements. Twice annually, the CFO and CEO are briefed by the CISO and CIO regarding ongoing projects, investments and changes to the threat landscape that have impacted, or may impact, the organization, ensuring that the highest levels of management are kept abreast of the Company's cybersecurity posture. Overall, this comprehensive approach ensures that management is well-informed and actively involved in safeguarding the Company from cybersecurity threats.
| ITEM 2. | PROPERTIES | ||||
We consider the offices,own or lease approximately 170 manufacturing plants, warehouses, service centers, and othersales and administrative offices to support our operations. These properties that we own or leaseare located in various regions around the world, including North America, Europe, Asia, South America and the Middle East. We consider these properties to be in good condition and generally suitable for their intended purpose. We believe these properties are adequate forwith sufficient capacity to accommodate the Company’s needs and will generally allow for expansion of capacity if needed. needs.
The following table summarizes the number and area (in thousands of square feet) of our material properties (other than our corporate headquarters) by region and business segment as of December 31, 2017.2023. We consider our properties containing 25,000 square feet or more, which primarily consist of manufacturing locations, to be material. Our material properties account for over 90% of the total square feet of our properties.
| Motion Technologies | Industrial Process | Connect & Control Technologies | Total | ||||||||||||||||||||||||||||||||
| Number of Owned Locations | 13 | 11 | 5 | 29 | |||||||||||||||||||||||||||||||
| Number of Leased Locations | 9 | 22 | 6 | 37 | |||||||||||||||||||||||||||||||
| Total Locations | 22 | 33 | 11 | 66 | |||||||||||||||||||||||||||||||
21
| Number of Facilities - Owned | |||||||||||||||||||||||||
| Industrial Process | Motion Technologies | Connect & Control Technologies | Other | Total | |||||||||||||||||||||
| Location | # | Area | # | Area | # | Area | # | Area | # | Area | |||||||||||||||
| Manufacturing: | |||||||||||||||||||||||||
| North America | 3 | 1,109.0 | 4 | 813.6 | 4 | 540.4 | — | — | 11 | 2,463.0 | |||||||||||||||
| Europe | 1 | 356.8 | 10 | 1,609.1 | 1 | 231.3 | — | — | 12 | 2,197.2 | |||||||||||||||
| Asia | 1 | 670.9 | 1 | 8.8 | 1 | 13.4 | — | — | 3 | 693.1 | |||||||||||||||
| South America | 1 | 68.0 | — | — | — | — | — | — | 1 | 68.0 | |||||||||||||||
| 6 | 2,204.7 | 15 | 2,431.5 | 6 | 785.1 | — | — | 27 | 5,421.3 | ||||||||||||||||
| Non-Manufacturing: | |||||||||||||||||||||||||
| North America | 3 | 112.5 | — | — | — | — | — | — | 3 | 112.5 | |||||||||||||||
| Europe | — | — | 1 | 38.5 | — | — | — | — | 1 | 38.5 | |||||||||||||||
| 3 | 112.5 | 1 | 38.5 | — | — | — | — | 4 | 151.0 | ||||||||||||||||
| Number of Facilities - Leased | |||||||||||||||||||||||||
| Industrial Process | Motion Technologies | Connect & Control Technologies | Other | Total | |||||||||||||||||||||
| Location | # | Area | # | Area | # | Area | # | Area | # | Area | |||||||||||||||
| Manufacturing: | |||||||||||||||||||||||||
| North America | 3 | 156.0 | 3 | 56.6 | 9 | 442.1 | — | — | 15 | 654.7 | |||||||||||||||
| Europe | — | — | 4 | 350.7 | 3 | 69.0 | — | — | 7 | 419.7 | |||||||||||||||
| Asia | 2 | 221.5 | 2 | 348.6 | 1 | 294.4 | — | — | 5 | 864.5 | |||||||||||||||
| South America | 1 | 31.8 | — | — | — | — | — | — | 1 | 31.8 | |||||||||||||||
| 6 | 409.3 | 9 | 755.9 | 13 | 805.5 | — | — | 28 | 1,970.7 | ||||||||||||||||
| Non-Manufacturing: | |||||||||||||||||||||||||
| North America | 16 | 421.6 | 2 | 58.0 | — | — | 2 | 64.6 | 20 | 544.2 | |||||||||||||||
| Europe | 10 | 133.0 | 1 | 28.0 | — | — | 1 | 3.2 | 12 | 164.2 | |||||||||||||||
| Middle East | 2 | 14.8 | — | — | — | — | — | — | 2 | 14.8 | |||||||||||||||
| Asia | 10 | 140.9 | 2 | 5.5 | 4 | 7.2 | 2 | 11.9 | 18 | 165.5 | |||||||||||||||
| South America | 6 | 220.9 | — | — | — | — | — | — | 6 | 220.9 | |||||||||||||||
| 44 | 931.2 | 5 | 91.5 | 4 | 7.2 | 5 | 79.7 | 58 | 1,109.6 | ||||||||||||||||
| ITEM 3. | LEGAL PROCEEDINGS | ||||
From time to time, we are involved in litigation, claims, government inquiries, investigations andlegal proceedings including but not limitedthat are incidental to thosethe operation of our businesses. Some of these proceedings allege damages relating to environmental exposures,exposure, intellectual property matters, copyright infringement, personal injury claims, regulatory matters, commercial and government contract issues,product liabilities, employment and employee benefit matters, government contract issues and commercial or contractual disputes and securities matters.
INFORMATION ABOUT OUR EXECUTIVE OFFICERS OF THE REGISTRANT
The current executive officers of the Company as of February 1, 2018,2024, are listed below.
| Name | Age | Current Title | |||||||||
| Luca Savi | 58 | ||||||||||
| President and Chief Executive Officer | |||||||||||
| Senior Vice President and President, | |||||||||||
| Senior Vice President | |||||||||||
| Vice President and Chief Accounting Officer | |||||||||||
| Senior Vice President and Chief Human Resources Officer | |||||||||||
| Bartek Makowiecki | 45 | Senior Vice President, Strategy and Business Development | |||||||||
| Lori B. Marino | 49 | Senior Vice President, General Counsel, Corporate Secretary and Chief Compliance Officer | |||||||||
| Senior Vice President and President, Industrial Process | |||||||||||
Emmanuel Caprais has served as our Senior Vice President and Chief Financial Officer since October 2011.2020. He previously served as Vice President Corporateof Finance from 2010 to 2011 and Director,Group Chief Financial Officer, in charge of the Company’s business unit finance teams, Financial Planning & Analysis and Investor Relations for the company.Mr. Caprais joined ITT in 2012, at which time he served as segment Chief Financial Officer of Motion Technologies and later Industrial Process. Prior to joining ITT, Mr. Caprais held leadership roles in finance at Marelli, and earlier held positions of increasing responsibility in finance at Valeo across North America and Europe.
22
Cheryl de Mesa Graziano has served as our Vice President and Chief Accounting Officer since November 2022. Prior to joining ITT, she served as Chief Accounting Officer of Party City Holdco Inc. (Party City) from 2008December 2021 to 2010.October 2022. Ms. de Mesa Graziano also served as Vice President, Global Controller and Vice President, Financial Reporting and Accounting at Party City. She previously held various positions of increasing responsibility at Stanley Black & Decker, Inc. from May 2013 to October 2019, including Assistant Corporate Controller and Global Leader, Corporate Technical Accounting and Compliance. Before 2013, Ms. de Mesa Graziano held finance leadership roles at other companies including IBM and Financial Executives International.
Maurine C. Lembesis has served as our Senior Vice President and Chief Human Resources Officer since January 2019. Prior to that, Ms. Lembesis served as our Vice President and Corporate Human Resources Business Partner. Prior to joining ITT in 2006,2013, she held roles of increasing responsibility in Human Resources at Avon Products Inc., including the role of Executive Director of Human Resources. In addition, Ms. Lembesis held various other human resources roles at Capital Group Companies, Pfizer Inc. and GE Capital.
Bartek Makowiecki has served as our Senior Vice President, Strategy and Business Development since September 2021. Prior to joining ITT, he served as Global Head of Strategy, M&A and Venturing of Ingredion Incorporated from October 2017 to September 2021. Immediately prior, he served as Director, Corporate Strategy & Head of M&A at Owens Corning from November 2015 to October 2017. Prior to that, Mr. ScaleraMakowiecki held senior financial roles with R.R. Donnelley, Dover Corp.,of increasing responsibility in global strategy and PricewaterhouseCoopers, LLP.M&A at Parker-Hannifin Corporation from August 2003 to October 2015.
Fernando Roland has served as our Senior Vice President and President of Industrial Process since August 2023. Prior to joining ITT, Mr. Roland served as Senior Vice President, Customer Engineered Solutions — Americas, and held other leadership roles at Continental AG from March 2013 to July 2023. Prior to that, Mr. Roland held various business leadership positions at companies such as DuPont de Nemours, Inc., Hyosung Corporation, and Performance Fibers from 1996 to 2013.
| ITEM 4. | MINE SAFETY DISCLOSURES | ||||
Not applicable.
23
PART II
| ITEM 5. | MARKET FOR | ||||
COMMON STOCK – MARKET PRICES AND DIVIDENDS
| 2017 | 2016 | ||||||||||||||
| High | Low | High | Low | ||||||||||||
| Three Months Ended: | |||||||||||||||
| March 31 | $ | 44.00 | $ | 38.52 | $ | 38.96 | $ | 29.15 | |||||||
| June 30 | 42.73 | 36.93 | 39.70 | 30.31 | |||||||||||
| September 30 | 44.95 | 38.66 | 36.98 | 30.06 | |||||||||||
| December 31 | 54.79 | 44.06 | 43.07 | 32.46 | |||||||||||
The amount and timing of dividends payable on our common stock are within the sole discretion of our Board of Directors and will be based on, and affected by, a number of factors, including our financial position and results of operations, available cash, expected capital spending plans, prevailing business conditions, and other factors the Board deems relevant. Therefore, there can be nowe cannot provide any assurance as to what level of dividends, if any, will be paid in the future.
During the fiscal year ended December 31, 2017, no2023, the Company did not offer or sell any equity securities of the Company were sold by the Company that were not registered under the Securities Act.
ISSUER PURCHASES OF EQUITY SECURITIES
On October 4, 2023, the Board of Directors approved an indefinite term $1,000 open-market share repurchase program (the 2023 Plan). Repurchases under this authorization will begin upon the completion of the 2019 Plan.
We have made no open-market share repurchases of our common stock forduring the quarter ended December 31, 2017.2023.
24
(IN MILLIONS, EXCEPT PER SHARE AMOUNTS) PERIOD | TOTAL NUMBER OF SHARES PURCHASED | AVERAGE PRICE PAID PER SHARE(1) | TOTAL NUMBER OF SHARES PURCHASED AS PART OF PUBLICLY ANNOUNCED PLANS OR PROGRAMS(2) | MAXIMUM DOLLAR VALUE OF SHARES THAT MAY YET BE PURCHASED UNDER THE PLANS OR PROGRAMS(2) | ||||||||||
| 10/1/2017 - 10/31/2017 | — | — | — | $ | 140.6 | |||||||||
| 11/1/2017 - 11/30/2017 | — | — | — | $ | 140.6 | |||||||||
| 12/1/2017 - 12/31/2017 | — | — | — | $ | 140.6 | |||||||||
COMPANY STOCK PERFORMANCE
COMPARISON OF CUMULATIVE FIVE-YEAR TOTAL RETURN

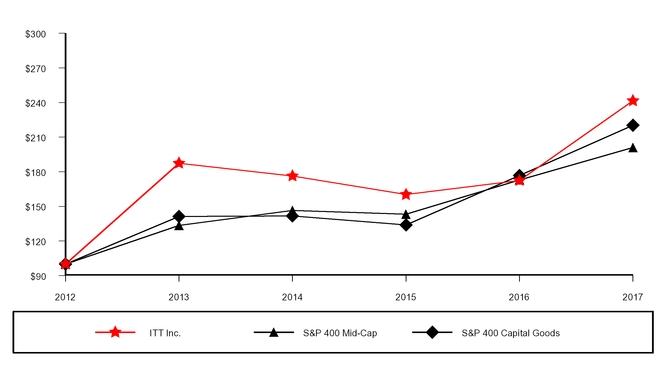
| 12/31/2012 | 12/31/2013 | 12/31/2014 | 12/31/2015 | 12/31/2016 | 12/31/2017 | |||||||||||||||||||||||||||||||||||||||||||||||||||||||||||||||||||||||||
| 12/31/2018 | 12/31/2018 | 12/31/2019 | 12/31/2020 | 12/31/2021 | 12/31/2022 | 12/31/2023 | ||||||||||||||||||||||||||||||||||||||||||||||||||||||||||||||||||||||||
| ITT Inc. | $ | 100.00 | $ | 187.38 | $ | 176.37 | $ | 160.26 | $ | 172.46 | $ | 241.55 | ||||||||||||||||||||||||||||||||||||||||||||||||||||||||||||||||||
| S&P 400 Mid-Cap | $ | 100.00 | $ | 133.46 | $ | 146.45 | $ | 143.25 | $ | 172.95 | $ | 201.02 | ||||||||||||||||||||||||||||||||||||||||||||||||||||||||||||||||||
| S&P 400 Capital Goods | $ | 100.00 | $ | 141.36 | $ | 141.71 | $ | 133.91 | $ | 176.66 | $ | 220.29 | ||||||||||||||||||||||||||||||||||||||||||||||||||||||||||||||||||
This graph is not, and is not intended to be, indicative of future performance of our common stock. This graph shall not be deemed "filed" with the SEC or subject to the liabilities of Section 18 of the Securities Exchange Act of 1934, as amended (the “Exchange Act”), and should not be deemed to be incorporated by reference into any of our prior or subsequent filings under the Securities Act.
| ITEM 6. | [RESERVED] | ||||
Not applicable.
25
| (In Millions, except per share amounts) | 2017(a) | 2016(b) | 2015 | 2014 | 2013 | ||||||||||||||
| Results of Operations | |||||||||||||||||||
| Revenue | $ | 2,585.3 | $ | 2,405.4 | $ | 2,485.6 | $ | 2,654.6 | $ | 2,496.9 | |||||||||
| Gross profit | 817.2 | 758.2 | 809.1 | 866.4 | 799.8 | ||||||||||||||
| Gross margin | 31.6 | % | 31.5 | % | 32.6 | % | 32.6 | % | 32.0 | % | |||||||||
Asbestos-related (benefit) costs, net(c) | (19.9 | ) | (25.6 | ) | (91.4 | ) | 3.9 | 32.8 | |||||||||||
| Other operating costs | 527.4 | 524.9 | 520.4 | 596.1 | 583.4 | ||||||||||||||
| Operating income | 309.7 | 258.9 | 380.1 | 266.4 | 183.6 | ||||||||||||||
| Operating margin | 12.0 | % | 10.8 | % | 15.3 | % | 10.0 | % | 7.4 | % | |||||||||
Income tax expense (benefit)(d) | 194.6 | 76.0 | 70.1 | 71.3 | (309.6 | ) | |||||||||||||
| Income from continuing operations attributable to ITT Inc. | 115.0 | 181.9 | 312.4 | 188.4 | 487.7 | ||||||||||||||
(Loss) income from discontinued operations, net of tax(e) | (1.5 | ) | 4.2 | 39.4 | (3.9 | ) | 0.8 | ||||||||||||
| Net income attributable to ITT Inc. | $ | 113.5 | $ | 186.1 | $ | 351.8 | $ | 184.5 | $ | 488.5 | |||||||||
| Income from continuing operations per basic share | $ | 1.30 | $ | 2.04 | $ | 3.48 | $ | 2.06 | $ | 5.36 | |||||||||
| (Loss) income from discontinued operations per basic share | $ | (0.01 | ) | $ | 0.05 | $ | 0.44 | $ | (0.04 | ) | $ | 0.01 | |||||||
| Net income per basic share | $ | 1.29 | $ | 2.09 | $ | 3.92 | $ | 2.02 | $ | 5.37 | |||||||||
| Income from continuing operations per diluted share | $ | 1.29 | $ | 2.02 | $ | 3.44 | $ | 2.03 | $ | 5.28 | |||||||||
| (Loss) income from discontinued operations per diluted share | $ | (0.01 | ) | $ | 0.05 | $ | 0.44 | $ | (0.04 | ) | $ | 0.01 | |||||||
| Net income per diluted share | $ | 1.28 | $ | 2.07 | $ | 3.88 | $ | 1.99 | $ | 5.29 | |||||||||
| Dividends declared | $ | 0.512 | $ | 0.496 | $ | 0.4732 | $ | 0.44 | $ | 0.40 | |||||||||
| Financial Position | |||||||||||||||||||
| Cash and cash equivalents | $ | 389.8 | $ | 460.7 | $ | 415.7 | $ | 584.0 | $ | 507.3 | |||||||||
| Total assets | 3,700.2 | 3,601.7 | 3,723.6 | 3,631.5 | 3,740.2 | ||||||||||||||
| Total debt and capital leases | 171.9 | 216.3 | 248.5 | 8.5 | 48.9 | ||||||||||||||
| ITEM 7. | |||
The following discussion should be read in conjunction with the consolidated financial statements and the notes related thereto. As we noted earlier in the Forward-Looking and Cautionary Statements of this Annual Report on Form 10-K, this Part II, Item 7, "Management’sManagement’s Discussion and Analysis of Financial Condition and Results of Operations", and Part II, Item 7A, "Quantitative and Qualitative Disclosures about Market Risk" (along with other sections of this Annual Report), may contain forward-looking statements. The risks discussed in Part I, Item 1A, "Risk Factors," and other risks identified in this Annual Report on Form 10-K could cause our actual results to differ materially from those expressed by such forward-looking statements.
All comparisons included within this Part II, Item 7, Management’s Discussion and Analysis of Financial Condition and Results of Operations, refer to results for the year ended December 31, 2023 compared to the year ended December 31, 2022, unless stated otherwise. Additionally, all financial results and share repurchases other than per share amounts are reported in millions, unless stated otherwise. Per share amounts are reported in ones. Please refer to our Annual Report on Form 10-K (2022 Annual Report) for a discussion of the year ended December 31, 2022 compared to the year ended December 31, 2021.
OVERVIEW
ITT Inc., through its worldwide subsidiaries, is a diversified manufacturer of highly engineered critical components and customized technology solutions for the transportation, industrial and energy transportationmarkets. Our product and industrial markets. We refer youservice offerings are organized into three segments: Motion Technologies (MT), Industrial Process (IP), and Connect & Control Technologies (CCT). Refer to Part I, Item 1, "Description of Business", for a further overview of our company, segments, products and servicesservice offerings, and other information about ourthe business.
EXECUTIVE SUMMARY
During 2017,2023, despite evolving macroeconomic conditions, we continued to focus on optimizing execution across the enterprise while advancing our long-term strategiesdelivered strong financial results, which included revenue and drivingoperating income growth, operating margin expansion, EPS growth and share gains witheffective deployment of capital. The following table provides a summary of key customers, end markets, and geographies. In early 2017, we created a new operating model and Chief Operating Officer structure, which has been successfully driving more robust processes and performance across the company. The benefits generated from increased volume, productivity improvements across our businesses, and proactive restructuring actions more than offset unfavorable headwinds experienced during the year.indicators for 2023 in comparison to 2022.
| Revenue | Operating Income | Operating Margin | EPS | ||||||||||||||
| $3,283 | $528 | 16.1% | $4.97 | ||||||||||||||
| 10% Increase | 13% Increase | 40bp Increase | 13% Increase | ||||||||||||||
| Organic Revenue | Adjusted Operating Income | Adjusted Operating Margin | Adjusted EPS | ||||||||||||||
| $3,229 | $555 | 16.9% | $5.21 | ||||||||||||||
| 8% Increase | 17% Increase | 100bp Increase | 17% Increase | ||||||||||||||
See the section titled "Key Performance Indicators and Non-GAAP Measures" for a definition and reconciliation of organic revenue, adjusted segment operating income, adjusted operating margin, and adjusted EPS.
Our 2023 results include:
•Revenue of $3,283.0 increased $295.3 due to higher sales volume and pricing actions, particularly within IP's aftermarket business, MT's Friction OE business, and CCT's components business. In addition, our 2023 results benefited by $30.5 from our recent acquisitions of Habonim and Micro-Mode Products, Inc. ("Micro-Mode"), and by $23.1 from favorable foreign currency translation.
•Operating income of $528.2 increased $60.2, primarily due to higher revenue, productivity savings, a gain of $7.2 on the sale of a product line within our CCT segment, lower charges related to the suspension of business in Russia, and the accretive impact of our recent acquisitions of Habonim and Micro-Mode. The increase in operating income was partially offset by higher labor, raw material and overhead costs, unfavorable foreign currency impacts and product mix, a loss of $15.3 on the sale of our Matrix Composites, Inc. ("Matrix") business, and a prior year gain of $15.5 on the sale of facilities within our IP segment.
26
•Income from continuing operations.operations was $4.97 per diluted share, an increase of $0.57 as compared to the prior year. The increase was primarily due to higher operating income, as discussed above, and lower share count resulting from open-market share repurchases executed during the year.
Throughout 2023, we remained committed to creating value through effective capital deployment, which included the following:
•In May, we acquired Micro-Mode, a leading provider of highly engineered connectors for harsh environment defense and space applications.
•We announced our intent to acquire Denmark-based Svanehøj Group A/S ("Svanehøj"), a leading provider of customized critical liquid and cryogenic pumps for liquefied gas applications for the marine sector, which will expand our international footprint and we expect will position us to benefit from the energy transition. The acquisition closed on January 19, 2024.
•We increased our capital expenditures by 4% over the prior year to fund investments in innovation, capacity and green energy, including solar installations.
•We repurchased 0.7 shares of common stock on the open market for $61, and announced a new $1 billion share repurchase program.
•We paid $96 in dividends to our shareholders. Our dividends declared in 2023 of $1.16 per share represented a 10% increase over the dividends per share declared of $1.056 in 2022.
Global Macroeconomic Conditions
During 2017,2023, the global economy experienced a mix of challenges that impacted the Company's performance. These challenges included geopolitical uncertainty, trade disputes, supply chain disruptions, production challenges, labor shortages, raw material constraints, and inflation. These items are described further below.
Israel-Palestine Conflict
In October 2023, tensions between Israel and Palestine escalated, resulting in war, regional instability, and market volatility. This situation has further increased geopolitical tensions, has attracted international attention, and has raised humanitarian and economic concerns. Our operations in Israel are limited to Habonim, which we advanced our strategic goals to drive long-term growth and share gains. The following highlights a few examples of strategic actions that occurred during the year that will help position us well for continued value creation:
Russia-Ukraine War
In February 2022, the United States and other leading nations announced targeted economic sanctions on Russia and certain Russian citizens in response to increase focus on aerospaceRussia’s war with Ukraine, which has increased regional instability and industrial markets, optimize operations, leverage shared infrastructure,global economic and drive long-term growth.
political uncertainty.
During the year,years ended December 31, 2023 and 2022, we drove market share gains by expandingrecorded total pre-tax charges of $2.5 and $7.9, primarily related to suspending our business in newRussia. Any future impacts on our business and existing key end marketsfinancial results are not expected to be material.
Inflationary Pressures
Since 2020, the cost of energy and geographies, including:
Beginning in 2022, central banks around the world have been raising interest rates to efficiently aligncounter inflation. Rising interest rates increased our friction footprint with the automotive platforms we have already secured.
27
Global macroeconomic conditions have led and may continue to lead to decreased demand for our products, increased costs, and reduced operating margins. We have been able to offset most of quarterly dividendsthese negative impacts through pricing actions and $30 in share repurchases.
DISCUSSION OF FINANCIAL RESULTS
| 2017 | 2016 | Change | |||||||||||||||||||||||||||||||||
| For the Year Ended December 31 | For the Year Ended December 31 | 2023 | 2022 | Change | |||||||||||||||||||||||||||||||
| Revenue | $ | 2,585.3 | $ | 2,405.4 | 7.5 | % | Revenue | $ | 3,283.0 | $ | $ | 2,987.7 | 9.9 | 9.9 | % | ||||||||||||||||||||
| Gross profit | 817.2 | 758.2 | 7.8 | % | Gross profit | 1,107.3 | 922.3 | 922.3 | 20.1 | 20.1 | % | ||||||||||||||||||||||||
| Operating expenses | |||||||||||||||||||||||||||||||||||
| Operating expenses | |||||||||||||||||||||||||||||||||||
| Operating expenses | 579.1 | 454.3 | 27.5 | % | |||||||||||||||||||||||||||||||
| Operating income | |||||||||||||||||||||||||||||||||||
| Operating income | |||||||||||||||||||||||||||||||||||
| Operating income | 528.2 | 468.0 | 12.9 | % | |||||||||||||||||||||||||||||||
| Interest and other non-operating expense, net | |||||||||||||||||||||||||||||||||||
| Interest and other non-operating expense, net | |||||||||||||||||||||||||||||||||||
| Interest and other non-operating expense, net | 8.7 | 6.2 | 40.3 | % | |||||||||||||||||||||||||||||||
| Income tax expense | Income tax expense | 104.8 | 91.1 | 15.0 | % | ||||||||||||||||||||||||||||||
| Income from continuing operations attributable to ITT Inc. | |||||||||||||||||||||||||||||||||||
| Income from continuing operations attributable to ITT Inc. | |||||||||||||||||||||||||||||||||||
| Income from continuing operations attributable to ITT Inc. | 411.4 | 368.3 | 11.7 | % | |||||||||||||||||||||||||||||||
| Net income attributable to ITT Inc. | Net income attributable to ITT Inc. | $ | 410.5 | $ | 367.0 | 11.9 | % | ||||||||||||||||||||||||||||
| Gross margin | 31.6 | % | 31.5 | % | 10 | bp | |||||||||||||||||||||||||||||
| Operating expenses | 507.5 | 499.3 | 1.6 | % | |||||||||||||||||||||||||||||||
| Gross margin | |||||||||||||||||||||||||||||||||||
| Gross margin | 33.7 | % | 30.9 | % | 280 | bp | |||||||||||||||||||||||||||||
| Operating expense to revenue ratio | 19.6 | % | 20.8 | % | (120 | )bp | Operating expense to revenue ratio | 17.6 | % | 15.2 | % | 240 | bp | ||||||||||||||||||||||
| Operating income | 309.7 | 258.9 | 19.6 | % | |||||||||||||||||||||||||||||||
| Operating margin | 12.0 | % | 10.8 | % | 120 | bp | Operating margin | 16.1 | % | 15.7 | % | 40 | bp | ||||||||||||||||||||||
| Income tax expense | 194.6 | 76.0 | 156.1 | % | |||||||||||||||||||||||||||||||
| Effective tax rate | 62.9 | % | 29.4 | % | 3,350 | bp | Effective tax rate | 20.2 | % | 19.7 | % | 50 | bp | ||||||||||||||||||||||
| Income from continuing operations attributable to ITT Inc. | 115.0 | 181.9 | (36.8 | )% | |||||||||||||||||||||||||||||||
| (Loss) income from discontinued operations, net of tax | (1.5 | ) | 4.2 | (135.7 | )% | ||||||||||||||||||||||||||||||
| Net income attributable to ITT Inc. | $ | 113.5 | $ | 186.1 | (39.0 | )% | |||||||||||||||||||||||||||||
All comparisons included withwithin the Discussion of Financial Results 2017for 2023 versus 20162022 refer to results for the year ended December 31, 20172023 compared to the year ended December 31, 2016,2022, unless stated otherwise.
REVENUE
The following table illustratessummarizes the year-over-year revenue resultsderived from each of our segmentssegments.
| For the Year Ended December 31 | 2023 | 2022 | Change | Organic growth(a) | |||||||||||||||||||
| Motion Technologies | $ | 1,457.8 | $ | 1,374.0 | 6.1 | % | 4.9 | % | |||||||||||||||
| Industrial Process | 1,129.6 | 971.0 | 16.3 | % | 14.3 | % | |||||||||||||||||
| Connect & Control Technologies | 699.4 | 645.6 | 8.3 | % | 5.7 | % | |||||||||||||||||
| Eliminations | (3.8) | (2.9) | |||||||||||||||||||||
| Total Revenue | $ | 3,283.0 | $ | 2,987.7 | 9.9 | % | 8.1 | % | |||||||||||||||
(a)See the section titled "Key Performance Indicators and Non-GAAP Measures" for the years ended December 31, 2017a definition and 2016.reconciliation of organic revenue.
Motion Technologies
| 2017 | 2016 | Change | Organic (decline) growth(a) | ||||||||||
| Industrial Process | $ | 807.2 | $ | 830.1 | (2.8 | )% | (3.4 | )% | |||||
| Motion Technologies | 1,176.0 | 983.4 | 19.6 | % | 9.8 | % | |||||||
| Connect & Control Technologies | 605.6 | 596.3 | 1.6 | % | 1.4 | % | |||||||
| Eliminations | (3.5 | ) | (4.4 | ) | (20.5 | )% | — | % | |||||
| Total Revenue | $ | 2,585.3 | $ | 2,405.4 | 7.5 | % | 3.2 | % | |||||
In March 2023, our Friction business signed a new 10-year agreement, effective January 1, 2024, for the supply of $5.7. Organic revenue decreased 3.4%, dueITT aftermarket brake pads to a 17% decline in project pump revenue primarily stemming from lower North American oil and gas projects in backlog entering the year and lower mining project revenue, but also reflected an 11% declineContinental AG. The previous 10-year agreement with Continental AG expired on December 31, 2023. The new agreement is expected to generate over $1 billion in revenue from valves partially related to a significant prior year contract. Partially offsetting this decline was organic revenue growth of 4% in short-cycle baseline pumps driven by stronger demand in the industrial and mining markets and growth of 3% from aftermarket parts driven by oil & gas in Europe and Middle East regions and growth of 6% from service due to strength in all North American markets.over its term.
28
Industrial Process business will vary and may be recorded upon shipment based on contract terms, when previously such projects were recorded over time. The impact to future
IP revenue trends is uncertain as it will depend on future orders and contract terms. However, cash flows and overall profitability of a contract at completion are unchanged by the new standard.
The level of order and shipment activity related to project pumpsat IP can vary significantly from period to period. Backlogperiod due to pump projects which are highly engineered, customized to customer needs, and have longer lead times. Total IP orders during 2023 were $1,227.0, an increase of 11.4% compared to the prior year, including $285.9 of orders in the fourth quarter, which represents 5.5% growth from the fourth quarter of last year. IP's backlog as of December 31, 20172023 was $336.5,$676.8, reflecting a decreasean increase of $10.7,$96.8, or 3.1%16.7%, compared to December 31, 2016.2022. Our backlog represents firm orders that have been received, acknowledged, and entered into our production systems.
GROSS PROFIT
Gross profit for 20172023 was $817.2,$1,107.3, reflecting a gross margin of 31.6%33.7%. Gross profit for 20162022 was $758.2,$922.3, reflecting a gross margin of 31.5%30.9%. Higher automotive sales volumes, lower labor costs as a result of restructuring benefits from our structural cost reset at our Industrial Process segment, operational improvements at our Connect & Control Technologies segment,The increases in gross profit and incremental activity from our 2017 acquisition of Axtonegross margin were primarily driven by an increase in revenue, described above in the section titled "Revenue", partially offset by unfavorable automotiveincreases in raw material, labor, and aerospace pricing and sales mix impacts, increased direct materialoverhead costs, due to higher commodity prices impacting our Motion Technologies segment, and unfavorable impacts from certain military-specification connectors.which were driven by inflationary pressures during the year, as discussed above in the section titled "Global Macroeconomic Conditions".
OPERATING EXPENSES
The following table provides further informationa disaggregation of our operating expenses by expense type, as well as a breakdown of operating expense by segment.
| For the Year Ended December 31 | 2023 | 2022 | Change | ||||||||||||||
General and administrative expenses(a) | $ | 302.6 | $ | 217.2 | 39.3 | % | |||||||||||
| Sales and marketing expenses | 174.0 | 156.9 | 10.9 | % | |||||||||||||
| Research and development expenses | 102.6 | 96.5 | 6.3 | % | |||||||||||||
| Gain on sale of long-lived assets | (0.1) | (16.3) | (99.4) | % | |||||||||||||
| Total operating expenses | $ | 579.1 | $ | 454.3 | 27.5 | % | |||||||||||
| By Segment: | |||||||||||||||||
| Motion Technologies | $ | 173.7 | $ | 140.9 | 23.3 | % | |||||||||||
| Industrial Process | 207.6 | 150.0 | 38.4 | % | |||||||||||||
| Connect & Control Technologies | 144.1 | 119.6 | 20.5 | % | |||||||||||||
| Corporate & Other | 53.7 | 43.8 | 22.6 | % | |||||||||||||
(a)The prior year presentation has been updated to conform to the current year presentation.
29
| 2017 | 2016 | Change | ||||||||
| General and administrative expenses | $ | 264.0 | $ | 274.1 | (3.7 | )% | ||||
| Sales and marketing expenses | 169.7 | 170.0 | (0.2 | )% | ||||||
| Research and development expenses | 93.7 | 80.8 | 16.0 | % | ||||||
| Asbestos-related benefit, net | (19.9 | ) | (25.6 | ) | (22.3 | )% | ||||
| Total operating expenses | $ | 507.5 | $ | 499.3 | 1.6 | % | ||||
| By Segment: | ||||||||||
| Industrial Process | $ | 175.7 | $ | 212.3 | (17.2 | )% | ||||
| Motion Technologies | 177.9 | 139.0 | 28.0 | % | ||||||
| Connect & Control Technologies | 147.4 | 136.7 | 7.8 | % | ||||||
| Corporate & Other | 6.5 | 11.3 | (42.5 | )% | ||||||
General and administrative ("G&A")(G&A) expenses were $264.0increased $85.4 for the year ended December 31, 2017, reflecting a decrease of $10.1, or 3.7%.2023. The year-over-year decreaseincrease was primarily due to an insurance related settlementhigher incentive-based compensation and payroll costs, including as a result of $16 receivedhigher headcount stemming from our acquisitions of Habonim in the fourthsecond quarter of 2017, lower restructuring costs of $13.2,2022 and cost savings from our past restructuring actions. In addition,Micro-Mode in the prior year we recorded pension settlementsecond quarter of 2023, a loss of $15.3 on the sale of our Matrix business, higher restructuring charges, of $12.7 and a trade name impairment of $4.1. These items wereunfavorable foreign currency impacts. The increase was partially offset by a gain of $7.2 resulting from the sale of a product line within our CCT segment, income of $3.7 from a recovery of costs associated with the 2020 lease termination of a legacy site, higher incentive compensation of approximately $20, unfavorable foreign currency impacts of approximately $13, a legal accrual of $5,corporate-owned life insurance investment gains, and a pension curtailment of $3.7. In addition, G&A expenses increased $10.6 due to the Axtone acquisition in early 2017.lower asset impairment charges.
Sales and marketing expenses increased $17.1 for the year ended December 31, 2017 were $169.7, reflecting a decrease of 0.2%, as lower2023, primarily driven by higher personnel and commissionother sales-related costs at Industrial Process wereto support higher sales activity. The increase in personnel costs was partially offset by higher overall selling costs at Motion Technologies attributable to strong sales growthhigher headcount stemming from, and incremental costs related totiming of, our acquisition of Axtone of $4.3.recent Habonim and Micro-Mode acquisitions.
Research and development ("R&D")(R&D) expenses increased $6.1 for the year ended December 31, 20172023, primarily driven by higher personnel costs to support investments in innovation and new product development.
Gain on sale of long-lived assets decreased by $16.2 for the year ended December 31, 2023. The prior year period included a one-time gain of $15.5 related to the sale of facilities that were $93.7, reflecting an increasepreviously held within our IP segment.
OPERATING INCOME
The following table summarizes our operating income and operating margin by segment.
| For the Year Ended December 31 | 2023 | 2022 | Change | ||||||||||||||
| Motion Technologies | $ | 230.8 | $ | 208.5 | 10.7 | % | |||||||||||
| Industrial Process | 243.6 | 187.6 | 29.9 | % | |||||||||||||
| Connect & Control Technologies | 107.5 | 115.8 | (7.2) | % | |||||||||||||
| Corporate & Other | (53.7) | (43.9) | 22.3 | % | |||||||||||||
| Total operating income | $ | 528.2 | $ | 468.0 | 12.9 | % | |||||||||||
| Operating Margin: | |||||||||||||||||
| Motion Technologies | 15.8 | % | 15.2 | % | 60 | bp | |||||||||||
| Industrial Process | 21.6 | % | 19.3 | % | 230 | bp | |||||||||||
| Connect & Control Technologies | 15.4 | % | 17.9 | % | (250) | bp | |||||||||||
| Consolidated ITT | 16.1 | % | 15.7 | % | 40 | bp | |||||||||||
MT operating income for the year ended December 31, 2023 increased $22.3 primarily due to higher revenue, as discussed above, productivity savings, and lower charges related to the suspension of $12.9, or 16.0%.business in Russia. The increase was partially offset by higher raw material, labor and overhead costs, as well as unfavorable foreign currency impacts and product mix.
IP operating income for the year ended December 31, 2023 increased $56.0, driven by higher revenue, as discussed above, productivity savings, lower charges related to the suspension of business in Russia, and the accretive impact of the acquisition of Habonim, which occurred in the second quarter of 2022. The increase was partially offset by higher labor and overhead costs, and unfavorable foreign currency impacts. The prior year period also benefited from a non-recurring gain of $15.5 related to the sale of facilities.
CCT operating income for the year ended December 31, 2023 decreased $8.3, driven by a $15.3 loss on the sale of our Matrix business, and higher raw material, labor and overhead costs. The decrease was partially offset byhigher revenue, as discussed above, productivity savings, a gain of $7.2 related to the sale of a product line, and the accretive impact of the second quarter acquisition of Micro-Mode.
Within Corporate & Other, corporate costs, net, increased $9.8 for the year ended December 31, 2023, primarily driven by increased product development activity at our Motion Technologies and Connect and Control segments. Incrementalhigher personnel-related costs, including incentive-based compensation. The increase was partially offset by income of $3.7 from a recovery of costs associated with the 2020 lease termination of a legacy site as well as by higher corporate-owned life insurance investment gains. The prior year period also included a $1.7 asset impairment charge related to our acquisitionthe relocation of Axtone were $1.4 during 2017.the Company’s corporate headquarters.
30
INTEREST AND OTHER NON-OPERATING EXPENSE (INCOME), NET
The following table summarizes our interest and other non-operating expense (income), net.
| For the Year Ended December 31 | 2023 | 2022 | Change | ||||||||||||||
| Interest expense | $ | 19.2 | $ | 10.9 | 76.1 | % | |||||||||||
| Interest income | (8.8) | (4.5) | 95.6 | % | |||||||||||||
| Non-operating postretirement (benefit) costs, net | (0.4) | 1.1 | 136.4 | % | |||||||||||||
| Other non-operating income, net | (1.3) | (1.3) | — | % | |||||||||||||
| Total interest and other non-operating expense, net | $ | 8.7 | $ | 6.2 | 40.3 | % | |||||||||||
The increase in interest and other non-operating expense, net asbestos-related benefit of $19.9, compared to a benefit of $25.6 infor the prior year. The decreaseyear ended December 31, 2023 was primarily due to higher interest expense associated with a lowerhigher average interest rate on our commercial paper borrowings, and $1.4 of interest expense related to a tax audit settlement in Italy, as discussed below in the section titled "Income Tax Expense". This increase was partially offset by an increase in interest income, which was primarily due to higher weighted average interest rates during the year, and an increase in postretirement benefits due to a prior year plan amendment.
31
INCOME TAX EXPENSE
The following table summarizes our income tax expense and effective tax rate.
| For the Year Ended December 31 | 2023 | 2022 | Change | |||||||||||||||||
| Income tax expense | $ | 104.8 | $ | 91.1 | 15.0 | % | ||||||||||||||
| Effective tax rate | 20.2 | % | 19.7 | % | 50 | bps | ||||||||||||||
The higher effective tax rate in 2023 compared to 2022 resulted from the Company recording tax expense in 2023 of $14.2 relating to a tax audit in Italy covering tax years 2016-2022. The 2023 expense includes $6.8 of U.S. tax on foreign earnings. These tax expenses were offset by $16.1 from valuation allowance reversals on deferred tax assets in Germany. ITT also recognized tax benefits of $4.9 from the filing of an amended 2017 consolidated federal tax return.
We are closely monitoring the potential passage of new U.S. and foreign tax legislation, which could result in substantial changes to the current U.S. or foreign tax systems, including changes to the statutory corporate tax rate. In October 2021, the Organization for Economic Cooperation and Development (OECD) and G20 Finance Ministers reached an agreement, known as Base Erosion and Profit Shifting (BEPS) Pillar Two, which is a multi-jurisdictional plan of action to address base erosion and profit shifting. On December 20, 2021, the OECD released the Model GloBE Rules for Pillar Two defining a 15% global minimum tax rate for large multinational corporations. The OECD continues to release additional guidance and countries are implementing legislation with widespread adoption of the Model GloBE Rules for Pillar Two expected by calendar year benefit2024. We are continuing to evaluate the Model GloBE Rules for Pillar Two and related legislation, and their potential impact on future periods. Enactment of this regulation in its current form could increase the amount of global corporate income tax paid by the Company.These increases could have a material adverse effect on our effective tax rate. As the effects of a change in U.S. or foreign tax law must be recognized in the period in which the new legislation is enacted, should new legislation be signed into law, our financial results could be materially impacted.
On August 16, 2022, the U.S. government enacted the Inflation Reduction Act of 2022 (the Inflation Reduction Act) into law. The Inflation Reduction Act includes a new corporate alternative minimum tax (the Corporate AMT) of 15% on the adjusted financial statement income (AFSI) of corporations with an average AFSI exceeding $1.0 billion over a three-year period. The Corporate AMT was effective for the Company beginning in 2023. Given the AFSI threshold, the Corporate AMT was not applicable to the Company in 2023, but the Corporate AMT may have potential impacts on our future U.S. tax expense, cash taxes and effective tax rate. Additionally, the Inflation Reduction Act imposes a 1% excise tax on the fair market value of net stock repurchases made after December 31, 2022. The impact of this provision was not material in 2023 and future impacts will be dependent on the extent of share repurchases made in future periods.
We operate in various tax jurisdictions and are subject to examination by tax authorities in these jurisdictions. We are currently under examination in several jurisdictions including Czechia, Germany, Hong Kong, India, Italy, Japan, the U.S. and Venezuela. The calculation of our tax liability for unrecognized tax benefits includes dealing with uncertainties in the application of complex tax laws and regulations in various tax jurisdictions. Due to the complexity of some uncertainties, the ultimate resolution may result in a payment that is materially different from our annual remeasurement. current estimate of the unrecognized tax benefit. Over the next 12 months, the net amount of the tax liability for unrecognized tax benefits in foreign and domestic jurisdictions is not expected to change by a significant amount.
See Note 18,6, Commitments and ContingenciesIncome Taxes, in our Notes to the Consolidated Financial Statements for further information on our asbestos-related liabilities and assets.
| 2017 | 2016 | Change | ||||||||
| Industrial Process | $ | 59.5 | $ | 33.5 | 77.6 | % | ||||
| Motion Technologies | 190.0 | 171.4 | 10.9 | % | ||||||
| Connect & Control Technologies | 66.7 | 65.2 | 2.3 | % | ||||||
| Segment operating income | 316.2 | 270.1 | 17.1 | % | ||||||
| Asbestos-related benefit, net | 19.9 | 25.6 | (22.3 | )% | ||||||
| Other corporate costs | (26.4 | ) | (36.8 | ) | (28.3 | )% | ||||
| Total corporate and other cost, net | (6.5 | ) | (11.2 | ) | (42.0 | )% | ||||
| Total operating income | $ | 309.7 | $ | 258.9 | 19.6 | % | ||||
| Operating margin: | ||||||||||
| Industrial Process | 7.4 | % | 4.0 | % | 340 | bp | ||||
| Motion Technologies | 16.2 | % | 17.4 | % | (120 | )bp | ||||
| Connect & Control Technologies | 11.0 | % | 10.9 | % | 10 | bp | ||||
| Segment operating margin | 12.2 | % | 11.2 | % | 100 | bp | ||||
| Consolidated operating margin | 12.0 | % | 10.8 | % | 120 | bp | ||||
32
| 2016 | 2015 | Change | ||||||||
| Revenue | $ | 2,405.4 | $ | 2,485.6 | (3.2 | )% | ||||
| Gross profit | 758.2 | 809.1 | (6.3 | )% | ||||||
| Gross margin | 31.5 | % | 32.6 | % | (110 | )bp | ||||
| Operating expenses | 499.3 | 429.0 | 16.4 | % | ||||||
| Operating expense to revenue ratio | 20.8 | % | 17.3 | % | 350 | bp | ||||
| Operating income | 258.9 | 380.1 | (31.9 | )% | ||||||
| Operating margin | 10.8 | % | 15.3 | % | (450 | )bp | ||||
| Income tax expense | 76.0 | 70.1 | 8.4 | % | ||||||
| Effective tax rate | 29.4 | % | 18.3 | % | 1,110 | bp | ||||
| Income from continuing operations attributable to ITT Inc. | 181.9 | 312.4 | (41.8 | )% | ||||||
| Income from discontinued operations, net of tax | 4.2 | 39.4 | (89.3 | )% | ||||||
| Net income attributable to ITT Inc. | $ | 186.1 | $ | 351.8 | (47.1 | )% | ||||
| 2016 | 2015 | Change | Organic Revenue Growth(a) | ||||||||||
| Industrial Process | $ | 830.1 | $ | 1,113.8 | (25.5 | )% | (22.9 | )% | |||||
| Motion Technologies | 983.4 | 767.2 | 28.2 | % | 12.3 | % | |||||||
| Connect & Control Technologies | 596.3 | 609.3 | (2.1 | )% | (3.3 | )% | |||||||
| Eliminations | (4.4 | ) | (4.7 | ) | (6.4 | )% | — | ||||||
| Total Revenue | $ | 2,405.4 | $ | 2,485.6 | (3.2 | )% | (7.3 | )% | |||||
| 2016 | 2015 | Change | ||||||||
| General and administrative expenses | $ | 274.1 | 258.3 | 6.1 | % | |||||
| Sales and marketing expenses | 170.0 | 183.2 | (7.2 | )% | ||||||
| Research and development expenses | 80.8 | 78.9 | 2.4 | % | ||||||
| Asbestos-related benefit, net | (25.6 | ) | (91.4 | ) | (72.0 | )% | ||||
| Total operating expenses | $ | 499.3 | $ | 429.0 | 16.4 | % | ||||
| By Segment: | ||||||||||
| Industrial Process | $ | 212.3 | $ | 221.6 | (4.2 | )% | ||||
| Motion Technologies | 139.0 | 101.5 | 36.9 | % | ||||||
| Connect & Control Technologies | 136.7 | 162.8 | (16.0 | )% | ||||||
| Corporate & Other | 11.3 | (56.9 | ) | ** | ||||||
| 2016 | 2015 | Change | ||||||||
| Industrial Process | $ | 33.5 | $ | 141.2 | (76.3 | )% | ||||
| Motion Technologies | 171.4 | 126.4 | 35.6 | % | ||||||
| Connect & Control Technologies | 65.2 | 54.6 | 19.4 | % | ||||||
| Segment operating income | 270.1 | 322.2 | (16.2 | )% | ||||||
| Asbestos-related benefit, net | 25.6 | 91.4 | (72.0 | )% | ||||||
| Other corporate costs | (36.8 | ) | (33.5 | ) | 9.9 | % | ||||
| Total corporate and other (cost) benefit, net | (11.2 | ) | 57.9 | (119.3 | )% | |||||
| Total operating income | $ | 258.9 | $ | 380.1 | (31.9 | )% | ||||
| Operating margin: | ||||||||||
| Industrial Process | 4.0 | % | 12.7 | % | (870 | )bp | ||||
| Motion Technologies | 17.4 | % | 16.5 | % | 90 | bp | ||||
| Connect & Control Technologies | 10.9 | % | 9.0 | % | 190 | bp | ||||
| Segment operating margin | 11.2 | % | 13.0 | % | (180 | )bp | ||||
| Consolidated operating margin | 10.8 | % | 15.3 | % | (450 | )bp | ||||
LIQUIDITY AND CAPITAL RESOURCES
Funding and Liquidity Strategy
We monitor our funding needs and design and execute strategies to meet overall liquidity requirements, including the management of our capital structure, on both a short- and long-term basis. Significant factors that affect our overall management of liquidity include our cash flow from operations, credit ratings, the availability of commercial paper, access to bank lines of credit, term loans, and the ability to attract long-term capital on satisfactory terms. We assess these factors along with current market conditions on a continuous basis, and as a result, may alter the mix of our short- and long-term financing when it is advantageous to do so. We expect to have enough liquidity to fund our ongoing working capital, capital expenditures, dividends,operations for at least the next 12 months and financing requirements through cash flows from operations and cash on hand, or by accessing the commercial paper market. If our access to the commercial paper market were adversely affected, we believe that alternative sources of liquidity, including our Revolving Credit Agreement, described below, would be sufficient to meet our short-term funding requirements.beyond.
We manage our worldwide cash requirements considering available funds among the many subsidiaries through which we conduct business and the cost effectiveness with which those funds can be accessed. We have identifiedsupport our growth and continue toexpansion in markets outside of the U.S. through the enhancement of existing products and development of new products, increased capital spending, and potential foreign acquisitions. We look for opportunities to access cash balances in excess of local operating requirements to meet our global liquidity needs in a cost-efficient manner. A majority of our cash and cash equivalents is held by our international subsidiaries. We plan to transfer cash between certain international subsidiaries and the U.S. and other international subsidiaries when it is cost effective to do so. The passage of the U.S. Tax Act will allow us greater flexibility around our global cash management strategy related to the amount and timing of transfers, however we will continue to support growth and expand in markets outside of the U.S. through the development of products, increased non-U.S. capital spending, and potentially the acquisition of foreign businesses. In connection with the Tax Act, we have estimated a one-time U.S. provisional tax expense of $57.9 on existing post-1986 foreign earnings and potential future distributions of such earnings to the U.S., however we expect that existing foreign tax credits, research and development tax credits, and net operating losses will offset most of this tax liability. Accordingly, we expect the net cash outflow resulting from this tax liability will be approximately $7. Net cash distributions from foreign countries amounted to $111.8the U.S. during the years ended December 31, 2023 and $100.0 during 20172022 were $357.5 and 2016,$74.0, respectively. The timing and amount of any additional future distributions remains under evaluation.evaluation based on our jurisdictional cash needs.
Capital Resources
As of December 31, 2023, we have access to short- and long-term funding sources. These include access to the capital markets through a commercial paper program, as well as $700 of available borrowing capacity under our 2021 Revolving Credit Agreement, which may potentially be expanded to $1,050 under the agreement. In addition, we have market access to secure longer-term funding, if needed. Our commercial paper program is supported by our 2021 Revolving Credit Agreement and our policy is to maintain unused committed bank lines of credit in an amount greater than outstanding commercial paper balances. These sources of capital are described further below.
Commercial Paper
When available and economically feasible, we have accessed the commercial paper market through programs in place in the U.S. and Europe to supplement cash flows generated internally and to provide additional short-term funding.
The following table presents our outstanding commercial paper borrowings. See Note 15, Debt, for further information.
| As of December 31 | 2023 | 2022 | ||||||||||||
| Commercial Paper Outstanding - U.S. Program | $ | 184.9 | $ | 299.2 | ||||||||||
| Commercial Paper Outstanding - Euro Program | — | 149.1 | ||||||||||||
| Total Commercial Paper Outstanding | $ | 184.9 | 448.3 | |||||||||||
The decrease in commercial paper outstanding from December 31, 2022 to December 31, 2023 was primarily related to higher share repurchase and acquisition activity in the prior year that was financed using commercial paper, and timing of repayments. See Note 18, Capital Stock, and Note 22, Acquisitions, Investments, and Divestitures, for further information.
All outstanding commercial paper for both periods had maturity terms of less than three months from the date of issuance. Our average daily outstanding commercial paper balance for the years ended 2023 and 2022 was $366.9 and $459.6, respectively, and the maximum outstanding commercial paper during each of those respective years was $669.9 and $561.7.
Revolving Credit Agreement
On August 5, 2021, we entered into a revolving credit facility agreement with a syndicate of third party lenders including Bank of America, N.A., as administrative agent (as amended, the 2021 Revolving Credit Agreement). The 2021 Revolving Credit Agreement matures in August 2026 and provides for an aggregate principal amount of up to $700 of (i) revolving extensions of credit (the revolving loans) outstanding at any time, and (ii) letters of credit for a face amount up to $100 at any time outstanding. Subject to certain conditions, we are permitted to terminate permanently the total commitments and reduce commitments by a minimum aggregate amount of $10 or any whole
33
multiple of $1 in excess thereof. Borrowings under the credit facility are available in U.S. dollars, Euros, British pound sterling or any other currency that may be requested by us, subject to the approval of the administrative agent and each lender. We are permitted to request that lenders increase the commitments under the facility by up to $350 for a maximum aggregate principal amount of $1,050; however, this is subject to certain conditions and therefore may not be available to us. As of December 31, 2023 and 2022, we had no outstanding borrowings under the 2021 Revolving Credit Agreement. See Note 15, Debt, to the Consolidated Financial Statements for further information.
Long-term Debt
Long-term debt is generally defined as any debt with an original maturity greater than 12 months. Our long-term debt is primarily related to outstanding Italian government loans maturing in June 2027. Our long-term debt carries a weighted average fixed interest rate of 0.86% and requires annual principal and interest payments of approximately $2.0, on average, through maturity. The table below provides our long-term debt outstanding as of December 31, 2023 and 2022.
| As of December 31 | 2023 | 2022 | |||||||||
| Current portion of long-term debt | $ | 2.3 | $ | 2.2 | |||||||
| Non-current portion of long-term debt | 5.7 | 7.7 | |||||||||
| Total long-term debt | $ | 8.0 | $ | 9.9 | |||||||
Term Loan
On January 12, 2024, ITT Italia S.r.l. (“ITT Italia”), an indirect wholly owned subsidiary of ITT, entered into a facility agreement (the “ITT Italia Credit Agreement”), among the Company, as a guarantor, ITT Italia, as borrower, and BNP Paribas, Italian Branch, as bookrunner, sole underwriter and global coordinator, mandated lead arranger and agent.
The ITT Italia Credit Agreement has an initial maturity of three years and provides for term loan borrowings in an aggregate principal amount of €300 million, €275 million of which have been used to finance the Company’s acquisition of Svanehøj Group A/S, which closed on January 19, 2024.
Credit ratings
The Company's ability to access the global capital markets and the related cost of financing is dependent upon, among other factors, the Company's credit ratings. Our credit ratings as of December 31, 2023 were as follows:
| Rating Agency | Short-Term Ratings | Long-Term Ratings | |||||||||
| Standard & Poor’s | A-2 | BBB | |||||||||
| Moody’s Investors Service | P-2 | Baa2 | |||||||||
| Fitch Ratings | F1 | BBB+ | |||||||||
In December 2023, Fitch Ratings upgraded ITT's short-term ratings, which include its Short-term Issuer Default rating and Commercial Paper rating, from F2 to F1. The upgraded ratings reflect ITT's conservative capital structure, product and geographic diversification, installed base, sizeable aftermarket revenue, solid EBITDA margins, and good financial flexibility. There were no other changes to our credit ratings during 2023. Please refer to the rating agency websites and press releases for more information.
34
Sources and Uses of Liquidity
In addition to the capital resources discussed above, our principal source of liquidity is our cash flow generated from operating activities, which provides us with the ability to meet the majority of our short-term funding requirements. The following table summarizes net cash derived from operating, investing, and financing activities for the years ended December 31, 2023 and 2022.
| For the Year Ended December 31 | 2023 | 2022 | |||||||||
| Operating activities | $ | 538.0 | $ | 277.7 | |||||||
| Investing activities | (181.0) | (255.1) | |||||||||
| Financing activities | (432.3) | (83.3) | |||||||||
| Foreign exchange | 3.6 | (25.8) | |||||||||
| Total net cash used in continuing operations | $ | (71.7) | $ | (86.5) | |||||||
| Net cash from discontinued operations | (0.3) | 0.1 | |||||||||
| Net change in cash and cash equivalents | $ | (72.0) | $ | (86.4) | |||||||
Operating Activities
The increase in net cash from operating activities of $260.3 was primarily driven by favorable net working capital impacts primarily due to improved inventory management and timing of accounts receivable collections, higher operating income, and lower incentive-based compensation payments related to the prior year.
Investing Activities
The increase in net cash from investing activities of $74.1 was primarily driven by our acquisition and equity-method investment activity. In 2023, we acquired Micro-Mode for a purchase price of $79.3. In 2022, we acquired Habonim for a purchase price of $139.9 and we purchased a minority investment in CRP Technology Srl and CRP USA LLC for $23.0. In addition, during 2023, we received proceeds of $10.5 from the sale of a product line within our CCT segment and $1.0 from the sale of our Matrix business, while in 2022 we received proceeds of $20.9 from the sale of facilities within our IP segment. Refer to Note 22, Acquisitions, Investments, and Divestitures, and Note 11, Plant, Property and Equipment, Net, for further information.
Financing Activities
The decrease in net cash from financing activities of $349.0 was primarily driven by a higher cash outflows of $525.7 associated with commercial paper borrowings due to timing of repayments. This was partially offset by lower cash outflows of $185.3 related to repurchases of ITT common stock.
Dividends
The amount and timing of dividends payable on our common stock are within the sole discretion of our Board of Directors and will be based on, and affected by, a number of factors, including our financial position and results of operations, available cash, expected capital spending plans, prevailing business conditions, and other factors the Board of Directors deems relevant. Therefore, there can be nowe cannot provide any assurance as to what level of dividends, if any, will be paid in the future. Aggregate dividends paiddeclared in 20172023 were $45.4,$95.9, compared to $44.6$87.7 in 2016 and $42.8 in 2015,2022, reflecting annual per share amounts of $0.512, $0.496,$1.160 and $0.4732,$1.06, respectively. In the first quarter of 2018,2024, we declared a quarterly dividend of $0.134$0.319 per share for shareholders of record on March 12, 2018.8, 2024, which will be paid on April 1, 2024.
On October 30, 2019, the Board of ITT common stock, respectively, at a total cost of $30.0 and $70.0, respectively, throughDirectors approved our current program, an indefinite term $500 open-market share repurchase program. To date, underprogram (the 2019 Plan). All repurchased shares are retired immediately following the programrepurchases. During the Company has repurchased 21.2 shares for $859.4.
| 2017 | 2016 | 2015 | |||||||||
| Operating activities | $ | 247.4 | $ | 240.7 | $ | 229.7 | |||||
| Investing activities | (223.2 | ) | (54.4 | ) | (485.5 | ) | |||||
| Financing activities | (112.5 | ) | (141.9 | ) | 120.4 | ||||||
| Foreign exchange | 19.8 | (11.4 | ) | (31.6 | ) | ||||||
| Total net cash flow (used in) provided by continuing operations | $ | (68.5 | ) | $ | 33.0 | $ | (167.0 | ) | |||
| Net cash (used in) provided by discontinued operations | (2.4 | ) | 12.0 | (1.3 | ) | ||||||
| Net change in cash and cash equivalents | $ | (70.9 | ) | $ | 45.0 | $ | (168.3 | ) | |||
2019 Plan. As of December 31, 2017,2023, there was $78.8 of remaining authorization left under the Company has entered into coverage-in-place agreements and policy buyout agreements representing approximately 42%2019 Plan.
On October 4, 2023, the Board of our recorded asset. Certain of our primary coverage-in-place agreements are exhausted which may result in higher net cash outflows until excess carriersDirectors approved an indefinite term $1,000 open-market share repurchase program (the 2023 Plan). Repurchases under this authorization will begin accepting claims for reimbursement. While there are overall limits onupon the aggregate amount of insurance available to the Company with respect to asbestos claims, with respect to certain coverage, those overall limits were not reached by the estimated liability recorded by the Company at December 31, 2017.
See Note 18, Capital Stock for defense and indemnity, net of tax, averaged $16 over the past three annual periods. Total net asbestos cash outflows also include certain administrative costs such as legal related costs for insurance asset recoveries.more information.
35
Funding of Postretirement Plans
The following table provides a summary of the funded status of our postretirement benefit plans as of December 31, 2017 and 2016.plans.
| 2023 | 2022 | ||||||||||||||||||||||||||||||||||||||||||||||
| As of December 31 | U.S. Pension | Non-U.S. Pension | Other Benefits | Total | U.S. Pension | Non-U.S. Pension | Other Benefits | Total | |||||||||||||||||||||||||||||||||||||||
| Fair value of plan assets | $ | — | $ | 0.4 | $ | — | $ | 0.4 | $ | — | $ | 0.4 | $ | — | $ | 0.4 | |||||||||||||||||||||||||||||||
| Projected benefit obligation | 11.2 | 73.2 | 66.2 | 150.6 | 11.2 | 67.9 | 70.7 | 149.8 | |||||||||||||||||||||||||||||||||||||||
| Funded status | $ | (11.2) | $ | (72.8) | $ | (66.2) | $ | (150.2) | $ | (11.2) | $ | (67.5) | $ | (70.7) | $ | (149.4) | |||||||||||||||||||||||||||||||
| 2017 | 2016 | ||||||||||||||||||||||||||||||
| U.S. Pension | Non-U.S. Pension | Other Benefits | Total | U.S. Pension | Non-U.S. Pension | Other Benefits | Total | ||||||||||||||||||||||||
| Fair value of plan assets | $ | 320.9 | $ | 0.6 | $ | 5.2 | $ | 326.7 | $ | 262.2 | $ | 0.9 | $ | 6.1 | $ | 269.2 | |||||||||||||||
| Projected benefit obligation | 325.7 | 93.3 | 138.1 | 557.1 | 312.3 | 79.9 | 138.8 | 531.0 | |||||||||||||||||||||||
| Funded status | $ | (4.8 | ) | $ | (92.7 | ) | $ | (132.9 | ) | $ | (230.4 | ) | $ | (50.1 | ) | $ | (79.0 | ) | $ | (132.7 | ) | $ | (261.8 | ) | |||||||
Contributions to our U.S. and non-U.S. pension and other postretirement plans were $9.5 and $11.0 during 2017 due2023 and 2022, respectively, which were used to foreign currency impacts.
fund participant benefits. We makecurrently estimate 2024 contributions to our pension and other postretirement benefit plans when considered necessary or advantageous to do so. However, the minimum funding requirements established by local government funding or taxing authorities, or established by other agreements, may influence future contributions. Funding requirements under IRS rules are a major consideration in making contributions to our U.S. pension plans. Future minimum funding requirements will depend primarily on the return on plan assets and discount rate, both determined using AFTAP guidelines. Depending on these factors, and the resulting funded status of our U.S. pension plans, the level of future minimum contributions could be material. During 2017 and 2016, we contributed $38.9 and $12.8 to our global pension plans, respectively. During 2017 and 2016 we made discretionary contributions to our U.S. pension plans of $35.0 and $7.8, respectively. We anticipate making contributions to our global pensionbenefits plans of approximately $5 during 2018.$12.
| 2017 | 2016 | ||||||
| Current portion of long-term debt and capital leases | $ | 1.2 | $ | 0.8 | |||
| Non-current portion of long-term debt and capital leases | 8.3 | 2.0 | |||||
| Total long-term debt and capital leases | $ | 9.5 | $ | 2.8 | |||
Contractual Obligations
The following table summarizes ITT’s commitment to make future payments under long-term contractual obligations was as follows, as of December 31, 2017:2023.
| Payments Due By Period | |||||||||||||||||||||||||||||||||||||||||||||||||||||||||||||||||
| Payments Due By Period | |||||||||||||||||||||||||||||||||||||||||||||||||||||||||||||||||
| Contractual Obligations | Total | Less Than 1 Year | 1-3 Years | 3-5 Years | More Than 5 Years | ||||||||||||||||||||||||||||||||||||||||||||||||||||||||||||
| Long-term debt, including interest and capital leases | $ | 10.1 | $ | 1.4 | $ | 3.2 | $ | 2.5 | $ | 3.0 | |||||||||||||||||||||||||||||||||||||||||||||||||||||||
| Total | Total | 2024 | 2025 to 2026 | 2027 to 2028 | Beyond 2029 | ||||||||||||||||||||||||||||||||||||||||||||||||||||||||||||
| Long-term debt | |||||||||||||||||||||||||||||||||||||||||||||||||||||||||||||||||
| Operating leases | 151.2 | 24.8 | 37.2 | 31.0 | 58.2 | ||||||||||||||||||||||||||||||||||||||||||||||||||||||||||||
Purchase obligations(a) | 105.8 | 85.8 | 15.2 | 4.8 | — | ||||||||||||||||||||||||||||||||||||||||||||||||||||||||||||
Other long-term obligations(b) | 108.3 | 13.0 | 25.0 | 23.9 | 46.4 | ||||||||||||||||||||||||||||||||||||||||||||||||||||||||||||
Postretirement benefit payments(b) | |||||||||||||||||||||||||||||||||||||||||||||||||||||||||||||||||
Other long-term obligations(c) | |||||||||||||||||||||||||||||||||||||||||||||||||||||||||||||||||
| Total | $ | 375.4 | $ | 125.0 | $ | 80.6 | $ | 62.2 | $ | 107.6 | |||||||||||||||||||||||||||||||||||||||||||||||||||||||
In addition to the amounts presented in the table above, we have recorded liabilities for pending asbestos claims and asbestos claims estimated to be filed over the next 10 years and uncertain tax positions of $877.2 and $31.2, respectively,$5.7 in our Consolidated Balance Sheet atas of December 31, 2017. These amounts have2023. This amount has been excluded from the contractual obligations table due to an inability to reasonably estimate the timing of payments in individual years. In addition, while we make contributions
(a)Represents unconditional purchase agreements that are enforceable and legally binding and that specify all significant terms to purchase goods or services, including fixed or minimum quantities to be purchased; fixed, minimum or variable price provisions; and the approximate timing of the transaction. Purchase agreements that are cancellable without penalty have been excluded.
(b)Represents the projected timing of payments for benefits earned to date and the expectation that certain future service will be earned by current active employees for our pension and other employee-related benefit plans. See Note 16, Postretirement Benefit Plans, for additional financial information related to our postretirement benefit plans when considered necessary or advantageousobligations.
(c)Other long-term obligations include amounts recorded in our Consolidated Balance Sheet as of December 31, 2023, including estimated environmental payments and employee compensation agreements. We estimate based on historical experience that we will spend, on average, approximately $6 per year on environmental investigation and remediation. A portion of our environmental investigation and remediation costs are legally mandated through various orders and agreements with state and federal oversight agencies. As of December 31, 2023, our recorded environmental liability was $56.0. See Note 19, Commitments and Contingencies, to do so, the minimum funding requirements established by local government funding or taxing authorities, or established by other agreements, may influence future contributions. As such, expected contributions to our postretirement benefit plans have been excluded from the table above.Consolidated Financial Statements for further information.
36
Off-Balance Sheet Arrangements
Off-balance sheet arrangements represent transactions, agreements or other contractual arrangements with unconsolidated entities, where an obligation or contingent interest exists. Our off-balance sheet arrangements as of December 31, 2017,2023 consist of indemnities related to acquisition and disposition agreements and certain third-party guarantees.
Indemnities
Since our founding in 1920 (pre-spin-offs), we have acquired and disposed of numerous entities.businesses. The related acquisition and disposition agreements allocate certain assets and liabilities among the parties and contain various representation and warranty clauses and may provide indemnities for a misrepresentation or breach of the representations and warranties by either party or for assumed or excluded liabilities. These provisions address a variety of subjects. The term and monetary amounts of each such provision are defined in the specific agreements and may be affected by various conditions and external factors. Many of the provisions have expired either by operation of law or as a result of the terms of the agreement. We do not have a liability recorded for these expired provisions and are not aware of any claims or other information that would give rise to material payments under such provisions.
Guarantees
We have $144.6had $159.4 of guarantees, letters of credit and similar arrangements outstanding atas of December 31, 2017,2023, primarily pertaining to commercial or performance guarantees and insurance matters. We have not recorded any material loss contingencies under these guarantees, letters of credit and similar arrangements as of December 31, 20172023 as the likelihood of nonperformance by the underlying obligors is considered remote. From time to time, we may provide certain third-party guarantees that may be affected by various conditions and external factors, some of which could require that payments be made under such guarantees. We do not consider the maximum exposure or current recorded liabilities under our third-party guarantees to be material either individually or in the aggregate. We do not believe such payments would have a material adverse impact on our financial statements.
KEY PERFORMANCE INDICATORS AND NON-GAAP MEASURES
Management reviews a variety of key performance indicators including revenue, segment operating income and margins, and earnings per share, order growth, adjusted free cash flow, and backlog, some of which are non-GAAP.calculated other than in accordance with accounting principles generally accepted in the United State of America (GAAP). In addition, we consider certain measures to be useful to management and investors when evaluating our operating performance for the periods presented. These measures provide a tool for evaluating our ongoing operations and management of assets from period to period. This information can assist investors in assessing our financial performance and measures our ability to generate capital for deployment among competing strategic alternatives and initiatives, including, but not limited to, acquisitions, dividends, and share repurchases. TheseSome of these metrics, however, are not measures of financial performance under accounting principles generally accepted in the United States of America (GAAP)GAAP and should not be considered a substitute for measures determined in accordance with GAAP. We consider the following non-GAAP measures disclosed in this Annual Report on Form 10-K to be key performance indicators. These measures, which may not be comparable to similarly titled measures reported by other companies, to be key performance indicators:consist of the following:
| Motion Technologies | Industrial Process | Connect & Control Technologies | Eliminations | Total ITT | |||||||||||||||||||||||||
| 2023 Revenue | $ | 1,457.8 | $ | 1,129.6 | $ | 699.4 | $ | (3.8) | $ | 3,283.0 | |||||||||||||||||||
| Acquisitions | — | (15.0) | (15.5) | — | (30.5) | ||||||||||||||||||||||||
| Foreign currency translation | (17.0) | (4.7) | (1.4) | — | (23.1) | ||||||||||||||||||||||||
| 2023 Organic revenue | 1,440.8 | 1,109.9 | 682.5 | (3.8) | 3,229.4 | ||||||||||||||||||||||||
| 2022 Revenue | 1,374.0 | 971.0 | 645.6 | (2.9) | 2,987.7 | ||||||||||||||||||||||||
| Organic revenue growth | $ | 66.8 | $ | 138.9 | $ | 36.9 | $ | (0.9) | $ | 241.7 | |||||||||||||||||||
| Percentage change | 4.9 | % | 14.3 | % | 5.7 | % | 8.1 | % | |||||||||||||||||||||
38
Industrial Process | Motion Technologies | Connect & Control Technologies | Eliminations | Total ITT | |||||||||||||||
| 2017 Revenue | $ | 807.2 | $ | 1,176.0 | $ | 605.6 | $ | (3.5 | ) | $ | 2,585.3 | ||||||||
| (Acquisitions)/divestitures, net | — | (74.0 | ) | — | — | (74.0 | ) | ||||||||||||
| Foreign currency translation | (5.7 | ) | (22.7 | ) | (1.0 | ) | (0.1 | ) | (29.5 | ) | |||||||||
| 2017 Organic revenue | 801.5 | 1,079.3 | 604.6 | (3.6 | ) | 2,481.8 | |||||||||||||
| 2016 Revenue | 830.1 | 983.4 | 596.3 | (4.4 | ) | 2,405.4 | |||||||||||||
| Organic revenue (decline)/growth | $ | (28.6 | ) | $ | 95.9 | $ | 8.3 | $ | 0.8 | $ | 76.4 | ||||||||
| Percentage change | (3.4 | )% | 9.8 | % | 1.4 | % | 3.2 | % | |||||||||||
| 2016 Revenue | $ | 830.1 | $ | 983.4 | $ | 596.3 | $ | (4.4 | ) | $ | 2,405.4 | ||||||||
| (Acquisitions)/divestitures, net | — | (126.4 | ) | (5.4 | ) | — | (131.8 | ) | |||||||||||
| Foreign currency translation | 28.7 | 4.7 | (2.0 | ) | 0.1 | 31.5 | |||||||||||||
| 2016 Organic revenue | 858.8 | 861.7 | 588.9 | (4.3 | ) | 2,305.1 | |||||||||||||
| 2015 Revenue | 1,113.8 | 767.2 | 609.3 | (4.7 | ) | 2,485.6 | |||||||||||||
| Organic revenue (decline)/growth | $ | (255.0 | ) | $ | 94.5 | $ | (20.4 | ) | $ | 0.4 | $ | (180.5 | ) | ||||||
| Percentage change | (22.9 | )% | 12.3 | % | (3.3 | )% | (7.3 | )% | |||||||||||
Industrial Process | Motion Technologies | Connect & Control Technologies | Eliminations | Total ITT | |||||||||||||||
| 2017 Orders | $ | 799.8 | $ | 1,198.8 | $ | 624.1 | $ | (3.3 | ) | $ | 2,619.4 | ||||||||
| (Acquisitions)/divestitures, net | — | (70.2 | ) | — | — | (70.2 | ) | ||||||||||||
| Foreign currency translation | (4.6 | ) | (22.0 | ) | (1.0 | ) | — | (27.6 | ) | ||||||||||
| 2017 Organic orders | 795.2 | 1,106.6 | 623.1 | (3.3 | ) | 2,521.6 | |||||||||||||
| 2016 Orders | 779.1 | 998.4 | 602.4 | (5.1 | ) | 2,374.8 | |||||||||||||
| Organic orders growth | $ | 16.1 | $ | 108.2 | $ | 20.7 | $ | 1.8 | $ | 146.8 | |||||||||
| Percentage change | 2.1 | % | 10.8 | % | 3.4 | % | 6.2 | % | |||||||||||
| 2016 Orders | $ | 779.1 | $ | 998.4 | $ | 602.4 | $ | (5.1 | ) | $ | 2,374.8 | ||||||||
| (Acquisitions)/divestitures, net | — | (126.8 | ) | (8.8 | ) | — | (135.6 | ) | |||||||||||
| Foreign currency translation | 23.6 | 4.5 | (1.7 | ) | 0.1 | 26.5 | |||||||||||||
| 2016 Organic orders | 802.7 | 876.1 | 591.9 | (5.0 | ) | 2,265.7 | |||||||||||||
| 2015 Orders | 936.7 | 780.0 | 618.6 | (4.7 | ) | 2,330.6 | |||||||||||||
| Organic orders (decline)/growth | $ | (134.0 | ) | $ | 96.1 | $ | (26.7 | ) | $ | (0.3 | ) | $ | (64.9 | ) | |||||
| Percentage change | (14.3 | )% | 12.3 | % | (4.3 | )% | (2.8 | )% | |||||||||||
Reconciliations of segment operating income (loss) to adjusted segment operating income (loss) for the years ended December 31, 2017, 20162023 and 20152022 are provided below.
| Year Ended December 31, 2023 | Motion Technologies | Industrial Process | Connect & Control Technologies | Corporate | ITT Inc. | |||||||||||||||||||||||||||||||||
| Operating income (loss) | $ | 230.8 | $ | 243.6 | $ | 107.5 | $ | (53.7) | $ | 528.2 | ||||||||||||||||||||||||||||
Loss on sale of business(a) | — | — | 15.3 | — | 15.3 | |||||||||||||||||||||||||||||||||
| Restructuring costs | 4.0 | 4.6 | 1.3 | — | 9.9 | |||||||||||||||||||||||||||||||||
| Impacts related to Russia-Ukraine war | 1.3 | 1.2 | — | — | 2.5 | |||||||||||||||||||||||||||||||||
| Acquisition- and divestiture-related costs | — | — | 2.4 | — | 2.4 | |||||||||||||||||||||||||||||||||
Other(b) | 0.1 | — | (0.1) | (3.7) | (3.7) | |||||||||||||||||||||||||||||||||
| Adjusted operating income (loss) | $ | 236.2 | $ | 249.4 | $ | 126.4 | $ | (57.4) | $ | 554.6 | ||||||||||||||||||||||||||||
| Operating margin | 15.8 | % | 21.6 | % | 15.4 | % | 16.1 | % | ||||||||||||||||||||||||||||||
| Adjusted operating margin | 16.2 | % | 22.1 | % | 18.1 | % | 16.9 | % | ||||||||||||||||||||||||||||||
| Year Ended December 31, 2022 | ||||||||||||||||||||||||||||||||||||||
| Operating income (loss) | $ | 208.5 | $ | 187.6 | $ | 115.8 | $ | (43.9) | $ | 468.0 | ||||||||||||||||||||||||||||
Gain on sale of long-lived assets(c) | — | (15.5) | — | — | (15.5) | |||||||||||||||||||||||||||||||||
| Impacts related to the Russia-Ukraine war | 3.1 | 4.8 | — | — | 7.9 | |||||||||||||||||||||||||||||||||
| Restructuring costs | 2.7 | 1.3 | — | (0.2) | 3.8 | |||||||||||||||||||||||||||||||||
| Acquisition-related costs | — | 3.2 | — | 0.5 | 3.7 | |||||||||||||||||||||||||||||||||
| Asset impairment charges | — | — | — | 1.7 | 1.7 | |||||||||||||||||||||||||||||||||
Other(d) | 1.3 | 1.2 | — | 1.7 | 4.2 | |||||||||||||||||||||||||||||||||
| Adjusted operating income (loss) | $ | 215.6 | $ | 182.6 | $ | 115.8 | $ | (40.2) | $ | 473.8 | ||||||||||||||||||||||||||||
| Operating margin | 15.2 | % | 19.3 | % | 17.9 | % | 15.7 | % | ||||||||||||||||||||||||||||||
| Adjusted operating margin | 15.7 | % | 18.8 | % | 17.9 | % | 15.9 | % | ||||||||||||||||||||||||||||||
(a)Relates to the sale of our Matrix business in December 2023. See Note 22, Acquisitions, Investments, and Divestitures, to the tables below.Consolidated Financial Statements for further information.
(b)Includes income from a recovery of costs associated with the 2020 lease termination of a legacy site.
(c)2022 includes a gain of $14.7 related to the sale of a former operating facility that was previously held by a business within our IP segment. See Note 11, Plant, Property and Equipment, Net, to the Consolidated Financial Statements for further information.
(d)2022 includes severance charges and accelerated amortization of an intangible asset.
39
| Year Ended December 31, 2017 | Industrial Process | Motion Technologies | Connect & Control Technologies | Total Segment | ||||||||||||
| Segment operating income | $ | 59.5 | $ | 190.0 | $ | 66.7 | $ | 316.2 | ||||||||
| Restructuring costs | 7.4 | 2.3 | 3.3 | 13.0 | ||||||||||||
| Acquisition-related expenses | (2.7 | ) | 6.4 | 0.4 | 4.1 | |||||||||||
Realignment costs and other(a) | 4.8 | — | 9.4 | 14.2 | ||||||||||||
| Adjusted segment operating income | $ | 69.0 | $ | 198.7 | $ | 79.8 | $ | 347.5 | ||||||||
| Year Ended December 31, 2016 | ||||||||||||||||
| Segment operating income | $ | 33.5 | $ | 171.4 | $ | 65.2 | $ | 270.1 | ||||||||
| Restructuring costs | 20.5 | 2.5 | 1.5 | 24.5 | ||||||||||||
| Acquisition-related expenses | — | 4.3 | 1.5 | 5.8 | ||||||||||||
Realignment costs and other(a) | 7.5 | (0.1 | ) | 4.5 | 11.9 | |||||||||||
| Adjusted segment operating income | $ | 61.5 | $ | 178.1 | $ | 72.7 | $ | 312.3 | ||||||||
| Year Ended December 31, 2015 | ||||||||||||||||
| Segment operating income | $ | 141.2 | $ | 126.4 | $ | 54.6 | $ | 322.2 | ||||||||
| Restructuring costs | 12.2 | — | 11.6 | 23.8 | ||||||||||||
| Acquisition-related expenses | (6.7 | ) | 13.1 | 1.4 | 7.8 | |||||||||||
| Realignment costs and other | (0.8 | ) | — | 1.2 | 0.4 | |||||||||||
| Adjusted segment operating income | $ | 145.9 | $ | 139.5 | $ | 68.8 | $ | 354.2 | ||||||||
| 2023 | 2022 | ||||||||||||||||||||||
| Income from Continuing Operations | EPS | Income from Continuing Operations | EPS | ||||||||||||||||||||
| Reported | $ | 411.4 | $ | 4.97 | $ | 368.3 | $ | 4.40 | |||||||||||||||
Loss on sale of business(a) | 15.3 | 0.19 | — | — | |||||||||||||||||||
| Restructuring costs | 9.9 | 0.12 | 3.8 | 0.05 | |||||||||||||||||||
| Impacts from Russia-Ukraine war | 2.5 | 0.03 | 7.9 | 0.09 | |||||||||||||||||||
| Acquisition- and divestiture-related costs | 2.4 | 0.03 | 3.7 | 0.04 | |||||||||||||||||||
Gain on sale of long-lived assets(b) | — | — | (15.5) | (0.19) | |||||||||||||||||||
| Asset impairment charges | — | — | 1.7 | 0.02 | |||||||||||||||||||
Other (benefits) costs(c) | (2.3) | (0.04) | 4.2 | 0.06 | |||||||||||||||||||
Total tax (benefit) expense of adjustments(d) | (6.2) | (0.07) | (0.3) | — | |||||||||||||||||||
Tax-related special items(e) | (2.0) | (0.02) | (2.3) | (0.03) | |||||||||||||||||||
| Adjusted | $ | 431.0 | $ | 5.21 | $ | 371.5 | $ | 4.44 | |||||||||||||||
(a)Relates to the table below.sale of our Matrix business in December 2023. See Note 22, Acquisitions, Investments, and Divestitures, to the Consolidated Financial Statements for further information.
| 2017 | 2016 | 2015 | |||||||||
| Income from continuing operations attributable to ITT Inc. | $ | 115.0 | $ | 181.9 | $ | 312.4 | |||||
Tax-related special items(b) | 116.1 | 5.9 | (37.1 | ) | |||||||
| Asbestos-related benefit, net of tax expense of $7.4, $9.5, and $33.8, respectively | (12.5 | ) | (16.1 | ) | (57.6 | ) | |||||
| Restructuring costs, net of tax benefit of $3.9, $7.1, and $5.5,respectively | 9.2 | 19.2 | 18.5 | ||||||||
Realignment costs, net of tax benefit of $4.2, $2.4, and $0.9, respectively(a) | 7.1 | 4.8 | 1.4 | ||||||||
| Acquisition-related costs, net of tax benefit of $0.8, $2.2, and $5.3, respectively | 3.4 | 3.6 | 2.5 | ||||||||
| Pension curtailment, settlement, or special termination benefit, net of tax benefit of $1.4, $4.7, and $0.0, respectively | 2.3 | 8.0 | — | ||||||||
Other unusual or infrequent items, net of tax of (expense) benefit of $(7.5), $(0.1), and $2.0, respectively(c) | (10.2 | ) | 0.8 | (8.4 | ) | ||||||
| Adjusted income from continuing operations | $ | 230.4 | $ | 208.1 | $ | 231.7 | |||||
| Income from continuing operations attributable to ITT Inc. per diluted share | $ | 1.29 | $ | 2.02 | $ | 3.44 | |||||
| Adjusted income from continuing operations per diluted share | $ | 2.59 | $ | 2.32 | $ | 2.55 | |||||
| 2017 | 2016 | 2015 | |||||||||
| U.S. federal tax law change | $ | 143.9 | $ | — | $ | — | |||||
| Charge on undistributed foreign earnings | (14.7 | ) | 24.7 | (7.4 | ) | ||||||
| Change in uncertain tax positions | (3.6 | ) | (14.5 | ) | (15.1 | ) | |||||
| Excess tax benefit from equity compensation activity | (2.7 | ) | — | — | |||||||
| Change in deferred tax asset valuation allowance | (0.1 | ) | (0.2 | ) | (7.3 | ) | |||||
| Impacts of tax audit closure | 0.4 | 0.1 | (7.0 | ) | |||||||
| Other | (7.1 | ) | (4.2 | ) | (0.3 | ) | |||||
| Net tax-related special items | $ | 116.1 | $ | 5.9 | $ | (37.1 | ) | ||||
(c)2023 primarily includes income of $3.7 from a reversalrecovery of accruedcosts associated with the 2020 lease termination of a legacy site, partially offset by interest expense of $1.4 related to uncertaina tax positions.audit settlement in Italy. 2022 primarily includes severance costs.
(e)2023 tax-related special items netinclude benefits from valuation allowance reversals of tax, for 2015$(16.4), a settlement expense primarily reflect the reversal of accrued interest related to a tax audit in Italy of $14.4, the tax impact on distributions of $7.5, a benefit related to the amendment of our federal tax return of $(4.9), and other of $(2.6). 2022 tax-related special items include a benefit related to a change in deferred tax asset valuation allowance of $(1.2), a benefit related to a change in uncertain tax positions andof $(0.7), a gain from an environmental insurance settlement.
40
| 2017 | 2016 | 2015 | |||||||||
| Net cash - Operating activities | $ | 247.4 | $ | 240.7 | $ | 229.7 | |||||
| Capital expenditures | (113.3 | ) | (111.4 | ) | (86.7 | ) | |||||
| Net asbestos cash flows | 45.3 | 31.5 | 24.6 | ||||||||
| Restructuring cash payments | 17.8 | 30.3 | 24.4 | ||||||||
Other cash payments(a) | 33.4 | 9.4 | 7.6 | ||||||||
| Adjusted free cash flow | $ | 230.6 | $ | 200.5 | $ | 199.6 | |||||
| Adjusted income from continuing operations | 230.4 | 208.1 | 231.7 | ||||||||
| Adjusted free cash flow conversion | 100.1 | % | 96.3 | % | 86.1 | % | |||||
CRITICAL ACCOUNTING ESTIMATES
The preparation of financial statements and related disclosures in accordance with GAAP requires us to make judgments, estimates and assumptions that affect the amounts reported in the financial statements and accompanying notes. Significant accounting policies used in the preparation of the financial statements are discussed in Note 1, "DescriptionDescription of Business, Basis of Presentation and Summary of Significant Accounting Policies", to the Consolidated Financial Statements. An accounting policy is deemed critical if it requires an accounting estimate to be made based on assumptions about matters that are highly uncertain at the time the estimate is made, if different estimates reasonably could have been used, or if changes to the estimate that are reasonably possible could materially affect the financial statements. Senior management has discussed the development, selection and disclosure of these estimates with the Audit Committee of ITT’s Board of Directors.
The accounting estimates and assumptions discussed below are those that we consider most critical to fully understanding our financial statements and evaluating our results as they are inherently uncertain, involve the most subjective or complex judgments, include areas where different estimates reasonably could have been used, and the use of an alternative estimate that is reasonably possible could materially affect the financial statements. We base our estimates on historical experience and other data and assumptions believed to be reasonable under the circumstances, the results of which form the basis for making judgments about the carrying values of assets and liabilities that are not readily apparent from other sources. Management believes that the accounting estimates employed and the resulting balances reported in the Consolidated Financial Statements are reasonable; however, actual results could differ materially from our estimates and assumptions.
Revenue Recognition
Revenue is derived from the sale of products and services to customers. We recognize revenue when persuasive evidenceto depict the transfer of promised goods or services to customers in an arrangement exists,amount that reflects the sales price is fixedconsideration to which we expect to be entitled in exchange for those goods or determinable, collectability is reasonably assured and delivery has occurred.services. For product sales, other than certain long-term construction and production-typeproduction type contracts (referredwhere we have no alternative use for the product and have an enforceable right to as design and build arrangements),payment, we recognize revenue at the time title and risks and rewardscontrol of ownership passour promised goods or services passes to the customer, which is generally when products are shipped and the contractual terms have been fulfilled. Certain contracts with customers require delivery, installation, testing, certification or other acceptance provisions to be satisfied before revenue is recognized. In instances where contractual terms include a provision for customer acceptance, revenue is recognized when either (i) we have previously demonstrated that the product meets the specified criteria based on either seller or customer-specified objective criteria or (ii) on formal acceptance received from the customer where the product has not been previously demonstrated to meet customer-specified objective criteria.
We generally recognize revenue for certain highly customized long-term design and build projects using the percentage-of-completioncost-to-cost method, based upon the percentage of costs incurred to total projected costs. Revenue and profit recognized under the percentage-of-completioncost-to-cost method are based on management’s estimates of measures such as total contract revenues, contract costs and the extent of progress toward completion. Due to the long-term nature of the contracts, these estimates are subject to uncertainties and require significant judgment. Estimates of contract costs include labor hours and rates, and material costs. These estimates consider historical performance, the complexity of the work to be performed, the estimated time to complete the project, and other economic factors such as inflation and market rates. We update our estimates on a periodic basis and any revisions to such estimates are recorded in earnings in the period in which they are determined. Provisions for estimated losses, if any, on uncompleted long-term contracts, are made in the period in which such losses are determined.
Additionally, accruals for estimated expenses related to sales returns and warranties are made at the time products are sold. Reserves for sales returns, rebates and other allowances are established using historical information on the frequency of returns for a particular product and period over which products can be returned. For distributors and resellers, our typical return period is less than 180 days. Future market conditions and product transitions may require us to take actions to increase customer incentive offerings, possibly resulting in a reduction in revenue at the time the incentive is offered.
Warranty accruals are established using historical information on the nature, frequency, and average cost of warranty claims and estimates of future costs. Our standard product warranty terms generally include post-sales support and repairs or replacement of a product at no additional charge for a specified period of time. WhileAlthough we engage in extensive product quality programs and processes, we base our estimated warranty obligation on product warranty terms offered to customers, ongoing product failure rates, materials usage, service delivery costs incurred in correcting
a product failure, as well asand specific product class failures outside of our baseline experience and associated overhead costs. If actual product failure rates, repair rates, or any other post-sales support costs differ from these estimates, revisions to the estimated warranty liability would be required.
41
For certain highly complex contracts, design, engineering, and other preproduction costs may be capitalized if the costs relate directly to a contract or anticipated contract that the entity can specifically identify, the costs generate or enhance resources of the entity that will be used in satisfying performance obligations in the future and the costs are expected to be recovered. In addition to direct labor and materials to fulfill a contract or anticipated contract, we exercise judgment in determining which costs are allocated, including allocations of contract management and depreciation of tooling used to fulfill the contract. Additionally, overall contract profitability is estimated in determining cost recoverability.
Income Taxes
Deferred income tax assets and liabilities are determined based on the estimated future tax effects of differences between the financial reporting and tax bases of assets and liabilities, applying currently enacted tax rates in effect for the year in which we expect the differences will reverse. We periodically assess the likelihood that we will be able to recover our deferred tax assets, and we reflect any changes to our estimate of the amount we are more likely than not to realize as a valuation allowance, with a corresponding adjustment to earnings or other comprehensive income (loss), as appropriate. The ultimate realization of deferred tax assets depends on the generation of future taxable income (including the reversals of deferred tax liabilities) during the periods in which those deferred tax assets will become deductible.
The Company assesses all available positive and negative evidence regarding the realizability of its deferred tax assets. Significant judgment is required in assessing the need for any valuation allowance recorded against deferred tax assets. In assessing the need for a valuation allowance, we consider all available evidence, both positive and negative, including the future reversal of existing taxable temporary differences, taxable income in carryback periods, prudent and feasible tax planning strategies, estimated future taxable income, and whether we have a recent history of losses. The valuation allowance can be affected by changes to tax regulations, interpretations and rulings, changes to enacted statutory tax rates, and changes to future taxable income estimates.
Our effective tax rate reflects the impact of certain undistributed foreign earnings for which we have not provided U.S. taxes because these earnings are considered indefinitely reinvested outside of the U.S. We plan foreign earnings remittance amounts based on projected cash flow needs, as well as the working capital and long-term investment requirements of our foreign subsidiaries and our domestic operations. Based on these assumptions, we estimate the amount we will distribute to the U.S. and accrue U.S. and foreign taxes on these planned foreign remittance amounts. Material changes in our estimates of cash, working capital and long-term investment requirements in the various jurisdictions in which we do business could impact our effective tax rate. Our provision for income taxes could be adversely impacted by changes in our geographic mix of earnings or changes in the enacted tax rates in the jurisdictions in which we conduct our business.
The calculation of our deferred and other tax balances involves significant management judgment when dealing with uncertainties in the application of complex tax regulations and rulings in a multitude of taxing jurisdictions across our global operations. The Company is routinely audited by U.S. federal, state and foreign tax authorities, the results of which could result incause proposed assessments against the Company. We recognize potential liabilities and record tax liabilities for anticipated tax audit issues based on our estimate of whether, and to the extent to which, additional taxes will be due. Furthermore, we recognize the tax benefit from an uncertain tax position only if it is more likely than not that the tax position will be sustained on examination by the taxing authorities, based on the technical merits of the position in consideration of applicable tax statutes and related interpretations and precedents and the expected outcome of the proceedings (or negotiations) with the taxing authorities. Tax benefits recognized in the financial statements from such a position are measured based on the largest benefit that has a greater than 50% likelihood of being realized on ultimate settlement.
We adjust our liability for uncertain tax positions in light of changing facts and circumstances; however, the ultimate resolution of a tax examination may differ from the amounts recorded in the financial statements for a number of reasons, including the Company’s decision to settle rather than litigate a matter, relevant legal precedent related to similar matters, and the Company’s success in supporting its filing positions with the tax authorities. If our estimate of tax liabilities proves different than the ultimate outcome, such differences will affect the provision for income taxes in the period in which such determination is made.
42
Goodwill and Other Intangible Assets
We review goodwill and indefinite-lived intangible assets for impairment annually and whenever events or changes in circumstances indicate the carrying value of an asset may not be recoverable. We also review the carrying value of our finite-lived intangible assets for potential impairment when impairment indicators arise. We conduct our annual impairment tests as of the first day of the fourth quarter. When reviewing for impairment, we may opt to make an initial qualitative evaluation, which considers present events and circumstances, to determine the likelihood of impairment. Our decision to perform a qualitative impairment assessment for an individual reporting unit in a given year is influenced by a number of factors, including the significance of the excess of the reporting unit's estimated fair value over carrying value at the last quantitative assessment date, changes in macroeconomic, industry and reporting-unit specific conditions and the amount of time in between quantitative fair value measurements. If the likelihood of impairment is not considered to be more likely than not, then no further testing is performed.
In cases when we opt not to perform a qualitative evaluation, or the qualitative evaluation indicates that the likelihood of impairment is more likely than not, we then perform a two-stepquantitative impairment test for goodwill. In the first step, weWe test each reporting unit for goodwill impairment quantitatively at a minimum of once every three years. We compare the estimated fair value of each reporting unit to its carrying value. If the estimated fair value of the reporting unit exceeds the carrying value of the net assets assigned to that reporting unit, goodwill is not impaired and we are not required to perform further testing.impaired. If the carrying value of the net assets assigned to the reporting unit exceeds its fair value, then we must perform the second step of the impairment test in order to measure the impairment loss to be recorded, if any. If the carrying value of a reporting unit’s goodwill exceeds its implied fair value, then we record an impairment loss equal to the difference. In our annual impairment test for indefinite-lived intangible assets, we compare the fair value of those assets to their carrying value. We recognize an impairment loss when the estimated fair value of the indefinite-lived intangible asset is less than its carrying value.
We estimate the fair value of our reporting units using an income approach. Under the income approach, we calculate fair value based on the present value of estimated future cash flows. We estimate the fair value of our indefinite-lived intangible assets using the relief from royalty method. The relief from royalty method estimates the portion of a company’s earnings attributable to an intellectual property asset based on an assumed royalty rate that the company would have paid had the asset not been owned.
Determining the fair value of a reporting unit or an indefinite-lived intangible asset is judgmental in nature and involves the use of significant estimates and assumptions, particularly related to future operating results and cash flows. These estimates and assumptions include, but are not limited to, revenue growth rates and operating margins used to calculate projected future cash flows, risk-adjusted discount rates, assumed royalty rates, future economic and market conditions, and the identification of appropriate market comparable data. In addition, the identification of reporting units and the allocation of assets and liabilities to the reporting units when determining the carrying value of each reporting unit also requires judgment. Goodwill is tested for impairment at the reporting unit level, which, based on the applicable accounting guidance, is either the operating segment or one level below (e.g.(e.g., the divisions of our Connect & Control TechnologyCCT segment). The fair value of our reporting units and indefinite-lived intangible assets are based on estimates and assumptions that are believed to be reasonable. Significant changes to these estimates and assumptions could adversely impact our conclusions. Actual future results may differ from those estimates. Further,
Environmental Liabilities
We are subject to various federal, state, local, and foreign environmental laws and regulations that require environmental assessment or remediation efforts. Accruals for environmental exposures are recorded on a site-by-site basis when it is probable that a liability has been incurred and the amount of the liability can be reasonably estimated, based on current law and existing technologies. Significant judgment is required to determine both the likelihood of a loss and the estimated amount of loss. Engineering studies, probability techniques, historical experience, and other factors are used to identify and evaluate remediation alternatives and their related costs in estimating our reserve for environmental liabilities. Our environmental reserve of $73.9$56.0 at December 31, 2017,2023, represents management’s estimate of undiscounted costs expected to be incurred related to environmental assessment or remediation efforts, as well asincluding related legal fees, without regard to potential recoveries from insurance companies or other third parties. Our estimated liability is reduced to reflect the participation of other potentially responsible parties in those instances where it is probable that such parties are legally responsible and financially
43
capable of paying their respective share of the relevant costs and that share can be reasonably estimated. Our environmental accruals are reviewed and adjusted for progress of investigation and remediation efforts and as additional technical or legal information become available, such as the impact of negotiations with regulators and other potentially responsible parties, settlements, rulings, advice of legal counsel, and other current information.
We closely monitor our environmental responsibilities, together with trends in the environmental laws. Environmental remediation reserves are subject to numerous inherent uncertainties that affect our ability to estimate our share of the costs. Such uncertainties involve incomplete information regarding particular sites, andincomplete information regarding other potentially responsible parties, uncertainty regarding the nature and extent of contamination at each site, uncertainties concerning the extent of remediation required under existing regulations, uncertainties concerning our share of any remediation liability, if any, widely varying cost estimates associated with potential alternative remedial approaches, uncertainty with regard to the length of time required to remediate a particular site, uncertainties concerning the potential effects of continuing improvements in remediation technology, and unpredictable nature and timing of changes in environmental standards and regulatory requirements. While environmental laws and regulations are subject to change, the nature of such change is inherently unpredictable and the timing of potential changes is uncertain. The effect of legislative or regulatory changes on environmental standards could be material to the Company’s financial statements. Additionally, violations by us of such laws and regulations, discovery of previously unknown or more extensive contamination, litigation involving environmental impacts, our inability to recover costs associated with any such developments, or financial insolvency of other potentially responsible parties could have a material adverse effect on our financial statements.
Although it is not possible to predict with certainty the ultimate costs of environmental remediation, the reasonably possible high-end range of our estimated environmental liability range at December 31, 20172023 was $126.3.$98.2. See Note 19, Commitments and Contingencies, to the Consolidated Financial Statements for more information.
Recent Accounting Pronouncements
See Note 2, Recent Accounting Pronouncements, in the Notes to the Consolidated Financial Statements for a complete discussion of recent accounting pronouncements.
| ITEM 7A. | QUANTITATIVE AND QUALITATIVE DISCLOSURES ABOUT MARKET RISK | ||||
As a result of our global operating and financing activities, we are exposed to various market risks, including from changes in foreign currency exchange rates, interest rates and commodity prices, which may adversely affect our operating results and financial position. The impact from changes in market conditions is generally minimized through our normal operating and financing activities. However, we may use derivative instruments, primarily forward contracts, interest rate swaps and futures contracts, to manage some of these exposures.risks. We do not use derivative financial instruments for trading or other speculative purposes. To minimize the risk of counterparty non-performance, derivative instruments are entered into with major financial institutions and there is no significant concentration with any one counterparty.
Foreign Currency Exchange Rate ExposuresRisk
Foreign currency risk is the possibility that our financial results could be adversely impacted because of changes in currency exchange rates.Our foreign currency exchange rate risk relates to receipts from customers, payments to suppliers and intercompany transactions denominated in foreign currencies. Our principal currency exposures relate to the Euro,euro, Chinese renminbi, Czech koruna, South Korean won, Polish zloty, British pound, and Mexican pesoSaudi riyal..
Based on a sensitivity analysis, at December 31, 2017, a hypothetical 10% change in the foreign currency exchange rates for the year ended December 31, 20172023 would have resulted in translation impact toimpacted our pre-tax earnings ofby approximately $23, due primarily to the Euro.$38. This calculation assumes that all currencies change in the same direction and proportion relative to the U.S. dollar and that there are no indirect effects, such as changes in non-U.S. dollar sales volumes or prices. This calculationTo mitigate this risk, from time to time, we enter into derivative financial instruments (e.g., forward contracts) with creditworthy counterparties. The aforementioned sensitivity analysis does not take into account the impact of the foreign currency forward exchange contracts discussed above and we did not have any such contracts in place as of December 31, 2017.derivative financial instruments entered into.
Interest Rate ExposuresRisk
Interest rate risk is the possibility that our financial results could be adversely impacted because of changes in interest rates. The Company’s exposure to changes in interest rates relates primarily to the Company’s outstanding debt, which consists primarily of commercial paper. While the Company is exposed to global interest rate fluctuations, it is most affected by fluctuations in U.S. interest rates. Changes in interest rates affect the interest earned on the Company’s cash and cash equivalents, derivative financial instruments and the fair value of those instruments, as well as costs associated with hedging and interest paid on the Company’s outstanding debt.
44
During 2023, central banks around the world raised interest rates to counter inflation. Rising interest rates have increased our cost of debt and may adversely impact customer behavior, including demand for our products. These conditions have contributed to a strengthening of the U.S. dollar relative to foreign currencies, which has resulted in unfavorable foreign currency translation impacts.
As of December 31, 2017,2023, our outstanding variablecommercial paper was $184.9, with a weighted average interest rate debt was $162.4.of 5.61%. We estimate that a hypothetical increase in interest rates of 100 basis points would result in approximately $1 to $2$1.9 of additional annual interest expense based on current borrowing levels.
Commodity Price ExposuresRisk
Commodity price risk is the possibility that our financial results could be adversely impacted because of changes in the prices of commodities used in production. Portions of our business are exposed to volatility in the prices of certain commodities, such as steel, gold, copper, nickel, iron, aluminum, tin, and rubber as well as specialty alloys, including titanium that we purchase in the raw form, or that are used in purchased component parts. The prices of these and other commodities may also be impacted by tariffs. When practical, we attempt to control such costs through fixed-price contracts with suppliers; however, we are prone to exposure as these contracts expire. We evaluate hedging opportunities to mitigate or minimize the risk of operating margin erosion resulting from the volatility of commodity prices.
Since 2020, the cost of raw materials, including commodities such as steel, that we use in our production processes has increased. The rising prices are mainly a result of increased demand fueled by economic recovery from the COVID-19 pandemic as well as lower supply since global production capacity was cut in 2020. In addition, heightened geopolitical tensions during 2023, including as a result of the Russia-Ukraine war, have exacerbated inflationary pressures on commodity prices. The impact of higher commodity prices on our financial results during 2023 was partially mitigated by fixed-price supply contracts with suppliers as well as by pricing actions.
Assuming all other variables remain constant, we estimate that a hypothetical 10% change in steel prices, excluding any impact of purchased component parts, would impact pre-tax earnings by approximately $6$8 to $8.$10. We estimate that a hypothetical 10% change in prices for any other commodity would not be material to our financial statements.
| ITEM 8. | FINANCIAL STATEMENTS AND SUPPLEMENTARY DATA | ||||
See Index to Consolidated Financial Statements herein.
| ITEM 9. | CHANGES IN AND DISAGREEMENTS WITH ACCOUNTANTS ON ACCOUNTING AND FINANCIAL DISCLOSURE | ||||
None.
| ITEM 9A. | CONTROLS AND PROCEDURES | ||||
Attached as exhibits to thethis Annual Report on Form 10-K are certifications of the Company’s Chief Executive Officer (CEO) and Chief Financial Officer (CFO), which are required in accordance with Rule 13a-14 under the Exchange Act, as amended.
(a) Evaluation of Disclosure Controls and Procedures
The Company, with the participation of various levels of management, including the CEO and CFO, conducted an evaluation of effectiveness of the design and operation of our disclosure controls and procedures (as defined in Rules 13a-15(e) and 15d-15(e) of the Exchange Act) as of December 31, 2017.2023. Based on such evaluation, such officers have concluded that, as of the end of the period covered by this report,Annual Report on Form 10-K, the Company’s disclosure controls and procedures are effective.
The Company's Disclosure Committee has the responsibility of considering and evaluating the materiality of information and reviewing disclosure obligations on a timely basis. The Disclosure Committee meets regularly and assists the CEO and the CFO in designing, establishing, reviewing, and evaluating the Company’s disclosure controls and procedures.
(b) Management’s Report on Internal Control Over Financial Reporting
The Company’s management is responsible for establishing and maintaining adequate internal control over financial reporting as defined in Rules 13a-15(f) and 15d-15(f) under the Exchange Act. The Company’s internal control over financial reporting is a process designed to provide reasonable assurance regarding the reliability of financial reporting and the preparation of financial statements for external purposes in accordance with accounting principles generally accepted in the United States of America.
Internal control over financial reporting includes those policies and procedures that (i) pertain to the maintenance of records that, in reasonable detail, completely, accurately and fairly reflect the transactions and dispositions of the Company’s assets; (ii) provide reasonable assurance that transactions are recorded as necessary to permit preparation of the financial statements in accordance with accounting principles generally accepted in the United States of America; (iii) provide reasonable assurance that Company receipts and expenditures are made only in accordance with the authorization of management and the directors of the Company, and (iv) provide reasonable assurance regarding prevention or timely detection of unauthorized acquisition, use, or disposition of assets that could have a material effect on the Consolidated Financial Statements. Internal control over financial reporting includes the controls themselves, monitoring and internal auditing practices, and actions taken to correct any identified deficiencies.
Management assessed the effectiveness of the Company’s internal control over financial reporting as of December 31, 2017.2023. Management based this assessment on criteria for effective internal control over financial reporting described in the 2013 "Internal Control — Integrated Framework" released by the Committee of Sponsoring Organizations (COSO) of the Treadway Commission. Management's assessment included an evaluation of the design of the Company’s internal control over financial reporting and testing of the operational effectiveness of its internal control over financial reporting. Management reviewed the results of its assessment with the Audit Committee of our Board of Directors.
For purposes of evaluating internal controls over financial reporting, management determined that the internal controls of Axtone Railway Components (Axtone),Micro-Mode, which the Company acquired on January 26, 2017,May 2, 2023, would be excluded from the internal control assessment as of December 31, 2017,2023, due to the timing of the closing of the acquisition and as permitted by the rules and regulations of the U.S. Securities and Exchange Commission. For the year ended December 31, 2017, Axtone2023, Micro-Mode constituted 4.2%2.3% of total assets and 3.1%0.5% of total revenues of the Company.
Based on this assessment, management determined that, as of December 31, 2017,2023, the Company maintained effective internal control over financial reporting.
The Company’s management, including the CEO and the CFO, does not expect that our internal controlscontrol over financial reporting, because of inherent limitations, will prevent or detect all errors and all fraud. Also, projections of any evaluation of effectiveness to future periods are subject to the risk that controls may be inadequate because of changes in conditions, or that the degree of compliance with the policies or procedures may deteriorate.
Management’s assessment, included herein, should be read in conjunction with the certifications and the attestation report on the registrant's internal control over financial reporting issued by Deloitte & Touche LLP, an independent registered public accounting firm, as stated in their report, which appears subsequent to Item 9B in this Annual Report on Form 10-K.
46
(c) Changes in Internal Control over Financial Reporting
During the three months ended December 31, 2017,2023, no change occurred in our internal controlscontrol over financial reporting that materially affected, or is reasonably likely to materially affect, our internal controlscontrol over financial reporting.
| ITEM 9B. | OTHER INFORMATION | ||||
Disclosure pursuant to Section 219 of the Iran Threat Reduction & Syria Human Rights Act (ITRA)
This disclosure is made pursuant to Section 219 of the Iran Threat Reduction and Syria Human Rights Act of 2012 which added subsection (r) to Section 13 of the Exchange Act (Section 13(r)). Section 13(r) requires an issuer to disclose in its annual or quarterly reports whether it or any of its affiliates have knowingly engaged in certain activities, transactions or dealings relating to Iran. Disclosure of such activities, transactions or dealings is required even when conducted outside the United States by non-U.S. persons in compliance with applicable law, and whether or not such activities are sanctionable under U.S. law.
In its 2012 Annual Report, ITT described its acquisition of all the shares of Joh. Heinr. Bornemann GmbH (Bornemann) in November 2012, as well as certain activities of Bornemann in Iran and the wind down of those activities in accordance with a General License issued on December 26, 2012 (the General License) by the Office of Foreign Assets Control. As permitted by the General License, on or before March 8, 2013, Bornemann completed the wind-down activities and ceased all activities in Iran. As required to be disclosed by Section 13(r), the gross revenues and operating income to Bornemann from its Iranian activities subsequent to its acquisition by ITT were Euros 2.2€2.2 million and Euros 1.5€1.5 million, respectively. Prior to its acquisition by ITT, Bornemann issued a performance bond to its Iranian customer in the amount of Euros 1.3€1.3 million (the Bond). Bornemann requested that the Bond be canceled prior to March 8, 2013; however, the former customer refused this request and as a result the Bond remains outstanding. Bornemann did not receive gross revenues or operating income, or pay interest, with respect to the Bond in any subsequent periods through December 31, 2017,2023, however, Bornemann did pay annual fees of approximately Euros 11€7 thousand in 2017, 20162023, €7 thousand in 2022 and 2015€10 thousand in 2021, to the German financial institution which is maintaining the Bond.
| ITEM 9C. | DISCLOSURES REGARDING FOREIGN JURISDICTIONS THAT PREVENT INSPECTIONS | ||||
Not applicable.
47
REPORT OF INDEPENDENT REGISTERED PUBLIC ACCOUNTING FIRM
To the Shareholdersshareholders and the Board of Directors of ITT Inc.
Opinion on Internal Control over Financial Reporting
We have audited the internal control over financial reporting of ITT Inc. and subsidiaries (the "Company") as of December 31, 2017,2023, based on criteria established in Internal Control -— Integrated Framework (2013) issued by the Committee of Sponsoring Organizations of the Treadway Commission (COSO). As described in Management’s Report on Internal Control Over Financial Reporting, management excluded from its assessment the internal control over financial reporting at Axtone Railway Components (“Axtone”), which was acquired on January 26, 2017 and whose financial statements constitute 4.2% of total assets and 3.1% of total revenues of the consolidated financial statement amounts as of and for the year ended December 31, 2017. Accordingly, our audit did not include the internal control over financial reporting at Axtone. In our opinion, the Company maintained, in all material respects, effective internal control over financial reporting as of December 31, 2017,2023, based on criteria established in Internal Control -— Integrated Framework (2013) issued by COSO.
We have also audited, in accordance with the standards of the Public Company Accounting Oversight Board (United States) (PCAOB), the consolidated financial statements as of and for the year ended December 31, 2017, and the related notes (collectively referred to as the “financial statements”),2023, of the Company and our report dated February 16, 2018,12, 2024, expressed an unqualified opinion on those financial statements.
As described in Management’s Report on Internal Control Over Financial Reporting, management excluded from its assessment the internal control over financial reporting at Micro-Mode Products, Inc., which was acquired on May 2, 2023, and whose financial statements constitute 2.3% of total assets and 0.5% of total revenues of the consolidated financial statement amounts as of and for the year ended December 31, 2023. Accordingly, our audit did not include the internal control over financial reporting at Micro-Mode Products, Inc.
Basis offor Opinion
The Company’s management is responsible for maintaining effective internal control over financial reporting and for its assessment of the effectiveness of internal control over financial reporting, included in the accompanying Management’s Reportreport on Internal Control Over Financial Reporting. Our responsibility is to express an opinion on the Company’s internal control over financial reporting based on our audit. We are a public accounting firm registered with the PCAOB and are required to be independent with respect to the Company in accordance with the U.S. federal securities laws and the applicable rules and regulations of the Securities and Exchange Commission and the PCAOB.
We conducted our audit in accordance with the standards of the PCAOB. Those standards require that we plan and perform the audit to obtain reasonable assurance about whether effective internal control over financial reporting was maintained in all material respects. Our audit included obtaining an understanding of internal control over financial reporting, assessing the risk that a material weakness exists, testing and evaluating the design and operating effectiveness of internal control based on the assessed risk, and performing such other procedures as we considered necessary in the circumstances. We believe that our audit provides a reasonable basis for our opinion.
Definition and Limitations of Internal Control over Financial Reporting
A company’s internal control over financial reporting is a process designed to provide reasonable assurance regarding the reliability of financial reporting and the preparation of financial statements for external purposes in accordance with generally accepted accounting principles. A company’s internal control over financial reporting includes those policies and procedures that (1) pertain to the maintenance of records that, in reasonable detail, accurately and fairly reflect the transactions and dispositions of the assets of the company; (2) provide reasonable assurance that transactions are recorded as necessary to permit preparation of financial statements in accordance with generally accepted accounting principles, and that receipts and expenditures of the company are being made only in accordance with authorizations of management and directors of the company; and (3) provide reasonable assurance regarding prevention or timely detection of unauthorized acquisition, use, or disposition of the company’s assets that could have a material effect on the financial statements.
Because of its inherent limitations, internal control over financial reporting may not prevent or detect misstatements. Also, projections of any evaluation of effectiveness to future periods are subject to the risk that controls may become inadequate because of changes in conditions, or that the degree of compliance with the policies or procedures may deteriorate.
| /s/ Deloitte & Touche LLP | ||
| Stamford, Connecticut | ||
| February | ||
PART III
| ITEM 10. | DIRECTORS, EXECUTIVE OFFICERS AND CORPORATE GOVERNANCE | ||||
Information required by this Item 10 is incorporated by reference from the information provided under the sections entitled “Information about Voting,” "Proposals"Voting Items," "How to be voted on at the Annual Meeting-Item 1. ElectionVote," "Election of Directors (Proxy Item No. 1)," "Corporate Governance and Related Matters-Board and Committee Membership-Audit Committee," "Section 16(a) Beneficial Ownership Reporting Compliance,"Structure-Overview of Committees-Audit Committee" and "Audit Committee Report" in our Proxy Statement for the 20182024 Annual Meeting of Shareholders (2018(2024 Proxy Statement).
Information required by this Item 10 with respect to executive officers of the Company is contained under the heading "Information About Our Executive Officers of the Company" in Part I of this Annual Report on Form 10-K.
ITT has adopted corporate governance principles and charters for each of its standing committees. The principles address director qualification standards election and selection of an independent presiding director, as well as responsibilities, access to management and independent advisors, compensation, orientation and continuing education, management succession principles and board and committee self-evaluation. The corporate governance principles and charters are available on the Company’s website at www.itt.com/investors.itt.com/investors/governance/.governance. A copy of the corporate governance principles and charters is also available to any shareholder who requests a copy from the Company’s secretary.
ITT has also adopted a written code of ethics, the "Code of Conduct," which is applicable to all directors, employees and officers (including the Company’s principal executive officer, principal financial officer, principal accounting officer or controller, or person performing similar functions). The Company’s Code of Conduct is available on our website at www.itt.com.investors.itt.com/investors/governance. We intend to satisfy the disclosure requirement under Item 5.05 of Form 8-K regarding an amendment to, or waiver from, a provision of our Code of Conduct by posting such information on our website at www.itt.com.
Pursuant to New York Stock Exchange (NYSE) Listing Company Manual Section 303A.12(a), the Company submitted a Section 12(a) CEO Certification to the NYSE in 2017.2023. The Company also filed with the SEC, as exhibits to the Company’s current Annual Report on Form 10-K, the certifications required under Section 302 of the Sarbanes-Oxley Act for its Chief Executive Officer and Chief Financial Officer.
| ITEM 11. | EXECUTIVE COMPENSATION | ||||
Information required by this Item 11 is incorporated by reference to the discussion under the headings "2017"2023 Non-Management Director Compensation," "Compensation Tables," "Compensation Discussion and Analysis," "Compensation and PersonnelHuman Capital Committee Report" and "Corporate Governance and Related Matters-Compensation"Compensation Committee Interlocks and Insider Participation" in our 20182024 Proxy Statement.
| ITEM 12. | SECURITY OWNERSHIP OF CERTAIN BENEFICIAL OWNERS AND MANAGEMENT AND RELATED STOCKHOLDER MATTERS | ||||
Information required by this Item 12 is incorporated by reference to the discussion under the caption "Stock"Other Matters - Stock Ownership of Directors, Executive Officers, and Certain Shareholders" "Section 16(a) Beneficial Ownership Reporting Compliance"Shareholders," and "Equity Compensation Plan Information" in our 20182024 Proxy Statement.
| ITEM 13. | CERTAIN RELATIONSHIPS AND RELATED TRANSACTIONS AND DIRECTOR INDEPENDENCE | ||||
Information required by this item is incorporated by reference to the discussions under the captions "Corporate Governance and Related Matters-PoliciesMatters-Board and Governance Policies-Policies for Approving Related Party Transactions" and "Corporate Governance"Directors’ Qualification and Related Matters-Director Independence,"Selection Process-Director Independence" in our 20182024 Proxy Statement.
| ITEM 14. | PRINCIPAL ACCOUNTING FEES AND SERVICES | ||||
Information about the fees for 20172023 and 20162022 for professional services rendered by our independent registered public accounting firm is incorporated by reference to the discussion under the heading "Proposal 2. Ratification"Ratification of Appointment of the Independent Registered Public Accounting Firm"Firm (Proxy Item No. 2)" of our 20182024 Proxy Statement. Our Audit Committee’s policy on pre-approval of audit and permissible non-audit services of our independent registered public accounting firm is also incorporated by reference to the discussion under the heading "Proposal 2. Ratification"Ratification of Appointment of the Independent Registered Public Accounting Firm"Firm (Proxy Item No. 2)" of our 20182024 Proxy Statement.
PART IV
| ITEM 15. | EXHIBITS AND FINANCIAL STATEMENT SCHEDULES | ||||
1.See Index to Consolidated Financial Statements appearing on page 51 for a list of the financial statements filed as a part of this report.
2.See Exhibit Index on page II-1 for a list of the exhibits filed or incorporated herein as a part of this report.
(b)Financial Statement Schedules are omitted because of the absence of the conditions under which they are required or because the required information is included in the Consolidated Financial Statements filed as part of this report.
| ITEM 16. | FORM 10-K SUMMARY | ||||
Not Applicable.
INDEX TO CONSOLIDATED FINANCIAL STATEMENTS
| ITEM | |||||
| PAGE | |||||
Report of Independent Registered Public Accounting Firm (PCAOB ID No. 34) | |||||
51
REPORT OF INDEPENDENT REGISTERED PUBLIC ACCOUNTING FIRM
To the Shareholdersshareholders and the Board of Directors of ITT Inc.
Opinion on the Financial Statements
We have audited the accompanying consolidated balance sheets of ITT Inc. and subsidiaries (the "Company") as of December 31, 20172023 and 2016,2022, the related consolidated statements of operations, comprehensive income, stockholders'shareholders’ equity, and cash flows, for each of the three years in the period ended December 31, 2017,2023, and the related notes (collectively referred to as the “financial statements”). In our opinion, the financial statements present fairly, in all material respects, the financial position of the Company as of December 31, 20172023 and 2016,2022, and the results of theirits operations and theirits cash flows for each of the three years in the period ended December 31, 2017,2023, in conformity with accounting principles generally accepted in the United States of America.
We have also audited, in accordance with the standards of the Public Company Accounting Oversight Board (United States) (PCAOB), the Company's internal control over financial reporting as of December 31, 2017,2023, based on the criteria established in Internal Control -— Integrated Framework (2013) issued by the Committee of Sponsoring Organizations of the Treadway Commission and our report dated February 16, 2018,12, 2024, expressed an unqualified opinion on the Company's internal control over financial reporting.
Basis for Opinion
These financial statements are the responsibility of the Company’s management. Our responsibility is to express an opinion on the Company’s financial statements based on our audits. We are a public accounting firm registered with the PCAOB and are required to be independent with respect to the Company in accordance with the U.S. federal securities laws and the applicable rules and regulations of the Securities and Exchange Commission and the PCAOB.
We conducted our audits in accordance with the standards of the PCAOB. Those standards require that we plan and perform the audit to obtain reasonable assurance about whether the financial statements are free of material misstatement, whether due to error or fraud. Our audits included performing procedures to assess the risks of material misstatement of the financial statements, whether due to error or fraud, and performing procedures that respond to those risks. Such procedures included examining, on a test basis, evidence regarding the amounts and disclosures in the financial statements. Our audits also included evaluating the accounting principles used and significant estimates made by management, as well as evaluating the overall presentation of the financial statements. We believe that our audits provide a reasonable basis for our opinion.
Critical Audit Matter
The critical audit matter communicated below is a matter arising from the current-period audit of the financial statements that was communicated or required to be communicated to the audit committee and that (1) relates to accounts or disclosures that are material to the financial statements and (2) involved our especially challenging, subjective, or complex judgments. The communication of critical audit matters does not alter in any way our opinion on the financial statements, taken as a whole, and we are not, by communicating the critical audit matter below, providing a separate opinion on the critical audit matter or on the accounts or disclosures to which it relates.
Revenue Recognition – Refer to Note 1 and Note 4 to the Consolidated Financial Statements
Critical Audit Matter Description
The Company recognizes revenue to depict the transfer of promised goods or services to customers in an amount that reflects the consideration to which the Company expects to be entitled in exchange for those goods or services.
Given the Company’s decentralized structure and geographic dispersion of the Company’s business units, auditing revenue recognized at a point in time required significant audit effort for us to identify, test, and evaluate the Company’s revenue recognition.
How the Critical Audit Matter Was Assessed in the Audit
To address this critical audit matter, we performed the following procedures to test revenue recognized at a point in time, among others:
52
•Obtained an understanding of the Company’s geographic composition of revenue and used judgment to determine which business units to perform revenue recognition procedures on.
•Obtained an understanding, evaluated the design, and tested the operating effectiveness of the Company’s relevant controls at certain business units to determine the appropriate revenue recognition.
•Performed site visits of selected business units across various geographies to perform revenue recognition testing and observe the Company's process, products, and arrangements.
•Performed detail transaction testing of revenue recognition at the business units by (1) evaluating the terms of revenue contracts and the appropriateness of management’s determination of revenue recognition; (2) agreeing amounts recorded to source documents to determine the revenue was properly recognized.
•Evaluated the overall sufficiency of audit evidence obtained by assessing the results of procedures performed over revenue recognition.
| /s/ | ||||||||
| Stamford, Connecticut | ||||||||
| February | ||||||||
| We have served as the Company's auditor since 2002. | ||||||||
CONSOLIDATED STATEMENTS OF OPERATIONS
(IN MILLIONS, EXCEPT PER SHARE AMOUNTS) YEARS ENDED DECEMBER 31 | 2017 | 2016 | 2015 | (IN MILLIONS, EXCEPT PER SHARE AMOUNTS) YEARS ENDED DECEMBER 31 | 2023 | 2022 | 2021 | |||||||||||||||||||||||||||
| Revenue | $ | 2,585.3 | $ | 2,405.4 | $ | 2,485.6 | ||||||||||||||||||||||||||||
| Costs of revenue | 1,768.1 | 1,647.2 | 1,676.5 | |||||||||||||||||||||||||||||||
| Gross profit | 817.2 | 758.2 | 809.1 | |||||||||||||||||||||||||||||||
| General and administrative expenses | 264.0 | 274.1 | 258.3 | |||||||||||||||||||||||||||||||
| Sales and marketing expenses | 169.7 | 170.0 | 183.2 | |||||||||||||||||||||||||||||||
| Research and development expenses | 93.7 | 80.8 | 78.9 | |||||||||||||||||||||||||||||||
| Gain on sale of long-lived assets | ||||||||||||||||||||||||||||||||||
| Asbestos-related benefit, net | (19.9 | ) | (25.6 | ) | (91.4 | ) | ||||||||||||||||||||||||||||
| Operating income | 309.7 | 258.9 | 380.1 | |||||||||||||||||||||||||||||||
| Interest and non-operating expenses (income), net | 0.3 | 0.5 | (2.2 | ) | ||||||||||||||||||||||||||||||
| Operating income | ||||||||||||||||||||||||||||||||||
| Operating income | ||||||||||||||||||||||||||||||||||
| Interest expense (income), net | ||||||||||||||||||||||||||||||||||
| Other non-operating income, net | ||||||||||||||||||||||||||||||||||
| Other non-operating income, net | ||||||||||||||||||||||||||||||||||
| Other non-operating income, net | ||||||||||||||||||||||||||||||||||
| Income from continuing operations before income tax | ||||||||||||||||||||||||||||||||||
| Income from continuing operations before income tax | ||||||||||||||||||||||||||||||||||
| Income from continuing operations before income tax | 309.4 | 258.4 | 382.3 | |||||||||||||||||||||||||||||||
| Income tax expense | 194.6 | 76.0 | 70.1 | |||||||||||||||||||||||||||||||
| Income from continuing operations | 114.8 | 182.4 | 312.2 | |||||||||||||||||||||||||||||||
| (Loss) income from discontinued operations, including tax benefit (expense) of $1.9, $(0.3), and $24.5, respectively | (1.5 | ) | 4.2 | 39.4 | ||||||||||||||||||||||||||||||
| (Loss) income from discontinued operations, net of tax benefit of $0.3, $0.4, and $0.2, respectively | ||||||||||||||||||||||||||||||||||
| Net income | 113.3 | 186.6 | 351.6 | |||||||||||||||||||||||||||||||
| Less: (Loss) income attributable to noncontrolling interests | (0.2 | ) | 0.5 | (0.2 | ) | |||||||||||||||||||||||||||||
| Less: Income attributable to noncontrolling interests | ||||||||||||||||||||||||||||||||||
| Net income attributable to ITT Inc. | $ | 113.5 | $ | 186.1 | $ | 351.8 | ||||||||||||||||||||||||||||
| Amounts attributable to ITT Inc.: | ||||||||||||||||||||||||||||||||||
| Amounts attributable to ITT Inc.: | ||||||||||||||||||||||||||||||||||
| Amounts attributable to ITT Inc.: | ||||||||||||||||||||||||||||||||||
| Income from continuing operations, net of tax | ||||||||||||||||||||||||||||||||||
| Income from continuing operations, net of tax | ||||||||||||||||||||||||||||||||||
| Income from continuing operations, net of tax | $ | 115.0 | $ | 181.9 | $ | 312.4 | ||||||||||||||||||||||||||||
| (Loss) income from discontinued operations, net of tax | (1.5 | ) | 4.2 | 39.4 | ||||||||||||||||||||||||||||||
| Net income | $ | 113.5 | $ | 186.1 | $ | 351.8 | ||||||||||||||||||||||||||||
| Earnings (loss) per share attributable to ITT Inc.: | ||||||||||||||||||||||||||||||||||
| Basic earnings per share: | ||||||||||||||||||||||||||||||||||
| Earnings (loss) per share attributable to ITT Inc.: | ||||||||||||||||||||||||||||||||||
| Earnings (loss) per share attributable to ITT Inc.: | ||||||||||||||||||||||||||||||||||
| Basic: | ||||||||||||||||||||||||||||||||||
| Basic: | ||||||||||||||||||||||||||||||||||
| Basic: | ||||||||||||||||||||||||||||||||||
| Continuing operations | ||||||||||||||||||||||||||||||||||
| Continuing operations | ||||||||||||||||||||||||||||||||||
| Continuing operations | $ | 1.30 | $ | 2.04 | $ | 3.48 | ||||||||||||||||||||||||||||
| Discontinued operations | (0.01 | ) | 0.05 | 0.44 | ||||||||||||||||||||||||||||||
| Net income | $ | 1.29 | $ | 2.09 | $ | 3.92 | ||||||||||||||||||||||||||||
| Diluted earnings per share: | ||||||||||||||||||||||||||||||||||
| Diluted: | ||||||||||||||||||||||||||||||||||
| Continuing operations | ||||||||||||||||||||||||||||||||||
| Continuing operations | ||||||||||||||||||||||||||||||||||
| Continuing operations | $ | 1.29 | $ | 2.02 | $ | 3.44 | ||||||||||||||||||||||||||||
| Discontinued operations | (0.01 | ) | 0.05 | 0.44 | ||||||||||||||||||||||||||||||
| Net income | $ | 1.28 | $ | 2.07 | $ | 3.88 | ||||||||||||||||||||||||||||
| Weighted average common shares – basic | 88.3 | 89.2 | 89.8 | |||||||||||||||||||||||||||||||
| Weighted average common shares – diluted | 89.0 | 89.9 | 90.7 | |||||||||||||||||||||||||||||||
| Cash dividends declared per common share | $ | 0.512 | $ | 0.496 | $ | 0.4732 | ||||||||||||||||||||||||||||
The accompanying Notes to the Consolidated Financial Statements are an integral part of the above statementsConsolidated Statements of operations.Operations.
CONSOLIDATED STATEMENTS OF COMPREHENSIVE INCOME
(IN MILLIONS) YEARS ENDED DECEMBER 31 | 2017 | 2016 | 2015 | ||||||||
| Net income | $ | 113.3 | $ | 186.6 | $ | 351.6 | |||||
| Other comprehensive income (loss): | |||||||||||
| Net foreign currency translation adjustment | 95.4 | (35.9 | ) | (93.4 | ) | ||||||
| Net change in postretirement benefit plans, net of tax impacts of $(5.5), $(6.9), and $9.8, respectively | 7.6 | 8.5 | (9.5 | ) | |||||||
| Net change investment securities, net of tax impacts of $0.0, $0.1, and $0.0, respectively | — | 0.2 | — | ||||||||
| Other comprehensive income (loss) | 103.0 | (27.2 | ) | (102.9 | ) | ||||||
| Comprehensive income | 216.3 | 159.4 | 248.7 | ||||||||
| Less: Comprehensive (loss) income attributable to noncontrolling interests | (0.2 | ) | 0.5 | (0.2 | ) | ||||||
| Comprehensive income attributable to ITT Inc. | $ | 216.5 | $ | 158.9 | $ | 248.9 | |||||
| Disclosure of reclassification adjustments and other adjustments to postretirement benefit plans (See Note 15) | |||||||||||
| Reclassification adjustments: | |||||||||||
| Amortization of prior service benefit, net of tax expense of $1.8, $2.1, and $3.8, respectively | (3.0 | ) | (3.5 | ) | (6.2 | ) | |||||
| Amortization of net actuarial loss, net of tax benefit of $(4.1), $(4.4), and $(4.5), respectively | 7.9 | 8.0 | 8.6 | ||||||||
| Loss (gain) on plan curtailment, net of tax (benefit) expense of $(1.4), $0.0, and $1.6, respectively | 2.3 | — | (2.6 | ) | |||||||
| Loss on plan settlement, net of tax benefit of $0.0, $(4.7), and $0.0, respectively | — | 8.0 | — | ||||||||
| Other adjustments: | |||||||||||
| Prior service cost, net of tax benefit of $0.8, $0.0, and $0.7, respectively | (1.3 | ) | (0.4 | ) | (1.3 | ) | |||||
| Net actuarial gain (loss), net of tax (expense) benefit of $(2.6), $0.1, and $8.2, respectively | 4.6 | (4.1 | ) | (10.5 | ) | ||||||
| Unrealized change from foreign currency translation | (2.9 | ) | 0.5 | 2.5 | |||||||
| Net change in postretirement benefit plans, net of tax | 7.6 | 8.5 | (9.5 | ) | |||||||
| Disclosure of reclassification adjustments to investment securities | |||||||||||
| Realized loss on investing securities, net of tax benefit of $0.0, $0.1, and $0.0, respectively | — | 0.2 | — | ||||||||
| (IN MILLIONS) YEARS ENDED DECEMBER 31 | 2023 | 2022 | 2021 | ||||||||||||||
| Net income | $ | 413.8 | $ | 369.4 | $ | 321.0 | |||||||||||
| Other comprehensive income (loss): | |||||||||||||||||
| Net foreign currency translation adjustment | 17.6 | (67.4) | (57.0) | ||||||||||||||
| Net change in postretirement benefit plans, net of tax impacts of $1.7, $(7.6), and $(1.5), respectively | (5.2) | 44.4 | 15.1 | ||||||||||||||
| Other comprehensive (loss) income | 12.4 | (23.0) | (41.9) | ||||||||||||||
| Comprehensive income | 426.2 | 346.4 | 279.1 | ||||||||||||||
| Less: Comprehensive income attributable to noncontrolling interests | 3.3 | 2.4 | 4.7 | ||||||||||||||
| Comprehensive income attributable to ITT Inc. | $ | 422.9 | $ | 344.0 | $ | 274.4 | |||||||||||
Disclosure of reclassification adjustments and other adjustments to postretirement benefit plans (See Note 16) | |||||||||||||||||
| Reclassification adjustments: | |||||||||||||||||
| Amortization of prior service benefit, net of tax expense of $1.4, $1.3, and $1.2, respectively | $ | (4.6) | $ | (4.2) | $ | (3.9) | |||||||||||
| Amortization of net actuarial loss, net of tax benefit of $—, $(0.5), and $(0.7), respectively | 0.1 | 2.6 | 3.7 | ||||||||||||||
| Other adjustments: | |||||||||||||||||
| Prior service cost, net of tax expense of $—, $(1.9), and $—, respectively | — | 6.2 | — | ||||||||||||||
| Net actuarial (loss) gain, net of tax benefit (expense) of $0.3, $(6.5), and $(2.0), respectively | (0.5) | 38.1 | 12.6 | ||||||||||||||
| Unrealized change from foreign currency translation | (0.2) | 1.7 | 2.7 | ||||||||||||||
| Net change in postretirement benefit plans, net of tax | $ | (5.2) | $ | 44.4 | $ | 15.1 | |||||||||||
The accompanying Notes to Consolidated Financial Statements are an integral part of the statements of comprehensive income.
(IN MILLIONS, EXCEPT PER SHARE AMOUNTS) DECEMBER 31 | 2017 | 2016 | |||||
| Assets | |||||||
| Current assets: | |||||||
| Cash and cash equivalents | $ | 389.8 | $ | 460.7 | |||
| Receivables, net | 629.6 | 523.9 | |||||
| Inventories, net | 311.9 | 295.2 | |||||
| Other current assets | 147.4 | 122.0 | |||||
| Total current assets | 1,478.7 | 1,401.8 | |||||
| Plant, property and equipment, net | 521.7 | 464.5 | |||||
| Goodwill | 886.8 | 774.7 | |||||
| Other intangible assets, net | 156.2 | 160.3 | |||||
| Asbestos-related assets | 304.0 | 314.6 | |||||
| Deferred income taxes | 149.9 | 297.4 | |||||
| Other non-current assets | 202.9 | 188.4 | |||||
| Total non-current assets | 2,221.5 | 2,199.9 | |||||
| Total assets | $ | 3,700.2 | $ | 3,601.7 | |||
| Liabilities and Shareholders’ Equity | |||||||
| Current liabilities: | |||||||
| Short-term loans and current maturities of long-term debt | $ | 163.6 | $ | 214.3 | |||
| Accounts payable | 351.4 | 301.7 | |||||
| Accrued liabilities | 384.4 | 350.2 | |||||
| Total current liabilities | 899.4 | 866.2 | |||||
| Asbestos-related liabilities | 800.1 | 877.5 | |||||
| Postretirement benefits | 227.3 | 248.6 | |||||
| Other non-current liabilities | 175.6 | 181.0 | |||||
| Total non-current liabilities | 1,203.0 | 1,307.1 | |||||
| Total liabilities | 2,102.4 | 2,173.3 | |||||
| Shareholders’ equity: | |||||||
| Common stock: | |||||||
| Authorized – 250.0 shares, $1 par value per share | |||||||
| Issued and Outstanding – 88.2 and 88.4 shares, respectively | 88.2 | 88.4 | |||||
| Retained earnings | 1,856.1 | 1,789.2 | |||||
| Accumulated other comprehensive loss: | |||||||
| Postretirement benefit plans | (137.6 | ) | (145.2 | ) | |||
| Cumulative translation adjustments | (210.6 | ) | (306.0 | ) | |||
| Total ITT Inc. shareholders' equity | 1,596.1 | 1,426.4 | |||||
| Noncontrolling interests | 1.7 | 2.0 | |||||
| Total shareholders’ equity | 1,597.8 | 1,428.4 | |||||
| Total liabilities and shareholders’ equity | $ | 3,700.2 | $ | 3,601.7 | |||
55
CONSOLIDATED STATEMENTS OF CASH FLOWSBALANCE SHEETS
(IN MILLIONS) YEARS ENDED DECEMBER 31 | 2017 | 2016 | 2015 | ||||||||
| Operating Activities | |||||||||||
| Net income | $ | 113.3 | $ | 186.6 | $ | 351.6 | |||||
| Less: (Loss) income from discontinued operations | (1.5 | ) | 4.2 | 39.4 | |||||||
| Less: (Loss) income attributable to noncontrolling interests | (0.2 | ) | 0.5 | (0.2 | ) | ||||||
| Income from continuing operations attributable to ITT Inc. | 115.0 | 181.9 | 312.4 | ||||||||
| Adjustments to income from continuing operations | |||||||||||
| Depreciation and amortization | 105.3 | 102.0 | 90.0 | ||||||||
| Equity-based compensation | 18.1 | 12.6 | 15.7 | ||||||||
| Asbestos-related benefit, net | (19.9 | ) | (25.6 | ) | (91.4 | ) | |||||
| Deferred income taxes | 147.0 | 20.9 | 25.6 | ||||||||
| Asbestos-related payments, net | (45.3 | ) | (31.5 | ) | (24.6 | ) | |||||
| Contributions to postretirement plans | (45.0 | ) | (19.0 | ) | (18.6 | ) | |||||
| Changes in assets and liabilities: | |||||||||||
| Change in receivables | (59.3 | ) | 22.5 | (72.0 | ) | ||||||
| Change in inventories | 14.2 | (7.2 | ) | 31.5 | |||||||
| Change in accounts payable | 16.8 | 0.7 | 11.0 | ||||||||
| Change in accrued expenses | 17.2 | (27.4 | ) | (45.8 | ) | ||||||
| Change in accrued income taxes | (14.8 | ) | (5.7 | ) | (7.4 | ) | |||||
| Other, net | (1.9 | ) | 16.5 | 3.3 | |||||||
| Net Cash – Operating activities | 247.4 | 240.7 | 229.7 | ||||||||
| Investing Activities | |||||||||||
| Capital expenditures | (113.3 | ) | (111.4 | ) | (86.7 | ) | |||||
| Acquisitions, net of cash acquired | (113.7 | ) | (8.8 | ) | (351.0 | ) | |||||
| Purchases of investments | — | (60.6 | ) | (140.1 | ) | ||||||
| Maturities of investments | — | 123.5 | 78.5 | ||||||||
| Proceeds from sale of businesses and other assets | 3.8 | 3.0 | 9.5 | ||||||||
| Proceeds from insurance recovery | — | — | 4.2 | ||||||||
| Other, net | — | (0.1 | ) | 0.1 | |||||||
| Net Cash – Investing activities | (223.2 | ) | (54.4 | ) | (485.5 | ) | |||||
| Financing Activities | |||||||||||
| Commercial paper, net borrowings | 48.9 | 19.0 | 94.5 | ||||||||
| Short-term revolving loans, borrowings | 77.3 | 27.7 | 200.0 | ||||||||
| Short-term revolving loans, repayments | (177.3 | ) | (78.3 | ) | (50.0 | ) | |||||
| Long-term debt issued | 7.0 | — | — | ||||||||
| Long-term debt, repaid | (1.3 | ) | (1.1 | ) | (3.6 | ) | |||||
| Repurchase of common stock | (32.9 | ) | (77.8 | ) | (84.0 | ) | |||||
| Dividends paid | (45.4 | ) | (44.6 | ) | (42.8 | ) | |||||
| Proceeds from issuance of common stock | 11.2 | 12.3 | 6.2 | ||||||||
| Excess tax benefit from equity compensation activity | — | 3.2 | 3.4 | ||||||||
| Other, net | — | (2.3 | ) | (3.3 | ) | ||||||
| Net Cash – Financing activities | (112.5 | ) | (141.9 | ) | 120.4 | ||||||
| Exchange rate effects on cash and cash equivalents | 19.8 | (11.4 | ) | (31.6 | ) | ||||||
| Net cash from discontinued operations – operating activities | (2.4 | ) | 12.0 | (1.3 | ) | ||||||
| Net change in cash and cash equivalents | (70.9 | ) | 45.0 | (168.3 | ) | ||||||
| Cash and cash equivalents – beginning of year | 460.7 | 415.7 | 584.0 | ||||||||
| Cash and Cash Equivalents – End of Period | $ | 389.8 | $ | 460.7 | $ | 415.7 | |||||
| Supplemental Cash Flow Disclosures | |||||||||||
| Cash paid (received) during the year for: | |||||||||||
| Interest | $ | 3.8 | $ | 4.5 | $ | 4.3 | |||||
| Income taxes, net of refunds received | 62.0 | 56.1 | 48.5 | ||||||||
| (IN MILLIONS, EXCEPT PER SHARE AMOUNTS) DECEMBER 31 | 2023 | 2022 | |||||||||
| Assets | |||||||||||
| Current assets: | |||||||||||
| Cash and cash equivalents | $ | 489.2 | $ | 561.2 | |||||||
| Receivables, net | 675.2 | 628.8 | |||||||||
| Inventories | 575.4 | 533.9 | |||||||||
| Other current assets | 117.9 | 112.9 | |||||||||
| Total current assets | 1,857.7 | 1,836.8 | |||||||||
| Non-current assets: | |||||||||||
| Plant, property and equipment, net | 561.0 | 526.8 | |||||||||
| Goodwill | 1,016.3 | 964.8 | |||||||||
| Other intangible assets, net | 116.6 | 112.8 | |||||||||
| Other non-current assets | 381.0 | 339.1 | |||||||||
| Total non-current assets | 2,074.9 | 1,943.5 | |||||||||
| Total assets | $ | 3,932.6 | $ | 3,780.3 | |||||||
| Liabilities and Shareholders’ Equity | |||||||||||
| Current liabilities: | |||||||||||
| Short-term borrowings | $ | 187.7 | $ | 451.0 | |||||||
| Accounts payable | 437.0 | 401.1 | |||||||||
| Accrued and other current liabilities | 413.1 | 333.4 | |||||||||
| Total current liabilities | 1,037.8 | 1,185.5 | |||||||||
| Non-current liabilities: | |||||||||||
| Postretirement benefits | 138.7 | 137.2 | |||||||||
| Other non-current liabilities | 217.0 | 200.2 | |||||||||
| Total non-current liabilities | 355.7 | 337.4 | |||||||||
| Total liabilities | 1,393.5 | 1,522.9 | |||||||||
| Shareholders’ equity: | |||||||||||
| Common stock: | |||||||||||
| Authorized – 250.0 shares, $1 par value per share | |||||||||||
| Issued and Outstanding – 82.1 and 82.7 shares, respectively | 82.1 | 82.7 | |||||||||
| Retained earnings | 2,778.0 | 2,509.7 | |||||||||
| Accumulated other comprehensive loss: | |||||||||||
| Postretirement benefits | (1.6) | 3.6 | |||||||||
| Cumulative translation adjustments | (330.3) | (347.9) | |||||||||
| Total accumulated other comprehensive loss | (331.9) | (344.3) | |||||||||
| Total ITT Inc. shareholders' equity | 2,528.2 | 2,248.1 | |||||||||
| Noncontrolling interests | 10.9 | 9.3 | |||||||||
| Total shareholders’ equity | 2,539.1 | 2,257.4 | |||||||||
| Total liabilities and shareholders’ equity | $ | 3,932.6 | $ | 3,780.3 | |||||||
The accompanying Notes to the Consolidated Financial Statements are an integral part of the above statements of cash flows.Consolidated Balance Sheets.
56
CONSOLIDATED STATEMENTS OF CHANGES IN SHAREHOLDERS’ EQUITYCASH FLOWS
| (IN MILLIONS) | SHARES | DOLLARS | ||||||||||||||||||
| YEARS ENDED DECEMBER 31 | 2017 | 2016 | 2015 | 2017 | 2016 | 2015 | ||||||||||||||
| Common Stock | ||||||||||||||||||||
| Common stock, beginning balance | 88.4 | 89.5 | 91.0 | $ | 88.4 | $ | 89.5 | $ | 91.0 | |||||||||||
| Activity from stock incentive plans | 0.7 | 1.1 | 0.6 | 0.7 | 1.1 | 0.6 | ||||||||||||||
| Share repurchases | (0.9 | ) | (2.2 | ) | (2.1 | ) | (0.9 | ) | (2.2 | ) | (2.1 | ) | ||||||||
| Common stock, ending balance | 88.2 | 88.4 | 89.5 | $ | 88.2 | $ | 88.4 | $ | 89.5 | |||||||||||
| Retained Earnings | ||||||||||||||||||||
| Retained earnings, beginning balance | $ | 1,789.2 | $ | 1,696.7 | $ | 1,445.1 | ||||||||||||||
| Cumulative adjustment for accounting change (See Note 2) | 1.0 | — | — | |||||||||||||||||
| Net income attributable to ITT Inc. | 113.5 | 186.1 | 351.8 | |||||||||||||||||
| Dividends declared | (45.5 | ) | (44.6 | ) | (42.8 | ) | ||||||||||||||
| Activity from stock incentive plans | 29.9 | 27.0 | 24.5 | |||||||||||||||||
| Share repurchases | (32.0 | ) | (75.6 | ) | (81.9 | ) | ||||||||||||||
| Purchase of noncontrolling interest | — | (0.4 | ) | — | ||||||||||||||||
| Retained earnings, ending balance | $ | 1,856.1 | $ | 1,789.2 | $ | 1,696.7 | ||||||||||||||
| Accumulated Other Comprehensive Loss | ||||||||||||||||||||
| Postretirement benefit plans, beginning balance | $ | (145.2 | ) | $ | (153.7 | ) | $ | (144.2 | ) | |||||||||||
| Net change in postretirement benefit plans | 7.6 | 8.5 | (9.5 | ) | ||||||||||||||||
| Postretirement benefit plans, ending balance | $ | (137.6 | ) | $ | (145.2 | ) | $ | (153.7 | ) | |||||||||||
| Cumulative translation adjustment, beginning balance | $ | (306.0 | ) | $ | (270.1 | ) | $ | (176.7 | ) | |||||||||||
| Net cumulative translation adjustment | 95.4 | (35.9 | ) | (93.4 | ) | |||||||||||||||
| Cumulative translation adjustments, ending balance | $ | (210.6 | ) | $ | (306.0 | ) | $ | (270.1 | ) | |||||||||||
| Unrealized (loss) gain on investment securities, beginning balance | $ | — | $ | (0.3 | ) | $ | (0.3 | ) | ||||||||||||
| Net change in investment securities | — | 0.3 | — | |||||||||||||||||
| Unrealized (loss) gain on investment securities, ending balance | $ | — | $ | — | $ | (0.3 | ) | |||||||||||||
| Total accumulated other comprehensive loss | $ | (348.2 | ) | $ | (451.2 | ) | $ | (424.1 | ) | |||||||||||
| Noncontrolling Interests | ||||||||||||||||||||
| Noncontrolling interests, beginning balance | $ | 2.0 | $ | 3.3 | $ | 5.4 | ||||||||||||||
| Income (loss) attributable to noncontrolling interests | (0.2 | ) | (0.2 | ) | ||||||||||||||||
| Dividend to noncontrolling interest shareholders | — | (1.9 | ) | (3.3 | ) | |||||||||||||||
| Noncontrolling interest acquired | — | — | 1.4 | |||||||||||||||||
| Other | (0.1 | ) | 0.1 | — | ||||||||||||||||
| Noncontrolling interests, ending balance | $ | 1.7 | $ | 2.0 | $ | 3.3 | ||||||||||||||
| Total Shareholders’ Equity | ||||||||||||||||||||
| Total shareholders’ equity, beginning balance | $ | 1,428.4 | $ | 1,365.4 | $ | 1,220.3 | ||||||||||||||
| Net change in common stock | (0.2 | ) | (1.1 | ) | (1.5 | ) | ||||||||||||||
| Net change in retained earnings | 66.9 | 92.5 | 251.6 | |||||||||||||||||
| Net change in accumulated other comprehensive loss | 103.0 | (27.1 | ) | (102.9 | ) | |||||||||||||||
| Net change in noncontrolling interests | (0.3 | ) | (1.3 | ) | (2.1 | ) | ||||||||||||||
| Total shareholders’ equity, ending balance | $ | 1,597.8 | $ | 1,428.4 | $ | 1,365.4 | ||||||||||||||
| (IN MILLIONS) YEARS ENDED DECEMBER 31 | 2023 | 2022 | 2021 | ||||||||||||||
| Operating Activities | |||||||||||||||||
| Income from continuing operations attributable to ITT Inc. | $ | 411.4 | $ | 368.3 | $ | 314.8 | |||||||||||
| Adjustments to income from continuing operations: | |||||||||||||||||
| Depreciation and amortization | 109.2 | 107.4 | 113.1 | ||||||||||||||
| Equity-based compensation | 20.2 | 18.1 | 16.5 | ||||||||||||||
| Asbestos-related (benefit) costs, net | — | — | (74.4) | ||||||||||||||
| Deferred income tax expense (benefit) | (27.6) | 2.9 | 115.7 | ||||||||||||||
| Gain on sale of long-lived assets | (0.1) | (16.3) | (7.0) | ||||||||||||||
| Other non-cash charges, net | 37.1 | 29.3 | 28.3 | ||||||||||||||
| Contribution to divest asbestos-related assets and liabilities | — | — | (398.0) | ||||||||||||||
| Changes in assets and liabilities: | |||||||||||||||||
| Change in receivables | (39.2) | (90.7) | (62.2) | ||||||||||||||
| Change in inventories | (34.4) | (99.5) | (82.7) | ||||||||||||||
| Change in contract assets | (0.3) | (7.4) | (2.5) | ||||||||||||||
| Change in contract liabilities | 23.1 | 23.3 | (3.6) | ||||||||||||||
| Change in accounts payable | 26.3 | 39.4 | 77.6 | ||||||||||||||
| Change in accrued expenses | 47.6 | (36.9) | 15.8 | ||||||||||||||
| Change in income taxes | 5.4 | (13.5) | 8.2 | ||||||||||||||
| Other, net | (40.7) | (46.7) | (68.0) | ||||||||||||||
| Net Cash – Operating activities | 538.0 | 277.7 | (8.4) | ||||||||||||||
| Investing Activities | |||||||||||||||||
| Capital expenditures | (107.6) | (103.9) | (88.4) | ||||||||||||||
| Proceeds from sale of business | 11.5 | — | — | ||||||||||||||
| Proceeds from sale of long-lived assets | 0.9 | 20.9 | 8.0 | ||||||||||||||
| Acquisitions, net of cash acquired | (79.3) | (146.9) | — | ||||||||||||||
| Payments to acquire interest in unconsolidated subsidiaries | (2.5) | (25.6) | (1.9) | ||||||||||||||
| Other, net | (4.0) | 0.4 | — | ||||||||||||||
| Net Cash – Investing activities | (181.0) | (255.1) | (82.3) | ||||||||||||||
| Financing Activities | |||||||||||||||||
| (Repayments of)/Proceeds from commercial paper, net | (266.0) | 259.7 | 95.4 | ||||||||||||||
| Long-term debt, repayments | (2.2) | (2.1) | (2.4) | ||||||||||||||
| Share repurchases under repurchase plan | (60.0) | (245.3) | (104.8) | ||||||||||||||
| Payments for taxes related to net share settlement of stock incentive plans | (7.2) | (8.8) | (11.7) | ||||||||||||||
| Dividends paid | (95.8) | (87.9) | (75.8) | ||||||||||||||
| Other, net | (1.1) | 1.1 | (0.5) | ||||||||||||||
| Net Cash – Financing activities | (432.3) | (83.3) | (99.8) | ||||||||||||||
| Exchange rate effects on cash and cash equivalents | 3.6 | (25.8) | (22.6) | ||||||||||||||
| Net cash from discontinued operations – operating activities | (0.3) | 0.1 | 0.8 | ||||||||||||||
| Net change in cash and cash equivalents | (72.0) | (86.4) | (212.3) | ||||||||||||||
| Cash and cash equivalents – beginning of year (includes restricted cash of $0.7, $0.8, and $0.8, respectively) | 561.9 | 648.3 | 860.6 | ||||||||||||||
| Cash and Cash Equivalents – end of year (includes restricted cash of $0.7, $0.7, and $0.8, respectively) | $ | 489.9 | $ | 561.9 | $ | 648.3 | |||||||||||
| Supplemental Disclosures of Cash Flow and Non-Cash Information: | |||||||||||||||||
| Cash paid for Interest | $ | 15.7 | $ | 10.8 | $ | 3.3 | |||||||||||
| Cash paid for Income taxes, net of refunds received | $ | 113.1 | $ | 92.7 | $ | 61.3 | |||||||||||
| Capital expenditures included in accounts payable | $ | 25.3 | $ | 21.8 | $ | 17.5 | |||||||||||
The accompanying Notes to the Consolidated Financial Statements are an integral part of the above statementsConsolidated Statements of changesCash Flows.
57
CONSOLIDATED STATEMENTS OF CHANGES IN SHAREHOLDERS’ EQUITY
| (IN MILLIONS, EXCEPT SHARE AMOUNTS) | Common Stock | Retained Earnings | Accumulated Other Comprehensive Loss | Noncontrolling Interest | Total Shareholders' Equity | ||||||||||||||||||||||||||||||
| (Shares) | (Dollars) | ||||||||||||||||||||||||||||||||||
| December 31, 2020 | 86.5 | $ | 86.5 | $ | 2,319.3 | $ | (279.4) | $ | 1.5 | $ | 2,127.9 | ||||||||||||||||||||||||
| Net income | — | — | 316.3 | — | 4.7 | 321.0 | |||||||||||||||||||||||||||||
| Activity from stock incentive plans | 0.3 | 0.3 | 17.4 | — | — | 17.7 | |||||||||||||||||||||||||||||
| Share repurchases | (1.2) | (1.2) | (103.6) | — | — | (104.8) | |||||||||||||||||||||||||||||
| Shares withheld related to net share settlement of stock incentive plans | (0.1) | (0.1) | (11.6) | — | — | (11.7) | |||||||||||||||||||||||||||||
| Dividends declared ($0.88 per share) | — | — | (76.2) | — | — | (76.2) | |||||||||||||||||||||||||||||
| Dividend to noncontrolling interest | — | — | — | — | (1.4) | (1.4) | |||||||||||||||||||||||||||||
| Net change in postretirement benefit plans, net of tax | — | — | — | 15.1 | — | 15.1 | |||||||||||||||||||||||||||||
| Net foreign currency translation adjustment | — | — | — | (57.0) | — | (57.0) | |||||||||||||||||||||||||||||
| Other | — | — | — | — | 0.1 | 0.1 | |||||||||||||||||||||||||||||
| December 31, 2021 | 85.5 | 85.5 | 2,461.6 | (321.3) | 4.9 | 2,230.7 | |||||||||||||||||||||||||||||
| Net income | — | — | 367.0 | — | 2.4 | 369.4 | |||||||||||||||||||||||||||||
| Activity from stock incentive plans | 0.3 | 0.3 | 19.7 | — | — | 20.0 | |||||||||||||||||||||||||||||
| Share repurchases | (3.0) | (3.0) | (242.3) | — | — | (245.3) | |||||||||||||||||||||||||||||
| Shares withheld related to net share settlement of stock incentive plans | (0.1) | (0.1) | (8.7) | — | — | (8.8) | |||||||||||||||||||||||||||||
| Dividends declared ($1.056 per share) | — | — | (87.7) | — | — | (87.7) | |||||||||||||||||||||||||||||
| Dividend to noncontrolling interest | — | — | — | — | (0.5) | (0.5) | |||||||||||||||||||||||||||||
| Acquisition of noncontrolling interest | — | — | — | — | 2.7 | 2.7 | |||||||||||||||||||||||||||||
| Net change in postretirement benefit plans, net of tax | — | — | — | 44.4 | — | 44.4 | |||||||||||||||||||||||||||||
| Net foreign currency translation adjustment | — | — | — | (67.4) | — | (67.4) | |||||||||||||||||||||||||||||
| Other | — | — | 0.1 | — | (0.2) | (0.1) | |||||||||||||||||||||||||||||
| December 31, 2022 | 82.7 | 82.7 | 2,509.7 | (344.3) | 9.3 | 2,257.4 | |||||||||||||||||||||||||||||
| Net income | — | — | 410.5 | — | 3.3 | 413.8 | |||||||||||||||||||||||||||||
| Activity from stock incentive plans | 0.2 | 0.2 | 20.6 | — | — | 20.8 | |||||||||||||||||||||||||||||
| Share repurchases | (0.7) | (0.7) | (59.8) | — | — | (60.5) | |||||||||||||||||||||||||||||
| Shares withheld related to net share settlement of stock incentive plans | (0.1) | (0.1) | (7.1) | — | — | (7.2) | |||||||||||||||||||||||||||||
| Dividends declared ($1.16 per share) | — | — | (95.9) | — | — | (95.9) | |||||||||||||||||||||||||||||
| Dividend to noncontrolling interest | — | — | — | — | (1.7) | (1.7) | |||||||||||||||||||||||||||||
| Net change in postretirement benefit plans, net of tax | — | — | — | (5.2) | — | (5.2) | |||||||||||||||||||||||||||||
| Net foreign currency translation adjustment | — | — | — | 17.6 | — | 17.6 | |||||||||||||||||||||||||||||
| December 31, 2023 | 82.1 | $ | 82.1 | $ | 2,778.0 | $ | (331.9) | $ | 10.9 | $ | 2,539.1 | ||||||||||||||||||||||||
The accompanying Notes to the Consolidated Financial Statements are an integral part of the above Consolidated Statements of Changes in shareholders’ equity.Shareholders’ Equity.
58
NOTES TO THE CONSOLIDATED FINANCIAL STATEMENTS
(DOLLARS AND SHARES (EXCEPT PER SHARE AMOUNTS) IN MILLIONS, UNLESS OTHERWISE STATED)
NOTE 1
DESCRIPTION OF BUSINESS, BASIS OF PRESENTATION AND SUMMARY OF SIGNIFICANT ACCOUNTING POLICIES
Description of Business
ITT Inc. is a diversified manufacturer of highly engineered critical components and customized technology solutions for the transportation, industrial, and oil and gasenergy markets. Unless the context otherwise indicates, references herein to "ITT," "the Company," and such words as "we," "us," and "our" include ITT Inc. and its subsidiaries. ITT operates throughin three segments: Motion Technologies, consisting of friction materials, and shock and vibration equipment; Industrial Process, consisting of industrial flow equipment and services; Motion Technologies, consisting of friction and shock and vibration equipment; and Connect & Control Technologies, consisting of electronic connectors, fluid handling, motion control, composite materials, and noise and energy absorption products. Financial information for our segments is presented in Note 3, 3, Segment Information.
Business Combination
On May 16, 2016,2, 2023, we consummatedcompleted the acquisition of Micro-Mode Products, Inc. (Micro-Mode) for a corporate reorganization into a holding company structure. As a resultpurchase price of $79.3, net of cash acquired. Subsequent to the reorganization ITT Inc.acquisition, Micro-Mode’s results are reported within our CCT segment. Refer to Note 22, Acquisitions, Investments, and Divestitures, an Indiana corporation that was previously a wholly owned subsidiary of ITT Corporation, becamefor further information.
Russia-Ukraine War
In February 2022, the publicly traded holding company of ITT Corporation and its subsidiaries and the successor issuer to ITT Corporation under Rule 12g-3(a) under the Securities Exchange Act of 1934 (Exchange Act). As the successor issuer, ITT Inc. common stock was deemed to be registered under Section 12(b) of the Exchange Act and ITT Inc. succeeded to ITT Corporation’s obligation to file reports, proxy statementsUnited States and other information requiredleading nations announced targeted economic sanctions on Russia and certain Russian citizens in response to Russia’s war with Ukraine, which has increased regional instability and global economic and political uncertainty. As described in Part I, Item 1A, Risk Factors, our business may be sensitive to global economic conditions, which can be negatively impacted by instability in the Exchange Act withgeopolitical environment.
During the SEC. For additional information regarding the holding company reorganization, please referyears ended December 31, 2023 and 2022, we recorded total pre-tax charges of $2.5 and $7.9, primarily related to the Current Report on Form 8-K that we filed with the SEC on May 16, 2016.
Basis of Presentation
The Consolidated Financial Statements and Notes thereto were prepared in conformity with accounting principles generally accepted in the United States of America (GAAP).
The preparation of financial statements in conformity with GAAP requires management to make estimates and assumptions that affect the reported amounts of assets and liabilities, the disclosure of contingent assets and liabilities at the date of the financial statements, and the reported amounts of revenue and expenses during the reporting period. Estimates are revised as additional information becomes available. Estimates and assumptions are used for, but not limited to, asbestos-related liabilities and recoveries from insurers, revenue recognition, unrecognized tax benefits, deferred tax valuation allowances, projected benefit obligations for postretirement plans, accounting for business combinations, goodwill and other intangible asset impairment testing, environmental liabilities, allowance for doubtful accountscredit losses and inventory valuation. Actual results could differ from these estimates.
Certain prior year amounts have been reclassified to conform to the current year presentation.
Significant Accounting Policies
Principles of Consolidation
Our consolidated financial statements include the accounts of all majority-owned subsidiaries. ITT consolidates companies in which it has a controlling financial interest or when ITT is considered the primary beneficiary of a variable interest entity. We account for investments in companies over which we have the ability to exercise significant influence, but do not hold a controlling interest under the equity method, and we record our proportionate share of income or losses in the Consolidated Statements of Operations. The results of companies acquired or disposed of during the fiscal year are included in the Consolidated Financial Statements from the effective date of acquisition or up to the date of disposal or distribution.disposal. All intercompany transactions have been eliminated.
59
Revenue Recognition
Revenue is derived from the sale of products and services to customers. The followingWe recognize revenue recognition policies describeto depict the mannertransfer of promised goods or services to customers in an amount that reflects the consideration to which we accountexpect to be entitled in exchange for different classes of revenue transactions.those goods or services.
For contracts recognized over time, we use the cost-to-cost method or the units-of-delivery method, depending on the nature of the contract, including length of production time.
For contracts recognized at a point in time, title and risks and rewards of ownership passwe recognize revenue when control passes to the customer, which is generally based on shipping terms that address when products are shipped,title and risk and rewards pass to the contractual terms have been fulfilled. Certaincustomer. However, we also consider certain customer acceptance provisions as certain contracts with customers require delivery,include installation, testing, certification or other acceptance provisions to be satisfied before revenue is recognized.provisions. In instances where contractual terms include a provision for customer acceptance, revenue is recognized when either (i)we consider whether we have previously demonstrated that the product meets objective criteria specified by either the specified criteriaseller or customer in assessing whether control has passed to the customer.
For service contracts, we recognize revenue as the services are rendered if the customer is benefiting from the service as it is performed, or otherwise upon completion of the service. Separately priced extended warranties are recognized as a separate performance obligation over the warranty period.
The transaction price in our contracts consists of fixed consideration and the impact of variable consideration including returns, rebates and allowances, and penalties. Variable consideration is generally estimated using a probability-weighted approach based on either seller or customer-specified objective criteria or (ii) on formal acceptance received fromhistorical experience, known trends, and current factors including market conditions and status of negotiations.
When there is more than one performance obligation, the customer where the product has not been previously demonstrated to meet customer-specified objective criteria.
Revenue is reported net of any required taxes collected from customers and remitted to government authorities, with the collected taxes recorded as current liabilities until remitted to the relevant government authority.
Shipping and Handling Costs
For most contracts, payment is due from the customer within 30 to 90 days after the product is delivered or the service has been performed. For design and build contracts, we generally collect progress payments from the customer throughout the term of the contract, resulting in contract assets or liabilities depending on the timing of the payments. Contract assets consist of unbilled amounts when revenue recognized exceeds customer billings. Contract liabilities consist of advance payments and billings in excess of revenue recognized.
Design and engineering costs for highly complex products to be sold under a long-term production-type contract are capitalized and amortized in a manner consistent with revenue recognition of the related contract or anticipated contract. Other design and development costs are recorded ascapitalized only if there is a componentcontractual guarantee for reimbursement. Costs to obtain a contract (e.g., commissions) for contracts greater than one year are capitalized and amortized in a manner consistent with revenue recognition of costs of revenue.the related contract.
Product Warranties
Our standard product warranty terms generally include post-sales support and repairs or replacement of a product at no additional charge for a specified period of time. Accruals for estimated expenses related to product warranties are made at the time revenue is recognized and are recorded as a component of costs of revenue. We estimate the liability for warranty claims based on our standard warranties, the historical frequency of claims and the cost to replace or repair our products under warranty. Factors that influence our warranty liability include the number of units sold, the length of warranty term, historical and anticipated rates of warranty claims and the cost per claim.
60
Postretirement Benefit Plans
ITT sponsors numerous pension and other employee-related defined benefit plans (collectively, postretirement benefit plans). The majoritySubstantially all of theseour U.S. postretirement benefit plans are closed to new participants. Postretirement benefit obligations are generally determined, where applicable, based on participant years of service, future compensation, and age at retirement or termination.termination, and the assumed rate of future healthcare cost increases. The determination of projected benefit obligations and the recognition of expenses related to postretirement benefit plans are dependent on various assumptions that are judgmental. The assumptions involved in the measurement of our postretirement benefit plan obligations and net periodic postretirement costs primarily relate to discount rates, long-term expected rates of return on plan assets, mortality and termination rates, and other factors. Management develops each assumption using relevant Company experience in conjunction with market-related data for each individual country in which such plans exist. Actual results that differ from our assumptions are accumulated and are amortized over the estimated future working life, or remaining lifetime, of the plan participants depending on the nature of the retirement plan. For the recognition of net periodic postretirement cost, the calculation of the long-term expected return on plan assets is generally derived using a market-related value of plan assets based on yearly average asset values at the measurement date over the last 5 years.
The funded status of each planall plans is recorded on our balance sheet. Actuarial gains and losses and prior service costs or credits that have not yet been recognized through net income are recorded in accumulated other comprehensive income within shareholders’ equity, net of taxes, until they are amortized as a component of net periodic postretirement cost.
Research & Development
Research and development activities are charged to expense as incurred. R&D as a percentage of sales was 3.1%, 3.2%, and 3.4% during 2023, 2022 and 2021, respectively.
Income Taxes
We determine the provision for income taxes using the asset and liability approach. Under this approach, deferred income tax assets and liabilities are determined based on the estimated future tax effects of differences between the financial reporting and tax bases of assets and liabilities, applying currently enacted tax rates in effect for the year in which we expect the differences will reverse. The ultimate realization of deferred tax assets is dependent on the generation of future taxable income (including the reversals of deferred tax liabilities) during the periods in which those deferred tax assets will become deductible.
We record a valuation allowance against our deferred tax assets when it is more likely than not that all or a portion of the deferred tax assets will not be realized. In assessing the need for a valuation allowance, the Company considers all available positive and negative evidence regarding the realizability of its deferred tax assets, including the future reversal of existing taxable temporary differences, taxable income in carryback periods, prudent and feasible tax planning strategies, estimated future taxable income, and whether we have a recent history of losses. The valuation allowance can be affected by changes to tax regulations, interpretations and rulings, changes to enacted statutory tax rates, and changes to future taxable income estimates.
We have not provided deferred tax liabilities for the impact of U.S. income taxes on undistributed foreign earningsbook over tax basis which we plan to reinvestconsider indefinitely reinvested outside the U.S. We plan foreign earnings remittance amounts based on projected cash flow needs, as well as the working capital and long-term investment requirements of foreign subsidiaries and our domestic operations.
Furthermore, we recognize the tax benefit from an uncertain tax position only if it is more likely than not that the tax position will be sustained on examination by the taxing authorities, based on the technical merits of the position in consideration of applicable tax statutes and related interpretations and precedents and the expected outcome of the proceedings (or negotiations) with the taxing authorities. Tax benefits recognized in the financial statements from such a position are measured based on the largest benefit that has a greater than 50% likelihood of being realized on ultimate settlement.
The Company has elected to account for Global Intangible Low Taxed Income as a current period expense when incurred. See Note 6, Income Taxes, for additional information.
61
Earnings Per Share
Basic earnings per common share considers the weighted average number of common shares outstanding. Diluted earnings per share considers the outstanding shares utilized in the basic earnings per share calculation as well as the dilutive effect of outstanding stock options and restricted stock that do not contain rights to nonforfeitable dividends. Diluted shares outstanding include the dilutive effect of in-the-money options, unvested restricted stock units and unvested performance stock units. The dilutive effect of such equity awards is calculated based on the average share price for each reporting period using the treasury stock method. Common stock equivalents are excluded from the computation of earnings per share if they have an anti-dilutive effect. See Note 7, Earnings Per Share Data, for additional information.
Cash and Cash Equivalents
ITT considers all highly liquid investments purchased with an original maturity or remaining maturity at the time of purchase of three months or less to be cash equivalents. Cash equivalents primarily include fixed-maturity time deposits and money market investments. We record the fixed maturity time deposits at amortized costRestricted cash was $0.7 as of December 31, 2023 and accrue interest during the maturity period.December 31, 2022. Restricted cash is presented within Other current assets and Other non-current assets in our Consolidated Balance Sheets.
Concentrations of Credit Risk
Financial instruments that potentially subject ITT to significant concentrations of credit risk consist principally of cash and cash equivalents, accounts receivableand notes receivables from trade customers, investments, and derivatives.derivative financial instruments. We maintain cash and cash equivalents with various financial institutions located in different geographical regions, and our policy is designed to limit exposure to any individual counterparty. Derivative financial instruments are transacted with multiple highly reputable financial institutions. As part of our risk management processes, we perform periodic evaluations of the relative credit standing of the financial institutions.institutions with which we transact. We have not sustained any material credit losses during the previous three years fromwith respect to financial instruments held at financial institutions.
Credit risk with respect to accounts receivable is generally diversified due to the large number of entities comprising ITT’s customer base and their dispersion across many different industries and geographic regions. However, our largest customer representsrepresented approximately 11% and 12%10% of the December 31, 2017 and 2016total outstanding trade accounts receivable balance, respectively.balances as of December 31, 2023 and December 31, 2022. Occasionally, we enter into notes receivables with certain of our customers. These notes receivables have maturities of six to 12 months and are guaranteed by reputable banks. ITT performs ongoing credit evaluations of the financial condition of its third-party
distributors, resellers and other customers and requires collateral, such as letters of credit and bank guarantees, in certain circumstances.
Allowance for Doubtful AccountsCredit Losses
We determine our allowance for doubtful accountscredit losses using a combination of factors to reduce our trade receivables and contract asset balances to their estimatedthe net realizable amount. We maintain anamount expected to be collected. The allowance for doubtful accountsis based on a variety of factors including the length of time receivables are past due, macroeconomic trends and conditions, significant one-time events, historical experience, and the financial conditionexpectations of our customers.future economic conditions. We also record a specific reservean allowance for individual accounts when we become aware of specific customer circumstances, such as in the case of bankruptcy filings or deterioration in the customer’s operating results or financial position. The past due or delinquency status of a receivable is based on the contractual payment terms of the receivable. If circumstances related to the specific customer change, we adjust estimates of the recoverability of receivables as appropriate.
Inventories
Inventories, which include the costs of material, labor and overhead, are stated at the lower of cost or market, withnet realizable value. Cost is generally computed using the standard cost generally computedmethod, which approximates actual cost on a first-in, first-out (FIFO) basis. Variances between standard and actual costs are charged to cost of sales or capitalized to inventory. Estimated losses from obsolete and slow-moving inventories are recorded to reduce inventory values to their estimated net realizable value and are charged to cost of sales. At the point of loss recognition, a new cost basis for that inventory is established and subsequent changes in facts and circumstances do not result in a recovery in carrying value. Inventories valued under the last-in, first-out (LIFO) method represent 12.1%13.8% and 12.9%13.0% of total 20172023 and 20162022 inventories, respectively. We have a LIFO reserve of $9.6$19.1 and $8.1$16.8 recorded as of December 31, 20172023 and 2016,2022, respectively.
62
Plant, Property and Equipment
Plant, property and equipment, including capitalized interest applicable to major project expenditures, are recorded at cost. Depreciation is computed on a straight-line basis over the estimated useful lives of the assets as follows: buildings and improvements – 5 to 40 years, machinery and equipment – 2 to 10 years, and furniture and office equipment – 3 to 7 years.assets. Leasehold improvements are depreciated over the life of the lease or the asset, whichever is shorter. Fully depreciated assets are retained in property and accumulated depreciation accounts until disposal. Repairs and maintenance costs are expensed as incurred. See Note 11, Plant, Property and Equipment, Net, for additional information.
Leases
The Company enters into operating and capital leases for the use of premises and equipment. Rentequipment, primarily classified as operating leases. Operating lease costs are recognized as an operating expense related to operatingover the lease agreements are recordedterm on a straight line basis, consideringstraight-line basis. For leases with terms greater than 12 months, we record a right-of-use asset and lease incentivesliability equal to the present value of the lease payments. In determining the discount rate used to measure the right-of-use asset and escalating rental payments.lease liability, we utilize the Company’s incremental borrowing rate and consider the term of the lease, as well as the geographic location of the leased asset.
Where options to renew a lease are available, they are included in the lease term and capitalized on the balance sheet to the extent there would be a significant economic penalty not to elect the option. Certain real estate leases are subject to periodic changes in an index or market rate. Although lease liabilities are not remeasured as a result of changes to an index or rate, these changes are treated as variable lease payments and recognized in the period in which the obligation for those payments is incurred. Variable lease expense also includes property tax and property insurance costs. See Note 14, Leases, for additional information.
Capitalized Internal Use Software
Costs incurred in the preliminary project stage of developing or acquiring internal use software are expensed as incurred. After the preliminary project stage is completed, management has approved the project and it is probable that the project will be completed and the software will be used for its intended purpose, ITT capitalizes certain internal and external costs incurred to acquire or create internal use software, principally related to software coding, designing system interfaces and installation and testing of the software. ITT amortizes capitalized internal use software costs using the straight-line method over the estimated useful life of the software, generally from 3 to 7 years.
Investments
Investments in fixed-maturity time deposits having an original maturity exceeding three months at the time of purchase, referred to as short-term time deposits, are classified as held-to-maturity and are recorded at amortized cost, which approximates fair value. There were no short-term time deposits held as of December 31, 20172023 and December 31, 2016. Short-term time deposits2022.
Investments in entities where we have the ability to exercise significant influence, but do not control, are presentedaccounted for under the equity method of accounting and are included in other currentOther noncurrent assets as short-term investments on thein our Consolidated Balance Sheet.Sheets. Significant influence typically exists if we have a 20% to 50% ownership interest in the investee. Under this method of accounting, our share of the net earnings or losses of the investee is included in non-operating profit in Other non-operating income, net in our Consolidated Statements of Operations. We didevaluate our equity method investments for impairment whenever events or changes in circumstances indicate that the carrying amounts of such investments may be impaired. If a decline in the value of an equity method investment is determined to be other than temporary, a loss is recorded in earnings in the current period.
Investments in entities for which we do not realizehave significant operating influence (we generally hold a less than 20% ownership stake in these entities) are initially recorded at the purchase price. For investments in entities with readily determinable fair values (e.g., publicly traded), the investment is measured at fair value each subsequent reporting period. For investments in entities without a readily determinable fair value, we have made an accounting policy election to measure the investment at cost, adjusted for any impairments and/or observable price changes. In both cases, these investments are included in Other noncurrent assets in our Consolidated Balance Sheets, with any gains or losses from the maturityand dividends received recognized in non-operating profit in Other non-operating income, net in our Consolidated Statements of these short-term time deposits during 2017 or 2016 and interest income recognized during 2017 or 2016 was not material to our results of operations.Operations.
63
Investments in corporate-owned life insurance (COLI) policies are recorded at their cash surrender values as of the balance sheet date. The Company’s investments in COLI policies are included in other non-current assets in the consolidated balance sheetsour Consolidated Balance Sheets and were $101.0$128.4 and $96.5$119.6 at December 31, 20172023 and 2016,2022, respectively. Changes in the cash surrender value during the period generally reflect gains or losses in the fair value of assets, premium payments, and policy redemptions. Gains from COLI investments of $3.8, $3.0,$4.2, $0.7, and $3.6$3.9 were recorded within generalGeneral and administrative expenses in theour Consolidated Statements of Operations during years ended December 31, 2017, 20162023, 2022 and 2015,2021, respectively. The COLI policy investments were made with the intention of utilizing them as a long-term funding source for deferred compensation obligations, which as of December 31, 2017 and 2016 were approximately $12.5 and $12.6, respectively, however, theCash receipts from COLI policies do not represent a committed funding source for these obligationswere $0.0, $0.4, and as such they$0.0 during 2023, 2022, and 2021, respectively, and are subject to claims from creditors, and we can designate them for another purpose at any time.recognized in investing activities in our Consolidated Statements of Cash Flows.
Long-Lived Asset Impairment
Long-lived assets, including intangible assets with finite lives and capitalized internal use software, are tested for impairment whenever events or changes in circumstances indicate their carrying value may not be recoverable. We assess the recoverability of long-lived assets based on the undiscounted future cash flow the assets are expected to generate and recognize an impairment loss when estimated undiscounted future cash flows expected to result from the use of the asset plus net proceeds expected from disposition of the asset, if any, are less than the carrying value of the asset. When an impairment is identified, we reduce the carrying amount of the asset to its estimated fair value based on a discounted cash flow approach or, when available and appropriate, to comparable market values.
Goodwill and Intangible Assets
Goodwill represents purchase consideration paid in a business combination that exceeds the values assigned to the net assets of the acquired business. Intangible assets include customer relationships, proprietary technology, trademarks, patents and other intangible assets. Intangible assets with a finite life are generally amortized on a straight-line basis over an estimated economic useful life, which generally ranges from 10-207-20 years, and are tested for impairment if indicators of impairment are identified. Certain of our intangible assets have an indefinite life, namely certain brands and trademarks.
Goodwill and indefinite-lived intangible assets are not amortized, but rather are tested for impairment annually (or more frequently if impairment indicators arise, such as changes to the reporting unit structure, significant adverse changes in the business climate or an adverse action or assessment by a regulator). We conduct our annual impairment testing on the first day of the fourth fiscal quarter. AnWe may perform an initial qualitative evaluation is performed which considers present events and circumstances, to determine the likelihood of impairment. If the likelihood of impairment is not considered to be more likely than not, then no further testing is performed. If it is considered to be more likely than not that the asset is impaired based on the qualitative evaluation or we elect not to perform a qualitative evaluation, then a two-step quantitative impairment test is performed. In the quantitative impairment test, the fair value of each reporting unit is compared to its carrying amount. If the fair value of a reporting unit exceeds its carrying value, there is no impairment. If the carrying value of the reporting unit exceeds its estimated fair value, then the second step of the impairment test is performed in order to measure the impairment loss to be recorded, if any. If the carrying value of a reporting unit’s goodwill exceeds its implied fair value, then we record an impairment loss equal to the difference. For indefinite-lived intangibles, if it is considered to be more likely than not that the asset is impaired, we compare the fair value of those assets to their carrying value. We recognize an impairment loss when the estimated fair value of the indefinite-lived intangible asset is less than its carrying value.
We estimate the fair value of our reporting units using an income approach. Under the income approach, we estimate fair value based on the present value of estimated future cash flows. We estimate the fair value of our indefinite-lived intangible assets using the relief from royalty method. The relief from royalty method estimates the portion of a company’s earnings attributable to an intellectual property asset based on an assumed royalty rate that the company would have paid had the asset not been owned. See Note 12, Goodwill and Other Intangible Assets, Net, for additional information.
Business Combinations
64
Commitments and Contingencies
We record accruals for commitments and loss contingencies when it is probable that a liability has been incurred and the amount of loss can be reasonably estimated. In addition, legal fees are accrued for cases where a loss is probable and the related fees can be reasonably estimated. Significant judgment is required to determine both probability and the estimated amount of loss, and these assessments can involve a series of complex judgments about future events and may rely on estimates and assumptions that have been deemed reasonable by management. We review these accruals quarterly and adjust the accruals to reflect the impact of negotiations, settlements, rulings, advice of legal counsel, and other current information. See Note 18,19, Commitments and Contingencies, for additional information.
Environmental-Related Liabilities and Assets
Accruals for environmental matters are recorded on a site-by-site basis when it is probable that a liability has been incurred and the amount of the liability can be reasonably estimated, based on current law and existing technologies. Our estimated liability is reduced to reflect the participation of other potentially responsible parties in those instances where it is probable that such parties are legally responsible and financially capable of paying their respective shares of the relevant costs, and that share can be reasonably estimated. Accruals for environmentalEnvironmental liabilities are primarily included in other non-current liabilities at undiscounted amounts and exclude claims for recoveries from insurance companies or other third parties.amounts.
The Company records an asset related to its environmental exposures for insurance and other expected third parties.party recoveries. The environmental-related asset represents our best estimate of probable recoveries from third parties for costs incurred in past periods, as well as costs estimated to be incurred in future periods.
Environmental costs and related recoveries are recorded within generalGeneral and administrative expenses in theour Consolidated Statements of Operations.Operations, other than those related to discontinued operations. See Note 19, Commitments and Contingencies, for additional information.
Foreign Currency Translation
The national currencies of our foreign subsidiaries are generally the functional currencies. Balance Sheet accounts are translated at the exchange rate in effect at the end of each period, except for equity which is translated at historical rates; Statement of Operations accounts are translated at the average rates of exchange prevailing during the period. Gains and losses resulting from foreign currency translation are reflected in the cumulative translation adjustments component of shareholders’ equity.
For foreign subsidiaries that do not use the local currency as their functional currency, foreign currency assets and liabilities are remeasured to the foreign subsidiary’s functional currency using end of period exchange rates, except for nonmonetary balance sheet accounts, which are remeasured at historical exchange rates.
For transactions denominated in other than the functional currency, revenue and expenses are remeasured at average exchange rates in effect during the reporting period in which the transactions occurred, except for expenses related to nonmonetary assets and liabilities. Transaction gains or losses from foreign currency remeasurement are reported in generalGeneral and administrative expenses in theour Consolidated Statements of Operations. During 2017the years ended December 31, 2023, 2022, and 2016,2021, we recognized transaction losses(loss)/gain of $12.4$(7.0), $6.1 and $1.0,$1.9, respectively. During 2015, we recognized transaction gains of $2.8.
From time to time, the Company may use derivative financial instruments, primarily foreign currency forward and option contracts, to mitigate exposure from foreign currency exchange rate fluctuations as it pertains to receipts from customers, payments to suppliers and intercompany transactions; as well as from commodity price fluctuations. We record derivatives at their fair value as either an asset or liability. For derivatives not designated as hedges, adjustments to reflect changes in the fair value of our derivatives are included in earnings. For cash flow hedges that qualify and are designated for hedge accounting, the effective portion of the change in fair value of the derivative is recorded in accumulated other comprehensive loss and subsequently recognized in earnings when the hedged transaction affects earnings. Any ineffective portion is recognized immediately in earnings. As of December 31, 2023 and 2022, no derivatives were designated as hedges. The differentials paid or received on interest rate swap agreements are recognized as adjustments to interest expense. Derivative contracts involve the risk of non-performance by the counterparty. The fair value of our foreign currency contracts are determined using the net position of the contracts and the applicable spot rates and forward rates as of the reporting date. See Note 21, Derivative Financial Instruments, for additional information.
Related Parties
Under Accounting Standards Codification (ASC) Topic 850, Related Party Disclosures, related party transactions include those between: (a) a parent entity and its subsidiaries; (b) subsidiaries of a common parent; (c)
65
an entity and trusts for the benefit of employees, such as pension and profit-sharing trusts that are managed by or under the trusteeship of the entity’s management; (d) an entity and its principal owners, management, or members of their immediate families; and (e) affiliates.
In January 2021, the Company entered into a three-month consulting agreement for $0.2 with Thomas Scalera, ITT's former Executive Vice President and Chief Financial Officer. The consulting agreement included, but was not limited to, financial, accounting, and investor relations advisory services.
There were no other material related party transactions during 2023, 2022 or 2021.
NOTE 2
RECENT ACCOUNTING PRONOUNCEMENTS
From time to time, the Financial Accounting Standards Board (“FASB”) or other standards setting bodies issue new accounting pronouncements. Updates to the FASB's accounting standards are communicated through issuance of an Accounting Standards Update (“ASU”). The Company considers the applicability and impact of all ASUs on our business and financial results.
Recently issued accounting standardpronouncements not yet adopted
In November 2023, the FASB issued ASU No. 2023-07, Segment Reporting (Topic 280): Improvements to Reportable Segment Disclosures. This ASU updates (ASUs). ASUs not listed belowreportable segment disclosure requirements by requiring disclosures of significant reportable segment expenses that are regularly provided to the Chief Operating Decision Maker (“CODM”) and included within each reported measure of a segment's profit or loss. This ASU also requires disclosure of the title and position of the individual identified as the CODM and an explanation of how the CODM uses the reported measures of a segment’s profit or loss in assessing segment performance and deciding how to allocate resources. This ASU is effective for annual periods beginning after December 15, 2023, and interim periods within fiscal years beginning after December 15, 2024. Adoption of the ASU should be applied retrospectively to all prior periods presented in the financial statements. Early adoption is permitted. We are currently evaluating the impact that this guidance will have on the disclosures within our financial statements, and expect to adopt this ASU for the year ending December 31, 2024.
In December 2023, the FASB issued ASU No. 2023-09, Income Taxes (Topic 740): Improvements to Income Tax Disclosures. This ASU requires disclosure of specific categories in the rate reconciliation and additional information for reconciling items that meet a quantitative threshold. The amendment also includes other changes to improve the effectiveness of income tax disclosures, including further disaggregation of income taxes paid for individually significant jurisdictions. This ASU is effective for annual periods beginning after December 15, 2024. Adoption of this ASU should be applied on a prospective basis. Early adoption is permitted. We are currently evaluating the impact that this guidance will have on the disclosures within our financial statements, and expect to adopt this ASU for the year ending December 31, 2025.
During 2023, there were assessed and determined to be either not applicableno other new accounting standards issued, or that are pending issuance, that are expected to have minimala material impact on our consolidated financial position or results of operations.
NOTE 3
SEGMENT INFORMATION
Motion Technologies manufactures brake components and specialized sealing solutions, shock absorbers and damping technologies primarily for the global automotive, truck and trailer, public bus and rail transportation markets.
Industrial Process manufactures engineered fluid process equipment serving a diversified mix of customers in global industries such as chemical, energy, mining, and other industrial process markets and is a provider of plant optimization and efficiency solutions and aftermarket services and parts.
66
Connect & Control Technologies manufactures harsh-environment connector solutions, and critical energy absorption, and flow control components, and composite materials for the aerospace and defense, general industrial, medical, and oilenergy markets.
Assets of our reportable segments exclude general corporate assets, which principally consist of cash, investments, deferred taxes, and gas markets.certain property, plant and equipment. These assets are included within Corporate and Other, which is described further below.
Corporate and Other consists of corporate office expenses including compensation, benefits, occupancy, depreciation, and other administrative costs, as well as charges related to certain matters, such as asbestos and environmental liabilities, that are managed at a corporate level and are not included in segment results when evaluating performance or allocating resources. Assets of the segments exclude general corporate assets, which principally consist of cash, investments, asbestos-related receivables, deferred taxes,In addition, Corporate and certain property, plantOther includes research and equipment.
| Revenue | Operating Income (Loss) | Operating Margin | ||||||||||||||||||||||||||||||
| 2017 | 2016 | 2015 | 2017 | 2016 | 2015 | 2017 | 2016 | 2015 | ||||||||||||||||||||||||
| Industrial Process | $ | 807.2 | $ | 830.1 | $ | 1,113.8 | $ | 59.5 | $ | 33.5 | $ | 141.2 | 7.4 | % | 4.0 | % | 12.7 | % | ||||||||||||||
| Motion Technologies | 1,176.0 | 983.4 | 767.2 | 190.0 | 171.4 | 126.4 | 16.2 | % | 17.4 | % | 16.5 | % | ||||||||||||||||||||
| Connect & Control Technologies | 605.6 | 596.3 | 609.3 | 66.7 | 65.2 | 54.6 | 11.0 | % | 10.9 | % | 9.0 | % | ||||||||||||||||||||
| Total segment results | 2,588.8 | 2,409.8 | 2,490.3 | 316.2 | 270.1 | 322.2 | 12.2 | % | 11.2 | % | 13.0 | % | ||||||||||||||||||||
| Asbestos-related benefit, net | — | — | — | 19.9 | 25.6 | 91.4 | — | — | — | |||||||||||||||||||||||
| Eliminations / Other corporate costs | (3.5 | ) | (4.4 | ) | (4.7 | ) | (26.4 | ) | (36.8 | ) | (33.5 | ) | — | — | — | |||||||||||||||||
| Total Eliminations / Corporate and Other costs | (3.5 | ) | (4.4 | ) | (4.7 | ) | (6.5 | ) | (11.2 | ) | 57.9 | — | — | — | ||||||||||||||||||
| Total | $ | 2,585.3 | $ | 2,405.4 | $ | 2,485.6 | $ | 309.7 | $ | 258.9 | $ | 380.1 | 12.0 | % | 10.8 | % | 15.3 | % | ||||||||||||||
| Assets | Capital Expenditures | Depreciation and Amortization | |||||||||||||||||||||||||||||
| 2017 | 2016 | 2017 | 2016 | 2015 | 2017 | 2016 | 2015 | ||||||||||||||||||||||||
| Industrial Process | $ | 1,025.7 | $ | 998.1 | $ | 19.3 | $ | 24.4 | $ | 20.4 | $ | 27.5 | $ | 27.9 | $ | 27.9 | |||||||||||||||
| Motion Technologies | 1,140.4 | 838.4 | 79.1 | 73.5 | 39.3 | 49.4 | 43.2 | 32.4 | |||||||||||||||||||||||
| Connect & Control Technologies | 694.8 | 678.4 | 10.6 | 11.7 | 23.7 | 22.8 | 24.3 | 23.4 | |||||||||||||||||||||||
| Corporate and Other | 839.3 | 1,086.8 | 4.3 | 1.8 | 3.3 | 5.6 | 6.6 | 6.3 | |||||||||||||||||||||||
| Total | $ | 3,700.2 | $ | 3,601.7 | $ | 113.3 | $ | 111.4 | $ | 86.7 | $ | 105.3 | $ | 102.0 | $ | 90.0 | |||||||||||||||
Revenue(a) | |||||||||||
| Geographic Information | 2017 | 2016 | 2015 | ||||||||
| United States | $ | 853.6 | $ | 900.3 | $ | 941.1 | |||||
| Germany | 389.3 | 324.4 | 290.7 | ||||||||
| Other developed markets | 495.5 | 459.6 | 476.8 | ||||||||
| Other emerging markets | 846.9 | 721.1 | 777.0 | ||||||||
| Total | $ | 2,585.3 | $ | 2,405.4 | $ | 2,485.6 | |||||
Plant, Property & Equipment, Net | |||||||
| Geographic Information | 2017 | 2016 | |||||
| United States | $ | 168.3 | $ | 181.6 | |||
| Italy | 102.9 | 81.0 | |||||
| China | 52.1 | 40.2 | |||||
| Germany | 39.1 | 38.5 | |||||
| Mexico | 34.5 | 28.7 | |||||
| Czech Republic | 27.9 | 16.8 | |||||
| South Korea | 27.8 | 28.0 | |||||
| Other developed markets | 41.8 | 36.0 | |||||
| Other emerging markets | 27.3 | 13.7 | |||||
| Total | $ | 521.7 | $ | 464.5 | |||
development-related expenses associated with a subsidiary that does not constitute a reportable segment.
The following table providespresents our revenue for each segment and reconciles our total segment revenue to total consolidated revenue.
| Revenue | |||||||||||||||||||||||||||||||||||||||||||||||||||||
| For the Year Ended December 31 | 2023 | 2022 | 2021 | ||||||||||||||||||||||||||||||||||||||||||||||||||
| Motion Technologies | $ | 1,457.8 | $ | 1,374.0 | $ | 1,368.6 | |||||||||||||||||||||||||||||||||||||||||||||||
| Industrial Process | 1,129.6 | 971.0 | 843.2 | ||||||||||||||||||||||||||||||||||||||||||||||||||
| Connect & Control Technologies | 699.4 | 645.6 | 554.7 | ||||||||||||||||||||||||||||||||||||||||||||||||||
| Total segment revenue | 3,286.8 | 2,990.6 | 2,766.5 | ||||||||||||||||||||||||||||||||||||||||||||||||||
| Eliminations | (3.8) | (2.9) | (1.5) | ||||||||||||||||||||||||||||||||||||||||||||||||||
| Total consolidated revenue | $ | 3,283.0 | $ | 2,987.7 | $ | 2,765.0 | |||||||||||||||||||||||||||||||||||||||||||||||
The following table presents our operating income for each segment and reconciles our total segment operating income to income from continuing operations before income tax.
| Operating Income | |||||||||||||||||||||||||||||||||||||||||||||||||||||
| For the Year Ended December 31 | 2023 | 2022 | 2021 | ||||||||||||||||||||||||||||||||||||||||||||||||||
| Motion Technologies | $ | 230.8 | $ | 208.5 | $ | 258.2 | |||||||||||||||||||||||||||||||||||||||||||||||
| Industrial Process | 243.6 | 187.6 | 126.8 | ||||||||||||||||||||||||||||||||||||||||||||||||||
| Connect & Control Technologies | 107.5 | 115.8 | 81.7 | ||||||||||||||||||||||||||||||||||||||||||||||||||
| Total segment operating income | 581.9 | 511.9 | 466.7 | ||||||||||||||||||||||||||||||||||||||||||||||||||
| Other corporate costs | (53.7) | (43.9) | (36.8) | ||||||||||||||||||||||||||||||||||||||||||||||||||
Asbestos-related benefit, net(a) | — | — | 74.4 | ||||||||||||||||||||||||||||||||||||||||||||||||||
| Interest (expense) income, net | (10.4) | (6.4) | 1.1 | ||||||||||||||||||||||||||||||||||||||||||||||||||
| Other non-operating income, net | 1.7 | 0.2 | 3.7 | ||||||||||||||||||||||||||||||||||||||||||||||||||
| Income from continuing operations before income tax | $ | 519.5 | $ | 461.8 | $ | 509.1 | |||||||||||||||||||||||||||||||||||||||||||||||
(a)The 2021 period includes a pre-tax gain of $88.8 resulting from the InTelCo divestiture transaction. See Note 19, Commitments and Contingencies, for further information.
The following table presents our operating margin for each segment. Segment operating margin is calculated as segment operating income divided by segment revenue.
| For the Year Ended December 31 | 2023 | 2022 | 2021 | ||||||||||||||||||||||||||||||||||||||||||||||||||
| Motion Technologies | 15.8 | % | 15.2 | % | 18.9 | % | |||||||||||||||||||||||||||||||||||||||||||||||
| Industrial Process | 21.6 | % | 19.3 | % | 15.0 | % | |||||||||||||||||||||||||||||||||||||||||||||||
| Connect & Control Technologies | 15.4 | % | 17.9 | % | 14.7 | % | |||||||||||||||||||||||||||||||||||||||||||||||
The following table presents our assets as of December 31, 2023 and 2022, as well as our capital expenditures and depreciation and amortization expense for the years ended December 31, 2023, 2022, and 2021, by segment.
67
| Assets | Capital Expenditures | Depreciation and Amortization | |||||||||||||||||||||||||||||||||||||||||||||
| 2023 | 2022 | 2023 | 2022 | 2021 | 2023 | 2022 | 2021 | ||||||||||||||||||||||||||||||||||||||||
| Motion Technologies | $ | 1,366.6 | $ | 1,311.9 | $ | 72.0 | $ | 73.2 | $ | 71.1 | $ | 64.4 | $ | 59.9 | $ | 64.1 | |||||||||||||||||||||||||||||||
| Industrial Process | 1,323.2 | 1,218.6 | 17.7 | 10.9 | 6.7 | 21.9 | 25.3 | 22.3 | |||||||||||||||||||||||||||||||||||||||
| Connect & Control Technologies | 834.6 | 751.6 | 16.1 | 14.8 | 8.5 | 20.3 | 18.8 | 21.8 | |||||||||||||||||||||||||||||||||||||||
| Corporate and Other | 408.2 | 498.2 | 1.8 | 5.0 | 2.1 | 2.6 | 3.4 | 4.9 | |||||||||||||||||||||||||||||||||||||||
| Total | $ | 3,932.6 | $ | 3,780.3 | $ | 107.6 | $ | 103.9 | $ | 88.4 | $ | 109.2 | $ | 107.4 | $ | 113.1 | |||||||||||||||||||||||||||||||
The following table displays consolidated revenue by geographic region. Revenue is attributed to individual regions based on the destination of the product category,or service delivery.
| For the Year Ended December 31, 2023 | Motion Technologies | Industrial Process | Connect & Control Technologies | Eliminations | Total | ||||||||||||||||||||||||
North America(a) | $ | 265.2 | $ | 660.9 | $ | 441.1 | $ | (3.7) | $ | 1,363.5 | |||||||||||||||||||
Europe(b) | 802.7 | 109.1 | 134.8 | — | 1,046.6 | ||||||||||||||||||||||||
Asia(c) | 370.1 | 118.5 | 84.1 | (0.1) | 572.6 | ||||||||||||||||||||||||
| Middle East and Africa | 1.5 | 139.6 | 28.4 | — | 169.5 | ||||||||||||||||||||||||
| South America | 18.3 | 101.5 | 11.0 | — | 130.8 | ||||||||||||||||||||||||
| Total | $ | 1,457.8 | $ | 1,129.6 | $ | 699.4 | $ | (3.8) | $ | 3,283.0 | |||||||||||||||||||
| For the Year Ended December 31, 2022 | |||||||||||||||||||||||||||||
North America(a) | $ | 266.9 | $ | 566.2 | $ | 390.2 | $ | (2.8) | $ | 1,220.5 | |||||||||||||||||||
Europe(b) | 756.7 | 94.6 | 136.4 | — | 987.7 | ||||||||||||||||||||||||
Asia(c) | 333.6 | 102.8 | 88.1 | (0.1) | 524.4 | ||||||||||||||||||||||||
| Middle East and Africa | 1.3 | 120.8 | 22.4 | — | 144.5 | ||||||||||||||||||||||||
| South America | 15.5 | 86.6 | 8.5 | — | 110.6 | ||||||||||||||||||||||||
| Total | $ | 1,374.0 | $ | 971.0 | $ | 645.6 | $ | (2.9) | $ | 2,987.7 | |||||||||||||||||||
| For the Year Ended December 31, 2021 | |||||||||||||||||||||||||||||
North America(a) | $ | 249.9 | $ | 470.1 | $ | 331.4 | $ | (1.5) | $ | 1,049.9 | |||||||||||||||||||
Europe(b) | 798.8 | 96.0 | 115.5 | — | 1,010.3 | ||||||||||||||||||||||||
Asia(c) | 307.8 | 99.8 | 84.0 | — | 491.6 | ||||||||||||||||||||||||
| Middle East and Africa | 1.0 | 97.7 | 18.1 | — | 116.8 | ||||||||||||||||||||||||
| South America | 11.1 | 79.6 | 5.7 | — | 96.4 | ||||||||||||||||||||||||
| Total | $ | 1,368.6 | $ | 843.2 | $ | 554.7 | $ | (1.5) | $ | 2,765.0 | |||||||||||||||||||
(a)Includes revenue of $1,075.8, $978.6, and $842.9 from the United States for 2023, 2022, and 2021, respectively.
(b)Includes revenue of $387.8, $404.7, and $418.3 from Germany for 2023, 2022, and 2021, respectively.
(c)Includes revenue of $351.8, $307.8, and $306.5 from China for 2023, 2022, and 2021, respectively.
68
The following table displays Plant, Property and Equipment (PPE), net by geographic region.
| As of December 31 | 2023 | 2022 | |||||||||
North America(a) | $ | 165.0 | $ | 156.5 | |||||||
Europe(b) | 287.5 | 272.5 | |||||||||
Asia(c) | 87.8 | 79.2 | |||||||||
| Middle East and Africa | 17.8 | 15.8 | |||||||||
| South America | 2.9 | 2.8 | |||||||||
| Total | $ | 561.0 | $ | 526.8 | |||||||
(a)Includes PPE, net of intercompany balances.$127.1 and $125.2 in the United States as of December 31, 2023 and 2022, respectively.
(b)Includes PPE, net of $134.4 and $113.6 in Italy as of December 31, 2023 and 2022, respectively.
| 2017 | 2016 | 2015 | |||||||||
| Pumps and complementary products | $ | 718.8 | $ | 745.1 | $ | 1,025.9 | |||||
| Pump support and maintenance services | 88.4 | 84.7 | 87.8 | ||||||||
| Brake component products | 979.7 | 873.4 | 656.7 | ||||||||
| Shock absorber equipment | 196.0 | 109.6 | 110.2 | ||||||||
| Connectors | 317.9 | 309.1 | 327.9 | ||||||||
| Aerospace control components | 223.1 | 220.8 | 210.7 | ||||||||
| Industrial control components | 61.4 | 62.7 | 66.4 | ||||||||
| Total | $ | 2,585.3 | $ | 2,405.4 | $ | 2,485.6 | |||||
NOTE 4
REVENUE
The following table represents our revenue disaggregated by end market.
| For the Year Ended December 31, 2023 | Motion Technologies | Industrial Process | Connect & Control Technologies | Eliminations | Total | ||||||||||||||||||||||||||||||||||||||||||
| Auto and rail | $ | 1,423.7 | $ | — | $ | — | $ | (0.1) | $ | 1,423.6 | |||||||||||||||||||||||||||||||||||||
| Chemical and industrial pumps | — | 893.0 | — | (0.1) | 892.9 | ||||||||||||||||||||||||||||||||||||||||||
| Aerospace and defense | 8.4 | — | 377.3 | — | 385.7 | ||||||||||||||||||||||||||||||||||||||||||
| General industrial | 25.7 | — | 270.7 | (3.6) | 292.8 | ||||||||||||||||||||||||||||||||||||||||||
| Energy | — | 236.6 | 51.4 | — | 288.0 | ||||||||||||||||||||||||||||||||||||||||||
| Total | $ | 1,457.8 | $ | 1,129.6 | $ | 699.4 | $ | (3.8) | $ | 3,283.0 | |||||||||||||||||||||||||||||||||||||
| For the Year Ended December 31, 2022 | |||||||||||||||||||||||||||||||||||||||||||||||
| Auto and rail | $ | 1,336.1 | $ | — | $ | — | $ | (0.1) | $ | 1,336.0 | |||||||||||||||||||||||||||||||||||||
| Chemical and industrial pumps | — | 780.9 | — | (0.1) | 780.8 | ||||||||||||||||||||||||||||||||||||||||||
| Aerospace and defense | 7.8 | — | 316.9 | — | 324.7 | ||||||||||||||||||||||||||||||||||||||||||
| General industrial | 30.1 | — | 285.1 | (2.7) | 312.5 | ||||||||||||||||||||||||||||||||||||||||||
| Energy | — | 190.1 | 43.6 | — | 233.7 | ||||||||||||||||||||||||||||||||||||||||||
| Total | $ | 1,374.0 | $ | 971.0 | $ | 645.6 | $ | (2.9) | $ | 2,987.7 | |||||||||||||||||||||||||||||||||||||
| For the Year Ended December 31, 2021 | |||||||||||||||||||||||||||||||||||||||||||||||
| Auto and rail | $ | 1,335.1 | $ | — | $ | — | $ | — | $ | 1,335.1 | |||||||||||||||||||||||||||||||||||||
| Chemical and industrial pumps | — | 659.0 | — | — | 659.0 | ||||||||||||||||||||||||||||||||||||||||||
| Aerospace and defense | 8.3 | — | 261.4 | — | 269.7 | ||||||||||||||||||||||||||||||||||||||||||
| General industrial | 25.2 | — | 255.2 | (1.5) | 278.9 | ||||||||||||||||||||||||||||||||||||||||||
| Energy | — | 184.2 | 38.1 | — | 222.3 | ||||||||||||||||||||||||||||||||||||||||||
| Total | $ | 1,368.6 | $ | 843.2 | $ | 554.7 | $ | (1.5) | $ | 2,765.0 | |||||||||||||||||||||||||||||||||||||
During 2017, 2016,2023, 2022, and 2015,2021, a single external customer, Continental AG, accounted for 11.1%7.3%, 10.5%8.4%, and 9.1%9.8% of consolidated ITT revenue, respectively. The revenueRevenue from this customer is reported within theour Motion Technologies segment.
69
Revenue recognized related to our Industrial Process segment primarily consists of pumps, valves and plant optimization systems and related services which serve the general industrial, energy, chemical and petrochemical, pharmaceutical, mining, pulp and paper, food and beverage, and power generation markets. Many of Industrial Process’s products are highly engineered and customized to our customer needs and therefore do not have an alternative use. For these longer term design and build projects, if the contract states that we also have an enforceable right to payment, we recognize revenue over time using the cost-to-cost method as we satisfy the performance obligations identified in the contract. If no right to payment exists, revenue is recognized at a point in time, generally based on shipping terms. A majority of our design and build project contracts currently do not have a right to payment. For pumps that do have an alternative use to us, revenue is recognized at a point in time. Revenue on service and repair contracts, representing 4%, 4%, and 3% of consolidated ITT revenue in 2023, 2022, and 2021, respectively, is recognized after the services have been rendered or over the service contract period.
Our Motion Technologies segment manufactures brake pads, shims, shock absorbers, and energy absorption components, and sealing technologies primarily for the transportation industry. Our Connect & Control Technologies segment designs and manufactures a range of highly engineered connectors and specialized control components for critical applications supporting various markets including aerospace and defense, industrial, transportation, medical, and energy. In both of these segments, most products have an alternative use. Therefore, revenue for those products is recognized at a point in time when control passes to the customer. In certain circumstances, we have concluded we do not have an alternative use for the component product. In these cases, due to the short-term nature of the production process we use a units-of-delivery method of revenue recognition.
Contract Assets and Liabilities
Contract assets consist of unbilled amounts where revenue recognized exceeds customer billings. Contract liabilities consist of advance payments and billings in excess of revenue recognized. The following table represents our net contract assets and liabilities.
| As of December 31 | 2023 | 2022 | ||||||||||||||||||||||||||||||
| Current contract assets | $ | 25.8 | $ | 26.3 | ||||||||||||||||||||||||||||
| Noncurrent contract assets | 1.6 | 1.2 | ||||||||||||||||||||||||||||||
| Current contract liabilities | (95.9) | (70.2) | ||||||||||||||||||||||||||||||
| Noncurrent contract liabilities | (4.5) | (4.4) | ||||||||||||||||||||||||||||||
| Net contract liabilities | $ | (73.0) | $ | (47.1) | ||||||||||||||||||||||||||||
Our net contract liability increased $25.9 during 2023, primarily due to timing of cash receipts relative to project performance within our IP segment. During 2023, we recognized revenue of $49.2 related to contract liabilities at December 31, 2022.
The aggregate amount of the transaction price allocated to unsatisfied or partially satisfied performance obligations was $1,246.5 as of December 31, 2023. Of this amount, we expect to recognize approximately $1,030 to $1,050 of revenue during 2024 and the remainder thereafter.
As of December 31, 2023 and 2022, deferred contract costs, net were $3.8 and $4.5, respectively, primarily related to pre-contract costs. During 2023 and 2022, we amortized $0.7 and $1.0, respectively.
70
NOTE 45
RESTRUCTURING ACTIONS
From time to time, we initiate restructuring actions to optimize our cost structure, improve operational efficiencies, align our workforce with strategic business initiatives, or integrate acquired businesses. For the years ended December 31, 2023, 2022, and 2021, none of our restructuring activities were considered individually significant. Restructuring costs are included as a component of generalrecorded within General and administrative expenseexpenses in our Consolidated Statements of Operations. Restructuring
The following table summarizes our restructuring costs incurred during each of the previous three years ended are presented in the table below.by component and by segment.
| 2017 | 2016 | 2015 | |||||||||
| By component: | |||||||||||
| Severance costs | $ | 9.5 | $ | 24.3 | $ | 21.7 | |||||
| Asset write-offs | 1.9 | 0.7 | 1.0 | ||||||||
| Other restructuring costs | 1.7 | 1.3 | 1.3 | ||||||||
| Total restructuring costs | $ | 13.1 | $ | 26.3 | $ | 24.0 | |||||
| By segment: | |||||||||||
| Industrial Process | $ | 7.4 | $ | 20.5 | $ | 12.2 | |||||
| Motion Technologies | 2.3 | 2.5 | — | ||||||||
| Connect & Control Technologies | 3.3 | 1.5 | 11.6 | ||||||||
| Corporate and Other | 0.1 | 1.8 | 0.2 | ||||||||
| For the Year Ended December 31 | 2023 | 2022 | 2021 | ||||||||||||||
| By component: | |||||||||||||||||
| Severance and other employee-related costs | $ | 8.0 | $ | 3.5 | $ | 8.0 | |||||||||||
| Asset write-offs | 1.8 | 0.1 | 0.6 | ||||||||||||||
| Other | 0.1 | 0.2 | 1.0 | ||||||||||||||
| Total restructuring costs | $ | 9.9 | $ | 3.8 | $ | 9.6 | |||||||||||
| By segment: | |||||||||||||||||
| Motion Technologies | $ | 4.0 | $ | 2.7 | $ | 3.9 | |||||||||||
| Industrial Process | 4.6 | 1.3 | 3.1 | ||||||||||||||
| Connect & Control Technologies | 1.3 | — | 2.4 | ||||||||||||||
| Corporate and Other | — | (0.2) | 0.2 | ||||||||||||||
| Total restructuring costs | $ | 9.9 | $ | 3.8 | $ | 9.6 | |||||||||||
The following table displays a rollforward of theour total restructuring accruals, presented onliability, which is included within Accrued and other current liabilities in our Consolidated Balance Sheet within accrued liabilities, for each of the previous two years ended December 31st.Sheets.
| 2023 | 2022 | ||||||||||
| Restructuring liability as of January 1 | $ | 3.9 | $ | 11.0 | |||||||
| Restructuring costs | 10.9 | 5.1 | |||||||||
| Reversal of prior accruals | (1.0) | (1.3) | |||||||||
| Cash payments | (7.3) | (10.5) | |||||||||
| Asset write-offs | (1.8) | (0.1) | |||||||||
| Foreign exchange translation and other | 0.1 | (0.3) | |||||||||
| Restructuring liability as of December 31 | $ | 4.8 | $ | 3.9 | |||||||
| By accrual type: | |||||||||||
| Severance and other employee-related | $ | 4.5 | $ | 3.9 | |||||||
| Other | 0.3 | — | |||||||||
| 2017 | 2016 | ||||||
| Restructuring accruals - beginning balance | $ | 14.6 | $ | 20.0 | |||
| Restructuring costs | 13.1 | 26.3 | |||||
| Cash payments | (17.8 | ) | (30.3 | ) | |||
| Asset write-offs | (1.9 | ) | (0.7 | ) | |||
| Foreign exchange translation and other | 0.9 | (0.7 | ) | ||||
| Restructuring accrual - ending balance | $ | 8.9 | $ | 14.6 | |||
| By accrual type: | |||||||
| Severance accrual | $ | 8.0 | $ | 14.3 | |||
| Facility carrying and other costs accrual | 0.9 | 0.3 | |||||
71
| 2017 | 2016 | ||||||
| Restructuring accruals - beginning balance | $ | 6.5 | $ | 4.9 | |||
| Restructuring costs | 7.4 | 20.5 | |||||
| Cash payments | (7.3 | ) | (18.0 | ) | |||
| Asset write-offs | (1.8 | ) | (0.5 | ) | |||
| Foreign exchange translation and other | (0.9 | ) | (0.4 | ) | |||
| Restructuring accruals - ending balance | $ | 3.9 | $ | 6.5 | |||
NOTE 56
INCOME TAXES
| 2017 | 2016 | 2015 | |||||||||
| Income components: | |||||||||||
| United States | $ | 89.2 | $ | 87.5 | $ | 159.3 | |||||
| International | 220.2 | 170.9 | 223.0 | ||||||||
| Income from continuing operations before income tax | 309.4 | 258.4 | 382.3 | ||||||||
| Income tax expense components: | |||||||||||
| Current income tax expense (benefit): | |||||||||||
| United States – federal | 7.7 | 4.3 | (8.5 | ) | |||||||
| United States – state and local | 1.3 | (0.3 | ) | 0.1 | |||||||
| International | 38.6 | 51.1 | 52.9 | ||||||||
| Total current income tax expense | 47.6 | 55.1 | 44.5 | ||||||||
| Deferred income tax expense components: | |||||||||||
| United States – federal | 105.9 | 26.4 | 31.9 | ||||||||
| United States – state and local | 4.4 | (2.1 | ) | 6.0 | |||||||
| International | 36.7 | (3.4 | ) | (12.3 | ) | ||||||
| Total deferred income tax expense | 147.0 | 20.9 | 25.6 | ||||||||
| Income tax expense | $ | 194.6 | $ | 76.0 | $ | 70.1 | |||||
| Effective income tax rate | 62.9 | % | 29.4 | % | 18.3 | % | |||||
| For the Year Ended December 31 | 2023 | 2022 | 2021 | ||||||||||||||
| Income (loss) components: | |||||||||||||||||
| United States | $ | 164.6 | $ | 155.7 | $ | 199.4 | |||||||||||
| International | 354.9 | 306.1 | 309.7 | ||||||||||||||
| Income from continuing operations before income tax | 519.5 | 461.8 | 509.1 | ||||||||||||||
| Income tax expense (benefit) components: | |||||||||||||||||
| Current income tax expense (benefit): | |||||||||||||||||
| United States – federal | 41.3 | 32.6 | 21.1 | ||||||||||||||
| United States – state and local | 5.5 | 1.2 | 2.6 | ||||||||||||||
| International | 85.6 | 54.4 | 50.2 | ||||||||||||||
| Total current income tax expense | 132.4 | 88.2 | 73.9 | ||||||||||||||
| Deferred income tax expense (benefit) components: | |||||||||||||||||
| United States – federal | (14.1) | (0.2) | 96.9 | ||||||||||||||
| United States – state and local | (2.7) | 3.1 | 15.5 | ||||||||||||||
| International | (10.8) | — | 3.3 | ||||||||||||||
| Total deferred income tax expense (benefit) | (27.6) | 2.9 | 115.7 | ||||||||||||||
| Income tax expense | $ | 104.8 | $ | 91.1 | $ | 189.6 | |||||||||||
| Effective income tax rate | 20.2 | % | 19.7 | % | 37.2 | % | |||||||||||
| 2017 | 2016 | 2015 | ||||||
| Tax provision at U.S. statutory rate | 35.0 | % | 35.0 | % | 35.0 | % | ||
| Federal deferred taxes remeasurement - Tax Act | 27.8 | % | — | % | — | % | ||
| One-time tax on foreign earnings - Tax Act | 18.8 | % | — | % | — | % | ||
| Foreign tax rate differential | (8.6 | )% | (3.5 | )% | (4.7 | )% | ||
| Tax exempt interest | (7.8 | )% | (5.2 | )% | (6.7 | )% | ||
| Valuation allowance on deferred tax assets | 7.2 | % | 1.4 | % | 3.3 | % | ||
| Tax on undistributed foreign earnings | (4.8 | )% | 4.9 | % | (5.6 | )% | ||
| U.S. permanent items | (2.2 | )% | (1.9 | )% | (1.0 | )% | ||
| Italy patent box prior year benefit | (1.1 | )% | — | % | — | % | ||
| Audit settlements and unrecognized tax benefits | (0.8 | )% | (5.2 | )% | (5.0 | )% | ||
| U.S. tax on foreign earnings | 0.3 | % | 4.7 | % | 3.8 | % | ||
| State and local income tax | % | (0.1 | )% | 1.0 | % | |||
| Foreign tax holiday | — | % | — | % | (1.1 | )% | ||
| Other adjustments | (1.2 | )% | (0.7 | )% | (0.7 | )% | ||
| Effective income tax rate | 62.9 | % | 29.4 | % | 18.3 | % | ||
| For the Year Ended December 31 | 2023 | 2022 | 2021 | ||||||||||||||
| Tax provision at U.S. statutory rate | 21.0 | % | 21.0 | % | 21.0 | % | |||||||||||
| State and local income tax | 0.9 | % | 1.1 | % | 0.6 | % | |||||||||||
| U.S. tax on foreign earnings | 1.3 | % | 0.6 | % | 0.1 | % | |||||||||||
| Italy patent box | (1.1) | % | (1.2) | % | (1.3) | % | |||||||||||
| Foreign-Derived Intangible Income ("FDII") | (1.2) | % | (1.1) | % | (0.5) | % | |||||||||||
| Excess tax benefits on stock-based compensation | (0.2) | % | (0.5) | % | (0.6) | % | |||||||||||
| Audit settlements and unrecognized tax benefits | 2.7 | % | (0.2) | % | (1.0) | % | |||||||||||
| Valuation allowance on deferred tax assets | (3.1) | % | (0.2) | % | (0.4) | % | |||||||||||
| Tax on undistributed foreign earnings | 0.3 | % | (0.1) | % | 0.8 | % | |||||||||||
| Asbestos divestiture | — | % | — | % | 18.9 | % | |||||||||||
| Foreign tax rate differential | 1.6 | % | — | % | (0.2) | % | |||||||||||
| Amended tax return | (1.0) | % | — | % | — | % | |||||||||||
| Other adjustments | (1.0) | % | 0.3 | % | (0.2) | % | |||||||||||
| Effective income tax rate | 20.2 | % | 19.7 | % | 37.2 | % | |||||||||||
The Company intends to distribute all post-1986 earnings to the U.S. in future years, and therefore is no longer asserting permanent reinvestment of these earnings outside the U.S. Further, the Company will provideprovides for any U.S. state and foreign taxes on distributions of future earnings of its foreign subsidiaries as these earnings will not be considered permanently reinvested in the foreign countries.
U.S. cash needs. InThe Company is indefinitely reinvested in any excess of financial reporting over tax basis in its foreign subsidiaries that exceeds undistributed earnings and profits. At December 31, 2023, the event additional foreign funds are needed to support U.S. operations, and if U.S.indefinitely reinvested excess of financial reporting over tax has not already been previously provided, we would be required to accrue and pay additional U.S. taxes.basis was $325.5.
72
The Tax Act reducedfollowing table includes the U.S. corporate income tax rate to 21% from 35%. The Company has recorded tax expense of $86.0 in its consolidated financial statements for the year ended December 31, 2017 resulting from a decrease in its U.S. net deferred tax assets.
| 2017 | 2016 | ||||||
| Deferred Tax Assets: | |||||||
| Loss carryforwards | $ | 165.5 | $ | 112.3 | |||
| Asbestos | 118.7 | 209.8 | |||||
| Employee benefits | 70.8 | 98.9 | |||||
| Accruals | 51.3 | 74.8 | |||||
| Credit carryforwards | 5.7 | 50.7 | |||||
| Other | 23.1 | 21.2 | |||||
| Gross deferred tax assets | 435.1 | 567.7 | |||||
| Less: Valuation allowance | 170.0 | 113.3 | |||||
| Net deferred tax assets | $ | 265.1 | $ | 454.4 | |||
| Deferred Tax Liabilities: | |||||||
| Intangibles | $ | (45.4 | ) | $ | (68.3 | ) | |
| Undistributed earnings | (39.0 | ) | (52.3 | ) | |||
| Accelerated depreciation | (31.8 | ) | (36.5 | ) | |||
| Investment | (0.2 | ) | (0.4 | ) | |||
| Total deferred tax liabilities | $ | (116.4 | ) | $ | (157.5 | ) | |
| Net deferred tax assets | $ | 148.7 | $ | 296.9 | |||
| As of December 31 | 2023 | 2022 | |||||||||
| Deferred Tax Assets: | |||||||||||
| Loss carryforwards | $ | 97.0 | $ | 119.1 | |||||||
| Inventory | 24.1 | 20.5 | |||||||||
| Accruals | 27.1 | 26.0 | |||||||||
| Employee benefits | 39.0 | 34.1 | |||||||||
| Research and expenditures capitalization | 17.8 | 10.2 | |||||||||
| Credit carryforwards | 11.1 | 2.8 | |||||||||
| Other | 30.2 | 25.2 | |||||||||
| Gross deferred tax assets | 246.3 | 237.9 | |||||||||
| Less: Valuation allowance | 73.3 | 102.4 | |||||||||
| Net deferred tax assets | $ | 173.0 | $ | 135.5 | |||||||
| Deferred Tax Liabilities: | |||||||||||
| Intangibles | $ | (45.3) | $ | (42.2) | |||||||
| Undistributed earnings | (46.2) | (34.8) | |||||||||
| Accelerated depreciation | (24.1) | (24.3) | |||||||||
| Total deferred tax liabilities | $ | (115.6) | $ | (101.3) | |||||||
| Net deferred tax assets | $ | 57.4 | $ | 34.2 | |||||||
Deferred taxes are presentedincluded in theour Consolidated Balance Sheets were as follows:
| 2017 | 2016 | ||||||
| Non-current assets | $ | 149.9 | $ | 297.4 | |||
| Other non-current liabilities | (1.2 | ) | (0.5 | ) | |||
| Net deferred tax assets | $ | 148.7 | $ | 296.9 | |||
| As of December 31 | 2023 | 2022 | |||||||||
| Other non-current assets | $ | 76.0 | $ | 54.7 | |||||||
| Other non-current liabilities | (18.6) | (20.5) | |||||||||
| Net deferred tax assets | $ | 57.4 | $ | 34.2 | |||||||
The table included below provides a rollforward of our valuation allowance on net deferred income tax assets from December 31, 2014 to December 31, 2017.(DTA).
| Federal | State | Foreign | Total | ||||||||||||
| DTA valuation allowance - December 31, 2014 | $ | — | $ | 45.0 | $ | 102.1 | $ | 147.1 | |||||||
| Change in assessment | — | — | (7.4 | ) | (7.4 | ) | |||||||||
| Current year operations | — | (3.5 | ) | (0.5 | ) | (4.0 | ) | ||||||||
| DTA valuation allowance - December 31, 2015 | — | 41.5 | 94.2 | 135.7 | |||||||||||
| Change in assessment | — | — | (0.3 | ) | (0.3 | ) | |||||||||
| Current year operations | — | 4.4 | (26.5 | ) | (22.1 | ) | |||||||||
| DTA valuation allowance - December 31, 2016 | — | 45.9 | 67.4 | 113.3 | |||||||||||
| Current year operations | — | 26.5 | 30.2 | 56.7 | |||||||||||
| DTA valuation allowance - December 31, 2017 | $ | — | $ | 72.4 | $ | 97.6 | $ | 170.0 | |||||||
| State | Foreign | Total | |||||||||||||||||||||
| DTA valuation allowance as of December 31, 2020 | $ | 40.4 | $ | 82.6 | $ | 123.0 | |||||||||||||||||
| Change in assessment | — | (1.9) | (1.9) | ||||||||||||||||||||
| Current year operations | (4.7) | (7.6) | (12.3) | ||||||||||||||||||||
| DTA valuation allowance as of December 31, 2021 | $ | 35.7 | $ | 73.1 | $ | 108.8 | |||||||||||||||||
| Change in assessment | — | (1.1) | (1.1) | ||||||||||||||||||||
| Current year operations | 3.8 | (9.1) | (5.3) | ||||||||||||||||||||
| DTA valuation allowance as of December 31, 2022 | $ | 39.5 | $ | 62.9 | $ | 102.4 | |||||||||||||||||
| Change in assessment | (23.1) | (16.4) | (39.5) | ||||||||||||||||||||
| Current year operations | (0.8) | 11.2 | 10.4 | ||||||||||||||||||||
| DTA valuation allowance as of December 31, 2023 | $ | 15.6 | $ | 57.7 | $ | 73.3 | |||||||||||||||||
The Company continues to maintain a valuation allowance against certain deferred tax assets attributable to state net operating losses and tax credits, and certain foreign net deferred tax assets primarily in Luxembourg, Germany, China and Indiathe U.K. which are not expected to be realized. Management assesses the available positive and negative evidence to estimate whether sufficient future taxable income will be generated to permit the use of deferred tax assets. The cumulative loss incurred over the three-year period ending December 31, 2023 constitutes significant objective negative evidence, resulting in the recognition of a valuation allowance against the net deferred tax assets for these jurisdictions. Such objective negative evidence limits our ability to consider subjective positive evidence, such as our projections of future taxable income. The amount of the deferred tax asset considered realizable, however, could be adjusted if estimates of future taxable income change or if objective negative evidence in the form of cumulative losses is no longer present and additional weight can be given to subjective evidence.
73
We have the following tax attributes available for utilization at December 31, 2017:2023:
| Attribute | Amount | First Year of Expiration | |||
| U.S. federal net operating losses | $ | 0.1 | 12/31/2033 | ||
| U.S. state net operating losses | $ | 1,326.2 | 12/31/2018 | ||
| U.S. federal tax credits | $ | 0.2 | 12/31/2021 | ||
| U.S. state tax credits | $ | 5.5 | 12/31/2020 | ||
Foreign net operating losses(a) | $ | 350.0 | 12/31/2018 | ||
| Attribute | Amount | First Year of Expiration | |||||||||
| U.S. state net operating losses | $ | 312.6 | 12/31/2024 | ||||||||
| U.S. federal tax credits | 8.4 | 12/31/2029 | |||||||||
| U.S. state tax credits | 2.3 | 12/31/2027 | |||||||||
Foreign net operating losses(a) | 305.7 | 12/31/2024 | |||||||||
(a) Included areIncludes approximately $228.1$223.0 of net operating loss carryforwards in Luxembourg as of December 31, 2017 that do not expire.2023.
Excess tax benefits related to stock-based compensation of $2.7$0.9, $2.4 and $3.2 for 20172023, 2022 and 2021, respectively, were recorded as an income tax benefit in the statement of operations whereas the 2016 and 2015 amounts of $3.2 and $3.4, respectively, were recorded as an adjustment to retained earnings in the balance sheet. The change in presentation is due to the January 1, 2017 adoption of ASU 2016-09 that simplified several aspects of the accounting for employee share-based payment transactions. The 2017 income tax benefit hashave been reflected in the caption “U.S. permanent items”“Excess tax benefits on stock-based compensation” within the effective tax rate reconciliation table.
Uncertain Tax Positions
We recognize income tax benefits from uncertain tax positions only if, based on the technical merits of the position, it is more likely than not that the tax position will be sustained on examination by the taxing authorities. The tax benefits recognized in the Consolidated Financial Statements from such positions are measured based on the largest benefit that has a greater than 50% likelihood of being realized upon ultimate settlement.
| 2017 | 2016 | 2015 | |||||||||
| Unrecognized tax benefits – January 1 | $ | 69.5 | $ | 87.6 | $ | 160.1 | |||||
| Additions for: | |||||||||||
| Current year tax positions | 1.1 | 1.2 | 3.4 | ||||||||
| Prior year tax positions | — | 0.2 | 1.8 | ||||||||
| Assumed in acquisition | — | 0.2 | 1.9 | ||||||||
| Reductions for: | |||||||||||
| Prior year tax positions | (12.7 | ) | (3.8 | ) | (56.6 | ) | |||||
| Expiration of statute of limitations | (5.8 | ) | (5.0 | ) | (4.0 | ) | |||||
| Settlements | (0.2 | ) | (10.9 | ) | (19.0 | ) | |||||
| Unrecognized tax benefits – December 31 | $ | 51.9 | $ | 69.5 | $ | 87.6 | |||||
| For the Year Ended December 31 | 2023 | 2022 | 2021 | ||||||||||||||
| Unrecognized tax benefits – January 1 | $ | 6.7 | $ | 7.6 | $ | 41.5 | |||||||||||
| Additions for: | |||||||||||||||||
| Current year tax positions | 1.4 | 1.7 | 0.6 | ||||||||||||||
| Prior year tax positions | 0.5 | 0.3 | 0.1 | ||||||||||||||
| Reductions for: | |||||||||||||||||
| Prior year tax positions | (0.6) | (0.1) | (5.5) | ||||||||||||||
| Expiration of statute of limitations | (2.3) | (2.8) | (19.7) | ||||||||||||||
| Settlements | — | — | (9.4) | ||||||||||||||
| Unrecognized tax benefits – December 31 | $ | 5.7 | $ | 6.7 | $ | 7.6 | |||||||||||
As of December 31, 2017, $24.7 and $2.52023, $4.4 of the unrecognized tax benefits would affectimpact the effective tax rate for continuing operations, and discontinued operations respectively, if realized. The Company operates in various tax jurisdictions and is subject to examination by tax authorities in these jurisdictions. The Company is currently under examination in several jurisdictions including Canada, China,Czechia, Germany, Hong Kong,India, Italy, Korea, Mexico,and the U.S. and Venezuela.
The calculation of our tax liability for unrecognized tax benefits includes dealing with uncertainties in the application of complex tax laws and regulations in various tax jurisdictions. Due to the complexity of some uncertainties, the ultimate resolution may result in a payment that is materially different from our current estimate of the unrecognized tax benefit. Over the next 12 months, the net amount of the tax liability for unrecognized tax benefits in foreign and domestic jurisdictions couldis not expected to change by approximately $16 due to changes in audit status, expiration of statutes of limitations and other events. The settlement of any future examinations could result in changes in the amounts attributable to the Company under its existing Tax Matters Agreement with Exelis and Xylem.a significant amount.
The following table summarizes the earliest open tax years by major jurisdiction as of December 31, 2017:2023:
| Jurisdiction | |||||
| Earliest Open Year | |||||
| China | |||||
| Germany | |||||
| Korea | 2023 | ||||
| Luxembourg | 2017 | ||||
| Mexico | 2016 | ||||
| United States | |||||
74
We classify interest relating to tax matters as a component of interest expense and tax penalties as a component of income tax expense in our Consolidated Statements of Operations. During 2017, 20162023, 2022, and 20152021 we recognized a net interest benefit of $2.4, $2.9,$0.1, $0.0, and $5.7,$0.7, respectively, related to tax matters. We had $4.1, $6.8, and $9.8 of interest expense accrued from continuing and discontinued operations related to tax matters as of December 31, 2017, 2016, and 2015, respectively.
NOTE 67
EARNINGS PER SHARE DATA
The following table provides a reconciliation of the databasic to diluted common shares outstanding, used in the calculationcomputation of basic and diluted commonearnings per share presented in our Consolidated Statements of Operations.
| For the Year Ended December 31 | 2023 | 2022 | 2021 | ||||||||||||||
| Basic weighted average common shares outstanding | 82.3 | 83.4 | 86.0 | ||||||||||||||
| Add: Dilutive impact of outstanding equity awards | 0.4 | 0.3 | 0.5 | ||||||||||||||
| Diluted weighted average common shares outstanding | 82.7 | 83.7 | 86.5 | ||||||||||||||
There were 0.1 anti-dilutive shares outstanding for the three years endedas of December 31, 2017, 20162023, and 2015.
| 2017 | 2016 | 2015 | ||||||
| Basic weighted average common shares outstanding | 88.3 | 89.2 | 89.8 | |||||
| Add: Dilutive impact of outstanding equity awards | 0.7 | 0.7 | 0.9 | |||||
| Diluted weighted average common shares outstanding | 89.0 | 89.9 | 90.7 | |||||
| 2017 | 2016 | 2015 | |||||||||
| Anti-dilutive stock options | 0.3 | 0.7 | 0.4 | ||||||||
| Average exercise price | $ | 42.43 | $ | 38.34 | $ | 42.50 | |||||
| Year(s) of expiration | 2024 - 2025 | 2024 - 2026 | 2024 - 2025 | ||||||||
NOTE 78
RECEIVABLES, NET
| 2017 | 2016 | ||||||
| Trade accounts receivable | $ | 601.4 | $ | 513.5 | |||
| Notes receivable | 3.9 | 4.2 | |||||
Other(a) | 40.4 | 21.6 | |||||
| Receivables, gross | 645.7 | 539.3 | |||||
| Less: allowance for doubtful accounts | 16.1 | 15.4 | |||||
| Receivables, net | $ | 629.6 | $ | 523.9 | |||
| As of December 31 | 2023 | 2022 | |||||||||
| Trade accounts receivable | $ | 641.3 | $ | 614.0 | |||||||
| Notes receivable | 25.5 | 8.2 | |||||||||
| Other | 22.6 | 18.3 | |||||||||
| Receivables, gross | 689.4 | 640.5 | |||||||||
| Less: allowance for credit losses - receivables | (14.2) | (11.7) | |||||||||
| Receivables, net | $ | 675.2 | $ | 628.8 | |||||||
| As of December 31 | 2023 | 2022 | |||||||||
| Allowance for credit losses - receivables | $ | 14.2 | $ | 11.7 | |||||||
| Allowance for credit losses - contract assets | — | 0.5 | |||||||||
| Total allowance for credit losses | $ | 14.2 | $ | 12.2 | |||||||
The following table displays a rollforward of theour total allowance for doubtful accountscredit losses.
| 2023 | 2022 | 2021 | |||||||||||||||
| Total allowance for credit losses as of January 1 | $ | 12.2 | $ | 12.5 | $ | 15.6 | |||||||||||
Charges (recoveries) to income(a) | 2.2 | 2.0 | (2.0) | ||||||||||||||
| Write-offs | (0.9) | (2.0) | (1.0) | ||||||||||||||
| Foreign currency and other | 0.7 | (0.3) | (0.1) | ||||||||||||||
| Total allowance for credit losses as of December 31 | $ | 14.2 | $ | 12.2 | $ | 12.5 | |||||||||||
(a) During the years ended December 31, 2023 and 2022, we recognized bad debt expense of $1.2 and $1.6, respectively, relating to impacts stemming from the Russia-Ukraine war. See Note 1, Description of Business and Basis of Presentation, for further information.
75
NOTE 9
INVENTORIES
The following table summarizes our inventories.
| As of December 31 | 2023 | 2022 | |||||||||
| Raw materials | $ | 366.6 | $ | 342.7 | |||||||
| Work in process | 111.8 | 104.6 | |||||||||
| Finished goods | 97.0 | 86.6 | |||||||||
Inventories(a) | $ | 575.4 | $ | 533.9 | |||||||
(a) During the years ended December 31, 2023 and 2022, we recorded inventory write-downs of $1.1 and $5.2, respectively, related to inventories held by entities impacted by the Russia-Ukraine war. See Note 1, Description of Business and Basis of Presentation, for further information.
Government Assistance (ASU 2021-10)
Since the start of the COVID-19 pandemic, energy prices have been increasing throughout the world, particularly in Europe. These increases have prompted governments to put in place measures to shield businesses and consumers from the direct impact of rising prices. These measures include granting subsidies to help offset the high energy prices.
ASU 2021-10 requires entities to provide information about the nature of transactions, related policies and effect of government grants on an entity’s financial statements. In particular, in Italy, to qualify for an energy subsidy a company must apply for and receive a certificate attesting that the company is an "energy and gas consuming company" (high energy consumption connected to the production cycle). The amount of subsidies granted is calculated based on a percentage of actual consumption, ranging from 25% to 40%. One of our Italian subsidiaries within our MT segment obtained this certificate and was granted energy subsidies from the Italian government beginning in April 2022. This program concluded in the second quarter of 2023. For the years ended December 31, 2023 and 2022, we recognized a benefit related to energy subsidies of $6.3 and $7.3, respectively, which we recorded within Costs of revenue in our Consolidated Statements of Operations. There was no other material government assistance received by the Company or any of our subsidiaries during the year.
NOTE 10
OTHER CURRENT AND NON-CURRENT ASSETS
The following table summarizes our other current and non-current assets.
| As of December 31 | 2023 | 2022 | |||||||||
| Advance payments and other prepaid expenses | $ | 55.3 | $ | 45.0 | |||||||
| Current contract assets, net | 25.8 | 26.3 | |||||||||
| Prepaid income taxes | 16.9 | 25.1 | |||||||||
| Other | 19.9 | 16.5 | |||||||||
| Other current assets | $ | 117.9 | $ | 112.9 | |||||||
| Other employee benefit-related assets | $ | 128.6 | $ | 119.8 | |||||||
| Operating lease right-of-use assets | 87.4 | 73.8 | |||||||||
| Deferred income taxes | 76.0 | 54.7 | |||||||||
| Equity method and other investments | 46.6 | 42.9 | |||||||||
| Capitalized software costs | 7.9 | 12.4 | |||||||||
| Environmental-related assets | 6.0 | 9.6 | |||||||||
| Other | 28.5 | 25.9 | |||||||||
| Other non-current assets | $ | 381.0 | $ | 339.1 | |||||||
76
NOTE 11
PLANT, PROPERTY AND EQUIPMENT, NET
The following table summarizes our property, plant, and equipment, net of accumulated depreciation.
| As of December 31 | Useful life (in years) | 2023 | 2022 | ||||||||||||||
| Machinery and equipment | 2 - 10 | $ | 1,317.9 | $ | 1,208.3 | ||||||||||||
| Buildings and improvements | 5 - 40 | 298.4 | 277.6 | ||||||||||||||
| Furniture, fixtures and office equipment | 3 - 7 | 83.7 | 80.5 | ||||||||||||||
| Construction in progress | 78.1 | 86.9 | |||||||||||||||
| Land and improvements | 29.5 | 29.3 | |||||||||||||||
| Other | 1.7 | 3.3 | |||||||||||||||
| Plant, property and equipment, gross | 1,809.3 | 1,685.9 | |||||||||||||||
| Less: accumulated depreciation | (1,248.3) | (1,159.1) | |||||||||||||||
| Plant, property and equipment, net | $ | 561.0 | $ | 526.8 | |||||||||||||
Depreciation expense of $84.2, $80.7, and $85.8 was recognized in 2023, 2022 and 2021, respectively.
During 2022, we recorded a gain of $14.7 related to the sale of a former operating facility that was previously held by a business within our IP segment. During 2021, we recorded a gain of $7.0 related to the sale of land that was previously held by a business within our MT segment. These gains were recorded within Gain on sale of long-lived assets in our Consolidated Statements of Operations for the years ended December 31, 2017, 2016,2022 and 2015.2021.
| 2017 | 2016 | 2015 | |||||||||
| Allowance for doubtful accounts – January 1 | $ | 15.4 | $ | 16.1 | $ | 13.3 | |||||
| Charges to income | 3.6 | 1.5 | 3.6 | ||||||||
| Write-offs | (4.4 | ) | (1.5 | ) | (0.8 | ) | |||||
| Foreign currency and other | 1.5 | (0.7 | ) | — | |||||||
| Allowance for doubtful accounts – December 31 | $ | 16.1 | $ | 15.4 | $ | 16.1 | |||||
| 2017 | 2016 | ||||||
| Finished goods | $ | 55.9 | $ | 53.0 | |||
| Work in process | 54.8 | 60.5 | |||||
| Raw materials | 184.4 | 166.0 | |||||
| Inventoried costs related to long-term contracts | 38.1 | 33.5 | |||||
| Total inventory before progress payments | 333.2 | 313.0 | |||||
| Less – progress payments | (21.3 | ) | (17.8 | ) | |||
| Inventories, net | $ | 311.9 | $ | 295.2 | |||
| 2017 | 2016 | ||||||
| Asbestos-related current assets | $ | 64.7 | $ | 66.0 | |||
| Prepaid income tax | 30.3 | 7.6 | |||||
| Other | 52.4 | 48.4 | |||||
| Other current assets | $ | 147.4 | $ | 122.0 | |||
| Other employee benefit-related assets | $ | 111.3 | $ | 96.5 | |||
| Capitalized software costs | 41.9 | 38.1 | |||||
| Environmental-related assets | 24.5 | 33.4 | |||||
| Equity method investments | 6.7 | 5.6 | |||||
| Other | 18.5 | 14.8 | |||||
| Other non-current assets | $ | 202.9 | $ | 188.4 | |||
NOTE 10
| 2017 | 2016 | ||||||
| Machinery and equipment | $ | 1,039.9 | $ | 898.6 | |||
| Buildings and improvements | 262.5 | 244.6 | |||||
| Furniture, fixtures and office equipment | 74.5 | 68.0 | |||||
| Construction work in progress | 58.4 | 68.5 | |||||
| Land and improvements | 28.7 | 28.2 | |||||
| Other | 10.9 | 5.3 | |||||
| Plant, property and equipment, gross | 1,474.9 | 1,313.2 | |||||
| Less: accumulated depreciation | (953.2 | ) | (848.7 | ) | |||
| Plant, property and equipment, net | $ | 521.7 | $ | 464.5 | |||
GOODWILL AND OTHER INTANGIBLE ASSETS, NET
Goodwill
| Motion Technologies | Industrial Process | Connect & Control Technologies | Total | ||||||||||||||||||||
| Goodwill as of December 31, 2021 | $ | 292.3 | $ | 352.4 | $ | 279.6 | $ | 924.3 | |||||||||||||||
| Goodwill acquired | — | 62.9 | 0.3 | 63.2 | |||||||||||||||||||
| Foreign currency translation | (4.6) | (16.6) | (1.5) | (22.7) | |||||||||||||||||||
| Goodwill as of December 31, 2022 | $ | 287.7 | $ | 398.7 | $ | 278.4 | $ | 964.8 | |||||||||||||||
| Goodwill acquired | — | — | 44.6 | 44.6 | |||||||||||||||||||
Allocated to divestiture of business(a) | — | — | (2.7) | (2.7) | |||||||||||||||||||
| Foreign currency translation | 4.6 | 4.3 | 0.7 | 9.6 | |||||||||||||||||||
| Goodwill as of December 31, 2023 | $ | 292.3 | $ | 403.0 | $ | 321.0 | $ | 1,016.3 | |||||||||||||||
(a)During the fourth quarter of 2023, we completed the sale of our Matrix business, which was previously included within our CCT segment. Goodwill of $0.3 was allocated to the divestiture. Additionally, during the second quarter of 2023, we completed the sale of a product line within our CCT segment. Goodwill of $2.4 was allocated to the divestiture. See Note 22, Acquisitions, Investments, and Divestitures, for the years ended December 31, 2017 and 2016 by segment are as follows:
Industrial Process | Motion Technologies | Connect & Control Technologies | Total | ||||||||||||
| Goodwill - December 31, 2015 | $ | 312.6 | $ | 201.0 | $ | 264.7 | $ | 778.3 | |||||||
| Adjustments to purchase price allocations | — | 2.6 | 0.4 | 3.0 | |||||||||||
| Foreign currency | (4.2 | ) | (1.3 | ) | (1.1 | ) | (6.6 | ) | |||||||
| Goodwill - December 31, 2016 | $ | 308.4 | $ | 202.3 | $ | 264.0 | $ | 774.7 | |||||||
| Goodwill acquired | — | 91.2 | — | 91.2 | |||||||||||
| Adjustments to purchase price allocations | — | (8.2 | ) | — | (8.2 | ) | |||||||||
| Foreign currency | 16.1 | 10.3 | 2.7 | 29.1 | |||||||||||
| Goodwill - December 31, 2017 | $ | 324.5 | $ | 295.6 | $ | 266.7 | $ | 886.8 | |||||||
Goodwill acquired during 2017 relates to our acquisition of Axtone and represents the excesspreliminary calculation of the excess purchase price over the net assets acquired. During the year ended December 31, 2023, goodwill acquired theis related to our acquisition of Micro-Mode. The valuation of whichMicro-Mode is expected to be completed in the first quarter of 2018.pending completion. Upon completion, of the valuation, goodwill acquired will be adjusted to reflectbased on the final fair valuevalues of the net assets acquired. SeeFor the year ended December 31, 2022, goodwill acquired is related to our acquisitions of Habonim and a product line from Clippard Instrument Laboratory, Inc. (Clippard). Refer to Note 21,22, Acquisitions, Investments, and Divestitures, for further information.
77
Other Intangible Assets, Net
| 2023 | 2022 | ||||||||||||||||||||||||||||||||||
| As of December 31 | Gross Carrying Amount | Accumulated Amortization | Net Intangibles | Gross Carrying Amount | Accumulated Amortization | Net Intangibles | |||||||||||||||||||||||||||||
Customer relationships(a) | $ | 202.4 | $ | (138.4) | $ | 64.0 | $ | 191.5 | $ | (127.1) | $ | 64.4 | |||||||||||||||||||||||
| Proprietary technology | 61.5 | (32.5) | 29.0 | 59.2 | (30.8) | 28.4 | |||||||||||||||||||||||||||||
| Trademarks and other | 22.0 | (17.5) | 4.5 | 17.6 | (16.6) | 1.0 | |||||||||||||||||||||||||||||
| Total finite-lived intangibles | 285.9 | (188.4) | 97.5 | 268.3 | (174.5) | 93.8 | |||||||||||||||||||||||||||||
| Indefinite-lived intangibles | 19.1 | — | 19.1 | 19.0 | — | 19.0 | |||||||||||||||||||||||||||||
| Other intangible assets | $ | 305.0 | $ | (188.4) | $ | 116.6 | $ | 287.3 | $ | (174.5) | $ | 112.8 | |||||||||||||||||||||||
(a)During the fourth quarter of 2023, we completed the sale of our Matrix business, which was previously included within our CCT segment. Customer relationships with a net book value of $5.5 were written off as follows:
| December 31, 2017 | December 31, 2016 | ||||||||||||||||||||||
Gross Carrying Amount | Accumulated Amortization | Net Intangibles | Gross Carrying Amount | Accumulated Amortization | Net Intangibles | ||||||||||||||||||
| Customer relationships | $ | 166.2 | $ | (74.4 | ) | $ | 91.8 | $ | 155.8 | $ | (59.3 | ) | $ | 96.5 | |||||||||
| Proprietary technology | 54.4 | (21.8 | ) | 32.6 | 52.5 | (16.8 | ) | 35.7 | |||||||||||||||
| Patents and other | 13.5 | (9.2 | ) | 4.3 | 9.0 | (7.6 | ) | 1.4 | |||||||||||||||
| Finite-lived intangible total | 234.1 | (105.4 | ) | 128.7 | 217.3 | (83.7 | ) | 133.6 | |||||||||||||||
| Indefinite-lived intangibles | 27.5 | — | 27.5 | 26.7 | — | 26.7 | |||||||||||||||||
| Other Intangible Assets | $ | 261.6 | $ | (105.4 | ) | $ | 156.2 | $ | 244.0 | $ | (83.7 | ) | $ | 160.3 | |||||||||
| Useful life (in years) | Fair value | ||||||||||
| Customer relationships | 20 | $ | 18.5 | ||||||||
| Developed technology | 20 | 5.5 | |||||||||
| Trade name | 20 | 2.3 | |||||||||
| Backlog | <2 | 1.9 | |||||||||
| Other | 10 | 0.5 | |||||||||
| Total intangible assets acquired | $ | 28.7 | |||||||||
Refer to Note 22, Acquisitions, Investments, and trademarks.
Customer relationships, proprietary technology and patentstrademarks and other intangible assets are amortized over weighted average lives of approximately 12.313.6 years, 13.214.4 years and 11.37.1 years, respectively.
Amortization expense related to intangible assets for 2017, 20162023, 2022 and 20152021 was $18.9, $20.1$19.1, $20.8, and $14.0,$18.9, respectively. Estimated amortization expense for each of the five succeeding years and thereafter is as follows:
| 2024 | $ | 15.9 | |||
| 2025 | 14.0 | ||||
| 2026 | 10.7 | ||||
| 2027 | 8.7 | ||||
| 2028 | 8.7 | ||||
| Thereafter | 39.5 | ||||
| Year | Estimated Amortization Expense | ||
| 2018 | $ | 18.1 | |
| 2019 | 18.1 | ||
| 2020 | 17.9 | ||
| 2021 | 17.9 | ||
| 2022 | 16.2 | ||
| Thereafter | 40.5 | ||
78
NOTE 1213
ACCOUNTS PAYABLE, ACCRUED LIABILITIES AND OTHER NON-CURRENT LIABILITIES
| 2017 | 2016 | ||||||
| Compensation and other employee-related benefits | $ | 147.2 | $ | 120.5 | |||
| Asbestos-related liability | 77.1 | 76.8 | |||||
| Customer-related liabilities | 45.5 | 39.9 | |||||
| Accrued income taxes and other tax-related liabilities | 36.1 | 31.0 | |||||
| Environmental and other legal matters | 22.8 | 25.1 | |||||
| Accrued warranty costs | 17.0 | 17.4 | |||||
| Other accrued liabilities | 38.7 | 39.5 | |||||
| Accrued and other current liabilities | $ | 384.4 | $ | 350.2 | |||
| Environmental liabilities | $ | 63.6 | $ | 63.2 | |||
| Compensation and other employee-related benefits | 36.4 | 33.0 | |||||
| Deferred income taxes and other tax-related liabilities | 19.3 | 24.9 | |||||
| Other | 56.3 | 59.9 | |||||
| Other non-current liabilities | $ | 175.6 | $ | 181.0 | |||
| As of December 31 | 2023 | 2022 | |||||||||
| Compensation and other employee-related benefits | $ | 165.5 | $ | 134.4 | |||||||
| Contract liabilities and other customer-related liabilities | 133.6 | 92.2 | |||||||||
| Accrued income taxes and other tax-related liabilities | 30.7 | 27.1 | |||||||||
| Operating lease liabilities | 19.5 | 19.0 | |||||||||
| Accrued warranty costs | 14.0 | 14.3 | |||||||||
| Environmental and other legal matters | 5.8 | 5.7 | |||||||||
| Accrued restructuring costs | 4.8 | 3.9 | |||||||||
| Other | 39.2 | 36.8 | |||||||||
| Accrued and other current liabilities | $ | 413.1 | $ | 333.4 | |||||||
| Operating lease liabilities | $ | 72.3 | $ | 58.9 | |||||||
| Environmental liabilities | 52.0 | 53.1 | |||||||||
| Deferred income taxes and other tax-related liabilities | 25.0 | 31.1 | |||||||||
| Compensation and other employee-related benefits | 38.0 | 25.0 | |||||||||
| Non-current maturities of long-term debt | 5.7 | 7.7 | |||||||||
| Other | 24.0 | 24.4 | |||||||||
| Other non-current liabilities | $ | 217.0 | $ | 200.2 | |||||||
Supply Chain Financing
The Company has supply chain financing ("SCF") programs in place under which participating suppliers may elect to obtain payment from an intermediary. The Company confirms the validity of invoices from participating suppliers and agrees to pay the intermediary an amount based on invoice totals. The majority of amounts payable under these programs are due within 90 to 180 days and are considered commercially reasonable. There are no assets pledged as security or other forms of guarantees provided for the committed payments. As of December 31, 2023 and 2022, there were $19.7 and $12.9, respectively, of outstanding amounts payable to suppliers who have elected to participate in these SCF programs. These amounts were recorded within Accounts payable in our Consolidated Balance Sheets.
79
NOTE 14
LEASES
The Company’s lease portfolio primarily relates to real estate, which may be used for manufacturing or non-manufacturing purposes (e.g., office space), and contains lease terms generally ranging between one and 18 years. Our lease portfolio also includes vehicles and equipment. Substantially all of our leases expire at various dates through 2027 and may include renewal and payment escalation clauses. ITT often pays maintenance, insurance and tax expenseare classified as operating leases.
Lease costs associated with fixed payments related to leased assets. Rental expenses underthe Company's operating leases were $25.4, $21.1$30.2, $26.6, and $18.6$25.7 for 2017, 2016the years ended December 31, 2023, 2022 and 2015,2021, respectively. Future minimumShort-term lease costs, variable lease costs, and sublease income related to our operating leases, as well as total lease payments undercosts related to our finance leases, were not material for the years ended December 31, 2023, 2022 and 2021.
The following table displays our future lease obligations related to non-cancellable operating leases with an initial term in excess of one year12 months as of December 31, 2017 are shown below.2023.
| 2024 | $ | 23.1 | |||
| 2025 | 20.0 | ||||
| 2026 | 17.1 | ||||
| 2027 | 12.4 | ||||
| 2028 | 9.3 | ||||
| Thereafter | 23.0 | ||||
| Total undiscounted future operating lease obligations | 104.9 | ||||
| Less: imputed interest | 13.1 | ||||
Present value of future operating lease obligations(a) | $ | 91.8 | |||
| 2018 | $ | 24.8 | |
| 2019 | 20.2 | ||
| 2020 | 17.0 | ||
| 2021 | 16.6 | ||
| 2022 | 14.4 | ||
| 2023 and thereafter | 58.2 | ||
| Total minimum lease payments | $ | 151.2 | |
| As of or for the Year Ended December 31 | 2023 | 2022 | |||||||||
Operating cash outflows from operating leases(a) | $ | 24.5 | $ | 25.9 | |||||||
| Right-of-use assets obtained in exchange for new operating lease liabilities | $ | 32.5 | $ | 18.3 | |||||||
| Weighted average remaining lease term (in years) | 6.1 | 5.8 | |||||||||
Weighted average discount rate(b) | 3.4 | % | 2.7 | % | |||||||
(a)Included within Other, net in our Consolidated Statements of Cash Flows.
(b)We use a discount rate for each lease based on an estimated incremental borrowing rate over a similar term as the lease, as the discount rate implicit in each lease cannot be readily determined.
In May 2022, we relocated our corporate headquarters from White Plains, New York to Stamford, Connecticut. During 2022, we terminated our former corporate headquarters lease, which resulted in an asset impairment charge of $1.7, reflected within our Consolidated Statements of Operations.
80
NOTE 1415
DEBT
The following table summarizes our outstanding debt obligations.
| 2017 | 2016 | ||||||
| Commercial Paper | $ | 162.4 | $ | 113.5 | |||
| Short-term loans | — | 100.0 | |||||
| Current maturities of long-term debt | 0.9 | 0.6 | |||||
| Current capital leases | 0.3 | 0.2 | |||||
| Short-term loans and current maturities of long-term debt | 163.6 | 214.3 | |||||
| Non-current maturities of long-term debt | 8.2 | 1.8 | |||||
| Non-current capital leases | 0.1 | 0.2 | |||||
| Long-term debt and capital leases | 8.3 | 2.0 | |||||
| Total debt and capital leases | $ | 171.9 | $ | 216.3 | |||
| As of December 31 | 2023 | 2022 | |||||||||
Commercial paper(a) | $ | 184.9 | $ | 448.3 | |||||||
| Short-term loans | 0.5 | 0.5 | |||||||||
| Current maturities of long-term debt | 2.3 | 2.2 | |||||||||
| Total short-term borrowings | 187.7 | 451.0 | |||||||||
| Non-current maturities of long-term debt | 5.7 | 7.7 | |||||||||
| Total debt | $ | 193.4 | $ | 458.7 | |||||||
Commercial Paper
| As of or for the Year Ended December 31 | 2023 | 2022 | ||||||||||||
| Commercial Paper Outstanding - U.S. Program | $ | 184.9 | $ | 299.2 | ||||||||||
| Commercial Paper Outstanding - Euro Program | — | 149.1 | ||||||||||||
| Total Commercial Paper Outstanding | $ | 184.9 | $ | 448.3 | ||||||||||
| Weighted Average Interest Rate - U.S. Program | 5.61 | % | 4.92 | % | ||||||||||
| Weighted Average Interest Rate - Euro Program | N/A | 2.31 | % | |||||||||||
Outstanding commercial paper for both periods had maturity terms less than one monththree months from the date of issuance as of December 31, 2017 and 2016, respectively.issuance.
On November 25, 2014,August 5, 2021, we entered into a competitive advance and revolving credit facility agreement (the Revolving Credit Agreement) with a consortiumsyndicate of third party lenders including JP Morgan Chase Bank of America, N.A., as administrative agent and Citibank, N.A., as syndication agent. On(the 2021 Revolving Credit Agreement). Upon its effectiveness, this agreement replaced our existing $500 revolving credit facility due November 29, 2016, we amended the2022 (the 2014 Revolving Credit Agreement). The 2021 Revolving Credit Agreement to extend the maturity date from November 25, 2019 to November 25, 2021. The interest ratematures in August 2026 and fees associated with drawn amounts are unchanged. The Revolving Credit Agreement provides for an aggregate principal amount of up to $500$700. The 2021 Revolving Credit Agreement provides for a potential increase of (i)commitment of up to $350 for a possible maximum of $1,050 in aggregate commitments at the request of the Company and with the consent of the institutions providing such increase of commitments.
On May 10, 2023, we entered into the First Amendment (the Amendment) to the Company’s 2021 Revolving Credit Agreement. In connection with the phase out of LIBOR as a reference interest rate, the Amendment replaced LIBOR as a benchmark for United States Dollar revolving extensions of credit (the revolving loans) outstanding at any time, (ii) competitive advance borrowing option which will be provided on an uncommitted competitive advance basis through an auction mechanism (the competitive advances)borrowings with the term secured overnight financing rate (Term SOFR), and (iii) letters of credit inreplaced LIBOR as a face amount up to $100 at any time outstanding. Subject to certain conditions, we are permitted to terminate permanentlybenchmark for Euro swing line borrowings with the total commitments and reduce commitments in minimum amounts of $10. We are also permitted, subject to certain conditions, to request that lenders increaseeuro overnight short-term rate (ESTR). The Amendment did not have a significant impact on the commitments underCompany’s consolidated financial statements.
Since the facility by up to $200 for a maximum aggregate principal amount of $700. Borrowings under the credit facility are available in U.S. dollars, Euros or British pound sterling.
As of December 31, 2017,2023 and December 31, 2022, we had no outstanding obligations under the current or former revolving credit facility. As of December 31, 2016, we had $100 outstanding under the credit facility, with an associated interest rate of 1.87%.
The credit facility2021 Revolving Credit Agreement contains customary affirmative and negative covenants that, among other things, will limit or restrict our ability to: incur additional debt or issue guarantees; create liens; enter into certain sale and lease-back transactions;liens; merge or consolidate with another person; sell, transfer, lease or otherwise dispose of assets; liquidate or dissolve; and enter
81
into restrictive covenants. Additionally, the 2021 Revolving Credit Agreement requires us not to permit the ratio of consolidated total indebtedness to consolidated earnings before interest, taxes, depreciation and amortization (EBITDA) (leverage ratio) to exceed 3.003.50 to 1.00, at any time, or the ratiowith a qualified acquisition step up immediately following such qualified acquisition of consolidated EBITDA4.00 to consolidated interest expense (interest coverage ratio)1.00 for four quarters, 3.75 to be less than 3.001.00 for two quarters thereafter, and returning to 1.00. At3.50 to 1.00 thereafter.
As of December 31, 2017, our interest coverage ratio and2023, all financial covenants (e.g., leverage ratioratio) associated with the 2021 Revolving Credit Agreement were within the prescribed thresholds.In the event
Long-term Debt
Our long-term debt is primarily related to outstanding Italian government loans maturing in June 2027. Our long-term debt carries a weighted average fixed interest rate of certain ratings downgrades0.86% and requires annual principal and interest payments of approximately $2.0, on average, through maturity. The non-current portion of long-term debt is presented within other non-current liabilities in our Consolidated Balance Sheets.
Subsequent Event
On January 12, 2024, ITT Italia S.r.l. (“ITT Italia”), an indirect wholly owned subsidiary of ITT, entered into a facility agreement (the “ITT Italia Credit Agreement”), among the Company, as a guarantor, ITT Italia, as borrower, and BNP Paribas, Italian Branch, as bookrunner, sole underwriter and global coordinator, mandated lead arranger and agent.
The ITT Italia Credit Agreement has an initial maturity of three years and provides for term loan borrowings in an aggregate principal amount of €300 million, €275 million of which have been used to finance the Company’s acquisition of Svanehøj Group A/S, which closed on January 19, 2024.
The interest rate per annum on the ITT Italia Credit Agreement is based on the EURIBOR rate for Euros, plus a level below investment grade,margin of 1.00%. The margin and fees are subject to adjustment should the directCompany’s credit ratings change.
The ITT Italia Credit Agreement contains customary affirmative and indirect significant U.S. subsidiaries of the Company would be requirednegative covenants, as well as financial covenants (e.g., leverage ratio), that are similar to guarantee the obligations under the credit facilitythose contained in our 2021 Revolving Credit Agreement, as described above.
82
NOTE 1516
POSTRETIREMENT BENEFIT PLANS
Defined Contribution Plans
Substantially all of ITT’s U.S. and certain international employees are eligible to participate in a defined contribution plan. ITT sponsors numerous defined contribution savings plans, which allow employees to contribute a portion of their pre-tax and/or after-tax income in accordance with specified guidelines. Several of theCertain plans require us to match a percentageportion of the employee contributions up to certain limits.contributions. Company contributions charged to incomeexpense amounted to $16.7, $17.3, $16.5 and $18.4$14.5 for 2017, 20162023, 2022 and 2015,2021, respectively.
The ITT Stock Fund, an investment option for certain ITTin our U.S. based defined contribution plans,plan, is considered an employee stock ownership plan and, as a result, participants in the ITT Stock Fund may receive dividends in cash or may reinvest such dividends into the ITT Stock Fund. The ITT Stock Fund held approximately 0.20.1 shares of ITT common stock at December 31, 2017.2023.
Defined Benefit Plans
ITT currently sponsors numerousa number of defined benefit pension plans, primarily outside of the U.S., which have approximately 2,000970 active participants; however, most of these plans have been closed to new participants. As of December 31, 2017,2023, international pension plans represented 87% of our total projected pension benefit obligation, the ITT Consolidated Hourly Pension Plan represented 39%, the ITT Industrial Process Pension Plan represented 35%, otherobligation. There is one remaining U.S. plans represented 4% and international pension plans represented 22%. The U.S. plans are generally for hourly employees with a flat dollar benefit formula based on years of service.plan, which is frozen to new participants. International plan benefits are primarily determined based on participant years of service, future compensation, and age at retirement or termination.
ITT also provides health care and life insurance benefits for eligiblecertain unionized employees in the U.S. employees upon retirement. In some cases, the plan is still open to certain union employees, but for the majorityNearly all of our businesses these plans are closed to new participants. The majority of the liability pertains to retirees with postretirement medical insurance.
Other Postretirement Employee Benefit (OPEB) Plan Amendment and Remeasurement
On July 31, 2022, management approved changes to a postretirement medical plan, covering certain unionized employees and retirees within our IP business. These changes closed the plan to new hires and, beginning in 2023, plan participants will receive a fixed contribution into a Health Reimbursement account. The plan amendment resulted in a decrease in our other postretirement benefit obligation and a prior service credit of $8.1 in 2022. The prior service credit was reflected in other comprehensive income and will be recognized into net income over approximately 10 years.
Balance Sheet Information
| 2017 | 2016 | ||||||||||||||||||||||
| Pension | Other Benefits | Total | Pension | Other Benefits | Total | ||||||||||||||||||
| Fair value of plan assets | $ | 321.5 | $ | 5.2 | $ | 326.7 | $ | 263.1 | $ | 6.1 | $ | 269.2 | |||||||||||
| Projected benefit obligation | 419.0 | 138.1 | 557.1 | 392.2 | 138.8 | 531.0 | |||||||||||||||||
| Funded status | $ | (97.5 | ) | $ | (132.9 | ) | $ | (230.4 | ) | $ | (129.1 | ) | $ | (132.7 | ) | $ | (261.8 | ) | |||||
| Amounts reported within: | |||||||||||||||||||||||
| Non-current assets | $ | 10.3 | $ | — | $ | 10.3 | $ | — | $ | — | $ | — | |||||||||||
| Accrued liabilities | (4.8 | ) | (8.6 | ) | (13.4 | ) | (3.7 | ) | (9.5 | ) | (13.2 | ) | |||||||||||
| Non-current liabilities | (103.0 | ) | (124.3 | ) | (227.3 | ) | (125.4 | ) | (123.2 | ) | (248.6 | ) | |||||||||||
| 2023 | 2022 | ||||||||||||||||||||||||||||||||||
| As of December 31 | Pension | Other Benefits | Total | Pension | Other Benefits | Total | |||||||||||||||||||||||||||||
| Fair value of plan assets | $ | 0.4 | $ | — | $ | 0.4 | $ | 0.4 | $ | — | $ | 0.4 | |||||||||||||||||||||||
| Projected benefit obligation | 84.4 | 66.2 | 150.6 | 79.1 | 70.7 | 149.8 | |||||||||||||||||||||||||||||
| Funded status | $ | (84.0) | $ | (66.2) | $ | (150.2) | $ | (78.7) | $ | (70.7) | $ | (149.4) | |||||||||||||||||||||||
| Amounts reported within: | |||||||||||||||||||||||||||||||||||
| Non-current assets | $ | 0.2 | $ | — | $ | 0.2 | $ | 0.2 | $ | — | $ | 0.2 | |||||||||||||||||||||||
| Accrued liabilities | (5.5) | (6.2) | (11.7) | (5.6) | (6.8) | (12.4) | |||||||||||||||||||||||||||||
| Non-current liabilities | (78.7) | (60.0) | (138.7) | (73.3) | (63.9) | (137.2) | |||||||||||||||||||||||||||||
A portion of our projected benefit obligation includes amounts that have not yet been recognized as expense in our results of operations. Such amounts are recorded within accumulated other comprehensive loss until they are amortized as a component of net periodic postretirement cost.
83
The following table provides a summary of amounts recorded within accumulated other comprehensive loss at December 31, 2017 and 2016.loss.
| 2017 | 2016 | ||||||||||||||||||||||
| Pension | Other Benefits | Total | Pension | Other Benefits | Total | ||||||||||||||||||
| Net actuarial loss | $ | 141.1 | $ | 56.3 | $ | 197.4 | $ | 154.0 | $ | 59.6 | $ | 213.6 | |||||||||||
| Prior service cost (benefit) | 2.0 | (44.3 | ) | (42.3 | ) | 5.1 | (50.5 | ) | (45.4 | ) | |||||||||||||
| Total | $ | 143.1 | $ | 12.0 | $ | 155.1 | $ | 159.1 | $ | 9.1 | $ | 168.2 | |||||||||||
| 2023 | 2022 | ||||||||||||||||||||||||||||||||||
| As of December 31 | Pension | Other Benefits | Total | Pension | Other Benefits | Total | |||||||||||||||||||||||||||||
| Net actuarial loss | $ | 9.5 | $ | 0.4 | $ | 9.9 | $ | 5.7 | $ | 3.4 | $ | 9.1 | |||||||||||||||||||||||
| Prior service cost (benefit) | 0.3 | (18.5) | (18.2) | 0.3 | (24.6) | (24.3) | |||||||||||||||||||||||||||||
| Total | $ | 9.8 | $ | (18.1) | $ | (8.3) | $ | 6.0 | $ | (21.2) | $ | (15.2) | |||||||||||||||||||||||
The following table providestables provide a rollforward of the projected benefit obligationsobligation, plan assets and funded status for our U.S. and international pension plans and our other employee-related defined benefit plans forplans.
| 2023 | 2022 | ||||||||||||||||||||||||||||||||||||||||||||||
| For the Year Ended December 31 | U.S. Pension | Int’l Pension | Other Benefits | Total | U.S. Pension | Int’l Pension | Other Benefits | Total | |||||||||||||||||||||||||||||||||||||||
| Change in benefit obligation | |||||||||||||||||||||||||||||||||||||||||||||||
| Benefit obligation as of January 1 | $ | 11.2 | $ | 67.9 | $ | 70.7 | $ | 149.8 | $ | 14.8 | $ | 93.1 | $ | 106.4 | $ | 214.3 | |||||||||||||||||||||||||||||||
| Service cost | — | 0.8 | 0.3 | 1.1 | — | 1.2 | 0.6 | 1.8 | |||||||||||||||||||||||||||||||||||||||
| Interest cost | 0.6 | 2.4 | 3.1 | 6.1 | 0.3 | 1.0 | 2.2 | 3.5 | |||||||||||||||||||||||||||||||||||||||
| Amendments | — | — | — | — | — | — | (8.1) | (8.1) | |||||||||||||||||||||||||||||||||||||||
Actuarial loss (gain)(a) | 0.3 | 3.4 | (2.9) | 0.8 | (3.0) | (18.3) | (23.3) | (44.6) | |||||||||||||||||||||||||||||||||||||||
| Benefits paid | (0.9) | (3.2) | (5.0) | (9.1) | (0.9) | (3.1) | (7.1) | (11.1) | |||||||||||||||||||||||||||||||||||||||
| Settlement | — | (0.4) | — | (0.4) | — | — | — | — | |||||||||||||||||||||||||||||||||||||||
| Foreign currency translation | — | 2.3 | — | 2.3 | — | (6.0) | — | (6.0) | |||||||||||||||||||||||||||||||||||||||
| Benefit obligation as of December 31 | $ | 11.2 | $ | 73.2 | $ | 66.2 | $ | 150.6 | $ | 11.2 | $ | 67.9 | $ | 70.7 | $ | 149.8 | |||||||||||||||||||||||||||||||
(a)The actuarial gain in 2022 is primarily due to an increase in discount rates during the years ended December 31, 2017 and 2016.
| 2017 | 2016 | ||||||||||||||||||||||||||||||
| U.S. | Int’l | Other Benefits | Total | U.S. | Int’l | Other Benefits | Total | ||||||||||||||||||||||||
| Change in benefit obligation | |||||||||||||||||||||||||||||||
| Benefit obligation – January 1 | $ | 312.3 | $ | 79.9 | $ | 138.8 | $ | 531.0 | $ | 339.9 | $ | 78.0 | $ | 143.4 | $ | 561.3 | |||||||||||||||
| Service cost | 4.6 | 1.4 | 0.8 | 6.8 | 4.1 | 1.3 | 0.9 | 6.3 | |||||||||||||||||||||||
| Interest cost | 10.5 | 1.6 | 4.4 | 16.5 | 11.9 | 1.5 | 4.9 | 18.3 | |||||||||||||||||||||||
| Amendments | 1.6 | — | 0.4 | 2.0 | — | 0.4 | — | 0.4 | |||||||||||||||||||||||
| Actuarial loss (gain) | 19.1 | (0.3 | ) | 1.9 | 20.7 | 5.9 | 4.2 | (1.9 | ) | 8.2 | |||||||||||||||||||||
| Benefits and expenses paid | (22.4 | ) | (3.0 | ) | (8.2 | ) | (33.6 | ) | (21.5 | ) | (2.7 | ) | (8.5 | ) | (32.7 | ) | |||||||||||||||
| Acquired | — | 3.5 | — | 3.5 | — | — | — | — | |||||||||||||||||||||||
| Settlement | — | (0.4 | ) | — | (0.4 | ) | (28.0 | ) | (0.5 | ) | — | (28.5 | ) | ||||||||||||||||||
| Curtailment | — | — | — | — | — | (0.2 | ) | — | (0.2 | ) | |||||||||||||||||||||
| Foreign currency translation | — | 10.6 | — | 10.6 | — | (2.1 | ) | — | (2.1 | ) | |||||||||||||||||||||
| Benefit obligation – December 31 | $ | 325.7 | $ | 93.3 | $ | 138.1 | $ | 557.1 | $ | 312.3 | $ | 79.9 | $ | 138.8 | $ | 531.0 | |||||||||||||||
| 2017 | 2016 | ||||||||||||||||||||||||||||||
| U.S. | Int’l | Other Benefits | Total | U.S. | Int’l | Other Benefits | Total | ||||||||||||||||||||||||
| Change in plan assets | |||||||||||||||||||||||||||||||
| Plan assets – January 1 | $ | 262.2 | $ | 0.9 | $ | 6.1 | $ | 269.2 | $ | 278.1 | $ | 0.9 | $ | 7.9 | $ | 286.9 | |||||||||||||||
| Actual return on plan assets | 45.2 | — | 1.2 | 46.4 | 24.0 | — | 0.5 | 24.5 | |||||||||||||||||||||||
| Employer contributions | 35.9 | 3.0 | 6.1 | 45.0 | 9.6 | 3.2 | 6.2 | 19.0 | |||||||||||||||||||||||
| Benefits and expenses paid | (22.4 | ) | (3.0 | ) | (8.2 | ) | (33.6 | ) | (21.5 | ) | (2.7 | ) | (8.5 | ) | (32.7 | ) | |||||||||||||||
| Settlement | — | (0.4 | ) | — | (0.4 | ) | (28.0 | ) | (0.5 | ) | — | (28.5 | ) | ||||||||||||||||||
| Foreign currency translation | — | 0.1 | — | 0.1 | — | — | — | — | |||||||||||||||||||||||
| Plan assets – December 31 | $ | 320.9 | $ | 0.6 | $ | 5.2 | $ | 326.7 | $ | 262.2 | $ | 0.9 | $ | 6.1 | $ | 269.2 | |||||||||||||||
| Funded status at end of year | $ | (4.8 | ) | $ | (92.7 | ) | $ | (132.9 | ) | $ | (230.4 | ) | $ | (50.1 | ) | $ | (79.0 | ) | $ | (132.7 | ) | $ | (261.8 | ) | |||||||
| 2023 | 2022 | ||||||||||||||||||||||||||||||||||||||||||||||
| U.S. Pension | Int’l Pension | Other Benefits | Total | U.S. Pension | Int’l Pension | Other Benefits | Total | ||||||||||||||||||||||||||||||||||||||||
| Change in plan assets | |||||||||||||||||||||||||||||||||||||||||||||||
| Plan assets as of January 1 | $ | — | $ | 0.4 | $ | — | $ | 0.4 | $ | — | $ | 0.5 | $ | — | $ | 0.5 | |||||||||||||||||||||||||||||||
| Employer contributions | 0.9 | 3.6 | 5.0 | 9.5 | 0.9 | 3.0 | 7.1 | 11.0 | |||||||||||||||||||||||||||||||||||||||
| Benefits and expenses paid | (0.9) | (3.2) | (5.0) | (9.1) | (0.9) | (3.1) | (7.1) | (11.1) | |||||||||||||||||||||||||||||||||||||||
| Settlement | — | (0.4) | — | (0.4) | — | — | — | — | |||||||||||||||||||||||||||||||||||||||
| Foreign currency translation | — | — | — | — | — | — | — | — | |||||||||||||||||||||||||||||||||||||||
| Plan assets as of December 31 | $ | — | $ | 0.4 | $ | — | $ | 0.4 | $ | — | $ | 0.4 | $ | — | $ | 0.4 | |||||||||||||||||||||||||||||||
| Funded status at end of year | $ | (11.2) | $ | (72.8) | $ | (66.2) | $ | (150.2) | $ | (11.2) | $ | (67.5) | $ | (70.7) | $ | (149.4) | |||||||||||||||||||||||||||||||
The accumulated benefit obligation for all defined benefit pension plans was $416.7$82.5 and $389.4 at$77.5 as of December 31, 20172023 and 2016,2022, respectively. Information for pension plans with an accumulated benefit obligation in excess of plan assets is included in the following table.
| As of December 31 | 2023 | 2022 | |||||||||
| Projected benefit obligation | $ | 84.2 | $ | 78.9 | |||||||
| Accumulated benefit obligation | 82.3 | 77.3 | |||||||||
| Fair value of plan assets | — | — | |||||||||
| 2017 | 2016 | ||||||
| Projected benefit obligation | $ | 107.8 | $ | 391.6 | |||
| Accumulated benefit obligation | 105.4 | 388.8 | |||||
| Fair value of plan assets | — | 262.2 | |||||
84
Statements of Operations Information
The following table provides the components of net periodic postretirement cost and other amounts recognized in other comprehensive loss for each of the years ended December 31, 2017, 2016 and 2015 as they pertain to our defined benefit pension plans.
| 2017 | 2016 | 2015 | |||||||||||||||||||||||||||||||||
| U.S. | Int’l | Total | U.S. | Int’l | Total | U.S. | Int’l | Total | |||||||||||||||||||||||||||
| Net periodic postretirement cost - pension | |||||||||||||||||||||||||||||||||||
| Service cost | $ | 4.6 | $ | 1.4 | $ | 6.0 | $ | 4.1 | $ | 1.3 | $ | 5.4 | $ | 3.5 | $ | 1.5 | $ | 5.0 | |||||||||||||||||
| Interest cost | 10.5 | 1.6 | 12.1 | 11.9 | 1.5 | 13.4 | 13.0 | 1.5 | 14.5 | ||||||||||||||||||||||||||
| Expected return on plan assets | (18.3 | ) | — | (18.3 | ) | (20.1 | ) | — | (20.1 | ) | (20.8 | ) | — | (20.8 | ) | ||||||||||||||||||||
| Amortization of net actuarial loss | 6.6 | 1.0 | 7.6 | 7.1 | 0.7 | 7.8 | 7.5 | 1.0 | 8.5 | ||||||||||||||||||||||||||
| Amortization of prior service cost | 1.0 | — | 1.0 | 0.9 | — | 0.9 | 1.0 | — | 1.0 | ||||||||||||||||||||||||||
| Net periodic postretirement cost | 4.4 | 4.0 | 8.4 | 3.9 | 3.5 | 7.4 | 4.2 | 4.0 | 8.2 | ||||||||||||||||||||||||||
| Curtailment or settlement charges | 3.7 | — | 3.7 | 12.7 | — | 12.7 | — | 0.1 | 0.1 | ||||||||||||||||||||||||||
| Total net periodic postretirement cost | 8.1 | 4.0 | 12.1 | 16.6 | 3.5 | 20.1 | 4.2 | 4.1 | 8.3 | ||||||||||||||||||||||||||
| Other changes in plan assets and benefit obligations recognized in other comprehensive income | |||||||||||||||||||||||||||||||||||
| Net actuarial (gain) loss | (7.9 | ) | (0.3 | ) | (8.2 | ) | 2.1 | 4.0 | 6.1 | 13.9 | (2.9 | ) | 11.0 | ||||||||||||||||||||||
| Prior service cost | 1.6 | — | 1.6 | — | 0.4 | 0.4 | — | — | — | ||||||||||||||||||||||||||
| Amortization of net actuarial (loss) gain | (6.6 | ) | (1.0 | ) | (7.6 | ) | (19.8 | ) | (0.7 | ) | (20.5 | ) | (7.5 | ) | (1.1 | ) | (8.6 | ) | |||||||||||||||||
| Amortization of prior service cost | (4.7 | ) | — | (4.7 | ) | (0.9 | ) | — | (0.9 | ) | (1.0 | ) | — | (1.0 | ) | ||||||||||||||||||||
| Foreign currency translation | — | 2.9 | 2.9 | — | (0.5 | ) | (0.5 | ) | — | (2.5 | ) | (2.5 | ) | ||||||||||||||||||||||
| Total change recognized in other comprehensive income | (17.6 | ) | 1.6 | (16.0 | ) | (18.6 | ) | 3.2 | (15.4 | ) | 5.4 | (6.5 | ) | (1.1 | ) | ||||||||||||||||||||
| Total impact from net periodic postretirement cost and changes in other comprehensive income | $ | (9.5 | ) | $ | 5.6 | $ | (3.9 | ) | $ | (2.0 | ) | $ | 6.7 | $ | 4.7 | $ | 9.6 | $ | (2.4 | ) | $ | 7.2 | |||||||||||||
| 2023 | 2022 | 2021 | |||||||||||||||||||||||||||||||||||||||||||||||||||
| For the Year Ended December 31 | U.S. Pension | Int’l Pension | Total | U.S. Pension | Int’l Pension | Total | U.S. Pension | Int’l Pension | Total | ||||||||||||||||||||||||||||||||||||||||||||
| Net periodic postretirement cost - pension | |||||||||||||||||||||||||||||||||||||||||||||||||||||
| Service cost | $ | — | $ | 0.8 | $ | 0.8 | $ | — | $ | 1.2 | $ | 1.2 | $ | — | $ | 1.4 | $ | 1.4 | |||||||||||||||||||||||||||||||||||
| Interest cost | 0.6 | 2.4 | 3.0 | 0.3 | 1.0 | 1.3 | 0.3 | 0.7 | 1.0 | ||||||||||||||||||||||||||||||||||||||||||||
| Amortization of net actuarial loss | — | — | — | 0.2 | 1.1 | 1.3 | 0.2 | 1.6 | 1.8 | ||||||||||||||||||||||||||||||||||||||||||||
| Net periodic postretirement cost | 0.6 | 3.2 | 3.8 | 0.5 | 3.3 | 3.8 | 0.5 | 3.7 | 4.2 | ||||||||||||||||||||||||||||||||||||||||||||
Settlement charge and other(a) | — | 0.1 | 0.1 | — | — | — | (3.4) | — | (3.4) | ||||||||||||||||||||||||||||||||||||||||||||
| Total net periodic postretirement cost | 0.6 | 3.3 | 3.9 | 0.5 | 3.3 | 3.8 | (2.9) | 3.7 | 0.8 | ||||||||||||||||||||||||||||||||||||||||||||
| Other changes in plan assets and benefit obligations recognized in other comprehensive income | |||||||||||||||||||||||||||||||||||||||||||||||||||||
| Net actuarial (gain) loss | 0.3 | 3.4 | 3.7 | (3.0) | (18.3) | (21.3) | (0.1) | (6.3) | (6.4) | ||||||||||||||||||||||||||||||||||||||||||||
| Amortization of net actuarial loss | — | — | — | (0.2) | (1.1) | (1.3) | (0.2) | (1.6) | (1.8) | ||||||||||||||||||||||||||||||||||||||||||||
| Foreign currency translation and other | — | 0.1 | 0.1 | — | (1.7) | (1.7) | — | (2.7) | (2.7) | ||||||||||||||||||||||||||||||||||||||||||||
| Total change recognized in other comprehensive income | 0.3 | 3.5 | 3.8 | (3.2) | (21.1) | (24.3) | (0.3) | (10.6) | (10.9) | ||||||||||||||||||||||||||||||||||||||||||||
| Total impact from net periodic postretirement cost and changes in other comprehensive income | $ | 0.9 | $ | 6.8 | $ | 7.7 | $ | (2.7) | $ | (17.8) | $ | (20.5) | $ | (3.2) | $ | (6.9) | $ | (10.1) | |||||||||||||||||||||||||||||||||||
plan.
The following table provides the components of net periodic postretirement cost and other amounts recognized in other comprehensive loss for each of the years ended December 31, 2017, 2016 and 2015 as they pertain to other employee-related defined benefit plans.
| 2017 | 2016 | 2015 | |||||||||
| Net periodic postretirement cost - other postretirement | |||||||||||
| Service cost | $ | 0.8 | $ | 0.9 | $ | 0.9 | |||||
| Interest cost | 4.4 | 4.9 | 5.0 | ||||||||
| Expected return on plan assets | (0.3 | ) | (0.5 | ) | (0.9 | ) | |||||
| Amortization of net actuarial loss | 4.4 | 4.6 | 4.6 | ||||||||
| Amortization of prior service credit | (5.8 | ) | (6.5 | ) | (11.0 | ) | |||||
| Net periodic postretirement cost (benefit) | 3.5 | 3.4 | (1.4 | ) | |||||||
| Gain due to curtailment | — | — | (4.2 | ) | |||||||
| Total net periodic postretirement cost (benefit) | 3.5 | 3.4 | (5.6 | ) | |||||||
| Other changes in plan assets and benefit obligations recognized in other comprehensive income | |||||||||||
| Net actuarial (gain) loss | 1.0 | (1.9 | ) | 7.7 | |||||||
| Prior service cost | 0.5 | — | — | ||||||||
| Amortization of net actuarial loss | (4.4 | ) | (4.6 | ) | (4.6 | ) | |||||
| Amortization of prior service credit | 5.8 | 6.5 | 11.0 | ||||||||
| Acceleration of prior service costs | — | — | 6.2 | ||||||||
| Total changes recognized in other comprehensive income | 2.9 | — | 20.3 | ||||||||
| Total impact from net periodic postretirement cost and changes in other comprehensive income | $ | 6.4 | $ | 3.4 | $ | 14.7 | |||||
| Pension | Other Benefits | Total | |||||||||
| Net actuarial loss | $ | 5.9 | $ | 4.3 | $ | 10.2 | |||||
| Prior service cost (credit) | 0.9 | (5.3 | ) | (4.4 | ) | ||||||
| Total | $ | 6.8 | $ | (1.0 | ) | $ | 5.8 | ||||
| For the Year Ended December 31 | 2023 | 2022 | 2021 | ||||||||||||||
| Net periodic postretirement cost - other postretirement | |||||||||||||||||
| Service cost | $ | 0.3 | $ | 0.6 | $ | 0.7 | |||||||||||
| Interest cost | 3.1 | 2.2 | 1.8 | ||||||||||||||
| Amortization of net actuarial loss | — | 1.8 | 2.6 | ||||||||||||||
| Amortization of prior service benefit | (6.0) | (5.5) | (5.1) | ||||||||||||||
| Total net periodic postretirement cost | (2.6) | (0.9) | — | ||||||||||||||
| Other changes in plan assets and benefit obligations recognized in other comprehensive income | |||||||||||||||||
| Net actuarial (gain) loss | (2.9) | (23.3) | (8.2) | ||||||||||||||
| Prior service benefit | — | (8.1) | — | ||||||||||||||
| Amortization of net actuarial loss | — | (1.8) | (2.6) | ||||||||||||||
| Amortization of prior service credit | 6.0 | 5.5 | 5.1 | ||||||||||||||
| Total changes recognized in other comprehensive income | 3.1 | (27.7) | (5.7) | ||||||||||||||
| Total impact from net periodic postretirement cost and changes in other comprehensive income | $ | 0.5 | $ | (28.6) | $ | (5.7) | |||||||||||
Postretirement Plan Assumptions
The determination of projected benefit obligations and the recognition of expenses related to postretirement benefit plans are dependent on various assumptions that are judgmental and developed in consultation with external advisors. Management develops each assumption using relevant Company experience in conjunction with market-related data for each individual country in which such plans exist. Periodically, the Company performs experience studies to validate certain actuarial assumptions such as age of retirement, rates of turnover, utilization of optional forms of payments. In 2015, the Company performed such study for its U.S. pension plans and reflected the results in its valuation. The actuarial assumptions are based on the provisions of the applicable accounting pronouncements, review of various market data and discussion with our external advisors. Assumptions are reviewed annually and adjusted as necessary. Changes in these assumptions could materially affect our financial statements.
85
The following table provides the weighted-average assumptions used to determine projected benefit obligations and net periodic postretirement cost as they pertain to our U.S. and non-U.S. defined benefit pension plans and other employee-related defined benefit plans.
| 2017 | 2016 | ||||||||||||||||
| U.S. | Int’l | Other Benefits | U.S. | Int’l | Other Benefits | ||||||||||||
| Obligation Assumptions: | |||||||||||||||||
| Discount rate | 3.6 | % | 1.7 | % | 3.6 | % | 4.2 | % | 1.7 | % | 4.1 | % | |||||
| Rate of future compensation increase | N/A | 3.3 | % | N/A | N/A | 3.4 | % | N/A | |||||||||
| Cost Assumptions: | |||||||||||||||||
| Discount rate | 4.2 | % | 1.7 | % | 4.1 | % | 4.3 | % | 2.3 | % | 4.1 | % | |||||
| Expected return on plan assets | 7.0 | % | 1.0 | % | 7.0 | % | 7.2 | % | 4.8 | % | 7.2 | % | |||||
| 2023 | 2022 | ||||||||||||||||||||||||||||||||||
| U.S. Pension | Int’l Pension | Other Benefits | U.S. Pension | Int’l Pension | Other Benefits | ||||||||||||||||||||||||||||||
| Obligation Assumptions: | |||||||||||||||||||||||||||||||||||
| Discount rate | 5.0 | % | 3.1 | % | 5.0 | % | 5.3 | % | 3.6 | % | 5.3 | % | |||||||||||||||||||||||
| Rate of future compensation increase | N/A | 3.4 | % | N/A | N/A | 2.8 | % | N/A | |||||||||||||||||||||||||||
| Cost Assumptions: | |||||||||||||||||||||||||||||||||||
| Discount rate | 5.3 | % | 3.6 | % | 5.3 | % | 2.7 | % | 1.1 | % | 3.0 | % | |||||||||||||||||||||||
| Expected return on plan assets | N/A | 1.0 | % | N/A | N/A | 1.0 | % | N/A | |||||||||||||||||||||||||||
The discount rate is used to calculate the present value of expected future benefit payments at the measurement date. The discount rate assumption is based on current investment yields of high-quality fixed income investments during the retirement benefits maturity period. The pension discount rate is determined by considering an interest rate yield curve comprising AAA/AA bonds, with maturities that are generally between zero and thirty30 years, developed by the plan's actuaries. Annual benefit payments are then discounted to present value using this yield curve to develop a single discount rate matching the plan's characteristics.
The rate of future compensation increase assumption for foreign plans reflects our long-term actual experience and future and near-term outlook. The rate of future compensation increase assumption is not applicable for the U.S. plansplan because the benefit formulaplan is based on a flat dollar benefit and years of service approach.frozen.
The Company has updated the mortality assumption to reflect the most recent projection update.
The assumed rate of future increases in the per capita cost of health care (the health care trend rate) is 7.0%7.3% for pre-age 65 retirees and 6.5%6.3% for post-age 65 retirees for 2018,2024, decreasing ratably to 4.5% in 2026. Increasing the health care trend rates by one percent per year would have the effect of increasing the benefit obligation by $7.5 and the aggregate annual service and interest cost components by $0.3. A decrease of one percent in the health care trend rate would reduce the benefit obligation by $6.4 and the aggregate annual service and interest cost components by $0.3.2031. To the extent that actual experience differs from these assumptions, the effect will be amortized over the average future working life or life expectancy of the plan participants.
| 2017 | 2016 | 2015 | ||||||
| Expected rate of return on plan assets | 7.0 | % | 7.2 | % | 8.0 | % | ||
| Actual rate of return on plan assets | 18.0 | % | 9.2 | % | (2.8 | )% | ||
| 2017 | 2016 | Asset Allocation Range | |||||
| U.S. equities | 22 | % | 26 | % | 0-50 % | ||
| International equities | 8 | % | 22 | % | 0-25 % | ||
| Fixed income | 68 | % | 51 | % | 50-100 % | ||
| Cash and other | 2 | % | 1 | % | 0-10 % | ||
Fair Value of Plan Assets
| Pension | Other Benefits | ||||||||||||||||||
| 2017 | Level 1 | Measured at NAV | Total | Level 1 | Total | ||||||||||||||
| Collective Trusts: | |||||||||||||||||||
| U.S. equity | $ | — | $ | 70.6 | $ | 70.6 | $ | — | $ | — | |||||||||
| International equity | — | 26.6 | 26.6 | — | — | ||||||||||||||
| Fixed income | — | 218.7 | 218.7 | — | — | ||||||||||||||
| Mutual funds | — | — | — | 5.2 | 5.2 | ||||||||||||||
| Cash and other | 5.6 | — | 5.6 | — | — | ||||||||||||||
| Total | $ | 5.6 | $ | 315.9 | $ | 321.5 | $ | 5.2 | $ | 5.2 | |||||||||
| Pension | Other Benefits | ||||||||||||||||||
| 2016 | Level 1 | Measured at NAV | Total | Level 1 | Total | ||||||||||||||
| Collective Trusts: | |||||||||||||||||||
| U.S. equity | $ | — | $ | 67.4 | $ | 67.4 | $ | — | $ | — | |||||||||
| International equity | — | 58.9 | 58.9 | — | — | ||||||||||||||
| Fixed income | — | 135.0 | 135.0 | — | — | ||||||||||||||
| Mutual funds | — | — | — | 6.1 | 6.1 | ||||||||||||||
| Cash and other | 1.8 | — | 1.8 | — | — | ||||||||||||||
| Total | $ | 1.8 | $ | 261.3 | $ | 263.1 | $ | 6.1 | $ | 6.1 | |||||||||
Contributions
We contributed $6.1$5.0 and $6.2$7.1 to our other employee-related defined benefit plans during 20172023 and 2016,2022, respectively. We estimate that the 20182024 contributions to our other employee-related defined benefit plans will be approximately $8.$6.
86
Estimated Future Benefit Payments
The following table provides the projected timing of payments for benefits earned to date and the expectation that certain future service will be earned by current active employees for our pension and other employee-related benefit plans.
U.S. Pension | Int’l Pension | Other Benefits | |||||||||
| 2018 | $ | 24.9 | $ | 3.9 | $ | 10.8 | |||||
| 2019 | 24.2 | 3.6 | 10.4 | ||||||||
| 2020 | 23.1 | 4.4 | 10.2 | ||||||||
| 2021 | 22.8 | 3.9 | 10.0 | ||||||||
| 2022 | 22.3 | 4.2 | 9.5 | ||||||||
| 2023 - 2027 | 103.2 | 19.5 | 41.7 | ||||||||
| U.S. Pension | Int’l Pension | Other Benefits | |||||||||||||||
| 2024 | $ | 0.9 | $ | 4.6 | $ | 6.2 | |||||||||||
| 2025 | 0.9 | 3.8 | 5.9 | ||||||||||||||
| 2026 | 0.9 | 3.8 | 5.6 | ||||||||||||||
| 2027 | 0.9 | 3.7 | 5.4 | ||||||||||||||
| 2028 | 0.9 | 3.9 | 5.2 | ||||||||||||||
| 2029 - 2033 | 4.4 | 19.8 | 23.4 | ||||||||||||||
NOTE 1617
LONG-TERM INCENTIVE EMPLOYEE COMPENSATION
The 2011 Omnibus Incentive Plan (2011 Incentive Plan) was approved by shareholders and established in May of 2011 to provide for the awarding of options on common shares and full value restricted common shares or units to employees and non-employee directors. The number of shares initially available for issuance to participants under the 2011 Incentive Plan was 4.6. The 2011 Incentive Plan replaced the ITT Amended and Restated 2003 Equity Incentive Plan (2003 Incentive Plan) on a prospective basis and no future grants will be made under the 2003 Incentive Plan. However, any shares remaining available for issuance under the 2003 Incentive Plan became available for grant under the 2011 Incentive Plan as of the date the 2011 Incentive Plan was approved by shareholders. As of December 31, 2017, 38.22023, 36.5 shares were available for future grants under the 2011 Incentive Plan. ITT makesThe Company can make shares available for the exercise of stock options or vesting of restricted shares or units by purchasing shares in the open market.
Our long-term incentive plan (LTIP) isawards are comprised of two components: restricted stock units (RSUs) and performance unit awardsstock units (PSUs). Prior to 2017, our LTIP also included non-qualified stock options (NQOs). The majority of RSUs and PSUs settle in shares; however RSUs and PSUs granted to certain international employees are settled in cash. We account for NQOs and equity-settled RSUs and PSUs as equity-based compensation awards andawards. We account for cash-settled RSUs and PSUs are accounted for as liability-based awards. PSUs granted prior to 2016 were based on both a relativecontain equally weighted performance conditions for total shareholder return (TSR) metric as well as aand return on invested capital (ROIC) metric, equally weighted. In 2017 and 2016,. PSUs granted werevest based on a relative TSRpredetermined performance metrics that align with the Company's stock price and relative ROIC metric, equally weighted. PSUs settle in shares, dependent uponfinancial performance following a three-year performance period and are subject to further align payouts with stock price performance.a payout factor which includes a maximum and minimum payout. PSUs are accounted for as two distinct awards, an ROICa TSR award and a TSRROIC award.
LTIP costs are primarily recorded within generalGeneral and administrative expenses in our Consolidated Statements of Operations, at their grant date fair value over the requisite service period (typically three years) on a straight-line basis and are reduced by forfeitures as they occur. These costs impacted
The following table summarizes our consolidated resultsshare-based compensation expense associated with our LTIP awards.
| For the Year Ended December 31 | 2023 | 2022 | 2021 | ||||||||||||||
| Equity-based awards | $ | 20.2 | $ | 18.1 | $ | 16.5 | |||||||||||
| Liability-based awards | 1.7 | 1.0 | 1.3 | ||||||||||||||
| Total share-based compensation expense | $ | 21.9 | $ | 19.1 | $ | 17.8 | |||||||||||
The income tax benefit realized during 2023, 2022 and 2021 associated with exercised stock options and vested restricted stock was $0.9, $2.4 and $3.2, respectively.
As of operations as follows:
| 2017 | 2016 | 2015 | |||||||||
| Share-based compensation expense, equity-based awards | $ | 18.1 | $ | 12.6 | $ | 15.7 | |||||
| Share-based compensation expense, liability-based awards | 2.8 | 1.8 | 1.1 | ||||||||
| Total share-based compensation expense in operating income | $ | 20.9 | $ | 14.4 | $ | 16.8 | |||||
| 2017 | 2016 | 2015 | ||||||||||||||||||
| Stock Options | Shares | Weighted Average Exercise Price | Shares | Weighted Average Exercise Price | Shares | Weighted Average Exercise Price | ||||||||||||||
| Outstanding – January 1 | 1.4 | $ | 30.57 | 1.7 | $ | 27.10 | 1.9 | $ | 24.20 | |||||||||||
| Granted | — | — | 0.4 | 33.01 | 0.2 | 41.52 | ||||||||||||||
| Exercised | (0.5 | ) | 22.95 | (0.6 | ) | 20.88 | (0.3 | ) | 19.87 | |||||||||||
| Canceled or expired | — | — | (0.1 | ) | 39.03 | (0.1 | ) | 35.95 | ||||||||||||
| Outstanding – December 31 | 0.9 | $ | 34.07 | 1.4 | $ | 30.57 | 1.7 | $ | 27.10 | |||||||||||
| Options exercisable – December 31 | 0.5 | $ | 32.24 | 0.8 | $ | 24.41 | 1.1 | $ | 21.75 | |||||||||||
| Options Outstanding | Options Exercisable | ||||||||||||||||
| Exercise Prices | Number | Weighted Average Remaining Contractual Life (in years) | Aggregate Intrinsic Value | Number | Weighted Average Remaining Contractual Life (in years) | Aggregate Intrinsic Value | |||||||||||
| Less than $23.00 | 0.1 | 3.5 | 3.4 | 0.1 | 3.5 | 3.4 | |||||||||||
| $26.76 | 0.1 | 5.2 | 4.2 | 0.1 | 5.2 | 4.2 | |||||||||||
| $33.01 | 0.3 | 8.1 | 6.1 | 0.1 | 8.1 | 0.6 | |||||||||||
| $41.52 | 0.2 | 7.2 | 2.2 | 0.1 | 7.2 | 0.4 | |||||||||||
| $43.52 | 0.2 | 6.2 | 1.4 | 0.1 | 6.2 | 1.4 | |||||||||||
| 0.9 | 6.5 | $ | 17.3 | 0.5 | 5.4 | $ | 10.0 | ||||||||||
| 2016 | 2015 | ||||||
| Dividend yield | 1.5 | % | 1.1 | % | |||
| Expected volatility | 32.2 | % | 29.4 | % | |||
| Expected life (in years) | 6.0 | 5.8 | |||||
| Risk-free rates | 1.5 | % | 1.7 | % | |||
| Weighted-average grant date fair value | $ | 9.16 | $ | 11.23 | |||
The fair value of equity-settled restricted stock unitsRSUs is determined using the closing price of the Company’s common stock on the date of grant. The fair value of cash-settled RSUs is remeasured using the closing price of the Company'sITT's common stock at the end of each reporting period. Recipients do not have voting rights and do not receive cash dividends during the restriction period. Dividend equivalents on RSUs, which are subject to forfeiture, are accrued and paid in cash upon vesting of the RSU, which typically occurs three years from the date of grant.RSU. If an employeea recipient retires or is terminated other than for cause, a pro rata portion of the RSU may vest.
87
The fair value of the TSR award wasis measured using a Monte Carlo simulation on the date of grant, measuring potential total shareholder return for ITT relative to the other companies in the S&P 400 Capital Goods Index (the TSR Performance Group). The expected volatility of ITT's stock price wasis based on the historical volatility of a peer group while expected volatility for the other companies in the TSR Performance Group wasis based on their own stock price history. AllFor TSR awards granted in 2023, all volatility and correlation measures were based on three years of daily historical price data through February 22, 2017,March 3, 2023, corresponding to the three-year performance period of the award. The TSR award payout is subject to a multiplier which includes a maximum and minimum payout. As the grant date occurs after the beginning of the performance period, actual TSR performance between the beginning of the performance period (December average closing stock price) and the grant date was reflected in the valuation. AFor TSR awards granted in 2023, a dividend yield of 1.23%1.24% was assumed based on ITT's annualized dividend payment of $0.512$1.16 per share and the February 23, 2017March 3, 2023 closing stock price of $41.68.$93.83.
The table below provides a rollforward of our outstanding RSUs and PSUs for each of the years ended December 31, 2017, 2016 and 2015.PSUs.
| 2023 | 2022 | 2021 | |||||||||||||||||||||||||||||||||
| Restricted Stock and Performance Units | Shares | Weighted Average Grant Date Fair Value | Shares | Weighted Average Grant Date Fair Value | Shares | Weighted Average Grant Date Fair Value | |||||||||||||||||||||||||||||
| Outstanding as of January 1 | 0.7 | $ | 76.36 | 0.7 | $ | 71.21 | 0.8 | $ | 59.25 | ||||||||||||||||||||||||||
| Granted | 0.3 | 99.33 | 0.3 | 77.72 | 0.3 | 90.14 | |||||||||||||||||||||||||||||
| Vested and issued | (0.2) | 69.91 | (0.3) | 66.20 | (0.3) | 57.36 | |||||||||||||||||||||||||||||
| Forfeited | (0.1) | 77.20 | — | — | (0.1) | 68.18 | |||||||||||||||||||||||||||||
| Outstanding as of December 31 | 0.7 | $ | 88.40 | 0.7 | $ | 76.36 | 0.7 | $ | 71.21 | ||||||||||||||||||||||||||
| Vested pending issuance | 0.1 | $ | 98.67 | 0.1 | $ | 63.88 | 0.1 | $ | 65.25 | ||||||||||||||||||||||||||
| 2017 | 2016 | 2015 | ||||||||||||||||||
Restricted Stock and Performance Units | Shares | Weighted Average Grant Date Fair Value | Shares | Weighted Average Grant Date Fair Value | Shares | Weighted Average Grant Date Fair Value | ||||||||||||||
| Outstanding – January 1 | 1.1 | $ | 38.24 | 1.3 | $ | 36.56 | 1.1 | $ | 31.70 | |||||||||||
| Granted | 0.5 | 42.52 | 0.5 | 33.28 | 0.5 | 41.34 | ||||||||||||||
Performance adjustment(a) | — | — | (0.1 | ) | 45.47 | 0.1 | 29.59 | |||||||||||||
| Lapsed | (0.2 | ) | 41.42 | (0.5 | ) | 29.86 | (0.3 | ) | 24.09 | |||||||||||
| Canceled | (0.2 | ) | 41.75 | (0.1 | ) | 39.20 | (0.1 | ) | 35.89 | |||||||||||
| Outstanding – December 31 | 1.2 | $ | 38.74 | 1.1 | $ | 38.24 | 1.3 | $ | 36.56 | |||||||||||
| Vested pending issuance | 0.1 | $ | 42.90 | — | $ | — | 0.3 | $ | 29.59 | |||||||||||
The table below provides the number of theour outstanding equity settled RSUs, cash settledshares by award type. Cash-settled RSUs and PSUs as of December 31, 2017, 2016 and 2015.outstanding were not material.
| 2017 | 2016 | 2015 | ||||||
| Equity settled RSUs | 0.7 | 0.7 | 0.7 | |||||
| Cash settled RSUs | 0.1 | 0.1 | 0.1 | |||||
| PSU awards | 0.4 | 0.3 | 0.5 | |||||
| As of December 31 | 2023 | 2022 | 2021 | ||||||||||||||
| Equity-settled RSUs | 0.4 | 0.4 | 0.4 | ||||||||||||||
| Equity-settled PSUs | 0.3 | 0.2 | 0.3 | ||||||||||||||
As of December 31, 2017,2023, substantially all RSUs outstanding are expected to vest. As of December 31, 2017,2023, the total number of PSUs expected to vest based on current performance estimates, including those vested but pending issuance, was 0.3.0.4.
Prior to 2017, our LTIP award grants also included non-qualified stock options (NQOs). NQOs outstanding and exercisable were nominal as of December 31, 2023, and 0.1 as of both December 31, 2022 and 2021. As of December 31, 2023, there were no options "out-of-the-money" and all options outstanding were fully vested. NQOs exercised of 0.1 during each of the years ended December 31, 2023, 2022 and 2021 resulted in cash proceeds of $0.6, $1.8 and $1.2, respectively.
Employee Stock Purchase Plan
We sponsor the ITT Inc. 2023 Employee Stock Purchase Plan (2023 ESPP), pursuant to which eligible employees may elect to contribute from 1% to 10% of their eligible compensation, which includes after-tax base salary and annual bonus, subject to certain income limits, to purchase shares of ITT's common stock. The adoption of the 2023 ESPP was approved by our shareholders at our 2023 Annual Shareholders Meeting. The aggregate number of shares of ITT’s stock authorized for issuance under the 2023 ESPP was 0.5.
88
Pursuant to the terms of the 2023 ESPP, employees may purchase stock under the 2023 ESPP at a price equal to 95% of ITT’s closing stock price on the purchase date. For the year ended December 31, 2023, no stock-based compensation expense was recorded in connection with the 2023 ESPP because the criteria of a non-compensatory plan in accordance with ASC 718, Compensation - Stock Compensation, were met.
NOTE 1718
CAPITAL STOCK
ITT has authority to issue an aggregate of 300 shares of capital stock, of which 250 shares have been designated as Common Stockcommon stock having a par value of $1$1 per share and 50 shares have been designated as Preferred Stockpreferred stock not having any par or stated value. There was no Preferred Stockpreferred stock outstanding as of December 31, 20172023 and 2016.2022.
The stockholdersholders of ITT common stock are entitled to receive dividends when and as declared by ITT’s Board of Directors. Dividends are paid quarterly. Dividends declared were $0.512, $0.496$1.160, $1.056 and $0.4732$0.880 per common share totaling $95.9, $87.7, and $76.2 in 2017, 2016,2023, 2022, and 2015,2021, respectively.
On October 27, 2006, a three-year $1 billion30, 2019, the Board of Directors approved our current program, an indefinite term $500 open-market share repurchase program (Share Repurchase Program) was approved by our Board of Directors. On December 16, 2008, the provisions of the Share Repurchase Program were modified by our Board of Directors to replace the original three-year term with an indefinite term.(the 2019 Plan). During 2017, 2016,2023, 2022, and 2015,2021, we repurchased 0.8and retired 0.7 shares, 2.03.0 shares, and 2.01.2 shares of common stock for $30.0, $70.0$60.5, $245.3 and $80.0, respectively. Through December 2017, we had repurchased 21.2 shares for $859.4, including commissions,$104.8, respectively, under the Share Repurchase Program.2019 Plan. 2023 included $0.5 related to a 1% excise tax assessed on share repurchases under the Inflation Reduction Act of 2022, which went into effect for repurchases made after December 31, 2022. As of December 31, 2023, there was $78.8 of remaining authorization left under the 2019 Plan.
On October 4, 2023, the Board of Directors approved an indefinite term $1,000 open-market share repurchase program (the 2023 Plan). Repurchases under this authorization will begin upon the completion of the 2019 Plan.
Separate from the Share Repurchase Program,our open-market share repurchase programs, the Company repurchasedwithheld 0.1 shares 0.2 shares,of common stock during each of the years ended 2023, 2022 and 0.1 shares2021 for an aggregate purchase price of $2.9, $7.8,$7.2, $8.8, and $4.0, during 2017, 2016 and 2015,$11.7, respectively, in settlement of employee tax withholding obligations due upon the vesting of restricted stock or stock units. All repurchase shares are canceled immediately following the repurchase.
NOTE 1819
COMMITMENTS AND CONTINGENCIES
From time to time, we are involved in litigation, claims, government inquiries, investigations and proceedings, including but not limited to those relating to environmental exposures, intellectual property matters, personal injury claims, product liabilities, regulatory matters, commercial and government contract issues, employment and employee benefit matters, commercial or contractual disputes, and securities matters.
Although the ultimate outcome of any legal matter cannot be predicted with certainty, based on present information including our assessment of the merits of the particular claim, as well as our current reserves and insurance coverage, we do not expect that such legal proceedings will have any material adverse impact on our financial statements, unless otherwise noted below. However, there can be no assurance that an adverse outcome in any of the proceedings described below will not result in material fines, penalties or damages, changes to the Company's business practices, loss of (or litigation with) customers or a material adverse effect on our financial statements.
Asbestos Matters
| (in thousands) | 2017 | 2016 | 2015 | |||||
| Pending claims – Beginning | 30 | 37 | 62 | |||||
| New claims | 4 | 4 | 4 | |||||
| Settlements | (2 | ) | (1 | ) | (1 | ) | ||
| Dismissals | (6 | ) | (10 | ) | (28 | ) | ||
| Pending claims – Ending | 26 | 30 | 37 | |||||
89
The table below summarizes theour total net asbestos chargeasbestos-related (benefit) costs.
| For the Year Ended December 31 | 2023 | 2022 | 2021 | ||||||||||||||
Asbestos provision, net(a) | $ | — | $ | — | $ | 14.4 | |||||||||||
| Gain on divestiture before income tax | — | — | (88.8) | ||||||||||||||
| Asbestos-related (benefit) costs, net | $ | — | $ | — | $ | (74.4) | |||||||||||
(a)2021 includes costs related to the divestiture of InTelCo as well as certain administrative costs such as legal-related costs for the years ended December 31, 2017, 2016 and 2015.
| 2017 | 2016 | 2015 | |||||||||
| Asbestos provision | $ | 56.5 | $ | 59.0 | $ | 63.0 | |||||
| Asbestos remeasurement, net | (76.4 | ) | (81.8 | ) | (44.8 | ) | |||||
| Defense cost adjustment | — | (4.9 | ) | (100.7 | ) | ||||||
| Settlement agreements | — | 2.1 | (8.9 | ) | |||||||
| Asbestos-related benefit, net | $ | (19.9 | ) | $ | (25.6 | ) | $ | (91.4 | ) | ||
| 2017 | 2016 | ||||||||||||||||||||||
| Liability | Asset | Net | Liability | Asset | Net | ||||||||||||||||||
| Balance as of January 1 | $ | 954.3 | $ | 380.6 | $ | 573.7 | $ | 1,042.8 | $ | 412.0 | $ | 630.8 | |||||||||||
| Asbestos provision | 67.1 | 10.6 | 56.5 | 68.8 | 9.8 | 59.0 | |||||||||||||||||
| Asbestos remeasurement | (66.4 | ) | 10.0 | (76.4 | ) | (75.9 | ) | 5.9 | (81.8 | ) | |||||||||||||
| Settlement agreements | — | — | — | — | (2.1 | ) | 2.1 | ||||||||||||||||
| Defense cost adjustment | — | — | — | (4.9 | ) | — | (4.9 | ) | |||||||||||||||
| Net cash activity and other | (77.8 | ) | (32.5 | ) | (45.3 | ) | (76.5 | ) | (45.0 | ) | (31.5 | ) | |||||||||||
| Balance as of December 31 | $ | 877.2 | $ | 368.7 | $ | 508.5 | $ | 954.3 | $ | 380.6 | $ | 573.7 | |||||||||||
| Current portion | 77.1 | 64.7 | 76.8 | 66.0 | |||||||||||||||||||
| Noncurrent portion | 800.1 | 304.0 | 877.5 | 314.6 | |||||||||||||||||||
Environmental Matters
In the ordinary course of business, we are subject to federal, state, local, and foreign environmental laws and regulations. We are responsible, or are alleged to be responsible, for ongoing environmental investigation and site remediation. These sites are in various stages of investigation and/or remediation and in many of these proceedings our liability is considered de minimis. We have received notification from the U.S. Environmental Protection Agency, and from similar state and foreign environmental agencies, that a number of sites formerly or currently owned and/or operated by ITT,the Company, and other properties or water supplies that may be or have been impacted from those operations, contain disposed or recycled materials or wastes and require environmental investigation and/or remediation. These sites include instances where we have been identified as a potentially responsible party under federal and state environmental laws and regulations.
Accruals for environmental matters are recorded on a site-by-site basis when it is probable that a liability has been incurred and the amount of the liability can be reasonably estimated.
The following table provides a rollforward of the estimated current and long-term environmental liability.
| 2023 | 2022 | ||||||||||
| Balance as of January 1 | $ | 57.1 | $ | 54.1 | |||||||
| Changes in estimates for pre-existing accruals: | |||||||||||
| Continuing operations | 2.6 | 1.7 | |||||||||
Discontinued operations(a) | — | 5.4 | |||||||||
| Accruals added during the period for new matters | — | 0.1 | |||||||||
| Cash payments | (3.9) | (4.0) | |||||||||
| Foreign currency | 0.2 | (0.2) | |||||||||
| Balance as of December 31 | $ | 56.0 | $ | 57.1 | |||||||
(a)During 2022, we increased the estimated environmental liability for the years ended December 31, 2017a former site of ITT by $5.4 and 2016.
| 2017 | 2016 | ||||||
| Balance as of January 1 | $ | 76.6 | $ | 82.6 | |||
Changes in estimates for pre-existing accruals(a) | 8.8 | 5.9 | |||||
| Net cash activity | (11.7 | ) | (11.9 | ) | |||
| Foreign currency | 0.2 | — | |||||
| Balance as of December 31 | $ | 73.9 | $ | 76.6 | |||
Environmental-related assets, representincluding a qualified settlement fund (QSF) and estimated recoveries from insurance providers and other third parties. In the fourth quarter of 2015, ITT entered into a settlement agreement with one of our insurance providers whereby the provider agreed to pay the net present value of the remaining limits of the policy amounting to approximately $34.2. In the first quarter of 2016, the Company received $2.0 in cashparties, were $10.0 and $32.2 was deposited into a QSF which can be drawn upon only to pay future environmental expenses associated with remediation sites covered under the policy, including sites owned by a former subsidiary of the Company. The Company recorded $23.0 of deferred income related to the settlement representing the excess of QSF monies over the probable liabilities associated with the covered remediation sites. During the first quarter of 2017, ITT entered into a settlement agreement with a former subsidiary to settle all claims covered by the environmental QSF. The former subsidiary no longer has rights to the funds in the QSF. The settlement resulted in a reduction to both our environmental-related asset and the corresponding deferred income liability balance of $5.2. During the second quarter of 2017, the QSF was amended resulting in income of $3.8. The total environmental-related asset$13.6 as of December 31, 20172023 and 2016 was $24.5 and $33.4,2022, respectively.
The following table illustrates the reasonably possible high range of estimated liability and number of active sites for environmental matters.
| 2017 | 2016 | ||||||
| High end range | $ | 126.3 | $ | 127.6 | |||
| Number of active environmental investigation and remediation sites | 36 | 39 | |||||
| As of December 31 | 2023 | 2022 | |||||||||
| High-end estimate of environmental liability | $ | 98.2 | $ | 93.5 | |||||||
| Number of open environmental sites | 26 | 28 | |||||||||
As actual costs incurred at identified sites in future periods may vary from our current estimates given the inherent uncertainties in evaluating environmental exposures, management believes it is possible that the outcome of these uncertainties may have a material adverse effect on our financial statements.
NOTE 1920
GUARANTEES, INDEMNITIES AND WARRANTIES
Indemnities
Since our founding in 1920 (pre-spin-offs), we have acquired and disposed of numerous entities.businesses. The related acquisition and disposition agreements allocate certain assets and liabilities among the parties and contain various representation and warranty clauses and may provide indemnities for a misrepresentation or breach of the representations and warranties by either party or for assumed or excluded liabilities. These provisions address a variety of subjects. The term and monetary amounts of each such provision are defined in the specific agreements and may be affected by various conditions and external factors. Many of the provisions have expired either by operation of law or as a result of the terms of the agreement. We do not have a liability recorded for these expired provisions and are not aware of any claims or other information that would give rise to material payments under such provisions.
Guarantees
We have $144.6$159.4 of guarantees, letters of credit and similar arrangements outstanding at December 31, 2017,2023, primarily pertaining to commercial or performance guarantees and insurance matters. We have not recorded any material loss contingencies under these guarantees, letters of credit and similar arrangements as of December 31, 20172023 as the likelihood of nonperformance by ITT is considered remote. From time to time, we may provide certain third-party guarantees that may be affected by various conditions and external factors, some of which could require that payments be made under such guarantees. We do not consider the maximum exposure or current recorded liabilities under our third-party guarantees to be material either individually or in the aggregate. We do not believe such payments would have a material adverse impact on our financial statements.Consolidated Financial Statements.
Warranties
ITT warrants numerous products, the terms of which vary widely. In general, ITT warrants its products against defect and specific non-performance. In certain markets, such as automotive, aerospace and rail, liability for product defects could extend beyond the selling price of the product and could be significant if the defect interrupts production or results in a recall.
The table included below provides changespresents a rollforward of our total warranty liability, which is recorded within Accrued liabilities and Other non-current liabilities in the warranty accrual for December 31, 2017 and 2016.our Consolidated Balance Sheets.
| 2023 | 2022 | ||||||||||
| Warranty liability as of January 1 | $ | 16.2 | $ | 20.1 | |||||||
| Warranty expense | 5.4 | 1.8 | |||||||||
| Payments | (5.1) | (5.2) | |||||||||
| Foreign currency and other | — | (0.5) | |||||||||
| Warranty liability as of December 31 | $ | 16.5 | $ | 16.2 | |||||||
| 2017 | 2016 | ||||||
| Warranty accrual – January 1 | $ | 19.8 | $ | 23.5 | |||
| Warranty expense | 7.2 | 7.4 | |||||
| Payments | (10.0 | ) | (10.1 | ) | |||
| Foreign currency and other | 1.3 | (1.0 | ) | ||||
| Warranty accrual – December 31 | $ | 18.3 | $ | 19.8 | |||
NOTE 21
DERIVATIVE FINANCIAL INSTRUMENTS
The Company is exposed to various market risks relating to its ongoing business operations. From time to time, we use derivative financial instruments to mitigate our exposure to certain of these risks, including foreign exchange rate and commodity price fluctuations. By using derivatives, the Company is further exposed to credit risk. Our exposure to credit risk includes the counterparty’s failure to fulfill its financial obligations under the terms of the derivative contract. The Company attempts to minimize its exposure by avoiding concentration risk among its counterparties and by entering into transactions with creditworthy counterparties.
| As of December 31 | 2023 | 2022 | |||||||||
| Notional amount (U.S. dollar equivalent) | $ | 258.4 | $ | 136.5 | |||||||
Fair value of foreign currency derivative contracts(a) | $ | 3.8 | $ | 1.7 | |||||||
(a) Our foreign currency derivative contracts are classified within Level 2 of the fair value hierarchy because these contracts are not actively traded and the valuation inputs are based on market observable data of similar instruments.
Gains or losses arising from discontinued operations forchanges in fair value of our foreign currency derivative contracts are recorded within General and administrative expenses in our Consolidated Statements of Operations, and were as follows:
| For the Year Ended December 31 | 2023 | 2022 | |||||||||
(Loss) gain on foreign currency derivative contracts(b) | $ | (2.5) | $ | 10.1 | |||||||
(b) None of our derivative contracts were designated as hedging instruments under ASC 815, Derivatives & Hedging.
The cash flow impact upon settlement of our foreign currency derivative contracts is included in operating activities in our Consolidated Statements of Cash Flows. During the year ended December 31, 2017 reflect a loss of $1.5, net of tax, primarily driven by environmental related liabilities. Results from discontinued operations for the year ended2023 and December 31, 2016 reflect a gain2022, net cash inflows from foreign currency derivative contracts were $1.5 and $7.7, respectively.
92
NOTE 22
ACQUISITIONS, INVESTMENTS, AND DIVESTITURES
Acquisition of $4.2, netMicro-Mode Products, Inc. (Micro-Mode)
On May 2, 2023, we completed the acquisition of tax, primarily related to favorable resolutions of certain legacy liabilities in 2016. Results from discontinued operations for the year ended December 31, 2015 reflect a gain of $39.4, principally related to the settlement of the U.S. income tax audit. This includes a tax benefit of $38.3 from the recognition of previously unrecognized tax positions, related net interest income of $3.2, and a $13.2 receivable due from Exelis and Xylem, partially offset by net tax expense of $17.4 from unfavorable audit adjustments.
Acquisition of Habonim Industrial Valves and Actuators Ltd (Habonim)
On April 4, 2022, we completed the acquisition of 100% of the privately held stock of Habonim for a purchase price allocationof $139.9. Habonim is subjecta designer and manufacturer of valves, valve automation and actuation for gas distribution (including liquified natural gas), biotech and harsh application service sectors. Habonim sells directly to change duringoriginal equipment manufacturers and integrators for customized solutions. Habonim has operations in Israel, the measurement period (upU.S. and the Netherlands, and has a workforce of approximately 200 employees. Subsequent to one year from the acquisition, date). Axtone, which had 2016 revenueHabonim’s results have been reported within our IP segment. The allocation of approximately $72, is a manufacturer of highly engineered and customized energy absorption solutions, including springs, buffers, and coupler components for the railway and industrial markets.
The assets acquired and liabilities assumed for both our Micro-Mode and Habonim acquisitions were recorded at fair value. As of December 31, 2023, the allocation of the purchase price to the assets acquired and liabilities assumed was substantially complete related to our acquisition of $83.0 recorded as goodwill. TheMicro-Mode, and was completed related to our acquisition of Habonim, and is presented in the table below.
| Allocation of Purchase Price | Micro-Mode | Habonim | ||||||
| Receivables | $ | 2.7 | $ | 10.2 | ||||
| Inventory | 5.6 | 17.8 | ||||||
| Plant, property and equipment | 6.0 | 16.1 | ||||||
| Goodwill | 44.6 | 62.9 | ||||||
| Other intangible assets | 28.7 | 47.2 | ||||||
| Other assets | 0.3 | 4.2 | ||||||
| Accounts payable and accrued liabilities | (2.3) | (8.7) | ||||||
| Other liabilities | (6.3) | (7.1) | ||||||
| Noncontrolling interest | — | (2.7) | ||||||
| Net assets acquired | $ | 79.3 | $ | 139.9 | ||||
Related to the acquisition of Micro-Mode, the primary areas of the purchase price allocationallocations that are not yet finalized relate to the valuation of certain contingenttangible and intangible assets, certain liabilities, income tax, and residual goodwill.goodwill, which represents the excess of the purchase price over the fair value of the net tangible and other intangible assets acquired. We expect to obtain the information necessary to finalize the fair value of the net assets and liabilities during the measurement period.period, not to exceed one year from the acquisition date. Changes to the preliminary estimates of the fair value during the measurement period will be recorded as adjustments to those assets and liabilities with a corresponding adjustment to goodwill in the period they occur. The goodwill arising from this acquisition which is not expected to be deductible for income tax purposes, has been assigned to the Motion Technologies segment.
| Cash | $ | 9.4 | |
| Receivables | 11.5 | ||
| Inventory | 13.6 | ||
| Plant, property and equipment | 13.1 | ||
| Goodwill | 83.0 | ||
| Other intangible assets | 9.9 | ||
| Other assets | 6.0 | ||
| Accounts payable and accrued liabilities | (14.9 | ) | |
| Postretirement liabilities | (4.2 | ) | |
| Other liabilities | (4.3 | ) | |
| Net assets acquired | $ | 123.1 | |
Pro forma results of operations have not been presented because the acquisitions were not deemed material atsignificant as of their acquisition dates.
Acquisition of Product Line
During June 2022, we purchased all production assets and proprietary technology related to an energy absorption product line for high-cycle applications in industrial automation. The Company determined that the product line met the definition of a business per ASC 805, Business Combinations. The product line was acquired for $7.0 from Clippard Instrument Laboratory, Inc., which is a third party U.S. manufacturer of electronic and pneumatic components, and is included within our CCT segment.
93
Investments in CRP Technology and CRP USA (CRP)
During the second quarter of 2022, we purchased a minority investment of 46% in CRP Technology Srl and 33% in CRP USA LLC (collectively "CRP") for $23.0. CRP is a manufacturer of reinforced composite materials for 3D printing for the aerospace, defense, premium automotive, and motorsports industries. CRP's Windform® high-performance materials enable engineers to develop complex, customized designs while providing lightweight and exceptionally durable products. In May 2023, ITT purchased an additional 9% share of CRP USA LLC for $1.4. This additional investment brought ITT’s direct share ownership in CRP USA LLC to 42%. The CRP investments are accounted for as equity method investments.
Divestiture of Matrix Composites, Inc. (Matrix)
On December 29, 2023, we completed the sale of our Matrix business, an aerospace and defense components manufacturer within our CCT segment, to a third party for total cash proceeds of $1.0. In connection with this transaction, we recorded a $15.3 pre-tax loss, which has been presented within General and administrative expenses on our Consolidated Statement of Operations for the year ended December 31, 2023.
Divestiture of Product Line
During the second quarter of 2023, we completed the sale of a product line within our CCT segment to a third party for $10.5. The Company determined that the product line met the definition of a business per ASC 805, Business Combinations. As a result of the transaction, we recognized a pre-tax gain on sale of $7.2, which is included in the General and administrative expenses line on our Consolidated Statements of Operations for the year ended December 31, 2023. Goodwill of $2.4 was allocated to the divestiture.
Subsequent Event
On January 19, 2024, we completed the acquisition date.
94
| 2017 Quarters | 2016 Quarters | ||||||||||||||||||||||||||||||
| Fourth | Third | Second | First | Fourth | Third | Second | First | ||||||||||||||||||||||||
| Revenue | $ | 683.6 | $ | 645.0 | $ | 630.9 | $ | 625.8 | $ | 588.4 | $ | 581.7 | $ | 626.2 | $ | 609.1 | |||||||||||||||
| Gross profit | 207.4 | 203.1 | 204.4 | 202.3 | 173.4 | 183.9 | 205.6 | 195.3 | |||||||||||||||||||||||
| (Loss) income from continuing operations attributable to ITT Inc. | (66.0 | ) | 87.0 | 47.9 | 46.1 | 23.6 | 88.3 | 32.3 | 37.7 | ||||||||||||||||||||||
| (Loss) income from discontinued operations | (1.2 | ) | (0.1 | ) | (0.1 | ) | (0.1 | ) | 2.2 | 1.8 | 0.5 | (0.3 | ) | ||||||||||||||||||
| Net (loss) income attributable to ITT Inc. | (67.2 | ) | 86.9 | 47.8 | 46.0 | 25.8 | 90.1 | 32.8 | 37.4 | ||||||||||||||||||||||
| Basic (loss) earnings per share attributable to ITT Inc.: | |||||||||||||||||||||||||||||||
| Continuing operations | $ | (0.75 | ) | $ | 0.99 | $ | 0.54 | $ | 0.52 | $ | 0.27 | $ | 0.99 | $ | 0.36 | $ | 0.42 | ||||||||||||||
| Discontinued operations | (0.01 | ) | — | — | — | 0.02 | 0.02 | — | — | ||||||||||||||||||||||
| Net (loss) income | $ | (0.76 | ) | $ | 0.99 | $ | 0.54 | $ | 0.52 | $ | 0.29 | $ | 1.01 | $ | 0.36 | $ | 0.42 | ||||||||||||||
| Diluted (loss) earnings per share attributable to ITT Inc.: | |||||||||||||||||||||||||||||||
| Continuing operations | $ | (0.75 | ) | $ | 0.98 | $ | 0.54 | $ | 0.52 | $ | 0.27 | $ | 0.98 | $ | 0.36 | $ | 0.42 | ||||||||||||||
| Discontinued operations | (0.01 | ) | — | — | — | 0.02 | 0.02 | — | (0.01 | ) | |||||||||||||||||||||
| Net (loss) income | $ | (0.76 | ) | $ | 0.98 | $ | 0.54 | $ | 0.52 | $ | 0.29 | $ | 1.00 | $ | 0.36 | $ | 0.41 | ||||||||||||||
| Common stock price per share: | |||||||||||||||||||||||||||||||
| High | $ | 54.79 | $ | 44.95 | $ | 42.73 | $ | 44.00 | $ | 43.07 | $ | 36.98 | $ | 39.70 | $ | 38.96 | |||||||||||||||
| Low | $ | 44.06 | $ | 38.66 | $ | 36.93 | $ | 38.52 | $ | 32.46 | $ | 30.06 | $ | 30.31 | $ | 29.15 | |||||||||||||||
| Close | $ | 53.37 | $ | 44.27 | $ | 40.18 | $ | 41.02 | $ | 38.57 | $ | 35.84 | $ | 31.98 | $ | 36.89 | |||||||||||||||
| Dividends per share | $ | 0.128 | $ | 0.128 | $ | 0.128 | $ | 0.128 | $ | 0.124 | $ | 0.124 | $ | 0.124 | $ | 0.124 | |||||||||||||||
EXHIBIT INDEX
| Exhibit Number | Description | ||||
Incorporated by reference to Exhibit 3.1 of ITT Inc.’s Form 8-K dated May 25, 2018 | |||||
| 3.2 | Incorporated by reference to Exhibit 3.2 of ITT Inc.’s Form 10-K for the year ended December 31, 2022 | ||||
Incorporated by reference to Exhibit 4.1 of ITT Inc.’s Form 10-K for the year ended December 31, 2019 | |||||
Incorporated by reference to Exhibit 10.1 of ITT Inc.’s Form 10-Q for the quarter ended July 3, 2021 | |||||
| 10.2 | Incorporated by reference to Exhibit 10.1 of ITT Inc.’s Form 8-K dated May 12, 2023 | ||||
Incorporated by reference to Exhibit 10.1 of ITT Inc.’s Form 8-K dated December 7, 2023 | |||||
Incorporated by reference to Exhibit 10.1 of ITT Inc.’s Form 8-K dated January 19, 2024 | |||||
Incorporated by reference to Exhibit 4.3 of ITT Inc.’s Form S-3 dated September 18, 2015 | |||||
Incorporated by reference to Exhibit 4.2 of ITT Inc.’s Post-Effective Amendment No. 1 to Registration Statement on Form S-3 dated May 16, 2016 | |||||
Incorporated by reference to Exhibit 10.5 of ITT Inc.’s Form 10-Q for the quarter ended June 30, 2016 | |||||
Incorporated by reference to Exhibit 10.18 of ITT Inc.’s Form 10-K for the year ended December 31, 2020 | |||||
Incorporated by reference to Exhibit 10.19 of ITT Inc.’s Form 10-K for the year ended December 31, 2020 | |||||
Incorporated by reference to Exhibit 10.2 of ITT Inc.’s Form 10-Q for the quarter ended June 30, 2019 | |||||
Incorporated by reference to Exhibit 10.3 of ITT Inc.’s Form 10-Q for the quarter ended June 30, 2019 | |||||
Incorporated by reference to Exhibit 10.10 of ITT Inc.’s Form 10-Q for the quarter ended June 30, 2016 | |||||
Incorporated by reference to Exhibit 10.4 of ITT Inc.’s Form 8-K dated May 16, 2016 | |||||
Incorporated by reference to Exhibit 10.4 of ITT Inc.’s Form 10-Q for the quarter ended March 31, 2020 | |||||
Incorporated by reference to Exhibit 10.1 of ITT Inc.’s Form 10-Q for the quarter ended October 1, 2022 | |||||
Incorporated by reference to Exhibit 4.3 of ITT Inc.’s Registration Statement on Form S-8 as filed on October 28, 2011 | |||||
Incorporated by reference to Exhibit 10.5 of ITT Inc.’s Form 10-Q for the quarter ended June 30, 2008 | |||||
Incorporated by reference to Exhibit 10.2 of ITT Inc.’s Current Report on Form 8-K dated May 16, 2016 | |||||
| 10.19* | Incorporated by reference to Exhibit 10.3 of ITT Inc.’s Form 10-Q for the quarter ended March 31, 2020 | ||||
| 10.20* | Incorporated by reference to Exhibit 10.17 of ITT Inc.’s Form 10-K for the year ended December 31, 2022 | ||||
| 10.21* | Incorporated by reference to Exhibit 10.18 of ITT Inc.’s Form 10-K for the year ended December 31, 2022 | ||||
| 10.22* | Incorporated by reference to Exhibit 10.1 of ITT Inc.’s Form 10-Q for the quarter ended April 2, 2022 | ||||
II-1
| Exhibit Number | Description | ||||
| 10.23* | Incorporated by reference to Exhibit 10.2 of ITT Inc.’s Form 10-Q for the quarter ended April 2, 2022 | ||||
| 10.24* | Incorporated by reference to Exhibit 10.1 of ITT Inc.’s Form 10-Q for the quarter ended March 31, 2021 | ||||
| 10.25* | Incorporated by reference to Exhibit 10.2 of ITT Inc.’s Form 10-Q for the quarter ended March 31, 2021 | ||||
| 10.26* | Incorporated by reference to Exhibit 10.1 of ITT Inc.’s Form 10-Q for the quarter ended July 1, 2023 | ||||
Incorporated by reference to Exhibit 10.5 to ITT Inc.’s Form 8-K dated May 16, 2016 | |||||
Incorporated by reference to Exhibit 10.27 of ITT Inc.’s Form 10-K for the year ended December 31, 2022 | |||||
| 21.1 | |||||
| 23.1 | |||||
| 31.1 | |||||
| 31.2 | |||||
| 32.1 | |||||
| 32.2 | |||||
| 97.1 | |||||
| 101 | The following materials from ITT Inc.’s Annual Report on Form 10-K for the year ended December 31, | ||||
| 104 | Cover Page Interactive Data File (embedded within the Inline XBRL document). | ||||
II-2
SIGNATURES
Pursuant to the requirements of Section 13 or 15(d) of the Securities Exchange Act of 1934, the registrant has duly caused this report to be signed on its behalf by the undersigned, thereunto duly authorized.
| ITT Inc. (Registrant) | |||||
| By: | /S/ CHERYL DE MESA GRAZIANO | ||||
Cheryl de Mesa Graziano Vice President and Chief Accounting Officer (Principal | |||||
| February | |||||
II-3
Pursuant to the requirements of the Securities Exchange Act of 1934, this report has been signed below by the following persons on behalf of the registrant and in the capacities and on the dates indicated.
| SIGNATURE | TITLE | DATE | ||||||||||
| /S/ LUCA SAVI | Chief Executive Officer, President and Director | February 12, 2024 | ||||||||||
(Principal Executive Officer) | ||||||||||||
| /S/ EMMANUEL CAPRAIS | Senior Vice President and Chief Financial Officer | |||||||||||
| Emmanuel Caprais (Principal Financial Officer) | ||||||||||||
| /S/ CHERYL DE MESA GRAZIANO | Vice President and Chief Accounting Officer | February 12, 2024 | ||||||||||
| Cheryl de Mesa Graziano (Principal Accounting Officer) | ||||||||||||
| /S/ | Director | February | ||||||||||
(Principal executive officer) | ||||||||||||
(Principal financial officer) | ||||||||||||
(Principal accounting officer) | ||||||||||||
| /S/ DONALD DEFOSSET, JR. | Director | February | ||||||||||
| Donald DeFosset, Jr. | ||||||||||||
| /S/ NICHOLAS C. FANANDAKIS | Director | February | ||||||||||
| Nicholas C. Fanandakis | ||||||||||||
| /S/ | Director | February | ||||||||||
| /S/ REBECCA A. MCDONALD | Director | February | ||||||||||
| Rebecca A. McDonald | ||||||||||||
| /S/ TIMOTHY H. POWERS | Director | February | ||||||||||
| Timothy H. Powers | ||||||||||||
| /S/ CHERYL L. SHAVERS | Director | February 12, 2024 | ||||||||||
| Cheryl L. Shavers | ||||||||||||
| /S/ SHARON SZAFRANSKI | Director | February 12, 2024 | ||||||||||
| Sharon Szafranski | ||||||||||||
II-4