UNITED STATES
SECURITIES AND EXCHANGE COMMISSION
WASHINGTON, D.C. 20549
FORM 10-K
(☒) ANNUAL REPORT PURSUANT TO SECTION 13 OR 15(d) OF THE SECURITIES EXCHANGE ACT OF 1934
For the fiscal year ended December 31, 20222023
OR
(☐) TRANSITION REPORT PURSUANT TO SECTION 13 OR 15(d) OF THE SECURITIES EXCHANGE ACT OF 1934
For the transition period from __________ to __________
Commission File Number 1-8022
CSX CORPORATION
| | | | | | | | | | | | | | | | | | | | | | | | | | | | | | | | |
| (Exact name of registrant as specified in its charter) |
| Virginia | | | | | | | | | 62-1051971 |
| (State or other jurisdiction of incorporation or organization) | | | | | | | | (I.R.S. Employer Identification No.) |
| | | | | | | | | | |
| 500 Water Street | 15th Floor | Jacksonville | FL | | | | 32202 | | 904 | 359-3200 |
| (Address of principal executive offices) | | | | (Zip Code) | | (Telephone number, including area code) |
| | | | | | | | | | |
| Securities registered pursuant to Section 12(b) of the Act: |
| Title of each class | | | Trading Symbol(s) | | Name of exchange on which registered |
| Common Stock, $1 Par Value | | | CSX | | Nasdaq Global Select Market |
Securities registered pursuant to Section 12(g) of the Act: None
Indicate by check mark if the registrant is a well-known seasoned issuer, as defined in Rule 405 of the Securities Act.
Yes (X) No ( )
Indicate by check mark if the registrant is not required to file reports pursuant to Section 13 or Section 15(d) of the Act.
Yes ( ) No (X)
Indicate by check mark whether the registrant (1) has filed all reports required to be filed by Section 13 or 15(d) of the Securities Exchange Act of 1934 during the preceding 12 months (or for such shorter period that the registrant was required to file such reports), and (2) has been subject to such filing requirements for the past 90 days.
Yes (X) No ( )
Indicate by check mark whether the registrant has submitted electronically every Interactive Data File required to be submitted pursuant to Rule 405 of Regulation S-T (§ 232.405 of this chapter) during the preceding 12 months (or for such shorter period that the registrant was required to submit such files).
Yes (X) No ( )
Indicate by check mark whether the registrant is a large accelerated filer, an accelerated filer, a non-accelerated filer, a smaller reporting company, or an emerging growth company (as defined in Exchange Act Rule 12b-2).
Large Accelerated Filer (X) Accelerated Filer ( ) Non-accelerated Filer ( ) Smaller reporting company (☐)
Emerging growth company (☐)
If an emerging growth company, indicate by check mark if the registrant has elected not to use the extended transition period for complying with any new or revised financial accounting standards provided pursuant to Section 13(a) of the Exchange Act. ( )
Indicate by check mark whether the registrant has filed a report on and attestation to its management’s assessment of the effectiveness of its internal control over financial reporting under Section 404(b) of the Sarbanes-Oxley Act (15 U.S.C. 7262(b)) by the registered public accounting firm that prepared or issued its audit report (☒)
If securities are registered pursuant to Section 12(b) of the Act, indicate by check mark whether the financial statements of the registrant included in the filing reflect the correction of an error to previously issued financial statements. (□)
Indicate by check mark whether any of those error corrections are restatements that required a recovery analysis of incentive-based compensation received by any of the registrant’s executive officers during the relevant recovery period pursuant to § 240.10D-1(b). (□)
Indicate by check mark whether the registrant is a shell company (as defined in Exchange Act Rule 12b-2).
Yes (☐) No (X)
On June 30, 20222023 (which is the last day of the second quarter and the required date to use), the aggregate market value of the Registrant’s voting stock held by non-affiliates was approximately $62$68 billion (based on the close price as reported on the NASDAQ National Market System on such date).
There were 2,062,605,4341,959,134,342 shares of Common Stock outstanding on January 31, 20232024 (the latest practicable date that is closest to the filing date).
DOCUMENTS INCORPORATED BY REFERENCE
Portions of the Registrant’s Definitive Proxy Statement (the “Proxy Statement”) to be filed no later than 120 days after the end of the fiscal year with respect to its 20232024 annual meeting of shareholders.
CSX 20222023 Form 10-K p.1
| | | | | | | | | | | | | | |
| CSX CORPORATION |
| FORM 10-K |
| TABLE OF CONTENTS |
| | | | | |
| Item No. | | Page |
| | | | | |
| PART I |
| 1. | | |
| | | |
| | | |
| 2. | | |
| 3. | | |
| 4. | | |
| | | |
| | | | | |
| PART II |
| 5. | | |
| 6. | | |
| 7. | | |
| | | | |
| | | | | |
| | | | | |
| | | | | |
| | | | | |
| | | | |
| | | | | |
| | | | | |
| 7A. | | |
| 8. | | |
| 9. | | |
| 9A. | | |
| 9B. | | |
| 9C. | | |
| |
| PART III |
| 10. | | |
| 11. | | |
| 12. | | |
| 13. | | |
| 14. | | |
| |
| PART IV |
| 15. | | |
| | | | | |
| |
| | | | | | | | | | | | | | |
| CSX CORPORATION |
| FORM 10-K |
| TABLE OF CONTENTS |
| | | | | |
| Item No. | | Page |
| | | | | |
| PART I |
| 1. | | |
| | | |
| | | |
| | |
| 2. | | |
| 3. | | |
| 4. | | |
| | | |
| | | | | |
| PART II |
| 5. | | |
| 6. | | |
| 7. | | |
| | | | |
| | | | | |
| | | | | |
| | | | | |
| | | | | |
| | | | |
| | | | | |
| | | | | |
| 7A. | | |
| 8. | | |
| 9. | | |
| 9A. | | |
| 9B. | | |
| 9C. | | |
| |
| PART III |
| 10. | | |
| 11. | | |
| 12. | | |
| 13. | | |
| 14. | | |
| |
| PART IV |
| 15. | | |
| | | | | |
| |
CSX 20222023 Form 10-K p.2
Item 1. Business
CSX Corporation, together with its subsidiaries ("CSX" or the “Company”), based in Jacksonville, Florida, is one of the nation's leading transportation companies. The Company provides rail-based freight transportation services including traditional rail service, the transport of intermodal containers and trailers, as well as other transportation services such as rail-to-truck transfers and bulk commodity operations. CSX and the rail industry provide customers with access to an expansive and interconnected transportation network that plays a key role in North American commerce and is critical to the long-term economic success and improved global competitiveness of the United States. In addition, freight railroads provide the most economical and environmentally efficient means to transport goods over land.
CSX Transportation, Inc.
CSX’s principal operating subsidiary, CSX Transportation, Inc. (“CSXT”), provides an important link to the transportation supply chain through its approximately 20,000 route-mile rail network and serves major population centers in 26 states east of the Mississippi River, the District of Columbia and the Canadian provinces of Ontario and Quebec. It has access to over 70 ocean, river and lake port terminals along the Atlantic and Gulf Coasts, the Mississippi River, the Great Lakes and the St. Lawrence Seaway. This access allows the Company to meet the dynamic transportation needs of manufacturers, industrial producers, the automotive industry, construction companies, farmers and feed mills, wholesalers and retailers, and energy producers. The Company’s intermodal business links customers to railroads via trucks and terminals. CSXT also serves thousands of production and distribution facilities through track connections with other Class I railroads and more than 240 short-line and regional railroads. On June 1, 2022, CSX completed its acquisition of Pan Am Systems, Inc. (“Pan Am”), which is the parent company of Pan Am Railways, Inc. This acquisition expandsexpanded CSXT’s reach in the Northeastern United States. For further details, refer to Note 17, Business Combinations.Combinations.
CSXT is also responsible for the Company's real estate sales, leasing, acquisition and management and development activities. Substantially all of these activities are focused on supporting railroad operations.
Other Entities
In addition to CSXT, the Company’s subsidiaries include Quality Carriers, Inc. ("Quality Carriers"), CSX Intermodal Terminals, Inc. (“CSX Intermodal Terminals”), Total Distribution Services, Inc. (“TDSI”), TransfloTRANSFLO Terminal Services, Inc. (“Transflo”TRANSFLO”), CSX Technology, Inc. (“CSX Technology”) and other subsidiaries. Effective July 1, 2021, CSX acquired Quality Carriers, the largest provider of bulk liquid chemicals truck transportation in North America. For further details, refer to Note 17, Business CombinationsCombinations.. CSX Intermodal Terminals owns and operates a system of intermodal terminals, predominantly in the eastern United States, and also provides drayage services (the pickup and delivery of intermodal shipments) for certain customers. TDSI serves the automotive industry with distribution centers and storage locations. TransfloTRANSFLO connects non-rail served customers to the many benefits of rail by transferring products from rail to trucks. The biggest TransfloTRANSFLO markets are chemicals and agriculture, which includes shipments of plastics and ethanol. CSX Technology and other subsidiaries provide support services for the Company.
Operating Model
The Company is focused on developing and strictly maintaining a scheduled service plan with an emphasis on improving customer service, optimizing assets and increasing employee engagement. When this operating model is executed effectively, the Company competes for an increased share of the U.S. freight market. Further, this model leads to reduced costs and strong free cash flow generation.
CSX 20222023 Form 10-K p.3
Lines of Business
During 2022,2023, the Company's services generated $14.9$14.7 billion of revenue and served four primary lines of business: merchandise, intermodal, coal and trucking.
•The merchandise business shipped 2.6 million carloads (41%(43% of volume) and generated $8.2$8.7 billion in revenue (55%(59% of revenue) in 2022.2023. The Company’s merchandise business is comprised of shipments in the following diverse markets: chemicals, agricultural and food products, automotive, minerals, automotive, forest products, metals and equipment, and fertilizers.
•The intermodal business shipped 3.02.8 million units (48%(45% of volume) and generated $2.3$2.1 billion in revenue (16%(14% of revenue) in 2022.2023. The intermodal business combines the superior economics of rail transportation with the flexibility of trucks and offers a cost and environmental advantage over long-haul trucking. Through a network of approximately 30 terminals, the intermodal business serves all major markets east of the Mississippi River and transports mainly manufactured consumer goods in containers, providing customers with truck-like service for longer shipments.
•The coal business shipped 697755 thousand carloads (11%(12% of volume) and generated $2.4$2.5 billion in revenue (16%(17% of revenue) in 2022.2023. The Company transports domestic coal, coke and iron ore to electricity-generating power plants, steel manufacturers and industrial plants as well as export coal to deep-water port facilities. Most of the export coal the Company transports is used for steelmaking, while the majority of domestic coal the Company ships is used for electricity generation.
•The trucking business generated $966$882 million, or 7%6%, of revenue in 2022.2023. Trucking revenue includes revenue from the operations of Quality Carriers, which was acquired by CSX effective July 1, 2021.
Other revenue accounted for 6%4% of the Company’s total revenue in 2022.2023. This category includes revenue from regional subsidiary railroads and incidental charges, including intermodal storage and equipment usage, demurrage and switching. Revenue from regional subsidiary railroads includes shipments by railroads that the Company does not directly operate. Intermodal storage represents charges for customer storage of containers at an intermodal terminal, ramp facility or offsite location beyond a specified period of time. Demurrage represents charges assessed when freight cars are held by a customer beyond a specified period of time. Switching represents charges assessed when a railroad switches cars for a customer or another railroad.
CSX's Committed Workforce
Most of the Company’s employees provide or support transportation services. The Company had more than 22,50023,000 employees as of December 2022,2023, which includes approximately 17,10017,700 employees that are members of a rail labor union. As of December 2, 2022, all 12 rail unions at CSX that participated in national bargaining were covered by national agreements with the Class I railroads and CSX-specific agreements that will remain in effect through December 31, 2024. InCollective agreements under the face of supply chain disruptionRailway Labor Act do not expire, but continue until amended, and a tight labor market, CSX continuesformal notices to focus on ensuring the hiring pipeline for frontline railroaders is adequate to meet customer needs and has implemented new recruiting and staffing measures.amend these agreements may be served as early as November 1, 2024.
CSX prioritizes workplace safety for employees and is committed to continued improvement through enhanced processes, training, technology, communication, and continuous collaboration with customers and peers across the railroad industry. Training programs and processes are focused on injury and accident prevention as well as emergency preparedness. The attainment of key safety targets is a component of management's annual incentive program. The FRA Personal Injury Frequency Index, a measure of the number of FRA-reportable injuries per 200,000 man-hours, was 0.960.89 in both2023 and 1.01 in 2022, and 2021, remaining flatimproving year over year.
CSX 20222023 Form 10-K p.4
The Compensation and Talent Management Committee of the Board of Directors is charged with oversight of CSX's workforce. The Company is committed to developing a culture that promotes workforce diversity and inclusion and encourages ethical behavior. As of December 31, 2022,2023, approximately 21%23% of CSX's overall workforce and 36%37% of management was diverse, calculated as the percentage of males of color and all females. In 2022,2023, CSX was recognized as a “Best Place to Work for Disability Inclusion” by Disability:IN and the American Association of People with Disabilities for a fourthfifth consecutive year after receiving a top score on their disability equality index. The CSX Code of Ethics serves as a guiding standard for ethical behavior and covers many types of matters, including discrimination and harassment as well as safety. Annually, all management employees are required, and union employees are highly encouraged, to complete ethics training.
Company History
A leader in freight rail transportation for nearly 200 years, the Company’s heritage dates back to the early nineteenth century when The Baltimore and Ohio Railroad Company (“B&O”), the nation’s first common carrier, was chartered in 1827. Since that time, the Company has built on this foundation to create a railroad that could safely and reliably service the ever-increasing demands of a growing nation. Since its founding, numerous railroads have combined with the former B&O through merger and consolidation to create what has become CSX. Each of the railroads that combined into the CSX family brought new geographical reach to valuable markets, gateways, cities, ports and transportation corridors.
CSX Corporation was incorporated in 1978 under Virginia law. In 1980, the Company completed the merger of the Chessie System and Seaboard Coast Line Industries into CSX. The merger allowed the Company to connect northern population centers and Appalachian coal fields to growing southeastern markets. Later, the Company’s acquisition of key portions of Conrail, Inc. ("Conrail") allowed CSXT to link the northeast, including New England and the New York metropolitan area, with Chicago and midwestern markets as well as the growing areas in the Southeast already served by CSXT. This current rail network, which now includes the network acquired from Pan Am, allows the Company to directly serve every major market in the eastern United States with safe, dependable, environmentally responsible and fuel efficient freight transportation and intermodal service.
Competition
The business environment in which the Company operates is highly competitive. Shippers typically select transportation providers that offer the most compelling combination of service and price. Service requirements, both in terms of transit time and reliability, vary by shipper and commodity. As a result, the Company’s primary competition varies by commodity, geographic location and mode of available transportation and includes other railroads, motor carriers that operate similar routes across its service area and, to a less significant extent, barges, ships and pipelines.
CSXT’s primary rail competitor is Norfolk Southern Railway, which operates throughout much of the Company’s territory. Other railroads also operate in parts of the Company’s territory. Depending on the specific market, competing railroads and deregulated motor carriers may exert pressure on price and service levels. For further discussion on the risk of competition to the Company, see Item 1A. Risk Factors.Factors.
CSX 20222023 Form 10-K p.5
Regulatory Environment
The Company's operations are subject to various federal, state, provincial (Canada) and local laws and regulations generally applicable to businesses operating in the United States and Canada. In the U.S., the railroad operations conducted by the Company's subsidiaries, including CSXT, are subject to the regulatory jurisdiction of the Surface Transportation Board (“STB”), the Federal Railroad Administration (“FRA”), and its sister agency within the U.S. Department of Transportation ("DOT"), the Pipeline and Hazardous Materials Safety Administration (“PHMSA”). Together, FRA and PHMSA have broad jurisdiction over railroad operating standards and practices, including track, freight cars, locomotives and hazardous materials requirements. In addition, the U.S. Environmental Protection Agency (“EPA”) has regulatory authority with respect to matters that impact the Company's properties and operations.
The Transportation Security Administration (“TSA”), a component of the Department of Homeland Security, has broad authority over railroad operating practices that may have homeland security implications. In Canada, the railroad operations conducted by the Company’s subsidiaries, including CSXT, are subject to the regulatory jurisdiction of the Canadian Transportation Agency.
Although the Staggers Act of 1980 significantly deregulated the U.S. rail industry, the STB has broad jurisdiction over rail carriers. The STB regulates routes, fuel surcharges, conditions of service, rates for non-exempt traffic, acquisitions of control over rail common carriers and the transfer, extension or abandonment of rail lines, among other railroad activities. Any new rules from the STB regarding, among other things, competitive access or revenue adequacy could have a material adverse effect on the Company's financial condition, results of operations and liquidity as well as its ability to invest in enhancing and maintaining vital infrastructure. For further discussion on regulatory risks to the Company, see Item 1A. Risk Factors.
Financial Information
Information regarding the Company's results of operations and financial position can be found in Item 7. Management’s Discussion and Analysis of Financial Condition.Condition and Results of Operations.
Other Information
CSX makes available on its website www.csx.com, free of charge, its annual reports on Form 10-K, quarterly reports on Form 10-Q, current reports on Form 8-K and all amendments to those reports as soon as reasonably practicable after such reports are filed with or furnished to the Securities and Exchange Commission (“SEC”). The information on the CSX website is not part of this annual report on Form 10-K. Additionally, the Company has posted its code of ethics on its website, which is also available to any shareholder who requests it. This Form 10-K and other SEC filings made by CSX are also accessible through the SEC’s website at www.sec.gov.
CSX has included the certifications of its Chief Executive Officer (“CEO”) and the Chief Financial Officer (“CFO”) required by Section 302 of the Sarbanes-Oxley Act of 2002 (“the Act”) as Exhibit 31, as well as Section 906 of the Act as Exhibit 32 to this Form 10-K report.
For additional information concerning business conducted by the Company during 2022,2023, see Item 7. Management's Discussion and Analysis of Financial Condition and Results of Operations.
CSX 20222023 Form 10-K p.6
Item 1A. Risk Factors
The risks set forth in the following risk factors could have a material adverse effect on the Company's financial condition, results of operations or liquidity, and could cause those results to differ materially from those expressed or implied in the Company's forward-looking statements. Additional risks and uncertainties not currently known to the Company or that the Company currently does not deem to be material also may materially impact the Company's financial condition, results of operations or liquidity.
Regulatory, Legislative and Legal
New legislation, or regulatory changes or other governmental actions could impact the Company's earnings or restrict its ability to independently negotiate prices.
Legislation passed by Congress, new regulations issued by federal agencies, or executive orders issued by the President of the United States could significantly affect the revenues, costs, including income taxes, and profitability of the Company's business. In addition, statutes or regulations imposingthat, among other things, impose price constraints or affecting rail-to-rail competition could adversely affect the Company's profitability.
Government regulation and compliance risks may adversely affect the Company's operations and financial results.
The Company is subject to the jurisdiction of various regulatory agencies, including the STB, FRA, PHMSA, TSA, EPA and other state, provincial, local and federal regulatory agencies for a variety of economic, health, safety, labor, environmental, tax, legal, cybersecurity and other matters. New or modified rules or regulations by these agencies could increase the Company's operating costs, adversely impact revenue or reduce operating efficiencies and affect service performance. Noncompliance with applicable laws or regulations could erode public confidence in the Company and can subject the Company to fines, penalties and other legal or regulatory sanctions.
CSXT, as a common carrier by rail, is required by law to transport hazardous materials whichand could expose the Company to significant costsbe adversely impacted by non-compliance with applicable regulations or from regulatory and claims.
A train accident involving the transport of hazardous materials could result in significant claims arising from personal injury, property or natural resource damage, environmental penalties and remediation obligations. Such claims, if insured, could exceed existing insurance coverage or insurance may not continue to be available at commercially reasonable rates. Under federal regulations, CSXT is required to transport hazardous materials under the legal duty referred to as the common carrier mandate.
CSXT is also required to comply with regulations regarding the handling of hazardous materials. In November 2008,materials and has a legal obligation to transport certain hazardous materials under the common carrier mandate. Applicable rules issued by the TSA issued final rules placingplace significant new security and safety requirements on passenger and freight railroad carriers, rail transit systems and facilities that ship hazardous materials by rail. Noncompliance with these rules can subject the Company to significant penalties and could be a factor in litigation arising out of a train accident. Finally, legislation preventing the transport of hazardous materials through certain cities could result in network congestion and increase the length of haul for hazardous substances, which could increase operating costs, reduce operating efficiency or increase the risk of an accident involving the transport of hazardous materials.
CSX 20222023 Form 10-K p.7
The Company may be subject to various claims and lawsuits that could result in significant expenditures.
As part of its railroad and other operations, the Company is subject to various claims and lawsuits related to disputes over commercial practices, labor and unemployment matters, occupational and personal injury claims, property damage or freight damage, environmental and other matters. The Company may experience material judgments or incur significant costs to defend existing and future lawsuits. Although the Company maintains insurance to cover some of these types of claims and establishes reserves when appropriate, final amounts determined to be due on any outstanding matters may exceed the Company's insurance coverage or differ materially from the recorded reserves. Additionally, the Company could be impacted by adverse developments not currently reflected in the Company's reserve estimates.
Operational, Safety and Business Disruption
An epidemic or pandemic and the initiatives to reduce its transmission could adversely affect the Company's business.
The Company could be materially and adversely affected by a public health crisis, including a widespread epidemic or pandemic. During a health crisis, policies and initiatives may be instituted by the public and private sector to reduce transmission, such as closures of businesses and manufacturing facilities, the promotion of social distancing, the adoption of working from home by companies and institutions, and travel restrictions. These policies or initiatives could adversely affect demand for the commodities and products that the Company transports, including import and export volume.
In addition, initiatives to reduce transmission could result in supply chain disruptions, which could impact volumes and make it more difficult for the Company to serve its customers. Moreover, operations are negatively affected when a significant number of employees are quarantined as the result of exposure to a contagious illness. To the extent a public health crisis adversely affects the Company's business and financial results, it may also have the effect of heightening many of the other risks described herein.
The Company relies on the security, stability and availability of its technology systems to operate its business.
The Company relies on information technology in all aspects of its business. The security, stability and availability of the Company’s and its key third-party vendors’ information technology systems are critical to its ability to operate safely and effectively and to compete within the transportation industry. A successful data breach, cyber-attack, or the occurrence of any similar incident that impacts the Company’s or its key third-party vendors’ information technology systems could result in a service interruption, train accident, misappropriation of confidential or proprietary information (including personal information), process failure, or other operational difficulties. A disruption or compromise of the Company’s or its key third-party vendors' information technology systems, even for short periods of time, and any resulting theft or compromise of Company confidential or proprietary information (including personal information), could adversely affect the Company’s business or reputation, create significant legal, regulatory or financial exposure and have a material adverse impact on CSX’s business, financial condition or operations.
CSX 20222023 Form 10-K p.8
The Company, its third-party vendors and other companies in the rail and transportation industries have been subject to, and are likely to continue to be the target of, data breaches, cyber-attacks and other similar incidents. These incidents may include, among other things, malware, ransomware, distributed denial of service attacks, social engineering, phishing, theft, malfeasance or improper access by employees or third-party vendors, software bugs, server malfunctions, software or hardware failures, human error, fraud, or other modes of attack or disruption. Attacks of these nature are increasing in frequency, levels of persistence, intensity and sophistication.sophistication, including by nation-state threat actors or those associated with nation-states. Further, the Company may be at increased risk of experiencing a cyber-attack as a result of being a component of the critical U.S. infrastructure. If such an event takes place, the Company may be required to incur significant expenses in excess of existing cybersecurity insurance coverage. As cybersecurity threats continue to evolve, the Company may be required to expend significant additional resources to continue to modify or enhance its protective measures or to investigate and remediate any information security vulnerabilities, data breaches, cyber-attacks or other similar incidents. A public health crisis could also increase the risk that theThe Company or its third-party vendors may also experience cybersecurity incidents as a result of employees, third-party vendors and other third parties with which they interact working remotely on less secure systems and environments.
Despite the Company’s efforts to protect its information technology systems, it may not be able to prevent or anticipate all data breaches, cyber-attacks or other similar incidents, detect or react to such incidents in a timely manner or adequately remediate any such incident. While CSX’s security protocols have detected attempts to gain unauthorized access to the Company’s information technology systems, none of such attempts have resulted in any material breach of or disruption to the Company’s systems. For example, CSX has experienced distributed denial of service attacks that have resulted in brief system disruptions, but none have resulted in access to CSX systems. Additionally, despite routine security assessment of the Company’s key third-party vendors, some vendors have experienced cyber-attacks in the past, but none of such attacks have had a material adverse impact on CSX’s business or operations. Due to applicable laws, rules and regulations or contractual obligations, CSX may be held responsible for data breaches, cyber-attacks or other similar incidents attributed to its third-party vendors as they relate to the information CSX shares with them.
Additionally, if CSX is unable to successfully acquire, develop or implement new technology, including artificial intelligence, it may suffer a competitive disadvantage within the rail industry and with companies providing other modes of transportation service.services.
Network or supply chain constraints could have a negative impact on service, operating efficiency or volume of shipments.
CSXT could experience rail network difficulties related to: (i) locomotive or crew shortages; (ii) labor shortages or other service disruptions in the supply chain affecting trucking, ports, handling facilities, customer facilities or other railroads; (iii) unpredictable increases in demand; (iv) extreme weather conditions; (v) regulatory changes resulting in forced access or impacting where and how fast CSXT can transport freight or maintain routes; (vi) reductions in availability of pooled equipment, including chassis; (vii) impacts from changes in network capacity or structure; or (viii) increased passenger activities, which could impact CSXT's operational fluidity, leading to deterioration of service, asset utilization and overall efficiency.
CSXT, as a common carrier by rail, transports hazardous materials, which could expose the Company to significant costs and claims in the event of a train accident.
A train accident involving the transport of hazardous materials could result in significant costs and claims arising from personal injury, property or natural resource damage, environmental penalties and remediation obligations. Such claims, if insured, could exceed existing insurance coverage or insurance may not continue to be available at commercially reasonable rates, which could have a material adverse effect on the Company's results of operations, financial condition, and liquidity. Under federal regulations, CSXT is required to transport certain hazardous materials under the legal duty referred to as the common carrier mandate regardless of risk or potential exposure to loss.
Future acts of terrorism, war or regulatory changes to combat the risk of terrorism may cause significant disruptions in the Company's operations.
Terrorist attacks, along with any government response to those attacks, may adversely affect the Company's financial condition, results of operations or liquidity. CSXT's rail lines, other key infrastructure and information technology systems may be targets or indirect casualties of acts of terror or war. This risk could cause significant business interruption and result in increased costs and liabilities and decreased revenues. In addition, premiums charged for some or all of the insurance coverage currently maintained by the Company could increase dramatically, or the coverage may no longer be available.
Furthermore, in response to the heightened risk of terrorism, federal, state and local governmental bodies are proposing and, in some cases, have adopted legislation and regulations relating to security issues that impact the transportation industry. For example, the Department of Homeland Security adopted regulations that require freight railroads to implement additional security protocols when transporting hazardous materials. Complying with these or future regulations could continue to increase the Company's operating costs and reduce operating efficiencies.
Severe weather or other natural occurrences could result in significant business interruptions and expenditures in excess of available insurance coverage.
The Company's operations may be affected by external factors such as severe weather and other natural occurrences, including floods, hurricanes, fires and earthquakes. As a result, the Company's rail network may be damaged, its workforce may be unavailable, fuel costs may rise and significant business interruptions could occur. In addition, the performance of locomotives and railcars could be adversely affected by extreme weather conditions. Hurricanes as well as storm and flooding events have impacted the Company's network in the past, leading to interrupted service and damage to track and equipment. Changes in weather patterns caused by climate change are expected to increase the frequency, severity or duration of certain adverse weather conditions.
Insurance maintained by the Company to protect against loss of business and other related consequences resulting from these natural occurrences is subject to coverage limitations, depending on the nature of the risk insured. This insurance may not be sufficient to cover all of the Company's damages or damages to others, and this insurance may not continue to be available at commercially reasonable rates. Even with insurance, if any natural occurrence leads to a catastrophic interruption of service, the Company may not be able to restore service without a significant interruption in operations.
Competitive, Economic and Financial
The Company faces competition from other transportation providers.
The Company experiences competition in pricing, service, reliability and other factors from various transportation providers including railroads and motor carriers that operate similar routes across its service area and, to a less significant extent, barges, ships and pipelines. Other transportation providers generally use public rights-of-way that are built and maintained by governmental entities, while CSXT and other railroads must build and maintain rail networks largely using internal resources. Any future improvements or expenditures materially increasing the quality or reducing the cost of alternative modes of transportation such as through the use of automation, autonomy or electrification, or legislation providing for less stringent size or weight restrictions on trucks, could negatively impact the Company's competitive position. Additionally, any future consolidation in the rail industry could materially affect the regulatory and competitive environment in which the Company operates.
Global economic conditions could negatively affect demand for commodities and other freight.
A decline or disruption in general domestic and global economic conditions that affects demand for the commodities and products the Company transports, including import and export volume, could reduce revenues or have other adverse effects on the Company's cost structure and profitability. For example, slower rates of economic growth in Asia, contraction of European economies, and changes in the global supply of seaborne coal or price of seaborne coal have adverse impacts on U.S. export coal volume and result in lower coal revenue for CSX. Additionally, embargoes or changes to trade agreements or policies could result in reduced import and export volumes due to increased tariffs and lower consumer demand. If the Company experiences significant declines in demand for its transportation services with respect to one or more commodities and products or continues to experience the impacts of inflation, the Company may experience reduced revenue and increased operating costs, workforce adjustments, and other related activities, which could have a material adverse effect on the Company's financial condition, results of operations and liquidity.
Changing dynamics in the U.S. and global energy markets could negatively impact profitability.
Over time, changing dynamics in the U.S. and global energy markets, including the impacts of regulation and alternative fuel sources, have resulted in lower energy production from coal-fired power plants in CSX's service territory. Changes in natural gas prices, or other factors impacting demand for electricity, could impact future power generation at coal-fired plants, which would affect the Company's domestic coal volumes and revenues.
Weaknesses in the capital and credit markets could negatively impact the Company’s access to capital.
The Company regularly relies on capital markets for the issuance of long-term debt instruments, commercial paper and bank financing from time to time. Instability or disruptions of the capital markets, including credit markets, significant increases in interest rates, or the deterioration of the Company’s financial condition due to internal or external factors, could restrict or prohibit access and could increase financing costs. A significant deterioration of the Company’s financial condition could also reduce credit ratings and could limit or affect its access to external sources of capital and increase the costs of short and long-term debt financing.
Availability of Critical Supplies and Labor
The unavailability of critical resources could adversely affect the Company’s operational efficiency and ability to meet demand.
Marketplace conditions for resources like locomotives as well as the availability of qualified personnel, particularlyincluding engineers and conductors as well as other skilled professional or technical employees, could each have a negative impact on the Company’s ability to meet demand for rail service. Although the Company strives to maintain adequate resources and personnel for the current business environment, unpredictable increases in demand for rail services or extreme weather conditions may exacerbate such risks, which could have a negative impact on the Company’s operational efficiency and otherwise have a material adverse effect on the Company’s financial condition, results of operations, or liquidity in a particular period.
Disruption to a key railroad industry supplier could negatively affect operating efficiency and increase costs.
The capital intensive and unique nature of core rail equipment (including rail, ties, freight cars and locomotives) limits the number of railroad equipment suppliers. If any of the current manufacturers stops production or experiences a supply shortage, CSXT could experience a significant cost increase or material shortage. In addition, a few critical railroad suppliers are foreign and, as such, adverse developments in international relations, new trade regulations, disruptions in international shipping or increases in global demand could make procurement of these supplies more difficult or increase CSXT's costs. Additionally, if a fuel supply shortage were to arise, the Company would be negatively impacted.
Failure to complete negotiations on collective bargaining agreements could result in strikes and/or work stoppages.
Most of CSX's employees are represented by labor unions and are covered by collective bargaining agreements. These agreements are either bargained for nationally by the National Carriers Conference Committee or locally between CSX and the union. Such agreements are negotiated over the course of several years and previously have not resulted in any extended work stoppages. Under the Railway Labor Act's procedures (which include mediation, cooling-off periods and the possibility of an intervention by the President of the United States), during negotiations neither party may take action until the procedures are exhausted. If, however, CSX is unable to negotiate acceptable agreements, the employees covered by the Railway Labor Act could strike, which could result in loss of business and increased operating costs as a result of higher wages or benefits paid to union members.
Climate Change and Environmental
The Company’s operations and financial results could be negatively impacted by climate change and regulatory and legislative responses to climate change.
There is potential for operational impacts from changing weather patterns or rising sea levels in the Company's operational territory, which could impact the Company's network or other assets.
Climate change and other emissions-related laws and regulations have been proposed and, in some cases adopted, on the federal, state, provincial and local levels. These final and proposed laws and regulations take the form of restrictions, caps, taxes or other controls on emissions.emissions as well as requirements to disclose information relating to climate change. In particular, the EPA has issued various regulations and may issue additional regulations targeting emissions, including rules and standards governing emissions from certain stationary sources and from vehicles. Any of these pending or proposed laws or regulations, including any proposed or implemented under the Biden administration, could adversely affect the Company's operations and financial results by, among other things: (i) reducing coal-fired electricity generation due to mandated emission standards; (ii) reducing the consumption of coal as a viable energy resource in the United States and Canada; (iii) increasing the Company's fuel, capital and other operating costs and negatively affecting operating and fuel efficiencies; and (iv) making it difficult for the Company's customers in the U.S. and Canada to produce products in a cost competitive manner. Any of these factors could reduce the amount of shipments the Company handles and have a material adverse effect on the Company's financial condition, results of operations or liquidity. In addition, CSX may become subject to legal requirements to disclose climate change related information and may become subject to demands or expectations by its supply chain partners, customers or other stakeholders to disclose information relating to climate risk or set related targets or goals. The Company's current practices with respect to climate risk disclosure may fail to meet these developing legal requirements or stakeholder demands or expectations. In addition, legislative or regulatory uncertainties and change regarding climate-related risks, including inconsistent perspectives or requirements, are likely to result in higher regulatory, compliance, credit, reputational and other risks and costs.
The Company is subject to environmental laws and regulations that may result in significant costs.
The Company is subject to wide-ranging federal, state, provincial and local environmental laws and regulations concerning, among other things, emissions into the air, ground and water; the handling, storage, use, generation, transportation and disposal of waste and other materials; the clean-up of hazardous material and petroleum releases and the health and safety of our employees. If the Company violates or fails to comply with these laws and regulations, CSX could be fined or otherwise sanctioned by regulators. The Company can also be held liable for consequences arising out of human exposure to any hazardous substances for which CSX is responsible. In certain circumstances, environmental liability can extend to formerly owned or operated properties, leased properties, adjacent properties and properties owned by third parties or Company predecessors, as well as to properties currently owned, leased or used by the Company.
The Company has been, and may in the future be, subject to allegations or findings to the effect that it has violated, or is strictly liable under, environmental laws or regulations, and such violations can result in the Company's incurring fines, penalties or costs relating to the cleanup of environmental contamination. Although the Company believes it has appropriately recorded current and long-term liabilities for known and reasonably estimable future environmental costs, it could incur significant costs that exceed reserves or require unanticipated cash expenditures as a result of any of the foregoing. The Company also may be required to incur significant expenses to investigate and remediate known, unknown or future environmental contamination.
Item 1B. Unresolved Staff Comments
None
CSX 20222023 Form 10-K p.12p.13
Item 1C. Cybersecurity
Cybersecurity Risk Management and Strategy
Strong performance and reliability of the Company's technology systems are critical to operating safely and effectively, and protecting personal and customer data is essential to maintaining stakeholder trust. The Company has implemented processes designed to assess, identify, and manage material cybersecurity risks, as described further below. CSX maintains a cybersecurity framework that is integrated across the organization through people, processes and technology to help protect the personal information of its customers, its contractors and its suppliers as well as protect the integrity of its own operations. Cybersecurity is also integrated into the Company’s Enterprise Risk Management (“ERM”) program. The Company equips CSX systems with various cybersecurity tools, conducts vulnerability scans and provides critical cybersecurity information to application users, as appropriate. The Company also takes proactive measures to advise CSX employees of how they can assist the Company in its cybersecurity practices. CSX informs employees on cybersecurity best practices, including how to identify cyber-related suspicious activity, how to report such activity and, as appropriate, proactive measures employees can take to safeguard company information and devices. The Company also provides cybersecurity awareness training to employees and conducts cybersecurity testing exercises to help maintain cybersecurity vigilance. With the assistance of third-party consultants, the Company conducts an annual cybersecurity exercise, which is often a "tabletop" scenario involving a cross-functional group responding to a hypothetical cybersecurity threat.
The Company considers its material cybersecurity-related risks, as described in more detail below and at Item 1A. Risk Factors, and applies various frameworks to establish controls that are reasonably designed to identify, protect, detect, respond to, and recover from significant cybersecurity incidents. The Company also tests its cybersecurity program to assess whether enhancements to cybersecurity measures are appropriate, such as additional detection and prevention capabilities. These tests may include the use of internal or third-party external risk assessments, and penetration testing. The Company also conducts periodic cybersecurity assessments, as appropriate, pursuant to its annual risk assessment process. Third party resources may also be used for these assessments.
As part of its cybersecurity program, CSX partners with a third-party to provide a managed service that is designed to enable continuous monitoring at its Security Operation Center ("SOC"). The SOC has established processes to identify, address, and remediate cybersecurity threats or vulnerabilities. This includes the engagement, where necessary, of third-party experts, advisors, and other cybersecurity professionals that have been retained by the Company to assist in responding to cybersecurity incidents or threats. Company processes also include various procedures for notifying members of the company's cybersecurity department, Chief Information Security Officer ("CISO"), legal department, accounting department, and others as applicable.
The Company has processes designed to provide reasonable oversight for the identification of cybersecurity risks associated with certain third-party service providers. As appropriate, the Company requires certain third-party providers to complete a cybersecurity questionnaire, to provide Service Organization Control assessment results, if such results exist, or to agree to contractual language regarding cybersecurity and incident notification obligations in agreements with the company. CSX also has processes that help monitor risks associated with its key third-party vendors’ technology systems, including, where appropriate, performing security assessments of cyber incidents through dashboard alerting for reported events. CSX’s internal cybersecurity processes and disclosure protocols consider cybersecurity incidents involving key applications provided by third-parties.
The Company, its third-party vendors and other companies in the rail and transportation industries have been subject to, and are likely to continue to be the target of, data breaches, cyber-attacks and other similar incidents as discussed in more detail in Item 1A. Risk Factors. In light of the numerous cybersecurity risks that CSX faces, it is reasonably likely that any of the related risks, individually or collectively, if significant, could materially affect the Company’s operations, including but not limited to service interruption, train accident or derailment, misappropriation of confidential or proprietary information (including personal information), process failure, or other operational difficulties.
Cybersecurity Governance
The cybersecurity program and related risks at CSX are managed by the VP Technology and CISO. The Company's CISO is a Certified Information Systems Auditor with over 30 years of industry experience including information security leadership positions at multiple publicly-traded companies.
The CISO is notified of cybersecurity events as needed based on the Company’s processes for addressing cybersecurity incidents and threats. The CISO is supported by a team that includes the SOC, which consists of the Deputy Chief Information Security Officer and other cybersecurity professionals as well as a team of third-party contractors. The SOC, with the assistance of outside third-parties as needed, analyzes, evaluates and remediates cybersecurity incidents and provides investigative information to the CISO. Depending on the significance of any specific cybersecurity incident or threat, and/or relation to prior incidents, the CISO will escalate relevant information, as appropriate, and the Company’s legal and accounting groups, with assistance from other company departments and third parties, will assist in assessing potential SEC disclosure obligations. The CISO coordinates disclosure to other agencies, when necessary, including requirements under the Transportation Security Administration directives.
More significant cybersecurity incidents or threats may result in notifications to senior leadership and, if necessary, to the Audit Committee and the Board of Directors. Additionally, a cybersecurity governance briefing takes place quarterly with leaders from the Company's technology, operations, commercial, legal, and accounting departments to discuss cybersecurity risks, threats, and incidents, including updates from the SOC and an assessment of ways to mitigate and remediate any threats or incidents the Company may be facing.
The Company's Audit Committee of the Board of Directors oversees the Company's cybersecurity risk, mitigation strategies and overall resiliency of the Company’s technology infrastructure. Such risk is managed as part of the Company’s overall risk management and business continuity processes and is included in the ERM program, which is also overseen by the Audit Committee. The Audit Committee periodically reviews assessments of information security controls and procedures, any incidents that could have a potentially significant impact on the company’s network, as well as potential cybersecurity risk disclosures. The Company's senior leadership team briefs the Audit Committee and Board of Directors at least annually on information technology and cybersecurity matters, including more frequent updates as circumstances warrant. Such annual updates include significant findings or updates by internal or external evaluations. The Audit Committee is apprised annually on emerging risks to the Company, including education on cybersecurity-related matters as needed. CSX has a cybersecurity expert on the Board and its Audit Committee to provide expanded oversight of the Company’s cybersecurity and technology systems.
Item 2. Properties
The Company’s properties primarily consist of track and its related infrastructure, locomotives, and freight cars and equipment. These categories and the geography of the network are described below.
Track and Infrastructure
Serving 26 states, the District of Columbia, and the Canadian provinces of Ontario and Quebec, the CSXT rail network serves, among other markets, New York, Philadelphia and Boston in the Northeast and Mid-Atlantic, the southeast markets of Atlanta, Miami and New Orleans, and the midwestern markets of St. Louis, MemphisColumbus and Chicago.
CSXT’s track structure includes mainline track, connecting terminals and yards, track within terminals and switching yards, sidings used for passing trains, track connecting CSXT's track to customer locations and turnouts that divert trains from one track to another. Total track miles, which reflect the size of CSXT’s network that connects markets, customers and western railroads, are greater than CSXT’s approximately 20,000 route miles. At December 2022,2023, the breakdown of track miles was as follows:
| | | | | |
| | Track |
| | Miles |
| Single Mainline Track | 19,87919,671 | |
| Other Mainline Track | 5,6625,652 | |
| Terminals and Switching Yards | 9,3089,270 | |
| Passing Sidings and Turnouts | 901896 | |
| Total | 35,75035,489 | |
In addition to its physical track structure, the Company operates numerous yards and terminals for rail and intermodal service. These serve as points of connectivity between the Company and its local customers and as sorting facilities where railcars and intermodal containers are received, classed for destination and placed onto outbound trains, or arrive and are delivered to the customer. The Company’s largest yards and terminals based on 20222023 volume (number of railcars or intermodal containers processed) are listed below.
| | | | | |
| Yards and Terminals | Annual Volume |
| Waycross, GA | 931,488930,651 | |
| Bedford Park Intermodal Terminal (Chicago) | 886,636926,845 | |
| Nashville, TN | 645,352 | |
| Cincinnati, OH | 644,478 | |
| Selkirk, NY | 636,750625,308 | |
Nashville, TN | 627,868 | |
Cincinnati, OH | 622,906 | |
| Avon, IN (Indianapolis) | 574,775597,169 | |
| Walbridge, OH (Toledo) | 372,880378,869 | |
| Fairburn, GA Intermodal Terminal (Atlanta) | 358,416362,767 | |
| Louisville, KY | 352,029356,740 | |
Chicago, 59th St. Intermodal TerminalIL | 308,421307,588 | |
CSX 20222023 Form 10-K p.13p.16
Network Geography
CSXT’s operations are primarily focused on four major transportation networks and corridors that are defined geographically and by commodity flows below.
Interstate 90 (I-90) Corridor – This CSXT corridor links Chicago and the Midwest to metropolitan areas in New York and New England. This route, also known as the “waterlevel route,” has minimal hills and grades and nearly all of it has two main tracks (referred to as double track). These engineering attributes permit the corridor to support high-speed service across intermodal, automotive and merchandise commodities. This corridor is a primary route for import traffic coming from the far east through western ports moving eastward across the country, through Chicago and into the population centers in the Northeast. The I-90 Corridor is also a critical link between ports in New York, New Jersey, and Pennsylvania and consumption markets in the Midwest. This route carries goods from all three of the Company’s major rail markets – merchandise, intermodal and coal.
Interstate 95 (I-95) Corridor – The CSXT I-95 Corridor connects Charleston, Jacksonville, Miami and many other cities throughout the Southeast with the heavily populated mid-Atlantic and northeastern cities of Baltimore, Philadelphia and New York. CSXT primarily transports food and consumer products, as well as metals and chemicals along this line. It is the leading rail corridor along the eastern seaboard south of the District of Columbia and provides access to major eastern ports.
Southeastern Corridor – This critical part of the network runs between CSXT’s western gateways of Chicago, St. Louis and Memphis through the cities of Nashville, Birmingham, and Atlanta and markets in the Southeast. The Southeastern Corridor is the premier rail route connecting these key cities, gateways, and markets and positions CSXT to efficiently handle projected traffic volumes of intermodal, automotive and general merchandise traffic. The corridor also provides direct rail service between the coal reserves of the southern Illinois basin and the demand for coal in the Southeast.
Coal Network – The CSXT coal network connects the coal mining operations in the Appalachian mountain region and Illinois basin with industrial areas in the Southeast, Northeast and Mid-Atlantic, as well as many river, lake, and deep water port facilities. The domestic coal market has declined significantly over the last decade and export coal remains subject to a high degree of volatility. CSXT’s coal network remains well positioned to supply utility markets in both the Northeast and Southeast and to transport coal shipments for export outside of the U.S. Most of the export coal the Company transports is used for steelmaking, while the majority of domestic coal the Company ships is used for electricity generation.
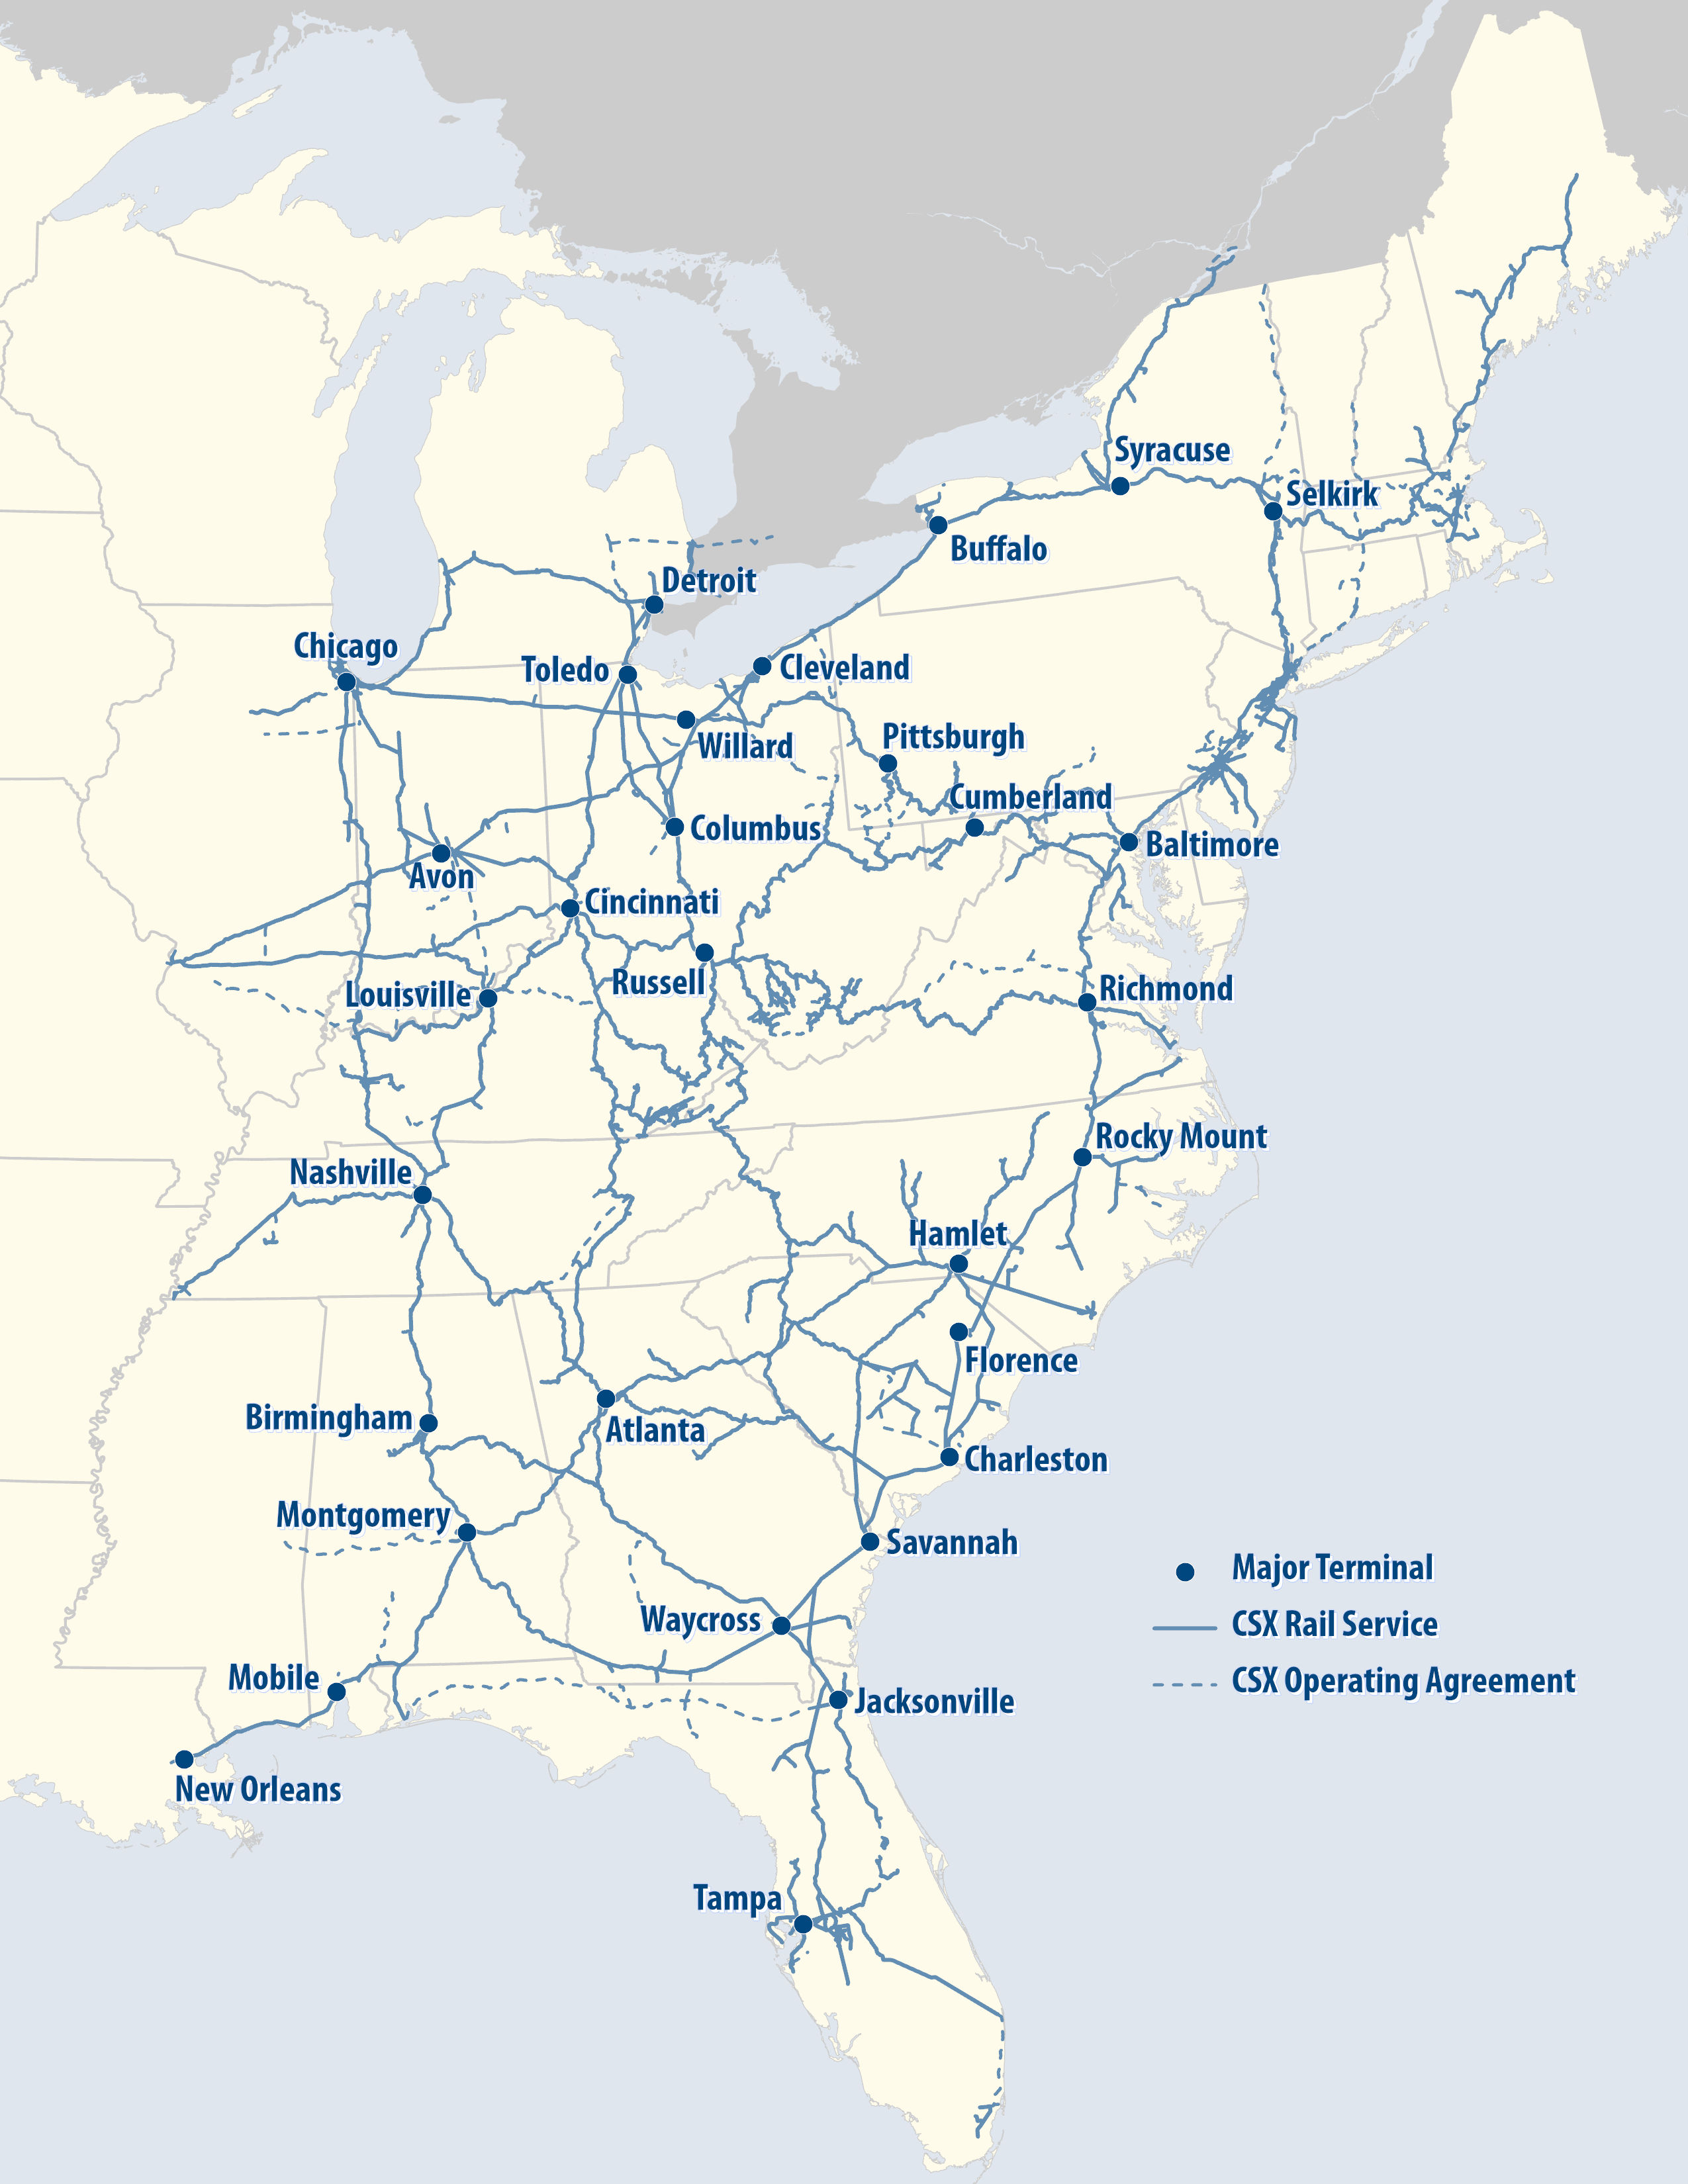
See the following page for a map of the CSX Rail Network. Also included on the map, "CSX Operating Agreement" indicates areas within which CSX can operate through trackage rights beyond the CSX network.
CSX 20222023 Form 10-K p.14p.17
CSX Rail Network
CSX 20222023 Form 10-K p.15p.18
Locomotives
As of December 2022,2023, CSXT owns or long-term leases more than 3,6003,500 locomotives. From time to time, the Company also short-term leases locomotives based on business needs. Freight locomotives are used primarily to pull trains while switching locomotives are used in yards. Auxiliary units are typically used to provide extra traction for heavy trains in hilly terrain. Of owned locomotives, approximately 68% were in active service as of December 31, 2022,2023, and the remainder were in storage to be utilized as needed. Storing locomotives and equipment allows the Company to quickly adjust its active fleet based on demand and other factors while avoiding delays due to supply limitations or excessive lead times to acquire additional equipment. As of December 2022,2023, CSXT’s fleet of owned or long-term leased locomotives consisted of the following types:
| | | | Locomotives | | % | | Average Age (years) | | Locomotives | | % | | Average Age (in Years) |
| Freight | Freight | 3,194 | | | 89 | % | | 23 | |
| Switching | Switching | 237 | | | 6 | % | | 45 | |
| Auxiliary Units | Auxiliary Units | 177 | | | 5 | % | | 29 | |
| Total locomotives | 3,608 | | | 100 | % | | 25 | |
| Total Locomotives | |
Equipment
The Company owns or long-term leases rail equipment, including several types of freight cars and intermodal containers. Of total owned and long-term leased equipment, approximately 91%89% was in active service as of December 31, 2022,2023, and the remainder were in storage to be utilized as needed. As of December 2022,2023, the Company’s owned and long-term leased equipment consisted of the following:
| | Equipment | Equipment | Number of Units | | % | Equipment | Number of Units | | % |
| Gondolas | Gondolas | 18,613 | | | 40 | % | Gondolas | 18,978 | | | 41 | | 41 | % |
| Multi-level Flat Cars | Multi-level Flat Cars | 10,736 | | | 23 | % | Multi-level Flat Cars | 11,095 | | | 24 | | 24 | % |
| Open-top Hoppers | Open-top Hoppers | 6,403 | | | 14 | % | Open-top Hoppers | 6,215 | | | 13 | | 13 | % |
| Covered Hoppers | Covered Hoppers | 6,366 | | | 13 | % | Covered Hoppers | 6,088 | | | 13 | | 13 | % |
| Box Cars | Box Cars | 3,745 | | | 8 | % | Box Cars | 3,059 | | | 7 | | 7 | % |
| Flat Cars | Flat Cars | 565 | | | 1 | % | Flat Cars | 575 | | | 1 | | 1 | % |
| Other Cars | Other Cars | 596 | | | 1 | % | Other Cars | 586 | | | 1 | | 1 | % |
| Subtotal Freight Cars | Subtotal Freight Cars | 47,024 | | | 100 | % | Subtotal Freight Cars | 46,596 | | | 100 | | 100 | % |
| Containers | Containers | 19,405 | | | |
| Total Equipment | Total Equipment | 66,429 | | |
| Total Equipment | |
| Total Equipment | |
At any time, approximately two-thirds of the railcars on the CSXT system are not owned or leased by the Company. Examples of these include railcars owned by other railroads (which are utilized by CSXT), shipper-furnished or private cars (which are generally used only in that shipper’s service), multi-level railcars used to transport automobiles (which are shared between railroads) and double-stack railcars, or well cars (which are industry pooled), that allow for two intermodal containers to be loaded one above the other.
CSX 20222023 Form 10-K p.16p.19
The Company’s revenue-generating equipment, either owned or long-term leased, primarily consists of freight cars and containers as described below.
Gondolas – Support CSXT’s metals markets and provide transport for woodchips and other bulk commodities. Some gondolas are equipped with special hoods for protecting products like coil and sheet steel.
Multi-level flat cars – Transport finished automobiles and are differentiated by the number of levels: bi-levels for large vehicles such as pickup trucks and SUVs and tri-levels for sedans and smaller automobiles.
Covered hoppers – Have a permanent roof and are segregated based upon commodity density. Lighter bulk commodities such as grain, fertilizer, flour, salt, sugar, clay and lime are shipped in large cars called jumbo covered hoppers. Heavier commodities like cement, ground limestone and industrial sand are shipped in small cube covered hoppers.
Open-top hoppers – Transport heavy dry bulk commodities such as coal, coke, stone, sand, ores and gravel that are resistant to weather conditions.
Box cars – Include a variety of tonnages, sizes, door configurations and heights to accommodate a wide range of finished products, including paper, auto parts, appliances and building materials. Insulated box cars deliver food products, canned goods, beer and wine.
Flat cars – Used for shipping intermodal containers and trailers or bulk and finished goods, such as lumber, pipe, plywood, drywall and pulpwood.
Other cars – Primarily leased refrigerator cars and slab steel cars.
Containers – Weather-proof boxes used for bulk shipment of freight, primarily in intermodal service.
Item 3. Legal Proceedings
For further details, please refer to Note 8. Commitments and Contingencies of this annual report on Form 10-K.
Item 4. Mine Safety Disclosure
Not Applicable
CSX 20222023 Form 10-K p.17p.20
Executive Officers of the Registrant
Executive officers of the Company are elected by the CSX Board of Directors and generally hold office until the next annual election of officers. There are no family relationships or any arrangement or understanding between any officer and any other person pursuant to which such officer was elected. As of the date of this filing, the executive officers’ names, ages and business experience are:
| | | | | |
| Name and Age | Business Experience During Past Five Years |
Joseph R. Hinrichs, 5657 President and Chief Executive Officer
| Hinrichs, a leader with more than 30 years of experience in the global automotive, manufacturing, and energy sectors, was named President and Chief Executive Officer in September 2022.
Hinrichs previously worked at Ford Motor Company from 2000 to 2020, most recently serving as President of Ford's global automotive business. In that role, he led the company’s automotive operations, overseeing Ford’s global business units and the Ford and Lincoln brands. He also led Ford’s automotive skill teams, overseeing product development, purchasing, manufacturing, labor affairs, marketing and sales, government affairs, information technology, sustainability, safety and environmental engineering. Other positions he held at Ford include President of Global Operations, President of the Americas, President of Asia Pacific and Africa, Chairman and CEO of Ford China, and Chairman & CEO of Ford Canada.
Over the past four years prior to joining CSX, Hinrichs has also served in multiple advisory and board roles of various companies. |
Sean R. Pelkey, 4344 Executive Vice President and Chief Financial Officer | Pelkey was named Executive Vice President and Chief Financial Officer in January 2022 after serving as Vice President2022. In this role, he guides all of the finance activities for the Company including accounting, financial planning, investor relations, procurement, tax and Acting Chief Financial Officer since June 2021.treasury. Prior to these roles,this role, Pelkey held the role of Vice President Finance & Treasury since 2017. In his current role, he is responsible for all financial aspects of the Company's business including financial and economic analysis, accounting, tax, treasury, real estate and purchasing activities.
Prior to 2017, he has held the positions of AVP Capital Markets and Director Performance Analysis. During his 1718 years with CSX, Mr. Pelkey has held a variety of other roles, including financial planning and technology finance. |
Kevin S. Boone, 4546 Executive Vice President and Chief Sales & MarketingCommercial Officer
| Boone was namedhas served as Executive Vice President and Chief Sales & Marketing Officer in June 2021 after serving as Chief FinancialCommercial Officer since May 2019.June 2021. In his current role, he is responsible for developing and implementing the Company's commercial organization.
strategy and oversees functions including sales, marketing, customer solutions, real estate and industrial development.
Mr. Boone has more than 20 years of experience in finance, accounting, mergers and acquisitions, and transportation performance analysis. He joined CSX in September 2017 as Vice President of Corporate Affairs and Chief Investor Relations Officer and was later named Vice President, Marketing and Strategy leading research and data analysis to advance growth strategies for CSX. In May 2019 he was named Chief Financial Officer. Before joining CSX in 2017, Mr. Boone worked as a Senior Equity Research Analyst at Janus Capital. He also served as a Vice President at Morgan Stanley in equity research and an associate at Merrill Lynch in the mergers and acquisitions group. |
| | | | | |
| Name and Age | Business Experience During Past Five Years |
Jamie J. Boychuk, 45Michael A. Cory, 61
Executive Vice President of Operationsand Chief Operating Officer | Boychuk has served as CSXT'sCory was named Executive Vice President of Operations since October 2019.and Chief Operating Officer in September 2023. In this role, he is responsible for transportation, network operations including terminals, mechanical, engineering and labor relations.
Since joining CSXT in 2017, he has
Mr. Cory is a seasoned railroad executive with approximately 40 years of operations experience, working at the Canadian National Railway Company ("CN") from 1981 to 2019. He served as Executive Vice President and Chief Operating Officer at CN. He also held the positions including Vice President of Network Operations, Senior Vice President of Network Engineering, Mechanical and Intermodal Operations;Operations, Senior Vice President of Scheduled Railroading;the Eastern Region and AssistantSenior Vice President for the Western Region during his time at CN.
After Mr. Cory's retirement from CN in 2019, he continued to provide transportation consulting services as well as serving as the President of Transportation Support. Mr. Boychuk previously worked at CanadianPacific National, Railway, where he served for 20 yearsAustralia's largest private railroad, in various operational roles of increasing responsibility, including sub-region General Manager.
|
2021.
| | | | | |
Name and Age | Business Experience During Past Five Years |
Stephen Fortune, 5354 Executive Vice President and Chief Digital and Technology Officer | Fortune was named CSX's Executive Vice President and Chief Digital and Technology Officer in April 2022. In this role, he is responsible for leading the Company's technology strategy development and all aspects of CSX's information technology systems operations, including cybersecurity.
Prior to joining CSX with nearly 20 years of information technology experience, he spent 30 years at BP, most recently as Chief Information Officer of the global BP group. |
Nathan D. Goldman, 6566 Executive Vice President and Chief Legal Officer | Goldman has served as Executive Vice President and Chief Legal Officer, and Corporate Secretary of CSX since November 2017. In this role, he directs the Company’s legal affairs, government relations, risk management, public safety, environmental, and audit functions.
During his 1920 years with the Company, Mr. Goldman has previously served as Vice President of Risk Compliance and General Counsel and has overseen work in compliance, risk management and safety programs. |
Diana B. Sorfleet, 5859 Executive Vice President and Chief Administrative Officer | Sorfleet was named Executive Vice President and Chief Administrative Officer in July 2018. In this role, her responsibilities include human resources, people systems and analytics, total rewards, facilities and aviation.
During her 1112 years with the Company, Ms. Sorfleet has previously served as Chief Human Resources Officer. Prior to joining CSX, she worked in human resources for 20 years. |
Angela C. Williams, 4849 Vice President and Chief Accounting Officer | Williams has served as Vice President and Chief Accounting Officer of CSX since March 2018. She is responsible for financial and regulatory reporting, freight billing and collections, payroll, accounts payable and various other accounting processes.
During her 1920 years with the Company, she previously served as Assistant Vice President - Assistant Controller and in other various accounting roles. With more than 25 years of experience, Williams held various accounting and auditing positions prior to joining CSX. Ms. Williams is a Certified Public Accountant in the state of Florida. |
CSX 20222023 Form 10-K p.19p.22
Item 5. Market for Registrant’s Common Equity, Related Stockholder Matters and Issuer Purchases of Equity Securities
Market Information
CSX’s common stock is listed on the Nasdaq Global Select Market, which is its principal trading market, and is traded over-the-counter and on exchanges nationwide. The official trading symbol is “CSX.”
Description of Common and Preferred Stock
A total of 5.4 billion shares of common stock are authorized, of which 2,066,350,0501,958,427,685 shares were outstanding as of December 31, 2022.2023. Each share is entitled to one vote in all matters requiring a vote of shareholders. There are no preemptive rights, which are privileges extended to select shareholders that would allow them to purchase additional shares before other members of the general public in the event of an offering. At January 31, 2023,2024, the latest practicable date that is closest to the filing date, there were 22,45321,547 common stock shareholders of record. The weighted average of common shares outstanding, which was used in the calculation of diluted earnings per share, was 2,1412,013 million as of December 31, 2022.2023. (See Note 2, Earnings Per Share.) A total of 25 million shares of preferred stock is authorized, none of which is currently outstanding.
The following table sets forth, for the quarters indicated, the dividends declared on CSX common stock.
| | | | Quarter | | | | Quarter | | |
| | | 1st | | 2nd | | 3rd | | 4th | | Year | | 1st | | 2nd | | 3rd | | 4th | | Year |
| 2023 | |
| 2022 | 2022 | $ | 0.100 | | | $ | 0.100 | | | $ | 0.100 | | | $ | 0.100 | | | $ | 0.400 | |
| 2021 | $ | 0.093 | | | $ | 0.093 | | | $ | 0.093 | | | $ | 0.093 | | | $ | 0.372 | |
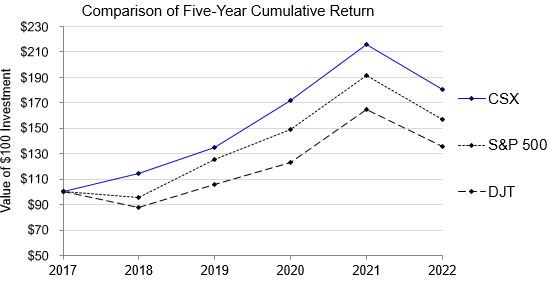
Stock Performance Graph
The cumulative shareholder returns, assuming reinvestment of dividends, on $100 invested at December 31, 20172018 are illustrated on the graph below. The Company references the Standard & Poor's 500 Stock Index (“S&P 500 ®”), and the Dow Jones U.S. Transportation Average Index, which provide comparisons to a broad-based market index and other companies in the transportation industry. This performance graph shall not be deemed "soliciting material" or to be "filed" with the SEC for purposes of Section 18 of the Exchange Act, or otherwise subject to liabilities under that Section, and shall not be deemed to be incorporated by reference into any filing of CSX Corp. under the Securities Act of 1933, as amended, or the Exchange Act.
CSX 20222023 Form 10-K p.20p.24
CSX Purchases of Equity Securities
TheDuring November 2023, the share repurchase program announced in July 2022 was completed and the Company continues to repurchasebegan repurchasing shares under the $5 billion share repurchase program announced in July 2022.approved on October 17, 2023. Total repurchase authority remaining as of December 31, 20222023 was $3.3$4.8 billion. For more information about share repurchases, see Note 2, Earnings Per Share. Share repurchase activity of $1.0 billion$581 million for the fourth quarter 20222023 was as follows:
| | | | | | | | | | | | | | | | | | | | | | | | | | |
| CSX Purchases of Equity Securities for the Quarter |
| Fourth Quarter | Total Number of Shares Purchased | | Average Price Paid per Share | Total Number of Shares Purchased as Part of Publicly Announced Plans or Programs | | Approximate Dollar Value of Shares that May Yet Be Purchased Under the Plans or Programs |
| Beginning Balance | | | | | | | $ | 4,292,997,017 | |
| October 1 - October 31, 2022 | 22,101,430 | | | $ | 27.50 | | 22,101,430 | | | | 3,685,141,410 | |
| November 1 - November 30, 2022 | 6,810,351 | | | | 29.80 | | 6,810,351 | | | | 3,482,205,188 | |
| December 1 - December 31, 2022 | 6,710,050 | | | | 31.33 | | 6,710,050 | | | | 3,271,977,916 | |
| Ending Balance | 35,621,831 | | | $ | 28.66 | | 35,621,831 | | | $ | 3,271,977,916 | |
| | | | | | | | | | | | | | | | | | | | | | | | | | |
| CSX Purchases of Equity Securities for the Quarter |
| Fourth Quarter | Total Number of Shares Purchased | | Average Price Paid per Share | Total Number of Shares Purchased as Part of Publicly Announced Plans or Programs | | Approximate Dollar Value of Shares that May Yet Be Purchased Under the Plans or Programs |
| Beginning Balance | | | | | | | $ | 371,411,668 | |
| October 1 - October 31, 2023 | 10,791,515 | | | $ | 30.53 | | 10,791,515 | | | | 41,950,017 | |
| November 1 - November 30, 2023 | 6,756,749 | | | | 30.66 | | 6,756,749 | | | | 4,834,766,702 | |
| December 1 - December 31, 2023 | 1,326,238 | | | | 33.45 | | 1,326,238 | | | | 4,790,399,073 | |
| Ending Balance | 18,874,502 | | | $ | 30.78 | | 18,874,502 | | | $ | 4,790,399,073 | |
Item 6. Reserved
CSX 20222023 Form 10-K p.21p.25
Item 7. Management's Discussion and Analysis of Financial Condition and Results of Operations
TERMS USED BY CSX
When used in this report, unless otherwise indicated by the context, these terms are used to mean the following:
Car hire - A charge paid by one railroad for its use of cars belonging to another railroad or car owner.
Class I freight railroad - One of the largest line haul freight railroads as determined based on operating revenue; the exact revenue required to be in each class is periodically adjusted for inflation by the Surface Transportation Board. Smaller railroads are classified as Class II or Class III.
Common carrier mandate - A federal mandate that requires U.S. railroads to accommodate reasonable requests from shippers to carry any freight, including hazardous materials.
Demurrage - A charge assessed by railroads for the use of rail cars by shippers or receivers of freight beyond a specified free time.
Department of Transportation ("DOT") - A U.S. government agency with jurisdiction over matters of all modes of transportation.
Depreciation study - Conducted by a third-party specialist and analyzed by management, a periodic statistical analysis of fixed asset service lives, salvage values, accumulated depreciation, and other factors for group assets along with a comparison of similar asset groups at other companies.
Double-stack - Stacking containers two-high on specially equipped cars.
Economic Profit (CSX Cash Earnings or CCE) -A non-GAAP measure designed to incentivize strategic investments earning more than the required return. Economic Profit is calculated as CSX’s gross cash earnings (after-tax adjusted EBITDA) minus the capital charge (long-term average cost of capital) on gross operating assets.
Environmental Protection Agency (“EPA”) - A U.S. government agency that has regulatory authority with respect to environmental law.
Federal Railroad Administration ("FRA") - The branch of the DOT that is responsible for developing and enforcing railroad safety regulations, including safety standards for rail infrastructure and equipment.
Free cash flow - The calculation of a non-GAAP measure by using net cash provided by operating activities and adjusting for property additions and certain other investing activities. Free cash flow is a measure of cash available for paying dividends, share repurchases and principal reduction on outstanding debt.
Group-life depreciation - A type of depreciation in which assets with similar useful lives and characteristics are aggregated into groups. Instead of calculating depreciation for individual assets, depreciation is calculated as a whole for each group.
Incidental charges - Charges for switching, demurrage, storage, etc.
Intermodal - A flexible way of transporting freight over highway, rail and water without being removed from the original transportation equipment, namely a container or trailer.
Mainline - The main track thoroughfare, exclusive of terminals, yards, sidings and turnouts.
Pipeline and Hazardous Materials Safety Administration (“PHMSA”) - An agency within the DOT that, together with the FRA, has broad jurisdiction over railroad operating standards and practices, including hazardous materials requirements.
Positive Train Control ("PTC") - An interoperable train control system designed to prevent train-to-train collisions, over-speed derailments, incursions into established work-zone limits, and train diversions onto another set of tracks.
Revenue adequacy - The achievement of a rate of return on investment over time at least equal to the industry cost of investment capital, as measured by the STB.
Shipper - A customer shipping freight via rail.
Siding - Track adjacent to the mainline used for passing trains.
Staggers Act of 1980 - Congressional law that significantly deregulated the rail industry, replacing the regulatory structure in existence since the 1887 Interstate Commerce Act. Where previously rates were controlled by the Interstate Commerce Commission, the Staggers Act allowed railroads to establish their own rates for shipments, enhancing their ability to compete with other modes of transportation.
Surface Transportation Board ("STB") - An independent governmental adjudicatory body administratively housed within the DOT, responsible for the economic regulation of interstate surface transportation within the United States.
Switching - Putting cars in a specific order, placing cars for loading, retrieving empty cars or adding or removing cars from a train at an intermediate point.
Terminal - A facility, typically owned by a railroad, for the handling of freight and for the breaking up, making up, forwarding and servicing of trains.
Transportation Security Administration (“TSA”) - A component of the Department of Homeland Security with broad authority over railroad operating practices that may have homeland security implications.
TTX Company ("TTX") - A company that provides its owner-railroads with standardized fleets of intermodal, automotive and general use railcars at time and mileage rates. CSX owns about 20 percent of TTX's common stock, and the remainder is owned by the other leading North American railroads and their affiliates.
Turnout - A track that diverts trains from one track to another.
Yard - A system of tracks, other than main tracks and sidings, used for making up trains, storing cars and other purposes.
CSX 20222023 Form 10-K p.23p.27
20222023 HIGHLIGHTS
• Revenue of $14.9$14.7 billion increased $2.3 billiondecreased $196 million or 19%1% versus the prior year.
• Expenses of $8.8$9.1 billion increased $1.9 billion$266 million or 27%3% year over year.
• Operating income of $6.0$5.6 billion increased $429decreased $462 million or 8% year over year.
• Operating ratio of 59.5%62.1% increased 420260 basis points from 55.3%59.5%.
• Earnings per diluted share of $1.95 increased $0.27$1.85 decreased $0.10 or 16%5% year over year.
RESULTS OF OPERATIONS
The following section generally discusses the Company's results of operations and financial condition for the year ended December 31, 2022,2023, compared to the year ended December 31, 2021.2022. A discussion regarding results of operations and financial condition for the year ended December 31, 2021,2022, compared to the year ended December 31, 2020,2021, can be found in Part II, Item 7 of CSX's Annual Report on Form 10-K for the year ended 2021,2022, filed with the Securities and Exchange Commission on February 16, 2022.15, 2023.
20222023 vs. 20212022 Results of Operations
| | | | | | | | | | | | | | | | | | | | | | | | | | |
| | Years Ended | | | | | |
| | 2022 | | 2021 | | $ Change | | % Change | |
| (Dollars in Millions) | | | | | | | | |
| Revenue | $ | 14,853 | | | $ | 12,522 | | | $ | 2,331 | | | 19 | % | |
| Expense | | | | | | | | |
| Labor and Fringe | 2,861 | | | 2,550 | | | (311) | | | (12) | | |
| Purchased Services and Other | 2,685 | | | 2,135 | | | (550) | | | (26) | | |
| Fuel | 1,626 | | | 913 | | | (713) | | | (78) | | |
| Depreciation and Amortization | 1,500 | | | 1,420 | | | (80) | | | (6) | | |
| Equipment and Other Rents | 396 | | | 364 | | | (32) | | | (9) | | |
| Gains on Property Dispositions | (238) | | | (454) | | | (216) | | | (48) | |
| Total Expense | 8,830 | | | 6,928 | | | (1,902) | | | (27) | | |
| Operating Income | 6,023 | | | 5,594 | | | 429 | | | 8 | | |
| Interest Expense | (742) | | | (722) | | | (20) | | | (3) | | |
| Other Income - Net | 133 | | | 79 | | | 54 | | | 68 | | |
| Income Tax Expense | (1,248) | | | (1,170) | | | (78) | | | (7) | | |
| Net Earnings | $ | 4,166 | | | $ | 3,781 | | | $ | 385 | | | 10 | | |
| | | | | | | | |
| Earnings Per Diluted Share | $ | 1.95 | | | $ | 1.68 | | | $ | 0.27 | | | 16 | % | |
| Operating Ratio | 59.5 | % | | 55.3 | % | | | | (420) | | bps |
Appointment of New Chief Executive Officer
On September 15, 2022, CSX announced that, as part of a planned succession process, its Board of Directors appointed Joseph R. Hinrichs as the Company’s new President and Chief Executive Officer and as a member of the Board of Directors, effective September 26, 2022. | | | | | | | | | | | | | | | | | | | | | | | | | | |
| | Years Ended | | | | | |
| | 2023 | | 2022 | | $ Change | | % Change | |
| (Dollars in Millions) | | | | | | | | |
| Revenue | $ | 14,657 | | | $ | 14,853 | | | $ | (196) | | | (1) | % | |
| Expense | | | | | | | | |
| Labor and Fringe | 3,024 | | | 2,861 | | | (163) | | | (6) | | |
| Purchased Services and Other | 2,764 | | | 2,685 | | | (79) | | | (3) | | |
| Depreciation and Amortization | 1,611 | | | 1,500 | | | (111) | | | (7) | | |
| Fuel | 1,377 | | | 1,626 | | | 249 | | | 15 | | |
| Equipment and Other Rents | 354 | | | 396 | | | 42 | | | 11 | | |
| Gains on Property Dispositions | (34) | | | (238) | | | (204) | | | (86) | | |
| Total Expense | 9,096 | | | 8,830 | | | (266) | | | (3) | | |
| Operating Income | 5,561 | | | 6,023 | | | (462) | | | (8) | | |
| Interest Expense | (809) | | | (742) | | | (67) | | | (9) | | |
| Other Income - Net | 139 | | | 133 | | | 6 | | | 5 | | |
| Income Tax Expense | (1,176) | | | (1,248) | | | 72 | | | 6 | | |
| Net Earnings | $ | 3,715 | | | $ | 4,166 | | | $ | (451) | | | (11) | | |
| | | | | | | | |
| Earnings Per Diluted Share | $ | 1.85 | | | $ | 1.95 | | | $ | (0.10) | | | (5) | % | |
| Operating Ratio | 62.1 | % | | 59.5 | % | | | | (260) | | bps |
Acquisition of Pan Am Systems, Inc.
On June 1, 2022, CSX acquired Pan Am for a purchase price of $600 million funded through a combination of common stock valued at $422 million and cash totaling $178 million. Accordingly, the consolidated 2022 results include the results of Pan Am's operations after the acquisition date. For further details, refer to Note 17, Business Combinations.
CSX 20222023 Form 10-K p.24p.28
| Volume and Revenue (Unaudited) | Volume and Revenue (Unaudited) | Volume and Revenue (Unaudited) |
Volume (Thousands of units); Revenue (Dollars in Millions); Revenue Per Unit (Dollars) | | Volume (Thousands of Units); Revenue (Dollars in Millions); Revenue Per Unit (Dollars) | | Volume (Thousands of Units); Revenue (Dollars in Millions); Revenue Per Unit (Dollars) |
| | | Volume | | Revenue | | Revenue Per Unit | | Volume | | Revenue | | Revenue Per Unit |
| | | 2022 | | 2021 | | % Change | | 2022 | | 2021 | | % Change | | 2022 | | 2021 | | % Change | | 2023 | | 2022 | | % Change | | 2023 | | 2022 | | % Change | | 2023 | | 2022 | | % Change |
| | | | | |
| Chemicals | Chemicals | 641 | | | 659 | | | (3) | % | | $ | 2,584 | | | $ | 2,421 | | | 7 | % | | $ | 4,031 | | | $ | 3,674 | | | 10 | % |
| Chemicals | |
| Chemicals | | 642 | | | 641 | | | — | % | | $ | 2,599 | | | $ | 2,584 | | | 1 | % | | $ | 4,048 | | | $ | 4,031 | | | — | % |
| Agricultural and Food Products | Agricultural and Food Products | 481 | | | 467 | | | 3 | % | | 1,664 | | | 1,461 | | | 14 | % | | 3,459 | | | 3,128 | | | 11 | % | Agricultural and Food Products | 468 | | | 481 | | 481 | | | (3) | | (3) | % | | 1,657 | | | 1,664 | | 1,664 | | | — | | — | % | | 3,541 | | | 3,459 | | 3,459 | | | 2 | | 2 | % |
| Automotive | Automotive | 338 | | | 318 | | | 6 | % | | 1,054 | | | 886 | | | 19 | % | | 3,118 | | | 2,786 | | | 12 | % | Automotive | 388 | | | 338 | | 338 | | | 15 | | 15 | % | | 1,219 | | | 1,054 | | 1,054 | | | 16 | | 16 | % | | 3,142 | | | 3,118 | | 3,118 | | | 1 | | 1 | % |
| Minerals | Minerals | 337 | | | 325 | | | 4 | % | | 658 | | | 587 | | | 12 | % | | 1,953 | | | 1,806 | | | 8 | % | Minerals | 358 | | | 337 | | 337 | | | 6 | | 6 | % | | 733 | | | 658 | | 658 | | | 11 | | 11 | % | | 2,047 | | | 1,953 | | 1,953 | | | 5 | | 5 | % |
| Metals and Equipment | | Metals and Equipment | 284 | | | 267 | | | 6 | % | | 917 | | | 828 | | | 11 | % | | 3,229 | | | 3,101 | | | 4 | % |
| Forest Products | Forest Products | 291 | | | 296 | | | (2) | % | | 996 | | | 918 | | | 8 | % | | 3,423 | | | 3,101 | | | 10 | % | Forest Products | 282 | | | 291 | | 291 | | | (3) | | (3) | % | | 1,012 | | | 996 | | 996 | | | 2 | | 2 | % | | 3,589 | | | 3,423 | | 3,423 | | | 5 | | 5 | % |
| Metals and Equipment | 267 | | | 277 | | | (4) | % | | 828 | | | 796 | | | 4 | % | | 3,101 | | | 2,874 | | | 8 | % |
| Fertilizers | Fertilizers | 203 | | | 229 | | | (11) | % | | 455 | | | 470 | | | (3) | % | | 2,241 | | | 2,052 | | | 9 | % | Fertilizers | 199 | | | 203 | | 203 | | | (2) | | (2) | % | | 516 | | | 455 | | 455 | | | 13 | | 13 | % | | 2,593 | | | 2,241 | | 2,241 | | | 16 | | 16 | % |
| Total Merchandise | Total Merchandise | 2,558 | | | 2,571 | | | (1) | % | | 8,239 | | | 7,539 | | | 9 | % | | 3,221 | | | 2,932 | | | 10 | % | Total Merchandise | 2,621 | | | 2,558 | | 2,558 | | | 2 | | 2 | % | | 8,653 | | | 8,239 | | 8,239 | | | 5 | | 5 | % | | 3,301 | | | 3,221 | | 3,221 | | | 2 | | 2 | % |
| Intermodal | Intermodal | 2,963 | | | 2,976 | | | — | % | | 2,306 | | | 2,039 | | | 13 | % | | 778 | | | 685 | | | 14 | % | Intermodal | 2,766 | | | 2,963 | | 2,963 | | | (7) | | (7) | % | | 2,060 | | | 2,306 | | 2,306 | | | (11) | | (11) | % | | 745 | | | 778 | | 778 | | | (4) | | (4) | % |
| Coal | Coal | 697 | | | 706 | | | (1) | % | | 2,434 | | | 1,790 | | | 36 | % | | 3,492 | | | 2,535 | | | 38 | % | Coal | 755 | | | 697 | | 697 | | | 8 | | 8 | % | | 2,484 | | | 2,434 | | 2,434 | | | 2 | | 2 | % | | 3,290 | | | 3,492 | | 3,492 | | | (6) | | (6) | % |
Trucking (a) | — | | | — | | | — | % | | 966 | | | 410 | | | 136 | % | | — | | | — | | | — | % |
| Trucking | | Trucking | — | | | — | | | — | % | | 882 | | | 966 | | | (9) | % | | — | | | — | | | — | % |
| Other | Other | — | | | — | | | — | % | | 908 | | | 744 | | | 22 | % | | — | | | — | | | — | % | Other | — | | | — | | — | | | — | | — | % | | 578 | | | 908 | | 908 | | | (36) | | (36) | % | | — | | | — | | — | | | — | | — | % |
| Total | Total | 6,218 | | | 6,253 | | | (1) | % | | $ | 14,853 | | | $ | 12,522 | | | 19 | % | | $ | 2,389 | | | $ | 2,003 | | | 19 | % | Total | 6,142 | | | 6,218 | | 6,218 | | | (1) | | (1) | % | | $ | 14,657 | | | $ | | $ | 14,853 | | | (1) | | (1) | % | | $ | 2,386 | | | $ | | $ | 2,389 | | | — | | — | % |
(a) Effective third quarter 2021, Trucking revenue is comprised of revenue from the operations of Quality Carriers, which was acquired by CSX effective July 1, 2021.
CSX 20222023 Form 10-K p.25p.29
Revenue
Total revenue increaseddecreased by $2.3 billion$196 million in 2022,2023, or 19%1%, when compared to the previous year primarily due to higherdecreases in other revenue, lower fuel recovery, pricing gains that includedeclines in export coal due to the benefitimpact of higher export coallower benchmark rates and the inclusion of Quality Carriers’ results.declines in intermodal volume. These declines were partially offset by pricing and volume gains in merchandise and higher coal volumes.
Merchandise Volume
Chemicals - Decreased due toIncreased shipments of export plastics, waste, and sand were offset by lower shipments of crude oil and other energy-related commodities as well as waste.materials used in making plastics.
Agricultural and Food Products – Increased as a result of higherDecreased primarily due to lower shipments of ethanol sweeteners and vegetable oils, andexport grain.
Automotive - Increased due to higher North American vehicle production as semiconductor availability has improved.well as new business wins.
Minerals - Increased due to higher shipments of aggregates and cement driven by increased road construction demand.and other infrastructure-related activities.
Metals and Equipment - Increased due to higher steel and scrap shipments, as well as stronger equipment shipments.
Forest Products – Decreased primarily due to lower shipments of pulpboard, paper, and building products.
Metals and Equipment - Decreased primarily due to lower steel shipments,lumber, partially offset by higher scrap shipments and equipment moves.of other building products.
Fertilizers - Decreased due to declines in short-haul shipments, which were partially offset by increases in long-haul potash and long-haul phosphate shipments.
Intermodal Volume
Lower domestic shipmentsvolume was due to continued supply-side constraints, more subdued seasonal demand thandecreased international shipments driven by high inventory levels and lower imports. Domestic shipments increased due to growth with key customers as well as the prior year and a softening truck market were mostly offset by increased international shipments.impact of supply-side constraints.
Coal Volume
Export coal increased due to higher shipments of metallurgical and thermal coal. Domestic coal decreased due to lower shipments of coal to northern utility coal, including the impacts of limited coal availability during mine disruptions during the year, as well as lower steel and industrial shipments. Export coal decreased due to lower shipments of thermal coal, partially driven by reduced capacity at Curtis Bay coal pier due to an outage at a portion of the facility. The facility is now back at full capacity.plants.
Trucking Revenue
Trucking revenue increased $556decreased $84 million versus the prior year due to the inclusion of Quality Carriers’ resultslower fuel and higher fuel surcharge.capacity surcharges.
Other Revenue
Other revenue was $164$330 million higher than prior year driven by increases in revenue forlower, primarily resulting from lower intermodal storage and equipment usage, increases in demurrage and higher affiliate revenue.usage.
CSX 20222023 Form 10-K p.26p.30
Expense
In 2022,2023, total expenses increased $1.9 billion,$266 million, or 27%3%, compared to prior year. Descriptions of each expense category as well as significant year-over-year changes are described below.
Labor and Fringe expenses include employee wages and related payroll taxes, health and welfare costs, pension, other post-retirement benefits and incentive compensation. These expenses increased $311$163 million due to the following items:
•The impactsAn increase of agreements reached with labor unions as well as inflation totaled $199 million. Of the total, $32$144 million relates to labor and benefits in prior years.was driven by inflation.
•The inclusionAn increase of Quality Carriers' operations for$89 million was due to the full year in 2022 versus a portionimpacts of the year in 2021 resulted in increased costs of $74 million.higher headcount and union employee vacation and sick benefits.
•Incentive compensation costs decreased $29$34 million primarily due to lower expected payouts as well as the impactimpacts of accelerated expense for eligible employees in the prior year.
•Prior year amounts included $32 million of out-of-period labor and benefit costs due to the agreement reached with labor unions.
•Other costs increased $67decreased by $4 million primarily due to hiring and retention costs, the inclusion of Pan Am's operations and other non-significant items.
Purchased Services and Other expenses consist primarily of contracted services to maintain infrastructure and equipment, terminal and pier services, purchased trucking and other transportation, and professional services. This category also includes costs related to materials, travel, casualty claims, environmental remediation, train accidents, property and sales tax, utilities and other items. Total purchased services and other expenses increased $550$79 million driven by the following:
•The inclusionAn increase of Quality Carriers' operations for the full year in 2022 versus a portion of the year in 2021 drove $280$101 million of additional costs.
•Higherwas due to higher operating support costs, which were primarily due to inflation and higher repair and maintenance costs. These increases were partially offset by lower volume and reduced congestion in intermodal terminal costs and an increased active locomotive fleet, drove an increase of $182 million.operations.
•AdjustmentsA decrease of $54 million was due to environmental reserves resultedinsurance recoveries in $21 million higher expense.the current year.
•All other costs increased $67$32 million primarily due to severalas higher technology spending, inflation and other increases were partially offset by lower trucking expenses and other non-significant items including Pan Am's operations and acquisition-related costs.
Fuel expense includes locomotive diesel fuel as well as non-locomotive fuel. This expense is largely driven by the market price and locomotive consumption of diesel fuel. Fuel expense increased $713 million primarily due to a 66% price increase in locomotive fuel prices and the inclusion of non-locomotive fuel used for trucking.items.
Depreciation expense primarily relates to recognizing the costs of capital assets, such as locomotives, railcars and track structure, over their respective useful lives, which are reviewed periodically as part of depreciation studies. This expense is impacted primarily by the capital expenditures made each year. Depreciation expense increased $80$111 million primarily due to a larger net asset base, which includes Quality Carriers' assets, as well as the impacts of a 2022 equipment depreciation study.study as well as a larger net asset base.
Fuel expense includes locomotive diesel fuel as well as non-locomotive fuel. This expense is largely driven by the market price and locomotive consumption of diesel fuel. Fuel expense decreased $249 million primarily due to a 19% decrease in locomotive fuel prices, partially offset by higher fuel consumption.
Equipment and Other Rents expense includes rent paid for freight cars owned by other railroads or private companies, net of rents received by CSXT for use of its equipment. This category of expenses also includes expenses for short-term and long-term leases of locomotives, railcars, containers, tractors and trailers, offices and other rentals. These expenses increased $32decreased $42 million primarily due to increasedlower car hire costs as well as the addition of Quality Carriers' costs. Car hire costs increased due to higher days per load and inflation,from improved car cycle times, partially offset by lowercosts related to higher automotive volume.
Gains on Property Dispositions decreased to $34 million in 2023 from $238 million in 2022 from $454 million in 2021 primarily due to lowerthe inclusion of $144 million of gains in 2022 from the sale of property rights to the Commonwealth of Virginia. Related to this transaction, CSX recognized gains of $144 million in 2022 and $349 million in 2021.
CSX 20222023 Form 10-K p.27p.31
Interest Expense
Interest Expense includes interest on long-term debt and related fair value hedges, equipment obligations and finance leases. Interest expense increased $20$67 million primarily as a result of higher average debt balances partially offset by increased capitalized interest.and higher effective interest rates.
Other Income - Net
Other Income - Net includes investment gains, losses, and interest income, as well as components of net periodic pension and post-retirement benefit cost and other non-operating activities. Other income increased $54$6 million primarily due to higher interest income drivenand other non-significant items, partially offset by increased rates, and an increasea decrease in net pension benefit credits during 2022.credits.
Income Tax Expense
Income Tax Expense increased $78decreased $72 million primarily due to higherlower earnings before income taxes, partially offset by favorable adjustments to deferred state taxes andprior year favorable state legislative changes.
Net Earnings and Earnings per Diluted Share
Net Earnings increased $385decreased $451 million to $4.2$3.7 billion, and earnings per diluted share increased $0.27decreased $0.10 to $1.95,$1.85, due to the factors mentioned above. Average shares outstanding was lower as a result of share repurchase activity during the year and had a favorable impact on earnings per diluted share.
CSX 20222023 Form 10-K p.28p.32
NON-GAAP MEASURES (Unaudited)
CSX reports its financial results in accordance with United States generally accepted accounting principles ("GAAP"). CSX also uses certain non-GAAP measures that fall within the meaning of Securities and Exchange Commission Regulation G and Regulation S-K Item 10(e), which may provide users of the financial information with additional meaningful comparison to prior reported results. Non-GAAP measures do not have standardized definitions and are not defined by GAAP. Therefore, CSX’s non-GAAP measures are unlikely to be comparable to similar measures presented by other companies. The presentation of these non-GAAP measures should not be considered in isolation from, as a substitute for, or as superior to the financial information presented in accordance with GAAP. Reconciliations of non-GAAP measures to corresponding GAAP measures are below.
Economic Profit
Management believes Economic Profit (CSX Cash Earnings or CCE) provides additional perspective to investors about financial returns generated by the business by representing a profit generated over and above the cost of capital used by the business to generate that profit. Economic Profit is designed to incentivize strategic investments that earn more than the required return. Increases in Economic Profit indicate that the Company is effectively allocating capital and rewarding shareholders by generating growth in excess of the incremental cost of capital associated with reinvestment in the business. This measure should be considered in addition to, rather than a substitute for, net income. This measure is defined by the Company as gross cash earnings minus the capital charge on gross operating assets. Gross cash earnings is calculated as Adjusted Earnings before Interest, Taxes, Depreciation and Amortization ("Adjusted EBITDA"), less an assumed 15% cash tax. The capital charge uses a long-term average cost of capital of 8% multiplied by the gross operating assets. CSX's gross operating assets include gross properties and other non-cash assets, net of non-interest bearing liabilities.
The following table reconciles net income (GAAP measure) to Economic Profit (non-GAAP measure).
| | | | | | | | |
| Years Ended |
| (Dollars in Millions) | 2023 | 2022 |
| Net Income | $ | 3,715 | | $ | 4,166 | |
| Add: Income Tax Expense | 1,176 | | 1,248 | |
| Remove: Other Income - Net | (139) | | (133) | |
| Add: Interest Expense | 809 | | 742 | |
| Add: Depreciation, Amortization, and Operating Lease Expense | 1,720 | | 1,609 | |
Remove: Unusual Items (a) | — | | (144) | |
| Adjusted EBITDA | 7,281 | | 7,488 | |
| 15% Assumed Cash Tax | (1,092) | | (1,123) | |
| Gross Cash Earnings | 6,189 | | 6,365 | |
| | |
| Current Assets (Less Cash and Short-term Investments) | (1,908) | | (1,843) | |
| Gross Properties | (49,212) | | (47,471) | |
| Other Assets | (3,896) | | (3,862) | |
| Non-Interest Bearing Liabilities | 10,873 | | 10,640 | |
Gross Operating Assets (b) | (44,143) | | (42,536) | |
| 8% Capital Charge | (3,531) | | (3,403) | |
| Economic Profit (Non-GAAP) | $ | 2,658 | | $ | 2,962 | |
(a) Unusual items are defined by management as unique events with greater than $100 million full year operating income impact, consistent with the terms of the Company's long-term incentive plan agreements. Gains from the Virginia transaction of $144 million were excluded for 2022.
(b) Gross operating assets reflects an average of reported balance sheet figures.
Free Cash Flow
Management believes that free cash flow is useful to investors as it is important in evaluating the Company’s financial performance. More specifically, free cash flow measures cash generated by the business after reinvestment. This measure represents cash available for both equity and bond investors to be used for dividends, share repurchases or principal reduction on outstanding debt. Free cash flow is calculated by using net cash from operations and adjusting for property additions and proceeds from property dispositions. This measure should be considered in addition to, rather than a substitute for, cash provided by operating activities. Free cash flow before dividends decreased $101$412 million year-over-year to $3.7$3.3 billion primarily due to higher property additions and lower proceeds and advances from property dispositions, mostly attributable to the sale of property rights to the Commonwealth of Virginia. These decreasesVirginia in the prior year, as well as higher property additions and less cash from operating activities. Cash from operating activities includes lower cash-generating net earnings and the impact of $168 million of higher payments for retroactive wages and bonuses, and associated taxes, related to finalized labor agreements as well as the offsetting impact of $381 million of postponed federal estimated tax payments, which were partially offsetextended until first quarter 2024 under an Internal Revenue Service tax relief announcement for those impacted by higher net cash provided by operating activities.Hurricane Idalia.
The following table reconciles cash provided by operating activities (GAAP measure) to free cash flow (non-GAAP measure).
| | | |
| | | | Years Ended | Years Ended |
| | | 2022 | | 2021 | | |
(Dollars in Millions) | | (Dollars in Millions) | |
| (Dollars in Millions) | |
| Net Cash Provided by Operating Activities | Net Cash Provided by Operating Activities | $ | 5,619 | | | $ | 5,099 | | | |
| Property Additions | Property Additions | (2,133) | | | (1,791) | | | |
| Property Additions | |
| Property Additions | |
| Proceeds and Advances from Property Dispositions | Proceeds and Advances from Property Dispositions | 246 | | | 529 | | | |
Other Investing Activities (a) | n/a | | (4) | | | |
| Proceeds and Advances from Property Dispositions | |
| Proceeds and Advances from Property Dispositions | |
| Free Cash Flow, before Dividends (Non-GAAP) | |
| Free Cash Flow, before Dividends (Non-GAAP) | |
| Free Cash Flow, before Dividends (Non-GAAP) | Free Cash Flow, before Dividends (Non-GAAP) | $ | 3,732 | | | $ | 3,833 | | | |
|
(a) Effective first quarter 2022, the results of other investing activities are no longer included in free cash flow. Prior year has not been restated as the change is immaterial.
CSX 20222023 Form 10-K p.29p.34
OPERATING STATISTICS (Estimated)
Certain operating statistics are estimated and can continue to be updated as actuals settle. The methodology for calculating train velocity, dwell, cars online and trip plan performance differs from that used by the Surface Transportation Board. The Company will continue to report these metrics to the Surface Transportation Board using the prescribed methodology.
| | | | | | | | | | | | | | | | | |
| Fiscal Years |
| 2022 | | 2021 | | Improvement/ (Deterioration) |
| Operations Performance | | | | | |
Train Velocity (Miles per hour)(a) | 16.1 | | | 17.9 | | | (10) | % |
Dwell (Hours)(a) | 11.3 | | | 10.7 | | | (6) | % |
Cars Online(a) | 138,074 | | | 131,564 | | | (5) | % |
On-Time Originations(a) | 60 | % | | 75 | % | | (20) | % |
On-Time Arrivals(a) | 52 | % | | 66 | % | | (21) | % |
Carload Trip Plan Performance(a) | 64 | % | | 69 | % | | (7) | % |
Intermodal Trip Plan Performance(a) | 90 | % | | 87 | % | | 3 | % |
| Fuel Efficiency | 0.99 | | | 0.96 | | | (3) | % |
| | | | | |
Revenue Ton-Miles (Billions) | | | | | |
| Merchandise | 126.0 | | | 126.3 | | | — | % |
| Coal | 33.8 | | | 35.4 | | | (5) | % |
| Intermodal | 30.0 | | | 31.5 | | | (5) | % |
| Total Revenue Ton-Miles | 189.8 | | | 193.2 | | | (2) | % |
| | | | | |
Total Gross Ton-Miles (Billions) | 375.5 | | | 376.0 | | | — | % |
| | | | | |
| Safety | | | | | |
FRA Personal Injury Frequency Index(a) | 0.96 | | | 0.96 | | | — | % |
FRA Train Accident Rate(a) | 3.18 | | | 3.22 | | | 1 | % |
| | | | | | | | | | | | | | | | | |
| Fiscal Years |
| 2023 | | 2022 | | Improvement/ (Deterioration) |
Operations Performance (a) | | | | | |
Train Velocity (Miles per hour) | 18.0 | | | 16.1 | | | 12 | % |
Dwell (Hours) | 9.4 | | | 11.3 | | | 17 | % |
| Cars Online | 125,580 | | | 138,074 | | | 9 | % |
| On-Time Originations | 77 | % | | 60 | % | | 28 | % |
| On-Time Arrivals | 71 | % | | 52 | % | | 37 | % |
| Carload Trip Plan Performance | 84 | % | | 64 | % | | 31 | % |
| Intermodal Trip Plan Performance | 95 | % | | 90 | % | | 6 | % |
| Fuel Efficiency | 1.02 | | | 0.99 | | | (3) | % |
| | | | | |
Revenue Ton-Miles (Billions) | | | | | |
| Merchandise | 128.0 | | | 126.0 | | | 2 | % |
| Coal | 37.4 | | | 33.8 | | | 11 | % |
| Intermodal | 28.3 | | | 30.0 | | | (6) | % |
| Total Revenue Ton-Miles | 193.7 | | | 189.8 | | | 2 | % |
| | | | | |
Total Gross Ton-Miles (Billions) | 381.3 | | | 375.5 | | | 2 | % |
| | | | | |
Safety (b) | | | | | |
| FRA Personal Injury Frequency Index | 0.89 | | | 1.01 | | | 12 | % |
| FRA Train Accident Rate | 3.32 | | | 3.37 | | | 1 | % |
(a) TheseBeginning second quarter 2023, all operations performance metrics include results from the network acquired from Pan Am. The impact of including Pan Am data was insignificant.
(b) Safety metrics do not include results from the network acquired from Pan Am. These metrics will be updated to include the Pan Am network results as data becomes available.integration completes.
Key Performance Measures Definitions:
Train Velocity - Average train speed between origin and destination in miles per hour (does not include locals, yard jobs, work trains or passenger trains). Train velocity measures the profiled scheduleactual train miles and times of trains (from departure to arrival and all interim time), anda train profiles are periodically updated to align with a changing operation.movement on CSX's network.
Dwell - Average amount of time in hours between car arrival to and departure from the yard.
Cars Online - Average number of active freight rail cars on lines operated by CSX, excluding rail cars that are being repaired, in storage, those that have been sold, or private cars dwelling at a customer location more than one day.
On-Time OriginationsOriginations - Percent of scheduled road trains that depart the origin yard on-time or ahead of schedule.
On-Time Arrivals - Percent of scheduled road trains that arrive at the destination yard on-time to within two hours of scheduled arrival.
Carload Trip Plan Performance - Percent of measured cars (excludes unit trains and other non-scheduled service as well as empty automotive shipments) destined for a customer that arrivecomplete their scheduled plan at or ahead of the original estimated time of arrival notification or interchange (as applicable).
Intermodal Trip Plan Performance - Percent of measured containers (excludes port shipments along with empty containers and other non-scheduled service) destined for a customer that arrivecomplete their scheduled plan at or ahead of the original estimated time of arrival, notification or interchange (as applicable)applicable).
Fuel Efficiency - Gallons of locomotive fuel per 1,000 gross ton-miles.
Revenue Ton-Miles (RTM's) - The movement of one revenue-producing ton of freight over a distance of one mile.
Gross Ton-Miles (GTM's) - The movement of one ton of train weight over one mile. GTM's are calculated by multiplying total train weight by distance the train moved. Total train weight is comprised of the weight of the freight cars and their contents.
FRA Personal Injury Frequency Index - Number of FRA-reportable injuries per 200,000 man-hours.
FRA Train Accident Rate - Number of FRA-reportable train accidents per million train-miles.
CSX 20222023 Form 10-K p.30p.35
The Company is committed to continuous improvement in safety and service performance through training, innovation and investment. Training and safety programs are designed to prevent incidents that can adversely impact employees, customers and communities. Technological innovations that can detect and avoid many types of human factor incidents are designed to serve as an additional layer of protection for the Company's employees. Continued capital investment in the Company's assets, including track, bridges, signals, equipment and detection technology also supports safety performance.
The Company remains focused on safety, service, and controlling costs. Train velocity declined 10%Velocity and dwell improved 12% and 17%, respectively, relative to 2021. Dwell increased by 6% and cars online increased 5% in 2022. ComparedCarload trip plan performance improved to 2021,84% compared to 64% while intermodal trip plan performance improved 3%to 95% compared to 90%, while carload trip plan performance decreased 7%.relative to 2022. CSX has seen an improvement in service metrics in the last quarter of 2022 and expects that trend to continue inthroughout 2023.
From a safety perspective, the FRA personal injury index was flat compared to prior year whileimproved by 12% and the train-accident rate improved by 1%. compared to prior year. Safety remainsis a top priorityguiding principle at CSX and the Company remains focused on its strong safety culture, including instilling the importance of safety in new hires. CSX is committed to reducing risk and enhancing the overall safety of its employees, customers and communities in which the Company operates.
LIQUIDITY AND CAPITAL RESOURCES
Liquidity is a company’s ability to generate adequate amounts of cash to meet both current and future needs for obligations as they mature and to provide for planned capital expenditures, including those to address regulatory and legislative requirements. To have a complete picture of a company’s liquidity, its sources and uses of cash, balance sheet and external factors should be reviewed.
Significant Cash Flows
The following charts highlight the operating, investing and financing components of the change in cash and cash equivalents for operating, investing and financing activities for full years 20222023 and 2021.2022.
In 2022,2023, the Company generated $5.6$5.5 billion of cash from operating activities, which was $520$70 million moreless than prior year primarily driven by lower cash-generating net earnings and $168 million higher cash-generating income,payments for retroactive wages and bonuses, including the associated taxes, related to finalized labor agreements. This decrease was partially offset by less favorable working capital activities.the impact of $381 million of postponed federal estimated tax payments mentioned above. Net cash used in investing activities was $2.1$2.3 billion, an increase in net spend of $254$156 million from the prior year primarily as a result ofdue to lower proceeds from property dispositions and higher property additions, and lower proceeds and advances from property dispositions, partially offset by decreased costs for business acquisitions.acquisition spending. Cash used in financing activities was $3.8$3.9 billion, which represents a decreasean increase in net spend of $343$98 million from the prior year mostly driven byprimarily due to lower proceeds from the issuance of long-term debt, as well as lower repayments of debt, partially offset by higherlower share repurchases.
CSX 20222023 Form 10-K p.31p.36
Sources of Cash and Liquidity
The Company has multiple sources of liquidity, including cash generated from operations and financing sources. The Company filed a shelf registration statement with the SEC on February 16, 2022, which may be used to issue debt or equity securities at CSX’s discretion, subject to market conditions and CSX Board authorization. While CSX seeks to give itself flexibility with respect to cash requirements, there can be no assurance that market conditions would permit CSX to sell such securities on acceptable terms at any given time, or at all. In 2022,2023, CSX issued $2.0 billion$600 million of long-term debt. See Note 10, Debt and Credit Agreements for more information.
CSX has access to a $1.2 billion five-year unsecured revolving credit facility backed by a diverse syndicate of banks that expires in March 2024.February 2028. As of December 31, 2022,2023, the Company had no outstanding balances under this facility. The Company also has a commercial paper program, backed by the revolving credit facility, under which the Company may issue unsecured commercial paper notes up to a maximum aggregate principal amount of $1.0 billion outstanding at any one time. As of December 31, 2022,2023, the Company had no outstanding debt under the commercial paper program.
Uses of Cash
CSX uses current cash balances for general corporate purposes, which may include capital expenditures, working capital requirements, reduction or refinancing of outstanding indebtedness, redemptions and repurchases of CSX common stock, dividends to shareholders, acquisitions and other business opportunities, and contributions to the Company's qualified pension plan.
In 2022,2023, CSX continued to invest in its business to create long-term value for shareholders. The Company is committed to maintaining and improving its existing infrastructure and to positioning itself for long-term, profitable growth through optimizing network and terminal capacity. Funds used for property additions are further described below.
| | | |
| | | | Years Ended | Years Ended |
Capital Expenditures (Dollars in Millions) | Capital Expenditures (Dollars in Millions) | 2022 | | 2021 | | |
| Track | Track | $ | 1,000 | | | $ | 876 | | | |
| Track | |
| Track | |
| Bridges, Signals and Other | |
| Bridges, Signals and Other | |
| Bridges, Signals and Other | Bridges, Signals and Other | 673 | | | 567 | | | |
| Total Infrastructure | Total Infrastructure | 1,673 | | | 1,443 | | | |
| Total Infrastructure | |
| Total Infrastructure | |
| Strategic Projects and Commercial Facilities | Strategic Projects and Commercial Facilities | 251 | | | 194 | | | |
| Strategic Projects and Commercial Facilities | |
| Strategic Projects and Commercial Facilities | |
| Freight Cars | |
| Freight Cars | |
| Freight Cars | |
| Locomotives | Locomotives | 104 | | | 89 | | | |
| Freight Cars | 75 | | | 29 | | | |
| Locomotives | |
| Locomotives | |
| Regulatory (including PTC) | |
| Regulatory (including PTC) | |
| Regulatory (including PTC) | Regulatory (including PTC) | 30 | | | 36 | | | |
| Total Capital Expenditures | Total Capital Expenditures | $ | 2,133 | | | 1,791 | | | |
| Total Capital Expenditures | |
| Total Capital Expenditures | |
Planned capital investments for 20232024 are expected to be approximately $2.3$2.5 billion. Of the 2023 investment, approximately 75% is expected to be usedSpending to sustain the core infrastructure with a focus on safety and operating equipment. The remaining amountsreliability will be useda top priority. In addition, management is committed to investments that promote profitable growth, including projects supporting service enhancements and productivity initiatives.initiatives, including investments in locomotives and freight cars. CSX intends to fund capital investments primarily through cash generated from operations.
CSX is continually evaluating market and regulatory conditions that could affect the Company’s ability to generate sufficient returns on capital investments. CSX may revise its future estimates for capital spending as a result of changes in business conditions, tax legislation or the enactment of new laws or regulations, which could have a material adverse effect on the Company’s operations and financial performance in the future (see Risk Factors under Item 1A of this Form 10-K).
CSX 20222023 Form 10-K p.32p.37
CSX is committed to returning cash to shareholders. Capital structure, capital investments and cash distributions, including dividends and share repurchases, are reviewed at least annually by the Board of Directors. On February 14, 2023,2024, the Company's Board of Directors authorized a 10%9% increase in the quarterly cash dividend to $0.11$0.12 per common share effective March 2023.2024. Management's assessment of market conditions and other factors guides the timing and volume of repurchases. Future share repurchases are expected to be funded by cash on hand, cash generated from operations and debt issuances.
Material Changes in the Consolidated Balance Sheets and Working Capital
CSX's balance sheet reflects its strong capital base and the impact of CSX's balanced approach in deploying capital for the benefit of its shareholders, which includes investments in infrastructure, dividend payments and share repurchases. Further, CSX is well positioned from a liquidity standpoint. The Company ended the year with $2.1$1.4 billion of cash, cash equivalents and short-term investments.
Total assets as well as total liabilities and shareholders' equity increased $1.4 billion$496 million from prior year end. The increase in total assets was primarily due to a $1.2 billion$693 million increase in net properties consistent with planned capital expenditures, a $113 million increase in net pension assets for qualified pension plans, a $105 million increase in materials and supplies and a $193$105 million increase in investments in affiliates and other companies,companies. These increases were partially offset by a reduction$605 million decrease in cash of $281 million. The increase in net properties was primarily attributable to capital expenditures as well as fixed assets acquired as part of the Pan Am transaction. In addition, the increase in investments in affiliates and other companies includes the impact of the acquired interest in Pan Am Southern, LLC as well as higher values of several affiliates. See Note 17, Business Combinations, for more details on purchase accounting.noted above.
Total liabilities increased $2.3 billion$988 million from prior year end primarily due to the issuance of $2.0 billion$600 million in long-term debt, a $414 million increase in income and other taxes payable largely related to postponed federal estimated tax payments, a $186$177 million increase in deferred income taxes due to accelerated tax depreciation and the impact of the Pan Am acquisition.a $107 million increase in accounts payable. These increases were partially offset by payouts of accrued retroactive wages and bonuses totaling $238 million and debt repayments of $186$153 million. Total shareholders' equity decreased $875$492 million from prior year end primarily driven by share repurchases of $4.7$3.5 billion and dividends paid of $852$882 million, partially offset by net earnings of $4.2 billion and $422 million of common stock issued to acquire Pan Am.$3.7 billion.
Working capital is considered a measure of a company’s ability to meet its short-term needs. CSX had a working capital surplus of $160 million at December 2023 and $1.4 billion at December 2022 and $1.6 billion at December 2021, a2022. This decrease of $262 million. Current assets decreased$1.2 billion since year end is primarily driven by the net declinedue to cash paid for share repurchases of $3.5 billion, property additions of $2.3 billion and dividend payments of $882 million, as well as a $558 million of long-term debt maturing in cash of $281 million described above,2024. These decreases were partially offset by the $165cash earned from operations of $5.5 billion and $600 million increase in accounts receivable. Current liabilities increased primarily due to the $167 million increase in accounts payable.
CSX 20222023 Form 10-K p.33p.38
The Company’s working capital balance varies due to factors such as the timing of scheduled debt payments and changes in cash and cash equivalent balances. Although the Company currently has a surplus, a working capital deficit is not unusual for CSX or other companies in the industry and does not indicate a lack of liquidity. The Company continues to maintain adequate current assets to satisfy current liabilities and maturing obligations when they come due. Furthermore, CSX has sufficient financial capacity, including its revolving credit facility, commercial paper program and shelf registration statement to manage its day-to-day cash requirements and any anticipated obligations. The Company from time to time accesses the credit markets for additional liquidity.
Completed Transactions
Acquisition of Pan Am Systems, Inc.
On June 1, 2022, CSX completed its acquisition of Pan Am. The closing price of $600 million was funded through a combination of common stock valued at $422 million and cash totaling $178 million, subject to certain customary purchase price adjustments.million. Total cash consideration paid to acquire the business includes a $30 million deposit paid in fourth quarter 2020. For further details, refer to Note 17, Business Combinations.
Acquisition of Quality Carriers, Inc.
On July 1, 2021, CSX acquired Quality Carriers, Inc. for a purchase price of $544 million in cash. This transaction was funded by cash on hand. For further details, refer to Note 17, Business Combinations.Combinations.
Sale of Property Rights to the Commonwealth of Virginia
On March 26, 2021, the Company entered into a comprehensive agreement to sell certain property rights in three CSX-owned line segments to the Commonwealth of Virginia (“Commonwealth”) over three phases for aphases. Over the course of the transaction, which was completed in 2022, total proceeds of $525 million. Asmillion were collected and total gains of December 31, 2022, all three phases are closed. Gains$493 million were recognized. This includes $125 million of proceeds collected and proceeds$144 million of gains recognized in 2022 and 2021 related to this transaction are summarized in the following table.2022. For further details, refer to Note 6, Properties.
| | | | | | | | | | | |
| | Years Ended |
| (Dollars in millions) | | 2022 | 2021 |
| Gains | | $ | 144 | | $ | 349 | |
| Proceeds | | 125 | | 400 | |
CSX 20222023 Form 10-K p.34p.39
Credit Ratings
Credit ratings reflect an independent agency’s judgment on the likelihood that a borrower will repay a debt obligation at maturity. The ratings reflect many considerations, such as the nature of the borrower’s industry and its competitive position, the size of the company, its liquidity and access to capital and the sensitivity of a company’s cash flows to changes in the economy. The two largest rating agencies, Standard & Poor’s Ratings Services (“S&P”) and Moody’s Investors Service (“Moody’s”), use alphanumeric codes to designate their ratings. The highest quality rating for long-term credit obligations is AAA and Aaa for S&P and Moody’s, respectively. A credit rating is not a recommendation to buy, sell or hold securities and may be subject to revision or withdrawal at any time by the assigning rating agency.
The cost and availability of unsecured financing are materially affected by CSX's long-term credit ratings. CSX's credit ratings remained stableimproved during 2022. As2023 following an upgrade by Moody's from a long-term rating Baa1 (Stable) as of December 2022 to A3 (Stable) as of December 2023. S&P's long-term rating for CSX remains consistent at BBB+ (Stable) for both December 2022 and December 2021, S&P's long-term rating on CSX was BBB+ (Stable), and Moody's was Baa1 (Stable).2023. Ratings of BBB- and Baa3 or better by S&P and Moody’s, respectively, reflect ratings on debt obligations that fall within a band of credit quality considered to be investment grade. If CSX's credit ratings were to decline to below investment-grade levels, the Company could experience significant increases in its interest cost for new debt. In addition, a decline in CSX’s credit ratings to below investment grade levels could adversely affect the market’s demand, and thus the Company’s ability to readily issue new debt. The Company is committed to maintaining an investment-grade credit profile.
Guaranteed Notes Issued By CSXT
In 2007, CSXT, a wholly-owned subsidiary of CSX Corporation, issued in a registered public offering $381 million of secured equipment notes maturing in 2023. CSX Corporation has fully and unconditionally guaranteed the notes. At CSXT’s option, CSXT may redeem any or all of the notes, in whole or in part, at any time, at the redemption price including premium. In the case of loss or destruction of any item of equipment securing the notes, if CSXT does not substitute another item of equipment for the item suffering such loss or destruction, CSXT will be required to redeem the notes in part at par. The guarantee of the notes will rank equally in right of payment with all existing and future senior obligations of CSX Corporation and will be effectively subordinated to all future secured indebtedness of CSX Corporation to the extent of the assets securing such indebtedness. The guarantee is subject to release in limited circumstances only upon the occurrence of certain customary conditions. As of December 31, 2022, the principal balance of these secured equipment notes was $139 million.
In accordance with SEC rules, including amendments adopted in 2020, CSX is not required to present separate condensed consolidating financial information for wholly-owned subsidiaries who issued or guaranteed notes. Additionally, presentation of combined summary financial information regarding subsidiary issuers and guarantors is not required because the assets, liabilities and results of operations of the combined issuers and guarantors of the notes are not materially different from the corresponding amounts presented in the consolidated financial statements.
CSX 20222023 Form 10-K p.35p.40
CONTRACTUAL OBLIGATIONS, OTHER COMMITMENTS AND OFF-BALANCE SHEET ARRANGEMENTS
Contractual Obligations
CSX is party to contractual arrangements that obligate the Company to make future cash payments. These obligations impact the Company’s liquidity and capital resource needs. The Company’s contractual obligations primarily consist of long-term debt and related interest payments, purchase commitments, leases, other-post employment benefits and agreements with Conrail.
•As of December 31, 2022,2023, the Company had outstanding fixed-rate notes with varying maturities. See Note 10, Debt and Credit Agreements, for additional information related to future debt payments. Future interest payments associated with outstanding debt total $14.8$14.3 billion, with $771$804 million payable in 2023.2024.
•Purchase commitments consist ofof CSX’s long-term locomotive maintenance program and other commitments to purchase technology, communications, railcar maintenance and other services. See Note 8, Commitments and Contingencies, for additional information about future payments related to purchase commitments.
•Capital expenditures include investments related to public-private partnerships. These partnership investments are typically for projects thatthat are partially or wholly reimbursed to CSX through government awards or other funding sources. Project contribution commitments that are not reimbursable total $80$55 million as of December 31, 2022.2023.
•The Company’s leases include property, equipment, and line leases. See Note 7, Leases, for additional information about future payments related to leases.
•Other post-employment benefits include estimated other post-retirement medical and life insurance payments and payments under non-qualified pension plans that are unfunded. See Note 9, Employee Benefit Plans, for additional information about future payments under such plans.
•Conrail owns rail infrastructure and operates for the joint benefit of CSX and NS.Norfolk Southern Corporation ("NS"). This is known as the shared asset area. Conrail charges fees for right-of-way usage, equipment rentals and transportation, switching and terminal service charges in the shared asset area. See Note 15, Investment in Affiliates and Related-Party Transactions, for additional information about future payments related to agreements with Conrail.
Other Commitments and Off-Balance Sheet Arrangements
Other commitments total $178$187 million and primarily consist of guarantees, letters of credit and surety bonds, none of which are individually significant. These off-balance sheet arrangements are not reasonably likely to have a material effect on the Company's financial condition, results of operations or liquidity.
LABOR AGREEMENTS
Approximately 17,10017,700 of the Company's approximately 22,50023,000 employees are members of a rail labor union. As of December 2, 2022, all 12 rail unions at CSX that participated in national bargaining were covered by national agreements with the Class I railroads and CSX-specific agreements that will remain in effect through December 31, 2024. Collective agreements under the Railway Labor Act do not expire, but continue until amended, and formal notices to amend these agreements may be served as early as November 1, 2024.
CSX 20222023 Form 10-K p.36p.41
CRITICAL ACCOUNTING ESTIMATES
The preparation of financial statements in conformity with accounting principles generally accepted in the United States requires that management make estimates in reporting the amounts of certain assets and liabilities, the disclosure of contingent assets and liabilities at the date of the financial statements and certain revenues and expenses during the reporting period. Actual results may differ from those estimates. These estimates and assumptions are discussed with the Audit Committee of the Board of Directors on a regular basis. Significant estimates using management judgment are made for the following areas:
•personal injury and environmental reserves;
•pension plan accounting; and
•depreciation policies for assets under the group-life method; and
•goodwill and other intangible assets.method
Personal Injury and Environmental Reserves
Personal Injury
Personal Injury reserves of $128 million and $126 million for 2023 and $118 million for 2022, and 2021, respectively, represent liabilities for employee work-related and third-party injuries. CSXT retains an independent actuary to assist management in assessing the value of personal injury claims. The methodology used by the actuary includes a development factor to reflect growth or reduction in the value of these personal injury claims. It is based largely on CSXT's historical claims and settlement experience. Actual results may vary from estimates due to the number, type and severity of the injury, costs of medical treatments and uncertainties in litigation. For additional details, including a description of our related accounting policies, see Note 5, Casualty, Environmental and Other Reserves, in the consolidated financial statements.
Environmental
Environmental reserves were $154 million and $161 million and $108 million for 20222023 and 2021,2022, respectively. The Company is a party to various proceedings related to environmental issues, including administrative and judicial proceedings involving private parties and regulatory agencies. The Company has been identified as a potentially responsible party at approximately 240230 environmentally impaired sites. The Company reviews its potential liability with respect to each site identified, giving consideration to a number of factors such as:
•type of clean-up required;
•nature of the Company’s alleged connection to the location (e.g., generator of waste sent to the site or owner or operator of the site);
•extent of the Company’s alleged connection (e.g., volume of waste sent to the location and other relevant factors); and
•number, connection and financial viability of other named and unnamed potentially responsible parties at the location.
Critical Accounting Estimates, continued
Conditions that are currently unknown could, at any given location, result in additional exposure, the amount and materiality of which cannot presently be reasonably estimated. For additional details, including a description of our related accounting policies, see Note 5, Casualty, Environmental and Other Reserves, in the consolidated financial statements.
Critical Accounting Estimates, continued
Pension Plan Accounting
The Company sponsors defined benefit pension plans principally for salaried, management personnel. For employees hired prior to 2003, the plans provide eligible employees with retirement benefits based predominantly on years of service and compensation rates near retirement. For employees hired between 2003 and 2019, benefits are determined based on a cash balance formula, which provides benefits by utilizing interest and pay credits based upon age, service and compensation. Beginning in 2020, the CSX Pension Plan was closed to new participants. As of December 2022,2023, the projected benefit obligation for the Company’s pension plans was $2.4$2.3 billion. For information related to the funded status of the Company's pension plans, see Note 9, Employee Benefit Plans.
The accounting for these plans is subject to the guidance provided in the Compensation-Retirement Benefits Topic in the ASC.Accounting Standards Codification ("ASC"). This rule requires that management make certain assumptions relating to the following:
•discount rates used to measure future obligations and interest expense;
•long-term rate of return on plan assets; and
•other assumptions.
The Company engages independent actuaries to compute the amounts of liabilities and expenses relating to these plans subject to the assumptions that the Company determines are appropriate based on historical trends, current market rates and future projections. These amounts are reviewed by management.
Critical Accounting Estimates, continued
Discount Rates
Discount rates affect the amount of liability recorded and the service and interest cost components of pension expense. Discount rates reflect the rates at which pension benefits could be effectively settled, or in other words, how much it would cost the Company to buy enough high quality bonds to generate cash flow equal to the Company's expected future benefit payments. The Company determines the discount rate based on the market yield as of year-end for high quality corporate bonds whose maturities match the plans' expected benefit payments.
The Company measures the service and interest cost components of the net pension benefits expense by using individual spot rates matched with separate cash flows for each future year. Under the spot rate approach, individual spot discount rates along the same high quality corporate bonds yield curve used to measure the pension benefit liabilities are applied to the relevant projected cash flows at the relevant maturity.
The weighted average discount rate used by the Company to value its pension obligations was 5.02%4.82% and 2.78%5.02% as of December 2022,2023, and December 2021,2022, respectively. As of December 2022,2023, the estimated duration of pension benefits is approximately 109 years.
Each year, the discount rate is reevaluated and adjusted using the current market interest rates for high quality corporate bonds to reflect the best estimate of the current effective settlement rates. In general, if interest rates decline or rise, the assumed discount rate will change.
Critical Accounting Estimates, continued
Long-term Rate of Return on Plan Assets
The expected long-term average rate of return on plan assets reflects the average rate of earnings expected on the funds invested, or to be invested, to provide for benefits included in the projected benefit obligation. In estimating that rate, the Company gives appropriate consideration to the returns being earned by the plan assets in the funds and the rates of return expected to be available for reinvestment as well as the current and projected asset mix of the funds. Management, with the assistance of an outsourced investment manager, balances market expectations obtained from various investment managers with both market and actual plan historical returns to develop a reasonable estimate of the expected long-term rate of return on assets. As this assumption is long term, the annual review may result in less frequent adjustment than other assumptions used in pension accounting. The long-term rate of return on plan assets used by the Company to value its benefit cost for the subsequent plan year was 6.75% in both 20222023 and 2021.2022.
Other Assumptions
The calculations made by the actuaries also include assumptions relating to mortality rates, turnover, retirement age and salary inflation rates. These assumptions are based upon historical data, recent plan experience and industry trends and are determined by management.
Critical Accounting Estimates, continued
20232024 Estimated Pension Expense
Net periodic pension benefit expense for 20232024 is expected to be a credit of $1$22 million. Net periodic pension benefit expense for 20232024 is expected to include service cost expense of $24$23 million. Service cost expense is included in labor and fringe on the consolidated income statement and all other components of net pension expense are included in other income - net. Net periodic pension expense in 20222023 was a credit of $41$1 million. The net decreaseincrease in the expected credit is primarily due to impacts from recent unfavorablefavorable pension asset experience, partially offset by the increase in discount rates.experience.
The following sensitivity analysis illustrates the effects of a 1% change in certain assumptions on the 20232024 estimated pension expense:
| | | | | | | | |
| (Dollars in Millions) | | Pension Expense |
| Discount Rate | | $ | 1612 | |
| Long-term Rate of Return | | $ | 2425 | |
Critical Accounting Estimates, continued
Depreciation Policies for Assets Utilizing the Group-Life Method
The depreciable assets of the Company are depreciated using either the group-life or straight-line method of accounting, which are both acceptable depreciation methods in accordance with GAAP. The Company depreciates its railroad assets, including main-line track, locomotives and freight cars, using the group-life method of accounting. Assets depreciated under the group-life method comprise 84% of total fixed assets of $48.1$50.3 billion on a gross basis at December 31, 2022.2023. The remaining depreciable assets of the Company, including non-railroad assets and assets under finance leases, are depreciated using the straight-line method on a per asset basis. Land is not depreciated.
Management performs a review of depreciation expense and useful lives on a regular basis. Under the group-life method, the service lives and salvage values for each group of assets are determined by completing periodic depreciation studies and applying management’s methods to determine the service lives of its properties. There are several factors taken into account during the depreciation study and they include:
•statistical analysis of historical life and salvage data for each group of property;
•statistical analysis of historical retirements for each group of property;
•evaluation of current operations;
•evaluation of technological advances and maintenance schedules;
•previous assessment of the condition of the assets;
•management's outlook on the future use of certain asset groups;
•expected net salvage to be received upon retirement; and
•comparison of assets to the same asset groups with other companies.
Critical Accounting Estimates, continued
The STB requires depreciation studies be performed every three years for equipment assets (e.g., locomotives and freight cars) and every six years for road and track assets (e.g., bridges, signals, rail, ties, and ballast). The Company completed a depreciation study for its road and track assets in 2020 and for equipment assets in 2022, both of which resulted in changes to accumulated depreciation, service lives, salvage values, and other related factors for certain assets. The 2022 equipment study resulted in an expected increase in annual depreciation expense of approximately $80 million primarily due to deferred losses on assets depreciated using the group-life method. Recent experience withA depreciation studies has resultedstudy was not performed in changes to accumulated depreciation and depreciation rates that did not materially affect the Company's depreciation expense of $1.4 billion in both 2021 and 2020.2023.
A 1% change in the average estimated useful life of all group-life assets would result in an approximate $12$13 million change to the Company’s annual depreciation expense. There were no significant changes to the company'sCompany's asset lives as a result of the 2022 and 2020 studies. For additional details, including a more detailed description of our related accounting policies, see Note 6, Properties, in the consolidated financial statements.
Goodwill and Intangible Assets
As of December 2022, the Company had $502 million of Goodwill and Other Intangibles - Net. In applying the acquisition method of accounting for business combinations, management must determine the fair value of assets acquired and liabilities assumed in order to properly allocate purchase price consideration between depreciable and amortizable assets and goodwill. The fair values assigned to tangible and intangible assets acquired and liabilities assumed are based on management’s estimates and assumptions, as well as other information compiled by management, including valuations that utilize customary valuation procedures and techniques. Estimates and assumptions include, but are not limited to, the cash flows that an asset is expected to generate in the future and the appropriate weighted-average cost of capital.
CSX evaluates goodwill and intangible assets for impairment on an annual basis, or sooner if indicators of impairment exist. In performing the qualitative impairment assessment, CSX considers relevant events and conditions, including but not limited to: macroeconomic trends, industry and market conditions, overall financial performance, company-specific events, and legal and regulatory factors. If the qualitative assessments indicate that it is more likely than not that the fair value of the reporting unit or intangible assets are less than their carrying amounts, the Company would perform a quantitative impairment test. If the carrying amount of the reporting unit's goodwill or intangible asset exceeded the fair value under the quantitative test, an impairment loss would be recorded. Measurement of the fair value of a reporting unit could be based on one or more of the following fair value measures: amounts at which the unit as a whole could be bought or sold in a current transaction between willing parties, present value techniques of estimated future cash flows, valuation techniques based on multiples of earnings or revenue, or a similar performance measure.
New Accounting Pronouncements and Changes in Accounting Policy
See Note 1, Nature of Operations and Significant Accounting Policies under the caption “New Accounting Pronouncements and Changes in Accounting Policy.Pronouncements.”
CSX 20222023 Form 10-K p.41p.45
FORWARD-LOOKING STATEMENTS
Certain statements in this report and in other materials filed with the Securities and Exchange Commission, as well as information included in oral statements or other written statements made by the Company, are forward-looking statements. The Company intends for all such forward-looking statements to be covered by the safe harbor provisions for forward-looking statements within the meaning of the Private Securities Litigation Reform Act of 1995 and the provisions of Section 27A of the Securities Act of 1933 and Section 21E of the Securities Exchange Act of 1934. These forward-looking statements within the meaning of the Private Securities Litigation Reform Act may contain, among others, statements regarding:
•projections and estimates of earnings, revenues, margins, volumes, rates, cost-savings, expenses, taxes or other financial items;
•expectations as to results of operations and operational initiatives;
•expectations as to the effect of claims, lawsuits, environmental costs, commitments, contingent liabilities, labor negotiations or agreements on the Company's financial condition, results of operations or liquidity;
•management's plans, strategies and objectives for future operations, capital expenditures, workforce levels, dividends, share repurchases, safety and service performance, proposed new services and other matters that are not historical facts, and management's expectations as to future performance and operations and the time by which objectives will be achieved; and
•future economic, industry or market conditions or performance and their effect on the Company's financial condition, results of operations or liquidity.
Forward-looking statements are typically identified by words or phrases such as "will," "should," “believe,” “expect,” “anticipate,” “project,” “estimate,” “preliminary” and similar expressions. The Company cautions against placing undue reliance on forward-looking statements, which reflect its good faith beliefs with respect to future events and are based on information currently available to it as of the date the forward-looking statement is made. Forward-looking statements should not be read as a guarantee of future performance or results and will not necessarily be accurate indications of the timing when, or by which, such performance or results will be achieved.
Forward-looking statements are subject to a number of risks and uncertainties and actual performance or results could differ materially from those anticipated by any forward-looking statements. The Company undertakes no obligation to update or revise any forward-looking statement. If the Company does update any forward-looking statement, no inference should be drawn that the Company will make additional updates with respect to that statement or any other forward-looking statements.
The following important factors, in addition to those discussed in Part II, Item 1A. Risk Factors and elsewhere in this report, may cause actual results to differ materially from those contemplated by any forward-looking statements:
•legislative, regulatory or legal developments involving transportation, including rail or intermodal transportation, the environment, hazardous materials, taxation, international trade and initiatives to further regulate the rail industry;
•the outcome of litigation, claims and other contingent liabilities, including, but not limited to, those related to fuel surcharge, environmental matters, taxes, shipper and rate claims subject to adjudication, personal injuries and occupational illnesses;
•changes in domestic or international economic, political or business conditions, including those affecting the transportation industry (such as the impact of industry competition, conditions, performance and consolidation, as well as the impact of international trade agreements and tariffs) and the level of demand for products carried by CSXT;
CSX 20222023 Form 10-K p.42p.46
•natural events such as severe weather conditions, including floods, fire, hurricanes and earthquakes, a pandemic crisis affecting the health of the Company's employees, its shippers or the consumers of goods, or other unforeseen disruptions of the Company's operations, systems, property, equipment or supply chain;
•competition from other modes of freight transportation, such as trucking, and competition and consolidation or financial distress within the transportation industry generally;
•the cost of compliance with laws and regulations that differ from expectations as well as costs, penalties and operational and liquidity impacts associated with noncompliance with applicable laws or regulations;
•the impact of increased passenger activities in capacity-constrained areas, including potential effects of high speed rail initiatives, or regulatory changes affecting when CSXT can transport freight or service routes;
•unanticipated conditions in the financial markets that may affect timely access to capital markets and the cost of capital, as well as management's decisions regarding share repurchases;
•changes in fuel prices, surcharges for fuel and the availability of fuel;
•the impact of natural gas prices on coal-fired electricity generation;
•the impact of global supply and price of seaborne coal on CSX's export coal market;
•availability of insurance coverage at commercially reasonable rates or insufficient insurance coverage to cover claims or damages;
•the inherent business risks associated with safety and security, including the transportation of hazardous materials or a cybersecurity attack which would threaten the availability and vulnerabilityreliability of information technology;
•adverse economic or operational effects from actual or threatened war or terrorist activities and any governmental response;
•loss of key personnel or the inability to hire and retain qualified employees;
•labor and benefit costs and labor difficulties, including stoppages affecting either the Company's operations or customers' ability to deliver goods to the Company for shipment;
•the Company's success in implementing its strategic, financial and operational initiatives, including acquisitions;
•the impact of conditions in the real estate market on the Company's ability to sell assets;
•changes in operating conditions and costs, including the impacts of inflation, or commodity concentrations;
•the impacts of a public health crisis and any policies or initiatives instituted in response; and
•the inherent uncertainty associated with projecting economic and business conditions.
Other important assumptions and factors that could cause actual results to differ materially from those in the forward-looking statements are specified elsewhere in this report and in CSX's other SEC reports, which are accessible on the SEC's website at www.sec.gov and the Company's website at www.csx.com. The information on the CSX website is not part of this annual report on Form 10-K.
CSX 20222023 Form 10-K p.43p.47
Item 7A. Quantitative and Qualitative Disclosures about Market Risk
Changes in interest rates may impact the cost of future long-term debt issued by the Company, and as a result, represent interest rate risk to the Company. In an effort to manage this risk, CSX may use certain financial instruments such as interest rate forward contracts. The following information, together with information included in Note 10, Debt and Credit Agreements, and Note 13, Fair Value Measurements, describes the key aspects of such contracts and the related market risk to CSX.
Changes in interest rates could impact the fair value of the Company's forward starting interest rate swap.swaps. In 2020, the Company executed two forward starting interest rate swaps with a notional value of $250 million for an aggregate notional value of $500 million. These swaps were effected to hedge the benchmark interest rate associated with future interest payments related to the anticipated refinancing of notes due in 2027. The Company recognized an unrealized gain of $80 million and $8 million net of tax during the years ended December 31, 2022 and 2021, respectively, in the consolidated statements of comprehensive income with the related asset on the balance sheet as of December 31, 2022. In fourth quarter 2022, CSX settled a portion equal to $160 million notional value of the aggregate $500 million cash flow hedges, which resulted inhedges. In 2023, CSX receiving a cash payment of $52 million. The gain associated with the settled portionexecuted two partial settlements equal to $226 million notional value of the hedges will continue to be classified in accumulated other comprehensive income (“AOCI”) until the associated debt instrument is issued in the future. Upon final settlement of the swaps, which expire in 2027, the unrealized gain or loss in AOCI will be recognized in earnings as an adjustment to interest expense over the same period during which the hedged transaction affects earnings.cash flow hedges. As of December 31, 2022,2023, these cash flow hedges had an aggregate notional value of $114 million and an asset value of $48 million. As of December 31, 2023, the potential change in fair value of forward starting interest rate swaps resulting from a hypothetical 10% change in interest rates would not be material.
Changes in interest rates could impact the fair value of the Company's fixed-to-floating interest rate swaps. In 2023, CSX entered into two separate fixed-to-floating interest rate swaps classified as fair value hedges. The swaps are designed to hedge 10 years of interest rate risk associated with market fluctuations attributable to the Secured Overnight Financing Rate ("SOFR") on a cumulative $250 million of fixed rate outstanding notes which are due in 2033. As of December 31, 2023, the cumulative fair value of these swaps was a $19 million asset. In 2022, CSX entered into five separate fixed-to-floating interest rate swaps classified as fair value hedges. The swaps are designed to hedge 10 years of interest rate risk associated with market fluctuations attributable to the Secured Overnight Financing RateSOFR on a cumulative $800 million of fixed rate outstanding notes, which are due between 2036 and 2040. As of December 31, 2022,2023, the cumulative fair value of these swaps was a $118$107 million liability, which is included in other long-term liabilities on the consolidated balance sheet. The associated cumulative adjustment to the hedged notes is included in long-term debt. Gains and losses resulting from changes in fair value of the interest rate swaps offset changes in the fair value of the hedged portion of the underlying debt with no gain or loss recognized due to hedge ineffectiveness. The difference in the net fixed-to-float interest settlement on the derivatives is recognized in interest expense and was not material for the year ending at December 31, 2022. The swaps will expire in 2032. If settled early, the remaining liability or asset will be amortized over the remaining life of the associated notes.liability. As of December 31, 2022,2023, the potential change in fair value of fixed-to-floating interest rate swaps resulting from a hypothetical 10% change in interest rates would not be material.
As of December 31, 2022,2023, CSX has no floating rate notes outstanding. However, changes in interest rates could impact the fair value (but not the carrying value) of the Company's fixed rate long-term debt. The potential decrease in fair value of the Company's fixed rate long-term debt resulting from a hypothetical 10% increase in U.S. Treasury rates, or approximately 40 basis points, is estimated to be $730 million as of December 31, 2023, and $709 million as of December 31, 2022, and $448 million as of December 31, 2021.2022. The underlying fair values of the Company's long-term debt were estimated based on quoted market prices or on the current rates offered for debt with similar terms and maturities.
CSX 20222023 Form 10-K p.44p.48
CSX CORPORATION
PART II
Item 8. Financial Statements and Supplementary Data
| | | | | | | | |
| INDEX TO CONSOLIDATED FINANCIAL STATEMENTS |
| | | |
| | | Page |
| Report of Independent Registered Public Accounting Firm (PCAOB ID: 42) | |
| | | |
| CSX Corporation | |
| | | |
| Consolidated Financial Statements and Notes to Consolidated Financial Statements | |
| | Herewith: | |
| | | |
| Consolidated Income Statements for the Years Ended: | |
| | December 31, 2023 | |
| December 31, 2022 | |
| | December 31, 2021 | |
| | December 31, 2020 |
| | |
| Consolidated Comprehensive Income Statements for the Years Ended: | |
| December 31, 2023 | |
| December 31, 2022 | |
| December 31, 2021 | |
| December 31, 2020 | |
| | | |
| Consolidated Balance Sheets as of: | |
| | December 31, 20222023 | |
| | December 31, 20212022 | |
| | | |
| Consolidated Cash Flow Statements for Years Ended: | |
| | December 31, 2023 | |
| December 31, 2022 | |
| | December 31, 2021 | |
| December 31, 2020 | |
| | | |
| Consolidated Statements of Changes in Shareholders' Equity: | |
| | December 31, 2023 | |
| December 31, 2022 | |
| | December 31, 2021 | |
| December 31, 2020 | |
| | | |
| Notes to Consolidated Financial Statements | |
CSX 20222023 Form 10-K p.45p.49
CSX CORPORATION
PART II
Item 8. Financial Statements and Supplementary Data
REPORT OF INDEPENDENT REGISTERED PUBLIC ACCOUNTING FIRM
To the Shareholders and the Board of Directors of CSX Corporation
Opinion on the Financial Statements
We have audited the accompanying consolidated balance sheets of CSX Corporation (the Company) as of December 31, 20222023 and 2021,2022, the related consolidated statements of income, comprehensive income, cash flows, and changes in shareholders’ equity and cash flows for each of the three years in the period ended December 31, 2022,2023 and the related notes (collectively referred to as the “consolidated financial statements”). In our opinion, the consolidated financial statements present fairly, in all material respects, the financial position of the Company at December 31, 20222023 and 2021,2022, and the results of its operations and its cash flows for each of the three years in the period ended December 31, 2022,2023, in conformity with U.S. generally accepted accounting principles.
We also have audited, in accordance with the standards of the Public Company Accounting Oversight Board (United States) (PCAOB), the Company’s internal control over financial reporting as of December 31, 2022,2023, based on criteria established in Internal Control-Integrated Framework issued by the Committee of Sponsoring Organizations of the Treadway Commission (2013 framework), and our report dated February 15, 202314, 2024 expressed an unqualified opinion thereon.
Basis for Opinion
These financial statements are the responsibility of the Company's management. Our responsibility is to express an opinion on the Company’s financial statements based on our audits. We are a public accounting firm registered with the PCAOB and are required to be independent with respect to the Company in accordance with the U.S. federal securities laws and the applicable rules and regulations of the Securities and Exchange Commission and the PCAOB.
We conducted our audits in accordance with the standards of the PCAOB. Those standards require that we plan and perform the audit to obtain reasonable assurance about whether the financial statements are free of material misstatement, whether due to error or fraud. Our audits included performing procedures to assess the risks of material misstatement of the financial statements, whether due to error or fraud, and performing procedures that respond to those risks. Such procedures included examining, on a test basis, evidence regarding the amounts and disclosures in the financial statements. Our audits also included evaluating the accounting principles used and significant estimates made by management, as well as evaluating the overall presentation of the financial statements. We believe that our audits provide a reasonable basis for our opinion.
Critical Audit Matter
The critical audit matter communicated below is a matter arising from the current period audit of the financial statements that was communicated or required to be communicated to the audit committee and that: (1) relates to accounts or disclosures that are material to the financial statements and (2) involved our especially challenging, subjective or complex judgments. The communication of the critical audit matter does not alter in any way our opinion on the consolidated financial statements, taken as a whole, and we are not, by communicating the critical audit matter below, providing a separate opinion on the critical audit matter or on the accounts or disclosure to which it relates.
CSX 20222023 Form 10-K p.46p.50
CSX CORPORATION
PART II
Item 8. Financial Statements and Supplementary Data
REPORT OF INDEPENDENT REGISTERED PUBLIC ACCOUNTING FIRM, continued
| | | | | | | | | | | |
| Depreciation Policies for Assets Utilizing the Group-Life Method | |
| Description of the Matter | As of December 31, 2022,2023, assets depreciated under the group-life method comprised 84% of total gross fixed assets of $48.1$50.3 billion. As discussed in Note 6 of the consolidated financial statements, the group-life method aggregates assets with similar lives and characteristics into groups and depreciates each of these groups as a whole. When using the group-life method, an underlying assumption is that each group of assets, as a whole, is used and depreciated to the end of the group’s recoverable life. The Company utilizes different depreciable asset categories to account for depreciation expense for the railroad assets that are depreciated under the group-life method.
Under the group-life method, depreciation studies are conducted by a third-party specialist and analyzed by the Company’s management to review asset service lives, salvage values, accumulated depreciation and other factors related to group assets. Depreciation studies are performed every three years for equipment assets and every six years for road and track assets. In years when depreciation studies are not performed, annual data reviews are conducted by a third-party specialist and analyzed by the Company’s management to review the asset service lives. A depreciation study was performed in 2022 for equipment assets. For road and track assets and equipment assets, the most recent depreciation study wasstudies were performed in 2020 and was2022, respectively. These studies were evaluated by the Company’s management in the current year through an annual data review.
Auditing depreciation expense for assets subject to the group-life method was complex and required the involvement of specialists due to the nature of the methods used in the depreciation studies to determine the useful service lives and salvage values of the Company’s assets. These methods have a significant effect on depreciation expense.
|
| How We Addressed the Matter in Our Audit | We obtained an understanding, evaluated the design and tested the operating effectiveness of controls over the Company’s process related to the assessment of periodic depreciation studies and annual data reviews of its group-life assets. For example, we tested controls over management’s review of the depreciation study for equipment assets and review of depreciation expense and estimated useful lives. We also tested controls over management’s annual data review of asset activity and assumptions that could impact the estimated useful lives determined in the most recent depreciation studystudies of equipment and road and track assets.
To test the estimated useful lives and salvage values of the Company’s group-life assets, we performed audit procedures that included, among others: obtaining the periodic depreciation studies and annual data reviews performed by the Company’s third-party specialist and reviewed by management; assessing the completeness and accuracy of the data provided by management to the third-party specialist; and including a specialist on our team to evaluate the methods used by the third-party specialist and reviewed by management in determining the estimated useful lives and salvage values of assets resulting from the depreciation studies andif any changes were necessary to the estimated useful lives and salvage values if any, resulting from the annual data reviews.
We compared the methodsassumptions used by management to those used throughout the industry and within other depreciation studies. We assessed the historical accuracy of management’s estimates via retrospective review and independently calculatedrecalculated the current year depreciation rates.
|
We have served as the Company’s auditor since 1981.
/s/ Ernst & Young LLP
Jacksonville, Florida
February 15, 202314, 2024
CSX 20222023 Form 10-K p.47p.51
CSX CORPORATION
PART II
Item 8. Financial Statements and Supplementary Data
CONSOLIDATED INCOME STATEMENTS
(Dollars in Millions, Except Per Share Amounts)
| | | | Years Ended | | Years Ended |
| | | 2022 | | 2021 | | 2020 | | 2023 | | 2022 | | 2021 |
| Revenue | Revenue | $ | 14,853 | | | $ | 12,522 | | | $ | 10,583 | |
| Expense | Expense | |
| Labor and Fringe | Labor and Fringe | 2,861 | | | 2,550 | | | 2,275 | |
| Labor and Fringe | |
| Labor and Fringe | |
| Purchased Services and Other | Purchased Services and Other | 2,685 | | | 2,135 | | | 1,719 | |
| Depreciation and Amortization | |
| Fuel | Fuel | 1,626 | | | 913 | | | 541 | |
| Depreciation and Amortization | 1,500 | | | 1,420 | | | 1,383 | |
| Equipment and Other Rents | Equipment and Other Rents | 396 | | | 364 | | | 338 | |
| Gains on Property Dispositions | Gains on Property Dispositions | (238) | | | (454) | | | (35) | |
| | Total Expense | Total Expense | 8,830 | | | 6,928 | | | 6,221 | |
| Total Expense | |
| Total Expense | |
| | Operating Income | |
| Operating Income | |
| Operating Income | Operating Income | 6,023 | | | 5,594 | | | 4,362 | |
| | Interest Expense | Interest Expense | (742) | | | (722) | | | (754) | |
| Interest Expense | |
| Interest Expense | |
| | | Other Income - Net (Note 14) | |
| | Other Income - Net (Note 14) | |
| | Other Income - Net (Note 14) | Other Income - Net (Note 14) | 133 | | | 79 | | | 19 | |
| Earnings Before Income Taxes | Earnings Before Income Taxes | 5,414 | | | 4,951 | | | 3,627 | |
| | Income Tax Expense (Note 12) | Income Tax Expense (Note 12) | (1,248) | | | (1,170) | | | (862) | |
| Income Tax Expense (Note 12) | |
| Income Tax Expense (Note 12) | |
| Net Earnings | Net Earnings | $ | 4,166 | | | $ | 3,781 | | | $ | 2,765 | |
| | Per Common Share (Note 2) | |
| Per Common Share (Note 2) | |
| Per Common Share (Note 2) | Per Common Share (Note 2) | | | | | | | | |
| Net Earnings Per Share | Net Earnings Per Share | | | | | | Net Earnings Per Share | | | |
| Basic | Basic | $ | 1.95 | | | $ | 1.68 | | | $ | 1.20 | |
| Assuming Dilution | Assuming Dilution | $ | 1.95 | | | $ | 1.68 | | | $ | 1.20 | |
| Average Common Shares Outstanding (Millions) | Average Common Shares Outstanding (Millions) | |
Average Common Shares Outstanding (Millions) | |
Average Common Shares Outstanding (Millions) | |
| Basic | |
| Basic | |
| Basic | Basic | 2,136 | | | 2,250 | | | 2,300 | |
| Assuming Dilution | Assuming Dilution | 2,141 | | | 2,255 | | | 2,305 | |
See accompanying Notes to Consolidated Financial Statements.
CSX 20222023 Form 10-K p.48p.52
CSX CORPORATION
PART II
Item 8. Financial Statements and Supplementary Data
CONSOLIDATED COMPREHENSIVE INCOME STATEMENTS
(Dollars in Millions)
| | Years Ended |
| 2022 | 2021 | 2020 |
| Years Ended | | | Years Ended |
| 2023 | | | 2023 | 2022 | 2021 |
| Net Earnings | Net Earnings | $ | 4,166 | | $ | 3,781 | | $ | 2,765 | |
| Other Comprehensive Income (Loss) - Net of Tax: | Other Comprehensive Income (Loss) - Net of Tax: | |
| Pension and Other Post-Employment Benefits | Pension and Other Post-Employment Benefits | (66) | | 167 | | 21 | |
| Pension and Other Post-Employment Benefits | |
| Pension and Other Post-Employment Benefits | |
| Interest Rate Derivatives | Interest Rate Derivatives | 80 | | 8 | | 62 | |
| Other | Other | 6 | | 15 | | (6) | |
| Total Other Comprehensive Income (Loss) (Note 16) | 20 | | 190 | | 77 | |
| Total Other Comprehensive Income (Note 16) | |
| Comprehensive Earnings | Comprehensive Earnings | $ | 4,186 | | $ | 3,971 | | $ | 2,842 | |
See accompanying Notes to Consolidated Financial Statements.
CSX 20222023 Form 10-K p.49p.53
CSX CORPORATION
PART II
Item 8. Financial Statements and Supplementary Data
CONSOLIDATED BALANCE SHEETS
(Dollars in Millions)
| | December | | December |
| 2022 | | 2021 |
| December | | | December | | December |
| 2023 | | | 2023 | | 2022 |
| ASSETS | ASSETS | ASSETS |
| Current Assets: | Current Assets: | | | | Current Assets: | | | |
| Cash and Cash Equivalents | Cash and Cash Equivalents | $ | 1,958 | | | $ | 2,239 | |
| Short-term Investments | Short-term Investments | 129 | | | 77 | |
| Accounts Receivable - Net (Note 11) | Accounts Receivable - Net (Note 11) | 1,313 | | | 1,148 | |
| Materials and Supplies | Materials and Supplies | 341 | | | 339 | |
| Other Current Assets | Other Current Assets | 108 | | | 70 | |
| Total Current Assets | Total Current Assets | 3,849 | | | 3,873 | |
| | Properties | Properties | 48,105 | | | 46,505 | |
| Properties | |
| Properties | |
| Accumulated Depreciation | Accumulated Depreciation | (13,863) | | | (13,490) | |
| Properties - Net (Note 6) | Properties - Net (Note 6) | 34,242 | | | 33,015 | |
| | Investment in Affiliates and Other Companies (Note 15) | |
| Investment in Affiliates and Other Companies (Note 15) | |
| Investment in Affiliates and Other Companies (Note 15) | Investment in Affiliates and Other Companies (Note 15) | 2,292 | | | 2,099 | |
| Right of Use Lease Asset (Note 7) | Right of Use Lease Asset (Note 7) | 505 | | | 501 | |
| Goodwill and Other Intangible Assets - Net (Note 18) | Goodwill and Other Intangible Assets - Net (Note 18) | 502 | | | 451 | |
| Other Long-term Assets | Other Long-term Assets | 522 | | | 592 | |
| Total Assets | Total Assets | $ | 41,912 | | | $ | 40,531 | |
| LIABILITIES AND SHAREHOLDERS' EQUITY | LIABILITIES AND SHAREHOLDERS' EQUITY | LIABILITIES AND SHAREHOLDERS' EQUITY |
| Current Liabilities: | Current Liabilities: | | | | Current Liabilities: | | | |
| Accounts Payable | Accounts Payable | $ | 1,130 | | | $ | 963 | |
| Labor and Fringe Benefits Payable | Labor and Fringe Benefits Payable | 707 | | | 630 | |
| Casualty, Environmental and Other Reserves (Note 5) | Casualty, Environmental and Other Reserves (Note 5) | 144 | | | 118 | |
| Current Maturities of Long-term Debt (Note 10) | Current Maturities of Long-term Debt (Note 10) | 151 | | | 181 | |
| Income and Other Taxes Payable | Income and Other Taxes Payable | 111 | | | 134 | |
| Other Current Liabilities | Other Current Liabilities | 228 | | | 207 | |
| Total Current Liabilities | Total Current Liabilities | 2,471 | | | 2,233 | |
| | Casualty, Environmental and Other Reserves (Note 5) | Casualty, Environmental and Other Reserves (Note 5) | 292 | | | 250 | |
| Casualty, Environmental and Other Reserves (Note 5) | |
| Casualty, Environmental and Other Reserves (Note 5) | |
| Long-term Debt (Note 10) | Long-term Debt (Note 10) | 17,896 | | | 16,185 | |
| Deferred Income Taxes - Net (Note 12) | Deferred Income Taxes - Net (Note 12) | 7,569 | | | 7,383 | |
| Long-term Lease Liability (Note 7) | Long-term Lease Liability (Note 7) | 488 | | | 478 | |
| Other Long-term Liabilities | Other Long-term Liabilities | 571 | | | 502 | |
| Total Liabilities | Total Liabilities | 29,287 | | | 27,031 | |
| | Shareholders' Equity: | |
| Shareholders' Equity: | |
| Shareholders' Equity: | Shareholders' Equity: | | | | | | |
| Common Stock, $1 Par Value (Note 3) | Common Stock, $1 Par Value (Note 3) | 2,066 | | | 2,202 | |
| Other Capital | Other Capital | 574 | | | 66 | |
| Retained Earnings | Retained Earnings | 10,363 | | | 11,630 | |
| Accumulated Other Comprehensive Loss (Note 16) | Accumulated Other Comprehensive Loss (Note 16) | (388) | | | (408) | |
| Non-controlling Minority Interest | Non-controlling Minority Interest | 10 | | | 10 | |
| Total Shareholders' Equity | Total Shareholders' Equity | 12,625 | | | 13,500 | |
| Total Liabilities and Shareholders' Equity | Total Liabilities and Shareholders' Equity | $ | 41,912 | | | $ | 40,531 | |
See accompanying Notes to Consolidated Financial Statements.
CSX 20222023 Form 10-K p.50p.54
CSX CORPORATION
PART II
Item 8. Financial Statements and Supplementary Data
CONSOLIDATED CASH FLOW STATEMENTS
(Dollars in Millions)
| | | | Years Ended | | Years Ended |
| | | 2022 | | 2021 | | 2020 | | 2023 | | 2022 | | 2021 |
| OPERATING ACTIVITIES | OPERATING ACTIVITIES | |
| Net Earnings | Net Earnings | $ | 4,166 | | | $ | 3,781 | | | $ | 2,765 | |
| Net Earnings | |
| Net Earnings | |
| Adjustments to Reconcile Net Earnings to Net Cash | Adjustments to Reconcile Net Earnings to Net Cash | | | | | Adjustments to Reconcile Net Earnings to Net Cash | | | | | |
| Provided by Operating Activities: | Provided by Operating Activities: | |
| Depreciation and Amortization | |
| Depreciation and Amortization | |
| Depreciation and Amortization | Depreciation and Amortization | 1,500 | | | 1,420 | | | 1,383 | |
| Deferred Income Taxes | Deferred Income Taxes | 117 | | | 167 | | | 180 | |
| Gains on Property Dispositions | Gains on Property Dispositions | (238) | | | (454) | | | (35) | |
| | Other Operating Activities | |
| Other Operating Activities | |
| Other Operating Activities | Other Operating Activities | (17) | | | 12 | | | (32) | |
| Changes in Operating Assets and Liabilities: | Changes in Operating Assets and Liabilities: | | | | | Changes in Operating Assets and Liabilities: | | | | | |
| Accounts Receivable | Accounts Receivable | (101) | | | (141) | | | 83 | |
| Other Current Assets | Other Current Assets | (22) | | | (25) | | | (75) | |
| Accounts Payable | Accounts Payable | 140 | | | 128 | | | (20) | |
| Income and Other Taxes Payable | Income and Other Taxes Payable | (39) | | | 72 | | | 39 | |
| Other Current Liabilities | Other Current Liabilities | 113 | | | 139 | | | (25) | |
| Net Cash Provided by Operating Activities | Net Cash Provided by Operating Activities | 5,619 | | | 5,099 | | | 4,263 | |
| INVESTING ACTIVITIES | INVESTING ACTIVITIES | |
| Property Additions | Property Additions | (2,133) | | | (1,791) | | | (1,626) | |
| Property Additions | |
| Property Additions | |
| Purchases of Short-term Investments | Purchases of Short-term Investments | (59) | | | (75) | | | (426) | |
| Proceeds from Sales of Short-term Investments | Proceeds from Sales of Short-term Investments | 9 | | | 5 | | | 1,424 | |
| Proceeds and Advances from Property Dispositions | Proceeds and Advances from Property Dispositions | 246 | | | 529 | | | 56 | |
| Business Acquisition, Net of Cash Acquired (Note 17) | Business Acquisition, Net of Cash Acquired (Note 17) | (227) | | | (541) | | | — | |
| Other Investing Activities | Other Investing Activities | 33 | | | (4) | | | (77) | |
| Net Cash Used in Investing Activities | Net Cash Used in Investing Activities | (2,131) | | | (1,877) | | | (649) | |
| FINANCING ACTIVITIES | FINANCING ACTIVITIES | |
| | Shares Repurchased | Shares Repurchased | (4,731) | | | (2,886) | | | (867) | |
| | Shares Repurchased | |
| | Shares Repurchased | |
| Dividends Paid | Dividends Paid | (852) | | | (839) | | | (797) | |
| Long-term Debt Repaid | Long-term Debt Repaid | (186) | | | (426) | | | (745) | |
| | Long-term Debt Issued (Note 10) | Long-term Debt Issued (Note 10) | 2,000 | | | — | | | 1,000 | |
| Long-term Debt Issued (Note 10) | |
| Long-term Debt Issued (Note 10) | |
| Other Financing Activities | Other Financing Activities | — | | | 39 | | | (34) | |
| Net Cash Used in Financing Activities | Net Cash Used in Financing Activities | (3,769) | | | (4,112) | | | (1,443) | |
| Net (Decrease) Increase in Cash and Cash Equivalents | (281) | | | (890) | | | 2,171 | |
| Net Decrease in Cash and Cash Equivalents | |
| CASH AND CASH EQUIVALENTS | CASH AND CASH EQUIVALENTS | | | | | CASH AND CASH EQUIVALENTS | | | | | |
| Cash and Cash Equivalents at Beginning of Period | Cash and Cash Equivalents at Beginning of Period | 2,239 | | | 3,129 | | | 958 | |
| Cash and Cash Equivalents at End of Period | Cash and Cash Equivalents at End of Period | $ | 1,958 | | | $ | 2,239 | | | $ | 3,129 | |
| | SUPPLEMENTAL CASH FLOW INFORMATION | SUPPLEMENTAL CASH FLOW INFORMATION | | | | |
| SUPPLEMENTAL CASH FLOW INFORMATION | |
| SUPPLEMENTAL CASH FLOW INFORMATION | | | | | | |
| Issuance of Common Stock as Consideration for Acquisition | Issuance of Common Stock as Consideration for Acquisition | $ | 422 | | | — | | | — | |
| Interest Paid - Net of Amounts Capitalized | Interest Paid - Net of Amounts Capitalized | $ | 729 | | | $ | 718 | | | $ | 750 | |
| Income Taxes Paid | Income Taxes Paid | $ | 1,167 | | | $ | 931 | | | $ | 664 | |
|
See accompanying Notes to Consolidated Financial Statements.
CSX 20222023 Form 10-K p.51p.55
CSX CORPORATION
PART II
Item 8. Financial Statements and Supplementary Data
CONSOLIDATED STATEMENTS OF CHANGES
IN SHAREHOLDERS’ EQUITY
(Dollars in Millions)
| | Common Shares Outstanding (Thousands) | Common Stock and Other Capital | Retained Earnings | Accumulated Other Comprehensive Income (Loss) (a) | Non-
controlling Minority Interest | Total Shareholders' Equity |
| December 31, 2019 | 2,320,414 | | $ | 2,412 | | $ | 10,111 | | $ | (675) | | $ | 15 | | $ | 11,863 | |
| Comprehensive Earnings: | | | | | |
| Net Earnings | — | | | — | | 2,765 | | — | | — | | 2,765 | |
| Other Comprehensive Income (Note 16) | — | | | — | | — | | 77 | | — | | 77 | |
| Total Comprehensive Earnings | | | | 2,842 | |
| Common stock dividends,$0.35 per share | — | | | — | | (797) | | — | | — | | (797) | |
| Share Repurchases | (37,842) | | | (38) | | (829) | | — | | — | | (867) | |
| | Other | 5,015 | | | 66 | | 9 | | — | | (6) | | 69 | |
| Common Shares Outstanding (Thousands) | | | Common Shares Outstanding (Thousands) | Common Stock and Other Capital | Retained Earnings | Accumulated Other Comprehensive (Loss) Income(a) | Non-
controlling Minority Interest | Total Shareholders' Equity |
| December 31, 2020 | December 31, 2020 | 2,287,587 | | | 2,440 | | 11,259 | | (598) | | 9 | | 13,110 | |
| Comprehensive Earnings: | Comprehensive Earnings: | | | | | Comprehensive Earnings: | | | | | | |
| Net Earnings | Net Earnings | — | | | — | | 3,781 | | — | | — | | 3,781 | |
| Other Comprehensive Income (Note 16) | Other Comprehensive Income (Note 16) | — | | | — | | — | | 190 | | — | | 190 | |
| Total Comprehensive Earnings | Total Comprehensive Earnings | | | | 3,971 | |
| Common stock dividends, $0.37 per share | | | | (839) | | | (839) | |
| Common stock dividends,$0.37 per share | |
| Share Repurchases | Share Repurchases | (90,431) | | | (90) | | (2,796) | | — | | — | | (2,886) | |
| | Other | Other | 4,631 | | | (82) | | 225 | | — | | 1 | | 144 | |
| Other | |
| Other | |
| December 31, 2021 | December 31, 2021 | 2,201,787 | | | 2,268 | | 11,630 | | (408) | | 10 | | 13,500 | |
| Comprehensive Earnings: | Comprehensive Earnings: | | | | |
| Net Earnings | |
| Net Earnings | |
| Net Earnings | Net Earnings | — | | | — | | 4,166 | | — | | — | | 4,166 | |
| Other Comprehensive Income (Note 16) | Other Comprehensive Income (Note 16) | — | | | — | | — | | 20 | | — | | 20 | |
| Total Comprehensive Earnings | Total Comprehensive Earnings | | | | 4,186 | |
| Common stock dividends, $0.40 per share | Common stock dividends, $0.40 per share | — | | | — | | (852) | | — | | — | | (852) | |
| Share Repurchases | Share Repurchases | (151,419) | | | (151) | | (4,580) | | — | | — | | (4,731) | |
| | Issuance of common stock for acquisition of Pan Am Systems, Inc. | Issuance of common stock for acquisition of Pan Am Systems, Inc. | 13,173 | | | 422 | | — | | — | | — | | 422 | |
| Other | Other | 2,826 | | | 101 | | (1) | | — | | — | | 100 | |
| December 31, 2022 | December 31, 2022 | 2,066,367 | | $ | 2,640 | | $ | 10,363 | | $ | (388) | | $ | 10 | | $ | 12,625 | |
| Comprehensive Earnings: | |
| Net Earnings | |
| Net Earnings | |
| Net Earnings | |
| Other Comprehensive Income (Note 16) | |
| Total Comprehensive Earnings | |
| Common stock dividends, $0.44 per share | |
| Share Repurchases | |
| | Excise Tax on Net Share Repurchases | |
| Excise Tax on Net Share Repurchases | |
| Excise Tax on Net Share Repurchases | |
| Other | |
| December 31, 2023 | |
(a) Accumulated Other Comprehensive Loss year-end balances shown above are net of tax. The associated taxes were $84 million, $122 million, and $107 million for 2023, 2022 and $156 million for 2022, 2021, and 2020, respectively. For additional information see Note 16, Other Comprehensive Income.Income (Loss).
See accompanying Notes to Consolidated Financial Statements.
CSX 20222023 Form 10-K p.52p.56
CSX CORPORATION
PART II
Item 8. Financial Statements and Supplementary Data
NOTES TO CONSOLIDATED FINANCIAL STATEMENTS
NOTE 1. Nature of Operations and Significant Accounting Policies
Business
CSX Corporation together with its subsidiaries ("CSX" or the “Company”), based in Jacksonville, Florida, is one of the nation's leading transportation companies. The Company provides rail-based transportation services including traditional rail service, the transport of intermodal containers and trailers, as well as other transportation services such as rail-to-truck transfers and bulk commodity operations.
CSX Transportation, Inc.
CSX’s principal operating subsidiary, CSX Transportation, Inc. (“CSXT”), provides an important link to the transportation supply chain through its approximately 20,000 route mile rail network and serves major population centers in 26 states east of the Mississippi River, the District of Columbia and the Canadian provinces of Ontario and Quebec. It has access to over 70 ocean, river and lake port terminals along the Atlantic and Gulf Coasts, the Mississippi River, the Great Lakes and the St. Lawrence Seaway. The Company’s intermodal business links customers to railroads via trucks and terminals. CSXT also serves thousands of production and distribution facilities through track connections to more than 240 short-line and regional railroads. On June 1, 2022, CSX completed its acquisition of Pan Am Systems, Inc. (“Pan Am”), which is the parent company of Pan Am Railways, Inc. This acquisition expands CSXT’s reach in the Northeastern United States. For further details, refer to Note 17, Business Combinations.Combinations.
CSXT is also responsible for the Company's real estate sales, leasing, acquisition and management and development activities. Substantially all of these activities are focused on supporting railroad operations.
Other Entities
In addition to CSXT, the Company’s subsidiaries include Quality Carriers, Inc. ("Quality Carriers"), CSX Intermodal Terminals, Inc. (“CSX Intermodal Terminals”), Total Distribution Services, Inc. (“TDSI”), TransfloTRANSFLO Terminal Services, Inc. (“Transflo”TRANSFLO”), CSX Technology, Inc. (“CSX Technology”) and other subsidiaries. Effective July 1, 2021, CSX acquired Quality Carriers, the largest provider of bulk liquid chemicals truck transportation in North America. For further details, refer to Note 17, Business CombinationsCombinations.. CSX Intermodal Terminals owns and operates a system of intermodal terminals, predominantly in the eastern United States, and also provides drayage services (the pickup and delivery of intermodal shipments) for certain customers. TDSI serves the automotive industry with distribution centers and storage locations. TransfloTRANSFLO connects non-rail served customers to the many benefits of rail by transferring products from rail to trucks. The biggest TransfloTRANSFLO markets are chemicals and agriculture, which include shipments of plastics and ethanol. CSX Technology and other subsidiaries provide support services for the Company.
CSX 20222023 Form 10-K p.53p.57
CSX CORPORATION
PART II
Item 8. Financial Statements and Supplementary Data
NOTE 1. Nature of Operations and Significant Accounting Policies, continued
Lines of Business
During 2022,2023, the Company's services generated $14.9$14.7 billion of revenue and served four primary lines of business: merchandise, intermodal, coal and trucking.
•The merchandise business shipped 2.6 million carloads (41%(43% of volume) and generated $8.2$8.7 billion in revenue (55%(59% of revenue) in 2022.2023. The Company’s merchandise business is comprised of shipments in the following diverse markets: chemicals, agricultural and food products, minerals, automotive, forest products, metals and equipment, and fertilizers.
•The intermodal business shipped 3.02.8 million units (48%(45% of volume) and generated $2.3$2.1 billion in revenue (16%(14% of revenue) in 2022.2023. The intermodal business combines the superior economics of rail transportation with the flexibility of trucks and offers a cost and environmental advantage over long-haul trucking. Through a network of approximately 30 terminals, the intermodal business serves all major markets east of the Mississippi River and transports mainly manufactured consumer goods in containers, providing customers with truck-like service for longer shipments.
•The coal business shipped 697755 thousand carloads (11%(12% of volume) and generated $2.4$2.5 billion in revenue (16%(17% of revenue) in 2022.2023. The Company transports domestic coal, coke and iron ore to electricity-generating power plants, steel manufacturers and industrial plants as well as export coal to deep-water port facilities. Most of the export coal the Company transports is used for steelmaking, while the majority of domestic coal the Company ships is used for electricity generation.
•The trucking business generated $966$882 million, or 7%6%, of revenue in 2022.2023. Trucking revenue includes revenue from the operations of Quality Carriers, which was acquired by CSX effective July 1, 2021.
Other revenue accounted for 6%4% of the Company’s total revenue in 2022.2023. This category includes revenue from regional subsidiary railroads and incidental charges, including intermodal storage and equipment usage, demurrage and switching. Revenue from regional subsidiary railroads includes shipments by railroads that the Company does not directly operate. Intermodal storage represents charges for customer storage of containers at an intermodal terminal, ramp facility or offsite location beyond a specified period of time. Demurrage represents charges assessed when freight cars are held by a customer beyond a specified period of time. Switching represents charges assessed when a railroad switches cars for a customer or another railroad.
The Company has two operating segments: rail and trucking. Although the Company provides a breakdown of revenue by line of business, the overall financial and operational performance of the railroad is analyzed as one operating segment due to the integrated nature of the rail network. As the trucking segment is not material for separate disclosure, the results of all operations are included in one reportable segment.
Employees
The Company's number of employees was more than 22,50023,000 as of December 2022,2023, which includes approximately 17,10017,700 union employees. Most of the Company’s employees provide or support transportation services.
CSX 20222023 Form 10-K p.54p.58
CSX CORPORATION
PART II
Item 8. Financial Statements and Supplementary Data
NOTE 1. Nature of Operations and Significant Accounting Policies, continued
Basis of Presentation
In the opinion of management, the accompanying consolidated financial statements contain all normal, recurring adjustments necessary to fairly present the financial position of CSX and its subsidiaries at December 31, 20222023 and December 31, 2021,2022, and the consolidated statements of income, comprehensive income, cash flows and changes in shareholders’ equity for the years ended 2023, 2022 2021 and 2020. Where applicable, prior year information has been reclassified to conform to current presentation.2021. In addition, management has evaluated and disclosed all material events occurring subsequent to the date of the financial statements up to the date this annual report is filed on Form 10-K.
Use of Estimates
The preparation of financial statements in conformity with accounting principles generally accepted in the United States requires that management make estimates in reporting the amounts of certain assets and liabilities, the disclosure of contingent assets and liabilities at the date of the financial statements and the reported amount of certain revenues and expenses during the reporting period. Actual results may differ from those estimates. Critical accounting estimates using management judgment are made for the following areas:
•personal injury and environmental reserves (see Note 5, Casualty, Environmental and Other Reserves);
•pension plan accounting (see Note 9, Employee Benefit Plans); and
•depreciation policies for assets under the group-life method (see Note 6, Properties); and
•goodwill and other intangible assets (see Note 17, Business Combinations and Note 18, Goodwill and Other Intangibles).
Fiscal Year
The Company's fiscal periods are based upon the calendar year. Except as otherwise specified, references to full years indicate CSX’s fiscal years ended on December 31, 2022,2023, December 31, 2021,2022, and December 31, 2020.2021.
Principles of Consolidation
The consolidated financial statements include results of operations of CSX and subsidiaries over which CSX has majority ownership or financial control. All significant intercompany accounts and transactions have been eliminated. Most investments in companies that were not majority-owned were carried at cost (if less than 20% owned and the Company has no significant influence) or were accounted for under the equity method (if the Company has significant influence but does not have control). These investments are reported within Investment in Affiliates and Other Companies on the consolidated balance sheets.
CSX 20222023 Form 10-K p.55p.59
CSX CORPORATION
PART II
Item 8. Financial Statements and Supplementary Data
NOTE 1. Nature of Operations and Significant Accounting Policies, continued
Cash and Cash Equivalents
On a daily basis, cash in excess of current operating requirements is invested in various highly liquid investments having a typical maturity date of three months or less at the date of acquisition. These investments are carried at cost, which approximates market value, and are classified as cash equivalents.
Investments
Investments in instruments with original maturities greater than three months that will mature in less than one year are classified as short-term investments. Investments with original maturities of one year or greater are initially classified within other long-term assets, and the classification is re-evaluated at each balance sheet date.
Materials and Supplies
Materials and supplies in the consolidated balance sheets are carried at average cost and consist primarily of parts used in the repair and maintenance of track structure, equipment, and CSXT’s freight car and locomotive fleets, as well as fuel.
New Accounting Pronouncements
In March 2020, the Financial Accounting Standards Board ("FASB") issued Accounting Standards Update ("ASU") 2020-04, Facilitation of the Effects of Reference Rate Reform on Financial Reporting. As the London Interbank Offered Rate ("LIBOR") willis no longer be available beginningas of July 2023, this standard update provides practical expedients for contract modifications made as part of the transition from LIBOR to alternative reference rates. The guidance was effective upon issuance and practical expedientsat present can generally be applied through the extended period ending December 31, 2024. CSX's revolving line of credit currently uses LIBOR as a reference rate. As of December 31, 2022, theThe Company has not applied the practical expedient to its forward starting interest rate swaps effective June 30, 2023. See Note 10, Debt and Credit Agreements, for additional information. The Company does not have any contracts.other contracts that are affected by the transition from LIBOR.
In November 2021,2023, the FASB issued ASU 2021-10,2023-07, Disclosure by Business Entities about Government AssistanceImprovements to Reportable Segment Disclosures. This standard update requires additional interim and annual disclosure of the nature of any government assistance received, accounting policies related to such assistance and the effect of that assistance on the entity’s financial statements.disclosures about a reportable segment’s expenses, even for companies with only one reportable segment. The Company adoptedis required to adopt the guidance for its 2024 annual report filed on Form 10-K, though early adoption is permitted. The Company is currently evaluating the impact of these amendments on its disclosures, but this guidance effective year end 2022 and the standard update didwill not impact the Company's results of operations or financial position as the update only impacts disclosures. See Note 6, Properties.position.
In December 2023, the FASB issued ASU 2023-09, Improvements to Income Tax Disclosures. This standard update requires additional interim and annual disclosures about a company’s income taxes, including more detailed information around the annual rate reconciliation and income taxes paid. The Company is required to adopt the guidance for its 2025 annual report filed on Form 10-K, though early adoption is permitted. The Company is currently evaluating the impact of these amendments on its disclosures, but this standard update will not impact the Company's results of operations or financial position.
CSX 20222023 Form 10-K p.56p.60
CSX CORPORATION
PART II
Item 8. Financial Statements and Supplementary Data
NOTE 2. Earnings Per Share
The following table sets forth the computation of basic earnings per share and earnings per share, assuming dilution:
| | | | Years Ended | | Years Ended |
| | | 2022 | | 2021 | | 2020 | | 2023 | | 2022 | | 2021 |
Numerator (Dollars in Millions): | Numerator (Dollars in Millions): | | | |
| Net Earnings | Net Earnings | $ | 4,166 | | | $ | 3,781 | | | $ | 2,765 | |
| Dividend Equivalents on Restricted Stock | — | | | — | | | — | |
| Net Earnings, Attributable to Common Shareholders | $ | 4,166 | | | $ | 3,781 | | | $ | 2,765 | |
| Net Earnings | |
| Net Earnings | |
| | Denominator (Units in Millions): | Denominator (Units in Millions): | |
| Denominator (Units in Millions): | |
| Denominator (Units in Millions): | |
| Average Common Shares Outstanding | |
| Average Common Shares Outstanding | |
| Average Common Shares Outstanding | Average Common Shares Outstanding | 2,136 | | | 2,250 | | | 2,300 | |
| Other Potentially Dilutive Common Shares | Other Potentially Dilutive Common Shares | 5 | | | 5 | | | 5 | |
| Average Common Shares Outstanding, Assuming Dilution | Average Common Shares Outstanding, Assuming Dilution | 2,141 | | | 2,255 | | | 2,305 | |
| | Net Earnings Per Share, Basic | Net Earnings Per Share, Basic | $ | 1.95 | | | $ | 1.68 | | | $ | 1.20 | |
| Net Earnings Per Share, Basic | |
| Net Earnings Per Share, Basic | |
| Net Earnings Per Share, Assuming Dilution | Net Earnings Per Share, Assuming Dilution | $ | 1.95 | | | $ | 1.68 | | | $ | 1.20 | |
Basic earnings per share is based on the weighted-average number of shares of common stock outstanding. Earnings per share, assuming dilution, is based on the weighted-average number of shares of common stock outstanding and common stock equivalents adjusted for the effects of common stock that may be issued as a result of potentially dilutive instruments. CSX's potentially dilutive instruments are made up of equity awards including stock options, performance units and employeerestricted stock options.units.
When calculating diluted earnings per share, the potential shares that would be outstanding if all outstanding stock options were exercised are included. This number is different from outstanding stock options, which is included in Note 4, Stock Plans and Share-Based Compensation, because it is offset by shares CSX could repurchase using the proceeds from these hypothetical exercises to obtain the common stock equivalent. The total average outstanding equity awards that were excluded from the diluted earnings per share calculation because their effect was antidilutive is in the table below.
| | | | | | | | | | | | | | | | | |
| Years Ended |
| 2022 | | 2021 | | 2020 |
Antidilutive Stock Options Excluded from Diluted EPS (in millions) | 3 | | | 2 | | | 6 | |
| | | | | | | | | | | |
| Years Ended |
| 2023 | 2022 | 2021 |
Antidilutive Stock Options Excluded from Diluted EPS (Units in Millions) | 3 | | 3 | | 2 | |
Share Repurchase Programs
During July 2022,November 2023, the share repurchase program announced in October 2020July 2022 was completed and the Company began repurchasing shares under the $5 billion share repurchase program approved on July 19, 2022.October 17, 2023. Total repurchase authority remaining was $3.3$4.8 billion as of December 31, 2022. Previously, shares2023. Previous share repurchase programs were repurchased under a program announced in October 2020 and January 2019 that wasand were completed in July 2022 and June 2021.2021, respectively.
CSX 20222023 Form 10-K p.57p.61
CSX CORPORATION
PART II
Item 8. Financial Statements and Supplementary Data
NOTE 2. Earnings Per Share, continued
Share repurchases may be made through a variety of methods including, but not limited to, open market purchases, purchases pursuant to Rule 10b5-1 plans, accelerated share repurchases and negotiated block purchases. The timing of share repurchases depends upon management's assessment of marketplace conditions and other factors, and the program remains subject to the discretion of the Board of Directors. Future share repurchases are expected to be funded by cash on hand, cash generated from operations and debt issuances. Shares are retired immediately upon repurchase. In accordance with the Equity Topic in the Accounting Standards Codification ("ASC"), the excess of repurchase price over par value is recorded in retained earnings.
Share Repurchase Activity
During 2023, 2022 2021 and 2020,2021, CSX repurchased the following shares:
| | Years Ended |
| 2022 | | 2021 | | 2020 |
| Years Ended | | | Years Ended |
| 2023 | | | 2023 | | 2022 | | 2021 |
Shares Repurchased (Units in Millions) | Shares Repurchased (Units in Millions) | 151 | | | 90 | | | 38 | |
Cost of Shares (Dollars in Millions) | Cost of Shares (Dollars in Millions) | $ | 4,731 | | | $ | 2,886 | | | $ | 867 | |
| Average Price Paid per Share | Average Price Paid per Share | $ | 31.25 | | | $ | 31.91 | | | $ | 22.90 | |
The Inflation Reduction Act of 2022 imposes a nondeductible 1% excise tax on the net value of most share repurchases made after December 31, 2022. Excise tax commensurate with net share repurchases is reflected in equity and a corresponding liability for excise taxes payable is included in other current liabilities on the consolidated balance sheet. Amounts shown in the table above exclude the impact of this excise tax.
Structured Share Repurchases
Periodically, CSX enters into structured agreements for the repurchase of CSX shares. Upon execution of each agreement, the Company pays a fixed amount of cash in exchange for the right to receive either CSX stock or a predetermined amount of cash, including a premium. Shares acquired through these structured share repurchase agreements were recorded in common stock and retained earnings and are included in the share repurchases table above. There were no repurchases under a structured agreement in 2023 or 2022.
As a result of entering into and settling structured share repurchase agreements, In 2021, the Company paid a net total of approximately $378 million and received approximately 12 million shares during the year ended 2021.as a result of entering into and settling structured share repurchase agreements. Premiums received were not material.
In December 2020, the Company completed a structured share repurchase. Under this agreement, the Company paid a total of $100 million and received approximately 3.3 million shares.
Dividend Increase
On February 14, 2023,2024, the Company's Board of Directors authorized a 10%9% increase in the quarterly cash dividend to $0.11$0.12 per common share effective March 2023.2024.
CSX 20222023 Form 10-K p.58p.62
CSX CORPORATION
PART II
Item 8. Financial Statements and Supplementary Data
NOTE 3. Shareholders’ Equity
Common and preferred stock consists of the following:
| | | | | |
| Common Stock, $1 Par Value | December 20222023 |
| | (Units in Millions) |
| Common Shares Authorized | 5,400 | |
| Common Shares Issued and Outstanding | 2,0661,958 | |
| | |
| Preferred Stock | |
| Preferred Shares Authorized | 25 | |
| Preferred Shares Issued and Outstanding | — | |
Holders of common stock are entitled to one vote on all matters requiring a vote for each share held. Preferred stock is senior to common stock with respect to dividends and upon liquidation of CSX.
Common Stock Split
On June 4, 2021, CSX announced a three-for-one split of the Company’s common stock in the form of a stock dividend. Each shareholder of record on June 18, 2021, received two additional shares of common stock for each share held as of this record date. The new shares were distributed after close of trading on June 28, 2021. All prior period share and per share amounts, common stock, other capital, and retained earnings were retroactively adjusted to reflect the impact of the stock split. Proportional adjustments were also made to outstanding awards under the Company's stock-based compensation plans.
Other Capital
As a result of the stock split during second quarter 2021, CSX's common stock balance was increased and its other capital balance was reduced commensurately. Because this adjustment brought the other capital balance below zero, $1.0 billion was reclassified from retained earnings to other capital to bring the other capital balance to zero as of June 30, 2021. Prior period amounts have also been retroactively adjusted as needed to bring the other capital balance to zero.
CSX 20222023 Form 10-K p.59p.63
CSX CORPORATION
PART II
Item 8. Financial Statements and Supplementary Data
NOTE 4. Stock Plans and Share-Based Compensation
Under CSX's share-based compensation plans, awards consist of performance units, stock options, restricted stock units and restricted stock awards for management and stock grants for directors. Awards granted under the various programs are determined and approved by the Compensation and Talent Management Committee of the Board of Directors. Awards to the Chief Executive Officer are approved by the full Board and awards to senior executives are approved by the Compensation and Talent Management Committee. In certain circumstances, the Chief Executive Officer or delegate approves awards to management employees other than senior executives. The Board of Directors approves awards granted to CSX's non-management directors upon recommendation of the Governance and Sustainability Committee.
Share-based compensation expense for awards under share-based compensation plans and purchases made as part of the employee stock purchase plan is measured using the fair value of the award on the grant date and is recognized on a straight-line basis over the service period of the respective award. Alternatively, expense is recognized upon death or upon grant date to certainover an accelerated service period for retirement-eligible employees whose agreements allow for continued vesting upon retirement. Forfeitures are recognized as they occur. Total pre-tax expense and income tax benefits associated with share-based compensation are shown in the table below. Income tax benefits include impacts from option exercises and the vesting of other equity awards.
| | | | Years Ended | | Years Ended |
| (Dollars in Millions) | (Dollars in Millions) | 2022 | 2021 | 2020 | (Dollars in Millions) | 2023 | 2022 | 2021 |
| Share-Based Compensation Expense | Share-Based Compensation Expense | |
| Performance Units | Performance Units | $ | 35 | | $ | 71 | | $ | (3) | |
| Performance Units | |
| Performance Units | |
| Restricted Stock Units and Awards | |
| Stock Options | Stock Options | 17 | | 18 | | 19 | |
| Restricted Stock Units and Awards | 15 | | 12 | | 6 | |
| Employee Stock Purchase Plan | Employee Stock Purchase Plan | 5 | | 4 | | 5 | |
| Stock Awards for Directors | Stock Awards for Directors | 2 | | 2 | | 2 | |
| Total Share-based Compensation Expense | Total Share-based Compensation Expense | $ | 74 | | $ | 107 | | $ | 29 | |
| Income Tax Benefit | Income Tax Benefit | $ | 17 | | $ | 23 | | $ | 19 | |
Long-term Incentive Plans
The objective of the CSX Long-term Incentive Plans (“LTIP”) is to motivate and reward certain employees for achieving and exceeding certain financial goals. The 2023-2025, 2022-2024, 2021-2023 and 2020-20222021-2023 LTIPs were adopted under the 2019 Stock and Incentive Award Plan. Grants were made in performance units, with each unit being equivalent to one share of CSX common stock, and payouts will be made in CSX common stock. The payout range for most participants will be between 0% and 200% of the target awards depending on Company performance against predetermined goals for each three-year cycle.
CSX 20222023 Form 10-K p.60p.64
CSX CORPORATION
PART II
Item 8. Financial Statements and Supplementary Data
NOTE 4. Stock Plans and Share-Based Compensation, continued
In 2023, 2022 2021 and 2020,2021, target performance units were granted to certain employees under three separate LTIP plans covering three-year cycles: the 2023-2025 ("2023-2025 LTIP"), the 2022-2024 ("2022-2024 LTIP"), and the 2021-2023 ("2021-2023 LTIP") and the 2020-2022 ("2020-2022 LTIP") plans.. Payouts of performance units for the plans will be based on the achievement of certain goals, in each case excluding non-recurring items as disclosed in the Company’s financial statements.
•For the 2023-2025 and 2022-2024 LTIP plan, the average annual operating income growth percentage and CSXEconomic Profit (CSX Cash Earnings ("CCE")or CCE), in each case excluding non-recurring items as defined in the plan, will each comprise 50% of the payout and will be measured independently of the other. Participants will receive stock dividend equivalents declared over the performance period based on the number of performance units paid upon vesting. As defined under the plan, CCE is a cash-flow-based measure thatEconomic Profit incentivizes strategic investments earning more than the required return. CCE equalsreturn and is calculated as CSX’s gross cash earnings (after-tax adjusted EBITDA) minus the required returnlong-term average cost of capital on gross operating assets.
•For the 2021-2023 LTIP plan, the average annual operating income growth percentage and cumulative free cash flow over the plan period will each comprise 50% of the payout and will be measured independently of the other. Participants will receive stock dividend equivalents declared over the performance period based on the number of performance units paid upon vesting.
•For the 2020-2022 LTIP plan, the cumulative operating income and cumulative free cash flow over the plan period will each comprise 50% of the payout and will be measured independently of the other. Participants will receive stock dividend equivalents declared over the performance period based on the number of performance units paid upon vesting.
For these plans, payouts for certain executive officers are subject to formulaic upward or downward adjustment by up to 25%, capped at an overall payout of 250%, based upon the Company’s total shareholder return relative to specified comparable groups over the performance period.
The fair values of the performance units awarded during the years ended December 2023, 2022 2021 and 20202021 were calculated primarily using a Monte-Carlo simulation model with the following weighted-average assumptions:
| | Years Ended |
| Years Ended | | | Years Ended |
| Weighted-Average Assumptions Used: | Weighted-Average Assumptions Used: | 2022 | 2021 | 2020 | Weighted-Average Assumptions Used: | 2023 | 2022 | 2021 |
| | Risk-free Interest Rate | Risk-free Interest Rate | 2.3 | % | 0.2 | % | 1.4 | % |
| Risk-free Interest Rate | |
| Risk-free Interest Rate | | 4.4 | % | 2.3 | % | 0.2 | % |
| Annualized Volatility | Annualized Volatility | 33.0 | % | 33.6 | % | 24.5 | % | Annualized Volatility | 33.2 | % | 33.0 | % | 33.6 | % |
Expected Life (in years) | Expected Life (in years) | 2.7 | 2.9 | Expected Life (in years) | 2.8 | 2.7 | 2.9 |
The risk-free interest rate assumptions reflect the U.S. Treasury yield curve in effect at the time of grant. The annualized volatility is based on observed historical volatility of daily stock returns for the three-year period preceding the grant date. The expected life is calculated using the remainder of the performance period.
CSX 20222023 Form 10-K p.61p.65
CSX CORPORATION
PART II
Item 8. Financial Statements and Supplementary Data
NOTE 4. Stock Plans and Share-Based Compensation, continued
Performance unit grant and vesting information is summarized as follows:
| | | | Years Ended | | Years Ended |
| | | 2022 | | 2021 | | 2020 | | 2023 | | 2022 | | 2021 |
| Weighted-Average Fair Value of Units Granted | Weighted-Average Fair Value of Units Granted | $ | 33.89 | | | $ | 30.11 | | | $ | 25.39 | |
Fair Value of Units Vested (in millions) | $ | 24 | | | $ | 19 | | | $ | 18 | |
Fair Value of Units Vested (in Millions) | |
The performance unit activity related to the outstanding long-term incentive plans and corresponding fair value is summarized as follows:
| | | | Performance Units Outstanding
(in Thousands) | | Weighted-Average Fair Value at Grant Date | | Performance Units Outstanding
(in Thousands) | | Weighted-Average Fair Value at Grant Date |
| Unvested at December 31, 2021 | 1,576 | | | $ | 27.21 | |
| Unvested at December 31, 2022 | |
| Granted | Granted | 670 | | | 33.89 | |
| Forfeited | Forfeited | (33) | | | 25.65 | |
| Vested | Vested | (959) | | | 25.52 | |
| Unvested at December 31, 2022 | 1,254 | | | $ | 32.14 | |
| Unvested at December 31, 2023 | |
As of December 2022,2023, there was $23$20 million of total unrecognized compensation cost related to performance units that is expected to be recognized over a weighted-average period of approximately two years.
Stock Options
Stock options in 2023, 2022 2021 and 20202021 were primarily granted along with the corresponding LTIP plans. With these grants, an employee receives an award that provides the opportunity in the future to purchase CSX shares at the closing market price of the stock on the date the award is granted (the strike price). Options granted become exercisable in equal installments on the anniversary of the grant date over a vesting period (three-year graded). All options expire 10 years from the grant date if they are not exercised.
The fair value of stock options granted was estimated as of the dates of grant using the Black-Scholes option valuation model, which uses the following assumptions: dividend yield, risk-free interest rate, annualized volatility and expected life. The annual dividend yield is based on the most recent quarterly CSX dividend payment annualized. The risk-free interest rate is based on U.S. Treasury yield curve in effect at the time of grant. The annualized volatility is based on historical volatility of daily CSX stock price returns over a 6.0 year look-back period ending on the grant date. The expected life is calculated using the safe harbor approach due to lack of historical data on CSX options, which is the midpoint between the vesting schedule and contractual term (10 years).
CSX 20222023 Form 10-K p.62p.66
CSX CORPORATION
PART II
Item 8. Financial Statements and Supplementary Data
NOTE 4. Stock Plans and Share-Based Compensation, continued
Assumptions and inputs used to estimate fair value of stock options are summarized as follows:
| | Years Ended |
| Years Ended | | | Years Ended |
| | | 2022 | 2021 | 2020 | | 2023 | 2022 | 2021 |
| Weighted-Average Fair Value of Units Granted | Weighted-Average Fair Value of Units Granted | $ | 10.12 | | $ | 7.94 | | $ | 6.31 | | Weighted-Average Fair Value of Units Granted | $ | 9.82 | $ | 10.12 | $ | 7.94 |
| | | Stock Options Valuation Assumptions: | Stock Options Valuation Assumptions: | |
| | Stock Options Valuation Assumptions: | |
| | Stock Options Valuation Assumptions: | |
| Annual Dividend Yield | |
| Annual Dividend Yield | |
| Annual Dividend Yield | Annual Dividend Yield | 1.1 | % | 1.2 | % | 1.2 | % | 1.4 | % | 1.1 | % | 1.2 | % |
| Risk-free Interest Rate | Risk-free Interest Rate | 2.0 | % | 0.7 | % | 1.4 | % | Risk-free Interest Rate | 3.8 | % | 2.0 | % | 0.7 | % |
| Annualized Volatility | Annualized Volatility | 30.1 | % | 31.2 | % | 26.1 | % | Annualized Volatility | 29.6 | % | 30.1 | % | 31.2 | % |
| Expected Life (in years) | 6.0 | 6.0 |
| Expected Life (in Years) | | Expected Life (in Years) | 6.0 | 6.0 |
| Other Pricing Model Inputs: | Other Pricing Model Inputs: | |
| Weighted-average Grant-date Market Price of CSX Stock (Strike Price) | Weighted-average Grant-date Market Price of CSX Stock (Strike Price) | $ | 35.12 | | $ | 29.65 | | $ | 26.53 | |
| Weighted-average Grant-date Market Price of CSX Stock (Strike Price) | |
| Weighted-average Grant-date Market Price of CSX Stock (Strike Price) | | $ | 31.54 | $ | 35.12 | $ | 29.65 |
The stock option activity is summarized as follows:
| | | | Stock Options Outstanding
(in Thousands) | | Weighted-Average Exercise Price | | Weighted-Average Remaining Contractual Life
(in Years) | | Aggregate Intrinsic Value
(in Millions) | | Stock Options Outstanding
(in Thousands) | | Weighted-Average Exercise Price | | Weighted-Average Remaining Contractual Life
(in Years) | | Aggregate Intrinsic Value
(in Millions) |
| Outstanding at December 31, 2021 | 12,512 | | | $ | 22.42 | | |
| Outstanding at December 31, 2022 | |
| Granted | |
| Granted | |
| Granted | Granted | 1,726 | | | 35.12 | | |
| Forfeited | Forfeited | (123) | | | 30.19 | | |
| Forfeited | |
| Forfeited | |
| Exercised | Exercised | (715) | | | 21.53 | | |
| Outstanding at December 31, 2022 | 13,400 | | | $ | 24.03 | | | 6.6 | | $ | 100 | |
| Exercisable at December 31, 2022 | 9,175 | | | $ | 20.85 | | | 5.8 | | $ | 93 | |
| Exercised | |
| Exercised | |
| Outstanding at December 31, 2023 | |
| Outstanding at December 31, 2023 | |
| Outstanding at December 31, 2023 | |
| Exercisable at December 31, 2023 | |
Unrecognized compensation expense related to stock options as of December 20222023 was $15$12 million and is expected to be recognized over a weighted-average period of approximately two years. The Company issues new shares upon stock option exercises. Additional information on stock option exercises is summarized as follows:
| | Years Ended |
| Years Ended | | | Years Ended |
| (Dollars in Millions) | (Dollars in Millions) | 2022 | 2021 | 2020 | (Dollars in Millions) | 2023 | 2022 | 2021 |
| Intrinsic Value of Stock Options Exercised | Intrinsic Value of Stock Options Exercised | $ | 9 | | $ | 32 | | $ | 30 | |
| Cash Received from Option Exercises | Cash Received from Option Exercises | $ | 15 | | $ | 31 | | $ | 29 | |
CSX 20222023 Form 10-K p.63p.67
CSX CORPORATION
PART II
Item 8. Financial Statements and Supplementary Data
NOTE 4. Stock Plans and Share-Based Compensation, continued
Restricted Stock Grants
Restricted stock grants consist of units and awards, each equivalent to one share of CSX stock. Restricted stock units are primarily issued along with corresponding LTIP plans and vest three years after the date of grant.grant (three-year cliff) or on the annual anniversary of the grant date over a vesting period (three-year graded). Separately, restricted stock awards generally vest over an employment period of up to five years. These awards are time-based and not based upon CSX’s attainment of operational targets. Participants receive cash or stock dividend equivalents on these shares, depending on the grant. Restricted stock grant and vesting information is summarized as follows:
| | | | Years Ended | | Years Ended |
| | | 2022 | | 2021 | | 2020 | | 2023 | | 2022 | | 2021 |
| Weighted-Average Fair Value of Units Granted | Weighted-Average Fair Value of Units Granted | $ | 34.55 | | | $ | 29.84 | | | $ | 26.43 | |
Fair Value of Units and Awards Vested (In Millions) | $ | 5 | | | $ | 12 | | | $ | 8 | |
Fair Value of Units and Awards Vested (in Millions) | |
The restricted stock activity related to the outstanding long-term incentive plans and other awards and corresponding fair value is summarized as follows:
| | | | Restricted Stock Units and Awards Outstanding
(in Thousands) | | Weighted-Average Fair Value at Grant Date | | Restricted Stock Units and Awards Outstanding
(in Thousands) | | Weighted-Average Fair Value at Grant Date |
| Unvested at December 31, 2021 | 1,023 | | | $ | 27.53 | |
| Unvested at December 31, 2022 | |
| Granted | Granted | 801 | | | 34.55 | |
| Forfeited | Forfeited | (54) | | | 29.85 | |
| Vested | Vested | (218) | | | 23.33 | |
| Unvested at December 31, 2022 | 1,552 | | | $ | 31.68 | |
| Unvested at December 31, 2023 | |
As of December 2022,2023, unrecognized compensation expense for these restricted stock units and awards was approximately $22$28 million, which will be expensed over a weighted-average remaining period of two years.
CSX 20222023 Form 10-K p.64p.68
CSX CORPORATION
PART II
Item 8. Financial Statements and Supplementary Data
NOTE 4. Stock Plans and Share-Based Compensation, continued
Stock Awards for Directors
CSX’s non-management directors receive a base annual retainer of $122,500$130,000 to be paid quarterly in cash, unless the director chooses to defer the retainer in the form of cash or CSX common stock. Additionally, non-management directors receive an annual grant of common stock in the amount of approximately $172,500$180,000 and the independent non-executive Chairman also receives an annual grant of common stock in the amount of approximately $250,000. These awards are evaluated periodically by the Board of Directors.
Employee Stock Purchase Plan
In May 2018, shareholders approved the 2018 CSX Employee Stock Purchase Plan (“ESPP”) for the benefit of Company employees. The Company registered 12 million shares of common stock that may be issued pursuant to this plan. Under the ESPP, employees may contribute between 1% and 10% of base compensation, after-tax, to purchase up to $25,000 of market value CSX common stock per year at 85% of the closing market price on either the grant date or the last day of the six-month offering period, whichever is lower. During 2023, 2022 2021 and 2020,2021, the Company issued the following shares under this program.
| | | | Years Ended | | Years Ended |
| | | 2022 | 2021 | | 2020 | | | 2023 | 2022 | 2021 |
Shares Issued (In Thousands) | 726 | | 730 | | | 726 | | |
Shares Issued (in Thousands) | |
| Weighted Average Purchase Price Per Share | Weighted Average Purchase Price Per Share | $ | 25.93 | | $ | 21.90 | | | $ | 20.13 | | |
CSX 20222023 Form 10-K p.65p.69
CSX CORPORATION
PART II
Item 8. Financial Statements and Supplementary Data
NOTE 5. Casualty, Environmental and Other Reserves
Activity related to casualty, environmental and other reserves is as follows:
| | | | Casualty | | Environmental | | Other | | | | Casualty | | Environmental | | Other | | |
| (Dollars in Millions) | (Dollars in Millions) | Reserves | | Reserves | | Reserves | | Total | (Dollars in Millions) | Reserves | | Reserves | | Total |
| December 31, 2019 | $ | 187 | | | $ | 74 | | | $ | 44 | | | $ | 305 | |
| Charged to Expense | 55 | | | 20 | | | 32 | | | 107 | |
| | Payments | (46) | | | (18) | | | (34) | | | (98) | |
| December 31, 2020 | December 31, 2020 | 196 | | | 76 | | | 42 | | | 314 | |
| Assumed in Acquisition of Quality Carriers | Assumed in Acquisition of Quality Carriers | — | | | 29 | | | 33 | | | 62 | |
| Charged to Expense | Charged to Expense | 55 | | | 26 | | | 49 | | | 130 | |
| | Payments | |
| Payments | |
| Payments | Payments | (71) | | | (23) | | | (44) | | | (138) | |
| December 31, 2021 | December 31, 2021 | 180 | | | 108 | | | 80 | | | 368 | |
| Assumed in Acquisition of Pan Am | Assumed in Acquisition of Pan Am | 19 | | | 36 | | | — | | | 55 | |
| Charged to Expense | Charged to Expense | 45 | | | 47 | | | 51 | | | 143 | |
| | Payments | Payments | (50) | | | (30) | | | (50) | | | (130) | |
| Payments | |
| Payments | |
| December 31, 2022 | December 31, 2022 | $ | 194 | | | $ | 161 | | | $ | 81 | | | $ | 436 | |
| Charged to Expense | |
| | Payments | |
| Payments | |
| Payments | |
| December 31, 2023 | |
Personal injury and environmental reserves are considered critical accounting estimates due to the need for management judgment. In the table above, the impacts of changes in estimates are included in the charged to expense amount and were not material in 2023, 2022 2021 or 2020.and 2021. Casualty, environmental and other reserves are provided for in the consolidated balance sheets as shown in the table below.
| | | | December 2022 | | December 2021 | | December 2023 | | December 2022 |
| (Dollars in Millions) | (Dollars in Millions) | Current | | Long-term | | Total | | Current | | Long-term | | Total | (Dollars in Millions) | Current | | Long-term | | Total | | Current | | Long-term | | Total |
| Casualty: | Casualty: | | | | | | | | | | | | Casualty: | | | | | | | |
| Personal Injury | Personal Injury | $ | 40 | | | $ | 86 | | | $ | 126 | | | $ | 37 | | | $ | 81 | | | $ | 118 | |
| Occupational | Occupational | 10 | | | 58 | | | 68 | | | 7 | | | 55 | | | 62 | |
| Total Casualty | Total Casualty | $ | 50 | | | $ | 144 | | | $ | 194 | | | $ | 44 | | | $ | 136 | | | $ | 180 | |
| Environmental | Environmental | 53 | | | 108 | | | 161 | | | 37 | | | 71 | | | 108 | |
| Other | Other | 41 | | | 40 | | | 81 | | | 37 | | | 43 | | | 80 | |
| Total | Total | $ | 144 | | | $ | 292 | | | $ | 436 | | | $ | 118 | | | $ | 250 | | | $ | 368 | |
CSX 20222023 Form 10-K p.66p.70
CSX CORPORATION
PART II
Item 8. Financial Statements and Supplementary Data
NOTE 5. Casualty, Environmental and Other Reserves, continued
These liabilities are accrued when probable and reasonably estimable in accordance with the Contingencies Topic in the ASC. Actual settlements and claims received could differ and final outcomes of these matters cannot be predicted with certainty. Considering the legal defenses currently available, the liabilities that have been recorded and other factors, it is the opinion of management that none of these items individually, when finally resolved, will have a material adverse effect on the Company's financial condition, results of operations or liquidity. Should a number of these items occur in the same period, however, their combined effect could be material in that particular period.
Casualty
Casualty reserves of $194 million and $180 million for 2022and 2021, respectively, represent accruals for personal injury, occupational disease and occupational injury claims primarily related to railroad operations. Casualty reserves include liabilities assumed as a result of the Company's acquisition of Pan Am in 2022. Beginning June 1, 2021, theThe Company's self-insured retention amount for casualty claims increased from $75 million tois $100 million per occurrence. Currently, no individual claim is expected to exceed the self-insured retention amount. Most of the Company's casualty claims relate to CSXT. In accordance with the Contingencies Topic in the ASC, to the extent the value of an individual claim exceeds the self-insured retention amount, the Company would present the liability on a gross basis with a corresponding receivable for insurance recoveries.
These reserves fluctuate based upon the timing of payments as well as changes in estimate. Actual results may vary from estimates due to the number, type and severity of the injury, costs of medical treatments and uncertainties in litigation. Defense and processing costs, which historically have been insignificant and are anticipated to be insignificant in the future, are not included in the recorded liabilities. Changes in casualty reserves are included in purchased services and other on the consolidated income statements.
Personal Injury
Personal injury reserves represent liabilities for employee work-related and third-party injuries. Work-related injuries for CSXT employees are primarily subject to the Federal Employers' Liability Act ("FELA"). CSXT retains an independent actuary to assist management in assessing the value of personal injury claims. An analysis is performed by the actuary quarterly and is reviewed by management. The methodology used by the actuary includes a development factor to reflect growth or reduction in the value of these personal injury claims based largely on CSXT's historical claims and settlement experience. These analyses did not result in a material adjustment to the personal injury reserve in 2023, 2022 2021 or 2020.2021.
CSX 20222023 Form 10-K p.67p.71
CSX CORPORATION
PART II
Item 8. Financial Statements and Supplementary Data
NOTE 5. Casualty, Environmental and Other Reserves, continued
Occupational
Occupational reserves represent liabilities arising from allegations of exposure to certain materials in the workplace (such as solvents, soaps, chemicals and diesel fumes), past exposure to asbestos or allegations of chronic physical injuries resulting from work conditions (such as repetitive stress injuries). The Company retains an independent actuary to analyze the Company’s historical claims, settlement amounts, and dismissal rates to assist in determining future anticipated claim filing rates and average settlement values. This analysis is performed by the actuary and reviewed by management quarterly. There were no material adjustments to the occupational reserve in 2023, 2022 2021 or 2020.2021.
Environmental
Environmental reserves were $161 million and $108 million for 2022and2021, respectively. Environmental reserves include liabilities assumed as a result of the Company's acquisition of Pan Am in 2022 and Quality Carriers in 2021. The Company is a party to various proceedings related to environmental issues, including administrative and judicial proceedings involving private parties and regulatory agencies. The Company has been identified as a potentially responsible party at approximately 240230 environmentally impaired sites. Many of these are, or may be, subject to remedial action under the federal Comprehensive Environmental Response, Compensation and Liability Act of 1980 ("CERCLA"), also known as the Superfund Law, or similar state statutes. Most of these proceedings arose from environmental conditions on properties used for ongoing or discontinued railroad operations. A number of these proceedings, however, are based on allegations that the Company, or its predecessors, sent hazardous substances to facilities owned or operated by others for treatment, recycling or disposal. In addition, some of the Company’s land holdings were leased to others for commercial or industrial uses that may have resulted in releases of hazardous substances or other regulated materials onto the property and could give rise to proceedings against the Company. Environmental reserves include liabilities assumed as a result of the Company's acquisition of Pan Am in 2022 and Quality Carriers in 2021.
In any such proceedings, the Company is subject to environmental clean-up and enforcement actions under the Superfund Law, as well as similar state laws that may impose joint and several liability for clean-up and enforcement costs on current and former owners and operators of a site without regard to fault or the legality of the original conduct. These costs could be substantial.
CSX 20222023 Form 10-K p.68p.72
CSX CORPORATION
PART II
Item 8. Financial Statements and Supplementary Data
NOTE 5. Casualty, Environmental and Other Reserves, continued
In accordance with the Asset Retirement and Environmental Obligations Topic in the ASC, the Company reviews its role with respect to each site identified at least quarterly, giving consideration to a number of factors such as:
•type of clean-up required;
•nature of the Company’s alleged connection to the location (e.g., generator of waste sent to the site or owner or operator of the site);
•extent of the Company’s alleged connection (e.g., volume of waste sent to the location and other relevant factors); and
•number, connection and financial viability of other named and unnamed potentially responsible parties at the location.
Based on management's review process, amounts have been recorded to cover contingent anticipated future environmental remediation costs with respect to each site to the extent such costs are reasonably estimable and probable. The recorded liabilities for estimated future environmental costs are undiscounted. The liability includes future costs for remediation and restoration of sites as well as any significant ongoing monitoring costs, but excludes any anticipated insurance recoveries. Payments related to these liabilities are expected to be made over the next several years. Environmental remediation costs are included in purchased services and other on the consolidated income statements.
Currently, the Company does not possess sufficient information to reasonably estimate the amounts of additional liabilities, if any, on some sites until completion of future environmental studies. In addition, conditions that are currently unknown could, at any given location, result in additional exposure, the amount and materiality of which cannot presently be reasonably estimated. Based upon information currently available, however, the Company believes its environmental reserves accurately reflect the estimated cost of remedial actions currently required.
Other
Other reserves were $81 millioninclude liabilities for various claims, such as automobile, property, general liability, workers' compensation and $80 million for 2022 and 2021, respectively. Theselongshoremen disability claims. Other reserves include liabilities assumed as a result of the Company's acquisition of Pan Am in 2022 and Quality Carriers in 2021. Other reserves include liabilities for various claims, such as automobile, property, general liability, workers' compensation and longshoremen disability claims.
CSX 20222023 Form 10-K p.69p.73
CSX CORPORATION
PART II
Item 8. Financial Statements and Supplementary Data
NOTE 6. Properties
Details of the Company’s net properties are as follows:
| | (Dollars in Millions) | (Dollars in Millions) | | | | Accumulated | | Net Book | | Annual Depreciation | | Estimated Useful Life | | Depreciation | (Dollars in Millions) | | | | Accumulated | | Net Book | | Annual Depreciation | | Estimated Useful Life | | Depreciation |
| December 2022 | | Cost | | Depreciation | | Value | | Rate | | ( Avg. Years) | | Method |
| December 2023 | | December 2023 | | Cost | | Depreciation | | Value | | Rate | | (Avg. Years) | | Method |
| Road | Road | | | | |
| | |
| | |
| | | | Rail and Other Track Material | | $ | 8,660 | | | $ | (1,405) | | | $ | 7,255 | | | 2.5% | | 41 | | Group Life | | Rail and Other Track Material | | $ | 9,537 | | | $ | | $ | (1,978) | | | $ | | $ | 7,559 | | | 2.5% | | 2.5% | | 41 | | Group Life |
| | | | Ties | | 6,763 | | | (2,010) | | | 4,753 | | | 3.5% | | 28 | | Group Life | | | Ties | | 7,020 | | | (2,131) | | (2,131) | | | 4,889 | | 4,889 | | | 3.5% | | 3.5% | | 28 | | Group Life |
| | | | Grading | | 2,741 | | | (637) | | | 2,104 | | | 1.3% | | 75 | | Group Life | | | Grading | | 2,796 | | | (668) | | (668) | | | 2,128 | | 2,128 | | | 1.3% | | 1.3% | | 75 | | Group Life |
| | | | Ballast | | 3,383 | | | (1,130) | | | 2,253 | | | 2.6% | | 38 | | Group Life | | | Ballast | | 3,424 | | | (1,119) | | (1,119) | | | 2,305 | | 2,305 | | | 2.6% | | 2.6% | | 38 | | Group Life |
| | | | Bridges, Trestles, and Culverts | | 2,989 | | | (454) | | | 2,535 | | | 1.7% | | 60 | | Group Life | | | Bridges, Trestles, and Culverts | | 3,121 | | | (525) | | (525) | | | 2,596 | | 2,596 | | | 1.7% | | 1.7% | | 60 | | Group Life |
| | | | Signals and Interlockers | | 3,299 | | | (1,210) | | | 2,089 | | | 4.1% | | 24 | | Group Life | | | Signals and Interlockers | | 3,376 | | | (1,351) | | (1,351) | | | 2,025 | | 2,025 | | | 4.1% | | 4.1% | | 24 | | Group Life |
| | | | Buildings | | 1,416 | | | (558) | | | 858 | | | 2.5% | | 40 | | Group Life/ Straight Line (a) | | | Buildings | | 1,530 | | | (608) | | (608) | | | 922 | | 922 | | | 2.5% | | 2.5% | | 40 | | Group Life/ Straight Line (a) |
| | | | Other | | 5,541 | | | (2,323) | | | 3,218 | | | 4.1% | | 25 | | Group Life/ Straight Line (a) | | | Other | | 5,786 | | | (2,546) | | (2,546) | | | 3,240 | | 3,240 | | | 4.1% | | 4.1% | | 25 | | Group Life/ Straight Line (a) |
| Total Road | Total Road | | 34,792 | | | (9,727) | | | 25,065 | | | | | | Total Road | | 36,590 | | | (10,926) | | (10,926) | | | 25,664 | | 25,664 | | | | | | | | | |
| Equipment | Equipment | | | | | | | | | | | | | Equipment | | | | | | |
| | | | Locomotive | | 4,848 | | | (1,856) | | | 2,992 | | | 3.8% | | 26 | | Group Life | | | Locomotive | | 4,952 | | | (1,981) | | (1,981) | | | 2,971 | | 2,971 | | | 3.8% | | 3.8% | | 26 | | Group Life |
| | | | Freight Cars | | 2,316 | | | (369) | | | 1,947 | | | 3.1% | | 32 | | Group Life | | | Freight Cars | | 2,300 | | | (378) | | (378) | | | 1,922 | | 1,922 | | | 3.1% | | 3.1% | | 32 | | Group Life |
| | | | Work Equipment and Other | | 3,132 | | | (1,911) | | | 1,221 | | | 8.9% | | 11 | | Group Life/ Straight Line (a) | | | Work Equipment and Other | | 3,391 | | | (2,100) | | (2,100) | | | 1,291 | | 1,291 | | | 8.9% | | 8.9% | | 11 | | Group Life/ Straight Line (a) |
| Total Equipment | Total Equipment | | 10,296 | | | (4,136) | | | 6,160 | | | | | | Total Equipment | | 10,643 | | | (4,459) | | (4,459) | | | 6,184 | | 6,184 | | | | | | | | | |
| Land | Land | | | | 2,272 | | | — | | | 2,272 | | | N/A | | N/A | | N/A | Land | | | | 2,272 | | | — | | — | | | 2,272 | | 2,272 | | | N/A | | N/A |
| Construction In Progress | Construction In Progress | | 745 | | | — | | | 745 | | | N/A | | N/A | | N/A | Construction In Progress | | 815 | | | — | | — | | | 815 | | 815 | | | N/A | | N/A |
| | Total Properties | Total Properties | | $ | 48,105 | | | $ | (13,863) | | | $ | 34,242 | | | | | | | |
| Total Properties | |
| Total Properties | | | $ | 50,320 | | | $ | (15,385) | | | $ | 34,935 | | | | | |
(a) For depreciation method, certain asset categories contain intermodal terminals, trucking or technology-related assets, which are depreciated using the straight-line method.
CSX 20222023 Form 10-K p.70p.74
CSX CORPORATION
PART II
Item 8. Financial Statements and Supplementary Data
NOTE 6. Properties, continued
| | (Dollars in Millions) | (Dollars in Millions) | | | | Accumulated | | Net Book | | Annual Depreciation | | Estimated Useful Life | | Depreciation | (Dollars in Millions) | | | | Accumulated | | Net Book | | Annual Depreciation | | Estimated Useful Life | | Depreciation |
| December 2021 | | Cost | | Depreciation | | Value | | Rate | | (Avg. Years) | | Method |
| December 2022 | | December 2022 | | Cost | | Depreciation | | Value | | Rate | | (Avg. Years) | | Method |
| Road | Road | | | | |
| | |
| | |
| | | | Rail and Other Track Material | | $ | 8,761 | | | $ | (1,835) | | | $ | 6,926 | | | 2.5% | | 41 | | Group Life | | Rail and Other Track Material | | $ | 8,660 | | | $ | | $ | (1,405) | | | $ | | $ | 7,255 | | | 2.5% | | 2.5% | | 41 | | Group Life |
| | | | Ties | | 6,522 | | | (1,923) | | | 4,599 | | | 3.5% | | 28 | | Group Life | | | Ties | | 6,763 | | | (2,010) | | (2,010) | | | 4,753 | | 4,753 | | | 3.5% | | 3.5% | | 28 | | Group Life |
| | | | Grading | | 2,751 | | | (624) | | | 2,127 | | | 1.3% | | 75 | | Group Life | | | Grading | | 2,741 | | | (637) | | (637) | | | 2,104 | | 2,104 | | | 1.3% | | 1.3% | | 75 | | Group Life |
| | | | Ballast | | 3,289 | | | (1,094) | | | 2,195 | | | 2.6% | | 38 | | Group Life | | | Ballast | | 3,383 | | | (1,130) | | (1,130) | | | 2,253 | | 2,253 | | | 2.6% | | 2.6% | | 38 | | Group Life |
| | | | Bridges, Trestles, and Culverts | | 2,794 | | | (411) | | | 2,383 | | | 1.7% | | 60 | | Group Life | | | Bridges, Trestles, and Culverts | | 2,989 | | | (454) | | (454) | | | 2,535 | | 2,535 | | | 1.7% | | 1.7% | | 60 | | Group Life |
| | | | Signals and Interlockers | | 3,266 | | | (1,086) | | | 2,180 | | | 4.1% | | 24 | | Group Life | | | Signals and Interlockers | | 3,299 | | | (1,210) | | (1,210) | | | 2,089 | | 2,089 | | | 4.1% | | 4.1% | | 24 | | Group Life |
| | | | Buildings | | 1,388 | | | (514) | | | 874 | | | 2.5% | | 40 | | Group Life/ Straight Line (a) | | | Buildings | | 1,416 | | | (558) | | (558) | | | 858 | | 858 | | | 2.5% | | 2.5% | | 40 | | Group Life/ Straight Line (a) |
| | | | Other | | 5,305 | | | (2,207) | | | 3,098 | | | 4.1% | | 25 | | Group Life/ Straight Line (a) | | | Other | | 5,541 | | | (2,323) | | (2,323) | | | 3,218 | | 3,218 | | | 4.1% | | 4.1% | | 25 | | Group Life/ Straight Line (a) |
| Total Road | Total Road | | 34,076 | | | (9,694) | | | 24,382 | | | | | | Total Road | | 34,792 | | | (9,727) | | (9,727) | | | 25,065 | | 25,065 | | | | | | | | | |
| Equipment | Equipment | | | | | | | | | | | | | Equipment | | | | |
| | | | Locomotive | | 4,912 | | | (1,732) | | | 3,180 | | | 3.6% | | 27 | | Group Life | | | Locomotive | | 4,848 | | | (1,856) | | (1,856) | | | 2,992 | | 2,992 | | | 3.8% | | 3.8% | | 26 | | Group Life |
| | | | Freight Cars | | 2,322 | | | (358) | | | 1,964 | | | 2.9% | | 35 | | Group Life | | | Freight Cars | | 2,316 | | | (369) | | (369) | | | 1,947 | | 1,947 | | | 3.1% | | 3.1% | | 32 | | Group Life |
| | | | Work Equipment and Other | | 2,891 | | | (1,706) | | | 1,185 | | | 8.2% | | 12 | | Group Life/ Straight Line (a) | | | Work Equipment and Other | | 3,132 | | | (1,911) | | (1,911) | | | 1,221 | | 1,221 | | | 8.9% | | 8.9% | | 11 | | Group Life/ Straight Line (a) |
| Total Equipment | Total Equipment | | 10,125 | | | (3,796) | | | 6,329 | | | | | | Total Equipment | | 10,296 | | | (4,136) | | (4,136) | | | 6,160 | | 6,160 | | | | | | | | | |
| Land | Land | | | | 1,885 | | | — | | | 1,885 | | | N/A | | N/A | | N/A | Land | | | | 2,272 | | | — | | — | | | 2,272 | | 2,272 | | | N/A | | N/A |
| Construction In Progress | Construction In Progress | | 419 | | | — | | | 419 | | | N/A | | N/A | | N/A | Construction In Progress | | 745 | | | — | | — | | | 745 | | 745 | | | N/A | | N/A |
| | Total Properties | Total Properties | | $ | 46,505 | | | $ | (13,490) | | | $ | 33,015 | | | | | | | |
| Total Properties | |
| Total Properties | | | $ | 48,105 | | | $ | (13,863) | | | $ | 34,242 | | | | | |
(a) For depreciation method, certain asset categories contain intermodal terminals, trucking or technology-related assets, which are depreciated using the straight-line method.
CSX 20222023 Form 10-K p.71p.75
CSX CORPORATION
PART II
Item 8. Financial Statements and Supplementary Data
NOTE 6. Properties, continued
Capital Expenditures
The Company’s capital investment includes purchased and self-constructed assets and property additions that substantially extend the service life or increase the utility of those assets. Indirect costs that can be specifically traced to capital projects are also capitalized. The Company is committed to maintaining and improving its existing infrastructure and expanding its network capacity for long-term growth. Rail operations are capital intensive and CSX accounts for these costs in accordance with GAAPUnited States generally accepted accounting principles ("GAAP") and the Company’s capitalization policy. All properties are stated at historical cost less an allowance for accumulated depreciation.
The Company’s largest category of capital investment is the replacement of track assets, andwhich is primarily completed by CSXT employees, as well as the acquisition or construction of new assets that enable CSX to enhance its operations or provide new capacity offerings to its customers. These construction projects are primarily completed by CSXT employees.Costs for track asset replacement and capacity projects that are capitalized include:
•labor costs, because many of the assets are self-constructed;
•costs to purchase or construct new track or to prepare ground for the laying of track;
•welding (rail, field and plant), which are processes used to connect segments of rail;
•new ballast, which is gravel and crushed stone that holds track in line;
•fuels and lubricants associated with tie, rail and surfacing work, which is the process of raising track to a designated elevation over an extended distance;
•cross, switch and bridge ties, which are the braces that support the rails on a track;
•gauging, which is the process of standardizing the distance between rails;
•handling costs associated with installing rail, ties or ballast;
•usage charge of machinery and equipment utilized in construction or installation; and
•other track materials.
Labor is a significant cost in self-constructed track replacement work. CSXT engineering employees directly charge their labor to the track replacement project (the capitalized depreciable property). In replacing track, these employees concurrently perform deconstruction and installation of track material. Because of this concurrent process, CSX must estimate the amount of labor that is related to deconstruction versus installation. As a component of the depreciation study for road and track assets, management performs an analysis of labor costs related to the self-constructed track replacement work, which includes direct observation of track replacement processes. Through this analysis, CSX determined that approximately 20% of labor costs associated with track replacement is related to the deconstruction of old track, for which certain elements are expensed, and 80% is associated with the installation of new track, which is capitalized.
Capital investment related to locomotives and freight cars comprises the second largest category of the Company’s capital assets. This category includes purchases of locomotives and freight cars as well as certain equipment leases that are considered to be finance leases in accordance with the Leases Topic in the ASC. In addition, costs to modify or rebuild these assets, which are capitalized if the investment incurred extends the asset’s service life or improves utilization. Improvement projects must meet specified dollar thresholds to be capitalized and are reviewed by management to determine proper accounting treatment. Routine repairs, overhauls and other maintenance costs, for all asset categories, are expensed as incurred.
CSX 20222023 Form 10-K p.72p.76
CSX CORPORATION
PART II
Item 8. Financial Statements and Supplementary Data
NOTE 6. Properties, continued
Depreciation Method
The depreciable assets of the Company are depreciated using either the group-life or straight-line method of accounting, which are both acceptable depreciation methods in accordance with GAAP. The Company depreciates its railroad assets, including main-line track, locomotives and freight cars, using the group-life method. Assets depreciated under the group-life method comprise 84% of total fixed assets of $48.1$50.3 billion on a gross basis as of December 2022.2023. The remaining depreciable assets of the Company, including non-railroad assets and assets under finance leases, are depreciated using the straight-line method on a per asset basis. Land is not depreciated.
The group-life method aggregates assets with similar lives and characteristics into groups and depreciates each of these groups as a whole. When using the group-life method, an underlying assumption is that each group of assets, as a whole, is used and depreciated to the end of its group’s recoverable life. The Company currently utilizes different depreciable asset categories to account for depreciation expense for the railroad assets that are depreciated under the group-life method. By utilizing various depreciable categories, the Company can more accurately account for the use of its assets. All assets of the Company are depreciated on a time or life basis.
The group-life method of depreciation closely approximates the straight-line method of depreciation. Additionally, due to the nature of most of its assets (e.g. track is one contiguous, connected asset), the Company believes that this is the most accurate and effective way to properly depreciate its assets.
Depreciation Studies
Management performs a review of depreciation expense and useful lives on a regular basis. Under the group-life method, the service lives and salvage values for each group of assets are determined by completing periodic depreciation studies and applying management’s methods to determine the service lives of its properties. A depreciation study is the periodic review of asset service lives, salvage values, accumulated depreciation, and other related factors for group assets conducted by a third-party specialist, analyzed by the Company’s management and approved by the STB,Surface Transportation Board ("STB"), the regulatory board that has broad jurisdiction over railroad practices. The STB requires depreciation studies be performed every three years for equipment assets (e.g., locomotives and freight cars) and every six years for road and track assets (e.g., bridges, signals, rail, ties, and ballast). The Company believes the frequency of depreciation studies currently required by the STB, complemented by annual data reviews conducted by a third-party specialist and analyzed by the Company's management, provides adequate review of asset service lives and that a more frequent review would not result in a material change due to the long-lived nature of most of the assets.
The Company completed a depreciation study for its road and track assets in 2020 and for equipment assets in 2022, both of which resulted in changes to accumulated depreciation, service lives, salvage values, and other related factors for certain assets. The 2022 equipment study resulted in an expected increase in annual depreciation expense of approximately $80 million primarily due to deferred losses on assets depreciated using the group-life method. Recent experience withA depreciation studies has resultedstudy was not performed in changes to accumulated depreciation and depreciation rates that did not materially affect the Company's depreciation expense of $1.4 billion in both 2021 and 2020.
2023.
CSX 20222023 Form 10-K p.73p.77
CSX CORPORATION
PART II
Item 8. Financial Statements and Supplementary Data
NOTE 6. Properties, continued
Group-Life Assets Sales and Retirements
Since the rail network is one contiguous, connected network it is impractical to maintain specific identification records for these assets. For track assets (e.g., rail, ties, and ballast), CSX utilizesretires assets on a first-in, first-out approachstatistical curve relative to asset retirements.the age of the assets. Equipment assets (e.g., locomotives and freight cars) are specifically identified at retirement. When an equipment asset is retired that has been depreciated using the group-life method, the cost is reduced from the cost base and recorded in accumulated depreciation.
For sales or retirements of assets depreciated under the group-life method that occur in the ordinary course of business, the asset cost (net of salvage value or sales proceeds) is charged to accumulated depreciation and no gain or loss is immediately recognized. This practice is consistent with accounting treatment prescribed under the group-life method. As part of the depreciation study, an assessment of the recorded amount of accumulated depreciation is made to determine if it is deficient (or in excess) of the appropriate amount indicated by the study. Any such deficiency (or excess), including any deferred gains or losses, is amortized as a component of depreciation expense over the remaining service life of the asset group until the next required depreciation study. Since the overall assumption with the group-life method is that the assets within the group on average have the same service life and characteristics, it is therefore concluded that the deferred gains and losses offset over time.
For sales or retirements of assets depreciated under the group-life method that do not occur in the ordinary course of business, a gain or loss may be recognized if the sale or retirement meets each of the following three criteria: (i) it is unusual, (ii) it is material in amount, and (iii) it varies significantly from the retirement profile identified through our depreciation studies. No material gains or losses were recognized on the sale of assets depreciated using the group-life method in 2023, 2022 2021 or 2020,2021, as no sales met the criteria described above.
Land and Straight-line Assets Sales and Retirements
When the Company sells or retires land, land-related easements or assets depreciated under the straight-line method, a gain or loss is recognized in purchased services and other on the consolidated statements of income. Primarily as a result of its initiative to monetize non-core properties, the Company recognized gains on the sale of properties of $34 million, $238 million, and $454 million in 2023, 2022 and $35 million2021, respectively. Gains in 2022 and 2021 and 2020, respectively.include amounts from the Virginia transaction discussed below.
Sale of Property Rights to the Commonwealth of Virginia
On March 26, 2021, the Company entered into a comprehensive agreement to sell certain property rights in three CSX-owned line segments to the Commonwealth of Virginia (“Commonwealth”) over three phases for a total of $525 million.phases. The timing and amount of gains recognized were based on the allocation of fair value to each conveyance, the timing of future conveyances and collectability. In April 2021, upon closing of the first phase of the agreement, the Company collected $200 million in proceeds and recognized a $349 million gain. In fourth quarter 2021, the Company collected additional proceeds of $200 million, a portion of which was attributable to the first phase with the remainder attributable to the second phase. The second phase closed in January 2022, which resulted in a $20 million gain in first quarter 2022. During June 2022, the Commonwealth approved the remaining proceeds, which resulted in a $122 million gain in second quarter 2022 related to property rights previously conveyed. Those remaining proceeds of $125 million were collected during fourth quarter 2022 upon closing of the third phase, resulting in a $2 million gain. Over the course of this transaction, which is now complete,was completed in 2022, total proceeds of $525 million have beenwere collected and total gains of $493 million have beenwere recognized. Gains and proceeds related to this transaction are summarized in the following table.
| | | | | | | | | | | | | | |
| | Years Ended |
| (Dollars in Millions) | | 2023 | 2022 | 2021 |
| Gains | | $ | — | | $ | 144 | | $ | 349 | |
| Proceeds | | — | | 125 | | 400 |
CSX 20222023 Form 10-K p.74p.78
CSX CORPORATION
PART II
Item 8. Financial Statements and Supplementary Data
NOTE 6. Properties, continued
Gains and proceeds in 2022 and 2021 related to this transaction are summarized in the following table.
| | | | | | | | | | | |
| | Years Ended |
| (Dollars in Millions) | | 2022 | 2021 |
| Gains | | $ | 144 | | $ | 349 | |
| Proceeds | | 125 | | 400 |
Impairment Review
Properties and other long-lived assets are reviewed for impairment whenever events or business conditions indicate the carrying amount of such assets may not be fully recoverable. Initial assessments of recoverability are based on estimates of undiscounted future net cash flows associated with an asset or a group of assets in accordance with the Property, Plant, and Equipment Topic in the ASC. Where impairment is indicated, the assets are evaluated and their carrying amount is reduced to fair value based on discounted net cash flows or other estimates of fair value. Impairment expense of $2 million in 2023, $4 million in 2022, and $2 million in 2021 and $8 million in 2020 was primarily due to the discontinuation of certain in-progress projects. Impairment expense is recorded in purchased services and other expense on the consolidated income statement.
Government Assistance
The Company is a party to contracts with recipients and subrecipients of awards from federal, state and local governmental agencies. These contracts meet the disclosure requirements under ASU 2021-10, Disclosure by Business Entities about Government Assistance, which the Company adopted effective year end 2022. These awards are typically in the form of cash for purposes of making improvements to the rail network as part of public safety, corridor expansion or economic revitalization initiatives. The awarding agency generally specifies how the awards are to be spent by the recipients and may include limited conditions requiring return of the assistance.
Government funding received or receivable related to a property asset is netted with the cost of the asset in properties on the consolidated balance sheet, and the net asset is subject to depreciation. Any amounts owed by the government entity are recorded within accounts receivable until reimbursed. For the years ended December 31, 2022,2023, and December 31, 2021,2022, the total amounts received under contracts with government entities to improve the rail network was $49$84 million and $66$49 million, respectively. Non-freight accounts receivable related to these government projects was $34$57 million and $7$34 million as of December 31, 2022,2023, and 2021,December 31, 2022, respectively.
CSX 20222023 Form 10-K p.75p.79
CSX CORPORATION
PART II
Item 8. Financial Statements and Supplementary Data
NOTE 7. Leases
At inception, the Company determines if an arrangement contains a lease and whether that lease meets the classification criteria of a finance or operating lease. Some of the Company’s lease arrangements contain lease components (e.g., minimum rent payments) and non-lease components (e.g., maintenance, labor charges, etc.). The Company generally accounts for each component separately based on the estimated standalone price of each component. For certain equipment leases, such as freight car, vehicles and work equipment, the Company accounts for the lease and non-lease components as a single lease component.
Certain of the Company’s lease agreements include rental payments that are adjusted periodically for an index or rate. The leases are initially measured using the projected payments adjusted for the index or rate in effect at the commencement date. The Company’s lease agreements do not contain any material residual value guarantees or material restrictive covenants.
Operating Leases
Operating leases are included in right-of-use lease assets, other current liabilities and long-term lease liabilities on the consolidated balance sheets. These assets and liabilities are recognized at the commencement date based on the present value of remaining lease payments over the lease term using the Company’s secured incremental borrowing rates or implicit rates, when readily determinable. Short-term operating leases, which have an initial term of 12 months or less, are not recorded on the balance sheet.
The Company has various lease agreements with other parties with terms up to 50 years.years, including a significant operating lease with the State of Georgia for approximately 137 miles of right-of-way with integral equipment for a term of 50 years with an annual 2.5% increase. Non-cancelable, long-term leases may include provisions for maintenance, options to purchase and options to extend the terms. These options are included in the lease term when it is reasonably certain that the option will be exercised. Lease expense for operating leases, including leases with escalations over their terms, is recognized on a straight-line basis over the lease term. Variable lease expense is recognized in the period in which the obligation for those payments is incurred. Lease expense is included in equipment and other rents on the consolidated income statements and is reported net of lease income. Lease income was not material to the results of operations for 2023, 2022 2021 or 2020.2021.
CSX 20222023 Form 10-K p.76p.80
CSX CORPORATION
PART II
Item 8. Financial Statements and Supplementary Data
NOTE 7. Leases, continued
CSX has a significant operating lease with the State of Georgia for approximately 137 miles of right-of-way with integral equipment for a term of 50 years with an annual 2.5% increase. The following table presents information about the amount, timing and uncertainty of cash flows arising from all of the Company’s operating leases as of December 31, 20222023.
| | (Dollars in Millions) | (Dollars in Millions) | December 2022 | (Dollars in Millions) | December 2023 |
| Maturity of Lease Liabilities | Maturity of Lease Liabilities | Lease Payments | Maturity of Lease Liabilities | Lease Payments |
| 2023 | $ | 71 | |
| 2024 | 2024 | 62 | |
| 2025 | 2025 | 55 | |
| 2026 | 2026 | 41 | |
| 2027 | 2027 | 35 | |
| 2028 | |
| Thereafter | Thereafter | 1,122 | |
| Total Undiscounted Operating Lease Payments | Total Undiscounted Operating Lease Payments | $ | 1,386 | |
| Less: Imputed Interest | Less: Imputed Interest | (829) | |
| Present Value of Operating Lease Liabilities | Present Value of Operating Lease Liabilities | $ | 557 | |
|
| | (Dollars in Millions) | (Dollars in Millions) | 2022 | 2021 | (Dollars in Millions) | 2023 | 2022 |
| Balance Sheet Classification | Balance Sheet Classification | |
| Right of Use Asset | Right of Use Asset | $ | 505 | | $ | 501 | |
| Right of Use Asset | |
| Right of Use Asset | |
| | Current Lease Liabilities (Included in Other Current Liabilities) | |
| Current Lease Liabilities (Included in Other Current Liabilities) | |
| Current Lease Liabilities (Included in Other Current Liabilities) | Current Lease Liabilities (Included in Other Current Liabilities) | $ | 69 | | $ | 64 | |
| Long-term Lease Liabilities | Long-term Lease Liabilities | 488 | | 478 | |
| Total Operating Lease Liabilities | Total Operating Lease Liabilities | $ | 557 | | $ | 542 | |
| | Other Information | Other Information | |
| Other Information | |
| Other Information | |
| Weighted-average Remaining Lease Term for Operating Leases | |
| Weighted-average Remaining Lease Term for Operating Leases | |
| Weighted-average Remaining Lease Term for Operating Leases | Weighted-average Remaining Lease Term for Operating Leases | 31 years | 32 years | 30 years | 31 years |
| Weighted-average Discount Rate for Operating Leases | Weighted-average Discount Rate for Operating Leases | 5.0 | % | 4.9 | % | Weighted-average Discount Rate for Operating Leases | 5.1 | % | 5.0 | % |
Cash Flows
As of December 20222023 and 2021,2022, the Company's right-of-use asset was valued at $498 million and $505 million, and $501respectively. In 2023, right of use assets of $56 million respectively.were recognized as non-cash asset additions due to new operating lease liabilities. In 2022, right-of-use assets of $74 million were recognized as non-cash asset additions due to new operating lease liabilities. In 2021, right-of-use assets of $88 million were recognized as non-cash asset additions that resulted from the inclusion of Quality Carriers’ leases and new operating lease liabilities. Cash paid for amounts included in the present value of operating lease liabilities was $76$78 million and $60$76 million during the years ended 20222023 and 2021,2022, respectively, and is included in operating cash flows.
CSX 20222023 Form 10-K p.77p.81
CSX CORPORATION
PART II
Item 8. Financial Statements and Supplementary Data
NOTE 7. Leases, continued
Operating Lease Costs
These costs are primarily related to long-term operating leases, but also include immaterial amounts for variable leases and short-term leases with terms greater than 30 days. These amounts are shown in the table below.
| | | | Years Ended | | Years Ended |
| (Dollars in Millions) | (Dollars in Millions) | 2022 | | 2021 | | 2020 | (Dollars in Millions) | 2023 | | 2022 | | 2021 |
| Rent Expense on Operating Leases | Rent Expense on Operating Leases | $ | 109 | | | $ | 89 | | | $ | 82 | |
Finance Leases
Finance leases are included in properties - net and long-term debt on the consolidated balance sheets and were not material as of December 20222023 or December 2021.2022. The associated amortization expense and interest expense are included in depreciation and interest expense, respectively, on the consolidated income statements and were not material to the results of operations for 2023, 2022 2021 or 2020.2021.
NOTE 8. Commitments and Contingencies
Purchase Commitments
CSXT's long-term locomotive maintenance program agreement with a third party contains commitments related to specific locomotive rebuilds and a long-term maintenance program that covers a portion of CSXT’s fleet of locomotives. The maintenance program costs are based on the maintenance cycle for each covered locomotive, which is determined by the asset's age and type. Expected future costs may change as required maintenance schedules are revised and locomotives are placed into or removed from service. Under CSXT’s current obligations, the agreement will expire no earlier than 2035.
The following table summarizes the number of locomotives covered and CSXT’s payments, including prepayments, underfor the long-term maintenance program.program which covers approximately 1,900 locomotives with payments based on active status during the period.
| | | | Years Ended | | Years Ended (a) |
| (Dollars in Millions) | (Dollars in Millions) | 2022 | | 2021 | | 2020 | (Dollars in Millions) | 2023 | | 2022 | | 2021 |
| Amounts Paid | Amounts Paid | $ | 128 | | | $ | 99 | | | $ | 158 | |
| Number of Locomotives | 1,871 | | | 1,863 | | | 1,874 | |
(a) The 2022 amount has been updated to include prepayments of $40 million.
CSX 20222023 Form 10-K p.78p.82
CSX CORPORATION
PART II
Item 8. Financial Statements and Supplementary Data
NOTE 8. Commitments and Contingencies, continued
The total of annual payments under the agreement, including those related to locomotive rebuilds and the long-term locomotive maintenance program, are estimated in the table below.
Additionally, the Company has various other commitments to purchase technology, communications, track maintenance services and materials, and other services from various suppliers. Total annual payments under all of these purchase commitments are also estimated in the table below.
| | (Dollars in Millions) | (Dollars in Millions) | Locomotive Maintenance & Rebuild Payments | | Other
Commitments | | Total | (Dollars in Millions) | Locomotive Maintenance & Rebuild Payments | | Other
Commitments | | Total |
| 2023 | $ | 220 | | | $ | 110 | | | $ | 330 | |
| 2024 | 2024 | 308 | | | 39 | | | 347 | |
| 2025 | 2025 | 328 | | | 40 | | | 368 | |
| 2026 | 2026 | 241 | | | 15 | | | 256 | |
| 2027 | 2027 | 329 | | | 17 | | | 346 | |
| 2028 | |
| Thereafter | Thereafter | 1,519 | | | 68 | | | 1,587 | |
| Total | Total | $ | 2,945 | | | $ | 289 | | | $ | 3,234 | |
Insurance
The Company maintains insurance programs with substantial limits for property damage, including resulting business interruption, and third-party liability. A certain amount of risk is retained by the Company on each insurance program. Under its property insurance program, the Company retains all risk up to $100 million per occurrence for losses from floods and named windstorms and up to $75 million per occurrence for other property losses. For third-party liability claims, the Company retains all risk up to $100 million per occurrence. As CSX negotiates insurance coverage above its full self-retention amounts, it retains a percentage of risk at various layers of coverage. While the Company believes its insurance coverage is adequate, future claims could exceed existing insurance coverage or insurance may not continue to be available at commercially reasonable rates.
Legal
The Company is involved in litigation incidental to its business and is a party to a number of legal actions and claims, various governmental proceedings and private civil lawsuits, including, but not limited to, those related to fuel surcharge practices, tax matters, environmental and hazardous material exposure matters, FELA and labor claims by current or former employees, other personal injury or property claims and disputes and complaints involving certain transportation rates and charges. Some of the legal proceedings include claims for compensatory as well as punitive damages and others are, or are purported to be, class actions. While the final outcomeoutcomes of these matters cannot be predicted with certainty, considering, among other things, the legal defenses available and liabilities that have been recorded along with applicable insurance, it is currently the opinion of management that none of these pending items willis likely to have a material adverse effect on the Company's financial condition, results of operations or liquidity. An unexpected adverse resolution of one or more of these items, however, could have a material adverse effect on the Company's financial condition, results of operations or liquidity in that particular period.
CSX 20222023 Form 10-K p.79p.83
CSX CORPORATION
PART II
Item 8. Financial Statements and Supplementary Data
NOTE 8. Commitments and Contingencies, continued
The Company is able to estimate a range of possible loss for certain legal proceedingsmatters for which a loss is reasonably possible in excess of reserves established. The Company has estimated this range to be $3 million to $21$55 million in the aggregate as of December 31, 2022.2023. This estimated aggregate range is based upon currently available information and is subject to significant judgment and a variety of assumptions. Accordingly, the Company's estimate will change from time to time, and actual losses may vary significantly from the current estimate.
Fuel Surcharge Antitrust Litigation
In May 2007, class action lawsuits were filed against CSXT and three other U.S.-based Class I railroads alleging that the defendants' fuel surcharge practices relating to contract and unregulated traffic resulted from an illegal conspiracy in violation of antitrust laws. The class action lawsuits were consolidated into one case in federal court in the District of Columbia. In 2017, the District Court issued its decision denying class certification. On August 16, 2019, the U.S. Court of Appeals for the D.C. Circuit affirmed the District Court’s ruling.
The consolidated case is now moving forward without class certification. Although the class was not certified, individual shippers have since brought claims against the railroads, which have been consolidated into a separate case.
CSXT believes that its fuel surcharge practices were arrived at and applied lawfully and that the case is without merit. Accordingly, the Company intends to defend itself vigorously. However, penalties for violating antitrust laws can be severe, and resolution of these matters individually or when aggregated could have a material adverse effect on the Company's financial condition, results of operations or liquidity in that particular period.
Environmental
CSXT is indemnifying Pharmacia LLC, formerly known as Monsanto Company, ("Pharmacia") for certain liabilities associated with real estate located in Kearny, New Jersey along the Lower Passaic River (the “Property”). The Property, which was formerly owned by Pharmacia, is now owned by CSXT. CSXT's indemnification and defense duties arise with respect to several matters. The U.S. Environmental Protection Agency ("EPA"), using its CERCLA authority, seeks the investigation and cleanup of hazardous substances in the 17-mile Lower Passaic River Study Area (the "Study Area”). CSXT, on behalf of Pharmacia, and a significant number of other potentially responsible parties are together conducting a Remedial Investigation and Feasibility Study of the Study Area pursuant to an Administrative Settlement Agreement and Order on Consent with the EPA. Pharmacia’s share of responsibility, indemnified by CSXT, for the investigation and cleanup costs of the Study Area may be determined through various mechanisms including (a) an allocation and settlement with EPA; (b) litigation brought by EPA against non-settling parties; or (c) litigation among the responsible parties.
CSX 20222023 Form 10-K p.80p.84
CSX CORPORATION
PART II
Item 8. Financial Statements and Supplementary Data
NOTE 8. Commitments and Contingencies, continued
For the lower 8eight miles of the Study Area, EPA issued its Record of Decision detailing the agency’s mandated remedial process in March 2016. Approximately 80Occidental Chemical Corporation ("Occidental") is performing the remedial design for the lower eight-mile portion of the Study Area pursuant to a consent order with EPA.
For the remaining upper nine miles of the Study Area, EPA selected an interim remedy in a Record of Decision dated September 28, 2021. On March 2, 2023, EPA issued an administrative order requiring Occidental to design the interim remedy for the upper nine miles of the Study Area.
Potentially responsible parties, including Pharmacia, are participating in an EPA-directed allocation and settlement process to assign responsibility for the remedy selected forrelated to the lower 8 miles ofriver and the entire Study Area.Area, respectively. CSXT is participatingparticipated in the EPA-directed allocation and settlement process on behalf of Pharmacia. For the remainder of the Study Area, EPA has selected an interim remedy in a Record of Decision dated September 28, 2021. Settlement discussions are also ongoing for the selected interim remedy.
On March 2, 2022, EPA issued a Notice Letter to Pharmacia, Occidental Chemical Corporation and eight other parties alleging they are liable under Section 107(a) of CERCLA for releases or threatened releases of hazardous substances and requesting each party, individually or collectively, submit good faith offers to EPA in connection with the entire Study Area. CSX,CSXT, on behalf of Pharmacia, responded to the Notice Letter and submitted a good faith offer to EPA on June 27, 2022, following meetings with a mediator from EPA’s Conflict Prevention and Resolution Center. On November 21, 2023, EPA notified the United States District Court for the District of New Jersey that it intended to move to enter a Consent Decree (“CD”) with a group of potentially responsible parties. On January 31, 2024, EPA filed a motion to enter a modified CD with 82 potentially responsible parties, requiring payment of $150 million to resolve their liability with respect to the entire Study Area. Pharmacia is not a participant in the CD settlement. Negotiations with EPA and other parties to resolve this matterPharmacia's liability continue.
CSXT is also defending and indemnifying Pharmacia with regard to the Property in litigation filed by Occidental, Chemical Corporation, which is seeking to recover various costs. These costs include costs for the remedial design of the lower 8 miles of the Study Area, as well as anticipatedits past and future costs associated with the future remediation of the entire Study Area. Alternatively, Occidental seeks to compel some, or all, of the defendants to participate in the remediation of the Study Area. Pharmacia is one of approximately 110 defendants in thisa federal lawsuit filed by Occidental on June 30, 2018.2018, and one of 37 defendants in a federal lawsuit filed by Occidental on March 24, 2023. CSXT is also defending and indemnifying Pharmacia in a cooperative natural resource damages assessment process related to the Property.
Based on currently available information, the Company does not believe its share of remediation costs as determined by the EPA-directed allocation with respect to the Property and the Study Area would be material to the Company's financial condition, results of operations or liquidity.
CSX 20222023 Form 10-K p.81p.85
CSX CORPORATION
PART II
Item 8. Financial Statements and Supplementary Data
NOTE 9. Employee Benefit Plans
The Company sponsors defined benefit pension plans principally for salaried, management personnel. For employees hired prior to 2003, the plans provide eligible employees with retirement benefits based predominantly on years of service and compensation rates near retirement. For employees hired between 2003 and 2019, benefits are determined based on a cash balance formula, which provides benefits by utilizing interest and pay credits based upon age, service and compensation. The CSX Pension Plan, the largest plan based on benefit obligation, was closed to new participants beginning in 2020.
The Company engages independent actuaries to compute the amounts of liabilities and expenses relating to these plans subject to the assumptions that the Company determines are appropriate based on historical trends, current market rates and future projections. These amounts are reviewed by management. In order to perform this valuation, the actuaries are provided with the details of the population covered at the beginning of the year, summarized in the table below, and projects that population forward to the end of the year.
| | | | | |
| As of |
| Pension Plan Participants: | January 1, 20222023 |
| Active Employees | 2,7672,479 | |
| Retirees and Beneficiaries | 11,46011,294 | |
Other(a) | 3,5863,504 | |
| Total | 17,81317,277 | |
(a) The Other category consists mostly of terminated but vested former employees.
CSX 20222023 Form 10-K p.82p.86
CSX CORPORATION
PART II
Item 8. Financial Statements and Supplementary Data
NOTE 9. Employee Benefit Plans, continued
The benefit obligation for these plans represents the liability of the Company for current and retiredformer employees and is affected primarily by the following:
•service cost (benefits attributed to employee service during the period);
•interest cost (interest on the liability due to the passage of time);
•actuarial gains/losses (experience during the year different from that assumed and changes in plan assumptions); and
•benefits paid to participants.
Cash Flows
Plan assets are amounts that have been segregated and restricted to provide qualified pension plan benefits and include amounts contributed by the Company and amounts earned from invested contributions, net of benefits paid. Qualified pension plan obligations are funded in accordance with regulatory requirements and with an objective of meeting or exceeding minimum funding requirements necessary to avoid restrictions on flexibility of plan operation and benefit payments. The Company funds the cost of nonqualified pension benefits on a pay-as-you-go basis. No qualified pension plan contributions were made during 2023, 2022 2021 and 2020.2021. No contributions to the Company's qualified pension plans are expected in 2023.2024.
Future expected benefit payments are as follows:
| Expected Cash Flows (Dollars in Millions): | Expected Cash Flows (Dollars in Millions): | Pension Benefits | Expected Cash Flows (Dollars in Millions): | Pension Benefits |
| 2023 | $ | 193 | |
| 2024 | 2024 | 188 | |
| 2025 | 2025 | 185 | |
| 2026 | 2026 | 183 | |
| 2027 | 2027 | 181 | |
| 2028-2032 | 879 | |
| 2028 | |
| 2029-2033 | |
| Total | Total | $ | 1,809 | |
Plan Assets
The Company outsources investment management related to pension plan assets. The CSX Investment Committee (the “Investment Committee”), whose members are selected by the Executive Vice President and Chief Financial Officer, is responsible for setting policy and oversight of investment management. The Investment Committee and investment manager utilize an investment asset allocation strategy that is monitored on an ongoing basis and updated periodically in consideration of plan or employee changes, or changing market conditions. Periodic studies provide an extensive modeling of asset investment return in conjunction with projected plan liabilities and seek to evaluate how to maximize return within the constraints of acceptable risk.
CSX 20222023 Form 10-K p.83p.87
CSX CORPORATION
PART II
Item 8. Financial Statements and Supplementary Data
NOTE 9. Employee Benefit Plans, continued
The current asset allocation targets 60%55% growth-oriented investments and 40%45% immunizing investments. The growth-oriented portfolio consists of return-seeking investments that are diversified across geography, market capitalization, and asset class. The immunizing portfolio is comprised of a customized mix of fixed income and cash investments designed to reduce liability risk. Allocations are evaluated for levels within 5% of targeted allocations and are adjusted quarterly as necessary.
The distribution of pension plan assets as of the measurement date is shown in the table below, and these assets are reported net of pension liabilities on the balance sheet.
| | | | December 2022 | | December 2021 | | December 2023 | | December 2022 |
| | | | | Percent of | | | | Percent of | | | | Percent of | | | | Percent of |
| (Dollars in Millions) | (Dollars in Millions) | Amount | | Total Assets | | Amount | | Total Assets | (Dollars in Millions) | Amount | | Total Assets | | Amount | | Total Assets |
| Equity | Equity | $ | 1,249 | | | 54 | % | | $ | 1,559 | | | 52 | % | Equity | $ | 1,142 | | | 47 | | 47 | % | | $ | 1,249 | | | 54 | | 54 | % |
| Fixed Income | Fixed Income | 144 | | | 6 | | | 204 | | | 7 | |
| Cash and Cash Equivalents | Cash and Cash Equivalents | 41 | | | 2 | | | 49 | | | 1 | |
| Growth-Oriented | Growth-Oriented | $ | 1,434 | | | 62 | % | | $ | 1,812 | | | 60 | % | Growth-Oriented | $ | 1,271 | | | 52 | | 52 | % | | $ | 1,434 | | | 62 | | 62 | % |
| Fixed Income | Fixed Income | 777 | | | 33 | | | 1,145 | | | 38 | |
| Cash and Cash Equivalents | Cash and Cash Equivalents | 116 | | | 5 | | | 59 | | | 2 | |
| Immunizing | Immunizing | $ | 893 | | | 38 | % | | $ | 1,204 | | | 40 | % | Immunizing | $ | 1,151 | | | 48 | | 48 | % | | $ | 893 | | | 38 | | 38 | % |
| Total | Total | $ | 2,327 | | | 100 | % | | $ | 3,016 | | | 100 | % | Total | $ | 2,422 | | | 100 | | 100 | % | | $ | 2,327 | | | 100 | | 100 | % |
Under the supervision of the Investment Committee, the investment manager selects investments or fund managers in accordance with standards of prudence applicable to asset diversification and investment suitability. The Company also selects fund managers with differing investment styles and benchmarks their investment returns against appropriate indices. Fund investment performance is continuously monitored. Acceptable performance is determined in the context of the long-term return objectives of the fund and appropriate asset class benchmarks.
Within the Company's equity funds, domestic stock is diversified among large and small capitalization stocks. International stock is diversified in a similar manner as well as in developed versus emerging markets stocks. Guidelines established with individual managers can limit investment by industry sectors, individual stock issuer concentration and the use of derivatives and CSX securities.
Fixed income securities guidelines established with individual managers specify the types of allowable investments, such as government, corporate and asset-backed bonds, target certain allocation ranges for domestic and foreign investments and limit the use of certain derivatives. Additionally, guidelines stipulate minimum credit quality constraints and any prohibited securities. For detailed information regarding the fair value of pension assets, see Note 13, Fair Value Measurements.
CSX 20222023 Form 10-K p.84p.88
CSX CORPORATION
PART II
Item 8. Financial Statements and Supplementary Data
NOTE 9. Employee Benefit Plans, continued
Benefit Obligation, Plan Assets and Funded Status
Changes in benefit obligation and the fair value of plan assets for the 20222023 and 20212022 plan years are as follows:
| | | | Pension Benefits | | Pension Benefits |
| | | Plan Year | | Plan Year | | Plan Year | | Plan Year |
| (Dollars in Millions) | (Dollars in Millions) | 2022 | | 2021 | (Dollars in Millions) | 2023 | | 2022 |
| Actuarial Present Value of Benefit Obligation | Actuarial Present Value of Benefit Obligation | | | | Actuarial Present Value of Benefit Obligation | | | |
| Accumulated Benefit Obligation | Accumulated Benefit Obligation | $ | 2,285 | | | $ | 2,909 | |
| Projected Benefit Obligation | Projected Benefit Obligation | 2,368 | | | 3,022 | |
| | Change in Projected Benefit Obligation: | Change in Projected Benefit Obligation: | | | |
| Change in Projected Benefit Obligation: | |
| Change in Projected Benefit Obligation: | | | | |
Projected Benefit Obligation at Beginning of Plan Year | Projected Benefit Obligation at Beginning of Plan Year | $ | 3,022 | | | $ | 3,257 | |
Service Cost (a) | Service Cost (a) | 36 | | | 45 | |
| Interest Cost | Interest Cost | 64 | | | 55 | |
| | Actuarial Gain | (570) | | | (142) | |
| Actuarial Loss (Gain) | |
| | Actuarial Loss (Gain) | |
| | Actuarial Loss (Gain) | |
| Benefits Paid | Benefits Paid | (184) | | | (193) | |
| Benefit Obligation at End of Plan Year | Benefit Obligation at End of Plan Year | $ | 2,368 | | | $ | 3,022 | |
| | Change in Plan Assets: | Change in Plan Assets: | | | |
| Change in Plan Assets: | |
| Change in Plan Assets: | | | | |
| Fair Value of Plan Assets at Beginning of Plan Year | Fair Value of Plan Assets at Beginning of Plan Year | $ | 3,016 | | | $ | 3,000 | |
| Actual (Loss) Return on Plan Assets | (523) | | | 187 | |
| Actual Return (Loss) on Plan Assets | |
| | Non-qualified Employer Contributions | |
| Non-qualified Employer Contributions | |
| Non-qualified Employer Contributions | Non-qualified Employer Contributions | 18 | | | 22 | |
| Benefits Paid | Benefits Paid | (184) | | | (193) | |
| Fair Value of Plan Assets at End of Plan Year | Fair Value of Plan Assets at End of Plan Year | $ | 2,327 | | | $ | 3,016 | |
| Funded Status at End of Plan Year | Funded Status at End of Plan Year | $ | (41) | | | $ | (6) | |
(a)Service cost for 20222023 and 20212022 includes capitalized service costs of $4 million each year.
In 2022,2023, the $20 million net actuarial loss for pension benefits was driven by a 20 basis point decrease in the weighted average discount rate, partially offset by changes to census data. The $570 million net actuarial gain for pension benefits in 2022 was driven by a 224 basis point increase in the weighted average discount rate. The $142 million net actuarial gain for pension benefits in 2021 was driven by a 35 basis points increase in the weighted average discount rate.
CSX 20222023 Form 10-K p.85p.89
CSX CORPORATION
PART II
Item 8. Financial Statements and Supplementary Data
NOTE 9. Employee Benefit Plans, continued
For qualified plan funding purposes, assets and discounted liabilities are measured in accordance with the Employee Retirement Income Security Act ("ERISA"), as well as other related provisions of the Internal Revenue Code and related regulations. Under these funding provisions and the alternative measurements available thereunder, the Company estimates its unfunded obligation for qualified plans on an annual basis.
In accordance with Compensation-Retirement Benefits Topic in the ASC, an employer must recognize the funded status of a pension plan by recording a liability (underfunded plan) or asset (overfunded plan) for the difference between the projected benefit obligation and the fair value of plan assets at the plan measurement date. Amounts related to pension benefits recorded in other long-term assets, labor and fringe benefits payable and other long-term liabilities on the balance sheet are as follows:
| | | | Pension Benefits | | Pension Benefits |
| | | December | | December | | December | | December |
| (Dollars in Millions) | (Dollars in Millions) | 2022 | | 2021 | (Dollars in Millions) | 2023 | | 2022 |
| Amounts Recorded in Consolidated | Amounts Recorded in Consolidated | | | Amounts Recorded in Consolidated | | | |
| Balance Sheets: | Balance Sheets: | | | | Balance Sheets: | | | |
| Long-term Assets | Long-term Assets | $ | 164 | | | $ | 255 | |
| Current Liabilities | Current Liabilities | (17) | | | (17) | |
| Long-term Liabilities | Long-term Liabilities | (188) | | | (244) | |
| Net Amount Recognized in Consolidated Balance Sheets | Net Amount Recognized in Consolidated Balance Sheets | $ | (41) | | | $ | (6) | |
Long-term assets as of December 20222023 and 20212022 in the preceding table relate to qualified pension plans where assets exceed projected benefit obligations. Current and long-term liabilities relate to plans where projected benefits obligations exceed assets. The following table shows the value of plan assets for only those plans with a net liability status.
| | | | | | | | |
| Aggregate | |
| (Dollars in Millions) | Fair Value | Aggregate |
| Benefit Obligations in Excess of Plan Assets | of Plan Assets | Benefit Obligation |
| Projected Benefit Obligation | $ | — | | $ | (205)(198) | |
| Accumulated Benefit Obligation | — | | (195)(188) | |
CSX 20222023 Form 10-K p.86p.90
CSX CORPORATION
PART II
Item 8. Financial Statements and Supplementary Data
NOTE 9. Employee Benefit Plans, continued
Net Benefit Expense
Only the service cost component of net periodic benefit costs is included in labor and fringe expense on the consolidated income statement. All other components of net periodic benefit cost are included in other income - net. The following table describes the components of expense/(income) related to net benefit expense recorded on the income statement.
| | Pension Benefits
Years Ended |
| Pension Benefits
Years Ended | | | Pension Benefits
Years Ended |
| (Dollars in Millions) | (Dollars in Millions) | 2022 | | 2021 | | 2020 | (Dollars in Millions) | 2023 | | 2022 | | 2021 |
| Service Cost Included in Labor and Fringe | Service Cost Included in Labor and Fringe | $ | 32 | | | $ | 41 | | | $ | 43 | |
| | Interest Cost | |
| Interest Cost | |
| Interest Cost | Interest Cost | 64 | | | 55 | | | 82 | |
| Expected Return on Plan Assets | Expected Return on Plan Assets | (188) | | | (186) | | | (176) | |
| Amortization of Net Loss | Amortization of Net Loss | 50 | | | 73 | | | 54 | |
| | Total Income Included in Other Income - Net | Total Income Included in Other Income - Net | $ | (74) | | | $ | (58) | | | $ | (40) | |
| Net Periodic Benefit (Credit)/Cost | $ | (42) | | | $ | (17) | | | $ | 3 | |
| Total Income Included in Other Income - Net | |
| Total Income Included in Other Income - Net | |
| Net Periodic Benefit Cost (Credit) | |
| | Settlement Loss (Gain) | 1 | | | — | | | (1) | |
| Total Periodic Benefit (Credit)/Cost | $ | (41) | | | $ | (17) | | | $ | 2 | |
| Settlement Loss | |
| Settlement Loss | |
| Settlement Loss | |
| Total Periodic Benefit Cost (Credit) | |
Pension Adjustments
The following table shows the pre-tax change in other comprehensive loss (income) attributable to certain components of net benefit expense and the change in benefit obligation for CSX for pension benefits.
| | (Dollars in Millions) | (Dollars in Millions) | Pension Benefits | (Dollars in Millions) | Pension Benefits |
| Components of Other Comprehensive | Components of Other Comprehensive | Years Ended | Components of Other Comprehensive | Years Ended |
| Loss (Income) | Loss (Income) | 2022 | | 2021 | Loss (Income) | 2023 | | 2022 |
| Recognized in the Balance Sheet | Recognized in the Balance Sheet | | | | Recognized in the Balance Sheet | | | |
| Losses (Gains) | $ | 141 | | | $ | (143) | |
| (Gains) Losses | |
| Expense Recognized in the Income Statement | Expense Recognized in the Income Statement | |
| Amortization of Net Losses | |
| Amortization of Net Losses | |
| Amortization of Net Losses | Amortization of Net Losses | $ | 50 | | | $ | 73 | |
| Settlement Loss | Settlement Loss | 1 | | | — | |
|
As of December 2022,2023, the balance to be amortized related to the Company's pension obligations is a pre-tax loss of $727$623 million. This amount is included in accumulated other comprehensive loss, a component of shareholders’ equity.
CSX 20222023 Form 10-K p.87p.91
CSX CORPORATION
PART II
Item 8. Financial Statements and Supplementary Data
NOTE 9. Employee Benefit Plans, continued
Assumptions
The expected long-term average rate of return on plan assets reflects the average rate of earnings expected on the funds invested, or to be invested, to provide for benefits included in the projected benefit obligation. In estimating that rate, the Company gives appropriate consideration to the returns being earned by the plan assets in the funds and the rates of return expected to be available for reinvestment as well as the current and projected asset mix of the funds. Management, with the assistance of the outsourced investment manager, balances market expectations obtained from various investment managers with both market and actual plan historical returns to develop a reasonable estimate of the expected long-term rate of return on assets. This assumption is reviewed annually and adjusted as deemed appropriate.
The Company measures the service cost and interest cost components of the net pension benefits expense by using individual spot rates matched with separate cash flows for each future year. The weighted averages of assumptions used by the Company to value its pension obligations were as follows:
| | | | Pension Benefits | | Pension Benefits |
| | | 2022 | | 2021 | | 2023 | | 2022 |
| Expected Long-term Return on Plan Assets: | Expected Long-term Return on Plan Assets: | | | | Expected Long-term Return on Plan Assets: | | | |
| Benefit Cost for Current Plan Year | Benefit Cost for Current Plan Year | 6.75 | % | | 6.75 | % | Benefit Cost for Current Plan Year | 6.75 | % | | 6.75 | % |
| Benefit Cost for Subsequent Plan Year | Benefit Cost for Subsequent Plan Year | 6.75 | % | | 6.75 | % | Benefit Cost for Subsequent Plan Year | 6.75 | % | | 6.75 | % |
| | Discount Rates: | Discount Rates: | | | |
| Discount Rates: | |
| Discount Rates: | | | | |
| Benefit Cost for Plan Year | Benefit Cost for Plan Year | |
| Service Cost for Plan Year | |
| Service Cost for Plan Year | |
| Service Cost for Plan Year | Service Cost for Plan Year | 2.98 | % | | 2.69 | % | 5.09 | % | | 2.98 | % |
| Interest Cost for Plan Year | Interest Cost for Plan Year | 2.18 | % | | 1.70 | % | Interest Cost for Plan Year | 4.90 | % | | 2.18 | % |
| Benefit Obligation at End of Plan Year | Benefit Obligation at End of Plan Year | 5.02 | % | | 2.78 | % | Benefit Obligation at End of Plan Year | 4.82 | % | | 5.02 | % |
| | Salary Scale Inflation | Salary Scale Inflation | 4.80 | % | | 4.60 | % |
| Salary Scale Inflation | |
| Salary Scale Inflation | | 4.80 | % | | 4.80 | % |
| Cash Balance Plan Interest Credit Rate | Cash Balance Plan Interest Credit Rate | 3.75 | % | | 3.75 | % | Cash Balance Plan Interest Credit Rate | 3.75 | % | | 3.75 | % |
CSX 20222023 Form 10-K p.88p.92
CSX CORPORATION
PART II
Item 8. Financial Statements and Supplementary Data
NOTE 9. Employee Benefit Plans, continued
Post-retirement Medical Plan
In addition to these plans, the Company sponsors a post-retirement medical plan and a life insurance plan that provide certain benefits to full-time, salaried, management employees hired prior to 2003 upon their retirement if certain eligibility requirements are met. The accumulated post-retirement benefit obligation related to this plan was $61$56 million and $81$61 million, respectively, as of December 31, 20222023 and 2021.2022. Through 2032,2033, total future expected benefit payments related to this plan were $55$50 million. Expenses in 2023, 2022 2021 and 20202021 related to this plan were not material.
Other Plans
Under collective bargaining agreements, the Company participates in a multi-employer benefit plan, which provides certain post-retirement health care and life insurance benefits to eligible contract employees. Premiums under this plan are expensed as incurred and amounted to $11 million, $13 million and $21 million in 2023, 2022 and $20 million in 2022, 2021, and 2020, respectively.
The Company maintains savings plans for virtually all full-time salaried employees and certain employees covered by collective bargaining agreements. Expense associated with these plans was $35 million, $28 million and $29 million for 2023, 2022 and $39 million for 2022, 2021, and 2020, respectively, and is included in labor and fringe expense on the consolidated income statement.
Under the terms of collective bargaining agreements that cover union-represented employees, Quality Carriers contributes to threetwo multi-employer pension plans. These plans provide defined benefits to retired participants. All threeBoth of these pension plans are in Pension Protection Act zone “red”, meaning they are at least 65% underfunded. Formal rehabilitation plans have been adopted. As of December 31, 2022, basedBased on information provided to the Company from the administrators of these plans, Quality Carriers’ portion of the contingent liability in the caseevent of a full withdrawal or termination from these plans is estimated to be approximately $336 million, of which$334 million. Of this amount, $328 million relates to the Central States Southeast and Southwest Areas Pension Plan.Plan and is based on information as of December 31, 2022, which is the latest information available at the date the financial statements were issued. The Company has withdrawn from one of the plans, resulting in an immaterial withdrawal liability, but does not currently intend to withdraw from the remainingany of these multi-employer pension plans. Required monthly contributions to these plans are not material.
CSX 20222023 Form 10-K p.89p.93
CSX CORPORATION
PART II
Item 8. Financial Statements and Supplementary Data
NOTE 10. Debt and Credit Agreements
Debt at December 20222023 and December 20212022 is shown in the table below. For information regarding the fair value of debt, see Note 13, Fair Value Measurements.
| | Maturity at
December | Average
Interest
Rates at
December | December | December |
| Maturity at
December | | | Maturity at
December | Average
Interest
Rates at
December | December | December |
| (Dollars in Millions) | (Dollars in Millions) | 2022 | 2021 | (Dollars in Millions) | 2023 | 2022 |
| Notes | Notes | 2023-2068 | 4.2% | $ | 17,877 | | $ | 16,166 | |
Equipment Obligations(a) | Equipment Obligations(a) | 2023-2027 | 6.2% | 141 | | 153 | |
| Finance Leases | Finance Leases | 2023-2032 | 6.0% | 29 | | 47 | |
| | Subtotal Long-term Debt (Including Current Portion) | Subtotal Long-term Debt (Including Current Portion) | | | $ | 18,047 | | $ | 16,366 | |
| Subtotal Long-term Debt (Including Current Portion) | |
| Subtotal Long-term Debt (Including Current Portion) | |
| Less Debt Due within One Year | Less Debt Due within One Year | | (151) | | (181) | |
| Long-term Debt (Excluding Current Portion) | Long-term Debt (Excluding Current Portion) | | $ | 17,896 | | $ | 16,185 | |
(a) Equipment obligations are secured by an interest in certain railroad equipment.
Debt Issuance & Early Redemption of Long-term Debt
On September 7, 2023, CSX issued $600 million of 5.20% notes due 2033. These notes are included in the consolidated balance sheets under long-term debt and may be redeemed by the Company at any time, subject to payment of certain make-whole premiums.
In July 28, 2022, CSX issued $950 million aggregate principal amount of 4.100%4.10% notes due 2032, $900 million aggregate principal amount of 4.500%4.50% notes due 2052 and $150 million aggregate principal amount of 4.650%4.65% notes due 2068. The 2068 notes are a reopening of existing notes originally issued in February 2018. These notes are included in the consolidated balance sheets under long-term debt and may be redeemed by the Company at any time, subject to payment of certain make-whole premiums.
In July 2021, finance lease obligations and debt totaling $68 million were assumed related to the Company's acquisition of Quality Carriers on July 1, 2021. No debt was issued in 2021.
On December 1, 2020, CSX issued $500 million of 2.50% notes due 2051. On December 30, 2020, the proceeds of the offering were used to fully redeem CSX’s outstanding $500 million of 3.70% notes that otherwise would have matured on November 1, 2023. These notes are included in the consolidated balance sheets under long-term debt and may be redeemed by the Company at any time, subject to payment of certain make-whole premiums.
The net proceeds from debt issuances will be used for general corporate purposes, which may include debt repayments, repurchases of CSX’s common stock, capital investment and working capital requirements. For more information regarding a non-cash debt transaction with a related party, see Note 15, Investment in Affiliates and Related-Party Transactions.
CSX 20222023 Form 10-K p.90p.94
CSX CORPORATION
PART II
Item 8. Financial Statements and Supplementary Data
NOTE 10. Debt and Credit Agreements, continued
Long-term Debt Maturities (Net of Discounts, Premiums and Issuance Costs)
| | (Dollars in millions) | Maturities at |
| (Dollars in Millions) | | (Dollars in Millions) | Maturities at |
| Years Ending | Years Ending | December 2022 | Years Ending | December 2023 |
| 2023 | $ | 151 | |
| 2024 | 2024 | 558 | |
| 2025 | 2025 | 606 | |
| 2026 | 2026 | 704 | |
| 2027 | 2027 | 998 | |
| 2028 | |
| Thereafter | Thereafter | 15,030 | |
| Total Long-term Debt Maturities, including current portion | Total Long-term Debt Maturities, including current portion | $ | 18,047 | |
Interest Rate Derivatives
Fair Value Hedges
In fourth quarter 2023, CSX entered into two separate fixed-to-floating interest rate swaps classified as fair value hedges. The swaps are designed to hedge 10 years of interest rate risk associated with market fluctuations attributable to the Secured Overnight Financing Rate ("SOFR") on a cumulative $250 million of fixed rate outstanding notes which are due in 2033. The cumulative fair value of these swaps, which is included in other long-term assets on the consolidated balance sheet, was an asset of $19 million as of December 31, 2023.
In first quarter 2022, CSX entered into five separate fixed-to-floating interest rate swaps classified as fair value hedges. The swaps are designed to hedge 10 years of interest rate risk associated with market fluctuations attributable to the Secured Overnight Financing RateSOFR on a cumulative $800 million of fixed rate outstanding notes which are due between 2036 and 2040. As of December 31, 2022, theThe cumulative fair value of these swaps was a $118 million liability, which is included in other long-term liabilities on the consolidated balance sheet. sheet, was a liability of $107 million and $118 million as of December 31, 2023, and December 31, 2022, respectively.
The 2022 swaps will expire in 2032 and the 2023 swaps will expire in 2033. If settled early, the remaining cumulative fair value adjustment to the hedged notes will be amortized over the remaining life of the associated notes. The cumulative adjustment to the hedged notes is included in long-term debt. debt on the consolidated balance sheet as shown in the following table.
| | | | | | | | |
| (Dollars in Millions) | December 31, 2023 | December 31, 2022 |
| Notional Value of Hedged Notes | $ | 1,050 | | $ | 800 | |
| Fair Value Asset Adjustment to Hedged Notes | 19 | | — | |
| Fair Value Liability Adjustment to Hedged Notes | (107) | | (118) | |
| Carrying Amount of Hedged Notes | $ | 962 | | $ | 682 | |
CSX CORPORATION
PART II
Item 8. Financial Statements and Supplementary Data
NOTE 10. Debt and Credit Agreements, continued
Gains and losses resulting from changes in fair value of the interest rate swaps offset changes in the fair value of the hedged portion of the underlying debt with no gain or loss recognized due to hedge ineffectiveness. The difference in the net fixed-to-float interest settlement on the derivatives is recognized in interest expense and was not material for the year ending at December 31, 2022. The swaps will expire in 2032. If settled early, the remaining cumulative fair value adjustment to the hedged notes will be amortized over the remaining life of the associated notes. The amounts recorded in long-term debt on the consolidated balance sheet related to these fair value hedges is summarized in the table below.as follows.
| | | | | |
(Dollars in Millions) | December 31, 2022 |
Notional Value of Hedged Notes | $ | 800 | |
Cumulative Fair Value Adjustment to Hedged Notes | (118) | |
Carrying Amount of Hedged Notes | $ | 682 | |
CSX CORPORATION
PART II
Item 8. Financial Statements and Supplementary Data
NOTE 10. Debt and Credit Agreements, continued | | | | | | | | | | | |
| | | |
| (Dollars in Millions) | 2023 | 2022 | 2021 |
| Interest Expense Impact (Increase) Decrease | $ | (28) | | $ | (1) | | N/A |
Cash Flow Hedges
In 2020, the Company executed forward starting interest rate swaps, classified as cash flow hedges, with aggregate notional value of $500 million. These swaps were effected to hedge the benchmark interest rate associated with future interest payments related to the anticipated refinancing of $850 million of 3.25% notes due in 2027. In accordance with the Derivatives and Hedging Topic in the ASC, the Company has designated these swaps as cash flow hedges. As of December 31, 2022 and 2021,Under the asset valueterms of the forward starting interestAdjustable Interest Rate (LIBOR) Act, the reference rate swaps was $127 million and $91 million, respectively, and was recorded in other long-term assets on the consolidated balance sheet.swaps were automatically replaced with daily compounded SOFR plus the fallback spread on July 1, 2023, the LIBOR replacement date.
Unrealized gains or losses associated with changes in the fair value of the hedge are recorded net of tax in accumulated other comprehensive income (“AOCI”) on the consolidated balance sheet. In fourth quarter 2022, CSX settled a portion equal to $160 million notional value of the aggregate $500 million cash flow hedges, which resulted in CSX receiving a cash payment of $52 million included in other operating activities on the consolidated cash flow statement. In second quarter 2023, CSX executed a partial settlement equal to $113 million notional value of the cash flow hedges, which resulted in CSX receiving a cash payment of $44 million. In third quarter 2023, CSX partially settled an additional $113 million notional value of the cash flow hedges and received a cash payment of $51 million included in other operating activities on the consolidated cash flow statement. The unsettled aggregate notional value of these swaps was $114 million and $340 million as of December 31, 2023, and December 31, 2022, respectively.
As of December 31, 2023 and 2022, the asset value of the forward starting interest rate swaps was $48 million and $127 million, respectively, and was recorded in other long-term assets on the consolidated balance sheet. Unrealized gains or losses associated with changes in the fair value of the hedge are recorded net of tax in accumulated other comprehensive income (“AOCI”) on the consolidated balance sheet. The unrealized gain associated with the settled portion of the hedges will continue to be classified in AOCI until the associated debt instrument is issued in the future. Unless settled early, the remainder of the swaps will expire in 2027 and the unrealized gain or loss in AOCI will be recognized in earnings as an adjustment to interest expense over the same period during which the hedged transaction affects earnings. Unrealized gains,amounts related to the hedge, recorded net of tax in other comprehensive income, related toare summarized in the hedges were $80 million, $8 million and $62 million for the years ended December 31, 2022, 2021 and 2020, respectively.table below.
| | | | | | | | | | | |
| (Dollars in Millions) | 2023 | 2022 | 2021 |
| Unrealized Gain - Net | $ | — | | $ | 80 | | $ | 8 | |
See Note 13, Fair Value Measurements, and Note 16, Other Comprehensive Income (Loss), for other information about the Company's hedges.
CSX CORPORATION
PART II
Item 8. Financial Statements and Supplementary Data
NOTE 10. Debt and Credit Agreements, continued
Credit Facilities
In February 2023, CSX hasreplaced its existing $1.2 billion unsecured revolving credit facility with a new $1.2 billion unsecured, revolving credit facility backed by a diverse syndicate of banks. This facility allows same-day borrowings at floating interest rates, based on LIBORSOFR or an agreed-upon replacement reference rate, plus a spread that depends upon CSX's senior unsecured debt ratings. This facility expires in March 2024, and asFebruary 2028. As of December 31, 2022,2023, the Company had no outstanding balances under this facility.
Commitment fees and interest rates payable under the facility were similar to fees and rates available to comparably rated investment-grade borrowers. As of December 31, 2022,2023, CSX was in compliance with all covenant requirements under the facility.
Commercial Paper
Under its commercial paper program, which is backed by the revolving credit facility, the Company may issue unsecured commercial paper notes up to a maximum aggregate principal amount of $1.0 billion. Proceeds from issuances of the notes are expected to be used for general corporate purposes. At December 31, 2022,2023, the Company had no commercial paper outstanding.
CSX 20222023 Form 10-K p.92p.97
CSX CORPORATION
PART II
Item 8. Financial Statements and Supplementary Data
NOTE 11. Revenues
The Company’s revenues are primarily derived from the transportation of freight as performance obligations that arise from its contracts with customers are satisfied. The following table presents the Company’s revenues disaggregated by market as this best depicts how the nature, amount, timing and uncertainty of revenue and cash flows are affected by economic factors.
| | Years Ended |
| Years Ended | | | Years Ended |
| (Dollars in Millions) | (Dollars in Millions) | 2022 | 2021 | 2020 | (Dollars in Millions) | 2023 | 2022 | 2021 |
| | Chemicals | |
| Chemicals | |
| Chemicals | Chemicals | $ | 2,584 | | $ | 2,421 | | $ | 2,309 | |
| Agricultural and Food Products | Agricultural and Food Products | 1,664 | | 1,461 | | 1,386 | |
| Automotive | Automotive | 1,054 | | 886 | | 920 | |
| Forest Products | Forest Products | 996 | | 918 | | 834 | |
| Metals and Equipment | Metals and Equipment | 828 | | 796 | | 675 | |
| Minerals | Minerals | 658 | | 587 | | 538 | |
| Fertilizers | Fertilizers | 455 | | 470 | | 414 | |
| Total Merchandise | Total Merchandise | 8,239 | | 7,539 | | 7,076 | |
| | | Intermodal | 2,306 | | 2,039 | | 1,702 | |
| | Coal | |
| | Coal | Coal | 2,434 | | 1,790 | | 1,397 | |
| | | Coal | |
| | Intermodal | |
| | Intermodal | |
| | Intermodal | |
| Trucking(a) | |
Trucking(a) | |
Trucking(a) | Trucking(a) | 966 | | 410 | | — | |
| | Other | Other | 908 | | 744 | | 408 | |
| Other | |
| Other | |
| | Total | Total | $ | 14,853 | | $ | 12,522 | | $ | 10,583 | |
| Total | |
| Total | |
(a) Effective third quarter 2021, Trucking revenue is comprised of revenue from the operations of Quality Carriers, which was acquired by CSX effective July 1, 2021.
Revenue Recognition
The Company generates revenue from rail freight billings under contracts with customers generally on a rate per carload, container or ton-basis based on length of haul and commodities carried. The Company’s performance obligation arises when it receives a bill of lading (“BOL”) to transport a customer's commodities at a negotiated price contained in a transportation services agreement or a publicly disclosed tariff rate. Once a BOL is received, a contract is formed whereby the parties are committed to perform, collectability of consideration is probable and the rights of the parties, shipping terms and conditions, and payment terms are identified. A customer may submit several BOLs for transportation services at various times throughout a service agreement term, but each shipment represents a distinct service that is a separately identified performance obligation.
CSX 20222023 Form 10-K p.93p.98
CSX CORPORATION
PART II
Item 8. Financial Statements and Supplementary Data
NOTE 11. Revenues, continued
The average transit time to complete a rail shipment is between 2 to 87 days depending on market. Payments for transportation services are normally billed once a BOL is received and are generally due within 15 days after the invoice date. The Company recognizes revenue over transit time of freight as it moves from origin to destination. Revenue for services started but not completed at the reporting date is allocated based on the relative transit time in each reporting period, with the portion allocated for services subsequent to the reporting date considered remaining performance obligations.
The certain key estimates included in the recognition and measurement of revenue and related accounts receivable are as follows:
•Revenue associated with shipments in transit, which is recognized ratably over transit time and is based on average cycle times to move commodities and products from their origin to their final destination or interchange;
•Adjustments to revenue for billing corrections and billing discounts;
•Adjustments to revenue for overcharge claims filed by customers, which are based on historical payments to customers for rate overcharges as a percentage of total billing; and
•Incentive-based refunds to customers, which are primarily volume-related, are recorded as a reduction to revenue on the basis of the projected liability (this estimate is based on historical activity, current volume levels and forecasted future volume).
Revenue related to interline transportation services that involve the services of another party, such as another railroad, is reported on a net basis. The portion of the gross amount billed to customers that is remitted by the Company to another party is not reflected as revenue.
Effective third quarter 2021, trucking revenue includes revenue from the operations of Quality Carriers and is mostly comprised of truck shipments of chemicals. A performance obligation arises when Quality Carriers receives a customer order to transport a commodity at a contracted rate. Revenue is recorded on a gross basis ratably over transit time.
Other revenue is recorded upon completion of the service and is comprised of revenue from regional subsidiary railroads and incidental charges, including demurrage, intermodal storage and equipment usage, demurrage and switching. Revenue from regional subsidiary railroads includes shipments by railroads that the Company does not directly operate. Demurrage represents charges assessed when freight cars are held by a customer beyond a specified period of time. Intermodal storage represents charges for customer storage of containers at an intermodal terminal, ramp facility or offsite location beyond a specified period of time. Demurrage represents charges assessed when freight cars are held by a customer beyond a specified period of time. Switching represents charges assessed when a railroad switches cars for a customer or another railroad.
During 2023, 2022 2021 and 2020,2021, revenue recognized from performance obligations related to prior periods (for example, due to changes in transaction price) was not material.
CSX 20222023 Form 10-K p.94p.99
CSX CORPORATION
PART II
Item 8. Financial Statements and Supplementary Data
NOTE 11. Revenues, continued
Remaining Performance Obligations
Remaining performance obligations represent the transaction price allocated to future reporting periods for freight services started but not completed at the reporting date. This includes the unearned portion of billed and unbilled amounts for cancellable freight shipments in transit. The Company expects to recognize the unearned portion of revenue for freight services in transit within one week of the reporting date. As of December 31, 2022,2023, remaining performance obligations were not material.
Contract Balances and Accounts Receivable
The timing of revenue recognition, billings and cash collections results in accounts receivable and customer advances and deposits (contract liabilities) on the consolidated balance sheets. Contract assets, contract liabilities and deferred contract costs recorded on the consolidated balance sheet as of December 31, 2023, and December 31, 2022, were not material.
The Company’s accounts receivable - net consists of freight and non-freight receivables, reduced by an allowance for credit losses.
| | (Dollars in Millions) | (Dollars in Millions) | December 31,
2022 | December 31,
2021 | (Dollars in Millions) | December 31,
2023 | December 31,
2022 |
| | Freight Receivables | |
| Freight Receivables | |
| Freight Receivables | Freight Receivables | $ | 1,067 | | $ | 951 | |
| Freight Allowance for Credit Losses | Freight Allowance for Credit Losses | (16) | | (14) | |
| Freight Receivables, net | Freight Receivables, net | 1,051 | | 937 | |
| | Non-Freight Receivables | Non-Freight Receivables | 279 | | 225 | |
| Non-Freight Receivables | |
| Non-Freight Receivables | |
| Non-Freight Allowance for Credit Losses | Non-Freight Allowance for Credit Losses | (17) | | (14) | |
| Non-Freight Receivables, net | Non-Freight Receivables, net | 262 | | 211 | |
| Total Accounts Receivable, net | Total Accounts Receivable, net | $ | 1,313 | | $ | 1,148 | |
Freight receivables include amounts earned, billed and unbilled, and currently due from customers for transportation-related services. Non-freight receivables include amounts billed and unbilled and currently due related to government reimbursement receivables and other non-revenue receivables. The Company maintains an allowance for credit losses to provide for the estimated amount of receivables that will not be collected. The allowance is based upon an assessment of risk characteristics, historical payment experience, and the age of outstanding receivables adjusted for forward-looking economic conditions as necessary. Credit losses recognized on the Company’s accounts receivable were not material in 20222023 and 2021.2022.
CSX 20222023 Form 10-K p.95p.100
CSX CORPORATION
PART II
Item 8. Financial Statements and Supplementary Data
NOTE 12. Income Taxes
Earnings before income taxes of $4.9 billion, $5.4 billion $5.0 billion and $3.6$5.0 billion for years ended 2023, 2022 2021 and 2020,2021, respectively, represent earnings from domestic operations. The breakdown of income tax expense between current and deferred is as follows:
| | Years Ended |
| Years Ended | | | Years Ended |
| (Dollars in Millions) | (Dollars in Millions) | 2022 | | 2021 | | 2020 | (Dollars in Millions) | 2023 | | 2022 | | 2021 |
| Current: | Current: | | |
| Federal | |
| Federal | |
| Federal | Federal | $ | 928 | | | $ | 827 | | | $ | 559 | |
| State | State | 203 | | | 176 | | | 123 | |
| Subtotal Current | Subtotal Current | $ | 1,131 | | | $ | 1,003 | | | $ | 682 | |
| | Deferred: | Deferred: | | | | | |
| Deferred: | |
| Deferred: | | | | |
| Federal | Federal | 166 | | | 166 | | | 149 | |
| State | State | (49) | | | 1 | | | 31 | |
| Subtotal Deferred | Subtotal Deferred | $ | 117 | | | $ | 167 | | | $ | 180 | |
| Total Income Tax Expense | Total Income Tax Expense | $ | 1,248 | | | $ | 1,170 | | | $ | 862 | |
The Company recorded a 2023 income tax benefit of $22 million primarily from a change in the valuation of deferred taxes as a result of filing the 2022 tax returns. In 2022, the Company recorded an income tax benefit of $78 million primarily as a result of state legislative changes and a change in the valuation of deferred taxes as a result of filing the 2021 tax returns. In 2021, the Company recorded an income tax benefit of $48 million primarily as a result of favorable state legislative changes, additional tax benefits associated with the vesting of share-based awards and adjustments to deferred taxes as a result of filing the 2020 state tax returns. In 2020, the Company recorded an income tax benefit of $30 million primarily as a result of the additional tax benefit associated with vesting of share-based awards and the resolution of certain tax matters.
Income tax expense reconciled to the tax computed at statutory rates is presented in the following table.
| | | | Years Ended | | Years Ended |
| (Dollars In Millions) | 2022 | | 2021 | | 2020 |
| (Dollars in Millions) | | (Dollars in Millions) | 2023 | | 2022 | | 2021 |
| | Federal Income Taxes | |
| Federal Income Taxes | |
| Federal Income Taxes | Federal Income Taxes | $ | 1,137 | | | 21.0 | % | | $ | 1,040 | | | 21.0 | % | | $ | 762 | | | 21.0 | % | $ | 1,027 | | | 21.0 | | 21.0 | % | | $ | 1,137 | | | 21.0 | | 21.0 | % | | $ | 1,040 | | | 21.0 | | 21.0 | % |
| State Income Taxes | State Income Taxes | 121 | | | 2.2 | % | | 139 | | | 2.8 | % | | 117 | | | 3.2 | % | State Income Taxes | 153 | | | 3.1 | | 3.1 | % | | 121 | | | 2.2 | | 2.2 | % | | 139 | | | 2.8 | | 2.8 | % |
| | Other | Other | (10) | | | (0.1) | % | | (9) | | | (0.2) | % | | (17) | | | (0.4) | % |
| Other | |
| Other | | (4) | | | (0.1) | % | | (10) | | | (0.1) | % | | (9) | | | (0.2) | % |
| Income Tax Expense/ Rate | Income Tax Expense/ Rate | $ | 1,248 | | | 23.1 | % | | $ | 1,170 | | | 23.6 | % | | $ | 862 | | | 23.8 | % | Income Tax Expense/ Rate | $ | 1,176 | | | 24.0 | | 24.0 | % | | $ | 1,248 | | | 23.1 | | 23.1 | % | | $ | 1,170 | | | 23.6 | | 23.6 | % |
CSX 20222023 Form 10-K p.96p.101
CSX CORPORATION
PART II
Item 8. Financial Statements and Supplementary Data
NOTE 12. Income Taxes, continued
The primary factors in the change in year-end net deferred income tax liability balances include the annual provision for deferred income tax expense and accumulated other comprehensive income/loss.income (loss). The significant components of deferred income tax assets and liabilities include:
| | | | 2022 | | 2021 | | 2023 | | 2022 |
| (Dollars in Millions) | (Dollars in Millions) | Assets | | Liabilities | | Assets | | Liabilities | (Dollars in Millions) | Assets | | Liabilities | | Assets | | Liabilities |
| Other Employee Benefit Plans | Other Employee Benefit Plans | $ | 105 | | | $ | — | | | $ | 106 | | | $ | — | |
| Accelerated Depreciation | Accelerated Depreciation | — | | | 7,600 | | | — | | | 7,366 | |
| Other | Other | 553 | | | 627 | | | 499 | | | 622 | |
| Total | Total | $ | 658 | | | $ | 8,227 | | | $ | 605 | | | $ | 7,988 | |
| Net Deferred Income Tax Liabilities | Net Deferred Income Tax Liabilities | | | $ | 7,569 | | | | | $ | 7,383 | |
The Company files a consolidated federal income tax return, which includes its principal domestic subsidiaries. CSX and its subsidiaries are subject to U.S. federal income tax as well as income tax of multiple state jurisdictions. CSX participated in a contemporaneous IRS audit of tax years 2023, 2022, and 2021. Federal examinations of original federal income tax returns for all years through 2020 are resolved.
As of December 20222023 and 2021,2022, the Company had approximately $18$19 million and $18 million, respectively, of total unrecognized tax benefits as a result of uncertain tax positions. Net tax benefits of $14$15 million and $15$14 million as of December 20222023 and 2021,2022, respectively, could favorably impact the effective income tax rate in each year. The Company does not expect that unrecognized tax benefits as of December 20222023 for various state and federal income tax matters will significantly change over the next 12 months. The final outcome of these uncertain tax positions is not yet determinable. There were no material changes to the total gross unrecognized tax benefits and prior year audit resolutions of the Company during the year ended December 2022.2023.
CSX’s continuing practice is to recognize net interest and penalties related to income tax matters in income tax expense. Accrued interest and penalties were not material as of December 20222023 or 2021.2022. Additionally, expenses from changes to the reserves for interest and penalties were not material in 2023, 2022 2021 or 2020.2021.
CSX 20222023 Form 10-K p.97p.102
CSX CORPORATION
PART II
Item 8. Financial Statements and Supplementary Data
NOTE 13. Fair Value Measurements
The Financial Instruments Topic in the ASC requires disclosures about fair value of financial instruments in annual reports as well as in quarterly reports. For CSX, this statement applies to certain investments, pension plan assets, long-term debt and interest rate derivatives. Also, the Fair Value Measurements and Disclosures Topic in the ASC clarifies the definition of fair value for financial reporting, establishes a framework for measuring fair value and requires additional disclosures about the use of fair value measurements.
Various inputs are considered when determining the value of the Company's investments, pension plan assets, long-term debt and interest rate derivatives. The inputs or methodologies used for valuing securities are not necessarily an indication of the risk associated with investing in these securities. These inputs are summarized in the three broad levels listed below:
•Level 1 – observable market inputs that are unadjusted quoted prices for identical assets or liabilities in active markets;
•Level 2 – other significant observable inputs (including quoted prices for similar securities, interest rates, credit risk, etc.); and
•Level 3 – significant unobservable inputs (including the Company’s own assumptions about the assumptions market participants would use in determining the fair value of investments).
The valuation methods described below may produce a fair value calculation that may not be indicative of net realizable value or reflective of future fair values. Furthermore, while the Company believes its valuation methods are appropriate and consistent with other market participants, the use of different methodologies or assumptions to determine the fair value of certain financial instruments could result in a different fair value measurement at the reporting date.
Investments
The Company's investment assets are carried at fair value on the consolidated balance sheet in accordance with the Fair Value Measurements and Disclosures Topic in the ASC. They are valued with assistance from a third-party trustee and consist of fixed income mutual funds, corporate bonds and government securities. The fixed income mutual funds are valued at the net asset value of shares held based on quoted market prices determined in an active market, which are Level 1 inputs. The corporate bonds and government securities are valued using broker quotes that utilize observable market inputs, which are Level 2 inputs. Unrealized losses as of December 31, 2023 and December 31, 2022 were not material. The Company believes any impairment of investments held with gross unrealized losses to be temporary and not the result of credit risk.
CSX 20222023 Form 10-K p.98p.103
CSX CORPORATION
PART II
Item 8. Financial Statements and Supplementary Data
NOTE 13. Fair Value Measurements, continued
The Company's investment assets are carried at fair value on the consolidated balance sheets as summarized in the following table.
| | December 2022 | | December 2021 |
| December 2023 | |
| December 2023 | |
| December 2023 | | | December 2022 |
| (Dollars in Millions) | (Dollars in Millions) | Level 1 | Level 2 | | Total | | Level 1 | Level 2 | | Total | (Dollars in Millions) | Level 1 | Level 2 | | Total | | Level 1 | Level 2 | | Total |
| Fixed Income Mutual Funds | Fixed Income Mutual Funds | $ | 89 | | $ | — | | | $ | 89 | | | $ | 75 | | $ | — | | | $ | 75 | |
| Corporate Bonds | Corporate Bonds | — | | 49 | | | 49 | | | — | | 63 | | | 63 | |
| Government Securities | Government Securities | — | | 58 | | | 58 | | | — | | 26 | | | 26 | |
| | Total Investments at Fair Value | Total Investments at Fair Value | $ | 89 | | $ | 107 | | | $ | 196 | | | $ | 75 | | $ | 89 | | | $ | 164 | |
| Total Investments at Fair Value | |
| Total Investments at Fair Value | |
| | Total Investments at Amortized Cost | Total Investments at Amortized Cost | | | $ | 201 | | | | $ | 156 | |
| Total Investments at Amortized Cost | |
| Total Investments at Amortized Cost | |
These investments have the following maturities and are represented on the consolidated balance sheet within short-term investments for investments with maturities of less than one year, and other long-term assets for investments with maturities of one year and greater.
| | (Dollars in Millions) | (Dollars in Millions) | December 2022 | | December 2021 | (Dollars in Millions) | December 2023 | | December 2022 |
| Less than 1 year | Less than 1 year | $ | 129 | | | $ | 77 | |
| 1 - 5 years | 1 - 5 years | 24 | | | 28 | |
| 5 - 10 years | 5 - 10 years | 10 | | | 12 | |
| Greater than 10 years | Greater than 10 years | 33 | | | 47 | |
| Total investments at fair value | Total investments at fair value | $ | 196 | | | $ | 164 | |
Long-term Debt
Long-term debt, which includes finance leases, is reported at carrying amount on the consolidated balance sheets and is the Company's only financial instrument with fair values significantly different from their carrying amounts. The majority of the Company's long-term debt is valued with assistance from a third party that utilizes closing transactions, market quotes or market values of comparable debt. For those instruments not valued by the third party, the fair value has been estimated by applying market rates of similar instruments to the scheduled contractual debt payments and maturities. These market rates are provided by the same third party. All of the inputs used to determine the fair value of the Company's long-term debt are Level 2 inputs.
The fair value of outstanding debt fluctuates with changes in a number of factors. Such factors include, but are not limited to, interest rates, market conditions, credit ratings, values of similar financial instruments, size of the transaction,instrument, cash flow projections and comparable trades. Fair value will exceed carrying value when the current market interest rate is lower than the interest rate at which the debt was originally issued. The fair value of a company's debt is a measure of its current value under present market conditions. It does not impact the financial statements under current accounting rules.
CSX 20222023 Form 10-K p.99p.104
CSX CORPORATION
PART II
Item 8. Financial Statements and Supplementary Data
NOTE 13. Fair Value Measurements, continued
The fair value and carrying value of the Company's long-term debt is as follows:
| | (Dollars in Millions) | (Dollars in Millions) | December 2022 | | December 2021 | (Dollars in Millions) | December 2023 | | December 2022 |
| Long-term Debt (Including Current Maturities): | Long-term Debt (Including Current Maturities): | | | | Long-term Debt (Including Current Maturities): | | | |
| Fair Value | Fair Value | $ | 16,135 | | | $ | 19,439 | |
| Carrying Value | Carrying Value | 18,047 | | | 16,366 | |
Interest Rate Derivatives
The Company’s fixed-to-floating and forward starting interest rate swaps are carried at their respective fair values, which are determined with assistance from a third party based upon pricing models using inputs observed from actively quoted markets. All of the inputs used to determine the fair value of the swaps are Level 2 inputs. The fair value of the Company’s fixed-to-floating interest rate swaps was an asset of $19 million (for swaps entered in 2023) and a liability of $107 million (for swaps entered in 2022) at December 31, 2023. As of December 31, 2022, the fair value of the fixed-to-floating interest rate swaps was a liability of $118 million as of December 31, 2022.million. The fair value of the Company’s forward starting interest rate swaps asset was $127$48 million and $91$127 million at December 31, 20222023 and 2021,2022, respectively. See Note 10, Debt and Credit Agreements, for further information.
Pension Plan Assets
Pension plan assets are reported at fair value, net of pension liabilities, on the consolidated balance sheet. The Investment Committee targets an allocation of pension assets to be generally 60% growth-oriented and 40% immunizing. See Note 9, Employee Benefit Plans, for further information. There are several valuation methodologies used for those assets as described below.
Investments in the Fair Value Hierarchy
•Common stock (Level 1): Valued at the closing price reported on the active market on which the individual securities are traded on the last day of the year and classified in Level 1 of the fair value hierarchy.
•Mutual funds (Level 1): Valued at the net asset value of shares held at year end based on quoted market prices determined in an active market. These assets are classified in Level 1 of the fair value hierarchy.
•Cash and cash equivalents (Level 1): Includes cash and short term investments with an original maturity of three months or less. The carrying value of cash and cash equivalents at year end approximates fair value. These assets are classified in Level 1 of the fair value hierarchy.
•Corporate bonds, government securities, asset-backed securities and derivatives (Level 2): Valued using price evaluations reflecting the bid and/or ask sides of the market for a similar investment at year end. Asset-backed securities include commercial mortgage-backed securities and collateralized mortgage obligations. These assets are classified in Level 2 of the fair value hierarchy.
CSX 20222023 Form 10-K p.100p.105
CSX CORPORATION
PART II
Item 8. Financial Statements and Supplementary Data
NOTE 13. Fair Value Measurements, continued
Investments Measured at Net Asset Value
•Partnerships: Net asset value of private equity is based on the fair market values associated with the underlying investments at year end. These funds have varying redemption restrictions, thatbut most require advanced notice of at least 15 business days.
•Commingled and common collective trust funds: This class consists of private funds that invest in corporate equity and debt securities, government securities and various short-term debt instruments and are measured at net asset value to estimate the fair value of the investments. The net asset value of the investments is determined by reference to the fair value of the underlying securities, which are valued primarily through the use of directly or indirectly observable inputs. These funds have redemption restrictions that require advanced notice of up to 45 business days.
The pension plan assets at fair value by level, within the fair value hierarchy, as of calendar plan years 20222023 and 20212022 are shown in the table below. For additional information related to pension assets, see Note 9, Employee Benefit Plans.
| | | |
| | | | December 2022 | | December 2021 | December 2023 | | December 2022 |
| (Dollars in Millions) | (Dollars in Millions) | Level 1 | | Level 2 | | | Total | | Level 1 | | Level 2 | | | Total | (Dollars in Millions) | Level 1 | | Level 2 | | | | Total | | Level 1 | | Level 2 | | | | Total |
| Common Stock | Common Stock | $ | 335 | | | $ | — | | | | $ | 335 | | | $ | 487 | | | $ | — | | | | $ | 487 | |
| Mutual Funds | Mutual Funds | 29 | | | — | | | | 29 | | | 14 | | | — | | | | 14 | |
| Cash and Cash Equivalents | Cash and Cash Equivalents | 157 | | | — | | | | 157 | | | 108 | | | — | | | | 108 | |
| Corporate Bonds | Corporate Bonds | — | | | 647 | | | | 647 | | | — | | | 1,013 | | | | 1,013 | |
| Government Securities | Government Securities | — | | | 88 | | | | 88 | | | — | | | 173 | | | | 173 | |
| Asset-backed Securities, Derivatives and Other | Asset-backed Securities, Derivatives and Other | — | | | 9 | | | | 9 | | | — | | | 98 | | | | 98 | |
| Total Investments in the Fair Value Hierarchy | Total Investments in the Fair Value Hierarchy | $ | 521 | | | $ | 744 | | | | $ | 1,265 | | | $ | 609 | | | $ | 1,284 | | | | $ | 1,893 | |
Investments Measured at Net Asset Value (a) | Investments Measured at Net Asset Value (a) | n/a | | n/a | | | $ | 1,062 | | | n/a | | n/a | | | $ | 1,123 | |
| Investments at Fair Value | Investments at Fair Value | $ | 521 | | | $ | 744 | | | | $ | 2,327 | | | $ | 609 | | | $ | 1,284 | | | | $ | 3,016 | |
(a) Investments measured at net asset value represent certain investments that have been measured at net asset value per share (or its equivalent) and thus are not classified in the fair value hierarchy. In accordance with ASC 820, Fair Value Measurements, the fair value amounts presented in this table are intended to permit reconciliation of the fair value hierarchy to the pension assets disclosed in Note 9, Employee Benefit Plans.
CSX 20222023 Form 10-K p.101p.106
CSX CORPORATION
PART II
Item 8. Financial Statements and Supplementary Data
NOTE 14. Other Income - Net
The Company derives income from items that are not considered operating activities. Income from these items is reported net of related expense. All components of net periodic pension and post-retirement benefit costs, excluding service cost, are included in other income - net on the consolidated income statement. Miscellaneous income (expense) may fluctuate due to timing and includes investment gains, losses and interest income as well as other non-operating activities.
For discussion of the drivers of changes in net periodic pension and post-retirement benefit credit from 2022 to 2023 and from 2021 to 2022, and from 2020 to 2021, refer to Note 9, Employee Benefit Plans. Interest income increased from 2022 to 2023 and from 2021 to 2022 primarily as a result of higher average interest rates. Debt repurchase expense decreased from 2020 to 2021 primarily as a result of long-term debt being redeemed earlier relative to maturity date in 2020. Other income – net consisted of the following:
| | | | Years Ended | | Years Ended |
| (Dollars in Millions) | (Dollars in Millions) | 2022 | | 2021 | | 2020 | (Dollars in Millions) | 2023 | | 2022 | | 2021 |
Net Periodic Pension and Post-retirement Benefit Credit (a) | Net Periodic Pension and Post-retirement Benefit Credit (a) | $ | 79 | | | $ | 64 | | | $ | 42 | |
| Interest Income | Interest Income | 42 | | | 7 | | | 17 | |
| Debt Repurchase Expense | — | | | — | | | (48) | |
| | Miscellaneous Income | |
| Miscellaneous Income | |
| Miscellaneous Income | Miscellaneous Income | 12 | | | 8 | | | 8 | |
| Total Other Income - Net | Total Other Income - Net | $ | 133 | | | $ | 79 | | | $ | 19 | |
|
(a) Excludes the service cost component of net periodic benefit cost.
CSX 20222023 Form 10-K p.102p.107
CSX CORPORATION
PART II
Item 8. Financial Statements and Supplementary Data
NOTE 15. Investment in Affiliates and Related-Party Transactions
CSX's investments in affiliates are included on the consolidated balance sheet as investments in affiliates and other companies.
| | | | | | | | | | | |
| | December | | December |
| (Dollars in Millions) | 2022 | | 2021 |
| Equity-method Investments: | | | |
| Conrail | $ | 1,124 | | | $ | 1,083 | |
| TTX | 914 | | | 849 | |
Other (a) | 254 | | | 167 | |
| Total | $ | 2,292 | | | $ | 2,099 | |
(a) Other investments as of December 31, 2022, includes an interest in Pan Am Southern, LLC, which is jointly-owned with a subsidiary of Norfolk Southern Corporation, that was acquired as part of the purchase of Pan Am. | | | | | | | | | | | |
| | December | | December |
| (Dollars in Millions) | 2023 | | 2022 |
| Conrail | $ | 1,175 | | | $ | 1,124 | |
| TTX | 961 | | | 914 | |
| Other Equity Method and Cost Method Investments | 261 | | | 254 | |
| Total | $ | 2,397 | | | $ | 2,292 | |
Conrail
Through a limited liability company, CSX and Norfolk Southern Corporation (“NS”) jointly own Conrail. CSX has a 42% economic interest and 50% voting interest in the jointly-owned entity, and NS has the remainder of the economic and voting interests. Pursuant to the Investments-Equity Method and Joint Venture Topic in the ASC, CSX applies the equity method of accounting to its investment in Conrail.
Conrail owns rail infrastructure and operates for the joint benefit of CSX and NS. This is known as the shared asset area. Conrail charges fees for right-of-way usage, equipment rentals and transportation, switching and terminal service charges in the shared asset area. These expenses are included in purchased services and other on the consolidated income statements. Future payments due to Conrail under the shared asset area agreements are shown in the table below.
| | (Dollars in Millions) | (Dollars in Millions) | Conrail Shared | (Dollars in Millions) | Conrail Shared |
| Years | Years | Asset Agreement | Years | Asset Agreement |
| 2023 | $ | 31 | |
| 2024 | 2024 | 31 | |
| 2025 | 2025 | 31 | |
| 2026 | 2026 | 31 | |
| 2027 | 2027 | 31 | |
| 2028 | |
| Thereafter | Thereafter | 44 | |
| Total | Total | $ | 199 | |
Also, included in equity earnings of affiliates are CSX’s 42% share of Conrail’s income and its amortization of the fair value write-up arising from the acquisition of Conrail and certain other adjustments. The amortization primarily represents the additional after-tax depreciation expense related to the write-up of Conrail’s fixed assets when the original purchase price, from the 1997 acquisition of Conrail, was allocated based on fair value. This write-up of fixed assets resulted in a difference between CSX's investment in Conrail and its share of Conrail's underlying net equity, which is $327$323 million as of December 2022.2023.
CSX 20222023 Form 10-K p.103p.108
CSX CORPORATION
PART II
Item 8. Financial Statements and Supplementary Data
NOTE 15. Investment in Affiliates and Related-Party Transactions, continued
The following table discloses amounts related to Conrail. All amounts in the table below are included in purchased services and other expenses on the Company’s consolidated income statements.
| | | | Years Ended | | Years Ended |
| (Dollars in Millions) | (Dollars in Millions) | 2022 | | 2021 | | 2020 | (Dollars in Millions) | 2023 | | 2022 | | 2021 |
| | Rents, Fees and Services | Rents, Fees and Services | $ | 130 | | | $ | 128 | | | $ | 126 | |
| Rents, Fees and Services | |
| Rents, Fees and Services | |
| Purchase Price Amortization and Other | Purchase Price Amortization and Other | 4 | | | 4 | | | 4 | |
| Equity Earnings of Conrail | Equity Earnings of Conrail | (44) | | | (44) | | | (49) | |
| Total Conrail Expense | Total Conrail Expense | $ | 90 | | | $ | 88 | | | $ | 81 | |
As required by the Related Party Disclosures Topic in the ASC, the Company has disclosed amounts below owed to Conrail, or its subsidiaries, representing liabilities under the operating, equipment and shared area agreements with Conrail. In 2014, the Company executed two promissory notes with a subsidiary of Conrail which were included in long-term debt on the consolidated balance sheets. In December 2020, the Company completed a non-cash conversion of $224 million of 2.89% notes due 2044 as well as its existing payable balance of approximately $217 million and $224 million, 2.89% notes due 2044 into new notes. The new notes for operation of the shared asset area are $441 million, 1.31% notes due 2050. Interest expense from these promissory notes was $6 million in each 2023, 2022 2021 and 2020.2021.
| | | | December | | December | | December | | December |
| (Dollars in Millions) | (Dollars in Millions) | 2022 | | 2021 | (Dollars in Millions) | 2023 | | 2022 |
| Balance Sheet Information: | Balance Sheet Information: | | | | Balance Sheet Information: | | | |
| CSX Accounts Payable to Conrail | CSX Accounts Payable to Conrail | $ | 136 | | | $ | 100 | |
| Promissory Notes Payable to Conrail Subsidiary | Promissory Notes Payable to Conrail Subsidiary | | | | Promissory Notes Payable to Conrail Subsidiary | | | |
| 1.31% CSX Promissory Note due December 2050 | 1.31% CSX Promissory Note due December 2050 | 73 | | | 73 | |
| 1.31% CSXT Promissory Note due December 2050 | 1.31% CSXT Promissory Note due December 2050 | 368 | | | 368 | |
|
TTX Company
TTX Company ("TTX") is a privately-held corporation engaged in the business of providing its owner-railroads with standardized fleets of intermodal, automotive and general use railcars at time and mileage rates. CSX owns about 20 percent of TTX's common stock, and the remaining is owned by the other leading North American railroads and their affiliates. Pursuant to the Investments-EquityInvestments - Equity Method topicTopic in the ASC, CSX applies the equity method of accounting to its investment in TTX. As part of the Pan Am acquisition in June 2022, CSX acquired an immaterial amount of TTX stock, which was subsequently repurchased by TTX in December 2022.
CSX 20222023 Form 10-K p.104p.109
CSX CORPORATION
PART II
Item 8. Financial Statements and Supplementary Data
NOTE 15. Investment in Affiliates and Related-Party Transactions, continued
As required by the Related Party Disclosures Topic in the ASC, the following table discloses amounts related to TTX. Car hire rents and equity earnings are included in equipment and other rents expense on the Company’s consolidated income statement.
| | | | Years Ended | | Years Ended |
| (Dollars in Millions) | (Dollars in Millions) | 2022 | | 2021 | | 2020 | (Dollars in Millions) | 2023 | | 2022 | | 2021 |
| Income Statement Information: | Income Statement Information: | |
| Car Hire Rents | Car Hire Rents | $ | 241 | | | $ | 221 | | | $ | 219 | |
| Car Hire Rents | |
| Car Hire Rents | |
| Equity Earnings of TTX | Equity Earnings of TTX | (51) | | | (52) | | | (51) | |
| Total TTX Expense | Total TTX Expense | $ | 190 | | | $ | 169 | | | $ | 168 | |
|
Also included below is balance sheet information related to CSX's payable to TTX, which represents car rental liabilities.
| | | | | | | | | | | |
| December | | December |
| Balance Sheet Information: | 2022 | | 2021 |
| CSX Payable to TTX | $ | 38 | | | $ | 35 | |
| | | | | | | | | | | |
| (Dollars in Millions) | December | | December |
| Balance Sheet Information: | 2023 | | 2022 |
| CSX Payable to TTX | $ | 43 | | | $ | 38 | |
NOTE 16. Other Comprehensive Income (Loss)
CSX reports comprehensive earnings or loss in accordance with the Comprehensive Income Topic in the ASC in the consolidated comprehensive income statement. Total comprehensive earnings are defined as all changes in shareholders' equity during a period, other than those resulting from investments by and distributions to shareholders.shareholders (e.g. issuance of equity securities and dividends). Generally, for CSX, total comprehensive earnings equal net earnings plus or minus adjustments for pension and other post-retirement liabilities as well as derivative activity and other adjustments. Total comprehensive earnings represent the activity for a period net of tax and were $3.8 billion, $4.2 billion and $4.0 billion for 2023, 2022 and $2.8 billion for 2022, 2021, and 2020, respectively.
While total comprehensive earnings is the activity in a period and is largely driven by net earnings in that period, accumulated other comprehensive income or loss (“AOCI”)AOCI represents the cumulative balance of other comprehensive income, net of tax, as of the balance sheet date. For CSX, AOCI is primarily the cumulative balance related to pension and other post-retirement benefit adjustments, interest rate derivatives and CSX's share of AOCI of equity method investees.
CSX 20222023 Form 10-K p.105p.110
CSX CORPORATION
PART II
Item 8. Financial Statements and Supplementary Data
NOTE 16. Other Comprehensive Income (Loss), continued
Changes in the AOCI balance by component are shown in the following table. Amounts reclassified in pension and other post-employment benefits to net earnings relate to the amortization of actuarial losses and are included in other income-netincome - net on the consolidated income statements. See Note 9, Employee Benefit Plans, for further information. Interest rate derivatives consist of forward starting interest rate swaps classified as cash flow hedges. See Note 10, Debt and Credit Agreements, for further information. Items classified as other primarily represent CSX's share of AOCI of equity method investees. Amounts reclassified in other to net earnings are included in purchased services and other or equipment and other rents on the consolidated income statements.
| | Pension and Other Post-Employment Benefits | Interest Rate Derivatives | Other | Accumulated Other Comprehensive Income (Loss) |
| Pension and Other Post-Employment Benefits | | | Pension and Other Post-Employment Benefits | Interest Rate Derivatives | Other | Accumulated Other Comprehensive (Loss) Income |
| (Dollars in Millions) | (Dollars in Millions) | |
| Balance December 31, 2019 - Net of Tax | $ | (619) | | $ | — | | $ | (56) | | $ | (675) | |
| Other Comprehensive Income (Loss) | |
| (Loss) Income Before Reclassifications | (17) | | 80 | | (10) | | 53 | |
| Amounts Reclassified to Net Earnings | 47 | | — | | 5 | | 52 | |
| Tax Expense | (9) | | (18) | | (1) | | (28) | |
| Total Other Comprehensive Income (Loss) | $ | 21 | | $ | 62 | | $ | (6) | | $ | 77 | |
| Balance December 31, 2020 - Net of Tax | |
| Balance December 31, 2020 - Net of Tax | |
| Balance December 31, 2020 - Net of Tax | Balance December 31, 2020 - Net of Tax | $ | (598) | | $ | 62 | | $ | (62) | | $ | (598) | |
| Other Comprehensive Income (Loss) | Other Comprehensive Income (Loss) | |
| | Income Before Reclassifications | |
| Income Before Reclassifications | |
| Income Before Reclassifications | Income Before Reclassifications | 147 | | 11 | | — | | 158 | |
| Amounts Reclassified to Net Earnings | Amounts Reclassified to Net Earnings | 66 | | — | | 15 | | 81 | |
| Tax Expense | Tax Expense | (46) | | (3) | | — | | (49) | |
| Total Other Comprehensive Income | Total Other Comprehensive Income | $ | 167 | | $ | 8 | | $ | 15 | | $ | 190 | |
| Balance December 31, 2021 - Net of Tax | Balance December 31, 2021 - Net of Tax | $ | (431) | | $ | 70 | | $ | (47) | | $ | (408) | |
| Other Comprehensive Income (Loss) | Other Comprehensive Income (Loss) | |
| | (Loss) Income Before Reclassifications | (Loss) Income Before Reclassifications | (129) | | 88 | | — | | (41) | |
| | (Loss) Income Before Reclassifications | |
| | (Loss) Income Before Reclassifications | |
| Amounts Reclassified to Net Earnings | |
| Tax Benefit (Expense) | |
| Total Other Comprehensive (Loss) Income | |
| Balance December 31, 2022 - Net of Tax | |
| Other Comprehensive Income (Loss) | |
| | Income Before Reclassifications | |
| | Income Before Reclassifications | |
| | Income Before Reclassifications | |
| Amounts Reclassified to Net Earnings | Amounts Reclassified to Net Earnings | 44 | | — | | 2 | | 46 | |
| Tax Expense | Tax Expense | 19 | | (8) | | 4 | | 15 | |
| Total Other Comprehensive (Loss) Income | $ | (66) | | $ | 80 | | $ | 6 | | $ | 20 | |
| Balance December 31, 2022 - Net of Tax | $ | (497) | | $ | 150 | | $ | (41) | | $ | (388) | |
| Total Other Comprehensive Income | |
| Balance December 31, 2023 - Net of Tax | |
CSX 20222023 Form 10-K p.106p.111
CSX CORPORATION
PART II
Item 8. Financial Statements and Supplementary Data
NOTE 17. Business Combinations
Acquisition of Pan Am Systems, Inc.
On June 1, 2022, CSX completed its acquisition of Pan Am Systems, Inc. (“Pan Am”), which is the parent company of Pan Am Railways, Inc. who jointly owns Pan Am Southern, LLC with a subsidiary of Norfolk Southern Corporation. Pan Am owns and operates a highly integrated, nearly 1,200-mile rail network and has a joint interest in the more than 600-mile Pan Am Southern system. This acquisition expands CSX’s reach in the Northeastern United States. The results of Pan Am's operations and its cash flows were consolidated prospectively.
The Company accounted for the transaction using the acquisition method in accordance with ASC Topic 805, Business Combinations.Combinations. The purchase price allocation was finalized as of December 31, 2022, and total measurement period adjustments to the preliminary allocation were immaterial.
The closing price of $600 million was funded through a combination of common stock valued at $422 million and cash totaling $178 million. Cash payments are included in investing activities on the Company's consolidated cash flow statement. Total cash consideration paid to acquire the business includes a $30 million deposit paid in 2020.
The allocation of total consideration to the fair values of the acquired assets and liabilities of Pan Am is summarized in the table below.
| | | | | |
| (Dollars in Millions) | June 1, 2022 |
| Assets Acquired: | |
| Accounts Receivable, net | $ | 46 | |
| Properties and Equipment, net | 600 |
| Goodwill | 17 |
| Investments in Affiliates | 90 |
| Other Assets | 11 |
| Total Assets Acquired | $ | 764 | |
| Liabilities Assumed: | |
| Accounts Payable and Accrued Liabilities | $ | 32 | |
| Deferred Tax Liabilities | 75 | |
| Other Long-term Liabilities | 57 | |
| Total Liabilities Assumed | $ | 164 | |
| Fair Value of Assets Acquired, Net of Liabilities Assumed: | $ | 600 | |
Properties and equipment of $600 million include road and track assets, work equipment, land, buildings and other assets. The investments in affiliates includes the interest in Pan Am Southern, LLC acquired as part of the purchase as well as other investments.
CSX 20222023 Form 10-K p.107p.112
CSX CORPORATION
PART II
Item 8. Financial Statements and Supplementary Data
NOTE 17. Business Combinations, continued
The Company has incurred costs related to this acquisition of approximately $32 million, of which $22 million was incurred in 2022 and $10 million was incurred in 2021. All acquisition-related costs were expensed as incurred and have been recorded in labor and fringe or purchased services and other in the accompanying consolidated income statements.
This acquisition is not material or significant with respect to the Company’s financial statements when reviewed under the quantitative and qualitative considerations of Regulation S-X Article 11 and ASC Topic 805.805. As the acquisition is not material or significant, CSX has not provided pro forma information relating to the pre-acquisition period.
Acquisition of Quality Carriers, Inc.
On July 1, 2021, the Company completed its acquisition of Quality Carriers, the largest provider of bulk liquid chemicals truck transportation in North America, for $544 million in cash, which is presented on the statement of cash flows net of $3 million cash acquired. Through a network of over 100 company-owned and affiliate terminals and facilities in key locations throughout the United States, Canada and Mexico, Quality Carriers provides transportation services to many of the leading chemical producers and shippers in North America. The results of Quality Carriers' operations and its cash flows were consolidated prospectively.
The Company accounted for the transaction using the acquisition method in accordance with ASC Topic 805, Business Combinations.Combinations. The purchase price allocation was finalized as of December 31, 2021, and total measurement period adjustments to the preliminary allocation were immaterial. The allocation of total consideration to the fair values of the acquired assets and liabilities of Quality Carriers is summarized in the table below.
| | | | | |
| (Dollars in Millions) | July 1, 2021 |
| Assets Acquired: | |
| Cash and Cash Equivalents | $ | 3 | |
| Accounts Receivable, net | 113 | |
| Properties and Equipment, net | 225 | |
| Goodwill | 213 | |
| Intangible Assets | 180 | |
| Other Assets | 9 | |
| Total Assets Acquired | $ | 743 | |
| Liabilities Assumed: | |
| Accounts Payable and Accrued Liabilities | $ | 48 | |
| Finance Lease Obligations and Notes Payable | 68 | |
| Casualty, Environmental and Other Reserves | 62 | |
| Other Long-term Liabilities | 21 | |
| Total Liabilities Assumed | $ | 199 | |
| Fair Value of Assets Acquired, Net of Liabilities Assumed: | $ | 544 | |
CSX 20222023 Form 10-K p.108p.113
CSX CORPORATION
PART II
Item 8. Financial Statements and Supplementary Data
NOTE 17. Business Combinations, continued
Cash paid to acquire the business, net of acquired cash and cash equivalents of $3 million, is included in investing activities on the Company's consolidated statement of cash flows. Properties and equipment of $225 million include tractors and trailers, equipment, land, buildings and other assets. For information about Goodwillgoodwill and intangible assets, see Note 18, Goodwill and Other Intangible Assets.
In 2021, the Company incurred costs related to this acquisition of approximately $17 million. All acquisition-related costs were expensed as incurred and have been recorded in purchased services and other in the accompanying consolidated income statements.
This acquisition is not material or significant with respect to the Company’s financial statements when reviewed under the quantitative and qualitative considerations of Regulation S-X Article 11 and ASC Topic 805.805. As the acquisition is not material or significant, CSX has not provided pro forma information relating to the pre-acquisition period.
Other Acquisitions
During 2023 and 2022, Quality Carriers completed several acquisitions of previous independent affiliates that were immaterial individually and in the aggregate.
CSX 20222023 Form 10-K p.109p.114
CSX CORPORATION
PART II
Item 8. Financial Statements and Supplementary Data
NOTE 18. Goodwill and Other Intangible Assets
The following table presents goodwill and other intangible asset balances and adjustments to those balances for the years ended December 31, 20222023 and 2021:2022:
| | Goodwill | | Intangible Assets | |
| Goodwill | |
| (Dollars in Millions) | (Dollars in Millions) | Net Carrying Amount | | Cost | Accumulated Amortization | Net Carrying Amount | | Total Goodwill and Other Intangible Assets - Net |
| Balance at December 31, 2020 | $ | 63 | | | $ | — | | $ | — | | $ | — | | | $ | 63 | |
| Additions | 213 | | | 180 | | — | | 180 | | | 393 | |
| Amortization | — | | | — | | (5) | | (5) | | | (5) | |
| Balance at December, 31, 2021 | $ | 276 | | | $ | 180 | | $ | (5) | | $ | 175 | | | $ | 451 | |
| (Dollars in Millions) | |
| (Dollars in Millions) | | Net Carrying Amount | | Cost | Accumulated Amortization | Net Carrying Amount | | Total Goodwill and Other Intangible Assets - Net |
| Balance at December 31, 2021 | |
| Additions | Additions | 43 | | | 18 | | — | | 18 | | | 61 | |
| Amortization | Amortization | — | | | — | | (10) | | (10) | | | (10) | |
| Balance at December, 31, 2022 | Balance at December, 31, 2022 | $ | 319 | | | $ | 198 | | $ | (15) | | $ | 183 | | | $ | 502 | |
| Additions | |
| Amortization | |
| Balance at December, 31, 2023 | |
AcquisitionAs a result of the acquisition of Pan Am Systems, Inc.
Goodwill related to the Pan Am acquisitionon June 1, 2022, CSX recognized $17 million of $17 milliongoodwill. The goodwill was calculated as the excess of the consideration paid over the fair value of net assets assumed as of June 1, 2022 and relates primarily to the ability of CSX to extend the reach of its service to a wider customer base over an expanded territory, creating new market prospects and efficiencies. Goodwill recognized in this acquisition is not deductible for tax purposes.
Acquisition ofDuring 2023 and 2022, Quality Carriers Inc.completed several acquisitions that were immaterial individually and in aggregate. The acquisitions resulted in the addition of $6 million and $26 million of goodwill in 2023 and 2022, respectively. Other intangible assets recognized as part of these acquisitions were $8 million and $18 million in 2023 and 2022, respectively.
As a resultThe Company's intangible assets balance primarily relates to intangibles recognized as part of the acquisition of Quality Carriers Inc. on July 1, 2021, CSXin 2021. Intangible assets recognized goodwill and intangible assets.The goodwill of $213 million was calculated asfrom the excess of the consideration paid over the fair value of net assets assumed as of July 1, 2021 and relates primarily to the ability of CSX to extend the reach of its network and gain access to new products, markets, and regions through a unique and competitive multimodal solution that leverages the reach of truck transportation with the cost advantage of rail-based services. Goodwill recognized in the acquisition is deductible for tax purposes.
Intangible assets of $180 million consist of $150 million of customer relationships and $30 million of trade names that will be amortized over a weighted-average period of 20 years and 15 years, respectively.
During 2022, Quality Carriers completed several acquisitions that were immaterial individually andthe fourth quarter 2023, the Company changed the date of its annual assessment of Goodwill to October 1st for all reporting units. The change in aggregate that resultedtesting date for goodwill is a change in the addition of $26 million of goodwill and $18 million other intangible assets.
Prior to 2021,accounting principle, which management believes is preferable as it will create consistency in the Company's goodwill balance relatedimpairment testing procedures across its reporting units. This change was not material to affiliates of CSXT, primarily P&L Transportation, Inc. In fourth quarter 2022, CSX performed its annual evaluation of each reporting unit'sCSX's consolidated financial statements and it did not delay, accelerate, or avoid any potential goodwill and intangible assets for impairment.impairment charges. No impairment was recorded as a result of this evaluation.the assessment.
CSX 20222023 Form 10-K p.110p.115
Item 9. Changes in and Disagreements with Accountants on Accounting and Financial Disclosure
None
Item 9A. Controls and Procedures
Evaluation of Disclosure Controls and Procedures
As of December 31, 2022,2023, under the supervision and with the participation of CSX's Chief Executive Officer (“CEO”) and Chief Financial Officer (“CFO”), management has evaluated the effectiveness of the design and operation of the Company's disclosure controls and procedures. Based on that evaluation, the CEO and CFO concluded that, as of December 31, 2022,2023, the Company's disclosure controls and procedures were effective at the reasonable assurance level in timely alerting them to material information required to be included in CSX’s periodic SEC reports.
Management's Report on Internal Control over Financial Reporting
CSX’s management is responsible for establishing and maintaining adequate internal control over financial reporting, as such term is defined in Exchange Act Rules 13a-15(f) and 15d-15(f). Under the supervision and with the participation of the management of CSX, including CSX’s CEO and CFO, CSX conducted an evaluation of the effectiveness of the Company’s internal control over financial reporting as of December 31, 20222023 based on the 2013 framework in Internal Control – Integrated Framework issued by the Committee of Sponsoring Organizations of the Treadway Commission, which is also referred to as COSO. Based on that evaluation, management of CSX concluded that the Company’s internal control over financial reporting was effective as of December 31, 2022.2023. Management's assessment of the effectiveness of internal control over financial reporting is expressed at the level of reasonable assurance because a control system, no matter how well designed and operated, can provide only reasonable, but not absolute, assurance that the control system's objectives will be met.
The Company’s internal control over financial reporting as of December 31, 20222023 has been audited by Ernst & Young LLP, an independent registered public accounting firm, as stated in their report which is included elsewhere herein.
CSX 20222023 Form 10-K p.111p.116
REPORT OF INDEPENDENT REGISTERED PUBLIC ACCOUNTING FIRM
To the Shareholders and the Board of Directors of CSX Corporation
Opinion on Internal Control Over Financial Reporting
We have audited CSX Corporation’s internal control over financial reporting as of December 31, 2022,2023, based on criteria established in Internal Control—Integrated Framework issued by the Committee of Sponsoring Organizations of the Treadway Commission (2013 framework) (the COSO criteria). In our opinion, CSX Corporation (the Company) maintained, in all material respects, effective internal control over financial reporting as of December 31, 2022,2023, based on the COSO criteria.
We also have audited, in accordance with the standards of the Public Company Accounting Oversight Board (United States) (PCAOB), the consolidated balance sheets of CSX Corporationthe Company as of December 31, 20222023 and 2021, and2022, the related consolidated statements of income, comprehensive income, cash flows, and changes in shareholders’shareholders' equity and cash flows for each of the three years in the period ended December 31, 2022,2023, and the related notes of the Company and our report dated February 15, 202314, 2024, expressed an unqualified opinion thereon.
Basis for Opinion
The Company’s management is responsible for maintaining effective internal control over financial reporting and for its assessment of the effectiveness of internal control over financial reporting included in the accompanying Management’s Report on Internal Control over Financial Reporting. Our responsibility is to express an opinion on the Company’s internal control over financial reporting based on our audit. We are a public accounting firm registered with the PCAOB and are required to be independent with respect to the Company in accordance with the U.S. federal securities laws and the applicable rules and regulations of the Securities and Exchange Commission and the PCAOB.
We conducted our audit in accordance with the standards of the PCAOB. Those standards require that we plan and perform the audit to obtain reasonable assurance about whether effective internal control over financial reporting was maintained in all material respects.
Our audit included obtaining an understanding of internal control over financial reporting, assessing the risk that a material weakness exists, testing and evaluating the design and operating effectiveness of internal control based on the assessed risk, and performing such other procedures as we considered necessary in the circumstances. We believe that our audit provides a reasonable basis for our opinion.
CSX 20222023 Form 10-K p.112p.117
REPORT OF INDEPENDENT REGISTERED PUBLIC ACCOUNTING FIRM, continued
Definition and Limitations of Internal Control over Financial Reporting
A company’s internal control over financial reporting is a process designed to provide reasonable assurance regarding the reliability of financial reporting and the preparation of financial statements for external purposes in accordance with generally accepted accounting principles. A company’s internal control over financial reporting includes those policies and procedures that (1) pertain to the maintenance of records that, in reasonable detail, accurately and fairly reflect the transactions and dispositions of the assets of the company; (2) provide reasonable assurance that transactions are recorded as necessary to permit preparation of financial statements in accordance with generally accepted accounting principles, and that receipts and expenditures of the company are being made only in accordance with authorizations of management and directors of the company; and (3) provide reasonable assurance regarding prevention or timely detection of unauthorized acquisition, use, or disposition of the company’s assets that could have a material effect on the financial statements.
Because of its inherent limitations, internal control over financial reporting may not prevent or detect misstatements. Also, projections of any evaluation of effectiveness to future periods are subject to the risk that controls may become inadequate because of changes in conditions, or that the degree of compliance with the policies or procedures may deteriorate.
/s/ Ernst & Young LLP
Jacksonville, Florida
February 15, 202314, 2024
CSX 20222023 Form 10-K p.113p.118
Changes in Internal Control over Financial Reporting
There were no material changes in the Company’s internal control over financial reporting.
Item 9B. Other Information
NoneOn November 10, 2023, Nathan D. Goldman, Executive Vice President, Chief Legal Officer and Corporate Secretary, adopted a trading plan intended to satisfy Rule 10b5-1(c) to sell up to 83,000 shares of CSX common stock and 161,487 employee stock options to be exercised via same-day-sale on or after February 20, 2024, subject to certain conditions, to be in effect until November 8, 2024 unless otherwise terminated pursuant to the terms of the trading plan.
During the fourth quarter of 2023, no other Company directors or officers adopted or terminated any "Rule 10b5-1 trading arrangement" or any "non-Rule 10b5-1 trading arrangement" as each term is defined in Item 408 of Regulation S-K.
Item 9C. Disclosure Regarding Foreign Jurisdictions That Prevent Inspections
Not applicable.
PART III
Item 10. Directors, Executive Officers of the Registrant and Corporate Governance
In accordance with Instruction G(3) of Form 10-K, the information required by this item is incorporated herein by reference to the Proxy Statement. The Proxy Statement will be filed no later than May 1, 2023April 30, 2024 with respect to the 20232024 annual meeting of shareholders, except for the information regarding the executive officers of the Company. Information regarding executive officers is included in Part I of this report under the caption "Executive Officers of the Registrant."
Item 11. Executive Compensation
In accordance with Instruction G(3) of Form 10-K, the information required by this Item is incorporated herein by reference to the Proxy Statement (see Item 10 above).
Item 12. Security Ownership of Certain Beneficial Owners and Management and Related Stockholder Matters
In accordance with Instruction G(3) of Form 10-K, the information required by this Item is incorporated herein by reference to the Proxy Statement (see Item 10 above).
Item 13. Certain Relationships and Related Transactions, and Director Independence
In accordance with Instruction G(3) of Form 10-K, the information required by this Item is incorporated herein by reference to the Proxy Statement (see Item 10 above).
Item 14. Principal Accounting Fees and Services
In accordance with Instruction G(3) of Form 10-K, the information required by this Item is incorporated herein by reference to the Proxy Statement (see Item 10 above).
CSX 20222023 Form 10-K p.114p.119
Item 15. Exhibits, Financial Statement Schedules
(a)(1) Financial Statements
| | | | | |
| See Index to Consolidated Financial Statements on page | |
(2) Financial Statement Schedules
The information required by Schedule II, Valuation and Qualifying Accounts, is included in Note 5 to the Consolidated Financial Statements, Casualty, Environmental and Other Reserves. All other financial statement schedules are not applicable.
(3) Exhibits
See exhibits listed under part (b) below.
(b) The documents listed below are being filed or have previously been filed on behalf of CSX and are incorporated herein by reference from the documents indicated and made a part hereof. Exhibits not previously filed are filed herewith. Pursuant to Regulation S-K, Item 601(b)(4)(iii), instruments that define the rights of holders of the Registrant's long-term debt securities, where the long-term debt securities authorized under each such instrument do not exceed 10% of the Registrant's total assets, have been omitted and will be furnished to the Commission upon request.
| | | | | | | | |
| Exhibit designation | Nature of exhibit | Previously filed
as exhibit to |
| 2.1 | Distribution Agreement, dated as of July 26, 2004, by and among CSX Corporation, CSX Transportation, Inc., CSX Rail Holding Corporation, CSX Northeast Holding Corporation, Norfolk Southern Corporation, Norfolk Southern Railway Company, CRR Holdings LLC, Green Acquisition Corp., Conrail Inc., Consolidated Rail Corporation, New York Central Lines LLC, Pennsylvania Lines LLC, NYC Newco, Inc. and PRR Newco, Inc. | September 2, 2004, Exhibit 2.1, Form 8-K |
| 3.1 | | February 11, 2015,
Exhibit 3.1, Form 10-K |
| 3.2 | | June 7, 2021 Exhibit 3.1, Form 8-K |
| 3.3 | | December 13, 2022,
Exhibit 3.1, Form 8-K |
| Instruments Defining the Rights of Security Holders, Including Debentures: |
| 4.1(a)(P) | Indenture, dated August 1, 1990, between the Registrant and The Chase Manhattan Bank, as Trustee | September 7, 1990,
Form SE |
| 4.1(b)(P) | First Supplemental Indenture, dated as of June 15, 1991, between the Registrant and The Chase Manhattan Bank, as Trustee | May 28, 1992,
Exhibit 4(c), Form SE |
| 4.1(c) | | June 5, 1997,
Exhibit 4.3, Form S-4
(Registration No. 333-28523)
|
| 4.1(d) | | May 12, 1998,
Exhibit 4.2, Form 8-K
|
| 4.1(e) | | November 7, 2001,
Exhibit 4.1, Form 10-Q
|
| 4.1(f) | | October 27, 2003,
Exhibit 4.1, Form 8-K
|
| 4.1(g) | | November 3, 2004,
Exhibit 4.1, Form 10-Q
|
CSX 20222023 Form 10-K p.115p.120
| | | | | | | | |
| Exhibit designation | Nature of exhibit | Previously filed
as exhibit to |
| 4.1(h) | | April 26, 2007,
Exhibit 4.4, Form 8-K
|
| 4.1(i) | | April 19, 2010,
Exhibit 4.1, Form 10-Q
|
| 4.1(j) | | February 12, 2019,
Exhibit 4.1.10, Form S-3ASR
|
| 4.1(k) | | December 10, 2020
Exhibit 4.3, Form 8-K |
| 4.1(l) |
| July 28, 2022,
Exhibit 4.3, Form 8-K
|
| 4.2* | | |
| Material Contracts: |
| 10.1 | Transaction Agreement, dated as of June 10, 1997, by and among CSX Corporation, CSX Transportation, Inc., Norfolk Southern Corporation, Norfolk Southern Railway Company, Conrail Inc., Consolidated Rail Corporation and CRR Holdings LLC, with certain schedules thereto | July 8, 1997, Exhibit 10, Form 8-K |
| 10.2 | Amendment No. 1, dated as of August 22, 1998, to the Transaction Agreement, dated as of June 10, 1997, by and among CSX Corporation, CSX Transportation, Inc., Norfolk Southern Corporation, Norfolk Southern Railway Company, Conrail Inc., Consolidated Rail Corporation and CRR Holdings, LLC | June 11, 1999, Exhibit 10.1, Form 8-K |
| 10.3 | Amendment No. 2, dated as of June 1, 1999, to the Transaction Agreement, dated as of June 10, 1997, by and among CSX Corporation, CSX Transportation, Inc., Norfolk Southern Corporation, Norfolk Southern Railway Company, Conrail Inc., Consolidated Rail Corporation and CRR Holdings, LLC | June 11, 1999, Exhibit 10.2, Form 8-K |
| 10.4 | Amendment No. 3, dated as of August 1, 2000, to the Transaction Agreement by and among CSX Corporation, CSX Transportation, Inc., Norfolk Southern Corporation, Norfolk Southern Railway Company, Conrail Inc., Consolidated Rail Corporation, and CRR Holdings, LLC. | March 1, 2001, Exhibit 10.34, Form 10-K |
| 10.5 | Amendment No. 4, dated and effective as of June 1, 1999, and executed in April 2004, to the Transaction Agreement, dated as of June 10, 1997, by and among CSX Corporation, CSX Transportation, Inc., Norfolk Southern Corporation, Norfolk Southern Railway Company, Conrail Inc., Consolidated Rail Corporation and CRR Holdings, LLC | August 6, 2004, Exhibit 99.1, Form 8-K |
| 10.6 | Amendment No. 5, dated as of August 27, 2004, to the Transaction Agreement, dated as of June 10, 1997, by and among CSX Corporation, CSX Transportation, Inc., Norfolk Southern Corporation, Norfolk Southern Railway Company, Conrail Inc., Consolidated Rail Corporation and CRR Holdings LLC | September 2, 2004, Exhibit 10.1, Form 8-K |
| 10.7 | | June 11, 1999, Exhibit 10.6, Form 8-K |
CSX 20222023 Form 10-K p.116p.121
| | | | | | | | |
| Exhibit designation | Nature of exhibit | Previously filed
as exhibit to |
| 10.8 | | June 11, 1999, Exhibit 10.4, Form 8-K |
| 10.9 | | June 11, 1999, Exhibit 10.5, Form 8-K |
| 10.10 | | June 11, 1999, Exhibit 10.7, Form 8-K |
| 10.11 | | September 2, 2004, Exhibit 10.2, Form 8-K |
| 10.12** | | February 22, 2008,
Exhibit 10.3, Form 10-K
|
| 10.13** | | March 4, 1994,
Exhibit 10.5, Form 10-K |
| 10.14** | | March 4, 2002,
Exhibit 10.23, Form 10-K
|
| 10.15** | | March 4, 2002,
Exhibit 10.24, Form 10-K
|
| 10.16** | | May 7, 2010,
Exhibit 10.1, Form 8-K |
| 10.17** | | December 21, 2020,
Exhibit 99.1, Form S-8 |
10.18**
| | February 7, 2018
Exhibit 10.41, Form 10-K
|
10.19** | | February 7, 2018
Exhibit 10.42, Form 10-K |
10.20** | | February 7, 2018
Exhibit 10.43, Form 10-K |
10.21** | | February 12, 2019
Exhibit 10.1, Form 8-K |
10.22 | $1,200,000,000 Five-Year Revolving Credit Agreement, dated as of March 29, 2019, among CSX Corporation, as borrower, the lenders party thereto, and JPMorgan Chase Bank, N.A., as administrative agent | April 3, 2019
Exhibit 10.1, Form 8-K |
10.23*10.19** | | May 8, 2019
Exhibit 10.1, Form 8-K |
10.24** | | February 21, 2020
Exhibit 10.1, Form 8-K
|
10.25** | | February 21, 2020
Exhibit 10.2, Form 8-K
|
10.26** | | February 26, 2016
Exhibit 10.2, Form 8-K
|
| | | | | | | | |
Exhibit designation | Nature of exhibit | Previously filed
as exhibit to |
10.27** | | May 8, 2020
Exhibit 10.1, Form 8-K
|
10.28*10.20** | | October 21, 2022,
Exhibit 10.1, Form 10-Q |
10.29*10.21** | | October 21, 2022, Exhibit 10.2, Form 10-Q |
| 10.22 | $1,200,000,000 Five-Year Revolving Credit Agreement, dated as of February 28, 2023, among CSX Corporation, as borrower, the lenders party thereto, and JPMorgan Chase Bank, N.A., as administrative agent | March 3, 2023
Exhibit 10.1, Form 8-K |
| 10.23** | | April 20, 2023,
Exhibit 10.2, Form 10-Q |
| 10.24** | | April 20, 2023,
Exhibit 10.3, Form 10-Q |
| 10.25** | | April 20, 2023,
Exhibit 10.4, Form 10-Q |
| 10.26** | | April 20, 2023,
Exhibit 10.5, Form 10-Q |
| | | | | | | | |
| Exhibit designation | Nature of exhibit | Previously filed
as exhibit to |
| 10.27** | | April 20, 2023,
Exhibit 10.6, Form 10-Q |
| 10.28** | | April 20, 2023,
Exhibit 10.7, Form 10-Q |
| 10.29** | | October 21, 2022,20, 2023,
Exhibit 10.1, Form 10-Q |
| 10.30** | | October 20, 2023,
Exhibit 10.2, Form 10-Q |
| 10.31** | | October 20, 2023,
Exhibit 10.3, Form 10-Q |
| 10.32** | | October 20, 2023,
Exhibit 10.4, Form 10-Q |
| 10.33** | | October 20, 2023,
Exhibit 10.5, Form 10-Q |
| Officer certifications: |
| 31* | | |
| 32* | | |
| Interactive data files: |
| 101* | The following financial information from CSX Corporation’s Annual Report on Form 10-K for the year ended December 31, 20222023 filed with the SEC on February 15, 2023,14, 2024, formatted in XBRL includes: (i) Consolidated Income Statements for the years ended December 31, 2022,2023, December 31, 2021,2022, and December 31, 2020,2021, (ii) Consolidated Comprehensive Income Statements for the years ended December 31, 2022,2023, December 31, 2021,2022, and December 31, 2020,2021, (iii) Consolidated Balance Sheets at December 31, 20222023 and December 31, 2021,2022, (iv) Consolidated Cash Flow Statements for the years ended December 31, 2022,2023, December 31, 20212022 and December 31, 2020,2021, (v) Consolidated Statements of Changes in Shareholders' Equity for the years ended December 31, 2022,2023, December 31, 20212022 and December 31, 2020,2021, and (vi) the Notes to Consolidated Financial Statements. | |
| 104* | The cover page from CSX Corporation’s Annual Report on Form 10-K for the year ended December 31, 20222023 formatted in iXBRL (Inline eXtensible Business Reporting Language) and contained in Exhibit 101. | |
| Other exhibits: |
| 21* | | |
22.1* | | |
| 23* | | |
| 24* | | |
| 97* | | |
| | |
| * Filed herewith |
| ** Management Contract or Compensatory Plan or Arrangement |
| (P) This Exhibit has been paper filed and is not subject to Item 601 of Reg S-K for hyperlinks. |
| Note: Items not filed herewith have been submitted in previous SEC filings. |
CSX 20222023 Form 10-K p.118p.123
Pursuant to the requirements of Section 13 or 15(d) of the Securities Exchange Act of 1934, the Registrant has duly caused this report to be signed on its behalf by the undersigned, thereunto duly authorized.
CSX CORPORATION
(Registrant)
By: /s/ ANGELA C. WILLIAMS
Angela C. Williams
Vice President and Chief Accounting Officer
(Principal Accounting Officer)
Dated: February 15, 202314, 2024
Pursuant to the requirements of the Securities Exchange Act of 1934, this report has been signed below by the following persons on behalf of the Registrant and in the capacities indicated on February 15, 2023.14, 2024.
| | | | | | | | |
| Signature | | Title |
| | | |
| /s/ JOSEPH R. HINRICHS | | President, Chief Executive Officer and Director |
| Joseph R. Hinrichs | | (Principal Executive Officer) |
| | | |
| /s/ SEAN R. PELKEY | | Executive Vice President and Chief Financial |
| Sean R. Pelkey | | Officer (Principal Financial Officer) |
| | | |
| /s/ ANGELA C. WILLIAMS | | Vice President and Chief Accounting Officer |
| Angela C. Williams | | (Principal Accounting Officer) |
| | | |
| /s/ NATHAN D. GOLDMAN | | Executive Vice President and Chief Legal Officer, Corporate Secretary |
| Nathan D. Goldman | | *Attorney-in-Fact |
| | |
CSX 20222023 Form 10-K p.119p.124
| | | | | | | | |
| Signature | | Title |
| | | |
| * | | Chairman of the Board and Director
|
| John J. Zillmer | | |
| | | |
| * | | Director |
| Donna M. Alvarado | | |
| | | |
| * | | Director |
| Thomas P. Bostick | | |
| | | |
| * | | Director |
| Steven T. Halverson | | |
| | | |
| * | | Director |
| Paul C. Hilal | | |
| | |
| * | | Director |
| David M. Moffett | | |
| | | |
| * | | Director |
| Linda H. Riefler | | |
| | | |
| * | | Director |
| Suzanne M. Vautrinot | | |
| | |
| * | | Director |
| James L. Wainscott | | |
| | |
| * | | Director |
| J. Steven Whisler | | |
| | | |
CSX 20222023 Form 10-K p.120p.125