| | | | | | |
| UNITED STATES | |
SECURITIES AND EXCHANGE COMMISSION |
| Washington, D.C. 20549 | |
| | |
| FORM 10-K | |
| | |
ANNUAL REPORT PURSUANT TO SECTION 13 OR 15(d) |
OF THE SECURITIES EXCHANGE ACT OF 1934 |
| | |
For the fiscal year ended June 30, 20152018 | Commission File Number 1-7233 |
| | |
STANDEX INTERNATIONAL CORPORATION |
(Exact name of registrant as specified in its Charter) |
| | |
DELAWARE | 31-0596149 |
(State of incorporation) | (I.R.S. Employer Identification No.) |
| |
11 KEEWAYDIN DRIVE, SALEM, NEW HAMPSHIRE | 03079 |
(Address of principal executive offices) | (Zip Code) |
| | |
(603) 893-9701 |
(Registrant’s telephone number, including area code) |
|
SECURITIES REGISTERED PURSUANT TO SECTION 12(b) OF THE SECURITIES EXCHANGE ACT OF 1934: |
| | |
Title of Each Class | | Name of Each Exchange on Which Registered |
Common Stock, Par Value $1.50 Per Share | | New York Stock Exchange |
Indicate by check mark if the Registrant is a well-known seasoned issuer, as defined in Rule 405 of the Securities Act.
YES [X] NO [ ]NO [X]
Indicate by check mark if the Registrant is not required to file reports pursuant to Section 13 or Section 15(d) of the Act.
YES [ ] NO [X]
Indicate by check mark whether the Registrant (1) has filed all reports required to be filed by Section 13 or 15(d) of the Securities Exchange Act of 1934 during the preceding 12 months (or for such shorter period that the Registrant was required to file such reports), and (2) has been subject to such filing requirements for the past 90 days. YES [X] NO [ ]
Indicate by check mark whether the registrant has submitted electronically and posted on its corporate website, if any, every Interactive Data File required to be submitted and posted pursuant to Rule 405 of Regulation S-T (§ 232.405 of this chapter) during the preceding 12 months (or for such shorter period that the registrant was required to submit and post such files). YES [X] [X]NO [ ]
Indicate by check mark if disclosure of delinquent filers pursuant to Item 405 of Regulation S-K is not contained herein and will not be contained, to the best of Registrant's knowledge, in definitive proxy or information statements incorporated by reference in Part III of this Form 10-K or any amendment to this Form 10-K. [ ]
Indicate by check mark whether the Registrant is a large accelerated filer, an accelerated filer, a non-accelerated filer, or a smaller reporting company. See definition of “large accelerated filer,” “accelerated filer” and “smaller reporting company” in Rule 12b-2 of the Exchange Act. (Check one):
Large accelerated filer X Accelerated filer Non-accelerated filer __ Smaller Reporting Company __
Indicate by check mark whether the Registrant is a shell company (as defined in Rule 12b-2 of the Exchange Act).
YES [ ] NO [X]
The aggregate market value of the voting and non-voting common equity held by non-affiliates of the Registrant at the close of business on December 31, 201429, 2017 was approximately $958,496,000.$1,288,543,257. Registrant’s closing price as reported on the New York Stock Exchange for December 31, 201429, 2017 was $77.26$101.85 per share.
The number of shares of Registrant's Common Stock outstanding on August 21, 201522, 2018 was 12,772,06112,826,411 .
DOCUMENTS INCORPORATED BY REFERENCE
Portions of the Proxy Statement for the Registrant’s 20152018 Annual Meeting of Stockholders (the “Proxy Statement”) are incorporated by reference into Part III of this report.
1
Forward Looking Statement
Statements contained in this Annual Report on Form 10-K that are not based on historical facts are "forward-looking statements"“forward-looking statements” within the meaning of the Private Securities Litigation Reform Act of 1995. Forward-looking statements may be identified by the use of forward-looking terminology such as “should,” “could,” "may,"“may,” “will,” “expect," "believe," "estimate," "anticipate," ”intends,” "continue,"“believe,” “estimate,” “anticipate,” “intend,” “continue,” or similar terms or variations of those terms or the negative of those terms. There are many factors that affect the Company’s business and the results of its operations and that may cause the actual results of operations in future periods to differ materially from those currently expected or desired.anticipated. These factors include, but are not limited to materialto: materially adverse or unforeseenunanticipated legal judgments, fines, penalties or settlements,settlements; conditions in the financial and banking markets, including fluctuations in exchange rates and the inability to repatriate foreign cash, generalcash; domestic and international recessionary economic conditions, including the impact, length and degree of the current slow growth conditionseconomic downturns on the customers and markets we serve and more specifically conditions in the food service equipment, automotive, construction, aerospace, energy, oil and gas, transportation, consumer appliance and general industrial markets,markets; lower-cost competition,competition; the relative mix of products which impact margins and operating efficiencies both domestic and foreign, in certain of our businesses,businesses; the impact of higher raw material and component costs, particularly steel, petroleum based products and refrigeration components,components; an inability to realize the expected cost savings from restructuring activities including effective completion of plant consolidations, cost reduction efforts restructuring including procurement savings and productivity enhancements, capital management improvements, strategic capital expenditures, and the implementation of lean enterprise manufacturing techniques,techniques; the inability to achieve the savings expected from theglobal sourcing of raw materials from and diversification efforts in emerging markets,markets; the impact on cost structure and on economic conditions as a result of actual and threatened increases in trade tariffs; the inability to attain expected benefits from strategic alliances or acquisitions and the inability to effectively consummate and integrate such acquisitions and achieve synergies contemplatedenvisioned by the Company. Other factors that couldCompany; market acceptance of our products; our ability to design, introduce and sell new products and related product components; the ability to redesign certain of our products to continue meeting evolving regulatory requirements; the impact the Company includeof delays initiated by our customers; and our ability to increase manufacturing production to meet demand; and potential changes to future pension funding requirements. In addition, any forward-looking statements represent management's estimates only as of the day made and should not be relied upon as representing management's estimates as of any subsequent date. While the Company may elect to update forward-looking statements at some point in the future, the Company and management specifically disclaim any obligation to do so, even if management's estimates change.
PART I
Item 1. Business
Standex International Corporation (“Standex”, the “Company" or "we"(1)) was incorporated in 1975 and is the successor of a corporation organized in 1955. As used in this report, the terms “we,” “us,” “our,” the “Company” and “Standex” mean Standex International Corporation and its subsidiaries. We have paid dividends each quarter since Standex became a public corporation in November 1964.
(1)
References in this Annual Report on Form 10-K to "Standex" or the "Company" or “we,” “our” or “us” shall mean Standex International Corporation and its subsidiaries.
Unless otherwise noted, references to years are to fiscal years.
We are a leading manufacturer of a variety of products and services for diverse commercial and industrial market segments.markets. We have 1112 operating segments,business units, aggregated and organized for reporting purposes into five segments: Food Service Equipment, Group, Engraving, Group, Engineering Technologies, Group, Electronics Products Group and Hydraulics Products Group.Hydraulics. Overall management, strategic development and financial control are maintainedled by the executive staff fromat our corporate headquarters located in Salem, New Hampshire.
Our long-term strategy is to enhance shareholder value by building larger, more profitable industrial platforms through a value creation system that assists management in meeting specific corporate strategy has several primary components.and business unit financial and strategic performance goals in order to create, improve, and enhance shareholder value. The Standex Value Creation System is a standard methodology which provides consistent tools used throughout the company in order to achieve our organization’s goals. The Standex Value Creation System employs four components: Balanced Performance Plan, Standex Growth Disciplines, Standex Operational Excellence, and Standex Talent Management. The Balanced Performance Plan process aligns annual goals throughout the business and provides a standard reporting, management and review process. It is focused on setting and
2
meeting annual and quarterly targets that support our short and long-term goals. The Standex Growth Disciplines use a set of tools and processes including market maps, growth laneways, and market tests to identify opportunities to expand the business organically and through acquisitions. Standex Operational Excellence employs a standard playbook and processes, including LEAN, to eliminate waste and improve profitability, cash flow and customer satisfaction. Finally, the Standex Talent Management process is an organizational development process that provides training, development, and succession planning for our employees throughout our worldwide organization. The Standex Value Creation System ties all disciplines in the organization together under a common umbrella by providing standard tools and processes to deliver our business objectives.
·
It is our objective to grow larger and more profitable business units through both organic initiatives and acquisitions. On an ongoing basis weWe seek to identify and implement organic growth initiatives such as new product development, geographic expansion, introduction of products and technologies into new markets and applications, and leveraging of sales synergies between business units, key accounts and strategic sales channel partners. Also, we utilizehave a long-term objective to create sizable business platforms by adding strategically aligned or “bolt on” acquisitions to strengthen the individual businesses, create both sales and cost synergies with our core business platforms, toand accelerate their growth and margin improvement. There isWe look to drive continuous improvement within our core business platforms, accelerate growth and improve margins. We have a particular focus on identifying and investing in opportunities that complement our products and will increase the global presence and capabilities of our businesses. From time to time, we have divested, and likely will continue to divest, businesses that we felt werefeel are not strategic or diddo not meet our growth and return expectations.
·
We create “Customer Intimacy” by partneringutilizing the Standex Growth Disciplines to partner with our customers in order to develop and deliver custom solutions or engineered productscomponents that provide technology-driven solutions tosolve problems for our customers.customers or otherwise meet their needs. This relationship generally provides us with the ability to sustainidentify new sales andopportunities with our customers, increase profit growth over time and provide superior operating margins tothat enhance shareholder returns. Further, we have made a priority inof developing new sales channels and leveraging strategic customer relationships.
·
We focus on operational excellence throughStandex Operational Excellence drives continuous improvement in the cost structureefficiency of our businesses andbusinesses. We recognize that our businesses are competing in a global economy that requires that we constantly striveus to improve our competitive position. We have deployed a number of management competencies to drive improvements in cost structure of our business units including operational excellence through lean enterprise, the use of low cost manufacturing facilities in countries such as Mexico India, and China, the consolidation of manufacturing facilities to achieve economies of scale and leveraging of fixed infrastructure costs, alternate sourcing to achieve procurement cost reductions, and capital improvements to increase productivity in both the shop floor productivity, which drives improvements in the cost structure ofand back-office.
The Company’s strong historical cash flow has been a cornerstone for funding our business units.
·
Our capital allocation strategy is tostrategy. We use cash flow generated from operations to fund the strategic growth programs described above, including acquisitions dividends, and capital investments for organic growth, maintenance of our capital assets and cost reductions. We recognize that cash flow is fundamental in our ability to invest in organic and acquisitive growth for our business units and return cash to our shareholders inthrough the formpayment of dividends to reflect the measure of quality from the earnings that we generate over time.and stock buybacks.
Please visit our website at www.standex.com to learn more about us or to review our most recent SEC filings. The information on our website is for informational purposes only and is not incorporated into this Annual Report on Form 10-K.
Description of Segments
Food Service Equipment
Food Service Equipment Group
Theis a provider of refrigeration, cooking, display merchandising and component pumps for the Commercial Food Service Equipment business is comprised of three groups. The Refrigeration Solutions group manufactures walk in and cabinet coolers and freezers used in commercial food facilities and some industrial, life science and scientific applications. The Cooking Solutions group manufacturers cooking equipment such as ovens, fryers, warmers and grills used in commercial food preparation and service. The Specialty Solutions group consists of a specialty pump used in beverage applications and custom display merchandising. Life Sciences markets.
Our products are used throughout the entire commercial food service process – from storage, to preparation, to cooking and to display. We focus on the challenges of enabling retail and food service establishments to provide food and beverages that are fresh and appealing while at the same time providing for food safety, and energy efficiency. In the scientific markets, our product portfolio is used to control the temperatures of critical health care products, medicines and laboratory samples.
In recent years, much of this segment has experienced head winds and operational challenges—especially with regard to standard products. We have invested in order to improve margin performance in these standard products businesses. At the same time, we plan to invest in further growing our differentiated products businesses through new product development, geographic expansion and selective acquisitions.
3
Food Service Locations
Food Service Equipment and Scientific products are manufactured in Hudson, WI; New Albany, MS; Summerville, SC; Nogales, Mexico; Simpsonville, SC; San Antonio, TX; Belleville, WI; and Mountmellick, Ireland. In addition, we have our culinary demonstration center in Allen, TX where we work with customers on design and use of select products.
Markets and Applications
The commercial food service equipment that we design and manufacture is utilized in restaurants, convenience stores, quick-service restaurants, supermarkets, drug stores and institutions such as hotels, hospitals, and both corporateschool cafeterias. The life science equipment that we design and school cafeterias to meet the challenges of providing food and beverages that are fresh and appealing while at the same time providing for food safety, energy efficiency and reliability of the equipment performance. In the scientific markets, our product portfoliomanufacture is used for research,in hospitals, pharmacies, clinical laboratories, reference laboratories, physicians’ offices and other clinical testing facilities.
Brands
NorLake®, Master-Bilt®, Lab Research products (LRP), American BioTech Supply (ABS), Cryosafe, CryoGuard, NorLake Scientific®, APW Wyott®, Bakers Pride®, Tri-Star, BKI®, Barbecue King, Ultrafryer®, Federal and storage of pharmaceuticals, reagents, enzymes, plasma, whole blood, bone marrow, viruses, stem cells DNA and plant samples.Procon®.
Food Service Equipment products are manufactured in Hudson, WI; New Albany, MS; Nogales, Mexico; Simpsonville, SC; San Antonio, TX; Belleville, WI; and Mountmellick, Ireland. In addition, we have our culinary demonstration center in Allen, TX. Our products are sold directly, through dealers, and through industry representatives in the Americas, Europe, Asia and Middle East.Products
Our product brands include:
-
Nor-Lake walk-in coolers and freezers and reach-in and under counter refrigerated cabinets to meet food service and scientific needs;
-
Master-Bilt® and Kool Star® refrigerated reach-in and under counter refrigerated cabinets, cases, display units, and walk-in coolers and freezers;
-cold storage equipment for use in the life sciences
APW Wyott®, Bakers Pride®, and Tri-Starcommercial ovens, char broilers, commercial ranges, griddles, toasters, warmers, roller grills and countertop merchandisers used in cooking, toasting, warming and merchandising food;
-
BKI® and Barbecue King® commercial cook and hold units, rotisseries, pressure fryers, ovens and baking equipment;
-
Ultrafryer® commercial deep fryers for restaurant and commercial installations;
-
Federal merchandizing display cases for bakery, deli and confectionary products; and
-
Procon® pump systems used in beverage and industrial fluid handling applications.
WeCustomers
Food Service Equipment products are sold to end-users, dealers, buying groups, consultants, government agencies and manufacturers.
Engraving
Standex Engraving Mold-Tech creates textures and surface finisheson tooling to enhance the beauty and function of a wide range of consumer goods and automotive products. Standex Engraving Mold-Tech focuses on continuing to meet the needs of a changing marketplace by offering experienced craftsmanship while investing in the latest technology. Our growth strategy is to continue to expand this segment throughour capacity to service our customers both organically and inorganically across our global market and to innovate new product introductionstechnologies to enhance the functionalization of surface textures. We are one company operating in 27 countries using the same approach to service of our customers to guarantee harmony on global programs.
Markets and acquisitions.Applications
Standex Engraving Group
The Engraving Group consists of three product lines. Mold-Tech is a world-wide leader in applying textures to molds on which manufacturers produce a final product with the desired surface textures on molded plastic parts and slush-molded parts. Mold-Tech serveshas become the global auto industry as well as consumer goods. Rolls platesleader by offering a full range of services to Original Equipment Manufacturers (OEM) markets. From start to finish, these services include the design of bespoke textures, the verification of the texture on a prototype, engraving the mold, enhancing and machinery is a niche businesspolishing it, and then offering on-site try-out support with ongoing tool maintenance and texture repair capabilities.
Specialized Standex Engraving Mold-Tech companies and brands also include:
Piazza Rosa and World Client Services which engraves patterns into rolls used to texturize building materials, packaging materials, papersoffer laser engraving and non-woven fabrics. tool finishing in Europe and Mexico.
Innovent, located in North America and Europe, is a specialized supplier of tools and machines used to produce diapers and products whichthat contain absorbent materials between layers of non-woven fabric.
We simplify the supply chain for global Original Equipment Manufacturers, “OEM”, as a single source texture solutions supplier. We provide texturizing services for the production of automotive components, particularly for interior dashboards and upholstery, textiles for paper towels and hygiene products, consumer products and cosmetic appearances, construction applications, various synthetic flooring products, and electronics used in computers, cell phones and printers.
Our worldwide Mold-Tech locations enable us to better serve our customers within key geographic areas on 6 continents including the United States, Canada, Europe, China, India, Southeast Asia, Korea, Australia, South Africa, and South America. Our products are primarily sold directly through our global sales network. The Engraving Group serves a number of industries including automotive, plastics, building products, synthetic materials, converting, textile and paper, computer, housewares, hygiene product tooling and aerospace industries.
The Engraving Group brands include:
-
Mold-Tech® which provides design and program management services texturizes molds used in the production of plastic parts and manufactures nickel shell slush mold tooling.
-
Mullen® Burst Testers.
-
Roehlen®, B.F. Perkins®, Eastern Engraving and I R International manufacture machinery, engrave rolls and plates used in production of textured industrial products.
-
Innovent is anThis engineering and manufacturing company deliveringprovides innovative product and service solutions to hygiene, aerospace and othervarious industrial clients around the world.
4
Products and Services
WeLaser Engraving offers superior features previously unavailable on products, such as multiple gloss levels, the elimination of paint and optimized scratch performance, including the ability to create nano-finishes to enhance function.
Chemical Engraving produces carefully designed textures and finishes without seams or distortion. Exclusive to Standex Engraving Mold-Tech, Digital Transfer Technology guarantees consistency, pattern integrity and texture harmony around the world.
Architexture Design Studio uses proprietary technology with proven expertise to create and test custom textures. An original texture is designed to offer beauty and function, then a graphic hybrid of the texture is wrapped on digital 3D forms using Fit-to-Form technology. The texture is printed out using Rapid Texture Prototype technology to create a large-format skin that can be wrapped on a model for testing. This verification process is called Model-Tech® which is exclusive to Standex Engraving Mold-Tech.
Tool Enhancement services increase the wear resistance of the mold. Processes include Primeform anti-scratch, laser hardening in localized areas, Tribocoat® and Release Coat.
Tool Finishing and ongoing support allows customers to achieve outstanding quality while saving valuable time. These services include laser micro-welding, polishing and lapping, laser cladding to accommodate engineering changes, mold assembly, tool management, maintenance, texture repair and on-site support. Zero Parting Line is an exclusive Standex Engraving Mold-Tech process that eliminates the appearance of matched-insert parting lines.
Nickel Shell Molds are particularly focused on growth throughspecifically designed to withstand extreme production conditions and extend the establishmentlife of new “greenfield” facilitiesthe mold. Slush molds, IMG molds, IMGL molds and IMC molds are also produced. Standex Engraving Mold-Tech is the only nickel shell supplier in emerging marketsthree global locations: Portugal, USA and development of proprietary digital based process technology. Our extensive worldwide network of 35 manufacturing and design centers provide uniform engravings to satisfy the needs of our global customers. We expect to continue to strengthen our market leadership position through continuously expanding the breadth of products and services we provide customers globally.China.
Engineering Technologies GroupCustomers
This division has become the global leader by offering a full range of services to Original Equipment Manufacturers (OEM), product designers, Tier One Suppliers and Toolmakers all around the world.
Engineering Technologies
The Engineering Technologies Group, “ETG”, provides critical engineered parts in all workable metal alloys using various forming processes. Our competitive advantage is to deliver neta provider of innovative, turnkey metal-formed solutions for OEM and near net formed single-source customized solutions which requires less input and raw material than traditional processes. The industry defines net and near net forming as the delivery of parts that can be inserted directly into the production line with no or little surface finishing required. Our precision manufacturing capabilities include metal spinning, metal forming, press forming, stretch forming, hydroforming, heat treating and brazing, computer numerical control and electrical discharge machining, high speed milling, and other fabrication services in all thickness and size ranges for all workable metal alloys.
Tier-1 manufacturers on their advanced engineering designs.
ETG solutions are in a wide variety of advanced applications, where the utilization of our precision netseek to reduce input weight and near net forming technologies, combined with our business placement within the manufacturing process to delivermaterial cost, lower part count, and reduce complexity for unique customer design challenges often involving exotic materials, large dimensions, large thicknesses or thin-wall construction, complex shapes and contours, and/or single-piece construction requirements. We devise and manufacture these cost-effective components and assemblies with reduced input weight, part count,by combining a portfolio of best-in-class forming technologies, vertically integrated manufacturing processes, proven forming technical experience, and cycle times. Theseon-site technical and design assistance.
We plan to grow Engineering Technologies Group by identifying new cutting-edge solutions are foundfor our metal-forming capabilities in the aviation, defense, energy, industrial, medical, marine, oilexisting and gas,adjacent markets via customer and manned and unmanned space markets. Our components and assemblies have been present on most major commercial aviation aircraft engines and nacellesresearch collaborations, as well as defenseby increasing market share within strategic relationships in priority market segments through customer intimacy and navy nuclear programs. We provide complex assemblies and formed solutions for the energy and oil and gas OEM’s, MRI machine formed components, and single piece formed and machined fuel and liquid oxygen tanks and tank domes for commercial and government space programs.technical education initiatives.
The group includes our legacyOur segment is comprised of two businesses including Spincraft, units, with locations in North Billerica, Massachusetts,MA, New Berlin, Wisconsin,WI, and theSpincraft ETG location in Newcastle upon Tyne in the U.K. The latest addition to the group,U.K, as well as Enginetics, has plants located in Huber Heights, and Eastlake, OH. Oursales are direct with the OEM’s in the particular market,throughout the world, with the majority of our sales in North America and Europe.
Electronics Products GroupMarkets and Applications
Engineering Technologies Group products serve applications within the space, aviation, defense, energy, medical, and general industrial markets.
-The space market we serve is comprised of components for space launch systems,
-Our aviation market includes a large portfolio of components and assemblies for OEM turbine engines,
-The defense market we serve covers a wide spectrum of metal applications,
-The energy market includes components and assemblies for new and MRO gas turbines, as well as solutions for oil & gas exploration operations.
5
Brands
This business unit’s names are Spincraft and Enginetics.
Products
-fuel tanks, tank domes, combustion liners, nozzles, and crew vehicle structures
-seals, heat shields, and combustor elements, as well as aerostructures, including air intake lipskins
-missile nose cones and fabrications, large dimension exhaust systems, navy-nuclear propulsion, and others
-components and assemblies for new and MRO gas turbines, as well as solutions for oil & gas exploration operations
-MRI scanner vessel ends, shields, and centrifuge bowls
Customers
Engineering Technologies components are sold directly to large space, aviation, defense, energy and medical companies, or suppliers to those companies.
Electronics Products Group
Electronics is a manufacturerglobal component and value-added solutions provider of custom magnetic sensing and electromechanicalpower conversion components such as: reed switches, reed relays; fluid level sensors, flow, pressure, proximity, conductive and inductive sensors; electronics assemblies; and magnetic components such as toroid and planar transformers.
assemblies. We are a global componentsfocused on designing, engineering, and manufacturing innovative electro-magnetic solutions, provider who designs, engineers, and manufactures innovative electronic components and sensorsassemblies to solve our customers’ application needs. Our mission and vision is to be a strategic partnerneeds with customers utilizing our innovative capabilities and solutions to solve challenges, and deliver high-quality products. Our components are small custom or standard parts that play an important role in larger products. Our products are vitalabsolute commitment to a diverse array of markets where a component can provide critical system feedback such as on/off, flow, level monitoring, proximity, etc., switches and control capabilities, transforming and isolating power safely, and measuring fluid levels. Our end user is typically an OEM industrial equipment manufacturer. Other end-user markets include, but are not limited to: transportation, appliances, HVAC, security, military, medical, aerospace, instrumentation, and general industrial/power applications.customer first attitude through the Partner/Solve/Deliver® approach.
Our components are manufactured in plants located in the USA, Mexico, Canada, the UK, Germany and China. We sell and build relationships globally through our own direct sales force, regional sales managers, commissioned agents, representative groups, and distribution channels. Our products are sold globally with approximately fifty percent of sales within North America, forty percent within Europe and the balance in Asia.
Our brand names are Standex Electronics and Standex-Meder Electronics. We continue to expand thethis business through organic growth with current customers, new customers, developing new products and technologies, geographic expansion, and inorganic growth through strategic acquisitions.
Components are manufactured in plants located in the USA, Mexico, the U.K., Germany, Japan and China.
Hydraulics Products GroupMarkets and Applications
The diverse products and vertically integrated manufacturing capabilities offered for engineered solutions are vital to an array of markets for providing safe and efficient power transformation, current monitoring, isolation, as well as sensors to monitor systems for function and safety. The end-user is typically an OEM industrial equipment manufacturer. End-user markets include, but are not limited to transportation, smart-grid, alternative energy, appliances, HVAC, security, military, medical, aerospace, test and measurement, power distribution, and general industrial applications.
Brands
Business unit names are Standex Electronics, Standex-Meder Electronics, Northlake Engineering, Standex Electronics Japan, and world renown reed switch product brands of MEDER, KENT, and KOFU switches.
Products
The magnetic sensing products employ technologies such as reed switch, Hall Effect, inductive, conductive and other technologies. Sensing based solutions include a complete portfolio of reed relays, fluid level, proximity, motion, flow, HVAC condensate, hydraulic pressure differential as well as custom electronics sensors containing these technologies. The magnetics or power conversion products include custom wound transformers and inductors for low and high frequency applications, current sense technology, advanced planar transformer technology, value added assemblies, and mechanical packaging.
Customers
The business sells to a wide variety of automotive, industrial, medical, power and consumer goods customers globally through a direct sales force, regional sales managers, and field applications engineers, commissioned agents, representative groups, and distribution channels.
Hydraulics
The Hydraulics Products Groupsegment is a leading global manufacturer of mobile hydraulic cylinders including single or double acting telescopic and piston rod hydraulic cylinders. Additionally we manufacture a specialty pneumatic cylinder and promote complete wet line kits, which are complete hydraulic systems for the heavy off-road construction and refuse markets.
6
We are focused on custom designs and manufacturing of products that include a pump, valves, hosemeet customer specific requirements or applications. Our in house custom design abilities and fittings.responsiveness to our customers’ needs drive our continuous top line growth opportunities. We leverage our full line of products for the dump truck and trailer market and deep expertise in their application to expand into new markets, targeting the most challenging custom applications. Our flexible design capability, global supply chain and speed to market enable us to be successful in our expansion efforts. Our team is dedicated to superior customer service through our technical engineering support and on-time delivery.
We plan to grow Hydraulics by expanding our cylinder offering, completing the hydraulics system with wet kits and sensors.
We manufacture our cylinders in Hayesville, OH and Tianjin, China.
Markets and Applications
Industries that use our products are construction equipment, refuse, airline support, mining, oil and gas, and other material handling applications. Our products are utilized by OEMs on vehicles such as dump trucks, dump trailers, bottom dumps, garbage trucks (both recycling and rear loader), container roll off vehicles, hook lift trucks, liquid waste handlers, vacuum trucks, compactors, balers, airport catering vehicles, container handling equipment for airlines, lift trucks, yard tractors, and underground mining vehicles.
WeBrands
Our products are marketed through the Custom Hoists® brand.
Products
Products include single and double acting telescopic and piston rod hydraulic cylinders. Additionally, we manufacture ourspecialty pneumatic cylinders in Hayesville, Ohio and Tianjin, China. promote complete wet line kits, which are complete hydraulic systems that include a pump, valves, hoses and fittings.
Customers
Our products are sold directly to OEMs, as well as distributors, dealers, and aftermarket repair outlets primarily in North America with some sales in South America and Asia.
We provide Custom Hoists® branded single and double acting telescopic hydraulic cylinders and single stage, welded type piston rod hydraulic cylinders for use in the mobile hydraulics industry.
Responsiveness to new opportunities drives continuous top line growth. We leverage our full line of products for the dump truck and trailer market and deep expertise in their application to expand into new markets, targeting challenging custom applications. Our flexible design capability and global supply chain enable us to be successful in our expansion efforts. Our team is dedicated to superior customer service through our technical engineering support and on-time delivery.
Raw Materials
Raw materials and components necessary for the manufacture of our products are generally available from numerous sources. Generally, we are not dependent on a single source of raw materials and supplies. We do not foresee unavailability of materials or supplies which would have a significant adverse effect on any of our businesses, nor any of our segments, in the near term.
Seasonality
We are a diversified business with generally low levels of seasonality, however our fiscal third quarter is typically the period with the lowest level of sales volume.
Patents and Trademarks
We hold approximately 58 United States patents and patents pending covering processes, methods and devices and approximately 44 United States trademarks. Many counterparts of these patents have also been registered in various foreign countries. In addition, we have various foreign registered and common law trademarks.
Due to the diversity of our businesses and the markets served, the loss of any single patent or trademark would not, in our opinion, materially affect any individual segment.
While we believe that many of our patents are important, we credit our competitive position in our niche markets to customer intimacy, engineering capabilities, manufacturing techniques and skills, marketing and sales promotions, service and the delivery of quality products.
Customers
Our business is not dependent upon a single customer or a few large customers, the loss of any one of which would not have a material adverse effect on our operations. No customer accounted for more than 5% of our consolidated revenue in fiscal 2015 or any of the years presented.
Working Capital
Our primary source of working capital is the cash generated from continuing operations. No segments require any special working capital needs outside of the normal course of business.
Backlog
Backlog includes all active or open orders for goods and services that have a firm fixed customer purchase order with defined delivery dates. Backlog also includes any future deliveries based on executed customer contracts, so long as such deliveries are based on agreed upon delivery schedules. Backlog is not generally a significant factor in the Company’s businesses because of our relatively short delivery periods and rapid inventory turnover with the exception of Engineering Technologies.
Backlog orders in place at June 30, 2015 and 2014 are as follows (in thousands):
| | | | | |
| | 2015 | | | 2014 |
Food Service Equipment | $ | 46,147 | | $ | 51,516 |
Engraving | | 18,992 | | | 11,456 |
Engineering Technologies | | 93,012 | | | 64,083 |
Electronics Products | | 38,445 | | | 32,102 |
Hydraulics Products | | 4,776 | | | 5,678 |
Total | | 201,372 | | | 164,835 |
Net realizable beyond one year | | 33,215 | | | 21,703 |
Net realizable within one year | $ | 168,157 | | $ | 143,132 |
Competition
Standex manufactures and markets products many of which have achieved a unique or leadership position in their market. However, we encounter competition in varying degrees in all product groups and for each product line. Competitors include domestic and foreign producers of the same and similar products. The principal methods of competition are product performance and technology, price, delivery schedule, quality of services, and other terms and conditions.
International Operations
We have international operations in all of our business segments. International operations are conducted at 5060 locations, in Europe, Canada, China, Japan, India, Southeast Asia, Korea, Australia, Mexico, Brazil, and South Africa. See the Notes to Consolidated Financial Statements for international operations financial data. Our net sales from international operations contributed approximately 27% of operating revenuesincreased from 31% in 2015 and 29%2017 to 32% in 2014.2018. International operations are subject to certain inherent risks in connection with the conduct of business in foreign countries including, exchange controls, price controls, limitations on participation in local enterprises, nationalizations, expropriation and other governmental action, restrictions of repatriation of earnings, and changes in currency exchange rates.
Research and Development
Developing new and improved products, broadening the application of established products, continuing efforts to improve our methods, processes, and equipment continues to drive our success. However, due to the nature of our manufacturing operations and the types of products manufactured, expenditures for research and development are not significant to any
7
individual segment or in the aggregate. Research and development costs are quantified in the Notes to Consolidated Financial Statements. We develop and design new products to meet customer needs in order to offer enhanced products or to provide customized solutions for customers.
Environmental Matters
Based on our knowledge and current known facts, we believe that we are presently in substantial compliance with all existing applicable environmental laws and regulations and do not anticipate (i) any instances of non-compliance that will have a material effect on our future capital expenditures, earnings or competitive position.position or (ii) any material capital expenditures for environmental control facilities.
Financial Information about Geographic Areas
Information regarding revenues from external customers attributed to the United States, all foreign countries and any individual foreign country, if material, is contained in the Notes to Consolidated Financial Statements for “Industry Segment Information.”
Number of Employees
As of June 30, 2015,2018, we employed approximately 5,1005,600 employees of which approximately 2,2002,100 were in the United States. About 300270 of our U.S. employees were represented by unions. Approximately 42% of our production workforce is situated in low-cost manufacturing regions such as Mexico Brazil and Asia.
Executive Officers of Standex
The executive officers of the Company as of June 30, 20152018 were as follows:
| | |
Name | Age | Principal Occupation During the Past Five Years |
David Dunbar | 5356
| President and Chief Executive Officer of the Company since January 2014;2014. President of the Valves and Controls global business unit of Pentair Ltd from 2009 through December 31, 2013. |
Thomas D. DeByle | 5558
| Vice President and Chief Financial Officer of the Company since March 2008. |
Deborah A. RosenAlan J. Glass
| 6054
| Vice President, Chief Legal Officer and Secretary of the Company since April 2016. Vice President, General Counsel and Secretary of CIRCOR International, Inc. from 2000 through 2016. |
Ross McGovern | 40 | Vice President, Chief Human Resources Officer of the Company since October 2001;August 2015. Director of Human Resources of Keurig Green Mountain 2015, Vice President of Human Resources of Datacolor from 2012 through 2015, and Global Human Resources Manager of R&D GE Healthcare, Medical Diagnostics, a subsidiary of General Electric from 2009 through 2011. |
Sean Valashinas | 47 | Chief Accounting Officer and Assistant Treasurer of the Company since July 1999.October 2007. |
Anne De Greef-SafftPaul Burns
| 5245
| GroupVice President of the Food Service Equipment GroupStrategy and Business Development since January 2015; PresidentJuly 2015, Director of Danaher’s Gems, Setra, SonixCorporate Development and Anderson Companies, where she directed the worldwide operations, marketingGlobal Mergers & Acquisitions at General Motors from 2013 through 2015, Director of Strategy and sales, engineering, accounting and human resources functions of these businessesBusiness Development at Tyco Flow Control from 20092011 through 2014.2013.
|
The executive officers are elected each year at the first meeting of the Board of Directors subsequent to the annual meeting of stockholders, to serve for one-year terms of office. There are no family relationships among any of the directors or executive officers of the Company.
Long-Lived Assets
Long-lived assets are described and discussed in the Notes to Consolidated Financial Statements under the caption “Long-Lived Assets.”
Available Information
Standex’s corporate headquarters are at 11 Keewaydin Drive, Salem, New Hampshire 03079, and our telephone number at that location is (603) 893-9701.
8
The U.S. Securities and Exchange Commission (the “SEC”) maintains an internet website at www.sec.gov that contains our annual reports on Form 10-K, quarterly reports on Form 10-Q, current reports on Form 8-K and proxy statements, and all amendments thereto. All reports that we file with the SEC may be read and copied at the SEC’s Public Reference Room at 100 F Street, N.E., Washington, DC 20549. Information about the operation of the Public Reference Room can be obtained by calling the SEC at 1-800-SEC-0330. Standex’s internet website address is www.standex.com. Our annual reports on Form 10-K, quarterly reports on Form 10-Q, current reports on Form 8-K and proxy statements, and all amendments thereto, are available free of charge on our website as soon as reasonably practicable after such reports are electronically filed with or furnished to the SEC. In addition, our code of business conduct, our code of ethics for senior financial management, our corporate governance guidelines, and the charters of each of the committees of our Board of Directors (which are not deemed filed by this reference), are available on our website and are available in print to any Standex shareholder, without charge, upon request in writing to “Chief Legal Officer, Standex International Corporation, 11 Keewaydin Drive, Salem, New Hampshire, 03079.”
The certifications of Standex’s Chief Executive Officer and Chief Financial Officer, as required by the rules adopted pursuant to Section 302 of the Sarbanes-Oxley Act of 2002, are filed as exhibits to this Form 10-K.
Item 1A. Risk Factors
An investment in the Company’s common sharesCompany involves various risks, including those mentioned below and those that are discussed from time to time in our other periodic filings with the SEC.Securities and Exchange Commission. Investors should carefully consider these risks, along with the other information filed in this report, before making an investment decision regarding our common shares. Allthe Company. Any of these risks could have a material adverse effect on our financial condition, results of operations and/or value of our common shares.an investment in the Company.
A deterioration in the domestic and international economic environment could adversely affect our operating results, cashflow and financial condition.
Recessionary economic conditions, coupled with or without a tightening of credit, could adversely impact major markets served by our businesses, including cyclical markets such as automotive, aviation, energy and power, heavy construction vehicle, general industrial, consumer appliances and food service. An economic recession could adversely affect our business by:
•
reducing demand for our products and services, particularly in markets where demand for our products and services is cyclical;
•
causing delays or cancellations of orders for our products or services;
•
reducing capital spending by our customers;
•
increasing price competition in our markets;
•
increasing difficulty in collecting accounts receivable;
•
increasing the risk of excess or obsolete inventories;
•
increasing the risk of impairment to long-lived assets due to reduced use of manufacturing facilities;
•
increasing the risk of supply interruptions that would be disruptive to our manufacturing processes; and
•
reducing the availability of credit and spending power for our customers.
We rely on our credit facility to provide us with sufficient capital to operate our businesses.
We rely on our revolving credit facility, in part along with operating cash flow, to provide us with sufficient capital to operate our businesses. The availability of borrowings under our revolving credit facility is dependent upon our compliance with the covenants set forth in the facility, including the maintenance of certain financial ratios. Our ability to comply with these covenants is dependent upon our future performance, which is subject to economic conditions in our markets along with factors that are beyond our control. Violation of those covenants could result in our lenders restricting or terminating our borrowing ability under our credit facility, cause us to be liable for covenant waiver fees or other obligations, or trigger an event of default under the terms of our credit facility, which could result in acceleration of the debt under the facility and require prepayment of the debt before its due date. Even if new financing is available in the event of a default under our current credit facility, the interest rate charged on any new borrowing could be substantially higher than under the current credit facility, thus adversely affecting our overall financial condition. If our lenders reduce or terminate our access to amounts under our credit facility, we may not have sufficient capital to fund our working capital needs or we may need to secure additional capital or financing to fund our working capital requirements or to repay outstanding debt under our credit facility.
9
Our credit facility contains covenants that restrict our activities.
Our revolving credit facility contains covenants that restrict our activities, including our ability to:
•
incur additional indebtedness;
•make investments, including acquisitions;
make investments;
•
create liens;
•
pay cash dividends to shareholders unless we are in compliancecompliant with the financial covenants set forth in the credit facility; and
•
sell material assets.
Our global operations subject us to international business risks.
We operate in 5060 locations outside of the United States in Europe, Canada, China, Japan, India, Singapore, Korea, Australia, Mexico, Brazil, Turkey, Malaysia, and South Africa. If we are unable to successfully manage the risks inherent to the operation and expansion of our global businesses, those risks could have a material adverse effect on our business, results of operations, cashflow or financial condition. ThoseThese international business risks include:
•
fluctuations in currency exchange rates;
•changes in government regulations;
•restrictions on repatriation of earnings;
•
���import and export controls;
•
political, social and economic instability or disruptions;instability;
•
potential adverse tax consequences;
•
difficulties in staffing and managing multi-national operations;
•unexpected changes in zoning or other land-use requirements;
•difficulties in our ability to enforce legal rights and remedies; and
•
changes in regulatory requirements.
Failure to achieve expected savings and synergies could adversely impact our operating profits and cash flows.
We focus on improving profitability through leanLEAN enterprise, low cost sourcing and manufacturing initiatives, improving working capital management, developing new and enhanced products, consolidating factories where appropriate, automating manufacturing processes, diversification efforts and completing acquisitions which deliver synergies to supplementstimulate sales and growth. If we wereare unable to successfully execute these programs, thissuch failure could adversely affect our operating profits and cash flows. In addition, actions we may take to consolidate manufacturing operations to achieve cost savings or adjust to market developments may result in restructuring charges that adversely affect our profits.
Violation of anti-bribery or similar laws by our employees, business partners or agents could result in fines, penalties, damage to our reputation or other adverse consequences.
We cannot assure that our internal controls, code of conduct and training of our employees will provide complete protection from reckless or criminal acts of our employees, business partners or agents that might violate USUnited States or international laws relating to anti-bribery or similar topics. An action resulting in aA violation of these laws could subject us to civil or criminal investigations that could result in substantial civil or criminal fines and penalties and which could damage our reputation.
We face significant competition in our markets and, if we are not able to respond to competition in our markets, our net sales, profits and cash flows could decline.
Our businesses operate in highly competitive markets. In order toTo compete effectively, compete, we must retain long standing relationships with significant customers, offer attractive pricing, maintain product quality, develop enhancements to products that offer performance features that are superior to our competitors and which maintain our brand recognition, continue to automate our manufacturing capabilities, continue to grow our business by establishing relationships with new customers, diversify into emerging markets and penetrate new markets. If we are unable to compete effectively, our net sales, profitability and cash flows could decline. Pricing pressures resulting from competition may adversely affect our net sales and profitability.
If we are unable to successfully introduce new products and product enhancements, our future growth could be impaired.
Our ability to develop new products and innovations to satisfy customer needs or demands in the markets we serve can affect our competitive position and often requires significant investment of resources. Difficulties or delays in research, development
10
or production of new products and services or failure to gain market acceptance of new products and technologies may significantly reduce future net sales and adversely affect our competitive position.
Increased prices or significant shortages of the commodities that we use in our businesses could result in lower net sales, profits and cash flows.
We purchase large quantities of steel, aluminum, refrigeration components, freight services, foam insulation and other metal commodities for the manufacture of our products. Historically, prices for commodities have fluctuated, and we are unable to enter into long term contracts or other arrangements to hedge the risk of price increases in many of these commodities. Significant price increases for these commodities could adversely affect our operating profits if we cannot timely mitigate the price increases by successfully sourcing lower cost commodities or by passing the increased costs on to customers. Shortages or other disruptions in the supply of these commodities could delay sales or increase costs.
Current and threatened tariffs on components and finished goods from China and other countries could result in lower net sales, profits and cash flows and could impair the value of our investments in our Chinese operations.
As part of our low-cost country sourcing strategy, we (i) maintain manufacturing facilities in China and (ii) import certain components and finished goods from our own facilities and third-party suppliers in China. Many of the components and finished goods we import from China are subject to tariffs recently enacted by the United States government as well as additional proposed tariffs. While we attempt to pass on these additional costs to our customers, competitive factors (including competitors who import from other countries not subject to such tariffs) may limit our ability to sustain price increases and, as a result, may adversely impact our net sales, profits and cash flows. In addition, the maintenance of such tariffs over the long-term could impair the value of our investments in our Chinese operations.
An inability to identify or complete future acquisitions could adversely affect our future growth.
As part of our growth strategy, we intend to pursue acquisitions that provide opportunities for profitable growth for our businesses and which enable us to leverage our competitive strengths. While we continue to evaluate potential acquisitions, we may not be able to identify and successfully negotiate suitable acquisitions, obtain financing for future acquisitions on satisfactory terms, obtain regulatory approval for certain acquisitions or otherwise complete acquisitions in the future. An inability to identify or complete future acquisitions could limit our future growth.
We may experience difficulties in integrating acquisitions.
Integration of acquired companies involves a number ofseveral risks, including:
•
inability to operate acquired businesses profitably;
•
failure to accomplish strategic objectives for those acquisitions;
•
unanticipated costs relating to acquisitions or to the integration of the acquired businesses;
•
difficulties in achieving planned cost savings synergies and growth opportunities; and
•
possible future impairment charges for goodwill and non-amortizable intangible assets that are recorded as a result ofdue to acquisitions.
Additionally, our level of indebtedness may increase in the future if we finance acquisitions with debt, which would cause us to incur additional interest expense and could increase our vulnerability to general adverse economic and industry conditions and limit our ability to service our debt or obtain additional financing. We cannot assure that future acquisitions will not have a material adverse effect on our financial condition, results of operations and cash flows.
Impairment charges could reduce our profitability.
We test goodwill and our other intangible assets with indefinite useful lives for impairment on an annual basis or on an interim basis if an event occursa potential impairment factor arises that might reduceindicates the fair value of the reporting unit may fall below its carrying value. Various uncertainties, including continued adverse conditions in the capital markets or changes in general economic conditions, could impact the future operating performance at one or more of our businesses which could significantly affect our valuations and could result in additional future impairments. The recognition of an impairment of a significant portion of goodwill would negatively affect our results of operations and could be a material effect to us.operations.
11
MaterialMaterially adverse or unforeseen legal judgments, fines, penalties or settlements could have an adverse impact on our profits and cash flows.
We are and may, from time to time, become a party to legal proceedings incidental to our businesses, including, but not limited to, alleged claims relating to product liability, environmental compliance, patent infringement, commercial disputes and employment and regulatory matters. In accordance with United States generally accepted accounting principles, we have establishedestablish reserves based on our assessment of contingencies.contingent liabilities. Subsequent developments in legal proceedings may affect our assessment and estimates of loss contingencies, recorded as reserves, which could require us to record additional reserves or make material payments which could adversely affect our profits and cash flows. Even the successful defense of legal proceedings may cause us to incur substantial legal costs and may divert management's time and resources away from our businesses.
The costs of complying with existing or future environmental regulations, and of correcting any violations of these regulations, could increase our expenses and reduceimpact our profitability.
We are subject to a variety of environmental laws relating to the storage, discharge, handling, emission, generation, use and disposal of chemicals, hazardous waste and other toxic and hazardous materials used to manufacture, or resulting from the process of manufacturing, our products. We cannot predict the nature, scope or effect of regulatory requirements to which our operations might be subject or the manner in which existing or future laws will be administered or interpreted. We are also exposed to potential legacy environmental risks relating to businesses we no longer own or operate. Future regulations could be applied to materials, products or activities that have not been subject to regulation previously. The costs of complying with new or more stringent regulations, or with more vigorous enforcement of these or existing regulations, could be significant.
In addition, properly permitted waste disposal facilities used by us as a legal and legitimate repository for hazardous waste may in the future become mismanaged or abandoned without our knowledge or involvement. In such event, legacy landfill liability could attach to or be imposed upon us in proportion to the waste deposited at any disposal facility.
Environmental laws require us to maintain and comply with a number of permits, authorizations and approvals and to maintain and update training programs and safety data regarding materials used in our processes. Violations of these requirements could result in financial penalties and other enforcement actions. We could be required to halt one or more portions of our operations until a violation is cured. Although we attempt to operate in compliance with these environmental laws, we may not succeed in this effort at all times. The costs of curing violations or resolving enforcement actions that might be initiated by government authorities could be substantial.
The costs of complying with existing or future regulations applicable to our products, and of correcting any violations of such regulations, could impact our profitability.
Certain of our products are subject to regulations promulgated by administrative agencies such as the Department of Energy, Occupational Health and Safety Administration and the Food and Drug Administration. Such regulations, among other matters, specify requirements regarding energy efficiency and product safety. Regulatory violations could result in financial penalties and other enforcement actions. We could be required to halt production of one or more products until a violation is cured. Although we attempt to produce our products in compliance with these requirements, the costs of curing violations or resolving enforcement actions that might be initiated by administrative agencies could be substantial.
Strategic divestitures could negatively affect our results and contingent liabilities from businesses that we have soldsell could adversely affect our results of operations and financial condition.
WeFrom time to time, we have sold and may continue to sell business that we consider to be either underperforming or no longer part of our strategic vision. The sale of any such business could result in a financial loss and/or write-down of goodwill which could have a material adverse effect on our results for the financial reporting period during which such sale occurs. In addition, in connection with such divestitures, we have retained, and may in the future retain responsibility for some of the known and unknown contingent liabilities related to a number of businesses we have sold,certain divestitures such as lawsuits, tax liabilities, product liability claims, and environmental matters and have agreed to indemnify purchasers of these businesses for certain of those contingent liabilities.matters.
The trading price of our common stock has been volatile, and investors in our common stock may experience substantial losses.
The trading price of our common stock has been volatile and may become volatile again in the future. The trading price of our common stock could decline or fluctuate in response to a variety of factors, including:
12
•
our failure to meet the performance estimates of securities analysts;
•
changes in financial estimates of our net sales and operating results or buy/sell recommendations by securities analysts;
•
fluctuations in our quarterly operating results;
•
substantial sales of our common stock;
•
changes in the amount or frequency of our payment of dividends or repurchases of our common stock;
•
general stock market conditions; or
•
other economic or external factors.
Decreases in discount rates and actual rates of return could require an increase in future pension contributions to our pension plans which could limit our flexibility in managing our Company.
KeyThe discount rate and the expected rate of return on plan assets represent key assumptions inherent in our actuarially calculated pension plan obligations and pension plan expense are the discount rate and the expected rate of return on plan assets.expense. If discount rates and actual rates of return on invested plan assets were to decrease significantly, our pension plan obligations could increase materially. TheAlthough our pension plans have been frozen, the size of future required pension contributions could require us to dedicate a greater portion of our cash flow from operations to making contributions, which could negatively impact our financial flexibility.
Our business could be negatively impacted by cybersecurity threats, information systems and network interruptions, and other security threats or disruptions.
Our information technology networks and related systems are critical to the operation of our business and essential to our ability to successfully perform day-to-day operations. Cybersecurity threats in particular, are persistent, evolve quickly, and include, but are not limited to, computer viruses, ransomware, attempts to access information, denial of service and other electronic security breaches. These events could disrupt our operations or customers and other third partythird-party IT systems in which we are involved and could negatively impact our reputation among our customers and the public which could have a negative impact on our financial conditions, results of operations, or liquidity.
We are subject to increasing regulation associated with data privacy and processing, the violation of which could result in significant penalties and harm our reputation.
Regulatory scrutiny of privacy, data protection, collection, use and sharing of data is increasing on a global basis. Like all global companies, we are subject to a number of laws, rules and directives (“privacy laws”) relating to the collection, use, retention, security, processing and transfer (“processing”) of personally identifiable information about our employees, customers and suppliers (“personal data”) in the countries where we operate. The most notable of these privacy laws is the EU’s General Data Protection Regulation (“GDPR”), which came into effect in 2018. GDPR extends the scope of the EU data protection law to all foreign companies processing data of EU residents and imposes a strict data protection compliance regime with severe penalties for non-compliance of up to the greater of 4% of worldwide turnover and €20 million. While we continue to strengthen our data privacy and protection policies and to train our personnel accordingly, a determination that there have been violations of GDPR or other privacy or data protection laws could expose us to significant damage awards, fines and other penalties that could, individually or in the aggregate, materially harm our results of operations and reputation.
Various restrictions in our charter documents, Delaware law and our credit agreement could prevent or delay a change in control of us that is not supported by our board of directors.
We are subject to a number ofseveral provisions in our charter documents, Delaware law and our credit facility that may discourage, delay or prevent a merger, acquisition or change of control that a stockholder may consider favorable. These anti-takeover provisions include:
•
maintaining a classified board and imposing advance notice procedures for nominations of candidates for election as directors and for stockholder proposals to be considered at stockholders' meetings;
•
a provision in our certificate of incorporation that requires the approval of the holders of 80% of the outstanding shares of our common stock to adopt any agreement of merger, the sale of substantially all of the assets of Standexthe Company to a third party or the issuance or transfer by Standexthe Company of voting securities having a fair market value of $1 million or more to a third party, if in any such case such third party is the beneficial owner of 10% or more of the outstanding shares of our common stock, unless the transaction has been approved prior to its consummation by all of our directors;
•
requiring the affirmative vote of the holders of at least 80% of the outstanding shares of our common stock for stockholders to amend our amended and restated by-laws;
•
covenants in our credit facility restricting mergers, asset sales and similar transactions; and
13
•
the Delaware anti-takeover statute contained in Section 203 of the Delaware General Corporation Law.
Section 203 of the Delaware General Corporation Law prohibits a merger, consolidation, asset sale or other similar business combination between Standexthe Company and any stockholder of 15% or more of our voting stock for a period of three years after the stockholder acquires 15% or more of our voting stock, unless (1) the transaction is approved by our board of directors before the stockholder acquires 15% or more of our voting stock, (2) upon completing the transaction the stockholder owns at least 85% of our voting stock outstanding at the commencement of the transaction, or (3) the transaction is approved by our board of directors and the holders of 66 2/3% of our voting stock, excluding shares of our voting stock owned by the stockholder.
Item 1B. Unresolved Staff Comments
None.
Item 2. Properties
We have a total of 94107 facilities, of which we operate 7789 manufacturing plants and warehouses located throughout the United States, Europe, Canada, Australia, Southeast Asia, Korea, Japan, China, India, Brazil, South Africa, and Mexico. The Company owns 2521 of the facilities and the balance are leased. For the year ended June 30, 20152018 the approximate building space utilized by each product groupsegment is as follows:
| | | | |
| | Area in Square Feet (in thousands) |
Segment location | Number of Facilities | Leased | Owned | Total |
EMEA(1) | 3 | 24 | 9 | 33 |
Other Americas | 4 | 33 | 185 | 218 |
United States | 15 | 353 | 790 | 1,143 |
Food Service Equipment Group | 22 | 410 | 984 | 1,394 |
| | | | |
Asia Pacific | 13 | 255 | - | 255 |
EMEA(1) | 12 | 107 | - | 107 |
Other Americas | 3 | 66 | - | 66 |
United States | 7 | 55 | 215 | 270 |
Engraving Group | 35 | 483 | 215 | 698 |
| | | | |
EMEA(1) | 3 | 80 | - | 80 |
United States | 6 | 196 | 171 | 367 |
Engineering Technologies Group | 9 | 276 | 171 | 447 |
| | | | |
Asia Pacific | 2 | 37 | - | 37 |
EMEA(1) | 5 | 8 | 89 | 97 |
Other Americas | 2 | 12 | 57 | 69 |
United States | 4 | 32 | 31 | 63 |
Electronics Group | 13 | 89 | 177 | 266 |
| | | | |
Asia Pacific | 2 | 65 | - | 65 |
Other Americas | 1 | 1 | - | 1 |
United States | 6 | 20 | 101 | 121 |
Hydraulics Products Group | 9 | 86 | 101 | 187 |
| | | | |
United States | 6 | 206 | 255 | 461 |
Corporate & Other | 6 | 206 | 255 | 461 |
Total | 94 | 1,550 | 1,903 | 3,453 |
| | Area in Square Feet (in thousands) |
Segment location | Number of Facilities | Leased | Owned | Total |
EMEA(1) | 1 | 13 | - | 13 |
Other Americas | 1 | - | 127 | 127 |
United States | 16 | 441 | 790 | 1,231 |
Food Service Equipment | 18 | 454 | 917 | 1,371 |
Asia Pacific | 16 | 279 | - | 279 |
EMEA(1) | 21 | 363 | 35 | 398 |
Other Americas | 6 | 89 | - | 89 |
United States | 6 | 76 | 99 | 175 |
Engraving | 49 | 807 | 134 | 941 |
EMEA(1) | 3 | 80 | - | 80 |
United States | 6 | 243 | 171 | 414 |
Engineering Technologies | 9 | 323 | 171 | 494 |
Asia Pacific | 11 | 77 | 29 | 106 |
EMEA(1) | 5 | 8 | 88 | 96 |
Other Americas | 2 | 5 | 56 | 61 |
United States | 4 | 61 | 30 | 91 |
Electronics | 22 | 151 | 203 | 354 |
Asia Pacific | 2 | 76 | - | 76 |
Other Americas | 1 | 1 | - | 1 |
United States | 5 | 15 | 101 | 116 |
Hydraulics | 8 | 92 | 101 | 193 |
United States | 1 | 12 | - | 12 |
Corporate & Other | 1 | 12 | - | 12 |
Total | 107 | 1,839 | 1,526 | 3,365 |
(1) EMEA consists primarily of Europe, Middle East and S. Africa.
In general, the buildings are in sound operating condition and are considered to be adequate for their intended purposes and current uses.
We own substantially all of the machinery and equipment utilized in our businesses.
Item 3. Legal Proceedings
Discussion of legal matters is incorporated by reference to Part II, Item 8, Note 12, “CONTINGENCIES,” in the Notes to the Consolidated Financial Statements.
14
Item 4. Mine Safety Disclosures
Not Applicable
PART II
Item 5. Market for Standex Common Stock
Related Stockholder Matters and Issuer Purchases of Equity Securities
The principal market in which the Common Stock of Standex is traded is the New York Stock Exchange under the ticker symbol “SXI”. The high and low sales prices for the Common Stock on the New York Stock Exchange and the dividends paid per Common Share for each quarter in the last two fiscal years are as follows:
| | Common Stock Price Range | | Dividends Per Share | Common Stock Price Range | | Dividends Per Share |
| 2015 | | 2014 | | | | 2018 | | 2017 | | | |
Year Ended June 30 | High | Low | | High | Low | | 2015 | 2014 | High | Low | | High | Low | | 2018 | 2017 |
First quarter | $ 76.99 | $ 65.01 | | $ 60.96 | $ 52.00 | | $ 0.10 | $ 0.08 | $ 109.30 | $ 89.70 | | $ 93.29 | $ 80.90 | | $ 0.16 | $ 0.14 |
Second quarter | 87.05 | 70.25 | | 64.90 | 56.15 | | 0.12 | 0.10 | 110.00 | 98.38 | | 97.55 | 74.35 | | 0.18 | 0.16 |
Third quarter | 83.98 | 66.72 | | 63.76 | 52.29 | | 0.12 | 0.10 | 106.90 | 93.15 | | 101.24 | 85.80 | | 0.18 | 0.16 |
Fourth quarter | 84.47 | 77.62 | | 78.49 | 53.82 | | 0.12 | 0.10 | 106.40 | 89.40 | | 100.30 | 84.30 | | 0.18 | 0.16 |
The approximate number of stockholders of record on July 31, 20152018 was 1,683.1,630.
Additional information regarding our equity compensation plans is presented in the Notes to Consolidated Financial Statements under the caption “Stock-Based Compensation and Purchase Plans” and Item 12 “Security Ownership of Certain Beneficial Owners and Management and Related Stockholder Matters.”
| | | | | | | | | | | | | | | | | |
Issuer Purchases of Equity Securities(1) | | | | | |
Quarter Ended June 30, 2015 | | | | | | |
Period | | (a) Total Number of Shares (or units) Purchased | (b) Average Price Paid per Share (or unit) | (c) Total Number of Shares (or units) Purchased as Part of Publicly Announced Plans or Programs | (d) Maximum Number (or Appropriate Dollar Value) of Shares (or units) that May Yet Be Purchased Under the Plans or Programs |
April 1 - April 30, 2015 | | 1,150 | | $ 80.27 | | 1,150 | | 351,936 |
May 1 - May 31, 2015 | | 846 | | 78.74 | | 846 | | 351,090 |
June 1 - June 30, 2015 | | 4,547 | | 79.57 | | 4,547 | | 346,543 |
TOTAL | | 6,543 | | $ 79.59 | | 6,543 | | 346,543 |
Issuer Purchases of Equity Securities(1) | | | | | | |
Quarter Ended June 30, 2018 | | | | | | | |
Period | | (a) Total Number of Shares (or units) Purchased | (b) Average Price Paid per Share (or unit) | | (c) Total Number of Shares (or units) Purchased as Part of Publicly Announced Plans or Programs | (d) Maximum Number (or Appropriate Dollar Value) of Shares (or units) that May Yet Be Purchased Under the Plans or Programs |
April 1 - April 30, 2018 | | - | | $ - | | | - | | $ 87,718,229 |
May 1 - May 31, 2018 | | 5,290 | | 99.27 | | | 5,290 | | 87,193,091 |
June 1 - June 30, 2018 | | 1,136 | | 105.20 | | | 1,136 | | 87,073,584 |
TOTAL | | 6,426 | | $ 100.32 | | | 6,426 | | $ 87,073,584 |
(1)The Company has a Stock Buyback Program (the “Program”) which was originally announced on January 30, 1985.1985 and most recently amended on April 26, 2016. Under the Program, the Company is authorized to repurchase up to an aggregate of $100 million of its shares. Under the program, purchases may repurchase its sharesbe made from time to time either inon the open market, including through 10b5-1 trading plans, or through privateprivately negotiated transactions, whenever it appears prudent to do so. The Program has no expiration date,block transactions, or other techniques in accordance with prevailing market conditions and the Company from time to time may authorize additional increasesrequirements of share incrementsthe Securities and Exchange Commission. The Board’s authorization is open-ended and does not establish a timeframe for buyback authority so as to maintain the Program.purchases. The Company authorized, on August 20, 2013,is not obligated to acquire a particular number of shares, and the repurchase of 0.5 million shares for repurchase pursuant to its Program. All previously announced repurchases have been completed.program may be discontinued at any time at the Company’s discretion.
15
The following graph compares the cumulative total stockholder return on the Company’s Common Stock as of the end of each of the last five fiscal years, with the cumulative total stockholder return on the Standard & Poor’s Small Cap 600 (Industrial Segment) Index and on the Russell 2000 Index, assuming an investment of $100 in each at their closing prices on June 30, 20082013 and the reinvestment of all dividends.
![[f10k001.jpg]](https://capedge.com/proxy/10-K/0000310354-15-000025/f10k001.jpg)
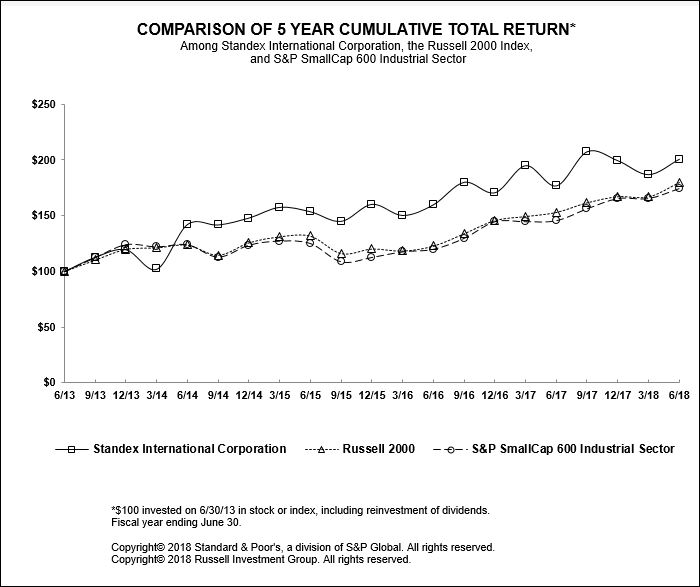
16
Item 6. Selected Consolidated Financial Data
Selected financial data for the five years ended June 30, is as follows:
See Item 7 for discussions on comparability of the below.
| | | 2015 | | 2014 | | 2013 | | 2012 | | 2011 | | 2018 | | 2017 | | 2016 | | 2015 | | 2014 |
SUMMARY OF OPERATIONS (in thousands) | SUMMARY OF OPERATIONS (in thousands) | | | | | | | | | SUMMARY OF OPERATIONS (in thousands) | | | | | | | | |
Net sales | | | | | | | | | | | | | | | | | | | | |
Food Service Equipment | | $ 408,706 | | $ 377,848 | | $ 367,008 | | $ 364,759 | | $ 343,150 | $ | 396,866 | | $ 380,970 | | $ 381,867 | | $ 408,706 | | $ 377,848 |
Engraving | | 110,781 | | 109,271 | | 93,380 | | 93,611 | | 85,258 | | 136,275 | | 105,943 | | 124,120 | | 110,781 | | 109,271 |
Engineering Technologies | | 97,018 | | 79,642 | | 74,838 | | 74,088 | | 61,063 | | 90,781 | | 90,506 | | 82,235 | | 97,018 | | 79,642 |
Electronics Products | | 114,196 | | 114,881 | | 108,085 | | 48,206 | | 46,600 | |
Hydraulics Products | | 41,441 | | 34,538 | | 30,079 | | 29,922 | | 22,925 | |
Electronics | | | 196,291 | | 136,689 | | 118,319 | | 114,196 | | 114,881 |
Hydraulics | | | 48,169 | | 41,150 | | 45,045 | | 41,441 | | 34,538 |
Total | | $ 772,142 | | $ 716,180 | | $ 673,390 | | $ 610,586 | | $ 558,996 | $ | 868,382 | | $ 755,258 | | $ 751,586 | | $ 772,142 | | $ 716,180 |
Gross profit | | $ 247,486 | | $ 238,269 | | $ 218,191 | | $ 201,736 | | $ 185,858 | | 301,801 | | $ 252,754 | | $ 252,253 | | $ 247,486 | | $ 238,269 |
Operating income (loss) | | | | | | | | | | | | | | | | | | | | |
Food Service Equipment | | $ 37,456 | | $ 38,203 | | $ 37,533 | | $ 38,389 | | $ 37,633 | $ | 34,853 | | $ 33,436 | | $ 40,142 | | $ 37,456 | | $ 38,203 |
Engraving | | 24,250 | | 22,145 | | 15,596 | | 17,896 | | 14,182 | | 28,966 | | 25,584 | | 29,579 | | 24,250 | | 22,145 |
Engineering Technologies | | 13,097 | | 12,676 | | 13,241 | | 14,305 | | 12,606 | | 6,449 | | 9,662 | | 8,258 | | 13,097 | | 12,676 |
�� Electronics Products | | 20,884 | | 19,732 | | 16,147 | | 8,715 | | 7,551 | |
Hydraulics Products | | 7,013 | | 5,781 | | 4,968 | | 4,403 | | 2,436 | |
Restructuring (a) | | (3,443) | | (10,077) | | (2,666) | | (1,685) | | (1,843) | |
Electronics | | | 45,310 | | 27,663 | | 21,104 | | 20,884 | | 19,732 |
Hydraulics | | | 7,316 | | 6,712 | | 7,947 | | 7,013 | | 5,781 |
Restructuring(1) | | | (7,594) | | (5,825) | | (4,232) | | (3,443) | | (10,077) |
Gain on sale of real estate | | - | | - | | - | | 4,776 | | 3,368 | | - | | 652 | | - | | - | | - |
Acquisition related expenses | | | (3,749) | | (7,843) | | - | | - | | - |
Other operating income (expense), net | Other operating income (expense), net | 438 | | 3,462 | | - | | - | | - | | - | | - | | (7,458) | | 438 | | 3,462 |
Corporate and Other | | (21,051) | | (26,054) | | (22,924) | | (23,443) | | (20,959) | | (27,512) | | (25,015) | | (24,996) | | (21,051) | | (26,054) |
Total | | $ 78,644 | | $ 65,868 | | $ 61,895 | | $ 63,356 | | $ 54,974 | | 84,039 | | 65,026 | | $ 70,344 | | $ 78,644 | | $ 65,868 |
Interest expense | | (3,161) | | (2,249) | | (2,469) | | (2,280) | | (2,107) | | (8,030) | | (4,043) | | (2,871) | | (3,161) | | (2,249) |
Other non-operating (loss) income | | 634 | | 4,184 | | (128) | | 519 | | (199) | | 1,243 | | 949 | | 1,052 | | 634 | | 4,184 |
Provision for income taxes | | (20,874) | | (18,054) | | (15,244) | | (15,699) | | (15,027) | | (40,620) | | (15,355) | | (16,295) | | (20,874) | | (18,054) |
Income from continuing operations | | 55,243 | | 49,749 | | 44,054 | | 45,896 | | 37,641 | | 36,632 | | 46,577 | | 52,230 | | 55,243 | | 49,749 |
Income/(loss) from discontinued operations | Income/(loss) from discontinued operations | (500) | | (6,883) | | 794 | | (14,991) | | (2,275) | | (28) | | (32) | | (174) | | (500) | | (6,883) |
Net income | | $ 54,743 | | $ 42,866 | | $ 44,848 | | $ 30,905 | | $ 35,366 | | $ 36,604 | | $ 46,545 | | $ 52,056 | | $ 54,743 | | $ 42,866 |
(a)
(1)See discussion of restructuring activities in Note 1615 of the consolidated financial statements.
| | | 2015 | | 2014 | | 2013 | | 2012 | | 2011 | | 2018 | | 2017 | | 2016 | | 2015 | | 2014 |
PER SHARE DATA | | | | | | | | | | | | | | | | | | | | |
Basic | | | | | | | | | | | | | | | | | | | | |
Income from continuing operations | | $ 4.37 | | $ 3.94 | | $ 3.51 | | $ 3.67 | | $ 3.02 | | $ 2.88 | | $ 3.68 | | $ 4.12 | | $ 4.37 | | $ 3.94 |
Income/(loss) from discontinued operations | Income/(loss) from discontinued operations | (0.04) | | (0.55) | | 0.06 | | (1.20) | | (0.18) | Income/(loss) from discontinued operations | - | | - | | (0.01) | | (0.04) | | (0.55) |
Total | | $ 4.33 | | $ 3.39 | | $ 3.57 | | $ 2.47 | | $ 2.84 | | $ 2.88 | | $ 3.68 | | $ 4.11 | | $ 4.33 | | $ 3.39 |
| | | | | | | | | | | |
Diluted | | | | | | | | | | | | | | | | | | | | |
Income from continuing operations | | $ 4.31 | | $ 3.89 | | $ 3.45 | | $ 3.59 | | $ 2.95 | | $ 2.86 | | $ 3.65 | | $ 4.09 | | $ 4.31 | | $ 3.89 |
Income/(loss) from discontinued operations | Income/(loss) from discontinued operations | (0.04) | | (0.54) | | 0.06 | | (1.17) | | (0.18) | Income/(loss) from discontinued operations | - | | - | | (0.01) | | (0.04) | | (0.54) |
Total | | $ 4.27 | | $ 3.35 | | $ 3.51 | | $ 2.42 | | $ 2.77 | | $ 2.86 | | $ 3.65 | | $ 4.08 | | $ 4.27 | | $ 3.35 |
| | | | | | | | | | | | | | | | | | | | |
Dividends declared | | $ 0.46 | | $ 0.38 | | $ 0.31 | | $ 0.27 | | $ 0.23 | | $ 0.70 | | $ 0.62 | | $ 0.54 | | $ 0.46 | | $ 0.38 |
17
| | 2018 | | 2017 | | 2016 | | 2015 | | 2014 |
BALANCE SHEET (in thousands) | | | | | | | | | |
Total assets | | $ 916,937 | | $ 867,676 | | $ 690,457 | | $ 659,063 | | $ 577,785 |
| | | | | | | | | | |
Accounts receivable | | 134,228 | | 127,060 | | 103,974 | | 110,478 | | 107,674 |
Inventories | | 127,223 | | 119,401 | | 105,402 | | 108,305 | | 97,065 |
Accounts payable | | 89,707 | | 96,487 | | 77,099 | | 80,764 | | 85,206 |
Goodwill | | 251,762 | | 242,690 | | 157,354 | | 154,732 | | 125,965 |
| | | | | | | | | | |
Long-term debt | | $ 193,772 | | $ 191,976 | | $ 92,114 | | $ 101,753 | | $ 44,681 |
Total debt | | 193,772 | | 191,976 | | 92,114 | | 101,753 | | 44,681 |
Less cash | | 109,602 | | 88,566 | | 121,988 | | 96,128 | | 74,260 |
Net debt (cash) | | $ 84,170 | | $ 103,410 | | $ (29,874) | | $ 5,625 | | $ (29,579) |
| | | | | | | | | | |
Stockholders' equity | | $ 450,795 | | $ 408,664 | | $ 369,959 | | $ 348,570 | | $ 340,726 |
| | | | | | | | | | |
KEY STATISTICS | | 2018 | | 2017 | | 2016 | | 2015 | | 2014 |
Gross profit margin | | 34.8% | | 33.5% | | 33.6% | | 32.1% | | 33.3% |
Operating income margin | | 9.7% | | 8.6% | | 9.4% | | 10.2% | | 9.2% |
| | | | | | | | | | |
| | 2015 | | 2014 | | 2013 | | 2012 | | 2011 |
BALANCE SHEET (in thousands) | | | | | | | | | |
Total assets | | $ 660,341 | | $ 578,160 | | $ 510,573 | | $ 479,811 | | $ 474,905 |
Accounts receivable | | 110,478 | | 107,674 | | 97,995 | | 96,493 | | 92,032 |
Inventories | | 108,305 | | 97,065 | | 81,811 | | 70,802 | | 72,447 |
Accounts payable | | 80,764 | | 85,206 | | 67,552 | | 60,229 | | 66,103 |
Goodwill | | 154,732 | | 125,965 | | 111,905 | | 100,633 | | 102,439 |
| | | | | | | | | | |
Short-term debt | | $ - | | $ - | | $ - | | $ - | | $ 5,100 |
Long-term debt | | 103,031 | | 45,056 | | 50,072 | | 50,000 | | 46,500 |
Total debt | | 103,031 | | 45,056 | | 50,072 | | 50,000 | | 51,600 |
Less cash | | 96,128 | | 74,260 | | 51,064 | | 54,749 | | 14,407 |
Net debt (cash) | | 6,903 | | (29,204) | | (992) | | (4,749) | | 37,193 |
Stockholders' equity | | 348,570 | | 340,726 | | 290,988 | | 242,907 | | 245,613 |
| | | | | | | | | | |
KEY STATISTICS | | 2015 | | 2014 | | 2013 | | 2012 | | 2011 |
Gross profit margin | | 32.1% | | 33.3% | | 32.4% | | 33.0% | | 33.2% |
Operating income margin | | 10.2% | | 9.2% | | 9.2% | | 10.4% | | 9.8% |
Item 7. Management's Discussion and Analysis of Financial Condition and Results of Operations
Overview
Overview
We are a leading manufacturer of a variety of products and services for diverse commercial and industrial markets. We have twelve operating business units, aggregated and organized for reporting purposes into five reportable segments: Food Service Equipment, Group, Engraving, Group, Engineering Technologies, Group, Electronics Products Group, and Hydraulics. Overall management, strategic development and financial control are led by the Hydraulics Products Group.executive staff at our corporate headquarters located in Salem, New Hampshire.
Our long termlong-term strategy is to build larger industrial platforms through a value creation system that assists management in meeting specific corporate and business unit financial and strategic performance goals in order to create, improve, and sustainenhance shareholder value. The Standex Value Creation System hasis a standard methodology which provides consistent tools used throughout the company in order to achieve our organization’s goal of transforming from its historic roots as a holding company to an efficient operating company. The Standex Value Creation System employs four components.components: Balanced Performance Plan, Standex Growth Disciplines, Standex Operational Excellence, and Standex Talent Management. The Balanced Performance Plan process aligns annual goals throughout the business and provides a standard reporting, management and review process. It is focused on setting and meeting annual and quarterly targets that support our short term and long term goals. The Standex Growth Disciplines areuse a standard set of tools and processes including market maps, growth laneways, and market tests to grow our businessesidentify opportunities to expand the business organically and through acquisitions. Standex Operational Excellence employs a standard playbook and processes, including LEAN, processes to eliminate waste and improve profitability, cash flow and customer satisfaction. Finally, the Standex Talent Management process is an organizational development process that provides training, development, and succession planning for our employees.employees throughout our worldwide organization. The value creation system providesStandex Value Creation System ties all disciplines in the organization together under a common umbrella by providing standard tools and processes throughout Standex to deliver our business objectives:objectives. Through the use of our Standex Value Creation System, we have developed a balanced approach to value creation. While we intend to continue investing acquisition capital in high margin and growth segments such as Electronics and Engraving, we will continue to support all of our businesses as they enhance value through deployment of our GDP+ and OpEx playbooks.
·
It is our objective to grow larger and more profitable business units through both organic initiatives and acquisitions. On an ongoing basis weWe seek to identify and implement organic growth initiatives such as new product development, geographic expansion, introduction of products and technologies into new markets and applications, key accounts and strategic sales channel partners. Also, we have a long-term objective to create sizable business platforms by adding strategically aligned or “bolt on” acquisitions to strengthen the individual businesses, to create both sales and cost synergies with our core business platforms, toand accelerate their growth and margin improvement. There isWe look to create both sales and cost synergies within our core business platforms, accelerate growth and improve margins. We have a particular focus on identifying and investing in opportunities that complement our products and will
18
increase the global presence and capabilities of our businesses. From time to time, we have divested, and likely will continue to divest, businesses that we felt werefeel are not strategic or do not meet our growth and return expectations.
oAs part of our ongoing strategy, we acquired Italy-based Piazza Rosa Group (“Piazza Rosa”) in July 2017. The privately held company is a leading provider of mold, tool treatment and finishing services for the automotive and consumer products markets. The combination of these competencies with Standex Engraving’s worldwide presence and texturizing capabilities creates a global tool finishing service leader. The acquisition also opens additional opportunities in the broader surface engineering market. The Piazza Rosa Group’s results are reported within our Engraving segment.
As part of our ongoing strategy, we acquired all of the outstanding shares of Oki Sensor Device Corporation from OKI Electric Industry Co., Ltd. during the third quarter of fiscal year 2017. Located in Kofu City, Japan, OKI Sensor Device Corporation is the world’s leading designer and supplier of magnetic reed switches. Now named Standex Electronics Japan Corporation, (“Standex Electronics Japan”) the acquisition enhances the Company’s access to important Asian markets and enables the Company to offer a world class suite of reed switches and related magnetic sensors while continuing to serve Standex Electronics Japan’s diverse distribution channels. Standex Electronics Japan’s results are reported within our Electronics segment.
During our second quarter of 2017, we acquired Horizon Scientific, Inc., (“Horizon Scientific”) a South Carolina-based supplier of laboratory refrigerators and freezers, as well as cryogenic equipment for the scientific, bio-medical and pharmaceutical markets. We have included the operating results of Horizon Scientific in our Food Service Equipment segment in our Condensed Consolidated Financial Statements. Horizon Scientific expands our access to higher-margin refrigeration markets in the growing scientific sector that provides solutions for exacting temperature storage requirements. Horizon Scientific’s products complement the scientific offerings in our Nor-Lake division.
During the first quarter of fiscal year 2017, we sold our U.S. Roll Plate and Machinery (“RPM”) business, as it was not strategic, and did not meet our growth and return expectations. This divestiture also allows our Engraving management to focus on higher growth and better return businesses within the segment.
·
We createdevelop “Customer Intimacy” by utilizing the Standex Growth Disciplines to partner with our customers in order to develop and deliver custom solutions or engineered components. By partnering with our customers during long-term product development cycles, we become an extension of their development teams. Through this Partner, Solve, Deliver® methodology, we are able to secure our position as a preferred long-term solution provider for our products that provide technology-driven solutions to our customers.and components. This relationship generally provides us with the ability to sustainstrategy results in increased sales and profit growth over time and provide operating margins that enhance shareholder returns. Further, we have made a priority of developing new sales channels and leveraging strategic customer relationships.
·
Standex Operational Excellence drives continuous improvement in the efficiency of our businesses.businesses, both on the shop floor and in the office environment. We recognize that our businesses are competing in a global economy that requires that we constantly striveus to improve our competitive position. We have deployed a number of management competencies to drive improvements in the cost structure of our business units including operational excellence through lean enterprise, the use of low cost manufacturing facilities, in countries such as Mexico, and China, the consolidation of manufacturing facilities to achieve economies of scale and leveraging of fixed infrastructure costs, alternate sourcing to achieve procurement cost reductions, and capital improvements to increase shop floor productivity, which drives improvements in the cost structure ofproductivity.
The Company’s strong historical cash flow has been a cornerstone for funding our business units.
·
Our capital allocation strategy is tostrategy. We use cash flow generated from operations to fund the strategic growth programs described above, including acquisitions dividends, and capital investments for organic growth, investments in capital assets to improve productivity and cost reductions. We recognize that cash flow is fundamentallower costs and to our ability to invest in organic and acquisitive growth for our business units and return cash to our shareholders in the formthrough payment of dividends.
As part of this ongoing strategy, during the first quarter of fiscal year 2015, we acquired Enginetics Corporation, (“Enginetics”), a leading producer of aircraft engine components for all major aircraft platforms. This investment complements our Engineering Technologies Groupdividends and allows us to provide broader solutions to the aviation market. During June 2014, we also acquired Ultrafryer Systems, Inc., (“Ultrafryer”), a manufacturer of high quality commercial deep fryers. This investment expanded our Food Service Equipment Group’s cooking product line capabilities in restaurant chains and commercial food service institutions. During June 2014, we also acquired the assets of Planar Quality Corporation, a producer of transformers for commercial military and space applications. This investment strategically enhances our Electronics Group’s transformer product line capabilities.
We continue to focus on our efforts to reduce cost and improve productivity across our businesses, particularly in the Food Service Equipment Group with the previously announced Cooking Solutions consolidation of operations located in the Cheyenne, Wyoming plant into its Mexico facility. We continue to evaluate our products and production processes and expect to execute similar cost reductions and restructuring programs on an ongoing basis.
Our business units are actively engaged in initiating new product introductions, expansion of product offerings through private labeling and sourcing agreements, geographic expansion of sales coverage, the development of new sales channels, leveraging strategic customer relationships, development of energy efficient products, new applications for existing products and technology, and next generation products and services for our end-user markets.
stock buybacks.
Restructuring expenses reflect costs associated with the Company’s efforts toof continuously improveimproving operational efficiency and expandexpanding globally in order to remain competitive in the end-user markets we serve. Each year the Company incursWe incur costs for actions to size itsour businesses to a level appropriate for current economic conditions, and to improve itsour cost structure, to enhance our competitive position and increase operating margins. Such expenses include costs for moving facilities to low-cost locations that allow for lower fixed and variable costs, external consultants who provide additional expertise, starting up plants after relocation, curtailing or downsizing operations because of changing economic conditions, and other costs resulting from asset redeployment decisions. Shutdown costs include severance, benefits, stay bonuses, lease and contract terminations, asset write-downs, costs of moving fixed assets, and moving and relocation costs. Vacant facility costs include maintenance, utilities, property taxes and other costs.
19
Because of the diversity of the Company’s businesses, end user markets and geographic locations, management does not use specific external indices to predict the future performance of the Company, other than general information about broad macroeconomic trends. Each of our individual business units serves niche markets and attempts to identify trends other than general business and economic conditions which are specific to their businessesits business and which could impact their performance. Those units report pertinent information to senior management, which useuses it to the extent relevant to assess the future performance of the Company. A description of any such material trends is described below in the applicable segment analysis.
We monitor a number of key performance indicators (“KPIs”) including net sales, income from operations, backlog, effective income tax rate, and gross profit margin.margin, and operating cash flow. A discussion of these KPIs is included in the discussion below. We may also supplement the discussion of these KPIs by identifying the impact of foreign exchange rates, acquisitions, and other significant items when they have a material impact on the discusseda specific KPI.
We believe that the discussion of these items provides enhanced information to investors by disclosing their consequenceimpact on the overall trend in order to providewhich provides a clearer comparative view of the KPI, whereas applicable. For discussion of the impact of foreign exchange rates on KPIs, the Company calculates the impact as the difference between the current period KPI calculated at the current period exchange rate as compared to the KPI calculated at the historical exchange rate for the prior period. For discussion of the impact of acquisitions, we isolate the effect toon the KPI amount that would have existed regardless of our acquisition. Sales resulting from synergies between the acquisition and existing operations of the Company are considered organic growth for the purposes of our discussion.
Unless otherwise noted, references to years are to fiscal years.
Consolidated Results from Continuing Operations (in thousands):
| | | 2015 | | 2014 | | 2013 | | 2018 | | 2017 | | 2016 |
Net sales | $ | 772,142 | $ | 716,180 | $ | 673,390 | $ | 868,382 | $ | 755,258 | $ | 751,586 |
Gross profit margin | | 32.1% | | 33.3% | | 32.4% | | 34.8% | | 33.5% | | 33.6% |
Restructuring costs | | 3,443 | | 10,077 | | 2,666 | | 7,594 | | 5,825 | | 4,232 |
Other income/(expense) operating | | 438 | | 3,462 | | - | | (3,749) | | (7,843) | | (7,458) |
Income from operations | | 78,644 | | 65,868 | | 61,895 | | 84,039 | | 65,026 | | 70,344 |
| | | | | | | | | | | | |
Backlog (realizable within 1 year) | $ | 168,157 | $ | 143,132 | $ | 125,396 | $ | 213,477 | $ | 193,539 | $ | 162,895 |
| | | | | | | | | | | | |
| | 2015 | | 2014 | | 2013 | | 2018 | | 2017 | | 2016 |
Net sales | $ | 772,142 | $ | 716,180 | $ | 673,390 | $ | 868,382 | $ | 755,258 | $ | 751,586 | |
Components of change in sales: | | | | | | | | | | | | | |
Effect of acquisitions | | 38,155 | | 297 | | 55,129 | | 59,855 | | 38,498 | | 11,672 | |
Effect of exchange rates | | (16,423) | | 3,954 | | (2,807) | | 14,394 | | (6,195) | | (15,011) | |
Effect of business divestitures | | | - | | (17,446) | | 2,791 | |
Organic sales growth | | 34,230 | | 38,539 | | 10,482 | | 38,875 | | (11,185) | | (20,008) | |
Net sales for the fiscal year 2018 increased by $113.1 million, or 15.0%, when compared to the prior year. Incremental sales increases from our recent acquisitions accounted for $59.9 million or 7.9%, while increased organic sales accounted for $38.9 million or 5.1%. We also recognized sales growth of $14.4 million or 1.9% related to favorable foreign exchange impacts. The organic sales increases occurred in all of our segments except Engineering Technologies.
Net sales for the fiscal year 20152017 increased by $56.0$3.7 million, or 7.8%0.5%, when compared to the prior year. The increase is driven by $34.2Incremental sales increases of $38.5 million or 4.8% of organic sales growth from three of our segments, $38.2 million or 5.3% of acquisitions from Enginetics, Ultrafryer, and Planarwere partially offset by unfavorable foreign exchangeorganic sales declines of $16.4$11.2 million, or 1.5%, the impact of $17.4 million, or 2.3% primarily, from the strengthdivestiture of the U.S. dollar as comparedRPM business, and an unfavorable impact of $6.2 million, or 0.8%, due to the Euro and Pound. Sales growth is a resulteffect of success of our top-line growth initiatives and improvements in end-user markets. We expect unfavorable foreign exchange impacts to revenue to continue into our first and second quarters of fiscal year 2016.
Netexchanges rates. The organic sales for the fiscal year 2014 increased by $42.8 million, or 6.4%, when compared to the prior year. The increase isdecrease was primarily driven by $38.5 million or 5.7% of organiclower sales growth from all our segmentsin the Refrigeration and favorable foreign exchange of $4.0 million. Sales growth is a result of success of our top-line growth initiatives and improvements in end-user markets.Cooking Solutions business units within the Food Service Equipment segment.
Gross Profit Margin
During 2015,2018, gross margin decreasedincreased to 32.1%34.8% as compared to 33.3%33.5% in 2014. This decrease is2017. Gross margin increases during fiscal year 2018 were primarily a resultdriven by the leverage on our 5.1% organic sales increase. The effects of exchange rate declines, an unfavorable sales mixpurchase accounting reduced our gross margins by 40 basis points in the prior year.
20
During 2017, gross margin remained essentially flat at 33.5% as compared to 33.6% in 2016. Excluding the effects of purchase accounting in both years, our gross margins increased 29 basis points compared to prior year. During fiscal year coupled with $1.72017, we incurred $3.1 million of purchase accounting charges associated withrelated to the EngineticsStandex Electronics Japan and Ultrafryer acquisitions.
During 2014, gross margin increased to 33.3%Horizon Scientific acquisitions as compared to 32.4%charges of $0.4 million in 2013. This increase isthe prior year for the Northlake acquisition.
Restructuring Charges and Acquisition Related Expenses
During fiscal year 2018, we incurred restructuring expenses of $7.6 million primarily a resultrelated to restructuring efforts that are intended to improve profitability, streamline production and enhance capacity to support future growth. These efforts include (i) approximately $4.1 million related to headcount reduction and plant realignment regarding the standard products businesses within Food Service Equipment; (ii) approximately $1.2 million in relation to the exit of sales volumean unprofitable Engraving business in Brazil; and favorable sales mix, coupled with the absence of $1.5(iii) approximately $1.1 million of purchase accounting charges incurred during 2013 associated with the Meder acquisition. Gross margin has increased at the Engraving Group due to strong automotive Mold-Tech sales.footprint optimization in the Engineering Technologies segment.
Acquisition related expenses in fiscal year 2018 were $3.8 million. These expenses were comprised primarily of $2.8 million for deferred compensation earned by the Horizon Scientific seller during the year. Since these payments are contingent on the seller remaining an employee of the Company, they are treated as compensation expense. Other acquisition related expenses related to Standex Electronics Japan and Piazza Rosa. Acquisition related expenses were approximately $4.0 million more in fiscal year 2017 due to the timing of the Standex Electronics Japan acquisition.
Selling, General, and Administrative Expenses
Selling, general, and administrative expenses, (“SG&A”) for the fiscal year 20152018 were $165.8$206.4 million, or 21.5%23.8% of sales compared to $165.8$174.1 million, or 23.1%23.0% of sales during the prior year. SG&A expenses were impacted by: (i) on-going SG&A expenses related to our recent acquisitions of $7.8 million, (ii) an increase in distribution and selling expenses of $9.4 million, (iii) an increase in administrative expenses related to investments to support our recent acquisitions and growth laneways and (iv) a $3.1 million increase in administrative compensation costs due to improved performance.
Selling, general, and administrative expenses, (“SG&A”) for the fiscal year 2017 were $174.1 million, or 23.0%, of sales compared to $170.2 million, or 22.6%, of sales during the prior year. The declineincrease in SG&A as a percentage of sales relates to three primary items: the absence of $3.9 million of management transition costs in the prior year; increased selling and distribution expense in the current year associated with a 4.8% increase in organic sales during the year; and $6.6 million of incremental expenses as a result of the Ultrafryer and Enginetics acquisitions.
Selling, general, and administrative expenses for the fiscal year 2014 were $165.8 million or 23.1% of sales compared to $153.6 million or 22.8% of sales. The increase was driven by $3.9 million of management transition costs, $3.4 million of compensation expenseprimarily due to improved performance$5.6 million and increase of $3.1$2.6 million of increased selling and distribution expenses due to incremental sales volume. The charge for management transition expense included search fees, relocation and other costs associated with the hiring of a new chief executive officer (“CEO”) and the acceleration of stock incentive compensation expenses related to the retired CEO. Horizon Scientific and Standex Electronics Japan businesses, respectively, which were not in prior year. These increases were partially offset by declines of $2.5 million from the divestiture of the RPM business, lower administrative compensation costs of $2.0 million, and lower variable expenses including commission and distribution costs.
Income from Operations
Income from operations for the fiscal year 20152018 was $84.0 million, compared to $65.0 million during the prior year. The $19.0 million dollar increase, or 29.2%, is primarily due to increased by $12.8sales volume, including 5.1% organic sales growth and 7.9% growth attributed to our recent acquisitions. The increase in operating income is also partially due to the reduction in acquisition related expenses of $4.1 million or 19.4%, whenas compared to the prior year. The increase is primarily driven by $56.0 million of sales increases, increasing gross profit by $9.2 million, along with a $6.6 million decline in restructuring expenses, and a reduction in net gain from insurance proceeds of $3.0 million.
Income from operations for the fiscal year 2014 increased by $4.02017 was $65.0 million, or 6.4%, when compared to $70.3 million during the prior year. The increasedecrease of $5.5 million was primarily driven by $42.8due to acquisition related costs of $7.8 million, an increase in restructuring costs of sales increases, gross profit improvement of $20.0$1.6 million, and a $3.5 million net gain from insurance proceeds,overall organic sales volume declines. These decreases were partially offset by increased operating expensethe positive performance of our Horizon Scientific and restructuring costs associated with the completion of a facility closure in the Food Service Equipment Group.Standex Electronic Japan acquisitions.
Discussion of the performance of alleach of our reportable segments is more fully explained in the segment analysis that follows.
Interest Expense
Interest expense for fiscal year 2018 was $8.0 million, an increase from $4.0 million in fiscal year 2017. The increase is due to higher borrowings associated with the recent acquisitions, in addition to working capital increases to support increased sales activity. Our effective interest rate of 3.29% as of June 30, 2018, increased 150 basis points as compared to 2.24% as of June 30, 2017. In addition, we incurred $0.9 million of charges associated with derivative activity related to the Standex Electronics Japan acquisition.
Interest expense for the fiscal year 20152017 was $3.2$4.0 million, an increase of $0.9$1.2 million as compared to the prior year. The increase is primarilyInterest expense increases were due to higher averageborrowing costs and an increase in outstanding borrowings, outstanding duringprimarily to fund acquisition activity.
21
Income Taxes
On December 22, 2017, the Tax Cuts and Jobs Act (the “Act”) was passed which resulted in the Company recording provisional estimates related to US taxes on foreign earnings, changes in the revaluation of deferred taxes, and foreign withholding taxes on cash repatriation in our consolidated financial statements. As a result of the Act, the Company recorded the following impacts for the year ending June 30, 2018:
A $1.34 million tax provision for income taxes due to a revaluation of the Company's estimated deferred tax assets and liabilities.
A $11.7 million tax provision related to a mandatory deemed repatriation of foreign earnings.
Other changes implemented by the Act will not impact the Company until the fiscal year ending June 30, 2019. These include several other technical provisions such interest expense deduction limitations on both unrelated and related party debt, new deemed foreign income inclusions under the Global Intangible Low-Taxed Income (GILTI) regime, the Foreign Derived Intangible Income (FDII) deduction for goods & services produced in the US and sold to foreign customers, the repeal of the Section 199 deduction, and the change to executive compensation deductions under Section 162(m).
In addition, as a result of the Enginetics acquisitionTax Reform change on US federal taxation on cash repatriation, the Company has changed its position on reinvestment of foreign earnings in several foreign jurisdictions. We recorded a $7.8 million tax provision related to the anticipated foreign withholding taxes and increased capital spending to support strategic growth programs. Interest expensestate taxes on future cash repatriation during the fourth quarter of $2.2 million during 2014 was comparable with 2013.2018.
Income Taxes
The Company's income tax provision from continuing operations for the fiscal year ended June 30, 20152018 was $20.9$40.6 million, or an effective rate of 27.4%,52.6% compared to $18.1$15.4 million, or an effective rate of 26.6%24.8% for the year ended June 30, 2014,2017, and $15.2$16.3 million, or an effective rate of 25.7%23.8% for the year ended June 30, 2013.2016. Changes in the effective tax rates from period to period may be significant as they depend on many factors including, but not limited to, the amount of the Company's income or loss, the mix of income earned in the U.S.US versus outside the U.S.,US, the effective tax rate in each of the countries in which we earn income, and any one timeone-time tax issues which occur during the period.
The Company's income tax provision from continuing operations for the fiscal year ended June 30, 2015 was impacted by the following items: (i) a benefit of $0.5 million related to the R&D tax credit that expired during the fiscal year on December 31, 2014 (ii) a benefit of $4.0 million due to the mix of income earned in jurisdictions with beneficial tax rates.
The Company's income tax provision from continuing operations for the fiscal year ended June 30, 2014 was impacted by the following items: (i) a benefit of $0.5 million related to the R&D tax credit that expired during the fiscal year on December 31, (ii) a benefit of $0.5 million related to a decrease in the statutory tax rate in the United Kingdom on prior period deferred tax liabilities recorded during the first quarter during the fiscal year, (iii) a benefit of $1.1 million due to non-taxable life insurance proceeds received in the third quarter and (iv) a benefit of $3.8 million due to the mix of income earned in jurisdictions with beneficial tax rates.
The Company's income tax provision from continuing operations for the fiscal year ended June 30, 2013 was impacted by the following items: (i) a benefit of $0.4 million related to the retroactive extension of the R&D credit recorded during the third quarter, (ii) a benefit of $0.3 million related to a decrease in the statutory tax rate in the United Kingdom on prior period deferred tax liabilities recorded during the first and fourth quarters, (iii) a benefit of $1.0 million from the reversal of a deferred tax liability that was determined to be no longer required during the third quarter and (iv) a benefit of $2.8 million due to the mix of income earned in jurisdictions with beneficial tax rates.
Capital Expenditures
During 2018, capital expenditures increased to $26.5 million or 3.1% of net sales, as compared to $26.4 million, or 3.5%, of net sales in the prior year. Capital spending is focused on growth initiatives, cost reduction, and upgrades to extend the capabilities of our capital assets. In general, we anticipate our capital expenditures over the longerlong term are expectedwill be approximately 3% to 4% of net sales. We expect 2019 capital spending to be approximately 2% to 3% of net sales. During 2015, capital expenditures increased to $22.6$36.0 million compared to $18.8which includes $5.0 million allocated for a new Standex Electronics facility in Cincinnati, which replaces a legacy facility sold for $1.4 million in the prior year. We anticipate capital expenditures in the rangethird quarter of $26.0 million to $28.0 million in 2016 including approximately $6.0 million related to a new facility to support growth in the aviation market.fiscal year 2018.
Backlog
Backlog includes all active or open orders for goods and services that have a firm fixed customer purchase order with defined delivery dates.services. Backlog also includes any future deliveries based on executed customer contracts, so long as such deliveries are based on agreed upon delivery schedules. Backlog is not generally a significant factor in the Company’s businesses because of our relatively short delivery periods and rapid inventory turnover with the exception of Engineering Technologies. Backlog orders are not necessarily an indicator of future sales levels because of variations in lead times and customer production demand pull systems. Customers may delay delivery of products or cancel orders prior to shipment, subject to possible cancellation penalties. Due to the nature of long term agreements in the Engineering Technologies group, the timing of orders and delivery dates can vary considerably resulting in significant backlog changes from one period to another. In general, the majority of net realizable backlog beyond one year comes from the Engineering Technologies Group.
Backlog orders in place at June 30, 2018 and 2017 are as follows (in thousands):
22
| | As of June 30, 2018 | | | As of June 30, 2017 |
| | Total Backlog | | Backlog under 1 year | | | Total Backlog | | Backlog under 1 year |
Food Service Equipment | $ | 45,011 | $ | 41,452 | | $ | 49,660 | $ | 47,039 |
Engraving | | 19,279 | | 19,269 | | | 21,584 | | 21,584 |
Engineering Technologies | | 98,289 | | 74,199 | | | 92,154 | | 61,329 |
Electronics | | 69,059 | | 64,180 | | | 60,092 | | 56,741 |
Hydraulics | | 14,481 | | 14,377 | | | 6,846 | | 6,846 |
Total | $ | 246,119 | $ | 213,477 | | $ | 230,336 | $ | 193,539 |
Backlog realizable within one year increased $25.0$19.9 million, or 17.5%,10.3% to $168.2$213.5 million at June 30, 20152018 from $143.1$193.5 million at June 30, 2014.2017. Backlog excludingincreases were realized at the acquisition year over year is down by $1.2 million or 0.8%. Engineering Technologies group segment primarily as a result of increases in the space and aviation sectors.
Segment Analysis (in thousands)
Food Service Equipment
| | 2015 compared to 2014 | | 2014 compared to 2013 | 2018 compared to 2017 | | 2017 compared to 2016 |
(in thousands except | | | | | % | | | | | | % | | | | | % | | | | | | % |
percentages) | 2015 | | 2014 | | Change | | 2014 | | 2013 | | Change | 2018 | | 2017 | | Change | | 2017 | | 2016 | | Change |
Net sales | $ 408,706 | | $ 377,848 | | 8.2% | | $ 377,848 | | $ 367,008 | | 3.0% | $ 396,866 | | $ 380,970 | | 4.2% | | $ 380,970 | | $ 381,867 | | (0.2%) |
Income from operations | 37,456 | | 38,203 | | -2.0% | | 38,203 | | 37,533 | | 1.8% | 34,853 | | 33,436 | | 4.2% | | 33,436 | | 40,142 | | (16.7%) |
Operating income margin | 9.2% | | 10.1% | | | | 10.1% | | 10.2% | | | 8.8% | | 8.8% | | | | 8.8% | | 10.5% | | |
Net sales for fiscal year 20152018 increased $30.9$15.9 million, or 8.2%4.2% when compared to the prior year. Organic sales increased $4.8 million or 1.3%; the acquisitions contributed $9.5 million or 2.5% and foreign exchange added $1.6 million or 0.4%. Refrigeration Solutions sales increased by 9.4%, which included organic sales increases of 5.2% and acquisition growth of 4.2%. Refrigeration sales increased in the scientific and food service markets. The dealer, direct, and retail food service markets recovered from prior year declines. Sales in Cooking Solutions decreased by 8.8% year over year due to the timing of grocery and convenience store rollouts in the current year, continued product rationalization and the timing of new product introductions. Specialty Solutions sales increased 9.4% with solid volume from the beverage market and strong growth in merchandising. The Standard Products businesses increased sales by 1.6% during the year while our Differentiated Products businesses grew by 7.8%.
Net sales for fiscal year 2017 decreased $0.9 million, or 0.2% when compared to the prior year. The Horizon Scientific acquisition added $23.4 million or 6.1%, while organic sales growthdeclined by $24.2 million or 6.3%. The organic sales decline was driven by organic sales increases of 4.9%, sales generated from Ultrafyer of 3.9%,a 7.4% decrease in Refrigeration Solutions and a 9.9% decrease in Cooking Solutions, partially offset by foreign exchange declines. The Refrigerated Solutions Groupa 2.7% increase in Specialty Solutions. Four factors contributed to the organic Refrigeration sales increased 4.7% as the group saw a returndecline: (i) continued loss of the drug retail business in 2015 and continued to have strong salesmarket share into the dollar store market. Also addingmarket, (ii) delayed growth in the pharmacy sector due to 2015 growth were general dealer marketsmerger delays, (iii) second half manufacturing issues which, were up appreciably, but atin the short term, lengthened our delivery lead-times and (iv) the increasing importance of buying groups as a sales channel and their resultant lower price point and with lower-margin product mix. This strength was partially offset by weakness in national food service chains.margins. Sales from the Cooking Solutions Group increased by 22.2% year over year. Excluding the Ultrafryer acquisition, Cooking Solutions Group grew at 4.2%. The acquisition of Ultrafryer has generated strong sales growth and has provided accessgroup decreased due to new chains. Elsewherenon-recurring rollouts in the Cooking Solutions Group, growth was driven by U.S. retail supermarket customers. We have re-aligned our European distribution in the U.K. by closing our directchannel, lower sales office. This is expectedon rationalized low-margin products and lower sales to yield profitable sales growth in 2016. The closure of a facility at the end of fiscal year 2014 caused delays in customer deliveries during the year. Factory and distribution center performance improved gradually during the year as we continued to align product mix in each distribution center with our customers’ needs. Further improvements are planned during 2016 to optimize the segment’s distribution network.few major dealers. Specialty Solutions sales increased 1.1% asdue to strong volume in our European pump business was impacted by the weakening of the Euro during the year. Foreign exchange losses in the group were offset by salesbeverage segment and modest growth in our specialty merchandising business as several new chains have signed on for development of customized solutions. We anticipate strong growth in the deli and display case markets primarily in convenience and small footprint retail stores in 2016.merchandising.
Income from operations for fiscal year 2015 decreased $0.72018 increased $1.4 million, or 2.0%by 4.2%, when compared to the prior year, and operating income margin declined from 10.1% to 9.2%was flat at 8.8%. Margins were negatively impacted by higher commodity prices and the plant realignment in our Standard Products businesses. The positive impactrealignment of the year-over-year volume increaseRefrigeration and Cooking Solutions plant operations was offset by a combination of adverse market channel, productlargely completed in 2018 and customer mix changes; negative foreign exchange impacts and disruptions resulting from a factory closure. During the fourth quarter operating income margin increased 0.9% over prior year to 11.8%.should show benefits in 2019. The operating income margin results in the Group have been trending favorably. We expect to realize the full benefits of the factory consolidation in the first half of 2016.
We have targeted operational margin improvements in 2016. This is expected to be driven by product line rationalization; realignment of our U.K. sales channel; introduction of several new products; and capital-related cost reduction projects. In addition, we are realigning our organizational structure, reducing the number of P&Ls from seven to four, building a strong leadership team, and implementing operational excellence initiatives.
Net sales for fiscal year 2014 increased $10.8 million, or 3.0%, when compared to the prior year. The Refrigerated Solutions (walk-in coolers and freezers and refrigerated cabinets)Scientific and Specialty Solutions businesses grew approximately 5.8%had a positive impact on margins in fiscal year 2018. Our focus in fiscal year 2019 is to continue to grow our Differentiated Products businesses and 3.6%, respectively,realize the savings from the operational improvements implemented this year over year, while the Cooking Solutions Group net sales declined by 3.0% year over year. The Refrigeration business continued to see penetration into the dollar store segment with its new line of “endless” merchandising products. Also strong were the general dealer markets and specialty cabinets for the beverage industry. This strength was partially offset by continued weakness in the drug retail segment as new store construction is at reduced levels compared to prior year, and to our quick-service restaurant chain customers that had reduced domestic capital spending due to customer changes in timing of deliveries. The Specialty Solutions Group growth was driven by strong growth in the beverage pump business as demand returned in both the domestic and international markets, particularly with demand for new products in the European espresso market segment. This growth was partially offset by a sales decline in the Specialty Merchandising segment due to soft demand in the middle of the fiscal year. The sales decline in the Cooking Solutions Group was driven by weakness at several key dealers, lapping of a chain rollout in the prior year and reductions in inventories at parts distributors. This was partially overcome by strengthening of the U.S. retail supermarket deli market segment, overcoming further softening of sales in the U.K. In addition, the Cooking Group benefited from $0.3 million of sales from the Ultrafryer acquisition.Standard Products businesses.
Income from operations for fiscal year 2014 increased $0.72017 decreased $6.7 million, or 1.8%16.7%, when compared to the prior year. The Group’s return onyear, and operating income margin decreased from 10.5% to 8.8%. Fiscal year results were primarily impacted by sales was nearly flat as compareddeclines in the Refrigeration Solutions group due to the prior year. The positive impact of the year over year volume increase was partially offset by a combination of adverse product and customer mix changes. Additionally, productivity was negatively impacted by disruption related to the manufacturing realignment.factors discussed above.
23
Engraving
| | 2015 compared to 2014 | | 2014 compared to 2013 | 2018 compared to 2017 | | 2017 compared to 2016 |
(in thousands except | | | | | % | | | | | | % | | | | | % | | | | | | % |
percentages) | 2015 | | 2014 | | Change | | 2014 | | 2013 | | Change | 2018 | | 2017 | | Change | | 2017 | | 2016 | | Change |
Net sales | $ 110,781 | | $ 109,271 | | 1.4% | | $ 109,271 | | $ 93,380 | | 17.0% | $ 136,275 | | $ 105,943 | | 28.6% | | $ 105,943 | | $ 124,120 | | (14.6%) |
Income from operations | 24,250 | | 22,145 | | 9.5% | | 22,145 | | 15,596 | | 42.0% | 28,966 | | 25,584 | | 13.2% | | 25,584 | | 29,579 | | (13.5%) |
Operating income margin | 21.9% | | 20.3% | | | | 20.3% | | 16.7% | | | 21.3% | | 24.1% | | | | 24.1% | | 23.8% | | |
Net sales for fiscal year 20152018 increased by $1.5$30.3 million or 1.4%28.6%, compared to the prior year with an organic growth rate of 10.2%. The Piazza Rosa Group acquisition contributed $13.2 million or 12.5%. Sales in our Mold-Tech businesses grew due to launches of new automotive models in the current year. New technologies sales of Architexture, laser, nickel shell, finishing and treatment grew by $17.8 million or 139% during the year. We expect Engraving sales growth in all regions in fiscal year 2019 due to the increase in the number of new automotive launches and the expansion of our combined offerings to the tooling industry.
Net sales for fiscal year 2017 decreased by $18.2 million or 14.6%, compared to the prior year. UnfavorableExcluding the impact of the end of prior year divesture of the Roll Plate and machinery business and foreign exchange, impactednet sales $7.2 million. Sales growth excluding foreign exchange losses were primarily driven by continued expansion of our Asia Pacific Mold-Tech business as a result ofgrew $2.0 million or 1.6%. Overall, Mold Tech increased its global market share. North American sales volumes were downshare for the year due to lower new automotive model activityintroductions. Asia Pacific and some automotive projects that were pushed out from the fourth quarterEurope sales grew $4.2 million in fiscal year 2017, partially offset by lower sales volume in North America, which was due to the first half of 2016. We continue to expand our Mold-Tech business with new operations established in the quarter in Sweden and Malaysia. Sales of core forming tooling grew 25% or $2.4 million as compared to prior year. First half softness in our roll plate and machinery business was offset as sales strengthened in the second half of the year. We expect sales improvements in 2016 in the North American market asdelayed new automotive model launches are anticipated to increase.launches.
Income from operations in fiscal year 20152018 increased by $2.1$3.4 million, or 9.5%13.2%, when compared to the prior year. The increase is drivenWhile overall operating income improved due to our new product offerings, these offerings required up-front investments which negatively impacted operating income margins for the year. We expect operating income margin improvements as the investments produce expected returns. In fiscal 2018, we were also negatively impacted by increased volumelower margins in Asia Pacific partially offset by unfavorable foreign exchangeBrazil, Sweden, and fewer new model launches which impeded margin growthGermany. We believe that we have made the necessary changes to improve profitability in the mold texturing business.
Net sales forthose locations in fiscal year 2014 increased by $15.9 million or 17.0%, compared to the prior year. This growth was driven by record new model launches and refreshed platforms in the global automotive industry. Increased market share gained by our Mold-Tech business resulted in a 26% or $16.9 million increase in mold texturing sales as compared to the prior year. Growth for Mold-Tech was strong in all markets we operate in worldwide. Sales of core forming tooling grew 6% or $0.5 million as compared to prior year.2019.
Income from operations in fiscal year 2014 increased2017 decreased by $6.5$4.0 million, or 42%13.5%, when compared to the prior year. High margins associated withNet of the Roll Plate and Machinery business, income from operations decreased by $2.8 million, or 9.8%. The operating income decline was driven by decreased automotive volume in North America, the impact of a sales decline at the Innovent business unit, and increased investments in growth laneways and new automotive model platform launches and refreshed platforms worldwide drove higher profitability for the year.technologies to fuel future opportunities.
Engineering Technologies
| | 2015 compared to 2014 | | 2014 compared to 2013 | 2018 compared to 2017 | | 2017 compared to 2016 |
(in thousands except | | | | | % | | | | | | % | | | | | % | | | | | | % |
percentages) | 2015 | | 2014 | | Change | | 2014 | | 2013 | | Change | 2018 | | 2017 | | Change | | 2017 | | 2016 | | Change |
Net sales | $ 97,018 | | $ 79,642 | | 21.8% | | $ 79,642 | | $ 74,838 | | 6.4% | $ 90,781 | | $ 90,506 | | 0.3% | | $ 90,506 | | $ 82,235 | | 10.1% |
Income from operations | 13,097 | | 12,676 | | 3.3% | | 12,676 | | 13,241 | | -4.3% | 6,449 | | 9,662 | | (33.3%) | | 9,662 | | 8,258 | | 17.0% |
Operating income margin | 13.5% | | 15.9% | | | | 15.9% | | 17.7% | | | 7.1% | | 10.7% | | | | 10.7% | | 10.0% | | |
Net sales in the fiscal year 20152018 increased $17.4$0.3 million or 21.8%,0.3% when compared to the prior year. Acquisitions contributed $22.5 million or 28.3%,Sales distribution by market in 2018 was as follows: 50% aviation, 27% space, 11% oil and gas, 5% medical, and 7% other markets. Aviation sales grew 14.3% from the prior year due to sales on new aircraft and engine platforms, including the Airbus A320 NEO and Boeing 737 Max platforms. Space market sales decreased 7.9% from the prior year driven by lower sales in the satellite launch vehicle segment, partially offset by organic sales declines of $4.6 million, or 5.8%. Salesan increase in the land based gas turbinemanned space segment. Defense and oil and gas segments were down 24.9%markets also declined in fiscal 2018. While we anticipate sales growth in fiscal 2019, we expect our first quarter sales will show a decline followed by increases in the remainder of the fiscal year.
Net sales in the fiscal year 2017 increased $8.3 million or 10.1% when compared to the prior year. Sales distribution by market in 2017 was as follows: 43% aviation, 29% space, 14% oil and gas, 5% medical, and 9% other markets. Although energy sales rebounded from historical lows, we continued our conversion of this business to an aviation focused business. Aviation sales increased 2.8% from the prior year, level. The decline was a result of reduced demand due to lower oil prices. Baseddespite delays experienced by key customers on current pricing levels, we expect thisnew engine platforms. Space market to remain soft for at least the next 12 months. In response we have implemented plans to align operating costs with demand. Space segment sales increased 26.3%15.8% from the prior year driven by higher sales in both the satellite launch and vehicle andmarkets. Defense related sales improved 11.6% from the manned space segments currentlyprior year. Sales in the development phase. Legacy salesenergy markets were up $4.6 million primarily due to contract awards
24
in the land based energy market. We expect continued strong growth in the aviation segment were up 24%market from the various platforms with nacelle lipskin & inlet duct products, along with aircraft engine components with the various OEM’s and Tier One customers.
Income from operations in fiscal 2018 decreased $3.2 million or 33.3% when compared to the prior year. The decrease in operating income was due to delays in major aircraft programs, decreased spending on development programs in the space and aviation markets, and pricing pressure on legacy aircraft parts. Looking forward, we do anticipate improved margins as the aviation programs ramp to full volume in calendar year 2020.
Income from operations in fiscal 2017 increased $1.4 million or 17.0% when compared to the prior year. The increase in operating income was due to higher sales volume and a favorable product mix in the Energy and Space segments compared to the prior year due to recent contract awards. Defense related sales were down 41.2% due to the timing of project based contracts. Sales in the medical segment were down 14.4% primarily due to a shift in product mix.period.
Income from operations in the fiscal year 2015 increased $0.4 million, or 3.3%, when compared to the prior year due to the impact of the Enginetics acquisition. Operating income was negatively impacted by $1.1 million of purchase accounting expenses and lower volume from oil and gas customers. During the first quarter of fiscal year 2016 we expect to break ground for a new facility in Wisconsin to support growth in the aviation market. We expect the facility to be operational in fiscal year 2016.
Electronics
| 2018 compared to 2017 | | 2017 compared to 2016 |
(in thousands except | | | | | % | | | | | | % |
percentages) | 2018 | | 2017 | | Change | | 2017 | | 2016 | | Change |
Net sales | $ 196,291 | | $ 136,689 | | 43.6% | | $ 136,689 | | $ 118,319 | | 15.5% |
Income from operations | 45,310 | | 27,663 | | 63.8% | | 27,663 | | 21,104 | | 31.1% |
Operating income margin | 23.1% | | 20.2% | | | | 20.2% | | 17.8% | | |
Net sales in the fiscal year 20142018 increased $4.8$59.6 million, or 6.4%, when compared to the prior year. Sales growth in the space, energy, aviation, and oil and gas markets was offset by declines in the medical and industrial market segments. The space market segment increased from prior year levels due to continued strong demand on launch vehicle development programs and the satellite launch segment. The land based gas turbine business improved year-over-year due to increased demand from our OEM customers. Sales to the oil and gas segment increased year-over-year as a result of additional large offshore platform projects. The aviation market was up from the prior year as a result of newly awarded programs and development contracts as well as increased market penetration.
Income from operations in the fiscal year 2014 decreased $0.6 million, or 4.3%, when compared to the prior year. Volume and product mix improvements in the U.K. were offset by higher manufacturing and development costs in the U.S.
Electronics Products
| | | | | | | | | | | |
| 2015 compared to 2014 | | 2014 compared to 2013 |
(in thousands except | | | | | % | | | | | | % |
percentages) | 2015 | | 2014 | | Change | | 2014 | | 2013 | | Change |
Net sales | $ 114,196 | | $ 114,881 | | -0.6% | | $ 114,881 | | $ 108,085 | | 6.3% |
Income from operations | 20,884 | | 19,732 | | 5.8% | | 19,732 | | 16,147 | | 22.2% |
Operating income margin | 18.3% | | 17.2% | | | | 17.2% | | 14.9% | | |
Net sales in the fiscal year 2015 decreased $0.7 million, 0.6%43.6%, when compared to the prior year. Organic sales growth of $4.8was $16.6 million, or 4.2%, was more than offset by exchange rate declines of $6.2 million. Almost all12.1%. The sales impact of the Standex Electronics Japan (“SEJ”) reed switch operation, acquired March 31, 2017, as compared to the prior year was $37.1 million. Foreign exchange rates favorably affected sales by $5.9 million. Organic sales growth came from the sensor, relay and planar product lines acrosswas strong in all major geographic areas. Salesareas and all major product lines with particular strength in sensors and reed switches. Looking forward to our first quarter fiscal 2019, demand remains strong across all regions.
Net sales in the fiscal year 2017 increased $18.4 million, or 15.5%, when compared to the prior year. Organic sales growth was $5.2 million, or 4.3%. The full year effect of the prior year Northlake acquisition added $2.7 million in local currencysales. The March 31, 2017 acquisition of SEJ added $12.4 million. Foreign exchange rates adversely affected sales by $1.9 million. Organic sales growth was particularly strong in Europe driven by volume increases in expanding sensor applications. We also experienced modest growth in North America and Asia. We have a strong backlog going into the first quarter of fiscal year 2016 and the Company anticipates that the strength in the US dollar will negatively impact net sales in the first half of 2016 as compared to the prior year.
Income from operations in the fiscal year 20152018 increased $1.2$17.7 million, or 5.8%63.8%, when compared to the prior year. The improvement was driven byoperating improvements were a result of the acquisition of SEJ reed switch business, along with operating efficiencies, product mix and higher organic sales growth; operational improvements; material and labor cost savings; favorable product mix due to increased sensor and relay sales; facility consolidations; and improved efficienciesgrowth in our new Mexico facility partially offset by a negative impact due to foreign exchange rates.
Net sales inbase business, and the fiscal year 2014 increased $6.8absence of $2.3 million or 6.3%, when compared toof purchase accounting expenses from the prior year. Much of the increase took place within the sensor product line both in North America and Europe. Sales in various markets improved particularly in transportation, industrial, contract manufacturing and metering. Sales were also helped by favorable foreign exchange rate totaling approximately $2.6 million.
Income from operations in the fiscal year 20142017 increased $3.6$6.6 million, or 22.2%31.1%, when compared to the same period in 2016. The operating improvements were a result of operating efficiencies and product mix as well as higher organic sales growth. The prior year acquisition of SEJ reed switch business and prior year acquisition of Northlake Engineering also impacted the EBIT improvement. The purchase accounting related to the SEJ reed switch business totaled $2.0 million.
Hydraulics
| 2018 compared to 2017 | | 2017 compared to 2016 |
(in thousands except | | | | | % | | | | | | % |
percentages) | 2018 | | 2017 | | Change | | 2017 | | 2016 | | Change |
Net sales | $ 48,169 | | $ 41,150 | | 17.1% | | $ 41,150 | | $ 45,045 | | (8.6%) |
Income from operations | 7,316 | | 6,712 | | 9.0% | | 6,712 | | 7,947 | | (15.5%) |
Operating income margin | 15.2% | | 16.3% | | | | 16.3% | | 17.6% | | |
Net sales in fiscal year 2018 increased by $7.0 million, or 17.1% compared to the prior year. Sales distribution by channel in 2018 was as follows: 37% dump trailer and truck, 26% refuse, 25% after-market, 5% export, and 7% other markets. The majority of the increase in sales was from strong demand in the refuse and dump markets. Additionally, several new OEM cylinder applications on front-end loading garbage trucks and container handlers were secured during the year. We anticipate sales increases in the first half of fiscal year 2019 as the construction, housing and infrastructure markets remain robust.We also anticipate additional sales increases due to price increases we are implementing to partially offset the impact of newly imposed tariffs on product we import from our Chinese operations.
25
Net sales in fiscal year 2017 decreased $3.9 million, or 8.6% compared to the prior year. Sales distribution by channel in 2017 was as follows: 37% dump trailer and truck, 22% refuse, 24% after-market, 6% export, and 11% other markets. The decrease in sales primarily resulted from a significant reduction in demand from the traditional North American dump trailer and truck markets.
Income from operations in fiscal year 2018 increased $0.6 million when compared to the prior year. The improvement was drivenMargins were impacted in fiscal 2018 by material cost increases. However, we implemented price increases in the sales increase as well as various cost savings both material and labor, product mix in sensors, a consolidationlatter half of the Tianjin manufacturing and Hong Kong distribution operations into the existing Shanghai operation, and the absence of $1.5 million of purchase accounting expenses related to the Meder acquisition incurred in 2013.
Hydraulics Products
| | | | | | | | | | | |
| 2015 compared to 2014 | | 2014 compared to 2013 |
(in thousands except | | | | | % | | | | | | % |
percentages) | 2015 | | 2014 | | Change | | 2014 | | 2013 | | Change |
Net sales | $ 41,441 | | $ 34,538 | | 20.0% | | $ 34,538 | | $ 30,079 | | 14.8% |
Income from operations | 7,013 | | 5,781 | | 21.3% | | 5,781 | | 4,968 | | 16.4% |
Operating income margin | 16.9% | | 16.7% | | | | 16.7% | | 16.5% | | |
Net sales in the fiscal year 2015 increased $6.9 million, or 20.0%, when compared to the prior year. Diversificationmitigate some of these material price increases. Looking forward, some of our OEM business into refuse and construction equipment along with strong demand for cylinder requirements in the traditional North American dump truck and trailer drove the increase in net sales. The business has focused on delivering custom engineered cylinder solutions to OEM customers, including single and double acting telescopic hydraulic cylinders, hydraulic rod cylinders, and most recently pneumatic cylinders. New applications for these products are being utilizedimpacted by recently enacted and currently proposed tariffs on roll off container handlers, garbage trucks, airline support equipment, lift trucks, and specialty loading equipment. To support expected increased demand, weproducts manufactured by us in China. These tariffs will be making capital investmentshave a negative impact on margins in our factories during 2016.fiscal 2019, if fully implemented.
Income from operations in the fiscal year 2015 increased2017 decreased $1.2 million or 21.3%15.5% when compared to the prior year due to increased sales volume and better facility utilization.
Net sales in the fiscal year 2014 increased $4.5 million, or 14.8%, when comparedmostly to the prior year. Diversificationreduction of our OEM business into refuse and construction equipment along with the revitalization of the traditional North American dump truck and trailer and export markets drove the 14.8% growth in net sales.
Income from operations in the fiscal year 2014 increased $0.8 million or 16.4% when compared to the prior year. This increase in annual income from operations was primarily due to better utilization of factory overhead bothvolume requirements for cylinders in the North American dump trailer and the Tianjin China, factories in addition to strict cost containment efforts.truck markets.
Corporate, Restructuring and Other
| | | 2015 compared to 2014 | | 2014 compared to 2013 | | 2018 compared to 2017 | | 2017 compared to 2016 |
(in thousands except | (in thousands except | | | | | % | | | | | | % | (in thousands except | | | | | % | | | | | | % |
percentages) | percentages) | 2015 | | 2014 | | Change | | 2014 | | 2013 | | Change | percentages) | 2018 | | 2017 | | Change | | 2017 | | 2016 | | Change |
| Corporate | $ (21,051) | | $ (26,054) | | -19.2% | | $ (26,054) | | $(22,924) | | 13.7% | Corporate | $ (27,512) | | $ (25,015) | | 10.0% | | $ (25,015) | | $ (24,996) | | 0.1% |
| Restructuring | (3,443) | | (10,077) | | -65.8% | | (10,077) | | (2,666) | | 278.0% | Restructuring | (7,594) | | (5,825) | | 30.4% | | (5,825) | | (4,232) | | 37.6% |
| Other operating income (expense), net | 438 | | 3,462 | | -87.3% | | 3,462 | | - | | 100.0% | Other Operating Expenses | (3,749) | | (7,843) | | (52.2%) | | (7,843) | | (7,458) | | 5.2% |
Corporate expenses increased by 10.0% in fiscal 2018 due to increases in administrative compensation costs as a result of improved performance along with additional investments to support the Standex Value Creation System.
During fiscal year 2015 decreased $5.0 million or 19.2%2017, Corporate expenses were flat when compared to the prior year.
The decrease is primarily due to the absence of management transition cost of $3.9 million incurred in 2014.
Corporate expenses in fiscal year 2014 increased $3.1 million or 13.7% when compared to the prior year. The increase was driven by $3.9 million of management transition. The charge for management transition expense includes search fees, relocationrestructuring and otheracquisition-related costs associated with the hiring of a new chief executive officer (“CEO”) and the acceleration of stock incentive compensation expenses related to the retired CEO.
Restructuring expense during fiscal year 2015 was $3.4 million compared to $10.1 million the prior year. Restructuring expense consisted of $2.6 million related to facility closures and consolidationshave been discussed above in the Food Service Equipment Group.Company Overview.
Restructuring expenses of $10.1 million in the fiscal year 2014 are composed of $9.2 million at Food Service Equipment primarily related to the announced closure of the Cheyenne, Wyoming facility, which includes a non-cash fixed asset impairment charge of $5.4 million.
The Company currently expects to incur between $2.0 and $4.0 million of restructuring expense in 2016, including the cost to complete actions initiated during 2015 and actions anticipated to be approved and initiated during 2016.
During fiscal year 2015, other operating income (expense), net decreased by $3.0 million from the prior year. The decrease is primarily a reduction of insurance proceeds received related to the catastrophic failure of a large vertical machining center located at our Engineering Technologies facility in Massachusetts.
During fiscal year 2014, other operating income (expense), net includes a $3.5 million net gain from insurance proceeds we received. Insurance proceeds of $4.5 million were partially offset by the write-off of the net book value of the machine of $1.0 million.
Discontinued Operations
In pursuing our business strategy, we have divested certain businesses and recorded activities of these businesses as discontinued operations.
In June 2014, the Company divested the American Foodservice Company, (“AFS”) a manufacturer of custom design and fabrication of counter systems and cabinets, in our Food Service Equipment Group segment. In connection with this sale, the Company received proceeds of $3.1 million and recorded a net loss on disposal of $3.2 million.
On March 30, 2012, Air Distribution Products Group, (“ADP”) was sold to a private equity buyer for consideration of $16.1 million consisting of $13.1 million in cash. Pursuant to the transaction, the Company received a $3.0 million promissory note from the buyer. The note is secured by a mortgage on the ADP real estate sold in the transaction in Detroit Lakes, MN, Medina, NY, and Powder Springs, GA. The Company remained the obligor of ADP’s Philadelphia, PA facility and administrative offices, and sublet space to the buyer after the divestiture. The buyer terminated their obligation under the Philadelphia sublease in September 2014. On February 4, 2015 we entered into a one year renewable sublease agreement for this building. Our net obligation with respect to the remaining Philadelphia leases is $1.3 million, of which $0.9 million was recorded as a liability at June 30, 2015. We do not expect to record additional charges related to these obligations.
During 2014, the Company received notice that its obligations under a guarantee provided to the buyers of ADP were triggered as a result of its withdrawal from both of the multi-employer pension plans in which ADP previously participated. As a result, the Company has recorded charges of $1.6 million in excess of the value of the guarantee previously recorded. The last of these obligations were settled in July of fiscal year 2016 by a $0.5 million payment to the final multi-employer plan.
The following table summarizes the Company’s discontinued operations activity, by operation, for the years ended June 30, (in thousands):
| | | | | | | | | | |
| Year Disposed | 2015 | | | 2014 | | | 2013 |
Sales: | | | | | | | | | | |
American Foodservice Company | 2014 | | $ | - | | $ | 20,556 | | $ | 27,870 |
| | | | | | | | | | |
Income (loss) before taxes: | | | | | | | | | | |
American Foodservice Company(1) | 2014 | | | (492) | | | (8,339) | | | 1,934 |
Air Distribution Products Group | 2012 | | | (137) | | | (1,849) | | | (451) |
Other loss from discontinued operations | | | | (130) | | | (387) | | | (207) |
Income (loss) before taxes from discontinued operations | | | (759) | | | (10,575) | | | 1,276 |
(Provision) benefit for tax | | | | 259 | | | 3,692 | | | (482) |
Net income (loss) from discontinued operations | | $ | (500) | | $ | (6,883) | | $ | 794 |
(1)American Foodservice Company incurred a pretax operational loss of $3.5 million and pretax loss on sale of $4.8 million.
Liquidity and Capital Resources
At June 30, 2015,2018, our total cash balance was $96.1$109.6 million, of which $90.3$101.8 million was held byoutside of the United States. Beginning in 2019, we expect to repatriate approximately $50 million of our cash held outside of the United States. During the fourth quarter of 2018, we recorded a $7.8 million tax provision related to the anticipated foreign subsidiaries.withholding taxes and state taxes on future cash repatriation. The repatriationamount and timing of cash balances from certain of our subsidiaries could have adverse tax consequences orrepatriation during 2019 will be subject to capital controls; however, those balances are generally available without legal restrictionsdependent upon each business unit’s operational needs including requirements to fund ordinary business operations. Our current plans are not expected to require a repatriation of cash to fund our U.S. operationsworking capital, capital expenditure, and as a result, we intend to indefinitely reinvest our foreign earnings to fund our overseas growth. If the undistributed earnings of our foreign subsidiaries are needed for operations in the United States we would be required to accrue and pay U.S. taxes upon repatriation. jurisdictional tax payments.
Cash Flow
Net cash provided by continuing operating activities for the year ended June 30, 2018 was $65.0 million compared to net cash provided by continuing operating activities of $64.0 million in the prior year. We generated $76.2 million from income statement activities and used $19.6 million of cash to fund working capital increases. Cash flow used in investing activities for the year ended June 30, 2018 totaled $32.3 million. Uses of investing cash consisted primarily of capital expenditures of $26.5 million and $10.4 million for Piazza Rosa and other acquisition activities. These uses of investing cash were partially offset by $2.1 million from proceeds of life insurance and $2.9 million from the net proceeds of the sale of a building in Cincinnati, Ohio. We leased back the Cincinnati, Ohio building and, as a result of the transaction, recorded a $0.7 million deferred gain that will be amortized over the initial operating lease term which expires in May 2019. Cash used by financing activities for the year ended June 30, 2018 were $11.9 million and included net borrowings of $1.3 million, cash paid for dividends of $8.9 million and stock repurchases of $2.7 million.
Net cash provided by operating activities from continuing operations for the year ended June 30, 20152017 was $66.2$64.0 million, compared to $72.0$81.2 million for the same period in 2014. Changes to net cash provided by operating activities of $5.8 million2016. The decrease was primarily relateddue to increases toin accounts receivable and inventory as well as a decrease in net income from continuing operations of $5.5 million and $2.9 million of decreases to non-cash stock compensation expenses which were more than offset by the use of cash for net working capital needs during the year.
$5.7 million. Net cash used infor investing activities from continuing operations for the year ended June 30, 20152017 was $78.5$179.1 million, consisting primarily of $57.1 million for the acquisitions and $22.6 $26.4
26
million for capital expenditures.
expenditure and $153.8 million to acquire the Horizon Scientific and Standex Electronics Japan businesses. Net cash providedused by financing activities for continuing operations for the year ended June 30, 2015,2017 was $44.6$84.7 million, consisting of netdebt borrowings of $58.0$99.5 million, primarily related to acquisitions during the year, partially offset bycash dividends paid of $5.8$7.9 million, and repurchased treasury stock of $7.6$7.8 million.
We sponsor a number of defined benefit and defined contribution retirement plans. The U.S. pension plan is frozen for all participants. We have evaluated the current and long-term cash requirements of these plans, and our existing sources of liquidity are expected to be sufficient to cover required contributions under ERISA and other governing regulations.
The fair value of the Company's U.S. defined benefit pension plan assets was $191.0 million at June 30, 2018, as compared to $195.3 million as of June 30, 2017. During the fourth quarter of 2018, we made a $5.5 million voluntary contribution to the defined benefit plan in the U.S. to accelerate tax benefits afforded to the Company by recent tax law changes.
We participate in two multi-employer pension plans and sponsor five defined benefit plans including two in the U.S. and one in the U.K., Germany, and Ireland. The Company’s pension plan is frozen for U.S. employees and participants in the plan ceased accruing future benefits. Our primary U.S. defined benefit plan is not expected to be 100% funded under ERISA rules at June 30, 2018, but, as a result of past contributions, we do not expect to make mandatory contributions to the plan until 2020. We expect to pay $1.4 million in prescribed contributions to our U.K. funded defined benefit plan and other unfunded defined benefit plans in the U.S. and Europe during fiscal year 2019.
We have evaluated the current and long-term cash requirements of our defined benefit and defined contribution plans as of June 30, 2018 and determined our operating cash flows from continuing operations and available liquidity are expected to be sufficient to cover the required contributions under ERISA and other governing regulations.
We have an insurance program in place to fund supplemental retirement income benefits for five retired executives. Current executives and new hires are not eligible for this program. At June 30, 2018, the underlying policies had a cash surrender value of $17.3 million and are reported net of loans of $8.6 million for which we have the legal right of offset. These amounts are reported net on our balance sheet.
Capital Structure
During fiscal year 2015, theThe Company entered into an Amended and Restatedits Credit Agreement (��(“Credit Facility”, or “facility”). in December 2014. This five-year Credit Facility expires in December 2019 and has a borrowing limit of $400 million, which can be increased by an amount of up to $100 million, in accordance with specified conditions contained in the agreement.conditions. The facility also includes a $10 million sublimit for swing line loans and a $30 million sublimit for letters of credit. The facility amends and restates a previously existing $225 million revolving credit agreement, which was scheduled to expire in January 2017.
Under the terms of the Credit Facility, we will pay a variable rate of interest and a commitment fee on borrowed amounts as well as a commitment fee on unused amounts under the facility. The amount of the commitment fee will dependdepends upon both the undrawn amount remaining available under the facility and the Company’s funded debt to EBITDA (as defined in the agreement) ratio at the last day of each quarter. As our funded debt to EBITDA ratio increases, the commitment fee will increase.increases.
Funds borrowed under the facility may be used for the repayment of debt, working capital, capital expenditures, acquisitions (so long as certain conditions, including a specified funded debt to EBITDA leverage ratio is maintained), and other general corporate purposes. As of June 30, 2015, the Company has used $7.2 million against the letter of credit sub-facility and had the ability to borrow $248.3 million under the facility based on our current EBITDA. The facility contains customary representations, warranties and restrictive covenants, as well as specific financial covenants. A significant drop in our adjusted earnings (as defined in our Credit Facility) would limit the amount of indebtedness that could be outstanding at the end of any fiscal quarter which could hinder our ability to make acquisitions or otherwise limit our long-term growth prospects. Failure to comply with this covenant could result in an acceleration of the debt maturity. As of June 30, 2018, the Company has used $7.9 million against the letter of credit sub-facility and had the ability to borrow $198.1 million under the facility based on our current trailing twelve-month EBITDA as defined in the Credit Agreement. The Company’s current financial covenants under the facility are as follows:
Interest Coverage Ratio - The Company is required to maintain a ratio of Earnings Before Interest and Taxes, as Adjusted (“Adjusted EBIT per the Credit Facility”), to interest expense for the trailing twelve months of at least 3.0:1. Adjusted EBIT per the Credit Facility specifically excludes extraordinary and certain other defined items such as cash restructuring and acquisition-related charges up to $7.5 million, and unlimited non-cash charges including gains or losses on sale of propertypurchase accounting and goodwill adjustments. At June 30, 2015,2018, the Company’s Interest Coverage Ratio was 26.99:11.32:1.
Leverage Ratio - The Company’s ratio of funded debt to trailing twelve month Adjusted EBITDA per the facility, calculated as Adjusted EBIT per the Credit Facility plus depreciation and amortization, may not exceed 3.5:1. At June 30, 2015,2018, the Company’s Leverage Ratio was 1.08:1.68:1.
27
As of June 30, 2015,2018, we had borrowings under our facility of $103.0 million and the effective rate of interest for outstanding borrowings under the facility was 1.46%. Our primary cash requirements in addition to day-to-day operating needs include interest payments, capital expenditures, and dividends. Our primary sources of cash for these requirements are cash flows from continuing operations and borrowings under the facility. We expect to spend between $26.0 and $28.0 million on capital expenditures during 2016, and expect that depreciation and amortization expense will be between $16.0 and $17.0 million and $2.5 and $3.5 million, respectively.
$193.8 million. In order to manage our interest rate exposure on these borrowings, we are party to $35.0$75.0 million of active floating to fixed rate swaps. These swaps convert our interest payments from LIBOR to a weighted average rate of 1.63%1.74%. The effective rate of interest for our outstanding borrowings, including the impact of the interest rate swaps, was 3.29%. Our primary cash requirements in addition to day-to-day operating needs include interest payments, capital expenditures, acquisitions, share repurchases, and dividends. Our primary sources of cash for these requirements are cash flows from continuing operations and borrowings under the facility. We expect that fiscal year 2019 depreciation and amortization expense will be between $22.0 and $23.0 million and $9.0 and $10.0 million, respectively.
The following table sets forth our capitalization at June 30, (in thousands):30:
| | | | | |
| | 2015 | | | 2014 |
Long-term debt | $ | 103,031 | | $ | 45,056 |
Less cash | | 96,128 | | | 74,260 |
Net (cash) debt | | 6,903 | | | (29,204) |
Stockholders’ equity | | 348,570 | | | 340,726 |
Total capitalization | $ | 355,473 | | $ | 311,522 |
| | 2018 | | | 2017 |
Long-term debt | $ | 193,772 | | $ | 191,976 |
Less cash and cash equivalents | | 109,602 | | | 88,566 |
Net debt | | 84,170 | | | 103,410 |
Stockholders' equity | | 450,795 | | | 408,664 |
Total capitalization | $ | 534,965 | | $ | 512,074 |
Stockholders’ equity increased year over year by $7.8$42.1 million, primarily as a result of current year net income of $54.7$36.6 million and a favorable change of $8.7 million in unrealized pension losses, partially offset by $23.1$9.0 million of unfavorable foreign currency translation, $5.9 millionfor dividends paid, $14.3 million of Unrealized Pension loss and favorable changes in fair value of derivative instruments of $0.2 million.declared. The Company's net (cash) debt to capital percentage changed to 15.7% for the year ended June 30, 2018 from 1.9%20.2% net debt to capital for the year ended June 30, 2015 from 9.4%2017. The change in net cashdebt to capital for the year ended June 30, 2014. This change wasis primarily driven by borrowings to fund acquisitions.cash generated through operations.
We sponsor a number of defined benefit and defined contribution retirement plans. The fair value of the Company's U.S. pension plan assets was $204.7 million at June 30, 2015 and the projected benefit obligation in the U.S. was $252.2 million at that time. In June 2012, the Moving Ahead for Progress in the 21st Century (“MAP 21”) bill was signed into law by Congress. As a result of past contributions, the plan is 100% funded under PPA rules at June 30, 2015, and we do not expect to make mandatory contributions to the plan until 2020. We expect to pay $1.5 million in prescribed contributions to our U.K. defined benefit plan and other unfunded defined benefit plans in both the U.S. and Europe during fiscal year 2016.
The Company’s pension plan was frozen for U.S. employees and participants in the plan ceased accruing future benefits. These actions contributed to a decrease of $1.0 million, or $0.05 per diluted share, of reduced expense related to our legacy U.S. plan in 2015 compared to 2014.
We have evaluated the current and long-term cash requirements of our defined benefit and defined contribution plans as of June 30, 2015 and determined our operating cash flows from continuing operations and available liquidity are expected to be sufficient to cover the required contributions under ERISA and other governing regulations.
We have an insurance program in place to fund supplemental retirement income benefits for six retired executives. Current executives and new hires are not eligible for this program. At June 30, 2015 the underlying policies had a cash surrender value of $18.6 million and are reported net of loans of $10.0 million for which we have the legal right of offset.
Contractual obligations of the Company as of June 30, 20152018 are as follows (in thousands):
| | | Payments Due by Period | | Payments Due by Period |
| | | | | Less | | | | | | | More | | | | | Less | | | | | | | More |
| | | | | than 1 | | | 1-3 | | 3-5 | | than 5 | | | | | than 1 | | | 1-3 | | 3-5 | | than 5 |
Contractual Obligations | | Total | | | Year | | | Years | | Years | | Years | | Total | | | Year | | | Years | | Years | | Years |
Long-term debt obligations | $ | 103,031 | | $ | 12 | | $ | 19 | | $ | 103,000 | | $ | - | $ | 194,000 | | $ | - | | $ | 194,000 | | $ | - | | $ | - |
Operating lease obligations | | 29,477 | | | 6,996 | | | 9,179 | | 5,055 | | 8,247 | | 57,122 | | | 10,202 | | | 16,626 | | 14,299 | | 15,995 |
Estimated interest payments(1) | | 7,885 | | | 1,897 | | | 3,582 | | 2,406 | | - | | 9,565 | | | 6,377 | | | 3,188 | | - | | - |
Post-retirement benefit payments(2) | Post-retirement benefit payments(2) | 5,009 | | | 518 | | | 969 | | | 1,005 | | | 2,517 | Post-retirement benefit payments(2) | 33,920 | | | 1,324 | | | 12,967 | | | 16,732 | | | 2,897 |
Total | $ | 145,402 | | $ | 9,423 | | $ | 13,749 | | $ | 111,466 | | $ | 10,764 | $ | 294,607 | | $ | 17,903 | | $ | 226,781 | | $ | 31,031 | | $ | 18,892 |
(1)
Estimated interest payments are based upon effective interest rates as of June 30, 2015,2018, and include the impact ofexclude only those interest rate swaps.swaps which are assets to us. See Item 7A for further discussions surrounding interest rate exposure on our variable rate borrowings.
(2)
Post-retirement benefits and pension plan contribution payments represents’ future pension payments to comply with local funding requirements. Our policy is to fund domestic pension liabilities in accordance with the minimum and maximum limits imposed by the Employee Retirement Income Security Act of 1974 (“ERISA”), federal income tax laws and the funding requirements of the Pension Protection Act of 2006.
At June 30, 2015,2018, we had $0.6$2.6 million of non-current liabilities for uncertain tax positions. We are not able to provide a reasonable estimate of the timing of future payments related to these obligations.
Off Balance Sheet Items
In March 2012, the Company sold substantially all of the assets of the ADP business. In connection with the divestiture, the Company remained the obligor of ADP’s Philadelphia, PA facility and administrative offices, and sublet space to the buyer after the divestiture. The buyer terminated their obligation under the Philadelphia sublease in September 2014. On February 4, 2015 we entered into a one year renewable, sublease agreement for this building. Our net obligation with respect to the remaining Philadelphia leases is $1.3 million, of which $0.9 million was recorded as a liability at June 30, 2015. We do not expect to record additional charges related to these obligations. The buyer’s obligations under the respective sublease and assumed lease are secured by a cross-default provision in the purchaser’s promissory note for a portion of the purchase price which is secured by mortgages on the ADP real estate sold in the transaction.
At June 30, 2015,2018, and 2014,2017, the Company had standby letters of credit outstanding, primarily for insurance and trade financing purposes, of $7.2$7.9 million and $11.3$8.9 million, respectively.
We had no other material off balance sheet items at June 30, 2015,2018, other than the operating leases summarized above in the “Contractual obligations” table.
28
Other Matters
Inflation –Certain of our expenses, such as wages and benefits, occupancy costs and equipment repair and replacement, are subject to normal inflationary pressures. Inflation for medical costs can impact both our reserves for self-insured medical plans as well as our reserves for workers' compensation claims. We monitor the inflationary rate and make adjustments to reserves whenever it is deemed necessary. Our ability to manage medical costs inflation is dependent upon our ability to manage claims and purchase insurance coverage to limit the maximum exposure for us. Each of our segments is subject to the effects of changing raw material costs caused by the underlying commodity price movements. In general, we do not enter into purchase contracts that extend beyond one operating cycle. While Standex considers our relationship with our suppliers to be good, there can be no assurances that we will not experience any supply shortage.
Foreign Currency Translation – Our primary functional currencies used by our non-U.S. subsidiaries are the Euro, British Pound Sterling (Pound), Mexican (Peso), Japanese (Yen), and Chinese (Yuan). During the current year, the Pound, Euro, and Peso have experienced decreases but the Yuan has remained flat in value related to the U.S. Dollar, our reporting currency. Since June 30, 2014 the Pound, Euro, and Peso have depreciated by 8.2%, 18.6%, and 16.3%, respectively (all relative to the U.S. Dollar). These exchange values were used in translating the appropriate non-U.S. subsidiaries’ balance sheets into U.S. Dollars at the end of the current year.
Defined Benefit Pension Plans – We record expenses related to these plans based upon various actuarial assumptions such as discount rates and assumed rates of returns. The Company’s pension plan was frozen for substantially all remaining eligible U.S. employees in 2015 and participants in the plan ceased accruing future benefits. These actions contributed to a decrease of $1.0 million, or $0.05 per diluted share, of reduced expense related to our legacy U.S. plan in 2015 compared to 2014.
Environmental Matters– To the best of our knowledge, we believe that we are presently in substantial compliance with all existing applicable environmental laws and regulations and do not anticipate any instances of non-compliance that will have a material effect on our future capital expenditures, earnings or competitive position.
Seasonality – We are a diversified business with generally low levels of seasonality, however our fiscal third quarter is typically the period with the lowest level of activity.
Employee Relations – The Company has labor agreements with a number ofseveral union locals in the United States and a number ofseveral European employees belong to European trade unions. The three U.S. union contracts expiring during fiscal year 2015 were successfully negotiated for an additional three years. There are no U.S. union contracts expiring during fiscal year 2016.
Critical Accounting Policies
The Consolidated Financial Statements include accounts of the Company and all of our subsidiaries. The preparation of financial statements in conformity with accounting principles generally accepted in the United States of America requires us to make estimates and assumptions in certain circumstances that affect amounts reported in the accompanying Consolidated Financial Statements. Although, we believe that materially different amounts would not be reported due to the accounting policies described below, the application of these accounting policies involves the exercise of judgment and use of assumptions as to future uncertainties and, as a result, actual results could differ from these estimates. We have listed a number of accounting policies which we believe to be the most critical.
The Company’s product sales are recorded when persuasive evidence of an arrangement exists, delivery has occurred, the price to the buyer is fixed or determinable, and collectability is reasonably assured. For products that include installation, and if the installation meets the criteria to be considered a separate element, product revenue is recognized upon delivery, and installation revenue is recognized when the installation is complete. Revenues under certain fixed price contracts are generally recorded when deliveries are made.
Sales and estimated profits under certain long-term contracts are recognized under the percentage-of-completion methods of accounting, whereby profits are recorded pro rata, based upon current estimates of costs to complete such contracts. Losses on contracts are provided for in the period in which the losses become determinable. Revisions in profit estimates are reflected on a cumulative basis in the period in which the basis for such revision becomes known. Any excess of the billings over cost and estimated earnings on long-term contracts is included in deferred revenue.
Collectability of Accounts Receivable – Accounts Receivable are reduced by an allowance for amounts that may become uncollectible in the future. Our estimate for the allowance for doubtful accounts related to trade receivables includes evaluation of specific accounts where we have information that the customer may have an inability to meet its financial obligation together with a general provision for unknown but existing doubtful accounts.
Realizability of Inventories – Inventories are valued at the lower of cost or market. The Company regularly reviews inventory values on hand using specific aging categories, and records a provision for obsolete and excess inventory based on historical usage and estimated future usage. As actual future demand or market conditions may vary from those projected by management, adjustments to inventory valuations may be required.
29
Realization of Goodwill -– Goodwill and certain indefinite-lived intangible assets are not amortized, but instead are tested for impairment at least annually and more frequently whenever events or changes in circumstances indicate that the fair value of the asset may be less than its carrying amount of the asset. The Company’s annual test for impairment is performed using a May 31st measurement date.
We have identified our reporting units for impairment testing as our eleventwelve operating segments, which are aggregated into our five reporting segments as disclosed in Note 1817 – Industry Segment Information.
The test for impairment is a two-step process. The first step compares the carrying amount of the reporting unit to its estimated fair value (Step 1). To the extent that the carrying value of the reporting unit exceeds its estimated fair value, a second step is performed, wherein the reporting unit’s carrying value is compared to the implied fair value (Step 2). To the extent that the carrying value exceeds the implied fair value, impairment exists and must be recognized.
As quoted market prices are not available for the Company’s reporting units, the fair value of the reporting units is determined using a discounted cash flow model (income approach). This method uses various assumptions that are specific to each individual reporting unit in order to determine the fair value. In addition, the Company compares the estimated aggregate fair value of its reporting units to its overall market capitalization.
Our annual impairment testing at each reporting unit relied on assumptions surrounding general market conditions, short-term growth rates, a terminal growth rate of 2.5%, and detailed management forecasts of future cash flows prepared by the relevant reporting unit. Fair values were determined primarily by discounting estimated future cash flows at a weighted average cost of capital of 9.69%10.04%. An increaseDuring our annual impairment testing, we evaluated the sensitivity of our most critical assumption, the discount rate, and determined that a 200 basis point change in the weighted average cost of capital of approximately 350 basis points in the analysisdiscount rate selected would not result inhave impacted the identificationtest results. Additionally, the Company could reduce the terminal growth rate from its current 2.5% to 1.0% and the fair value of any impairments.all reporting units would still exceed their carrying value.
While we believe that our estimates of future cash flows are reasonable, changes in assumptions could significantly affect our valuations and result in impairments in the future. The most significant assumption involved in the Company’s determination of fair value is the cash flow projections of each reporting unit. Certain reporting units have been significantly impacted by the current global economic downturn and if the effects of the current global economic environment are protracted or the recovery is slower than we have projected estimates of future cash flows for each reporting unit may be insufficient to support the carrying value of the reporting units, requiring the Company to re-assess its conclusions related to fair value and the recoverability of goodwill.
As a result of our annual assessment, the Company determined that the fair value of the reporting units and indefinite-lived intangible assets substantially exceeded their respective carrying values. Therefore, no impairment charges were recorded in connection with our assessmentsannual assessment during 2015.2018.
Cost of Employee Benefit Plans – We provide a range of benefits to our employees,certain retirees, including pensions and some postretirement benefits. We record expenses relating to these plans based upon various actuarial assumptions such as discount rates, assumed rates of return, compensation increases and turnover rates, and health care cost trends.rates. The expected return on plan assets assumption of 7.10%7.0% in the U.S. is based on our expectation of the long-term average rate of return on assets in the pension funds and is reflective of the current and projected asset mix of the funds and considers the historical returns earned on the funds. We have analyzed the rates of return on assets used and determined that these rates are reasonable based on the plans’ historical performance relative to the overall markets as well as our current expectations for long-term rates of returns for our pension assets. The U.S. discount rate of 4.7%4.4% reflects the current rate at which pension liabilities could be effectively settled at the end of the year. The discount rate is determined by matching our expected benefit payments from a stream of AA- or higher bonds available in the marketplace, adjusted to eliminate the effects of call provisions. We review our actuarial assumptions, including discount rate and expected long-term rate of return on plan assets, on at least an annual basis and make modifications to the assumptions based on current rates and trends when appropriate. Based on information provided by our actuaries and other relevant sources, we believe that our assumptions are reasonable.
The cost of employee benefit plans includes the selection of assumptions noted above. A twenty-five basis point change in the expected return on plan assets assumptions, holding our discount rate and other assumptions constant, would increase or decrease pension expense by approximately $0.6$0.5 million per year. A twenty-five basis point change in our discount rate, holding all other assumptions constant, would have no impact on 20152018 pension expense as changes to amortization of net losses would be offset by changes to interest cost. In future years, the impact of discount rate changes could yield different sensitivities. See the Notes to the Consolidated Financial Statements for further information regarding pension plans.
Business Combinations - The accounting for business combinations requires estimates and judgments as to expectations for future cash flows of the acquired business and the allocation of those cash flows to identifiable intangible assets in determining the estimated fair values for assets acquired and liabilities assumed. The fair values assigned to tangible and intangible assets acquired and liabilities assumed, are based on management’s estimates and assumptions, as well as other information compiled
30
by management, including valuations that utilize customary valuation procedures and techniques. If the actual results differ from the estimates and judgments used in these fair values, the amounts recorded in the consolidated financial statements could result in a possible impairment of the intangible assets and goodwill, or require acceleration of the amortization expense of finite-lived intangible assets.
Allocations of the purchase price for acquisitions are based on estimates of the fair value of the net assets acquired and are subject to adjustment upon finalization of the purchase price allocation. During this measurement period, the Company will adjust assets or liabilities if new information is obtained about facts and circumstances that existed as of the acquisition date that, if known, would have resulted in the recognition of those assets and liabilities as of that date. All changes that do not qualify as measurement period adjustments are included in current period earnings.
Recently Issued Accounting Pronouncements
In April 2015,See "Item 8. Financial Statements and Supplementary Data, Note 1. Summary of Accounting Policies” for information regarding the Financial Accounting Standards Board (“FASB”)effect of recently issued accounting standard update ASU 2015-3,Simplifying the Presentationpronouncements on our consolidated statements of Debt Issuance Cost. The standard is effective for annualoperations, comprehensive income, stockholders’ equity, cash flows, and interim periods with those annual periods beginning after December 15, 2015. Early adoption is permitted and retrospective application will be required. We expect to adopt this standard in the quarter ending September 30, 2016. The Company does not expect that adoption of ASU 2015-3 to have a material impact to its consolidated results of operations.
In February 2015, the FASB issued ASU No. 2015-02, “Consolidation (Topic 820) - Amendments to the Consolidation Analysis.” This update amends the current consolidation guidance for both the variable interest entity (VIE) and voting interest entity (VOE) consolidation models. The amendments in this ASU are effective, for fiscal years and for interim periods within those fiscal years, beginning after December 15, 2015, with early adoption permitted. The Company believes the adoption of this ASU will not have a material impact on its consolidated financial statements.
In January 2015, the FASB issued ASU No. 2015-01, “Income Statement—Extraordinary and Unusual Items.” This update eliminates from GAAP the concept of extraordinary items. ASU 2015-01 is effectivenotes for the first interim period within fiscal years beginning after December 15, 2015, with early adoption permitted provided that the guidance is applied from the beginning of the fiscal year of adoption. A reporting entity may apply the amendments prospectively or retrospectively to all prior periods presented in the financial statements. The Company believes the adoption of this ASU will not have a material impact on its consolidated financial statements.
Inended June 2014, the FASB issued accounting standard update ASU 2014-12,Accounting for Share-Based Payments When the Terms of an Award Provide That a Performance Target Could Be Achieved after the Requisite Service Period. The update provides guidance on how to account for certain share-based payment awards where employees would be eligible to vest in the award regardless of whether the employee is still rendering service on the date the performance target is achieved. The standard is effective for annual and interim periods with those annual periods beginning after December 15, 2015. Early adoption is permitted. The Company does not expect the adoption of ASU 2014-12 to have a material impact to its consolidated results of operation.30, 2018.
In May 2014, the FASB and the International Accounting Standards Board jointly issued a comprehensive new revenue recognition standard, ASU 2014-09,Revenue from Contract with Customers, that will supersede nearly all existing revenue recognition guidance under US GAAP and IFRS. The standard’s primary principle is that a company will recognize revenue when it transfers promised goods or services to customers in an amount that reflects the consideration to which the Company expects to be entitled in exchange for those goods or services. The original standard was effective for fiscal years beginning after December 15, 2016; however, in July 2015, the FASB approved a one-year deferral of this standard, with a new effective date for fiscal years beginning after December 15, 2017. We expect to adopt this standard in the quarter ending September 30, 2018. The Company is continuing to evaluating the impact of adopting ASU 2014-09 on its consolidated financial statements.
Item 7A. Quantitative and Qualitative Disclosures About Market Risk
Risk Management
We are exposed to market risks from changes in interest rates, commodity prices and changes in foreign currency exchange. To reduce these risks, we selectively use, from time to time, financial instruments and other proactive management techniques. We have internal policies and procedures that place financial instruments under the direction of the Treasurer and restrict all derivative transactions to those intended for hedging purposes only. The use of financial instruments for trading purposes (except for certain investments in connection with the non-qualified defined contribution plan) or speculation is strictly prohibited. The Company has no majority-owned subsidiaries that are excluded from the consolidated financial statements. Further, we have no interests in or relationships with any special purpose entities.
Exchange Risk
We are exposed to both transactional risk and translation risk associated with exchange rates. The transactional risk is mitigated, in large part, by natural hedges developed with locally denominated debt service on intercompany accounts. We also mitigate certain of our foreign currency exchange rate risks by entering into forward foreign currency contracts from time to time. The contracts are used as a hedge against anticipated foreign cash flows, such as dividendloan payments, loan payments,customer remittances, and materials purchases, and are not used for trading or speculative purposes. The fair values of the forward foreign currency exchange contracts are sensitive to changes in foreign currency exchange rates, as an adverse change in foreign currency exchange rates from market rates would decrease the fair value of the contracts. However, any such losses or gains would generally be offset by corresponding gains and losses, respectively, on the related hedged asset or liability. At June 30, 20152018 and 2014,2017, the fair value, in the aggregate, of the Company’s open foreign exchange contracts was an asset of $0.7 million and a liability of $1.2$2.8 million respectively.at the end of both periods.
Our primary translation risk is with the Euro, British Pound Sterling, Peso, Japanese Yen and Chinese Yuan. A hypothetical 10% appreciation or depreciation of the value of any these foreign currencies to the U.S. Dollar at June 30, 2015,2018, would not result in a material change in our operations, financial position, or cash flows. We do not hedge our most significant foreign currency translation risk. As a result, fluctuations inrisks primarily through cross currency exchange rates can affect our stockholders’ equity.swaps and other instruments, as appropriate.
Interest Rate
The Company’s effective rate on variable-rate borrowings under the revolving credit agreement is 1.46%3.29% and 3.87%2.41% at June 30, 20152018 and 2014,2017, respectively. Our interest rate exposure is limited primarily to interest rate changes on our variable rate borrowings. From time to time, we will use interest rate swap agreements to modify our exposure to interest rate movements. We currentlyAt June 30, 2018, we have $35.0$75.0 million of active floating to fixed rate swaps with terms ranging from twoone to fivefour years. These swaps convert our interest payments from LIBOR to a weighted average rate of 1.63%1.74%. At June 30, 20152018 and 2014,2017, the fair value, in the aggregate, of the Company’s interest rate swaps was a liabilityan asset of $0.6$1.3 million and a liability of $1.1$0.2 million respectively. Due to the impact of the swaps, anA 25 basis point increase in interest rates would not materially impactincrease our annual interest expense at June 30, 2015.by $0.3 million.
31
Concentration of Credit Risk
We have a diversified customer base. As such, the risk associated with concentration of credit risk is inherently minimized. As of June 30, 2015,2018, no one customer accounted for more than 5% of our consolidated outstanding receivables or of our sales.
Commodity Prices
The Company is exposed to fluctuating market prices for all commodities used in its manufacturing processes. Each of our segments is subject to the effects of changing raw material costs caused by the underlying commodity price movements. In general, we do not enter into purchase contracts that extend beyond one operating cycle. While Standex considers our relationship with our suppliers to be good, there can be no assurances that we will not experience any supply shortage.
The Engineering Technologies, Food Service Equipment, Electronics, and Hydraulics Groupssegments are all sensitive to price increases for steel products, other metal commodities and petroleum based products. In the past year, we have experienced price fluctuations for a number of materials including steel, copper wire, other metal commodities, refrigeration components and foam insulation. These materials are some of the key elements in the products manufactured in these segments. Wherever possible, we will implement price increases to offset the impact of changing prices. The ultimate acceptance of these price increases, if implemented, will be impacted by our affected divisions’ respective competitors and the timing of their price increases.
32
Item 8. Financial Statements and Supplementary Data
| Consolidated Balance Sheets | | | | | | | | | | | |
| | | | | | | | | | | |
Standex International Corporation and Subsidiaries | Standex International Corporation and Subsidiaries | | | Standex International Corporation and Subsidiaries | | | |
As of June 30 (in thousands, except share data) | As of June 30 (in thousands, except share data) | 2015 | | 2014 | As of June 30 (in thousands, except share data) | 2018 | | 2017 |
| | | | | | | | | | | |
ASSETS | | | | | | | | | | | |
Current assets: | | | | | | | | | | | |
Cash and cash equivalents | | $ | 96,128 | | $ | 74,260 | | $ | 109,602 | | $ | 88,566 |
Accounts receivable, net | | | 110,478 | | 107,674 | | | 134,228 | | | 127,060 |
Inventories | | | 108,305 | | 97,065 | | | 127,223 | | | 119,401 |
Prepaid expenses and other current assets | Prepaid expenses and other current assets | 7,070 | | | 7,034 | | | 10,558 | | | 8,397 |
Income taxes receivable | | | 747 | | 922 | | | 2,348 | | | 2,469 |
Deferred tax asset | | | 12,674 | | 12,981 | | | - | | | 14,991 |
Total current assets | | | 335,402 | | | 299,936 | | | 383,959 | | | 360,884 |
| | | | | | | | | | | |
Property, plant, equipment, net | | | 108,536 | | 96,697 | |
Property, plant and equipment, net | | | | 144,570 | | | 133,160 |
Intangible assets, net | | | 38,048 | | 31,490 | | | 98,075 | | | 102,503 |
Goodwill | | | 154,732 | | 125,965 | | | 251,762 | | | 242,690 |
Deferred tax asset | | | 917 | | 878 | | | 7,447 | | | 1,135 |
Other non-current assets | | | 22,706 | | 23,194 | | | 31,124 | | | 27,304 |
Total non-current assets | | | 324,939 | | | 278,224 | | | 532,978 | | | 506,792 |
| | | | | | | | | | | |
Total assets | | $ | 660,341 | | $ | 578,160 | | $ | 916,937 | | $ | 867,676 |
| | | | | | | | | | | |
LIABILITIES AND STOCKHOLDERS' EQUITY | LIABILITIES AND STOCKHOLDERS' EQUITY | | | LIABILITIES AND STOCKHOLDERS' EQUITY | | | |
Current liabilities: | | | | | | | | | | | |
Accounts payable | | $ | 80,764 | | $ | 85,206 | | $ | 89,707 | | $ | 96,487 |
Accrued liabilities | | | 47,742 | | 51,038 | | | 65,575 | | | 58,694 |
Income taxes payable | | | 10,285 | | 4,926 | | | 6,059 | | | 4,783 |
Total current liabilities | | | 138,791 | | | 141,170 | | | 161,341 | | | 159,964 |
| | | | | | | | | | | |
Long-term debt | | | 103,031 | | 45,056 | | | 193,772 | | | 191,976 |
Deferred income taxes | | | 7,368 | | 10,853 | | | 26,816 | | | 24,986 |
Pension obligations | | | 53,422 | | 31,815 | | | 57,826 | | | 70,745 |
Other non-current liabilities | | | 9,159 | | | 8,540 | | | 26,387 | | | 11,341 |
Total non-current liabilities | | | 172,980 | | | 96,264 | | | 304,801 | | | 299,048 |
| | | | | | | | | | | |
Commitments and Contingencies (Notes 11 and 12) | Commitments and Contingencies (Notes 11 and 12) | | | Commitments and Contingencies (Notes 11 and 12) | | | |
| | | | | | | | | | | |
Stockholders' equity: | | | | | | | | | | | |
Common stock, par value $1.50 per share - | Common stock, par value $1.50 per share - | | | | Common stock, par value $1.50 per share - | | | | |
60,000,000 shares authorized, 27,984,278 | 60,000,000 shares authorized, 27,984,278 | | | | 60,000,000 shares authorized, 27,984,278 | | | | |
issued, 12,651,488 and 12,639,615 shares | | | | |
outstanding in 2015 and 2014 | | | 41,976 | | 41,976 | |
issued, 12,705,562 and 12,662,661 shares | | issued, 12,705,562 and 12,662,661 shares | | | | |
outstanding in 2018 and 2017 | | | | 41,976 | | | 41,976 |
Additional paid-in capital | | | 47,254 | | 43,388 | | | 61,328 | | | 56,783 |
Retained earnings | | | 632,864 | | 584,014 | | | 761,430 | | | 716,605 |
Accumulated other comprehensive loss | Accumulated other comprehensive loss | | (93,017) | | | (55,819) | | | (121,859) | | | (115,938) |
Treasury shares (15,332,790 shares in 2015 | | | | |
and 15,344,663 shares in 2014) | | | (280,507) | | | (272,833) | |
Treasury shares (15,278,716 shares in 2018 | | | | | | | |
and 15,321,617 shares in 2017) | | | | (292,080) | | | (290,762) |
Total stockholders' equity | | | 348,570 | | | 340,726 | | | 450,795 | | | 408,664 |
| | | | | | | | | | | |
Total liabilities and stockholders' equity | Total liabilities and stockholders' equity | $ | 660,341 | | $ | 578,160 | Total liabilities and stockholders' equity | $ | 916,937 | | $ | 867,676 |
| | | | | | | |
See notes to consolidated financial statements. | See notes to consolidated financial statements. | | | See notes to consolidated financial statements. | | | |
33
Consolidated Statements of Operations | | | | | | | | | |
| | | | | | | | | |
Standex International Corporation and Subsidiaries | | | | | | | | | |
For the Years Ended June 30 (in thousands, except per share data) | | 2018 | | | 2017 | | | 2016 |
Net sales | | $ | 868,382 | | $ | 755,258 | | $ | 751,586 |
Cost of sales | | | (566,581) | | | (502,504) | | | (499,333) |
Gross profit | | | 301,801 | | | 252,754 | | | 252,253 |
| | | | | | | | | |
Selling, general and administrative | | | 206,419 | | | 174,060 | | | 170,219 |
Restructuring costs | | | 7,594 | | | 5,825 | | | 4,232 |
Acquisition related expenses | | | 3,749 | | | 7,843 | | | - |
Other operating (income) expense, net | | | - | | | - | | | 7,458 |
Income from operations | | | 84,039 | | | 65,026 | | | 70,344 |
| | | | | | | | | |
Interest expense | | | 8,030 | | | 4,043 | | | 2,871 |
Other non-operating (income) expense, net | | | (1,243) | | | (949) | | | (1,052) |
Total | | | 6,787 | | | 3,094 | | | 1,819 |
| | | | | | | | | |
Income from continuing operations before income taxes | | | 77,252 | | | 61,932 | | | 68,525 |
Provision for income taxes | | | (40,620) | | | (15,355) | | | (16,295) |
Income from continuing operations | | | 36,632 | | | 46,577 | | | 52,230 |
| | | | | | | | | |
Income (loss) from discontinued operations, net of tax | | | (28) | | | (32) | | | (174) |
| | | | | | | | | |
Net income | | $ | 36,604 | | $ | 46,545 | | $ | 52,056 |
| | | | | | | | | |
Basic earnings per share: | | | | | | | | | |
Income (loss) from continuing operations | | $ | 2.88 | | $ | 3.68 | | $ | 4.12 |
Income (loss) from discontinued operations | | | - | | | - | | | (0.01) |
Total | | $ | 2.88 | | $ | 3.68 | | $ | 4.11 |
| | | | | | | | | |
Diluted earnings per share: | | | | | | | | | |
Income (loss) from continuing operations | | $ | 2.86 | | $ | 3.65 | | $ | 4.09 |
Income (loss) from discontinued operations | | | - | | | - | | | (0.01) |
Total | | $ | 2.86 | | $ | 3.65 | | $ | 4.08 |
| | | | | | | | | |
See notes to consolidated financial statements. | | | | | | | | | |
34
Consolidated Statements of Comprehensive Income | | | | | | | | |
| | | | | | | | |
Standex International Corporation and Subsidiaries | | | | | | | | |
| | | | | | | | |
| | | | | | | | |
For the Years Ended June 30, (in thousands) | | 2018 | | | 2017 | | | 2016 |
| | | | | | | | |
Net income (loss) | $ | 36,604 | | $ | 46,545 | | $ | 52,056 |
Other comprehensive income (loss): | | | | | | | | |
Defined benefit pension plans: | | | | | | | | |
Actuarial gains (losses) and other changes in unrecognized costs | $ | 6,159 | | $ | 3,689 | | $ | (26,619) |
Amortization of unrecognized costs | | 5,485 | | | 5,729 | | | 4,779 |
Derivative instruments: | | | | | | | | |
Change in unrealized gains and (losses) | | 2,541 | | | (2,896) | | | (1,010) |
Amortization of unrealized gains and (losses) into interest expense | | 292 | | | (462) | | | 567 |
Amortization of unrealized gains and (losses) into cost of goods sold | | - | | | 75 | | | 112 |
Foreign currency translation gains (losses) | | 93 | | | (472) | | | (11,303) |
Other comprehensive income (loss) before tax | $ | 14,570 | | $ | 5,663 | | $ | (33,474) |
| | | | | | | | |
Income tax (provision) benefit: | | | | | | | | |
Defined benefit pension plans: | | | | | | | | |
Actuarial gains (losses) and other changes in unrecognized costs | $ | (1,436) | | $ | (1,354) | | $ | 10,075 |
Amortization of unrecognized costs | | (1,460) | | | (2,012) | | | (1,685) |
Derivative instruments: | | | | | | | | |
Change in unrealized gains and (losses) | | (339) | | | (80) | | | 384 |
Amortization of unrealized gains and (losses) into interest expense | | (43) | | | (152) | | | (216) |
Amortization of unrealized gains and (losses) into cost of goods sold | | - | | | (28) | | | (42) |
Income tax (provision) benefit to other comprehensive income (loss) | $ | (3,278) | | $ | (3,626) | | $ | 8,516 |
| | | | | | | | |
Other comprehensive income (loss), net of tax | | 11,292 | | | 2,037 | | | (24,958) |
Comprehensive income (loss) | $ | 47,896 | | $ | 48,582 | | $ | 27,098 |
| | | | | | | | |
See notes to consolidated financial statements. | | | | | | | | |
35
| | | | | | | | | | | |
Consolidated Statements of Operations | | | | | | | | | |
| | | | | | | | | |
Standex International Corporation and Subsidiaries | | | | | | | | | |
For the Years Ended June 30 (in thousands, except per share data) | | 2015 | | | 2014 | | | 2013 |
Net sales | | $ | 772,142 | | $ | 716,180 | | $ | 673,390 |
Cost of sales | | | 524,656 | | | 477,911 | | | 455,199 |
Gross profit | | | 247,486 | | | 238,269 | | | 218,191 |
| | | | | | | | | |
Selling, general and administrative | | | 165,837 | | | 165,786 | | | 153,630 |
Restructuring costs | | | 3,443 | | | 10,077 | | | 2,666 |
Other operating (income) expense, net | | | (438) | | | (3,462) | | | - |
Income from operations | | | 78,644 | | | 65,868 | | | 61,895 |
| | | | | | | | | |
Interest expense | | | 3,161 | | | 2,249 | | | 2,469 |
Other, net | | | (634) | | | (4,184) | | | 128 |
Total | | | 2,527 | | | (1,935) | | | 2,597 |
| | | | | | | | | |
Income from continuing operations before income taxes | | | 76,117 | | | 67,803 | | | 59,298 |
Provision for income taxes | | | 20,874 | | | 18,054 | | | 15,244 |
Income from continuing operations | | | 55,243 | | | 49,749 | | | 44,054 |
| | | | | | | | | |
Income (loss) from discontinued operations, net of tax | | | (500) | | | (6,883) | | | 794 |
| | | | | | | | | |
Net income | | $ | 54,743 | | $ | 42,866 | | $ | 44,848 |
| | | | | | | | | |
Basic earnings per share: | | | | | | | | | |
Income (loss) from continuing operations | | $ | 4.37 | | $ | 3.94 | | $ | 3.51 |
Income (loss) from discontinued operations | | | (0.04) | | | (0.55) | | | 0.06 |
Total | | $ | 4.33 | | $ | 3.39 | | $ | 3.57 |
| | | | | | | | | |
Diluted earnings per share: | | | | | | | | | |
Income (loss) from continuing operations | | $ | 4.31 | | $ | 3.89 | | $ | 3.45 |
Income (loss) from discontinued operations | | | (0.04) | | | (0.54) | | | 0.06 |
Total | | $ | 4.27 | | $ | 3.35 | | $ | 3.51 |
| | | | | | | | | |
See notes to consolidated financial statements. | | | | | | | | | |
Consolidated Statements of Stockholders' Equity | | | | | | | | | | |
| | | | | | | | | | | | | | |
Standex International Corporation and Subsidiaries | | | | Accumulated | | | | | | |
| | | | | | | | Other | Treasury Stock | |
For the Years Ended June 30 (in thousands, except as specified) | Common Stock | | Additional Paid-in Capital | | Retained Earnings | | Comprehensive Income (Loss) | Shares | | Amount | Total Stockholders’ Equity |
Balance, June 30, 2015 | $ | 41,976 | $ | 47,254 | $ | 632,864 | $ | (93,017) | 15,333 | $ | (280,507) | $ | 348,570 |
Stock issued for employee stock option and purchase plans, including related income tax benefit and other | | | | 31 | | | | | (94) | | 1,725 | | 1,756 |
Stock-based compensation | | | | 5,089 | | | | | | | | | 5,089 |
Treasury stock acquired | | | | | | | | | 71 | | (5,636) | | (5,636) |
Comprehensive income: | | | | | | | | | | | | | |
Net Income | | | | | | 52,056 | | | | | | | 52,056 |
Foreign currency translation adjustment | | | | | | | | (11,303) | | | | | (11,303) |
Pension and OPEB adjustments, net of tax of $8.4 million | | | | | | | | (13,450) | | | | | (13,450) |
Change in fair value of derivatives, net of tax of $0.2 million | | | | | | | | (205) | | | | | (205) |
Dividends declared ($0.54 per share) | | | | | | (6,918) | | | | | | | (6,918) |
Balance, June 30, 2016 | $ | 41,976 | $ | 52,374 | $ | 678,002 | $ | (117,975) | 15,310 | $ | (284,418) | $ | 369,959 |
Stock issued for employee stock option and purchase plans, including related income tax benefit and other | | | | (614) | | | | | (78) | | 1,462 | | 848 |
Stock-based compensation | | | | 5,023 | | | | | | | | | 5,023 |
Treasury stock acquired | | | | | | | | | 90 | | (7,806) | | (7,806) |
Comprehensive income: | | | | | | | | | | | | | |
Net Income | | | | | | 46,545 | | | | | | | 46,545 |
Foreign currency translation adjustment | | | | | | | | (472) | | | | | (472) |
Pension and OPEB adjustments, net of tax of $3.4 million | | | | | | | | 6,052 | | | | | 6,052 |
Change in fair value of derivatives, net of tax of $0.3 million | | | | | | | | (3,543) | | | | | (3,543) |
Dividends declared ($0.62 per share) | | | | | | (7,942) | | | | | | | (7,942) |
Balance, June 30, 2017 | $ | 41,976 | $ | 56,783 | $ | 716,605 | $ | (115,938) | 15,322 | $ | (290,762) | $ | 408,664 |
Stock issued for employee stock option and purchase plans and other | | | | (417) | | | | | (70) | | 1,334 | | 917 |
Stock-based compensation | | | | 4,962 | | | | | | | | | 4,962 |
Treasury stock acquired | | | | | | | | | 27 | | (2,652) | | ��(2,652) |
Adoption of ASU 2018-02 | | | | | | 17,215 | | (17,215) | | | | | - |
Comprehensive income: | | | | | | | | | | | | | |
Net Income | | | | | | 36,604 | | | | | | | 36,604 |
Foreign currency translation adjustment | | | | | | | | 94 | | | | | 94 |
Pension and OPEB adjustments, net of tax of $2.9 million | | | | | | | | 8,748 | | | | | 8,748 |
Change in fair value of derivatives, net of tax of $0.4 million | | | | | | | | 2,452 | | | | | 2,452 |
Dividends declared ($0.70 per share) | | | | | | (8,994) | | | | | | | (8,994) |
Balance, June 30, 2018 | $ | 41,976 | $ | 61,328 | $ | 761,430 | $ | (121,859) | 15,279 | $ | (292,080) | $ | 450,795 |
| | | | | | | | | | | | | |
See notes to consolidated financial statements. | | | | | | | |
36
| | | | | | | | |
Consolidated Statements of Comprehensive Income | | | | | | | | |
| | | | | | | | |
Standex International Corporation and Subsidiaries | | | | | | | | |
| | | | | | | | |
| | | | | | | | |
For the Years Ended June 30 (in thousands) | | 2015 | | | 2014 | | | 2013 |
| | | | | | | | |
Net income (loss) | $ | 54,743 | | $ | 42,866 | | $ | 44,848 |
Other comprehensive income (loss): | | | | | | | | |
Defined benefit pension plans: | | | | | | | | |
Actuarial gains (losses) and other changes in unrecognized costs | $ | (27,344) | | $ | (604) | | $ | 12,640 |
Amortization of unrecognized costs | | 4,690 | | | 4,855 | | | 8,701 |
Derivative instruments: | | | | | | | | |
Change in unrealized gains and (losses) | | (687) | | | (194) | | | (195) |
Amortization of unrealized gains and (losses) into interest expense | | 1,034 | | | 1,031 | | | 1,050 |
Foreign currency translation gains (losses) | | (23,133) | | | 6,055 | | | (4,025) |
Other comprehensive income (loss) before tax | $ | (45,440) | | $ | 11,143 | | $ | 18,171 |
| | | | | | | | |
Income tax (provision) benefit: | | | | | | | | |
Defined benefit pension plans: | | | | | | | | |
Actuarial gains (losses) and other changes in unrecognized costs | $ | 10,045 | | $ | 362 | | $ | (4,836) |
Amortization of unrecognized costs | | (1,671) | | | (1,724) | | | (3,165) |
Derivative instruments: | | | | | | | | |
Change in unrealized gains and (losses) | | 262 | | | 74 | | | 75 |
Amortization of unrealized gains and (losses) into interest expense | | (394) | | | (394) | | | (400) |
Income tax (provision) benefit to other comprehensive income (loss) | $ | 8,242 | | $ | (1,682) | | $ | (8,326) |
| | | | | | | | |
Other comprehensive income (loss), net of tax | | (37,198) | | | 9,461 | | | 9,845 |
Comprehensive income (loss) | $ | 17,545 | | $ | 52,327 | | $ | 54,693 |
| | | | | | | | |
See notes to consolidated financial statements. | | | | | | | | |
| | | | | | | | | | | | | | | | | | | | |
Consolidated Statements of Stockholders' Equity | | | | | | | | | | |
| | | | | | | | | | | | | | |
Standex International Corporation and Subsidiaries | | | | Accumulated | | | | | | |
| | | | Additional | | | | Other | Treasure Stock | Total |
For the Years Ended June 30 (in thousands, except as specified) | CommonStock | | Paid-in Capital | | Retained Earnings | | Comprehensive Income (Loss) |
Shares | |
Amount | Stockholders’ Equity |
Balance, June 30, 2012 | $ | 41,976 | $ | 34,928 | $ | 505,163 | $ | (75,125) | 15,461 | $ | (264,035) | $ | 242,907 |
Stock issued for employee stock option and purchase plans, including related income tax benefit and other | | | |
(1,072) | | | | |
(210) | |
3,606 | |
2,534 |
Stock-based compensation | | | | 3,343 | | | | | | | | | 3,343 |
Treasury stock acquired | | | | | | | | | 184 | | (8,509) | | (8,509) |
Comprehensive income: | | | | | | | | | | | | | |
Net Income | | | | | | 44,848 | | | | | | | 44,848 |
Foreign currency translation adjustment | | | | | | | | (4,025) | | | | | (4,025) |
Pension and OPEB adjustments, net of tax of ($8.0) million | | | | | | | |
13,340 | | | | |
13,340 |
Change in fair value of derivatives, net of tax of ($0.3) million | | | | | | | |
530 | | | | |
530 |
Dividends paid ($.31 per share) | | | | | | (3,980) | | | | | | | (3,980) |
Balance, June 30, 2013 | $ | 41,976 | $ | 37,199 | $ | 546,031 | $ | (65,280) | 15,435 | $ | (268,938) | $ | 290,988 |
Stock issued for employee stock option and purchase plans, including related income tax benefit and other | | | |
(441) | | | | |
(222) | |
3,895 | |
3,454 |
Stock-based compensation | | | | 6,630 | | | | | | | | | 6,630 |
Treasury stock acquired | | | | | | | | | 132 | | (7,790) | | (7,790) |
Comprehensive income: | | | | | | | | | | | | | |
Net Income | | | | | | 42,866 | | | | | | | 42,866 |
Foreign currency translation adjustment | | | | | | | | 6,055 | | | | | 6,055 |
Pension and OPEB adjustments, net of tax of ($1.3) million | | | | | | | |
2,889 | | | | |
2,889 |
Change in fair value of derivatives, net of tax of ($0.3) million | | | | | | | |
517 | | | | |
517 |
Dividends paid ($.38 per share) | | | | | | (4,883) | | | | | | | (4,883) |
Balance, June 30, 2014 | $ | 41,976 | $ | 43,388 | $ | 584,014 | $ | (55,819) | 15,345 | $ | (272,833) | $ | 340,726 |
Stock issued for employee stock option and purchase plans, including related income tax benefit and other | | | |
102 | | | | |
(150) | |
2,682 | |
2,784 |
Stock-based compensation | | | | 3,764 | | | | | | | | | 3,764 |
Treasury stock acquired | | | | | | | | | 138 | | (10,356) | | (10,356) |
Comprehensive income: | | | | | | | | | | | | | |
Net Income | | | | | | 54,743 | | | | | | | 54,743 |
Foreign currency translation adjustment | | | | | | | | (23,133) | | | | |
(23,133) |
Pension and OPEB adjustments, net of tax of $8.4 million | | | | | | | |
(14,280) | | | | |
(14,280) |
Change in fair value of derivatives, net of tax of ($0.2) million | | | | | | | |
215 | | | | |
215 |
Dividends paid ($.46 per share) | | | | | | (5,893) | | | | | | | (5,893) |
Balance, June 30, 2015 | $ | 41,976 | $ | 47,254 | $ | 632,864 | $ | (93,017) | 15,333 | $ | (280,507) | $ | 348,570 |
| | | | | | | | | | | | | |
See notes to consolidated financial statements. | | | | | | | |
| | | | | | | | | | |
Consolidated Statements of Cash Flows | | | | | | | | | | |
| | | | | | | | | | |
Standex International Corporation and Subsidiaries | | | | | | | | | | |
For the Years Ended June 30(in thousands) | | | 2015 | | | 2014 | | | 2013 | |
Cash Flows from Operating Activities | | | | | | | | | | |
Net income | | $ | 54,743 | | $ | 42,866 | | $ | 44,848 | |
Income (loss) from discontinued operations | | | (500) | | | (6,883) | | | 794 | |
Income (loss) from continuing operations | | | 55,243 | | | 49,749 | | | 44,054 | |
Adjustments to reconcile net income (loss) to net cash provided by operating activities: | |
Depreciation and amortization | | | 16,684 | | | 14,591 | | | 15,235 | |
Stock-based compensation | | | 3,764 | | | 6,630 | | | 3,343 | |
Deferred income taxes | | | (249) | | | (3,343) | | | (2,416) | |
Non-cash portion of restructuring charge | | | (171) | | | 5,982 | | | (31) | |
Excess tax benefit from share-based payment activity | | | (2,088) | | | (1,650) | | | (1,990) | |
Disposal of real estate and equipment | | | - | | | 925 | | | - | |
Life insurance benefit | | | - | | | (3,353) | | | - | |
Increase/(decrease) in cash from changes in assets and liabilities, net of effects from discontinued operations and business acquisitions: |
Accounts receivables, net | | | (5,564) | | | (6,614) | | | 4,335 | |
Inventories | | | (6,073) | | | (10,041) | | | 656 | |
Contributions to defined benefit plans | | | (1,484) | | | (1,527) | | | (4,578) | |
Prepaid expenses and other | | | 4,619 | | | (6,388) | | | (2,889) | |
Accounts payable | | | (3,657) | | | 15,166 | | | 3,414 | |
Accrued payroll, employee benefits and other liabilities | (4,334) | | | 6,192 | | | 2,372 | |
Income taxes payable | | | 9,477 | | | 5,673 | | | 2,700 | |
Net cash provided by operating activities from continuing operations | 66,167 | | | 71,992 | | | 64,205 | |
Net cash used for operating activities from discontinued operations | (2,128) | | | (1,693) | | | (4,024) | |
Net cash provided by operating activities | | | 64,039 | | | 70,299 | | | 60,181 | |
Cash Flows from Investing Activities | | | | | | | | | | |
Expenditures for capital assets | | | (22,561) | | | (18,832) | | | (14,104) | |
Expenditures for acquisitions, net of cash acquired | | (57,149) | | | (23,075) | | | (39,613) | |
Expenditures for executive life insurance policies | | | (408) | | | (444) | | | (435) | |
Proceeds withdrawn from life insurance policies | | | - | | | 3,654 | | | 1,480 | |
Proceeds from sale of real estate and equipment | | | 66 | | | 118 | | | 28 | |
Other investing activity | | | 1,536 | | | 2,964 | | | - | |
Net cash provided by (used for) investing activities from continuing operations | (78,516) | | | (35,615) | | | (52,644) | |
Net cash provided by (used for) investing activities from discontinued operations | - | | |
2,452 | | |
(43) | |
Net cash provided by (used for) investing activities | | | (78,516) | | | (33,163) | | | (52,687) | |
Cash Flows from Financing Activities | | | | | | | | | | |
Proceeds from borrowings | | | 274,700 | | | 71,000 | | | 121,000 | |
Payments of debt | | | (216,700) | | | (76,000) | | | (121,785) | |
Stock issued under employee stock option and purchase plans | 696 | | | 1,098 | | | 279 | |
Excess tax benefit associated with stock option exercises | 2,088 | | | 1,650 | | | 1,990 | |
Cash dividends paid | | | (5,820) | | | (4,793) | | | (3,891) | |
Purchase of treasury stock | | | (10,356) | | | (7,790) | | | (8,509) | |
Net cash provided by (used for) financing activities | | | 44,608 | | | (14,835) | | | (10,916) | |
Effect of exchange rate changes on cash | | | (8,263) | | | 895 | | | (263) | |
Net change in cash and cash equivalents | | | 21,868 | | | 23,196 | | | (3,685) | |
Cash and cash equivalents at beginning of year | | | 74,260 | | | 51,064 | | | 54,749 | |
Cash and cash equivalents at end of year | | $ | 96,128 | | $ | 74,260 | | $ | 51,064 | |
| | | | | | | | | | |
Supplemental Disclosure of Cash Flow Information: | | | | | | | | | | |
Cash paid during the year for: | | | | | | | | | | |
Interest | | $ | 2,547 | | $ | 1,834 | | $ | 2,193 | |
Income taxes, net of refunds | | $ | 12,891 | | $ | 14,048 | | $ | 14,018 | |
| | | | | | | | | | |
See notes to consolidated financial statements. | | | | | | | | | | |
Consolidated Statements of Cash Flows | | | | | | | | | | |
| | | | | | | | | | |
Standex International Corporation and Subsidiaries | | | | | | | | | | |
For the Years Ended June 30(in thousands) | | | 2018 | | | 2017 | | | 2016 | |
Cash Flows from Operating Activities | | | | | | | | | | |
Net income | | $ | 36,604 | | $ | 46,545 | | $ | 52,056 | |
Income (loss) from discontinued operations | | | ( (28) | | | (32) | | | (174) | |
Income (loss) from continuing operations | | | 36,632 | | | 46,577 | | | 52,230 | |
Adjustments to reconcile net income (loss) to net cash provided by operating activities: | |
Depreciation and amortization | | | 29,163 | | | 20,315 | | | 17,953 | |
Stock-based compensation | | | 4,962 | | | 5,023 | | | 5,089 | |
Deferred income taxes | | | 7,391 | | | (121) | | | (6,756) | |
Non-cash portion of restructuring charge | | | (1,264) | | | 1,414 | | | 2,323 | |
Loss on assets held for sale | | | - | | | - | | | 7,267 | |
(Gain) loss on disposal of real estate and equipment | | | (655) | | | (652) | | | 191 | |
Excess tax benefit from share-based payment activity | | | - | | | - | | | (795) | |
Increase/(decrease) in cash from changes in assets and liabilities, net of effects from discontinued operations and business acquisitions: |
Accounts receivables, net | | | (3,440) | | | (6,013) | | | 4,144 | |
Inventories | | | (6,814) | | | (3,796) | | | 1,729 | |
Contributions to defined benefit plans | | | (6,966) | | | (1,443) | | | (1,320) | |
Prepaid expenses and other | | | 1,786 | | | 61 | | | 1,092 | |
Accounts payable | | | (9,326) | | | 4,552 | | | (3,368) | |
Accrued payroll, employee benefits and other liabilities | 12,444 | | | 3,726 | | | 6,731 | |
Income taxes payable | | | 1,090 | | | (5,610) | | | (5,289) | |
Net cash provided by operating activities from continuing operations | 65,003 | | | 64,033 | | | 81,221 | |
Net cash used for operating activities from discontinued operations | (78) | | | (594) | | | (897) | |
Net cash provided by operating activities | | | 64,925 | | | 63,439 | | | 80,324 | |
Cash Flows from Investing Activities | | | | | | | | | | |
Expenditures for capital assets | | | (26,539) | | | (26,448) | | | (17,851) | |
Expenditures for acquisitions, net of cash acquired | | | (10,397) | | | (153,815) | | | (13,700) | |
Expenditures for executive life insurance policies | | | (310) | | | (377) | | | (417) | |
Proceeds from sale of real estate and equipment | | | 2,852 | | | 1,106 | | | 383 | |
Other investing activity | | | 2,129 | | | 483 | | | - | |
Net cash (used for) investing activities from continuing operations | (32,265) | | | (179,051) | | | (31,585) | |
Net cash provided by investing activities from discontinued operations | - | | | - | | | 2,803 | |
Net cash provided by (used for) investing activities | | | (32,265) | | | (179,051) | | | (28,782) | |
Cash Flows from Financing Activities | | | | | | | | | | |
Proceeds from borrowings | | | 163,500 | | | 263,700 | | | 65,000 | |
Payments of debt | | | (164,788) | | | (164,200) | | | (75,000) | |
Stock issued under employee stock option and purchase plans | | | 915 | | | 848 | | | 942 | |
Excess tax benefit from share-based payment activity | | | - | | | - | | | 795 | |
Purchase of treasury stock | | | (2,652) | | | (7,806) | | | (5,636) | |
Cash dividends paid | | | (8,888) | | | (7,852) | | | (6,846) | |
Net cash provided by (used for) financing activities | | | (11,913) | | | 84,690 | | | (20,745) | |
Effect of exchange rate changes on cash | | | 289 | | | (2,500) | | | (4,937) | |
Net change in cash and cash equivalents | | | 21,036 | | | (33,422) | | | 25,860 | |
Cash and cash equivalents at beginning of year | | | 88,566 | | | 121,988 | | | 96,128 | |
Cash and cash equivalents at end of year | | $ | 109,602 | | $ | 88,566 | | $ | 121,988 | |
| | | | | | | | | | |
Supplemental Disclosure of Cash Flow Information: | | | | | | | | | | |
Cash paid during the year for: | | | | | | | | | | |
Interest | | $ | 6,178 | | $ | 3,258 | | $ | 2,351 | |
Income taxes, net of refunds | | $ | 22,145 | | $ | 20,413 | | $ | 24,769 | |
| | | | | | | | | | |
See notes to consolidated financial statements. | | | | | | | | | | |
STANDEX INTERNATIONAL CORPORATION AND SUBSIDIARIES
NOTES TO CONSOLIDATED FINANCIAL STATEMENTS
37
1. SUMMARY OF ACCOUNTING POLICIES
Basis of Presentation and Consolidation
Standex International Corporation (“Standex” or the “Company”) is a diversified manufacturing company with operations in the United States, Europe, Asia, Africa, and Latin America. The accompanying consolidated financial statements include the accounts of Standex International Corporation and its subsidiaries and are prepared in accordance with accounting principles generally accepted in the United States of America (“GAAP”). All intercompany accounts and transactions have been eliminated in consolidation.
The Company considers events or transactions that occur after the balance sheet date, but before the financial statements are issued to provide additional evidence relative to certain estimates or to identify matters that require additional disclosure. We evaluated subsequent events through the date and time our consolidated financial statements were issued.
Accounting Estimates
The preparation of consolidated financial statements in conformity with GAAP requires the use of estimates, judgments and assumptions that affect the reported amounts of assets, liabilities, revenues and expenses, and related disclosure of contingent assets and liabilities at the date of the financial statements and for the period then ended. Estimates are based on historical experience, actuarial estimates, current conditions and various other assumptions that are believed to be reasonable under the circumstances. These estimates form the basis for making judgments about the carrying values of assets and liabilities when they are not readily apparent from other sources. These estimates assist in the identification and assessment of the accounting treatment necessary with respect to commitments and contingencies. Actual results may differ from these estimates under different assumptions or conditions.
Cash and Cash Equivalents
Cash and cash equivalents include highly liquid investments purchased with a maturity of three months or less. These investments are carried at cost, which approximates fair value. At June 30, 20152018 and 2014,2017, the Company’s cash was comprised solely of cash on deposit.
Trading Securities
The Company purchases investments in connection with the KEYSOP Plan for certain retired executives and for its non-qualified defined contribution plan for employees who exceed certain thresholds under our traditional 401(k) plan. These investments are classified as trading and reported at fair value. The investments generally consist of mutual funds, are included in other non-current assets and amounted to $2.3 million and $3.1$2.4 million at June 30, 20152018 and 2014, respectively.$2.4 million at June 30, 2017. Gains and losses on these investments are recorded as other non-operating income (expense), net in the Consolidated Statements of Operations.
Accounts Receivable Allowances
The Company has provided an allowance for doubtful accounts reserve which represents the best estimate of probable loss inherent in the Company’s account receivables portfolio. This estimate is derived from the Company’s knowledge of its end markets, customer base, products, and historical experience.
The changes in the allowances for uncollectible accounts during 2015, 2014,2018, 2017, and 20132016 were as follows (in thousands):
| | | 2015 | | | 2014 | | | 2013 | | 2018 | | | 2017 | | | 2016 |
Balance at beginning of year | $ | 2,282 | | $ | 2,325 | | $ | 1,974 | $ | 2,406 | | $ | 2,119 | | $ | 2,226 |
Acquisitions and other | | 4 | | | 93 | | | 190 | | (169) | | | 52 | | | 3 |
Provision charged to expense | | 496 | | | 375 | | | 268 | | 870 | | | 416 | | | 8 |
Write-offs, net of recoveries | | (556) | | | (511) | | | (107) | | (137) | | | (181) | | | (118) |
Balance at end of year | $ | 2,226 | | $ | 2,282 | | $ | 2,325 | $ | 2,970 | | $ | 2,406 | | $ | 2,119 |
Inventories
38
Inventories are stated at the lower of (first-in, first-out) cost or market. Inventory quantities on hand are reviewed regularly, and provisions are made for obsolete, slow moving, and non-saleable inventory, based primarily on management’s forecast of customer demand for those products in inventory.
Long-Lived Assets
Long-lived assets that are used in operations, excluding goodwill and identifiable intangible assets, are tested for recoverability whenever events or changes in circumstances indicate that its carrying amount may not be recoverable. Recognition and measurement of a potential impairment loss is performed on assets grouped with other assets and liabilities at the lowest level where identifiable cash flows are largely independent of the cash flows of other assets and liabilities. An impairment loss is the amount by which the carrying amount of a long-lived asset (asset group) exceeds its estimated fair value. Fair value is determined based on discounted cash flows or appraised values, depending upon the nature of the assets.
Property, Plant and Equipment
Property, plant and equipment are reported at cost less accumulated depreciation. Depreciation is recorded on assets over their estimated useful lives, generally using the straight-line method. Lives for property, plant and equipment are as follows:
| |
Buildings | 40 to 50 years |
Leasehold improvements | Lesser of useful life or term, unless renewals are deemed to be reasonably assured |
Machinery and equipment | 8 to 15 years |
Furniture and Fixtures | 3 to 10 years |
Computer hardware and software | 3 to 7 years |
Routine maintenance costs are expensed as incurred. Major improvements are capitalized. Major improvements to leased buildings are capitalized as leasehold improvements and depreciated over the lesser of the lease term or the life of the improvement.
Routine maintenance costs are expensed as incurred. Major improvements are capitalized. Major improvements to leased buildings are capitalized as leasehold improvements and depreciated over the lesser of the lease term or the life of the improvement.
Amortization of computer hardware and software of $0.5$1.4 million, $0.4$0.6 million, and $0.4$0.6 million is included as a component of long-term assetsdepreciation expense for the years ended June 30, 2015, 2014,2018, 2017, and 20132016, respectively.
Goodwill and Identifiable Intangible Assets
All business combinations are accounted for using the acquisition method. Goodwill and identifiable intangible assets with indefinite lives, are not amortized, but are reviewed annually for impairment or more frequently if impairment indicators arise. Identifiable intangible assets that are not deemed to have indefinite lives are amortized on an accelerated basis over the following useful lives:
| |
Customer relationships | 5 to 16 years |
Patents | 12 years |
Non-compete agreements | 5 to 10 years |
Other | 10 years |
Developed technology | 10-20 years |
Trade names | Indefinite life |
See discussion of the Company’s assessment of impairment in Note 5 – Goodwill and Note 6 – Intangible Assets.
Fair Value of Financial Instruments
The financial instruments, shown below, are presented at fair value. Fair value is defined as the price that would be received to sell an asset or paid to transfer a liability in an orderly transaction between market participants at the measurement date. Where available, fair value is based on observable market prices or parameters or derived from such prices or parameters. When observable prices or inputs are not available, valuation models may be applied.
Assets and liabilities recorded at fair value in the consolidated balance sheet are categorized based upon the level of judgment associated with the inputs used to measure their fair values. Hierarchical levels directly related to the amount of subjectivity associated with the inputs to fair valuation of these assets and liabilities and the methodologies used in valuation are as follows:
Level 1 – Quoted prices in active markets for identical assets and liabilities. The Company’s deferred compensation plan assets consist of shares in various mutual funds (for the deferred compensation plan, investments are participant-directed)participant-
39
directed) which invest in a broad portfolio of debt and equity securities. These assets are valued based on publicly quoted market prices for the funds’ shares as of the balance sheet dates. For pension assets (see Note 1716 – Employee Benefit Plans), securities are valued based on quoted market prices for securities held directly by the trust.
Level 2 – Inputs, other than quoted prices in an active market, that are observable either directly or indirectly through correlation with market data. For foreign exchange forward contracts and interest rate swaps, the Company values the instruments based on the market price of instruments with similar terms, which are based on spot and forward rates as of the balance sheet dates. For pension assets held in commingled funds (see Note 1716 – Employee Benefit Plans), the Company values investments based on the net asset value of the funds, which are derived from the quoted market prices of the underlying fund holdings. The Company has considered the creditworthiness of counterparties in valuing all assets and liabilities.
Level 3–3 – Unobservable inputs based upon the Company’s best estimate of what market participants would use in pricing the asset or liability.
We did not have any transfers of assets and liabilities between Level 1 and Level 2among Levels of the fair value measurement hierarchy atduring the years ended June 30, 2015 and 2014.2018 or 2017.
Cash and cash equivalents, accounts receivable, and accounts payable and debt are carried at cost, which approximates fair value.
The fair values of our financial instruments at June 30, 20152018 and 20142017 were (in thousands):
| | | | 2015 | | | 2018 |
| | Total | | Level 1 | | Level 2 | | Level 3 | | Total | | Level 1 | | Level 2 | | Level 3 |
Financial Assets | Financial Assets | | | | | | | | | | | | Financial Assets | | | | | | | | | | | |
| | Marketable securities - deferred compensation plan | $ | 2,362 | | $ | 2,362 | | $ | - | | $ | - |
| Marketable securities - deferred compensation plan | $ | 2,324 | | $ | 2,324 | | $ | - | | $ | - | Foreign exchange contracts | | 1,357 | | | - | | | 1,357 | | | - |
| Foreign Exchange contracts | | 844 | | | - | | | 844 | | | - | Interest rate swaps | | 1,325 | | | - | | | 1,325 | | | - |
| | | | | | | | | | | | | | | | | | | | | | | | |
Financial Liabilities | Financial Liabilities | | | | | | | | | | | | Financial Liabilities | | | | | | | | | | | |
| Foreign Exchange contracts | $ | 193 | | $ | - | | $ | 193 | | $ | - | Foreign exchange contracts | $ | 4,204 | | $ | - | | $ | 4,204 | | $ | - |
| Interest rate swaps | | 551 | | | - | | | 551 | | | - | Interest rate swaps | | - | | | - | | | - | | | - |
| | | | | | | | | | | | | Contingent acquisition payments(a) | | 7,535 | | | - | | | - | | | 7,535 |
| | | 2014 | | | | | | | | | | | | |
| | Total | | Level 1 | | Level 2 | | Level 3 | | | 2017 |
| | | Total | | Level 1 | | Level 2 | | Level 3 |
Financial Assets | Financial Assets | | | | | | | | | | | | Financial Assets | | | | | | | | | | | |
| | Marketable securities - deferred compensation plan | $ | 2,397 | | $ | 2,397 | | $ | - | | $ | - |
| Marketable securities - deferred compensation plan | $ | 3,114 | | $ | 3,114 | | $ | - | | $ | - | Foreign exchange contracts | | 399 | | | - | | | 399 | | | - |
| Foreign Exchange contracts | | 356 | | | - | | | 356 | | | - | Interest rate swaps | | 3,777 | | | - | | | 3,777 | | | - |
| | | | | | | | | | | | | | | | | | | | | | | | |
Financial Liabilities | Financial Liabilities | | | | | | | | | | | | Financial Liabilities | | | | | | | | | | | |
| Foreign Exchange contracts | $ | 1,552 | | $ | - | | $ | 1,552 | | $ | - | Foreign exchange contracts | $ | 3,232 | | $ | - | | $ | 3,232 | | $ | - |
| Interest rate swaps | | 1,061 | | | - | | | 1,061 | | | - | Interest rate swaps | | 3,958 | | | - | | | 3,958 | | | - |
Contingent acquisition payments(a) 2,108 - - 2,108
(a) The fair value of our contingent consideration arrangement is determined based on our evaluation as to the probability and amount of any deferred compensation that has been earned to date.
Our financial liabilities based upon Level 3 inputs include contingent consideration arrangements relating to our acquisition of Horizon Scientific or Piazza Rosa. We are contractually obligated to pay contingent consideration payments to the Sellers of these businesses based on the achievement of certain criteria.
Contingent consideration payable to the Horizon seller is based on continued employment of the seller on the second and third anniversary of the closing date of the acquisition. Contingent acquisition payment liabilities are scheduled to be paid in periods through fiscal year 2020. As of June 30, 2018, we could be required to pay up to $8.0 million for contingent consideration arrangements if specific criteria are achieved.
40
Contingent consideration payable to the Piazza Rosa sellers is based on the achievement of certain revenue targets of each of the first three years following the acquisition. Contingent acquisition payments are payable in euros and can be paid in periods through fiscal year 2021. As of June 30, 2018, we could be required to pay up to $1.7 million for contingent consideration arrangements if the revenue targets are met.
We have determined the fair value of the liabilities for the contingent consideration based on a probability-weighted discounted cash flow analysis. This fair value measurement is based on significant inputs not observable in the market and thus represents a Level 3 measurement within the fair value hierarchy. The fair value of the contingent consideration liability associated with future payments was based on several factors, the most significant of which are continued employment of the seller and the risk-adjusted discount rate for the fair value measurement. As of June 30, 2018, neither the amount recognized for the contingent consideration arrangement, nor the range of outcomes or the assumptions used to develop the estimate had changed.
Concentration of Credit Risk
The Company is subject to credit risk through trade receivables and short-term cash investments. Concentration of risk with respect to trade receivables is minimized because of the diversification of our operations, as well as our large customer base and our geographical dispersion. No individual customer accounts for more than 5% of revenues or accounts receivable in the periods presented.
Short-term cash investments are placed with high credit-quality financial institutions. The Company monitors the amount of credit exposure in any one institution or type of investment instrument.
Revenue Recognition
The Company’s product sales are recorded when persuasive evidence of an arrangement exists, delivery has occurred, the price to the buyer is fixed or determinable, and collectability is reasonably assured. For products that include installation, and if the installation meets the criteria to be considered a separate element, product revenue is recognized upon delivery, and installation revenue is recognized when the installation is complete. Revenues under certain fixed price contracts are generally recorded when deliveries are made.
Sales and estimated profits under certain long-term contracts are recognized under the percentage-of-completion methods of accounting, whereby profits are recorded pro rata, based upon current estimates of costs to complete such contracts. Losses on contracts are provided forfully recognized in the period in which the losses become determinable. Revisions in profit estimates are reflected on a cumulative basis in the period in which the basis for such revision becomes known. Any excess of the billings over cost and estimated earnings on long-term contracts is included in deferred revenue.
Cost of Goods Sold and Selling, General and Administrative Expenses
The Company includes expenses in either cost of goods sold or selling, general and administrative categories based upon the natural classification of the expenses. Cost of goods sold includes expenses associated with the acquisition, inspection, manufacturing and receiving of materials for use in the manufacturing process. These costs include inbound freight charges, purchasing and receiving costs, inspection costs, warehousing costs, internal transfer costs as well as depreciation, amortization, wages, benefits and other costs that are incurred directly or indirectly to support the manufacturing process. Selling, general and administrative includes expenses associated with the distribution of our products, sales effort, administration costs and other costs that are not incurred to support the manufacturing process. The Company records distribution costs associated with the sale of inventory as a component of selling, general and administrative expenses in the Consolidated Statements of Operations. These expenses include warehousing costs, outbound freight charges and costs associated with distribution personnel. Our gross profit margins may not be comparable to those of other entities due to different classifications of costs and expenses.
The Company purchased $2.4 million, $2.4 million, and $3.3 million from a 20% owned equity interest during the years ended June 30, 2018, 2017, and 2016 respectively. The inventory was purchased under customary terms and conditions and sold to customers in the ordinary course of business. Earnings from this investment are not material and are accounted for under the equity method.
Our total advertising expenses, which are classified under selling, general, and administrative expenses are primarily related to trade shows, and totaled $5.0$4.3 million, $4.6$5.1 million, and $4.6$4.3 million for the years endedJune 30,, 2015, 2014, 2018, 2017, and 2013,2016, respectively.
Research and Development
41
Research and development expenditures are expensed as incurred. Total research and development costs, which are classified under selling, general, and administrative expenses, were $4.1$6.1 million, $4.8$5.5 million, and $4.4$4.9 million for the years endedJune 30,, 2015, 2014, 2018, 2017, and 2013,2016, respectively.
Warranties
The expected cost associated with warranty obligations on our products is recorded when the revenue is recognized. The Company’s estimate of warranty cost is based on contract terms and historical warranty loss experience that is periodically adjusted for recent actual experience. Since warranty estimates are forecasts based on the best available information, claims costs may differ from amounts provided. Adjustments to initial obligations for warranties are made as changes in the obligations become reasonably estimable.
The changes in continuing operations warranty reserve, which are recorded as accrued liabilities, during 2015, 2014,2018, 2017, and 20132016 were as follows (in thousands):
| | | 2015 | | | 2014 | | | 2013 | | 2018 | | | 2017 | | | 2016 |
Balance at beginning of year | $ | 6,941 | | $ | 6,782 | | $ | 5,767 | $ | 9,243 | | $ | 9,085 | | $ | 7,436 |
Acquisitions | | 3 | | | 274 | | | 795 | |
Acquisitions and other charges | | | (138) | | | 301 | | | (5) |
Warranty expense | | 11,086 | | | 3,937 | | | 4,282 | | 9,223 | | | 9,203 | | | 13,503 |
Warranty claims | | (10,594) | | | (4,052) | | | (4,062) | | (8,972) | | | (9,346) | | | (11,849) |
Balance at end of year | $ | 7,436 | | $ | 6,941 | | $ | 6,782 | $ | 9,356 | | $ | 9,243 | | $ | 9,085 |
The decrease in warranty expense during 2017 compared to 2016 is primarily due to the conclusion of the warranty period for potential claims arising from production and manufacturing issues experienced in the Cooking Solutions business when the Company transitioned from the Cheyenne plant to Nogales in fiscal year 2015. Additional warranty expense changes were due to the decline in sales volume for warrantable products which reduced the potential for future claims.
Stock-Based Compensation Plans
Restricted stock awards generally vest over a three-year period. Compensation expense associated with these awards is recorded based on their grant-date fair values and is generally recognized on a straight-line basis over the vesting period except for awards with performance conditions, which are recognized on a graded vesting schedule. Compensation cost for an award with a performance condition is based on the probable outcome of that performance condition. The stated vesting period is considered non-substantive for retirement eligible participants. Accordingly, the Company recognizes any remaining unrecognized compensation expense upon participant reaching retirement eligibility.
Foreign Currency Translation
The functional currency of our non-U.S. operations is generally the local currency. Assets and liabilities of non-U.S. operations are translated into U.S. Dollars on a monthly basis using period-end exchange rates. Revenues and expenses of these operations are translated using average exchange rates. The resulting translation adjustment is reported as a component of comprehensive income (loss) in the consolidated statements of stockholders’ equity and comprehensive income. Gains and losses from foreign currency transactions are included in results of operations and were not material for any period presented.
Derivative Instruments and Hedging Activities
The Company recognizes all derivatives on its balance sheet at fair value.
Forward foreign currency exchange contracts are periodically used to limit the impact of currency fluctuations on certain anticipated foreign cash flows, such as foreign purchases of materials and loan payments from subsidiaries. The Company enters into such contracts for hedging purposes only. ForThe Company has designated certain of these currency contracts as hedges, and changes in the fair value of intercompany loan payments,these contracts are recognized in other comprehensive income until the Company records derivative gains and losses directly to the statement of operations due to the general short-term nature and predictability of the transactions.hedged items are recognized in earnings. Hedge ineffectiveness, if any, associated with these contracts will be reported in net income.
The Company also uses interest rate swaps to manage exposure to interest rates on the Company’s variable rate indebtedness. The Company values the swaps based on contract prices in the derivatives market for similar instruments. The Company has designated the swapsits interest rate swap agreements, including those that are forward-dated, as cash flow hedges, and changes in the fair value of the swaps are recognized in other comprehensive income (loss) until the hedged items are recognized in earnings. Hedge ineffectiveness, if any, associated with the swaps will be reported by the Company in interest expense.
42
The Company does not hold or issue derivative instruments for trading purposes.
Income Taxes
Deferred assets and liabilities are recordedThe Company's income tax provision from continuing operations for the expected future tax consequencesfiscal year ended June 30, 2018 was $40.6 million, or an effective rate of events that have been included52.6%, compared to $15.4 million, or an effective rate of 24.8% for the year ended June 30, 2017, and $16.3 million, or an effective rate of 23.8% for the year ended June 30, 2016. Changes in the financial statementseffective tax rates from period to period may be significant as they depend on many factors including, but not limited to, the amount of the Company's income or loss, the mix of income earned in the US versus outside the US, the effective tax returns. Deferredrate in each of the countries in which we earn income, and any one-time tax assets and liabilities are determined based onissues which occur during the differences between the financial statements and the tax bases of assets and liabilities using enacted tax rates. Valuation allowances are provided when the Company does not believe it more likely than not the benefit of identified tax assets will be realized.period.
The Company provides reservesCompany's income tax provision from continuing operations for potential payments of tax to various tax authorities related to uncertain tax positions and other issues. The Company accounts for uncertain tax positions based on a determination of whether and how much ofthe fiscal year ended June 30, 2018 was impacted by the following items: (i) a tax benefit taken by the Company in its tax filings or positions is more likely than not to be realized following resolution of any potential contingencies presentprovision related to the impact of the Sec. 965 toll tax benefit, assuming thatof $11.7 million, (ii) a tax provision related to a revaluation of deferred taxes due to the matter in question will be raisedfederal rate reduction of $1.3 million, and (iii) a tax provision related to expected foreign withholding taxes on cash repatriation of $7.8 million.
The Company's income tax provision from continuing operations for the fiscal year ended June 30, 2017 was impacted by the following items: (i) a provision of $0.4 million related to non-deductible transaction costs, (ii) a benefit of $0.6 million related to the R&D tax authorities. Interestcredit, and penalties associated with such uncertain tax positions are recorded as(iii) a componentbenefit of $5.3 million due to the mix of income earned in jurisdictions with beneficial tax expense.rates.
The Company's income tax provision from continuing operations for the fiscal year ended June 30, 2016 was impacted by the following items: (i) a net benefit of $0.9 million related to a bargain-sale of idle property to a charitable organization, and (ii) a benefit of $0.7 million related to the R&D tax credit, and (iii) a benefit of $4.9 million due to the mix of income earned in jurisdictions with beneficial tax rates.
Earnings Per Share
| (share amounts in thousands) | | 2015 | | 2014 | | 2013 | | 2018 | | 2017 | | 2016 |
Basic – Average Shares Outstanding | | 12,655 | | 12,613 | | 12,561 | | 12,698 | | 12,666 | | 12,682 |
Effect of Dilutive Securities – Stock Options and | Effect of Dilutive Securities – Stock Options and | | | | | | Effect of Dilutive Securities – Stock Options and | | | | | |
Restricted Stock Awards | | 150 | | 165 | | 219 | | 90 | | 102 | | 102 |
Diluted – Average Shares Outstanding | | 12,788 | | 12,768 | | 12,784 |
Both basic and dilutive income is the same for computing earnings per share. There were no outstanding instruments that had an anti-dilutive effect at June 30, 2015, 20142018, 2017 and 2013.2016.
Recently Issued Accounting Pronouncements
In April 2015, the Financial Accounting Standards Board (“FASB”) issued accounting standard update ASU 2015-3,Simplifying the Presentation of Debt Issuance Cost. The standard is effective for annual and interim periods with those annual periods beginning after December 15, 2015. Early adoption is permitted and retrospective application will be required. We expect to adopt this standard in the quarter ending September 30, 2016. The Company does not expect that adoption of ASU 2015-3 to have a material impact to its consolidated results of operations.
In February 2015, the FASB issued ASU No. 2015-02, “Consolidation (Topic 820) - Amendments to the Consolidation Analysis.” This update amends the current consolidation guidance for both the variable interest entity (VIE) and voting interest entity (VOE) consolidation models. The amendments in this ASU are effective, for fiscal years and for interim periods within those fiscal years, beginning after December 15, 2015, with early adoption permitted. The Company believes the adoption of this ASU will not have a material impact on its consolidated financial statements.
In January 2015, the FASB issued ASU No. 2015-01, “Income Statement—Extraordinary and Unusual Items.” This update eliminates from GAAP the concept of extraordinary items. ASU 2015-01 is effective for the first interim period within fiscal years beginning after December 15, 2015, with early adoption permitted provided that the guidance is applied from the beginning of the fiscal year of adoption. A reporting entity may apply the amendments prospectively or retrospectively to all prior periods presented in the financial statements. The Company believes the adoption of this ASU will not have a material impact on its consolidated financial statements.
In June 2014, the FASB issued accounting standard update ASU 2014-12,Accounting for Share-Based Payments When the Terms of an Award Provide That a Performance Target Could Be Achieved after the Requisite Service Period. The update provides guidance on how to account for certain share-based payment awards where employees would be eligible to vest in the award regardless of whether the employee is still rendering service on the date the performance target is achieved. The standard is effective for annual and interim periods with those annual periods beginning after December 15, 2015. Early adoption is permitted. The Company does not expect the adoption of ASU 2014-12 to have a material impact to its consolidated results of operation.
In May 2014, the FASB and the InternationalFinancial Accounts Standards Board ("FASB") issued Accounting Standards Board jointly issued a comprehensive new revenue recognition standard, ASUUpdate (“ASU”) No. 2014-09,Revenue “Revenue from ContractContracts with Customers that will supersede nearly all (Topic 606),” which amends most of the existing revenue recognition guidance, under US GAAP and IFRS. The standard’s primary principle is thatincluding industry-specific guidance. ASU 2014-09 establishes a company willsingle comprehensive model for companies to use in accounting for revenue arising from contracts with customers. Under ASU No. 2014-09, an entity should recognize revenue when it transfers promised goods or services to customers in an amount that reflects the consideration to which the Companyentity expects to be entitled in exchange for those goods or services.services and requires additional disclosure about the nature, amount, timing, and uncertainty of revenue and cash flows arising from customer contracts, including significant judgments and changes in judgments and assets recognized from costs incurred to obtain or fulfill a contract. In early 2016, the FASB issued additional updates: ASU No. 2016-10, 2016-11 and2016-12. These updates provide further guidance and clarification on specific items within the previously issued update. The originalCompany will adopt Topic 606 under the modified retrospective method and will only apply this method to contracts that are not completed as of the date of adoption. Application of this method will result in a cumulative effect of initially applying the standard as an adjustment to the opening balance of retained earnings at the date of initial application for any open contracts as of the adoption date.
The Company established a global steering committee with a project plan to analyze the impact of this standard. The assessment phase of the project plan, which included identifying the various revenue streams, initiating contract reviews and reviewing current accounting policies and practices to identify potential differences that would result from the application of the standard is complete. This assessment included (1) utilizing questionnaires to assist with the identification of revenue streams, (2) performing sample contract analyses for each revenue stream identified, (3) assessing the noted differences in
43
recognition and measurement that may result from adopting this new standard, (4) performing detailed analyses of contracts with larger customers, and (5) developing plans to test transactions for consistency with contract provisions that affect revenue recognition.
As part of the analysis phase, the committee analyzed the impact of the standard on its contract portfolio by reviewing a sample of its contracts to identify potential differences that would result from applying the requirements of the new standard. The committee also analyzed the impact of requirements for identifying contracts, performance obligations, and variable consideration.
Based on procedures performed, the committee has identified two areas that will be impacted by application of the new revenue standard. In the Food Service Equipment segment, the Company bases volume-related rebate accruals on the achievement of certain pre-defined tiers. The new guidance requires the Company to calculate the rebate accrual on anticipated sales for the rebate period, rather than measurement of actual achievement of specific tiers. The Company expects to record a one-time catch up adjustment for this change, upon adoption of the new standard during the quarter ending September 30, 2018, of $1.5 million. In Engineering Technologies, the committee analyzed certain long-term contracts, currently recognizing revenue utilizing the point-in-time method, to determine if any of the three criteria in ASC 606-10-25-27 are being met which would require revenue to be recognized over time under the new standard.
It was determined that $0.7 million in net sales will be moved from point in time to overtime. The net change for Engineering Technologies will be approximately $0.1 million after cost of sales of $0.6 million. The net impact will be reflected as a reduction to retained earnings in our quarterly report for the quarter ending September 30, 2018.
The Company is also evaluating the disclosure requirements under the new standard that are effective in the first quarter of fiscal year 2019. The Company will continue to evaluate these disclosure requirements and incorporate the collection of relevant data into its reporting process in the first quarter of fiscal year 2019.
During the first quarter of fiscal year 2019, the Company will continue to analyze the adoption impact and disclose the final impact in our September 30 2018 10Q.
In November 2015, the FASB issued ASC Update 2015-17,Income Taxes (Topic 740): Balance Sheet Classification of Deferred Taxes, as part of its simplification initiatives. This update requires deferred tax liabilities and assets to be classified as non-current on the consolidated condensed balance sheet for fiscal years beginning after December 15, 2016, and interim periods within those annual periods. Early application is permitted. An entity can elect adoption prospectively or retrospectively to all periods presented. We have adopted ASU 2015-17 prospectively. As a result, we have presented all deferred tax assets and liabilities as noncurrent on our consolidated balance sheet as of June 30, 2018, but have not reclassified current deferred assets and liabilities on our consolidated balance sheet as of June 30, 2017. There was no impact on our results of operations as a result of the adoption of ASU 2015-17.
In February 2016, the FASB issued ASU 2016-02,Leases (Topic 842). ASU 2016-02 increases transparency and comparability among organizations by recognizing lease assets and liabilities on the balance sheet and disclosing key information about leasing arrangements. A modified retrospective transition approach is required for lessees for capital and operating leases existing at, or entered into after, the beginning of the earliest comparative period presented in the financial statements, with certain practical expedients available. For leases with a term of twelve months or less, a lessee is permitted to make an accounting policy election by class of underlying asset not to recognize lease assets and liabilities. ASU 2016-02 is effective for fiscal years beginning after December 15, 2016;2018. While we are continuing to assess the effect of the adoption, we currently believe the most significant potential changes relate to (i) recognition of right-of-use assets and lease liabilities on our balance sheet for equipment and real estate operating leases, and (ii) the derecognition of existing assets and liabilities for certain sale-leaseback transactions that currently do not qualify for sale accounting. The Company anticipates the adoption will have a material impact on the Company’s consolidated financial statements due to the materiality of the underlying leases subject to the new guidance, however in July 2015,are unable to quantify that effect until our analysis is complete.
In January 2017, the FASB approvedissued ASU 2017-04,Simplifying the Test for Goodwill Impairment, which simplifies the accounting for goodwill impairments by eliminating step two from the goodwill impairment test. Instead, if the carrying amount of a one-year deferralreporting unit exceeds its fair value, an impairment loss shall be recognized in an amount equal to that excess, limited to the total amount of this standard, with agoodwill allocated to that reporting unit. ASU 2017-04 also clarifies the requirements for excluding and allocating foreign currency translation adjustments to reporting units related to an entity's testing of reporting units for goodwill impairment. It further clarifies that an entity should consider income tax effects from any tax-deductible goodwill on the carrying amount of the reporting unit when measuring the goodwill impairment loss, if applicable. ASU 2017-04 is effective for annual or any interim goodwill impairment tests in fiscal years beginning after December 15, 2019. The Company is currently assessing the potential impact of the adoption of ASU 2017-04 on our consolidated financial statements.
44
In March 2017, the FASB issued ASU 2017-07,Compensation-Retirement Benefits (Topic 715): Improving the Presentation of Net Periodic Pension Cost and Net Periodic Postretirement Benefit Cost, which changes how employers that sponsor defined benefit pension or other postretirement benefit plans present the net periodic benefit cost in the income statement. The new guidance requires the service cost component of net periodic benefit cost to be presented in the same income statement line items as other employee compensation costs arising from services rendered during the period. Other components of the net periodic benefit cost are to be stated separately from service cost and outside of operating income. This guidance is effective date for fiscal years beginning after December 15, 2017. We expect2017 (fiscal 2019 for the Company) and interim periods within those annual periods. The amendment is to adopt thisbe applied retrospectively. The provisions of the new standard will impact the classification of pension expense in the Statement of Operations and will impact both current and historical operating income and Other Expense – Non Operating beginning in the first quarter ending September 30, 2018.of fiscal year 2019.
In August 2017, the FASB issued ASU 2017-12,Derivatives and Hedging (Topic 815); Targeting Improvements to Accounting for Hedging Activities, which improves the financial reporting of hedging relationships to better portray the economic results of an entity’s risk management activities in its financial statements and to make certain targeted improvements to simplify the application of hedge accounting guidance. The new guidance requires additional disclosures including cumulative basis adjustments for fair value hedges and the effect of hedging on individual income statement line items. This guidance is effective for fiscal years beginning after December 15, 2018 (fiscal 2020 for the Company), and interim periods within those fiscal years. The amendment is to be applied prospectively. The Company is continuing to evaluatein the preliminary stages of assessing the potential impact of adoptingthe adoption of ASU 2014-092017-12 on itsour consolidated financial statements.
In February 2018, the FASB issued ASU 2018-02,Income Statement - Reporting Comprehensive Income (Topic 220): Reclassification of Certain Tax Effects from Accumulated Other Comprehensive Income, which will allow a reclassification from accumulated other comprehensive income to retained earnings for the tax effects resulting from "An Act to Provide for Reconciliation Pursuant to Titles II and V of the Concurrent Resolution on the Budget for Fiscal Year 2018" (the "Act") that are stranded in accumulated other comprehensive income. This standard also requires certain disclosures about stranded tax effects. This ASU, however, does not change the underlying guidance that requires that the effect of a change in tax laws or rates be included in income from continuing operations. ASU 2018-02 is effective for interim and annual periods beginning after December 15, 2018, with early adoption permitted. It must be applied either in the period of adoption or retrospectively to each period in which the effect of the change in the U.S. federal corporate income tax rate in the Act is recognized. We elected to early adopt this ASU during the fiscal third quarter of 2018. The amount of the reclassification was $17.2 million.
2. ACQUISITIONS
TheEach of the Company’s recent acquisitions are strategically significant to the future growth prospects of the Company. The Company howeverevaluated the significance of each acquisition on a standalone basis and in aggregate, considering both qualitative and quantitative factors.
Piazza Rosa Group
During the first quarter of fiscal year 2018, the Company acquired the Piazza Rosa Group. The Italy-based privately held company is a leading provider of mold and tool treatment and finishing services for the automotive and consumer products markets. We have included the results of the Piazza Rosa Group in our Engraving segment in our Condensed Consolidated Financial Statements.
The Company paid $10.1 million in cash for all of the issued and outstanding equity interests of the Piazza Rosa Group and also paid $2.8 million subsequent to closing in order to satisfy assumed debt of the entity at the time of acquisition. The Company has estimated that total cash consideration will be adjusted by $2.6 million based upon achievement of certain revenue metrics over the next three years.
The preliminary purchase price was allocated to the net tangible and identifiable intangible assets acquired and liabilities assumed based on their fair values on the closing date. Goodwill recorded from this transaction is attributable to potential revenue increases from the combined competencies with Standex Engraving’s worldwide presence and Piazza Rosa Group’s texturizing capabilities. The combined companies create a global tool finishing service leader and open additional opportunities in the broader surface engineering market.
Intangible assets of $4.1 million were preliminarily recorded, consisting of $2.3 million of customer relationships to be amortized over a period of eight years, $1.6 million for trademarks, and $0.2 million of other intangibles assets. Since the preliminary valuation, the Company adjusted goodwill by $0.5 million primarily as a result of identification of other identifiable assets.
45
The Company will finalize its purchase accounting for this acquisition in the first quarter of fiscal year 2019, and will record an approximate $1.5 million reduction to identified intangible assets with a corresponding increase to goodwill. The goodwill of $6.6 million created by the transaction is not deductible for income tax purposes.
The components of the fair value of the Piazza Rosa Group acquisition, including the allocation of the purchase price at June 30, 2015, we concluded, that historical results2018, are as follows (in thousands):
| | | Preliminary Allocation | | Adjustments | | | Preliminary Allocation |
| | | September 30, 2017 | | | | | June 30, 2018 |
Fair value of business combination: | | | | | | | | | |
Total cash consideration | | $ | 10,056 | | $ | - | | $ | 10,056 |
Fair value of contingent consideration | | | - | | | 2,617 | | | 2,617 |
Total | | $ | 10,056 | | $ | 2,617 | | $ | 12,673 |
Identifiable assets acquired and liabilities assumed: | | | | | | | | | |
Other acquired assets | | $ | 2,678 | | $ | 1,664 | | $ | 4,342 |
Inventories | | | 637 | | | (2) | | | 635 |
Property, plant, and equipment | | | 5,005 | | | 558 | | | 5,563 |
Identifiable intangible assets | | | 4,087 | | | (1) | | | 4,086 |
Goodwill | | | 6,218 | | | 416 | | | 6,634 |
Liabilities assumed | | | (7,387) | | | - | | | (7,387) |
Deferred taxes | | | (1,182) | | | (18) | | | (1,200) |
Total | | $ | 10,056 | | $ | 2,617 | | $ | 12,673 |
| | | | | | | | | |
OKI Sensor Device Corporation
During the third quarter of the acquired Companies both individually and in the aggregate, were immaterial to the Company’s consolidated financial results and therefore additional proforma disclosures are not presented.
On September 4, 2014,fiscal year 2017, the Company acquired Engineticsall of the outstanding shares of OKI Sensor Device Corporation from OKI Electric Industry Co., Ltd. Located in Kofu City, Japan, OKI Sensor Device Corporation is the world’s leading designer and supplier of magnetic reed switches. Now named Standex Electronics Japan Corporation (“Enginetics”Standex Electronics Japan”), the acquisition enhances the Company’s access to important Asian markets and enables the Company to offer a leading producerworld class suite of aircraft engine components for all major aircraft platforms. This investment complementsreed switches and related magnetic solutions while continuing to serve Standex Electronics Japan’s diverse distribution channels. We have included the results of Standex Electronics Japan in our Engineering Technologies Group and allows us to provide broader solutions to the aviation market.Electronics segment in our Condensed Consolidated Financial Statements.
The Company paid $55.0$129.2 million in cash, net of cash acquired, for 100% of the outstanding stock of MPE Aeroengines Inc, of which Enginetics is a wholly owned subsidiaryStandex Electronics Japan. The preliminary purchase price was allocated to the net tangible and has recordedidentifiable intangible assets acquired and liabilities assumed based on their fair values on the closing date. Goodwill recorded from this transaction is attributable to potential revenue increases from enhanced access to our Asian markets and synergies created from the vertical integration with a key supplier.
Intangible assets of $10.6$51.4 million were recorded, consisting of $9.1$47.8 million of developed technology to be amortized over a period of 10-20 years, $3.4 million of customer relationships to be amortized over a period of fifteen years, and $0.2 million of product order backlog which was amortized during fiscal year 2017. Since the preliminary valuation, the Company adjusted goodwill by $3.4 million as a result of tax adjustments, a pension adjustment of $1.9 million and purchase accounting changes including a decrease in the fair value of developed technology, fixed assets, and customer relationships of $2.3 million, $0.2 million, and $0.2 million, respectively, and an additional $0.1 million of product order backlog which was amortized during fiscal year 2017. The goodwill of $79.4 million created by the transaction is not deductible for income tax purposes.
The components of the fair value of the Standex Electronics Japan acquisition, including the final allocation of purchase price are as follows (in thousands):
46
| | | | | Final Allocation |
Fair value of business combination: | | | | | |
Cash payments | | | | $ | 137,676 |
Less: cash acquired | | | | | (8,521) |
Total | | | | $ | 129,155 |
Identifiable assets acquired and liabilities assumed: | | | | | |
Other acquired assets | | | | $ | 10,339 |
Inventories | | | | | 8,203 |
Property, plant, and equipment | | | | | 18,206 |
Identifiable intangible assets | | | | | 51,400 |
Goodwill | | | | | 79,434 |
Liabilities assumed | | | | | (19,279) |
Deferred taxes | | | | | (19,148) |
Total | | | | $ | 129,155 |
The Company finalized the purchase price allocation during the quarter ended March 31, 2018.
The following table reflects the unaudited pro forma operating results of the Company for the years ended June 30, 2018 and 2017, which give effect to the acquisition of Standex Electronics Japan as if it had occurred at the beginning of each period presented. The pro forma information combines the historical financial results of the Company and Standex Electronics Japan, adjusted for changes in foreign exchange rates. The pro forma results are not necessarily indicative of the operating results that would have occurred had the acquisition been effective at the beginning of each period, nor are they intended to be indicative of results that may occur in the future. The pro forma information does not include the effects of any synergies related to the Standex Electronics Japan acquisition, transactions between the entities prior to acquisition, or the pre-acquisition impact of other businesses acquired by the Company during this period as they were not material to the Company’s historical results of operations.
| (Unaudited Pro Forma) |
| For the year ended June 30, |
In thousands | 2018 | | 2017 |
Net Sales | $ | 868,382 | | | $ | 805,235 |
Net Income | $ | 36,823 | | | $ | 57,810 |
Earnings per share: | | | |
Basic | $ | 2.90 | | | $ | 4.56 |
Diluted | $ | 2.88 | | | $ | 4.53 |
* Fiscal year 2017 unaudited pro-forma results have been recast as a result of the adoption of Accounting Standards Update (ASU) 2016-09, Improvements to Employee Share-Based Payment Accounting.
Pro forma earnings during the year ended June 30, 2018 were adjusted to exclude tax-affected acquisition-related costs incurred during the first quarter of $0.2 million.
Pro forma earnings during the year ended June 30, 2017 were adjusted to include expense of $1.8 million for amortization of intangible assets recognized at fair value, depreciation expense of $0.9 million for the fair value adjustment of the acquired fixed assets, and $0.8 million of interest expense associated with incremental borrowings under the Company’s Credit Facility. Pro forma earnings were also adjusted to exclude non-recurring acquisition-related costs of $4.2 million.
Horizon Scientific
During the second quarter of fiscal year 2017, the Company acquired Horizon Scientific, a supplier of laboratory refrigerators and freezers, as well as cryogenic equipment for the scientific, bio-medical and pharmaceutical markets. We believe the
47
acquisition of Horizon Scientific enhances Standex’s penetration of the refrigeration markets in the growing scientific sector. We have included the operating results of Horizon Scientific in our Food Service Equipment segment in our Condensed Consolidated Financial Statements.
The Company paid $24.7 million in cash, net of cash acquired, for 100% of the outstanding stock of Horizon Scientific. The purchase price was subject to cash and net working capital adjustments of $0.3 million which was paid in fiscal year 2018 along with deferred compensation of up to $8.0 million. The purchase price was allocated to the net tangible and identifiable intangible assets acquired and liabilities assumed based on their fair values on the closing date.
Intangible assets of $16.2 million have been recorded, consisting of $14.5 million of customer relationships which are expected to be amortized over a period of fifteen years, and $1.5$1.4 million of trademarks which are indefinite-lived. Acquiredindefinite lived, and $0.3 million of product order backlog which amortized during the current fiscal year. The goodwill of $34.8$6.7 million created by the transaction is not deductible for income tax purposes due to the naturepurposes.
The components of the transaction.fair value of the Horizon Scientific acquisition including the allocation of the purchase price are as follows (in thousands):
| | | | Final Allocation |
Fair value of business combination: | | | | | |
Cash payments | | | | $ | 26,457 |
Identified cash and net working capital adjustment | | | | | 341 |
Less: cash acquired | | | | | (1,797) |
Total | | | | $ | 25,001 |
Identifiable assets acquired and liabilities assumed: | | | | | |
Current assets | | | | $ | 4,863 |
Inventories | | | | | 4,470 |
Property, plant, and equipment | | | | | 1,616 |
Identifiable intangible assets | | | | | 16,150 |
Goodwill | | | | | 6,660 |
Liabilities assumed | | | | | (2,374) |
Deferred taxes | | | | | (6,384) |
Total | | | | $ | 25,001 |
| | | | | |
Transaction costs associated with this acquisition were immaterial. All transaction costs were recorded as general and administrative expense during the year ended June 30, 2017.
Northlake
On October 1, 2015, the Company acquired Northlake Engineering, Inc., (“Northlake”), a Wisconsin-based designer, manufacturer and distributor of high reliability electromagnetic products and solutions serving the North America power distribution and medical equipment markets. Northlake reports to our Electronics segment.
The Company paid $13.7 million in cash for 100% of the outstanding stock of Northlake and has recorded intangible assets of $6.8 million, consisting of $4.1 million of customer relationships which primarily are expected to be amortized over a period of twelve and half years, $2.4 million of trademarks which are indefinite-lived and $0.3 million of non-compete which are expected to amortized over a period of five years. Acquired goodwill of $5.1 million is deductible for income tax purposes. The Company finalized the purchase price allocation during the quarter endending June 30, 2015.2016.
The components of the fair value of the EngineticsNorthlake acquisition, including finalthe allocation of the purchase price and subsequent measurement period adjustments at June 30, 2015,2016, are as follows (in thousands):
48
| | Final |
Fair value of business combination: | | |
Cash payments | $ | 14,015 |
Less: cash acquired | | (315) |
Total | $ | 13,700 |
Identifiable assets acquired and liabilities assumed: | | |
Current assets | $ | 2,810 |
Property, plant, and equipment | | 1,407 |
Identifiable intangible assets | | 6,824 |
Goodwill | | 5,121 |
Other non-current assets | | 158 |
Liabilities assumed | | (2,620) |
Total | $ | 13,700 |
Acquisition-Related Costs
| | | | | | | | |
Enginetics | Preliminary Allocation |
Adjustments | | |
Final |
Fair value of business combination: | | | | | | | | |
Cash payments | $ | 55,021 | | $ | - | | $ | 55,021 |
Less: cash acquired | | (113) | | | - | | | (113) |
Total | $ | 54,908 | | $ | - | | $ | 54,908 |
Identifiable assets acquired and liabilities assumed: | | | | | | | |
Current Assets | $ | 12,350 | | $ | (216) | | $ | 12,134 |
Property, plant, and equipment | | 8,881 | | | (73) | | | 8,808 |
Identifiable intangible assets | | 10,600 | | | - | | | 10,600 |
Goodwill | | 32,797 | | | 1,993 | | | 34,790 |
Other non-current assets | | 158 | | | - | | | 158 |
Liabilities assumed | | (2,826) | | | (2,623) | | | (5,449) |
Deferred taxes | | (7,052) | | | 919 | | | (6,133) |
Total | $ | 54,908 | | $ | ��- | | $ | 54,908 |
On June 20, 2014,Acquisition-related costs include costs related to acquired businesses and other pending acquisitions. These costs consist of (i) deferred compensation and (ii) acquisition-related professional service fees and expenses, including financial advisory, legal, accounting, and other outside services incurred in connection with acquisition activities, and regulatory matters related to acquired entities. These costs do not include the Company acquired allamortization of the outstanding stock of Ultrafryer Systems, Inc. (“Ultrafryer”), a producer of commercial deep fryers for restaurant and commercial installations. This investment complements our Food Service Equipment Group’s product line and allows us to provide broader solutions to restaurant chains and commercial food service installations.
The Company paid $23.0 million in cash for 100% of the stock of Ultrafryer and has recordedacquired intangible assets or purchase accounting expenses, which we define as acquired backlog and the step-up of $7.6 million, consisting of $2.4 million of trademarks which are indefinite-lived, $4.9 million of customer relationships, and $0.3 million of other intangible assets which are expectedinventory to be amortized over a period of fifteen and threefair value.
Deferred compensation costs relate to five years, respectively. Acquired goodwill of $11.0 million is not deductible for income tax purposespayments due to the natureseller of Horizon Scientific for $2.8 million on the second anniversary and $5.6 million on the third anniversary of the transaction.closing date of the purchase. For the years ended June 30, 2018 and 2017, we recorded deferred compensation costs of $2.8 million and $2.1 million, respectively, for estimated deferred compensation earned by the Horizon Scientific seller. The payments are contingent on the seller remaining an employee of the Company with limited exceptions at each anniversary date.
Acquisition related costs of $5.7 million in 2017 consisted of $2.7 million of investment banker fees for services provided in connection with the Standex Electronics Japan transaction and $3.0 million for third-party due diligence expenses also related to Standex Electronics Japan and other acquisitions.
The components of the fair value of the Ultrafryer acquisition, including final allocation of the purchase price and subsequent measurement periods adjustments, related to the purchase of land and building, at June 30, 2015,acquisition-related costs are as follows (in(dollars in thousands):
| | | | | | | | | | |
Ultrafryer | | Preliminary Allocation at June 30, 2014 |
Adjustments | | |
Final |
Fair value of business combination: | | | | | | | | | |
| Cash payments | | $ | 20,745 | | $ | 2,241 | | $ | 22,986 |
| Less: cash acquired | | | (20) | | | - | | | (20) |
| Total | | $ | 20,725 | | $ | 2,241 | | $ | 22,966 |
Identifiable assets acquired and liabilities assumed: | | | | | | | | | |
| Current Assets | | $ | 5,871 | | $ | 50 | | $ | 5,921 |
| Property, plant, and equipment | | | 1,259 | | | 2,100 | | | 3,359 |
| Identifiable intangible assets | | | 7,612 | | | - | | | 7,612 |
| Goodwill | | | 10,930 | | | 91 | | | 11,021 |
| Liabilities assumed | | | (1,733) | | | - | | | (1,733) |
| Deferred taxes | | | (3,214) | | | - | | | (3,214) |
| Total | | $ | 20,725 | | $ | 2,241 | | $ | 22,966 |
| | June 30, 2018 | June 30, 2017 |
Deferred compensation arrangements | | $ | 2,810 | $ 2,108 |
Acquisition-related costs | | | 939 | 5,735 |
Total | $ | 3,749 | $ 7,843 |
3. INVENTORIES
Inventories are comprised of (in thousands):
| June 30 | | 2015 | | 2014 | | 2018 | | 2017 |
Raw materials | $ | 46,865 | | $ | 44,273 | $ | 58,878 | | $ | 53,313 |
Work in process | | 29,165 | | | 24,551 | | 33,507 | | | 28,110 |
Finished goods | | 32,275 | | | 28,241 | | 34,838 | | | 37,978 |
Total | $ | 108,305 | | $ | 97,065 | $ | 127,223 | | $ | 119,401 |
Distribution costs associated with the sale of inventory are recorded as a component of selling, general and administrative expenses and were $23.3$ 25.5 million, $20.8$20.4 million, and $20.1 million in 2015, 2014,2018, 2017, and 2013,2016, respectively.
49
4. PROPERTY, PLANT AND EQUIPMENT
Property, plant and equipment consist of the following (in thousands):
| June 30 | | | 2015 | | | 2014 | | | 2018 | | | 2017 |
Land, buildings and | | | | | | | | | | | | |
leasehold improvements | | $ | 71,517 | | $ | 78,596 | | $ | 83,459 | | $ | 78,048 |
Machinery, equipment and other | | | 181,394 | | | 171,238 | | | 217,749 | | | 199,419 |
Total | | | 252,911 | | | 249,834 | | | 301,208 | | | 277,467 |
Less accumulated depreciation | | | 144,375 | | | 153,137 | | | 156,638 | | | 144,307 |
Property, plant and equipment - net | | $ | 108,536 | | $ | 96,697 | | $ | 144,570 | | $ | 133,160 |
Depreciation expense for the years ended June 30, 2015, 2014,2018, 2017, and 20132016 totaled $13.4$18.8 million, $12.2$14.7 million, and $12.7$13.7 million, respectively.
During the fourth quarter of fiscal year 2015, the Company classified land and buildings valued at $1.9 million, net as available for sale within other current assets.
5. GOODWILL
Goodwill and certain indefinite-lived intangible assets are not amortized, but instead are tested for impairment at least annually and more frequently whenever events or changes in circumstances indicate that the fair value of the asset may be less than its carrying amount of the asset.amount. The Company’s annual test for impairment is performed using a May 31st measurement date.
The Company has identified our reporting units for impairment testing as its eleventwelve operating segments, which are aggregated into five reporting segments as disclosed in Note 1817 – Industry Segment Information.
As quoted market prices are not available for the Company’s reporting units, the fair value of the reporting units is determined using a discounted cash flow model (income approach). This method uses various assumptions that are specific to each individual reporting unit in order to determine the fair value. In addition, the Company compares the estimated aggregate fair value of its reporting units to its overall market capitalization.
While the Company believes that estimates of future cash flows are reasonable, changes in assumptions could significantly affect valuations and result in impairments in the future. The most significant assumption involved in the Company’s determination of fair value is the cash flow projections of each reporting unit. If the estimates of future cash flows for each reporting unit may be insufficient to support the carrying value of the reporting units, the Company will reassess its conclusions related to fair value and the recoverability of goodwill.
As a result ofWe completed our annual assessment, the Companyimpairment testing as of May 31, 2018, and determined that the fair value of theeach of its reporting units and indefinite-lived intangible assets substantially exceeded theireach unit’s respective carrying values. Therefore,value, therefore, no impairment charges were recorded in connection with our assessmentstesting and assessment during 20152018 and 2014.2017.
Changes to goodwill during the years ended June 30, 20152018 and 20142017 are as follows (in thousands):
| | | 2015 | | | 2014 | | 2018 | | | 2017 |
Balance at beginning of year | $ | 143,904 | | $ | 129,844 | $ | 260,629 | | $ | 175,293 |
Accumulated impairment losses | | 17,939 | | | 17,939 | | 17,939 | | | 17,939 |
Balance at beginning of year, net | | 125,965 | | | 111,905 | | 242,690 | | | 157,354 |
Acquisitions | | 34,881 | | | 12,132 | | 7,655 | | | 85,561 |
Foreign currency translation | | (6,114) | | | 1,928 | | 1,417 | | | (225) |
Balance at end of year | $ | 251,762 | | $ | 242,690 |
50
6. INTANGIBLE ASSETS
Intangible assets consist of the following (in thousands):
| | | | | Tradenames | | | | | | | | | |
| | Customer Relationships | | | (Indefinite-lived) | | | Developed Technology | | | Other | | | Total |
June 30, 2018 | | | | | | | | | | | | | | |
Cost | $ | 66,802 | | $ | 20,396 | | $ | 48,281 | | $ | 4,927 | | $ | 140,406 |
Accumulated amortization | | (33,917) | | | - | | | (4,709) | | | (3,705) | | | (42,331) |
Balance, June 30, 2018 | $ | 32,885 | | $ | 20,396 | | $ | 43,572 | | $ | 1,222 | | $ | 98,075 |
| | | | | | | | | | | | | | |
June 30, 2017 | | | | | | | | | | | | | | |
Cost | $ | 64,247 | | $ | 18,715 | | $ | 47,586 | | $ | 4,503 | | $ | 135,051 |
Accumulated amortization | | (28,764) | | | - | | | (826) | | | (2,958) | | | (32,548) |
Balance, June 30, 2017 | $ | 35,483 | | $ | 18,715 | | $ | 46,760 | | $ | 1,545 | | $ | 102,503 |
| | | | | | | | | | | |
| | Customer | | | Trademarks | | | | | | |
| | Relationships | | | (Indefinite-lived) | | | Other | | | Total |
June 30, 2015 | | | | | | | | | | | |
Cost | $ | 43,493 | | $ | 15,514 | | $ | 4,096 | | $ | 63,103 |
Accumulated amortization | | (22,628) | | | - | | | (2,427) | | | (25,055) |
Balance, June 30, 2015 | $ | 20,865 | | $ | 15,514 | | $ | 1,669 | | $ | 38,048 |
| | | | | | | | | | | |
June 30, 2014 | | | | | | | | | | | |
Cost | $ | 36,145 | | $ | 14,508 | | $ | 4,061 | | $ | 54,714 |
Accumulated amortization | | (21,137) | | | - | | | (2,087) | | | (23,224) |
Balance, June 30, 2014 | $ | 15,008 | | $ | 14,508 | | $ | 1,974 | | $ | 31,490 |
Amortization expense from continuing operations for the years ended June 30, 2015, 2014,2018, 2017, and 20132016 totaled $2.8$9.0 million, $2.6$5.0 million, and $2.6$3.6 million, respectively. At June 30, 2015,2018, aggregate amortization expense is estimated to be $3.1 million in fiscal 2016, $3.1 million in fiscal 2017, $2.9 million in fiscal 2018, $2.7$9.0 million in fiscal 2019, $2.3$8.5 million in fiscal 2020, $7.9 million in fiscal 2021, $7.4 million in fiscal 2022, $6.7 million in fiscal 2023, and $8.2$38.2 million thereafter.
7. DEBT
Long-term debt is comprised of the following at June 30 (in thousands):
| | 2018 | | | 2017 |
Bank credit agreements | $ | 194,000 | | $ | 192,500 |
Other | | - | | | 6 |
Total funded debt | | 194,000 | | | 192,506 |
Issuance Cost | | (228) | | | (530) |
Total long-term debt | $ | 193,772 | | $ | 191,976 |
| | | | | |
| | 2015 | | | 2014 |
Bank credit agreements | $ | 103,000 | | $ | 45,000 |
Other | | 31 | | | 56 |
Total long-term debt | $ | 103,031 | | $ | 45,056 |
Long-term debt is due as follows (in thousands):
2019 | $ | - |
2020 (matures December 2019) | | 194,000 |
2021 | | - |
2022 | | - |
2023 | | - |
Thereafter | | - |
Funded Debt | | 194,000 |
Issuance costs | | (228) |
Debt, net issuance cost | $ | 193,772 |
| | |
2016 | $ | 12 |
2017 | | 12 |
2018 | | 7 |
2019 | | - |
2020 | | 103,000 |
Thereafter | | - |
Bank Credit Agreements
During fiscal year 2015, the Company entered into an Amended and Restated Credit Agreement (“Credit Facility”, or “facility”). This five-year Credit Facility expires in December 2019 and has a borrowing limit of $400 million, which can be increased by an amount of up to $100 million, in accordance with specified conditions contained in the agreement. The facility also includes a $10 million sublimit for swing line loans and a $30 million sublimit for letters of credit. The facility amends and restates a previously existing $225 million revolving credit agreement, which was scheduled to expire in January 2017.
Under the terms of the Credit Agreement, we will pay a variable rate of interest and a commitment fee on borrowed amounts as well as a commitment fee on unused amounts under the facility. The amount of the commitment fee will depend upon both the undrawn amount remaining available under the facility and the Company’s funded debt to EBITDA (as defined in
51
the agreement) ratio at the last day of each quarter. As our funded debt to EBITDA ratio increases, the commitment fee will increase.
Funds borrowed under the facility may be used for the repayment of debt, working capital, capital expenditures, acquisitions (so long as certain conditions, including a specified funded debt to EBITDA leverage ratio is maintained), and other general corporate purposes. As of June 30, 2015,2018, the Company had the ability to borrow $248.3$198.1 million under the facility based on our current EBITDA. The facility contains customary representations, warranties and restrictive covenants, as well as specific financial covenants which the Company was compliant with as of June 30, 2015.2018. The Company’s current financial covenants under the facility are as follows:
Interest Coverage Ratio - The Company is required to maintain a ratio of Earnings Before Interest and Taxes, as Adjusted (“Adjusted EBIT per the Credit Agreement”), to interest expense for the trailing twelve months of at least 3.0:1. Adjusted EBIT per the Credit Agreement specifically excludes extraordinary and certain other defined items such as cash restructuring and acquisition-related charges up to $7.5 million, and unlimited non-cash charges including gains or losses on sale of property and goodwill adjustments. At June 30, 2015,2018, the Company’s Interest Coverage Ratio was 26.99:11.40:1.
Leverage Ratio - The Company’s ratio of funded debt to trailing twelve month Adjusted EBITDA per the credit agreement, calculated as Adjusted EBIT per the Credit Agreement plus depreciation and amortization, may not exceed 3.5:1. At June 30, 2015,2018 the Company’s Leverage Ratio was 1.08:1.67:1.
As of June 30, 2015,2018, we had borrowings under our facility of $103.0$194 million and the effective rate of interest for outstanding borrowings under the facility was 1.46%3.29%. Our primary cash requirements in addition to day-to-day operating needs include interest payments, capital expenditures, and dividends. Our primary sources of cash for these requirements are cash flows from continuing operations and borrowings under the facility.
In order to manage our interest rate exposure, we are party to $35.0$75.0 million of active floating to fixed rate swaps. These swaps convert our interest payments from LIBOR to a weighted average rate of 1.63%1.74%.
Other Long-Term Borrowings
At June 30, 2015,2018, and 2014,2017, the Company had standby letter of credit sub-facility outstanding, primarily for insurance and trade financing purposes of $7.2$7.9 million and $11.3$8.9 million, respectively.
8. ACCRUED LIABILITIES
Accrued expenses recorded in our Consolidated Balance Sheets at June 30, consist of the following (in thousands):
| | | 2015 | | 2014 | | 2018 | | | 2017 |
Payroll and employee benefits | $ | 26,329 | | $ | 26,736 | $ | 31,749 | | $ | 28,522 |
Workers' compensation | | 2,586 | | | 2,610 | | 2,728 | | | 2,399 |
Warranty | | 8,066 | | | 7,401 | | 9,356 | | | 9,243 |
Fair value of derivatives | | | 2,853 | | | 3,014 |
Other | | 10,761 | | | 14,291 | | 18,889 | | | 15,516 |
Total | $ | 47,742 | | $ | 51,038 | $ | 65,575 | | $ | 58,694 |
The increase in other liabilities during 2018 compared to 2017 is primarily due to the inclusion of $1.2 million of other liabilities from acquired entities.
9. DERIVATIVE FINANCIAL INSTRUMENTS
Interest Rate Swaps
In order to manage our interest rate exposure, we are party to $35.0$75.0 million of active floating to fixed rate swaps. These swaps convert our interest payments from LIBOR to a weighted average rate of 1.63%1.74% at June 30, 2015.2018.
52
The fair value of the swaps recognized in accrued liabilities and in other comprehensive income (loss) at June 30, 20152018 and 20142017 is as follows (in thousands):
| | | | | | | | | |
| | | | | | Fair Value at June 30, |
Effective Date | | Notional Amount | Fixed Interest Rate | Maturity | |
2015 | | |
2014 |
June 1, 2010 | $ | 5,000 | 2.495% | May 26, 2015 | $ | - | | $ | (108) |
June 1, 2010 | | 5,000 | 2.495% | May 26, 2015 | | - | | | (108) |
June 4, 2010 | | 10,000 | 2.395% | May 26, 2015 | | - | | | (206) |
June 9, 2010 | | 5,000 | 2.34% | May 26, 2015 | | - | | | (100) |
June 18, 2010 | | 5,000 | 2.38% | May 26, 2015 | | - | | | (103) |
September 21, 2011 | | 5,000 | 1.60% | September 22, 2014 | | - | | | (18) |
March 15, 2012 | | 10,000 | 2.75% | March 15, 2016 | | (186) | | | (418) |
December 19, 2014 | | 20,000 | 1.18% | December 19, 2017 | | (140) | | | - |
December 19, 2014 | | 5,000 | 1.20% | December 19, 2017 | | (36) | | | - |
December 19, 2015 | | 10,000 | 2.01% | December 19, 2019 | | (150) | | | - |
December 18, 2015 | | 15,000 | 1.46% | December 19, 2018 | | (39) | | | - |
| | | | | $ | (551) | | $ | (1,061) |
| | | | | | Fair Value at June 30, |
Effective Date | | Notional Amount | Fixed Interest Rate | Maturity | | 2018 | | | 2017 |
December 19, 2014 | | 20,000 | 1.18% | December 19, 2017 | $ | - | | $ | 8 |
December 19, 2014 | | 5,000 | 1.20% | December 19, 2017 | | - | | | 1 |
December 18, 2015 | | 15,000 | 1.46% | December 19, 2018 | | 55 | | | (1) |
December 19, 2015 | | 10,000 | 2.01% | December 19, 2019 | | 74 | | | (106) |
May 24, 2017 | | 25,000 | 1.88% | April 24, 2022 | | 764 | | | (60) |
May 24, 2017 | | 25,000 | 1.67% | May 24, 2020 | | 432 | | | (23) |
| | | | | $ | 1,325 | | $ | (181) |
The Company reported no losses for the years ended June 30, 2015, 2014,2018, 2017, and 2013,2016, as a result of hedge ineffectiveness. Future changes in these swap arrangements, including termination of the agreements, may result in a reclassification of any gain or loss reported in accumulated other comprehensive income (loss) into earnings as an adjustment to interest expense. Accumulated other comprehensive income (loss) related to these instruments is being amortized into interest expense concurrent with the hedged exposure.
Foreign Exchange Contracts
Forward foreign currency exchange contracts are used to limit the impact of currency fluctuations on certain anticipated foreign cash flows, such as foreign purchases of materials and loan payments to and frombetween subsidiaries. The Company enters into such contracts for hedging purposes only. For hedges of intercompany loan payments, theThe Company has not elected hedge accounting due todesignated certain of these currency contracts as hedges, and changes in the general short-term nature and predictabilityfair value of these contracts are recognized in other comprehensive income until the transactions, and records derivative gains and losses directly to the consolidated statement of operations.hedged items are recognized in earnings. Hedge ineffectiveness, if any, associated with these contracts will be reported in net income. At June 30, 20152018 and 20142017, the Company had outstanding forward contracts related to hedges of intercompany loans with net unrealized gain / (losses) of $0.7$(2.9) million and ($1.2)$(2.8) million, respectively, which approximate the unrealized gains or losses on the related loans. The contracts have maturity dates ranging from 2016-2019,2018-2023, which correspond to the related intercompany loans. The notional amounts of these instruments, by currency in thousands, are as follows:
| Currency | | 2015 | | 2014 | | 2018 | | 2017 |
USD | | | 64,558 | | 73,000 |
Euro | | 10,134,797 | | 24,289,064 | | 21,300 | | 21,335 |
Canadian Dollar | | - | | 3,600,000 | |
Pound Sterling | | 1,730,542 | | 3,975,192 | | 6,826 | | 6,962 |
Peso | | | 54,000 | | 54,000 |
Canadian | | | 20,600 | | 20,600 |
The table below presents the fair value of derivative financial instruments as well as their classification on the balance sheet at June 30, (in thousands):
| | Asset Derivatives | Asset Derivatives |
| 2015 | | 2014 | 2018 | | 2017 |
Derivative designated as | Balance | | | | Balance | | | | Balance | | | | Balance | | |
hedging instruments | Sheet | | | | Sheet | | | | Sheet | | | | Sheet | | |
| Line Item | | Fair Value | | Line Item | | | Fair Value | Line Item | | Fair Value | | Line Item | | Fair Value |
Interest rate swaps | | Other Assets | | $ | 1,325 | | Accrued Liabilities | | $ | - |
Foreign exchange contracts | Other Assets | | $ | 844 | | Other Assets | | $ | 356 | Other Assets | | | 1,357 | | Accrued Liabilities | | | - |
| | | | $ | 2,682 | | | | $ | - |
53
| | | | | | | | | |
| Liability Derivatives |
| 2015 | | 2014 |
Derivative designated as | Balance | | | | | Balance | | | |
hedging instruments | Sheet | | | | | Sheet | | | |
| Line Item | | | Fair Value | | Line Item | | | Fair Value |
Interest rate swaps | Accrued Liabilities | | $ | 551 | | Accrued Liabilities | | $ | 1,061 |
Foreign exchange contracts | Accrued Liabilities | | | 193 | | Accrued Liabilities | | | 1,552 |
| | | $ | 744 | | | | $ | 2,613 |
| Liability Derivatives |
| 2018 | | 2017 |
Derivative designated as | Balance | | | | | Balance | | | |
hedging instruments | Sheet | | | | | Sheet | | | |
| Line Item | | | Fair Value | | Line Item | | | Fair Value |
Interest rate swaps | Accrued Liabilities | | $ | - | | Accrued Liabilities | | $ | 181 |
Foreign exchange contracts | Accrued Liabilities | | | 4,204 | | Accrued Liabilities | | | 2,833 |
| | | $ | 4,204 | | | | $ | 3,014 |
The table below presents the amount of gain (loss) recognized in comprehensive income on our derivative financial instruments (effective portion) designated as hedging instruments and their classification within comprehensive income for the periods ended (in thousands):
| | | | 2015 | | | 2014 | | | 2013 | | | 2018 | | | 2017 | | | 2016 |
Interest rate swaps | | $ | (533) | | $ | (194) | | $ | (195) | | $ | 1,367 | | $ | 282 | | $ | (743) |
Foreign exchange contracts | | | (154) | | | - | | | - | | | 1,174 | | | (3,178) | | | (267) |
| | $ | (687) | | $ | (194) | | $ | (195) | | $ | 2,541 | | $ | (2,896) | | $ | (1,010) |
The table below presents the amount reclassified from accumulated other comprehensive income (loss) to Net Incomenet income for the periods ended (in thousands):
| Details about Accumulated | | | | | | | | | | | Affected line item | | | | | | | | | | | Affected line item |
Other Comprehensive | | | | | | | | | | | in the Statements | | | | | | | | | | | in the Statements |
Income (Loss) Components | | | 2015 | | | 2014 | | | 2013 | | of Operations | | | 2018 | | | 2017 | | | 2016 | | of Operations |
Interest rate swaps | | $ | 1,034 | | $ | 1,031 | | $ | 1,050 | | Interest expense | | $ | 171 | | $ | 399 | | $ | 567 | | Interest expense |
Foreign exchange contracts | | | - | | | - | | | - | | Cost of goods sold | | | - | | | 75 | | | 112 | | Cost of goods sold |
Foreign exchange contracts | | | | 121 | | | (861) | | | - | | Interest expense |
| | $ | 1,034 | | $ | 1,031 | | $ | 1,050 | | | | $ | 292 | | $ | (387) | | $ | 679 | | |
10. INCOME TAXES
On December 22, 2017, the Tax Cuts and Jobs Act (the “Act” or “TCJA”) was passed which, among other things, reduces the federal corporate tax rate to 21.0% effective for taxable years starting on or after January 1, 2018. For the year ending June 30, 2018, the Company recorded federal taxes using a blended federal rate of 28.0%. During the quarter ended December 31, 2017 (Q2 FY2018), the Company reported provisional amounts for the toll/transition tax and the change in the U.S. deferred tax. Pursuant toSEC guidance provided in Staff Accounting Bulletin No. 118, the Company is utilizing the measurement period approach for the income tax effects of tax reform for which the accounting is incomplete and expects to complete process in FY19 as the FY18 tax returns are finalized.
During the fourth quarter of 2018, the Company updated the impact of the tax law as follows:
The Company recorded provision for income taxes of $56 thousand during the quarter due to a revaluation of the Company's estimated deferred tax assets as of December 31, 2017. The increase was a result of a change in the current year activity from the prior quarter for a total year-to date impact of approximately $1.34 million.
The Company has recorded a tax benefit of approximately $1.49 million to its provision for income taxes during the quarter related to a mandatory deemed repatriation of foreign earnings. This amount includes a state tax benefit of $.54 million based on updated state guidance for a year-to date impact of approximately $11.7 million. This amount may change when the Company finalizes the calculation of post-1986 foreign E&P previously deferred from U.S. federal taxation. In addition, further interpretations of the TCJA from U.S. federal and state governments and regulatory organizations may change the provisional tax liability or the accounting treatment of the provisional tax liability. Under the Act, the Company is permitted to pay this tax over an eight-year period commencing with the due date of the 2018 tax return.
Since these provisions during the quarter are still based on estimates, the Company will continue to measure the impact of these areas and record any changes in subsequent quarters when information and guidance become available.
54
Other law changes implemented by the Act such as the repeal of the Section 199 manufacturing deduction, changes to the calculation for Section 162(m) executive compensation deduction, interest deduction limitation and Global Intangible Low Taxed Income (GILTI), and others will not have any impact on the Company until the fiscal year ending June 30, 2019.As allowed under US GAAP, the Company has elected to treat any taxes due on future U.S. inclusions in taxable income under the GILTI provision as a current-period expense when incurred. The Company will continue to monitor guidance regarding these changes for how it will impact the financial statements in later periods.
In addition, as a result of the Tax Reform change on US federal taxation on cash repatriation,current US debts levels and updated cash flow planning, the Company has changed its position on reinvestment of foreign earnings in several foreign jurisdictions. As a result, the Company has recorded a tax provision of approximately $7.8 million during the quarter related to the anticipated foreign withholding taxes and state taxes on future cash repatriation.
The components of income from continuing operations before income taxes are as follows (in thousands):
| | | 2015 | | 2014 | | 2013 | | 2018 | | 2017 | | 2016 |
U.S. Operations | $ | 33,161 | | $ | 26,965 | | $ | 35,805 | $ | 7,525 | | $ | 16,257 | | $ | 23,996 |
Non-U.S. Operations | | 42,956 | | | 40,838 | | | 23,493 | | 69,727 | | | 45,675 | | | 44,529 |
Total | $ | 76,117 | | $ | 67,803 | | $ | 59,298 | $ | 77,252 | | $ | 61,932 | | $ | 68,525 |
The Company utilizes the asset and liability method of accounting for income taxes. Deferred income taxes are determined based on the estimated future tax effects of differences between the financial and tax bases of assets and liabilities given the provisions of the enacted tax laws. The components of the provision for income taxes on continuing operations are(in thousands) were as shown below (in thousands):below:
| | | 2015 | | 2014 | | 2013 | | 2018 | | 2017 | | 2016 |
Current: | | | | | | | | | | | | |
Federal | $ | 9,195 | | $ | 9,653 | | $ | 9,099 | $ | 11,057 | | $ | 2,229 | | $ | 11,014 |
State | | 556 | | 415 | | 1,382 | | 498 | | 230 | | 523 |
Non-U.S. | | 11,372 | | | 11,329 | | | 7,179 | | 21,674 | | | 13,017 | | | 11,514 |
Total Current | | 21,123 | | | 21,397 | | | 17,660 | | 33,229 | | | 15,476 | | | 23,051 |
| | | | | | | |
Deferred: | | | | | | | | | | | | | | |
Federal | $ | 556 | | $ | (2,017) | | $ | (454) | $ | 2,012 | | $ | 2,141 | | $ | (5,214) |
State | | (495) | | (376) | | 18 | | 1,091 | | (290) | | (1,060) |
Non-U.S. | | (310) | | | (950) | | | (1,980) | | 4,288 | | | (1,972) | | | (482) |
Total Deferred | | (249) | | | (3,343) | | | (2,416) | | 7,391 | | | (121) | | | (6,756) |
Total | $ | 20,874 | | $ | 18,054 | | $ | 15,244 | $ | 40,620 | | $ | 15,355 | | $ | 16,295 |
The following is aA reconciliation from the U.S. Federal income tax rate on continuing operations to the total tax provision is as follows (in thousands):follows:
| | 2015 | | 2014 | | 2013 | 2018 | | 2017 | | 2016 |
Provision at statutory tax rate | 35.0% | | 35.0% | | 35.0% | 28.0% | | 35.0% | | 35.0% |
State taxes | 0.1% | | 0.0% | | 1.5% | 1.5% | | (0.1%) | | (0.5%) |
Impact of foreign operations | -5.0% | | -5.6% | | -6.5% | (0.9%) | | (8.0%) | | (6.7%) |
Federal tax credits | -1.2% | | -0.7% | | -2.2% | (1.2%) | | (1.3%) | | (1.8%) |
Life insurance proceeds | 0.0% | | -1.7% | | 0.0% | |
Tax Reform | | 16.7% | | 0.0% | | 0.0% |
Cash repatriation | | 9.5% | | 0.0% | | 0.0% |
Contributions, net | | 0.0% | | 0.0% | | (1.3%) |
Other | -1.5% | | -0.4% | | -2.1% | (1.0%) | | (0.8%) | | (0.9%) |
Effective income tax provision | 27.4% | | 26.6% | | 25.7% | 52.6% | | 24.8% | | 23.8% |
Due to the effective date of the Act’s rate reduction on our fiscal year, the Company recorded a blended statutory rate for the year ended June 30, 2018.
Changes in the effective tax rates from period to period may be significant as they depend on many factors including, but not limited to, size of the Company’s income or loss and any one-time activities occurring during the period.
55
The Company's income tax provision from continuing operations for the fiscal year ended June 30, 2018 was impacted by the following items: (i) a tax provision related to the impact of the Sec. 965 toll tax of $11.7 million, (ii) a tax provision related to a revaluation of deferred taxes due to the federal rate reduction of $1.3 million, and (iii) a tax provision related to expected foreign withholding taxes on cash repatriation of $7.8 million.
The Company's income tax provision from continuing operations for the fiscal year ended June 30, 20152017 was impacted by the following items: (i) a benefit of $0.5$0.6 million related to the R&D tax credit, that expired during the fiscal year on December 31, and (ii) a benefit of $4.0$5.3 million due to the mix of income earned in jurisdictions with beneficial tax rates.
The Company's income tax provision from continuing operations for the fiscal year ended June 30, 20142016 was impacted by the following items: (i) a net benefit of $0.5$0.9 million related to a bargain-sale of idle property to a charitable organization, and (ii) a benefit of $0.7 million related to the R&D tax credit, that expired during the fiscal year on December 31, (ii) a benefit of $0.5 million related to a decrease in the statutory tax rate in the United Kingdom on prior period deferred tax liabilities recorded during the first quarter during the fiscal year,and (iii) a benefit of $1.1 million due to non-taxable life insurance proceeds received in the third quarter and (iv) a benefit of $3.8$4.9 million due to the mix of income earned in jurisdictions with beneficial tax rates.
The Company's income tax provision from continuing operations for the fiscal year ended June 30, 2013 was impacted by the following items: (i) a benefit of $0.4 million related to the retroactive extension of the R&D credit recorded during the third quarter, (ii) a benefit of $0.3 million related to a decrease in the statutory tax rate in the United Kingdom on prior period deferred tax liabilities recorded during the first and fourth quarters, (iii) a benefit of $1.0 million from the reversal of a deferred tax liability that was determined to be no longer required during the third quarter and (iv) a benefit of $2.8 million due to the mix of income earned in jurisdictions with beneficial tax rates.
Significant components of the Company’s deferred income taxes are as follows (in thousands):
| | | 2015 | | 2014 | | 2018 | | | 2017 |
Deferred tax liabilities: | | | | | | | | |
Depreciation and amortization | $ | (31,126) | | $ | (20,934) | $ | (39,775) | | $ | (55,041) |
Withholding Taxes | | | (7,833) | | - |
Other | | | - | | | - |
Total deferred tax liability | $ | (31,126) | | $ | (20,934) | $ | (47,608) | | $ | (55,041) |
| | | | | | | | |
Deferred tax assets: | | | | | | | | |
Accrued compensation | $ | 3,911 | | $ | 4,463 | $ | 2,657 | | $ | 4,127 |
Accrued expenses and reserves | | 6,680 | | 3,040 | | 4,808 | | 6,886 |
Pension | | 19,624 | | 10,975 | | 13,522 | | 26,309 |
Inventory | | 2,066 | | 1,549 | | 1,613 | | 2,677 |
Other | | 1,741 | | 758 | | 452 | | 939 |
Net operating loss and credit carry forwards | | 3,983 | | | 3,685 | | 8,668 | | | 6,773 |
Total deferred tax asset | $ | 38,005 | | $ | 24,470 | $ | 31,720 | | $ | 47,711 |
| | | | | | | | |
Less: Valuation allowance | | (656) | | | (530) | | (3,482) | | | (1,530) |
Net deferred tax asset (liability) | $ | 6,223 | | $ | 3,006 | $ | (19,370) | | $ | (8,860) |
The Company estimates the degree to which deferred tax assets, including net operating loss and credit carry forwards will result in a benefit based on expected profitability by tax jurisdiction and provides a valuation allowance for tax assets and loss carry forwards that it believes will more likely than not go unrealized. The valuation allowance at June 30, 20152018 applies to state and foreign loss carry forwards, which management has concluded that it is more likely than not that these tax benefits will not be realized. The increase (decrease) in the valuation allowance from the prior year was $0.12 million, less than $0.1 million,due to the current year activity in those same state and ($0.3) million in 2015, 2014, and 2013, respectively.foreign loss jurisdictions.
As of June 30, 2015,2018, the Company had gross state net operating loss ("NOL") and credit carry forwards of approximately $43.3$61.6 million and $2.2$2.5 million, respectively, which may be available to offset future state income tax liabilities and expire at various dates from 20152018 through 2034.2037. In addition, the Company had foreign NOL carry forwards of approximately $2.7 million, $1.7$3.1million, $2.4 million of which carry forward indefinitely and $1.0$0.7 million that carry forward for 10 years.
The Company’s
Under ASU 2016-09,Improvements to Employee Share-Based Payment Accounting, all excess tax benefits and tax deficiencies are recognized as income taxes currently payabletax expense or benefit in the income statement. Accordingly, we recorded discrete income tax benefits in the consolidated statements of income of $395 during the fiscal year ended June 30, 2018, for federal and state purposes have been reduced by the benefitexcess tax benefits related to equity compensation.
As a result of the tax reform law passed on December 22, 2017,undistributed foreign earnings were subject to the U.S. one-time mandatory transition tax and are eligible to be repatriated to the U.S. without additional U.S. tax under the Tax Act and companies are now eligible to receive 100 percent dividend received deduction in excess of recognized compensation cost from employee stock compensation transactions. The provision for income taxes that is currently payable hasforeign dividends. However, the permanent reinvestment assertion must still be assessed and made regarding potential liabilities for foreign withholding taxes. Historically, we have not been adjusted by approximately $2.1 million and $1.7 million of such benefits of the Company that have been allocated to additional paid in capital in 2015 and 2014, respectively.
A provision has not been made for U.S. or additional non-U.S.provided deferred taxes on $160.2 million ofthe cumulative undistributed earnings of internationalour foreign subsidiaries as theses were deemed to be permanently reinvested. As of June 30, 2018, we reassessed our position regarding our permanent
56
reinvestment in various foreign jurisdictions. As a result, we determined that couldassessment of previously undistributed earnings of certain foreign subsidiaries no longer meet the requirements for indefinite reinvestment under applicable accounting guidance. Therefore, we recognizeddeferred tax liabilities of approximately $4.2 million that relate to foreign withholding taxes on these earnings. In addition, we have determined that current earnings from several foreign jurisdictions will no longer be subjectreinvested. As such the Company has recorded deferred tax liabilities of approximately $3.1 million related to taxation if remitted to the U.S.foreign withholding taxes on these current year earnings. It is not practicableexpected deferred tax liabilities will continue to estimatebe recorded on current earnings in future periods from these jurisdictions. Lastly, the amount of tax that might be payableCompany maintains its permanent reinvestment on the remaining undistributed earnings. Our intention is to reinvestearnings in certain foreign jurisdictions. If repatriated, these earnings permanently or to repatriate the earnings only when it iswould generate a tax effective to do so. Accordingly, we believe that U.S. tax on any earnings that might be repatriated would be partially offset by U.S. foreign tax credits.
liability of approximately $1.8 million.
The total provision for income taxes included in the consolidated financial statements was as follows (in thousands):
| | | 2015 | | 2014 | | 2013 | | 2018 | | | 2017 | | | 2016 |
Continuing operations | $ | 20,874 | | $ | 18,054 | | $ | 15,244 | $ | 40,620 | | $ | 15,355 | | $ | 16,295 |
Discontinued operations | | (259) | | | (3,692) | | | 482 | | (15) | | | (27) | | | (55) |
| $ | 20,615 | | $ | 14,362 | | $ | 15,726 | |
Total Provision | | $ | 40,605 | | $ | 15,328 | | $ | 16,240 |
The changes in the amount of gross unrecognized tax benefits during 2015, 20142018, 2017 and 20132016 were as follows (in thousands):
| | | 2015 | | 2014 | | 2013 | | 2018 | | | 2017 | | | 2016 |
Beginning Balance | $ | 1,033 | | $ | 1,286 | | $ | 1,298 | $ | 2,991 | | $ | 2,978 | | $ | 1,054 |
Additions based on tax positions related to the current year | | 17 | | 25 | | 77 | | 12 | | 12 | | 2,125 |
Additions for tax positions of prior years | | 4 | | - | | 19 | | - | | 1 | | - |
Reductions for tax positions of prior years | | - | | | (278) | | | (108) | | - | | | - | | | (201) |
Ending Balance | $ | 1,054 | | $ | 1,033 | | $ | 1,286 | $ | 3,003 | | $ | 2,991 | | $ | 2,978 |
If the unrecognized tax benefits in the table above were recognized in a future period, $0.6$2.5 million of the unrecognized tax benefit would impact the Company’s effective tax rate.
Within the next twelve months, the statute of limitations will close in various U.S., state and non-U.S. jurisdictions. As a result, it is reasonably expected that net unrecognized tax benefits from these various jurisdictions would be recognized within the next twelve months. The recognition of these tax benefits is not expected to have a material impact to the Company's financial statements. The Company does not reasonably expect any other significant changes in the next twelve months. The following tax years, in the major tax jurisdictions noted, are open for assessment or refund:
| |
Country | Years Ending June 30, |
United States | 20122015 to 20152018
|
Canada | 20122014 to 20152018
|
Germany | 20122016 to 20152018
|
Ireland | 20122016 to 20152018
|
Portugal | 20122014 to 20152018
|
United Kingdom | 20122016 to 20152018
|
The Company’s policy is to include interest expense and penalties related to unrecognized tax benefits within the provision for income taxes on the consolidated statements of operations. At both June 30, 20152018 and June 30, 2014,2017, the Companycompany had less than $0.1 million$0.1million for accrued interest expense on unrecognized tax benefits.
11. COMMITMENTS
The Company leases certain property and equipment under agreements with initial terms ranging from one to twentysixty years. Rental expense related to continuing operations for the years ended June 30, 2015, 2014,2018, 2017, and 20132016 was approximately $6.1$10.2 million, $5.5$8.0 million and $4.9$6.6 million, respectively.
57
The gross minimum annual rental commitments under non-cancelable operating leases, principally real-estate at June 30, 2015:2018`:
| (in thousands) | (in thousands) | | Lease | | | Sublease | | Net obligation | (in thousands) | | Lease | | | Sublease | | Net obligation |
2016 | | $ | 6,996 | | $ | 378 | | $ | 6,618 | |
2017 | | | 5,464 | | | 364 | | 5,100 | |
2018 | | | 3,715 | | | 87 | | 3,628 | |
2019 | | | 2,854 | | | - | | 2,854 | | | 10,202 | | | 329 | | 9,873 |
2020 | | | 2,201 | | | - | | 2,201 | | | 8,704 | | | 336 | | 8,368 |
2021 | | | | 7,923 | | | 346 | | 7,577 |
2022 | | | | 7,095 | | | 356 | | 6,739 |
2023 | | | | 7,204 | | | 367 | | 6,837 |
Thereafter | | | 8,247 | | | - | | 8,247 | | | 15,995 | | | 2,670 | | 13,325 |
| | | | | | | | | |
12. CONTINGENCIES
From time to time, the Company is subject to various claims and legal proceedings, including claims related to environmental remediation, either asserted or unasserted, that arise in the ordinary course of business. While the outcome of these proceedings and claims cannot be predicted with certainty, the Company’s management does not believe that the outcome of any of the currently existing legal matters will have a material impact on the Company’s consolidated financial position, results of operations or cash flow. The Company accrues for losses related to a claim or litigation when the Company’s management considers a potential loss probable and can reasonably estimate such potential loss.
13. STOCK-BASED COMPENSATION AND PURCHASE PLANS
Stock-Based Compensation Plans
Under incentive compensation plans, the Company is authorized to make grants of stock options, restricted stock and performance share units to provide equity incentive compensation to key employees and directors. In fiscal 2005, the Company began granting stock awards instead of stock options. The stock award program offers employees and directors the opportunity to earn shares of our stock over time, rather than options that give the employees and directors the right to purchase stock at a set price. The Company has stock plans for directors, officers and certain key employees.
Total compensation cost recognized in income for equity based compensation awards was $3.8$4.9 million, $6.6$5.0 million, and $3.3$5.1 million for the years ended June 30, 2015, 20142018, 2017, and 2013,2016, respectively, primarily within Selling, General, and Administrative Expenses. The total income tax benefit recognized in the consolidated statement of operations for equity-based compensation plans was $1.3$1.2 million, $2.3$1.9 million, and $1.2$1.8 million for the years ended June 30, 2015, 20142018, 2017 and 2013,2016, respectively.
390,394There were 157,921 shares of common stock were reserved for issuance under various compensation plans at June 30, 2015.2018.
Restricted Stock Awards
The Company may award shares of restricted stock to eligible employees and non-employee directors of the Company at no cost, giving them in most instances all of the rights of stockholders, except that they may not sell, assign, pledge or otherwise encumber such shares and rights during the restriction period. Such shares and rights are subject to forfeiture if certain employment conditions are not met. During the restriction period, recipients of the shares are entitled to dividend equivalents on such shares, providing that such shares are not forfeited. Dividends are accumulated and paid out at the end of the restriction period. During 2015, 20142018, 2017, and 2013,2016, the Company granted 43,598, 62,698,51,792, 51,563, and 44,38848,984 shares, respectively, of restricted stock to eligible participants. Restrictions on the stock awards generally lapse between fiscal 20162018 and fiscal 2018.2020. For the years ended June 30, 2015, 20142018, 2017, and 2013, $2.32016, $3.7 million, $3.3$3.6 million, and $1.5$2.6 million, respectively, was recognized as compensation expense related to restricted stock awards. Substantially all awards are expected to vest.
58
A summary of restricted stock awards activity during the year ended June 30, 20152018 is as follows:
| | | | Restricted Stock Awards |
| Restricted Stock Awards | Number | | Aggregate |
| Number | | Aggregate | of | | Intrinsic |
| of | | Intrinsic | Shares | | Value |
| Shares | | Value | |
| | | | |
Outstanding, June 30, 2014 | 144,095 | | $ | 10,732,196 | |
Outstanding, June 30, 2017 | | 115,703 | | $ | 10,494,262 |
Granted | 43,598 | | | | 51,792 | | | |
Exercised / vested | (71,220) | | | 2,831,554 | (37,970) | | $ | 757,216 |
Canceled | (11,394) | | | | (9,515) | | | |
Outstanding, June 30, 2015 | 105,079 | | $ | 8,398,964 | |
Outstanding, June 30, 2018 | | 120,010 | | $ | 12,258,515 |
Restricted stock awards granted during 2015, 20142018, 2017 and 20132016 had a weighted average grant date fair value of $76.47, $58.84,$93.73, $85.07, and $44.59,$77.38, respectively. The grant date fair value of restricted stock awards is determined based on the closing price of the Company’s common stock on the date of grant. The total intrinsic value of awards exercised during the years ended June 30, 2015, 2014,2018, 2017, and 20132016 was $2.8$0.8 million, $3.1$0.8 million, and $3.5$1.1 million, respectively.
As of June 30, 2015,2018, there was $2.7$4.1 million of unrecognized compensation costs related to awards expected to be recognized over a weighted-average period of 1.471.38 years.
Executive Compensation Program
The Company operates a compensation program for key employees. The plan contains both an annual component as well as a long-term component. Under the annual component, participants may elect to defer up to 50% of their annual incentive compensation in restricted stock which is purchased at a discount to the market. Additionally, non-employee directors of the Company may defer a portion of their director’s fees in restricted stock units which is purchased at a discount to the market. During the restriction period, recipients of the shares are entitled to dividend equivalents on such units, providing that such shares are not forfeited. Dividend equivalents are accumulated and paid out at the end of the restriction period. The restrictions on the units expire after three years. At June 30, 20152018 and 2014,2017, respectively, 43,54931,760 and 52,43135,707 shares of restricted stock units are outstanding and subject to restrictions that lapse between fiscal 20162018 and fiscal 2018.2020. The compensation expense associated with this incentive program is charged to income over the restriction period. The Company recorded compensation expense related to this program of $0.3 million, $0.7$0.4 million, and $0.6$0.2 million for the years ended June 30, 2015, 20142018, 2017 and 2013,2016, respectively.
As of June 30, 2015,2018, there was $0.3 million of unrecognized compensation costs related to awards expected to be recognized over a weighted-average period of 1.10 years1.21 years.
The fair value of the awards under the annual component of this incentive program is measured using the Black-Scholes option-pricing model. Key assumptions used to apply this pricing model are as follows:
| | 2018 | | | 2017 | | | 2016 |
Risk-free interest rates | | 1.55% | | | 0.71% | | | 1.10% |
Expected life of option grants (in years) | | 3 | | | 3 | | | 3 |
Expected volatility of underlying stock | | 25.6% | | | 25.7% | | | 26.6% |
Expected quarterly dividends (per share) | $ | 0.16 | | $ | 0.14 | | $ | 0.12 |
| | | | | | | | |
| | 2015 | | | 2014 | | | 2013 |
Risk-free interest rates | | 0.88% | | | 0.70% | | | 0.25% |
Expected life of option grants (in years) | | 3 | | | 3 | | | 3 |
Expected volatility of underlying stock | | 32.0% | | | 38.9% | | | 47.4% |
Expected quarterly dividends (per share) | $ | 0.10 | | $ | 0.08 | | $ | 0.07 |
Under the long-term component, grants of performance share units (“PSUs”) are made annually to key employees and the share units are earned based on the achievement of certain overall corporate financial performance targets over the performance period. At the end of the performance period, the number of shares of common stock issued will be determined by adjusting upward or downward from the target in a range between 50% and 200%. No shares will be issued if the minimum performance threshold is not achieved. The final performance percentage, on which the payout will be based, considering the performance metrics established for the performance period, will be certified by the Compensation Committee of the Board of Directors.
TheBeginning in 2017, awards granted by the Committee providedprovide that the PSUs will be converted to shares of common stock if the Company’s EBITDA (earnings before interest, taxes, depreciation and amortization) and return on assetsinvested capital meet specified levels approved by the Committee. A participant’s right to any shares that are earned will cliff vest in three equal installments.years. An executive whose employment terminates prior to the vesting of any installmentaward for a reason other than death, disability, retirement, or following a change in control, will forfeit the shares represented by that installment.award. In certain circumstances, such as
59
death, disability, or retirement, PSUs are paid on a pro-rata basis. In the event of a change in control, vesting of the awards granted is accelerated.
A summary of the awards activity under the executive compensation program during the year ended June 30, 20152018 is as follows:
| | | | | | | | | | | Annual Component | | Performance Stock Units |
| Annual Component | | | | Performance Stock Units | | | Weighted | | | | | | | |
| | | Weighted | | | | | | | | Number | | Average | | Aggregate | | Number | | Aggregate |
| Number | | Average | | Aggregate | | Number | | Aggregate | of | | Exercise | | Intrinsic | | of | | Intrinsic |
| of | | Exercise | | Intrinsic | | of | | Intrinsic | Shares | | Price | | Value | | Shares | | Value |
| Shares | | Price | | Value | | Shares | | Value | |
| | | | | | | | | | | |
Non-vested, June 30, 2014 | 52,432 | | $ | 29.91 | | $ | 1,360,566 | | 40,366 | | $ | 2,156,759 | |
Non-vested, June 30, 2017 | | 35,707 | | $ | 59.11 | | $ | 318,334 | | 52,890 | | $ | 4,254,256 |
Granted | 14,650 | | | 55.76 | | | | | 31,199 | | | | 9,050 | | $ | 68.03 | | | | | 24,567 | | | |
Vested | (21,298) | | | 23.00 | | | 1,089,126 | | (24,137) | | | 1,459,558 | (10,930) | | $ | 55.76 | | | 428,893 | | (15,780) | | $ | 1,194,319 |
Forfeited | (2,235) | | | 35.53 | | | | | (18,978) | | | | (2,067) | | $ | 60.62 | | | | | (3,167) | | | |
Non-vested, June 30, 2015 | 43,549 | | $ | 41.70 | | $ | 794,828 | | 28,450 | | $ | 1,873,626 | |
Non-vested, June 30, 2018 | | 31,760 | | $ | 62.71 | | | 442,850 | | 58,028 | | $ | 5,013,531 |
Restricted stock awards granted under the annual component of this program in fiscal 2015, 2014,2018, 2017, and 20132016 had a grant date fair value of $80.98, $69.47,$96.56, $87.05, and $55.61,$82.79, respectively. The PSUs granted in fiscal 2015, 20142018, 2017 and 20132016 had a grant date fair value of $74.82, $54.48,$91.75, $83.92, and $44.20,$76.61, respectively. The total intrinsic value of awards vested under the executive compensation program during the years ended June 30, 2015, 2014 and 20132018 was $1.5 million, $2.2$1.6 million, and $3.1$2.3 million respectively.for the years ended June 30, 2017 and June 30, 2016.
The Company recognized compensation expense related to the PSUs of $1.3$0.9 million, $2.7$1.0 million, and $1.3$2.3 million for the years ended June 30, 2015, 20142018, 2017 and 2013,2016 respectively based on the probability of the performance targets being met. The total unrecognized compensation costs related to non-vested performance share units was $1.0$2.0 million at June 30, 2015,2018, which is expected to be recognized over a weighted average period of 1.571.3 years.
Employee Stock Purchase Plan
The Company has an Employee Stock Purchase Plan that allows employees to purchase shares of common stock of the Company at a discount from the market each quarter. SharesThe ESPP plan, which was effective as of July 1, 2005, provided employees the option to purchase Standex stock at a discount of 5%. The Plan was modified, effective as of April 1, 2017, to increase the stock purchase discount to 15% and is considered a compensatory Plan. Under this new Plan, shares of our stock may be purchased by employees quarterly at 95%85% of the fair market value on the last day of each quarter. The 15% discount is recorded as a component of SG&A in the Company’s Consolidated Statements of Operations. Shares of stock reserved for the plan were 94,48881,315 at June 30, 2015.2018. Shares purchased under this plan aggregated 3,382, 4,473,to 5,622, 3,742, and 5,8133,809 in 2015, 20142018, 2017 and 2013,2016, respectively, at an average price of $74.42, $58.54,$86.01, $84.17, and $48.16,$75.66, respectively.
14. ACCUMULATED OTHER COMPREHENSIVE INCOME (LOSS)
The components of the Company’s accumulated other comprehensive income (loss) at June 30 are as follows (in thousands):
| | | 2015 | | 2014 | | | 2018 | | | 2017 |
Foreign currency translation adjustment | | $ | (13,333) | | $ | 9,800 | | $ | (25,013) | | $ | (25,107) |
Unrealized pension losses, net of tax | | | (79,248) | | | (64,968) | | | (95,112) | | | (86,646) |
Unrealized losses on derivative instruments, net of tax | | | (436) | | | (651) | | | (1,734) | | | (4,185) |
Total | | $ | (93,017) | | $ | (55,819) | | $ | (121,859) | | $ | (115,938) |
60
15. DISCONTINUED OPERATIONSRESTRUCTURING
In June 2014, the Company divested the American Foodservice Company, (“AFS”) a manufacturer of custom design and fabrication of counter systems and cabinets, in our Food Service Equipment Group segment. In connection with this sale, the Company received proceeds of $3.1 million and recorded a net loss on disposal of $3.2 million.
On March 30, 2012, ADP was sold to a private equity buyer for consideration of $16.1 million consisting of $13.1 million in cash. Pursuant to the transaction, the Company received a $3.0 million promissory note from the buyer. The note is secured by a mortgage on the ADP real estate sold in the transaction in Detroit Lakes, MN, Medina, NY, and Powder Springs, GA. The Company remained the obligor of ADP’s Philadelphia, PA facility and administrative offices, and sublet space to the buyer after the divestiture. The buyer terminated their obligation under the Philadelphia sublease in September 2014. On February 4, 2015 we entered into a one year renewable sublease agreement for this building. Our net obligation with respect to the remaining Philadelphia leases is $1.3 million, of which $0.9 million was recorded as a liability at June 30, 2015. We do not expect to record additional charges related to these obligations
During 2014, the Company received notice that its obligations under a guarantee provided to the buyers of ADP were triggered as a result of its withdrawal from both of the multi-employer pension plans in which ADP previously participated. As a result, the Company has recorded charges of $1.6 million in excess of the value of the guarantee previously recorded. The last of these obligations were settled in July of fiscal year 2016 by a $0.5 million payment to the final multi-employer plan.
The following table summarizes the Company’s discontinued operations activity, by operation, for the years ended June 30, (in thousands):
| | | | | | | | | | | |
| Year Disposed | 2015 | | | 2014 | | | 2013 |
Sales: | | | | | | | | | | |
American Foodservice Company | 2014 | | $ | - | | $ | 20,556 | | $ | 27,870 |
Air Distribution Products Group | 2012 | | | - | | | - | | | - |
| | | | - | | | 20,556 | | | 27,870 |
Income (loss) before taxes: | | | | | | | | | | |
American Foodservice Company(1) | 2014 | | | (492) | | | (8,339) | | | 1,934 |
Air Distribution Products Group | 2012 | | | (137) | | | (1,849) | | | (451) |
Other loss from discontinued operations | | | | (130) | | | (387) | | | (207) |
Income (loss) before taxes from discontinued operations | | | (759) | | | (10,575) | | | 1,276 |
(Provision) benefit for tax | | | | 259 | | | 3,692 | | | (482) |
Net income (loss) from discontinued operations | | | $ | (500) | | $ | (6,883) | | $ | 794 |
(1)American Foodservice Company incurred a pretax operational loss of $3.5 million and pretax loss on sale of $4.8 million in 2014.
Assets and liabilities related to discontinued operations to be retained by the Company are recorded in the Consolidated Balance Sheets at June 30 under the following captions (in thousands):
| | | | |
| | 2015 | | 2014 |
Current assets | $ | 23 | $ | 199 |
Non-current assets | | 3,014 | | 3,014 |
Current liabilities | | 1,383 | | 2,340 |
Non-current liabilities | | 896 | | 1,791 |
16. RESTRUCTURING
The Company has undertaken a number of initiatives that have resulted in severance, restructuring, and related charges. A summary of charges by initiative is as follows (in thousands):
| | | Involuntary Employee | | | | | | | | Involuntary Employee | | | | | | |
| | Severance and | | | | | | | | Severance and | | | | | | |
Year Ended June 30, | | Benefit Costs | | Other | | Total | | Benefit Costs | | Other | | Total |
2015 Restructuring Initiatives | | $ | 847 | | $ | 2,319 | | $ | 3,166 | |
2018 Restructuring Initiatives | | | $ | 2,668 | | $ | 3,825 | | $ | 6,493 |
Prior Year Initiatives | | | 11 | | | 266 | | | 277 | | | 224 | | | 877 | | | 1,101 |
Total expense | | $ | 858 | | $ | 2,585 | | $ | 3,443 | | $ | 2,892 | | $ | 4,702 | | $ | 7,594 |
| | | | | | | | | | | | | | | | | |
2014 Restructuring Initiatives | | $ | 1,528 | | $ | 8,477 | | $ | 10,005 | |
2017 Restructuring Initiatives | | | $ | 1,863 | | $ | 3,590 | | $ | 5,453 |
Prior Year Initiatives | | | 72 | | | - | | | 72 | | | - | | | 372 | | | 372 |
Total expense | | $ | 1,600 | | $ | 8,477 | | $ | 10,077 | | $ | 1,863 | | $ | 3,962 | | $ | 5,825 |
| | | | |
2013 Restructuring Initiatives | | $ | 1,299 | | $ | 1,367 | | $ | 2,666 | |
2016 Restructuring Initiatives | | | $ | 1,046 | | $ | 893 | | $ | 1,939 |
Prior Year Initiatives | | | - | | | - | | | - | | | 96 | | | 2,197 | | | 2,293 |
Total expense | | $ | 1,299 | | $ | 1,367 | | $ | 2,666 | | $ | 1,142 | | $ | 3,090 | | $ | 4,232 |
20152018 Restructuring Initiatives
The Company continues to focus on our efforts to reduce cost and improve productivity across our businesses, particularly through headcount reductions, facility closures, and facility closures.consolidations. During the second quarterfiscal year ended June 30, 2018, we incurred restructuring expenses from 2018 initiatives related to three restructuring programs that are intended to improve profitability, streamline production and enhance capacity to support future growth: (1) the realignment of 2015,management functions at the Company announced the closure of our Food Service Equipment U.K. facilityGroup level; (2) headcount reduction and entered into a distribution agreementplant realignment with a U.K. based partnerregard to the standard products businesses within Food Service Equipment; and (3) the exit of an unprofitable Engraving business in Brazil.
| | Involuntary Employee Severance and Benefit Costs | Other | | Total | |
Restructuring liabilities at June 30, 2017 | | $ | - | | $ | - | | $ | - | |
Additions and adjustments | | | 2,838 | | | 3,149 | | | 5,987 | |
Payments | | | (2,676) | | | (3,124) | | | (5,800) | |
Restructuring liabilities at June 30, 2018 | | $ | 162 | | $ | 25 | | $ | 187 | |
2017 Restructuring Initiatives
The Company continues to focus on our efforts to reduce channelcost and improve productivity across our businesses, particularly through headcount reductions, facility closures, and consolidations. The Company’s 2017 initiatives are from three primary areas. First, Engineering Technologies incurred $3.6 million of expense related to manufacturing footprint optimization at the Enginetics, Huber Heights, Ohio facility which allowed us to close its East Lake, Ohio facility. We vacated and sublet the East Lake facility for approximately the same aggregate lease costs and enhance profitability, expand and strengthen, our U.K.for which we are obligated under the lease. Second, we spent $1.2 million to gain organizational efficiencies within the Food Service Equipment group’s presence for all ofsegment. Finally, we spent $0.5 million to move our brands. We incurred severance and non-cash lease impairment costs of $0.8 million associated with these activities for the year ending June 30, 2015. Restructuring expenseElectronics facility in China due to government directives related to all businesses in the 2015 initiatives have been completed.area where our facility was located.
The Company anticipates further restructuring charges in 2019 based upon market conditions and cost reduction activities to improve our competitive advantage.
61
Activity in the reserves related to 20152017 restructuring initiatives is as follows (in thousands):
| | | | | | | | |
| Involuntary Employee | | | | | | |
| Severance and | | | | | | |
| Benefit Costs | | Other | | Total |
Restructuring Liabilities at June 30, 2014 | $ | - | | $ | - | | $ | - |
Additions | | 847 | | | 2,319 | | | 3,166 |
Payments | | (769) | | | (2,013) | | | (2,782) |
Restructuring Liabilities at June 30, 2015 | $ | 78 | | $ | 306 | | $ | 384 |
| Involuntary Employee | | | | | | |
| Severance and | | | | | | |
| Benefit Costs | | Other | | Total |
Restructuring Liabilities at June 30, 2017 | $ | 506 | | $ | 801 | | $ | 1,307 |
Additions and adjustments | | 532 | | | 1,044 | | | 1,576 |
Payments | | (745) | | | (1,845) | | | (2,590) |
Restructuring Liabilities at June 30, 2018 | $ | 293 | | $ | - | | $ | 293 |
Prior Year Initiatives
The Company previously announced a consolidation of our Food Service Equipment Group Cheyenne, Wyoming plant into its Mexico facility and other manufacturing consolidation efforts. During fiscal year 2014 we recorded a non-cash expense of $5.4 million related to the impairment of long-lived assets in Cheyenne. Expenses totaling $0.3 million were recorded during the year ending June 30, 2015. Restructuring activities related to all prior year initiatives are substantially complete. The cumulative expense related to all activities making up this initiative is expected to be $10.4 million.
Activity in the reserves related to prior year restructuring initiatives is as follows (in thousands):
| | | | | | | | |
| Involuntary Employee | | | | | | |
| Severance and | | | | | | |
| Benefit Costs | | Other | | Total |
Restructuring Liabilities at June 30, 2013 | $ | 10 | | $ | - | | $ | 10 |
Additions | | 1,528 | | | 3,051 | | | 4,579 |
Payments | | (983) | | | (3,051) | | | (4,034) |
Restructuring Liabilities at June 30, 2014 | $ | 555 | | $ | - | | $ | 555 |
Additions | | 11 | | | 266 | | | 277 |
Payments | | (566) | | | (266) | | | (832) |
Restructuring Liabilities at June 30, 2015 | $ | - | | $ | - | | $ | - |
| Involuntary Employee | | | | | | |
| Severance and | | | | | | |
| Benefit Costs | | Other | | Total |
Restructuring Liabilities at June 30, 2016 | $ | 74 | | $ | 256 | | $ | 330 |
Additions | | 1,927 | | | 3,742 | | | 5,669 |
Payments | | (1,495) | | | (2,760) | | | (4,255) |
Restructuring Liabilities at June 30, 2017 | $ | 506 | | $ | 1,238 | | $ | 1,744 |
The Company’s total restructuring expenses by segment are as follows (in thousands):
| | | | | | |
| | Involuntary Employee | | | | |
| | Severance and | | | | |
Year Ended June 30, | | Benefit Costs | | Other | | Total |
Fiscal Year 2015 | | |
Food Service Equipment Group | | $ 215 | | $ 2,363 | | $ 2,578 |
Engineering Technologies Group | | 75 | | - | | 75 |
Engraving Group | | 220 | | - | | 220 |
Electronics Products Group | | 348 | | 222 | | 570 |
Total expense | | $ 858 | | $ 2,585 | | $ 3,443 |
| | | | | | |
Fiscal Year 2014 | | |
Food Service Equipment Group | | $ 746 | | $ 8,408 | | $ 9,154 |
Engraving Group | | 667 | | 21 | | 688 |
Electronics Products Group | | 187 | | 48 | | 235 |
Total expense | | $ 1,600 | | $ 8,477 | | $ 10,077 |
| | | | | | |
Fiscal Year 2013 | | |
Food Service Equipment Group | | $ 183 | | $ 25 | | $ 208 |
Engineering Technologies Group | | 44 | | - | | 44 |
Engraving Group | | 776 | | 1,253 | | 2,029 |
Electronics Products Group | | 296 | | 89 | | 385 |
Total expense | | $ 1,299 | | $ 1,367 | | $ 2,666 |
| | Involuntary Employee | | | | |
| | Severance and | | | | |
Year Ended June 30, | | Benefit Costs | | Other | | Total |
Fiscal Year 2018 | | |
Food Service Equipment | | $ 962 | | $ 3,203 | | $ 4,165 |
Engineering Technologies | | 224 | | 874 | | 1,098 |
Engraving | | 1,199 | | 489 | | 1,688 |
Electronics | | 215 | | 84 | | 299 |
Corporate and Other | | 292 | | 52 | | 344 |
Total expense | | $ 2,892 | | $ 4,702 | | $ 7,594 |
| | | | | | |
Fiscal Year 2017 | | | | | | |
Food Service Equipment | | $ 1,101 | | $ 85 | | $ 1,186 |
Engineering Technologies | | 809 | | 3,070 | | 3,879 |
Engraving | | 6 | | - | | 6 |
Electronics | | 11 | | 488 | | 499 |
Corporate and Other | | (64) | | 319 | | 255 |
Total expense | | $ 1,863 | | $ 3,962 | | $ 5,825 |
| | | | | | |
Fiscal Year 2016 | | |
Food Service Equipment | | $ 138 | | $ 2,841 | | $ 2,979 |
Engineering Technologies | | 160 | | - | | 160 |
Engraving | | 92 | | - | | 92 |
Electronics | | 624 | | 217 | | 841 |
Corporate and Other | | 128 | | 32 | | 160 |
Total expense | | $ 1,142 | | $ 3,090 | | $ 4,232 |
17.
62
16. EMPLOYEE BENEFIT PLANS
Retirement Plans
The Company has defined benefit pension plans covering certain current and former employees both inside and outside of the U.S. The Company’s pension plan for U.S. salaried employees was frozen as of December 31, 2007, and participants in the plan ceased accruing future benefits. The Company’s pension plan for U.S. hourly employees was frozen for substantially all participants as of July 31, 2013, and replaced with a defined contribution benefit plan. Based on changes to the plan, the Company recorded a reduction in U.S. non-cash pension plan expense in 2014 of $2.6 million as compared to 2013, which was partially offset by increased expenses associated with the implementation of the defined contribution benefit program. During fiscal 2015, the Society of Actuaries released new mortality tables that reflect increased life expectancy over the previous tables. The company incorporated these new tables into its most recent measurement of its U.S. pension obligations which resulted in an increase in the Company’s projected benefit obligation as of June 30, 2015.
Net periodic benefit cost for U.S. and non-U.S. plans included the following components (in thousands):
| | U.S. Plans | | | Foreign Plans |
| | Year Ended June 30, | | | Year Ended June 30, |
| | 2018 | | | 2017 | | | 2016 | | | 2018 | | | 2017 | | | 2016 |
Service Cost | $ | 3 | | $ | 3 | | $ | 70 | | $ | 187 | | $ | 37 | | $ | 34 |
Interest Cost | | 10,079 | | | 10,451 | | | 11,489 | | | 1,050 | | | 1,022 | | | 1,428 |
Expected return on plan assets | | (13,484) | | | (13,761) | | | (13,864) | | | (947) | | | (1,152) | | | (1,294) |
Recognized net actuarial loss | | 4,579 | | | 4,760 | | | 3,979 | | | 941 | | | 1,016 | | | 835 |
Amortization of prior service cost (benefit) | | - | | | - | | | 14 | | | (37) | | | (48) | | | (49) |
Net periodic benefit cost (benefit) | $ | 1,177 | | $ | 1,453 | | $ | 1,688 | | $ | 1,194 | | $ | 875 | | $ | 954 |
| | | | | | | | | | | | | | | | |
| | | | | | | | | | | | | | | | | |
| | U.S. Plans | | | Foreign Plans |
| | Year Ended June 30, | | | Year Ended June 30, |
| | 2015 | | | 2014 | | | 2013 | | | 2015 | | | 2014 | | | 2013 |
Service Cost | $ | 211 | | $ | 233 | | $ | 702 | | $ | 44 | | $ | 46 | | $ | 40 |
Interest Cost | | 10,476 | | | 11,241 | | | 10,941 | | | 1,618 | | | 1,723 | | | 1,667 |
Expected return on plan assets | | (13,954) | | | (13,513) | | | (14,790) | | | (1,474) | | | (1,532) | | | (1,339) |
Recognized net actuarial loss | | 3,945 | | | 3,941 | | | 7,577 | | | 750 | | | 819 | | | 901 |
Amortization of prior service cost (benefit) | |
54 | | |
57 | | |
98 | | |
(53) | | |
(60) | | |
(57) |
Amortization of transition Obligation (asset) |
- | | |
- | | |
2 | | |
- | | |
- | | |
- |
Curtailment | | 244 | | | - | | | 52 | | | - | | | - | | | - |
Net periodic benefit cost (benefit) | $ | 976 | | $ | 1,959 | | $ | 4,582 | | $ | 885 | | $ | 996 | | $ | 1,212 |
The following table sets forth the funded status and amounts recognized as of June 30, 20152018 and 20142017 for our U.S. and foreign defined benefit pension plans (in thousands):
| | U.S. Plans | | Foreign Plans | U.S. Plans | | Foreign Plans |
| Year Ended June 30, | | Year Ended June 30, | Year Ended June 30, | | Year Ended June 30, |
| | 2015 | | 2014 | | | 2015 | | 2014 | | 2018 | | | 2017 | | | 2018 | | | 2017 |
Change in benefit obligation | | | | | | | | | | | | | | | | | |
Benefit obligation at beginning of year | $ | 240,426 | | $ | 227,874 | | $ | 44,278 | | $ | 37,897 | $ | 259,963 | | $ | 269,162 | | $ | 42,141 | | $ | 41,820 |
Service cost | | 211 | | 233 | | 44 | | 46 | | 3 | | 3 | | | 187 | | 37 |
Interest cost | | 10,476 | | 11,241 | | 1,618 | | 1,723 | | 10,079 | | 10,451 | | | 1,050 | | 1,022 |
Actuarial loss (gain) | | 16,570 | | 16,317 | | 3,996 | | 2,161 | | (10,761) | | (3,624) | | | (2,701) | | 1,016 |
Benefits paid | | (15,468) | | (15,239) | | (1,455) | | (1,662) | | (16,188) | | (16,029) | | | (1,639) | | (1,352) |
Foreign currency exchange rate | | - | | | - | | | (4,800) | | | 4,113 | |
Foreign currency exchange rate & other changes | | | - | | | - | | | 2,156 | | | (402) |
Projected benefit obligation at end of year | $ | 252,215 | | $ | 240,426 | | $ | 43,681 | | $ | 44,278 | $ | 243,096 | | $ | 259,963 | | $ | 41,194 | | $ | 42,141 |
Change in plan assets | | | | | | | | | | | | | | | | | |
Fair value of plan assets at beginning of year | $ | 216,043 | | $ | 200,174 | | $ | 37,487 | | $ | 30,889 | $ | 195,328 | | $ | 197,850 | | $ | 36,921 | | $ | 35,007 |
Actual return on plan assets | | 3,900 | | 30,956 | | 3,410 | | 3,034 | | 6,070 | | 13,223 | | 1,113 | | 2,677 |
Employer contribution | | 235 | | 152 | | 1,336 | | 1,375 | | 5,750 | | 284 | | | 1,196 | | 1,143 |
Benefits paid | | (15,468) | | (15,239) | | (1,455) | | (1,662) | | (16,188) | | (16,029) | | | (1,638) | | (1,352) |
Foreign currency exchange rate | | - | | | - | | | (3,412) | | | 3,851 | | - | | | - | | | 525 | | | (554) |
Fair value of plan assets at end of year | $ | 204,710 | | $ | 216,043 | | $ | 37,366 | | $ | 37,487 | $ | 190,960 | | $ | 195,328 | | $ | 38,117 | | $ | 36,921 |
| | | | | | | | | | | | | | | | | | | |
Funded Status | $ | (47,505) | | $ | (24,383) | | $ | (6,315) | | $ | (6,791) | $ | (52,136) | | $ | (64,635) | | $ | (3,076) | | $ | (5,220) |
Amounts recognized in the consolidated balance sheets consists of: | Amounts recognized in the consolidated balance sheets consists of: | | | | | | | Amounts recognized in the consolidated balance sheets consists of: | | | | | | | | |
Prepaid Benefit Cost | $ | - | | $ | - | | $ | 107 | | $ | 1,167 | $ | - | | $ | - | | $ | 4,759 | | $ | 1,324 |
Current liabilities | | (199) | | (199) | | (314) | | (327) | | (219) | | (220) | | | (1,926) | | (330) |
Non-current liabilities | | (47,306) | | | (24,184) | | | (6,109) | | | (7,631) | | (51,917) | | | (64,415) | | | (5,909) | | | (6,330) |
Net amount recognized | $ | (47,505) | | $ | (24,383) | | $ | (6,316) | | $ | (6,791) | $ | (52,136) | | $ | (64,635) | | $ | (3,076) | | $ | (5,336) |
| | | | | | | | | | | | | | | | | | | |
Unrecognized net actuarial loss | | 114,715 | | 92,036 | | 10,655 | | 10,506 | $ | 121,281 | | $ | 129,207 | | $ | 4,778 | | $ | 8,484 |
Unrecognized prior service cost | | 14 | | | 312 | | | (130) | | | (220) | | - | | | - | | | (45) | | | (33) |
Accumulated other comprehensive income, pre-tax | $ | 114,729 | | $ | 92,348 | | $ | 10,525 | | $ | 10,286 | $ | 121,281 | | $ | 129,207 | | $ | 4,733 | | $ | 8,451 |
63
The accumulated benefit obligation for all defined benefit pension plans was $295.0$283.9 million and $283.7$301.6 million at June 30, 20152018 and 2014,2017, respectively.
The estimated actuarial net loss and prior service benefit for the defined benefit pension plans that will be amortized from accumulated other comprehensive income into net periodic benefit cost over the next fiscal year are $4.9 million and less than $0.1 million, respectively.is $4.5 million.
Plan Assets and Assumptions
The fair values of the Company’s pension plan assets at June 30, 20152018 and 20142017 by asset category, as classified in the three levels of inputs described in Note 1 under the captionFair Value of Financial Instruments, are as follows (in thousands):
| June 30, 2018 |
| Total | | Level 1 | | Level 2 | | Level 3 |
Cash and cash equivalents | $ | 4,482 | | $ | 325 | | $ | 4,157 | | $ | - |
Common and preferred stocks | | 89,934 | | | 16,353 | | | 73,581 | | | - |
U.S. Government securities | | 14,461 | | | - | | | 14,461 | | | - |
Corporate bonds and other fixed income securities | | 102,105 | | | 6,711 | | | 95,394 | | | - |
Other | | 18,095 | | | - | | | 18,095 | | | - |
| $ | 229,077 | | | 23,389 | | | 205,688 | | | - |
| | | | | | | | | | | |
| June 30, 2015 |
| Total | | Level 1 | | Level 2 | | Level 3 |
Cash and cash equivalents | $ | 4,051 | | $ | 451 | | $ | 3,600 | | $ | - |
Common and preferred stocks | | 101,725 | | | 17,716 | | | 84,009 | | | - |
U.S. Government securities | | 14,469 | | | - | | | 14,469 | | | - |
Corporate bonds and other fixed income securities | | 112,297 | | | 6,238 | | | 106,059 | | | - |
Other | | 9,534 | | | - | | | 9,534 | | | - |
| $ | 242,076 | | $ | 24,405 | | $ | 217,671 | | $ | - |
| | | | | | | | | | | |
| June 30, 2014 |
| Total | | Level 1 | | Level 2 | | Level 3 |
Cash and cash equivalents | $ | 3,078 | | $ | 287 | | $ | 2,791 | | $ | - |
Common and preferred stocks | | 107,498 | | | 16,754 | | | 90,744 | | | - |
U.S. Government securities | | 13,334 | | | - | | | 13,334 | | | - |
Corporate bonds and other fixed income securities | | 118,131 | | | 7,297 | | | 110,834 | | | - |
Other | | 11,488 | | | - | | | 11,488 | | | - |
| $ | 253,529 | | $ | 24,338 | | $ | 229,191 | | $ | - |
| June 30, 2017 |
| Total | | Level 1 | | Level 2 | | Level 3 |
Cash and cash equivalents | $ | 11,160 | | $ | 452 | | $ | 10,708 | | $ | - |
Common and preferred stocks | | 94,951 | | | 16,976 | | | 77,975 | | | - |
U.S. Government securities | | 11,989 | | | - | | | 11,989 | | | - |
Corporate bonds and other fixed income securities | | 97,691 | | | 6,728 | | | 90,963 | | | - |
Other | | 16,458 | | | - | | | 16,458 | | | - |
| $ | 232,249 | | $ | 24,156 | | $ | 208,093 | | $ | - |
Asset allocation at June 30, 20152018 and 20142017 and target asset allocations for 20152018 are as follows:
| | U.S. Plans | | Foreign Plans | U.S. Plans | | Foreign Plans |
| Year Ended June 30, | | Year Ended June 30, | Year Ended June 30, | | Year Ended June 30, |
Asset Category | 2015 | | 2014 | | 2015 | | 2014 | 2018 | | 2017 | | 2018 | | 2017 |
Equity securities | 33% | | 32% | | 24% | | 26% | 33% | | 33% | | 20% | | 21% |
Debt securities | 31% | | 28% | | 75% | | 73% | 33% | | 29% | | 44% | | 44% |
Global balanced securities | 26% | | 28% | | 0% | | 0% | 24% | | 26% | | 35% | | 28% |
Other | 10% | | 12% | | 1% | | 1% | 10% | | 12% | | 1% | | 7% |
Total | 100% | | 100% | | 100% | | 100% | 100% | | 100% | | 100% | | 100% |
| | 2015 | 2018 |
Asset Category – Target | U.S. | | U.K. | U.S. | | U.K. |
Equity securities | 32% | | 25% | 32% | | 18% |
Debt and market neutral securities | 33% | | 75% | 33% | | 45% |
Global balanced securities | 25% | | 0% | 25% | | 37% |
Other | 10% | | 0% | 10% | | 0% |
Total | 100% | | 100% | 100% | | 100% |
Our investment policy for the U.S. pension plans targets a range of exposure to the various asset classes. Standex rebalances the portfolio periodically when the allocation is not within the desired range of exposure. The plan seeks to provide returns in excess of the various benchmarks. The benchmarks include the following indices: S&P 500; Citigroup PMI EPAC; Citigroup World Government Bond and Barclays Aggregate Bond. A third partythird-party investment consultant tracks the plan’s portfolio relative to the benchmarks and provides quarterly investment reviews which consist of a performance and risk assessment on all investment managers and on the portfolio.
64
Certain managers within the plan use, or have authorization to use, derivative financial instruments for hedging purposes, the creation of market exposures and management of country and asset allocation exposure. Currency speculation derivatives are strictly prohibited.
| | | | | |
Year Ended June 30 | 2015 | | 2014 | | 2013 |
Plan assumptions - obligation | | | | | |
Discount rate | 2.30 - 4.70% | | 2.90 - 4.50% | | 3.50 - 5.10% |
Rate of compensation increase | 3.80% | | 3.80% | | 3.50 - 3.90% |
| | | | | |
Plan assumptions - cost | | | | | |
Discount rate | 2.90 - 4.50% | | 3.50 - 5.10% | | 4.00 - 4.60% |
Expected return on assets | 4.20 - 7.25% | | 4.60 - 7.25% | | 4.80 - 7.80% |
Rate of compensation increase | 3.80% | | 3.90% | | 3.40 - 3.50% |
Year Ended June 30 | 2018 | | 2017 | | 2016 |
Plan assumptions - obligation | | | | | |
Discount rate | 0.38 - 4.40% | | 1.90 - 4.00% | | 1.50 - 4.00% |
Rate of compensation increase | 3.6% | | 3.70% | | 3.30% |
| | | | | |
Plan assumptions - cost | | | | | |
Discount rate | 0.43 - 4.00% | | 1.50 - 4.00% | | 2.30 - 4.70% |
Expected return on assets | 2.55 - 7.00% | | 3.75 - 7.10% | | 3.90 - 7.10% |
Rate of compensation increase | 3.70% | | 3.30% | | 3.75% |
Included in the above are the following assumptions relating to the obligations for defined benefit pension plans in the United States at June 30, 2015;2018; a discount rate of 4.7%4.4% and expected return on assets of 7.25%7.0%. The U.S. defined benefit pension plans represent the majority of our pension obligations. The expected return on plan assets assumption is based on our expectation of the long-term average rate of return on assets in the pension funds and is reflective of the current and projected asset mix of the funds. The discount rate reflects the current rate at which pension liabilities could be effectively settled at the end of the year. The discount rate is determined by matching our expected benefit payments from a stream of AA- or higher bonds available in the marketplace, adjusted to eliminate the effects of call provisions.
Expected benefit payments for the next five years are as follows: 2016, $16.9 million; 2017,$17.1 million; 2018, $17.1 million; 2019, $17.3$17.6 million; 2020, $17.5$17.4 million; 2021, $17.2 million; 2022, $17.7 million; 2023, $17.8 million and thereafter, $89.4$89.3 million. The Company expects to make $1.5$1.4 million of contributions to its pension plans in 2016.2019.
The Company operates a defined benefit planplans in Germany and Japan which isare unfunded.
Multi-Employer Pension Plans
We contribute to a number of multiemployer defined benefit plans under the terms of collective bargaining agreements that cover our union-represented employees. These plans generally provide for retirement, death and/or termination benefits for eligible employees within the applicable collective bargaining units, based on specific eligibility/participation requirements, vesting periods and benefit formulas. The risks of participating in these multiemployer plans are different from single-employer plans in the following aspects:
·
Assets contributed to the multiemployer plan by one employer may be used to provide benefits to employees of other participating employers.
·
If a participating employer stops contributing to the multiemployer plan, the unfunded obligations of the plan may be borne by the remaining participating employers.
·
If we choose to stop participating in some of our multiemployer plans, we may be required to pay those plans an amount based on the underfunded status of the plan, referred to as a withdrawal liability. However, cessation of participation in a multiemployer plan and subsequent payment of any withdrawal liability is subject to the collective bargaining process.
The following table outlines the Company’s participation in multiemployer pension plans for the periods ended June 30, 2015, 2014,2018, 2017, and 2013,2016, and sets forth the yearly contributions into each plan. The “EIN/Pension Plan Number” column provides the Employer Identification Number (“EIN”) and the three-digit plan number. The most recent Pension Protection Act zone status available in 20152017 and 20142016 relates to the plans’ two most recent fiscal year-ends. The zone status is based on information that we received from the plans’ administrators and is certified by each plan’s actuary. Among other factors, plans certified in the red zone are generally less than 65% funded, plans certified in the orange zone are both less than 80% funded and have an accumulated funding deficiency or are expected to have a deficiency in any of the next six plan years, plans certified in the yellow zone are less than 80% funded, and plans certified in the green zone are at least 80% funded. The “FIP/RP Status Pending/Implemented” column indicates whether a financial improvement plan (“FIP”) for yellow/orange zone plans, or a rehabilitation plan (“RP”) for red zone plans, is either pending or has been implemented. For all plans, the Company’s contributions do not exceed 5% of the total contributions to the plan in the most recent year.
65
| | | | | | | | | | | | | | | | | | | | | | | | | | | | |
| | Pension Protection Act Zone Status | Contributions | | | | |
Pension Fund |
EIN/Plan Number |
2015 |
2014 |
FIP/RP Status |
2015 | |
2014 | |
2013 | |
Surcharge Imposed? | Expiration Date of Collective Bargaining Agreement |
New England Teamsters and Trucking Industry Pension Fund | 04-6372430-001 | Red | Red | Yes/ Implemented | $ | 437 | | $ | 541 | | $ | 427 | | No | 4/15/2018 |
IAM National Pension Fund, National Pension Plan | 51-6031295-002 | Green | Green | No | | 633 | | | 659 | | | 623 | | No | 10/4/2016 - 5/31/2018 |
| | | | | $ | 1,070 | | $ | 1,200 | | $ | 1,050 | | | |
Pension Fund | EIN/Plan Number | Pension Protection Act Zone Status | Contributions | Surcharge Imposed? | Expiration Date of Collective Bargaining Agreement |
2018 | 2017 | FIP/RP Status | | 2018 | | | 2017 | | | 2016 |
New England Teamsters and Trucking Industry Pension Fund | 04-6372430-001 | Red | Red | Yes/ Implemented | $ | 482 | | $ | 530 | | $ | 485 | | No | April 2021 |
| | | | | | | | | | | | | | | |
IAM National Pension Fund, National Pension Plan | 51-6031295-002 | Green | Green | N/A | | 638 | | | 633 | | | 575 | | No | Oct. 2019 -May 2021 |
| | | | | $ | 1,120 | | $ | 1,163 | | $ | 1,060 | | | |
Retirement Savings Plans
The Company has two primary employee savings plans, one for salaried employees and one for hourly employees. Substantially all of our full-time domestic employees are covered by these savings plans. Under the provisions of the plans, employees may contribute a portion of their compensation within certain limitations. The Company, at the discretion of the Board of Directors, may make contributions on behalf of our employees under the plans. Company contributions were $3.8$3.7 million, $4.0 million, and $4.1$4.0 million for the years ended June 30, 2015, 2014,2018, 2017, and 2013,2016, respectively. At June 30, 2015,2018, the salaried plan holds approximately 96,00068,000 shares of Company common stock, representing approximately 9%6.26% of the holdings of the plan.
Postretirement Benefits Other Than Pensions
The Company sponsors an unfunded postretirement medical plan covering certain full-time employees who retire and have attained the requisite age and years of service. Retired employees are required to contribute toward the cost of coverage according to various established rules.
The accumulated benefit obligation of the post-retirement medical plan was less than $0.2 million at both June 30, 2015 and June 30, 2014. The plan holds no assets as the Company makes contributions as benefits are due. Contributions for each of the last two fiscal years were less than $0.1 million. The assumed weighted average discount rate was 4.70% and 4.50% as of June 30, 2015 and 2014, respectively. A 1% increase in the assumed health care cost trend rate does not impact either the accumulated benefit obligation or the net postretirement cost, as the employer contribution for each participant is a fixed amount.
Effective January 1, 2013, the Company terminated its life insurance benefit provided to certain current and future retirees, resulting in a curtailment and settlement of the plan’s obligations. The Company recorded a $2.3 million benefit from the settlement and curtailment as a component of selling, general and administrative expenses during the third quarter of 2013.
The following table sets forth the postretirement benefit cost reflected in the consolidated income statement sheet at year end (in thousands):
Components of Net Periodic Benefit Cost (in thousands)
| | | | | | | | |
| Year Ended June 30, |
| | 2015 | | | 2014 | | | 2013 |
Service Cost | $ | - | | $ | - | | $ | 13 |
Interest Cost | | 7 | | | 9 | | | 49 |
Recognized net actuarial gain | | (1) | | | (7) | | | (24) |
Curtailment | | - | | | - | | | 51 |
Plan Settlement | | - | | | - | | | (2,329) |
Amortization of transition obligation | | - | | | - | | | 112 |
Net periodic benefit cost | $ | 6 | | $ | 2 | | $ | (2,128) |
18.17. INDUSTRY SEGMENT INFORMATION
The Company has determined that it has five reportable segments organized around the types of product sold:
•
Food Service Equipment Group – an aggregation of seveneight operating segments that manufacture and sell commercial food service equipment;
•
Engraving Group – provides mold texturizing, slush molding tools, project management and design services, roll engraving, hygiene product tooling, low observation vents for stealth aircraft, and process machinery for a number of industries;
•
Engineering Technologies Group – provides net and near net formed single-source customized solutions in the manufacture of engineered components for the aviation, aerospace, defense, energy, industrial, medical, marine, oil and gas, and manned and unmanned space markets.
•
Electronics Products Group – manufacturing and selling of electronic components for applications throughout the end-user market spectrum; and
•
Hydraulics Products Group – manufacturing and selling of single and double-acting telescopic and piston rod hydraulic cylinders.
Net sales include only transactions with unaffiliated customers and include no significant intersegment or export sales. Operating income by segment and geographic area excludes general corporate and interest expenses. Assets of the Corporate segment consist primarily of cash, office equipment, and other non-current assets.
Given the nature of our corporate expenses, management has concluded that it would not be appropriate to allocate the expenses associated with corporate activities to our operating segments. These corporate expenses include the costs for the corporate headquarters, salaries and wages for the personnel in corporate, professional fees related to corporate matters and compliance efforts, stock-based compensation and post-retirement benefits related to our corporate executives, officers and directors, and other compliance related costs. The Company has a process to allocate and recharge certain direct costs to the operating segments when such direct costs are administered and paid at corporate. Such direct expenses that are recharged on an intercompany basis each month include such costs as insurance, workers’ compensation programs, audit fees and pension expense. The accounting policies applied by the reportable segments are the same as those described in the Summary of Accounting Policies footnote to the consolidated financial statements. There are no differences in accounting policies which would be necessary for an understanding of the reported segment information.
66
| | | | | | | | | | | | | | | | | | | | | | | | | | | | | | | | | | | | | | | | | | | | | | | | | | | |
Industry Segments | | | | | | | | | | | | | | | | | |
(in thousands) | Net Sales | | Depreciation and Amortization |
| | 2015 | | | 2014 | | | 2013 | | | 2015 | | | 2014 | | | 2013 |
Food Service Equipment | $ | 408,706 | | $ | 377,848 | | $ | 367,008 | | $ | 5,176 | | $ | 4,485 | | $ | 4,930 |
Engraving | | 110,781 | | | 109,271 | | | 93,380 | | | 3,497 | | | 3,342 | | | 3,226 |
Engineering Technologies | | 97,018 | | | 79,642 | | | 74,838 | | | 4,278 | | | 3,063 | | | 3,288 |
Electronics Products | | 114,196 | | | 114,881 | | | 108,085 | | | 2,759 | | | 2,807 | | | 2,986 |
Hydraulics Products | | 41,441 | | | 34,538 | | | 30,079 | | | 665 | | | 625 | | | 566 |
Corporate and Other | | - | | | - | | | - | | | 309 | | | 269 | | | 239 |
Total | $ | 772,142 | | $ | 716,180 | | $ | 673,390 | | $ | 16,684 | | $ | 14,591 | | $ | 15,235 |
| | | |
| Income (Loss) From Operations | | Capital Expenditures |
| | 2015 | | | 2014 | | | 2013 | | | 2015 | | | 2014 | | | 2013 |
Food Service Equipment | $ | 37,456 | | $ | 38,203 | | $ | 37,533 | | $ | 4,791 | | $ | 3,740 | | $ | 3,149 |
Engraving | | 24,250 | | | 22,145 | | | 15,596 | | | 5,856 | | | 4,648 | | | 5,106 |
Engineering Technologies | | 13,097 | | | 12,676 | | | 13,241 | | | 8,025 | | | 7,686 | | | 1,734 |
Electronics Products | | 20,884 | | | 19,732 | | | 16,147 | | | 2,298 | | | 1,631 | | | 3,243 |
Hydraulics Products | | 7,013 | | | 5,781 | | | 4,968 | | | 784 | | | 684 | | | 580 |
Restructuring charge | | (3,443) | | | (10,077) | | | (2,666) | | | - | | | - | | | - |
Gain on sale of real estate | | - | | | - | | | - | | | - | | | - | | | - |
Other operating income (expense), net | | 438 | | | 3,462 | | | - | | | - | | | - | | |
- |
Corporate | | (21,051) | | | (26,054) | | | (22,924) | | | 268 | | | 1,531 | | | 568 |
Total | $ | 78,644 | | $ | 65,868 | | $ | 61,895 | | $ | 22,022 | | $ | 19,920 | | $ | 14,380 |
Interest expense | | (3,161) | | | (2,249) | | | (2,469) | | | | | | | | | |
Other, net | | 634 | | | 4,184 | | | (128) | | | | | | | | | |
Income from continuing operations before income taxes |
$ | 76,117 | |
$ |
67,803 | |
$ |
59,298 | | | | | | | | | |
| | | |
| Goodwill | | Identifiable Assets |
| | 2015 | | | 2014 | | | 2015 | | | 2014 |
Food Service Equipment | $ | 56,812 | | $ | 56,731 | | $ | 218,334 | | $ | 214,674 |
Engraving | | 20,248 | | | 20,716 | | | 114,268 | | | 101,106 |
Engineering Technologies | | 46,000 | | | 12,188 | | | 141,351 | | | 75,591 |
Electronics Products | | 28,614 | | | 33,272 | | | 90,948 | | | 103,699 |
Hydraulics Products | | 3,058 | | | 3,058 | | | 22,705 | | | 16,410 |
Corporate & Other | | - | | | - | | | 72,735 | | | 66,680 |
Total | $ | 154,732 | | $ | 125,965 | | $ | 660,341 | | $ | 578,160 |
| | | | | | | | |
Net sales(1) | | 2015 | | | 2014 | | | 2013 |
United States | $ | 561,923 | | $ | 505,853 | | $ | 488,048 |
Asia Pasific | | 64,840 | | | 53,551 | | | 51,664 |
EMEA(2) | | 117,816 | | | 130,602 | | | 113,367 |
Other Americas | | 27,563 | | | 26,174 | | | 20,311 |
Total | $ | 772,142 | | $ | 716,180 | | $ | 673,390 |
Industry Segments | | | | | | | | | | | | | | | | | |
(in thousands) | Net Sales | | Depreciation and Amortization |
| | 2018 | | | 2017 | | | 2016 | | | 2018 | | | 2017 | | | 2016 |
Food Service Equipment | $ | 396,866 | | $ | 380,970 | | $ | 381,867 | | $ | 5,960 | | $ | 5,206 | | $ | 5,030 |
Engraving | | 136,275 | | | 105,943 | | | 124,120 | | | 5,483 | | | 3,100 | | | 3,403 |
Engineering Technologies | | 90,781 | | | 90,506 | | | 82,235 | | | 6,006 | | | 5,976 | | | 5,363 |
Electronics | | 196,291 | | | 136,689 | | | 118,319 | | | 10,564 | | | 4,960 | | | 3,200 |
Hydraulics | | 48,169 | | | 41,150 | | | 45,045 | | | 750 | | | 730 | | | 651 |
Corporate and Other | | - | | | - | | | - | | | 400 | | | 343 | | | 306 |
Total | $ | 868,382 | | $ | 755,258 | | $ | 751,586 | | $ | 29,163 | | $ | 20,315 | | $ | 17,953 |
| | | |
| Income (Loss) From Operations | | Capital Expenditures(2) |
| | 2018 | | | 2017 | | | 2016 | | | 2018 | | | 2017 | | | 2016 |
Food Service Equipment | $ | 34,853 | | $ | 33,436 | | $ | 40,142 | | $ | 3,790 | | $ | 5,088 | | $ | 4,560 |
Engraving | | 28,966 | | | 25,584 | | | 29,579 | | | 9,401 | | | 7,807 | | | 4,031 |
Engineering Technologies | | 6,449 | | | 9,662 | | | 8,258 | | | 3,537 | | | 6,510 | | | 6,562 |
Electronics | | 45,310 | | | 27,663 | | | 21,104 | | | 8,263 | | | 4,000 | | | 2,796 |
Hydraulics | | 7,316 | | | 6,712 | | | 7,947 | | | 1,399 | | | 1,058 | | | 988 |
Restructuring charge | | (7,594) | | | (5,825) | | | (4,232) | | | - | | | - | | | - |
Acquisition-related costs | | (3,749) | | | (7,843) | | | - | | | - | | | - | | | - |
Gain on sale of real estate | | - | | | 652 | | | - | | | - | | | - | | | - |
Other operating income (expense), net(1) | | - | | | - | | | (7,458) | | | - | | | - | | | - |
Corporate | | (27,512) | | | (25,015) | | | (24,996) | | | 257 | | | 418 | | | 96 |
Total | $ | 84,039 | | $ | 65,026 | | $ | 70,344 | | $ | 26,647 | | $ | 24,881 | | $ | 19,033 |
Interest expense | | (8,030) | | | (4,043) | | | (2,871) | | | | | | | | | |
Other, net | | 1,243 | | | 949 | | | 1,052 | | | | | | | | | |
Income from continuing operations before income taxes | $ | 77,252 | | $ | 61,932 | | $ | 68,525 | | | | | | | | | |
| | | | | | | | | | | | | | | | | |
(1)Other operating expense in 2016 consists primarily of a $7.3 million charge to adjust the Roll, Plate, and Machinery business in the Engraving segment to its net realizable value (2) Includes capital expenditures in accounts payable of $0.4 million, $0.5 million, and $2.1 million at June 30, 2018, 2017, and 2016 respectively. |
| Goodwill | | Identifiable Assets |
| | 2018 | | | 2017 | | | 2018 | | | 2017 |
Food Service Equipment | $ | 63,464 | | $ | 63,464 | | $ | 249,573 | | $ | 243,414 |
Engraving | | 26,675 | | | 20,000 | | | 149,973 | | | 115,664 |
Engineering Technologies | | 44,247 | | | 44,120 | | | 150,150 | | | 150,805 |
Electronics | | 113,798 | | | 112,047 | | | 318,564 | | | 292,776 |
Hydraulics | | 3,059 | | | 3,059 | | | 25,646 | | | 21,405 |
Corporate & Other(3) | | 497 | | | - | | | 23,031 | | | 43,612 |
Total | $ | 251,762 | | $ | 242,690 | | $ | 916,937 | | $ | 867,676 |
(3) The decrease of Corporate identifiable assets in the periods presented reflects the use of foreign corporate cash in 2017 to acquire Standex Electronics Japan. See discussion related to the purchase in Note 2 of the consolidated financial statements. |
67
| | | | | | | | |
Net sales(4) | | 2018 | | | 2017 | | | 2016 |
United States | $ | 593,141 | | $ | 523,266 | | $ | 548,058 |
Asia Pacific | | 108,569 | | | 86,480 | | | 70,269 |
EMEA(5) | | 149,249 | | | 124,990 | | | 107,765 |
Other Americas | | 17,423 | | | 20,522 | | | 25,494 |
Total | $ | 868,382 | | $ | 755,258 | | $ | 751,586 |
(1)(4) Net sales were identified based on geographic location where our products and services were initiated.
(2)(5) EMEA consists primarily of Europe, Middle East and S. Africa.
| Long-lived assets | | 2015 | | | 2014 | | 2013 | | 2018 | | | 2017 | | 2016 |
United States | $ | 76,274 | | $ | 59,225 | | $ | 58,890 | $ | 84,887 | | $ | 84,365 | | $ | 76,545 |
Asia Pasific | | 7,047 | | | 5,627 | | | 4,166 | |
EMEA(2) | | 18,604 | | | 23,266 | | | 22,065 | |
Asia Pacific | | | 30,910 | | | 30,268 | | | 7,035 |
EMEA(6) | | | 25,709 | | | 15,816 | | | 17,287 |
Other Americas | | 6,611 | | | 8,579 | | | 7,421 | | 3,064 | | | 2,711 | | | 5,819 |
Total | $ | 108,536 | | $ | 96,697 | | $ | 92,542 | $ | 144,570 | | $ | 133,160 | | $ | 106,686 |
19. INSURANCE PROCEEDS(6) EMEA consists primarily of Europe, Middle East and S. Africa.
The Company recorded $0.4 million and $3.5 million in 2015 and 2014 of net gains, as components of other operating income net, from insurance proceeds we received related to a catastrophic failure of a large vertical machining center located at our Engineering Technologies facility in Massachusetts. Insurance proceeds of $4.5 million in 2014 were partially offset by the write-off of the net book value of the machine of $1.0 million.
During 2014, the Company recorded $3.4 million gain, as a component of other non-operating income net, from proceeds for a life insurance policy triggered by the death of a former executive. This life insurance policy relates to an inactive program for key executives. There are six retired executives remaining in this program and current management is ineligible to participate.
20.18. QUARTERLY RESULTS OF OPERATIONS (UNAUDITED)
The unaudited quarterly results of operations for the years ended June 30, 20152018 and 20142017 are as follows (in thousands, except for per share data):
| | | 2015 | | 2018 |
| First | | Second | | Third | | Fourth | First | | Second | | Third | | Fourth |
Net sales | $ | 202,027 | | $ | 189,337 | | $ | 180,999 | | $ | 199,779 | $ | 214,379 | | $ | 209,751 | | $ | 216,743 | | $ | 227,508 |
Gross profit | | 66,112 | | | 58,800 | | | 57,258 | | | 65,316 | | 74,181 | | | 71,526 | | | 73,772 | | | 82,320 |
Net income (loss) | | 14,552 | | | 11,184 | | | 12,626 | | | 16,381 | |
Net income | | | 13,998 | | | (2,807) | | | 12,800 | | | 12,610 |
EARNINGS PER SHARE(1) | | | | | | | | | | | | | | | | | | | | | | |
Basic | $ | 1.18 | | $ | 0.89 | | $ | 1.01 | | $ | 1.29 | $ | 1.10 | | $ | (0.22) | | $ | 1.01 | | $ | 0.99 |
Diluted | $ | 1.16 | | $ | 0.88 | | $ | 1.00 | | $ | 1.27 | $ | 1.10 | | $ | (0.22) | | $ | 1.00 | | $ | 0.99 |
| | | | | | | | | | | | | | | | | | | | | | |
| | 2014 | | 2017 |
| First | | Second | | Third | | Fourth | First | | Second | | Third | | Fourth |
Net sales | $ | 178,140 | | $ | 166,540 | | $ | 174,160 | | $ | 197,340 | $ | 179,600 | | $ | 173,854 | | $ | 184,715 | | $ | 217,089 |
Gross profit | | 60,405 | | | 55,894 | | | 57,572 | | | 64,398 | | 61,776 | | | 56,894 | | | 61,348 | | | 72,736 |
Net income (loss) | | 9,082 | | | 10,517 | | | 13,220 | | | 10,047 | |
Net income | | | 14,344 | | | 10,442 | | | 7,660 | | | 14,131 |
EARNINGS PER SHARE(1) | | | | | | | | | | | | | | | | | | | | | | |
Basic | $ | 0.97 | | $ | 0.84 | | $ | 1.05 | | $ | 1.08 | $ | 1.13 | | $ | 0.82 | | $ | 0.60 | | $ | 1.12 |
Diluted | $ | 0.96 | | $ | 0.83 | | $ | 1.04 | | $ | 1.07 | $ | 1.12 | | $ | 0.82 | | $ | 0.60 | | $ | 1.11 |
(1)Basic and diluted earnings per share are computed independently for each reporting period. Accordingly, the sum of the quarterly earnings per share amounts may not agree to the year-to-date amounts.
During the fourth quarter of fiscal 2017, we adopted Accounting Standards Update (ASU) 2016-09 requiring the recognition of excess tax benefits as a component of income tax expense which were historically recognized in equity. As required, our Q1-Q3 2017 results have been recast to allocate $0.6 million of the benefit to the applicable periods. In addition, the ASU requires a prospective update to the treasury method of calculating weighted average diluted shares outstanding resulting in the inclusion of additional shares in our diluted EPS calculation.
68
19. DISPOSAL OF A BUSINESS
During the first quarter of fiscal year 2017, the Company sold its U.S. Roll Plate and Machinery business, as it was not strategic and did not meet our growth and return expectations. This divestiture also allows the Company’s management to focus on higher growth and better return businesses within the Engraving segment.
During the fourth quarter of fiscal year 2016, the Company recorded a $7.3 million non-cash loss to adjust the net assets of the business to their net realizable value. The expense is recorded as a component of Other Operating Income, net. The sale of the business does not constitute a significant strategic shift that will have a major effect on the entity’s operations and financial results.
20. SUBSEQUENT EVENT
On August 23, 2018, the Company announced that it had acquired Michigan-based Tenibac-Graphion, Inc., a provider of chemical and laser texturing services. Privately held Tenibac-Graphion, Inc. reported revenues of $25 million for the year ended December 31, 2017. The acquisition closed during August 2018, and will be reporting operating results into our Engraving segment.
69
REPORT OF INDEPENDENT REGISTERED PUBLIC ACCOUNTING FIRM
Board of Directors and StockholdersShareholders
Standex International Corporation
Opinion on the financial statements
We have audited the accompanying consolidated balance sheetsheets of Standex International Corporation (a Delaware corporation) and subsidiaries (the “Company”) as of June 30, 2015,2018 and 2017, and the related consolidated statements of operations, comprehensive income, changes in stockholders’ equity, and cash flows for each of the yearthree years in the period ended June 30, 2015. 2018, and the related notes (collectively referred to as the “financial statements”). In our opinion, thefinancial statements present fairly, in all material respects, the financial position of the Companyas of June 30, 2018 and 2017, and the results of itsoperations and itscash flows for each of the three years in the period ended June 30, 2018, in conformity with accounting principles generally accepted in the United States of America.
We also have audited, in accordance with the standards of the Public Company Accounting Oversight Board (United States) (“PCAOB”), the Company’s internal control over financial reporting as of June 30, 2018, based on criteria established in the 2013Internal Control—Integrated Framework issued by the Committee of Sponsoring Organizations of the Treadway Commission (COSO), and our report dated August 28, 2018 expressed an unqualified opinion.
Basis for opinion
These financial statements are the responsibility of the Company’s management. Our responsibility is to express an opinion on thesethe Company’s financial statements based on our audit.
audits. We are a public accounting firm registered with the PCAOB and are required to be independent with respect to the Company in accordance with the U.S. federal securities laws and the applicable rules and regulations of the Securities and Exchange Commission and the PCAOB.
We conducted our auditaudits in accordance with the standards of the Public Company Accounting Oversight Board (United States).PCAOB. Those standards require that we plan and perform the audit to obtain reasonable assurance about whether the financial statements are free of material misstatement. An audit includesmisstatement, whether due to error or fraud. Our audits included performing procedures to assess the risks of material misstatement of the financial statements, whether due to error or fraud, and performing procedures that respond to those risks. Such procedures included examining, on a test basis, evidence supporting the amounts and disclosures in the financial statements. An auditOur audits also includes assessingincluded evaluating the accounting principles used and significant estimates made by management, as well as evaluating the overall financial statement presentation. We believe that our audit provides a reasonable basis for our opinion.
In our opinion, the consolidated financial statements referred to above present fairly, in all material respects,presentation of the financial position of Standex International Corporation and subsidiaries as of June 30, 2015, and the results of their operations and their cash flows for the year ended June 30, 2015 in conformity with accounting principles generally accepted in the United States of America.
We also have audited, in accordance with the standards of the Public Company Accounting Oversight Board (United States), the Company’s internal control over financial reporting as of June 30, 2015, based on criteria established in the 2013 Internal Control—Integrated Framework issued by the Committee of Sponsoring Organizations of the Treadway Commission (COSO), and our report dated August 27, 2015 expressed an unqualified opinion.
/s/ GRANT THORNTON LLP
Boston, Massachusetts
August 27, 2015
REPORT OF INDEPENDENT REGISTERED PUBLIC ACCOUNTING FIRM
To the Board of Directors and Stockholders of
Standex International Corporation
Salem, New Hampshire
We have audited the accompanying consolidated balance sheet of Standex International Corporation and subsidiaries (the “Company”) as of June 30, 2014, and the related consolidated statements of operations, comprehensive (loss) income, equity and cash flows for the years ended June 30, 2014 and 2013. These financial statements are the responsibility of the Company's management. Our responsibility is to express an opinion on these financial statements based on our audits.
We conducted our audits in accordance with the standards of the Public Company Accounting Oversight Board (United States). Those standards require that we plan and perform the audit to obtain reasonable assurance about whether the financial statements are free of material misstatement. An audit includes examining, on a test basis, evidence supporting the amounts and disclosures in the financial statements. An audit also includes assessing the accounting principles used and significant estimates made by management, as well as evaluating the overall financial statement presentation. We believe that our audits provide a reasonable basis for our opinion.
In our opinion, such consolidated and combined financial statements present fairly, in all material respects, the financial position of Standex International Corporation and subsidiaries as of June 30, 2014, and the results of their operations and their cash flows for the years ended June 30, 2014 and 2013, in conformity with accounting principles generally accepted in the United States of America.
/s/ DELOITTE & TOUCHEGRANT THORNTON LLP
We have served as the Company’s auditor since 2015.
Boston, Massachusetts
August 28, 20142018
70
Item 9. Changes In and Disagreements with Accountants on Accounting and Financial Disclosure
Not Applicable
Item 9A. Controls and Procedures
The management of the Company including its Chief Executive Officer, and Chief Financial Officer, have conducted an evaluation of the effectiveness of the Company’s disclosure controls and procedures (as such term is defined in Rules 13a-15(e) and 15(d)-15(e) under the Securities Exchange Act of 1934, as amended, (the “Exchange Act”) as of the end of the period covered by this report. Based on that evaluation, the Chief Executive Officer and Chief Financial Officer concluded as of June 30, 2015,2018, that the disclosure controls and procedures are effective in ensuring that the information required to be disclosed by the Company in reports that it files or submits under the Exchange Act is (i) recorded, processed, summarized and reported within the time periods specified in the Commission's rules and forms and (ii) that such information is accumulated and communicated to the Company’s management, including its Chief Executive Officer and Chief Financial Officer as appropriate to allow timely decisions regarding required disclosure.
SEC guidance permits the exclusion of an evaluation of the effectiveness of a registrant's disclosure controls and procedures as they relate to the internal control over financial reporting for an acquired business during the first year following such acquisition. As discussed in Note 2 to the consolidated financial statements contained in this Report;Report, the Company acquired all of the outstanding stock of MPE Aeroengines, Inc. including its wholly owned subsidiary Enginetics Corporation, (“Enginetics”) on September 4, 2014. Engineticsthe Piazza Rosa Group. The acquisition represents 3.1%approximately 1.5% of the Company's consolidated revenue for the year ended June 30, 20152018, and approximately 10.1%1.8% of the Company's consolidated assets at June 30, 2015.2018. Management's evaluation and conclusion as to the effectiveness of the design and operation of the Company’s disclosure controls and procedures as of June 30, 20152018 excludes any evaluation of the internal control over financial reporting of Enginetics.the Piazza Rosa Group.
There were no changes in the Company’s internal control over financial reporting identified in connection with management’s evaluation that occurred during the fourth quarter of our fiscal year (ended June 30, 2015)2018) that has materially affected, or is reasonably likely to materially affect our internal control over financial reporting.
Management's Report on Internal Control over Financial Reporting
The management of Standex is responsible for establishing and maintaining adequate internal control over financial reporting (as defined in Section 240.13a-15(f) of the Exchange Act). The Company’s internal control over financial reporting is designed to provide reasonable assurance as to the reliability of the Company’s financial reporting and the preparation of financial statements for external purposes in accordance with generally accepted accounting principles. Management, including the Chief Executive Officer and the Chief Financial Officer, assessed the effectiveness of our internal control over financial reporting as of the end of the fiscal year covered by this report on Form 10-K. In making this assessment, management used the criteria established by the Committee of Sponsoring Organizations of the Treadway Commission in “Internal Control-Integrated Framework (2013).” These criteria are in the areas of control environment, risk assessment, control activities, information and communication and monitoring. Management’s assessment included documenting, evaluating and testing the design and operating effectiveness of our internal control over financial reporting.
Based on the Company’s processes, as described above, management, including the Chief Executive Officer and the Chief Financial Officer, has concluded that our internal control over financial reporting was effective as of June 30, 20152018 to provide reasonable assurance of achieving its objectives. These results were reviewed with the Audit Committee of the Board of Directors. Grant Thornton, LLP, the independent registered public accounting firm that audited our consolidated financial statements included in this Annual Report on Form 10-K, has issued an unqualified attestation report on the Company’s internal control over financial reporting, which is included below.
Inherent Limitation on Effectiveness of Controls
No matter how well designed, internal control over financial reporting has inherent limitations. Internal control over financial reporting determined to be effective can provide only reasonable, not absolute, assurance with respect to financial statement preparation and may not prevent or detect all misstatements that might be due to error or fraud. In addition, a design of a control system must reflect the fact that there are resource constraints, and the benefits of controls must be considered relative to their costs. Because of the inherent limitations in all control systems, no evaluation of controls can provide absolute assurance that all control issues and instances of fraud, if any, within the Company have been detected.
71
REPORT OF INDEPENDENT REGISTERED PUBLIC ACCOUNTING FIRM
Board of Directors and StockholdersShareholders
Standex International Corporation
Opinion on internal control over financial reporting
We have audited the internal control over financial reporting of Standex International Corporation (a Delaware corporation) and subsidiaries (the “Company”) as of June 30, 2015,2018, based on criteria established in the 2013Internal Control—Integrated Framework issued by the Committee of Sponsoring Organizations of the Treadway Commission (COSO)(“COSO”). In our opinion, the Company maintained, in all material respects, effective internal control over financial reporting as of June 30, 2018, based on criteria established in the 2013Internal Control—Integrated Framework issued by COSO.
We also have audited, in accordance with the standards of the Public Company Accounting Oversight Board (United States) (“PCAOB”), the consolidated financial statements of the Company as of and for the year ended June 30, 2018, and our report dated August 28, 2018 expressed an unqualified opinion on those financial statements.
Basis for opinion
The Company’s management is responsible for maintaining effective internal control over financial reporting and for its assessment of the effectiveness of internal control over financial reporting, included in the accompanying Management’s Report on Internal Control over Financial Reporting (“Management’s Report”). Our responsibility is to express an opinion on the Company’s internal control over financial reporting based on our audit. Our audit of,We are a public accounting firm registered with the PCAOB and opinion on,are required to be independent with respect to the Company’s internal control over financial reporting does not includeCompany in accordance with the internal control over financial reporting of Enginetics Corporation, a wholly-owned subsidiary, whose financial statements reflect total assetsU.S. federal securities laws and revenues constituting 10%the applicable rules and 4% percent, respectively,regulations of the related consolidated financial statement amounts as ofSecurities and forExchange Commission and the year ended June 30, 2015. As indicated in Management’s Report, Enginetics Corporation was acquired during the year ended June 30, 2015. Management’s assertion on the effectiveness of the Company’s internal control over financial reporting excluded internal control over financial reporting of Enginetics Corporation.
PCAOB.
We conducted our audit in accordance with the standards of the Public Company Accounting Oversight Board (United States).PCAOB. Those standards require that we plan and perform the audit to obtain reasonable assurance about whether effective internal control over financial reporting was maintained in all material respects. Our audit included obtaining an understanding of internal control over financial reporting, assessing the risk that a material weakness exists, testing and evaluating the design and operating effectiveness of internal control based on the assessed risk, and performing such other procedures as we considered necessary in the circumstances. We believe that our audit provides a reasonable basis for our opinion.
Our audit of, and opinion on, the Company’s internal control over financial reporting does not include the internal control over financial reporting of Piazza Rosa S.r.l. (“Piazza Rosa”), a wholly-owned subsidiary, whose financial statements reflect total assets and revenues constituting 1.8 and 1.5 percent, respectively, of the related consolidated financial statement amounts as of and for the year ended June 30, 2018. As indicated in Management’s Report, Piazza Rosa was acquired during 2018. Management’s assertion on the effectiveness of the Company’s internal control over financial reporting excluded internal control over financial reporting of Piazza Rosa.
Definition and limitations of internal control over financial reporting
A company’s internal control over financial reporting is a process designed to provide reasonable assurance regarding the reliability of financial reporting and the preparation of financial statements for external purposes in accordance with generally accepted accounting principles. A company’s internal control over financial reporting includes those policies and procedures that (1) pertain to the maintenance of records that, in reasonable detail, accurately and fairly reflect the transactions and dispositions of the assets of the company; (2) provide reasonable assurance that transactions are recorded as necessary to permit preparation of financial statements in accordance with generally accepted accounting principles, and that receipts and expenditures of the company are being made only in accordance with authorizations of management and directors of the
72
company; and (3) provide reasonable assurance regarding prevention or timely detection of unauthorized acquisition, use, or disposition of the company’s assets that could have a material effect on the financial statements.
Because of its inherent limitations, internal control over financial reporting may not prevent or detect misstatements. Also, projections of any evaluation of effectiveness to future periods are subject to the risk that controls may become inadequate because of changes in conditions, or that the degree of compliance with the policies or procedures may deteriorate.
In our opinion, the Company maintained, in all material respects, effective internal control over financial reporting as of June 30, 2015, based on criteria established in the 2013 Internal Control—Integrated Framework issued by COSO.
We also have audited, in accordance with the standards of the Public Company Accounting Oversight Board (United States), the consolidated financial statements of the Company as of and for the year ended June 30, 2015, and our report dated August 27, 2015 expressed an unqualified opinion on those financial statements.
/s/ GRANT THORNTON LLP
Boston, Massachusetts
August 27, 201528, 2018
73
Item 9B. Other Information
None
PART III
Item 10. Directors, Executive Officers and Corporate Governance
The Company will file with the Securities and Exchange Commission (“SEC”) a definitive Proxy Statement no later than 120 days after the close of the fiscal year ended June 30, 20152018 (the “Proxy Statement”). The information required by this item and not provided in Part 1 of this report under Item 1 “Executive Officers of Standex” is incorporated by reference from the Proxy Statement under the captions “Election of Directors,” “Stock Ownership in the Company,” “Other Information Concerning the Company, Board of Directors and its Committees” and “Section 16(a) Beneficial Ownership Reporting Compliance.”
There have been no material changes to the procedures by which security holders may recommend nominees to our Board of Directors. Information regarding the process for identifying and evaluating candidates for director are set forth and incorporated in reference to the information in the Proxy Statement under the caption “Corporate Governance/Nominating Committee Report.”
Information regarding the Audit Committee Financial Expert and the identification of the Audit Committee is incorporated by reference to the information in the Proxy Statement under the caption “Other Information Concerning the Company, Board of Directors and its Committee, Audit Committee.” The Audit Committee is established in accordance with Section 3(a)(58)(A) of the Securities Exchange Act.
We maintain a corporate governance section on our website, which includes our code of ethics for senior financial management that applies to our chief executive officer, principal financial officer, principal accounting officer, controller or persons performing similar functions. Our corporate governance section also includes our code of business conduct and ethics for all employees. In addition, we will promptly post any amendments to or waivers of the code of ethics for senior financial management on our website. You can find this and other corporate governance information at www.standex.com.
Item 11. Executive Compensation
Information regarding executive compensation is incorporated by reference from the Proxy Statement under the captions and sub-captions: “Executive Compensation,” “Compensation Discussion and Analysis,” “Report of the Compensation“Compensation Committee Report,” “2015“2018 Summary Compensation Table,” “Other Information Concerning the Company, Board of Directors and Its Committees,” and “Directors Compensation.”
Item 12. Security Ownership of Certain Beneficial Owners and Management and Related Stockholder Matters
The stock ownership of each person known to Standex to be the beneficial owner of more than 5% of its Common Stock is incorporated by reference in the Proxy Statement under the caption “Stock Ownership of Certain Beneficial Owners.” The beneficial ownership of Standex Common Stock of all directors and executive officers of the Company is incorporated by reference in the Proxy Statement under the caption and sub-caption “Stock Ownership in the Company” and “Stock Ownership by Directors, Nominees for DirectorsDirector and Executive Officers,” respectively.
74
The Equity Compensation Plan table below represents information regarding the Company’s equity based compensation plan at June 30, 2015.2018.
| | (A) | | (B) | | (C) | (A) | | (B) | | (C) |
| Number of Securities To | | Weighted-Average | | Number of Securities Remaining | Number of Securities To | | Weighted-Average | | Number of Securities Remaining |
| Be Issued Upon Exercise | | Exercise Price Of | | Available For Future Issuance Under | Be Issued Upon Exercise | | Exercise Price Of | | Available For Future Issuance Under |
| Of Outstanding Options, | | Outstanding Options, | | Equity Compensation Plans (Excluding | Of Outstanding Options, | | Outstanding Options, | | Equity Compensation Plans (Excluding |
Plan Category | Warrants And Rights | | Warrants And Rights | | Securities reflected in Column (A)) | Warrants And Rights | | Warrants And Rights | | Securities reflected in Column (A)) |
Equity compensation plans approved by stockholders | 201,132 | |
$ 9.03 | |
390,394 | 209,985 | | $ 9.85 | | 157,921 |
Equity compensation plans not approved by stockholders | - | | - | | - | - | | - | | - |
Total | 201,132 | | $ 9.03 | | 390,394 | 209,985 | | $ 9.85 | | 157,921 |
The Company has one equity compensation plan, approved by stockholders, under which equity securities of the Company have been authorized for issuance to employees and non-employee directors. This plan is further described in the “Notes to Consolidated Financial Statements” under the heading “Stock-Based Compensation and Purchase Plans.”
Item 13. Certain Relationships and Related Transactions and Director Independence
Information regarding certain relationships and related transactions is incorporated by reference in the Proxy Statement under the caption and sub-caption “Certain Relationships and Related Transactions” And “Stock Ownership by Directors, Nominees for Director and Executive Officers,” respectively.
Information regarding director independence is incorporated by reference in the Proxy Statement under the caption “Election of Directors - Determination of Independence.”
Item 14. Principal Accountant Fees and Services
This Information in addition to information regarding aggregate fees billed for each of the last two fiscal years for professional services rendered by the professional accountant for audit of the Company’s annual financial statements and review of financial statements included in the Company’s Form 10-K as well as others are incorporated by reference in the Proxy Statement under the caption “Independent Auditors’ Fees.”
PART IV
Item 15. Exhibits and Financial Statement Schedules
(a)(1)
1.Financial Statements
Financial Statements covered by the Reports of Independent Registered Public Accounting Firm
(A)
Consolidated Statements of Operations for the fiscal years ended June 30, 2015, 20142018, 2017 and 20132016
(B)
Consolidated Balance Sheets as of June 30, 20152018 and 20142017
(C)
Consolidated Statements of Stockholders’ Equity and Comprehensive Income for the fiscal years ended June 30, 2015, 20142018, 2017 and 20132016
(D)Consolidated Statements of Stockholders’ Equity for the fiscal years ended June 30, 2018, 2017 and 2016
(E)Consolidated Statements of Cash Flows for the fiscal years ended June 30, 2015, 20142018, 2017 and 20132016
(E)
(F)Notes to Consolidated Financial Statements
(2)
2.Financial Statements Schedule
The following financial statement schedule is included as required by Item 8 to this report on Form 10-K
Schedule II – Valuation and Qualifying Accounts is included in the Notes to Consolidated Financial Statements
All other schedules are not required and have been omitted
(3)
Exhibits
Incorporated
Incorporated
75
Exhibit
by Reference Filed
Filed
Number
Exhibit Description Form DateHerewith
Form
Date3.Exhibits
Herewith
(b)
3.
(i)
Restated Certificate of Incorporation of Standex,
10-Q
12/31/1998
dated October 27, 1998 filed as Exhibit 3(i).
(ii)
By-Laws of Standex, as amended, and restated
8-K
2/4/2015
effective January 30, 2015 filed as Item 5.03, Exhibit 3.1
4.10.(a)Employment Agreement dated10-K6/30/2016
(a)
Agreement ofJanuary, 20, 2014 between the Company dated September 15, 1981,
10-Kand David Dunbar*
6/30/1981
to furnish a copy of any instrument with respect to
certain other long-term debt to the Securities and
Exchange Commission upon its request filed as
Exhibit 4.
10.
(a)
(b)Amended and Restated Employment Agreement
10-K
6/30/2010
dated August 25, 2010 between the Company
and Roger L. Fix*
(b)
Non-Competition Agreement between the
8-K
12/3/2014
Company and John Abbott dated December 1, 2014
Filed as Item 5.02(e), Exhibit 10*
(c)
Amended and Restated Employment Agreement
10-K
6/30/2010
dated August 25, 2010 between the Company
and John Abbott*
(d)
Amended and Restated Employment Agreement
10-K
6/30/2010
dated August 25, 2010 between the Company
and Thomas D. DeByle*
(e)
Amended and Restated (c)Employment Agreement dated10-K6/30/2016
10-K
6/30/2010
dated August 25, 2010April 4, 2016 between the Company
and Deborah A. Rosen*Alan J. Glass*
(f)
(d)Employment Agreement dated10-K6/30/2016
10-Q
9/30/2013
August 2, 201217, 2015 between the Company
And Michael A. Patterson*and Ross McGovern*
(g)(e)Employment Agreement dated10-K6/30/2016
July 27, 2015 between the Company
and Paul Burns*
(f)Standex International Corporation Amended and
10-K
6/30/2012
And Restated 2008 Long Term Incentive Plan,
effective October 28, 2008. Filed as Exhibit 10.*
(h)
Standex International Corporation Executive
10-Q
3/31/2001
Security Program, as amended and restated on
January 31, 2001 filed as Exhibit 10(a).*
(i)
(g)Standex International Corporation Executive Life
10-K
6/30/2001
Insurance Plan effective April 27, 1994 and as
Amended and restated on April 25, 2001 filed
as Exhibit 10(k).*
(j)
(h)Standex International Corporation Supplemental
10-K
6/30/1995
Retirement Plan adopted April 26, 1995 and
Amended on July 26, 1995 filed as Exhibit 10(n).*
(k)
(i)Form of Indemnification Agreement for directors
8-K
5/5/2008
and executive officers of the Company filed as
Item 1.01, Exhibit 10.*
(l)(j)Standex International Corporation Long Term10-K6/30/2018
Executive Officer long-term performance shareIncentive Plan Award
8-K
8/28/2008
Unit awards filed as Item 5.02.*
(m)
(k)Standex Deferred Compensation Plan for highly
8-K
1/31/2008
compensated employees filed as Item 5.02.*
(l)Code of Ethics for Chief Executive Officer and10-K6/30/2005
(n)Senior Financial Officers is incorporated by
Restricted Stock Unit Award granted to Roger L.
8-K
1/27/2006
Fix dated January 25, 2006 filedreference as Item 1.01.*Exhibit 14.
76
(o)
(m)Amended and Restated Credit Agreement
8-K
12/19/2014
Dated December 19, 2014 by and among
Standex International Corporation, Citizens Bank, N.A.;
Bank of America, N.A.; TD Bank, N.A.;
JPMorgan Chase Bank, N.A.; Branch Banking
& Trust Company and Santander Bank, N.A.
Filed as Item 1.01, Exhibit 10
(p)
Amendment to Directors’ Compensation Program
8-K
11/2/2006
for members of the Board of Directors of the
Company filed as Item 1.01.*
(q)
(n)Stock Purchase Agreement dated as of October 17,10-Q9/30/2016
2016 by and among MPEStandex International
10Q/ACorporation, as buyer, and Gregory J. Deutschmann,
11/3/2014
Aeroengines,as sellers, of Horizon Scientific, Inc. the stockholders and optionholders
of MPE Aeroengines, Inc. Morgenthaler Management
Partners VIII, LLC, as Representative and Standex
International Corporation Dated August 14, 2014
, filed as Item 1.01,
Exhibit 10
(r)
(o)Share Purchase and Sale Agreement dated July 1, 2014as of February 2,10-Q3/31/2017
X2017 by Mold-Tech Singapore Pte. Ltd. a subsidiary
Betweenof Standex International Corporation, as buyer and
AFS All American Millwork And Fabrication, LLC.Oki Electric Industry Co., Ltd. as sellers, of all
Outstanding stock of Oki Sensor Device Corporation
(r)(English translation of Japanese original document)
Purchase and Sale
10.Employment Agreement dated February 22,10-KX
10-Q
3/31/2012
2012 amongAugust 2, 2016 between the Company Standex Air Distribution,
Products, Inc., Snappy Air Distribution Products, Inc.and James Zupancic*
as Sellers and BW HVAC Operations, LLC and
BW HVAC Real Estate Holdings, LLC as Buyers
Filed as Exhibit 10
(s)
Stock Purchase Agreement
10-K
6/30/2014
dated June 20, 2014 among the Company, as
Buyer, and the shareholders of Ultrafryer Systems, Inc.,
as Sellers filed as Exhibit 10
(t)
Code of Ethics for Chief Executive Officer and
10-K
6/30/2005
Senior Financial Officers is incorporated by
reference as Exhibit 14.
21.
Subsidiaries of Standex International CorporationX
X
23.1
Consent of Independent Registered PublicX
X
Accounting Firm Grant Thornton LLP
23.2
Consent of Independent Registered Public
X
Accounting Firm
24.
Powers of Attorney of Charles H. Cannon, Thomas E.X
X
Chorman, Jeffrey S. Edwards, William R. Fenoglio,
Gerald H. Fickenscher, Roger L. Fix,
Thomas J. Hansen,
Michael Hickey and Daniel B. Hogan and H. Nicholas Muller, III, Ph. D.
31.1
Rule 13a-14(a) Certification of President andX
X
Chief Executive Officer
31.2
Rule 13a-14(a) Certification of Vice President andX
X
Chief Financial Officer
32.
Section 1350 CertificationX
X
101.INS
XBRL Instance Document
101.SCH
XBRL Taxonomy Extension Schema Document
101.CAL
XBRL Taxonomy Extension Calculation Linkbase Document
101.DEF
XBRL Taxonomy Extension Definition Linkbase Document
101.LAB
XBRL Taxonomy Extension Label Linkbase Document
101.PRE
XBRL Taxonomy Extension Presentation Linkbase Document
* Management contract or compensatory plan or arrangement.
77
SIGNATURES
Pursuant to the requirements of Section 13 or 15(d) of the Securities Exchange Act of 1934, Standex International Corporation has duly caused this Annual Report on Form 10-K to be signed on its behalf by the undersigned, thereunto duly authorized, on August 27, 2015.28, 2018.
STANDEX INTERNATIONAL CORPORATION
(Registrant)
/s/ DAVID DUNBAR
David Dunbar
President/Chief Executive Officer
Pursuant to the requirements of the Securities Exchange Act of 1934, this report has been signed below by the following persons on behalf of Standex International Corporation and in the capacities indicated on August 27, 2015:28, 2018:
SignatureTitle
Title
/s/ DAVID DUNBAR
President/Chief Executive Officer
David Dunbar
/s/ THOMAS D. DEBYLE
Vice President/Chief Financial Officer
Thomas D. DeByle
/s/ SEAN VALASHINAS
Chief Accounting Officer / Assistant Treasurer
Sean Valashinas
David Dunbar, pursuant to powers of attorney which are being filed with this Annual Report on Form 10-K, has signed below on August 27, 201528, 2018 as attorney-in-fact for the following directors of the Registrant:
| |
Charles H. Cannon | Roger L. FixThomas J. Hansen
|
Thomas E. Chorman | Thomas J. HansenMichael A. Hickey
|
Jeffrey S. Edwards | Daniel B. Hogan |
William R. Fenoglio
| H. Nicholas Muller, III, Ph.D.
|
Gerald H. Fickenscher | |
| |
/s/ DAVID DUNBAR
David Dunbar
Supplemental Information to be furnished with reports filed pursuant to Section 15(d) of the Act by Registrants which have not registered securities pursuant to Section 12 of the Act.
The Company will furnish its 20152017 Proxy Statement and proxy materials to security holders subsequent to the filing of the annual report on this Form. Copies of such material shall be furnished to the Commission when they are sent to security holders.
78
INDEX TO EXHIBITS
PAGE10Employment Agreement dated August 2, 2016 between the Company and James Zupancic
10(s)
Purchase and Sale Agreement
dated June 30, 2014 among Standex International Corporation, as Seller, and AFS All-American Millwork and Fabrication, LLC, as Buyer
21.
21Subsidiaries of Standex
23.1
23Consent of Independent Registered Public Accounting Firm Grant Thornton LLP
23.2
Consent of Independent Registered Public Accounting Firm
24.
24Powers of Attorney of Charles H. Cannon, Thomas E. Chorman, Jeffrey S. Edwards, William R. Fenoglio, Gerald Fickenscher, Roger L. Fix, Thomas J. Hansen, Michael A. Hickey and Daniel B. Hogan and H. Nicholas Muller, III, Ph.D..
31.1
Rule 13a-14(a) Certification of President and Chief Executive Officer
31.2
Rule 13a-14(a) Certification of Vice President and Chief Financial Officer
32.
32Section 1350 Certification
END OF FORM 10-K
SUPPLEMENTAL INFORMATION FOLLOWS
Board of DirectorsTitle
Title
Roger L. Fix4
Chairman
Charles H. Cannon, Jr.,1, 2, 4
Retired Chairman and CEO, JBT Corporation
Thomas E. Chorman1, 2, 3
CEO, Foam Partners LLC
David Dunbar4
President and Chief Executive OfficerOfficer; Chairman of the Board
Jeffrey S Edwards2, 3
Chairman and Chief Executive Officer, Cooper Standard
Holdings, Inc.
William R. Fenoglio1, 4
Former President/CEO, Augat, Inc.
Gerald H. Fickenscher1, 3
Retired Vice President, Europe, Middle East,
and Africa, Crompton Corporation
Thomas J. Hansen1, 4
Former Vice Chairman of IllinoisToolIllinois Tool Works, Inc.
Michael A. HickeyExecutive Vice President and President of the Global Institutional
Business, Ecolab Inc.
Daniel B. Hogan, Ph. D. 3
Executive Director, Passim Folk Music and Cultural Center
H. Nicholas Muller, III, Ph.D. 2, 3
Former President/CEO, Frank Lloyd Wright Foundation
________________________
1
Member of Audit Committee
2
Member of Compensation Committee
3
Member of Corporate Governance/Nominating Committee
4
Member of Executive Committee
79
Corporate Officers
David Dunbar
President and Chief Executive Officer
Thomas D. DeByle
Vice President, Chief Financial Officer and Treasurer
Deborah A. Rosen
Alan J. GlassVice President, Chief Legal Officer and Secretary
Stacey S. Constas
Corporate Governance Officer and Assistant Secretary
Sean Valashinas
Chief Accounting Officer and Assistant Treasurer
Christopher J. Seiler
Tax Director
Ross McGovernVice President, Chief Human Resources Officer
Operating Management
FOOD SERVICE EQUIPMENT GROUP
Anne De Greef-Safft
GroupPaul BurnsVice President of Food Service Equipment GroupStrategy and Business Development
James ZupancicVice President of Operational Excellence
ENGINEERING TECHNOLOGIES GROUP
Leonard Paolillo
President
ENGRAVING GROUP
Phillip R. Whisman
President
ELECTRONICS PRODUCTS GROUP
John Meeks
President
HYDRAULICS PRODUCTS GROUP
Richard Hiltunen
President
Shareholder Information
Corporate Headquarters
Standex International Corporation
11 Keewaydin Drive, Suite 300
Salem, NH 03079
(603) 893-9701
Facsimile: (603) 893-7324
www.standex.comwww.Standex.com
Common Stock
Listed on the New York Stock Exchange
(Ticker symbol: SXI)
Transfer Agent and RegistrarComputershare
Computershare
250 Royall Street
Canton, MA 07021
(800) 368-5948
www.Computershare.com
Independent Auditors
Grant Thornton LLP
75 State Street, 13th Floor
Boston, MA 02109-1827
Shareholder Services
Stockholders should contact Standex’s Transfer Agent (Computershare, 250 Royall Street, Canton, MA 02021) regarding changes in name, address or ownership of stock; lost certificates of dividends; and consolidation of accounts.
Stockholders’ Meeting
The Annual Meeting of Stockholders will be held at 11:9:00 a.m. on Wednesday,Tuesday, October 28, 201523, 2017 at the Burlington Marriott, One Burlington Mall Road, Burlington, MA 01803.Standex International Corporation’s Corporate Headquarters, 11 Keewaydin Drive 3rd Floor, Salem, NH 03079
1
80