UNITED STATES
SECURITIES AND EXCHANGE COMMISSION
Washington, D.C. 20549
FORM 10-K
|
| | |
| þ | | ANNUAL REPORT PURSUANT TO SECTION 13 OR 15(d) OF THE SECURITIES EXCHANGE ACT OF 1934 |
| | | FOR THE FISCAL YEAR ENDED DECEMBER 31, 20172018 |
OR
|
| | |
| o | | ANNUAL REPORT PURSUANT TO SECTION 13 OR 15(d) OF THE SECURITIES EXCHANGE ACT OF 1934 |
| | | FOR THE TRANSITION PERIOD FROM __________TO __________ |
Commission file number: 001-32743
EXCO RESOURCES, INC.
(Exact name of Registrant as specified in its charter)
|
| | |
Texas (State of incorporation) | | 74-1492779 (I.R.S. Employer Identification No.) |
| | | |
12377 Merit Drive, Suite 1700, Dallas, Texas (Address of principal executive offices) | | 75251 (Zip Code) |
Registrant’s telephone number, including area code: (214) 368-2084
Securities registered pursuant to Section 12 (b) of the Act: None
Securities registered pursuant to Section 12 (g) of the Act: Common Shares, par value $0.001 per share
Indicate by check mark if the registrant is a well-known seasoned issuer, as defined in Rule 405 of the Securities Act. Yes o No þ
Indicate by check mark if the registrant is not required to file reports pursuant to Section 13 or Section 15(d) of the Act. Yes o No þ
Indicate by check mark whether the registrant: (1) has filed all reports required to be filed by Section 13 or 15(d) of the Securities Exchange Act of 1934 during the preceding 12 months (or for such shorter period that the registrant was required to file such reports), and (2) has been subject to such filing requirements for the past 90 days. Yes þ No o
Indicate by check mark whether the registrant has submitted electronically and posted on its corporate website, if any, every Interactive Data File required to be submitted and posted pursuant to Rule 405 of Regulation S-T (§ 232.405 of this chapter) during the preceding 12 months (or for such shorter period that the registrant was required to submit and post such files). Yes þ No o
Indicate by check mark if disclosure of delinquent filers pursuant to Item 405 of Regulation S-K is not contained herein, and will not be contained, to the best of registrant’s knowledge, in definitive proxy or information statements incorporated by reference in Part III of this Form 10-K or any amendment to this Form 10-K. o
Indicate by check mark whether the registrant is a large accelerated filer, an accelerated filer, a non-accelerated filer, a smaller reporting company, or an emerging growth company. See the definitions of “large accelerated filer,” “accelerated filer,” “smaller reporting company,” and “emerging growth company” in Rule 12b-2 of the Exchange Act.
|
| | |
Large accelerated filer o | | Accelerated filer o |
Non-accelerated filer oþ | | Smaller reporting company þ |
Emerging growth company o | | |
If an emerging growth company, indicate by check mark if the registrant has elected not to use the extended transition period for complying with any new or revised financial accounting standards provided pursuant to Section 13(a) of the Exchange Act. o
Indicate by check whether the registrant is a shell company (as defined in Rule 12b-2 of the Exchange Act). Yes o No þ
As of March 8, 2018,2019, the registrant had 21,630,46421,584,514 outstanding common shares, par value $0.001 per share, which is its only class of common shares. As of the last business day of the registrant's most recently completed second fiscal quarter, the aggregate market value of the registrant's common shares held by non-affiliates was approximately $29,307,000.$1,501,809.
DOCUMENTS INCORPORATED BY REFERENCE
The registrant intends to file an amendment on Form 10-K/A not later than 120 days after the close of the fiscal year ended December 31, 2017.2018. Portions of such amendment will be incorporated by reference into Part III, Items 10-14 of this Annual Report on Form 10-K.
EXCO RESOURCES, INC.
TABLE OF CONTENTS
EXCO RESOURCES, INC.
PART I
Item 1. Business
General
Unless the context requires otherwise, references in this Annual Report on Form 10-K to “EXCO,” “EXCO Resources,” “Company,” “we,” “our,” and “us” are to EXCO Resources, Inc. and its consolidated subsidiaries.
We have provided definitions of terms commonly used in the oil and natural gas industry in the “Glossary of selected oil and natural gas terms” section of this Annual Report on Form 10-K.
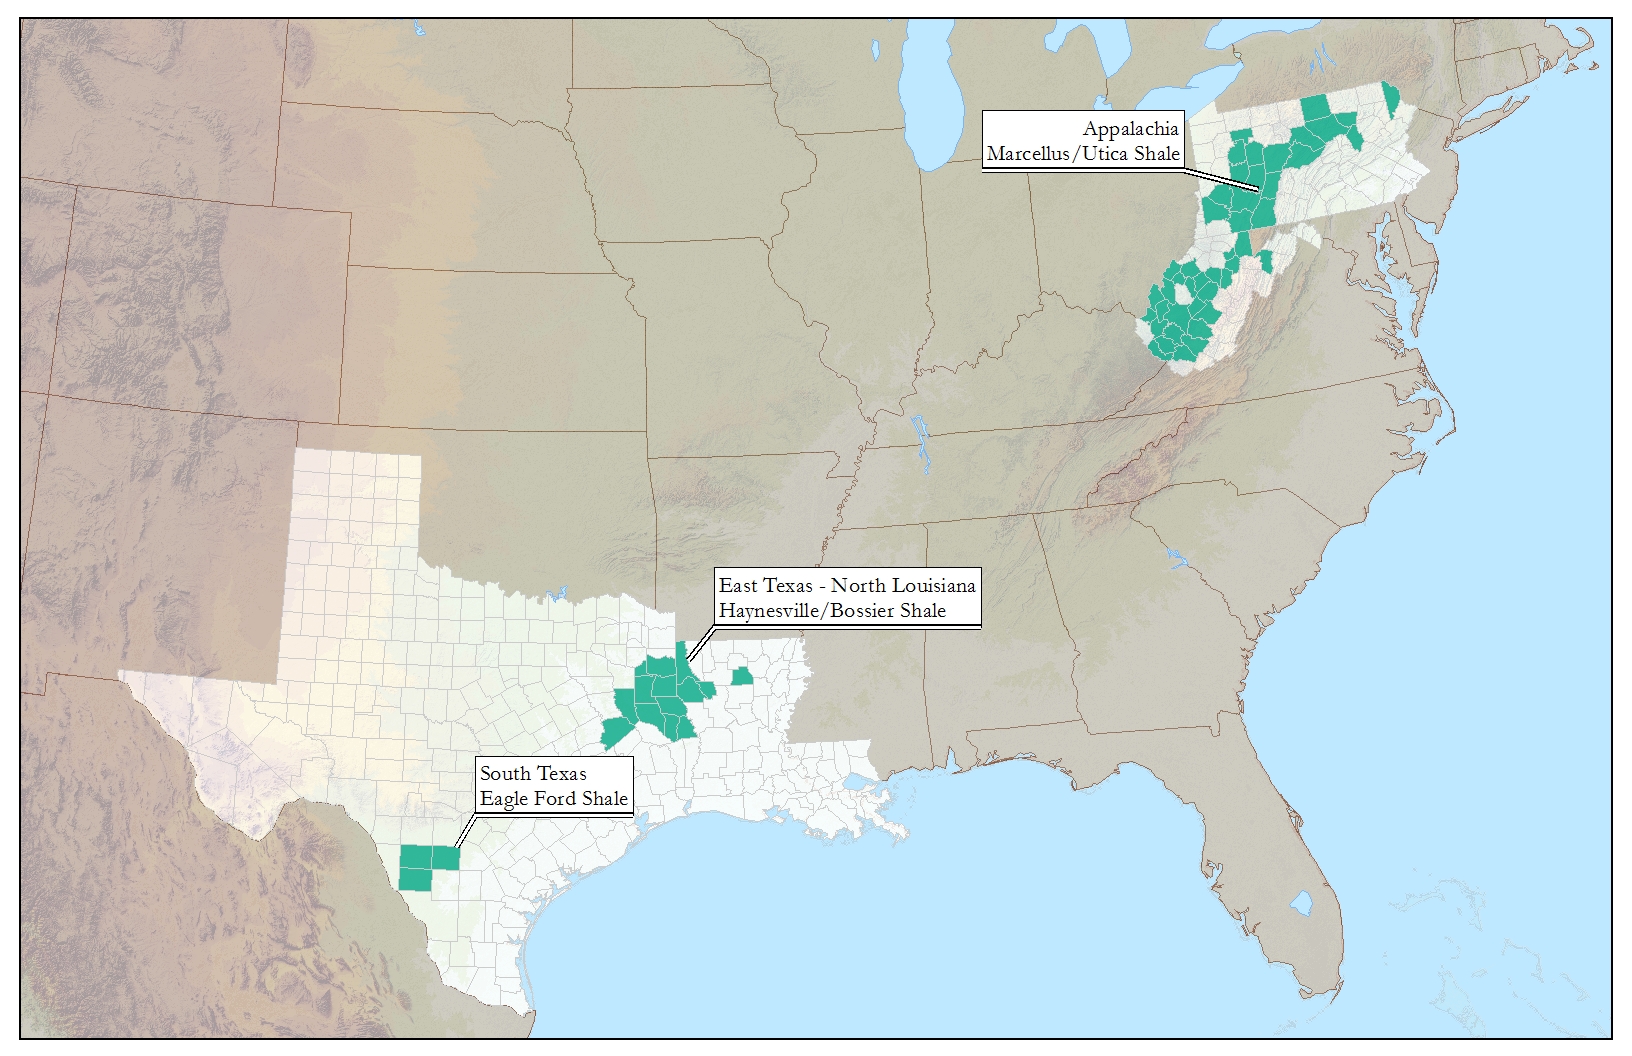
We are an independent oil and natural gas company engaged in the exploration, exploitation, acquisition, development and production of onshore U.S. oil and natural gas properties with a focus on shale resource plays. Our principal operations are conducted in certain key U.S. oil and natural gas areas including Texas, Louisiana and the Appalachia region. Our primary strategy focuses on the exploitation and development of our shale resource plays and the pursuit of leasing and acquisition opportunities.
Bankruptcy proceedings under Chapter 11
On January 15, 2018 ("Petition Date"), the Company and certain of its subsidiaries, including EXCO Services, Inc., EXCO Partners GP, LLC, EXCO GP Partners OLP, LP, EXCO Partners OLP GP, LLC, EXCO Operating Company, LP, EXCO Midcontinent MLP, LLC, EXCO Holding (PA), Inc., EXCO Production Company (PA), LLC, EXCO Resources (XA), LLC, EXCO Production Company (WV), LLC, EXCO Land Company, LLC, EXCO Holding MLP, Inc., Raider Marketing, LP, Raider Marketing GP, LLC (collectively, the “Filing Subsidiaries” and, together with the Company, the “Debtors”), filed voluntary petitions for relief under Chapter 11 of the United States Bankruptcy Code (“Bankruptcy Code”) in the United States Bankruptcy Court for the Southern District of Texas (“Court”). The Chapter 11 cases are being jointly administered under the caption In Re EXCO Resources, Inc., Case No. 18-30155 (MI) ("Chapter 11 Cases"). The Court granted all of the first day motions filed by the Debtors that were designed primarily to minimize the impact of the Chapter 11 proceedings on our operations, customers and employees. We will continue to operate our businesses as “debtors in possession” under the jurisdiction of the Court and in accordance with the applicable provisions of the Bankruptcy Code and orders of the Court. We expect to continue our operations without interruption during the pendency of the Chapter 11 proceedings.
DIP Credit Agreement
On January 22, 2018, we closed a debtor-in-possession credit agreement (“DIP Credit Agreement”) with lenders including affiliates of Fairfax Financial Holdings Limited (“Fairfax”), Bluescape Resources Company LLC (“Bluescape”) and JPMorgan Chase Bank, N.A. (collectively the “DIP Lenders”). The DIP Credit Agreement includes a senior secured debtor-in-possession revolving credit facility in an aggregate principal amount of $125.0 million (“Revolver A Facility”) and a senior secured debtor-in-possession revolving credit facility in an aggregate principal amount of $125.0 million (“Revolver B Facility”, and together with the Revolver A Facility, the “DIP Facilities”). Proceeds from the DIP Facilities were used to repay all obligations outstanding under our previous revolving credit agreement ("EXCO Resources Credit Agreement") and will provide additional liquidity to fund our operations during the Chapter 11 Cases. On January 15, 2019, we entered into an amendment to the DIP Credit Agreement to extend the maturity date from January 22, 2019 to May 22, 2019. See further discussion of the DIP Credit Agreement in “Note 5. Debt” in the Notes to our Consolidated Financial Statements.
Impact on our indebtedness
The commencement of the Chapter 11 Cases constituted an event of default that accelerated our obligations under the EXCO Resources Credit Agreement, senior secured 1.5 lien notes due March 20, 2022 (“1.5 Lien Notes”), senior secured 1.75 lien term loans due October 26, 2020 (“1.75 Lien Term Loans”), senior unsecured notes due September 15, 2018 (“2018 Notes”), and senior unsecured notes due April 15, 2022 (“2022 Notes”). These debt instruments provide that as a result of the commencement of the Chapter 11 Cases, the principal and interest due thereunder shall be immediately due and payable. Any efforts to enforce such payment obligations under the debt instruments are automatically stayed as a result of the commencement of the Chapter 11 Cases, and the creditors’ rights of enforcement with respect to the debt instruments are subject to the applicable provisions of the Bankruptcy Code. On February 22, 2018, the Court approved our ability to make
adequate protection payments for interest on the DIP Credit Agreement and the 1.5 Lien Notes. See further discussion of the impact in “Note 5. Debt” in the Notes to our Consolidated Financial Statements.
Rejection of executory contracts
Subject to certain exceptions, under the Bankruptcy Code, the Debtors may assume, assign, or reject certain executory contracts and unexpired leases subject to the approval of the Court and fulfillment of certain other conditions. The rejection of an executory contract or unexpired lease is generally treated as a breach as of the Petition Date of such executory contract or unexpired lease and, subject to certain exceptions, relieves the Debtors of performing their future obligations under such executory contract or unexpired lease but may give rise to a general unsecured claim against the Company or the applicable Filing Subsidiaries for damages caused by such rejection.
During March 2018, the Court approved the rejection of certain executory contracts related to the sale, marketing and transportation of natural gas in the North Louisiana region. On November 19, 2018, the Court approved an agreement to settle any claims related to a minimum volume commitment for gathering services in the East Texas and North Louisiana regions.
On August 9, 2018, the Court approved the rejection of the office lease for our corporate headquarters in Dallas, Texas. We subsequently entered into a new lease for a reduced amount of square footage in the same office building with a term through December 31, 2022. See further discussion of the impact of the rejection and settlement of executory contracts as part of “Note 1. Organization and basis of presentation” in the Notes to our Consolidated Financial Statements.
Status of plan of reorganization
On October 1, 2018, the Debtors filed a Settlement Joint Chapter 11 Plan of Reorganization (the “October 2018 Plan”) and related Disclosure Statement with the Court. As is customary in bankruptcy proceedings, the Debtors subsequently filed amendments to the October 2018 Plan and related Disclosure Statement with the Court. The distributions under the October 2018 Plan were expected to be funded with: (i) cash on hand; (ii) a new revolving credit facility; (iii) a new second lien debt instrument; (iv) the equity in the reorganized Company; and, (v) the D&O Proceeds, as defined below.
On November 5, 2018, the Court authorized us to solicit acceptances of the October 2018 Plan and approved the Disclosure Statement and other related solicitation materials and procedures necessary to approve the October 2018 Plan. Simultaneous with the solicitation process, we initiated a marketing process for the issuance of the new revolving credit facility and the new second lien debt instrument. During the course of the marketing process, oil prices experienced a significant decline and overall market conditions worsened. As a result, we were not able to obtain the exit financing required to consummate the October 2018 Plan. On February 15, 2019, the Court approved a motion to extend the filing exclusivity period through April 1, 2019 and the solicitation exclusivity period through May 31, 2019.
On March 8, 2019, the Debtors filed a Second Amended Joint Chapter 11 Plan of Reorganization (“March 2019 Plan”) and related Disclosure Statement with the Court. The March 2019 Plan provides for either a reorganization of the Debtors as a going concern or the sale of the Debtors’ assets (“All Asset Sale”). The Debtors will make a final determination regarding which path to pursue by the date of the hearing to approve the Disclosure Statement. The March 2019 Plan included the following key elements:
Holders of the DIP Credit Agreement will receive payment in full in cash with proceeds from either a new revolving credit facility (“Exit Facility”) or, in the event of an All Asset Sale, proceeds from the sale of assets;
Holders of allowed 1.5 Lien Notes claims will receive either their pro rata share of a new mandatorily convertible security or, in the event of an All Asset Sale, the liens securing such allowed claim;
Holders of allowed 1.75 Lien Term Loans claims will receive either their pro rata share of the equity in the reorganized Company representing the value attributable to encumbered assets or, in the event of an All Asset Sale, the liens securing such allowed claim;
Holders of the Second Lien Term Loans, 2018 Notes, 2022 Notes, allowed general unsecured claims and deficiency claims associated with the 1.75 Lien Term Loans will receive either their pro rata share of equity in the reorganized Company representing the value attributable to unencumbered assets, or in the event of an All Asset Sale, proceeds attributable to the sale of the unencumbered assets (“Unsecured Claims Recovery”);
Holders of existing equity interests in EXCO shall not receive a distribution and the equity interests will be deemed canceled, discharged, released and extinguished; and
The carriers of directors’ and officers’ liability insurance coverage related to the Debtors will contribute $13.4 million (“D&O Proceeds”) to the Debtors in exchange for full and final settlement of potential claims and causes of action against current and former directors and officers.
The March 2019 Plan does not release the Debtors or holders of claims of the 1.5 Lien Notes and 1.75 Lien Term Loans from certain causes of action. The litigation of these causes of action will be managed by a trustee appointed by the committee of unsecured creditors of the Debtors and will not occur until after the confirmation of the March 2019 Plan. If any of the disputed claims are successfully prosecuted, this could materially impact the aforementioned recoveries for holders of allowed claims. If some or all of the 1.5 Lien Notes claims or 1.75 Lien Term Loans claims are deemed to be unsecured claims following the successful prosecution of a secured claims challenge, the holders of such 1.5 Lien Notes claims and 1.75 Lien Term Loans claims will receive their pro rata share of the Unsecured Claims Recovery. We have not received consents from any creditors in support of the March 2019 Plan. Therefore, our ability to confirm the March 2019 Plan is subject to a high degree of uncertainty.
For the duration of the Chapter 11 proceedings, our operations and our ability to develop and execute our business plan are subject to risks and uncertainties associated with Chapter 11 proceedings described in "Item 1A. Risk Factors”. As a result of these risks and uncertainties, our assets, liabilities, shareholders' equity, officers and/or directors could be significantly different following the conclusion of the Chapter 11 Cases, and the description of our operations, properties and capital plans included in this annual report may not accurately reflect our operations, properties and capital plans following the Chapter 11 Cases. See further discussion of the Chapter 11 Cases in "Note 17. Subsequent events"1. Organization and basis of presentation" in the Notes to our Consolidated Financial Statements.
Our business strategy
Our primary strategy focuses on the exploitation and development of our shale resource plays and the pursuit of leasing and acquisition opportunities. Our liquidity and ability to maintain compliance with debt covenants have been negatively impacted by the prolonged depressed oil and natural gas price environment, levels of indebtedness, and gathering, transportation and certain other commercial contracts. We define liquidity as cash and restricted cash plus the unused borrowing base under certain revolving credit agreements ("Liquidity").
During 2017, we focused on restructuring our balance sheet to improve our Liquidity and financial condition. On March 15, 2017, we closed a series of transactions including the issuance of $300.0 million in aggregate principal amount of senior secured 1.5 lien notes due March 20, 2022 ("1.5 Lien Notes"), the exchange of $682.8 million in aggregate principal amount of our senior secured second lien term loans due October 26, 2020 ("Second Lien Term Loans") for a like amount of senior secured 1.75 lien term loans due October 26, 2020 ("1.75 Lien Term Loans," and such exchange, the "Second Lien Term Loan Exchange") and the issuance of warrants to purchase our common shares. The terms of the indenture governing the 1.5 Lien Notes and the credit agreement governing the 1.75 Lien Term Loans allow for interest payments in cash, common shares or, in certain circumstances, additional indebtedness (such interest payments in common shares or additional indebtedness, "PIK Payments"), subject to certain restrictions and limitations. Concurrently with the issuance of the 1.5 Lien Notes and as a condition precedent thereto, on March 15, 2017, we amended our credit agreement ("EXCO Resources Credit Agreement") to,
among other things, permit the issuance of the 1.5 Lien Notes and the exchanges of Second Lien Term Loans, reduce the borrowing base thereunder to $150.0 million and modify certain financial covenants. See further discussion of these transactions as part of "Note 5. Debt" in the Notes to our Consolidated Financial Statements. The principal purpose of issuing the 1.5 Lien Notes and the Second Lien Term Loan Exchange was to alleviate our substantial cash interest payment burden and improve our Liquidity. Our initial expectation was to make PIK Payments in common shares on the 1.5 Lien Notes and the 1.75 Lien Term Loans throughout the remainder of 2017 and 2018. On June 20, 2017, we paid interest on the 1.75 Lien Term Loans in common shares, which resulted in the issuance of 2,745,754 common shares ("PIK Shares"). On September 20, 2017, we paid $17.0 million and $26.2 million of interest on the 1.5 Lien Notes and 1.75 Lien Term Loans, respectively, through the issuance of additional 1.5 Lien Notes and 1.75 Lien Term Loans. However, certain limitations and restrictions within our debt agreements prevented us from making PIK Payments in subsequent periods.
In order to improve our Liquidity, we entered into a purchase and sale agreement on April 7, 2017 to divest our oil and natural gas properties and surface acreage in South Texas for a total purchase price of $300.0 million, subject to customary closing conditions and adjustments. However, we were not able to meet the closing conditions due to the alleged termination of a long-term natural gas sales contract that was required to be in full force and effect as of the closing date. As a result, the purchase and sale agreement was terminated as of August 15, 2017. We are currently in litigation with the party to the natural gas sales contract as a result of their alleged termination of the contract. See further discussion of this transaction as part of "Note 3. Acquisitions, divestitures and other significant events" in the Notes to our Consolidated Financial Statements.
On September 7, 2017, we announced that our Board of Directors delegated authority to the Audit Committee of the Board of Directors ("Audit Committee") to explore strategic alternatives to strengthen our balance sheet and maximize the value of the Company, which included, but was not limited to, seeking a comprehensive out-of-court restructuring or reorganization under Chapter 11 of the Bankruptcy Code. At the direction of the Audit Committee, we retained PJT Partners LP as financial advisors and Alvarez & Marsal North America, LLC as restructuring advisors, and continued to engage Kirkland & Ellis LLP as legal advisors to assist the Company with the restructuring process. We initiated discussions with our stakeholders to evaluate the feasibility of a consensual in-court or out-of-court restructuring.
Due to liquidity constraints and limitations and restrictions on our ability to pay interest in cash, commons shares or additional indebtedness, we did not make our interest payment on the 1.75 Lien Term Loans that was due on December 20, 2017 or the interest payment on the Second Lien Term Loans that was due on December 26, 2017. In anticipation of certain events of default related to compliance with financial covenants and the failure to pay interest on certain debt instruments, we entered into agreements with certain holders of the EXCO Resources Credit Agreement, 1.5 Lien Notes, and 1.75 Lien Term Loans to forbear from exercising their rights and remedies as a result of an event of default under the debt instruments until January 15, 2018.
Despite our significant efforts to improve our financial condition, we continued to face increasing liquidity concerns. As of December 31, 2017, our Liquidity was $55.5 million. On January 15, 2018, the Company and the Filing Subsidiaries filed voluntary petitions for relief under Chapter 11 of the Bankruptcy Code. We were not able to reach an agreement with our creditors for a plan of reorganization prior to commencement of the Chapter 11 Cases. Therefore, the outcome of the Chapter 11 process is subject to a high degree of uncertainty and is dependent upon factors outside of our control, including actions of the Court and our creditors.
On January 22, 2018, we closed a Debtor-in-Possession Credit Agreement (“DIP Credit Agreement”) with lenders including affiliates of Fairfax Financial Holdings Limited ("Fairfax"), Bluescape Resources Company LLC ("Bluescape") and JPMorgan Chase Bank, N.A. (collectively the "DIP Lenders"). The DIP Credit Agreement includes a senior secured debtor-in-possession revolving credit facility in an aggregate principal amount of $125.0 million (“Revolver A Facility”) and a senior secured debtor-in-possession revolving credit facility in an aggregate principal amount of $125.0 million (“Revolver B Facility”, and together with the Revolver A Facility, the “DIP Facilities”). The proceeds from the DIP Facilities were used to refinance all obligations outstanding under the EXCO Resources Credit Agreement and will provide additional liquidity to fund our operations during the Chapter 11 process. See further discussion of the DIP Credit Agreement in "Note 17. Subsequent events" in the Notes to our Consolidated Financial Statements.
We continue to engage in discussions with our creditors regarding the terms of a financial restructuring plan. In conjunction with this process, we will explore potential strategic alternatives to maximize value for the benefit of our stakeholders, which may include a sale of certain or substantially all of our assets under Section 363 of the Bankruptcy Code, a plan of reorganization to equitize certain indebtedness as an alternative to the sale process, or a combination thereof.
Our strengths
High quality asset base in attractive regions
Our core areas have an extensive inventory of drilling opportunities that provide the option to allocate capital to enhance our returns in various commodity price environments. In addition, a significant portion of our acreage is held-by-production, which allows for the development of these properties within an optimum time frame. We hold significant acreage positions in three prominent oil and natural gas regions in the United States:
East Texas and North Louisiana - we currently hold approximately 84,900 net acres in the Haynesville and Bossier shales;
South Texas - we currently hold approximately 49,700 net acres in the Eagle Ford shale; and
Appalachia - we held approximately 125,600 net acres prospective for the Marcellus shale and approximately 40,000 net acres prospective for the Utica shale predominantly located in the dry gas window as of December 31, 2017. On February 27, 2018, we closed a settlement agreement with a wholly owned subsidiary of Royal Dutch Shell, plc, ("Shell") to resolve arbitration regarding our right to participate in an area of mutual interest in the Appalachia region ("Appalachia JV Settlement"). The settlement approximately doubled our interests in the aforementioned acreage in the Appalachia region. See further discussion of this settlement as part of "Note 17. Subsequent events" in the Notes to our Consolidated Financial Statements.
Our properties are generally characterized by:
multi-year inventory of development drilling and exploitation projects;
high drilling success rates;
significant unproved reserves and resources; and
long reserve lives.
We have extensive amounts of technical and operational expertise within the Haynesville and Bossier shales. We have accumulated significant amounts of contiguous acreage and are one of the largest operators within this region. Our economies of scale and operational expertise have allowed us to efficiently develop our assets and minimize our costs through greater utilization of multi-well pads and existing infrastructure and facilities. We are dedicated to the continuous improvement and innovation of well designs in order to maximize our return on capital. In recent years, we have achieved improvements in well performance through the use of extended laterals, increased use of proppant and other changes to our completion design.
We have applied our technical and operational expertise from other shale plays to our development of the Eagle Ford shale. We have realized significant improvements in our drilling performance, and the optimization of our well design has yielded strong results.
Our position in the Marcellus and Utica shales requires low maintenance capital as a substantial portion of our acreage is held-by-production, which gives us flexibility to control the timing of our development activities in the region.
Operational control
We operate a significant portion of our properties, which allows us to manage our operating costs and better control capital expenditures as well as the timing of development and exploitation activities. Therefore, we are able to allocate our capital to the most attractive projects based on commodity prices, rates of return and industry trends. As of December 31, 2017, we operated 869 of our 1,181 gross wells, or wells representing approximately 91% of our Proved Developed Reserves.
Skilled technical personnel and experienced team
Our management team has extensive industry experience in acquiring, exploring, exploiting and developing oil and natural gas properties. We have developed a workforce of highly skilled technical and operational personnel who have been successful in developing our shale resources. We leverage our technical expertise to exploit our asset base in an efficient and cost-effective manner. We believe our technical expertise gives us a competitive advantage in our key operating areas.
Development plans for 2018
Our plans for 2018 include a limited development program focused on the Haynesville shale in North Louisiana and the Eagle Ford shale in South Texas. The development of the Haynesville shale includes limited drilling and the completion of certain wells drilled in the prior year. Our development program for the Eagle Ford shale includes the drilling and completion of certain wells that will preserve the value of certain acreage with leasehold obligations. Our development plans also include limited capital allocated to participate in the development of non-operated wells, maintenance capital and leasehold costs. The capital expenditures associated with the development plans are highly concentrated in the first half of 2018.
Summary of geographic areas of operations
The following tables set forth summary operating information attributable to our principal geographic areas of operation as of December 31, 2017:2018:
| | | Areas | | Total Proved Reserves (Bcfe) (1) | | PV-10 (in millions) (1) (2) | | Average daily net production (Mmcfe/d) (3) | | Total Proved Reserves (Bcfe) (1) | | PV-10 (in millions) (1) (2) | | Average daily net production (Mmcfe/d) (3) |
| North Louisiana | | 318.3 |
| | $ | 226.8 |
| | 175 |
| | 285.5 |
| | $ | 280.0 |
| | 163 |
|
| East Texas | | 68.1 |
| | 65.8 |
| | 36 |
| | 59.4 |
| | 58.0 |
| | 24 |
|
| South Texas | | 66.3 |
| | 132.5 |
| | 18 |
| | 90.1 |
| | 304.9 |
| | 28 |
|
| Appalachia and other | | 114.2 |
| | 57.7 |
| | 26 |
| | 225.6 |
| | 114.5 |
| | 51 |
|
| Total | | 566.9 |
| | $ | 482.7 |
| | 255 |
| | 660.6 |
| | $ | 757.4 |
| | 266 |
|
| | | Areas | | Total gross acreage | | Total net acreage | | Total gross acreage | | Total net acreage |
| North Louisiana | | 102,300 |
| | 56,000 |
| | 101,400 |
| | 55,500 |
|
| East Texas | | 111,600 |
| | 42,100 |
| | 110,000 |
| | 41,100 |
|
| South Texas | | 103,000 |
| | 49,700 |
| | 100,800 |
| | 48,500 |
|
| Appalachia and other | | 398,300 |
| | 180,700 |
| | 382,200 |
| | 342,800 |
|
| Total | | 715,200 |
| | 328,500 |
| | 694,400 |
| | 487,900 |
|
| |
| (1) | The total Proved Reserves and PV-10 as of December 31, 20172018 were prepared in accordance with the rules and regulations of the Securities and Exchange Commission ("SEC"). |
| |
| (2) | The PV-10 data used in this table was based on reference prices using the simple average of the spot prices for the trailing 12 month period using the first day of each month beginning on January 1, 20172018 and ending on December 1, 2017,2018, of $2.98$3.10 per Mmbtu for natural gas and $51.34$65.56 per Bbl for oil, in each case adjusted for geographical and historical differentials. Market prices for oil and natural gas are volatile (see “Item 1A. Risk Factors - Risks Relating to Our Business”). We believe that PV-10, while not a financial measure in accordance with generally accepted accounting principles in the United States ("GAAP"), is an important financial measure used by investors and independent oil and natural gas producers for evaluating the relative significance of oil and natural gas properties and acquisitions due to tax characteristics which can differ significantly among comparable companies. The total Standardized Measure, a measure recognized under GAAP, as of December 31, 20172018 was $482.7$757.4 million. The Standardized Measure represents the PV-10 after giving effect to income taxes and is calculated in accordance with the Financial Accounting Standards Board ("FASB") Accounting Standards Codification ("ASC") 932, Extractive Activities, Oil and Gas ("ASC 932"). Our tax basis in the associated properties exceeded the pre-tax cash inflows and, as a result, there is no difference in Standardized Measure and PV-10 for all years presented. The amount of estimated future plugging and abandonment costs, the PV-10 of these costs and the Standardized Measure were determined by us. We do not designate our derivative financial instruments as hedges and accordingly, do not include the impact of derivative financial instruments when computing the Standardized Measure. |
| |
| (3) | The average daily net production rate was calculated based on the average daily rate during the final month of the year ended December 31, 2017.2018. |
Our development and exploitation project areas
East Texas and North Louisiana
Our operations in East Texas and North Louisiana are focused on the Haynesville and Bossier shales, which are primarily located in Shelby, Harrison, Panola, San Augustine and Nacogdoches Counties in Texas and DeSoto and Caddo Parishes in Louisiana. Our acreage in this region is predominantly held-by-production. The Haynesville shale is located at depths of 12,000 to 14,500 feet and is being developed with horizontal wells that typically have 4,500 to 10,000 foot laterals. The lateral lengths of future wells to be drilled in this region are dependent on factors including our acreage position and nearby existing wells. The Bossier shale lies just above certain portions of the Haynesville shale and also contains rich deposits of natural gas. The geographic position of our properties in the Haynesville and Bossier shales provides us access to nearby markets with favorable natural gas price indices compared to the rest of the country.
North Louisiana
Our position in the Holly area of North Louisiana consists of 30,70030,800 net acres in DeSoto Parish and 12,80011,700 net acres in Caddo Parish, which are predominantly held-by-production. At December 31, 2017,2018, we had a total of 425434 gross (232.9(236.5 net) operated wells flowing to sales. Our development activities in North Louisiana during 2017 featured a modified Haynesville shale well design, which included2018 primarily focused on the usecompletion of approximately 3,500 pounds of proppant per lateral foot and lateral lengths ranging from 4,500 to 10,000 feet. We drilled 2913 gross (17.9(7.4 net) operated wells drilled in prior year and turned-to-sales 12drilling of 6 gross (8.4(3.6 net) operated wells in the Haynesville shale during 2017. As of December 31, 2017, we had 17 gross (9.3 net) wells that were drilled and waiting on completion or in various stages of the completion process.wells. Including non-operated volumes, our average natural gas production was approximately 175163 net Mmcfe per day during December 2017.
2018. During March 2018, the Court approved the rejection of certain executory contracts related to the sale, marketing and transportation of natural gas in the North Louisiana region. During November 2018, the Court approved an agreement to settle any claims related to a minimum volume commitment for the gathering of natural gas production in the East Texas and North Louisiana regions. The rejection and settlement of these agreements resulted in a significant improvement in our realized natural gas price differentials, gathering expenses, and transportation expenses. We plan to drill 1 gross (0.7(0.6 net) operated well in the Haynesville shale during the first quarter of 2018. We plan to2019 and complete 11 gross (6.7(6.2 net) operated wells in the Haynesville shale during the first quarterthree quarters of 2018, which consists of2019. In addition, we plan to perform refracs on 3 gross (1.5 net) wells drilled in prior year. Asutilizing an improved design that includes a result, we will have 7 gross (3.3 net) operated wells in the Haynesville shale that will be waiting on completion at the end of the first quarter of 2018. Due to capital constraints, these wells are not expected to be completed until 2019.cemented liner and increased proppant volumes.
East Texas
Our operations in East Texas are focused on the Haynesville and Bossier shales. Our acreage is primarily located in Harrison, Panola, Shelby, San Augustine and Nacogdoches Counties in Texas and is predominantly held-by-production. The Haynesville and Bossier shales in East Texas are being developed with horizontal wells that typically have 6,000 to 7,500 foot laterals. Our position in the Shelby area of East Texas primarily consists of 31,40030,400 net acres and includes approximately 9,8009,700 net acres subject to continuous drilling obligations. We plan to drill, or participate with another operator in drilling, on the acreage subject to the continuous drilling obligation in the future to hold the acreage. Excluding the acreage subject to the continuous drilling obligation, approximately 91%96% of our net acres are held-by-production in the Shelby area.
As of December 31, 2017,2018, we had a total of 104102 gross (47.0(45.9 net) operated wells flowing to sales. Our development in this region during 20172018 was limited to the participation in certain non-operated wells. Including non-operated volumes, our average natural gas production was approximately 3624 net Mmcfe per day during December 2017.
2018. Our plans for 20182019 include the participation in non-operated wells that will satisfy our continuous drilling obligation in the southern portion of the region. In addition, we plan to participate in certain non-operated wells to evaluate the potential for modifications toappraise our spacingposition in Harrison and extentPanola Counties. Our position in Harrison and Panola Counties consists of development in the Haynesville and Bossier shales.5,400 net acres.
South Texas
Our position in this region includes approximately 49,70048,500 net acres, of which approximately 93%95% are held-by-production. Our South Texas acreage covers portions of Zavala, Dimmit and Frio Counties. Our acreage in the Eagle Ford shale is in the oil window and averages 375 feet in gross thickness at true vertical depths ranging from 5,400 to 6,800 feet. Our lateral lengths range from 5,000 to 10,000 feet and the total measured depth averages 14,600 feet. Our acreage in the area also includes additional upside in formations such as the Austin Chalk, Buda, Georgetown and Pearsall formations.
As of December 31, 2017,2018, we had a total of 225236 gross (97.6(107.9 net) operated horizontal wells flowing to sales. Including non-operated volumes, our average oil production in South Texas was approximately 3,0004,700 net barrels of oil equivalent per day during December 2017. We entered into an agreement2018. Our ability to divest our assets in South Texas during 2017; however,transport or sell the sale was not consummatednatural gas from this region has been limited since we were not able to satisfy certain closing conditions due to the alleged termination of a long-term natural gas sales contract that was requiredby the primary purchaser of our natural gas in May 2017. As a result, we commenced flaring natural gas in January 2018. We are evaluating operational and commercial solutions for the natural gas production in order to be in full force and effect asavoid significant curtailments of our oil production. See further discussion of the closing date. We did not allocate development capitalrisks related to our ability to sell or transport natural gas from this region during 2017 in anticipation of the potential sale. In late 2017, we initiated a limited"Item 1A. Risk Factors". Our development program thatduring 2018 focused on the Eagle Ford shale, which included drilling 214 gross (1.6(11.3 net) operated wells and plan to continue development in this region during 2018.
completing 16 gross (12.9 net) operated wells. We plan to drill 1026 gross (8.0(8.5 net) and turn-to-sales 1223 gross (9.6(7.4 net) operated wells in the Eagle Ford shale during 2018. Our2019. In addition, our plans for 2019 include the construction of an electrical distribution network over the core development program in this region is designedarea that will provide a more efficient cost structure to preserveoperate the value of certain acreage with leasehold obligations, primarily due to lease expirations, continuous drilling obligations and offset well obligations. The development is primarily focused on Zavala and Frio Counties.field.
Appalachia
Our operations in the Appalachia region have primarily included testing and selectively developing the Marcellus shale with horizontal drilling. As of December 31, 2017,2018, we held approximately 177,700339,800 net acres in the Appalachia region, including approximately 125,600234,800 net acres prospective for the Marcellus shale and approximately 40,00069,000 net acres prospective for the dry gas window of the Utica shale in Pennsylvania. Drilling, completion and production activities in Pennsylvania target the Marcellus shale as well as deeper formations including the Utica shale at depths ranging from 5,000 to more than 12,000 feet. Approximately 92% of our acreage is held-by-production, which allows us to control the timing of the development of this region.
As of December 31, 2017, we operated a total of 115 gross (41.0 net) horizontal wells in the Marcellus shale. We did not allocate development capital to this region during 2017. Including non-operated volumes, our production in the Appalachia region was approximately 26 net Mmcfe per day during December 2017. In recent years, we have limited our development of the Marcellus shale due to wide regional natural gas price differentials. These differentials continue to be volatile; however, the differentials in the region have the potential to be favorably impacted by the expansion of infrastructure and other sources of demand for natural gas in the Northeast region in future years. We have an extensive inventory of undeveloped locations prospective for the Marcellus and Utica shales that has potential to provide attractive rates of return in an improved commodity price environment. Our plans for 2018 are limited to turning-to-sales 1 gross (0.5 net) well in Sullivan County, Pennsylvania that was drilled in prior years. We do not have any producing wells in the dry gas window of the Utica shale; however, we are currently assessing the potential of the formation to determine the extent of future development.
On February 27, 2018, we closed a settlement agreement with a subsidiary of Shell to resolve arbitration regarding our right to participate in an area of mutual interest in the Appalachia region. The settlement increased our acreage in the Appalachia region by approximately 177,700 net acres, and the production from the additional interests in producing wells acquired was 26 net Mmcfe per day during December 2017. See further discussion of this settlement as part of "Note 17. Subsequent3. Acquisitions, divestitures and other significant events" in the Notes to our Consolidated Financial Statements. Drilling, completion and production activities in Pennsylvania target the Marcellus shale as well as deeper formations including the Utica shale at depths ranging from 5,000 to more than 12,000 feet. Approximately 98% of our acreage is held-by-production, which allows us to control the timing of the development of this region.
As of December 31, 2018, we operated a total of 116 gross (83.3 net) horizontal wells in the Marcellus shale. During 2018, we turned-to-sales 1 gross (0.9 net) operated Marcellus shale well in Northeast Pennsylvania that was previously awaiting the connection of a pipeline. Including non-operated volumes, our production in the Appalachia region was approximately 51 net Mmcfe per day during December 2018. In recent years, we have limited our development of the Marcellus shale due to wide regional natural gas price differentials. These differentials continue to be volatile; however, the differentials in the region narrowed during 2018 and have the potential to be favorably impacted by the expansion of infrastructure and other sources of demand for natural gas in the Northeast region in future years. We have an extensive inventory of undeveloped locations prospective for the Marcellus and Utica shales that has potential to provide attractive rates
of return through enhanced completion designs and an improved commodity price environment. Our plans for 2019 include drilling and turning-to-sales 2 gross (1.9 net) operated Marcellus shale wells in Northeast Pennsylvania. These wells will feature an enhanced completion design that includes increased proppant volumes and tighter cluster spacing, which has proven to be effective on recent wells in the region. We do not have any producing wells in the dry gas window of the Utica shale; however, we are currently assessing the potential of the formation to determine the extent of future development. Our plans for 2019 include drilling and turning-to-sales 1 gross (1.0 net) operated appraisal well targeting the dry gas window of the Utica shale in Central Pennsylvania.
Our hydraulic fracturing activities
Oil and natural gas may be recovered from our properties through the use of sophisticated drilling and hydraulic fracturing techniques. Hydraulic fracturing involves the injection of water, sand, gel and chemicals under pressure into formations to fracture the surrounding rock and stimulate production. Our hydraulic fracturing activities are primarily focused in the Eagle Ford shale in South Texas, Haynesville and Bossier shales in East Texas and North Louisiana and Marcellus shale in the Appalachia region. Predominantly all of our Proved Reserves are associated with shale assets in these areas.
Although the cost of each well will vary, the costs associated with the hydraulic fracturing portion of the well on average represent the following percentages of the total costs of drilling and completing a well: 35-40%40-50% in the Haynesville and Bossier shale formation; 30-40%45-55% in the Eagle Ford shale formation; and 25-35%35-45% in the Marcellus shale formation. These costs may increase in future periods as a result of higher levels of proppant utilized in the completion of our shale wells.
We review best practices and industry standards to comply with regulatory requirements in the protection of potable water sources when drilling and completing our wells. Protective practices include, but are not limited to, setting multiple strings of protection pipe across potable water sources and cementing these pipe strings to surface, continuously monitoring the hydraulic fracturing process in real time and disposing of non-recycled produced fluids in authorized disposal wells at depths below the potable water sources. In addition, we actively seek methods to minimize the environmental impact of our hydraulic fracturing operations in all of our operating areas.
For more information on the risks of hydraulic fracturing, see “Item 1A. Risk Factors - Our business exposes us to liability and extensive regulation on environmental matters, which could result in substantial expenditures”expenditures” and “Item 1A. Risk Factors - Federal, state and local legislation and regulatory initiatives relating to hydraulic fracturing could result in increased costs and additional operating restrictions or delays"delays".
Marketing arrangements
We produce oil and natural gas. We do not refine or process the oil or natural gas we produce. We sell the majority of the oil we produce under contracts using market sensitive pricing. The majority of our oil contracts are based on NYMEX pricing, which is typically calculated as the average of the daily closing prices of oil to be delivered one month in the future. We also sell a portion of our oil at F.O.B. field prices posted by the principal purchaser of oil where our producing properties are located. Our sales contracts are of a type common within the industry, and we usually negotiate a separate contract for each area. Generally, we sell our oil to purchasers and refiners near the areas of our producing properties.
We sell the majority of our natural gas under individually negotiated gas purchase contracts using market sensitive pricing. Our sales contracts vary in length from spot market sales of a single day to term agreements that may extend up to a year. Our natural gas customers primarily include natural gas marketing companies. The natural gas purchase contracts define the terms and conditions unique to each of these sales. The price received for natural gas sold on the spot market varies daily, reflecting changing market conditions.
We may be unable to market all of the oil or natural gas we produce. If our oil and natural gas cannot be marketed, we may be unable to negotiate favorable pricing and contractual terms. Changes in oil or natural gas prices may significantly affect our revenues, cash flows, the value of our oil and natural gas properties and the estimates of recoverable oil and natural gas reserves. Further, significant declines in the prices of oil or natural gas may have a material adverse effect on our business and on our financial condition.
We engage in oil and natural gas production activities in geographic regions where, from time to time, the supply of oil or natural gas available for delivery exceeds the demand. If this occurs, companies purchasing oil or natural gas in these areas may reduce the amount of oil or natural gas that they purchase from us. If we cannot locate other buyers for our production or for any of our oil or natural gas reserves, we may shut-in our oil or natural gas wells for certain periods of time. Furthermore, we may shut-in our oil and natural gas wells if regional market prices decrease to a level that is uneconomical to produce. If
this occurs, we may incur additional payment obligations under our oil and natural gas leases and, under certain circumstances, the oil and natural gas leases might be terminated. Economic conditions, particularly depressed oil and natural gas prices, may negatively impact the liquidity and creditworthiness of our purchasers and may expose us to risk with respect to the ability to collect payments for the oil and natural gas we deliver.
Raider Marketing, LP ("Raider") is a wholly owned subsidiary of EXCO and is the contractual counterparty by operation of Texas law to all of EXCO's gathering, transportation and marketing contracts in Texas and Louisiana. Raider purchases and resells natural gas from third-party producers as well as oil and natural gas from operated wells in Texas and Louisiana, and charges a fee for marketing services to certain working interest owners in the related wells.
The availability of a ready market and the prices for oil and natural gas are dependent upon a number of factors that are beyond our control. These factors include, among other things:
supply and demand for oil and natural gas and expectations regarding supply and demand;
the level of domestic and international production;
the availability of imported oil and natural gas;
federal regulations applicable to the export of, and construction of export facilities for, oil and natural gas;
political and economic conditions and events in foreign oil and natural gas producing nations, including embargoes, sanctions, continued hostilities in the Middle East and other sustained military campaigns, and acts of terrorism or sabotage;
the ability of members of the Organization of Petroleum Exporting Countries to agree to and maintain oil price and production controls;
domestic and international government regulation, legislation and policies, including levying tariffs on oil and natural gas imports;
the cost and availability of transportation and pipeline systems with adequate capacity;
the cost and availability of other competitive fuels;
fluctuating and seasonal demand for oil, natural gas and refined products;
concerns about global warming or other conservation initiatives and the extent of governmental price controls and regulation of production;
regional price differentials and quality differentials of oil and natural gas;
the availability of refining capacity;
technological advances affecting oil and natural gas production and consumption;
weather conditions and natural disasters;
foreign and domestic government relations; and
overall domestic and global economic conditions.
Accordingly, in light of the many uncertainties affecting the supply and demand for oil, natural gas and refined petroleum products, we cannot accurately predict the prices or marketability of oil and natural gas from any producing well in which we have or may acquire an interest.
Our oil and natural gas reserves
Our Proved Reserves as of December 31, 20172018 were approximately 566.9660.6 Bcfe, of which approximately 68%52% were located in the Haynesville/Bossier shales, 20%34% in the Marcellus shale and 12%14% in the Eagle Ford shale.
The following table summarizes our Proved Reserves as of December 31, 2018, 2017 2016 and 2015.2016. This information was prepared in accordance with the rules and regulations of the SEC. The comparability of our reserves is impacted by commodity prices, purchases and sales of reserves in place, production, revisions of previous estimates, changes in our development plans, and discoveries and extensions. See "Management's discussion and analysis of oil and natural gas reserves" for a summary of the changes in our Proved Reserves.
| | | | | As of December 31, | | As of December 31, |
| | | 2017 (3) | | 2016 (3) | | 2015 | | 2018 (3) | | 2017 (3) | | 2016 (3) |
| Oil (Mbbls) | | | | | | | | | | | | |
| Developed | | 9,412 |
| | 10,168 |
| | 12,056 |
| | 13,302 |
| | 9,412 |
| | 10,168 |
|
| Undeveloped | | — |
| | — |
| | 8,383 |
| | — |
| | — |
| | — |
|
| Total | | 9,412 |
| | 10,168 |
| | 20,439 |
| | 13,302 |
| | 9,412 |
| | 10,168 |
|
| | | | | | | | | | | | | |
| Natural gas (Mmcf) | | | | | | | | | | | | |
| Developed | | 510,451 |
| | 415,719 |
| | 364,932 |
| | 580,781 |
| | 510,451 |
| | 415,719 |
|
| Undeveloped | | — |
| | — |
| | 419,742 |
| | — |
| | — |
| | — |
|
| Total | | 510,451 |
| | 415,719 |
| | 784,674 |
| | 580,781 |
| | 510,451 |
| | 415,719 |
|
| | | | | | | | | | | | | |
| Equivalent reserves (Mmcfe) | | | | | | | | | | | | |
| Developed | | 566,924 |
| | 476,727 |
| | 437,268 |
| | 660,590 |
| | 566,924 |
| | 476,727 |
|
| Undeveloped | | — |
| | — |
| | 470,040 |
| | — |
| | — |
| | — |
|
| Total | | 566,924 |
| | 476,727 |
| | 907,308 |
| | 660,590 |
| | 566,924 |
| | 476,727 |
|
| | | | | | | | | | | | | |
| PV-10 (in millions) (1) | | | | | | | | | | | | |
| Developed | | $ | 482.7 |
| | $ | 310.9 |
| | $ | 359.4 |
| | $ | 757.4 |
| | $ | 482.7 |
| | $ | 310.9 |
|
| Undeveloped | | — |
| | — |
| | 42.7 |
| | — |
| | — |
| | — |
|
| Total | | $ | 482.7 |
| | $ | 310.9 |
| | $ | 402.1 |
| | $ | 757.4 |
| | $ | 482.7 |
| | $ | 310.9 |
|
| | | | | | | | | | | | | |
| Standardized Measure (in millions) (2) | | $ | 482.7 |
| | $ | 310.9 |
| | $ | 402.1 |
| | $ | 757.4 |
| | $ | 482.7 |
| | $ | 310.9 |
|
| |
| (1) | The PV-10 is based on the following average spot prices, in each case adjusted for historical differentials. Prices presented on the table below are the trailing 12 month simple average spot price at the first of the month for natural gas at Henry Hub and West Texas Intermediate ("WTI") crude oil at Cushing, Oklahoma. |
| | | | | Average spot prices | | Average spot prices |
| | Oil (per Bbl) | | Natural gas (per Mmbtu) | | Oil (per Bbl) | | Natural gas (per Mmbtu) |
| December 31, 2018 | | | $ | 65.56 |
| | $ | 3.10 |
|
| December 31, 2017 | | $ | 51.34 |
| | $ | 2.98 |
| | 51.34 |
| | 2.98 |
|
| December 31, 2016 | | 42.75 |
| | 2.48 |
| | 42.75 |
| | 2.48 |
|
| December 31, 2015 | | 50.28 |
| | 2.59 |
| |
| |
| (2) | There is no difference in Standardized Measure and PV-10 for all years presented as our tax basis in the associated properties exceeded the pre-tax cash inflows. We believe that PV-10, while not a financial measure in accordance with GAAP, is an important financial measure used by investors and independent oil and natural gas producers for evaluating the relative significance of oil and natural gas properties and acquisitions due to tax characteristics, which can differ significantly among comparable companies. The Standardized Measure represents the PV-10 after giving effect to income taxes, and is calculated in accordance with ASC 932. |
| |
| (3) | All of our undeveloped locations that meet the technical definition of Proved Undeveloped Reserves were reclassified to unproved reserves during 2016 due to the uncertainty regarding the financing required to develop these reserves. These reserves remainedbased on engineering guidelines remain classified as unproved due to our inability to meet the Reasonable Certainty criteria for recording Proved Undeveloped Reserves, as prescribed under the SEC requirements, asbecause the uncertainty regarding our availability of capital required to develop these reserves still existed at December 31, 2018, 2017 and 2016. We have a significant amount of reserves that would meet the criteria to be classified as Proved Undeveloped Reserves if we were able to demonstrate the financial capability to execute a development plan. |
Management has established, and is responsible for, internal controls designed to provide reasonable assurance that the estimates of Proved Reserves are computed and reported in accordance with rules and regulations promulgated by the SEC as well as established industry practices used by independent engineering firms and our peers. These internal controls include documented process workflows and qualified professional engineering and geological personnel with specific reservoir experience. Our internal processes and controls surrounding this process are routinely tested. We also retain outside independent engineering firms to prepare estimates of our Proved Reserves. Senior management reviews and approves our reserve estimates, whether prepared internally or by third parties. Our Strategic Development and Reserves DirectorChief Operating Officer oversaw our outside independent engineering firms, Netherland, Sewell & Associates, Inc. ("NSAI"), and Ryder Scott Company, L.P. ("Ryder Scott") in connection with the preparation of their estimates of our Proved Reserves as of December 31, 2017.2018. We also regularly communicate with our outside independent engineering firms throughout the year regarding technical and operational matters critical to our reserve estimations. Our Strategic Development and Reserves Director has over 13 years of experience in the oil and natural gas industry with a focus on reserves valuation. He is a graduate of the University of Oklahoma with dual degrees in Energy Management and Finance. In addition, he is an active participant in industry reserves seminars and professional industry groups. Our Chief Operating Officer, and our Strategic Development and Reserves Director, with input from other members of senior management, areis responsible for the selection of our third-party engineering firms and review of the reports generated by such firms. Our Chief Operating Officer has over 2627 years of experience in the oil and natural gas industry and is a graduate of Texas Tech University with a degree in Petroleum Engineering. During his career, he has had multiple responsibilities in technical or leadership roles including asset management, drilling and completions, production engineering, reservoir engineering and reserves management, economic evaluations and field development in U.S. onshore and international projects. The third-party engineering reports are also provided to the Audit Committee.
Our estimated Proved Reserves and future net cash flows for our shale properties in all regions except South Texas were prepared by NSAI as of December 31, 2017, 20162018 and 2015.2017. Our estimated Proved Reserves and future net cash flows for our shale properties in the South Texas region were prepared by Ryder Scott as of December 31, 2017, 20162018 and 2015. During 2016, we sold substantially all of our remaining non-shale properties. The estimates of Proved Reserves and future net cash flows for our non-shale properties as of December 31, 2015 were prepared by Lee Keeling and Associates, Inc. ("Lee Keeling").2017. Differences may exist between reserve quantities and values as presented in this Form 10-K and the reports of third party engineering firms filed herewith due to the exclusion of certain properties from the reports of third party engineering firms and immaterial differences in the calculations performed by the reserves evaluation software utilized by management and the third party engineering firms for estimating reserves and values.
NSAI and Ryder Scott and Lee Keeling are independent petroleum engineering firms that perform a variety of reserve engineering and valuation assessments for public and private companies, financial institutions and institutional investors. NSAI and Ryder Scott and Lee Keeling have performed these services for over 50 years. Our internal technical employees responsible for reserve estimates and interaction with our independent engineers include employees and corporate officers with petroleum and other engineering degrees and relevant industry experience.
Estimates of oil and natural gas reserves are projections based on a process involving an independent third party engineering firm's communication with EXCO's engineers and geologists, the collection of any and all required geological, geophysical, engineering and economic data, and such firm's complete external preparation of all required estimates and are forward-looking in nature. These reports rely on various assumptions, including definitions and economic assumptions required by the SEC, including the use of constant oil and natural gas pricing, use of current and constant operating costs and capital costs. We also make assumptions relating to availability of funds and timing of capital expenditures for development of our Proved Undeveloped Reserves. These reports should not be construed as the current market value of our Proved Reserves. The process of estimating oil and natural gas reserves is also dependent on geological, engineering and economic data for each reservoir. Because of the uncertainties inherent in the interpretation of this data, we cannot ensure that the Proved Reserves will ultimately be realized. Our actual results could differ materially. See “Note 16. Supplemental information relating to oil and natural gas producing activities (unaudited)” in the Notes to our Consolidated Financial Statements for additional information regarding our oil and natural gas reserves and the Standardized Measure.
NSAI and Ryder Scott and Lee Keeling also examined our estimates with respect to reserve categorization, using the definitions for Proved Reserves set forth in SEC Regulation S-X Rule 4-10(a) and SEC staff interpretations and guidance. In preparing an estimate of our Proved Reserves and future net cash flows attributable to our interests, NSAI and Ryder Scott and Lee Keeling did not independently verify the accuracy and completeness of information and data furnished by us with respect to ownership interests, oil and natural gas production, well test data, historical costs of operation and development, product prices, or any agreements relating to current and future operations of the properties and sales of production. However, if in the course of the examination anything came to the attention of NSAI or Ryder Scott, or Lee Keeling, which brought into question the validity or sufficiency of any such information or data, NSAI or Ryder Scott or Lee Keeling did not rely on such information or
data until they had satisfactorily resolved their questions relating thereto or had independently verified such information or data. NSAI and Ryder Scott and Lee Keeling determined that their estimates of Proved Reserves conform to the guidelines of the SEC, including the criteria of Reasonable Certainty, as it pertains to expectations about the recoverability of Proved Reserves in future years, under existing economic and operating conditions, consistent with the definition in Rule 4-10(a)(24) of SEC Regulation S-X.
Management's discussion and analysis of oil and natural gas reserves
The following discussion and analysis of our proved oil and natural gas reserves and changes in our Proved Reserves is intended to provide additional guidance on the operational activities, transactions, economic and other factors which significantly impacted our estimate of Proved Reserves as of December 31, 20172018 and changes in our Proved Reserves during 2017.2018. This discussion and analysis should be read in conjunction with “Note 16. Supplemental information relating to oil and natural gas producing activities (unaudited)” in the Notes to our Consolidated Financial Statements, and in “Item 1A. Risk Factors” addressing the uncertainties inherent in the estimation of oil and natural gas reserves elsewhere in this Annual Report on Form 10-K. The following table summarizes the changes in our Proved Reserves from January 1, 20172018 to December 31, 2017.2018.
| | | | | Oil (Mbbls) | | Natural gas (Mmcf) | | Equivalent natural gas (Mmcfe) | | Oil (Mbbls) | | Natural gas (Mmcf) | | Equivalent natural gas (Mmcfe) |
| Proved Developed Reserves | | 9,412 |
| | 510,451 |
| | 566,924 |
| | 13,302 |
| | 580,781 |
| | 660,590 |
|
| Proved Undeveloped Reserves | | — |
| | — |
| | — |
| | — |
| | — |
| | — |
|
| Total Proved Reserves | | 9,412 |
| | 510,451 |
| | 566,924 |
| | 13,302 |
| | 580,781 |
| | 660,590 |
|
| The changes in reserves for the year are as follows: | | | | | | | | | | | | |
| January 1, 2017 | | 10,168 |
| | 415,719 |
| | 476,727 |
| |
| January 1, 2018 | | | 9,412 |
| | 510,451 |
| | 566,924 |
|
| Purchases of reserves in place | | — |
| | 50,456 |
| | 50,456 |
| | — |
| | 118,415 |
| | 118,415 |
|
| Discoveries and extensions | | 13 |
| | 21,880 |
| | 21,958 |
| | 1,387 |
| | 22,482 |
| | 30,804 |
|
| Revisions of previous estimates: | | | | | | | | | | | | |
| Changes in price | | 679 |
| | 30,200 |
| | 34,274 |
| | 690 |
| | 5,726 |
| | 9,866 |
|
| Other factors | | (290 | ) | | 72,332 |
| | 70,593 |
| |
| Performance and other factors | | | 3,170 |
| | 22,486 |
| | 41,502 |
|
| Sales of reserves in place | | — |
| | — |
| | — |
| | — |
| | — |
| | — |
|
| Production | | (1,158 | ) | | (80,136 | ) | | (87,084 | ) | | (1,357 | ) | | (98,779 | ) | | (106,921 | ) |
| December 31, 2017 | | 9,412 |
| | 510,451 |
| | 566,924 |
| |
| December 31, 2018 | | | 13,302 |
| | 580,781 |
| | 660,590 |
|
Purchases of reserves in place
PurchasesThe 118.4 Bcfe of purchases of reserves in place primarilyfor natural gas related to theour acquisition of incremental interests in certain oil and natural gas properties that we operate and undeveloped acreage in the North Louisiana region. The acquisitions increased Proved Reserves by 50.5 Bcfe during for the year ended December 31, 2017. Our Proved Reserves will increase in the future as a result of the Appalachia JV Settlement that closed on February 27, 2018. The Proved Reserves related toacquired in the Appalachia JV Settlement were approximately 114.2 Bcfe aspredominantly consists of December 31, 2017.proved producing properties in the Marcellus shale.
Discoveries and extensions
Proved Reserve additions from discoveries and extensions were 22.030.8 Bcfe for the year ended December 31, 2017,2018, primarily due to the development of operated wells in the Eagle Ford shale and non-operated wells in the Haynesville and Bossier shales in North Louisiana.shale.
Revisions of previous estimates
Our revisions of previous estimates included upward revisions to our Proved Reserve quantities of 104.951.4 Bcfe. The increase in commodity prices contributed to 34.39.9 Bcfe of the upward revisions, which extended the economic life of certain producing properties when using prices prescribed by the SEC. This change in price was primarily driven by the increase in the trailing 12 month average of oil and natural gas prices. The trailing 12 month average oil price increased from $42.75 per Bbl for the year ended December 31, 2016 to $51.34 per Bbl for the year ended December 31, 2017 to $65.56 per Bbl for the year ended December 31, 2018 and the trailing 12 month average natural gas price increased from $2.48 per Mmbtu for the year ended December 31, 2016 to $2.98 per Mmbtu for the year ended December 31, 2017.
2017 to $3.10 per Mmbtu for the year ended December 31, 2018.
In addition, our revisions of previous estimates included 70.641.5 Bcfe due to performance and other factors. The revisions were primarily due to the reclassification of wells to Proved Reserves during 20172018 that were previously reclassified to unproved reserves in prior years due to capital constraints. These reclassifications primarily related to conversions of wells to Proved Developed Reserves as a result of our development activities in the North Louisiana region.and South Texas regions.
Oil and natural gas production
Total oil and natural gas production in 20172018 was 87.1106.9 Bcfe, which included approximately 3.52.8 Bcfe in production from extensions and discoveries that were not reflected in our Proved Reserves at January 1, 2017.2018.
Proved Undeveloped Reserves
All of our undeveloped locations that meet the technical definition of Proved Undeveloped Reserves were reclassified to unproved reserves during 2016 due to the uncertainty regarding the financing required to develop these reserves. These reserves remainedbased on engineering guidelines are classified as unproved due to our inability to meet the Reasonable Certainty criteria for recording Proved Undeveloped Reserves, as prescribed under the SEC requirements, asbecause the uncertainty regarding our availability of capital required to develop these reserves still existed at December 31, 2017 and 2016.2018. During 2017,2018, we converted certain unproved reserves to Proved Developed Reserves as a result of our drilling and completion activities. However, we did not report any changes in our Proved Undeveloped Reserves for the year ended December 31, 2017.2018. We have a significant amount of reserves that would meet the criteria to be classified as Proved Undeveloped Reserves if we were able to demonstrate the financial capability to execute a development plan.
Impacts of changes in reserves on depletion rate and statements of operations in 20172018
Our depletion rate decreasedincreased to $0.57$0.74 per Mcfe in 20172018 from $0.71$0.57 per Mcfe in 2016.2017. The decreaseincrease was primarily due to the increaseadditional costs associated with our development of the South Texas and North Louisiana regions. In particular, the development of oil producing assets in South Texas results in a higher depletion rate when calculated on per Mcfe basis compared to the rest of our Proved Reserves during 2017.properties.
Our production, prices and expenses
The following table summarizes revenues, net production, average sales price per unit and costs and expenses associated with the production of oil and natural gas. Certain reclassifications have been made to prior period information to conform to current period presentation.
| | | | | Year Ended December 31, | | Year Ended December 31, |
| (in thousands, except production and per unit amounts) | | 2017 | | 2016 | | 2015 | | 2018 | | 2017 | | 2016 |
| Revenues, production and prices: | | | | | | | | | | | | |
| Oil: | | | | | | | | | | | | |
| Revenue | | $ | 57,693 |
| | $ | 67,317 |
| | $ | 102,787 |
| | $ | 90,614 |
| | $ | 57,693 |
| | $ | 67,317 |
|
| Production sold (Mbbls) | | 1,158 |
| | 1,769 |
| | 2,342 |
| | 1,357 |
| | 1,158 |
| | 1,769 |
|
| Average sales price per Bbl | | $ | 49.82 |
| | $ | 38.05 |
| | $ | 43.89 |
| | $ | 66.78 |
| | $ | 49.82 |
| | $ | 38.05 |
|
| Natural gas: | | | | | | | | | | | | |
| Revenue | | $ | 201,137 |
| | $ | 181,332 |
| | $ | 226,471 |
| | $ | 281,977 |
| | $ | 201,137 |
| | $ | 181,332 |
|
| Production sold (Mmcf) | | 80,136 |
| | 93,829 |
| | 109,926 |
| | 98,779 |
| | 80,136 |
| | 93,829 |
|
| Average sales price per Mcf | | $ | 2.51 |
| | $ | 1.93 |
| | $ | 2.06 |
| | $ | 2.85 |
| | $ | 2.51 |
| | $ | 1.93 |
|
| Costs and expenses: | | | | | | | | | | | | |
| Oil and natural gas operating costs per Mcfe | | $ | 0.40 |
| | $ | 0.33 |
| | $ | 0.43 |
| | $ | 0.39 |
| | $ | 0.40 |
| | $ | 0.33 |
|
We had two areas that exceeded 15% of our total Proved Reserves as of December 31, 2017.2018. The Holly field in North Louisiana and the Marcellus shale in Appalachia represented approximately 56%43% and 20%34% of our total Proved Reserves, respectively. The following table provides additional information related to our Holly and Marcellus shale areas:
| | | | Year Ended December 31, | Year Ended December 31, |
| | 2017 | | 2016 | | 2015 | 2018 |
| 2017 |
| 2016 |
| Holly area: | | | | | | | | | | |
| Natural gas production sold (Mmcf) | 53,368 |
| | 55,290 |
| | 73,863 |
| 70,104 |
| | 53,368 |
| | 55,290 |
|
| Average price per Mcf | $ | 2.60 |
| | $ | 2.00 |
| | $ | 2.18 |
| $ | 2.94 |
| | $ | 2.60 |
| | $ | 2.00 |
|
| Oil and natural gas operating costs per Mcf | 0.32 |
| | 0.23 |
| | 0.22 |
| 0.29 |
| | 0.32 |
| | 0.23 |
|
| Marcellus shale: | | | | | | | | | | |
| Natural gas production sold (Mmcf) | 9,863 |
| | 10,851 |
| | 12,133 |
| 17,829 |
| | 9,863 |
| | 10,851 |
|
| Average price per Mcf | $ | 2.14 |
| | $ | 1.50 |
| | $ | 1.39 |
| $ | 2.51 |
| | $ | 2.14 |
| | $ | 1.50 |
|
| Oil and natural gas operating costs per Mcf | 0.17 |
| | 0.12 |
| | 0.22 |
| 0.24 |
| | 0.17 |
| | 0.12 |
|
Our interest in productive wells
The following table quantifies information regarding productive wells (wells that are currently producing oil or natural gas or are capable of production), including temporarily shut-in wells. The number of total gross oil and natural gas wells excludes any multiple completions. Gross wells refer to the total number of physical wells in which we hold a working interest, regardless of our percentage interest. A net well is not a physical well, but is a concept that reflects the actual total working interests we hold in all wells. We compute the number of net wells by totaling the percentage interests we hold in all our gross wells.
| | | | | At December 31, 2017 | | At December 31, 2018 |
| | | Gross wells (1) | | Net wells | | Gross wells (1) | | Net wells |
| | | Oil | | Natural gas | | Total | | Oil | | Natural gas | | Total | | Oil | | Natural gas | | Total | | Oil | | Natural gas | | Total |
| Producing region: | | | | | | | | | | | | | | | | | | | | | | | | |
| North Louisiana | | — |
| | 644 |
| | 644 |
| | — |
| | 246.7 |
| | 246.7 |
| | — |
| | 677 |
| | 677 |
| | — |
| | 251.2 |
| | 251.2 |
|
| East Texas | | — |
| | 151 |
| | 151 |
| | — |
| | 51.5 |
| | 51.5 |
| | — |
| | 157 |
| | 157 |
| | — |
| | 50.3 |
| | 50.3 |
|
| South Texas | | 243 |
| | 1 |
| | 244 |
| | 100.3 |
| | 0.1 |
| | 100.4 |
| | 255 |
| | 1 |
| | 256 |
| | 111.3 |
| | 0.1 |
| | 111.4 |
|
| Appalachia and other | | 2 |
| | 140 |
| | 142 |
| | 0.1 |
| | 41.4 |
| | 41.5 |
| | 1 |
| | 156 |
| | 157 |
| | — |
| | 85.5 |
| | 85.5 |
|
| Total | | 245 |
| | 936 |
| | 1,181 |
| | 100.4 |
| | 339.7 |
| | 440.1 |
| | 256 |
| | 991 |
| | 1,247 |
| | 111.3 |
| | 387.1 |
| | 498.4 |
|
| |
| (1) | As of December 31, 2017,2018, we did not hold interests in any wells with multiple completions. |
As of December 31, 2017,2018, we operated 869888 gross (418.4(473.6 net) wells, which represented approximately 91%90% of our Proved Developed Reserves.
Our drilling activities
Our drilling activities are primarily focused on horizontal drilling in shale plays, particularly in the Haynesville, Bossier, Eagle Ford and Marcellus shales. The following tables summarize our approximate gross and net interests in the operated wells we drilled during the periods indicated and refer to the number of wells completed during the period, regardless of when drilling was initiated.
|
| | | | | | | | | | | | | | | | | | |
| | | Development wells |
| | | Gross | | Net |
| | | Productive | | Dry | | Total | | Productive | | Dry | | Total |
| Year ended December 31, 2017 (1) | | 10 |
| | — |
| | 10 |
| | 6.8 |
| | — |
| | 6.8 |
|
| Year ended December 31, 2016 (2) | | 15 |
| | — |
| | 15 |
| | 9.2 |
| | — |
| | 9.2 |
|
| Year ended December 31, 2015 (3) | | 63 |
| | — |
| | 63 |
| | 25.3 |
| | — |
| | 25.3 |
|
| | | Exploratory wells |
| | | Gross | | Net |
| | | Productive | | Dry | | Total | | Productive | | Dry | | Total |
| Year ended December 31, 2017 (1) | | 2 |
| | — |
| | 2 |
| | 1.6 |
| | — |
| | 1.6 |
|
| Year ended December 31, 2016 | | — |
| | — |
| | — |
| | — |
| | — |
| | — |
|
| Year ended December 31, 2015 (3) | | 5 |
| | — |
| | 5 |
| | 3.9 |
| | — |
| | 3.9 |
|
|
| | | | | | | | | | | | | | | | | | |
| | | Development wells |
| | | Gross | | Net |
| | | Productive | | Dry | | Total | | Productive | | Dry | | Total |
| Year ended December 31, 2018 (1) | | 30 |
| | — |
| | 30 |
| | 21.2 |
| | — |
| | 21.2 |
|
| Year ended December 31, 2017 (2) | | 10 |
| | — |
| | 10 |
| | 6.8 |
| | — |
| | 6.8 |
|
| Year ended December 31, 2016 (3) | | 15 |
| | — |
| | 15 |
| | 9.2 |
| | — |
| | 9.2 |
|
| | | Exploratory wells |
| | | Gross | | Net |
| | | Productive | | Dry | | Total | | Productive | | Dry | | Total |
| Year ended December 31, 2018 (1) | | — |
| | — |
| | — |
| | — |
| | — |
| | — |
|
| Year ended December 31, 2017 (2) | | 2 |
| | — |
| | 2 |
| | 1.6 |
| | — |
| | 1.6 |
|
| Year ended December 31, 2016 (3) | | — |
| | — |
| | — |
| | — |
| | — |
| | — |
|
| |
| (1) | Our development wells in 2018 primarily included the Haynesville shale in the Holly area of North Louisiana and the Eagle Ford shale of South Texas. None of the wells completed during the period were classified as exploratory. |
| |
| (2) | Our development wells in 2017 primarily included the Haynesville shale in the Holly area of North Louisiana. Our exploratory wells included the Bossier shale in the Holly area of North Louisiana. |
| |
(2)(3) | Our development wells in 2016 primarily included the Haynesville and Bossier shales in the Shelby area of East Texas and the Haynesville shale in the Holly area of North Louisiana. |
| |
(3) | Our development None of the wells in 2015 includedcompleted during the Haynesville and Bossier shales in the Shelby area of East Texas and the Holly area of North Louisiana. Our development wells also included the Eagle Ford shale in our core area in Zavala and Frio Counties, Texas. We completed one gross exploratory well in the Bossier shale in the North Louisiana region and four gross exploratory wells in the Buda formation in the South Texas region.
period were classified as exploratory. |
Our developed and undeveloped acreage
Developed acreage includes those acres spaced or assignable to producing wells or wells capable of producing. Undeveloped acreage represents those acres that do not currently have completed wells capable of producing commercial quantities of oil or natural gas, regardless of whether the acreage contains Proved Reserves. The definitions of gross acres and net acres conform to how we determine gross wells and net wells. The following table sets forth our developed and undeveloped acreage:
| | | | | At December 31, 2017 | | At December 31, 2018 |
| | | Developed | | Undeveloped | | Developed | | Undeveloped |
| Area | | Gross | | Net | | Gross | | Net | | Gross | | Net | | Gross | | Net |
| North Louisiana | | 76,700 |
| | 37,000 |
| | 25,600 |
| | 19,000 |
| | 77,700 |
| | 37,700 |
| | 23,700 |
| | 17,800 |
|
| East Texas | | 45,900 |
| | 20,300 |
| | 65,700 |
| | 21,800 |
| | 46,900 |
| | 20,500 |
| | 63,100 |
| | 20,600 |
|
| South Texas | | 95,400 |
| | 45,900 |
| | 7,600 |
| | 3,800 |
| | 94,300 |
| | 45,400 |
| | 6,500 |
| | 3,100 |
|
| Appalachia and other | | 48,700 |
| | 18,200 |
| | 349,600 |
| | 162,500 |
| | 53,300 |
| | 38,100 |
| | 328,900 |
| | 304,700 |
|
| Total | | 266,700 |
| | 121,400 |
| | 448,500 |
| | 207,100 |
| | 272,200 |
| | 141,700 |
| | 422,200 |
| | 346,200 |
|
The primary terms of our oil and natural gas leases expire at various dates. Most of our undeveloped acreage is held-by-production, which means that these leases are active as long as there is production of oil or natural gas from wells on the acreage or certain lease terms are met. Upon ceasing production, these leases will expire. As of December 31, 2017,2018, we had approximately 9,500; 2,300;2,800; 5,900; and 3,400200 net acres with lease expirations in 2018, 2019, 2020 and 2020,2021, respectively. The majority of this acreage with lease expirations is located in the Appalachia region. In addition, we have approximately 9,8009,700 net acres located in the Shelby area of East Texas that are subject to continuous drilling obligations, and we plan to drill onhold the acreage through drilling wells or participating in the future to holddrilling of non-operated wells on the acreage. Predominantly all of our expiring acreage is located within our shale resource plays.
The held-by-production acreage in many cases represents potential additional drilling opportunities through down-spacing and drilling of proved undeveloped and unproved locations in the same formation(s) already producing, as well as
other non-producing formations, in a given oil or natural gas field without the necessity of purchasing additional leases or producing properties.
Our significant customers
For the years ended December 31, 2017, 2016 and 2015, sales to BG Energy Merchants LLC, and subsequently a subsidiary of Shell, accounted for approximately 32%, 24% and 20%, respectively, of total consolidated revenues. BG Energy Merchants LLC was a subsidiary of BG Group, plc ("BG Group") until the acquisition of BG Group by Shell in early 2016. In January 2018, we discontinued the sale of natural gas to Shell in the East Texas and North Louisiana regions as a result of litigation regarding certain natural gas sales contracts. See further discussion in "Item 3. Legal proceedings". We have not experienced any interruptions or negative impact to our natural gas sales prices as a result of the discontinuance of sales to Shell in these regions. For the years ended December 31, 2017, 2016 and 2015, Chesapeake Energy Marketing Inc. accounted for approximately 17%, 32%, and 38% respectively, of total consolidated revenues. Chesapeake Energy Marketing Inc. is a subsidiary of Chesapeake Energy Corporation ("Chesapeake"). We are managing our credit risk as a result of the current commodity price environment through the attainment of financial assurances from certain customers. The loss of any significant customer may cause a temporary interruption in sales of, or lower price for, our oil and natural gas production.
Competition
The oil and natural gas industry is highly competitive, particularly with respect to acquiring prospective oil and natural gas properties and oil and natural gas reserves. We encounter strong competition from other independent operators and from major oil companies in acquiring properties, contracting for drilling equipment and securing trained personnel. Many of these competitors have substantially greater financial, managerial, technological and other resources than we do. Many of these companies not only engage in the acquisition, exploration, development, and production of oil and natural gas, but also have refining operations, market refined products and their own drilling rigs and oilfield services.
The oil and natural gas industry has periodically experienced shortages of drilling rigs, equipment, pipe and personnel, which have delayed development drilling and other exploitation activities and have caused significant price increases and operational delays. We may experience difficulties in obtaining drilling rigs and other services in certain areas as well as an increase in the cost for these services and related material and equipment. We are unable to predict when, or if, supply or demand imbalances may occur or how these market-driven factors impact prices, which affect our development and exploitation programs. Furthermore, our relationships with vendors may be negatively impacted by the Chapter 11 Cases, including their perception of our financial condition and long-term business plans. This could further disadvantage our ability to obtain services or negatively impact the prices to obtain certain services.
The oil and gas industry has recently experienced an increase incontinues to experience strong demand for drilling and completion services as a result of the improved commodity price environment and more efficient and effective development techniques.services. The domestic U.S. onshore rig count increased from 374 in May 2016 to 9101,056 in December 2017.2018. Furthermore, oil and gas companies have increased the average amount of proppant utilized in the hydraulic fracturing process to enhance recoveries from the wells. As a result, the increased demand for drilling rigs and completion services could result in increased costs to develop our oil and gas properties.
Competition also exists for hiring experienced personnel, particularly in petroleum engineering, geoscience, accounting and financial reporting, tax and land professions. In addition, the market for oil and natural gas properties is competitive. We are often outbid by competitors in our attempts to lease or acquire properties. The oil and natural gas industry also faces competition from alternative fuel sources, including other fossil fuels such as coal and renewable energy sources such as wind and solar power. Competitive conditions may be affected by future legislation and regulations as the U.S. develops new energy and climate-related policies. All of these challenges could make it more difficult to execute our growth strategy or result in an increase in our costs.
Applicable laws and regulations
General
The oil and natural gas industry is extensively regulated by numerous federal, state and local authorities. Laws, orders and regulations affecting the oil and natural gas industry are under constant review for amendment or expansion, which could
increase the regulatory burden and financial sanctions for noncompliance. Although the regulatory burden on the oil and natural gas industry increases our cost of doing business and, consequently, affects our profitability, we believe these burdens do not affect us any differently or to any greater or lesser extent than they affect others in our industry with similar types, quantities and locations of production.
The following is a summary of the more significant existing environmental, safety and other laws and regulations to which our business operations are subject and with which compliance may have a material adverse effect on our capital expenditures, earnings or competitive position.
Production regulation
Our operations are subject to a number of regulations at the federal, state and local levels. These regulations require, among other things, permits for the drilling of wells, drilling bonds and reports concerning operations. Many states, counties and municipalities in which we operate also regulate one or more of the following:
•the location of wells;
•the method of drilling, completing and operating wells;
•the surface use and restoration of properties upon which wells are drilled;
•the plugging and abandoning of wells;
•notice to surface owners and other third parties; and
•produced water and waste disposal.
State laws regulate the size and shape of drilling and spacing units or proration units governing the pooling of oil and natural gas properties. Horizontal wells drilled in shale formations, as distinguished from vertical wells, utilize multilateral wells and stacked laterals, all of which are also subject to well spacing, density and proration requirements of the Texas Railroad Commission that could adversely impact our ability to maximize the efficiency of our horizontal wells related to reservoir drainage over time. Some states, including Louisiana and Texas, allow forced pooling or integration of tracts to facilitate exploration while other states rely on voluntary pooling of lands and leases. In some instances, forced pooling or unitization may be implemented by third parties and may reduce our interest in the unitized properties. In addition, state conservation laws establish maximum rates of production from oil and natural gas wells and generally prohibit the venting or flaring of natural gas and require that oil and natural gas be produced in a prorated, equitable system. These laws and regulations may limit the amount of oil and natural gas we can produce from our wells or limit the number of wells or the locations at which we can drill. Moreover, most states generally impose a production, ad valorem or severance tax with respect to the production and sale of oil and natural gas within its jurisdiction. Many local authorities also impose an ad valorem tax on the minerals in place. States do not generally regulate wellhead prices or engage in other, similar direct economic regulation, but there can be no assurance they will not do so in the future.
Our operations are subject to numerous stringent federal and state statutes and regulations governing the discharge of materials into the environment or otherwise relating to environmental protection, some of which carry substantial administrative, civil and criminal penalties, as well as potential injunctive relief, for failure to comply. These laws and regulations may require the acquisition of a permit before drilling commences, restrict the types, quantities and concentrations of various substances that can be released into the environment in connection with drilling, production and transportation of oil and natural gas, govern the sourcing, storage and disposal of water used or produced in the drilling and completion process, restrict or prohibit drilling activities in certain areas and on certain lands lying within wetlands and other protected areas, require closing earthen impoundments and impose liabilities for pollution resulting from operations or failure to comply with regulatory filings.
Statutes, rules and regulations that apply to the exploration and production of oil and natural gas are often reviewed, amended, expanded and reinterpreted, making the prediction of future costs or the impact of regulatory compliance to new laws and statutes difficult. The regulatory burden on the oil and natural gas industry increases its cost of doing business and, consequently, adversely affects its (and our) profitability.
FERC and CFTC matters
The availability, terms and cost of downstream transportation significantly affect sales of natural gas and oil. The interstate transportation of natural gas, including regulation of the terms, conditions and rates for interstate transportation and storage of natural gas, is subject to federal regulation by the Federal Energy Regulatory Commission (“FERC”) under the Natural Gas Act (“NGA”). Transportation rates under the NGA must be just and reasonable. Since 1985, FERC has implemented regulations intended to increase competition within the natural gas industry by requiring that interstate natural gas
transportation be made available on an open-access, not unduly discriminatory basis. FERC’s jurisdiction under the NGA excludes gathering and distribution of natural gas; therefore, gathering and distribution of natural gas are subject to regulation by individual state laws. State regulations also govern the rates and terms for access to, and transportation of natural gas on, intrastate pipeline facilities (while intrastate pipelines may from time to time provide specific services that are subject to limited regulation by FERC). The interstate transportation of oil, including regulation of the rates, terms and conditions of service, is subject to federal regulation by FERC under the Interstate Commerce Act. Rates for such oil transportation must be just and reasonable and not unduly discriminatory. Oil transportation that is not federally regulated is left to state regulation.
With respect to its regulation of natural gas pipelines under the NGA, FERC has not generally required the applicant for construction of a new interstate natural gas pipeline to produce evidence of the greenhouse gas (“GHG”) emissions of the proposed pipeline’s customers. In August 2017, the U.S. Circuit Court of Appeals for the DC Circuit issued a decision remanding a natural gas pipeline certificate application to FERC, which required FERC to revise its environmental impact statement for the proposed pipeline to take into account GHG carbon emissions from downstream power plants using natural gas transported by the new pipeline. It is too early to determine the impacts of this Court decision, but it could be significant.
The federal government recently ended its decades-old prohibition of exports of crude oil produced in the lower 48 states of the U.S. It is too recent an event to determine the impact this regulatory change may have on our operations or our sales of
oil. The general perception in the industry is that ending the prohibition on exports of oil produced in the U.S. may have a positive impact on U.S. producers. In addition, the U.S. Department of Energy (“DOE”) authorizes exports of natural gas, including exports of natural gas by pipelines connecting U.S. natural gas production to pipelines in Mexico, which are expected to increase significantly with the changes taking place in the Mexican government’s regulations of the energy sector in Mexico. In addition, the DOE authorizes the export of liquefied natural gas (“LNG”) through LNG export facilities, the construction of which is regulated by FERC. In the third quarter of 2016, the first quantities of natural gas produced in the lower 48 states of the U.S. were exported as LNG from the first of several LNG export facilities being developed and constructed in the U.S. Gulf Coast region. While the volume of natural gas exports increased in 2018 and 2017, it is too recent an event to determine the impact this change may have on our operations or our sales of natural gas, the perception in the industry is that this will be a positive development for producers of U.S. natural gas.
Wholesale prices for natural gas and oil are not currently regulated and are determined by the market. We cannot predict, however, whether new legislation to regulate the price of energy commodities might be proposed, what proposals, if any, might actually be enacted by Congress or the various state legislatures, and what effect, if any, the proposals might have on the operations of the underlying properties.
Under the Energy Policy Act of 2005, FERC possesses regulatory oversight over natural gas markets, including the purchase, sale and transportation activities of natural gas market participants other than intrastate pipelines. The Commodity Futures Trading Commission (“CFTC”) also holds authority to monitor markets and enforce anti-market manipulation regulations with respect to the physical and financial (futures, options and swaps) energy commodities market pursuant to the Commodity Exchange Act, as amended by the Dodd Frank Wall Street Reform and Consumer Protection Act of 2010. With regard to our physical sales of natural gas and oil, our gathering of any of these energy commodities, and any related hedging activities that we undertake, we are required to observe these anti-market manipulation laws and related regulations enforced by FERC and/or the CFTC. These agencies hold substantial enforcement authority, including the ability to assess civil penalties of up to $1 million per day per violation, to order disgorgement of profits and to recommend criminal penalties. Should we violate the anti-market manipulation laws and regulations, we could also be subject to related third party damage claims by, among others, sellers, royalty owners and taxing authorities.
Federal, state or tribal oil and natural gas leases
In the event we conduct operations on federal, state or tribal oil and natural gas leases, such operations must comply with numerous regulatory restrictions, including various nondiscrimination statutes, royalty and related valuation requirements, and certain of these operations must be conducted pursuant to certain on-site security regulations and other appropriate permits issued by the Bureau of Land Management ("BLM"), Bureau of Ocean Energy Management, Bureau of Safety and Environmental Enforcement or other appropriate federal, state or tribal agencies.
Surface Damage Acts
In addition, a number of states and some tribal nations have enacted surface damage statutes (“SDAs”). These laws are designed to compensate for damage caused by mineral development. Most SDAs contain entry notification and negotiation requirements to facilitate contact between operators and surface owners/users. Most also contain binding requirements for payments by the operator to surface owners/users in connection with exploration and operating activities in addition to bonding
requirements to compensate for damages to the surface as a result of such activities. Costs and delays associated with SDAs could impair operational effectiveness and increase development costs.
Other regulatory matters relating to our pipeline and gathering system assets and rail transportation
The pipelines we use to gather and transport our oil and natural gas in interstate commerce are subject to regulation by the U.S. Department of Transportation (“DOT”) under the Hazardous Liquid Pipeline Safety Act of 1979, as amended (“HLPSA”) with respect to oil, and the Natural Gas Pipeline Safety Act of 1968, as amended (“NGPSA”) with respect to natural gas. The HLPSA and NGPSA govern the design, installation, testing, construction, operation, replacement and management of natural gas and hazardous liquids pipeline facilities, including pipelines transporting crude oil. Where applicable, the HLPSA and NGPSA also require us and other pipeline operators to comply with regulations issued pursuant to these acts that are designed to permit access to and allow copying of records and to make certain reports available and provide information as required by the Secretary of Transportation.
The Pipeline Safety Act of 1992, as reauthorized and amended (“Pipeline Safety Act”) mandates requirements in the way that the energy industry ensures the safety and integrity of its pipelines. The law applies to natural gas and hazardous liquids pipelines, including some gathering pipelines. Central to the law are the requirements it places on each pipeline operator
to prepare and implement an “integrity management program.” The Pipeline Safety Act mandates a number of other requirements, including increased penalties for violations of safety standards and qualification programs for employees who perform sensitive tasks. The DOT has established a number of rules carrying out the provisions of this act. The DOT Pipeline and Hazardous Materials Safety Administration (“PHMSA”) has established a new risk-based approach to determine which gathering pipelines are subject to regulation, and what safety standards regulated pipelines must meet. We could incur significant expenses as a result of these laws and regulations.
The pipelines used to gather and transport natural gas being produced by us are also subject to regulation by the DOT under the NGPSA, the Pipeline Safety Act, and the Pipeline Safety, Regulatory Certainty, and Job Creation Act of 2011, which was signed into law in January 2012. This law includes a number of provisions affecting pipeline owners and operators that became effective upon approval, including increased civil penalties for violators of pipeline regulations and additional reporting requirements. Most of the changes do not impact gathering lines. This legislation requires the PHMSA to issue or revise certain regulations and to conduct various reviews, studies and evaluations. In addition, the PHMSA had initially considered regulations regarding, among other things, the designation of additional high consequence areas along pipelines, minimum requirements for leak detection systems, installation of emergency flow restricting devices, and revision of valve spacing requirements. In October 2015, the PHMSA issued proposed new safety regulations for hazardous liquid pipelines, including a requirement that all hazardous liquid pipelines have a system for detecting leaks and for operators to establish a timeline for inspections of affected pipelines following extreme weather events or natural disasters. If such revisions to gathering line regulations and liquid pipelines regulations are enacted by PHMSA, we could incur significant expenses.
Any transportation of the Company’s crude oil or natural gas liquids by rail is also subject to regulation by the DOT’s PHMSA and the DOT’s Federal Railroad Administration (“FRA”) under the Hazardous Materials Regulations at 49 CFR Parts 171-180 (“HMR”), including Emergency Orders by the FRA and new regulations being proposed by the PHMSA, arising due to the consequences of train accidents and the increase in the rail transportation of flammable liquids.
U.S. federal taxation
Federal income tax laws significantly affect our operations. The principal provisions that affect us are those that permit us, subject to certain limitations, to deduct as incurred, rather than to capitalize and amortize, our share of the domestic “intangible drilling and development costs” and to claim depletion on a portion of our domestic oil and natural gas properties (up to an aggregate of 1,000 Bbls per day of domestic crude oil and/or equivalent units of domestic natural gas). Further, the federal government may adopt tax laws and/or regulations that will possibly materially adversely affect us. For example, recentlytax legislation enacted tax legislationin December 2017 provides that net operating losses (“NOLs”) arising in tax years ending after December 31, 2017 are only deductible to the extent of 80% of our taxable income in such year. In addition, NOLs can now be carried forward indefinitely, but cannot be carried back. Other measures that have been proposed in the past include the repeal or elimination of percentage depletion and the immediate deduction or write-offs of intangible drilling costs. Because of the speculative nature of such measures at this time,potential future changes in federal tax laws, we are unable to determine what effect, if any, future proposalslaws would have on product demand or our results of operations. See further discussion of the potential limitations on our ability to utilize NOLs in "Item 1A. Risk Factors" and recent changes to tax laws and regulations in "Note 12. Income taxes" in the Notes to our Consolidated Financial Statements.
U.S. environmental regulations
The exploration, development and production of oil and natural gas, including the operation of saltwater injection and disposal wells, are subject to various federal, state and local environmental laws and regulations. These laws and regulations can increase the costs of planning, designing, installing and operating oil and natural gas wells. Federal environmental statutes to which our domestic activities are subject include, but are not limited to:
•the Oil Pollution Act of 1990 (“OPA”);
•the Clean Water Act of 1972 (“CWA”);
•the Rivers and Harbors Act of 1899;
•the Comprehensive Environmental Response, Compensation and Liability Act, as amended (“CERCLA”);
•the Resource Conservation and Recovery Act (“RCRA”);
•the Clean Air Act (“CAA”);
•the Safe Drinking Water Act (“SDWA”);
•the Toxic Substances Control Act of 1976 ("TSCA");
•the Endangered Species Act of 1973 (the "ESA"); and
•the National Environment Policy Act of 1969 (the "NEPA").
These laws and their implementing regulations, as well as analogous state and local laws and regulations, generally restrict pollutants emitted to the air, discharges to surface waters, and disposal or other releases to surface and below ground soils and groundwater.
In general, the oil and natural gas exploration and production industry has been the subject of increasing scrutiny and regulation by environmental authorities. For example, the United States Environmental Protection Agency (“EPA”) has identified ensuring environmental compliance by the energy extraction sectionsector as one of its enforcement initiatives for fiscal years 2017-2019. However, the EPA has proposed to transition away from a sector specific initiative for the 2020-2023 fiscal years to a more general focus on significant sources of VOCs.
Our domestic activities are subject to regulations promulgated under federal statutes and comparable state statutes. We also are subject to regulations governing the handling, transportation, storage and disposal of naturally occurring radioactive materials that are found in our oil and natural gas operations and other materials generated by our operations. Administrative, civil and criminal penalties, as well as injunctive relief, may be imposed for non-compliance with environmental laws and regulations. Additionally, these laws and regulations may require the acquisition of permits or other governmental authorizations before we undertake certain activities, limit or prohibit other activities because of protected areas or species, restrict the types of substances used in our drilling operations, impose certain substantial liabilities for the investigation and clean-up of pollution, impose certain reporting requirements, regulate remedial plugging operations to prevent future contamination, and require substantial expenditures for compliance. We cannot predict what effect future regulation or legislation, enforcement policies, and claims for damages to property, employees, other persons and the environment resulting from our operations could have on our activities.
Under the CWA, which was amended and augmented by OPA, our release or threatened release of oil or hazardous substances into or upon waters of the United States, adjoining shorelines and wetlands and offshore areas could result in our being held responsible for: (1) the costs of removing or remediating a release; (2) administrative, civil or criminal fines or penalties; or (3) specified damages, such as loss of use, property damage and natural resource damages. The scope of our liability could be extensive depending upon the circumstances of the release. Liability can be joint and several and without regard to fault. The CWA imposes restrictions and permitting requirements for discharges of pollutants as well as certain discharges of dredged or fill material into waters of the United States, including certain wetlands, which may apply to various of our construction activities, as well as requirements to develop Spill Prevention Control and Countermeasure Plans and Facility Response Plans to address potential discharges of oil into or upon waters of the United States and adjoining shorelines. State laws governing discharges to water also may impose restrictions and require varying civil, criminal and administrative penalties and impose liabilities in the case of a discharge of petroleum or its derivatives, or other hazardous substances, into state waters. TheIn 2015, the EPA has issued final rules outlining its position on the federal jurisdictional reach over waters of the United States. This interpretation by the EPA may constitute an expansion of federal jurisdiction over waters of the United States. The rule was stayed nationwide byapproved and the U.S. Sixth Circuit Court of Appeals in October 2015 as that appellate courtcurrent administration moved to stay and several other courts hear lawsuits opposing implementationreplace the rule. On February 14, 2019, the EPA proposed a new rule on federal jurisdiction over the waters of the rule. In January 2017, the United States Supreme Court accepted review of the rule to determine whether jurisdiction rests with the federal district or appellate courts. Litigation surroundingStates. The comment period on this rule is ongoing. In February 2017, President Trump issued an executive order directing the agencies to begin the process of rescinding or revising the rule.
remains open.
CERCLA, often referred to as Superfund, and comparable state statutes, impose liability that is generally joint and several and that is retroactive for costs of investigation and remediation and for natural resource damages, without regard to fault or the legality of the original conduct, on specified classes of persons for the release of a “hazardous substance” or under state law, other specified substances, into the environment. So-called potentially responsible parties (“PRPs”) include the current and certain past owners and operators of a facility where there has been a release or threat of release of a hazardous substance and persons who disposed of or arranged for the disposal of hazardous substances found at a site. CERCLA also authorizes the EPA and, in some cases, third parties to take actions in response to threats to the public health or the environment and to seek to recover from the PRPs the cost of such action. Liability can arise from conditions on properties where operations are conducted, even under circumstances where such operations were performed by third parties not under our control, and/or from conditions at third party disposal facilities where materials from operations were sent. Although CERCLA currently exempts petroleum (including oil and natural gas) from the definition of hazardous substance, some similar state statutes do not provide such an exemption. We cannot ensure that this exemption will be preserved in any future amendments of the act. Such amendments could have a material impact on our costs or operations. Additionally, our operations may involve the use or handling of other materials that may be classified as hazardous substances under CERCLA or regulated under similar state statutes. We may also be the owner or operator of sites on which hazardous substances have been released.
Oil and natural gas exploration and production, and possibly other activities, have been conducted at a majority of our properties by previous owners and operators. Materials from these operations remain on some of the properties and in certain instances may require remediation. In some instances, we have agreed to indemnify the sellers of producing properties from whom we have acquired reserves against certain liabilities for environmental claims associated with the properties. We do not believe the costs to be incurred by us for compliance and remediating previously or currently owned or operated properties will be material, but we cannot guarantee that result.
RCRA and comparable state and local programs impose requirements on the management, generation, treatment, storage, disposal and remediation of both hazardous and nonhazardous solid wastes. Although we believe we utilize operating and waste disposal practices that are standard in the industry, hydrocarbons or other solid wastes may have been disposed or released on or under the properties we own or lease, in addition to the locations where such wastes have been taken for disposal. In addition, many of these properties have been owned or operated by third parties. We have not had control over such parties' treatment of hydrocarbons or other solid wastes and the manner in which such substances may have been disposed or released. We also generate hazardous and non-hazardous solid waste in our routine operations. It is possible that certain wastes generated by our operations, which are currently exempt from “hazardous waste” regulations under RCRA, may in the future be designated as “hazardous waste” under RCRA or other applicable state statutes and become subject to more rigorous and costly management and disposal requirements; these wastes may not be exempt under current applicable state statutes. For example, following the filing of a lawsuit in the U.S. District Court for the District of Columbia in May 2016 by several non-governmental environmental groups against the EPA for the agency’s failure to timely assess its RCRA Subtitle D criteria regulations for oil and gas wastes, the EPA and the environmental groups entered into an agreement that was finalized in a consent decree issued by the District Court on December 28, 2016. Under the decree, the EPA is required to propose no later than March 15, 2019, a rulemaking for revision of certain Subtitle D criteria regulations pertaining to oil and gas wastes or sign a determination that revision of the regulations is not necessary. If the EPA proposes a rulemaking for revised oil and gas waste regulations, the Consent Decree requires that the EPA take final action following notice and comment rulemaking no later than July 15, 2021. Non-exempt waste is subject to more rigorous and costly disposal requirements. A loss of the RCRA exclusion for drilling fluids, produced waters and related wastes could result in a significant increase in our costs to manage and dispose of waste.
Our operations are subject to local, state and federal regulations for the control of emissions from sources of air pollution. The CAA and analogous state and local laws require certain new and modified sources of air pollutants to obtain permits prior to commencing construction or operation. Smaller sources may qualify for exemption from permit requirements or for more streamlined permitting, for example, through qualifications for permits by rule, standard permits or general permits. Major sources of air pollutants are subject to more stringent, federally imposed requirements including additional operating permits. Federal and state laws designed to control hazardous (i.e., toxic) air pollutants may require installation of additional controls. Administrative enforcement actions for failure to comply strictly with air pollution regulations or permits are generally resolved by payment of monetary fines and correction of any identified deficiencies. Alternatively, regulatory agencies could bring lawsuits for civil penalties or require us to suspend or forgo construction, modification or operation of certain air emission sources.
The EPA has issued final rules to subject oil and natural gas productions, storage, processing and transmission operations to regulation under the New Source Performance Standards (“NSPS”) and National Emission Standards for Hazardous Air Pollutants (“NESHAPS”), both programs under the CAA, and to impose new and amended requirements under both programs. The EPA rules include NSPS standards for completions of hydraulically fractured natural gas wells. Beginning January 1, 2015,
operators must capture the natural gas and make it available for use or sale, which can be done through the use of green completions. The standards are applicable to new hydraulically fractured wells and also existing wells that are refractured. Further, the finalized regulations also establish specific new requirements, which became effective in 2012, for emissions from compressors, controllers, dehydrators, storage tanks, natural gas processing plants and certain other equipment. These rules may require changes to our operations, including the installation of new equipment to control emissions. We continuously evaluate the effect these rules and amendments will have on our business.
The EPA has adopted rules to regulate methane emissions including from new and modified oil and gas production sources and natural gas processing and transmission sources, and has announced its intention to regulate methane emissions from existing oil and gas sources. The rules amend the air emission rules for oil and natural gas sources and natural gas processing and transmission facilities to include new standards for methane. In September 2018, the EPA proposed changes to the previously-adopted methane emissions rules to reduce regulatory burdens and harmonize federal and state requirements by reducing the frequency for monitoring methane leaks and increase the time allowed for repair and allowing companies to meet certain state requirements for leaks as an alternative to EPA standards where the state regulations “are at least equivalent” to the EPA’s. The status of future regulation remains unclear, but if adoptedany changes could require changes to our operations, including the installation of new emission control equipment. Simultaneously with the methane rules, the EPA adopted new rules governing the aggregating of multiple surface sites into a single-source of air quality permitting purposes, a change which could impact the applicability of permitting requirement to our operations and subject certain operations to additional regulatory requirements. We continuously evaluate the effect of these rules on our operations.
In the most recent Congressional session, a resolution was proposed which aimed to dramatically reduce greenhouse gas emissions, including a transition from fossil fuel. It is unclear what the future of this or other legislation would be. However, such legislation if adopted could have an adverse effect on demand for the oil and natural gas that we produce. In the absence of comprehensive federal legislation on GHG emission control, the EPA attempted to require the permitting of GHG emissions.
Although the Supreme Court struck down the permitting requirements, it upheld the EPA’s authority to control GHG emissions when a permit is required due to emissions of other pollutants. These permitting provisions, to the extent applicable to our operations, could require us to implement emission controls or other measures to reduce GHG emissions and we could incur additional costs to satisfy those requirements. In addition, GHG regulations could have an adverse effect on demand for the oil and natural gas we produce.
In addition, the EPA requires the reporting of GHG emissions from specified large GHG emission sources including onshore and offshore oil and natural gas production facilities and onshore oil and natural gas processing, transmission, storage and distribution facilities, which may include facilities we operate. Reporting of GHG emissions from such facilities is required on an annual basis. We will continue to incur costs associated with this reporting obligation.
Additionally, in December 2015, the United States joined the international community at the 21st Conference of the Parties of the United Nations Framework Convention on Climate Change in Paris, France that prepared an agreement requiring member countries to review and "represent a progression" in their intended nationally determined contributions, which set GHG emission reduction goals every five years beginning in 2020. This “Paris Agreement” was signed by the United States in April 2016 and entered into force in November 2016. The United States is one of more than 120 nations having ratified or otherwise consented to the agreement; however, this agreement does not create any binding obligations for nations to limit their GHG emissions but, rather, includes pledges to voluntarily limit or reduce future emissions. In June 2017, President Trump has announced anthe United States' intention to withdraw from the Paris Agreement.
In late 2016, the BLM adopted rules governing flaring and venting on public and tribal lands, which could require additional equipment and emissions controls as well as inspection requirements. These rules haveIn September 2018, the BLM finalized a rule that eliminated many of the initial restrictions on flaring and venting and modified or replaced others. This rulemaking has been challenged in court and remain in litigation. The BLM has temporarily suspended or delayed parts of the rule until January 17, 2019. If allowed to stand, these additionallitigation is ongoing. Additional regulations on our air emissions isare likely to result in increased compliance costs and additional operating restrictions on our business.
ESA was established to protect endangered and threatened species. Pursuant to that act, if a species is listed as threatened or endangered, restrictions may be imposed on activities adversely affecting that species’ habitat. Similar protections are offered to migratory birds under the Migratory Bird Treaty Act. The U.S. Fish and Wildlife Service must also designate the species’ critical habitat and suitable habitat as part of the effort to ensure survival of the species. A critical habitat or suitable habitat designation could result in further material restrictions to land use and may materially delay or prohibit land access for oil and natural gas development. If we were to have a portion of our leases designated as critical or suitable habitat, it may adversely impact the value of the affected leases.
Oil and natural gas exploration and production activities on federal lands may be subject to the NEPA, which requires federal agencies, including the Department of the Interior, to evaluate major agency actions having the potential to significantly impact the environment. In the course of such evaluations, an agency will prepare an Environmental Assessment that assesses the potential direct, indirect and cumulative impacts of a proposed project and, if necessary, will prepare a more detailed Environmental Impact Statement that may be made available for public review and comment. Depending on the mitigation strategies recommended in the Environmental Assessments or Environmental Impact Statement, we could incur added costs, which may be significant. Reviews and decisions under NEPA are also subject to protest, appeal or litigation, any or all of
which may delay or halt projects. To the extent that our exploration and development plans include leases on federal lands, the NEPA requirements have the potential to delay or impose additional conditions upon the development of oil and natural gas projects.
Hydraulic fracturing activities
Over the past few years, there has been an increased focus on environmental aspects of hydraulic fracturing activities in the United States. While hydraulic fracturing is typically regulated by state oil and natural gas commissions in the United States, there have recently been a number of regulatory initiatives at the federal and local levels as well as by other state agencies.
Nearly all of our exploration and production operations depend on the use of hydraulic fracturing to enhance production from oil and natural gas wells. Hydraulic fracturing involves the injection of water, sand and chemicals under pressure into formations to fracture the surrounding rock and stimulate production. Our hydraulic fracturing activities are focused in our shale plays in South Texas, East Texas, North Louisiana and Appalachia. Predominantly all of our undeveloped properties would not be economical without the use of hydraulic fracturing to stimulate production from the well.
Currently, most hydraulic fracturing activities are regulated at the state level, as the SDWA currently exempts from regulation the injection of fluids or propping agents (other than diesel fuels) for hydraulic fracturing operations. Congress has periodically considered legislation to amend the federal SDWA to remove the exemption from regulation and permitting that is applicable to hydraulic fracturing operations and to require reporting and disclosure of chemicals used by the oil and natural gas industry in the hydraulic fracturing process. Sponsors of bills previously introduced before the Senate and House of Representatives have asserted that chemicals used in the fracturing process could adversely affect drinking water supplies. Many states have considered or adopted legislation regulating hydraulic fracturing, including the disclosure of chemicals used in the process or the prohibition of certain hydraulic fracturing activities. These bills, or similar legislation, if adopted, could increase the possibility of litigation and establish an additional level of regulation at the federal level that could lead to operational delays or increased operating costs and could result in additional regulatory burdens, making it more difficult to perform hydraulic fracturing and increasing our costs of compliance.
In addition, the EPA has recently been taking action to assert federal regulatory authority over hydraulic fracturing using diesel under the SDWA's Underground Injection Control Program and has issued guidance regarding its authority over the permitting of these activities. Additionally, in December 2016, the EPA released its final report on the potential impacts of hydraulic fracturing on drinking water resources, concluding that “water cycle” activities associated with hydraulic fracturing may impact drinking water resources “under some circumstances,” including water withdrawals for fracturing in times or areas of low water availability; surface spills during the management of fracturing fluids, chemicals or produced water; injection of fracturing fluids into wells with inadequate mechanical integrity; injection of fracturing fluids directly into groundwater resources; discharge of inadequately treated fracturing wastewater to surface waters; and disposal or storage of fracturing wastewater in unlined pits. Further, in June 2016, the EPA published an effluent limit guideline final rule prohibiting the discharge of wastewater from onshore unconventional oil and natural gas extraction facilities to publicly owned wastewater treatment plants. In 2014, the EPA published an advanced notice of public rulemaking regarding TSCA reporting of the chemical substances and mixture used in hydraulic fracturing.
The BLM published a final rule that established new or more stringent standards relating to hydraulic fracturing on federal and tribal lands but, in June 2016 a Wyoming federal judge struck down this final rule, finding that the BLM lacked authority to promulgate the rule. On July 25, 2017, the BLM proposed to rescind these regulations. In December 2017, the BLM issued a final rule to rescind the earlier rulemaking on hydraulic fracturing. This rulemaking has been challenged in court and litigation is ongoing.
Local regulations, which may be preempted by state and federal regulations, have included the following which may extend to all operations including those beyond hydraulic fracturing:
•noise control ordinances;
•traffic control ordinances;
•limitations on the hours of operations; and
•mandatory reporting of accidents, spills and pressure test failures.
If in the course of our routine oil and natural gas operations, surface spills and leaks occur, including casing leaks of oil or other materials, we may incur penalties and costs for waste handling, investigation and remediation and third party actions for damages. Moreover, we are only able to directly control the operations of the wells that we operate. Notwithstanding our
lack of control over wells owned by us but operated by others, the failure of the operator to comply with applicable environmental regulations may be attributable to us and may impose legal liabilities upon us.
If substantial liabilities to third parties or governmental entities are incurred, the payment of such claims may reduce or eliminate the funds available for project investment or result in loss of our properties. Although we maintain insurance coverage we consider to be customary in the industry, we are not fully insured against all of these risks, either because insurance is not available or because of high premiums. Accordingly, we may be subject to liability or may lose substantial portions of properties due to hazards that cannot be insured against or have not been insured against due to prohibitive premiums or for other reasons. The imposition of any of these liabilities or compliance obligations on us may have a material adverse effect on our financial condition and results of operations.
We do not anticipate that we will be required in the near future to expend amounts that are material in relation to our total capital expenditures program complying with current environmental laws and regulations. As these laws and regulations are frequently changed and are subject to interpretation, our assessment regarding the cost of compliance or the extent of liability risks may change in the future.
OSHA and other regulations
To the extent not preempted by other applicable laws, we are subject to the requirements of the federal OSHA and comparable state statutes, where applicable. The OSHA hazard communication standard, the EPA community right-to-know regulations under Title III of CERCLA and similar state statutes, where applicable, require that we maintain and/or disclose information about hazardous materials used or produced in our operations. We believe that we are in substantial compliance with these applicable requirements and with other OSHA and comparable state requirements.
Title to our properties
When we acquire developed properties we conduct a title investigation, which will most often include either reviewing or obtaining a title opinion. However, when we acquire undeveloped properties, as is common industry practice, we usually conduct little or no investigation of title other than a preliminary review of local real property and/or mineral records. We will conduct title investigations and, in most cases, obtain a title opinion of local counsel for the drill site before we begin drilling operations. We believe that the methods we utilize for investigating title prior to acquiring any property are consistent with practices customary in the oil and natural gas industry and that our practices are adequately designed to enable us to acquire marketable title to properties. However, some title risks cannot be avoided, despite the use of customary industry practices.
Our properties are generally burdened by:
customary royalty and overriding royalty interests;
liens incident to operating agreements; and
liens for current taxes and other burdens and minor encumbrances, easements and restrictions.
We believe that none of these burdens materially detract from the value of our properties or materially interfere with property used in the operation of our business. In addition to the foregoing listed burdens, substantially all of our properties have been pledged as collateral under the DIP Credit Agreement, EXCO Resources Credit Agreement, 1.5 Lien Notes, 1.75 Lien Term Loans and the Second Lien Term Loans.
Operational factors and insurance
Oil and natural gas exploration and development involve a high degree of risk. In the event of explosions, environmental damage, or other accidents such as well fires, blowouts, equipment failure and human error, substantial liabilities to third parties or governmental entities may be incurred, the satisfaction of which could substantially reduce available cash and possibly result in the loss of oil and natural gas properties. As is common in the oil and natural gas industry, we are not fully insured against all risks associated with our business either because such insurance is not available or because we believe the premium costs are prohibitive. A loss not fully covered by insurance could have a materially adverse effect on our operating results, financial position or cash flows. For further discussion on risks see “Item 1A. Risk Factors - We are exposed to operating hazards and uninsured risks that could adversely impact our results of operations and cash flows.flows.”
We currently carry automobile liability, general liability and excess liability insurance with a combined annual limit of $72 million per occurrence and in the aggregate. These insurance policies contain maximum policy limits and deductibles ranging from $1,000 to $25,000 that must be met prior to recovery, and are subject to customary exclusions and limitations.
Our automobile and general liability insurance covers us and our subsidiaries for third-party claims and liabilities arising out of lease operations and related activities. The excess liability insurance is in addition to, and is triggered if the automobile and general liability insurance per occurrence limit is reached. Further, we currently carry $45 million of pollution coverage, $25 million of well control (blowout) coverage, property insurance in the amount of $178 million in respect of wellhead, surface equipment, tanks, and miscellaneous items and scheduled oil lease roads coverage with deductibles ranging from $100,000$25,000 to $500,000.
We require our third-party contractors to sign master service agreements in which they generally agree to indemnify us for the injury and death of the service provider's employees as well as contractors and subcontractors that are hired by the service provider. Similarly, we agree to indemnify our third-party contractors against claims made by our employees and our other contractors. Additionally, each party generally is responsible for damage to its own property.
Our third-party contractors that perform hydraulic fracturing operations for us sign master service agreements containing the indemnification provisions noted above. We do not currently have any insurance policies in effect that are intended to provide coverage for losses solely related to hydraulic fracturing operations. We believe that our general liability, excess
liability and pollution insurance policies would cover third-party claims related to hydraulic fracturing operations and associated legal expenses, in accordance with, and subject to, the terms of such policies. However, these policies generally will not cover fines and penalties. Further, these policies may not cover the costs and expenses related to government-mandated environmental clean-up responsibilities, or may do so on a limited basis.
Our employees
As of December 31, 2017,2018, we employed 168153 persons. None of our employees are represented by unions or covered by collective bargaining agreements. To date, we have not experienced any strikes or work stoppages due to labor problems, and we consider our relations with our employees to be satisfactory. We also utilize the services of independent consultants and contractors.
Forward-looking statements
This Annual Report on Form 10-K contains forward-looking statements, as defined in Section 27A of the Securities Act of 1933, as amended ("Securities Act") and Section 21E of the Securities Exchange Act of 1934, as amended ("the Exchange Act"). These forward-looking statements relate to, among other things, the following:
our future financial and operating performance and results;
our business strategy;
market prices;
our future use of derivative financial instruments;
our liquidity and capital resources; and
our plans and forecasts.
We have based these forward-looking statements on our current assumptions, expectations and projections about future events. We use the words “may,” “expect,” “anticipate,” “estimate,” “believe,” “continue,” “intend,” “plan,” “potential,” “project,” “budget” and other similar words to identify forward-looking statements. The statements that contain these words should be read carefully because they discuss future expectations, contain projections of results of operations or our financial condition and/or state other “forward-looking” information. We do not undertake any obligation to update or revise any forward-looking statements, except as required by applicable securities laws. These statements also involve risks and uncertainties that could cause our actual results or financial condition to materially differ from our expectations in this Annual Report on Form 10-K and the documents incorporated herein by reference, including, but not limited to:
bankruptcy proceedings and the effect of those proceedings on our ongoing and future operations, including the actions of the Court and our creditors;
the outcome of potential strategic alternatives to maximize value for the benefit of our stakeholders as part of the Chapter 11 process, which may include a sale of certain or substantially all of our assets under Section 363 of the Bankruptcy Code, a plan of reorganization to equitize certain indebtedness as an alternative to the sale process, or a combination thereof;
our ability to negotiateenter into transactions as a planresult of reorganization in connection with theour Chapter 11 process,filing, including the restructuring of our indebtedness;commodity derivative contracts with financial institutions and services with vendors;
our future cash flows and the adequacy to fund the significant costs associated with the bankruptcy process, including our ability to limit these costs by obtaining confirmation of a successful plan of reorganization in a timely manner;
our ability to obtain the requisite number of votes required to obtain confirmation of a plan of reorganization;
our ability to maintain compliance with debt covenants and to meet debt service obligations associated with the DIP Credit Agreement;
our ability to obtain exit financing in order to consummate a plan of reorganization;
future capital requirements and availability of financing, including limitations on our ability to incur certain types of indebtedness under our debt agreements and to refinance or replace existing debt obligations;
fluctuations in the prices of oil and natural gas;
the availability of oil and natural gas;
disruption of credit and capital markets and the ability of financial institutions to honor their commitments;
estimates of reserves and economic assumptions, including estimates related to acquisitions and dispositions of oil and natural gas properties;
geological concentration of our reserves;
risks associated with drilling and operating wells;
exploratory risks, including those related to our activities in shale formations;
discovery, acquisition, development and replacement of oil and natural gas reserves;
our ability to enter into transactions as a result of our Chapter 11 filing, including commodity derivative contracts with financial institutions and services with vendors;
timing and amount of future production of oil and natural gas;
availability of drilling and production equipment;
availability of water, sand and other materials for drilling and completion activities;
marketing of oil and natural gas;
political and economic conditions and events in oil-producing and natural gas-producing countries;
title to our properties;
litigation;
competition;
our ability to attract and retain key personnel;
general economic conditions, including costs associated with drilling and operations of our properties;
impact on our common shares as a result of the delisting from the New York Stock Exchange ("NYSE"), including the negative impact on our share price, volatility and liquidity associated with trading on over-the-counter markets;
environmental or other governmental regulations, including legislation to reduce emissions of greenhouse gases, legislation of derivative financial instruments, regulation of hydraulic fracture stimulation and elimination of income tax incentives available to our industry;
receipt and collectability of amounts owed to us by purchasers of our production;
our ability and decisions whether or not to enter into commodity derivative financial instruments;
potential acts of terrorism;
our ability to manage joint ventures with third parties, including the resolution of any material disagreements and our partners’ ability to satisfy obligations under these arrangements;
actions of third party co-owners of interests in properties in which we also own an interest;
fluctuations in interest rates;
our ability to effectively integrate companies and properties that we acquire;
our ability to execute our business strategies and other corporate actions; and
our ability to continue as a going concern.
We believe it is important to communicate our expectations of future performance to our investors. However, events may occur in the future that we are unable to accurately predict, or over which we have no control. We caution users of the financial statements not to place undue reliance on any forward-looking statements. When considering our forward-looking statements, keep in mind the risk factors and other cautionary statements included in this Annual Report on Form 10-K. The risk factors noted in this Annual Report on Form 10-K provide examples of risks, uncertainties and events that may cause our actual results to differ materially from those contained in any forward-looking statement. Please see “Item 1A. Risk Factors” for a discussion of certain risks related to our business, indebtedness and common shares.
Our revenues, operating results and financial condition depend substantially on prevailing prices for oil and natural gas and the availability of capital from the DIP Credit Agreement and other sources. Declines in oil or natural gas prices may have a material adverse effect on our financial condition, Liquidity, results of operations, the amount of oil or natural gas that we can produce economically and the ability to fund our operations. Historically, oil and natural gas prices and markets have been volatile, with prices fluctuating widely, and they are likely to continue to be volatile.
Glossary of selected oil and natural gas terms
The following are abbreviations and definitions of terms commonly used in the oil and natural gas industry and this Annual Report on Form 10-K.
2-D seismic. Geophysical data that depicts the subsurface strata in two dimensions.
3-D seismic. Geophysical data that depicts the subsurface strata in three dimensions. 3-D seismic typically provides a more detailed and accurate interpretation of the subsurface strata than 2-D seismic.
Appraisal wells. Wells drilled to convert an area or sub-region from the resource to the reserves category.
Analogous reservoir. Analogous reservoirs, as used in resources assessments, have similar rock and fluid properties, reservoir conditions (depth, temperature, and pressure) and drive mechanisms, but are typically at a more advanced stage of development than the reservoir of interest and thus may provide concepts to assist in the interpretation of more limited data and estimation of recovery. When used to support proved reserves, an “analogous reservoir” refers to a reservoir that shares the following characteristics with the reservoir of interest: (i) same geological formation (but not necessarily in pressure communication with the reservoir of interest); (ii) same environment of deposition; (iii) similar geological structure; and (iv) same drive mechanism.
Bbl. One stock tank barrel, or 42 U.S. gallons liquid volume, used in reference to oil, NGLs or other liquid hydrocarbons.
Bbtu. One billion British thermal units.
Bcf. One billion cubic feet of natural gas.
Bcfe. One billion cubic feet equivalent calculated by converting one Bbl of oil or NGLs to six Mcf of natural gas. This ratio of Bbl to Mcf is commonly used in the oil and natural gas industry and represents the approximate energy
equivalent of natural gas to oil or NGLs, and does not represent the sales price equivalency of natural gas to oil or NGLs. Currently the sales price of a Bbl or NGL is significantly higher than the sales price of six Mcf of natural gas.
Btu. British thermal unit, which is the heat required to raise the temperature of a one pound mass of water from 58.5 to 59.5 degrees Fahrenheit.
Completion. The installation of permanent equipment for the production of oil or natural gas, or, in the case of a dry hole, the reporting to the appropriate authority that the well has been abandoned.
Deterministic method. The method of estimating reserves or resources when a single value for each parameter (from the geoscience, engineering, or economic data) in the reserves calculation is used in the reserves estimation procedure.
Developed acreage. The number of acres which are allocated or assignable to producing wells or wells capable of production.
Development well. A well drilled within the proved area of an oil or natural gas reservoir to the depth of a stratigraphic horizon known to be productive.
Dry hole; Dry well. A well found to be incapable of producing either oil or natural gas in sufficient quantities to justify completion as an oil or natural gas well.
Economically producible. As it relates to a resource, a resource which generates revenue that exceeds, or is reasonably expected to exceed, the costs of the operation.
Estimated ultimate recovery (EUR). Estimated ultimate recovery is the sum of reserves remaining as of a given date and cumulative production as of that date.
Exploitation. The continuing development of a known producing formation in a previously discovered field. To maximize the ultimate recovery of oil or natural gas from the field by development wells, secondary recovery equipment or other suitable processes and technology.
Exploratory well. An exploratory well is a well drilled to find a new field or to find a new reservoir in a field previously found to be productive of oil or natural gas in another reservoir. Generally, an exploratory well is any well that is not a development well, a service well, or a stratigraphic test well.
Farmout. An assignment of an interest in a drilling location and related acreage conditional upon the drilling of a well on that location.
Formation. A succession of sedimentary beds that were deposited under the same general geologic conditions.
Fracture stimulation. A stimulation treatment routinely performed involving the injection of water, sand and chemicals under pressure to stimulate hydrocarbon production.
Full cost pool. The full cost pool consists of all costs associated with property acquisition, exploration, and development activities for a company using the full cost method of accounting. Additionally, any internal costs that can be directly identified with acquisition, exploration and development activities are included. Any costs related to production, general corporate overhead or similar activities are not included.
Gross acres or gross wells. The total acres or wells, as the case may be, in which a working interest is owned.
Held-by-production. A provision in an oil, natural gas and mineral lease that perpetuates a company's right to operate a property or concession as long as the property or concession produces a minimum paying quantity of oil or natural gas.
Horizontal wells. Wells drilled at angles greater than 70 degrees from vertical.
Initial production rate. Generally, the maximum 24 hour production volume from a well.
Mbbl. One thousand stock tank barrels.
Mcf. One thousand cubic feet of natural gas.
Mcfe. One thousand cubic feet equivalent calculated by converting one Bbl of oil or NGLs to six Mcf of natural gas.
Mmbbl. One million stock tank barrels.
Mmbtu. One million British thermal units.
Mmcf. One million cubic feet of natural gas.
Mmcf/d. One million cubic feet of natural gas per day.
Mmcfe. One million cubic feet of natural gas equivalent calculated by converting one Bbl of oil or NGLs to six Mcf of natural gas. This ratio of Bbl to Mcf is commonly used in the oil and natural gas industry and represents the approximate
energy equivalent of natural gas to oil or NGLs, and does not represent the sales price equivalency of natural gas to oil or NGLs. Currently the sales price of a Bbl or NGL is significantly higher than the sales price of six Mcf of natural gas.
Mmcfe/d. One million cubic feet of natural gas equivalent per day calculated by converting one Bbl of oil or NGLs to six Mcf of natural gas.
Net acres or net wells. Exists when the sum of fractional ownership interests owned in gross acres or gross wells equals one. We compute the number of net wells by totaling the percentage interest we hold in all our gross wells.
NYMEX. New York Mercantile Exchange.
NGLs. The combination of ethane, propane, butane and natural gasolines that when removed from natural gas become liquid under various levels of higher pressure and lower temperature.
Overriding royalty interest. An interest in an oil and/or natural gas property entitling the owner to a share of oil and natural gas production free of the costs of production.
Pad drilling. The drilling of multiple wells from the same site.
Play. A term applied to a portion of the exploration and production cycle following the identification by geologists and geophysicists of areas with potential oil and natural gas reserves.
Present value of estimated future net revenues or PV-10. The present value of estimated future net revenues is an estimate of future net revenues from a property at the date indicated, without giving effect to derivative financial instrument activities, after deducting production and ad valorem taxes, future capital costs, abandonment costs and operating expenses, but before deducting future income taxes. The future net revenues have been discounted at an annual rate of 10% to determine their “present value.” The present value is shown to indicate the effect of time on the value of the net revenue stream and should not be construed as being the fair market value of the properties. Estimates have been made using constant oil and natural gas prices and operating and capital costs at the date indicated, at its acquisition date, or as otherwise indicated.
Probabilistic method. The method of estimation of reserves or resources when the full range of values that could reasonably occur for each unknown parameter (from the geoscience and engineering data) is used to generate a full range of possible outcomes and their associated probabilities of occurrence.
Productive well. A productive well is a well that is not a dry well.
Proved Developed Reserves. These reserves are reserves of any category that can be expected to be recovered: (i) through existing wells with existing equipment and operating methods or in which the cost of the required equipment is relatively minor compared to the cost of a new well; and (ii) through installed extraction equipment and infrastructure operational at the time of the reserves estimate if the extraction is by means not involving a well.
Proved Reserves. Proved oil and natural gas reserves are those quantities of oil and natural gas, which, by analysis of geoscience and engineering data, can be estimated with Reasonable Certainty to be economically producible from a
given date forward, from known reservoirs, and under existing economic conditions, operating methods, and government regulations, prior to the time at which contracts providing the right to operate expire, unless evidence indicates that renewal is reasonably certain, regardless of whether deterministic or probabilistic methods are used for the estimation. The project to extract the hydrocarbons must have commenced or the operator must be reasonably certain that it will commence the project within a reasonable time.
The area of the reservoir considered as proved includes: (i) the area identified by drilling and limited by fluid contacts, if any, and (ii) adjacent undrilled portions of the reservoir that can, with Reasonable Certainty, be judged to be continuous with it and to contain economically producible oil or gas on the basis of available geoscience and engineering data.
In the absence of data on fluid contacts, proved quantities in a reservoir are limited by the lowest known hydrocarbons (LKH) as seen in a well penetration unless geoscience, engineering, or performance data and reliable technology establishes a lower contact with Reasonable Certainty. Where direct observation from well penetrations has defined a highest known oil (HKO) elevation and the potential exists for an associated gas cap, proved oil reserves may be assigned in the structurally higher portions of the reservoir only if geoscience, engineering, or performance data and reliable technology establish the higher contact with Reasonable Certainty.
Reserves which can be produced economically through application of improved recovery techniques (including, but not limited to, fluid injection) are included in the proved classification when: (i) successful testing by a pilot project in an area of the reservoir with properties no more favorable than in the reservoir as a whole, the operation of an installed program in the reservoir or an analogous reservoir, or other evidence using reliable technology establishes the Reasonable Certainty of the engineering analysis on which the project or program was based; and (ii) the project has been approved for development by all necessary parties and entities, including governmental entities.
Existing economic conditions include prices and costs at which economic producibility from a reservoir is to be determined. The price shall be the average price during the 12-month period prior to the ending date of the period covered by the report, determined as an unweighted arithmetic average of the first-day-of-the-month price for each month within such period, unless prices are defined by contractual arrangements, excluding escalations based upon future conditions.
Proved Undeveloped Reserves. Reserves of any category that are expected to be recovered from new wells on undrilled acreage, or from existing wells where a relatively major expenditure is required for recompletion.
Reserves on undrilled acreage shall be limited to those directly offsetting development spacing areas that are reasonably certain of production when drilled, unless evidence using reliable technology exists that establishes Reasonable Certainty of economic producibility at greater distances. Undrilled locations can be classified as having undeveloped reserves only if a development plan has been adopted indicating that they are scheduled to be drilled within five years, unless the specific circumstances justify a longer time.
Under no circumstances shall estimates for undeveloped reserves be attributable to any acreage for which an application of fluid injection or other improved recovery technique is contemplated, unless such techniques have been proved effective by actual projects in the same reservoir or an analogous reservoir or by other evidence using reliable technology establishing Reasonable Certainty.
Recompletion. An operation within an existing well bore to make the well produce oil and/or natural gas from a different, separately producible zone other than the zone from which the well had been producing.
Reasonable Certainty. If deterministic methods are used, Reasonable Certainty means a high degree of confidence that the quantities will be recovered. If probabilistic methods are used, there should be at least a 90% probability that the quantities actually recovered will equal or exceed the estimate. A high degree of confidence exists if the quantity is much more likely to be achieved than not, and, as changes due to increased availability of geoscience (geological, geophysical, and geochemical), engineering, and economic data are made to EUR with time, reasonably certain EUR is much more likely to increase or remain constant than to decrease.
Reservoir. A porous and permeable underground formation containing a natural accumulation of producible oil and/or natural gas that is confined by impermeable rock or water barriers and is individual and separate from other reservoirs.
Resources. Resources are quantities of oil and natural gas estimated to exist in naturally occurring accumulations. A portion of the resources may be estimated to be recoverable, and another portion may be considered to be unrecoverable. Resources include both discovered and undiscovered accumulations.
Royalty interest. An interest in an oil and/or natural gas property entitling the owner to a share of oil and natural gas production free of the costs of production.
Shale. Fine-grained sedimentary rock composed mostly of consolidated clay or mud. Shale is the most frequently occurring sedimentary rock.
Shut-in well. A producing well that has been closed down temporarily for, among other things, economics, cleaning out, building up pressure, lack of a market or lack of equipment.
Spud. To start the well drilling process.
Standardized Measure of discounted future net cash flows or the Standardized Measure. Under the Standardized Measure, future cash flows are estimated by applying the simple average spot prices for the trailing 12 month period using the first day of each month beginning on January 1 and ending on December 1 of each respective year, adjusted for price differentials, to the estimated future production of year-end Proved Reserves. Future cash inflows are reduced by estimated future production and development costs based on period-end and future plugging and abandonment costs to determine pre-tax cash inflows. Future income taxes are computed by applying the statutory tax rate to the excess of pre-tax cash inflows over our tax basis in the associated properties. Future net cash inflows after income taxes are discounted using a 10% annual discount rate to arrive at the Standardized Measure.
Stock tank barrel. 42 U.S. gallons liquid volume.
Tcf. One trillion cubic feet of natural gas.
Tcfe. One trillion cubic feet equivalent calculated by converting one Bbl of oil or NGLs to six Mcf of natural gas. This ratio of Bbl to Mcf is commonly used in the oil and natural gas industry and represents the approximate energy equivalent of natural gas to oil or NGLs, and does not represent the sales price equivalency of natural gas to oil or NGLs. Currently the sales price of a Bbl or NGL is significantly higher than the sales price for six Mcf of natural gas.
Undeveloped acreage. Leased acreage on which wells have not been drilled or completed to a point that would permit the production of economic quantities of oil and natural gas regardless of whether such acreage contains Proved Reserves.
Working interest. The operating interest that gives the owner the right to drill, produce and conduct activities on the property and a share of production.
Workovers. Operations on a producing well to restore or increase production.
Available information
We make available, free of charge, our Annual Report on Form 10-K, Quarterly Reports on Form 10-Q, Current Reports on Form 8-K and amendments to these reports on our website at www.excoresources.com as soon as reasonably practicable after those reports and other information are electronically filed with, or furnished to, the SEC.
The risk factors noted in this section and other factors noted throughout this Annual Report on Form 10-K, including those risks identified in “Item 7. Management's Discussion and Analysis of Financial Condition and Results of Operations” describe examples of risks, uncertainties and events that may cause our actual results to differ materially from those contained in any forward-looking statement.
If one or more of these risks or uncertainties materialize, or if underlying assumptions prove incorrect, actual outcomes may vary materially from those included in this Annual Report on Form 10-K.
Risks Relating to Our Restructuring
We have filed voluntary petitions for relief under the Bankruptcy Code and are subject to the risks and uncertainties associated with bankruptcy cases.
On January 15, 2018, the Company and the Filing Subsidiaries filed voluntary petitions for relief under Chapter 11 of the Bankruptcy Code. Our business and operations will be subject to various risks for the duration of the Chapter 11 proceedings, including, but not limited to, the following:
our ability to continue as a going concern;
our ability to develop, file and consummate a Chapter 11 plan of reorganization;
our ability to obtain Court, creditor and regulatory approval of a Chapter 11 plan of reorganization in a timely manner;
our ability to obtain consents or waivers to further extend the DIP Facilities beyond the scheduled maturity date of May 22, 2019 or refinance the DIP Facilities if we are unable to consummate a plan of reorganization in a timely manner;
our ability to obtain Court approval with respect to motions in the Chapter 11 Cases and the outcomes of Court rulings and of the Chapter 11 Cases in general;
the ability of third parties to file motions in our Chapter 11 Cases, which may interfere with our business operations or our ability to propose and/or complete a Chapter 11 plan of reorganization;
increasedsignificant costs related to the Chapter 11 Cases and related litigation;
our ability to obtain and maintain normal payment and other terms with customers, vendors and service providers, as well as our ability to maintain contracts that are critical to our operations;
a loss of, or a disruption in the materials or services received from suppliers, contractors or service providers with whom we have commercial relationships;
potential increased difficulty in retaining and motivating our key employees through the process of reorganization, and potential increased difficulty in attracting new employees;
significant time and effort required to be spent by our senior management in dealing with the bankruptcy and restructuring activities rather than focusing exclusively on business operations; and
our ability to fund and execute our business plan and our ability to obtain any necessary financing for our business on acceptable terms or at all.
We are also subject to risks and uncertainties with respect to the actions and decisions of creditors and other third parties who have interests in our Chapter 11 Cases that may be inconsistent with our plans. These risks and uncertainties could affect our business and operations in various ways and may significantly increase the duration of the Chapter 11 Cases. For example, negative events or publicity associated with the Chapter 11 Cases could adversely affect our relationships with our vendors and employees, as well as with customers, which in turn could adversely affect our operations and financial condition. Also,
pursuant to the Bankruptcy Code, we need Court approval for transactions outside the ordinary course of business, which may limit our ability to respond timely to events or take advantage of opportunities.
Because of the risks and uncertainties associated with the Chapter 11 Cases, we cannot predict or quantify the ultimate impact that events occurring during the Chapter 11 Cases may have on our business, cash flows, liquidity, financial condition and results of operations, nor can we predict the ultimate impact that events occurring during the Chapter 11 Cases may have on our corporate or capital structure.
We believe it is highly likely that our existing common shares will be canceled at the conclusion of our Chapter 11 proceedings.
We have a significant amount of indebtedness that is senior to our existing common shares in our capital structure. As a result, we believe it is highly likely that our existing common shares will be canceled at the conclusion of our Chapter 11 proceedings, and the holders of our existing common shares willare not expected to be entitled to any recovery. The March 2019 Plan would result in our common shares being canceled, discharged, released and extinguished without the holders thereof receiving any distribution. As a limited recovery, if any. Anyresult, any trading in our common shares during the pendency of the Chapter 11 Cases is highly speculative and poses substantial risks to purchasers of shares of our common shares.
Operating under Court protection for a long period of time may harm our business.
Our future results are dependent upon the successful confirmation and implementation of a plan of reorganization. A longWe have been operating under Court protection since our initial filing for relief under Chapter 11 of the Bankruptcy Code in January 2018, and this prolonged period of operations under Court protection couldhas had, and is expected to continue to have, a material adverse effect on our business, financial condition, results of operations and liquidity. So long as the proceedings related to the Chapter 11 Cases continue, our senior management will be required to spend a significant amount of time and effort dealing with the reorganization instead of focusing exclusively on our business operations.
In conjunction with these bankruptcy proceedings, we are exploring the potential sale of certain or substantially all of our assets under Section 363 of the Bankruptcy Code. There can be no assurance that any such sale will be completed. The process to market our assets will result in additional uncertainty surrounding the potential outcome of the Chapter 11 Cases and could further delay the conclusion of the Chapter 11 Cases. A prolonged period of operating under Court protection also may make it more difficult to retain management and other key personnel necessary to the success and growth of our business. In addition, the longer the Chapter 11 Cases continue, the more likely it is that our customers and suppliers will lose confidence in our ability to reorganize our businesses successfully and seek to establish alternative commercial relationships.
During the course of the Chapter 11 Cases, we have been required, and expect that we will continue to be required, to incur substantial costs for professional fees and other expenses associated with the administration of the Chapter 11 Cases. We have incurred $67.8 million in legal and professional fees related to the Chapter 11 Cases for the period from the Petition Date to December 31, 2018. Furthermore, we have experienced, and expect to continue to experience, significant costs and delays due to litigation during the Chapter 11 Cases. These fees and expenses have forced us to divert our capital resources away from capital expenditures to grow our business.
During the pendency of the bankruptcy proceedings, our Liquidity will depend mainly on cash generated from operating activities and available funds under the DIP Credit Agreement. On January 22, 2018, we closed the DIP Credit Agreement providing for $250.0 million of debtor-in-possession financing. The proceeds from the DIP Facilities were used to refinance all obligations outstanding under the EXCO Resources Credit Agreement and willare expected to provide additional liquidity to fund our operations during the Chapter 11 Cases.
So long as the Chapter 11 Cases continue, we will be required to incur substantial costs for professional fees and other expenses associated with the administration of the Chapter 11 Cases. Furthermore, we may experience significant costs and delays due to litigation during the Chapter 11 Cases. The DIP Facilities mature on May 22, 2019 and may not be sufficient to support our day-to-day operations in the event of a prolonged restructuring process and we may be required to seek additional debtor-in-possession financing to fund our operations. A further extension of the DIP Facilities beyond the scheduled maturity date would require a waiver or consent from the DIP Lenders. If we are unablerequired to seek additional financing, we may not be able to obtain such financing on favorable terms or at all,all. See further discussion regarding the impact of the maturity of the DIP Facilities in "Item 1A. Risk Factors - We have substantial liquidity needs and may be required to seek additional financing if we experience a prolonged bankruptcy process. If we are unable to maintain adequate liquidity, we may not be able to obtain financing on satisfactory terms". As a result, our chances of successfully reorganizing our business may be seriously jeopardized, the likelihood that we instead will be required to liquidate our assets may be enhanced, and, as a result, any claims and securities in the Debtors could become further devalued or become worthless.
We cannot predict the ultimate outcome for the liabilities that will be subject to a plan of reorganization. Even if a plan of reorganization is approved and implemented, our operating results may be adversely affected by the possible reluctance of prospective lenders and other counterparties to do business with a company that recently emerged from Chapter 11.
We are subject to the risks and uncertainties associated with our exclusive right to file a plan of reorganization.
At the outset of the Chapter 11 proceedings, the Bankruptcy Code provides debtors-in-possession the exclusive right to file and solicit acceptance of a plan of reorganization for the first 120 days of the bankruptcy case, subject to extension at the discretion of the court. All other parties are prohibited from filing or soliciting a plan of reorganization during this period. Our initial filing exclusivity period was set to expire on May 15, 2018 and the solicitation exclusivity period was set to expire on July 14, 2018. The Court has approved multiple extensions to the filing exclusivity period and the solicitation exclusivity period. The most recent extensions were approved by the Court on February 15, 2019, which extended the filing exclusivity period through April 1, 2019 and the solicitation exclusivity period through May 31, 2019. If the Court terminates that right or the exclusivity period expires, there could be a material adverse effect on our ability to achieve confirmation of a plan in order to achieve our stated goals. The possible decision of creditors and/or other third parties, whose interest may be inconsistent with our own, to file alternative plans of reorganization could further protract the Chapter 11 proceedings, leading us to continue to incur significant professional fees and costs. Because of these risks and uncertainties associated with the termination or expiration of our exclusivity rights, we cannot predict or quantify the ultimate impact that events occurring during the Chapter 11 cases may have on our business, cash flows, liquidity, financial condition and results of operations, nor can we predict the ultimate impact that events occurring during the Chapter 11 cases may have on our corporate or capital structure.
We may not be able to obtain confirmation of a Chapter 11 plan of reorganization.
To emerge successfully from Court protection as a viable entity, we must meet certain statutory requirements with respect to a Chapter 11 plan of reorganization, including obtaining the requisite acceptances of such a plan, and certain other statutory conditions for confirmation of such a Chapter 11 plan, which have not occurred to date. We were not able to reach an agreement with our creditors for a plan of reorganization prior to commencement of the Chapter 11 Cases. Therefore, the outcome of our Chapter 11 process is subject to a high degree of uncertainty and is dependent upon factors outside of our control, including actions of the Court and our creditors. The confirmation process is subject to potential delays, which could include a delay in the Court’s commencement of the confirmation hearing regarding our plan.
We have not received consents from any creditors in support of the March 2019 Plan. Therefore, we may not receive the requisite acceptances of our creditors in the proceedings related to the Chapter 11 Cases to confirm a plan.the March 2019 Plan. Even if the requisite acceptances of a plan are received, the Court may not confirm such a plan. The precise requirements and evidentiary showing for confirming a plan, notwithstanding its rejection by one or more impaired classes of claims or equity interests, depends upon a number of factors including, without limitation, the status and seniority of the claims or equity interests in the rejecting class (i.e., secured claims or unsecured claims, subordinated or senior claims, or common shares).
If a Chapter 11 plan of reorganization is not ultimately confirmed by the Court, it is unclear whether we would be able to reorganize our business and what, if anything, holders of claims against us would ultimately receive with respect to their claims. Our creditors would likely incur significant costs in connection with developing and seeking approval of an alternative plan of reorganization, which might not be supported by any of the current debt holders, various statutory committees or other stakeholders. If we are unable to confirm the March 2019 Plan and an alternative reorganization could not be agreed upon, it is possible that we would have to liquidate our assets, in which case it is likely that holders of claims would receive substantially less favorable treatment than they would receive if we were to emerge as a viable, reorganized entity. There can be no assurance as to whether we will successfully reorganize and emerge from the Chapter 11 Cases or, if we do successfully reorganize, as to when we would emerge from the Chapter 11 Cases.
Any plan of reorganization that we may implement will be based in large part upon assumptions and analyses developed by us. If these assumptions and analyses prove to be incorrect, or market conditions deteriorate, our plan may be unsuccessful in its execution.
Any plan of reorganization that we may implement will affect both our capital structure and the ownership, structure and operation of our businesses and will reflect assumptions and analyses based on our experience and perception of historical trends, current conditions and expected future developments, as well as other factors that we consider appropriate under the circumstances. Whether actual future results and developments will be consistent with our expectations and assumptions depends on a number of factors, including but not limited to:
changes in the price of oil and natural gas, including our increased exposure since none of our estimated future production is currently covered by commodity derivative contracts;
our ability to obtain adequate liquidity and financing sources, including acceptable terms for any new debt instruments contemplated by a plan of reorganization;
our ability to maintain the confidence of our vendors, customers and joint interest partners in our viability as a continuing entity and to attract and retain sufficient business with them;
our ability to retain key employees; and
the overall strength and stability of general economic conditions of the financial and oil and gas industries, both in the U.S. and in global markets.
Adverse changes in any of these factors could materially affect the successful reorganization of our businesses. Accordingly, any Chapter 11 plan of reorganization may not enable us to achieve our goals or continue as a going concern.
In addition, any plan of reorganization will rely upon financial projections, including with respect to revenues, EBITDA, capital expenditures, debt service and cash flow. Financial forecasts are necessarily speculative, and it is likely that one or more of the assumptions and estimates that are the basis of these financial forecasts will not be accurate. In our case, the forecasts will be even more speculative than normal, because they may involve fundamental changes in the nature of our capital structure. Accordingly, we expect that our actual financial condition and results of operations will differ, perhaps materially, from what we have anticipated. Consequently, there can be no assurance that the results or developments contemplated by any plan of reorganization we may implement will occur or, even if they do occur, that they will have the anticipated effects on us and our subsidiaries or our businesses or operations. The failure of any such results or developments to materialize as anticipated could materially adversely affect the successful execution of any plan of reorganization.
Even if a Chapter 11 plan of reorganization is consummated, we will continue to face risks.
Even if a Chapter 11 plan of reorganization is consummated, we will continue to face a number of risks, including certain risks that are beyond our control, such as further deterioration or other changes in economic conditions, changes in our industry, changes in prices for oil and natural gas and increasing expenses. Some of these concerns and effects typically become more acute when a case under the Bankruptcy Code continues for a protracted period without indication of how or when the case may be completed. As a result of these risks and others, there is no guaranty that any plan of reorganization will achieve our stated goals.
Furthermore, even if our debts are reduced or discharged through a plan of reorganization, we may need to raise additional funds through public or private debt or equity financing or other means to fund our business after the completion of the Chapter 11 process. Adequate funds may not be available when needed or may not be available on favorable terms.
The terms of our indebtedness include restrictions and financial covenants that may restrict our business and financing activities.
The availability of borrowings under the DIP Credit Agreement is essential to our ability to fund our operations during the Chapter 11 Cases. The DIP Credit Agreement includes certain affirmative and negative covenants, including, among other covenants customary in similar reserve-based credit facilities and debtor-in-possession financings, requirements to maintain a
minimum level of liquidity and limit our aggregate disbursements to certain thresholds compared to the 13-week cash flow forecasts provided to the DIP Lenders. Our future ability to comply with these restrictions and covenants is uncertain and will be affected by the levels of cash flow from our operations, development activities and other events or circumstances beyond our control. If market or other economic conditions deteriorate, our ability to comply with these covenants may be impaired. The DIP Facilities contain events of default, including: (i) conversion of the Chapter 11 Cases to cases under Chapter 7 of the Bankruptcy Code and (ii) appointment of a trustee, examiner or receiver in the Chapter 11 Cases.
If we violate any provisions of our such financing agreements that are not cured or waived within the appropriate time periods provided therein, a significant portion of our indebtedness may become immediately due and payable and our lenders’ commitment to make further loans to us may terminate. We might not have, or be able to obtain, sufficient funds to make these accelerated payments.
We have substantial liquidity needs and may be required to seek additional financing if we experience a prolonged bankruptcy process. If we are unable to maintain adequate liquidity, we may not be able to obtain financing on satisfactory terms.
Our principal sources of Liquidity historically have been internally generated cash flows from operations, borrowings under certain credit agreements, issuances of debt securities, dispositions of non-strategic assets, joint ventures and capital markets when conditions are favorable. Our capital program approved for 2018 will require additionalLiquidity, including our ability to meet our ongoing operational obligations, is dependent upon, among other things; (i) our ability to comply with the terms and conditions of any post-petition financing aboveand cash collateral order entered by the level ofCourt in connection with the Chapter 11 Cases, (ii) our ability to maintain adequate cash generated byon
hand, (iii) our operations. As described above, we have entered into the DIP Facilities, but we cannot guarantee that the funds available under the DIP Facilities and ourability to generate cash flow from operations, will be sufficient(iv) our ability to funddevelop, confirm and consummate a Chapter 11 plan or other alternative restructuring transaction and (v) the cost, duration and outcome of the Chapter 11 Cases. Our ability to maintain adequate Liquidity depends in part upon industry conditions and general economic, financial, competitive, regulatory and other factors beyond our operations if we experience a prolonged bankruptcy process.control.
We face uncertainty regarding the adequacy of our Liquidity and capital resources and have extremely limited, if any, access to additional financing. In addition to the cash requirement necessary to fund ongoing operations, we have incurred significant professional fees and other costs in connection with preparation for the Chapter 11 Cases and expect that we will continue to incur significant professional fees and costs throughout our Chapter 11 Cases. We cannot provide assurance that our Liquidity will be sufficient to continue to fund our operations and allow us to satisfy our obligations related to Chapter 11 Cases until we are able to emerge from our Chapter 11.
Our Liquidity, including our abilityThe DIP Facilities are currently set to meet our ongoing operational obligations, is dependent upon, among other things; (i) our abilitymature on May 22, 2019. In order to comply with the terms and conditions of any post-petition financing and cash collateral order entered by the Court in connection with the Chapter 11 Cases, (ii) our ability to maintain adequate cash on hand, (iii) our ability to generate cash flow from operations, (iv) our ability to develop, confirm and consummate a Chapter 11 plan or other alternative restructuring transaction and (v) the cost, duration and outcome of the Chapter 11 Cases. Our ability to maintain adequate Liquidity depends in part upon industry conditions and general economic, financial, competitive, regulatory and other factors beyond our control. In the event thatrepay the DIP Facilities and our cash on hand and cash flow from operations are not sufficient to meet our Liquidity needs,at maturity, we may be requiredcurrently expect that we would need to seek additional financing.financing, sell assets, refinance or restructure the DIP Facilities prior to maturity or extend the maturity date of the DIP Facilities. We can provide no assurance that additional financing would be available or, if available, offered to us on acceptable terms. Our access to additional financing is, and for the foreseeable future will likely continue to be, extremely limited if it is available at all. Although we have previously extended the maturity date of the DIP Facilities, the DIP Lenders may not agree to any further extensions. Our ability to consummate the March 2019 Plan in a timely manner, if at all, is subject to significant risk since we have not received consents from any creditors in support of the March 2019 Plan. As a result, it is unlikely that we will be able to consummate a plan of reorganization prior to the maturity of the DIP Facilities. Therefore, our long-term Liquidity requirementsliquidity and the adequacy of our capital resources are difficult to predicthighly uncertain at this time.
Upon emergence from bankruptcy, the composition of our board of directors will change significantly.
The composition of our board of directors is expected to change significantly following the Chapter 11 Cases. Any new directors may have different backgrounds, experiences and perspectives from those individuals who previously served on the board and, thus, may have different views on the issues that will determine the future of the Company. As a result, the future strategy and plans of the Company may differ materially from those of the past.
In certain instances, a Chapter 11 case may be converted to a case under Chapter 7 of the Bankruptcy Code.
Upon a showing of cause, the Court may convert our Chapter 11 Cases to cases under Chapter 7 of the Bankruptcy Code. In such event, a Chapter 7 trustee would be appointed or elected to liquidate our assets for distribution in accordance with the priorities established by the Bankruptcy Code. We believe that liquidation under Chapter 7 would result in significantly smaller distributions being made to our creditors than those provided for in a Chapter 11 plan because of (i) the likelihood that the assets would have to be sold or otherwise disposed of in a distressed fashion over a short period of time rather than in a controlled manner and as a going concern, (ii) additional administrative expenses involved in the appointment of a Chapter 7 trustee and (iii) additional expenses and claims, some of which would be entitled to priority, that would be generated during the liquidation and from the rejection of leases and other executory contracts in connection with a cessation of operations. In addition, if the Chapter 11 Cases are converted to cases under Chapter 7, that would constitute an event of default under the DIP Credit Agreement.
As a result of the Chapter 11 Cases, our historical financial information may be volatile and not be indicative of our future financial performance.
During the Chapter 11 Cases, we expect our financial results under U.S. GAAP to continue to be volatile as asset impairments, asset dispositions, restructuring activities and expenses, contract terminations and rejections, and claims assessments may significantly impact our Consolidated Financial Statements. As a result, our historical financial performance may not be indicative of our financial performance after the date of the bankruptcy filing.
Our capital structure will likely be significantly altered under any Chapter 11 plan confirmed by the Court. Under fresh-start accounting rules that may apply to us upon the effective date of a Chapter 11 plan, our assets and liabilities would be adjusted to fair value, which could have a significant impact on our financial statements. Accordingly, if fresh-start accounting rules apply, our financial condition and results of operations following our emergence from Chapter 11 would not be comparable to the financial condition and results of operations reflected in our historical financial statements. In connection with the Chapter 11 Cases and the development of a Chapter 11 plan, it is also possible that additional restructuring and related charges may be identified and recorded in future periods. Such charges could be material to our consolidated financial position, liquidity and results of operations.
Transfers of our equity, or issuances of equity in connection with our Chapter 11 Cases, may impair our ability to utilize our federal income tax net operating loss carryforwards in future years.
Under federal income tax law, a corporation is generally permitted to deduct from taxable income net operating losses carried forward from prior years. We have NOLs of approximately $2.1$2.2 billion as of December 31, 2017.2018. Our ability to utilize our NOLs to offset future taxable income and to reduce federal income tax liability is subject to certain requirements and restrictions. If we experience an “ownership change,” as defined in Section 382 of the U.S. Internal Revenue Code, then our ability to use our net operating loss carryforwards may be substantially limited, which could have a negative impact on our financial position and results of operations. Generally, there is an “ownership change” if one or more shareholders owning five percent or more of a corporation’s common stock ("Substantial Shareholder") have aggregate increases in their ownership of such stock of more than 50 percentage points over the prior three-year period.
We received relief from the Court to establish notice and sell-down procedures for trading of our common shares in order to provide us with the ability to formulate a plan of reorganization that preserves our tax attributes. Under the order, prior to any proposed acquisition or disposition of equity securities that would result in an increase or decrease in the amount of our equity securities owned by a Substantial Shareholder, or that would result in a person or entity becoming a Substantial Shareholder, such person or entity is required to file with the Court and notify us of such acquisition or disposition. We have the right to seek an injunction from the Court to prevent certain acquisitions or sales of our common shares if the acquisition or sale would pose a material risk of adversely affecting our ability to utilize such tax attributes.
Following the implementation of a plan of reorganization, it is possible that an “ownership change” may be deemed to occur. Under Section 382 of the U.S. Internal Revenue Code, absent an application exception, if a corporation undergoes an “ownership change,” the amount of its net operating losses that may be utilized to offset future taxable income generally is subject to an annual limitation. If an ownership change occurs and our NOLs are subject to the Section 382 limitation, this could adversely impact our future cash flows if we have taxable income and are not able to offset it through the utilization of our NOLs. See further discussion of the impact of the restructuring on our tax attributes as part of "Note 12. Income taxes" in the Notes to our Consolidated Financial Statements.
We have significant exposure to fluctuations in commodity prices since none of our estimated future production is covered by commodity derivative contracts and we may not be able to enter into commodity derivative contracts covering our estimated future production on favorable terms or at all.
During the Chapter 11 Cases, our ability to enter into commodity derivative contracts covering estimated future production is limited under the DIP Credit Agreement. We are only permitted to enter into commodity derivative contracts with lenders under the DIP Credit Agreement. As a result, we may not be able to enter into commodity derivative contracts covering our production in future periods on favorable terms or at all. IfNone of our estimated future production is currently covered by commodity derivative contracts; therefore, we will continue to be significantly impacted by changes in commodity prices if we cannot or choose not to enter into commodity derivative contracts in the future, we could be more affected by changes in commodity prices.future. Our inability to hedge the risk of low commodity prices in the future, on favorable terms or at all, could have a material adverse impact on our business, financial condition and results of operations.
We have and may continue to experience increased levels of employee attrition as a result of the Chapter 11 Cases.
As a result of the Chapter 11 Cases, we have and may continue to experience increased levels of employee attrition, and
our employees likely will face considerable distraction and uncertainty. A loss of key personnel or material erosion of employee morale could adversely affect our business and results of operations. Our ability to engage, motivate and retain key employees or take other measures intended to motivate and incentivize key employees to remain with us through the pendency of the Chapter 11 Cases is limited by restrictions on implementation of incentive programs under the Bankruptcy Code. The loss of services of members of our senior management team could impair our ability to execute our strategy and implement operational initiatives, which would be likely to have a material adverse effect on our financial condition, Liquidity and results of operations.
Risks Relating to Our Business
Oil and natural gas prices, which are subject to fluctuations, have declined substantially from historical highs. Reductions in oil and natural gas prices have, and may in the future, adversely affect our revenues as well as our ability to maintain or increase our borrowing capacity, repay current or future indebtedness and obtain additional capital on attractive terms.
Our future financial condition, access to capital, cash flow and results of operations depend upon the prices we receive for our oil and natural gas. We are particularly dependent on prices for natural gas. Historically, oil and natural gas prices have been volatile and are subject to fluctuations in response to changes in supply and demand, market uncertainty and a variety of additional factors that are beyond our control, including, but not limited to:
the domestic and foreign supply of oil and natural gas;
weather conditions;
the price and quantity of imports and exports of oil and natural gas;
political conditions and events in other oil-producing and natural gas-producing countries, including embargoes, hostilities in the Middle East and other sustained military campaigns, and acts of terrorism or sabotage;
the actions of the OPEC;OPEC and other significant oil and natural gas producing nations;
domestic and international government regulation, legislation and policies;policies, including levying tariffs on oil and natural gas imports;
the level of global oil and natural gas inventories;
technological advances affecting energy consumption;
the price and availability of alternative fuels and other energy sources; and
overall economic conditions.
Oil and natural gas prices declined sharply during the latter half of 2014 and continuedare currently depressed compared to decline throughout 2015 and into 2016. Oil and natural gas prices have recently experienced a modest recovery;recent historical levels; however, they may never return to historical highs or remain at a level that allows us to economically operate our business. Prices of oil and natural gas have historically been extremely volatile and we expect this volatility to continue.
During 2017,2018, the NYMEX Henry Hub natural gas price fluctuated from a high of $3.65$6.88 per Mmbtu to a low of $2.44$2.48 per Mmbtu, while the NYMEX WTI crude oil price ranged from a high of $60.42$76.41 per Bbl to a low of $42.53 per Bbl. For the five years ended December 31, 2017,2018, the NYMEX Henry Hub natural gas price ranged from a high of $7.94 per Mmbtu to a low of $1.49 per Mmbtu, while the NYMEX WTI crude oil price ranged from a high of $110.53$107.26 per Bbl to a low of $26.21 per Bbl.
On December 31, 2017,2018, the spot market price for natural gas at Henry Hub was $2.97$3.07 per Mmbtu, a 20% decrease3% increase from December 31, 2016.2017. On December 31, 2017,2018, the spot market price for crude oil at Cushing was $60.42$45.41 per Bbl, a 12% increase25% decrease from December 31, 2016.2017. For 2017,2018, our average realized prices (before the impact of derivative financial instruments) for oil and natural gas were $49.82$66.78 per Bbl and $2.51$2.85 per Mcf, respectively, compared with 20162017 average realized prices of $38.05$49.82 per Bbl and $1.93$2.51 per Mcf, respectively.
Our revenues, cash flow and profitability, as well as our ability to maintain or increase our borrowing capacity, to repay current or future indebtedness and to obtain additional capital on attractive terms, depend substantially upon oil and natural gas prices. Any sustained reductions in oil and natural gas prices will directly affect our revenues and can indirectly impact expected production by changing the amount of funds available to us to reinvest in exploration and development activities. Further reductions in oil and natural gas prices could also reduce the quantities of reserves that are commercially recoverable. Depressed oil and natural gas prices and reductions in our reserves could have other adverse consequences, including downward redeterminationsour ability to obtain the exit financing required to consummate a plan of the availability of borrowings under the DIP Credit Agreement, which may begin on January 1, 2019 if we elect to extend the maturity of the DIP Credit Agreement.reorganization. Additionally, further or continued declines in prices could result in additional non-cash charges to earnings due to impairments to our oil and natural gas properties.
In light of the depressed commodity price environment, there is risk that, among other things:
third parties’ confidence in our commercial or financial ability to explore and produce oil and natural gas could erode, which could impact our ability to execute on our business strategy;
it may become more difficult to retain, attract or replace key employees;
employees could be distracted from performance of their duties or more easily attracted to other career opportunities; and
our suppliers, vendors and service providers could renegotiate the terms of our arrangements, terminate their relationship with us or require financial assurances from us.
The occurrence of certain of these events may have a material adverse effect on our business, results of operations and financial condition.
Changes in the differential between NYMEX or other benchmark prices of oil and natural gas and the reference or regional index price used to price our actual oil and natural gas sales could have a material adverse effect on our results of operations and financial condition.
The reference or regional index prices that we use to price our oil and natural gas sales sometimes reflect a premium or discount to the relevant benchmark prices, such as NYMEX. The difference between the benchmark price and the price we reference in our sales contracts is called a differential. We cannot accurately predict oil and natural gas differentials. Changes in differentials between the benchmark price for oil and natural gas and the reference or regional index price we reference in our sales contracts could have a material adverse effect on our results of operations and financial condition. We have experienced significant volatility in our price differentials including crude oil production from the Eagle Ford shale and natural gas production from certain areas in Appalachia. Our crude oil production from the Eagle Ford shale is currently sold at a price based on the WTI index plus or minus the differential to indices correlated to the Louisiana Light Sweet index. During 2017,2018, the monthly average of this differential ranged from a high of WTI plus $4.19$4.99 per barrel to a low of WTI less $3.27$0.99 per barrel. Our natural gas production from the Marcellus shale in Northeast Pennsylvania is sold at a price based on a Platts index that represents value into the Transco Leidy Pipeline. Due to the increasedhigh levels of production in this region without an offsetting increase insufficient pipeline capacity or infrastructure to the Northeast United States markets, the monthly average of this differential during 20172018 ranged from a low of NYMEX less $0.44$0.31 per Mmbtu to a high of NYMEX less $2.11$1.38 per Mmbtu. These differentials vary depending on factors such as supply, demand, pipeline capacity, infrastructure and weather. These differentials continue to be volatile; however, the differentials in the region have the potential to be favorably impacted by the expansion of infrastructure and other sources of demand for natural gas in the Northeast region in future years.
We may encounter obstacles to marketing our oil and natural gas, which could adversely impact our revenues.
Market conditions or the unavailability of satisfactory oil and natural gas transportation arrangements or infrastructure may hinder our access to oil and natural gas markets or delay our production. The availability of a ready market for our oil and natural gas production depends on a number of factors, including the demand for and supply of oil and natural gas and the proximity of reserves to pipelines and terminal facilities.
Our ability to market our production depends, in substantial part, on the availability and capacity of gathering systems, pipelines, processing facilities and oil and condensate trucking operations owned and operated by third-parties. Our failure to obtain these services on acceptable terms could have a material adverse effect on our business. Transportation space on the gathering systems and pipelines we utilize is occasionally limited or unavailable due to repairs, outages caused by accidents or other events, or improvements to facilities or due to space being utilized by other companies that have priority transportation agreements. We may be required to shut inshut-in wells due to lack of a market or inadequacy or unavailability of crude oil or natural gas pipelines, gathering systems or trucking capacity. A portion of our production may also be interrupted, or shut-in, from time to time for numerous other reasons, including as a result of accidents, excessive pressures, maintenance, weather, field labor issues or other disruptions of service. Curtailments and disruptions may last from a few days to several months, and we have no control over when or if third-party facilities are restored.
We have experienced production curtailments in our producing regions resulting from offsetting fracturing stimulation operations. As we have increased our knowledge of our shale properties, we have begun to shut-in production on adjacent wells when conducting completion operations. Due to the high production capabilities of these wells, these volumes can be significant. Our access to transportation options can also be affected by U.S. federal and state regulation of oil and natural gas production and transportation, general economic conditions and changes in supply and demand.
In our South Texas region, the primary purchaser of our natural gas allegedly terminated a long-term natural gas sales contract on May 31, 2017. See further discussion of the litigation related to the purported termination of this contract in "Item 3. Legal proceedings". Our ability to transport or sell the natural gas from this region is limited due to the existing
infrastructure and we may experience significant curtailments of production if we cannot find an operational or commercial solution. After the alleged termination of the long-term natural gas sales contract, we have either sold natural gas on short-term sales contracts or flared natural gas in order to avoid significant curtailments of our oil production. However, our ability and the costs associated with entering into natural gas sales contracts in the future are highly uncertain.
These factors and the availability of markets are beyond our control. Any significant curtailment in gathering, processing or pipeline system capacity, significant delay in the construction of necessary facilities or lack of availability of transportation would interfere with our ability to market our oil and natural gas production, and could have a material adverse effect on our cash flow and results of operations.
Our oil production in the South Texas region may be curtailed if we are not able to find an operational or commercial solution for the associated natural gas production.
In our South Texas region, the primary purchaser of our natural gas allegedly terminated a long-term natural gas sales contract on May 31, 2017. As a result, our ability to transport or sell the natural gas from this region continues to be limited due to the existing infrastructure and we may experience significant curtailments of production in the future if we cannot find an
operational or commercial solution. After the alleged termination of the long-term natural gas sales contract, we have either sold natural gas on short-term sales contracts or flared natural gas in order to avoid significant curtailments of our oil production. However, our ability and the costs associated with entering into natural gas sales contracts in the future are highly uncertain.
In January 2018, we commenced the flaring of natural gas produced in our South Texas region pursuant to temporary flare permits. We submitted a request to the Texas Railroad Commission for an extension of the permits to continue the aforementioned flaring of natural gas for up to two years (the “Flaring Application”). We went before the Texas Railroad Commission at a hearing regarding the Flaring Application in May 2018 and expect that a final ruling will be issued during 2019. See further discussion in “Item 3. Legal Proceedings”. If the Flaring Application is denied or, in the future, we are unable, for any sustained period, to secure acceptable delivery or transportation arrangements or encounter production related difficulties, we may be required to shut-in or curtail production of both oil and natural gas from the affected wells in the South Texas region. Any such shut-in or curtailment or an inability to obtain acceptable terms for delivery of the oil and natural gas produced from our fields, would materially and adversely affect our cash flows and results of operations. We continue to evaluate alternatives, including construction of a Company-owned gathering system or the negotiation of a new gathering agreement.
We may experience a financial loss if any of our significant customers fail to pay us for our oil or natural gas or reduce the volume of oil and natural gas that they purchase from us.
Our ability to collect payments from the sale of oil and natural gas to our customers depends on the payment ability of our customer base, which includes several significant customers. If any one or more of our significant customers fails to pay us for any reason, we could experience a material loss. We are managing our credit risk as a result of the current commodity price environment through the attainment of financial assurances from certain customers. In addition, if any of our significant customers cease to purchase our oil or natural gas or reduce the volume of the oil or natural gas that they purchase from us, the loss or reduction could have a detrimental effect on our production volumes and may cause a temporary interruption in sales of, or a lower price for, our oil and natural gas. We have filed a lawsuit against a subsidiary of Shell regarding their failure to remit payment under certain natural gas sales agreements in the East Texas and North Louisiana regions, see further discussion in "Item 3. Legal proceedings".
We have significant natural gas firm transportation and marketing agreements primarily in East Texas and North Louisiana that require us to pay fixed amounts of money to the shippers or marketers regardless of quantities actually shipped or marketed. Our results of operations and Liquidity could be adversely affected if we are required to pay for shortfall amounts under these contracts.
We have significant natural gas firm transportation contracts primarily in North Louisiana that require us to pay fixed amounts of money to the shippers regardless of quantities actually shipped. The use of firm transportation agreements allows us priority space in a shippers’ pipeline. Historically, we have paid significant amounts for the unused portion of these firm transportation agreements. These contracts include a natural gas sales contract with Enterprise Products Operating LLC (“Enterprise”) and a firm transportation agreement with Acadian Gas Pipeline System (“Acadian”) that are currently in litigation. See further discussion of the litigation related to our natural gas sales and firm transportation agreements in "Item 3. Legal proceedings". In addition, we are in default under a firm transportation contract with Regency Intrastate Gas LLC ("Regency") since we failed to remit payment during 2017. As a result, Regency is entitled to exercise certain rights and remedies, including the acceleration of the remaining charges under the agreement. As of December 31, 2017, the unpaid amounts and remaining charges under this agreement were $67.3 million.
We have an agreement to deliver an aggregate minimum volume commitment of natural gas production in East Texas and North Louisiana to certain gathering systems over a five-year period ending on November 30, 2018. If there is a shortfall to the minimum volume commitment in any year, then we are severally responsible with a joint venture partner to pay fixed amounts of money to the gatherer regardless of quantities actually produced in to the systems. For the twelve months ended November 30, 2017, our net share of the shortfall was $23.1 million, which had not been paid prior to the commencement of the Chapter 11 Cases.
In addition, we have sales and marketing agreements in North Louisiana whereby we are required to deliver a minimum amount of natural gas. These contracts include a natural gas sales contract with a subsidiary of Shell that is currently in litigation. See further discussion of the litigation in "Item 3. Legal proceedings".
On January 18, 2018, the Company and the Filing Subsidiaries filed motions to reject certain executory contracts as permitted under the Bankruptcy Code. The contracts include the following:
Firm transportation agreements with Acadian, which required us to transport 325,000 Mmbtu per day on the Acadian Gas Pipeline System or pay reservation charges through October, 31, 2025;
Natural gas sales agreements with Enterprise, which required us to sell 75,000 Mmbtu per day of natural gas to Enterprise or incur certain costs through October 31, 2025;
Firm transportation agreements with Regency, which required us to either transport 237,500 Mmbtu per day of natural gas or pay reservation charges through January 31, 2020;
Marketing agreement with Chesapeake, which required us to allow Chesapeake to purchase natural gas for certain wells in North Louisiana through 2021; and
Natural gas sales agreements with Shell, which required us to sell 100,000 Mmbtu per day of natural gas to Shell or incur certain costs through November 30, 2020.
On March 7, 2018, the Court approved the rejection of the aforementioned executory contracts with Regency, Chesapeake and Shell. The hearing to consider the motion to reject the Enterprise and Acadian contracts is scheduled for March 29, 2018. On March 1, 2018, the Company and the Filing Subsidiaries filed a motion to reject an agreement to deliver an aggregate minimum volume commitment of natural gas production in East Texas and North Louisiana to certain gathering systems through November 30, 2018. See further discussion of the future minimum obligations under these contracts as of December 31, 2017 in "Note 8. Commitments and contingencies" and the motions to reject these contracts in "Note 17. Subsequent events" in the Notes to our Consolidated Financial Statements.
If we are not able to reject the remainder of these contracts, it could adversely affect our business, financial condition and results of operations.
There are risks associated with our drilling activity that could impact our results of operations and financial condition. Our ability to develop properties in new or emerging formations may be subject to more uncertainties than drilling in areas that are more developed or have a longer history of established production.
Our drilling involves numerous risks, including the risk that we will not encounter commercially productive oil or natural gas reservoirs. We must incur significant expenditures to identify and acquire properties and to drill and complete wells. Additionally, seismic and other technology does not allow us to know conclusively prior to drilling a well that oil or natural gas is present or economically producible. The costs of drilling and completing wells are often uncertain, and drilling operations may be curtailed, delayed or canceled as a result of a variety of factors, including unexpected drilling conditions, pressure or irregularities in formations, equipment failures or accidents, weather conditions and shortages or delays in the delivery of equipment. We have experienced some delays in contracting for drilling rigs and in obtaining fracture stimulation crews and materials. Also, we may experience issues with the availability of water and sand used in our drilling and hydraulic fracturing activities. All of these risks could adversely affect our results of operations and financial condition.
The results of our drilling in new or emerging formations, including our properties in shale formations, are more uncertain initially than drilling results in areas that are developed, have established production or where we have a longer history of operation. Because new or emerging formations have limited or no production history, we are less able to use past drilling results in those areas to help predict future drilling results. Our experience with horizontal drilling in these areas to date, as well as the industry’s drilling and production history, while growing, is limited. The ultimate success of these drilling and completion techniques will be better evaluated over time as more wells are drilled and production profiles are better established. We have implemented several initiatives to manage our base production and minimize the decline from our shale properties. If these initiatives are not successful and we are required to incur significant expenditures to manage our base production, this could negatively impact our production and cash flows from operations.
If our drilling results are less than anticipated or we are unable to execute our drilling program because of capital constraints, lease expirations, and/or natural gas and oil prices decline, our investment in these areas may not be as attractive as we anticipate and we could incur material impairments of undeveloped properties and the value of our undeveloped acreage could decline in the future, which could have a material adverse effect on our business and results of operations.
Certain of our undeveloped leasehold assets are subject to leases that will expire over the next several years unless production is established on the acreage.
Leases on oil and natural gas properties typically have a term after which they expire unless, prior to expiration, a well is drilled and production of hydrocarbons in paying quantities is established. If our leases expire and we are unable to renew the leases, we will lose our right to develop the related properties. While we seek to actively manage our leasehold inventory through drilling wells to hold the leasehold acreage that we believe is material to our operations, our drilling plans for these areas are subject to change.
We conduct a substantial portion of our operations through joint interest and joint venture arrangements. Material disagreements with our partners could have a material adverse effect on the success of these operations, our financial condition and our results of operations. Furthermore, the actions taken by our partners could prevent or alter our development plans.
We conduct a substantial portion of our operations through joint interest and joint venture arrangements with third parties. In many instances, we depend on these third parties for elements of these arrangements, such as payments of substantial development and other costs. The performance of these third party obligations or the ability of third parties to meet their obligations under these arrangements is outside our control. If these parties do not meet or satisfy their obligations under these arrangements, the performance and success of these arrangements, and their value to us, may be adversely affected. If our current or future joint interest or joint venture partners are unable to meet their obligations, we may be forced to undertake the obligations ourselves and/or incur additional expenses in order to have some other party perform such obligations. In such cases we may also be required to enforce our rights, which may cause disputes among our partners and us. If any of these events occur, they may adversely impact us, our financial performance and results of operations.
Such arrangements may involve risks not otherwise present when exploring and developing properties directly, including, for example:
our partners may share certain approval rights over major decisions;
the possibility that our partners might become insolvent or bankrupt, leaving us liable for their shares of joint interest or joint venture liabilities;
the possibility that we may incur liabilities as a result of an action taken by our partners;
partners may be in a position to take action contrary to our instructions or requests or contrary to our policies or objectives;
disputes between us and our partners may result in litigation or arbitration that would increase our expenses, delay or terminate projects and prevent our officers and directors from focusing their time and effort on our business; and
that under certain joint venture arrangements, neither joint venture partner may have the power to control the venture and an impasse could be reached that might have a negative influence on our investment in the joint venture.
The failure to resolve disagreements with our partners could adversely affect our ability to transact the business that is the subject of such arrangement, which would in turn negatively affect our financial condition and results of operations. We are currently in litigation with a subsidiary of Shell related to their failure to remit payment for natural gas sales in the East Texas and North Louisiana regions. The outcome of the litigation could impact our joint venture with Shell in the East Texas and North Louisiana regions. See further discussion related to this litigation in "Item 3. Legal proceedings". Furthermore, on January 26, 2018, we filed a motion to authorize the entry into a settlement agreement with Shell to resolve arbitration regarding our right to participate in an area of mutual interest in the Appalachia region. Under the terms of the settlement agreement, our joint venture with Shell in the Appalachia region would be terminated. The Court approved this settlement agreement on February 22, 2018, and the settlement agreement closed on February 27, 2018. See further discussion related to the settlement agreement in "Note 17. Subsequent events" in the Notes to our Consolidated Financial Statements.
The owners of working interests may not consent to the development of certain properties that we operate, which may require us to assume their share of the working interest during the development and a period after the well is on production. This may require us to expend additional capital that was not anticipated as part of our development plans and assume additional risks associated with the development and future performance of the properties. The owners of working interests in certain properties that we operate may also hold rights within the respective operating agreements that could prevent us from performing additional development activities on the properties such as recompletions and other workovers without their consent.
We may be unable to acquire or develop additional reserves, which would reduce our revenues and access to capital.
Our success depends upon our ability to find, develop or acquire additional oil and natural gas reserves that are profitable to produce. Factors that may hinder our ability to acquire or develop additional oil and natural gas reserves include competition, access to capital, prevailing oil and natural gas prices and the number and attractiveness of properties for sale. If we are unable to conduct successful development activities or acquire properties containing Proved Reserves, our total Proved Reserves will generally decline as a result of production. Also, our production will generally decline. We may be unable to locate additional reserves, drill economically productive wells or acquire properties containing Proved Reserves.
Acquisitions, development drilling and exploratory drilling are the main methods of replacing reserves. However, development and exploratory drilling operations may not result in any increases in reserves for various reasons. Our future oil and natural gas production depends on our success in finding or acquiring additional reserves. If we fail to replace reserves through drilling or acquisitions, our level of production and cash flows will be adversely affected. Throughout 2016 and 2017 we reduced our development activities and suspended drilling in certain regions, which caused our production to decline and negatively impacted our ability to replace our reserves, which in turn negatively impacted our operating results.
We may not correctly evaluate reserve data or the exploitation potential of properties as we engage in our acquisition, exploration, development and exploitation activities.
Our future success will depend on the success of our acquisition, exploration, development and exploitation activities. Our decisions to purchase, explore, develop or otherwise exploit properties or prospects will depend in part on the evaluation of data obtained from production reports and engineering studies, geophysical and geological analyses and seismic and other information, the results of which are often inconclusive and subject to various interpretations. These decisions could significantly reduce our ability to generate cash needed to service our debt and fund our capital program and other working capital requirements.
Our estimates of oil and natural gas reserves involve inherent uncertainty, which could materially affect the quantity and value of our reported reserves, our financial condition and the value of our common shares.
Numerous uncertainties are inherent in estimating quantities of Proved Reserves, including many factors beyond our control. This Annual Report on Form 10-K contains estimates of our Proved Reserves and the PV-10 and Standardized Measure of our Proved Reserves. These estimates are based upon reports of our independent petroleum engineers. These reports rely upon various assumptions, including assumptions required by the SEC as to oil and natural gas prices, drilling and operating expenses, capital expenditures, taxes and availability of funds. These estimates should not be construed as the current market value of our estimated Proved Reserves.
The process of estimating oil and natural gas reserves is complex, requiring significant decisions and assumptions in the evaluation of available geological, engineering and economic data for each reservoir. As a result, the estimates are inherently imprecise evaluations of reserve quantities and future net revenue and such estimates prepared by different engineers or by the same engineers at different times, may vary substantially.
Our actual future production, revenues, taxes, development expenditures, operating expenses and quantities of recoverable oil and natural gas reserves may vary substantially from those we have assumed in the estimates. Any significant variance in our assumptions could materially affect the quantity and value of reserves, the amount of PV-10 and Standardized Measure described in this Annual Report on Form 10-K, and our financial condition. In addition, our reserves, the amount of PV-10 and Standardized Measure may be revised downward or upward, based upon production history, results of future exploitation and development activities, prevailing oil and natural gas prices, decisions and assumptions made by engineers and other factors. A material decline in prices paid for our production can adversely impact the estimated volumes and values of our reserves. Similarly, a decline in market prices for oil or natural gas may adversely affect our PV-10 and Standardized Measure. Any of these negative effects on our reserves or PV-10 and Standardized Measure may negatively affect the value of our common shares.
Impairments of our asset values could have a substantial negative effect on our results of operations and net worth.
We follow the full cost method of accounting for our oil and natural gas properties. Depending upon oil and natural gas prices in the future, and at the end of each quarterly and annual period when we are required to test the carrying value of our assets using full cost accounting rules, we may be required to record an impairment to the value of our oil and natural gas properties if the present value of the after-tax future cash flows from our oil and natural gas properties falls below the net book value of these properties. We have in the past experienced, and may experience in the future, ceiling test impairments with respect to our oil and natural gas properties. As discussed above, we are also currently in Chapter 11 proceedings and, upon the approval of a Chapter 11 plan, may be required to apply fresh-start accounting principles that may cause us to experience additional impairments. See “Item 1A. Risk Factors - As a result of the Chapter 11 cases, our historical financial information may be volatile and not be indicative of our future financial performance”performance” for additional information.
Our evaluation of impairment is based upon estimates of Proved Reserves. The value of our Proved Reserves may be lowered in future periods as a result of a decline in prices of oil and natural gas, a downward revision of our oil and natural gas reserves or other factors. As a result, our evaluation of impairment for future periods is subject to uncertainties inherent in estimating quantities of Proved Reserves, in projecting the future rates of production and in the timing of development
activities. The accuracy of any reserve estimate is a function of the quality of available data and of engineering and geological interpretation and judgment. Because several of these factors are beyond our control, we cannot accurately predict or control
the amount of ceiling test impairments in future periods. Future ceiling test impairments could negatively affect our results of operations and net worth.
We did not recognize any impairments to our proved oil and natural gas properties for the year ended December 31, 2017. For the years ended December 31, 20162018 and 2015, we recognized impairments of $160.8 million and $1.2 billion to our proved oil and natural gas properties.2017. We may have additional impairments of our oil and natural gas properties in future periods if the cost of our unamortized proved oil and natural gas properties exceeds the limitation under the full cost method of accounting. The possibility and amount of any future impairment is difficult to predict, and will depend, in part, upon future oil and natural gas prices to be utilized in the ceiling test, estimates of proved reserves and future capital expenditures and operating costs.
We also test goodwill for impairment annually or when circumstances indicate that an impairment may exist. If the book value of our reporting unit exceeds the estimated fair value of the reporting unit, an impairment charge will occur, which would negatively impact our results of operations and net worth. As a result of our testing of goodwill for impairment, we did not record an impairment charge for the years ended December 31, 2017, 20162018 and 2015.2017.
We are exposed to operating hazards and uninsured risks that could adversely impact our results of operations and cash flow.
Our operations are subject to the risks inherent in the oil and natural gas industry, including the risks of:
fires, explosions and blowouts;
pipe failures;
abnormally pressured formations; and
environmental accidents such as oil spills, natural gas leaks, ruptures or discharges of toxic gases, brine or well fluids into the environment (including groundwater contamination).
We have in the past experienced some of these events during our drilling, production and midstream operations. These events may result in substantial losses to us from:
injury or loss of life;
severe damage to or destruction of property, natural resources and equipment;
pollution or other environmental damage;
environmental clean-up responsibilities;
regulatory investigation;
penalties and suspension of operations; or
attorneys’ fees and other expenses incurred in the prosecution or defense of litigation.
As is customary in our industry, we maintain insurance against some, but not all, of these risks. Our insurance may not be adequate to cover these potential losses or liabilities. Furthermore, insurance coverage may not continue to be available at commercially acceptable premium levels or at all. Due to cost considerations, from time to time we have declined to obtain coverage for certain drilling activities. We do not carry business interruption insurance. Losses and liabilities arising from uninsured or under-insured events could require us to make large unbudgeted cash expenditures that could adversely impact our results of operations and cash flow.
We are subject to complex federal, state, local and other laws and regulations that could adversely affect the cost, manner or feasibility of conducting our operations.
Our oil and natural gas development and production operations are subject to complex and stringent laws and regulations. In order to conduct our operations in compliance with these laws and regulations, we must obtain and maintain numerous permits, approvals and certificates from various federal, state and local governmental authorities. We may incur substantial costs in order to comply with these existing laws and regulations. In addition, our costs of compliance may increase if existing laws and regulations are revised or reinterpreted, or if new laws and regulations become applicable to our operations. Our business is subject to federal, state and local laws and regulations as interpreted and enforced by governmental authorities possessing jurisdiction over various aspects of the exploration for, production and sale of, oil and natural gas. Failure to comply with such laws and regulations, as interpreted and enforced, could have a material adverse effect on our business, financial condition and results of operations. For additional information, see “Item 1. Business - Applicable Laws and Regulations".
Our business exposes us to liability and extensive regulation on environmental matters, which could result in substantial expenditures and could negatively impact production.
Our operations are subject to numerous complex U.S. federal, state and local laws and regulations relating to the protection of the environment, including those governing the discharge of materials into the water and air, the generation, management and disposal of hazardous substances and wastes and the clean-up of contaminated sites. Laws, rules and regulations protecting the environment have changed frequently and the changes often include increasingly stringent requirements.
In general, the oil and natural gas exploration and production industry has been the subject of increasing scrutiny and regulation by environmental authorities. For example, the EPA has identified ensuring environmental compliance by the energy extraction sectionsector as one of its enforcement initiatives for fiscal years 2017 - 2019. ThisHowever, the EPA has proposed to transition away from a sector specific initiative was identified duringfor the prior administration and it is unclear whether the new administration will continue with the ongoing initiatives.2020-2023 fiscal years to a more general focus on significant sources of VOCs.
Compliance with environmental laws and regulations often increases our cost of doing business and, in turn, decreases our profitability. Failure to comply with these laws and regulations may result in the assessment of administrative, civil and criminal penalties, the incurrence of investigatory or remedial obligations as well as associated natural resource damages, or the issuance of injunctive relief. Any changes that result in more stringent or costly waste handling, storage, transport, disposal or cleanup requirements could require us to make significant expenditures to maintain compliance, and may otherwise have a material adverse effect on our earnings, results of operations, competitive position or financial condition. Changes to the requirements for drilling, completing, operating, and abandoning wells and related facilities could have similar adverse effects on us.
In addition, we could incur substantial expenditures complying with environmental laws and regulations, including future environmental laws and regulations which may be more stringent than those currently in effect. For example, the regulation of GHG emissions by the EPA or by various states in the areas in which we conduct business could have an adverse effect on our operations and demand for our oil and natural gas production. Moreover, the EPA has shown a general increased scrutiny on the oil and gas industry through its regulations under the CAA, SDWA, RCRA, TSCA and CWA.
The environmental laws and regulations to which we are subject may, among other things:
require us to apply for and receive a permit before drilling commences or certain associated facilities are developed;
restrict the types, quantities and concentrations of substances that can be released into the environment in connection with drilling, hydraulic fracturing, and production activities;
limit or prohibit drilling activities on certain lands lying within wilderness, wetlands and other “waters of the United States,” threatened and endangered species habitats and other protected areas;
require remedial measures to mitigate pollution from current or former operations, such as cleaning up spills, dismantling abandoned facilities, pit closure or plugging abandoned wells;
require additional control and monitoring devices on equipment; and
impose substantial liabilities for pollution resulting from our operations.
Our operations may be impacted by recent or changing regulatory standards. For example, the EPA issued effluent limitation guidelines limiting our ability to dispose of waste water from hydraulic fracturing activities into publicly owned wastewater treatment systems. The EPA and state regulators are also reviewing the practices for the disposal of solid waste in surface impoundments from exploration and production facilities under Subtitle D of RCRA and may continue to refine those requirements. The EPA and state regulators are also expanding National Pollutant Discharge Elimination System permitting for storm water discharges at drilling sites.
Changes in regulation can also occur at a state or local level. For example, the State of Pennsylvania Department of Environmental Protection is updating oil and gas regulations which include more stringent permitting requirements, waste handling disposal and water restoration requirements. Some localities, for example in Texas, are enacting water usage restrictions that may impact oil and gas exploration. In addition, some states have considered, and notably California has adopted, a state specific GHG regulatory program that may limit GHG emissions or may require costs in association with the control of GHG emissions.
The implementation of climate change regulations could result in increased operating costs and reduced demand for our oil and natural gas production.
GHG regulations could require us to incur increased operating costs and could have an adverse effect on demand for our oil and natural gas production. In the most recent Congressional session, a resolution was proposed which aimed to dramatically reduce GHG emissions, including a transition from fossil fuel. It is unclear what the future of this or other legislation would be. However, such legislation if adopted could have an adverse effect on demand for the oil and natural gas that we produce.
In the absence of comprehensive federal legislation on GHG emission control, the EPA attempted to require the permitting of GHG emissions. Although the U.S. Supreme Court struck down GHG permitting requirements for GHG as a stand-alone pollutant, it upheld the EPA’s authority to control GHG emissions when a source has to secure a major source permit to control the emissions of other criteria pollutants. These permitting provisions, to the extent applicable to our operations, could require us to implement emission controls or other measures to reduce GHG emissions and we could incur additional costs to satisfy those requirements. Additionally, the EPA established GHG reporting requirements for a broad range of sources, including in the petroleum and natural gas industry, requiring those sources to monitor, maintain records on, and annually report their GHG emissions. Although this rule does not limit the amount of GHGs that can be emitted, it requires us to incur costs to monitor record and report GHG emissions associated with our operations.
As part of a move to reduce GHG emissions, the EPA has issued new rules limiting methane emissions from new or modified oil and gas sources. The rules amend the air emissions rules for the oil and natural gas sources and natural gas processing and transmission sources to include new standards for methane. Simultaneously with the methane rules, the EPA adopted new rules governing the aggregating of multiple surface sites into a single-source of air quality permitting purposes. The grouping together of sources may cause a group of sources to be treated as a “major source” and face enhanced regulation under federal environmental laws, including the CAA.
Federal, state and local legislation and regulatory initiatives relating to hydraulic fracturing could result in increased costs and additional operating restrictions or delays.
Hydraulic fracturing involves the injection of water, sand and chemicals under pressure into rock formations to stimulate natural gas production. Most hydraulic fracturing (other than hydraulic fracturing using diesel) is exempted from regulation under the SDWA. Congress has considered legislation to amend the federal SDWA to remove the exemption from regulation and permitting that is applicable to hydraulic fracturing operations and require reporting and disclosure of chemicals used by the oil and natural gas industry in the hydraulic fracturing process. Many states have adopted or are considering legislation regulating hydraulic fracturing, including the disclosure of chemicals used in the process. Such bills or similar legislation, if adopted, could increase the possibility of litigation and establish an additional level of regulation that could lead to operational delays or increased operating costs and could result in additional regulatory burdens, making it more difficult to perform hydraulic fracturing and increasing our costs of compliance. At the state and local levels, some jurisdictions have adopted, and others are considering adopting, requirements that could impose more stringent permitting, public disclosure or well construction requirements on hydraulic fracturing activities, as well as bans on hydraulic fracturing activities. In the event that new or more stringent state or local legal restrictions relating to the hydraulic fracturing process are adopted in areas where we have properties, we could incur potentially significant added costs to comply with such requirements, experience delays or curtailment in the pursuit of exploration, development or production activities, and perhaps even be precluded from drilling wells.
In addition, the EPA has asserted federal regulatory authority over hydraulic fracturing using diesel under the SDWA’s Underground Injection Control Program (“UIC”) and has issued guidance regarding its authority over the permitting of these activities. Additionally, in December 2016, the EPA released its final report on the potential impacts of hydraulic fracturing on drinking water resources, concluding that “water cycle” activities associated with hydraulic fracturing may impact drinking water resources “under some circumstances,” including water withdrawals for fracturing in times or areas of low water availability; surface spills during the management of fracturing fluids, chemicals or produced water; injection of fracturing fluids into wells with inadequate mechanical integrity; injection of fracturing fluids directly into groundwater resources; discharge of inadequately treated fracturing wastewater to surface waters; and disposal or storage of fracturing wastewater in unlined pits. If this assessment results in additional regulatory scrutiny, it could make it difficult to perform hydraulic fracturing and increase our costs of compliance and doing business. Consequently, these studies and initiatives could spur further legislative or regulatory action regarding hydraulic fracturing or similar production operations.
Further, in June 2016, the EPA published an effluent limit guideline final rule prohibiting the discharge of wastewater from onshore unconventional oil and natural gas extraction facilities to publicly owned wastewater treatment plants.
These new initiatives related to hydraulic fracturing may increase our cost of disposal and impact our business operations and could cause our hydraulic fracturing activities to become subject to additional permit requirements or operations
restrictions which could lead to permitting delays and potential increases in costs. Restrictions on hydraulic fracturing could reduce the amount of oil and natural gas that we ultimately are able to produce.
The EPA has adopted rules to limit air emissions from oil and gas operations, subjecting oil and natural gas production, processing, transmission and storage operations to regulation under the NSPS and NESHAPS programs under the CAA. The EPA rules include NSPS standards for completions of hydraulically fractured natural gas wells. Before January 1, 2015, these standards require owners/operators to reduce VOC emissions from natural gas not sent to the gathering line during well completion either by flaring, using a completion combustion device, or by capturing the natural gas using green completions with a completion combustion device. Beginning January 1, 2015, operators must capture the natural gas and make it available for use or sale, which can be done through the use of green completions. The standards are applicable to newly fractured wells and also existing wells that are refractured. Further, the finalized regulations also establish specific new requirements, effective in 2012, for emissions from compressors, controllers, dehydrators, storage tanks, natural gas processing plants and certain other equipment. The implementation of these new requirements may result in increased operating and compliance costs, increased regulatory burdens and delays in our operations. There may also be further refinement to existing NSPS standards for VOCs as data is gathered about the implementation of those requirements.
We operate in a litigious environment.
Any constituent could bring suit regarding our existing or planned operations or allege a violation of an existing contract. Any such action could delay when planned operations can actually commence or could cause a halt to existing production until such alleged violations are resolved by the courts. Not only could we incur significant legal and support expenses in defending our rights, but halting existing production or delaying planned operations could impact our future operations and financial condition. In addition, we are defendants in numerous cases involving claims by landowners for surface or subsurface damages arising from our operations and for claims by unleased mineral owners and royalty owners for unpaid or underpaid revenues customary in our business. We incur costs in defending these claims and from time to time must pay damages or other amounts due. Such legal disputes can also distract management and other personnel from their primary responsibilities. For additional information on our significant litigation matters, see “Item 3. Legal Proceedings" and "Note 8. Commitments and contingencies” in the Notes to our Consolidated Financial Statements.
Our business could be negatively impacted by security threats, including cybersecurity threats, and other disruptions.
As an oil and natural gas production company, we face various security threats, including cybersecurity threats to gain unauthorized access to sensitive information or to render data or systems unusable; threats to the safety of our employees; threats to the security of our facilities and infrastructure or third party facilities and infrastructure, such as processing plants and pipelines; and threats from terrorist acts. Although we utilize various procedures and controls to monitor these threats and mitigate our exposure to such threats, there can be no assurance that these procedures and controls will be sufficient in preventing security threats from materializing. If any of these events were to materialize, they could lead to losses of sensitive information, critical infrastructure, personnel or capabilities essential to our operations and could have a material adverse effect on our reputation, financial position, results of operations or cash flows. The implementation of additional procedures and controls to monitor and mitigate security threats and to increase security for our information, facilities and infrastructure may result in increased capital and operating costs. Cybersecurity attacks in particular are evolving and include, but are not limited to, malicious software, attempts to gain unauthorized access to data, and other electronic security breaches that could lead to disruptions in critical systems, unauthorized release of confidential or otherwise protected information and corruption of data. These events could damage our reputation and lead to financial losses from remedial actions, loss of business or potential liability.
There are inherent limitations in all internal controlcontrols over financial reporting, and misstatements due to error or fraud may occur and not be detected.
While we have taken actions designed to address compliance with the internal control, disclosure control and other requirements of the Sarbanes-Oxley Act of 2002, as amended, and the rules and regulations promulgated by the SEC implementing these requirements, there are inherent limitations in our ability to control all circumstances. Our management, including our chief financial officer and chief accounting officer, do not expect that our internal controls and disclosure controls will prevent all errors and all fraud. A control system, no matter how well conceived and operated, can provide only reasonable, not absolute, assurance that the objectives of the control system are met. In addition, the design of a control system must reflect the fact that there are resource constraints and the benefit of controls must be relative to their costs. Because of the inherent
limitations in all control systems, no evaluation of controls can provide absolute assurance that all control issues and instances of fraud, if any, in our company have been detected. These inherent limitations include the realities that judgments in decision-making can be faulty and that breakdowns can occur because of simple errors or mistakes. Further, controls can be circumvented by individual acts of some persons, by collusion of two or more persons, or by management override of the controls. The design of any system of controls also is based in part upon certain assumptions about the likelihood of future
events, and there can be no assurance that any design will succeed in achieving its stated goals under all potential future conditions. Over time, a control may be inadequate because of changes in conditions, such as growth of our company or increased transaction volume, or the degree of compliance with the policies or procedures may deteriorate. Because of inherent limitations in a cost-effective control system, misstatements due to error or fraud may occur and not be detected.
The Consolidated Financial Statements included herein contain disclosures that express substantial doubt about our ability to continue as a going concern, indicating the possibility that we may not be able to operate in the future.
The Consolidated Financial Statements included herein have been prepared on a going concern basis, which contemplates the realization of assets and the satisfaction of liabilities and other commitments in the normal course of business. The Consolidated Financial Statements do not reflect any adjustments that might result from the outcome of our Chapter 11 proceedings. Our level of indebtedness has adversely impacted and is continuing to adversely impact our financial condition. The outcome of our Chapter 11 process is subject to a high degree of uncertainty and is dependent upon factors outside of our control, including actions of the Court and our creditors. The significant risks and uncertainties related to our liquidity and Chapter 11 proceedings described above raise substantial doubt about our ability to continue as a going concern.
See further discussion regarding our ability to continue as a going concern as part of "Note 1. Organization and basis of presentation" in the Notes to our Consolidated Financial Statements.
Risks Relating to Our Common Shares
Our common shares are no longer listed on a national securities exchange and are quoted only in over-the-counter markets,were deregistered under the Exchange Act, which may have a negative impact on our share price, volatility and Liquidity.
On December 22, 2017, the NYSE suspended trading in our common shares and commenced proceedings to delist our common shares due to our failure to maintain an average global market capitalization over a consecutive 30 trading-day period of at least $15 million pursuant to Section 802.01B of the NYSE Listed Company Manual.
OnSince December 27, 2017, our common shares beganhave been trading over the counter on the OTC Pink Marketplace under the ticker symbol “XCOO.” Our common shares continue to trade under that symbol with the added designation of “Q” to symbolize that we are currently in bankruptcy proceedings.
TheOur bankruptcy proceedings, as well as the delisting of our common shares from the NYSE and commencement of trading on the OTC Pink Marketplace, has resulted and may continue to result in a significant reduction in some or all of the following, each of which could have a material adverse effect on our shareholders:
the liquidity of our common shares;
the market price of shares of our common shares;
our ability to obtain financing for the continuation of our operations;
the number of institutional and other investors that will consider investing in shares of our common shares;
the number of market makers in our common shares;
the availability of information concerning the trading prices and volume of our common shares; and
the number of broker-dealers willing to execute trades in our common shares.
AlthoughThere is no assurance that we will continue to trade on the OTC Pink Marketplace as we are dependent on one or more market makers establishing a market for our common shares, have been delisted fromand even if they continue to do so, there can be no assurance that an active trading market will be maintained. Broker-dealers may decline to trade in the NYSE,OTC Pink Marketplace because (1) the market for such securities is often limited, (2) such securities are generally more volatile, and (3) the risk to investors is generally greater. Selling our shares could be difficult because smaller quantities of shares can be bought and sold, transactions can be delayed and securities analyst and media coverage of us may be reduced. These factors could result in lower prices and larger spreads in the bid and ask prices for shares of our common shares as well as lower trading volume. We cannot provide any assurance that, even if our common shares continue to be listed or quoted on the OTC Pink Marketplace or another market or system, the market for our common shares will be liquid.
On February 15, 2019, we are required to continue filing periodic reports with the SEC unless and until we take action to deregisterderegistered our common shares under Section 12(g) of the Exchange Act, which terminated the requirement to publicly file reports including financial statements and suspendother pertinent information about the Company. As a result, our reporting obligations under Section 15(d)common share price and liquidity of our common shares may be further negatively impacted since there will be significantly less public information about the Exchange Act.Company.
We believe it is highly likely that our existing common shares will be canceled at the conclusion of our Chapter 11 proceedings, and the holders of our existing common shares are not expected to be entitled to any recovery. As a result, we expect that the market for our common shares will be extremely limited during the pendency of our bankruptcy proceedings. See Item "1A. Risk Factors - We believe it is highly likely that our existing common shares will be canceled at the conclusion of our Chapter 11 proceedings".
Our common share price may fluctuate significantly.or remain significantly depressed throughout the pendency of our bankruptcy proceedings.
Our common shares currently trade on the OTC Pink Marketplace but an active trading market formay have severely limited liquidity as a result of our common shares may not be sustained.bankruptcy proceedings, among other things. The market price of our common shares could fluctuate significantlyhas previously experienced significant fluctuations as a result of:
bankruptcy proceedings and the outcome of the Chapter 11 Cases;
dilutive issuances of our common shares;
announcements relating to our business or the business of our competitors;
changes in expectations as to our future financial performance or changes in financial estimates of public market analysis;
actual or anticipated quarterly variations in our operating results;
conditions generally affecting the oil and natural gas industry;
the success of our operating strategy; and
the operating and share price performance of other comparable companies.
Many of these factors are beyond our control and we cannot predict their potential effects on the price of our common shares. In addition, the stock markets in general can experience considerableThe price and volume fluctuations. See further discussion of the impact of the Chapter 11 Cases on our common shares may fluctuate significantly in Item "1A.the future as a result of these or other factors. However, we currently believe it is highly likely that our existing common shares will be canceled at the conclusion of our Chapter 11 proceedings, and the holders of our existing common shares are not expected to be entitled to any recovery. As a result, the market price of our common shares may remain significantly depressed during the pendency of our Chapter 11 proceedings. See "Item 1A. Risk Factors - We believe it is highly likely that our existing common shares will be canceled at the conclusion of our Chapter 11 proceedings"proceedings".
| |
| Item 1B. | Unresolved Staff Comments |
Not applicable.None.
Corporate offices
We lease office space in Dallas, Texas. We also have small offices for technical and field operations in Texas, Louisiana and Pennsylvania. The table below summarizes our material corporate leases.
| | | Location | | Approximate square footage | | Approximate remaining monthly payment | | Expiration | | Approximate square footage | | Approximate remaining monthly payment | | Expiration |
Dallas, Texas (1) | | 155,000 |
| | $ | 251,000 |
| | May 31, 2025 | | 48,000 |
| | $ | 95,000 |
| | December 31, 2022 |
| |
(1) | The office lease in Dallas, Texas contains a right on our behalf to terminate the lease agreement early on June 30, 2020 or June 30, 2022. |
Other
We have described our oil and natural gas properties, oil and natural gas reserves, acreage, wells, production and drilling activity in “Item 1. Business” of this Annual Report on Form 10-K.
Bankruptcy proceedings under Chapter 11
On January 15, 2018, the Company and the Filing Subsidiaries filed voluntary petitions for relief under Chapter 11 of the Bankruptcy Code. See further discussion in "Note 17. Subsequent events"1. Organization and basis of presentation" in the Notes to our Consolidated Financial Statements for additional information.Statements.
Enterprise and Acadian contract litigation
During the third quarter of 2016, we terminateda dispute arose regarding our sales and transportation contracts with Enterprise Products Operating LLC ("Enterprise") and Acadian Gas Pipeline System ("Acadian"), respectively. Enterprise and Acadian are part of the corporate family of Enterprise Products Partners L.P. (“EPD”). UnderIn August 2016, each of EXCO and Enterprise did not remit certain payments allegedly due under the parties’ sales and transportation agreements, Enterprise owed us for July 2016 natural gas sales, and we owed Acadian for July 2016 transportation fees. The amount owed to us by Enterprise exceeded the amount owed by us to Acadian. Werespective agreements. EXCO’s subsidiary, Raider, notified Enterprise that the agreements were in writing of its failure to paydefault, and gave Enterprise opportunity to cure. When Enterprise failed to cure, we gave written notice to Enterprise and Acadian that we were terminatingsubsequently terminated the sales and transportation agreements. Enterprise subsequently filed an amended petitiondisputed our right to terminate the agreements, and commenced litigation at Enterprise Products Operating LLC and Acadian Gas Pipeline System v. EXCO Operating Company, LP, EXCO Partners OLP GP, LLC, Raider Marketing, LP, and Raider Marketing GP, LLC No. 2016-60848 157th Judicial District, Harris County, Texas. The amended petition alleges that we could not terminate the parties’ agreements despite Enterprise's uncured payment default under the gas sales agreement,Texas, and further alleged that we were in breach of the firm transportation agreements. On October 17, 2016, we filed a counterclaim asserting that Enterprise was the breaching party because it improperly withheld payment for natural gas we delivered and the amounts owed by Enterprise exceeded the amounts owed by us to Acadian. We are also seeking a declaration that we properly terminated the contracts with Enterprise and Acadian, as well as payment of the amounts owed to us under the agreements. EPD subsequently joined Bluescape and two of our officers, Harold Hickey and Steve Estes, asserting breachEstes. In October 2016, we filed counterclaims against Enterprise and Acadian in the state court action. The suit was automatically stayed pursuant to the Bankruptcy Code upon the commencement of fiduciary duty claims and thereafter joined Bluescape asserting tortious interference with an existing contract. We havethe bankruptcy cases.
On February 12, 2018, Enterprise filed a summary judgment motion asin the Court seeking to lift the claimsautomatic stay to continue the suit in state court, and on March 9, 2018, Enterprise filed a motion in the state court seeking to sever the litigation against Bluescape from the litigation against us and our
officers and the motion is pending before the court. If we prevail on the summary judgment motionso it could be case dispositive. This case was anticipatedproceed despite the automatic stay. On March 19, 2018, we filed a motion seeking to gohalt litigation against Bluescape and our directors. On April 19, 2018, the Court entered a stipulation and agreed order pursuant to trial in the second or third quarter of 2018; however, the case is stayed due to our Chapter 11 filings. EPD has filed awhich, among other things: (a) Enterprise withdrew its motion to lift the stay.stay, dismissed its claims against our directors, and agreed not to commence litigation against Bluescape (although discovery could commence) until its claims against us had been resolved; and (b) we agreed to object to any proofs of claim filed by Enterprise or Acadian in the bankruptcy cases by July 20, 2018.
On April 23, 2018, Enterprise and Acadian filed proofs of claim asserting claims against EXCO and Raider. On July 20, 2018, we filed an objection to all proofs of claim filed by Enterprise and Acadian (“Enterprise Claims Objection”), and on October 22, 2018, we filed a motion seeking summary judgment in our favor. On October 5, 2018, Enterprise filed a response to the Enterprise Claims Objection and a motion seeking the Court’s abstention therefrom (“Enterprise Abstention Motion”). On October 29, 2018, the Debtors and Bluescape each filed an objection to the Enterprise Abstention Motion. On November 14, 2018, the Enterprise Claims Objection (and related summary judgment motion) and Enterprise Abstention Motion were abated by agreement. If the abatement is lifted, litigation between us and Enterprise/Acadian could recommence in either the state court, the Court, or both.
On November 13, 2018, EXCO and Bluescape executed an agreement with EPD to settle the aforementioned litigation and claims against the Debtors ("EPD Settlement Agreement"). Per the terms of the EPD Settlement Agreement:
The proofs of claim filed by EPD in the Chapter 11 Cases shall be settled for an allowed general unsecured claim of $10.0 million. These claims primarily include costs related to the rejection of a natural gas sales agreement and natural gas transportation agreement in the North Louisiana region. On the effective date of a plan of reorganization, Bluescape shall be required to purchase the claim from Enterprise for $5.0 million;
The Debtors shall pay Enterprise: (i) $6.25 million on the effective date of a plan of reorganization, and (ii) $6.25 million on September 1, 2019; and
Upon completion of the payments from the Debtors and Bluescape to EPD, each party shall provide releases and take all actions to dismiss the aforementioned litigation.
The EPD Settlement Agreement will not be effective until it is approved by the Court. Furthermore, the EPD Settlement Agreement will be terminated if the effective date of a plan of reorganization does not occur prior to July 1, 2019. We filed a motion with the Court to approve the EPD Settlement Agreement on March 13, 2019 and the hearing is scheduled for April 11, 2019.
Chesapeake natural gas sales contract litigation
On June 6, 2017, we filed a petition, application for temporary restraining order and temporary injunction against Chesapeake Energy Marketing, LLC ("CEML") in Dallas County, Texas, Case No. DC-17-06672, in the 14th District Court of Dallas County, Texas, for allegedly wrongfully terminating a long-term sales contract with an expiration of June 30, 2032, between Chesapeake and Raider Marketing, LP ("Raider").Raider. We are asserting breach of contract, tortious interference with existing contract, tortious interference with prospective business relations, and declaratory relief that the contract is still in full force and effect. On June 7, 2017, Chesapeake filed to remove the lawsuit to the United States District Court Northern District of Texas. We subsequently joined Chesapeake Energy Corporation ("CEC"). CEC has filed a motion to dismiss for lack of personal jurisdiction, and the motion remains pending. See further discussion of the impact of the wrongful termination of the contract by CEML on our ability to divest certain assets in the South Texas region in "Note 3. Acquisitions, divestitures and other significant events" in the Notes to our Consolidated Financial Statements.
On May 24, 2018, CEML filed a motion seeking relief from the automatic stay to pursue counterclaims against us in the district court litigation. On July 23, 2018, the Court entered an order approving a joint stipulation and agreed order lifting the automatic stay to for the limited purpose of allowing CEML to assert any counterclaims or affirmative defenses in the litigation.
On February 21, 2019, EXCO executed an agreement with CEC and CEML to settle the aforementioned litigation, claims against the Debtors, and other matters ("Chesapeake Settlement Agreement"). Per the terms of the Chesapeake Settlement Agreement:
All claims filed by CEC and CEML in the Chapter 11 Cases shall be deemed disallowed and expunged. These claims primarily include costs related to the rejection of a marketing agreement in the North Louisiana region and pre-petition costs related to sales of natural gas in the South Texas region;
EXCO agreed to release CEC and CEML from pre-petition litigation including the wrongful termination of a natural gas sales contract in South Texas and improper charges for post-production costs in North Louisiana; and
EXCO will assume certain sales contracts with CEML and joint operating agreements with CEC.
The Chesapeake Settlement Agreement will not be effective until it is approved by the Court. We filed a motion with the Court to approve the Chesapeake Settlement Agreement on February 25, 2019 and the hearing is scheduled for March 20, 2019.
Shell natural gas sales contract litigation
We are plaintiffs in an adversary proceeding pending in the United States Bankruptcy Court for the Southern District of Texas, Houston Division under Case No. 18-30155. This lawsuit was originally filed in Harris County District Court on December 26, 2017. We filed a notice of non-suit without prejudice onOn January 26, 2018, in order to bring the claim aswe initiated an adversary proceeding in the Chapter 11 reorganization. EXCO initiated this adversary proceeding against Shell Energy North America (US) LP ("Shell Energy"), a subsidiary of Shell, under Case No. 18-30155 in the bankruptcy proceeding. This lawsuit was originally filed in Harris County District Court on JanuaryDecember 26, 2018.2017 and subsequently non-suited after the filing of the bankruptcy petitions. We brought suit as a result ofdue to Shell Energy’s improper withholding of approximately $33.4 million in revenue, which EXCO is owed underrelated to the parties’ Base Contract for Sale and Purchasesales of Natural Gas executed in August of 2009. This unpaid revenue is due to EXCO for the natural gas EXCO delivered to Shell Energy in East Texas and North Louisiana for the months of November and December 2017. On March 23, 2018, the adversary proceeding was dismissed. The issues between Shell Energy and us related to the unpaid revenues remain outstanding.
In addition, we had withheld $28.5 million in revenues owed to Shell as a result of the dispute with Shell Energy. On October 1, 2018, the Court approved our settlement with Shell ("Shell Settlement Agreement"), pursuant to which:
EXCO will pay a total of $22.5 million to Shell, including $9.0 million within 15 days following the approval of the settlement agreement by the Court, $9.0 million within 45 days following the approval of the Court, and the remaining $4.5 million on or before the effective date of the plan of reorganization. Per the terms of the Shell Settlement Agreement, we paid Shell $18.0 million during the fourth quarter of 2018. Upon payment in full of the remaining amount, Shell shall release EXCO from any further liability related to the withheld revenues;
EXCO will commence the completion of four wells that were previously drilled in North Louisiana no later than November 15, 2018, and subsequently commence the completion of three additional wells that were previously drilled in North Louisiana. Per the terms of the Shell Settlement Agreement, we commenced completion on each of these wells during the fourth quarter of 2018 and first quarter of 2019;
EXCO shall assume the joint development agreement with Shell for the East Texas/ North Louisiana joint venture as part of the bankruptcy proceedings and any defaults occurring thereunder are deemed to be satisfied; and
Shell shall not challenge EXCO’s right to serve as operator under the joint development agreement for the East Texas/ North Louisiana joint venture for the remaining term through January 1, 2020, subject to certain exceptions.
The settlement agreement does not prevent us from asserting any claim, cross-claim, defense, or other cause of action against Shell Energy, nor does the settlement agreement prevent Shell Energy from asserting any claim, cross-claim, defense, or
other cause of action against us. Furthermore, the settlement agreement provides that it shall not affect any proof of claim that Shell Energy filed in the Chapter 11 Cases. On March 7, 2018, the Court approved the rejection of certain natural gas sales agreements with Shell’s affiliate, Shell Energy, and we recorded a liability of $41.5 million in “Liabilities subject to compromise” related to our current estimate of the allowed claim. The receivable for sales of oil and natural gas to Shell Energy in November and December 2017 and the estimate of the allowed claim for the rejection of the natural gas sales agreement with Shell Energy were presented as a net amount of $8.1 million in "Liabilities subject to compromise" as of December 31, 2018.
Azure minimum volume commitment litigation
On March 1, 2018, we filed a motion to reject an agreement to deliver an aggregate minimum volume commitment of natural gas production in East Texas and North Louisiana to certain gathering systems owned by Azure Midstream Energy, LLC and TGG Pipeline, Ltd. (collectively, “Azure”) through November 30, 2018. The motion was abated on May, 8, 2018 and on May 16, 2018, EXCO Operating Company, LP (“EOC”) and Raider commenced an adversary proceeding against Azure under Case No. 18-03096 in the bankruptcy proceedings. We initiated this adversary proceeding against Azure to establish that the minimum volume commitment agreement is severable from the base gathering agreement between the parties. Various dispositive motions were filed, which were heard by the Court on August 9, 2018. In addition, on April 11, 2018, Azure filed a motion to compel payment of an administrative expense claim for payment of certain disputed compression fees, and on April 13, 2018 filed proofs of claims on account of the gathering and minimum volume commitment agreements. We objected to Azure’s proofs of claim and filed a motion to estimate the claims against EOC at $0.
On November 19, 2018, the Court approved our settlement with Azure ("Azure Settlement Agreement"), pursuant to which:
EXCO agreed to pay Azure $15.0 million and transfer equity interests held in Azure (~3.35%) on the effective date of EXCO’s plan of reorganization; and
EXCO will assume the base gathering agreement with Azure and cure any associated pre-petition amounts associated with the agreement on or before February 28, 2019.
Upon completion of the aforementioned criteria, Azure’s claims related to the base gathering agreement and minimum volume commitment will be deemed to be satisfied. On March 1, 2019, we paid $6.4 million of pre-petition costs for gathering services under the base gathering agreement. The remaining payment and transfer of equity interests are expected to be paid on the effective date of EXCO's plan of reorganization.
Natural gas flaring application
In January 2018, we commenced the flaring of natural gas produced in our South Texas region pursuant to temporary flare permits. In May 2018, we went before the Texas Railroad Commission at a hearing regarding a requested extension of the Flaring Application for up to two-years. We expect that a final ruling by the Texas Railroad Commission on the Flaring Application will be issued in early 2019.
| |
| Item 4. | Mine Safety Disclosures |
Not applicable.
PART II
| |
| Item 5. | Market for the Registrant's Common Equity, Related Stockholder Matters and Issuer Purchases of Equity Securities |
Market information for our common shares
Our common shares have historically been traded on the NYSE. On December 22, 2017, the NYSE suspended the trading of our common shares and commenced proceedings to delist our common shares due to our failure to maintain an average global market capitalization over a consecutive 30 trading-day period of at least $15 million. As a result, on December 27, 2017, our common shares commenced trading on the OTC Pink Marketplace under the symbol “XCOO”. Subsequent to our filing voluntary petitions for relief under Chapter 11 on January 15, 2018, our common shares are quoted over-the-counter under the symbol "XCOOQ".
since December 27, 2017. Prior to that time, our common shares were traded on the NYSE.
The following table sets forth for the periods indicated, the highest and lowest sales price for our common shares, as reported on the NYSE for the periods through December 22, 2017, and the quarterly high and low bid quotations for our common shares as reported over-the-counter for the period beginning December 27, 2017:
| | | | | Price per share | | Price per share |
| | | High | | Low | | High | | Low |
| 2017 | | | | | |
| 2018: | | | | | |
| First Quarter | | $ | 14.70 |
| | $ | 7.05 |
| | $ | 0.74 |
| | $ | 0.19 |
|
| Second Quarter | | 9.90 |
| | 2.65 |
| | 0.39 |
| | 0.06 |
|
| Third Quarter | | 2.81 |
| | 1.00 |
| | 0.16 |
| | 0.05 |
|
| Fourth Quarter | | 1.72 |
| | 0.19 |
| | 0.14 |
| | 0.02 |
|
| | | | | | | | | |
| 2016 | | | | | |
| 2017: | | | | | |
| First Quarter | | $ | 29.10 |
| | $ | 10.50 |
| | $ | 14.70 |
| | $ | 7.05 |
|
| Second Quarter | | 28.65 |
| | 7.65 |
| | 9.90 |
| | 2.65 |
|
| Third Quarter | | 21.30 |
| | 13.50 |
| | 2.81 |
| | 1.00 |
|
| Fourth Quarter | | 18.90 |
| | 12.75 |
| | 1.72 |
| | 0.19 |
|
Our shareholders
According to our transfer agent, Continental Stock Transfer & Trust Company, there were 13260 holders of record of our common shares on December 31, 20172018 (including nominee holders such as banks and brokerage firms who hold shares for beneficial holders and holders of restricted shares).
Our dividend policy
We have not paid any dividends on our common shares since 2014 and we do not anticipate paying any dividends on our common shares in the foreseeable future. The agreements governing our indebtedness contain covenants that generally limit our ability to pay dividends. In addition, we are currently prohibited from paying cash dividends on our common shares under the Bankruptcy Code, as well as under Texas law because we have negative shareholders’ equity. Any future declaration of dividends, as well as the establishment of record and payment dates, will depend on, among other things, our earnings, capital requirements, financial condition, prospects and other factors our Board of Directors may deem relevant.
Issuer repurchases of common shares
The following table details our repurchases of common shares for the three months ended December 31, 2017:
|
| | | | | | | | | | | | | | |
| Period | | Total Number of Shares Purchased | | Average Price Paid Per Share | | Total Number of Shares Purchased as Part of Publicly Announced Plans or Programs | | Maximum Approximate Dollar Value of Shares that May Yet Be Purchased Under the Plans or Programs (in millions) (1) |
| October 1 - October 31 | | — |
| | $ | — |
| | — |
| | $ | 192.5 |
|
| November 1 - November 30 | | — |
| | — |
| | — |
| | 192.5 |
|
| December 1 - December 31 | | — |
| | — |
| | — |
| | 192.5 |
|
| Total | | — |
| | — |
| | — |
| | |
| |
(1) | On July 19, 2010, we announced a $200.0 million share repurchase program. |
| |
| Item 6. | Selected Financial Data |
The following table presents our selected historical financialinformation required herein has been omitted due to the relief from disclosure afforded to smaller reporting companies under Regulation S-K and operating data. This financial data should be read in conjunction with “Item 7. Management's Discussion and AnalysisArticle 8 of Financial Condition and Results of Operations,” our Consolidated Financial Statements, the Notes to our Consolidated Financial Statements and the other financial information included in this Annual Report on Form 10-K. This information does not replace the Consolidated Financial Statements. Certain reclassifications have been made to prior period information to conform to current period presentation.
Selected consolidated financial and operating data |
| | | | | | | | | | | | | | | | | | | | |
| | | Year Ended December 31, |
| (in thousands, except per share amounts) | | 2017 | | 2016 | | 2015 | | 2014 | | 2013 |
| Statement of operations data (1): | | | | | | | | | | |
| Total revenues | | $ | 283,646 |
| | $ | 271,001 |
| | $ | 355,700 |
| | $ | 695,917 |
| | $ | 663,090 |
|
| Operating income (loss) (2) | | (40,556 | ) | | (220,949 | ) | | (1,339,875 | ) | | 126,875 |
| | 179,221 |
|
| Net income (loss) (3)(4)(5) | | $ | 24,362 |
| | $ | (225,258 | ) | | $ | (1,192,381 | ) | | $ | 120,669 |
| | $ | 22,204 |
|
| Basic net income (loss) per share | | $ | 1.14 |
| | $ | (12.09 | ) | | $ | (65.37 | ) | | $ | 6.75 |
| | $ | 1.55 |
|
| Diluted net income (loss) per share | | $ | 1.14 |
| | $ | (12.09 | ) | | $ | (65.37 | ) | | $ | 6.74 |
| | $ | 1.44 |
|
| Cash dividends declared per share | | $ | — |
| | $ | — |
| | $ | — |
| | $ | 2.25 |
| | $ | 3.00 |
|
| Weighted average common shares and common share equivalents outstanding: | | | | | | | | | | |
| Basic | | 21,288 |
| | 18,630 |
| | 18,241 |
| | 17,884 |
| | 14,334 |
|
| Diluted | | 21,288 |
| | 18,630 |
| | 18,241 |
| | 17,892 |
| | 15,394 |
|
| Statement of cash flow data: | | | | | | | | | | |
| Net cash provided by (used in): | | | | | | | | | | |
| Operating activities | | $ | 54,411 |
| | $ | (414 | ) | | $ | 134,027 |
| | $ | 362,093 |
| | $ | 350,634 |
|
| Investing activities | | (182,551 | ) | | (55,009 | ) | | (300,833 | ) | | (221,588 | ) | | (252,478 | ) |
| Financing activities | | 158,669 |
| | 52,244 |
| | 132,748 |
| | (144,683 | ) | | (93,317 | ) |
| Balance sheet data: | | | | | | | | | | |
| Current assets | | $ | 167,830 |
| | $ | 110,617 |
| | $ | 149,801 |
| | $ | 330,766 |
| | $ | 305,854 |
|
| Total assets | | 840,347 |
| | 661,414 |
| | 954,126 |
| | 2,304,942 |
| | 2,399,836 |
|
| Current liabilities (6) | | 1,666,970 |
| | 258,363 |
| | 252,919 |
| | 329,436 |
| | 349,170 |
|
| Long-term debt (6) | | — |
| | 1,258,538 |
| | 1,320,279 |
| | 1,430,516 |
| | 1,850,120 |
|
| Shareholders' equity | | (846,199 | ) | | (871,906 | ) | | (662,323 | ) | | 510,004 |
| | 147,905 |
|
| Total liabilities and shareholders' equity | | 840,347 |
| | 661,414 |
| | 954,126 |
| | 2,304,942 |
| | 2,399,836 |
|
| |
(1) | We have completed numerous acquisitions and dispositions which impact the comparability of the selected financial data between periods. |
| |
(2) | Operating income (loss) during 2017 was impacted by the acceleration of the remaining $56.4 million in costs under a firm transportation agreement. See "Note 8. Commitments and contingencies" in the Notes to our Consolidated Financial Statements for additional information. Operating income (loss) loss during 2016 was impacted by the impairment of oil and natural gas properties charge of $160.8 million and the settlement of the litigation with a joint venture partner. See "Note 3. Acquisitions, divestitures and other significant events" in the Notes to our Consolidated Financial Statements for additional information regarding the litigation with our joint venture partner. Operating income (loss) during 2015 was impacted by the impairment of oil and natural gas properties charge of $1.2 billion. Operating income (loss) during 2013 was impacted by a gain recognized on the contribution of properties to Compass Production Partners, L.P. ("Compass").
|
| |
(3) | In March 2017, we issued warrants to the investors of 1.5 Lien Notes and to certain exchanging holders of the Second Lien Term Loans (collectively referred to as the "2017 Warrants" as defined in "Note 4. Derivative financial instruments" in the Notes to our Consolidated Financial Statements). We record the 2017 Warrants as non-current liabilities at fair value, with the increase or decrease in fair value being recognized in earnings. As a result of the change in the fair value of the 2017 Warrants, we recorded a gain of $159.2 million on the revaluation of the warrants during the year ended December 31, 2017. |
| |
(4) | During 2016, we recognized a net gain on extinguishment of debt $119.5 million due to repurchases of a portion of the 2018 Notes and 2022 Notes. During 2015, we recognized a gain on restructuring and extinguishment of debt as a result of repurchasing a portion of our 2018 Notes and 2022 Notes in exchange for the holders of such notes agreeing to act as lenders in connection with |
the Exchange Term Loan (as defined in "Note 5. Debt" in the Notes to our Consolidated Financial Statements). In addition, we repurchased a portion of the 2018 Notes in open market purchases which resulted in a net gain on extinguishment of debt. See "Note 5. Debt" in the Notes to our Consolidated Financial Statements for further discussion.
| |
(5) | On November 15, 2013, we sold our equity interest in TGGT Holdings, LLC ("TGGT") to Azure Midstream Holdings LLC ("Azure") in exchange for cash proceeds and an equity interest in Azure. We report our equity interest acquired in Azure using the cost method of accounting. |
| |
(6) | During 2017, we reclassified all of our outstanding indebtedness to a current liability as a result of agreements entered into in anticipation of events of default under certain debt agreements, as well as any outstanding debt with cross-default provisions, and an event of default under the Second Lien Term Loans. See "Note 5. Debt" in the Notes to our Consolidated Financial Statements for further discussion. |
| |
| Item 7. | Management’s Discussion and Analysis of Financial Condition and Results of Operations |
The following management's discussion and analysis of our financial condition and results of operations should be read in conjunction with our financial statements and the related notes to those statements included elsewhere in this Annual Report on Form 10-K. In addition to historical financial information, the following management's discussion and analysis contains forward-looking statements that involve risks, uncertainties and assumptions. Our results and the timing of selected events may differ materially from those anticipated in these forward-looking statements as a result of many factors, including those discussed under “Item 1A. Risk Factors” and elsewhere in this Annual Report on Form 10-K.
Overview and history
We are an independent oil and natural gas company engaged in the exploration, exploitation, acquisition, development and production of onshore U.S. oil and natural gas properties with a focus on shale resource plays. Our principal operations are conducted in certain key U.S. oil and natural gas areas including Texas, Louisiana and the Appalachia region. Our primary strategy focuses on the exploitation and development of our shale resource plays and the pursuit of leasing and acquisition opportunities.
Like all oil and natural gas exploration and production companies, we face the challenge of natural production declines. We attempt to offset the impact of this natural decline by implementing drilling and exploitation projects to identify and develop additional reserves and adding reserves through leasing and undeveloped acreage acquisition opportunities. Our financial condition has been negatively impacted by the prolonged depressed oil and natural gas price environment, levels of indebtedness, and gathering, transportation and certain other commercial contracts.
Chapter 11 Cases
On January 15, 2018, the Company and the Filing Subsidiaries filed voluntary petitions for relief under Chapter 11 of the Bankruptcy Code in the United States Bankruptcy Court for the Southern District of Texas. The Debtors have filed a motion with the Court seeking joint administration of their Chapter 11 cases under the caption In Re EXCO Resources, Inc., Case No. 18-30155 (MI). The Court has granted all of the first day motions filed by the Debtors that were designed primarily to minimize the impact of the Chapter 11 proceedings on our operations, customers and employees. We will continue to operate our businesses as “debtors in possession” under the jurisdiction of the Court and in accordance with the applicable provisions of the Bankruptcy Code and orders of the Court. We expect to continue our operations without interruption during the pendency of the Chapter 11 proceedings.
On January 22, 2018, we closed the DIP Credit Agreement, which includes an initial borrowing base of $250.0 million. The proceeds from the DIP Facilities were used to refinance all obligations outstanding under the EXCO Resources Credit Agreement and will provide additional liquidity to fund our operations during the Chapter 11 process. We continueOn January 15, 2019, we entered into an amendment to engage in discussionsthe DIP Credit Agreement to extend the maturity date from January 22, 2019 to May 22, 2019.
On October 1, 2018, the Debtors filed the October 2018 Plan and related Disclosure Statement with our creditors regarding the termsCourt. On November 5, 2018, the Court authorized us to solicit acceptances of the October 2018 Plan and approved the Disclosure Statement and other related solicitation materials and procedures necessary to approve the October 2018 Plan. Simultaneous with the solicitation process, we initiated a marketing process for the issuance of a financial restructuring plan. In conjunction with this process, we will explore potential strategic alternatives to maximize value fornew revolving credit facility and a new second lien debt instrument. During the benefit of our stakeholders, which may include a sale of certain or substantially all of our assets under Section 363course of the Bankruptcy Code,marketing process, oil prices experienced a plansignificant decline and overall market conditions worsened. As a result, we were not able to obtain the exit financing required to consummate the October 2018 Plan. On February 15, 2019, the Court approved a motion to extend the filing exclusivity period through April 1, 2019 and the solicitation exclusivity period through May 31, 2019. On March 8, 2019, the Debtors filed the March 2019 Plan and related Disclosure Statement with the Court. The March 2019 Plan provides for either a reorganization of reorganization to equitize certain indebtednessthe Debtors as a going concern or an alternative toAll Asset Sale. We have not received consents from any creditors in support of the sale process, or a combination thereof.March 2019 Plan.
For the duration of the Chapter 11 proceedings,Cases, our operations and our ability to develop and execute our business plan are subject to risks and uncertainties associated with the Chapter 11 proceedings described in "Item 1A. Risk Factors”.Cases. As a result
of these risks and uncertainties, our assets, liabilities, shareholders’ equity, officers and/or directors could be significantly different following the outcome of the Chapter 11 proceedings,Cases, and the description of our operations, properties and capital plans included in this annual report on Form 10-K may not accurately reflect our operations, properties and capital plans following the conclusion of the Chapter 11 proceedings.Cases. See further discussion of the impact of the bankruptcy proceedings as part of “Note 1. Organization and basis of presentation” in the Notes to our Consolidated Financial Statements.
Impact on our indebtedness
The commencement of the Chapter 11 Cases constituted an event of default that accelerated our obligations under the EXCO Resources Credit Agreement, 1.5 Lien Notes, 1.75 Lien Term Loans, 2018 Notes, and 2022 Notes. These debt instruments provide that as a result of the commencement of the Chapter 11 Cases, the principal and interest due thereunder shall be immediately due and payable. Any efforts to enforce such payment obligations under the debt instruments are automatically stayed as a result of the commencement of the Chapter 11 Cases, and the creditors’ rights of enforcement with respect to the debt instruments are subject to the applicable provisions of the Bankruptcy Code.
As of the Petition Date, we adjusted the carrying value of our indebtedness to the estimated amount that will be allowed as claims in "Note 17. Subsequent events"the Chapter 11 Cases. These amounts represent our current estimate and may materially differ from actual future settlement amounts paid. As of December 31, 2018, the carrying value for each of our debt instruments approximates the principal amount. The corresponding expense associated with the adjustments was recorded as “Reorganization items, net” on our Consolidated Statement of Operations for the year ended December 31, 2018.
On February 22, 2018, the Court approved our ability to make adequate protection payments for interest on the DIP Credit Agreement and the 1.5 Lien Notes. We accrued interest on 1.75 Lien Term Loans, senior secured second lien term loans due October 26, 2020 (“Second Lien Term Loans”), 2018 Notes and 2022 Notes through the Petition Date, with no interest accrued subsequent to the filings. As a result, we expect our interest expense to decrease in the future.
Rejection of executory contracts
Subject to certain exceptions, under the Bankruptcy Code, the Debtors may assume, assign, or reject certain executory contracts and unexpired leases subject to the approval of the Court and fulfillment of certain other conditions. The rejection of an executory contract or unexpired lease is generally treated as a breach as of the Petition Date of such executory contract or unexpired lease and, subject to certain exceptions, relieves the Debtors of performing their future obligations under such executory contract or unexpired lease but may give rise to a general unsecured claim against the Company or the applicable Filing Subsidiaries for damages caused by such rejection. Our estimate of allowable claims related to the executory contracts and unexpired leases approved for rejection by the Court was recorded as “Liabilities subject to compromise” on our Consolidated Balance Sheet as of December 31, 2018 and the corresponding expense was recorded as “Reorganization items, net” in our Consolidated Statement of Operations for year ended December 31, 2018.
During March 2018, the Court approved the rejection of certain executory contracts related to the sale, marketing and transportation of natural gas in the North Louisiana region. On November 19, 2018, the Court approved an agreement entered into by EXCO and Azure to settle any claims related to a minimum volume commitment for gathering services in the East Texas and North Louisiana regions. We expect our realized natural gas price differentials and gathering and transportation expenses to improve in the future as a result of the rejection and settlement of these contracts.
On August 9, 2018, the Court approved the rejection of the office lease for our corporate headquarters in Dallas, Texas. We subsequently entered into a new lease for a reduced amount of square footage in the same office building with a term through December 31, 2022. We expect our rent expense included within general and administrative expenses to decrease in the future as a result of the rejection of this contract. See further discussion of the impact of the rejection and settlement of executory contracts as part of “Note 1. Organization and basis of presentation” in the Notes to our Consolidated Financial Statements.
Appalachia JV Settlement
On February 27, 2018, we closed the Appalachia JV Settlementa settlement agreement with a subsidiary of Shell to resolve arbitration regarding our right to participate in an area of mutual interest in the Appalachia region.region (“Appalachia JV Settlement”). As a result of the Appalachia JV Settlement, we acquired Shell'sShell’s interests in theour joint venture in Appalachia, including entities that own interests in oil and natural gas properties, an entity that operates the wells in the joint venture in Appalachia (“OPCO”) and an entity that owns and operates midstream assets in the Appalachia region.region (“Appalachia Midstream”). As a result, the Appalachia JV Settlement increased our production, revenues and expenses in the Appalachia region are expected to increase inregion. Also, the future. Also,Appalachia JV Settlement decreased our recoveries of general and administrative expenses related to the joint venture in Appalachia are expected to decrease in the future.Appalachia. See further discussion of this settlement as part of "Note 17. Subsequent events"“Note 3. Acquisitions, divestitures and other significant events” in the Notes to our Consolidated Financial Statements.
Financing transactions and restructuring activities during 2017
On March 15, 2017, we closed a series of transactions including the issuance of $300.0 million in aggregate principal amount of 1.5 Lien Notes, exchange of $682.8 million in aggregate principal amount of Second Lien Term Loans for a like amount of 1.75 Lien Term Loans and issuance of warrants to purchase our common shares. The terms of the indenture governing the 1.5 Lien Notes and the credit agreement governing the 1.75 Lien Term Loans allow for interest payments in cash, common shares or additional indebtedness, subject to certain restrictions and limitations. The transaction fees paid to the lenders included a combination of cash and warrants to purchase our common shares. The 1.5 Lien Notes were issued to affiliates of Fairfax, Bluescape and Oaktree Capital Management, LP ("Oaktree"), as well as an unaffiliated lender.
The proceeds from the 1.5 Lien Notes were primarily utilized to repay the outstanding indebtedness under the EXCO Resources Credit Agreement as of March 2017. In connection with these transactions, the EXCO Resources Credit Agreement was amended to reduce the borrowing base to $150.0 million, permit the issuance of the 1.5 Lien Notes and the exchange of Second Lien Term Loans, and modify certain financial covenants. On June 20, 2017, we paid interest on the 1.75 Lien Term Loans in common shares, which resulted in the issuance of 2,745,754 common shares. On September 20, 2017, we paid $17.0 million and $26.2 million of interest on the 1.5 Lien Notes and 1.75 Lien Term Loans, respectively, through the issuance of additional 1.5 Lien Notes and 1.75 Lien Term Loans.
On September 7, 2017, we announced that our Board of Directors delegated authority to the independent directors of the Audit Committee to explore strategic alternatives to strengthen the Company’s balance sheet and maximize the value of the Company, which included, but was not limited to, seeking a comprehensive out-of-court restructuring or reorganization under Chapter 11 of the Bankruptcy Code. At the direction of the Audit Committee, we retained PJT Partners LP as financial advisors and Alvarez & Marsal North America, LLC as restructuring advisors, and continued to engage Kirkland & Ellis LLP as legal advisors to assist the Company with the restructuring process. We initiated discussions with certain stakeholders regarding strategic alternatives to restructure our balance sheet. During the third quarter of 2017, the Compensation Committee of the Board of Directors and the Company revised our employee compensation programs to retain employees and align the interests of employees with our stakeholders. The revised incentive plans solely consist of cash-based compensation and we have discontinued the grant of share-based compensation to employees until the completion of a restructuring. See further discussion of the revisions to our employee compensation programs in "Note 11. Equity-based and other incentive-based compensation" in the Notes to our Consolidated Financial Statements.
During the third quarter of 2017, we borrowed substantially all of our remaining unused commitments under the EXCO Resources Credit Agreement. On September 29, 2017, we obtained a limited waiver from the lenders under the EXCO Resources Credit agreement waiving an event of default as a result of a failure to comply with certain financial covenants as of September 30, 2017.
Due to liquidity constraints and restrictions and limitations on our ability to pay interest in cash, common shares or additional indebtedness, we did not make our interest payment on the 1.75 Lien Term Loans that was due on December 20, 2017 and the interest payment on the Second Lien Term Loans that was due on December 26, 2017. In anticipation of certain events of default related to compliance with financial covenants and failure to pay interest on certain debt instruments, we entered into agreements with certain holders of the indebtedness under our EXCO Resources Credit Agreement, 1.5 Lien Notes, and 1.75 Lien Term Loans to forbear from exercising their rights and remedies as a result of an event of default under such debt instruments until January 15, 2018. See further discussion in "Note 5. Debt" in the Notes to our Consolidated Financial Statements.
Changes to Board of Directors
On September 20, 2017, each of B. James Ford and Samuel A. Mitchell resigned from their respective positions as members of our Board of Directors. At the time of their respective resignations, neither Mr. Ford nor Mr. Mitchell was a member of any committee of the Board. On October 6, 2017, Stephen J. Toy resigned from his position as a member of the Board. At the time of his resignation, Mr. Toy was a member of each of the Audit Committee, Compensation Committee and Nominating and Corporate Governance Committee of the Board. On November 9, 2017, C. John Wilder resigned from his position as a member of the Board and as Executive Chairman of the Board. At the time of his resignation, Mr. Wilder was not a member of any committee of the Board. In connection with the resignation of Mr. Wilder, we entered into a suspension agreement with Energy Strategic Advisory Services LLC ("ESAS") pursuant to which, among other things: (i) the services and investment agreement with ESAS, dated as of March 31, 2015, was suspended such that, during the suspension period and subject to the terms and conditions of the agreement: (a) ESAS is not required to provide any services to us, (b) we are not required to make any payments to ESAS with respect to the suspension period and (c) ESAS does not have the right to nominate a member to the Company’s Board of Directors; and (ii) the warrants previously issued to ESAS under the services and investment agreement ("ESAS Warrants") were forfeited and canceled and we have no further obligations under the ESAS Warrants. ESAS is a wholly owned subsidiary of an affiliate of Bluescape, and Mr. Wilder serves as the Executive Chairman of Bluescape and indirectly controls ESAS.
Reverse share split and NYSE compliance
On June 2, 2017, we filed a certificate of amendment to our Amended and Restated Certificate of Formation to reduce the number of authorized common shares from 780,000,000 to 260,000,000 and effect a 1-for-15 reverse share split. The reverse share split became effective after the market closed on June 12, 2017. See "Note 1. Organization and basis of presentation" in the Notes to our Consolidated Financial Statements for further discussion.
As a result of our failure to maintain certain continued listing standards on the NYSE, our common shares were suspended from trading on the NYSE on December 22, 2017. Our common shares are traded over-the-counter under the symbol "XCOOQ".
Termination of South Texas Divestiture
On April 7, 2017, we entered into a purchase and sale agreement with a subsidiary of Venado Oil and Gas, LLC ("Venado") to divest our oil and natural gas properties and surface acreage in South Texas for a total purchase price of $300.0 million that was subject to closing conditions and adjustments based on an effective date of January 1, 2017.
Pursuant to the terms of the agreement, the closing of the transaction was originally anticipated to occur on June 1, 2017 (the “Original Scheduled Closing Date”), unless certain conditions had not been satisfied or waived on or prior to the Original Scheduled Closing Date. The purchase agreement included conditions to the closing, including seller's representation and warranty regarding all material contracts being in full force and effect be true as of the Original Scheduled Closing Date. As described in "Note 3. Acquisitions, divestitures and other significant events" in the Notes to our Consolidated Financial Statements, the closing conditions were not anticipated to be satisfied or waived by the Original Scheduled Closing Date due to the alleged termination of a long-term natural gas sales contract by CEML. We are currently in litigation with CEML as a result of their alleged termination of the contract, see further discussion in "Item 3. Legal proceedings". Therefore, we entered into an amendment to extend the Original Scheduled Closing Date to August 15, 2017.
The amendment, among other things, provided that the satisfaction of the closing conditions would be deemed satisfied by the reinstatement of the natural gas sales contract or by entry into a new gathering agreement. Because all closing conditions had not been satisfied or waived by August 15, 2017, EXCO and Venado mutually agreed to terminate the purchase and sale agreement, effective as of August 15, 2017. Following the termination, the purchase and sale agreement was void and of no further effect.
Critical accounting estimates
The process of preparing financial statements in conformity with GAAP requires us to make estimates and assumptions to determine reported amounts of certain assets, liabilities, revenues, expenses and related disclosures. We have identified the most critical accounting policies used in the preparation of our Consolidated Financial Statements. We determined the critical policies by considering accounting policies that involve the most complex or subjective decisions or assessments. We identified our most critical accounting policies to be those related to our estimates of Proved Reserves, derivative financial instruments,
business combinations, equity-based compensation, oil and natural gas properties, goodwill, revenue recognition, asset retirement obligations and income taxes.
The following is a discussion of our most critical accounting estimates, judgments and uncertainties that are inherent in our application of GAAP. For a more complete discussion of our accounting policies see "Note 2. Summary of significant accounting policies" in the Notes to our Consolidated Financial Statements.
Estimates of Proved Reserves
The Proved Reserves data included in this Annual Report on Form 10-K was prepared in accordance with SEC guidelines. The accuracy of a reserve estimate is a function of:
the quality and quantity of available data;
the interpretation of this data;
the accuracy of various mandated economic assumptions; and
the technical qualifications, experience and judgment of the persons preparing the estimates.
Because these estimates depend on many assumptions, all of which may substantially differ from actual results, reserve estimates may be different from the quantities of oil and natural gas that are ultimately recovered. In addition, results of drilling, testing and production after the date of an estimate may justify material revisions to the estimate. The assumptions used for our shale properties including reservoir characteristics and performance are subject to further refinement as additional production history is accumulated.
You should not assume that the present value of future net cash flows represents the current market value of our estimated Proved Reserves. In accordance with the SEC's requirements, we based the estimated discounted future net cash flows from Proved Reserves according to the requirements in the SEC's Release No. 33-8995 Modernization of Oil and Gas Reporting. Actual future prices and costs may be materially higher or lower than the prices and costs used in the preparation of the estimate. Further, the mandated discount rate of 10% may not be an accurate assumption of future interest rates or cost of capital.
Proved Reserve quantities directly and materially impact depletion expense. If the Proved Reserves decline, then the rate at which we record depletion expense increases. A decline in the estimate of Proved Reserves may result from lower market prices, making it uneconomical to drill or produce from higher cost fields. In addition, a decline in Proved Reserves may impact the outcome of our assessment of our oil and natural gas properties and require an impairment of the carrying value of our oil and natural gas properties.
Business combinations
When we acquire assets that qualify as a business, we use FASB ASC 805-10, Business Combinations ("ASC 805-10") to record our acquisitions of oil and natural gas properties or entities. ASC 805-10 requires that acquired assets, identifiable intangible assets and liabilities be recorded at their fair value, with any excess purchase price being recognized as goodwill. Application of ASC 805-10 requires significant estimates to be made by management using information available at the time of acquisition. Since these estimates require the use of significant judgment, actual results could vary as the estimates are subject to changes as new information becomes available.
Derivative financial instruments
We usehave historically used derivative financial instruments to manage price fluctuations, protect our investments and achieve a more predictable cash flow. The estimates of the fair values of our derivative financial instruments require judgment. The fair value of our derivative financial instruments is determined by quoted futures prices, utilization of the credit-adjusted risk-free rate curves and the implied rates of volatility. We do not designate our derivative financial instruments as hedging instruments for financial accounting purposes and, as a result, we recognize the change in the respective instruments’ fair value
in earnings. When prices for oil and natural gas are volatile, a significant portion of the effect of our derivative financial instrument management activities consists of non-cash income or expense due to changes in the fair value of our derivative financial instruments. Our ability to enter into commodity derivative contracts is limited during the Chapter 11 Cases, see further discussion in "Note 4. Derivative financial instruments" in the Notes to our Consolidated Financial Statements.
On March 15, 2017, we issued warrants to investors in connection with the issuance of the 1.5 Lien Notes and 1.75 Lien Term Loans in March 2017. The 2017 Warrants are accounted for as derivatives in accordance with FASB ASC 815, Derivatives and Hedging, ("ASC 815"), and required to be classified as liabilities due to the types of anti-dilution adjustments.
We record As a pre-petition obligation that may be impacted by the Chapter 11 process, we have classified the 2017 Warrants as non-current liabilities at fair value, with“Liabilities subject to compromise" on the increase or decrease in fair value being recognized in earnings.Consolidated Balance Sheet as of December 31, 2018. The liability attributable to our common share warrantsthe 2017 Warrants as of the issuance date and the end of each reporting period was measured using the Black-Scholes model based on inputs including our share price, volatility, expected remaining life and the risk-free rate of return. The increase or decrease in fair value of the 2017 Warrants is recognized in earnings. The implied rates of volatility were determined based on historical prices of our common shares over a period consistent with the expected remaining life. The 2017 Warrants will be measured at fair value on a recurring basis until the date of exercise, cancellation or expiration.
Equity-based compensation
Our equity-based compensation includes share-based compensation to employees which we account for in accordance with FASB ASC 718, Compensation-Stock Compensation ("ASC 718") and. Our equity-based compensation for 2017 includes compensation expense for warrants issued to ESASEnergy Strategic Advisory Services LLC (“ESAS”), a subsidiary of Bluescape, which we accountaccounted for in accordance with FASB ASC 505-50, Equity-Based Payments to Non-Employees ("ASC 505-50"). The warrants were forfeited and canceled pursuant to an agreement with ESAS entered into on November 9, 2017.
ASC 718 requires share-based compensation to employees to be recognized in our Consolidated Statements of Operations based on their estimated fair values. Estimating the grant date fair value of our share-based compensation requires management to make assumptions and to apply judgment in estimating the fair value. These assumptions and judgments include estimating the volatility of our share price, dividend yields, expected term, forfeiture rates and other company-specific inputs. ASC 505-50 requires the warrants to be re-measured each interim reporting period until the completion of the services under the agreement and an adjustment is recorded in our Consolidated Statements of Operations. The fair value of the warrants iswas dependent on factors such as our share price, historical volatility, risk-free rate and performance relative to our peer group.
Changes in these assumptions could materially affect the estimate of the fair value. If actual results are not consistent with the assumptions used, the equity-based compensation expense reported in our financial statements may not be representative of the actual economic impact of the equity-based compensation.
Oil and natural gas properties
The accounting for, and disclosure of, oil and natural gas producing activities require that we choose between two GAAP alternatives: the full cost method or the successful efforts method. We use the full cost method of accounting, which involves capitalizing all acquisition, exploration, exploitation and development costs of oil and natural gas properties. Once we incur costs, they are recorded in the depletable pool of proved properties or in unproved properties, collectively, the full cost pool. Our unproved property costs are not subject to depletion. We review our unproved oil and natural gas property costs on a quarterly basis to assess for impairment or the need to transfer unproved costs to proved properties as a result of extension or discoveries from drilling operations or determination that no Proved Reserves are attributable to such costs. In determining whether such costs should be impaired or transferred, we evaluate lease expiration dates, recent drilling results, future development plans and current market values. Our undeveloped properties are predominantly held-by-production, which reduces the risk of impairment as a result of lease expirations.
We capitalize interest on the costs related to the acquisition of undeveloped acreage in accordance with FASB ASC 835-20, Capitalization of Interest. When the unproved property costs are moved to proved developed and undeveloped oil and natural gas properties, or the properties are sold, we cease capitalizing interest related to these properties. We capitalize the portion of general and administrative costs, including share-based compensation, which is attributable to our acquisition, exploration, exploitation and development activities.
We calculate depletion using the unit-of-production method. Under this method, the sum of the full cost pool, excluding the book value of unproved properties, and all estimated future development costs less estimated salvage value are divided by the total estimated quantities of Proved Reserves. This rate is applied to our total production for the quarter, and the appropriate expense is recorded.
Sales, dispositions and other oil and natural gas property retirements are accounted for as adjustments to the full cost pool, with no recognition of gain or loss, unless the disposition would significantly alter the amortization rate and/or the relationship between capitalized costs and Proved Reserves.
Pursuant to Rule 4-10(c)(4) of Regulation S-X, at the end of each quarterly period, companies that use the full cost method of accounting for their oil and natural gas properties must compute a limitation on capitalized costs ("ceiling test"). The ceiling test involves comparing the net book value of the full cost pool, after taxes, to the full cost ceiling limitation defined below. In the event the full cost ceiling limitation is less than the full cost pool, we are required to record a ceiling test impairment of our oil and natural gas properties. The full cost ceiling limitation is computed as the sum of the present value of
estimated future net revenues from our Proved Reserves by applying the average price as prescribed by the SEC Release No. 33-8995, less estimated future expenditures (based on current costs) to develop and produce the Proved Reserves, discounted at 10%, plus the cost of properties not being amortized and the lower of cost or estimated fair value of unproved properties included in the costs being amortized, net of income tax effects.
The ceiling test is computed using the simple average spot price for the trailing 12 month period using the first day of each month. Each of the reference prices for oil and natural gas are further adjusted for quality factors and regional differentials to derive estimated future net revenues. Under full cost accounting rules, any ceiling test impairments of oil and natural gas properties may not be reversed in subsequent periods. Since we do not designate our derivative financial instruments as hedging instruments, we are not allowed to use the impacts of the derivative financial instruments in our ceiling test computations.
The evaluation of impairment of our oil and natural gas properties includes estimates of Proved Reserves. There are numerous uncertainties inherent in estimating quantities of Proved Reserves, in projecting the future rates of production and in the timing of development activities. The accuracy of any reserve estimate is a function of the quality of available data and of engineering and geological interpretation and judgment. Results of drilling, testing and production subsequent to the date of the estimate may justify revisions of such estimate. Accordingly, reserve estimates often differ from the quantities of oil and natural gas that are ultimately recovered.
Goodwill
In accordance with FASB ASC 350-20, Intangibles-Goodwill and Other, goodwill isshall not be amortized, but is tested for impairment on an annual basis as of December 31,at least annually, or more frequently as impairment indicators arise. Impairment tests involve the use of estimates related to the fair market value of the business operations with which goodwill is associated. Losses, if any, resulting from impairment tests will be reflected in operating income or loss in the Consolidated Statements of Operations.
We apply a two-part, equally weighted approach in determining the fair valueAs of our business as part of the goodwill impairment test. We perform an income approach, which usesDecember 31, 2018, we utilized a discounted cash flow model to value our business and corroborated the results of the valuation model through a comparison to our enterprise value that is calculated as the combined market approach, in whichcapitalization of our equity plus the fair value is determined using trading metrics and transaction multiples of peer companies.our debt. The discounted cash flow model used in the income approach requires us to make various judgmental assumptions about future production, revenues, operating and capital expenditures, discount rates and other inputs which are based on our budgets, business plans, economic projections and anticipated future cash flows. The market approach requires us to make assumptions regarding the identifications of comparable companies and transactions as well as the future performance of ourselves and the comparable companies. As part of the determination of the fair value of our reporting unit, we corroborate the results of the valuation model through a comparison to our enterprise value that is calculated as the combined market capitalization of our equity plus the fair value of our debt. Due to the changing market conditions, it is possible that inputs and assumptions used in the valuation may change in the future, which could materially affect the estimate of the fair value of our business.
Revenue recognition and natural gas imbalances
We use the sales method of accounting for oil and natural gas revenues. We record sales revenue based on an estimate of the volumes delivered at estimated prices as determined by the applicable sales agreement. We estimate our sales volumes primarily on company-measured volume readings. We then adjust our oil and natural gas sales in subsequent periods based on the data received from our purchasers that reflects actual volumes and prices received. Historically, these differences have been immaterial. Natural gas imbalances at December 31, 2017, 20162018 were 0.7 Bcf and 2015were reflected as a reduction to our Proved Reserves. Natural gas imbalances at December 31, 2017 were not significant.
Asset retirement obligations
We follow FASB ASC 410-20, Asset Retirement Obligations ("ASC 410-20") to account for legal obligations associated with the retirement of long-lived assets. ASC 410-20 requires these obligations be recognized at their estimated fair value at the time that the obligations are incurred. The costs of plugging and abandoning oil and natural gas properties fluctuate with costs associated with the industry. Our calculation of asset retirement obligations uses numerous assumptions and judgments,
including the ultimate settlement amounts, inflation factors, credit adjusted discount rates, timing of settlement, and changes in the legal, regulatory, environmental and political environments. We periodically assess the estimated costs of our asset retirement obligations and adjust the liability according to these estimates.
Income taxes
Income taxes are accounted for in accordance with FASB ASC 740, Income Taxes. Deferred taxes are recorded to reflect
the tax benefits and consequences of future years' differences between the tax basis of assets and liabilities and their financial reporting basis. We must make certain estimates related to the reversal of temporary differences, and actual results could vary from those estimates. We assess, using all available positive and negative evidence, the likelihood that the deferred tax assets will be recovered from future taxable income. Examples of positive and negative evidence include historical taxable income or losses, forecasted income or losses, the estimated timing of the reversals of existing temporary differences as well as prudent and feasible tax planning strategies. We record a valuation allowance to reduce deferred tax assets if it is more likely than not that some portion or all of the deferred tax assets will not be realized. As of December 31, 2017,2018, we continued to have a full valuation allowance against our net deferred tax assets. A significant amount of judgment is also required in determining the amount of unrecognized tax benefit to record for uncertain tax positions. We consider the amounts and probabilities of the outcomes that could be realized upon ultimate settlement of an uncertain tax position using the facts, circumstances and information available at the reporting date to establish the appropriate amount of unrecognized tax benefit. We currently do not have any uncertain tax positions recorded as of December 31, 2017.2018.
Our results of operations
A summary of key financial data for the years ended December 31, 2017, 20162018 and 20152017 related to our results of operations is presented below:
| | | | | Year Ended December 31, | | Year to year change | | Year Ended December 31, | | Year to year Change |
| (dollars in thousands, except per unit prices) | | 2017 | | 2016 | | 2015 | | 2017-2016 | | 2016-2015 | | 2018 | | 2017 | |
| Production: | | | | | | | | | | | | | | | | |
| Oil (Mbbls) | | 1,158 |
| | 1,769 |
| | 2,342 |
| | (611 | ) | | (573 | ) | | 1,357 |
| | 1,158 |
| | 199 |
|
| Natural gas (Mmcf) | | 80,136 |
| | 93,829 |
| | 109,926 |
| | (13,693 | ) | | (16,097 | ) | | 98,779 |
| | 80,136 |
| | 18,643 |
|
| Total production (Mmcfe) (1) | | 87,084 |
| | 104,443 |
| | 123,978 |
| | (17,359 | ) | | (19,535 | ) | | 106,921 |
| | 87,084 |
| | 19,837 |
|
| Average daily production (Mmcfe) | | 239 |
| | 285 |
| | 340 |
| | (46 | ) | | (55 | ) | | 293 |
| | 239 |
| | 54 |
|
| Revenues before derivative financial instrument activities: | | | |
| Revenues before commodity derivative financial instrument activities: | | Revenues before commodity derivative financial instrument activities: |
| Oil | | $ | 57,693 |
| | $ | 67,317 |
| | $ | 102,787 |
| | $ | (9,624 | ) | | $ | (35,470 | ) | | $ | 90,614 |
| | $ | 57,693 |
| | $ | 32,921 |
|
| Natural gas | | 201,137 |
| | 181,332 |
| | 226,471 |
| | 19,805 |
| | (45,139 | ) | | 281,977 |
| | 201,137 |
| | 80,840 |
|
| Total oil and natural gas revenues | | 258,830 |
| | 248,649 |
| | 329,258 |
| | 10,181 |
| | (80,609 | ) | | 372,591 |
| | 258,830 |
| | 113,761 |
|
| Purchased natural gas and marketing | | 24,816 |
| | 22,352 |
| | 26,442 |
| | 2,464 |
| | (4,090 | ) | | 21,435 |
| | 24,816 |
| | (3,381 | ) |
| Total revenues | | $ | 283,646 |
| | $ | 271,001 |
| | $ | 355,700 |
| | $ | 12,645 |
| | $ | (84,699 | ) | | $ | 394,026 |
| | $ | 283,646 |
| | $ | 110,380 |
|
| Oil and natural gas derivative financial instruments: | | | |
| Commodity derivative financial instruments: | | Commodity derivative financial instruments: |
| Gain (loss) on derivative financial instruments - commodity derivatives | | $ | 24,732 |
| | $ | (34,137 | ) | | $ | 75,869 |
| | $ | 58,869 |
| | $ | (110,006 | ) | | $ | (615 | ) | | $ | 24,732 |
| | $ | (25,347 | ) |
| Average sales price (before cash settlements of derivative financial instruments): | | | |
| Average sales price (before cash settlements of commodity derivative financial instruments): | | Average sales price (before cash settlements of commodity derivative financial instruments): |
| Oil (per Bbl) | | $ | 49.82 |
| | $ | 38.05 |
| | $ | 43.89 |
| | $ | 11.77 |
| | $ | (5.84 | ) | | $ | 66.78 |
| | $ | 49.82 |
| | $ | 16.96 |
|
| Natural gas (per Mcf) | | 2.51 |
| | 1.93 |
| | 2.06 |
| | 0.58 |
| | (0.13 | ) | | 2.85 |
| | 2.51 |
| | 0.34 |
|
| Natural gas equivalent (per Mcfe) | | 2.97 |
| | 2.38 |
| | 2.66 |
| | 0.59 |
| | (0.28 | ) | | 3.48 |
| | 2.97 |
| | 0.51 |
|
| Costs and expenses: | | | | | | | | | | | | | | | | |
| Oil and natural gas operating costs | | $ | 35,011 |
| | $ | 34,609 |
| | $ | 53,903 |
| | $ | 402 |
| | $ | (19,294 | ) | | $ | 42,149 |
| | $ | 35,011 |
| | $ | 7,138 |
|
| Production and ad valorem taxes | | 13,131 |
| | 15,380 |
| | 22,630 |
| | (2,249 | ) | | (7,250 | ) | | 15,260 |
| | 13,131 |
| | 2,129 |
|
| Gathering and transportation | | 111,427 |
| | 106,460 |
| | 99,321 |
| | 4,967 |
| | 7,139 |
| | 76,175 |
| | 111,427 |
| | (35,252 | ) |
| Purchased natural gas | | 23,400 |
| | 23,557 |
| | 27,369 |
| | (157 | ) | | (3,812 | ) | | 16,387 |
| | 23,400 |
| | (7,013 | ) |
| Depletion | | 50,066 |
| | 74,482 |
| | 213,302 |
| | (24,416 | ) | | (138,820 | ) | | 78,981 |
| | 50,066 |
| | 28,915 |
|
| Depreciation and amortization | | 974 |
| | 1,500 |
| | 2,124 |
| | (526 | ) | | (624 | ) | | 1,308 |
| | 974 |
| | 334 |
|
General and administrative | | 30,165 |
| | 48,700 |
| | 58,818 |
| | (18,535 | ) | | (10,118 | ) | | 27,850 |
| | 30,165 |
| | (2,315 | ) |
| Interest expense, net | | 108,175 |
| | 70,438 |
| | 106,082 |
| | 37,737 |
| | (35,644 | ) | | 33,917 |
| | 108,175 |
| | (74,258 | ) |
| Costs and expenses (per Mcfe): | | | | | | | | | | | | | | | | |
| Oil and natural gas operating costs | | $ | 0.40 |
| | $ | 0.33 |
| | $ | 0.43 |
| | $ | 0.07 |
| | $ | (0.10 | ) | | $ | 0.39 |
| | $ | 0.40 |
| | $ | (0.01 | ) |
| Production and ad valorem taxes | | 0.15 |
| | 0.15 |
| | 0.18 |
| | — |
| | (0.03 | ) | | 0.14 |
| | 0.15 |
| | (0.01 | ) |
| Gathering and transportation | | 1.28 |
| | 1.02 |
| | 0.80 |
| | 0.26 |
| | 0.22 |
| | 0.71 |
| | 1.28 |
| | (0.57 | ) |
| Depletion | | 0.57 |
| | 0.71 |
| | 1.72 |
| | (0.14 | ) | | (1.01 | ) | | 0.74 |
| | 0.57 |
| | 0.17 |
|
| Depreciation and amortization | | 0.01 |
| | 0.01 |
| | 0.02 |
| | — |
| | (0.01 | ) | | 0.01 |
| | 0.01 |
| | — |
|
Net income (loss) | | $ | 24,362 |
| | $ | (225,258 | ) | | $ | (1,192,381 | ) | | $ | 249,620 |
| | $ | 967,123 |
| | $ | (182,697 | ) | | $ | 24,362 |
| | $ | (207,059 | ) |
| |
| (1) | Mmcfe is calculated by converting one barrel of oil into six Mcf of natural gas. |
| |
| (2) | Equity-based compensation included in general and administrative expense was expense of $2.1 million and income of $11.4 million for the years ended December 31, 2018 and 2017, respectively. |
| |
| (3) | Net loss for the for the year ended December 31, 2018 includes the effects of the gain recognized from the Appalachia JV Settlement of $119.2 million and net costs associated with the Chapter 11 Cases of $409.3 million. Net income for the year ended December 31, 2017 includes the effect of the $159.2 million gain recognized due to the change in fair value of our common share warrants resulting from a decrease in our share price during the period. |
The following is a discussion of our financial condition and results of operations for the years ended December 31, 2017, 20162018 and 2015.
2017. The comparability of our results of operations for 2017, 2016the years ended December 31, 2018 and 20152017 was affected by:
changes in general and administrative expenses as a result of legal and professional fees incurred in connection with the restructuring process;
rejection of certain executory contracts as part of the Chapter 11 Cases related to the sale, marketing and transportation of natural gas in the North Louisiana region, and the office lease for our corporate headquarters;
impact of the Chapter 11 Cases on our indebtedness, including the adjustments to the carrying value as well as the accrual of interest during the pendency of the bankruptcy proceedings;
gains from the settlement of litigation with our Appalachian joint venture partner during 2018, as well as increased production, revenues and operating expenses attributable to the acquired interests;
fluctuations in oil and natural gas prices, which impact our oil and natural gas reserves, revenues, cash flows and net income or loss;
impairments of our oil and natural gas properties during 2016 and 2015;
asset impairments and other non-recurring costs, including the acceleration of costs related to a firm transportation agreement in 2017 and the settlement of the litigation with a joint venture partner in the Eagle Ford shale during 2016;
mark-to-market gains and losses from our derivative financial instruments, including significant gains on the 2017 Warrants due to a decrease in EXCO'sEXCO’s share price during 2017;price;
changes in Proved Reservesproved reserves and production volumes and their impact on depletion;
the sale of our shallow conventional assets in Appalachia and the transfer of interests in connection with the settlement of the litigation with a joint venture partner in the Eagle Ford shale during 2016;
the impact of declining natural gas production volumes from our reduced drillingdevelopment activities in certain shale formations;
significant changes in our capital structure as a result of transactions in 2017 and 2016, including the issuance of the 1.5 Lien Notes and Second Lien Term Loan Exchange on March 15, 2017 and repurchases of 2018 Notes and 2022 Notes during 2016 and 2015;
gain on restructuring of debt and accounting treatment for the debt exchange transactions during the fourth quarter of 2015;
changes in general and administrative expenses as a result of legal and professional fees incurred in connection with the restructuring of our balance sheet; and
the reductions in our workforce that occurred during 2016 and 2015.
General
The availability of a ready market and the prices for oil and natural gas are dependent upon a number of factors that are beyond our control. These factors include, among other things:
supply and demand for oil and natural gas and expectations regarding supply and demand;
the level of domestic and international production;
the availability of imported oil and natural gas;
federal regulations applicable to the export of, and construction of export facilities for natural gas;
political and economic conditions and events in foreign oil and natural gas producing nations, including embargoes, continued hostilities in the Middle East and other sustained military campaigns, and acts of terrorism or sabotage;
the ability of members of the Organization of Petroleum Exporting Countries to agree to and maintain oil price and production controls;
the cost and availability of transportation and pipeline systems with adequate capacity;
the cost and availability of other competitive fuels;
fluctuating and seasonal demand for oil, natural gas and refined products;
concerns about global warming or other conservation initiatives and the extent of governmental price controls and regulation of production;
regional price differentials and quality differentials of oil and natural gas;
the availability of refining capacity;
technological advances affecting oil and natural gas production and consumption;
weather conditions and natural disasters;
foreign and domestic government relations; and
overall domestic and global economic conditions.
Accordingly, in light of the many uncertainties affecting the supply and demand for oil, natural gas and refined petroleum products, we cannot accurately predict the prices or marketability of oil and natural gas from any producing well in which we have or may acquire an interest.
Marketing arrangements
On August 19, 2016, we formed Raider through an internal merger to provide marketing services to EXCO and pursue independent business opportunities. Raider is a wholly owned subsidiary of EXCO and is the contractual counterparty by operation of Texas law to all of EXCO's gathering, transportation and marketing contracts in Texas and Louisiana. Raider purchases and resells natural gas from third-party producers as well as oil and natural gas from operated wells in Texas and Louisiana, and charges a fee for marketing services to certain working interest owners in the related wells.
We produce oil and natural gas. We do not refine or process the oil or natural gas we produce. We sell the majority of the oil we produce under contracts using market sensitive pricing. The majority of our oil contracts are based on NYMEX pricing, which is typically calculated as the average of the daily closing prices of oil to be delivered one month in the future. We also
sell a portion of our oil at F.O.B. field prices posted by the principal purchaser of oil where our producing properties are located. Our sales contracts are of a type common within the industry, and we usually negotiate a separate contract for each area. Generally, we sell our oil to purchasers and refiners near the areas of our producing properties.
We sell the majority of our natural gas under individually negotiated gas purchase contracts using market sensitive pricing. Our sales contracts vary in length from spot market sales of a single day to term agreements that may extend for a year or more. Our natural gas customers primarily include natural gas marketing companies. The natural gas purchase contracts define the terms and conditions unique to each of these sales. The price received for natural gas sold on the spot market varies daily, reflecting changing market conditions.
We may be unable to market all of the oil or natural gas we produce. If our oil and natural gas can be marketed, we may be unable to negotiate favorable pricing and contractual terms. Changes in oil or natural gas prices may significantly affect our revenues, cash flows, the value of our oil and natural gas properties and the estimates of recoverable oil and natural gas reserves. Further, significant declines in the prices of oil or natural gas may have a material adverse effect on our business and on our financial condition.
We engage in oil and natural gas production activities in geographic regions where, from time to time, the supply of oil or natural gas available for delivery exceeds the demand. If this occurs, companies purchasing oil or natural gas in these areas may reduce the amount of oil or natural gas that they purchase from us. If we cannot locate other buyers for our production or for any of our oil or natural gas reserves, we may shut in our oil or natural gas wells for certain periods of time. Furthermore, we may shut in our oil and natural gas wells if regional market prices decrease to a level that is uneconomical to produce. If this occurs, we may incur additional payment obligations under our oil and natural gas leases and, under certain circumstances, the oil and natural gas leases might be terminated. Economic conditions, particularly depressed oil and natural gas prices, may negatively impact the liquidity and creditworthiness of our purchasers and may expose us to risk with respect to the ability to collect payments for the oil and natural gas we deliver.production.
Oil and natural gas production, revenues and prices
The following table presents our production, revenue and average sales prices for the years ended December 31, 20172018 and 2016:
2017:
| | | | | Year Ended December 31, | | | | | | | | Year Ended December 31, | | | | | | |
| | | 2017 | | 2016 | | Year to year change | | 2018 | | 2017 | | Year to year change |
| (dollars in thousands, except per unit rate) | | Production (Mmcfe) | | Revenue | | $/Mcfe | | Production (Mmcfe) | | Revenue | | $/Mcfe | | Production (Mmcfe) | | Revenue | | $/Mcfe | | Production (Mmcfe) | | Revenue | | $/Mcfe | | Production (Mmcfe) | | Revenue | | $/Mcfe | | Production (Mmcfe) | | Revenue | | $/Mcfe |
| Producing region: | | | | | | | | | | | | | | | | | | | | | | | | | | | | | | | | | | | | |
| North Louisiana | | 53,373 |
| | $ | 138,653 |
| | $ | 2.60 |
| | 55,314 |
| | $ | 110,755 |
| | $ | 2.00 |
| | (1,941 | ) | | $ | 27,898 |
| | $ | 0.60 |
| | 70,104 |
| | $ | 206,396 |
| | $ | 2.94 |
| | 53,373 |
| | $ | 138,653 |
| | $ | 2.60 |
| | 16,731 |
| | $ | 67,743 |
| | $ | 0.34 |
|
| East Texas | | 16,106 |
| | 45,026 |
| | 2.80 |
| | 24,454 |
| | 54,944 |
| | 2.25 |
| | (8,348 | ) | | (9,918 | ) | | 0.55 |
| | 10,828 |
| | 31,070 |
| | 2.87 |
| | 16,106 |
| | 45,026 |
| | 2.80 |
| | (5,278 | ) | | (13,956 | ) | | 0.07 |
|
| South Texas | | 7,742 |
| | 54,084 |
| | 6.99 |
| | 11,471 |
| | 62,037 |
| | 5.41 |
| | (3,729 | ) | | (7,953 | ) | | 1.58 |
| | 8,160 |
| | 90,308 |
| | 11.07 |
| | 7,742 |
| | 54,084 |
| | 6.99 |
| | 418 |
| | 36,224 |
| | 4.08 |
|
| Appalachia and other | | 9,863 |
| | 21,067 |
| | 2.14 |
| | 13,204 |
| | 20,913 |
| | 1.58 |
| | (3,341 | ) | | 154 |
| | 0.56 |
| | 17,829 |
| | 44,817 |
| | 2.51 |
| | 9,863 |
| | 21,067 |
| | 2.14 |
| | 7,966 |
| | 23,750 |
| | 0.37 |
|
| Total | | 87,084 |
| | $ | 258,830 |
| | $ | 2.97 |
| | 104,443 |
| | $ | 248,649 |
| | $ | 2.38 |
| | (17,359 | ) | | $ | 10,181 |
| | $ | 0.59 |
| | 106,921 |
| | $ | 372,591 |
| | $ | 3.48 |
| | 87,084 |
| | $ | 258,830 |
| | $ | 2.97 |
| | 19,837 |
| | $ | 113,761 |
| | $ | 0.51 |
|
Production for the year ended December 31, 2017 decreased2018 increased by 17.419.8 Bcfe, or 17%23%, as compared with 2016. The decreaseto the same period in production was primarily due to limited development activities in recent years as a result of the depressed oil and natural gas price environment and liquidity constraints.2017. Significant components of the changes in production were a result of:
decreasedIncreased production of 1.916.7 Bcfe for the year ended December 31, 20172018 in the North Louisiana region, primarily due to production declines partially offset by additional volumes from the11 gross (6.7 net) operated wells turned-to-sales in 2017. We expect production in the North Louisiana region to increase due to additionalfirst quarter of 2018 and 8 gross (4.9 net) operated wells turned-to-sales duringin the fourth quarter of 2017 and first quarter of 2018.2017.
decreasedDecreased production of 8.35.3 Bcfe for the year ended December 31, 20172018 in the East Texas region, primarily due to natural production declines as we have not turned an operated well to sales in the region since the first quarter of 2016.
decreasedIncreased production of 3.70.4 Bcfe for the year ended December 31, 20172018 in the South Texas region primarily due to production declines as we have not turned anregion. We turned-to-sales 9 gross (8.6 net) operated well to saleswells in the region since late 2015.first half of 2018 and an additional 7 gross (4.3 net) wells in the second half of 2018. We expect continued increases in production in the South Texas region to increase2019 due to additional wells turned-to-sales duringin mid to late 2019. Prior to the first halfquarter of 2018.2018, the most recent operated well turned-to-sales in this region was in the fourth quarter of 2015.
decreasedIncreased production of 3.38.0 Bcfe for the year ended December 31, 20172018 in the Appalachia region, primarily due to the saleacquisition of ouradditional interests in shallow conventional assetsthe Appalachia JV Settlement and 1 gross (0.9 net) operated well turned-to-sales in 2016 and production declines, partially offset by lower
shut-in volumes. We have not had an active drilling program in this region since 2013. Productionthe first quarter of 2018. The last well that turned to sales in the Appalachia region prior to the first quarter of 2018 was impacted by significant shut-in volumes during the fourth quarters of 2017 and 2016 due to low regional natural gas prices.in late 2015.
Oil and natural gas revenues for the year ended December 31, 20172018 increased by $10.2$113.8 million, or 4%44%, as compared with 2016.to the same period in 2017. The increase in revenues was primarily the result of increasesan increase in commodity prices offset by oil and natural gas production declines.prices and an increase in production. Our average natural gas sales price increased 30%14% to $2.85 per Mcf for the year ended December 31, 2018 from $2.51 per Mcf for the year ended December 31, 2017, from $1.93 per Mcf for the year ended December 31, 2016, primarily due to higher market prices.improved natural gas price differentials as a
result of the rejection of certain executory contracts for the sale and marketing of natural gas in the North Louisiana region. Our average sales price of oil per Bbl increased 31%34% to $66.78 per Bbl for the year ended December 31, 2018 from $49.82 per Bbl for the year ended December 31, 2017, from $38.05 per Bbl for the year ended December 31, 2016, primarily due to higher market prices.
The following table and discussion presents our production, revenue and average sales prices for the years ended December 31, 2016 and 2015:
|
| | | | | | | | | | | | | | | | | | | | | | | | | | | | | | | | | |
| | | Year Ended December 31, | | | | | | |
| | | 2016 | | 2015 | | Year to year change |
| (dollars in thousands, except per unit rate) | | Production (Mmcfe) | | Revenue | | $/Mcfe | | Production (Mmcfe) | | Revenue | | $/Mcfe | | Production (Mmcfe) | | Revenue | | $/Mcfe |
| Producing region: | | | | | | | | | | | | | | | | | | |
| North Louisiana | | 55,314 |
| | $ | 110,755 |
| | $ | 2.00 |
| | 73,896 |
| | $ | 160,612 |
| | $ | 2.17 |
| | (18,582 | ) | | $ | (49,857 | ) | | $ | (0.17 | ) |
| East Texas | | 24,454 |
| | 54,944 |
| | 2.25 |
| | 18,275 |
| | 45,656 |
| | 2.50 |
| | 6,179 |
| | 9,288 |
| | (0.25 | ) |
| South Texas | | 11,471 |
| | 62,037 |
| | 5.41 |
| | 15,220 |
| | 96,008 |
| | 6.31 |
| | (3,749 | ) | | (33,971 | ) | | (0.90 | ) |
| Appalachia and other | | 13,204 |
| | 20,913 |
| | 1.58 |
| | 16,587 |
| | 26,982 |
| | 1.63 |
| | (3,383 | ) | | (6,069 | ) | | (0.05 | ) |
| Total | | 104,443 |
| | $ | 248,649 |
| | $ | 2.38 |
| | 123,978 |
| | $ | 329,258 |
| | $ | 2.66 |
| | (19,535 | ) | | $ | (80,609 | ) | | $ | (0.28 | ) |
Production for the year ended December 31, 2016 decreased by 19.5 Bcfe, or 16%, as compared with 2015. The decrease in our production was primarily attributable to a reduction in our capital expenditures of 72% compared to prior year in response to the lower oil and natural gas price environment. Significant components of the changes in production included:
decreased production of 18.6 Bcfe for the year ended December 31, 2016 in the North Louisiana region primarily due to production declines partially offset by additional volumes from the wells turned-to-sales during 2016.
increased production of 6.2 Bcfe for the year ended December 31, 2016 in the East Texas region primarily due to additional volumes from wells turned-to-sales during late 2015 and early 2016.
decreased production of 3.7 Bcfe for the year ended December 31, 2016 in the South Texas region primarily due to production declines and the transfer of a portion of our interests in certain producing wells to a joint venture partner. The transfer of our interests was the result of the litigation settlement with a joint venture partner that is described in more detail in "Note 3. Acquisitions, divestitures and other significant events" in the Notes to our Consolidated Financial Statements.
decreased production of 3.4 Bcfe for the year ended December 31, 2016 in the Appalachia region primarily due to the sale of our interests in shallow conventional assets located in Pennsylvania and West Virginia in 2016 and production declines.
Oil and natural gas revenues for the year ended December 31, 2016 decreased by $80.6 million, or 24%, as compared with 2015. The decrease in revenues was primarily the result of decreases in oil and natural gas production and prices. Our average natural gas sales price decreased 6% to $1.93 per Mcf for the year ended December 31, 2016 from $2.06 per Mcf for the year ended December 31, 2015, primarily due to lower market prices. Our average sales price of oil per Bbl decreased 13% to $38.05 per Bbl for the year ended December 31, 2016 from $43.89 per Bbl for the year ended December 31, 2015, primarily due to lower market prices.
Purchased natural gas and marketing revenues
Purchased natural gas and marketing revenues include revenues we receive as a result of selling natural gas purchased from third parties and marketing fees we receive from third parties. Purchased natural gas and marketing revenues for the year ended December 31, 2017 increased2018 decreased by $2.5$3.4 million, or 11%14%, as compared with 2016,to the same period in 2017. The decrease for the year ended December 31, 2018 was primarily due to higher natural gas prices andlower marketing fees charged to third parties beginning in September 2016, partially offset byand lower volumes purchased. Purchased natural gas and marketing revenues for the year ended December 31, 2016 decreased by $4.1 million, or 15%, as
compared to 2015, primarily due to lower volumes sold partially offset byThe decrease in marketing fees charged to third parties beginningwas primarily due to an increase in September 2016.our average working interests in production from operated wells compared to the same period in prior year.
Oil and natural gas operating costs
The following tables and discussion present our oil and natural gas operating costs for the years ended December 31, 2017, 2016,2018 and 2015.2017:
| | | | | Year Ended December 31, | | | | | | | | Year Ended December 31, | | | | | | |
| | | 2017 | | 2016 | | Year to year change | | 2018 | | 2017 | | Year to year change |
| (in thousands) | | Lease operating expenses | | Workovers and other | | Total | | Lease operating expenses | | Workovers and other | | Total | | Lease operating expenses | | Workovers and other | | Total | | Lease operating expenses | | Workovers and other | | Total | | Lease operating expenses | | Workovers and other | | Total | | Lease operating expenses | | Workovers and other | | Total |
| Producing region: | | | | | | | | | | | | | | | | | | | | | | | | | | | | | | | | | | | | |
| North Louisiana | | $ | 14,055 |
| | $ | 3,130 |
| | $ | 17,185 |
| | $ | 11,467 |
| | $ | 1,050 |
| | $ | 12,517 |
| | $ | 2,588 |
| | $ | 2,080 |
| | $ | 4,668 |
| | $ | 17,939 |
| | $ | 2,091 |
| | $ | 20,030 |
| | $ | 14,055 |
| | $ | 3,130 |
| | $ | 17,185 |
| | $ | 3,884 |
| | $ | (1,039 | ) | | $ | 2,845 |
|
| East Texas | | 4,585 |
| | 828 |
| | 5,413 |
| | 5,082 |
| | 596 |
| | 5,678 |
| | (497 | ) | | 232 |
| | (265 | ) | | 3,655 |
| | 1,696 |
| | 5,351 |
| | 4,585 |
| | 828 |
| | 5,413 |
| | (930 | ) | | 868 |
| | (62 | ) |
| South Texas | | 10,677 |
| | 4 |
| | 10,681 |
| | 11,405 |
| | 246 |
| | 11,651 |
| | (728 | ) | | (242 | ) | | (970 | ) | | 12,422 |
| | 90 |
| | 12,512 |
| | 10,677 |
| | 4 |
| | 10,681 |
| | 1,745 |
| | 86 |
| | 1,831 |
|
| Appalachia and other | | 1,694 |
| | 38 |
| | 1,732 |
| | 4,692 |
| | 71 |
| | 4,763 |
| | (2,998 | ) | | (33 | ) | | (3,031 | ) | | 3,585 |
| | 671 |
| | 4,256 |
| | 1,694 |
| | 38 |
| | 1,732 |
| | 1,891 |
| | 633 |
| | 2,524 |
|
| Total | | $ | 31,011 |
| | $ | 4,000 |
| | $ | 35,011 |
| | $ | 32,646 |
| | $ | 1,963 |
| | $ | 34,609 |
| | $ | (1,635 | ) | | $ | 2,037 |
| | $ | 402 |
| | $ | 37,601 |
| | $ | 4,548 |
| | $ | 42,149 |
| | $ | 31,011 |
| | $ | 4,000 |
| | $ | 35,011 |
| | $ | 6,590 |
| | $ | 548 |
| | $ | 7,138 |
|
| | | | | | | | | | | | | | | | | | | | | | | | | | | | | | | | | | | | | |
| | | Year Ended December 31, | | | | | | | | Year Ended December 31, | | | | | | |
| | | 2017 | | 2016 | | Year to year change | | 2018 | | 2017 | | Year to year change |
| (per Mcfe) | | Lease operating expenses | | Workovers and other | | Total | | Lease operating expenses | | Workovers and other | | Total | | Lease operating expenses | | Workovers and other | | Total | | Lease operating expenses | | Workovers and other | | Total | | Lease operating expenses | | Workovers and other | | Total | | Lease operating expenses | | Workovers and other | | Total |
| Producing region: | | | | | | | | | | | | | | | | | | | | | | | | | | | | | | | | | | | | |
| North Louisiana | | $ | 0.26 |
| | $ | 0.06 |
| | $ | 0.32 |
| | $ | 0.21 |
| | $ | 0.02 |
| | $ | 0.23 |
| | $ | 0.05 |
| | $ | 0.04 |
| | $ | 0.09 |
| | $ | 0.26 |
| | $ | 0.03 |
| | $ | 0.29 |
| | $ | 0.26 |
| | $ | 0.06 |
| | $ | 0.32 |
| | $ | — |
| | $ | (0.03 | ) | | $ | (0.03 | ) |
| East Texas | | 0.28 |
| | 0.05 |
| | 0.33 |
| | 0.21 |
| | 0.02 |
| | 0.23 |
| | 0.07 |
| | 0.03 |
| | 0.10 |
| | 0.34 |
| | 0.16 |
| | 0.50 |
| | 0.28 |
| | 0.05 |
| | 0.33 |
| | 0.06 |
| | 0.11 |
| | 0.17 |
|
| South Texas | | 1.38 |
| | — |
| | 1.38 |
| | 0.99 |
| | 0.02 |
| | 1.01 |
| | 0.39 |
| | (0.02 | ) | | 0.37 |
| | 1.52 |
| | 0.01 |
| | 1.53 |
| | 1.38 |
| | — |
| | 1.38 |
| | 0.14 |
| | 0.01 |
| | 0.15 |
|
| Appalachia and other | | 0.17 |
| | — |
| | 0.17 |
| | 0.36 |
| | 0.01 |
| | 0.37 |
| | (0.19 | ) | | (0.01 | ) | | (0.20 | ) | | 0.20 |
| | 0.04 |
| | 0.24 |
| | 0.17 |
| | — |
| | 0.17 |
| | 0.03 |
| | 0.04 |
| | 0.07 |
|
| Total | | $ | 0.36 |
| | $ | 0.04 |
| | $ | 0.40 |
| | $ | 0.31 |
| | $ | 0.02 |
| | $ | 0.33 |
| | $ | 0.05 |
| | $ | 0.02 |
| | $ | 0.07 |
| | $ | 0.35 |
| | $ | 0.04 |
| | $ | 0.39 |
| | $ | 0.36 |
| | $ | 0.04 |
| | $ | 0.40 |
| | $ | (0.01 | ) | | $ | — |
| | $ | (0.01 | ) |
Oil and natural gas operating costs for the year ended December 31, 20172018 increased by $0.4$7.1 million, or 1%20%, as compared with 2016. The increase wasto the same period in 2017, primarily due to higher workover activity, partially offset by lower lease operating expenses due tovariable costs as a result of increased production and the saleacquisition of our conventional assetsincremental interests in the Appalachia region during 2016.
|
| | | | | | | | | | | | | | | | | | | | | | | | | | | | | | | | | | | | |
| | | Year Ended December 31, | | | | | | |
| | | 2016 | | 2015 | | Year to year change |
| (in thousands) | | Lease operating expenses | | Workovers and other | | Total | | Lease operating expenses | | Workovers and other | | Total | | Lease operating expenses | | Workovers and other | | Total |
| Producing region: | | | | | | | | | | | | | | | | | | |
| North Louisiana | | $ | 11,467 |
| | $ | 1,050 |
| | $ | 12,517 |
| | $ | 13,342 |
| | $ | 2,798 |
| | $ | 16,140 |
| | $ | (1,875 | ) | | $ | (1,748 | ) | | $ | (3,623 | ) |
| East Texas | | 5,082 |
| | 596 |
| | 5,678 |
| | 4,097 |
| | 1,426 |
| | 5,523 |
| | 985 |
| | (830 | ) | | 155 |
|
| South Texas | | 11,405 |
| | 246 |
| | 11,651 |
| | 18,768 |
| | 2,007 |
| | 20,775 |
| | (7,363 | ) | | (1,761 | ) | | (9,124 | ) |
| Appalachia and other | | 4,692 |
| | 71 |
| | 4,763 |
| | 10,850 |
| | 615 |
| | 11,465 |
| | (6,158 | ) | | (544 | ) | | (6,702 | ) |
| Total | | $ | 32,646 |
| | $ | 1,963 |
| | $ | 34,609 |
| | $ | 47,057 |
| | $ | 6,846 |
| | $ | 53,903 |
| | $ | (14,411 | ) | | $ | (4,883 | ) | | $ | (19,294 | ) |
| | | | | | | | | | | | | | | | | | | |
| | | Year Ended December 31, | | | | | | |
| | | 2016 | | 2015 | | Year to year change |
| (per Mcfe) | | Lease operating expenses | | Workovers and other | | Total | | Lease operating expenses | | Workovers and other | | Total | | Lease operating expenses | | Workovers and other | | Total |
| Producing region: | | | | | | | | | | | | | | | | | | |
| North Louisiana | | $ | 0.21 |
| | $ | 0.02 |
| | $ | 0.23 |
| | $ | 0.18 |
| | $ | 0.04 |
| | $ | 0.22 |
| | $ | 0.03 |
| | $ | (0.02 | ) | | $ | 0.01 |
|
| East Texas | | 0.21 |
| | 0.02 |
| | 0.23 |
| | 0.22 |
| | 0.08 |
| | 0.30 |
| | (0.01 | ) | | (0.06 | ) | | (0.07 | ) |
| South Texas | | 0.99 |
| | 0.02 |
| | 1.01 |
| | 1.23 |
| | 0.13 |
| | 1.36 |
| | (0.24 | ) | | (0.11 | ) | | (0.35 | ) |
| Appalachia and other | | 0.36 |
| | 0.01 |
| | 0.37 |
| | 0.65 |
| | 0.04 |
| | 0.69 |
| | (0.29 | ) | | (0.03 | ) | | (0.32 | ) |
| Total | | $ | 0.31 |
| | $ | 0.02 |
| | $ | 0.33 |
| | $ | 0.38 |
| | $ | 0.05 |
| | $ | 0.43 |
| | $ | (0.07 | ) | | $ | (0.03 | ) | | $ | (0.10 | ) |
JV Settlement. Oil and natural gas operating costs decreased from $0.40 per Mcfe for the year ended December 31, 2016 decreased by $19.3 million, or 36%, as compared with 2015. The decrease was primarily due2017 to cost reduction efforts, including significant reductions in labor costs, repair and maintenance costs, chemical treatment costs, workover activity and saltwater disposal costs. Reduced labor costs were primarily due to significant reductions in our workforce in 2015 and 2016. The sale of our conventional assets in Appalachia in 2016 also contributed to lower oil and natural gas operating costs in the region, including the associated reductions in our workforce. On a consolidated basis, our net share of labor costs$0.39 per Mcfe for the year ended December 31, 2016 decreased by $4.6 million, or 51%, as compared with 2015.2018. The reduction in saltwater disposal costs isdecrease on a per Mcfe basis was primarily due to the renegotiation of contractsincreased production in relation to certain fixed oil and more cost-efficient disposal methods.natural gas operating costs.
Production and ad valorem taxes
The following table presents our production and ad valorem taxes on a percentage of revenue basis and per Mcfe basis for the years ended December 31, 2018 and 2017:
| | | | | Year Ended December 31, | | Year Ended December 31, |
| | | 2017 | | 2016 | | 2015 | | 2018 | | 2017 |
| (in thousands, except per unit rate) | | Production and ad valorem taxes | | % of revenue | | Taxes $/Mcfe | | Production and ad valorem taxes | | % of revenue | | Taxes $/Mcfe | | Production and ad valorem taxes | | % of revenue | | Taxes $/Mcfe | | Production and ad valorem taxes | | % of revenue | | Taxes $/Mcfe | | Production and ad valorem taxes | | % of revenue | | Taxes $/Mcfe |
| Producing region: | | | | | | | | | | | | | | | | | | | | | | | | | | | | | | |
| North Louisiana | | $ | 6,936 |
| | 5.0 | % | | $ | 0.13 |
| | $ | 7,482 |
| | 6.8 | % | | $ | 0.14 |
| | $ | 10,027 |
| | 6.2 | % | | $ | 0.14 |
| | $ | 6,609 |
| | 3.2 | % | | $ | 0.09 |
| | $ | 6,936 |
| | 5.0 | % | | $ | 0.13 |
|
| East Texas | | 1,291 |
| | 2.9 | % | | 0.08 |
| | 1,467 |
| | 2.7 | % | | 0.06 |
| | 1,059 |
| | 2.3 | % | | 0.06 |
| | 635 |
| | 2.0 | % | | 0.06 |
| | 1,291 |
| | 2.9 | % | | 0.08 |
|
| South Texas | | 4,300 |
| | 8.0 | % | | 0.56 |
| | 5,709 |
| | 9.2 | % | | 0.50 |
| | 10,216 |
| | 10.6 | % | | 0.67 |
| | 6,008 |
| | 6.7 | % | | 0.74 |
| | 4,300 |
| | 8.0 | % | | 0.56 |
|
| Appalachia and other | | 604 |
| | 2.9 | % | | 0.06 |
| | 722 |
| | 3.5 | % | | 0.05 |
| | 1,328 |
| | 4.9 | % | | 0.08 |
| | 2,008 |
| | 4.5 | % | | 0.11 |
| | 604 |
| | 2.9 | % | | 0.06 |
|
| Total | | $ | 13,131 |
| | 5.1 | % | | $ | 0.15 |
| | $ | 15,380 |
| | 6.2 | % | | $ | 0.15 |
| | $ | 22,630 |
| | 6.9 | % | | $ | 0.18 |
| | $ | 15,260 |
| | 4.1 | % | | $ | 0.14 |
| | $ | 13,131 |
| | 5.1 | % | | $ | 0.15 |
|
Production and ad valorem taxes for the year ended December 31, 2017 decreased2018 increased by $2.2$2.1 million or 15%16%, as compared with 2016.to the same period in 2017. The decreaseincrease was primarily due to loweran increase in production volumes offset byand higher commodityoil prices and lower ad valorem taxesfor the year ended December 31, 2018. The increase in South Texas. The higher oil prices primarily impacted properties located in our South Texas region because production taxes are based on a fixed percentage of gross value of production sold. Production and ad valorem taxesIn addition, we incurred higher assessments for the year ended December 31, 2016 decreased by $7.3 million, or 32%, as compared with 2015.impact fee required to be paid to the Commonwealth of Pennsylvania. The decreaseincrease in the impact fee was primarily due to lower production volumes and lower commodity prices.
Production and ad valorem tax rates per Mcfe were $0.15, $0.15 and $0.18 for 2017, 2016 and 2015, respectively. The decrease from 2015 to 2016 was primarily due to lower ad valorem taxes in South Texas.
In our North Louisiana and East Texas regions, we currently receive severance tax holidays on certain horizontal wells which reduce the effective rate of these taxes. Our horizontal wellshigher natural gas market prices utilized in the state of Louisiana are eligible for an exemption from severance taxes for the earlier of two years from the date of first production or until payout of qualified costs. In July 2015, the state of Louisiana decreased its severance tax rate for wells that do not receive exemptions from $0.163 to $0.158 per Mcf. The effective severance tax rate decreased to $0.098 per Mcf in July 2016 and increased to $0.111 per Mcf in July 2017. Our horizontal natural gas wells in the state of Texas are eligible for an exemption from severance taxes for up to ten years of production or until the cumulative valuecalculation of the tax reduction equals 50% of the drilling and completion costs incurred for the well.
Production and ad valorem taxes are set by state and local governments and vary as to the tax ratefee and the value to which that rate is applied. In Louisiana, where a substantial percentage of our production is derived, severance taxes are levied on a per Mcf basis. Therefore, the resulting dollar value of production is not sensitive to changesadditional interests in prices for natural gas, except for holiday exemptions, if any. In our other operating areas, particularly Texas, production taxes are based on a fixed percentage of gross value of production sold. As such, our realized severance and ad valorem tax rates may become more sensitive to prices, except for wells that receive holiday exemptions, if any. The Commonwealth of Pennsylvania requires an impact fee to be paid on all unconventional wells spud based on a price tier calculation for a period of 15 years. Multiple pieces of legislation have been introduced in both the Pennsylvania House and the Senate that propose a severance tax at varying rates on the production of oil and natural gas. This severance tax would likely be in addition togas properties acquired as a result of the impact fee and could have an impact on our production taxes in future periods. There is no certainty that this legislation will pass, nor is it possible to quantify the impact at this time.Appalachia JV Settlement.
Gathering and transportation
Gathering and transportation expenses for the year ended December 31, 2017 increased2018 decreased by $5.0$35.3 million, or 5%32%, as compared with 2016. The increase was primarily due to gathering expensesthe same period in connection with taking our gas in-kind from certain third-party operated wells in the North Louisiana region, shortfall fees under an agreement to deliver an aggregate minimum volume commitment of natural gas production to certain gathering systems in East Texas and North Louisiana, and higher variable gathering costs on volumes from wells turned-to-sales in North Louisiana. If we utilize the gathering contract with the minimum volume commitment, these costs are allocated amongst the owners that incur these types of costs. If we do not utilize the gathering contract with the minimum volume commitment, we incur the entire amount of the shortfall fees and these costs are not allocated to other owners.2017. Gathering and transportation expenses were $1.28$0.71 per Mcfe for the year ended December 31, 2017,2018 as compared to $1.02$1.28 per Mcfe for the year ended December 31, 2016.
Gathering and transportation expenses for the year ended December 31, 2016 increased by $7.1 million, or 7%, as compared with 2015.same period in 2017. The increase wasdecreases were primarily due to gathering expenses in connection with taking ourthe impact of the rejection of executory contracts for the transportation of natural gas in-kind from certain third-party operated wells in the North Louisiana region and higher variable gathering costs on volumes from wells turned-to-sales in North Louisiana. Gathering and transportation expenses were $1.02 per Mcfe foras part of the year ended December 31, 2016, as compared to $0.80 per Mcfe for the year ended December 31, 2015. The increase was primarily due to lower volumes in relation to fixed costs under gathering and firm transportation contracts in the East Texas and North Louisiana regions.
As discussed in "Note 8. Commitments and contingencies" in the Notes to our Consolidated Financial Statements, we terminated certain sales and firm transportation agreements during the third quarter of 2016 that are currently subject to litigation. The termination of these contracts will not be reflected in our financial results until the litigation is resolved and it is deemed to be realized in accordance with GAAP. On January 18, 2018 and March 1, 2018, the Company and the Filing Subsidiaries filed motions to reject certain executory contracts as permitted under the Bankruptcy Code, including certain gathering and transportation contracts. Certain of these transportation contracts were rejected by the Court on March 7, 2018, and a hearing to consider the motion to reject additional gathering and transportation contracts is scheduled for March 29, 2018. The rejection of these contracts is expected to significantly decrease ourChapter 11 Cases. We expect gathering and transportation expenses in future periods. See further discussionto continue to decline on a per Mcfe basis during 2019 due to lower fixed costs associated with the expiration of the motion to reject these contracts in "Note 17. Subsequent events"a minimum volume commitment for gathering services in the Notes to our Consolidated Financial Statements.North Louisiana region.
Purchased natural gas expenses
Purchased natural gas expenses are purchases of natural gas from third parties plus the related costs of transportation. Purchased natural gas expenses for the year ended December 31, 20172018 decreased by $0.2$7.0 million, or 1%30%, as compared with
2016,to the same period in 2017. The decrease was primarily due to lower volumes purchased. Purchasedpurchased and lower transportation costs as a result of the rejection of executory contracts for the transportation of natural gas expenses forin the year ended December 31, 2016 decreased by $3.8 million, or 14%, as compared with 2015, primarily due to lower purchase prices.North Louisiana region.
Depletion, depreciation and amortization
Depletion, depreciation and amortization for the year ended December 31, 2017 decreased as compared with 2016 primarily due to a decrease in depletion expense of $24.4 million, or 33%. On a per Mcfe basis, the depletion rate for the year ended December 31, 2017 was $0.57 per Mcfe, compared with $0.71 per Mcfe in 2016. The decrease in depletion expense was primarily due to a decrease in production and the depletion rate. The decrease in the depletion rate was primarily related to higher proved reserve volumes and impairments of our oil and natural gas properties during 2016, which lowered our depletable base.
Depletion, depreciation and amortization for the year ended December 31, 2016 decreased as compared with 20152018 increased from the same period in 2017 primarily due to a decreasean increase in depletion expense of $139.4$28.9 million, or 17%58%. OnThe increase in depletion expense was primarily due to an increase in production and a per Mcfe basis, thehigher depletion rate. The depletion rate for the year ended December 31, 20162018 was $0.71$0.74 per Mcfe, compared with $1.72to $0.57 per Mcfe in 2015.the same period in 2017. The decreaseincrease in the depletion expenserate was primarily due to impairmentsthe additional costs associated with our development of the South Texas and North Louisiana regions. In particular, the development of oil producing assets in South Texas results in a higher depletion rate when calculated on per Mcfe basis compared to the rest of our oil and natural gas properties during 2016 and 2015, which lowered our depletable base.properties.
Impairment of oil and natural gas properties
For the year ended December 31, 2017, we did not record impairments to our oil and natural gas properties primarily due to an increase in oil and natural gas prices. The trailing twelve month reference price of $2.98 per Mmbtu for natural gas and $51.34 per Bbl of oil for the year ended December 31, 2017 increased from $2.48 per Mmbtu for natural gas and $42.75 per Bbl of oil for the year ended December 31, 2016. For the years ended December 31, 2016 and 2015, we recorded impairments to our oil and natural gas properties of $160.8 million and $1.2 billion, respectively, primarily due to the significant decline in oil and natural gas prices and the related downward revisions to the reserves of our oil and gas properties due to changes in prices.
Oil and natural gas prices are volatile and we may incur additional impairments during 2018 if future oil and natural gas prices result in a decrease in the trailing twelve-month reference prices compared to December 31, 2017. For the first quarter 2018, the trailing twelve month reference prices expected to be utilized in our first quarter 2018 ceiling test calculation are approximately $3.00 per Mmbtu for natural gas and $53.49 per Bbl of oil, representing an increase of 1% and 4% for the price of natural gas and oil, respectively, from December 31, 2017. The possibility and amount of any future impairment is difficult to predict, and will depend, in part, upon future oil and natural gas prices to be utilized in the ceiling test, estimates of Proved Reserves and future capital expenditures and operating costs.
General and administrative
The following table presents our general and administrative expenses for the years ended December 31, 2017, 20162018 and 2015:2017:
| | | | | Year Ended December 31, | | Year to year change | | Year Ended December 31, | | |
| (in thousands, except per unit rate) | | 2017 | | 2016 | | 2015 | | 2017-2016 | | 2016-2015 | |
| General and administrative costs: | | | | | | | | | | | |
| Gross general and administrative expense | | $ | 65,484 |
| | $ | 58,002 |
| | $ | 87,788 |
| | $ | 7,482 |
| | $ | (29,786 | ) | |
| (in thousands) | | | 2018 | | 2017 | | Year to year change |
| General and administrative expenses: | | | | | | | |
| Gross general and administrative expenses | | | $ | 47,072 |
| | $ | 65,484 |
| | $ | (18,412 | ) |
| Technical services and service agreement charges | | (6,386 | ) | | (7,132 | ) | | (15,884 | ) | | 746 |
| | 8,752 |
| | (4,284 | ) | | (6,386 | ) | | 2,102 |
|
| Operator overhead reimbursements | | (14,585 | ) | | (13,703 | ) | | (13,126 | ) | | (882 | ) | | (577 | ) | | (14,060 | ) | | (14,585 | ) | | 525 |
|
| Capitalized salaries | | (2,918 | ) | | (3,245 | ) | | (7,158 | ) | | 327 |
| | 3,913 |
| | (2,931 | ) | | (2,918 | ) | | (13 | ) |
| General and administrative expense, excluding equity-based compensation | | 41,595 |
| | 33,922 |
| | 51,620 |
| | 7,673 |
| | (17,698 | ) | |
| General and administrative expenses, excluding equity-based compensation | | | 25,797 |
| | 41,595 |
| | (15,798 | ) |
| Gross equity-based compensation | | (10,430 | ) | | 15,530 |
| | 10,626 |
| | (25,960 | ) | | 4,904 |
| | 2,400 |
| | (10,430 | ) | | 12,830 |
|
| Capitalized equity-based compensation | | (1,000 | ) | | (752 | ) | | (3,428 | ) | | (248 | ) | | 2,676 |
| | (347 | ) | | (1,000 | ) | | 653 |
|
| General and administrative expense | | $ | 30,165 |
| | $ | 48,700 |
| | $ | 58,818 |
| | $ | (18,535 | ) | | $ | (10,118 | ) | |
| General and administrative expenses | | | $ | 27,850 |
| | $ | 30,165 |
| | $ | (2,315 | ) |
General and administrative expenses for the year ended December 31, 20172018 decreased by $18.5$2.3 million or 38%, compared with 2016.to the same period in 2017. Significant components of the changes in general and administrative expense for the year ended December 31, 2017 compared to 2016expenses were a result of:
increased personnel costsHigher equity-based compensation of $2.8$13.5 million for the year ended December 31, 2017 compared2018, primarily due to the same periodincome in the prior year of $14.5 million related to a significant decline in the fair value of the warrants issued to ESAS. This was partially offset by a decrease in equity-based compensation of $1.7 million for the year ended December 31, 2018 due to the discontinuation of grants of share-based compensation to employees and lower employee headcount.
Increased personnel costs of $2.3 million for year ended December 31, 2018. The increase was primarily due to higher cash-based bonus expense during the current year, partially offset by variable costs associated with lower headcount. The increase in bonus expense was due to the adoption of new cash-based retention and incentive plans in connection with our restructuring activities. The cash-based retention and incentive plans are intended to replace grants under the discontinued equity-based incentive plans. As a result, we expect cash-based personnel costs to increaseincreased and equity-based compensation expense to decrease in future periods. See "Note 11. Equity-baseddecreased.
Decreased consulting and other incentive-based compensation" in the Notes to our Consolidated Financial Statements for additional information.
increased professional and legal fees of $8.3contract labor costs $2.9 million for the year ended December 31, 2017 compared2018 primarily due to the same period insuspension of the priorservices and investment agreement with ESAS that was effective November 9, 2017.
Decreased legal and professional fees of $14.7 million for the year ended December 31, 2018. Our legal and professional fees during 2017 primarily consisted of legal, financial and restructuring advisors engaged to evaluate strategic alternatives. Any legal and professional fees related to the legal and advisory fees incurred in connection with restructuring activities. We will be required to incur substantial costs for professional fees and other expenses associated with the administration of the Chapter 11 proceedings. In additionCases incurred subsequent to the legalPetition Date are classified as “Reorganization items, net” on the Consolidated Statement of Operations.
Decreased overhead reimbursement, technical services and financial advisors hired to represent us, weservice agreement charges of $2.6 million for the year ended December 31, 2018. The decreases are required to pay the costs relatedprimarily a result of lower recoveries from third parties due to the legal and financial advisors of certainacquisition of our creditors. As a result, we expect professional and legal fees to increase significantlyjoint venture partner’s interests in future periods.the Appalachia JV Settlement.
decreasedDecreased various other gross general and administrative expenses of $3.6$3.1 million for the year ended December 31, 2017 compared to the same period in the prior year.2018. These decreases reflect our continued efforts to reduce our general and administrative costs throughout the organization.
decreased equity-based compensation of $26.0 million for the year ended December 31, 2017 compared to the same period in the prior year. The decrease was primarily due to income of $14.5 million for the year ended December 31, 2017 compared to expense of $11.3 million for the year ended December 31, 2016 for the ESAS Warrants. The fair value of the warrants is dependent on factors such as our share price, historical volatility, risk-free rate and performance relative to our peer group. The income related to these warrants in 2017 was primarily due to a decline in fair value as a result of a significant decrease in EXCO's common share price. Furthermore, the ESAS Warrants were forfeited and canceled and previously recognized compensation costs were reversed.
General and administrative expenses for the year ended December 31, 2016 decreased by $10.1 million, or 17%, compared with 2015. Significant components of the changes in general and administrative expense for the year ended December 31, 2016 compared to 2015 were a result of:
decreased personnel costs of $29.8 million for the year ended December 31, 2016 compared to the same period in the prior year, primarily due to reductions in our workforce and employee benefits, including the suspension of the 401(K) employer match.
increased professional and legal fees of $6.7 million for the year ended December 31, 2016 compared to the same period in the prior year, primarily related to the legal and advisory fees incurred in connection with the strategic initiatives focused on restructuring our balance sheet and gathering and transportation contracts;
decreased various other gross general and administrative expenses of $6.7 million for the year ended December 31, 2016 compared to the same period in the prior year. These decreases reflect our efforts to reduce our general and administrative costs throughout the organization.
decreased technical services and service agreement recoveries of $8.8 million for the year ended December 31, 2016 compared to the same period in the prior year. These decreases were primarily a result of reduced headcount and lower recoveries in connection with the transition service agreement with a former joint venture that terminated in April 2015.
decreased capitalized salaries of $3.9 million and capitalized equity-based compensation of $2.7 million for the year ended December 31, 2016 compared to the same period in the prior year, primarily as a result of reduced employee headcount; and
increased equity-based compensation of $4.9 million for the year ended December 31, 2016 compared to the same period in the prior year. The increase was primarily due to $8.1 million of additional compensation expense related to the warrants issued to ESAS in 2015. The increase in our equity-based compensation expense was partially offset by lower equity-based compensation to employees as a result of reductions in our workforce.
Other operating items
Other operating items were net losses of $59.2 million, $24.2 million and $0.5 million for the years ended December 31, 2017, 2016 and 2015, respectively. The net loss for the year ended December 31, 2017 was primarily due to the acceleration of the remaining $56.4 million in costs under a firm transportation agreement. See further discussion in "Note 8. Commitment and contingencies" in the Notes to our Consolidated Financial Statements. The net loss for the year ended December 31, 2016 was
primarily due to the settlement of the litigation with a joint venture partner in the Eagle Ford shale. See "Note 3. Acquisitions, divestitures and other significant events" in the Notes to our Consolidated Financial Statements for additional information. The net loss for the year ended December 31, 2015 primarily consisted of legal expenses and other assessments partially offset by income from surface acreage that we own in the South Texas region.costs.
Interest expense, net
The following table presents our interest expense for the years ended December 31, 2017, 2016 and 2015:
|
| | | | | | | | | | | | | | | | | | | | |
| | | Year Ended December 31, | | Year to year change |
| (in thousands) | | 2017 | | 2016 | | 2015 | | 2017-2016 | | 2016-2015 |
| Interest expense, net: | | | | | | | | | | |
| EXCO Resources Credit Agreement | | $ | 4,554 |
| | $ | 5,909 |
| | $ | 6,747 |
| | $ | (1,355 | ) | | $ | (838 | ) |
| 1.5 Lien Notes | | 39,480 |
| | — |
| | — |
| | 39,480 |
| | — |
|
| 1.75 Lien Term Loans | | 36,228 |
| | — |
| | — |
| | 36,228 |
| | — |
|
| Fairfax Term Loan | | 7,708 |
| | 37,611 |
| | 6,764 |
| | (29,903 | ) | | 30,847 |
|
| 2018 Notes | | 10,157 |
| | 10,612 |
| | 50,381 |
| | (455 | ) | | (39,769 | ) |
| 2022 Notes | | 5,964 |
| | 12,294 |
| | 38,338 |
| | (6,330 | ) | | (26,044 | ) |
| Amortization of deferred financing costs | | 10,198 |
| | 8,989 |
| | 15,729 |
| | 1,209 |
| | (6,740 | ) |
| Capitalized interest | | (6,440 | ) | | (5,213 | ) | | (12,040 | ) | | (1,227 | ) | | 6,827 |
|
| Other | | 326 |
| | 236 |
| | 163 |
| | 90 |
| | 73 |
|
| Total interest expense, net | | $ | 108,175 |
| | $ | 70,438 |
| | $ | 106,082 |
| | $ | 37,737 |
| | $ | (35,644 | ) |
Interest expense, net for the year ended December 31, 2017 increased $37.7 million from 2016. Significant components of the changes in interest expense, net for the year ended December 31, 2017 compared to 2016 were a result of additional interest expense on the 1.5 Lien Notes and 1.75 Lien Term Loans partially as a result of higher interest rates associated with PIK Payments. This was partially offset by lower interest expense on the 2018 Notes and 2022 Notes due to lower outstanding balances as a result of note repurchases that occurred during 2016, lower average outstanding balances on the EXCO Resources Credit Agreement, and the Fairfax Term Loan. The Fairfax Term Loan was terminated as a result of the Second Lien Term Loan Exchange.
Interest expense, net for the year ended December 31, 2016 decreased $35.6$74.3 million from the same period in 2015. Significant components of2017. The decrease was primarily due to the changes in interest expense, net for the year ended December 31, 2016 compared to 2015 were a result of lower outstanding balances on the 2018 Notes and 2022 Notes from debt restructuring activities and note repurchases in 2015 and 2016. This was partially offset by additional interest from the 12.5% senior secured Second Lien Term Loan with certain affiliates of Fairfax Financial Holdings Limited in the aggregate principal amount of $300.0 million ("Fairfax Term Loan"), which closed in the fourth quarter of 2015. The decreases were also partially offset by lower capitalized interest primarily related to lower balances of unproved oil and natural gas properties and suspension of our drilling and development program ininterest accrued on certain areas.
The Exchange Term Loans and a portion ofinstruments subsequent to the 1.75 Lien Term Loans are accounted for as a troubled debt restructuring pursuant to ASC 470-60, Troubled Debt Restructuring by Debtors. As such, the carrying amounts of the Exchange Term Loan and a portion of the 1.75 Lien Term Loans, whether designated as interest or as principal amount, are adjusted each time we make a payment. Interest expense is recognized on this portion of the 1.75 Lien Term Loans if the fair value of the PIK Payments exceeds the interest capitalized as part of the carrying value.
Petition Date. As a result of the bankruptcy proceedings, the Court may limitlimited post-petition interest on debtcertain indebtedness that may be under securedunder-secured or unsecured. On February 22, 2018, the Court approved our ability to make adequate protection payments for interest on the DIP Credit Agreement and the 1.5 Lien Notes. Furthermore, a significant portion ofWe continued to accrue and pay interest on the DIP Credit Agreement and the 1.5 Lien Notes subsequent to the Petition Date. We accrued interest on 1.75 Lien Term Loans, Second Lien Term Loans, 2018 Notes and 2022 Notes through the Petition Date with no interest accrued subsequent to the Petition Date. See “Note 5. Debt” in the Notes to our indebtedness may be repaid, canceled or equitized as a result of the Chapter 11 Cases. Therefore, our interest expense may decrease in future periods.Consolidated Financial Statements for additional information.
Gain (loss) on derivative financial instruments - commodity derivatives
Our oil and natural gas derivative financial instruments resulted in a net gainsloss of $0.6 million and a net gain of $24.7 million, net losses of $34.1 million and net gains of $75.9 million for the years ended December 31, 2018 and 2017, 2016 and 2015, respectively. Based onIn January 2018, the nature ofcounterparty to our derivativeremaining open swap contracts decreases inearly terminated the related commodity price typicallyoutstanding contracts effective January 31, 2018. As a result, in increases to the value of our derivatives contracts. The significant fluctuations demonstrate the high volatility inwe did not have any outstanding oil and natural gas prices between each of the periods.
The ultimate settlement amount of the unrealized portion of the derivative financial instruments is dependent on future commodity prices.subsequent to the termination of these contracts.
The following table presents our oil and natural gas prices, before and after the impact of the cash settlement of our derivative financial instruments.commodity derivatives:
| | | | | Year Ended December 31, | | Year to year change | | Year Ended December 31, | | |
| Average realized pricing: | | 2017 | | 2016 | | 2015 | | 2017-2016 | | 2016-2015 | | 2018 | | 2017 | | Year to year change |
| Natural gas (per Mcf): | | | | | | | | | | | | | | | | |
| Net price, excluding derivatives | | $ | 2.51 |
| | $ | 1.93 |
| | $ | 2.06 |
| | $ | 0.58 |
| | $ | (0.13 | ) | | $ | 2.85 |
| | $ | 2.51 |
| | $ | 0.34 |
|
| Cash receipts (payments) on derivatives | | (0.05 | ) | | 0.24 |
| | 0.74 |
| | (0.29 | ) | | (0.50 | ) | | 0.01 |
| | (0.05 | ) | | 0.06 |
|
| Net price, including derivatives | | $ | 2.46 |
| | $ | 2.17 |
| | $ | 2.80 |
| | $ | 0.29 |
| | $ | (0.63 | ) | | $ | 2.86 |
| | $ | 2.46 |
| | $ | 0.40 |
|
| Oil (per Bbl): | | | | | | | | | | | | | | | | |
| Net price, excluding derivatives | | $ | 49.82 |
| | $ | 38.05 |
| | $ | 43.89 |
| | $ | 11.77 |
| | $ | (5.84 | ) | | $ | 66.78 |
| | $ | 49.82 |
| | $ | 16.96 |
|
| Cash receipts on derivatives | | (0.15 | ) | | 9.24 |
| | 20.12 |
| | (9.39 | ) | | (10.88 | ) | |
| Cash receipts (payments) on derivatives | | | — |
| | (0.15 | ) | | 0.15 |
|
| Net price, including derivatives | | $ | 49.67 |
| | $ | 47.29 |
| | $ | 64.01 |
| | $ | 2.38 |
| | $ | (16.72 | ) | | $ | 66.78 |
| | $ | 49.67 |
| | $ | 17.11 |
|
| Natural gas equivalent (per Mcfe): | | | | | | | | | | | | | | | | |
| Net price, excluding derivatives | | $ | 2.97 |
| | $ | 2.38 |
| | $ | 2.66 |
| | $ | 0.59 |
| | $ | (0.28 | ) | | $ | 3.48 |
| | $ | 2.97 |
| | $ | 0.51 |
|
| Cash receipts (payments) on derivatives | | (0.05 | ) | | 0.37 |
| | 1.04 |
| | (0.42 | ) | | (0.67 | ) | | 0.01 |
| | (0.05 | ) | | 0.06 |
|
| Net price, including derivatives | | $ | 2.92 |
| | $ | 2.75 |
| | $ | 3.70 |
| | $ | 0.17 |
| | $ | (0.95 | ) | | $ | 3.49 |
| | $ | 2.92 |
| | $ | 0.57 |
|
Our nettotal cash paymentsreceipts for 2017the year ended December 31, 2018 were $4.1$0.5 million,, or $0.05$0.01 per Mcfe, compared to net cash receiptspayments of $39.1$4.1 million,, or $0.37$0.05 per Mcfe, in 2016 and net cash receipts of $128.8 million, or $1.04 per Mcfe, in 2015. The differences between cash payments and cash receipts during 2017 and 2016 were primarily due to lower volumes hedged and higher oil and natural gas prices infor the current period. The differences between the cash receipts during 2016 and 2015 were primarily due to lower volumes hedged and lower strike prices during 2016.year ended December 31, 2017.
Gain on derivative financial instruments - common share warrants
Pursuant to ASC 815, we account for the warrants issued in connection with the issuance of the 1.5 Lien Notes and 1.75 Lien Term Loans during 2017 Warrants as derivative financial instruments and carry the warrants as a non-current liability at their fair value, with the increase or decrease in fair value being recognized in earnings. These warrants arewill be measured at fair value on a recurring basis until the date of exercise or the date of expiration. WeOn January 16, 2018, affiliates of Fairfax surrendered all of their rights to the 2017 Warrants, which had entitled them rights to purchase in aggregate up to 10,824,376 common shares at $13.95 per share and 1,725,576 common shares at $0.01 per share. During the year ended December 31, 2018, we recorded a gain onof $1.9 million, primarily due to the revaluationcancellation of the warrants of $159.2 million duringby Fairfax and changes in EXCO’s share price. During the year ended December 31, 2017, we recorded a gain of $159.2 million primarily due to a decrease in EXCO'sEXCO’s share price.
Gain (loss)Reorganization items, net
Pursuant to ASC 852, any costs directly related to an entity’s bankruptcy proceedings are presented separately as "Reorganization items, net." We recorded a net loss on Reorganization items, net of $409.3 million for the year ended December 31, 2018 primarily due to the rejection of executory contracts of $312.2 million, legal and professional fees of $67.8 million and the acceleration of deferred financing costs, debt discounts and deferred reductions in carrying value of debt instruments of $30.5 million partially offset by gains on the settlement of pre-petition claims of $1.2 million. The losses associated with the rejection of executory contracts, unexpired leases and adjustments to the carrying value of debt instruments are based on our current estimate of the allowable claims and may differ from actual claims or future settlement amounts paid. We will continue to evaluate these liabilities throughout the Chapter 11 process and adjust amounts as necessary. Such adjustments may be material. See “Note 1. Organization and basis of presentation” in the Notes to our Consolidated Financial Statements for additional information.
Loss on restructuring and extinguishment of debt
For the year ended December 31, 2017, we recorded a net loss on extinguishmentrestructuring of debt of $6.4 million. The net loss was primarily due to third-party fees incurred in connection with the Second Lien Term Loan Exchange. The exchange was accounted for as a modification of debt, and as a result, third-party fees were immediately expensed.
For the year ended December 31, 2016, we recorded a net gain on extinguishment of debt of $119.5 million. The net gain was primarily duemillion related to the repurchases of an aggregate of $179.1 million in principal amount of the 2018 Notes and 2022 Notes with an aggregate of $53.3 million in cash.
For the year ended December 31, 2015, we recorded a net gain of $193.3 million. We repurchased a portion of the outstanding 2018 Notes and 2022 Notes in exchange for the holders of such notes agreeing to act as lenders in connection with the Exchange Term Loan which resulted in a net gain of $165.1 million. Additionally, in the fourth quarter of 2015, we repurchased $40.8 million in principal of the 2018 Notes through open market repurchases with $12.0 million in cash resulting in a $28.2 million net gain on extinguishment of debt. The net gains on the transactions during 2016 and 2015 included an acceleration of the related deferred financing costs and notes discount, as well as directtransaction costs associated with the transactions.exchange of Second Lien Term Loans for 1.75 Lien Term Loans.
Equity lossincome (loss)
OurWe recognized equity income of $0.2 million and an equity loss wasof $4.2 million, $16.4 million, and $15.7 million for the years ended December 31, 2018 and 2017, 2016respectively. We acquired the remaining ownership interests in OPCO and 2015, respectively. Our equity loss for the year ended December 31, 2017 was primarily comprisedAppalachia Midstream as a result of impairments of $5.2 million of EXCO's interest in a midstream investment in the East Texas and North Louisiana regions.
Our equity loss for the year ended December 31, 2016 was primarily comprised of impairments of $9.6 million to our midstream investments in the Appalachia regionJV Settlement on February 27, 2018. Prior to the settlement, we accounted for our ownership interests in OPCO and the East Texas and North Louisiana regions. In addition, we had an impairment of $1.7 million to our investment that servesAppalachia Midstream as the operator and owns an interest in our Appalachia assets ("OPCO") and a net loss of $2.8 million for the year ended December 31, 2016 from our equity method investment that ownsinvestments. As a result of the settlement, OPCO and manages certain surface acreage in the North Louisiana region primarily due to its impairment of certain assets.
Our equity loss for the year ended December 31, 2015 was primarily due to other than temporary impairments ofAppalachia Midstream are wholly-owned subsidiaries and are consolidated within our midstream investments in the Appalachia region and the East Texas and North Louisiana regions. The impairments were recorded to reduce the carrying values to the fair values.
The impairments were recorded to reduce the carrying values to the fair values. For additional discussion of our impairments, see "Note 6. Fair value measurements" in the Notes to our Consolidated Financial Statements.financial results.
Income taxes
During the years ended December 31, 2018 and 2017, we recognized an income tax benefit of $4.5 million and income tax expense of $0.3 million, respectively. The following table presents a reconciliation of our income tax provision (benefit)benefit and expense for the years ended December 31, 2017, 20162018 and 2015:2017:
|
| | | | | | | | | | | | |
| | | Year Ended December 31, |
| (in thousands) | | 2017 | | 2016 | | 2015 |
| Federal income taxes (benefit) provision at statutory rate of 35% | | $ | 8,630 |
| | $ | (77,860 | ) | | $ | (417,333 | ) |
| Increases (reductions) resulting from: | | | | | | |
| Adjustments to the valuation allowance | | (525,674 | ) | | 82,459 |
| | 459,843 |
|
| Non-deductible compensation | | 3,206 |
| | 5,019 |
| | 2,399 |
|
| State taxes net of federal benefit | | (1,496 | ) | | (7,637 | ) | | (45,009 | ) |
| Federal and state tax rate change | | 421,610 |
| | — |
| | — |
|
| Non-deductible interest | | 149,577 |
| | — |
| | — |
|
| Non-taxable gain on warrants | | (55,716 | ) | | — |
| | — |
|
| Other | | 159 |
| | 821 |
| | 100 |
|
| Total income tax provision | | $ | 296 |
| | $ | 2,802 |
| | $ | — |
|
|
| | | | | | | | | | | | |
| | | Year Ended December 31, | | |
| (in thousands) | | 2018 | | 2017 | | Year to year change |
| Income tax (benefit) expense: | | | | | | |
| Current income tax (benefit) expense | | $ | — |
| | $ | (1,420 | ) | | $ | 1,420 |
|
| Deferred income tax (benefit) expense | | (4,518 | ) | | 1,716 |
| | (6,234 | ) |
| Total income tax (benefit) expense | | $ | (4,518 | ) | | $ | 296 |
| | $ | (4,814 | ) |
Deferred income tax benefit during the year ended December 31, 2018 related to changes in a deferred tax liability for tax-deductible goodwill. As of December 31, 2017, we recognized a deferred tax liability of $4.5 million for tax-deductible goodwill. The deferred tax liability related to goodwill was considered to have an indefinite life based on the nature of the underlying asset and could not be offset under GAAP with a deferred tax asset with a definite life, such as NOLs. As a result of the Tax Cuts and Jobs Act (“Tax Act”), deferred tax assets resulting from NOLs generated in taxable years subsequent to December 31, 2017 are considered to have an indefinite life. Therefore, we recognized an income tax benefit of $4.5 million during the in the first quarter of 2018 because we expect to be able to utilize deferred tax assets related to NOLs to offset the deferred tax liability related to goodwill. During the year ended December 31, 2017, we recognized a current income tax benefit of $1.4 million due to refunds for alternative minimum tax credits. During the years ended December 31, 2017credits and 2016, we recognized deferred income tax expense of $1.7 million, and $2.8 million, respectively, related to a deferred tax liability for tax deductible goodwill. Duringchanges in the year ended December 31, 2016, the book basis of goodwill exceeded the tax basis that caused the previous book and tax basis differences to change from a deferred tax asset to a deferred tax liability. The deferred tax liability related to tax-deductible goodwill iswith an indefinite life that could not be offset by NOLs that were considered to have an indefinite life based on the nature of the underlying asset and cannot be offset under GAAP with a deferred tax asset with a definite life such as NOLs. However,prior to the deferred income tax expense is not expected to result in cash paymentsenactment of income taxes in the foreseeable future.
|
| | | | | | | | | | | | |
| | | Year Ended December 31, |
| (in thousands) | | 2017 | | 2016 | | 2015 |
| Income tax expense (benefit): | | | | | | |
| Current income tax benefit | | $ | (1,420 | ) | | $ | — |
| | $ | — |
|
| Deferred income tax expense | | 1,716 |
| | 2,802 |
| | — |
|
| Total income tax expense | | $ | 296 |
| | $ | 2,802 |
|
| $ | — |
|
During the years ended 2017, 2016 and 2015, we recognized a fullOur net deferred tax assets have been fully reserved with valuation allowances. Our accumulated valuation allowance againstas of December 31, 2018 was approximately $874.9 million and has fully offset our net deferred tax assets. We will continue to recognize deferred tax valuation allowances until the realization of deferred benefits becomes more-likely-than-not. The utilization of our NOLs to offset taxable income in future periods may be limited if we undergo an ownership change based on the criteria in Section 382 of the Internal Revenue Code. See further discussion of the potential limitations on the utilization of our net operating losses as part of "Item 1A. Risk Factors".
As of December 31, 2017, 2016 and 2015, there were no unrecognized tax benefits, including interest and penalties that would be required to be recognized in our financial statements.
On December 22, 2017, the United States enacted the Tax Cuts and Jobs Act ("Tax Act") which, among other things, lowered the U.S. Federal tax rate from 35% to 21%, repealed the corporate alternative minimum tax, and provided for a refund of previously accrued alternative minimum tax credits. We are still analyzing certain aspects of the Tax Act, which could potentially affect the measurement of our income tax balances and future income tax expense or benefit. See further discussion of the Tax Act in "Note 12. Income taxes" in the Notes to our Consolidated Financial Statements.
Our Liquidity, capital resources and capital commitments
Overview
Our primary sources of capital resources and Liquidity (defined as cash and restricted cash plus the unused borrowing base under the DIP Credit Agreement) have historically consisted of internally generated cash flows from operations, borrowings under certain credit agreements, issuances of debt securities, dispositions of non-strategic assets, joint ventures and the capital markets when conditions are favorable. Our ability to issue additional indebtedness, dispose assets, enter into joint ventures or access the capital markets may be substantially limited or nonexistent during ourthe Chapter 11 proceedingsCases and will require court approval in most instances. Accordingly, our Liquidity will depend mainly on cash generated from operating activities and available funds under the DIP Credit Agreement. Factors that could impact our Liquidity, capital resources and capital commitments include the following:
the outcome of potential strategic alternatives to maximize value for the benefit of our stakeholders as part of the Chapter 11 process, which may include a sale of certain or substantially all of our assets under Section 363 of the Bankruptcy Code, a plan of reorganization to equitize certain indebtedness, or a combination thereof;
significant costs associated with the bankruptcy process, including our ability to limit these costs by obtaining confirmation of a successful plan of reorganization in a timely manner;
decisions from the Court related to requirements to pay interest on certain debt instruments during the bankruptcy process;
decisions from the Court related to the rejection of certain executory contracts, including certain sales, firm transportation and gathering contracts;
our ability to maintain compliance with debt covenants;
reductions to our borrowing basecovenants under the DIP Credit Agreement, which may begin on January 1, 2019 if we elect to extend the maturity of the DIP Credit Agreement;
our ability to fund, finance or repay indebtedness, including our ability to restructure our indebtedness during the Chapter 11 Cases;
limitations on our ability to incur certain types of indebtedness in accordance with our debt agreements;
requirements to provide certain vendors and other parties with letters of credit or cash deposits as a result of our credit quality, which reduce the amount of available borrowings under the DIP Credit Agreement;
costs related to the settlement of pre-petition claims;
our ability to obtain exit financing on favorable terms in order to consummate a plan of reorganization prior to the maturity of the DIP Credit Agreement on May 22, 2019, or our ability to obtain the waivers or consents required from the DIP Lenders to extend the DIP Credit Agreement;
the level of planned drilling activities;
the results of our ongoing drilling programs;
potential acquisitions and/or dispositions of oil and natural gas properties or other assets;
the integration of acquisitions of oil and natural gas properties or other assets;
our ability to effectively manage operating, general and administrative expenses and capital expenditure programs, specifically related to pricing pressures from key vendors utilized in our drilling, completion and operating activities;
reduced oil and natural gas revenues resulting from, among other things, depressed oil and natural gas prices and lower production from reductions toin our drilling and development activities;
our ability to mitigate commodity price volatility with commodity derivative financial instruments; and
the potential outcome of litigation.
Recent events affecting Liquidity
Our Liquidity and ability to maintain compliance with debt covenants have been negatively impacted by the prolonged depressed oil and natural gas price environment, levels of indebtedness, and gathering, transportation and certain other commercial contracts. During 2017, we closed a series of transactions that were intended to improve our Liquidity and capital structure. Despite our significant efforts to improve our financial condition, we continued to face increasing liquidity concerns. Due to liquidity constraints and restrictions and limitations on our ability to pay interest in cash, common shares or additional indebtedness, we did not make our interest payment on the 1.75 Lien Term Loans that was due on December 20, 2017 and the interest payment on the Second Lien Term Loans that was due on December 26, 2017. In anticipation of certain events of
default related to compliance with financial covenants and failure to pay interest on certain debt instruments, we entered into agreements with certain holders of the indebtedness under our EXCO Resources Credit Agreement, 1.5 Lien Notes, and 1.75 Lien Term Loans to forbear from exercising their rights and remedies as a result of an event of default under such debt instruments until January 15, 2018. Our Liquidity was $55.5 million as of December 31, 2017.
On January 15, 2018, the Company and the Filing Subsidiaries filed voluntary petitions for relief under Chapter 11 of the Bankruptcy Code. We expect to continue to incur significant costs associated with the bankruptcy process, including legal, financial and restructuring advisors to the Company and certain of our creditors. Therefore, our ability to obtain confirmation of a successful plan of reorganization in a timely manner is critical to ensuring our Liquidity is sufficient during the bankruptcy process.
On January 22, 2018, we closed the DIP Credit Agreement, which includes an initial borrowing base of $250.0 million. The proceedsmillion and maturity date of January 22, 2019. Proceeds from the DIP Credit Agreement were used to refinancerepay all obligations outstanding under the EXCO Resources Credit Agreement and will provide additional liquidity to fund our operations during the Chapter 11 process. Our capital budget for 2018 is limitedLiquidity was $144.2 million as of December 31, 2018.
On January 15, 2019, we entered into an amendment to $125.0 million inthe DIP Credit Agreement to extend the maturity date from January 22, 2019 to May 22, 2019. In order to preserve our Liquidity duringrepay the pendencyDIP Facilities at maturity, we currently expect that we would need to seek additional financing, sell assets, refinance or restructure the DIP Facilities prior to maturity or extend the maturity date of the bankruptcy process. We expectDIP Facilities. A further extension of the DIP Facilities beyond the scheduled maturity date would require a waiver or consent from the DIP Lenders. If we are required to incur significant costs associatedseek additional financing, we may not be able to obtain such financing on favorable terms or at all.
On March 8, 2019, the Debtors filed the March 2019 Plan and related Disclosure Statement with the bankruptcy process, including legal, financial and restructuring advisors toCourt; however, we have not received consents from any creditors in support of the Company and certain ofMarch 2019 Plan. Therefore, our creditors. Our ability to obtain confirmation ofconfirm a successful plan of reorganization in a timely manner is criticalsubject to ensuringfactors beyond our Liquiditycontrol, including actions of the Court and creditors. As a result, it is sufficient duringunlikely that we will be able to consummate a plan of reorganization prior to the bankruptcy process.
maturity of the DIP Facilities. Therefore, our long-term liquidity and the adequacy of our capital resources are highly uncertain at this time.
The following table presents information relating to our Liquidity and outstanding principal balances of our debt as of December 31, 2017 and February 28, 2018:
| | | (in thousands) | | December 31, 2017 | | February 28, 2018 | | December 31, 2018 |
| DIP Credit Agreement | | $ | — |
| | $ | 156,406 |
| | $ | 156,406 |
|
| EXCO Resources Credit Agreement | | 126,401 |
| | — |
| |
| 1.5 Lien Notes | | 316,958 |
| | 316,958 |
| | 316,958 |
|
| 1.75 Lien Term Loans | | 708,926 |
| | 708,926 |
| | 708,926 |
|
| Exchange Term Loan | | 17,246 |
| | 17,246 |
| |
| Second Lien Term Loans | | | 17,246 |
|
| 2018 Notes | | 131,345 |
| | 131,345 |
| | 131,576 |
|
| 2022 Notes | | 70,169 |
| | 70,169 |
| | 70,169 |
|
| Total principal balance of debt | | $ | 1,371,276 |
| | $ | 1,401,050 |
| |
| Total debt | | | $ | 1,401,281 |
|
| Net debt | | $ | 1,316,408 |
| | $ | 1,295,884 |
| | $ | 1,338,691 |
|
| Borrowing base | | $ | 150,000 |
| | $ | 250,000 |
| | $ | 250,000 |
|
| Unused borrowing base (1) | | $ | 605 |
| | $ | 69,600 |
| | $ | 81,600 |
|
| Cash (2) | | $ | 54,868 |
| | $ | 105,166 |
| | $ | 62,590 |
|
| Unused borrowing base plus cash | | $ | 55,473 |
| | $ | 174,766 |
| | $ | 144,190 |
|
| |
| (1) | Net of $23.0 million and $24.0$12.0 million in letters of credit as ofat December 31, 2017 and February 28, 2018, respectively.2018. |
| |
| (2) | Includes restricted cash of $15.3 million and $7.4$16.0 million at December 31, 2017 and February 28, 2018, respectively.2018. |
As of January 15, 2018,the Petition Date, we had approximately $1.4 billion in principal amount of indebtedness. The filing of the Chapter 11 Cases described above constituted an event of default that accelerated our obligations under the following debt instruments:
(i) EXCO Resources Credit Agreement;
(ii) 1.5 Lien Notes;
(iii) 1.75 Lien Term Loans;
(iv) 2018 Notes; and
(v) 2022 Notes.
These debt instruments provide that as a result of the commencement of the Chapter 11 Cases, the principal and interest due thereunder shall be immediately due and payable. In addition, we were in default under the Second Lien Term Loans as a result of our failure to make interest payments. Any efforts to enforce such payment obligations under the debt instruments are automatically stayed as a result of the commencement of the Chapter 11 Cases, and the creditors’ rights of enforcement inwith respect ofto the debt instruments are subject to the applicable provisions of the Bankruptcy Code.
The proceeds Proceeds from the DIP FacilitiesCredit Agreement were used to refinancerepay all obligations under the EXCO Resources Credit Agreement and the EXCO Resources Credit Agreement was terminated. On February 22, 2018, the Court approved our ability to make adequate protection payments for interest on the DIP Credit Agreement and the 1.5 Lien Notes.
The DIP Credit Agreement contains certain financial covenants, including, but not limited to:
our cash (as defined in the DIP Credit Agreement) plus unused commitments under the DIP Credit Agreement cannot be less than of $20.0 million ("(“Minimum Liquidity Test"Test”); and
aggregate disbursements cannot exceed 120% of the aggregate disbursements (excluding professional fees incurred in the Chapter 11 Cases) set forth in the 13-week forecasts provided to the administrative agent of the DIP Credit Agreement. The testing period is based on the immediately preceding four-week period and is measured every two weeks. The 13-week forecast is provided to the administrative agent on a monthly basis and shall be consistent in all material respects with the applicable period covered by the 2018 budget that was previously delivered to the administrative agent of the DIP Credit Agreement.
As of December 31, 2018, we were in compliance with all of the covenants under the DIP Credit Agreement. The DIP Credit Agreement contains events of default, including: (i) conversion of the Chapter 11 Cases to cases under Chapter 7 of the Bankruptcy Code and (ii) appointment of a trustee, examiner or receiver in the Chapter 11 Cases.
The DIP Facilities will mature on the earliest of (a) 12 months from the initial borrowings on January 22, 2018, (b) the effective date of a plan of reorganization in the Chapter 11 Cases and (c) the date of termination of all revolving commitments and/or the acceleration of the obligations under the DIP Facilities following an event of default. We have the option, subject to certain conditions, to extend the maturity of the DIP Facilities to the date that is 18 months from the initial borrowing date. See further discussion of the DIP Credit Agreement in "Note 17. Subsequent events" in the Notes to our Consolidated Financial Statements.
Historical sources and uses of funds
Net increases (decreases) in cash are summarized as follows:
|
| | | | | | | | | | | | |
| | | Year Ended December 31, |
| (in thousands) | | 2017 | | 2016 | | 2015 |
| Net cash provided by (used in) operating activities | | $ | 54,411 |
| | $ | (414 | ) | | $ | 134,027 |
|
| Net cash used in investing activities | | (182,551 | ) | | (55,009 | ) | | (300,833 | ) |
| Net cash provided by (used in) financing activities | | 158,669 |
| | 52,244 |
| | 132,748 |
|
| Net increase (decrease) in cash | | $ | 30,529 |
| | $ | (3,179 | ) | | $ | (34,058 | ) |
|
| | | | | | | | |
| | | Year Ended December 31, |
| (in thousands) | | 2018 | | 2017 |
| Net cash provided by operating activities | | $ | 133,996 |
| | $ | 54,411 |
|
| Net cash used in investing activities | | (150,217 | ) | | (178,430 | ) |
| Net cash provided by financing activities | | 23,943 |
| | 158,669 |
|
| Net increase in cash | | $ | 7,722 |
| | $ | 34,650 |
|
Operating activities
The primary factors impacting our cash flows from operating activities generally include: (i) levels of production from our oil and natural gas properties, (ii) prices we receive from sales of oil and natural gas production, including settlement proceeds or payments related to our oil and natural gas derivatives, (iii) operating costs of our oil and natural gas properties, (iv) costs of our general and administrative activities, including legal and professional fees related to the Chapter 11 Cases during the year ended December 31, 2018 and (v) interest expense. Our cash flows from operating activities have historically been impacted by fluctuations in oil and natural gas prices and our production volumes.
For the year ended December 31, 2017,2018, our net cash provided by operating activities was $54.4 million as compared to net cash used in operating activities of $0.4 million for the year ended December 31, 2016. The increase was primarily due to higher oil and natural gas prices, lower cash interest payments and more favorable working capital conversions, partially offset by lower production and lower cash receipts on derivative contracts.
For the year ended December 31, 2016, our net cash used in operating activities was $0.4$134.0 million as compared to net cash provided by operating activities of $134.0$54.4 million for the year ended December 31, 2015.2017. The decreaseincrease in cash provided by operating activities was primarily attributabledue to lowerincreases in revenues from decreasedrelated to increased production and lower averageimproved oil and natural gas prices and reductions in 2016. In addition, the decrease was due to lower cash receipts on derivative contracts of $39.1 million for the year ended December 31, 2016 compared to $128.8 million for the year ended December 31, 2015. Working capital conversions contributed to a $35.3 million decrease in cash flows from operations for the year ended December 31, 2016, primarilygathering expenses due to the timingrejection of collectionscertain midstream contracts. This was partially offset by significant payments for legal and professional fees related to the Chapter 11 Cases. See “Note 1. Organization and basis of accounts receivablepresentation” in the Notes to our Consolidated Financial Statements for oil and natural gas sales, and costs incurred for our development program in late 2015 that were paid in early 2016.further discussion of the impact of the Chapter 11 Cases.
Investing activities
Our investing activities consist primarily of drilling and development expenditures, acquisitions and divestitures. Future acquisitions are dependentFor the year ended December 31, 2018, our net cash used in investing activities was $150.2 million, which primarily consisted of development activities focused on oilthe North Louisiana and natural gas prices, availabilitySouth Texas regions of attractive acreage$166.0 million. This is partially offset by $14.8 million of cash held by OPCO and other oil and natural gas properties, acceptable ratesAppalachia Midstream that was acquired as a result of return, and availability of capital.
the Appalachia JV Settlement. For the year ended December 31, 2017, our net cash used in investing activities of $182.6was $178.4 million, which primarily consisted of $147.0 million of drilling and completion activities in the North Louisiana region. In addition, we acquired oil and gas properties and undeveloped acreage in the North Louisiana region for $24.2 million.million during the year ended December 31, 2017.
Financing activities
For the year ended December 31, 2016,2018, our net cash used in investingprovided by financing activities was $55.0 million that primarily consisted of $79.4$23.9 million. Proceeds from the DIP Credit Agreement were used to repay all obligations outstanding under the EXCO Resources Credit Agreement and we expect the DIP Credit Agreement to provide additional liquidity to fund our operations during the Chapter 11 process. In addition, we spent $6.1 million of completion activitiesfinancing costs related to issuance of the DIP Facilities. See “Note 5. Debt” in the East Texas region and development activities in the North Louisiana region. This was partially offset by $14.3 million of proceeds received primarily from the sale of certain non-core undeveloped acreage in South Texas and our interests in four producing wells and the sale of our shallow conventional assets in Appalachia.
For the year ended December 31, 2015, our net cash used in investing activities was $300.8 million primarily dueNotes to our drilling and completion activities inConsolidated Financial Statements for further discussion of the East Texas, North Louisiana and South Texas regions. The cash used in investing activities for the year ended December 31, 2015 included a significant amount of expenditures related to the wells drilled in 2014.
Financing activitiesDIP Facilities.
For the year ended December 31, 2017, our net cash provided by financing activities was $158.7 million. We receivedmillion primarily due to $295.5 million of net proceeds from the 1.5 Lien Notes, which we used to repay borrowings under the EXCO Resources Credit Agreement in the amount of $265.6 million. We subsequently had net borrowings of $163.4 million under the EXCO Resources Credit Agreement, which exhausted substantially all of our remaining unused commitments under the EXCO Resources Credit Agreement. In addition, we made paymentsused cash to pay $22.1 million of $22.1 millioncosts primarily related to debt restructuring activities during the first quarter of 2017, and we made payments of $11.6 million on a portion of the Exchange Term Loan, which reduced its carrying value.
For the year ended December 31, 2016,Capital expenditures
During 2018, our net cash provided by financing activities was $52.2capital expenditures of $156.8 million were focused primarily due to $161.1 million in net borrowings under the EXCO Resources Credit Agreement partially offset by payments of $50.7 million on the Exchange Term Loan, which reduced its carrying value, and an aggregate of $53.3 million of cash payments used to repurchase a portion of our 2018 Notes and 2022 Notes. On March 29, 2016, we borrowed our remaining unused commitments of $232.4 million under the EXCO Resources Credit Agreement to secure our Liquidity. Prior to the completiondevelopment of the borrowing base redetermination process on March 29, 2016, we repaidHaynesville and Eagle Ford shales. The development of the entire $232.4 million.Haynesville shale in North Louisiana included drilling 6 gross (3.6 net) operated well and turning-to-sales 13 gross (7.4 net) operated wells. The borrowing and subsequent repayment both occurred on the same day.completion activities in North Louisiana primarily
For
included wells drilled in prior year. Our development program for the year ended December 31, 2015, our net cash provided by financing activities was $132.7 million primarily dueEagle Ford shale included drilling 14 gross (11.3 net) operated wells and completing 16 gross (12.9 net) operated wells to $300.0 million of proceeds received frompreserve the Fairfax Term Loan and $165.0 million in borrowings under the EXCO Resources Credit Agreement. We used the proceeds from the Fairfax Term Loan to repay the outstanding indebtedness under the EXCO Resources Credit Agreement. The issuance of the Exchange Term Loan and the related retirements of the 2018 and 2022 Notes were conducted simultaneously with the same creditors and did not impact our cash flows from financing activities. In addition, we used cash to pay $20.9 million of deferred financing costs primarily related to recent debt restructuring activities, repurchase a portion of the 2018 Notes for $12.0 million and a cash payment of $8.8 million that reduced the carrying value of certain acreage with leasehold obligations and provide attractive rates of return. Our drilling and completion activities included $21.5 million for the Exchange Term Loan.
Capital expendituresdevelopment of non-operated wells.
During 2017, our capital expenditures, including oil and natural gas property acquisitions, totaled $189.9 million, of which $147.9 million was primarily related to the development of the Haynesville shale and the appraisal of the Bossier shale in North Louisiana. Our development program in North Louisiana during 2017 included drilling 29 gross (17.9 net) operated wells and turning-to-sales 12 gross (8.4 net) operated wells. The development program in this region included a significant amount of capital expenditures on wells that willto be completed in subsequent years. As of December 31, 2017, we had 17 gross (9.3 net) operated wells in North Louisiana that were drilled and waiting on completion or in various stages of the completion process. In addition, we restarted development activities in South Texas focused on the Eagle Ford shale in late 2017. This included drilling 2 gross (1.6 net) operated wells during 2017. Our oil and natural gas property acquisitions during 2017 primarily included incremental interests in certain oil and natural gas properties that we operate and undeveloped acreage in the North Louisiana region.
During 2016, our capital expenditures, including oil and natural gas property acquisitions, totaled $79.4 million, of which $62.3 million was related to drilling and completion activities. Our development program during 2016 included an operated drilling rig for a portion of the year focused on the Haynesville shale in North Louisiana, to drill and complete 6 gross (5.2 net) operated wells. The wells drilled in 2016 featured a modified Haynesville shale well design which included enhanced completion methods, including the use of more proppant and longer laterals. We also completed 8 gross (3.6 net) operated wells in the Haynesville and Bossier shales in the Shelby area of East Texas.
During 2015, our capital expenditures, including oil and natural gas property acquisitions, totaled $284.8 million, of which $228.5 million was related to drilling and development activities. Our development program during 2015 focused
primarily on the Haynesville and Bossier shales in the Shelby area of East Texas. Our development activities in North Louisiana during 2015 included limited drilling as well as completion activities. Our capital expenditures in the South Texas region focused on the development of the Eagle Ford shale and the Buda formation, as well as the leasing of acreage in Zavala County, Texas. As a result of the decline in oil prices, we suspended our drilling in the South Texas region in the fourth quarter of 2015. We drilled an appraisal well in the Marcellus shale in Northeast Pennsylvania, which will be turned-to-sales in 2018 upon construction of a gathering line.
The following table presents our capital expenditures for the years ended December 31, 2017, 20162018 and 2015.2017.
| | | | | Year Ended December 31, | | Year Ended December 31, |
| (in thousands) | | 2017 | | 2016 | | 2015 | | 2018 | | 2017 |
| Capital expenditures: | | | | | | | | | | |
| Lease purchases and seismic | | $ | 5,854 |
| | $ | 767 |
| | $ | 13,364 |
| | $ | 1,177 |
| | $ | 5,854 |
|
| Development capital expenditures | | 147,861 |
| | 62,328 |
| | 228,545 |
| | 146,834 |
| | 147,861 |
|
| Field operations, gathering and water pipelines | | 220 |
| | 667 |
| | 6,672 |
| | 1,208 |
| | 220 |
|
| Corporate and other | | 11,483 |
| | 14,637 |
| | 28,602 |
| | 7,546 |
| | 11,483 |
|
| Total capital expenditures excluding oil and natural gas property acquisitions | | 165,418 |
| | 78,399 |
| | 277,183 |
| | 156,765 |
| | 165,418 |
|
Oil and natural gas property acquisitions | | 24,465 |
| | 1,031 |
| | 7,608 |
| | — |
| | 24,465 |
|
| Total capital expenditures including oil and natural gas property acquisitions | | $ | 189,883 |
| | $ | 79,430 |
| | $ | 284,791 |
| | $ | 156,765 |
| | $ | 189,883 |
|
| |
| (1) | The fair value of the assets and liabilities acquired as a result of the Appalachia JV Settlement was $128.9 million, which includes the acquired interests in oil and gas properties and the consolidation of the net assets of OPCO and Appalachia Midstream. Per the terms of the settlement agreement, the acquisition of interests in oil and gas properties and equity investments did not require us to transfer any cash consideration. See "Note 3. Acquisitions, divestitures and other significant events" in the Notes to our Consolidated Financial Statements for further discussion of the Appalachia JV Settlement. |
2018
2019 Capital Budget
Our capital budget for 20182019 includes $124.0$136.8 million for drilling and completion activities focused on the Haynesville and Eagle Ford shales. The development ofWe plan to drill 1 gross (0.6 net) operated well in the Haynesville shale in North Louisiana includes drilling 1during the first quarter of 2019 and turn-to-sales 11 gross (0.7(6.2 net) operated well andwells in the completionHaynesville shale during the first three quarters of 112019. We plan to drill 26 gross (6.7(8.5 net) operated wells. The completion activitieswells and turn-to-sales 23 gross (7.4 net) operated wells in North Louisiana primarily include wells drilled in prior year. Our development program for the Eagle Ford shale includes theduring 2019. Our plans for 2019 include drilling of 10and turning-to-sales 2 gross (8.0(1.9 net) operated Marcellus shale wells in Northeast Pennsylvania and completion of 121 gross (9.6(1.0 net) operated wells that will preserveappraisal well targeting the valuedry gas window of certain acreage with leasehold obligations.the Utica shale in Central Pennsylvania. Our drilling and completion activities include $21.0$15.0 million to participate in the development of non-operated wells. In addition, we plan to spend a limited amount of capital on refracs, maintenance and leasehold costs. The capital expenditures associated with the development plans are highly concentrated in the first half of 2018. The 20182019 capital budget is currently allocated as follows:
| | | (in thousands) | | 2018 Capital Budget | | 2019 Capital Budget |
| Lease purchases and seismic | | $ | 4,000 |
| | $ | 4,000 |
|
| Development capital expenditures | | 113,000 |
| | 136,800 |
|
| Field operations, gathering and water pipelines | | 3,000 |
| | 6,600 |
|
| Corporate and other | | 4,000 |
| | 4,000 |
|
| Total capital expenditures | | $ | 124,000 |
| | $ | 151,400 |
|
Derivative
If we are unable to consummate a plan of reorganization in a timely manner, our liquidity may be significantly constrained unless we obtain consents or waivers to further extend the DIP Facilities beyond the scheduled maturity date of May 22, 2019 or refinance the DIP Facilities. As a result, our capital budget for 2019 may be subject to change in order to preserve our liquidity. Furthermore, the composition of our board of directors is expected to change significantly following the Chapter 11 Cases. Our capital budget for 2019 may be subject to change if there are differing perspectives on our strategy between our current and future board of directors.
Commodity derivative financial instruments
Our production is generally sold at prevailing market prices. WeHistorically, we have historically entered into oil and natural gas derivative contracts for a portion of our production to mitigate the impact of commodity price fluctuations and achieve a more predictable cash flow associated with our operations. These transactions limit our exposure to declines in prices, but also limit the benefits we would realize if oil and natural gas prices increase.
As of December 31, 2017, we hadDuring the Chapter 11 Cases, our ability to enter into commodity derivative financial instruments in place forcontracts covering estimated future production is limited under the volumes and prices shown below:
|
| | | | | | | | | | | | | |
| | NYMEX gas volume - Bbtu | | Weighted average contract price per Mmbtu | | NYMEX oil volume - Mbbl | | Weighted average contract price per Bbl |
| Swaps: | | | | | | | | |
| 2018 | | 3,650 |
| | $ | 3.15 |
| | — |
| | — |
|
In January 2018,DIP Credit Agreement. We are only permitted to enter into commodity derivative contracts with lenders under the counterparty to our remaining swap contracts early terminated the outstanding contracts effective January 31, 2018. We received proceeds of $0.5 million for the settlement of these contracts in February 2018.DIP Credit Agreement. As a result, we
no longer have any may not be able to enter into commodity derivative financial instrumentscontracts covering our production in future periods on favorable terms or at all. If we cannot or choose not to mitigate the impact of fluctuationsenter into commodity derivative contracts in the market prices of oil and natural gas.future, we could be more affected by changes in commodity prices. Historically, oil and natural gas prices have been volatile and are dependent on factors outside of our control. ReductionsOur inability to hedge the risk of low commodity prices in the marketfuture, on favorable terms or at all, could have a material adverse impact on our business, financial condition and results of operations. Our exposure to commodity price offluctuations will increase in the future due to lower oil and natural gas pricesvolumes covered by derivative contracts compared to historical levels.
As of December 31, 2018, we had no derivative financial instruments in place to mitigate the impact of commodity price fluctuations for future may adversely affect our revenues as well as our ability to fund our operations and maintain compliance with debt covenants.production. See further details on our derivative financial instruments in "Note“Note 4. Derivative financial instruments"instruments” and "Note“Note 6. Fair value measurements"measurements” in the Notes to our Consolidated Financial Statements.
Off-balance sheet arrangements
As of December 31, 2017,2018, we had no arrangements or any guarantees of off-balance sheet debt to third parties.
Contractual obligations and commercial commitments
The following table presents our contractual obligations and commercial commitments as of December 31, 2017 and does not include those of our equity method investments. Our remaining obligations under many of these obligations and commitments will be materially impacted by the outcome of our Chapter 11 proceedings. See "Note 17. Subsequent events" in the Notes to our Consolidated Financial Statements for additional information.
|
| | | | | | | | | | | | | | | | | | | | |
| | | Payments due by period |
| (in thousands) | | Less than one year | | One to three years | | Three to five years | | More than five years | | Total |
| EXCO Resources Credit Agreement (1) | | $ | 126,401 |
| | $ | — |
| | $ | — |
| | $ | — |
| | $ | 126,401 |
|
| 1.5 Lien Notes (2) | | — |
| | — |
| | 316,958 |
| | — |
| | 316,958 |
|
| 1.75 Lien Term Loans (3) | | — |
| | 708,926 |
| | — |
| | — |
| | 708,926 |
|
| Exchange Term Loan (4) | | — |
| | 17,246 |
| | — |
| | — |
| | 17,246 |
|
| Senior Notes (5) | | 131,576 |
| | — |
| | 70,169 |
| |
|
| | 201,745 |
|
| Gathering and firm transportation services (6) | | 87,621 |
| | 94,004 |
| | 66,612 |
| | 94,443 |
| | 342,680 |
|
| Other fixed commitments (7) | | 3,222 |
| | 4,364 |
| | 1,601 |
| | — |
| | 9,187 |
|
| Drilling contracts (8) | | 1,138 |
| | — |
| | — |
| | — |
| | 1,138 |
|
| Operating leases and other | | 3,760 |
| | 4,771 |
| | 36 |
| | — |
| | 8,567 |
|
| Total contractual obligations | | $ | 353,718 |
| | $ | 829,311 |
| | $ | 455,376 |
| | $ | 94,443 |
| | $ | 1,732,848 |
|
| |
(1) | The EXCO Resources Credit Agreement matures on July 31, 2018. The interest rate grid on the revolving credit facility of the EXCO Resources Credit Agreement ranges from LIBOR plus 225 bps to 325 bps (or ABR plus 125 bps to 225 bps), depending on the percentages of drawn balances to the borrowing base. On January 22, 2018, we utilized the proceeds from the DIP Facilities to refinance all obligations under the EXCO Resources Credit Agreement. |
| |
(2) | The 1.5 Lien Notes mature on March 20, 2022. The 1.5 Lien Notes bear interest at a cash interest rate of 8% per annum, or, if we elect to make interest payments on the 1.5 Lien Notes by issuing common shares or additional 1.5 Lien Notes, at an interest rate of 11% per annum. Based on the outstanding principal balance as of December 31, 2017, the annual interest obligation is $25.4 million if paid in cash or $34.9 million if paid in-kind with additional 1.5 Lien Notes or common shares. |
| |
(3) | The 1.75 Lien Term Loans mature on October 26, 2020. The 1.75 Lien Term Loans bear interest at a cash interest rate of 12.5% per annum, or, if we elect to make interest payments on the 1.75 Lien Term Loans by issuing common shares additional 1.75 Lien Term Loans, at an interest rate of 15% per annum. Based on the outstanding principal balance as of December 31, 2017, the annual interest obligation is $88.6 million if paid in cash or $106.3 million if paid in-kind with additional 1.75 Lien Term Loans or common shares. |
| |
(4) | The Exchange Term Loan matures on October 26, 2020. Based on the outstanding principal balance as of December 31, 2017, the annual interest obligation on the Exchange Term Loan is $2.2 million based on the interest rate of 12.5% per annum. |
| |
(5) | The 2018 Notes are due on September 15, 2018 and the 2022 Notes are due on April 15, 2022. Based on the outstanding principal balance at December 31, 2016, the annual interest obligation on the 2018 Notes and 2022 Notes is $7.0 million and $6.0 million, respectively. |
| |
(6) | Gathering and firm transportation services reflect contracts whereby EXCO commits to transport a minimum quantity of natural gas on a gatherer's system or a shipper's pipeline. Whether or not EXCO delivers the minimum quantity, we pay the fees as if the quantities were delivered. These expenses represent our gross commitments under these contracts and a portion of these costs will be incurred by working interest and other owners. As described in "Note 2. Summary of significant accounting policies" in the Notes to our Consolidated Financial Statements, we report these costs as gathering and transportation expenses or as a reduction in total sales price received from the purchaser. In addition, our variable rate gathering and firm transportation contracts do not have a minimum volume commitment and are not included in the table above. As such, our gathering and firm transportation services |
presented in the table above may not be representative of the amounts reported as gathering and transportation expenses in our Consolidated Financial Statements.
During 2017, we accelerated the remaining costs under a firm transportation agreement as a result of our default. As of December 31, 2017, the unpaid amounts and remaining charges under this agreement were $67.3 million and are recorded as a liability in "Revenue and royalties payable" in our Consolidated Balance Sheet. Therefore, the amounts payable related to this agreement were excluded from the table above. In addition, we are in litigation related to certain other sales and transportation contracts. The commitments related to the contracts currently in litigation are included in the table above and the termination of these contracts will not be reflected in our financial results until the litigation is resolved and it is deemed to be realized in accordance with GAAP. See "Note 8. Commitments and contingencies" in the Notes to our Consolidated Financial Statements for additional information.
| |
(7) | Other fixed commitments are primarily related to minimum sales commitments under marketing contracts. |
| |
(8) | Drilling contracts represent the contractual rate for our operated rigs through the term of the contracts as of December 31, 2017. The actual drilling costs under these contracts will be incurred by working interest owners in the development of the related properties. |
Item 7A. Quantitative and Qualitative Disclosures About Market Risk
Some of the
The information below contains forward-looking statements. The primary objective of the following information is to provide forward-looking quantitative and qualitative information about our potential exposure to market risks. The term “market risk” refersrequired herein has been omitted due to the riskrelief from disclosure afforded to smaller reporting companies under Regulation S-K and Article 8 of loss arising from adverse changes in oil and natural gas prices, interest rates charged on borrowings and earned on cash equivalent investments, and adverse changes in the market value of marketable securities. The disclosure is not meant to be a precise indicator of expected future losses, but rather an indicator of reasonably possible losses. This forward-looking information provides an indicator of how we view and manage our ongoing market risk exposures. Our market risk sensitive instruments were entered into for hedging and investment purposes, not for trading purposes.
Commodity price risk
Our most significant market risk exposure is in the pricing applicable to our oil and natural gas production. Realized pricing is primarily driven by the prevailing worldwide price for crude oil and spot market prices for natural gas. Pricing for oil and natural gas production is volatile. For the year ended December 31, 2017, a $1.00 decrease in the average commodity price per Mcfe would have resulted in a decrease in oil and natural gas revenues, excluding the impact of commodity derivative financial instruments, of approximately $87.1 million.
We have historically entered into derivative financial instruments to manage our exposure to commodity price fluctuations, protect our returns on investments, and achieve a more predictable cash flow in connection with our financing activities and borrowings related to these activities. These transactions limit exposure to declines in prices, but also limit the benefits we would realize if oil and natural gas prices increase. Subsequent to the early termination of a natural gas swap contract in January 2018, our future production is not covered by any commodity derivative financial instruments. During the Chapter 11 proceedings, our ability to enter into new commodity derivative contracts covering additional estimated future production is limited under the DIP Credit Agreement. We are only permitted to enter into additional commodity derivative contracts with lenders under the DIP Credit Agreement. As a result, we may not be able to enter into additional commodity derivative contracts covering our production in future periods on favorable terms or at all. If we cannot or choose not to enter into commodity derivative contracts in the future, we could be more affected by changes in commodity prices. Our inability to hedge the risk of low commodity prices in the future, on favorable terms or at all, could have a material adverse impact on our business, financial condition and results of operations.
Interest rate risk
At December 31, 2017, our exposure to interest rate changes related primarily to borrowings under the EXCO Resources Credit Agreement. The interest rates per annum on the 2018 Notes, 2022 Notes and Second Lien Term Loans are fixed at 7.5%, 8.5% and 12.5%, respectively. The 1.5 Lien Notes bear interest at a cash interest rate of 8% per annum, or, if we elect to make interest payments on the 1.5 Lien Notes with our common shares or, in certain circumstances, by issuing additional 1.5 Lien Notes, at an interest rate of 11% per annum. The 1.75 Lien Term Loans bear interest at a cash rate of 12.5% per annum, or, if we elect to pay interest on the 1.75 Lien Term Loans with our common shares or, in certain circumstances, by issuing additional 1.75 Lien Term Loans, at an interest rate of 15.0% per annum.
On January 22, 2018, we closed the DIP Credit Agreement and utilized the proceeds to refinance all obligations outstanding under the EXCO Resources Credit Agreement. Interest is payable on borrowings under the DIP Credit Agreement based on an adjusted LIBOR plus 4.00% per annum. At February 28, 2018, we had approximately $156.4 million in outstanding borrowings under the DIP Credit Agreement. A 1.0% increase in interest rates (100 bps) based on the variableRegulation S-X.
borrowings as of February 28, 2018 would result in an increase in our interest expense of approximately $1.6 million per year. The interest we pay on these borrowings is set periodically based upon market rates.
Equity price risk
Our exposure to changes in our common share price primarily relate to the 2017 Warrants. We account for the 2017 Warrants as derivative instruments and record the warrants as a non-current liability at fair value, with the change in fair value recognized in earnings. The 2017 Warrants will be measured at fair value on a recurring basis until the underlying common share warrants are exercised or the date of expiration. The 2017 Warrants had a fair value of $2.0 million on December 31, 2017. As of December 31, 2017, a 10% increase in the price of our common shares would have increased the fair value of the liability related to the 2017 Warrants by approximately $0.3 million. As discussed in "Item 1A. Risk Factors", we believe it is highly likely that our existing common shares will be canceled at the conclusion of our Chapter 11 proceedings, and the holders of our existing common shares will be entitled to a limited recovery, if any.
| |
| Item 8. | Financial Statements and Supplementary Data |
EXCO Resources, Inc.
Index to Consolidated Financial Statements
Management's Report on Internal Control Over Financial Reporting
To the Board of Directors and Shareholders of
EXCO Resources, Inc.:
Management is responsible for establishing and maintaining adequate internal control over financial reporting (as defined in Rule 13a-15(f) under the Securities Exchange Act of 1934, as amended). Our internal control over financial reporting is designed to provide reasonable assurance to management and our Board of Directors regarding the preparation and fair presentation of published financial statements. Because of its inherent limitations, internal control over financial reporting may not prevent or detect misstatements. Therefore, even those systems determined to be effective can provide only reasonable assurance with respect to financial statement preparation and presentation. Management assessed the effectiveness of our internal control over financial reporting as of December 31, 2017.2018. In making this assessment, management used the criteria set forth by the Committee of Sponsoring Organizations of the Treadway Commission ("COSO") in Internal Control-Integrated Framework (2013). Based on management's assessment, management believes that, as of December 31, 2017,2018, our internal control over financial reporting was effective based on those criteria.
The effectiveness of EXCO Resources, Inc.'s internal control over financial reporting as of December 31, 2017 has been audited by KPMG LLP, an independent registered public accounting firm, as stated in their report which appears herein.
|
| | | | |
| By: | /s/ Harold L. Hickey | | By: | /s/ Tyler S. Farquharson |
| Title: | Chief Executive Officer and President | | Title: | Vice President, Chief Financial Officer and Treasurer |
| | | | | |
| Dallas, Texas | | | |
March 15, 201818, 2019 | | | |
Report of Independent Registered Public Accounting Firm
The
To the Shareholders and Board of Directors
EXCO Resources, Inc.:
Opinion on the Consolidated Financial Statements
We have audited the accompanying consolidated balance sheets of EXCO Resources, Inc. and subsidiaries (Debtor-in-Possession) (the Company)“Company”) as of December 31, 20172018 and 2016,2017, the related consolidated statements of operations, changes in shareholders’ equity, and cash flows for each of the years in the three-yeartwo-year period ended December 31, 2017,2018, and the related notes (collectively, the consolidated financial statements). In our opinion, the consolidated financial statements present fairly, in all material respects, the financial position of the Company as of December 31, 20172018 and 2016,2017, and the results of its operations and its cash flows for each of the years in the three-yeartwo‑year period ended December 31, 2017,2018, in conformity with U.S. generally accepted accounting principles.
We also have audited, in accordance with the standards of the Public Company Accounting Oversight Board (United States) (PCAOB), the Company’s internal control over financial reporting as of December 31, 2017, based on criteria established in Internal Control - Integrated Framework (2013) issued by the Committee of Sponsoring Organizations of the Treadway Commission, and our report dated March 15, 2018 expressed an unqualified opinion on the effectiveness of the Company’s internal control over financial reporting.
Going Concern
The accompanying consolidated financial statements have been prepared assuming that the Company will continue as a going concern. As discussed in noteNote 1 to the consolidated financial statements, the Company filed a voluntary petition for reorganization under Chapter 11 of the United States Bankruptcy Code on January 15, 2018, which raises substantial doubt about the Company’s ability to continue as a going concern. Management'sManagement’s plans in regard to this matter are also described in noteNote 1. The consolidated financial statements do not include any adjustments that might result from the outcome of this uncertainty.
Basis for Opinion
These consolidated financial statements are the responsibility of the Company’s management. Our responsibility is to express an opinion on these consolidated financial statements based on our audits. We are a public accounting firm registered with the Public Company Accounting Oversight Board (United States) (PCAOB) and are required to be independent with respect to the Company in accordance with the U.S. federal securities laws and the applicable rules and regulations of the Securities and Exchange Commission and the PCAOB.
We conducted our audits in accordance with the standards of the PCAOB. Those standards require that we plan and perform the audit to obtain reasonable assurance about whether the consolidated financial statements are free of material misstatement, whether due to error or fraud. The Company is not required to have, nor were we engaged to perform, an audit of its internal control over financial reporting. As part of our audits, we are required to obtain an understanding of internal control over financial reporting but not for the purpose of expressing an opinion on the effectiveness of the Company’s internal control over financial reporting. Accordingly, we express no such opinion.
Our audits included performing procedures to assess the risks of material misstatement of the consolidated financial statements, whether due to error or fraud, and performing procedures that respond to those risks. Such procedures included examining, on a test basis, evidence regarding the amounts and disclosures in the consolidated financial statements. Our audits also included evaluating the accounting principles used and significant estimates made by management, as well as evaluating the overall presentation of the consolidated financial statements. We believe that our audits provide a reasonable basis for our opinion.
/s/ KPMG LLP
We have served as the Company’s auditor since 2006
2006.
Dallas, Texas
March 15, 201818, 2019
Report of Independent Registered Public Accounting Firm
The Shareholders and Board of Directors
EXCO Resources, Inc.:
Opinion on Internal Control Over Financial Reporting
We have audited EXCO Resources, Inc. and subsidiaries’ (the Company) internal control over financial reporting as of December 31, 2017, based on criteria established in Internal Control - Integrated Framework (2013) issued by the Committee of Sponsoring Organizations of the Treadway Commission. In our opinion, the Company maintained, in all material respects, effective internal control over financial reporting as of December 31, 2017, based on criteria established in Internal Control - Integrated Framework (2013) issued by the Committee of Sponsoring Organizations of the Treadway Commission.
We also have audited, in accordance with the standards of the Public Company Accounting Oversight Board (United States) (PCAOB), the consolidated balance sheets of the Company as of December 31, 2017 and 2016, the related consolidated statements of operations, changes in shareholders’ equity, and cash flows for each of the years in the three-year period ended December 31, 2017, and the related notes, (collectively, the consolidated financial statements) and our report dated March 15, 2018 expressed an unqualified opinion on those consolidated financial statements.
Basis for Opinion
The Company’s management is responsible for maintaining effective internal control over financial reporting and for its assessment of the effectiveness of internal control over financial reporting, included in the accompanying Management’s Report on Internal Control Over Financial Reporting. Our responsibility is to express an opinion on the Company’s internal control over financial reporting based on our audit. We are a public accounting firm registered with the PCAOB and are required to be independent with respect to the Company in accordance with the U.S. federal securities laws and the applicable rules and regulations of the Securities and Exchange Commission and the PCAOB.
We conducted our audit in accordance with the standards of the PCAOB. Those standards require that we plan and perform the audit to obtain reasonable assurance about whether effective internal control over financial reporting was maintained in all material respects. Our audit of internal control over financial reporting included obtaining an understanding of internal control over financial reporting, assessing the risk that a material weakness exists, and testing and evaluating the design and operating effectiveness of internal control based on the assessed risk. Our audit also included performing such other procedures as we considered necessary in the circumstances. We believe that our audit provides a reasonable basis for our opinion.
Definition and Limitations of Internal Control Over Financial Reporting
A company’s internal control over financial reporting is a process designed to provide reasonable assurance regarding the reliability of financial reporting and the preparation of financial statements for external purposes in accordance with generally accepted accounting principles. A company’s internal control over financial reporting includes those policies and procedures that (1) pertain to the maintenance of records that, in reasonable detail, accurately and fairly reflect the transactions and dispositions of the assets of the company; (2) provide reasonable assurance that transactions are recorded as necessary to permit preparation of financial statements in accordance with generally accepted accounting principles, and that receipts and expenditures of the company are being made only in accordance with authorizations of management and directors of the company; and (3) provide reasonable assurance regarding prevention or timely detection of unauthorized acquisition, use, or disposition of the company’s assets that could have a material effect on the financial statements.
Because of its inherent limitations, internal control over financial reporting may not prevent or detect misstatements. Also, projections of any evaluation of effectiveness to future periods are subject to the risk that controls may become inadequate because of changes in conditions, or that the degree of compliance with the policies or procedures may deteriorate.
/s/ KPMG LLP
Dallas, Texas
March 15, 2018
EXCO RESOURCES, INC. (DEBTOR-IN-POSSESSION)
CONSOLIDATED BALANCE SHEETS
| | | (in thousands) | | December 31, 2017 | | December 31, 2016 | | December 31, 2018 | | December 31, 2017 |
| | | | | | | | | |
| Assets | | | | | | | | |
| Current assets: | | | | | | | | |
| Cash and cash equivalents | | $ | 39,597 |
| | $ | 9,068 |
| | $ | 46,541 |
| | $ | 39,597 |
|
| Restricted cash | | 15,271 |
| | 11,150 |
| | 16,049 |
| | 15,271 |
|
| Accounts receivable, net: | | | | | | | | |
| Oil and natural gas | | 55,692 |
| | 52,674 |
| | 61,947 |
| | 55,692 |
|
| Joint interest | | 30,570 |
| | 25,905 |
| | 32,089 |
| | 30,570 |
|
| Other | | 1,976 |
| | 3,813 |
| | 2,050 |
| | 1,976 |
|
| Derivative financial instruments - commodity derivatives | | 1,150 |
| | — |
| | — |
| | 1,150 |
|
| Other current assets | | 23,574 |
| | 8,007 |
| | 11,467 |
| | 23,574 |
|
| Total current assets | | 167,830 |
| | 110,617 |
| | 170,143 |
| | 167,830 |
|
| Equity investments | | 14,181 |
| | 24,365 |
| | 4,732 |
| | 14,181 |
|
| Oil and natural gas properties (full cost accounting method): | | | | | | | | |
| Unproved oil and natural gas properties and development costs not being amortized | | 118,652 |
| | 97,080 |
| | 155,646 |
| | 118,652 |
|
| Proved developed and undeveloped oil and natural gas properties | | 3,107,566 |
| | 2,939,923 |
| | 3,332,779 |
| | 3,107,566 |
|
| Accumulated depletion | | (2,752,311 | ) | | (2,702,245 | ) | | (2,831,293 | ) | | (2,752,311 | ) |
| Oil and natural gas properties, net | | 473,907 |
| | 334,758 |
| | 657,132 |
| | 473,907 |
|
| Other property and equipment, net and other non-current assets | | 21,274 |
| | 23,661 |
| | 37,531 |
| | 21,274 |
|
| Deferred financing costs, net | | — |
| | 4,376 |
| |
| Derivative financial instruments | | — |
| | 482 |
| |
| Goodwill | | 163,155 |
| | 163,155 |
| | 163,155 |
| | 163,155 |
|
| Total assets | | $ | 840,347 |
| | $ | 661,414 |
| | $ | 1,032,693 |
| | $ | 840,347 |
|
| Liabilities and shareholders’ equity | | | | | | | | |
| Current liabilities: | | | | | | | | |
| Accounts payable and accrued liabilities | | $ | 68,277 |
| | $ | 54,762 |
| | $ | 64,925 |
| | $ | 68,277 |
|
| Revenues and royalties payable | | 207,956 |
| | 120,845 |
| | 45,316 |
| | 207,956 |
|
| Accrued interest payable | | 27,637 |
| | 4,701 |
| | 7,088 |
| | 27,637 |
|
| Current portion of asset retirement obligations | | 600 |
| | 344 |
| | 600 |
| | 600 |
|
| Income taxes payable | | — |
| | — |
| |
| Derivative financial instruments - commodity derivatives | | — |
| | 27,711 |
| |
| Current maturities of long-term debt | | 1,362,500 |
| | 50,000 |
| | 473,364 |
| | 1,362,500 |
|
| Total current liabilities | | 1,666,970 |
| | 258,363 |
| | 591,293 |
| | 1,666,970 |
|
| Long-term debt | | — |
| | 1,258,538 |
| |
| Deferred income taxes | | 4,518 |
| | 2,802 |
| | — |
| | 4,518 |
|
| Derivative financial instruments - commodity derivatives | | — |
| | 464 |
| |
| Derivative financial instruments - common share warrants | | 1,950 |
| | — |
| | — |
| | 1,950 |
|
| Asset retirement obligations and other long-term liabilities | | 13,108 |
| | 13,153 |
| | 24,413 |
| | 13,108 |
|
| Liabilities subject to compromise | | | 1,443,483 |
| | — |
|
| Commitments and contingencies | | — |
| | — |
| | | | |
| Shareholders’ equity: | | | | | | | | |
| Common shares, $0.001 par value; 260,000,000 authorized shares; 21,670,186 shares issued and 21,630,541 shares outstanding at December 31, 2017; 18,915,952 shares issued and 18,876,307 shares outstanding at December 31, 2016 | | 22 |
| | 19 |
| |
| Common shares, par value $0.001, 260,000,000 shares authorized; 21,624,129 shares issued and 21,584,514 shares outstanding at December 31, 2018; 21,670,186 shares issued and 21,630,541 shares outstanding at December 31, 2017 | | | 22 |
| | 22 |
|
| Additional paid-in capital | | 3,539,422 |
| | 3,538,080 |
| | 3,541,822 |
| | 3,539,422 |
|
| Accumulated deficit | | (4,378,011 | ) | | (4,402,373 | ) | | (4,560,708 | ) | | (4,378,011 | ) |
| Treasury shares, at cost; 39,645 at December 31, 2017 and 2016 | | (7,632 | ) | | (7,632 | ) | |
| Treasury shares, at cost; 39,645 shares at December 31, 2018 and December 31, 2017 | | | (7,632 | ) | | (7,632 | ) |
| Total shareholders’ equity | | (846,199 | ) | | (871,906 | ) | | (1,026,496 | ) | | (846,199 | ) |
| Total liabilities and shareholders’ equity | | $ | 840,347 |
| | $ | 661,414 |
| | $ | 1,032,693 |
| | $ | 840,347 |
|
See accompanying notes.
EXCO RESOURCES, INC. (DEBTOR-IN-POSSESSION)
CONSOLIDATED STATEMENTS OF OPERATIONS
| | | | | Year Ended December 31, | | Year Ended December 31, |
| (in thousands, except per share data) | | 2017 | | 2016 | | 2015 | | 2018 | | 2017 |
| Revenues: | | | | | | | | | | |
| Oil | | $ | 57,693 |
| | $ | 67,317 |
| | $ | 102,787 |
| | $ | 90,614 |
| | $ | 57,693 |
|
| Natural gas | | 201,137 |
| | 181,332 |
| | 226,471 |
| | 281,977 |
| | 201,137 |
|
| Purchased natural gas and marketing | | 24,816 |
| | 22,352 |
| | 26,442 |
| | 21,435 |
| | 24,816 |
|
| Total revenues | | 283,646 |
| | 271,001 |
| | 355,700 |
| | 394,026 |
| | 283,646 |
|
| Costs and expenses: | | | | | | | | | | |
| Oil and natural gas operating costs | | 35,011 |
| | 34,609 |
| | 53,903 |
| | 42,149 |
| | 35,011 |
|
| Production and ad valorem taxes | | 13,131 |
| | 15,380 |
| | 22,630 |
| | 15,260 |
| | 13,131 |
|
| Gathering and transportation | | 111,427 |
| | 106,460 |
| | 99,321 |
| | 76,175 |
| | 111,427 |
|
| Purchased natural gas | | 23,400 |
| | 23,557 |
| | 27,369 |
| | 16,387 |
| | 23,400 |
|
| Depletion, depreciation and amortization | | 51,040 |
| | 75,982 |
| | 215,426 |
| | 80,289 |
| | 51,040 |
|
| Impairment of oil and natural gas properties | | — |
| | 160,813 |
| | 1,215,370 |
| |
| Accretion of discount on asset retirement obligations | | 874 |
| | 2,210 |
| | 2,277 |
| |
| Accretion of liabilities | | | 1,997 |
| | 874 |
|
| General and administrative | | 30,165 |
| | 48,700 |
| | 58,818 |
| | 27,850 |
| | 30,165 |
|
| Gain on Appalachia JV Settlement | | | (119,237 | ) | | — |
|
| Other operating items | | 59,154 |
| | 24,239 |
| | 461 |
| | (1,325 | ) | | 59,154 |
|
| Total costs and expenses | | 324,202 |
| | 491,950 |
| | 1,695,575 |
| | 139,545 |
| | 324,202 |
|
| Operating loss | | (40,556 | ) | | (220,949 | ) | | (1,339,875 | ) | |
| Operating income (loss) | | | 254,481 |
| | (40,556 | ) |
| Other income (expense): | | | | | | | | | | |
| Interest expense, net | | (108,175 | ) | | (70,438 | ) | | (106,082 | ) | | (33,917 | ) | | (108,175 | ) |
| Gain (loss) on derivative financial instruments - commodity derivatives | | 24,732 |
| | (34,137 | ) | | 75,869 |
| | (615 | ) | | 24,732 |
|
| Gain on derivative financial instruments - common share warrants | | 159,190 |
| | — |
| | — |
| | 1,889 |
| | 159,190 |
|
| Gain (loss) on restructuring and extinguishment of debt | | (6,380 | ) | | 119,457 |
| | 193,276 |
| |
| Loss on restructuring and extinguishment of debt | | | — |
| | (6,380 | ) |
| Other income | | 31 |
| | 43 |
| | 122 |
| | 70 |
| | 31 |
|
| Equity loss | | (4,184 | ) | | (16,432 | ) | | (15,691 | ) | |
| Equity income (loss) | | | 175 |
| | (4,184 | ) |
| Reorganization items, net | | | (409,298 | ) | | — |
|
| Total other income (expense) | | 65,214 |
| | (1,507 | ) | | 147,494 |
| | (441,696 | ) | | 65,214 |
|
| Income (loss) before income taxes | | 24,658 |
| | (222,456 | ) | | (1,192,381 | ) | | (187,215 | ) | | 24,658 |
|
| Income tax expense | | 296 |
| | 2,802 |
| | — |
| |
| Income tax expense (benefit) | | | (4,518 | ) | | 296 |
|
| Net income (loss) | | $ | 24,362 |
| | $ | (225,258 | ) | | $ | (1,192,381 | ) | | $ | (182,697 | ) | | $ | 24,362 |
|
| Earnings (loss) per common share: | | | | | | | | | | |
| Basic: | | | | | | | | | | |
| Net income (loss) | | $ | 1.14 |
| | $ | (12.09 | ) | | $ | (65.37 | ) | | $ | (8.42 | ) | | $ | 1.14 |
|
| Weighted average common shares outstanding | | 21,288 |
| | 18,630 |
| | 18,241 |
| | 21,686 |
| | 21,288 |
|
| Diluted: | | | | | | | | | | |
| Net income (loss) | | $ | 1.14 |
| | $ | (12.09 | ) | | $ | (65.37 | ) | | $ | (8.42 | ) | | $ | 1.14 |
|
| Weighted average common shares and common share equivalents outstanding | | 21,288 |
| | 18,630 |
| | 18,241 |
| | 21,686 |
| | 21,288 |
|
See accompanying notes.
EXCO RESOURCES, INC. (DEBTOR-IN-POSSESSION)
CONSOLIDATED STATEMENTS OF CASH FLOWS
| | | | | Year Ended December 31, | | Year Ended December 31, |
| (in thousands) | | 2017 | | 2016 | | 2015 | | 2018 | | 2017 |
| Operating Activities: | | | | | | | | | | |
| Net income (loss) | | $ | 24,362 |
| | $ | (225,258 | ) | | $ | (1,192,381 | ) | | $ | (182,697 | ) | | $ | 24,362 |
|
| Adjustments to reconcile net income (loss) to net cash provided by (used in) operating activities: | | | | | | | |
| Deferred income tax expense | | 1,716 |
| | 2,802 |
| | — |
| |
| Adjustments to reconcile net income (loss) to net cash provided by operating activities: | | | | | |
| Deferred income tax expense (benefit) | | | (4,518 | ) | | 1,716 |
|
| Depletion, depreciation and amortization | | 51,040 |
| | 75,982 |
| | 215,426 |
| | 80,289 |
| | 51,040 |
|
| Equity-based compensation | | (11,430 | ) | | 14,778 |
| | 7,198 |
| | 2,053 |
| | (11,430 | ) |
| Accretion of discount on asset retirement obligations | | 874 |
| | 2,210 |
| | 2,277 |
| |
| Impairment of oil and natural gas properties | | — |
| | 160,813 |
| | 1,215,370 |
| |
| Loss from equity investments | | 4,184 |
| | 16,432 |
| | 15,691 |
| |
| Accretion of liabilities | | | 1,997 |
| | 874 |
|
| (Income) loss from equity investments | | | (175 | ) | | 4,184 |
|
| Proceeds from equity investments | | 4,452 |
| | — |
| |
|
| | — |
| | 4,452 |
|
| (Gain) loss on derivative financial instruments - commodity derivatives | | (24,732 | ) | | 34,137 |
| | (75,869 | ) | | 615 |
| | (24,732 | ) |
| Cash receipts (payments) of commodity derivative financial instruments | | (4,111 | ) | | 39,149 |
| | 128,800 |
| | 535 |
| | (4,111 | ) |
| Gain on derivative financial instruments - common share warrants | | (159,190 | ) | | — |
| | — |
| | (1,889 | ) | | (159,190 | ) |
| Amortization of deferred financing costs and discount on debt issuance | | 26,960 |
| | 9,256 |
| | 16,994 |
| | 4,166 |
| | 26,960 |
|
| Gain on Appalachia JV Settlement | | | (119,237 | ) | | — |
|
| Non-cash and non-operating reorganization items, net | | | 341,342 |
| | — |
|
| Loss on restructuring and extinguishment of debt | | | — |
| | 6,380 |
|
| Paid in-kind interest expense | | 59,464 |
| | — |
| | — |
| | (21,078 | ) | | 59,464 |
|
| Other non-operating items | | 2,006 |
| | 24,073 |
| | (32 | ) | | — |
| | 2,006 |
|
| Gain (loss) on restructuring and extinguishment of debt | | 6,380 |
| | (119,457 | ) | | (193,276 | ) | |
| Effect of changes in: | | | | | | | | | | |
| Restricted cash with related party | | — |
| | 2,100 |
| | (2,100 | ) | |
| Accounts receivable | | (7,160 | ) | | (19,763 | ) | | 88,610 |
| | (3,837 | ) | | (7,160 | ) |
| Other current assets | | (12,498 | ) | | (1,716 | ) | | 434 |
| | 13,207 |
| | (12,498 | ) |
| Accounts payable and other current liabilities | | 92,094 |
| | (15,952 | ) | | (93,115 | ) | |
| Net cash provided by (used in) operating activities | | 54,411 |
| | (414 | ) | | 134,027 |
| |
| Accounts payable and other liabilities | | | 23,223 |
| | 92,094 |
|
| Net cash provided by operating activities | | | 133,996 |
| | 54,411 |
|
| Investing Activities: | | | | | | | | | | |
| Additions to oil and natural gas properties, gathering assets and equipment | | (147,016 | ) | | (79,393 | ) | | (317,590 | ) | | (165,999 | ) | | (147,016 | ) |
| Property acquisitions | | (24,151 | ) | | (1,032 | ) | | (7,608 | ) | | 14,832 |
| | (24,151 | ) |
| Proceeds from disposition of property and equipment | | 350 |
| | 14,349 |
| | 7,397 |
| | — |
| | 350 |
|
| Restricted cash | | (4,121 | ) | | 7,970 |
| | 4,850 |
| |
| Net changes in advances to joint ventures | | (9,161 | ) | | 3,097 |
| | 10,663 |
| |
| Equity investments and other | | 1,548 |
| | — |
| | 1,455 |
| |
| Net changes in amounts due to joint ventures | | | — |
| | (9,161 | ) |
| Other | | | 950 |
| | 1,548 |
|
| Net cash used in investing activities | | (182,551 | ) | | (55,009 | ) | | (300,833 | ) | | (150,217 | ) | | (178,430 | ) |
| Financing Activities: | | | | | | | | | | |
| Borrowings under DIP Credit Agreement | | | 156,406 |
| | — |
|
| Borrowings under EXCO Resources Credit Agreement | | 163,401 |
| | 404,897 |
| | 165,000 |
| | — |
| | 163,401 |
|
| Repayments under EXCO Resources Credit Agreement | | (265,592 | ) | | (243,797 | ) | | (300,000 | ) | | (126,401 | ) | | (265,592 | ) |
| Proceeds received from issuance of 1.5 Lien Notes, net | | 295,530 |
| | — |
| | — |
| | — |
| | 295,530 |
|
| Repurchases of senior unsecured notes | | — |
| | (53,298 | ) | | (12,008 | ) | |
| Proceeds received from issuance of Fairfax Term Loan | | — |
| | — |
| | 300,000 |
| |
| Payments on Exchange Term Loan | | (11,602 | ) | | (50,695 | ) | | (8,827 | ) | |
| Proceeds from issuance of common shares, net | | — |
| | — |
| | 9,693 |
| |
| Payments on Second Lien Term Loans | | | — |
| | (11,602 | ) |
| Payments of common share dividends | | (6 | ) | | (91 | ) | | (164 | ) | | — |
| | (6 | ) |
| Deferred financing costs and other | | (23,062 | ) | | (4,772 | ) | | (20,946 | ) | |
| Net cash provided by (used in) financing activities | | 158,669 |
| | 52,244 |
| | 132,748 |
| |
| Net increase (decrease) in cash | | 30,529 |
| | (3,179 | ) | | (34,058 | ) | |
| Cash at beginning of period | | 9,068 |
| | 12,247 |
| | 46,305 |
| |
| Cash at end of period | | $ | 39,597 |
| | $ | 9,068 |
| | $ | 12,247 |
| |
| Debt financing costs and other | | | (6,062 | ) | | (23,062 | ) |
| Net cash provided by financing activities | | | 23,943 |
| | 158,669 |
|
| Net increase in cash, cash equivalents and restricted cash | | | 7,722 |
| | 34,650 |
|
| Cash, cash equivalents and restricted cash at beginning of period | | | 54,868 |
| | 20,218 |
|
| Cash, cash equivalents and restricted cash at end of period | | | $ | 62,590 |
| | $ | 54,868 |
|
| | | | | | |
| Supplemental Cash Flow Information: | | | | | | | | | | |
| Cash interest payments | | $ | 27,786 |
| | $ | 68,134 |
| | $ | 117,463 |
| | $ | 35,000 |
| | $ | 27,786 |
|
| Income tax payments | | — |
| | — |
| | — |
| | — |
| | — |
|
| Supplemental non-cash investing and financing activities: | | | | | | | | | | |
| Capitalized equity-based compensation | | $ | 1,000 |
| | $ | 752 |
| | $ | 3,428 |
| | $ | 347 |
| | $ | 1,000 |
|
| Capitalized interest | | 6,440 |
| | 5,213 |
| | 12,040 |
| | 3,357 |
| | 6,440 |
|
| Net assets acquired on Appalachia JV Settlement, excluding cash and cash equivalents | | | 114,028 |
| | — |
|
See accompanying notes.
EXCO RESOURCES, INC. (DEBTOR-IN-POSSESSION)
CONSOLIDATED STATEMENTS OF CHANGES IN SHAREHOLDERS’ EQUITY
| | | | | Common Shares | | Treasury Shares | | Additional paid-in capital | | Accumulated deficit | | Total shareholders’ equity | | Common shares | | Treasury shares | | Additional paid-in capital | | Accumulated deficit | | Total shareholders’ equity |
| (in thousands) | | Shares | | Amount | | Shares | | Amount | | | Shares | | Amount | | Shares | | Amount | |
| Balance at December 31, 2014 | | 18,301 |
| | $ | 18 |
| | (39 | ) | | $ | (7,615 | ) | | $ | 3,502,461 |
| | $ | (2,984,860 | ) | | $ | 510,004 |
| |
| Issuance of common shares | | 392 |
| | 1 |
| | — |
| | — |
| | 9,843 |
| | — |
| | 9,844 |
| |
| Equity-based compensation | | — |
| | — |
| | — |
| | — |
| | 10,106 |
| | — |
| | 10,106 |
| |
| Restricted shares issued, net of cancellations | | 227 |
| | — |
| | — |
| | — |
| | — |
| | — |
| | — |
| |
| Common share dividends | | — |
| | — |
| | — |
| | — |
| | — |
| | 121 |
| | 121 |
| |
| Treasury share repurchases | | — |
| | — |
| | (1 | ) | | (17 | ) | | — |
| | — |
| | (17 | ) | |
| Net loss | | — |
| | — |
| | — |
| | — |
| | — |
| | (1,192,381 | ) | | (1,192,381 | ) | |
| Balance at December 31, 2015 | | 18,920 |
| | $ | 19 |
| | (40 | ) | | $ | (7,632 | ) | | $ | 3,522,410 |
| | $ | (4,177,120 | ) | | $ | (662,323 | ) | |
| Issuance of common shares | | 16 |
| | — |
| | ��� |
| | — |
| | — |
| | — |
| | — |
| |
| Equity-based compensation | | — |
| | — |
| | — |
| | — |
| | 15,662 |
| | — |
| | 15,662 |
| |
| Restricted shares issued, net of cancellations | | (20 | ) | | — |
| | — |
| | — |
| | 8 |
| | — |
| | 8 |
| |
| Common share dividends | | — |
| | — |
| | — |
| | — |
| | — |
| | 5 |
| | 5 |
| |
| Net loss | | — |
| | — |
| | — |
| | — |
| | — |
| | (225,258 | ) | | (225,258 | ) | |
| Balance at December 31, 2016 | | 18,916 |
| | $ | 19 |
| | (40 | ) | | $ | (7,632 | ) | | $ | 3,538,080 |
| | $ | (4,402,373 | ) | | $ | (871,906 | ) | | 18,916 |
| | $ | 19 |
| | (40 | ) | | $ | (7,632 | ) | | $ | 3,538,080 |
| | $ | (4,402,373 | ) | | $ | (871,906 | ) |
| Issuance of common shares | | 2,746 |
| | 3 |
| | — |
| | — |
| | 11,395 |
| | — |
| | 11,398 |
| | 2,746 |
| | 3 |
| | — |
| | — |
| | 11,395 |
| | — |
| | 11,398 |
|
| Equity-based compensation | | — |
| | — |
| | — |
| | — |
| | (10,053 | ) | | — |
| | (10,053 | ) | | — |
| | — |
| | — |
| | — |
| | (10,053 | ) | | — |
| | (10,053 | ) |
| Restricted shares issued, net of cancellations | | 8 |
| | — |
| | — |
| | — |
| | — |
| | — |
| | — |
| | 8 |
| | — |
| | — |
| | — |
| | — |
| | — |
| | — |
|
| Net income | | — |
| | — |
| | — |
| | — |
| | — |
| | 24,362 |
| | 24,362 |
| | — |
| | — |
| | — |
| | — |
| | — |
| | 24,362 |
| | 24,362 |
|
| Balance at December 31, 2017 | | 21,670 |
| | $ | 22 |
| | (40 | ) | | $ | (7,632 | ) | | $ | 3,539,422 |
| | $ | (4,378,011 | ) | | $ | (846,199 | ) | | 21,670 |
| | $ | 22 |
| | (40 | ) | | $ | (7,632 | ) | | $ | 3,539,422 |
| | $ | (4,378,011 | ) | | $ | (846,199 | ) |
| Equity-based compensation | | | — |
| | — |
| | — |
| | — |
| | 2,400 |
| | — |
| | 2,400 |
|
| Restricted shares issued, net of cancellations | | | (46 | ) | | — |
| | — |
| | — |
| | — |
| | — |
| | — |
|
| Net loss | | | — |
| | — |
| | — |
| | — |
| | — |
| | (182,697 | ) | | (182,697 | ) |
| Balance at December 31, 2018 | | | 21,624 |
| | $ | 22 |
| | (40 | ) | | $ | (7,632 | ) | | $ | 3,541,822 |
| | $ | (4,560,708 | ) | | $ | (1,026,496 | ) |
See accompanying notes.
EXCO RESOURCES, INC. (DEBTOR-IN-POSSESSION)
NOTES TO CONSOLIDATED FINANCIAL STATEMENTS
| |
1. | Organization and basis of presentation |
1.Organization and basis of presentation
Unless the context requires otherwise, references in this Annual Report on Form 10-K to “EXCO,” “EXCO Resources,” the “Company,” “we,” “us,”“our” and “our”“us” are to EXCO Resources, Inc. and its consolidated subsidiaries.
We are an independent oil and natural gas company engaged in the exploration, exploitation, acquisition, development and production of onshore U.S. oil and natural gas properties with a focus on shale resource plays. Our principal operations are conducted in certain key U.S. oil and natural gas areas including Texas, Louisiana and the Appalachia region. The following is a brief discussion of our producing regions.regions:
•East Texas and North Louisiana
The East Texas and North Louisiana regions are primarily comprised of our Haynesville and Bossier shale assets. We have a joint venture with a wholly owned subsidiary of Royal Dutch Shell, plc ("Shell"(“Shell”), covering an undivided 50% interest in the majority of our Haynesville and Bossier shale assets in East Texas and North Louisiana. The East Texas and North Louisiana regions also include certain assets outside of the joint venture in the Haynesville and Bossier shales. We serve as the operator for most of our properties in the East Texas and North Louisiana regions.
•South Texas
The South Texas region is primarily comprised of our Eagle Ford shale assets. We serve as the operator for most of our properties in the South Texas region.
•Appalachia
The Appalachia region is primarily comprised of our Marcellus shale assets. We had a joint venture with Shell covering our Marcellus shale and other assets in the Appalachian region (“Appalachia region ("Appalachia JV"JV”). EXCO and Shell each owned an undivided 50% interest in the Appalachia JV and a 49.75% working interest in the Appalachia JV'sJV’s properties. The remaining 0.5% working interest is held by a jointly owned operatingan entity ("OPCO") that operates the Appalachia JV's properties. WeJV’s properties (“OPCO”), which was previously jointly owned a 50% interest in OPCO.by EXCO and Shell. On February 27, 2018, we closed a settlement agreement with a subsidiary of Shell to resolve arbitration regarding our right to participate in an area of mutual interest in the Appalachia region ("(“Appalachia JV Settlement"Settlement”). As a result of the Appalachia JV Settlement, we acquired Shell'sShell’s interests in the Appalachia JV and OPCO. See further discussion of this settlement as part of "Note 17. Subsequent events"transaction in “Note 3. Acquisitions, divestitures and other significant events”.
The accompanying Consolidated Balance Sheets as of December 31, 20172018 and 2016,2017, Consolidated Statements of Operations, Consolidated Statements of Cash Flows and Consolidated Statements of Changes in Shareholders’ Equity for the years ended December 31, 2017, 20162018 and 20152017 are for EXCO and its consolidated subsidiaries. The Consolidated Financial Statements and related footnotes are presented in accordance with generally accepted accounting principles in the United States ("GAAP"). Certain reclassifications have been made to prior period information to conform to current period presentation.
Reverse share split
On June 2, 2017, we filed a certificate of amendment to our Amended and Restated Certificate of Formation to reduce the number of authorized common shares from 780,000,000 to 260,000,000 and effect a 1-for-15 reverse share split. The reverse share split became effective after the market closed on June 12, 2017. The par value of the common shares remained unchanged at $0.001 per share, which required retrospective reclassification from common shares to additional paid-in capital within the shareholders' equity section of our consolidated balance sheets. Shareholders' equity and all share data, including treasury shares, and per share data presented herein have been retrospectively adjusted to reflect the impact of the decrease in authorized shares and the reverse share split, as appropriate.
Chapter 11 Cases and Going Concern Assessment
On January 15, 2018 (“Petition Date”), the Company and certain of its subsidiaries, including EXCO Services, Inc., EXCO Partners GP, LLC, EXCO GP Partners OLP, LP, EXCO Partners OLP GP, LLC, EXCO Operating Company, LP, EXCO Midcontinent MLP, LLC, EXCO Holding (PA), Inc., EXCO Production Company (PA), LLC, EXCO Resources (XA), LLC, EXCO Production Company (WV), LLC, EXCO Land Company, LLC, EXCO Holding MLP, Inc., Raider Marketing, LP and Raider Marketing GP, LLC (collectively, the “Filing Subsidiaries” and, together with the Company, the “Debtors”), filed voluntary petitions for relief
under Chapter 11 of the United States Bankruptcy Code (“Bankruptcy Code”) in the United States Bankruptcy Court for the Southern District of Texas (“Court”(the “Court”). The Chapter 11 cases are being jointly administered under the caption In Re EXCO Resources, Inc., Case No. 18-30155 (MI) ("“Chapter 11 Cases"Cases”). The Court granted all of the first day motions filed by the Debtors that were designed primarily to minimize the impact of the Chapter 11 proceedingsCases on ourtheir operations, customers and employees. We willThe Debtors continue to operate ourtheir businesses as “debtors in possession” under the jurisdiction of the Court and in accordance with the applicable provisions of the Bankruptcy Code and orders of the Court. WeThe Debtors expect to continue our operations without interruption during the pendency of the Chapter 11 proceedings.Cases.
For the duration of the Chapter 11 proceedings,Cases, our operations and our ability to develop and execute our business plan are subject to risks and uncertainties associated with Chapter 11 proceedings described in "Item 1A. Risk Factors”.Cases. As a result of these risks and uncertainties, our assets, liabilities, shareholders'shareholders’ equity, officers and/or directors could be significantly different following the conclusion of the Chapter 11 Cases, and the description of our operations, properties and capital plans included in this annual report on Form 10-K may not accurately reflect our operations, properties and capital plans following the Chapter 11 Cases. See further discussion of the Chapter 11 proceedings in "Note 17. Subsequent events".
We were not able to reach an agreement with our creditors for a plan of reorganization prior to commencementconclusion of the Chapter 11 Cases. Therefore, the
The outcome of ourthe Chapter 11 process is subject to a high degree of uncertainty and is dependent upon factors outside of our control, including actions of the Court and our creditors. The significant risks and uncertainties related to our Liquidityliquidity and the Chapter 11 proceedings described aboveCases raise substantial doubt about our ability to continue as a going concern. We define liquidity as cash and restricted cash plus the unused borrowing base under the debtor-in-possession credit agreement (“Liquidity”). These Consolidated Financial Statements have been prepared on a going concern basis, which contemplates the realization of assets and the satisfaction of liabilities and other commitments in the normal course of business. The accompanying Consolidated Financial Statements do not include any adjustments to reflect the possible future effects of this uncertainty on the recoverability or classification of recorded asset amounts or the amounts or classification of liabilities.
Chapter 11 filing impact on creditors and shareholders
The Debtors filed schedules and statements with the Court setting forth, among other things, the assets and liabilities of each of the Debtors, subject to the assumptions filed in connection therewith. These schedules and statements are subject to further amendment or modification during the Chapter 11 Cases. Certain holders of pre-petition claims that are not governmental units were required to file proofs of claim by April 15, 2018. The deadline for governmental units to file proofs of claim was September 4, 2018. Differences between amounts scheduled by the Debtors and claims by creditors are being investigated and will be reconciled and resolved to within an immaterial amount in connection with the claims resolution process. In light of the number of creditors with filed or scheduled claims, the claims resolution process may take considerable time to complete and likely will continue after the Debtors emerge from bankruptcy. Accordingly, the ultimate number and amount of allowed claims is not presently known, nor can the ultimate recovery with respect to allowed claims be presently asserted.
Under the priority requirements established by the Bankruptcy Code, unless creditors agree otherwise, pre-petition and post-petition liabilities owed to creditors must be satisfied in full before the holders of our existing common shares are entitled to receive any distributions or retain any property under a plan of reorganization. The ultimate recovery for creditors and shareholders, if any, will not be determined until confirmation and implementation of a plan of reorganization. The outcome of the Chapter 11 Cases remains uncertain at this time and, as a result, we cannot accurately estimate the amounts or value of distributions that creditors or shareholders may receive.
Automatic stay
Subject to certain specific exceptions under the Bankruptcy Code, the Chapter 11 filings automatically stayed most judicial and administrative actions against the Debtors as well as efforts by creditors to collect on or otherwise exercise rights or remedies with respect to pre-petition claims. As a result, most creditor actions to obtain possession of property from the Debtors, or to create, perfect or enforce any lien against the Debtors’ property, or to collect on or otherwise exercise rights or remedies with respect to a pre-petition claim are stayed.
Impact on indebtedness
As of the Petition Date, we had approximately $1.4 billion in principal amount of indebtedness, including approximately: (i) $126.4 million outstanding under our previous revolving credit agreement (“EXCO Resources Credit Agreement”), (ii) $317.0 million outstanding under our senior secured 1.5 lien notes due March 20, 2022 (“1.5 Lien Notes”), (iii) $708.9 million outstanding under our senior secured 1.75 lien term loans due October 26, 2020 (“1.75 Lien Term Loans”), (iv) $17.2 million outstanding under our senior secured second lien term loans due October 26, 2020 (“Second Lien Term Loans”), (v) $131.6 million outstanding under our senior unsecured notes due September 15, 2018 (“2018 Notes”), and (vi) $70.2 million outstanding under our senior unsecured notes due April 15, 2022 (“2022 Notes”). The commencement of the Chapter 11 Cases described above constituted an event of default that accelerated our obligations under the following debt instruments:
EXCO Resources Credit Agreement;
1.5 Lien Notes;
1.75 Lien Term Loans;
2018 Notes; and
2022 Notes.
These debt instruments provide that as a result of the commencement of the Chapter 11 Cases, the principal and interest due thereunder shall be immediately due and payable. Any efforts to enforce such payment obligations under the debt instruments are automatically stayed as a result of the commencement of the Chapter 11 Cases, and the creditors’ rights of enforcement in respect of the debt instruments are subject to the applicable provisions of the Bankruptcy Code. As a result of the Chapter 11 Cases, the Court may limit post-petition interest on debt that may be under-secured or unsecured.
On January 22, 2018, we closed a debtor-in-possession credit agreement (“DIP Credit Agreement”) with lenders including affiliates of Fairfax Financial Holdings Limited (“Fairfax”), Bluescape Resources Company LLC (“Bluescape”) and JPMorgan Chase Bank, N.A. (collectively the “DIP Lenders”). The DIP Credit Agreement includes a senior secured debtor-in-possession revolving credit facility in an aggregate principal amount of $125.0 million (“Revolver A Facility”) and a senior secured debtor-in-possession revolving credit facility in an aggregate principal amount of $125.0 million (“Revolver B Facility”, and together with the Revolver A Facility, the “DIP Facilities”). Proceeds from the DIP Facilities were used to repay all obligations outstanding under the EXCO Resources Credit Agreement and will provide additional liquidity to fund our operations during the Chapter 11 Cases. On February 22, 2018, the Court approved our ability to make adequate protection payments for interest on the DIP Credit Agreement and the 1.5 Lien Notes. As of December 31, 2018, we had $156.4 million in outstanding indebtedness and $81.6 million of available borrowing capacity under the DIP Facilities. On January 15, 2019, we entered into an amendment to the DIP Credit Agreement to extend the maturity date from January 22, 2019 to May 22, 2019. See further discussion of the DIP Credit Agreement in “Note 5. Debt”.
Restrictions on trading of our equity securities to protect our use of net operating losses
The Court has entered a final order pursuant to Sections 362(a)(3) and 541 of the Bankruptcy Code enabling the Company and the Filing Subsidiaries to avoid limitations on the use of our income tax net operating loss carryforwards (“NOLs”) and certain other tax attributes by imposing certain notice procedures and transfer restrictions on the trading of our equity securities. In general, the order applies to any person that, directly or indirectly, beneficially owns (or would beneficially own as a result of a proposed transfer) at least 4.5% of our outstanding common shares (“Substantial Shareholder”), and requires that each Substantial Shareholder file with the Court and serve us with notice of such status. Under the order, prior to any proposed acquisition or disposition of equity securities that would result in an increase or decrease in the amount of our equity securities owned by a Substantial Shareholder, or that would result in a person or entity becoming a Substantial Shareholder, such person or entity is required to file with the Court and notify us of such acquisition or disposition. We have the right to seek an injunction from the Court to prevent certain acquisitions or sales of our common shares if the acquisition or sale would pose a material risk of adversely affecting our ability to utilize such tax attributes.
Executory contracts
Subject to certain exceptions, under the Bankruptcy Code, the Debtors may assume, assign, or reject certain executory contracts and unexpired leases subject to the approval of the Court and fulfillment of certain other conditions. The rejection of an executory contract or unexpired lease is generally treated as a breach as of the Petition Date of such executory contract or unexpired lease and, subject to certain exceptions, relieves the Debtors of performing their future obligations under such executory contract or unexpired lease but may give rise to a general unsecured claim against the Debtors for damages caused by such rejection. The assumption of an executory contract or unexpired lease generally requires the Debtors to cure existing monetary or other defaults under such executory contract or unexpired lease and provide adequate assurance of future performance thereunder. Any description of the treatment of an executory contract or unexpired lease with the Company or any of the Filing Subsidiaries, including any description of the obligations under any such executory contract or unexpired lease, is qualified by and subject to any rights they have with respect to executory contracts and unexpired leases under the Bankruptcy Code.
During March 2018, the Court approved the rejection of the following executory contracts:
Firm transportation agreements with Acadian Gas Pipeline System, which required us to transport 325,000 Mmbtu per day on the Acadian Gas Pipeline System or pay reservation charges through October, 31, 2025;
Natural gas sales agreements with Enterprise Products Operating LLC (“Enterprise”), which required us to sell 75,000 Mmbtu per day of natural gas to Enterprise or incur certain costs through October 31, 2025;
Firm transportation agreements with Regency Intrastate Gas Systems LLC, which required us to either transport 237,500 Mmbtu per day of natural gas or pay reservation charges through January 31, 2020;
Marketing agreement with a subsidiary of Chesapeake Energy Corporation (“Chesapeake”), which required us to allow Chesapeake to purchase natural gas from certain wells in North Louisiana through 2021; and
Natural gas sales agreements with Shell, which required us to sell 100,000 Mmbtu per day of natural gas to Shell or incur certain costs through November 30, 2020.
On March 1, 2018, the Debtors filed a motion to reject an agreement to deliver an aggregate minimum volume commitment of natural gas production in East Texas and North Louisiana to certain gathering systems owned by Azure Midstream Energy, LLC and TGG Pipeline, Ltd. (collectively, “Azure”) through November 30, 2018. The motion was abated on May, 8, 2018 and on May 16, 2018, EXCO Operating Company, LP and Raider Marketing, LP commenced an adversary proceeding (Adv. Proc. No. 18-03096) against Azure to establish that the minimum volume commitment agreement is severable from the base gathering agreement between the parties. The Debtors and the contract counterparties each filed various dispositive motions that were heard by the Court on August 9, 2018. On November 19, 2018, the Court approved an agreement entered into by EXCO and Azure to settle any claims related to the minimum volume commitment (“Azure Settlement Agreement”). Per the terms of the Azure Settlement Agreement:
EXCO agreed to pay Azure $15.0 million and transfer equity interests held in Azure (~3.35%) on the effective date of EXCO’s plan of reorganization; and
EXCO will assume the base gathering agreement with Azure and cure any associated pre-petition amounts associated with the agreement on or before February 28, 2019.
Upon completion of the aforementioned criteria, Azure’s claims related to the base gathering agreement and minimum volume commitment will be deemed to be satisfied. On March 1, 2019, we paid $6.4 million of pre-petition costs for gathering services under the base gathering agreement. The remaining payment and transfer of equity interests are expected to be paid on the effective date of EXCO's plan of reorganization.
As of December 31, 2018, the accrual of $30.3 million related to the minimum volume commitment was classified as “Liabilities subject to compromise” and the equity interests in Azure of $0.8 million were classified as "Equity investments" on our Consolidated Balance Sheet. The impact of the Azure Settlement Agreement will not be reflected in the financial statements until all material contingencies are resolved, including the payments and transfer of equity interests that are expected to occur on the effective date of the plan of reorganization.
On August 9, 2018, the Court approved the rejection of the office lease for our corporate headquarters in Dallas, Texas. We subsequently entered into a new lease for a reduced amount of square footage in the same office building with a term through December 31, 2022.
Plan of Reorganization
On October 1, 2018, the Debtors filed a Settlement Joint Chapter 11 Plan of Reorganization (the “October 2018 Plan”) and related Disclosure Statement with the Court. As is customary in bankruptcy proceedings, the Debtors subsequently filed amendments to the October 2018 Plan and related Disclosure Statement with the Court. The distributions under the October 2018 Plan were expected to be funded with: (i) cash on hand; (ii) a new revolving credit facility; (iii) a new second lien debt instrument; (iv) the equity in the reorganized Company; and, (v) the D&O Proceeds, as defined below.
On November 5, 2018, the Court authorized us to solicit acceptances of the October 2018 Plan and approved the Disclosure Statement and other related solicitation materials and procedures necessary to approve the October 2018 Plan. Simultaneous with the solicitation process, we initiated a marketing process for the issuance of the new revolving credit facility and the new second lien debt instrument. During the course of the marketing process, oil prices experienced a significant decline and overall market conditions worsened. As a result, we were not able to obtain the exit financing required to consummate the October 2018 Plan. On February 15, 2019, the Court approved a motion to extend the filing exclusivity period through April 1, 2019 and the solicitation exclusivity period through May 31, 2019.
On March 8, 2019, the Debtors filed a Second Amended Joint Chapter 11 Plan of Reorganization (“March 2019 Plan”) and related Disclosure Statement with the Court. The March 2019 Plan provides for either a reorganization of the Debtors as a going concern or the sale of the Debtors’ assets (“All Asset Sale”). The Debtors will make a final determination regarding which path to pursue by the date of the hearing to approve the Disclosure Statement. The March 2019 Plan included the following key elements:
Holders of the DIP Credit Agreement will receive payment in full in cash with proceeds from either a new revolving credit facility (“Exit Facility”) or, in the event of an All Asset Sale, proceeds from the sale of assets;
Holders of allowed 1.5 Lien Notes claims will receive either their pro rata share of a new mandatorily convertible security or, in the event of an All Asset Sale, the liens securing such allowed claim;
Holders of allowed 1.75 Lien Term Loans claims will receive either their pro rata share of the equity in the reorganized Company representing the value attributable to encumbered assets or, in the event of an All Asset Sale, the liens securing such allowed claim;
Holders of the Second Lien Term Loans, 2018 Notes, 2022 Notes, allowed general unsecured claims and deficiency claims associated with the 1.75 Lien Term Loans will receive either their pro rata share of equity in the reorganized Company representing the value attributable to unencumbered assets, or in the event of an All Asset Sale, proceeds attributable to the sale of the unencumbered assets (“Unsecured Claims Recovery”);
Holders of existing equity interests in EXCO shall not receive a distribution and the equity interests will be deemed canceled, discharged, released and extinguished; and
The carriers of directors’ and officers’ liability insurance coverage related to the Debtors will contribute $13.4 million (“D&O Proceeds”) to the Debtors in exchange for full and final settlement of potential claims and causes of action against current and former directors and officers.
The March 2019 Plan does not release the Debtors or holders of claims of the 1.5 Lien Notes and 1.75 Lien Term Loans from certain causes of action. The litigation of these causes of action will be managed by a trustee appointed by the committee of unsecured creditors of the Debtors and will not occur until after the confirmation of the March 2019 Plan. If any of the disputed claims are successfully prosecuted, this could materially impact the aforementioned recoveries for holders of allowed claims. If some or all of the 1.5 Lien Notes claims or 1.75 Lien Term Loans claims are deemed to be unsecured claims following the successful prosecution of a secured claims challenge, the holders of such 1.5 Lien Notes claims and 1.75 Lien Term Loans claims will receive their pro rata share of the Unsecured Claims Recovery.
We have not received consents from any creditors in support of the March 2019 Plan. Therefore, we may not receive the requisite acceptances to confirm the March 2019 Plan. Even if the requisite acceptances for the March 2019 Plan are received, the Court may not confirm such a plan. Therefore, we are not able to predict or quantify the ultimate impact that events occurring during the Chapter 11 cases may have on our business, cash flows, liquidity, financial condition and results of operations, nor can we predict the ultimate impact that events occurring during the Chapter 11 cases may have on our corporate or capital structure.
Accounting during bankruptcy
We have applied Financial Accounting Standards Board (“FASB”) Accounting Standards Codification (“ASC”) 852, Reorganizations (“ASC 852”), in the preparation of these Consolidated Financial Statements. For periods subsequent to the Chapter 11 filings, ASC 852 requires the financial statements to distinguish transactions and events that are directly associated with the reorganization from the ongoing operations of the business. Accordingly, certain revenues, expenses, realized gains and losses and provisions for losses that are realized or incurred during the bankruptcy proceedings, including losses related to executory contracts that have been approved for rejection by the Court, and adjustments to the carrying value of certain indebtedness are recorded as “Reorganization items, net” on the Consolidated Statement of Operations. In addition, pre-petition obligations that may be impacted by the Chapter 11 process have been classified on the Consolidated Balance Sheet as of December 31, 2018 as “Liabilities subject to compromise.”
Liabilities subject to compromise
The accompanying Consolidated Balance Sheet as of December 31, 2018 includes amounts classified as liabilities subject to compromise, which represent liabilities that are anticipated to be allowed as claims in the Chapter 11 Cases. These amounts represent our current estimate of known or potential obligations to be resolved in connection with the Chapter 11 Cases, and may differ from actual future settlement amounts paid. Differences between liabilities estimated and claims filed, or to be filed, will be investigated and resolved in connection with the claims resolution process. We will continue to evaluate these liabilities throughout the Chapter 11 process and adjust amounts as necessary. Such adjustments may be material.
Liabilities subject to compromise include amounts related to the rejection of various executory contracts and unexpired leases. Additional amounts may be included in liabilities subject to compromise in future periods if additional executory contracts or unexpired leases are rejected. Conversely, to the extent that executory contracts or unexpired leases are not rejected and are instead assumed, liabilities associated therewith would constitute post-petition liabilities which will be satisfied in full under a plan of reorganization. The nature of certain potential claims arising under the Debtors’ executory contracts and unexpired leases has not been determined at this time, and therefore, such claims are not reasonably estimable at this time and may be material.
The following table summarizes the components of liabilities subject to compromise included on the Consolidated Balance Sheet as of December 31, 2018:
|
| | | | |
| (in thousands) | | December 31, 2018 |
| Current maturities of long-term debt | | $ | 927,917 |
|
| Accrued interest payable | | 34,281 |
|
| Accounts payable, accrued expenses and other liabilities | | 95,915 |
|
| Liabilities related to rejected executory contracts | | 385,370 |
|
| Liabilities subject to compromise | | $ | 1,443,483 |
|
As of December 31, 2018, the principal and accrued interest associated with the DIP Credit Agreement and 1.5 Lien Notes were not classified as liabilities subject to compromise as a result of the adequate protection approved by the Court and our current estimates of the recoverability of claims related to these instruments.
Reorganization items, net
We have incurred significant expenses associated with the Chapter 11 process, primarily (i) the acceleration of deferred financing costs, debt discounts and deferred reductions in carrying value associated with debt instruments previously accounted for as a troubled debt restructuring pursuant to ASC 470-60, Troubled Debt Restructuring by Debtors, (ii) adjustments for estimated allowable claims related to executory contracts approved for rejection by the Court, and (iii) legal and professional fees incurred subsequent to the Petition Date related to the restructuring process. These costs, which are being expensed as incurred, significantly impact our results of operations. The following table summarizes the components included in “Reorganization items, net” in our Consolidated Statement of Operations for the year ended December 31, 2018:
|
| | | | |
| (in thousands) | | Year Ended December 31, 2018 |
| Legal and professional fees | | $ | 67,790 |
|
| Deferred financing costs, debt discounts and deferred reductions in carrying value | | 30,509 |
|
| Rejection of executory contracts | | 312,182 |
|
| Other | | (1,183 | ) |
| Reorganization items, net | | $ | 409,298 |
|
As of December 31, 2018, our accrual of $24.9 million for legal and professional fees related to the Chapter 11 Cases incurred subsequent to the Petition Date was classified as "Accounts payable and accrued liabilities" on our Consolidated Balance Sheet. Our cash disbursements for reorganization items for the year ended December 31, 2018 were $43.0 million.
Interest expense
We have discontinued recording interest on debt instruments classified as liabilities subject to compromise as of the Petition Date. The contractual interest on liabilities subject to compromise not reflected in the Consolidated Statement of Operations was approximately $103.6 million, representing interest expense from the Petition Date through December 31, 2018. The cash interest rate of 12.5% was utilized in the determination of contractual interest expense that would have been incurred under the 1.75 Lien Term Loans for the period subsequent to the Petition Date.
| |
2. | Summary of significant accounting policies |
2.Significant accounting policies
We consider significant accounting policies to be those related to our estimates of proved reserves, oil and natural gas properties, derivatives, business combinations, equity-based compensation, goodwill, revenue recognition, asset retirement obligations and income taxes. The policies include significant estimates made by management using information available at the time the estimates were made. However, these estimates could change materially if different information or assumptions were used. In addition, see further discussion of our application of ASC 852 as a result of the Chapter 11 Cases in “Note 1. Organization and basis of presentation”.
Principles of consolidation
We consolidate all of our subsidiaries in the accompanying Consolidated Balance Sheets as of December 31, 20172018 and 20162017 and the Consolidated Statements of Operations, Consolidated Statements of Cash Flows and Changes in Shareholders' Equity for the years ended December 31, 2017, 20162018 and 2015.2017. Investments in unconsolidated affiliates in which we are able to exercise significant influence are accounted for using the equity method. We use the cost method of accounting for investments in unconsolidated affiliates in which we are not able to exercise significant influence. All intercompany transactions and accounts have been eliminated.
Management estimates
In preparing the Consolidated Financial Statements in conformity with GAAP, we are required to make estimates and assumptions that affect the reported amounts of assets, liabilities, revenues and expenses during the reporting periods. The more significant estimates pertain to proved oil and natural gas reserve volumes, future development costs, asset retirement obligations, equity-based compensation, estimates relating to oil and natural gas revenues and expenses, accrued liabilities, the fair market value of assets and liabilities acquired in business combinations, derivatives and goodwill. Actual results may differ from management's estimates.
Cash equivalents
We consider all highly liquid investments with maturities of three months or less when purchased, to be cash equivalents.
Restricted cash
The restricted cash on our balance sheet is principally comprised of our share of an evergreen escrow account with Shell that is used to fund our share of development operations in East Texas and North Louisiana. Funds held in this escrow account are restricted and can be used primarily for drilling and operations in East Texas and North Louisiana.
Concentration of credit risk and accounts receivable
Financial instruments that potentially subject us to a concentration of credit risk consist principally of cash, trade receivables and our derivative financial instruments. We place our cash with financial institutions which we believe have
sufficient credit quality to minimize risk of loss. We sell oil and natural gas to various customers. In addition, we participate with other parties in the drilling, completion and operation of oil and natural gas wells. The majority of our accounts receivable are due from either purchasers of oil or natural gas or participants in oil and natural gas wells for which we serve as the operator. We have the right to offset future revenues against unpaid charges related to wells which we operate. Oil and natural gas receivables are generally uncollateralized. The allowance for doubtful accounts was immaterial at both December 31, 20172018 and 2016.2017. We place our derivative financial instruments with financial institutions that we believe have high credit ratings. To mitigate our risk of loss due to default, we have entered into master netting agreements with our counterparties on our derivative financial instruments that allow us to offset our asset position with our liability position in the event of a default by the counterparty.
For the yearsyear ended December 31, 2017, 2016 and 2015,2018, sales to BGChesapeake Energy Merchants LLC,Marketing, Inc. and subsequently a subsidiary of ShellCIMA Energy, LTD accounted for approximately 32%, 24%17% and 20%15%, respectively, of total consolidated revenues. BGChesapeake Energy Merchants LLC wasMarketing Inc. is a subsidiary of BG Group, plcChesapeake Energy Corporation ("BG Group"Chesapeake") untiland CIMA Energy, LTD is a subsidiary of Mitsubishi Corporation. For the acquisitionyear ended December 31, 2017, sales to Shell Energy North America (US) LP ("Shell Energy"), a subsidiary of BG Group by Shell, in early 2016.and Chesapeake accounted for approximately 32% and 17%, respectively, of total consolidated revenues. In January 2018, we discontinued the sale of natural gas to Shell in the East Texas and North Louisiana regions as a result of litigation regarding certain natural gas sales contracts. See further discussion in "Item"Part I. Item 3. Legal proceedings" and in "Note 8. Commitments and contingencies". We have not experienced any interruptions or negative impact to our natural gas sales prices as a result the discontinuance of sales to Shell in these regions. For the years ended December 31, 2017, 2016 and 2015, Chesapeake Energy Marketing Inc. accounted for approximately 17%, 32%, and 38% respectively, of total consolidated revenues. Chesapeake Energy Marketing Inc. is a subsidiary of Chesapeake Energy Corporation ("Chesapeake").
Derivative financial instruments
Our derivative financial instruments are comprised of commodity derivative contracts and the 2017 Warrants (as defined in "Note 4. Derivative financial instruments"). We usehave historically used commodity derivative financial instruments to mitigate the impacts of commodity price fluctuations, to protect our returns on investments and to achieve a more predictable cash flow. FASB ASC 815, Derivatives and Hedging, ("ASC 815"), requires that every derivative instrument (including certain
derivative instruments embedded in other contracts) be recorded on the balance sheet as either an asset or liability measured at its estimated fair value. ASC 815 requires that changes in the derivative's estimated fair value be recognized in earnings unless specific hedge accounting criteria are met, or exemptions for normal purchases and normal sales as permitted by ASC 815 exist.are met. We do not designate our derivative financial instruments as hedging instruments and as a result, recognize the change in a derivative's estimated fair value in earnings as a component of other income or expense. Our derivative financial instruments are not held for trading purposes. Changes in our derivative financial instruments are recorded as non-operating income or expense in our Consolidated Statements of Operations.
Oil and natural gas properties
The accounting for, and disclosure of, oil and natural gas producing activities require that we choose between two GAAP alternatives: the full cost method or the successful efforts method. We use the full cost method of accounting, which involves capitalizing all acquisition, exploration, exploitation and development costs of oil and natural gas properties. Once we incur costs, they are recorded in the depletable pool of proved properties or in unproved properties, collectively, the full cost pool. Our unproved property costs, which include unproved oil and natural gas properties, properties under development and major development projects, collectively totaled $155.6 million and $118.7 million and $97.1 millionas of December 31, 20172018 and 2016,2017, respectively, and are not subject to depletion. We review our unproved oil and natural gas property costs on a quarterly basis to assess for impairment or the need to transfer unproved costs to proved properties as a result of extension or discoveries from drilling operations or determination that no Proved Reserves are attributable to such costs. In determining whether such costs should be impaired or transferred, we evaluate lease expiration dates, recent drilling results, future development plans and current market values. Our undeveloped properties are predominantly held-by-production, which reduces the risk of impairment as a result of lease expirations. There were no impairments of unproved properties during 2017the years ended December 31, 2018 and 2016 and we impaired $88.1 million of unproved properties during 2015. The impairment was recorded to reflect the estimated fair value of our undeveloped properties as a result of the decline in oil and natural gas prices. The impairment also included certain expiring acreage that was no longer part of our drilling plans. See "Note 6. Fair value measurements" for further discussion.2017.
We capitalize interest on the costs related to the acquisition of undeveloped acreage in accordance with FASB ASC 835-20, Capitalization of Interest. When the unproved property costs are moved to proved developed and undeveloped oil and natural gas properties, or the properties are sold, we cease capitalizing interest related to these properties. We capitalize the portion of general and administrative costs, including share-based compensation, that is attributable to our acquisition, exploration, exploitation and development activities.
We calculate depletion using the unit-of-production method. Under this method, the sum of the full cost pool, excluding the book value of unproved properties, and all estimated future development costs less estimated salvage value are divided by
the total estimated quantities of Proved Reserves. This rate is applied to our total production for the quarter, and the appropriate expense is recorded.
Sales, dispositions and other oil and natural gas property retirements are accounted for as adjustments to the full cost pool, with no recognition of gain or loss, unless the disposition would significantly alter the relationship between capitalized costs and Proved Reserves.
Pursuant to Rule 4-10(c)(4) of Regulation S-X, at the end of each quarterly period, companies that use the full cost method of accounting for their oil and natural gas properties must compute a limitation on capitalized costs ("ceiling test"). The ceiling test involves comparing the net book value of the full cost pool, after taxes, to the full cost ceiling limitation defined below. In the event the full cost ceiling limitation is less than the full cost pool, we are required to record a ceiling test impairment of our oil and natural gas properties. The full cost ceiling limitation is computed as the sum of the present value of estimated future net revenues from our Proved Reserves by applying the average price as prescribed by the SEC Release No. 33-8995, less estimated future expenditures (based on current costs) to develop and produce the Proved Reserves, discounted at 10%, plus the cost of properties not being amortized and the lower of cost or estimated fair value of unproved properties included in the costs being amortized, net of income tax effects.
The ceiling test for each period presented was based on the following average spot prices, in each case adjusted for quality factors and regional differentials to derive estimated future net revenues. Prices presented in the table below are the trailing 12 monthtwelve-month simple average spot prices at the first of the month for natural gas at Henry Hub ("HH"(“HH”) and West Texas Intermediate ("WTI"(“WTI”) crude oil at Cushing, Oklahoma. The fluctuations demonstrate the volatility in oil and natural gas prices between each of the periods and have a significant impact on our ceiling test limitation.
| | | | | Average spot prices | | Average spot prices |
| | | Oil (per Bbl) | | Natural gas (per Mmbtu) | | Oil (per Bbl) | | Natural gas (per Mmbtu) |
| December 31, 2018 | | | $ | 65.56 |
| | $ | 3.10 |
|
| December 31, 2017 | | $ | 51.34 |
| | $ | 2.98 |
| | 51.34 |
| | 2.98 |
|
| December 31, 2016 | | 42.75 |
| | 2.48 |
| | 42.75 |
| | 2.48 |
|
| December 31, 2015 | | 50.28 |
| | 2.59 |
| |
For the year ended December 31, 2017, weWe did not recognize impairments to our proved oil and natural gas properties. For the year ended December 31, 2016 and 2015, we recognized impairmentsan impairment to our proved oil and natural gas properties for the years ended December 31, 2018 and 2017. The possibility and amount of $160.8 millionany future impairments is difficult to predict, and $1.2 billion, respectively. The impairments were primarily due to the declinewill depend, in part, upon future oil and natural gas prices. prices to be utilized in the ceiling test, estimates of proved reserves, future capital expenditures and operating costs.
As of December 31, 2018 and 2017, we did not recognize anyall of our undeveloped locations that meet the technical definition of Proved Undeveloped Reserves based on engineering guidelines remained classified as unproved due to our inability to meet the Reasonable Certainty criteria for recording Proved Undeveloped Reserves, as prescribed under the SEC requirements as a resultrequirements. Our recognition of proved undeveloped reserves continues to be affected by the uncertainty regarding our availability of capital required to develop these reserves. We have aA significant amount of our proved undeveloped reserves that would meetwere previously reclassified to unproved remain economic at current prices, and we may report proved undeveloped reserves in the criteria to be classified as Proved Undeveloped Reservesfuture if we were able to demonstratedetermine we have the financial capability to execute a development plan.
Under full cost accounting rules, any ceiling test impairments of oil and natural gas properties may not be reversed in subsequent periods. Since we do not designate our derivative financial instruments as hedging instruments, we are not allowed to use the impacts of the derivative financial instruments in our ceiling test computations.
The evaluation of impairment of our oil and natural gas properties includes estimates of Proved Reserves.proved reserves. There are numerousinherent uncertainties inherent in estimating quantities of Proved Reserves, inproved reserves including projecting the future rates of production and in the timing of development activities. The accuracy of any reserve estimate is a function of the quality of available data, and of engineering and geological interpretation and judgment. Results of drilling, testing and production subsequent to the date of the estimate may justify revisions of such estimate. Accordingly, reserve estimates often differ from the quantities of oil and natural gas that are ultimately recovered.
Other property and equipment, net and other non-current assets
Other property and equipment, net and other non-current assets is primarily comprised of surface acreage and buildings and equipment associated with field offices located in our South Texas region. The buildings and equipment are capitalized at cost and depreciated on a straight line basis over their estimated useful lives ranging from 35 to 15 years.
Goodwill
In accordance with FASB ASC 350-20, Intangibles-Goodwill and Other ("("ASC 350-20"), goodwill isshall not be amortized, but is tested for impairment on an annual basis,at least annually, or more frequently as impairment indicators arise. Impairment tests which involve the use of estimates related to the fair market value of the business operations with which goodwill is associated, are performed as of December 31 of each year.associated. Losses, if any, resulting from impairment tests will be reflected in operating income or loss in the Consolidated Statements of Operations.
We considerAs of December 31, 2018, we utilized a discounted cash flow model to value our business and corroborated the results of the valuation model through a comparison to our enterprise value that is calculated as the combined market capitalization of our equity plus the fair value of our debt,debt. The discounted cash flow model used in determining the fair value ofincome approach requires us to make various judgmental assumptions about future production, revenues, operating and capital expenditures, discount rates and other inputs which are based on our reporting unit. As part ofbudgets, business plans, economic projections and anticipated future cash flows. Due to the determinationchanging market conditions, it is possible that inputs and assumptions used in the valuation may change in the future, which could materially affect the estimate of the fair value of our reporting unit, we corroborate our enterprise value to the results of the valuation model in which we apply a two-part, equally weighted approach in determining the fair value of our business. We perform an income approach, which uses a discounted cash flow model to value our business, and a market approach, in which our value is determined using trading metrics and transaction multiples of peer companies.
As a result of testing, the fair value of our business significantly exceeded the carrying value of net assets at December 31, 2017 and we did not record an impairment charge for the periodsyears ending December 31, 2017, 2016 or 2015.2018 and 2017.
Asset retirement obligations
We apply FASB ASC 410-20, Asset Retirement and Environmental Obligations ("ASC 410-20") to account for estimated future plugging and abandonment costs. ASC 410-20 requires legal obligations associated with the retirement of long-lived assets to be recognized at their estimated fair value at the time that the obligations are incurred. Upon initial recognition of a liability, that cost is capitalized as part of the related long-lived asset and allocated to expense over the useful life of the asset. Our asset retirement obligations primarily represent the present value of the estimated amount we will incur to plug, abandon and remediate our proved producing properties at the end of their productive lives, in accordance with applicable state laws.
The following is a reconciliation of our asset retirement obligations for the periods indicated:years ended December 31, 2018 and 2017:
| | | | | December 31, | | Year Ended December 31, |
| (in thousands) | | 2017 | | 2016 | | 2015 | | 2018 | | 2017 |
| Asset retirement obligations at beginning of period | | $ | 11,289 |
| | $ | 41,648 |
| | $ | 36,755 |
| | $ | 12,017 |
| | $ | 11,289 |
|
| Activity during the period: | | | | | | | | | | |
| Liabilities incurred during the period | | 12 |
| | — |
| | 881 |
| | — |
| | 12 |
|
| Revisions in estimated assumptions | | — |
| | 175 |
| | 3,215 |
| | (1 | ) | | — |
|
| Liabilities settled during the period | | (175 | ) | | (140 | ) | | (293 | ) | | (77 | ) | | (175 | ) |
Adjustment to liability due to acquisitions | | 17 |
| | 1 |
| | 180 |
| | 2,319 |
| | 17 |
|
Adjustment to liability due to divestitures (1) | | — |
| | (32,605 | ) | | (1,367 | ) | | (7 | ) | | — |
|
| Accretion of discount | | 874 |
| | 2,210 |
| | 2,277 |
| | 1,054 |
| | 874 |
|
| Asset retirement obligations at end of period | | 12,017 |
| | 11,289 |
| | 41,648 |
| | 15,305 |
| | 12,017 |
|
| Less current portion | | 600 |
| | 344 |
| | 845 |
| | 600 |
| | 600 |
|
| Long-term portion | | $ | 11,417 |
| | $ | 10,945 |
| | $ | 40,803 |
| | $ | 14,705 |
| | $ | 11,417 |
|
| |
| (1) | ForThe increase in our asset retirement obligations during the year ended December 31, 2016, the adjustment to liability2018 is primarily due to divestitures consisted primarilyadditional interests in oil and natural gas properties acquired as part of $22.6 million and $9.7 million from the sales of our conventional assets located in Pennsylvania and West Virginia, respectively.Appalachia JV Settlement. |
Our asset retirement obligations are determined using discounted cash flow methodologies based on inputs and assumptions developed by management. We do not have any assets that are legally restricted for purposes of settling asset retirement obligations.
Revenue recognition and natural gas imbalances
In May 2014, the FASB issued ASU No. 2014-09, Revenue from Contracts with Customers (Topic 606) (“ASU 2014-09”). The FASB and the International Accounting Standards Board jointly issued this comprehensive new revenue recognition standard that will supersede nearly all existing revenue recognition guidance under GAAP. The core principle of the guidance is that an entity should recognize revenue to depict the transfer of promised goods or services to customers in an amount that reflects the consideration to which the entity expects to be entitled in exchange for those goods or services. The FASB issued additional ASUs that primarily clarified the implementation guidance on principal versus agent considerations, performance obligations and licensing, collectability, presentation of sales taxes and other similar taxes collected from customers, and non-cash consideration. ASU 2014-09 is effective for annual and interim periods beginning after December 15, 2017 and permits the use of either the retrospective or cumulative effect transition method.
We adopted ASU No. 2014-09, Revenue from Contracts with Customers and related updates in the first quarter of 2018 based on the modified retrospective method of adoption. The adoption of this standard did not have an impact on our consolidated financial condition and results of operations. We have implemented processes to ensure new contracts are reviewed for the appropriate accounting treatment and to generate the disclosures required under the new standard.
Overview of marketing arrangements
We produce oil and natural gas. We do not refine or process the oil or natural gas we produce. We sell the majority of the oil we produce under contracts using market sensitive pricing. The majority of our oil contracts are based on NYMEX pricing, which is typically calculated as the average of the daily closing prices of oil to be delivered one month in the future. We also sell a portion of our oil at F.O.B. field prices posted by the principal purchaser of oil where our producing properties are
located. Our sales contracts are of a type common within the industry, and we usually negotiate a separate contract for each area. Generally, we sell our oil to purchasers and refiners near the areas of our producing properties.
We sell the majority of our natural gas under individually negotiated gas purchase contracts using market sensitive pricing. Our sales contracts vary in length from spot market sales of a single day to term agreements that may extend for a month or more. Our natural gas customers primarily include natural gas marketing companies. The natural gas purchase contracts define the terms and conditions unique to each of these sales. The price received for natural gas sold on the spot market varies daily, reflecting changing market conditions.
Revenue recognition under ASC 606
We use the sales method of accounting for oil and natural gas revenues. Under theWe record sales method, revenues are recognizedrevenue based on actualan estimate of the volumes ofdelivered at estimated prices as determined by the applicable sales agreement. We estimate our sales volumes primarily on company-measured volume readings. We then adjust our oil and natural gas sold to purchasers. Gassales in subsequent periods based on the data received from our purchasers that reflects actual volumes and prices received. Natural gas imbalances at December 31, 2018 were 0.7 Bcf and were reflected as a reduction to our Proved Reserves. Natural gas imbalances at December 31, 2017, 2016 and 2015 were not significant.
Gathering and transportation
We generally sell oil and natural gas under two types of agreements whichthat are common in our industry. Both types of agreements include a transportation charge. Onecharges. We evaluate whether we are the principal or the agent in each transaction. The first type of agreement is a net-back arrangement, under which we sell oil or natural gas at the wellhead and collect a price, net of the transportation costs incurred by the purchaser. The purchaser takes custody, title and risk of loss of the oil or natural gas at the wellhead. In this case, we record salesrevenue when the control transfers to the purchaser at the wellhead based on the price received, from the purchaser, net of the transportation costs.
Under the other arrangement,second type of agreement, we sell oil or natural gas at a specific delivery point, pay transportation to a third-party and receive proceeds from the purchaser with no transportation deduction. The purchaser takes custody, title, and risk of loss of the oil or natural gas at the specific delivery point. In this case, we are deemed to be the principal and the ultimate third-party purchaser is deemed to be the customer. We recognize revenue when control transfers to the purchaser at the specific delivery point based on the price received from the purchaser. The costs that we incur to transport the oil or natural gas are recorded as gathering and transportation expenses. As such, our computed realized prices include revenues that are recognized under two separate bases.
Raider Marketing, LP (“Raider”) is a wholly owned subsidiary focused on the marketing of oil and natural gas. Raider purchases and resells natural gas from third-party producers, as well as oil and natural gas from operated wells in Texas and Louisiana, and charges a fee for marketing services to certain working interest owners in the related wells. Raider takes custody, title and risk of loss from the third-party producer upon the purchase of natural gas and then sells the natural gas to a separate third-party purchaser further downstream. The price paid for the purchase of natural gas from the third-party producer is not dependent on the price received from the ultimate purchaser. We are deemed to be the principal in these transactions. As such, third party purchases and sales are reported on a gross basis as “Purchased natural gas” expenses and “Purchased natural gas and marketing” revenues, respectively. The marketing fee charged by Raider to certain working interest owners in our operated wells is reported as “Purchased natural gas and marketing” revenues.
Transaction price allocated to remaining performance obligations
Our sales are short-term in nature with a contract term of one year or less. We have utilized the practical expedient in ASC 606-10-50-14 exempting us from disclosure of the transaction price allocated to remaining performance obligations if the performance obligation is part of a contract that has an original expected duration of one year or less.
Contract balances
Under our oil and natural gas sales contracts, we invoice customers once our performance obligations have been satisfied, at which point payment is unconditional. Accordingly, our oil and natural gas sales contracts do not give rise to contract assets or liabilities under ASC 606.
Prior-period performance obligations
We record revenue in the month production is delivered to the purchaser. However, settlement statements for certain oil and natural gas sales may not be received for 30 to 90 days after the date production is delivered, and as a result, we are
required to estimate the amount of production delivered to the purchaser and the price that will be received for the sale of the product. We record the differences between our estimates and the actual amounts received for product sales in the month that payment is received from the purchaser. We have internal controls for our revenue estimation process and related accruals, and any identified differences between our revenue estimates and actual revenue received historically have not been significant. For the year ended December 31, 2018, revenue recognized in the reporting period related to performance obligations satisfied in prior reporting periods was not material.
Gathering and transportation
As noted earlier in our discussion of revenue recognition, we generally sell oil and natural gas under two types of agreements in which both types of agreements include a transportation charge. Under the first agreement, transportation charges are incurred by the purchaser while under the second arrangement, we incur the cost of transportation as receive proceeds from the purchaser with no transportation deduction. In this case, we record the transportation cost as gathering and transportation expense. As such, our computed realized prices, before the impact of derivative financial instruments, include revenues which are reported under two separate bases. Gathering and transportation expenses totaled $76.2 million and $111.4 million$106.5 million and $99.3 million for the years ended December 31, 2017, 20162018 and 2015,2017, respectively. Transportation charges for the year ended December 31, 2018 were lower due to the rejection of certain firm transportation agreements in connection with the bankruptcy proceedings.
Capitalization of internal costs
As part of our proved developed oil and natural gas properties, we capitalize a portion of salaries and related share-based compensation for employees who are directly involved in the acquisition, appraisal, exploration, exploitation and development of oil and natural gas properties. During the years ended December 31, 2017, 20162018 and 2015,2017, we capitalized $3.9 million, $4.0$3.3 million and $10.6$3.9 million, respectively. The capitalized amounts include $1.0 million, $0.8$0.3 million and $3.4$1.0 million of share-based compensation for the years ended December 31, 2017, 20162018 and 2015,2017, respectively.
Overhead reimbursement fees
We have classified fees from overhead charges billed to working interest owners of $14.6 million, $13.7$14.1 million and $13.1$14.6 million for the years ended December 31, 2017, 20162018 and 2015,2017, respectively, as a reduction of general and administrative expenses in the accompanying Consolidated Statements of Operations. We classified our share of these charges as oil and natural gas production costs in the amount of $6.0 million, $5.8$6.7 million and $5.7$6.0 million for the years ended December 31, 2017, 20162018 and 2015,2017, respectively.
In addition, we have agreements with Shell that allow us to bill each other certain personnel costs and related fees incurred on behalf of the joint ventures in the East Texas, North Louisiana and Appalachia regions.regions (prior to the Appalachia JV Settlement). For the years ended December 31, 2017, 20162018 and 2015,2017, general and administrative expenses were reduced by $6.4 million, $7.1$4.3 million and $15.9$6.4 million, respectively, for recoveries of fees for our personnel and services provided to our joint ventures and other partners. These recoveries are net of fees charged to us by Shell for their personnel and services.
Environmental costs
Environmental costs that relate to current operations are expensed as incurred. Remediation costs that relate to an existing condition caused by past operations are accrued when it is probable that those costs will be incurred and can be reasonably estimated based upon evaluations of currently available facts related to each site.
Income taxes
Income taxes are accounted for in accordance with FASB ASC 740, Income Taxes ("ASC 740"), under which deferred income taxes are recognized for the future tax effects of temporary differences between the financial statement carrying amounts and the tax basis of existing assets and liabilities using the enacted statutory tax rates in effect at year-end. The effect on deferred taxes for a change in tax rates is recognized in earnings in the period that includes the enactment date. A valuation allowance for deferred tax assets is recorded when it is more likely than not that the benefit from the deferred tax asset will not be realized.
Earnings per share
We account for earnings per share in accordance with FASB ASC 260-10, Earnings Per Share ("ASC 260-10"). ASC 260-10 requires companies to present two calculations of earnings per share ("EPS"): basic and diluted. Basic EPS is based on the weighted average number of common shares outstanding during the period and includes warrants representing the right to purchase our common shares at an exercise price of $0.01. Basic EPS excludes stock options, restricted share units, restricted
share awards, warrants issued Energy Strategic Advisory Services LLC ("ESAS", the warrants are referred to as "ESAS Warrants") and Financing Warrants (as defined in "Note 4. Derivative financial instruments"). Diluted EPS is computed in the same manner as basic EPS after assuming the issuance of common shares for all potentially dilutive common share equivalents,
which include stock options, restricted share units, restricted share awards, ESAS Warrants and Financing Warrants, whether exercisable or not.
Equity-based compensation
Our equity-based compensation includes share-based compensation to employees which we account for in accordance with FASB ASC 718, Compensation-Stock Compensation ("ASC 718") and equity-based compensation for ESAS Warrants which we accounted for in accordance with FASB ASC 505-50, Equity-Based Payments to Non-Employees ("ASC 505-50"). See "Note 13. Related party transactions" for further discussion.
ASC 718 requires all share-based payments to employees, including grants of employee stock options, restricted share units and restricted share awards, to be recognized in our Consolidated Statements of Operations based on their estimated fair values. We recognize expense on a straight-line basis over the vesting period of the option, restricted share unit or restricted share award. We capitalize part of our share-based compensation that is attributable to our acquisition, exploration, exploitation and development activities.
Our 2005 Amended and Restated Long-Term Incentive Plan ("2005 Incentive Plan") provides for the granting of options and other equity incentive awards of our common shares in accordance with terms within the agreements. New shares will be issued for any options exercised or awards granted. Under the 2005 Incentive Plan, we have only issued stock options, restricted share units and restricted share awards, although the plan allows for other share-based awards. We have discontinued the grant of share-based compensation to officers and employees until the completion of a restructuring. As a result, there were no grants of share-based compensation during the years ended December 31, 2018 and 2017. See further discussion in "Note 11. Equity-based and other incentive-based compensation".
The measurement of the ESAS Warrants was accounted for in accordance with ASC 505-50, which required the warrants to be re-measured each interim reporting period until the completion of the services under the agreement and an adjustment was recorded in our Consolidated Statements of Operations included as equity-based compensation expense. The ESAS Warrants were forfeited and canceled on November 9, 2017 concurrently with the suspension of the services and investment agreement with ESAS. See "Note 11. Equity-based and other incentive-based compensation" for additional information of the ESAS Warrants.
Recent accounting pronouncements
In February 2016, the FASB issued Accounting Standards Update ("ASU") No. 2016-02, Leases (Topic 842) ("ASU 2016-02"). The main difference between the current requirement under GAAP and ASU 2016-02 is the recognition of lease assets and lease liabilities by lessees for those leases classified as operating leases. ASU 2016-02 requires that a lessee recognize in the statement of financial position a liability to make lease payments (the lease liability) and a right-of-use asset representing its right to use the underlying asset for the lease term (other than leases that meet the definition of a short-term lease). The liability will be equal to the present value of lease payments. The asset will be based on the liability, subject to adjustment, such as for initial direct costs. For income statement purposes, the FASB retained a dual model, requiring leases to be classified as either operating or finance. Operating leases will result in straight-line expense (similar to current operating leases) while finance leases will result in a front-loaded expense pattern (similar to current capital leases). Classification will be based on criteria that are largely similar to those applied in current lease accounting. For lessors, the guidance modifies the classification criteria and the accounting for sales-type and direct financing leases. ASU 2016-02 is effective for annual and interim periods beginning after December 15, 2018 and early adoption is permitted.
In January 2018, the FASB issued further guidance on the new lease standard in ASU No. 2018-01, Leases (Topic 842): Land Easement Practical Expedient for Transition to Topic 842 (“ASU 2018-01”). ASU 2018-01 provides a practical expedient to exclude existing or expired land easements from the evaluation of leases under ASU 2016-02 mustif the easements were not previously accounted for as leases under the current guidance. In July 2018, the FASB issued additional guidance on the accounting for leases in ASU No. 2018-10, Codification Improvements to Topic 842, Leases, and ASU No. 2018-11, Leases (Topic 842): Targeted Improvements (“ASU 2018-11”). ASU 2016-02 was initially required to be adopted using a modified retrospective transition, and provides for certain practical expedients. These transactions willwhich would require application of the new guidance at the beginning of the earliest comparative period presented. We are currently assessingThe guidance in ASU 2018-11 provides companies with another transition method that allows entities to recognize a cumulative-effect adjustment to the potential impactopening balance of ASU 2016-02 and expect it may have an impact on our consolidatedretained earnings as of the date of adoption. Under this method, previously presented years’ financial conditionpositions and results of operations upon adoption.would not be adjusted. The new guidance also provides
In August 2016,lessors with a practical expedient, by class of underlying asset, to not separate non-lease components from the FASB issued ASU No. 2016-15, Statementassociated lease component if (1) the non-lease components would otherwise be accounted for under the new revenue recognition standard, (2) both the timing and pattern of Cash Flows (Topic 230): Classificationtransfer are the same for the non-lease components and associated lease component, and (3) if accounted for separately, the lease component would be classified as an operating lease.
We are substantially complete with the adoption of Certain Cash Receipts and Cash Payments ("ASU 2016-15"). ASU 2016-15 reduces diversity in practice in how certain transactions are classified in the statement of cash flows. The amendments in ASU 2016-15 provide guidance on specific cash flow issues including debt prepayment or debt extinguishment costs, settlement of zero-coupon debt instruments or other debt instruments with coupon interest rates that are insignificant in relationASUs related to the effective interest ratenew lease standard using the optional transition method on January 1, 2019, which will not require an adjustment to the opening balance of shareholders' equity. We plan to adopt the borrowing, contingent consideration payments made afterpractical expedient package, the land easement and short-term lease recognition exemption provided for under the new standard. Also, we plan to elect a businesspractical expedient that permits combining lease and non-lease components in a contract and accounting for the combination proceeds from the settlementas a lease. We anticipate that we will recognize a right-of-use asset and corresponding lease liability of insurance claims, proceeds from the settlement of corporate-owned life insurance policies and distributions received from equity method investees. ASU 2016-15 is effective for annual and interim periods beginning after December 15, 2017, and earlyapproximately $4 million to $6 million upon adoption is permitted. We adopted ASU 2016-15 in the fourth quarter of 2017, and elected to apply the cumulative earnings approach to classify distributions received from equity method investees.
In October 2016, the FASB issued ASU No. 2016-16, Income Taxes (Topic 740): Intra-Entity Transfers of Assets Other Than Inventory ("ASU 2016-16"). The amendments in this update require that an entity recognize the income tax consequences of an intra-entity transfer of an asset other than inventory when the transfer occurs. Consequently, the amendments in this update eliminate the exception for an intra-entity transfer of an asset other than inventory. ASU 2016-16 is effective for annual and interim periods beginning after December 15, 2017 and early adoption is permitted. We assessed ASU 2016-16 and concluded it did not have an impact on our consolidated financial condition and results of operations.Consolidated Balance Sheet.
In November 2016, the FASB issued ASU No. 2016-18, Statement of Cash Flows (Topic 230): Restricted Cash (a consensus of the FASB Emerging Issues Task Force) ("“ASU 2016-18"2016-18”). The amendments in this update require that a statement of cash flows explain the change during the period in total cash, cash equivalents and amounts generally described as restricted cash or restricted cash equivalents. Therefore, amounts generally described as restricted cash and restricted cash equivalents should be included with cash and cash equivalents when reconciling the beginning-of-period and end-of-period total amounts shown on the statement of cash flows. ASU 2016-18 is effective for annual and interim periods beginning after December 15, 2017 and early adoption is permitted. We are currently assessing the potential impact ofadopted ASU 2016-18 on our consolidated financial condition and results of operations and will apply ASU 2016-18 beginning within the first quarter of 2018.2018 utilizing retrospective application. The adoption resulted in an increase in reported investing cash flows of $4.1 million for the year ended December 31, 2017 with a corresponding adjustment to the reported end of period cash balances.
In January 2017, the FASB issued Accounting Standards Update ("ASU")ASU No. 2017-01, Business Combinations (Topic 805): Clarifying the Definition of a Business ("“ASU 2017-07"2017-01”). ASU 2017-01 is effective for annual and interim periods beginning after December 15, 2017. Under ASU 2017-01, an entity must first determine whether substantially all of the fair value of the gross assets acquired is concentrated in a single identifiable asset or a group of similar assets. If this threshold is met, the set is not a business. If this threshold is not met, the entity then evaluates whether the set meets the requirement that a business include,includes, at a minimum, an input and a substantive process that together significantly contribute to the ability to create outputs. We are currently assessing the potential impact of ASU 2017-01 on our consolidated financial condition and results of operations and will apply ASU 2017-07 to future asset acquisitions occurring in annual and interim periods beginning after December 15, 2017.
In January 2017, the FASB issued ASU No. 2017-04, Intangibles - Goodwill and Other (Topic 350): Simplifying the Test for Goodwill Impairment ("ASU 2017-04"). ASU 2017-04 eliminates Step 2 of the goodwill impairment test. Instead, an entity should perform its annual or interim goodwill impairment test by comparing the fair value of a reporting unit with its carrying amount. An entity should recognize an impairment charge for the amount by which the carrying amount exceeds the reporting unit’s fair value; however, the loss recognized should not exceed the total amount of goodwill allocated to that reporting unit. An entity still has the option to perform the qualitative assessment for a reporting unit to determine if the quantitative impairment test is necessary. ASU 2017-04 is effective for annual and interim periods beginning after December 15, 2019 and early adoption is permitted for interim or annual goodwill impairment tests performed after January 1, 2017. We early adopted ASU 2017-04 during 2017,2017-01 in the first quarter of 2018 and will apply the guidance inof ASU 2017-04, if applicable,2017-01 prospectively to future goodwill impairment tests.
In May 2017,asset acquisitions, including the FASB issued ASU No. 2017-09, Compensation - Stock Compensation (Topic 718): Scopeacquisitions as part of Modification Accounting ("ASU 2017-09"). ASU 2017-09 provides guidance about which changes to the terms or conditionsAppalachia JV Settlement during the first quarter of a share-based payment award require an entity to apply modification accounting in Topic 718. ASU 2017-09 is effective for annual and interim periods beginning after December 15, 2017, and early adoption is permitted. We adopted ASU 2017-09 in the current period; however, the adoption of ASU 2017-09 did not have an impact on our consolidated financial condition and results of operations. We will apply the guidance in ASU 2017-09 in future periods, if applicable.2018.
In July 2017, the FASB issued ASU No. 2017-11, Earnings Per Share (Topic 260), Distinguishing Liabilities from Equity (Topic 480), Derivatives and Hedging (Topic 815): I. Accounting for Certain Financial Instruments with Down Round Features, II. Replacement of the Indefinite Deferral for Mandatorily Redeemable Financial Instruments of Certain Nonpublic Entities and Certain Mandatorily Redeemable Noncontrolling Interests with a Scope Exception ("(“ASU 2017-11"2017-11”). ASU 2017-11 revises the guidance for instruments with down round features in Subtopic 815-40, Derivatives and Hedging -
Contracts in Entity’s Own Equity, which is considered in determining whether an equity-linked financial instrument qualifies for a scope exception from derivative accounting. An entity is still is required to determine whether instruments would be classified in equity under the guidance in Subtopic 815-40 in determining whether they qualify for that scope exception. If they do qualify, freestanding instruments with down round features are no longer classified as liabilities. Our 2017 Warrants (as defined in “Note 4. Derivative financial instruments”) are required to be classified as liabilities under the current guidance due to their down round features. The amendments in Part I are required to be applied retrospectively to outstanding financial instruments with down round features. ASU 2017-11 is effective for annual and interim periods beginning after December 15, 2018, and early adoption is permitted, including adoption in an interim period. We are currently assessing the impact of ASU 2017-11; however, we believe that it maycould have a significantan impact on our consolidated financial condition and results of operations if we determine the 2017 Warrants qualify for equity classification. During the year ended December 31, 2017,However, we recorded a gain of $159.2 million on the revaluation ofbelieve it is highly likely that our existing common shares as well as the 2017 Warrants onwill be canceled at the Consolidated Statementsconclusion of Operations and a liability of $2.0 million on the Consolidated Balance Sheet as of December 31, 2017.our Chapter 11 Cases.
Revenue from Contracts with Customers (Topic 606)
In May 2014,March 2018, the FASB issued ASU No. 2014-09, Revenue from Contracts with Customers2018-05, Income Taxes (Topic 606) ("740): Amendments to SEC paragraphs pursuant to SEC Staff Accounting Bulletin No. 118 (“ASU 2014-09"2018-05”). The FASBamendments in this update add various SEC paragraphs pursuant to the issuance of SEC Staff Accounting Bulletin No. 118, Income Tax Accounting Implications of the Tax Cuts and Jobs Act (“SAB 118”). SAB 118 directs taxpayers to consider the implications of the Tax Cuts and Jobs Act (“Tax Act”) as provisional when it does not have the necessary information available, prepared, or analyzed in reasonable detail to complete its accounting for the change in the tax law. SAB 118 provides a one-year measurement period from a registrant’s reporting period that includes the Tax Act’s enactment date to allow the registrant sufficient time to obtain, prepare and analyze information to complete the required accounting under ASC 740. We reflected the impact of the changes in rates on our deferred tax assets and liabilities at December 31, 2017, as we are required to reflect the change in the period in which the law is enacted. We completed our analysis of the impact of the Tax Act during 2018 and the International Accounting Standards Board ("IASB") jointly issued this comprehensive new revenue recognition standard that will supersede nearly all existing revenue recognition guidance under GAAP.impact of any changes are reflected in
our deferred tax assets and liabilities at December 31, 2018. The core principleultimate impact of the Tax Act may differ from the estimates provided herein, possibly materially, due to additional regulatory guidance, is that anchanges in interpretations and assumptions, and other actions as a result of the Tax Act.
In June 2018, the FASB issued ASU No. 2018-07, Compensation—Stock Compensation (Topic 718): Improvements to Nonemployee Share-Based Payment Accounting (“ASU 2018-07”). The amendments in this update expand the scope of Topic 718 to include share-based payment transactions for acquiring goods or services from nonemployees. An entity should recognize revenueapply the requirements of Topic 718 to depict the transfer of promisednonemployee awards except in certain circumstances. ASU 2018-07 clarifies that Topic 718 applies to all share-based payment transactions in which a grantor acquires goods or services to customersbe consumed in an amount that reflects the consideration to which the entity expects to be entitled in exchange for those goods or services. In doing so, companies will need to use more judgment and make more estimates than under currently applicable guidance, including identifying performance obligations in the contract, estimating the amount of variable consideration to include ina grantor’s operations unless the transaction price and allocatingeffectively provides financing to the transaction price to each separate performance obligation. The FASB issued additional ASUs that primarily clarified the implementation guidance on principal versus agent considerations, performance obligations and licensing, collectability, presentation of sales taxes and other similar taxes collected from customers, and non-cash consideration.grantor or are awarded under a contract accounted for under Topic 606 (as defined below). ASU 2014-092018-07 is effective for annualfiscal years and interim periods within those fiscal years beginning after December 15, 20172018. The amendments require that adjustments required upon application of the update be made through a cumulative-effect adjustment to retained earnings as of the beginning of the fiscal year of adoption. We have historically awarded share-based compensation to nonemployees; however, we do not currently have any outstanding share-based awards to nonemployees. Therefore, we do not believe the adoption of ASU 2018-07 will have an impact on our consolidated financial condition and permitsresults of operations unless share-based payments are issued to nonemployees in the use of either the retrospective or cumulative effect transition method.future.
We are substantially complete with our assessmentIn July 2018, the FASB issued ASU No. 2018-09, Codification Improvements (“ASU 2018-09”). The amendments in this update include changes to clarify and make other incremental improvements to GAAP under the FASB’s perpetual project to address suggestions from stakeholders. The amendments in this update affect a wide variety of topics and apply to all reporting entities within the scope of the impactaffected accounting guidance. The transition and effective date guidance is based on the facts and circumstances of ASU 2014-09each amendment. A number of the amendments do not require transition guidance and are effective as of the relatedissuance of the update while many of the updates and clarifications. ASU 2014-09 and the related updates will be implementedthat have transition guidance are effective for the interim and annual periods beginning after December 15, 20172018. For amendments relating to issued but not effective guidance, the effective date of these amendments follows that of the originally issued update. We are currently assessing the potential impact of the many amendments within ASU 2018-09 and are currently unable to quantify the newimpact, if any, the standard will be applied using the modified retrospective method of adoption. We do not believe this standard will have a material impact, if any, on our consolidated financial condition and results of operations. However,
3.Acquisitions, divestitures and other significant events
2018 Acquisitions
Appalachia JV Settlement
On January 26, 2018, we filed a motion in the adoptionCourt to authorize the entry into a settlement agreement with a subsidiary of Shell to resolve arbitration regarding our right to participate in an area of mutual interest in the Appalachia region. The final order related to this settlement was approved on February 22, 2018 and we closed the settlement agreement on February 27, 2018 ("Appalachia JV Settlement"). Under the terms of the standard will require that we provide expanded disclosuresAppalachia JV Settlement:
Shell transferred its interests to EXCO in each of BG Production Company (PA), LLC, BG Production Company (WV), LLC, OPCO, and Appalachia Midstream, LLC (“Appalachia Midstream”). On April 20, 2018, BG Production Company (PA), LLC legally changed its name to EXCO Production Company (PA) II, LLC and BG Production Company (WV), LLC legally changed its name to EXCO Production Company (WV) II, LLC;
Shell and EXCO terminated and considered to be fulfilled obligations and liabilities under certain specified agreements related to the nature, amount, timingAppalachia JV;
EXCO reconveyed its interests in certain leases, representing an interest in 364 net acres, that EXCO had previously acquired from Shell within the area of mutual interest, in exchange for consideration of $0.7 million;
EXCO and uncertaintyShell mutually released all existing, future, known, and unknown claims for all existing, future, known, and unknown damages and remedies that each party may have against one another arising out of revenueor relating to the joint development agreement, the area of mutual interest, the arbitration, the state court action, and all joint venture dealings among the parties and certain of their affiliates in the Appalachia region, except as expressly provided in the settlement; and
EXCO caused the arbitration and the state court action to be dismissed with prejudice.
The settlement increased our acreage in the Appalachia region by approximately 177,700 net acres, and the production from the additional interests in producing wells acquired was 26 net Mmcfe per day during December 2017. In addition, EXCO now owns 100% of OPCO and Appalachia Midstream subsequent to the settlement. Prior to the settlement, we accounted for our 50% ownership interests in OPCO and Appalachia Midstream as equity method investments. The entities associated with
the Appalachia JV Settlement, including EXCO Production Company (PA) II, LLC, EXCO Production Company (WV) II, LLC, OPCO, and Appalachia Midstream, have not filed for relief under Chapter 11 of the Bankruptcy Code, and the operations of these entities are not expected to be affected by the Chapter 11 Cases.
We accounted for the acquisitions in accordance with FASB ASC 805, Business Combinations. The following table presents a summary of the fair value of assets acquired and liabilities assumed as part of the Appalachia JV Settlement as of the closing date.
|
| | | | |
| (in thousands) | | Amount |
| Assets acquired: | | |
| Cash and cash equivalents | | $ | 14,832 |
|
| Accounts receivable, net | | 6,493 |
|
| Other current assets | | 5,264 |
|
| Unproved oil and natural gas properties | | 33,542 |
|
| Proved developed and undeveloped oil and natural gas properties, net | | 72,548 |
|
| Other assets | | 18,109 |
|
| Liabilities assumed: | | |
| Accounts payable and accrued liabilities | | (9,718 | ) |
| Asset retirement obligations | | (2,315 | ) |
| Other long-term liabilities | | (9,895 | ) |
| Fair value of net assets acquired | | $ | 128,860 |
|
The fair value of the assets and liabilities acquired as part of the Appalachia JV Settlement of $128.9 million resulted in a gain of $119.2 million after remeasurement of our previously held equity interest in OPCO and Appalachia Midstream and adjustments to certain balances held by OPCO. As of the closing date, the carrying value of our equity investments in OPCO and Appalachia Midstream was $9.6 million.
We performed a valuation of the assets and liabilities acquired as of the closing date. A summary of the key inputs is as follows:
Working capital - The fair value approximated the carrying value for working capital including cash and cash flows arisingequivalents, accounts receivable, other current assets, accounts payable and accrued liabilities.
Oil and natural gas properties - The fair value allocated to unproved and proved oil and natural gas properties was $33.5 million and $72.5 million, respectively. The fair value of oil and natural gas properties was determined based on a discounted cash flow model of the estimated reserves. The estimated quantities of reserves utilized assumptions based on our internal geological, engineering and financial data. We utilized NYMEX forward strip prices to value the reserves then applied various discount rates depending on the classification of reserves and other risk characteristics.
Other assets - The fair value allocated to other assets was $18.1 million, which is primarily comprised of natural gas gathering assets held by Appalachia Midstream. The fair value of the natural gas gathering assets was determined based on transaction multiples of peer companies and a discounted cash flow model from contracts with customers. We plan to complete the implementation of processes to ensure new contracts are reviewedour internally generated oil and natural gas reserves for the appropriate accounting treatmentrelated properties.
Asset retirement liabilities - The fair value allocated to asset retirement obligations was $2.3 million. These asset retirement obligations represent the present value of the estimated amount to be incurred to plug, abandon and generateremediate proved producing properties at the disclosures requiredend of their productive lives, in accordance with applicable state laws. The fair value was determined based on a discounted cash flow model, which included assumptions of the estimated current abandonment costs, discount rate, inflation rate, and timing associated with the incurrence of these costs.
Firm transportation contract - OPCO holds a contract that requires it to transport a minimum volume of natural gas or pay reservation charges. The performance obligations under the new standard priorcontract exceeded the future economic benefit to be received over the filinglife of our Form 10-Q for the three months ended March 31, 2018.contract. We calculated the fair value as the present value of the remaining unused commitments discounted at a rate consistent with market participants. The fair value of the liability was $12.1 million, including the current portion of $2.2 million and the long-term portion of $9.9 million.
Pro forma results of operations - The following table reflects the unaudited pro forma results of operations if the Appalachia JV Settlement had occurred on January 1, 2017:
|
| | | | | | | |
| | Year Ended December 31, |
| (in thousands except for per share data) | 2018 | | 2017 |
| Oil and natural gas revenues | $ | 398,105 |
| | $ | 305,371 |
|
| Net income (loss) (1) | (181,437 | ) | | 27,971 |
|
| Basic earnings (loss) per share | $ | (8.37 | ) | | $ | 1.31 |
|
| Diluted earnings (loss) per share | $ | (8.37 | ) | | $ | 1.31 |
|
| |
3.(1) | Acquisitions, divestituresThe pro forma results of operations include adjustments for revenues and other significant eventsdirect expenses related to the interests acquired as part of the Appalachia JV Settlement. Net income (loss) for the year ended December 31, 2018 includes the non-cash gains or losses associated with the fair value of net assets acquired and remeasurement of previously held interests in OPCO and Appalachia Midstream. |
Related party transactions - As noted previously, prior to the Appalachia JV Settlement, we accounted for our 50% ownership interests in OPCO and Appalachia Midstream as equity method investments. OPCO served as the operator of our wells in the Appalachia JV and we advanced funds to OPCO on an as needed basis. Additionally, there are service agreements between us and OPCO whereby we provide administrative and technical services for which we are reimbursed. Prior to the closing of the settlement, we received $1.7 million under these agreements during 2018. We received $6.6 million under these agreements during 2017. As of December 31, 2017, we recorded a receivable of $0.6 million for services performed on behalf of OPCO in "Accounts receivable, net — Other" and a payable of $3.7 million for advances owed to OPCO in "Accounts payable and accrued liabilities" on our Consolidated Balance Sheet. During the year ended December 31, 2017, we received a $6.0 million cash distribution from Appalachia Midstream.
2017 Acquisitions and termination of South Texas divestiture
Termination of South Texas divestiture
On April 7, 2017, we entered into a purchase and sale agreement with a subsidiary of Venado Oil and Gas, LLC ("Venado") to divest our oil and natural gas properties and surface acreage in South Texas for a total purchase price of $300.0 million that was subject to closing conditions and adjustments based on an effective date of January 1, 2017.
Pursuant to the terms of the agreement, the closing of the transaction was originally anticipated to occur on June 1, 2017 (the “Original Scheduled Closing Date”), unless certain conditions had not been satisfied or waived on or prior to the Original Scheduled Closing Date. The purchase agreement included conditions to the closing, including seller's representation and warranty regarding all material contracts being in full force and effect be true as of the Original Scheduled Closing Date. On May 31, 2017, Chesapeake Energy Marketing, L.L.C. (“CEML”) purportedly terminated a long-term natural gas sales contract with an expiration of June 30, 2032, between CEML and Raider Marketing, LP (“Raider”), a wholly owned subsidiary of EXCO.
On June 6, 2017, we filed a petition, application for temporary restraining order and temporary injunction against CEML and subsequently added the parent entity, Chesapeake Energy Corporation ("CEC"). In the lawsuit, we assert breach of contract, tortious interference with existing contract, tortious interference with prospective business relations, and declaratory relief that the contract is still in full force and effect. On June 7, 2017, CEML filed to remove the lawsuit to the United States
District Court Northern District of Texas. On June 9, 2017, the District Court denied our motion for temporary restraining order. CEC filed a motion to dismiss on the basis of personal jurisdiction, and the motion remains pending.
Due to the purported contract termination, the closing conditions were not anticipated to be satisfied or waived by the Original Scheduled Closing Date. Therefore, we entered into an amendment to extend the Original Scheduled Closing Date to August 15, 2017. The amendment, among other things, provided that the satisfaction of the closing conditions would be deemed satisfied by the reinstatement of the natural gas sales contract or by entry into a new gathering agreement. Because all closing conditions had not been satisfied or waived by August 15, 2017, EXCO and Venado mutually agreed to terminate the purchase and sale agreement, effective as of August 15, 2017. Following the termination, the purchase and sale agreement was void and of no further effect.
North Louisiana acquisitions
During the year ended December 31, 2017, we closed acquisitions of certain oil and natural gas properties and undeveloped acreage in the North Louisiana region for $24.2 million. The total purchase price was primarily allocated to $5.2 million of unproved oil and natural gas properties and $19.0 million of proved oil and natural gas properties.
2016 Divestitures
South Texas transaction
On May 6, 2016, we closed a sale of certain non-core undeveloped acreage in South Texas and our interests in four producing wells for $11.5 million, after final purchase price adjustments. Proceeds from the sale were used to reduce indebtedness under the EXCO Resources Credit Agreement (as defined in "Note 5. Debt").
Conventional asset divestitures
On July 1, 2016, we closed the sale of our interests in shallow conventional assets located in Pennsylvania and received an overriding royalty interest in each well. In addition, we retained all rights to other formations below the conventional depths in this region including the Marcellus and Utica shales. For the six months ended June 30, 2016, the divested assets produced approximately 6 Mmcfe per day and the revenues less direct operating expenses, excluding general and administrative costs, generated a net loss of less than $0.1 million. The asset retirement obligations related to the divested wells were $22.6 million on July 1, 2016.
On October 3, 2016, we closed the sale of our interests in shallow conventional assets located primarily in West Virginia for approximately $4.5 million, subject to customary post-closing purchase price adjustments. We retained all rights to other formations below the conventional depths in this region including the Marcellus and Utica shales. For the nine months ended September 30, 2016, the divested assets produced approximately 4 Mmcfe per day and the revenues less direct operating expenses, excluding general and administrative costs, generated net income of $0.7 million. The asset retirement obligations related to the divested wells were $9.7 million on October 3, 2016.
The divestitures of our interests during 2016 did not significantly alter the relationship between our capitalized costs and Proved Reserves and were accounted for as an adjustment of capitalized costs with no gain or loss recognized in accordance with Rule 4-10(c)(6)(i) of Regulation S-X.
2015 Acquisitions and termination of Participation Agreement
In July 2013, we entered into a participation agreement with a joint venture partner for the development of certain assets in the Eagle Ford shale ("Participation Agreement"). The Participation Agreement required us to offer to purchase our joint venture partner's working interest in wells that have been on production for at least one year. The offers were made on a quarterly basis for a group of wells based on prices defined in the Participation Agreement, subject to specific well criteria and return hurdles.
We closed the first acquisition of our joint venture partner's interest in 3 gross (1.4 net) wells on March 11, 2015 for a total purchase price of $7.6 million.
During the fourth quarter of 2015, our Eagle Ford joint venture partner purported to accept our offer under the Participation Agreement to purchase interests in 21 gross (10.3 net) wells for $42.7 million, subject to purchase price adjustments subsequent to the effective date of June 30, 2015. We notified our joint venture partner that we did not intend to
close this acquisition as our partner's purported acceptance had not been received in a timely manner under the terms of the Participation Agreement, and our joint venture partner filed a petition for injunctive relief and damages alleging that, among other things, we breached our obligation under the Participation Agreement. In addition, subsequent offers were also in dispute for various reasons.
On July 25, 2016, we settled the litigation with our joint venture partner, and the litigation was thereafter dismissed after a final judgment order was entered in response to the parties’ joint motion to dismiss the case with prejudice. Among other things, the settlement provided a full release for any claims, rights, demands, damages and causes of action that either party has asserted or could have asserted for any breach of the Participation Agreement. As part of the settlement, the parties amended and restated the Participation Agreement to (i) eliminate our requirement to offer to purchase our joint venture partner's interests in certain wells each quarter, (ii) eliminate our requirement to convey a portion of our working interest to our joint venture partner upon commencing development of future locations, (iii) terminate the area of mutual interest, which required either party acquiring an interest in non-producing acreage included in certain areas to provide notice of the acquisition to the non-acquiring party and allowed the non-acquiring party to acquire a proportionate share in such acquired interest, (iv) provide that EXCO transfer to its joint venture partner a portion of its interests in certain producing wells and certain undeveloped locations in South Texas (“Transferred Interests”), effective May 1, 2016 and (v) modify or eliminate certain other provisions. The Participation Agreement was terminated on December 1, 2016 upon final settlement of the agreement.
We recorded a loss in "Other operating items" in the Consolidated Statements of Operations, and a corresponding credit to the "Proved developed and undeveloped oil and natural gas properties" in our Consolidated Balance Sheet during 2016. The fair value of the Transferred Interests was $23.2 million as of July 25, 2016 based on a discounted cash flow model of the estimated reserves using NYMEX forward strip prices. See "Note 6. Fair value measurements" for additional information. The net production from the Transferred Interests was approximately 350 Bbls of oil per day during June 2016.
| |
4. | Derivative financial instruments |
4.Derivative financial instruments
Our derivative financial instruments are comprised of commodity derivative contractsderivatives and common share warrants.
The table below presents the effect of derivative financial instruments on our Consolidated Balance Sheets:
| | | (in thousands) | |
| | December 31, 2017 | | December 31, 2016 | | | | December 31, 2018 | | December 31, 2017 |
| Current assets | | Derivative financial instruments - commodity derivatives | | $ | 1,150 |
| | $ | — |
| | Derivative financial instruments - commodity derivatives | | $ | — |
| | $ | 1,150 |
|
| Long-term assets | | Derivative financial instruments - commodity derivatives | | — |
| | 482 |
| |
| Current liabilities | | Derivative financial instruments - commodity derivatives | | — |
| | (27,711 | ) | |
| Liabilities subject to compromise | | | Derivative financial instruments - common share warrants | | (61 | ) | | — |
|
| Long-term liabilities | | Derivative financial instruments - commodity derivatives | | — |
| | (464 | ) | | Derivative financial instruments - common share warrants | | — |
| | (1,950 | ) |
| | | Net commodity derivative financial instruments | | $ | 1,150 |
| | $ | (27,693 | ) | |
| | | | | | |
| Long-term liabilities | | Derivative financial instruments - common share warrants | | $ | (1,950 | ) | | $ | — |
| |
The table below presents the effect of derivative financial instruments on our Consolidated StatementStatements of Operations:Operations.
| | | | | Year Ended December 31, | | Year Ended December 31, |
| (in thousands) | | 2017 | | 2016 | | 2015 | | 2018 | | 2017 |
| Gain (loss) on derivative financial instruments - commodity derivatives | | $ | 24,732 |
| | $ | (34,137 | ) | | $ | 75,869 |
| | $ | (615 | ) | | $ | 24,732 |
|
| Gain on derivative financial instruments - common share warrants | | 159,190 |
| | — |
| | — |
| | 1,889 |
| | 159,190 |
|
Commodity derivative financial instruments
Our primary objective in enteringWe have historically entered into commodity derivative financial instruments iswith the primary objective to manage our exposure to commodity price fluctuations, protect our returns on investments and achieve a more predictable cash flow from operations. These transactions limit exposure to declines in commodity prices, but also limit the benefits we would realize if commodity prices increase. When prices for oil and natural gas are volatile, a significant portion of the effect of our commodity derivative financial instruments consists of non-cash income or expense due to changes in the fair value. Cash losses or gains only arise from payments made or received on monthly settlements of contracts or if we terminate a contract prior to its expiration. We do not designate our commodity derivative financial instruments as hedging instruments for financial accounting purposes and, as a result, we recognize the change in the respective instruments’ fair value in earnings.
Settlements in the normal course of maturities of our derivative financial instrument contracts result in cash receipts from, or cash disbursements to, our derivative contract counterparties. Changes in the fair value of our derivative financial instrument contracts, which include both cash settlements and non-cash changes in fair value, are included in earnings with a corresponding increase or decrease in the Consolidated Balance Sheets fair value amounts.
Our oil and natural gas derivative instruments have historically beenduring the year ended December 31, 2017 were comprised of the following instruments:
Swaps: Theseswap contracts, allowwhich allowed us to receive a fixed price and pay a floating market price to the counterparty for the hedged commodity.
Collars: A collar is At December 31, 2017, we had outstanding swap contracts covering 3,650 Bbtu of natural gas at a combination of options including a sold call and a purchased put. These contracts allow us to participate in the upside of commodity prices to the ceiling of the call option and provide us with downside protection through the put option. If the market price is below theweighted average strike price of the purchased put at the time of settlement then$3.15 per Mmbtu. In January 2018, the counterparty pays usto our remaining open swap contracts early terminated the excess. Ifoutstanding contracts effective January 31, 2018. We received proceeds of $0.5 million for the market price is above the strike pricesettlement of the sold call at the timethese contracts in February 2018. As of settlement,December 31, 2018, we pay the counterparty the excess. These transactions were conducted contemporaneously with a single counterparty and resulted in a net cashless transaction.
Wedid not have historically entered intoany outstanding commodity derivative financial instruments with the financial institutions that are lenders under the EXCO Resources Credit Agreement. To mitigate our risk of loss due to default, we have entered into master netting agreements with counterparties to our commodity derivative financial instruments that allow us to offset our asset position with our liability position in the event of a default by the counterparty. Our credit rating and financial condition have restricted our ability to enter into certain types of commodity derivative financial instruments and limited the maturity of the contracts with counterparties. instruments.
The DIP Credit Agreement (as defined in "Note 5. Debt") permits us to enter into commodity derivative contracts up to 90% of the reasonably anticipated projected production from our proved developed producing reserves for any month during the forthcoming five year period. We are only permitted to enter into additional commodity derivative contracts with lenders under the DIP Credit Agreement.
The following table presents the volumes and fair value of our commodity derivative financial instruments as of December 31, 2017:
|
| | | | | | | | | | | |
| (dollars in thousands, except prices) | | Volume (Bbtu) | | Weighted average strike price per Mmbtu | | Fair value at December 31, 2017 |
| Natural gas: | | | | | | |
| Swaps: | | | | | | |
| 2018 | | 3,650 |
| | $ | 3.15 |
| | $ | 1,150 |
|
In January 2018, the counterparty to our remaining swap contracts early terminated the outstanding contracts effective January 31, 2018. We received proceeds of $0.5 million for the settlement these contracts in February 2018. As a result, this limits our options to enter into commodity derivative contracts covering our production in future periods. Our exposure to commodity price fluctuations will increase in 2018the future due to lower oil and natural gas volumes covered by derivative contracts compared to historical levels.
At December 31, 2016, we had outstanding swap and collar contracts covering 41,950 and 10,950 Bbtu of natural gas, respectively, and outstanding swap contracts covering 183 Mbbls of oil.
At December 31, 2017, the average forward NYMEX HH natural gas price per Mmbtu for the calendar year 2018 was $2.84.
Our commodity derivative financial instruments covered approximately 58% and 57% of production volumes for the years ended December 31, 2017 and 2016.
Common share warrants
In connection with the issuance of the 1.5 Lien Notes, on March 15, 2017, we issued warrants to the investors of the 1.5 Lien Notes representing the right to purchase an aggregate of up to 21,505,383 common shares (assuming a cash exercise) at an exercise price of $13.95 per share ("(“Financing Warrants"Warrants”), and warrants representing the right to purchase an aggregate of up to 431,433 common shares (assuming a cash exercise) at an exercise price of $0.01 per share (“Commitment Fee Warrants”). In addition, certain exchanging holders of the Second Lien Term Loans received warrants representing the right to purchase an
aggregate of up to 1,325,546 common shares (assuming a cash exercise) at an exercise price of $0.01 per share ("(“Amendment Fee Warrants"Warrants”, and with the Commitment Fee Warrants and Financing Warrants, collectively referred to as the "2017 Warrants"“2017 Warrants”). See "Note 5. Debt" for further discussion
Pursuant to the terms of the Second Lien Term Loans.
Subject to certain exceptions and limitations,2017 Warrants, the 2017 Warrants may not be exercised, subject to certain exceptions and limitations, if, as a result of such exercise, the holder of such 2017 Warrants or its affiliates would beneficially own, directly or indirectly, more than 50% of our outstanding common shares. Each of the 2017 Warrants has an exercise term of 5five years from May 31, 2017 and, subject to certain exceptions, may be exercised by cash or cashless exercise. The Financing Warrants are subject to an anti-dilution adjustment in the event we issue common shares for consideration less than the market value of our common shares or exercise price of the Financing Warrants, subject to certain adjustments and exceptions. The Commitment Fee Warrants and the Amendment Fee Warrants are subject to an anti-dilution adjustment in the event we issue common shares at a price per share less than $10.50 per share, subject to certain exceptions and adjustments. The 2017 Warrants are accounted for as derivatives in accordance with FASB ASC 815, Derivatives and Hedging, (“ASC 815”), and are required to be classified as liabilities due to the types of anti-dilution adjustments.
We record the 2017 Warrants as non-current liabilities at fair value, with the increase or decrease in fair value being recognized in earnings. On January 16, 2018, affiliates of Fairfax, which had previously been identified as a related party, surrendered all of their rights to 2017 Warrants. Their rights under the 2017 Warrants had entitled them to purchase in aggregate up to 10,824,376 common shares at $13.95 per share and 1,725,576 common shares at $0.01 per share. The remaining 2017 Warrants will be measured at fair value on a recurring basis until the date of exercise cancellation or the date of expiration. As a result of the change in the fair value of the 2017 Warrants, we recorded a gaingains of $1.9 million and $159.2 million during the years ended December 31, 2018 and 2017, respectively, on the revaluation of the warrants, during year ended December 31, 2017 in "Gain“Gain on derivative financial instruments - common share warrants"warrants” on the Consolidated Statements of Operations. The gain wasgains were primarily due to a decrease in EXCO'sour share price. In January 2018,price and the 2017 Warrants heldcancellation of warrants by affiliates of Fairfax were canceled; see further discussion in "Note 13. Related party transactions".Fairfax.
5. Debt
The carrying value of our total debt is summarized as follows:
| | | (in thousands) | | December 31, 2017 | | December 31, 2016 | | December 31, 2018 | | December 31, 2017 |
| DIP Credit Agreement | | | $ | 156,406 |
| | $ | — |
|
| EXCO Resources Credit Agreement | | $ | 126,401 |
| | $ | 228,592 |
| | — |
| | 126,401 |
|
| 1.5 Lien Notes, net of unamortized discount | | 176,560 |
| | — |
| | 316,958 |
| | 176,560 |
|
| 1.75 Lien Term Loans, net of unamortized discount | | 845,763 |
| | — |
| | 708,926 |
| | 845,763 |
|
| Exchange Term Loan | | 23,543 |
| | 590,477 |
| |
| Fairfax Term Loan | | — |
| | 300,000 |
| |
| Second Lien Term Loans | | | 17,246 |
| | 23,543 |
|
| 2018 Notes, net of unamortized discount | | 131,345 |
| | 131,056 |
| | 131,576 |
| | 131,345 |
|
| 2022 Notes | | 70,169 |
| | 70,169 |
| | 70,169 |
| | 70,169 |
|
| Deferred financing costs, net | | (11,281 | ) | | (11,756 | ) | | — |
| | (11,281 | ) |
| Total debt, net | | 1,362,500 |
| | 1,308,538 |
| | 1,401,281 |
| | 1,362,500 |
|
| Less amounts due within one year | | 1,362,500 |
| | 50,000 |
| |
| Total debt due after one year | | $ | — |
| | $ | 1,258,538 |
| |
| Less amounts included in liabilities subject to compromise | | | 927,917 |
| | — |
|
| Current maturities of long-term debt | | | $ | 473,364 |
| | $ | 1,362,500 |
|
|
| | | | | | | | | | | | | | | | |
| | | December 31, 2017 |
| (in thousands) | | Carrying value | | Deferred reduction in carrying value | | Unamortized discount/deferred financing costs | | Principal balance |
| EXCO Resources Credit Agreement | | $ | 126,401 |
| | $ | — |
| | $ | — |
| | $ | 126,401 |
|
| 1.5 Lien Notes | | 176,560 |
| | — |
| | 140,398 |
| | 316,958 |
|
| 1.75 Lien Term Loans | | 845,763 |
| | (154,171 | ) | | 17,334 |
| | 708,926 |
|
| Exchange Term Loan | | 23,543 |
| | (6,297 | ) | | — |
| | 17,246 |
|
| 2018 Notes | | 131,345 |
| | — |
| | 231 |
| | 131,576 |
|
| 2022 Notes | | 70,169 |
| | — |
| | — |
| | 70,169 |
|
| Deferred financing costs, net | | (11,281 | ) | | — |
| | 11,281 |
| | — |
|
| Total debt | | $ | 1,362,500 |
| | $ | (160,468 | ) | | $ | 169,244 |
| | $ | 1,371,276 |
|
Termscommencement of the Chapter 11 Cases, and conditionsthe creditors’ rights of enforcement with respect to the debt instruments are subject to the applicable provisions of the Bankruptcy Code.
As of the Petition Date, we adjusted the carrying value of our indebtedness to the estimated amount that will be allowed as claims in the Chapter 11 Cases. These amounts represent our current estimate and may materially differ from actual future settlement amounts paid. This resulted in expenses of $24.4 million for the acceleration of (i) deferred financing costs, (ii) debt discounts, and (iii) deferred reductions in carrying value associated with debt instruments previously accounted for as a troubled debt restructuring pursuant to ASC 470-60, which was classified as “Reorganization items, net” in our Consolidated Statement of Operations for the year ended December 31, 2018. As discussed below, the proceeds from the DIP Facilities were used to repay all obligations under the EXCO Resources Credit Agreement and the EXCO Resources Credit Agreement was terminated. The financing costs of $6.1 million that were directly attributable to the DIP Credit Agreement were expensed as “Reorganization items, net” in our Consolidated Statement of Operations for the year ended December 31, 2018. As of December 31, 2018, the carrying value for each of our debt instruments approximates the principal amount.
On February 22, 2018, the Court approved our ability to make adequate protection payments for interest on the DIP Credit Agreement and the 1.5 Lien Notes. For the year ended December 31, 2018, we made cash interest payments on the DIP Credit Agreement and the 1.5 Lien Notes of $9.6 million and $25.4 million, respectively. The principal and accrued interest associated with the DIP Credit Agreement and 1.5 Lien Notes as of December 31, 2018, were not classified as liabilities subject to compromise as a result of the adequate protection approved by the Court and our current estimate of the recoverability of claims related to these debt obligationsinstruments. We accrued interest on 1.75 Lien Term Loans, Second Lien Term Loans, 2018 Notes and 2022 Notes through the Petition Date with no interest accrued subsequent to the filings. The 1.75 Lien Term Loans, Second Lien Term Loans, 2018 Notes and 2022 Notes are discussed below.classified as “Liabilities subject to compromise” on the Consolidated Balance Sheet as of December 31, 2018. The accrued interest related to these instruments classified as "Liabilities subject to compromise" is presented in the following table.
|
| | | | |
| (in thousands) | | December 31, 2018 |
| 1.75 Lien Term Loans | | $ | 28,800 |
|
| Second Lien Term Loans | | 701 |
|
| 2018 Notes | | 3,289 |
|
| 2022 Notes | | 1,491 |
|
| Accrued interest payable classified as Liabilities subject to compromise | | $ | 34,281 |
|
DIP Credit Agreement
On January 18, 2018, the Court entered into an interim order that authorized us to enter into the DIP Credit Agreement. On January 22, 2018, we closed a Debtor-in-Possessionthe DIP Credit Agreement, (“DIP Credit Agreement”), which includes a senior secured debtor-in-possession revolving credit facilitythe Revolver A Facility in an aggregate principal amount of $125.0 million (“and the Revolver A Facility”) and a senior secured debtor-in-possession revolving credit facilityB Facility in an aggregate principal amount of $125.0 million (“Revolver B Facility”, and together(collectively with the Revolver A Facility, the “DIP Facilities”"DIP Facilities"). with the DIP Lenders. Hamblin Watsa Investment Counsel Ltd. is the administrative agent (“DIP Agent”) for the DIP Credit Agreement. The proceeds fromof the DIP Facilities were to be used in accordance with the DIP Credit Agreement wereto (i) repay obligations outstanding under the EXCO Resources Credit Agreement, (ii) pay for operating expenses incurred during the Chapter 11 Cases subject to a budget provided to the DIP Lenders under the DIP Credit Agreement, (iii) pay for certain transaction costs, fees and expenses, and (iv) pay for certain other costs and expenses of administering the Chapter 11 Cases. We used approximately $104.0 million of the proceeds provided through the DIP Facilities to refinancerepay all obligations outstanding under our credit agreement ("the EXCO Resources Credit Agreement"Agreement. Under the DIP Credit Agreement, approximately $24.0 million of outstanding letters of credit were deemed issued under the Revolver A Facility, and approximately $21.6 million of loans outstanding under the EXCO Resources Agreement were deemed exchanged for loans under the Revolver B Facility.
On February 22, 2018, the Court entered into a final order authorizing entry into the DIP Credit Agreement on a final basis. The entry into the final order resulted in the termination of the EXCO Resources Credit Agreement. As of December 31, 2018, we had $156.4 million in outstanding indebtedness and $12.0 million of letters of credit outstanding under the DIP Facilities. Our available borrowing capacity under the DIP Facilities was $81.6 million as of December 31, 2018.
All amounts outstanding under the DIP Facilities bear interest at an adjusted LIBOR plus 4.00% per annum. During the continuance of an event of default under the DIP Facilities, the outstanding amounts bear interest at an additional 2.00% per annum above the interest rate otherwise applicable. The rate applicable to borrowings under the DIP Facilities at December 31, 2018 was 6.53% per annum.
The DIP Facilities were set to mature on the earliest of (a) January 22, 2019, (b) the effective date of a plan of reorganization in the Chapter 11 Cases, or (c) the date of termination of all revolving commitments and/or the acceleration of the obligations under the DIP Facilities following an event of default. On January 15, 2019, the Company entered into an amendment to the DIP Credit Agreement (the “DIP Amendment”) that extended the maturity date. The DIP Credit Agreement, as amended by the DIP Amendment, will mature on the earliest of (i) May 22, 2019, (ii) the effective date of a plan of reorganization in the Chapter 11 Cases, and provide additional(iii) the date of termination following an event of default of all revolving commitments and/or the acceleration of the obligations under the our senior secured debtor-in possession revolving credit facilities. In accordance with its terms, the DIP Amendment became effective on January 18, 2019. We have not received consents from any creditors in support of the March 2019 Plan; therefore, our ability to confirm a plan of reorganization in a timely manner is highly uncertain due to factors beyond our control, including actions of the Court and creditors. As a result, it is unlikely that we will be able to consummate a plan of reorganization prior to the maturity of the DIP Facilities. Therefore, our long-term liquidity is highly dependent on our ability to fundobtain consents or waivers to further extend the DIP Facilities beyond the scheduled maturity date of May 22, 2019 or refinance the DIP Facilities if we are unable to obtain to consummate a plan of reorganization in a timely manner.
Borrowings under the DIP Credit Agreement remain subject to an initial borrowing base of $250.0 million. A redetermination of the borrowing base is scheduled to occur on April 1, 2019 based upon the value of our operations duringoil and gas reserves. The DIP Lenders have considerable discretion in setting our borrowing base as part of the redetermination process. However, we may elect to redetermine the borrowing base to an amount equal to two-thirds of the net present value, discounted at nine percent, of our proved developed reserves.
The DIP Lenders and the DIP Agent, subject to the Carve-Out (as defined below), at all times: (i) are entitled to joint and several super-priority administrative expense claim status in the Chapter 11 Cases; (ii) have a first priority lien on substantially all of our assets; (iii) have a junior lien on any of our assets subject to a valid, perfected and non-avoidable lien as of the Petition Date, other than such liens securing the obligations under the 1.5 Lien Notes, 1.75 Lien Term Loans and Second Lien Term Loans, and (iv) have a first priority pledge of 100% of the stock and other equity interests in each of our direct and indirect subsidiaries. Our obligations to the DIP Lenders and the liens and super-priority claims are subject in each case to a carve out ("Carve-Out") that accounts for certain administrative, court and legal fees payable in connection with the Chapter 11 Cases. See further discussion of
The DIP Credit Agreement contains certain financial covenants, including, but not limited to:
our cash (as defined in the DIP Credit Agreement) plus unused commitments under the DIP Credit Agreement cannot be less than $20.0 million; and
aggregate disbursements cannot exceed 120% of the aggregate disbursements (excluding professional fees incurred in "Note 17. Subsequent events".the Chapter 11 Cases) set forth in the 13-week forecasts provided to the DIP Agent. The testing period is based on the immediately preceding four-week period and is measured every two weeks. The 13-week forecast is provided to the DIP Agent on a monthly basis and shall be consistent in all material respects with the applicable period covered by the 2018 budget that was previously delivered to the DIP Agent.
As of December 31, 2018, we were in compliance with all of the covenants under the DIP Credit Agreement. The DIP Credit Agreement contains events of default, including: (i) conversion of the Chapter 11 Cases to cases under Chapter 7 of the Bankruptcy Code and (ii) appointment of a trustee, examiner or receiver in the Chapter 11 Cases. The DIP Facilities contained an event of default if we failed to pursue a Court hearing no later than July 1, 2018 to consider the sale of all or substantially all of our assets; however, the final order entered by the Court deemed this requirement to be no longer in force and effect.
EXCO Resources Credit Agreement
As of December 31, 2017, we borrowed substantially all of our remaining unused commitments and had $126.4 million of outstanding indebtedness and $23.0 million of outstanding letters of credit under the EXCO Resources Credit Agreement as of December 31, 2017. The borrowing base under the EXCO Resources Credit agreement was $150.0 million as of December 31, 2017. As a result, the availability remaining under the EXCO Resources Credit Agreement, including letters of credit, was $0.6 million as of December 31, 2017. Borrowings under the EXCO Resources Credit Agreement were collateralized by first lien mortgages providing a security interest of not less than 80% of the engineered value, as defined in the agreement, in our oil and natural gas properties covered by the borrowing base. As discussed above, the proceeds from the DIP Facilities were used to refinance all obligations under the EXCO Resources Credit Agreement and the EXCO Resources Credit Agreement was terminated.
The maturity date of the EXCO Resources Credit Agreement was July 31, 2018. The interest rate grid for the revolving commitment under the EXCO Resources Credit Agreement ranged from London Interbank Offered Rate ("LIBOR") plus 250 bps to 350 bps (or alternate base rate ("ABR") plus 150 bps to 250 bps), depending on our borrowing base usage. On December 31, 2017, our interest rate was approximately 4.9%.
Concurrently with the issuance of the 1.5 Lien Notes and as a condition precedent thereto, on March 15, 2017, we amended the EXCO Resources Credit Agreement to, among other things, permit the issuance of the 1.5 Lien Notes and the exchanges of Second Lien Term Loans, reduce the borrowing base thereunder to $150.0 million and modify certain financial covenants. Our financial covenants (as defined in the EXCO Resources Credit Agreement), required that:
our cash (as defined in the EXCO Resources Credit Agreement) plus unused commitments under the EXCO Resources Credit Agreement cannot be less than (i) $50.0 million as of the end of a fiscal month and (ii) $70.0 million as of the end of a fiscal quarter;
our Aggregate Revolving Credit Exposure Ratio (as defined in the EXCO Resources Credit Agreement) cannot exceed 1.2 to 1.0 as of the end of any fiscal quarter. Aggregate revolving credit exposure utilized in the Aggregate Revolving Credit Exposure Ratio includes borrowings and letters of credit under the EXCO Resources Credit Agreement; and
our Interest Coverage Ratio cannot be less than 2.0 to 1.0. The consolidated EBITDAX and consolidated interest expense utilized in this ratio are based on the two fiscal quarters ended multiplied by 2.0 as of December 31, 2017, the most recent three fiscal quarters ended multiplied by 4/3 as of March 31, 2018, and the trailing twelve month period for fiscal quarters ending thereafter. The definition of consolidated interest expense includes cash interest payments that are accounted for as reductions in the carrying amount of indebtedness in accordance with FASB ASC 470-60, Troubled Debt Restructuring by Debtors. Consolidated interest expense is limited to payments in cash, and excludes PIK Payments (as defined below) on the 1.5 Lien Notes and 1.75 Lien Term Loans (as defined below).
On December 19, 2017, we entered into a forbearance agreement with the lenders under the EXCO Resources Credit Agreement. Pursuant to this agreement, the lenders under the EXCO Resources Credit Agreement agreed to forbear from
exercising their rights and remedies until January 15, 2018, with respect to anticipated events of default arising from the failure to pay interest on certain debt instruments and failure to comply with certain financial covenants under the EXCO Resources Credit Agreement. An event of default as a result of a breach of any covenant under the EXCO Resources Credit Agreement could also cause an event of default under the indenture governing the 1.5 Lien Notes, credit agreement governing the 1.75 Lien Term Loans and the indentures governing the 2018 Notes and 2022 Notes. FASB ASC 470, Debt, requires debt to be presented as a current liability if a debtor modifies a covenant in anticipation of a potential default and it is probable the debtor will not be able meet the covenant in future periods. Therefore, we have classified the amounts outstanding under the EXCO Resources Credit Agreement, as well as any outstanding debt with cross-default provisions, as a current liability.
1.5 Lien Notes
On March 15, 2017, we issued an aggregate of $300.0 million of 1.5 Lien Notes due March 20, 2022 to affiliates of Fairfax Financial Holdings Limited ("Fairfax"), Bluescape Resources Company LLC ("Bluescape"), Oaktree Capital Management, LP ("Oaktree"), and an unaffiliated investor. We used the majority of the proceeds from the issuance of the 1.5 Lien Notes to repay the entire amount outstanding under the EXCO Resources Credit Agreement in March 2017. As described in “Note 4. Derivative financial instruments,” in connection with the issuance of the 1.5 Lien Notes, we also issued the Commitment Fee Warrants and the Financing Warrants with a combined fair value of $148.6 million. The combined fair value of the warrants and $4.5 million of cash paid to certain investors who elected to receive cash in lieu of Commitment Fee Warrants was recorded as a discount to the 1.5 Lien Notes. The discount and $4.3 million of transaction costs incurred related to the transaction were being amortized to interest expense over the life of the 1.5 Lien Notes until the acceleration of the costs at the Petition Date.
The 1.5 Lien Notes bear interest at a cash interest rate of 8% per annum, or, if we elect to make interest payments on the 1.5 Lien Notes with our common shares or, in certain circumstances, by issuing additional 1.5 Lien Notes, at an interest rate of 11% per annum. Interest is payable bi-annually on March 20 and September 20 of each year, commencing on September 20, 2017. On September 20, 2017, we paid the interest due on the 1.5 Lien Notes in-kind with approximately $17.0 million of aggregate principal amount of 1.5 Lien Notes, resulting in $317.0 million of total aggregate principal amount of 1.5 Lien Notes outstanding. On December 19, 2017, we entered into a forbearance agreement with certain lenders under the 1.5 Lien Notes. Pursuant to this agreement, the lenders under the 1.5 Lien Notes agreed to forbear from exercising their rights and remedies until January 15, 2018, with respect to anticipated events of default arising from the failure to pay interest on certain debt instruments and failure to comply with certain financial covenants under the EXCO Resources Credit Agreement.
As described in “Note 4. Derivative financial instruments,” in connection with the issuance of the 1.5 Lien Notes, we also issued the Commitment Fee Warrants and the Financing Warrants. The combined fair value of the Commitment Fee Warrants and the Financing Warrants of $148.6 million as of March 15, 2017 and $4.5 million of cash paid to certain investors who elected to receive cash in lieu of Commitment Fee Warrants was recorded as a discount to the 1.5 Lien Notes. The discount and $4.3 million of transaction costs incurred related to the transaction are being amortized to interest expense over the life of the 1.5 Lien Notes. We used the majority of the proceeds from the issuance of the 1.5 Lien Notes to repay the entire amount outstanding under the EXCO Resources Credit Agreement in March 2017.
The 1.5 Lien Notes are jointly and severally guaranteed by all of the our subsidiaries that guarantee our indebtedness under the EXCO Resources Credit Agreement, 1.75 Lien Term Loans and the Second Lien Term Loans, and are secured by first priority liens on substantially all of our assets and such guarantors. The 1.5 Lien Notes rank pari passu in right of payment with one another and all of our other existing and future senior indebtedness, including debt under the EXCO Resources Credit Agreement, the 1.75 Lien Term Loans, the Second Lien Term Loans and the 2018 Notes and 2022 Notes. However, as a result of the debt under the EXCO Resources Credit Agreement having a priority claim to the collateral securing the 1.5 Lien Notes, the 1.5 Lien Notes are (i) effectively junior to debt under the EXCO Resources Credit Agreement and any other priority lien obligations, (ii) pari passu with one another, (iii) effectively senior to the 1.75 Lien Term Loans, the Second Lien Term Loans and any third lien obligations and (iv) effectively senior to all of our existing and future unsecured senior indebtedness, including the 2018 Notes and 2022 Notes, in each case to the extent of the collateral.
1.75 Lien Term Loans and Second Lien Term Loan Exchange
During 2015, we closed a 12.5% senior secured second lien term loan with certain affiliates of Fairfax in the aggregate principal amount of $300.0 million ("Fairfax Term Loan") and a 12.5% senior secured second lien term loan with certain unsecured noteholders in the aggregate principal amount of $400.0 million (“Exchange Term Loan" and together with the Fairfax Term Loan, "Second Lien Term Loans"). The proceeds from the Exchange Term Loan were used to repurchase a portion of the outstanding 2018 Notes and 2022 Notes in exchange for the holders of such notes agreeing to act as lenders in connection with the Exchange Term Loan. The exchange was accounted for as a troubled debt restructuring pursuant to FASB ASC 470-60, Troubled Debt Restructuring by Debtors. The future undiscounted cash flows from the Exchange Term Loan through its maturity were less than the carrying amounts of the retired 2018 Notes and 2022 Notes. As a result, the carrying amount of the Exchange Term Loan was adjusted to equal the total undiscounted future cash payments, including interest and principal. All cash payments under the terms of the Exchange Term Loan, whether designated as interest or as principal amount, reduce the carrying amount and no interest expense is recognized.
In connection with the offering of the 1.5 Lien Notes, on March 15, 2017, we completed the Second Lien Term Loan Exchange whereby approximately $682.8 million in aggregate principal amount of the outstanding Second Lien Term Loans, consisting of all of the outstanding indebtedness under the Fairfax Term Loan and approximately $382.8 million in aggregate principal amount of the Exchange Term Loan, were exchanged for approximately $682.8 million in aggregate principal amount of 1.75 Lien Term Loans. As described in “Note 4. Derivative financial instruments,” in connection with the issuance of the 1.75 Lien Term Loans, we also issued the Amendment Fee Warrants with a fair value of $12.6 million. The fair value of the Amendment Fee Warrants issued to the lenders of the 1.75 Lien Term Loans and the $8.6 million of cash paid to the lenders who elected to receive cash in lieu of warrants was recorded as a discount to the 1.75 Lien Term Loans, and was being amortized to interest expense over the life of the loans until the acceleration of the discount at the Petition Date.
As a result of the Second Lien Term Loan Exchange, the Fairfax Term Loan was deemed satisfied and paid in full and was terminated. In addition, by participating in the Second Lien Term Loan Exchange, each exchanging lender was deemed to consenthave consented to an amendment to the Second Lien Term Loans that eliminated substantially all of the restrictive covenants and events of default in the agreements governing the Second Lien Term Loans. Following the Second Lien Term Loan Exchange, the Company haswe had approximately $17.2 million in aggregate principal amount of Second Lien Term Loans outstanding, consisting entirely of the remaining portion of the Exchange Term Loan.
The Second Lien Term Loan Exchange was accounted for as a modification of debt, and no gain or loss was recognized on the exchange. As described in “Note 4. Derivative financial instruments,” in connection with the issuance of the 1.75 Lien Term Loans, we also issued the Amendment Fee Warrants. The combined fair value of the Amendment Fee Warrants issued to the lenders of the 1.75 Lien Term Loans on March 15, 2017 of $12.6 million and $8.6 million of cash paid to the lenders who elected to receive cash in lieu of warrants was recorded as a discount to the 1.75 Lien Term Loans, and is being amortized to interest expense over the life of the loans. The transaction costs related to the Second Lien Term Loan Exchange of $6.4 million were recorded in "Gain (loss)"Loss on restructuring and extinguishment of debt" in our Consolidated StatementsStatement of Operations for the year ended December 31, 2017.
The 1.75 Lien Term Loans are due on October 26, 2020, bear interest at a cash rate of 12.5% per annum, or, if we elect to pay interest on the 1.75 Lien Term Loans with our common shares or, in certain circumstances, by issuing additional 1.75
Lien Term Loans, at an interest rate of 15.0% per annum. On September 20, 2017, we paid the interest due on the 1.75 Lien Term Loans in-kind with approximately $26.2 million of aggregate principal amount of 1.75 Lien Term Loans, resulting in $708.9 million of total aggregate principal amount of 1.75 Lien Term Loans outstanding. On December 19, 2017, we entered into a forbearance agreement with certain lenders under the 1.75 Lien Term Loans. Pursuant to this agreement, the lenders under the 1.75 Lien Term Loans agreed to forbear from exercising their rights and remedies until January 15, 2018, with respect to anticipated events of default arising from the failure to pay interest on certain debt instruments and failure to comply with certain financial covenants under the EXCO Resources Credit Agreement. The December 20, 2017 interest payment on the 1.75 Lien Term Loans was required to be paid in-kind pursuant to the terms of the indenture governing the 1.5 Lien Notes. We have not paid the interest on the 1.75 Lien Term Loans of $27.0 million, based on the rate of 15% for PIK Payments that was due on December 20, 2017. Also, we have not paid the interest on the Second Lien Term Loans of $0.5 million that was due on December 26, 2017. As a result of the failure to pay interest on the Second Lien Term Loans, we are currently in default of the agreement governing the Second Lien Term Loans and the outstanding balance was classified as a current liability as of December 31, 2017.
The 1.75 Lien Term Loans are jointly and severally guaranteed by all of our subsidiaries that guarantee the indebtedness under the EXCO Resources Credit Agreement and the Second Lien Term Loans, and are secured by first priority liens on substantially all of our assets and such guarantors. The 1.75 Lien Term Loans rank pari passu in right of payment with one another and all of our other existing and future senior indebtedness, including debt under the EXCO Resources Credit Agreement, the 1.5 Lien Notes, the Second Lien Term Loans and the 2018 Notes and 2022 Notes. However, as a result of the debt under the EXCO Resources Credit Agreement and the 1.5 Lien Notes having a priority claim to the collateral securing the 1.75 Lien Term Loans, the 1.75 Lien Term Loans rank (i) effectively junior to debt under the EXCO Resources Credit Agreement, the 1.5 Lien Notes and any other priority lien obligations, (ii) pari passu with one another, (iii) effectively senior to the Second Lien Term Loans and any third lien obligations and (iv) effectively senior to all of our existing and future unsecured senior indebtedness, including the 2018 Notes and 2022 Notes, in each case to the extent of the collateral.
PIK Payments under the 1.5 Lien Notes and the 1.75 Lien Term Loans
The principal purpose of issuing the 1.5 Lien Notes and Second Lien Term Loan Exchange was to alleviate our substantial cash interest payment burden and improve our Liquidity. The indenture governing the 1.5 Lien Notes and the credit agreement governing the 1.75 Lien Term Loans were intended to allow us to make payments in additional indebtedness or common shares ("PIK Payments"), subject to certain restrictions and limitations.
On June 20, 2017, we issued a total of 2,745,754 common shares ("PIK Shares") in lieu of an approximate $23.0 million cash interest payment under the 1.75 Lien Term Loans. The number of PIK Shares issued was calculated based on the interest rate for PIK Payments of 15.0%, which resulted in a value of $27.6 million for the interest payment. The price of the Company's common shares for determining PIK Shares was based on the trailing 20-day volume weighted average price calculated as of the end of the three trading days prior to February 28, 2017. On September 20, 2017, we paid approximately $17.0 million and $26.2 million of PIK Payments under the 1.5 Lien Notes and 1.75 Lien Term Loans, respectively, through the issuance of additional 1.5 Lien Notes and 1.75 Lien Term Loans.
Our initial expectation was to make PIK Payments in common shares on the 1.5 Lien Notes and the 1.75 Lien Term Loans throughout the remainder of 2017 and 2018. However, there were significant limitations on our ability to make PIK Payments during 2017. Under our Registration Rights Agreement with the holdersas a result of the 1.5 Lien Notes and lenders of the 1.75 Lien Term Loans ("Registration Rights Agreement"), our ability to make PIK Paymentsrestrictions in common shares is subject to a resale registration statement related to the common shares issued as PIK Payments and all of the shares underlying the warrants issued in connection with the 1.5 Lien Notes and 1.75 Lien Term Loans being declared effective by the SEC by October 11, 2017 ("Resale Registration Statement"). We did not anticipate the Resale Registration Statement would be declared effective as of October 11, 2017, and, as such, we provided a notice of a delay of effectiveness for the Resale Registration Statement to the
holders of the 1.5 Lien Notes and lenders of the 1.75 Lien Term Loans, as permitted under the Registration Rights Agreement, extending the requirement for the Resale Registration Statement to be declared effective to no later than December 8, 2017. The Resale Registration Statement was not declared effective during 2017; therefore, we were restricted in making PIK Payments in common shares subsequent to December 8, 2017.
Even if the Resale Registration Statement was declared effective, the terms of the indenture governing the 1.5 Lien Notes and the credit agreement governing the 1.75 Lien Term Loans prohibit the issuance of common shares as PIK Payments if it would result in a beneficial owner, directly or indirectly, owning more than 50% of our outstanding common shares. Our common share price experienced a significant decline during 2017, which would have resulted in the issuance of a greater number of common shares to make PIK Payments on the 1.5 Lien Notes and 1.75 Lien Term Loans. This could have prevented us from being able to pay interest in common shares due to the 50% ownership limitation.
The amount of PIK Payments made in additional 1.5 Lien Notes or 1.75 Lien Term Loans is subject to incurrence covenants within our debt agreements that limit our aggregate secured indebtedness to $1.2 billion. This amount is reduced dollar-for-dollar to the extent that we incur any additional secured indebtedness, including PIK Payments in additional indebtedness. After the PIK Payments in additional indebtedness on September 20, 2017, our ability to make future PIK Payments in additional indebtedness was limited to $6.9 million. This would not have been sufficient to make our next quarterly interest payment of approximately $26.9 million, based on the PIK interest rate of 15.0% on the 1.75 Lien Term Loans, that was scheduled to occur on December 20, 2017, and was required to be paid in-kind pursuant to the terms of the indenture governing the 1.5 Lien Notes. Furthermore, the agreement governing the 1.75 Lien Term Loans restricts our ability to pay interest in cash, unless we have liquidity, on a pro forma basis, of at least $175.0 million.
After December 31, 2018, the amount of PIK Payments we are permitted to make is dependent upon our Liquidity, which, for the purposes of 1.5 Lien Notes and 1.75 Lien Term Loans, is defined as (i) the sum of (a) our unrestricted cash and cash equivalents and (b) any amounts available to be borrowed under the EXCO Resources Credit Agreement (to the extent then available) less (ii) the face amount of any letters of credit outstanding under the EXCO Resources Credit Agreement.
Covenants, events of default and other material provisions under the 1.5 Lien Notes and the 1.75 Lien Term Loans
The 1.5 Lien Notes and 1.75 Lien Term Loans are guaranteed by substantially all of EXCO’s subsidiaries, with the exception of certain non-guarantor subsidiaries and our jointly-held equity investments with Shell. The 1.5 Lien Notes and 1.75 Lien Term Loans are secured by second priority liens and third priority liens, respectively, on substantially all of EXCO’s assets and the assets of such guarantors. Subject to certain exceptions, the covenants under the indenture governing the 1.5 Lien Notes and the credit agreement governing the 1.75 Lien Term Loans contain covenants limit our ability and the ability of our restricted subsidiaries to, among other things:
pay dividends or make other distributions or redeem or repurchase our common shares;
prepay, redeem or repurchase certain junior lien or unsecured debt;
enter into agreements restricting the subsidiary guarantors’ ability to pay dividends to us or another subsidiary guarantor, make loans or advances to us or transfer assets to us;
engage in asset sales or substantially alter the business that we conduct;
enter into transactions with affiliates;
consolidate, merge or dispose of assets;
incur liens; and
enter into sale/leaseback transactions.
In addition, the indenture governing the 1.5 Lien Notes includes restrictions on our ability tothings, incur additional indebtedness, among other things and subject totransfer assets or make certain restrictions.types of payments. The indenture governing the 1.5 Lien Notes and the credit agreement governing the 1.75 Lien Term Loans require that net cash proceeds of certain asset sales be used within one year to acquire or develop oil and natural gas properties or we must use the proceeds to permanently repay, redeem or repurchase a portion of the EXCO Resources Credit Agreement, 1.5 Lien Notes or 1.75 Lien Term Loans. If there is an eventcontain customary events of default, we will be required to payincluding the filing of a petition for relief under the Bankruptcy Code, which require the payment of each of the 1.5 Lien Notes and the 1.75 Lien Term Loans in an amount equal to the outstanding principal amount plus an applicable make-whole premium. The enforceability of the make-whole premium on the 1.5 Lien Notes and 1.75 Lien Term Loans is subject to the outcome of the Chapter 11 Cases.
The 1.5 Lien Notes, 1.75 Lien Term Loans and the Second Lien Term Loans are jointly and severally guaranteed by all of the our restricted subsidiaries and are secured by first priority liens on substantially all of our assets and such guarantors. In connection with the offering of the 1.5 Lien Notes and the Second Lien Term Loan Exchange, we entered into an amended and restated intercreditor agreement, under which the lenders of the remaining outstanding portion of the Exchange Term Loan agreed to subordinate their security interest in the collateral to the interests of the holders of the 1.5 Lien Notes and the 1.75 Lien Term Loans and the lenders under EXCO Resources Credit Agreement.Loans. In addition, the lenders of the 1.75 Lien Term Loans agreed to subordinate their security interest in the collateral to the interests of the holders of the 1.5 Lien Notes and the
lenders under the EXCO Resources Credit Agreement, and the holders of theNotes. The 1.5 Lien Notes, agreed1.75 Lien Term Loans and the Second Lien Term Loans are effectively senior to subordinate their security interestall our existing and future unsecured indebtedness, including the 2018 Notes and 2022 Notes, in the collateraleach case to the lenders underextent of the EXCO Resources Credit Agreement.collateral.
2018 and 2022 Notes
The 2018 Notes and 2022 Notes are guaranteed on a senior unsecured basis by substantially all of EXCO’s subsidiaries. Our equity investments, other than OPCO,those acquired as part of the Appalachia JV Settlement, have been designated as unrestricted subsidiaries under the indenture governing the 2018 Notes.
During 2015 and 2016, we completed exchanges and a series of open market repurchases of the 2018 Notes significantly reducing the aggregate principal amount outstanding. As of December 31, 2017, $131.6 million in principal was outstanding on the 2018 Notes. Interest accrues at 7.5% per annum and is payable semi-annually in arrears on March 15 and September 15 of each year. The maturity date of the 2018 Notes is September 15, 2018.
The indentureindentures governing the 2018 Notes contains covenants, which may limit our ability and the ability of our restricted subsidiaries to:
incur or guarantee additional debt and issue certain types of preferred shares;
pay dividends on our capital stock or redeem, repurchase or retire our capital stock or subordinated debt;
make certain investments;
create liens on our assets;
enter into sale/leaseback transactions;
create restrictions on the ability of our restricted subsidiaries to pay dividends or make other payments to us;
engage in transactions with our affiliates;
transfer or issue shares of stock of subsidiaries;
transfer or sell assets; and
consolidate, merge or transfer all or substantially all of our assets and the assets of our subsidiaries.
2022 Notes
The 2022 Notes were issued at 100.0% of the principal amount and bear interest at a rate of 8.5% per annum, payable in arrears on April 15 and October 15 of each year. During 2015 and 2016, we completed exchanges and a series of open market repurchases of the 2022 Notes significantly reducing the aggregate principal amount outstanding. As of December 31, 2017, $70.2 million in principal was outstanding on the 2022 Notes.
The 2022 Notes rank equally in right of payment to any existing and future senior unsecured indebtedness of the Company (including the 2018 Notes) and are guaranteed on a senior unsecured basis by EXCO’s consolidated subsidiaries that are guarantors of the indebtedness under the EXCO Resources Credit Agreement. The 2022 Notes were issued under the same base indenture governing the 2018 Notes and the supplemental indenture governing the 2022 Notes contains similar covenants to those in the supplemental indenture governing the 2018 Notes. As of December 31, 2018, $131.6 million and $70.2 million in principal were outstanding on the 2018 Notes and 2022 Notes, respectively. Interest accrued on the 2018 Notes at 7.5% per annum and was payable semi-annually in arrears on March 15 and September 15 of each year. Interest accrued on the 2022 Notes at 8.5% per annum and was payable semi-annually in arrears on April 15 and October 15 of each year. The maturity date of the 2018 Notes was September 15, 2018 and the maturity date of the 2022 Notes is April 15, 2022. The repayment of the interest and principal obligations was stayed as part of the Chapter 11 proceedings and recorded as "Liabilities subject to compromise" on the Consolidated Balance Sheet as of the December 31, 2018.
6.Fair value measurements | |
6. | Fair value measurements |
We value our derivatives and other financial instruments according to FASB ASC 820, Fair Value Measurements and Disclosures("ASC 820"), which defines fair value as the exchange price that would be received for an asset or paid to transfer a liability ("(“exit price"price”) in the principal or most advantageous market for the asset or liability in an orderly transaction between market participants on the measurement date.
We categorize the inputs used in measuring fair value into a three-tier fair value hierarchy. These tiers include:
Level 1 – Observable inputs, such as quoted market prices in active markets, for substantially identical assets and liabilities.
Level 2 – Observable inputs other than quoted prices within Level 1 for similar assets and liabilities. These include quoted prices in markets that are not active or other inputs that are observable or can be corroborated by observable market data. If the asset or liability has a specified or contractual term, the input must be observable for substantially the full term of the asset or liability.
Level 3 – Unobservable inputs that are supported by little or no market activity, generally requiring development of fair value assumptions by management.
During the years ended December 31, 20172018 and 20162017 there were no changes in the fair value level classifications, except that the Exchange Term Loan was reclassified to Level 3.classifications.
Fair value of derivative financial instruments
The following table presents a summary of the estimated fair value of our derivative financial instruments as of December 31, 20172018 and 2016.2017.
| | | | | December 31, 2017 | | As of December 31, 2018 |
| (in thousands) | | Level 1 | | Level 2 | | Level 3 | | Total | | Level 1 | | Level 2 | | Level 3 | | Total |
| Derivative financial instruments - commodity derivatives | | $ | — |
| | $ | 1,150 |
| | $ | — |
| | $ | 1,150 |
| |
| Liabilities: | | | | | | | | | |
| Derivative financial instruments - common share warrants | | — |
| | (1,950 | ) | | — |
| | (1,950 | ) | | $ | — |
| | $ | 61 |
| | $ | — |
| | $ | 61 |
|
| | | December 31, 2016 | | As of December 31, 2017 |
| (in thousands) | | Level 1 | | Level 2 | | Level 3 | | Total | | Level 1 | | Level 2 | | Level 3 | | Total |
| Assets: | | | | | | | | | |
| Derivative financial instruments - commodity derivatives | | $ | — |
| | $ | (27,693 | ) | | $ | — |
| | $ | (27,693 | ) | | $ | — |
| | $ | 1,150 |
| | $ | — |
| | $ | 1,150 |
|
| Liabilities: | | | | | | | | | |
| Derivative financial instruments - common share warrants | | | — |
| | 1,950 |
| | — |
| | 1,950 |
|
Derivative financial instruments - commodity derivatives
We evaluatehave historically evaluated commodity derivative assets and liabilities in accordance with master netting agreements with the derivative counterparties, but report them on a gross basis onin our Consolidated Balance Sheets. Net commodity derivative asset values are determined primarily by quoted NYMEX futures prices, notional volumes and utilization of the counterparties’ credit-adjusted risk-free rate curves and net commodity derivative liabilities are determined by utilization of our credit-adjusted risk-free rate curve. The credit-adjusted risk-free rates of our counterparties are based on an independent market-quoted credit default swap rate curve for the counterparties’ debt plus the LIBOR curve as of the end of the reporting period. Our credit-adjusted risk-free rate is based on the blended rate of independent market-quoted credit default swap rate curves for companies that have the same credit rating as us plus the LIBOR curve as of the end of the reporting period.
The valuation of our commodity price derivatives, represented by oil and natural gas swaps and collar contracts, is discussed below.
Oil derivatives. Our oil derivatives consisted of swap contracts for notional barrels of oil at fixed NYMEX oil index prices. The asset and liability values attributable to our oil derivatives as of the end of the reporting period are based on (i) the contracted notional volumes, (ii) independent active NYMEX futures price quotes for oil index prices, and (iii) the applicable credit-adjusted risk-free rate curve, as described above.
Natural gas derivatives. Our natural gas derivatives consisted of swap and collar contracts for notional Mmbtus of natural gas at posted price indexes, including NYMEX HH swap and option contracts. The asset and liability values attributable to our natural gas derivatives as of the end of the reporting period are based on (i) the contracted notional volumes, (ii) independent active NYMEX futures price quotes for natural gas, (iii) the applicable credit-adjusted risk-free rate curve, as described above, and (iv) the implied rates of volatility inherent in the option contracts. The implied rates of volatility were determined based on the average of historical HH natural gas prices.
The fair value of our commodity derivative financial instruments may be different from the settlement value based on company-specific inputs, such as credit ratings, futures markets and forward curves, and readily available buyers or sellers.
Derivative financial instruments - common share warrants
The liability attributable to our common share warrants as of the issuance date and the end of each reporting period wasis measured using the Black-Scholes model based on inputs including our share price, volatility, expected remaining life and the risk-free rate of return. The implied rates of volatility were determined based on historical prices of our common shares over a period consistent with the expected remaining life. Common share warrants are measured at fair value on a recurring basis until the date of exercise or the date of expiration.
See further details on the fair value of our derivative financial instruments in “Note 4. Derivative financial instruments”.
Fair value of other financial instruments
Our financial instruments include cash and cash equivalents, accounts receivable and payable and accrued liabilities. The carrying amount of these instruments approximates fair value because of their short-term nature.
The carrying values of our borrowings under the revolving commitment of the EXCO ResourcesDIP Credit Agreement approximatesapproximate fair value, as it isthese are subject to short-term floating interest rates that approximate the rates available to us for those periods.
The estimated fair values of our senior notes and term loans are presented below. The estimated fair values of the 2018 Notes and 2022 Notes have been calculated based on quoted prices in active markets. The estimated fair valuevalues of the 1.5 Lien Notes and Second Lien Term Loans were calculated based on a model internally prepared by management that lacks significant observable inputs and was classified as Level 3. The 1.75 Lien Term Loans and the Exchange Term Loan havehas been calculated based on quoted prices obtained from third-party pricing sources that lack significant observable inputs and are classified as Level 3. The 2017 Warrants are considered freestanding financial instruments and are not considered in the determination of the fair value of the 1.5 Lien Notes and 1.75 Lien Term Loans. The estimated fair value of the Exchange Term Loan was calculated based on quoted prices obtained from third-party sources and classified as Level 2 during 2016. During the year ended December 31, 2017, we reclassified the fair value of the Exchange Term Loan into Level 3 due to the lack of market activity and significant observable inputs. See "Note“Note 5. Debt"Debt” for the carrying value and the principal balance of each debt instrument included in the table below.
|
| | | | | | | | | | | | | | | | |
| | | December 31, 2017 |
| (in thousands) | | Level 1 | | Level 2 | | Level 3 | | Total |
| 1.5 Lien Notes | | $ | — |
| | $ | — |
| | $ | 232,276 |
| | $ | 232,276 |
|
| 1.75 Lien Term Loans | | — |
| | — |
| | 372,186 |
| | 372,186 |
|
| Exchange Term Loan | | — |
| | — |
| | 9,054 |
| | 9,054 |
|
| 2018 Notes | | 4,658 |
| | — |
| | — |
| | 4,658 |
|
| 2022 Notes | | 2,586 |
| | — |
| | — |
| | 2,586 |
|
| | | December 31, 2016 |
| (in thousands) | | Level 1 | | Level 2 | | Level 3 | | Total |
| Exchange Term Loan | | $ | — |
| | $ | 294,000 |
| | $ | — |
| | $ | 294,000 |
|
| Fairfax Term Loan | | — |
| | 222,000 |
| | — |
| | 222,000 |
|
| 2018 Notes | | 79,028 |
| | — |
| | — |
| | 79,028 |
|
| 2022 Notes | | 35,260 |
| | — |
| | — |
| | 35,260 |
|
Other fair value measurements
During 2017 and 2016, we impaired $5.2 million and $4.9 million, respectively, of our investment in a midstream company in the East Texas and North Louisiana regions that we account for under the cost method of accounting. The estimated fair value of our cost method investment was determined based on transaction multiples for similar companies. During 2016, we also impaired $4.7 million of our equity method investment in a midstream company in the Appalachia region and $1.7 million of our equity method investment in OPCO. The estimated fair value of our equity method investment in a midstream company in the Appalachia region was determined based on transaction multiples of peer companies and a discounted cash flow model from our internally generated oil and natural gas reserves for the related properties. The estimated fair value of OPCO was determined based on trading metrics of peer companies. The impairments of our cost and equity method investments were primarily a result of limited development activity in the regions. The impairments were recorded to reduce the carrying values to the fair values and were considered to be Level 3 within the fair value hierarchy.
As discussed in "Note 3. Acquisitions, divestitures and other significant events", we recorded a $23.2 million loss in "Other operating items" in our Consolidated Statements of Operations during 2016 and a corresponding credit to our "Proved developed and undeveloped oil and natural gas properties" in our balance sheet related to the settlement of litigation with a joint venture partner in the Eagle Ford shale. The fair market value of the properties transferred pursuant to the settlement was determined using a discounted cash flow model of the estimated reserves. The estimated quantities of reserves utilized assumptions based on our internal geological, engineering and financial data. We utilized NYMEX forward strip prices to value the reserves, then applied various discount rates depending on the classification of reserves and other risk characteristics. The fair value measurements utilized included significant unobservable inputs that are considered to be Level 3 within the fair value
hierarchy. These unobservable inputs include management's estimates of reserve quantities, commodity prices, operating costs, development costs, discount factors and other risk factors applied to the future cash flows.
As discussed in "Note 2. Summary of significant accounting policies", we assess our unproved oil and natural gas properties for potential impairment due to an other than temporary trend that would negatively impact the fair value. During the year ended December 31, 2015, we impaired approximately $88.1 million of unproved properties to reduce the carrying value to the fair value. These impairment charges were transferred to the depletable portion of the full cost pool. We calculated the estimated fair value of our unproved properties based on the average cost per undeveloped acre or the discounted cash flow models from our internally generated oil and natural gas reserves as of December 31, 2015. The pricing utilized in the discounted cash flow models was based on NYMEX futures, adjusted for basis differentials. Our oil and natural gas properties were further discounted based on the classification of the underlying reserves and management's assessment of recoverability. The fair value measurements utilized included significant unobservable inputs that were considered to be Level 3 within the fair value hierarchy. These unobservable inputs include management's estimates of reserve quantities, commodity prices, operating costs, development costs, discount factors and other risk factors applied to the future cash flows. The average cost per undeveloped acre was based on recent comparable market transactions in each region. |
| | | | | | | | | | | | | | | | |
| | | As of December 31, 2018 |
| (in thousands) | | Level 1 | | Level 2 | | Level 3 | | Total |
| 1.5 Lien Notes | | $ | — |
| | $ | — |
| | $ | 272,609 |
| | $ | 272,609 |
|
| 1.75 Lien Term Loans | | — |
| | — |
| | 216,222 |
| | 216,222 |
|
| Second Lien Term Loans | | — |
| | — |
| | 4,185 |
| | 4,185 |
|
| 2018 Notes | | 23,330 |
| | — |
| | — |
| | 23,330 |
|
| 2022 Notes | | 12,653 |
| | — |
| | — |
| | 12,653 |
|
| | | As of December 31, 2017 |
| (in thousands) | | Level 1 | | Level 2 | | Level 3 | | Total |
| 1.5 Lien Notes | | $ | — |
| | $ | — |
| | $ | 232,276 |
| | $ | 232,276 |
|
| 1.75 Lien Term Loans | | — |
| | — |
| | 372,186 |
| | 372,186 |
|
| Second Lien Term Loans | | — |
| | — |
| | 9,054 |
| | 9,054 |
|
| 2018 Notes | | 4,658 |
| | — |
| | — |
| | 4,658 |
|
| 2022 Notes | | 2,586 |
| | — |
| | — |
| | 2,586 |
|
| |
| 7. | Environmental regulation |
Various federal, state and local laws and regulations covering discharge of materials into the environment, or otherwise relating to the protection of the environment, may affect our operations and the costs of our oil and natural gas exploitation, development and production operations. We do not anticipate that we will be required in the foreseeable future to expend amounts material in relation to the financial statements taken as a whole by reason of environmental laws and regulations. Because these laws and regulations are constantly being changed, we are unable to predict the conditions and other factors over which we do not exercise control that may give rise to environmental liabilities affecting us.
| |
| 8. | Commitments and contingencies |
The following table presents our future minimum obligations under our commercial commitments as of December 31, 2017.2018. The commitments do not include those of our equity method investments.
|
| | | | | | | | | | | | | | | | | | | | |
| (in thousands) | | Gathering and firm transportation services (1) | | Other fixed commitments | | Drilling contracts | | Operating leases and other | | Total |
| 2018 | | $ | 87,621 |
| | $ | 3,222 |
| | $ | 1,138 |
| | $ | 3,760 |
| | $ | 95,741 |
|
| 2019 | | 47,541 |
| | 2,415 |
| | — |
| | 3,149 |
| | 53,105 |
|
| 2020 | | 46,463 |
| | 1,949 |
| | — |
| | 1,622 |
| | 50,034 |
|
| 2021 | | 33,306 |
| | 1,601 |
| | — |
| | 36 |
| | 34,943 |
|
| 2022 | | 33,306 |
| | — |
| | — |
| | — |
| | 33,306 |
|
| Thereafter | | 94,443 |
| | — |
| | — |
| | — |
| | 94,443 |
|
| Total | | $ | 342,680 |
| | $ | 9,187 |
| | $ | 1,138 |
| | $ | 8,567 |
| | $ | 361,572 |
|
| |
(1) | The commitments under our firm transportation agreement with Regency have been excluded from the above totals. See the discussion below for more details regarding this agreement. |
Gathering and firm transportation services |
| | | | | | | | | | | | | | | | |
| (in thousands) | | Drilling contracts | | Operating leases and other | | Other fixed commitments | | Total |
| 2019 | | $ | 3,661 |
| | $ | 1,635 |
| | $ | 17 |
| | $ | 5,313 |
|
| 2020 | | — |
| | 1,595 |
| | 12 |
| | 1,607 |
|
| 2021 | | — |
| | 1,193 |
| | 2 |
| | 1,195 |
|
| 2022 | | — |
| | 1,173 |
| | — |
| | 1,173 |
|
| 2023 | | — |
| | — |
| | — |
| | — |
|
| Thereafter | | — |
| | — |
| | — |
| | — |
|
| Total | | $ | 3,661 |
| | $ | 5,596 |
| | $ | 31 |
| | $ | 9,288 |
|
We have entered into firm transportation and gathering agreements with pipeline companies to facilitate sales from our East Texas and North Louisiana production. Gathering and firm transportation services presented in the tables within this footnote represent our gross commitments under these contracts, and a portion of these costs will be incurred by working interest and other owners. We report these costs as gathering and transportation expenses or as a reduction in total sales price received from the purchaser. In addition, our variable rate firm transportation and gathering agreements do not have a minimum volume commitment and are not included in the tables within this footnote. As such, our gathering and firm transportation services presented in the table above may not be representative of the amounts reported as gathering and transportation expenses in our Consolidated Financial Statements.
At December 31, 2017, our firm transportation and gathering agreements covered the following gross volumes of natural gas:
|
| | | | | | |
| (in Bcf) | | Firm transportation services (1) | | Gathering services |
| 2018 | | 183 |
| | 100 |
|
| 2019 | | 183 |
| | — |
|
| 2020 | | 180 |
| | — |
|
| 2021 | | 146 |
| | — |
|
| 2022 | | 146 |
| | — |
|
| Thereafter | | 413 |
| | — |
|
| Total | | 1,251 |
| | 100 |
|
| |
(1) | The commitments under our firm transportation agreement with Regency have been excluded from the above totals. See the discussion below for more details regarding this agreement. |
On January 18, 2018, the Company and the Filings Subsidiaries filed motions to reject certain executory contracts as permitted under the Bankruptcy Code. This included certain of our sales, gathering and transportation agreements included as commitments as of December 31, 2017. See further discussion of the rejection of these executory contracts in "Note 17. Subsequent events".
Enterprise and Acadian contract litigation
During the third quarter of 2016, we terminated our sales and transportation contracts with Enterprise Products Operating LLC (“Enterprise”) and Acadian Gas Pipeline System (“Acadian”), respectively. We transported natural gas produced from our operated wells in North Louisiana through Acadian, and Enterprise was a purchaser of certain volumes of our natural gas, until we terminated the contracts. Enterprise and Acadian are part of the corporate family of Enterprise Products Partners L.P. (“EPD”). Acadian is an indirect, wholly-owned subsidiary of EPD that owns and operates the Acadian natural gas pipeline system. The agreement with Acadian provided for the firm transportation of 150,000 Mmbtu/day and 175,000 Mmbtu/day of natural gas at reservation fees of $0.25 and $0.20, respectively. In addition, the sales contract with Enterprise contemplated that we could, subject to certain limitations and exclusions, sell 75,000 Mmbtu/day of natural gas at a $0.25 reduction from market index prices. The primary term for these contracts had been through October 31, 2025. The fees described represent our gross commitments and a portion of these costs is allocated to working interest and other owners. The Acadian firm transportation agreement is accounted for as gathering and transportation expenses, and the Enterprise sales contract is accounted for as a reduction in the total sales price within revenues.
Under the parties’ sales and transportation agreements, Enterprise owed us for July 2016 natural gas sales, and we owed Acadian for July 2016 transportation fees. The amount owed to us by Enterprise exceeded the amount owed by us to Acadian. We notified Enterprise in writing of its failure to pay and gave Enterprise opportunity to cure. When Enterprise failed to cure, we gave written notice to Enterprise and Acadian that we were terminating the sales and transportation agreements. Enterprise and Acadian subsequently filed an action in Harris County, Texas, against us alleging that we could not terminate the parties’ agreements despite Enterprise's uncured payment default under the natural gas sales agreement, and further alleged that we were in breach of the firm transportation agreements. On October 17, 2016, we filed a counterclaim asserting that Enterprise was the breaching party because it improperly withheld payment for natural gas we delivered to it and the amounts owed by Enterprise exceeded the amounts owed by us to Acadian. We are also seeking a declaration that we properly terminated the contracts with Enterprise and Acadian. EPD subsequently joined two of our officers, Harold Hickey and Steve Estes, asserting breach of fiduciary duty claims and thereafter joined Bluescape asserting tortious interference with an existing contract. We have filed a summary judgment motion as to the claims against us and our officers, and the motion is pending before the court. If we prevail on the summary judgment motion it could be case dispositive. This case is anticipated to go to trial in the second or third quarter of 2018; however, the case is stayed due to our Chapter 11 filings. We cannot currently estimate or predict the outcome of the litigation but we plan to vigorously defend our right to terminate the contracts and to seek the amounts owed to us for delivered natural gas.
We are no longer selling natural gas under the Enterprise sales contract or transporting natural gas under the Acadian firm transportation contract effective as of the termination date. The Company is accounting for these contracts in accordance with FASB ASC 450 ("ASC 450"), Contingencies, which states a contingency that might result in a gain should not be reflected until it is realized or realizable. There is a rebuttable presumption that a claim subject to litigation does not meet the criteria to be realized or realizable; therefore, the termination of these contracts will not be reflected in our financial results until the
litigation is resolved. Upon resolution of the litigation, we will adjust the previously recognized amounts to reflect the outcome of the litigation. As of December 31, 2017, we recorded a net liability of $43.8 million for costs subsequent to the termination of the contract in accordance with the guidance related to contingencies in ASC 450. The minimum obligations under these agreements are included in the tables of our commercial commitments as of December 31, 2017.
Regency transportation agreement default
We have a firm transportation agreement with Regency Intrastate Gas Systems LLC ("Regency") to transport 237,500 Mmbtu/day of natural gas at a cost of $0.30 per Mmbtu until January 31, 2020. We were obligated to pay a reservation charge of $0.30 per Mmbtu if we failed to transport the minimum volumes under the agreement. The costs under the agreement were recorded as "Gathering and transportation expenses" in our Consolidated Statement of Operations.
On October 23, 2017, we were notified of our failure to pay $2.2 million for the July 2017 charges. The contract provides that the failure to pay the entire charge when due constitutes a default. If the payment default was not fully cured to Regency’s satisfaction within 30 days written notice, Regency has the right to immediately accelerate the payments of the remaining reservation charges due under the contract. We have not received a notice of acceleration. We have not cured the default for July 2017 and have not remitted payment for any subsequent months.
Due to our default under the contract and Regency's right to accelerate the remaining payments, we accounted for these contracts in accordance with ASC 450, which states that an estimated loss from a loss contingency shall be accrued if (1) information available before the financial statements are issued indicates that it is probable that an asset had been impaired or a liability had been incurred at the date of the financial statements, and (2) the amount of loss can be reasonably estimated. As of December 31, 2017, the unpaid amounts and remaining charges under this agreement of $67.3 million were recorded as "Revenue and royalties payable" in our Consolidated Balance Sheet. In addition to the expenses under the agreement prior to the event of default, we recorded $56.4 million related to the acceleration of the remaining charges subsequent to the event of default as "Other operating items" in our Consolidated Statement of Operations for the year ended December 31, 2017.
Shell natural gas sales contract litigation
We had a natural gas sales agreement with Shell Energy North America (US) LP ("Shell Energy"), a subsidiary of Shell, under which we were contractually obligated to deliver and sell to Shell Energy, and Shell Energy was contractually obligated to receive and purchase from us, natural gas production of 100,000 Mmbtu/day. We were to receive the product of an index price and the volumes delivered less the product of the reservation charge of $0.39 per Mmbtu and the daily contract volume. The contract was scheduled to end in November 2020.
On December 22, 2017, we received notice from Shell Energy that they were exercising their right to require adequate assurance of performance from us for the reservation charges under the contract. Shell Energy requested assurances in the form of letters of credit of approximately $44.4 million, which was approximately equal to the remaining reservation charges for the remaining term of the contract. We responded to the notice by stating the request for the letter of credit request was unreasonable and unjustified under the terms of the agreement. Subsequently, Shell Energy notified us that they were withholding payment for the purchase of natural gas for the months of November and December 2017 as a means to satisfy their demands of reasonable assurance of performance. Shell Energy allegedly terminated the sales contracts on December 26, 2017 as a result of the adequate assurance provision despite our objections to the reasonableness of their request. We ceased selling natural gas to Shell Energy in the East Texas and North Louisiana regions effective as of the date of their breach.
On December 26, 2017, we filed a claim in Harris County, Texas seeking declaratory relief that (1) we had not undergone an event of default as defined within the agreement, (2) Shell Energy was in material breach of the contract, and (3) Shell Energy’s request of adequate assurance of performance was neither reasonable, nor justified, and not in good faith under the agreement or applicable Texas law. In addition to the preceding, we are also seeking actual damages, reasonable attorneys’ fees, court costs, prejudgment and post-judgment interest at the maximum rate allowed by Texas law, and all other relief to which we may be justly entitled. On January 26, 2018, we filed a notice of non-suit in Harris County District Court. Concurrently with filing the notice of non-suit in the county court, we filed an adversary proceeding against Shell Energy in the Chapter 11 Cases.
As of December 31, 2017, we recorded a receivable of approximately $33.4 million related to the sales of natural gas to Shell Energy in East Texas and North Louisiana for the months of November and December 2017. As of December 31, 2017, we are withholding $16.8 million in revenues payable to Shell to offset our exposure until the litigation is resolved. The revenues payable may increase in subsequent months due to the natural gas marketed on behalf of Shell's ownership interests in our operated wells. We plan to adamantly assert our right to terminate the contract as a result of Shell Energy's breach and
demand payment for the natural gas sales during November and December 2017. Due to the uncertainty surrounding the outcome of the litigation, we are not able to reasonably estimate a potential loss, if any, at this time. The minimum obligations under this agreement are included in the tables of our commercial commitments as of December 31, 2017.
Other commitments
We lease our offices and certain equipment. Our rental expenses were approximately $2.3 million, $2.6$2.4 million and $3.4$2.3 million for the years ended December 31, 2017, 20162018 and 2015,2017, respectively. We have also entered into drilling rig contracts primarily to develop our assets in the East Texas and North Louisiana regions. The actual drilling costs under these contracts will be incurred by working interest owners in the development of the related properties. These contracts are short-term in nature and are dependent on our planned drilling program.
Our other fixed commitments primarily consist of marketing contracts in which we are obligated to pay the buyer a fee if we fail to deliver minimum quantities of natural gas.
In the ordinary course of business, we are periodically a party to lawsuits. From time to time, oil and natural gas producers, including EXCO, have been named in various lawsuits alleging underpayment of royalties and the allocation of production costs in connection with oil and natural gas sold. We have reserved our estimated exposure and do not believe it was material to our current, or future, financial position or results of operations.
We believe that we have properly reflected any potential exposure in our financial position when determined to be both probable and estimable.
Shell natural gas sales contract litigation
As of September 30, 2018, we had withheld $28.5 million in revenues owed to Shell as a result of a dispute regarding the failure of Shell Energy North America (US) LP ("Shell Energy"), a subsidiary of Shell, to pay us for the sale of natural gas. We entered into a settlement agreement with Shell on September 17, 2018 that was approved by the Court on October 1, 2018 ("Shell Settlement Agreement"). Under the terms of the settlement agreement:
EXCO will pay a total of $22.5 million to Shell, including $9.0 million within 15 days following the approval of the settlement agreement by the Court, $9.0 million within 45 days following the approval of the Court, and the remaining $4.5 million on or before the effective date of the plan of reorganization. Per the terms of the Shell Settlement Agreement, we paid Shell $18.0 million during the fourth quarter of 2018. Upon payment in full of the remaining amount, Shell shall release EXCO from any further liability related to the withheld revenues;
EXCO will commence the completion of four wells that were previously drilled in North Louisiana no later than November 15, 2018, and subsequently commence the completion of three additional wells that were previously drilled in North Louisiana. Per the terms of the Shell Settlement Agreement, we commenced completion on each of these wells during the fourth quarter of 2018 and first quarter of 2019;
EXCO shall assume the joint development agreement with Shell for the East Texas/ North Louisiana joint venture as part of the bankruptcy proceedings and any defaults occurring thereunder are deemed to be satisfied; and
Shell shall not challenge EXCO’s right to serve as operator under the joint development agreement for the East Texas/ North Louisiana joint venture for the remaining term through January 1, 2020, subject to certain exceptions.
The settlement agreement does not prevent us from asserting any claim, cross-claim, defense, or other cause of action against Shell Energy, nor does the settlement agreement prevent Shell Energy from asserting any claim, cross-claim, defense, or other cause of action against us. Furthermore, the settlement agreement provides that it shall not affect any proof of claim that Shell Energy filed in the Chapter 11 Cases. As of December 31, 2017, we had a receivable of approximately $33.4 million related to the sales of natural gas to Shell Energy in East Texas and North Louisiana for the months of November and December 2017. Shell Energy is withholding payment as a means to satisfy their demands of reasonable assurance of
performance under a natural gas sales agreement. We believe the request for adequate assurance was unreasonable and unjustified under the terms of the agreement and these amounts have been improperly withheld by Shell Energy. On March 7, 2018, the Court approved the rejection of the aforementioned natural gas sales agreement with Shell Energy and we recorded a liability of $41.5 million in “Liabilities subject to compromise” related to our current estimate of the allowed claim. The receivable for sales of oil and natural gas to Shell Energy in November and December 2017 and the estimate of the allowed claim for the rejection of the natural gas sales agreement with Shell Energy were presented as a net amount of $8.1 million in "Liabilities subject to compromise" as of December 31, 2018. See further discussion regarding this dispute with Shell Energy in "Item 3. Legal proceedings".
We sponsor a 401(k) plan for our employees and matchedwhich matches 100% of employee contributions during 2015. Ourup to certain limits. For the year ended December 31, 2018, the Company's matching programcontribution was suspended during 2016 in responseup to depressed oil and natural gas prices which have negatively impacted our business and operations. The Company reinstated itsa maximum of 4% of each employee's pay. For the year ended December 31, 2017, the Company's matching program effective January 1, 2017 in which it matched 100% of employee contributionscontribution was up to a maximum of 3% of each employee's pay. Our matching contributions were $0.7 million and $0.6 million for the years ended December 31, 2018 and 2017, respectively. Effective January 1, 2018,2019, the Company increased its matching contribution up to a maximum of 4%5% of each employee's pay. Our matching contributions were $0.6 million and $5.2 million for the years ended December 31, 2017 and 2015, respectively.
10.Earnings (loss) per share
The following table presents the basic and diluted earnings (loss) per share computations, adjusted to give effect to our reverse share split on June 12, 2017, for the years ended December 31, 2017, 20162018 and 2015:
2017:
| | | | | Year Ended December 31, | | Year Ended December 31, |
| (in thousands, except per share data) | | 2017 | | 2016 | | 2015 | | 2018 | | 2017 |
| Basic net income (loss) per common share: | | | | | | | | | | |
| Net income (loss) | | $ | 24,362 |
| | $ | (225,258 | ) | | $ | (1,192,381 | ) | | $ | (182,697 | ) | | $ | 24,362 |
|
| Weighted average common shares outstanding | | 21,288 |
| | 18,630 |
| | 18,241 |
| | 21,686 |
| | 21,288 |
|
| Net income (loss) per basic common share | | $ | 1.14 |
| | $ | (12.09 | ) | | $ | (65.37 | ) | | $ | (8.42 | ) | | $ | 1.14 |
|
| Diluted net income (loss) per common share: | | | | | | | | | | |
| Net income (loss) | | $ | 24,362 |
| | $ | (225,258 | ) | | $ | (1,192,381 | ) | | $ | (182,697 | ) | | $ | 24,362 |
|
| Weighted average common shares outstanding | | 21,288 |
| | 18,630 |
| | 18,241 |
| | 21,686 |
| | 21,288 |
|
| Dilutive effect of: | | | | | | | | | | |
| Stock options | | — |
| | — |
| | — |
| |
| Restricted shares and restricted share units | | — |
| | — |
| | — |
| | — |
| | — |
|
| Warrants | | — |
| | — |
| | — |
| |
| Weighted average common shares and common share equivalents outstanding | | 21,288 |
| | 18,630 |
| | 18,241 |
| | 21,686 |
| | 21,288 |
|
| Net income (loss) per diluted common share | | $ | 1.14 |
| | $ | (12.09 | ) | | $ | (65.37 | ) | | $ | (8.42 | ) | | $ | 1.14 |
|
Basic net income (loss) per common share is based on the weighted average number of common shares outstanding during the period. In addition, the Commitment Fee and Amendment Fee Warrants, which represent the right to purchase our common shares at an exercise price of $0.01 are included in our weighted average common shares outstanding and used in the
computation of our basic net income (loss) per common share. On January 16, 2018, affiliates of Fairfax surrendered all of their rights to the Commitment Fee and Amendment Fee Warrants at an exercise price of $0.01.Warrants. See "Note 13. Related partyRelated-party transactions" for additional information on the warrants issued to Fairfax.
Diluted net income (loss) per common share for the years ended December 31, 2017, 20162018 and 20152017 is computed in the same manner as basic net income (loss) per share after assuming the issuance of common shares for all potentially dilutive common share equivalents, which include stock options, restricted share units, restricted share awards, Financing Warrants, and ESAS Warrants, whether exercisable or not. The computation of diluted EPSnet income (loss) per common share excluded 12,907,872; 5,097,538;11,251,824 and 2,636,27912,907,872 antidilutive common share equivalents for the years ended December 31, 2017, 20162018 and 2015,2017, respectively. The antidilutive common share equivalents for the yearyears ended December 31, 2018 and 2017 primarily related to the Financing Warrants. The antidilutive common share equivalents for the year ended December 31, 2016 and 2015 primarily related to the ESAS Warrants. On November 9, 2017, the ESAS Warrants were forfeited as a result of suspension of the services and investment agreement with ESAS. See "Note 11. Equity-based and other incentive-based compensation" for additional information on the warrants issued to ESAS.
On January 16, 2018, affiliates of Fairfax surrendered all of their rights to the Commitment Fee, Amendment Fee and Financing Warrants. See "Note 13. Related party transactions" for additional information on the Financing Warrants issued to Fairfax.
11.Equity-based and other incentive-based compensation
Key Employee Incentive Plan, Key Employee Retention Plan, and Prepaid Retention Plans
In connection with our review of strategic alternatives during late 2017, the Compensation Committee of the Board of Directors (“Compensation Committee”) determined that (i) normal annual and long-term incentive cycles are likely to be ineffective due to our ongoing strategic restructuring efforts and (ii) the use of equity compensation is currently ineffective and inefficient. As a result, the Compensation Committee and the Company restructured our incentive plans to retain employees and align the interests of employees with our stakeholders. We implemented the following changes to our compensation plans:
Termination of the 2017 Management Incentive Plan - We terminated the 2017 Management Incentive Plan and made pro-rated incentive payments based on the achievement of performance goals as of June 30, 2017. The payments of $1.1 million were made in cash.
Adoption of the KEIP and KERP - We adopted two new cash-based incentive programs beginning on July 1, 2017, including the Key Employee Incentive Plan ("KEIP") for certain officers and Key Employee Retention Plan ("KERP") for employees. The payout of the KEIP is dependent on the achievement of certain performance goals, including production, general and administrative expenses, lease operating expenses, and EBITDA. The payout of the KERP was dependent on the achievement of these performance measures and a fixed percentage of the employees' salary for the first two quarters of the plan until it was converted to be solely based on a fixed percentage of the employees' salary. We incurred $4.8 million in general and administrative expenses related to these plans during 2017. The motion to consider the KERP was approved by the Court on February 22, 2018 and the motion to consider the KEIP was approved by the Court on May 23, 2018. We incurred $4.8 million in general administrative expenses related to these plans during 2018. The KERP is paid on a quarterly basis and the KEIP earned during 2018 will not be paid until the confirmation of a plan of reorganization. Therefore, we accrued $2.2 million related to the KEIP as of December 31, 2018. The term of the KERP was extended to December 31, 2018 and may be extended further at the discretion of the Compensation Committee or the Company, which would be subject to approval as part of the Chapter 11 Cases. The term of the KEIP was extended to December 31, 2018 and further extensions, if any, would be subject to approval as part of the Chapter 11 Cases.
Retention Bonus Agreements - We entered into retention bonus agreements with certain key officers and employees, which resulted in payments of $0.8 million and $7.8 million during 2018 and 2017, respectively. In the event a recipient of a retention bonus voluntarily terminates his or her employment without Good Reason (as defined in each Retention Bonus Agreement), or the Company terminates such recipient’s employment for Cause (as defined in each Retention Bonus Agreement), in either case, before either December 31, 2018 or March 31, 2019 (depending on the agreement with the officer or employee), then such recipient will be required to promptly repay the retention bonus. We recognized $6.3 million and $1.4 million of general and administrative expenses related to these retention bonuses during 2018 and 2017, respectively. The remainder of $0.9 million was recorded as a prepaid asset as of December 31, 2018 and will be recognized over the remaining retention period ending March 31, 2019.
Discontinuation of equity incentive grants - We have discontinued the grant of share-based compensation to officers and employees until the completion of a restructuring. As a result, there were no grants of share-based compensation during 2018 or 2017. The adoption of the KEIP, KERP and retention bonuses were intended to replace all existing cash-based bonus and equity-based compensation programs.
Share-based compensation
Description of plan
Our 2005 Incentive Plan is a shareholder-approved plan authorizing the issuance of up to 3,033,333 restricted shares, restricted share units and stock options. As of December 31, 20172018 and 2016,2017, there were 1,140,5431,376,008 and 952,9181,140,543 shares, respectively, available for issuance under the 2005 Incentive Plan. Option grants and restricted share grants count as one share and 1.74 shares, respectively, against the total number of shares available for grant. The holders of restricted shares, excluding restricted share units ("RSU") discussed below, havehad voting rights, and upon vesting, the right to receive all accrued and unpaid dividends.
We believe it is highly likely that our existing common shares and share-based compensation will be canceled at the conclusion of our Chapter 11 proceedings and holders willare not expected to be entitled to a limited recovery, if any.any recovery. See "Item 1A. Risk Factors" for additional information.
Stock options
As of December 31, 2017, we had 108,578 stock options outstanding and exercisable with exercise prices ranging from $74.70 to $405.00 per share. We did not grant any stock options during the years ended December 31, 2017, 2016 or 2015. Our outstanding stock option expiration dates range from five to ten years following the date of grant and have a weighted average remaining life of 3.24 years.
Service-based restricted share awards
Our service-based restricted share awards are valued at the closing price of our common shares on the date of grant and vest over a range of one to five years. A summary of our service-based restricted share activity for the year ended December 31, 2017 is as follows:
|
| | | | | | | | |
| | | | Shares | | Weighted average grant date fair value per share |
| |
| | Non-vested shares outstanding at December 31, 2016 | | 145,907 |
| | $ | 18.99 |
|
| | Granted | | 39,384 |
| | 9.78 |
|
| | Vested | | (117,781 | ) | | 17.94 |
|
| | Forfeited | | (30,908 | ) | | 15.10 |
|
| | Non-vested shares outstanding at December 31, 2017 | | 36,602 |
| | $ | 15.75 |
|
Market-based restricted share awards
Certain RSU's granted to our officers and certain employees have vesting percentages between 0% and 200% depending on EXCO's total shareholder return in comparison to an identified peer group. Our market-based restricted share units are valued on the date of grant and vest over a range of three years, subject to the achievement of certain criteria. Total compensation expense is recognized over the vesting period using the straight-line method.
The Company has discretion to convert certain vested awarded units, if any, into a cash payment equal to the fair market value of a share of common stock, multiplied by the number of vested units, or the number of whole shares of common stock equal to the number of vested units, if any. These RSUs met the criteria for equity classification per ASC 718.
The grant date fair values of our market-based restricted share awards and restricted share units were determined using a Monte Carlo model which uses company-specific inputs to generate different stock price paths. The assumptions used in the Monte Carlo model for the RSUs granted in 2016 are as follows:
|
| | |
| Assumption | | 2016 |
| Risk-free rate of return | | 0.45 - 0.71 % |
| Volatility | | 119.83 % |
| Dividend yield | | 0.00 % |
A summary of our market-based restricted share activity for RSUs during the year ended December 31, 20172018 is as follows:
| | | | | Shares | | Weighted average grant date fair value per share | | Shares | | Weighted average grant date fair value per share |
| | | |
| Non-vested shares/units outstanding at December 31, 2016 | | 337,331 |
| | $ | 27.83 |
| |
| Non-vested shares/units outstanding at December 31, 2017 | | | 249,992 |
| | $ | 29.96 |
|
| Granted | | — |
| | — |
| | — |
| | — |
|
| Vested | | — |
| | — |
| | — |
| | — |
|
| Forfeited | | (87,339 | ) | | 21.74 |
| | (3,200 | ) | | 25.39 |
|
| Non-vested shares/units outstanding at December 31, 2017 | | 249,992 |
| | $ | 29.96 |
| |
| Non-vested shares/units outstanding at December 31, 2018 | | | 246,792 |
| | $ | 30.02 |
|
ESAS Warrants
On September 8, 2015, EXCO issued warrants to ESAS as an additional performance incentive for services performed under a services and investment agreement. The ESAS Warrants were issued in four tranches to purchase an aggregate of 5,333,335 common shares, subject to certain time-based vesting criteria and EXCO's total shareholder return in comparison to an identified peer group. See further discussion of the ESAS Warrants in "Note 13. Related party transactions".
Equity-based compensation costs
All of our stock options, restricted shares and certain RSUs are accounted for in accordance with ASC 718 and are classified as equity. As required by ASC 718, the granting of options and awards to our employees under the 2005 Incentive Plan are share-based payment transactions and are to be treated as compensation expense by us with a corresponding increase to additional paid-in capital.
Total share-based compensation to employees to be recognized on unvested options, restricted share awards and RSUs as of December 31, 20172018 was $3.2$0.9 million and will be recognized over a weighted average period of 1.40.5 years.
The measurement of the ESAS Warrants was accounted for in accordance with ASC 505-50, which required the ESAS Warrants to be re-measured each interim reporting period and an adjustment was recorded in the statement of operations within equity-based compensation expense. Concurrently with the suspension of the services and investment agreement with ESAS, on November 9, 2017, the ESAS Warrants were forfeited and canceled and previously recognized compensation costs were reversed. For the yearsyear ended December 31, 2017, 2016 and 2015, equity-based compensation related to the ESAS Warrants was income of $14.5 million and expense of $11.3 million and $3.2 million, respectively.million.
The following is a reconciliation of our compensation expense for the years ended December 31, 2017, 20162018 and 2015:2017:
| | | | | Year Ended December 31, | | Year Ended December 31, |
| (in thousands) | | 2017 | | 2016 | | 2015 | | 2018 | | 2017 |
| Equity-based compensation expense (1) | | $ | (11,430 | ) | | $ | 14,778 |
| | $ | 7,198 |
| | $ | 2,053 |
| | $ | (11,430 | ) |
| Equity-based compensation capitalized | | 1,000 |
| | 752 |
| | 3,428 |
| | 347 |
| | 1,000 |
|
| Total equity-based compensation | | $ | (10,430 | ) | | $ | 15,530 |
| | $ | 10,626 |
| | $ | 2,400 |
| | $ | (10,430 | ) |
| |
| (1) | Equity-based compensation expense includes share-based compensation to employees and equity-based compensation for ESAS Warrants. |
We did not recognize a tax benefit attributable to our equity-based compensation for the years ended December 31, 2017, 20162018 and 2015.
Key Employee Incentive Plan, Key Employee Retention Plan, and Prepaid Retention Plans
In connection with our review of strategic alternatives during late 2017, the Compensation Committee of the Board of Directors (“Compensation Committee”) determined that (i) normal annual and long-term incentive cycles are likely to be ineffective due to our ongoing strategic restructuring efforts and (ii) the use of equity compensation is currently ineffective and inefficient. As a result, the Compensation Committee and the Company restructured our incentive plans to retain employees and align the interests of employees with our stakeholders. We implemented the following changes to our compensation plans:
Termination of the 2017 Management Incentive Plan - We terminated the 2017 Management Incentive Plan and made pro-rated incentive payments based on the achievement of performance goals as of June 30, 2017. The payments of $1.1 million were made in cash.
Adoption of the KEIP and KERP - We adopted two new cash-based incentive programs, including the Key Employee Incentive Plan ("KEIP") for certain officers and Key Employee Retention Plan ("KERP") for employees. The payout of the KEIP is dependent on the achievement of certain performance goals, including production, general and administrative expenses, lease operating expenses, and EBITDA. The payout of the KERP was dependent on the achievement of these performance measures and a fixed percentage of the employees' salary for the first two quarters of the plan until it was converted to be solely based on a fixed percentage of the employees' salary. The initial term under each of these plans is from July 1, 2017 to June 30, 2018. We incurred $4.8 million in general and administrative expenses related to these plans during 2017. The motion to consider the KERP was approved by the Court on February 22, 2018. The approval of the KEIP for the period subsequent to the petition date remains subject to approval as part of the Chapter 11 Cases. As a result, the terms and amounts related to the KEIP could materially change if we receive objections from the Court or our creditors. The KEIP and KERP may be extended beyond the initial term at the discretion of the Compensation Committee or the Company, which would be subject to further approval as part of the Chapter 11 Cases.
Retention Bonus Agreements - We entered into retention bonus agreements with certain key officers and employees, which resulted in payments of $7.9 million during 2017. In the event a recipient of a retention bonus voluntarily terminates his or her employment without Good Reason (as defined in each Retention Bonus Agreement), or the Company terminates such recipient’s employment for Cause (as defined in each Retention Bonus Agreement), in either case, before either December 31, 2018 or March 31, 2019 (depending on the agreement with the officer or employee), then such recipient will be required to promptly repay the retention bonus. We recognized $1.4 million of general and administrative expenses related to these retention bonuses during 2017 and the remainder will be recognized over the remaining retention period.
Discontinuation of equity incentive grants - We have discontinued the grant of share-based compensation to officers and employees until the completion of a restructuring. As a result, there were no grants of share-based compensation during 2017. The adoption of the KEIP, KERP and retention bonuses were intended to replace all existing cash-based bonus and equity-based compensation programs.
The income tax provision attributable to our income (loss) before income taxes for the years ended December 31, 2017, 20162018 and 2015,2017, consisted of the following:
| | | | | Year ended December 31, | | Year ended December 31, |
| (in thousands) | | 2017 | | 2016 (1) | | 2015 | | 2018 | | 2017 |
| Current: | | | | | | | | | | |
| Federal | | $ | (1,420 | ) | | $ | — |
| | $ | — |
| | $ | — |
| | $ | (1,420 | ) |
| State | | — |
| | — |
| | — |
| | — |
| | — |
|
| Total current income tax (benefit) | | $ | (1,420 | ) | | $ | — |
| | $ | — |
| | $ | — |
| | $ | (1,420 | ) |
| | | | | | | | | | | |
| Deferred: | | | | | | | | | | |
| Federal | | $ | 528,886 |
| | $ | (72,020 | ) | | $ | (414,834 | ) | | $ | (34,884 | ) | | $ | 528,886 |
|
| State | | (1,496 | ) | | (7,637 | ) | | (45,009 | ) | | (1,028 | ) | | (1,496 | ) |
| Valuation allowance | | (525,674 | ) | | 82,459 |
| | 459,843 |
| | 31,394 |
| | (525,674 | ) |
| Total deferred income tax (benefit) | | 1,716 |
| | 2,802 |
| | — |
| | (4,518 | ) | | 1,716 |
|
| Total income tax (benefit) | | $ | 296 |
| | $ | 2,802 |
| | $ | — |
| | $ | (4,518 | ) | | $ | 296 |
|
| |
(1) | We made certain revisions between components of the reconciliation of our income tax provision for the year ended December 31, 2016. These revisions were deemed to be an immaterial correction of an error and did not affect our net deferred tax assets or liabilities or income tax expense. |
On December 22, 2017, the United States enacted the Tax Cuts and Jobs Act ("Tax Act") which, among other things, lowered the U.S. Federal tax rate from 35% to 21%, repealed the corporate alternative minimum tax, and provided for a refund of previously accrued alternative minimum tax credits. We reflected the impact of this rate on our deferred tax assets and liabilities at December 31, 2017, as it is required to reflect the change in the period in which the law is enacted. The Tax Act also repealed the corporate alternative minimum tax for tax years beginning after January 1, 2018 and provided that prior alternative minimum tax credits would be refundable. We have credits that are expected to be refunded between 2018 and 2020 asAs a result of the Tax Act and monetization opportunities under current law, we have credits that were refunded in 2017.late 2017 and the remainder are expected to be refunded in 2019. In addition, the Tax Act limits the amount taxpayers are able to deduct for net operating loss carryforwards ("NOLs")NOLs generated in taxable years beginning after December 31, 2017 to 80% of the taxpayer’s taxable income. The law also generally repeals all carrybacks for losses generated in taxable years ending after December 31, 2017. However, any NOLs generated in taxable years ending after December 31, 2017 can be carried forward indefinitely. On December 22, 2017, the SEC issued Staff Accounting Bulletin No. 118, which provides a one-year measurement period from a registrant's reporting period that includes the Tax Act's enactment date to allow the registrant sufficient time to obtain, prepare and analyze information to complete the required accounting under ASC 740. We are still analyzing certain aspectscompleted our analysis of the impact of the Tax Act which could potentially affectduring 2018 and the measurementimpact of any changes are reflected in our incomedeferred tax balancesassets and future income tax expense or benefit.liabilities at December 31, 2018. The ultimate impact of the Tax Act may differ from the estimates provided herein, possibly materially, due to additional regulatory guidance, changes in interpretations and assumptions, and other actions as a result of the Tax Act.
We have NOLs for U.S. income tax purposes that have been generated from our operations. Our NOLs generated prior to 2018 are scheduled to expire if not utilized between 2028 and 2037. As a result of the repurchase of a portion of our senior unsecured notes during 2015 and 2016, we had cancellation of debt income for tax purposes. We reduced our NOLs by the amount of cancellation of debt income of approximately $86.6 million $125.8 million and $538.0 millionrelated to certain debt restructuring transactions during 2017, 2016 and 2015, respectively.the year ended December 31, 2017.
The utilization of our NOLs to offset taxable income in future periods may be limited if we undergo an ownership change based on the criteria in Section 382 of the Internal Revenue Code. Generally, an ownership change occurs for Section 382 purposes when the percentage of stock held by one or more five-percent shareholders increases by more than 50 percentage points over the lowest stock ownership held by such shareholders on any testing date within a three-year period. See further discussion of the potential limitations on the utilization of our net operating losses as part of "Item 1A. Risk Factors". The Internal Revenue Code permits the exclusion of cancellation of debt income from taxable income if the discharge occurs during a Chapter 11 case. If this occurs, the amount of cancellation of debt income would reduce a company's tax attributes unless it is offset by NOLs. The NOLs that are available to offset cancellation of debt income in a Chapter 11 case are not limited by
Section 382 of the Internal Revenue Code. NOLs available for utilization as of December 31, 20172018 were approximately $2.1$2.2 billion.
There is an exception to the foregoing annual limitation rules for entities in bankruptcy that generally applies when “qualified creditors” of a debtor corporation receive, in respect of their claims, at least 50% of the voting rights and value of the equity of the reorganized debtor pursuant to a confirmed chapter 11 plan (the “382(l)(5) Exception”). Under the 382(l)(5) Exception, a debtor’s NOLs prior to the ownership change are not limited on an annual basis, but, instead, NOL carryforwards will be reduced by the amount of any interest deductions claimed during the three taxable years preceding the effective date of the plan of reorganization, and during the part of the taxable year prior to and including the effective date of the plan of reorganization, in respect of all debt converted into equity in the reorganization. If the 382(l)(5) Exception applies and the reorganized debtors undergo another “ownership change” within two years after the effective date of the plan of reorganization, then the reorganized debtors’ losses prior to the ownership change would effectively be eliminated in their entirety.
If we are eligible for the 382(l)(5) Exception, we currently anticipate that we would not elect out of its application in order to preserve the Company’s tax attributes. However, it is uncertain whether the structure of the March 2019 Plan or an alternative plan of reorganization would allow us to qualify for the 382(l)(5) Exception. Therefore, we cannot provide any assurance regarding the extent of limitations on the Company’s tax attributes upon emergence from bankruptcy.
Deferred income taxes reflect the net tax effects of temporary differences between the carrying amounts of assets and liabilities for financial reporting purposes and the amounts used for income tax purposes. Significant components of our deferred tax liabilities and assets are as follows:
| | | (in thousands) | | December 31, 2017 | | December 31, 2016 (1) | | December 31, 2018 | | December 31, 2017 |
| Deferred tax assets: | | | | | | | | |
| Net operating loss and AMT credits carryforwards | | $ | 548,701 |
| | $ | 767,236 |
| |
| Net operating loss carryforwards | | | $ | 568,976 |
| | $ | 548,701 |
|
| Oil and natural gas properties, gathering assets, and equipment | | 236,601 |
| | 428,056 |
| | 178,498 |
| | 236,601 |
|
| Debt restructuring | | 3,978 |
| | 99,934 |
| |
| Liabilities subject to compromise | | | 92,954 |
| | — |
|
| Other | | 54,487 |
| | 73,923 |
| | 43,149 |
| | 58,465 |
|
| Total deferred tax assets before valuation allowance | | 843,767 |
| | 1,369,149 |
| | 883,577 |
| | 843,767 |
|
| Valuation allowance | | (843,480 | ) | | (1,369,149 | ) | | (874,877 | ) | | (843,480 | ) |
| Total deferred tax assets | | 287 |
| | — |
| | 8,700 |
| | 287 |
|
| Deferred tax liabilities: | | | | | | | | |
| Goodwill | | $ | (4,518 | ) | | $ | (2,802 | ) | | $ | (7,205 | ) | | $ | (4,518 | ) |
| Derivative financial instruments | | (287 | ) | | — |
| | — |
| | (287 | ) |
| Other | | | (1,495 | ) | | — |
|
| Total deferred tax liabilities | | (4,805 | ) | | (2,802 | ) | | (8,700 | ) | | (4,805 | ) |
| Net deferred tax assets (liabilities) | | $ | (4,518 | ) | | $ | (2,802 | ) | | $ | — |
| | $ | (4,518 | ) |
| |
(1) | We made certain revisions between components of our non-current deferred tax assets as of December 31, 2016. As a result, our deferred tax assets and valuation allowance increased by $0.8 million. These revisions were deemed to be an immaterial correction of an error and did not affect our net deferred tax assets or liabilities or income tax expense. |
As previously discussed, we reflected the impact of the change in the tax rate as a result of the Tax Act on our deferred tax assets and liabilities at December 31, 2017. During the years ended 2017, 2016December 31, 2018 and 2015,2017, we recognized a full valuation allowance against our net deferred tax assets.
A reconciliation of our income tax provision (benefit) computed by applying the statutory United States federal income tax rate to our income (loss) before income taxes for the years ended December 31, 2017, 20162018 and 20152017 is presented in the following table:
| | | | | Year Ended December 31, | | Year Ended December 31, |
| (in thousands) | | 2017 | | 2016 (1) | | 2015 | | 2018 | | 2017 |
| Federal income taxes (benefit) provision at statutory rate of 35% | | $ | 8,630 |
| | $ | (77,860 | ) | | $ | (417,333 | ) | |
| Federal income taxes (benefit) provision at statutory rate | | | $ | (39,315 | ) | | $ | 8,630 |
|
| Increases (reductions) resulting from: | | | | | | | | | | |
| Adjustments to the valuation allowance | | (525,674 | ) | | 82,459 |
| | 459,843 |
| | 31,394 |
| | (525,674 | ) |
| Non-deductible compensation | | 3,206 |
| | 5,019 |
| | 2,399 |
| | — |
| | 3,206 |
|
| State taxes net of federal benefit | | (1,496 | ) | | (7,637 | ) | | (45,009 | ) | | (1,028 | ) | | (1,496 | ) |
| Federal and state tax rate change | | 421,610 |
| | — |
| | — |
| | — |
| | 421,610 |
|
| Non-deductible interest | | 149,577 |
| | — |
| | — |
| | 4,814 |
| | 149,577 |
|
| Non-taxable gain on warrants | | (55,716 | ) | | — |
| | — |
| | (397 | ) | | (55,716 | ) |
| Other | | 159 |
| | 821 |
| | 100 |
| | 14 |
| | 159 |
|
| Total income tax provision | | $ | 296 |
| | $ | 2,802 |
| | $ | — |
| | $ | (4,518 | ) | | $ | 296 |
|
| |
(1) | We made certain revisions between components of the reconciliation of our income tax provision for the year ended December 31, 2016. These revisions were deemed to be an immaterial correction of an error and did not affect our net deferred tax assets or liabilities or income tax expense. |
During the year ended December 31, 2017, we recognized a current income tax benefit of $1.4 million due to refunds for alternative minimum tax credits. During the years ended 2017December 31, 2018 and 2016,2017, we recognized deferred income tax benefit of $4.5 million and expense of $1.7
million, and $2.8 millionrespectively, related to a deferred tax liability for tax deductible goodwill. DuringDeferred income tax benefit during the yearsyear ended 2017 and 2016, the book basis of goodwill exceeded the tax basis that caused the previous book and tax basis differencesDecember 31, 2018 related to change fromchanges in a deferred tax asset toliability for tax-deductible goodwill. As of December 31, 2017, we recognized a deferred tax liability.liability of $4.5 million for tax-deductible goodwill. The deferred tax liability related to goodwill iswas considered to have an indefinite life based on the nature of the underlying asset and cannotcould not be offset under GAAP with a deferred tax asset with a definite life, such as NOLs. However,As a result of the Tax Act, deferred tax assets resulting from NOLs generated in taxable years subsequent to December 31, 2017 are considered to have an indefinite life. Therefore, we recognized an income tax benefit of $4.5 million during the in the first quarter of 2018 because we expect to be able to utilize deferred tax assets related to NOLs to offset the deferred income tax expense is not expectedliability related to result in cash payments of income taxes in the foreseeable future.goodwill.
We did not recognize any liabilities for unrecognized tax benefits. As of December 31, 2017, 20162018 and 2015,2017, our policy is to recognize interest related to unrecognized tax benefits of interest expense and penalties in operating expenses. We have not accrued any interest or penalties relating to unrecognized tax benefits in the Consolidated Financial Statements.
We file a corporate consolidated income tax return for U.S. federal income tax purposes and file income tax returns in various states. With few exceptions, we are no longer subject to U.S. federal and state and local examinations by tax authorities for years before 2008.2009.
| |
| 13. | Related party transactions |
OPCO and Appalachia Midstream JV
OPCO serves as the operator of our wells in the Appalachia JV and we advance funds to OPCO on an as needed basis. We did not advance any funds to OPCO during the years ended December 31, 2017, 2016 or 2015. OPCO may distribute any excess cash equally between us and Shell when its operating cash flows are sufficient to meet its capital requirements. There are service agreements between us and OPCO whereby we provide administrative and technical services for which we are reimbursed. For the years ended December 31, 2017, 2016 and 2015 these transactions included the following:
|
| | | | | | | | | |
| | | Year Ended December 31, |
| (in thousands) | | 2017 | | 2016 | | 2015 |
| Amounts received from OPCO | | 6,596 |
| | 15,016 |
| | 30,577 |
|
As of December 31, 2017 and 2016, the amounts owed under the service agreements were as follows:
|
| | | | | | | | |
| (in thousands) | | December 31, 2017 | | December 31, 2016 |
| Amounts due to EXCO (1) | | $ | 587 |
| | $ | 618 |
|
| Amounts due from EXCO (2) | | 3,726 |
| | 13,624 |
|
| |
(1) | Amounts due to us consist of receivables for services performed on behalf of OPCO. These amounts are recorded in "Accounts receivable, net — Other" on our Consolidated Balance Sheets. |
| |
(2) | Any amounts we owe to OPCO are netted against the advance until the advances are utilized. If the advances are fully utilized, we record amounts owed in "Accounts payable and accrued liabilities" on our Consolidated Balance Sheets. |
As of December 31, 2017, we owned a 50% interest in an entity that owns and operates midstream assets in the Appalachia region ("Appalachia Midstream JV"). On October 12, 2017, EXCO received a $6.0 million cash distribution from Appalachia Midstream JV.
ESAS
On March 31, 2015, we entered into a services and investment agreement with ESAS, a wholly owned subsidiary of an affiliate of Bluescape. C. John Wilder, Executive Chairman of Bluescape, was the Executive Chairman of our Board of Directors until his resignation on November 9, 2017, and indirectly controls ESAS. As consideration for the services provided under the agreement, EXCO paid ESAS a monthly fee of $300,000 and an annual incentive payment of up to $2.4 million per year that was based on EXCO’s common share price achieving certain performance hurdles as compared to a peer group. The monthly fees were held in escrow until one year following the closing of the agreement and reported as "Restricted cash" on our Consolidated Balance Sheets. As an additional performance incentive under the services and investment agreement, EXCO issued ESAS Warrants in four tranches to purchase an aggregate of 5,333,335 common shares, subject to the satisfaction of certain performance criteria, at exercise prices ranging from $41.25 per share to $150.00 per share. The number of shares and exercise prices have been adjusted to reflect the reverse share-split that occurred on June 2, 2017.
The payments to ESAS as part of the services and investment agreement were $3.4 million and $8.4 million during 2017 and 2016, respectively. Amounts paid to ESAS in 2017 consisted of the monthly fees through the suspension of the contract in November 9, 2017. Amounts paid to ESAS in 2016 consisted of (i) the monthly fees including fees previously held in escrow and (ii) a $2.4 million annual incentive payment as a result of EXCO achieving a performance rank above the 75th percentile of the peer group.
On September 20, 2017, ESAS received $4.0 million and $1.8 million of PIK Payments in the form of additional 1.5 Lien Notes and 1.75 Lien Term Loans, respectively, resulting in ESAS holding $74.0 million in aggregate principal amount of 1.5 Lien Notes and $49.7 million in aggregate principal amount of 1.75 Lien Term Loans as of December 31, 2018 and 2017. During the year ended December 31, 2017, ESAS also received $1.2 million of cash interest payments on the Exchange Term Loan and 192,609 of PIK Shares under the 1.75 Lien Term Loans. In addition, ESAS holds Financing Warrants representing the
right to purchase an aggregate of 5,017,922 common shares at an exercise price equal to $13.95 per share. ESAS received a consent fee of $1.6 million in cash for exchanging its interest in the Exchange Term Loan, and a commitment fee of $2.1 million in cash in connection with the issuance of the 1.5 Lien Notes.
On November 9, 2017, we entered into an agreement with ESAS pursuant to which, among other things: (i) the services and investment agreement with ESAS dated as of March 31, 2015, was suspended such that, during the suspension period and subject to the terms and conditions of the agreement: (a) ESAS is not required to provide any services to us, (b) we are not required to make any payments to ESAS with respect to the suspension period and (c) ESAS does not have the right to nominate a member to the Company’s Board of Directors; and (ii) the ESAS Warrants were forfeited and canceled and we have no further obligations under the ESAS Warrants. Prior to the suspension, the payments to ESAS as part of the services and investment agreement were $3.4 million for the year ended December 31, 2017.
On January 22, 2018, we closed the DIP Credit Agreement with lenders including affiliates of Bluescape. See "Note 17. Subsequent events"5. Debt" for further discussion of the DIP Credit Agreement.
Fairfax
Samuel Mitchell servesserved as a Managing Director of Hamblin Watsa Investment Counsel Ltd. ("Hamblin Watsa"), the investment manager of Fairfax and certain affiliates thereof. Samuel Mitchell was a member of our Board of Directors until his resignation on September 20, 2017. On September 20, 2017, certain affiliates of Fairfax received $8.5 million and $15.8 million of PIK Payments in the form of additional 1.5 Lien Notes and 1.75 Lien Term Loans, respectively, resulting in Fairfax holding, directly or indirectly, $159.5 million in aggregate principal amount of 1.5 Lien Notes and $427.9 million in aggregate principal amount of 1.75 Lien Term Loans as of December 31, 2018 and 2017. During the year ended December 31, 2017, Fairfax also received $10.6 million of cash interest payments on the Fairfax Term Loan and the Exchange Term Loan and 1,657,330 of PIK Shares under the 1.75 Lien Term Loans. In addition, Fairfax holds Financing Warrants representing the right to purchase an aggregate of 10,824,377 common shares at an exercise price equal to $13.95 per share, Commitment Fee Warrants representing the right to purchase an aggregate of 431,433 common shares at an exercise price equal to $0.01 per share and Amendment Fee Warrants representing the right to purchase an aggregate of 1,294,143 common shares at an exercise price equal to $0.01 per share. On January 16, 2018, affiliates of Fairfax surrendered all of their rights in the 2017 Warrants.
On January 22, 2018, we closed the DIP Credit Agreement with lenders including affiliates of Fairfax. See "Note 17. Subsequent events"5. Debt" further discussion of the DIP Credit Agreement.
Oaktree
B. James Ford servesserved as a Senior Advisor of Oaktree, and was a member of our Board of Directors until his resignation on September 20, 2017. On September 20, 2017, Oaktree received $2.2 million of PIK Payments in the form of additional 1.5 Lien Notes resulting in certain affiliates of Oaktree holding, directly or indirectly, $41.7 million in aggregate principal amount of 1.5 Lien Notes as of December 31, 2018 and 2017. In addition, certain affiliates of Oaktree hold Financing Warrants representing the right to purchase an aggregate of 2,831,542 common shares at an exercise price equal to $13.95 per share. Oaktree also received a commitment fee of $1.2 million in cash in connection with the issuance of the 1.5 Lien Notes.
| |
| 14. | Condensed consolidating financial statements |
As of December 31, 2017,2018, the majority of EXCO’s subsidiaries were guarantors under the EXCO ResourcesDIP Credit Agreement, the indenture governing the 1.5 Lien Notes, the credit agreement governing the 1.75 Lien Term Loans, the credit agreement governing the Second Lien Term Loans, and the indentures governing the 2018 Notes and 2022 Notes. The DIP Credit Agreement, entered into on January 22, 2018, is guaranteed by the same subsidiaries as the EXCO Resources Credit Agreement, 1.5 Lien Notes, 1.75 Lien Term Loans, Second Lien Term Loans, 2018 Notes and 2022 Notes. All of our unrestricted subsidiaries under the 1.5 Lien Notes, 1.75 Lien Term Loans and the indentures governing the 2018 Notes and 2022 Notes are considered non-guarantor subsidiaries.
Set forth below are condensed consolidating financial statements of EXCO, the guarantor subsidiaries and the non-guarantor subsidiaries. The EXCO ResourcesDIP Credit Agreement, 1.5 Lien Notes, 1.75 Lien Term Loans, 2018 Notes and 2022 Notes, which were issued by EXCO Resources, Inc., are jointly and severally guaranteed by substantially all of our subsidiaries (referred to as Guarantor Subsidiaries). For purposes of this footnote, EXCO Resources, Inc. is referred to as Resources to distinguish it from the Guarantor Subsidiaries. Each of the Guarantor Subsidiaries is a 100% owned subsidiary of Resources and the guarantees are unconditional as they relate to the assets of the Guarantor Subsidiaries. Resources and the Guarantor Subsidiaries solely consist of entities that are Debtors in the Chapter 11 Cases, including each of the Filing Subsidiaries. The non-guarantor subsidiaries solely consist of entities that are not included in the Chapter 11 Cases, including OPCO, Appalachia Midstream, EXCO Production Company (PA) II, LLC, EXCO Production Company (WV) II, LLC and certain other entities (referred to as Non-Guarantor Subsidiaries).
The following financial information presents consolidating financial statements, which include:
Resources;
the Guarantor Subsidiaries;
the Non-Guarantor Subsidiaries;
elimination entries necessary to consolidate Resources, the Guarantor Subsidiaries and the Non-Guarantor Subsidiaries; and
EXCO on a consolidated basis.
Investments in subsidiaries are accounted for using the equity method of accounting for the disclosures within this footnote. The financial information for the Guarantor Subsidiaries and the Non-Guarantor Subsidiaries is presented on a combined basis. The elimination entries primarily eliminate investments in subsidiaries and intercompany balances and transactions.
EXCO RESOURCES, INC. (DEBTOR-IN-POSSESSION)
CONDENSED CONSOLIDATING BALANCE SHEET
As of December 31, 2017
2018
| | | (in thousands) | | Resources | | Guarantor Subsidiaries | | Non-Guarantor Subsidiaries | | Eliminations | | Consolidated | | Resources | | Guarantor Subsidiaries | | Non-Guarantor Subsidiaries | | Eliminations | | Consolidated |
| Assets | | | | | | | | | | | | | | | | | | | | |
| Current assets: | | | | | | | | | | | | | | | | | | | | |
| Cash and cash equivalents | | $ | 49,170 |
| | $ | (9,573 | ) | | $ | — |
| | $ | — |
| | $ | 39,597 |
| | $ | 47,269 |
| | $ | (20,059 | ) | | $ | 19,331 |
| | $ | — |
| | $ | 46,541 |
|
| Restricted cash | | — |
| | 15,271 |
| | — |
| | — |
| | 15,271 |
| | 653 |
| | 15,396 |
| | — |
| | — |
| | 16,049 |
|
| Other current assets | | 22,697 |
| | 90,265 |
| | — |
| | — |
| | 112,962 |
| | 6,671 |
| | 93,305 |
| | 7,577 |
| | — |
| | 107,553 |
|
| Total current assets | | 71,867 |
| | 95,963 |
| | — |
| | — |
| | 167,830 |
| | 54,593 |
| | 88,642 |
| | 26,908 |
| | — |
| | 170,143 |
|
| Equity investments | | — |
| | — |
| | 14,181 |
| | — |
| | 14,181 |
| | — |
| | — |
| | 4,732 |
| | — |
| | 4,732 |
|
| Oil and natural gas properties (full cost accounting method): | | | | | | | | | | | | | | | | | | | | |
| Unproved oil and natural gas properties and development costs not being amortized | | — |
| | 118,652 |
| | — |
| | — |
| | 118,652 |
| | — |
| | 121,738 |
| | 33,908 |
| | — |
| | 155,646 |
|
| Proved developed and undeveloped oil and natural gas properties | | 333,719 |
| | 2,773,847 |
| | — |
| | — |
| | 3,107,566 |
| | 334,709 |
| | 2,924,788 |
| | 73,282 |
| | — |
| | 3,332,779 |
|
| Accumulated depletion | | (330,777 | ) | | (2,421,534 | ) | | — |
| | — |
| | (2,752,311 | ) | | (330,776 | ) | | (2,494,452 | ) | | (6,065 | ) | | — |
| | (2,831,293 | ) |
| Oil and natural gas properties, net | | 2,942 |
| | 470,965 |
| | — |
| | — |
| | 473,907 |
| | 3,933 |
| | 552,074 |
| | 101,125 |
| | — |
| | 657,132 |
|
| Other property and equipment, net and other non-current assets | | 892 |
| | 20,382 |
| | — |
| | — |
| | 21,274 |
| | 587 |
| | 19,565 |
| | 17,379 |
| | — |
| | 37,531 |
|
| Investments in and advances to affiliates, net | | 466,055 |
| | — |
| | — |
| | (466,055 | ) | | — |
| |
| Investments in and (advances to) affiliates, net | | | 379,516 |
| | — |
| | — |
| | (379,516 | ) | | — |
|
| Goodwill | | 13,293 |
| | 149,862 |
| | — |
| | — |
| | 163,155 |
| | 13,293 |
| | 149,862 |
| | — |
| | — |
| | 163,155 |
|
| Total assets | | $ | 555,049 |
| | $ | 737,172 |
| | $ | 14,181 |
| | $ | (466,055 | ) | | $ | 840,347 |
| | $ | 451,922 |
| | $ | 810,143 |
| | $ | 150,144 |
| | $ | (379,516 | ) | | $ | 1,032,693 |
|
| Liabilities and shareholders' equity | | | | | | | | | | | |
| Liabilities and shareholders’ equity | | | | | | | | | | | |
| Current maturities of long-term debt | | $ | 1,362,500 |
| | $ | — |
| | $ | — |
| | $ | — |
| | $ | 1,362,500 |
| | $ | 473,364 |
| | $ | — |
| | $ | — |
| | $ | — |
| | $ | 473,364 |
|
| Other current liabilities | | 32,280 |
| | 272,190 |
| | — |
| | — |
| | 304,470 |
| | 38,343 |
| | 71,802 |
| | 7,784 |
| | — |
| | 117,929 |
|
| Long-term debt | | — |
| | — |
| | — |
| | — |
| | — |
| |
| Derivative financial instruments - common share warrants | | 1,950 |
| | — |
| | — |
| | — |
| | 1,950 |
| |
| Other long-term liabilities | | 4,518 |
| | 13,108 |
| | — |
| | — |
| | 17,626 |
| | — |
| | 14,825 |
| | 9,588 |
| | — |
| | 24,413 |
|
| Liabilities subject to compromise | | | 966,711 |
| | 476,772 |
| | — |
| | — |
| | 1,443,483 |
|
| Payable to parent | | — |
| | 2,447,586 |
| | — |
| | (2,447,586 | ) | | — |
| | — |
| | 2,452,128 |
| | (3,380 | ) | | (2,448,748 | ) | | — |
|
| Total shareholders' equity | | (846,199 | ) | | (1,995,712 | ) | | 14,181 |
| | 1,981,531 |
| | (846,199 | ) | |
| Total liabilities and shareholders' equity | | $ | 555,049 |
| | $ | 737,172 |
| | $ | 14,181 |
| | $ | (466,055 | ) | | $ | 840,347 |
| |
| Total shareholders’ equity | | | (1,026,496 | ) | | (2,205,384 | ) | | 136,152 |
| | 2,069,232 |
| | (1,026,496 | ) |
| Total liabilities and shareholders’ equity | | | $ | 451,922 |
| | $ | 810,143 |
| | $ | 150,144 |
| | $ | (379,516 | ) | | $ | 1,032,693 |
|
EXCO RESOURCES, INC. (DEBTOR-IN-POSSESSION)
CONDENSED CONSOLIDATING BALANCE SHEET
As of December 31, 2016
2017
|
| | | | | | | | | | | | | | | | | | | | |
| (in thousands) | | Resources | | Guarantor Subsidiaries | | Non-Guarantor Subsidiaries | | Eliminations | | Consolidated |
| Assets | | | | | | | | | | |
| Current assets: | | | | | | | | | | |
| Cash and cash equivalents | | $ | 24,610 |
| | $ | (15,542 | ) | | $ | — |
| | $ | — |
| | $ | 9,068 |
|
| Restricted cash | | — |
| | 11,150 |
| | — |
| | — |
| | 11,150 |
|
| Other current assets | | 6,463 |
| | 83,936 |
| | — |
| | — |
| | 90,399 |
|
| Total current assets | | 31,073 |
| | 79,544 |
| | — |
| | — |
| | 110,617 |
|
| Equity investments | | — |
| | — |
| | 24,365 |
| | — |
| | 24,365 |
|
| Oil and natural gas properties (full cost accounting method): | | | | | | | | | | |
| Unproved oil and natural gas properties and development costs not being amortized | | — |
| | 97,080 |
| | — |
| | — |
| | 97,080 |
|
| Proved developed and undeveloped oil and natural gas properties | | 331,823 |
| | 2,608,100 |
| | — |
| | — |
| | 2,939,923 |
|
| Accumulated depletion | | (330,776 | ) | | (2,371,469 | ) | | — |
| | — |
| | (2,702,245 | ) |
| Oil and natural gas properties, net | | 1,047 |
| | 333,711 |
| | — |
| | — |
| | 334,758 |
|
| Other property and equipment, net and other non-current assets | | 568 |
| | 23,093 |
| | — |
| | — |
| | 23,661 |
|
| Investments in and advances to affiliates, net | | 430,168 |
| | — |
| | — |
| | (430,168 | ) | | — |
|
| Deferred financing costs, net | | 4,376 |
| | — |
| | — |
| | — |
| | 4,376 |
|
| Derivative financial instruments - commodity derivatives | | 482 |
| | — |
| | — |
| | — |
| | 482 |
|
| Goodwill | | 13,293 |
| | 149,862 |
| | — |
| | — |
| | 163,155 |
|
| Total assets | | $ | 481,007 |
| | $ | 586,210 |
| | $ | 24,365 |
| | $ | (430,168 | ) | | $ | 661,414 |
|
| Liabilities and shareholders' equity | | | | | | | | | | |
| Current maturities of long-term debt | | $ | 50,000 |
| | $ | — |
| | $ | — |
| | $ | — |
| | $ | 50,000 |
|
| Other current liabilities | | 40,671 |
| | 167,692 |
| | — |
| | — |
| | 208,363 |
|
| Long-term debt | | 1,258,538 |
| | — |
| | — |
| | — |
| | 1,258,538 |
|
| Other long-term liabilities | | 3,704 |
| | 12,715 |
| | — |
| | — |
| | 16,419 |
|
| Payable to parent | | — |
| | 2,337,585 |
| | — |
| | (2,337,585 | ) | | — |
|
| Total shareholders' equity | | (871,906 | ) | | (1,931,782 | ) | | 24,365 |
| | 1,907,417 |
| | (871,906 | ) |
| Total liabilities and shareholders' equity | | $ | 481,007 |
| | $ | 586,210 |
| | $ | 24,365 |
| | $ | (430,168 | ) | | $ | 661,414 |
|
| | | | | | | | | | | |
EXCO RESOURCES, INC.
CONDENSED CONSOLIDATING STATEMENT OF OPERATIONS
For the year ended December 31, 2017
|
| | | | | | | | | | | | | | | | | | | | |
| (in thousands) | | Resources | | Guarantor Subsidiaries | | Non-Guarantor Subsidiaries | | Eliminations | | Consolidated |
| Revenues: | | | | | | | | | | |
| Oil and natural gas | | $ | — |
| | $ | 258,830 |
| | $ | — |
| | $ | — |
| | $ | 258,830 |
|
| Purchased natural gas and marketing | | — |
| | 24,816 |
| | — |
| | — |
| | 24,816 |
|
| Total revenues | | — |
| | 283,646 |
| | — |
| | — |
| | 283,646 |
|
| Costs and expenses: | | | | | | | | | | |
| Oil and natural gas production | | — |
| | 48,142 |
| | — |
| | — |
| | 48,142 |
|
| Gathering and transportation | | — |
| | 111,427 |
| | — |
| | — |
| | 111,427 |
|
| Purchased natural gas | | — |
| | 23,400 |
| | — |
| | — |
| | 23,400 |
|
| Depletion, depreciation and amortization | | 298 |
| | 50,742 |
| | — |
| | — |
| | 51,040 |
|
| Impairment of oil and natural gas properties | | — |
| | — |
| | — |
| | — |
| | — |
|
| Accretion of discount on asset retirement obligations | | — |
| | 874 |
| | — |
| | — |
| | 874 |
|
| General and administrative | | (30,224 | ) | | 60,389 |
| | — |
| | — |
| | 30,165 |
|
| Other operating items | | 553 |
| | 58,601 |
| | — |
| | — |
| | 59,154 |
|
| Total costs and expenses | | (29,373 | ) | | 353,575 |
| | — |
| | — |
| | 324,202 |
|
| Operating income (loss) | | 29,373 |
| | (69,929 | ) | | — |
| | — |
| | (40,556 | ) |
| Other income (expense): | | | | | | | | | | |
| Interest expense, net | | (108,173 | ) | | (2 | ) | | — |
| | — |
| | (108,175 | ) |
| Gain on derivative financial instruments - commodity derivatives | | 24,732 |
| | — |
| | — |
| | — |
| | 24,732 |
|
| Gain on derivative financial instruments - common share warrants | | 159,190 |
| | — |
| | — |
| | — |
| | 159,190 |
|
| Loss on restructuring of debt | | (6,380 | ) | | — |
| | — |
| | — |
| | (6,380 | ) |
| Other income | | 30 |
| | 1 |
| | — |
| | — |
| | 31 |
|
| Equity loss | | — |
| | — |
| | (4,184 | ) | | — |
| | (4,184 | ) |
| Net loss from consolidated subsidiaries | | (74,114 | ) | | — |
| | — |
| | 74,114 |
| | — |
|
| Total other income (expense) | | (4,715 | ) | | (1 | ) | | (4,184 | ) | | 74,114 |
| | 65,214 |
|
| Income (loss) before income taxes | | 24,658 |
| | (69,930 | ) | | (4,184 | ) | | 74,114 |
| | 24,658 |
|
| Income tax expense | | 296 |
| | — |
| | — |
| | — |
| | 296 |
|
| Net income (loss) | | $ | 24,362 |
| | $ | (69,930 | ) | | $ | (4,184 | ) | | $ | 74,114 |
| | $ | 24,362 |
|
|
| | | | | | | | | | | | | | | | | | | | |
| (in thousands) | | Resources | | Guarantor
Subsidiaries | | Non-Guarantor
Subsidiaries | | Eliminations | | Consolidated |
| Assets | | | | | | | | | | |
| Current assets: | | | | | | | | | | |
| Cash and cash equivalents | | $ | 49,170 |
| | $ | (9,573 | ) | | $ | — |
| | $ | — |
| | $ | 39,597 |
|
| Restricted cash | | — |
| | 15,271 |
| | — |
| | — |
| | 15,271 |
|
| Other current assets | | 22,697 |
| | 90,265 |
| | — |
| | — |
| | 112,962 |
|
| Total current assets | | 71,867 |
| | 95,963 |
| | — |
| | — |
| | 167,830 |
|
| Equity investments | | — |
| | — |
| | 14,181 |
| | — |
| | 14,181 |
|
| Oil and natural gas properties (full cost accounting method): | | | | | | | | | | |
| Unproved oil and natural gas properties and development costs not being amortized | | — |
| | 118,652 |
| | — |
| | — |
| | 118,652 |
|
| Proved developed and undeveloped oil and natural gas properties | | 333,719 |
| | 2,773,847 |
| | — |
| | — |
| | 3,107,566 |
|
| Accumulated depletion | | (330,777 | ) | | (2,421,534 | ) | | — |
| | — |
| | (2,752,311 | ) |
| Oil and natural gas properties, net | | 2,942 |
| | 470,965 |
| | — |
| | — |
| | 473,907 |
|
| Other property and equipment, net and other non-current assets | | 892 |
| | 20,382 |
| | — |
| | — |
| | 21,274 |
|
| Investments in and (advances to) affiliates, net | | 466,055 |
| | — |
| | — |
| | (466,055 | ) | | — |
|
| Goodwill | | 13,293 |
| | 149,862 |
| | — |
| | — |
| | 163,155 |
|
| Total assets | | $ | 555,049 |
| | $ | 737,172 |
| | $ | 14,181 |
| | $ | (466,055 | ) | | $ | 840,347 |
|
| Liabilities and shareholders’ equity | | | | | | | | | | |
| Current maturities of long-term debt | | $ | 1,362,500 |
| | $ | — |
| | $ | — |
| | $ | — |
| | $ | 1,362,500 |
|
| Other current liabilities | | 32,280 |
| | 272,190 |
| | — |
| | — |
| | 304,470 |
|
| Derivative financial instruments - common share warrants | | 1,950 |
| | — |
| | — |
| | — |
| | 1,950 |
|
| Other long-term liabilities | | 4,518 |
| | 13,108 |
| | — |
| | — |
| | 17,626 |
|
| Payable to parent | | — |
| | 2,447,586 |
| | — |
| | (2,447,586 | ) | | — |
|
| Total shareholders’ equity | | (846,199 | ) | | (1,995,712 | ) | | 14,181 |
| | 1,981,531 |
| | (846,199 | ) |
| Total liabilities and shareholders’ equity | | $ | 555,049 |
| | $ | 737,172 |
| | $ | 14,181 |
| | $ | (466,055 | ) | | $ | 840,347 |
|
EXCO RESOURCES, INC.
CONDENSED CONSOLIDATING STATEMENT OF OPERATIONS
For the year ended December 31, 2016
|
| | | | | | | | | | | | | | | | | | | | |
| (in thousands) | | Resources | | Guarantor Subsidiaries | | Non-Guarantor Subsidiaries | | Eliminations | | Consolidated |
| Revenues: | | | | | | | | | | |
| Oil and natural gas | | $ | — |
| | $ | 248,649 |
| | $ | — |
| | $ | — |
| | $ | 248,649 |
|
| Purchased natural gas and marketing | | — |
| | 22,352 |
| | — |
| | — |
| | 22,352 |
|
| Total revenues | | — |
| | 271,001 |
| | — |
| | — |
| | 271,001 |
|
| Costs and expenses: | | | | | | | | | | |
| Oil and natural gas production | | 4 |
| | 49,985 |
| | — |
| | — |
| | 49,989 |
|
| Gathering and transportation | | — |
| | 106,460 |
| | — |
| | — |
| | 106,460 |
|
| Purchased natural gas | | — |
| | 23,557 |
| | — |
| | — |
| | 23,557 |
|
| Depletion, depreciation and amortization | | 381 |
| | 75,601 |
| | — |
| | — |
| | 75,982 |
|
| Impairment of oil and natural gas properties | | 838 |
| | 159,975 |
| | — |
| | — |
| | 160,813 |
|
| Accretion of discount on asset retirement obligations | | — |
| | 2,210 |
| | — |
| | — |
| | 2,210 |
|
| General and administrative | | (11,254 | ) | | 59,954 |
| | — |
| | — |
| | 48,700 |
|
| Other operating items | | (385 | ) | | 24,624 |
| | — |
| | — |
| | 24,239 |
|
| Total costs and expenses | | (10,416 | ) | | 502,366 |
| | — |
| | — |
| | 491,950 |
|
| Operating income (loss) | | 10,416 |
| | (231,365 | ) | | — |
| | — |
| | (220,949 | ) |
| Other income (expense): | | | | | | | | | | |
| Interest expense, net | | (70,438 | ) | | — |
| | — |
| | — |
| | (70,438 | ) |
| Loss on derivative financial instruments - commodity derivatives | | (34,137 | ) | | — |
| | — |
| | — |
| | (34,137 | ) |
| Gain on restructuring and extinguishment of debt | | 119,457 |
| | — |
| | — |
| | — |
| | 119,457 |
|
| Other income | | 9 |
| | 34 |
| | — |
| | — |
| | 43 |
|
| Equity loss | | — |
| | — |
| | (16,432 | ) | | — |
| | (16,432 | ) |
| Net loss from consolidated subsidiaries | | (247,763 | ) | | — |
| | — |
| | 247,763 |
| | — |
|
| Total other income (expense) | | (232,872 | ) | | 34 |
| | (16,432 | ) | | 247,763 |
| | (1,507 | ) |
| Income (loss) before income taxes | | (222,456 | ) | | (231,331 | ) | | (16,432 | ) | | 247,763 |
| | (222,456 | ) |
| Income tax expense | | 2,802 |
| | — |
| | — |
| | — |
| | 2,802 |
|
| Net income (loss) | | $ | (225,258 | ) | | $ | (231,331 | ) | | $ | (16,432 | ) | | $ | 247,763 |
| | $ | (225,258 | ) |
EXCO RESOURCES, INC. (DEBTOR-IN-POSSESSION)
CONDENSED CONSOLIDATING STATEMENT OF OPERATIONS
For the year endedYear Ended December 31, 20152018
| | | (in thousands) | | Resources | | Guarantor Subsidiaries | | Non-Guarantor Subsidiaries | | Eliminations | | Consolidated | | Resources | | Guarantor
Subsidiaries | | Non-Guarantor
Subsidiaries | | Eliminations | | Consolidated |
| Revenues: | | | | | | | | | | | | | | | | | | | | |
| Oil and natural gas | | $ | 4 |
| | $ | 329,254 |
| | $ | — |
| | $ | — |
| | $ | 329,258 |
| | $ | — |
| | $ | 352,228 |
| | $ | 20,363 |
| | $ | — |
| | $ | 372,591 |
|
| Purchased natural gas and marketing | | — |
| | 26,442 |
| | — |
| | — |
| | 26,442 |
| | — |
| | 21,090 |
| | 345 |
| | — |
| | 21,435 |
|
| Total revenues | | 4 |
| | 355,696 |
| | — |
| | — |
| | 355,700 |
| | — |
| | 373,318 |
| | 20,708 |
| | — |
| | 394,026 |
|
| Costs and expenses: | | | | | | | | | | | | | | | | | | | | |
| Oil and natural gas production | | 37 |
| | 76,496 |
| | — |
| | — |
| | 76,533 |
| | — |
| | 54,431 |
| | 2,978 |
| | — |
| | 57,409 |
|
| Gathering and transportation | | — |
| | 99,321 |
| | — |
| | — |
| | 99,321 |
| | — |
| | 72,772 |
| | 3,403 |
| | — |
| | 76,175 |
|
| Purchased natural gas | | — |
| | 27,369 |
| | — |
| | — |
| | 27,369 |
| | — |
| | 16,387 |
| | — |
| | — |
| | 16,387 |
|
| Depletion, depreciation and amortization | | 943 |
| | 214,483 |
| | — |
| | — |
| | 215,426 |
| | 299 |
| | 73,305 |
| | 6,685 |
| | — |
| | 80,289 |
|
| Impairment of oil and natural gas properties | | 9,316 |
| | 1,206,054 |
| | — |
| | — |
| | 1,215,370 |
| |
| Accretion of discount on asset retirement obligations | | 4 |
| | 2,273 |
| | — |
| | — |
| | 2,277 |
| |
| Accretion of liabilities | | | — |
| | 931 |
| | 1,066 |
| | — |
| | 1,997 |
|
| General and administrative | | (4,313 | ) | | 63,131 |
| | — |
| | — |
| | 58,818 |
| | (34,637 | ) | | 58,296 |
| | 4,191 |
| | — |
| | 27,850 |
|
| Gain on Appalachia JV Settlement | | | — |
| | — |
| | (119,237 | ) | | — |
| | (119,237 | ) |
| Other operating items | | 1,646 |
| | (1,185 | ) | | — |
| | — |
| | 461 |
| | (46 | ) | | (1,109 | ) | | (170 | ) | | — |
| | (1,325 | ) |
| Total costs and expenses | | 7,633 |
| | 1,687,942 |
| | — |
| | — |
| | 1,695,575 |
| | (34,384 | ) | | 275,013 |
| | (101,084 | ) | | — |
| | 139,545 |
|
| Operating loss | | (7,629 | ) | | (1,332,246 | ) | | — |
| | — |
| | (1,339,875 | ) | |
| Operating income | | | 34,384 |
| | 98,305 |
| | 121,792 |
| | — |
| | 254,481 |
|
| Other income (expense): | | | | | | | | | | | | | | | | | | | | |
| Interest expense, net | | (106,082 | ) | | — |
| | — |
| | — |
| | (106,082 | ) | | (33,917 | ) | | — |
| | — |
| | — |
| | (33,917 | ) |
| Gain on derivative financial instruments - commodity derivative | | 75,869 |
| | — |
| | — |
| | — |
| | 75,869 |
| |
| Gain on restructuring of debt | | 193,276 |
| | — |
| | — |
| | — |
| | 193,276 |
| |
| Loss on derivative financial instruments - commodity derivatives | | | (615 | ) | | — |
| | — |
| | — |
| | (615 | ) |
| Gain on derivative financial instruments - common share warrants | | | 1,889 |
| | — |
| | — |
| | — |
| | 1,889 |
|
| Other income | | 87 |
| | 35 |
| | — |
| | — |
| | 122 |
| | 27 |
| | 37 |
| | 6 |
| | — |
| | 70 |
|
| Equity loss | | — |
| | — |
| | (15,691 | ) | | — |
| | (15,691 | ) | |
| Equity income | | | — |
| | — |
| | 175 |
| | — |
| | 175 |
|
| Reorganization items, net | | | (101,284 | ) | | (308,014 | ) | | — |
| | — |
| | (409,298 | ) |
| Net loss from consolidated subsidiaries | | (1,347,902 | ) | | — |
| | — |
| | 1,347,902 |
| | — |
| | (87,699 | ) | | — |
| | — |
| | 87,699 |
| | — |
|
| Total other income (expense) | | (1,184,752 | ) | | 35 |
| | (15,691 | ) | | 1,347,902 |
| | 147,494 |
| | (221,599 | ) | | (307,977 | ) | | 181 |
| | 87,699 |
| | (441,696 | ) |
| Income (loss) before income taxes | | (1,192,381 | ) | | (1,332,211 | ) | | (15,691 | ) | | 1,347,902 |
| | (1,192,381 | ) | | (187,215 | ) | | (209,672 | ) | | 121,973 |
| | 87,699 |
| | (187,215 | ) |
| Income tax expense | | — |
| | — |
| | — |
| | — |
| | — |
| |
| Income tax benefit | | | (4,518 | ) | | — |
| | — |
| | — |
| | (4,518 | ) |
| Net income (loss) | | $ | (1,192,381 | ) | | $ | (1,332,211 | ) | | $ | (15,691 | ) | | $ | 1,347,902 |
| | $ | (1,192,381 | ) | | $ | (182,697 | ) | | $ | (209,672 | ) | | $ | 121,973 |
| | $ | 87,699 |
| | $ | (182,697 | ) |
EXCO RESOURCES, INC. (DEBTOR-IN-POSSESSION)
CONDENSED CONSOLIDATING STATEMENT OF CASH FLOWSOPERATIONS
For the year endedYear Ended December 31, 2017
|
| | | | | | | | | | | | | | | | | | | | |
| (in thousands) | | Resources | | Guarantor Subsidiaries | | Non-Guarantor Subsidiaries | | Eliminations | | Consolidated |
| Operating Activities: | | | | | | | | | | |
| Net cash provided by (used in) operating activities | | $ | (22,761 | ) | | $ | 77,172 |
| | $ | — |
| | $ | — |
| | $ | 54,411 |
|
| Investing Activities: | | | | | | | | | | |
| Additions to oil and natural gas properties, gathering assets and equipment and property acquisitions | | (1,347 | ) | | (169,820 | ) | | — |
| | — |
| | (171,167 | ) |
| Proceeds from disposition of property and equipment | | — |
| | 350 |
| | — |
| | — |
| | 350 |
|
| Restricted cash | | — |
| | (4,121 | ) | | — |
| | — |
| | (4,121 | ) |
| Net changes in advances to joint ventures | | — |
| | (9,161 | ) | | — |
| | — |
| | (9,161 | ) |
| Equity investments and other | | — |
| | 1,548 |
| | — |
| | — |
| | 1,548 |
|
| Advances/investments with affiliates | | (110,001 | ) | | 110,001 |
| | — |
| | — |
| | — |
|
| Net cash used in investing activities | | (111,348 | ) | | (71,203 | ) | | — |
| | — |
| | (182,551 | ) |
| Financing Activities: | | | | | | | | | | |
| Borrowings under EXCO Resources Credit Agreement | | 163,401 |
| | — |
| | — |
| | — |
| | 163,401 |
|
| Repayments under EXCO Resources Credit Agreement | | (265,592 | ) | | — |
| | — |
| | — |
| | (265,592 | ) |
| Proceeds received from issuance of 1.5 Lien Notes | | 295,530 |
| | — |
| | — |
| | — |
| | 295,530 |
|
| Payments on Exchange Term Loan | | (11,602 | ) | | — |
| | — |
| | — |
| | (11,602 | ) |
| Payments of common share dividends | | (6 | ) | | — |
| | — |
| | — |
| | (6 | ) |
| Debt financing costs and other | | (23,062 | ) | | — |
| | — |
| | — |
| | (23,062 | ) |
| Net cash provided by financing activities | | 158,669 |
| | — |
| | — |
| | — |
| | 158,669 |
|
| Net increase (decrease) in cash | | 24,560 |
| | 5,969 |
| | — |
| | — |
| | 30,529 |
|
| Cash at beginning of period | | 24,610 |
| | (15,542 | ) | | — |
| | — |
| | 9,068 |
|
| Cash at end of period | | $ | 49,170 |
| | $ | (9,573 | ) | | $ | — |
| | $ | — |
| | $ | 39,597 |
|
|
| | | | | | | | | | | | | | | | | | | | |
| (in thousands) | | Resources | | Guarantor
Subsidiaries | | Non-Guarantor
Subsidiaries | | Eliminations | | Consolidated |
| Revenues: | | | | | | | | | | |
| Oil and natural gas | | $ | — |
| | $ | 258,830 |
| | $ | — |
| | $ | — |
| | $ | 258,830 |
|
| Purchased natural gas and marketing | | — |
| | 24,816 |
| | — |
| | — |
| | 24,816 |
|
| Total revenues | | — |
| | 283,646 |
| | — |
| | — |
| | 283,646 |
|
| Costs and expenses: | | | | | | | | | | |
| Oil and natural gas production | | — |
| | 48,142 |
| | — |
| | — |
| | 48,142 |
|
| Gathering and transportation | | — |
| | 111,427 |
| | — |
| | — |
| | 111,427 |
|
| Purchased natural gas | | — |
| | 23,400 |
| | — |
| | — |
| | 23,400 |
|
| Depletion, depreciation and amortization | | 298 |
| | 50,742 |
| | — |
| | — |
| | 51,040 |
|
| Accretion of liabilities | | — |
| | 874 |
| | — |
| | — |
| | 874 |
|
| General and administrative | | (30,224 | ) | | 60,389 |
| | — |
| | — |
| | 30,165 |
|
| Other operating items | | 553 |
| | 58,601 |
| | — |
| | — |
| | 59,154 |
|
| Total costs and expenses | | (29,373 | ) | | 353,575 |
| | — |
| | — |
| | 324,202 |
|
| Operating income (loss) | | 29,373 |
| | (69,929 | ) | | — |
| | — |
| | (40,556 | ) |
| Other income (expense): | | | | | | | | | | |
| Interest expense, net | | (108,173 | ) | | (2 | ) | | — |
| | — |
| | (108,175 | ) |
| Gain on derivative financial instruments - commodity derivatives | | 24,732 |
| | — |
| | — |
| | — |
| | 24,732 |
|
| Gain on derivative financial instruments - common share warrants | | 159,190 |
| | — |
| | — |
| | — |
| | 159,190 |
|
| Loss on restructuring of debt | | (6,380 | ) | | — |
| | — |
| | — |
| | (6,380 | ) |
| Other income | | 30 |
| | 1 |
| | — |
| | — |
| | 31 |
|
| Equity loss | | — |
| | — |
| | (4,184 | ) | | — |
| | (4,184 | ) |
| Net loss from consolidated subsidiaries | | (74,114 | ) | | — |
| | — |
| | 74,114 |
| | — |
|
| Total other income (expense) | | (4,715 | ) | | (1 | ) | | (4,184 | ) | | 74,114 |
| | 65,214 |
|
| Income (loss) before income taxes | | 24,658 |
| | (69,930 | ) | | (4,184 | ) | | 74,114 |
| | 24,658 |
|
| Income tax expense | | 296 |
| | — |
| | — |
| | — |
| | 296 |
|
| Net income (loss) | | $ | 24,362 |
| | $ | (69,930 | ) | | $ | (4,184 | ) | | $ | 74,114 |
| | $ | 24,362 |
|
EXCO RESOURCES, INC.
CONDENSED CONSOLIDATING STATEMENT OF CASH FLOWS
For the year ended December 31, 2016
|
| | | | | | | | | | | | | | | | | | | | |
| (in thousands) | | Resources | | Guarantor Subsidiaries | | Non-Guarantor Subsidiaries | | Eliminations | | Consolidated |
| Operating Activities: | | | | | | | | | | |
| Net cash provided by (used in) operating activities | | $ | 572 |
| | $ | (986 | ) | | $ | — |
| | $ | — |
| | $ | (414 | ) |
| Investing Activities: | | | | | | | | | | |
| Additions to oil and natural gas properties, gathering assets and equipment and property acquisitions | | (1,521 | ) | | (78,904 | ) | | — |
| | — |
| | (80,425 | ) |
| Proceeds from disposition of property and equipment | | 10 |
| | 14,339 |
| | — |
| | — |
| | 14,349 |
|
| Restricted cash | | — |
| | 7,970 |
| | — |
| | — |
| | 7,970 |
|
| Net changes in advances to joint ventures | | — |
| | 3,097 |
| | — |
| | — |
| | 3,097 |
|
| Advances/investments with affiliates | | (60,991 | ) | | 60,991 |
| | — |
| | — |
| | — |
|
| Net cash provided by (used in) investing activities | | (62,502 | ) | | 7,493 |
| | — |
| | — |
| | (55,009 | ) |
| Financing Activities: | | | | | | | | | | |
| Borrowings under EXCO Resources Credit Agreement | | 404,897 |
| | — |
| | — |
| | — |
| | 404,897 |
|
| Repayments under EXCO Resources Credit Agreement | | (243,797 | ) | | — |
| | — |
| | — |
| | (243,797 | ) |
| Repurchases of senior unsecured notes | | (53,298 | ) | | — |
| | — |
| | — |
| | (53,298 | ) |
| Payment on Exchange Term Loan | | (50,695 | ) | | — |
| | — |
| | — |
| | (50,695 | ) |
| Payments of common share dividends | | (91 | ) | | — |
| | — |
| | — |
| | (91 | ) |
| Deferred financing costs and other | | (4,772 | ) | | — |
| | — |
| | — |
| | (4,772 | ) |
| Net cash provided by financing activities | | 52,244 |
| | — |
| | — |
| | — |
| | 52,244 |
|
| Net increase (decrease) in cash | | (9,686 | ) | | 6,507 |
| | — |
| | — |
| | (3,179 | ) |
| Cash at beginning of period | | 34,296 |
| | (22,049 | ) | | — |
| | — |
| | 12,247 |
|
| Cash at end of period | | $ | 24,610 |
| | $ | (15,542 | ) | | $ | — |
| | $ | — |
| | $ | 9,068 |
|
EXCO RESOURCES, INC. (DEBTOR-IN-POSSESSION)
CONDENSED CONSOLIDATING STATEMENT OF CASH FLOWS
For the year ended Year Ended December 31, 20152018
|
| | | | | | | | | | | | | | | | | | | | |
| (in thousands) | | Resources | | Guarantor Subsidiaries | | Non-guarantor subsidiaries | | Eliminations | | Consolidated |
| Operating Activities: | | | | | | | | | | |
| Net cash provided by operating activities | | $ | 34,532 |
| | $ | 99,495 |
| | $ | — |
| | $ | — |
| | $ | 134,027 |
|
| Investing Activities: | | | | | | | | | | |
| Additions to oil and natural gas properties, gathering assets and equipment | | (2,601 | ) | | (322,597 | ) | | — |
| | — |
| | (325,198 | ) |
| Proceeds from disposition of property and equipment | | 686 |
| | 6,711 |
| | — |
| | — |
| | 7,397 |
|
| Restricted cash | | — |
| | 4,850 |
| | — |
| | — |
| | 4,850 |
|
| Net changes in advances to joint ventures | | — |
| | 10,663 |
| | — |
| | — |
| | 10,663 |
|
| Equity investments and other | | — |
| | 1,455 |
| | — |
| | — |
| | 1,455 |
|
| Advances/investments with affiliates | | (217,906 | ) | | 217,906 |
| | — |
| | — |
| | — |
|
| Net cash used in investing activities | | (219,821 | ) | | (81,012 | ) | | — |
| | — |
| | (300,833 | ) |
| Financing Activities: | | | | | | | | | | |
| Borrowings under EXCO Resources Credit Agreement | | 165,000 |
| | — |
| | — |
| | — |
| | 165,000 |
|
| Repayments under EXCO Resources Credit Agreement | | (300,000 | ) | | — |
| | — |
| | — |
| | (300,000 | ) |
| Proceeds received from issuance of Fairfax Term Loan | | 300,000 |
| | — |
| | — |
| | — |
| | 300,000 |
|
| Repurchases of senior unsecured notes | | (12,008 | ) | | — |
| | — |
| | — |
| | (12,008 | ) |
| Payment on Exchange Term Loan | | (8,827 | ) | | — |
| | — |
| | — |
| | (8,827 | ) |
| Proceeds from issuance of common shares, net | | 9,693 |
| | — |
| | — |
| | — |
| | 9,693 |
|
| Payments of common share dividends | | (164 | ) | | — |
| | — |
| | — |
| | (164 | ) |
| Deferred financing costs and other | | (20,946 | ) | | — |
| | — |
| | — |
| | (20,946 | ) |
| Net cash provided by financing activities | | 132,748 |
| | — |
| | — |
| | — |
| | 132,748 |
|
| Net increase (decrease) in cash | | (52,541 | ) | | 18,483 |
| | — |
| | — |
| | (34,058 | ) |
| Cash at beginning of period | | 86,837 |
| | (40,532 | ) | | — |
| | — |
| | 46,305 |
|
| Cash at end of period | | $ | 34,296 |
| | $ | (22,049 | ) | | $ | — |
| | $ | — |
| | $ | 12,247 |
|
|
| | | | | | | | | | | | | | | | | | | | |
| (in thousands) | | Resources | | Guarantor
Subsidiaries | | Non-Guarantor
Subsidiaries | | Eliminations | | Consolidated |
| Operating Activities: | | | | | | | | | | |
| Net cash provided by (used in) operating activities | | $ | (22,984 | ) | | $ | 148,311 |
| | $ | 8,669 |
| | $ | — |
| | $ | 133,996 |
|
| Investing Activities: | | | | | | | | | | |
| Additions to oil and natural gas properties, gathering assets and equipment and property acquisitions | | (1,047 | ) | | (164,164 | ) | | 14,044 |
| | — |
| | (151,167 | ) |
| Other | | — |
| | 950 |
| | — |
| | — |
| | 950 |
|
| Advances/investments with affiliates | | (1,160 | ) | | 4,542 |
| | (3,382 | ) | | — |
| | — |
|
| Net cash provided by (used in) investing activities | | (2,207 | ) | | (158,672 | ) | | 10,662 |
| | — |
| | (150,217 | ) |
| Financing Activities: | | | | | | | | | | |
| Borrowings under DIP Credit Agreement | | 156,406 |
| | — |
| | — |
| | — |
| | 156,406 |
|
| Repayments under EXCO Resources Credit Agreement | | (126,401 | ) | | — |
| | — |
| | — |
| | (126,401 | ) |
| Debt financing costs and other | | (6,062 | ) | | — |
| | — |
| | — |
| | (6,062 | ) |
| Net cash provided by financing activities | | 23,943 |
| | — |
| | — |
| | — |
| | 23,943 |
|
| Net increase (decrease) in cash, cash equivalents and restricted cash | | (1,248 | ) | | (10,361 | ) | | 19,331 |
| | — |
| | 7,722 |
|
| Cash, cash equivalents and restricted cash at beginning of period | | 49,170 |
| | 5,698 |
| | — |
| | — |
| | 54,868 |
|
| Cash, cash equivalents and restricted cash at end of period | | $ | 47,922 |
| | $ | (4,663 | ) | | $ | 19,331 |
| | $ | — |
| | $ | 62,590 |
|
EXCO RESOURCES, INC. (DEBTOR-IN-POSSESSION)
CONDENSED CONSOLIDATING STATEMENT OF CASH FLOWS
For the Year Ended December 31, 2017
|
| | | | | | | | | | | | | | | | | | | | |
| (in thousands) | | Resources | | Guarantor
Subsidiaries | | Non-Guarantor
Subsidiaries | | Eliminations | | Consolidated |
| Operating Activities: | | | | | | | | | | |
| Net cash provided by (used in) operating activities | | $ | (22,761 | ) | | $ | 77,172 |
| | $ | — |
| | $ | — |
| | $ | 54,411 |
|
| Investing Activities: | | | | | | | | | | |
| Additions to oil and natural gas properties, gathering assets and equipment and property acquisitions | | (1,347 | ) | | (169,820 | ) | | — |
| | — |
| | (171,167 | ) |
| Proceeds from disposition of property and equipment | | — |
| | 350 |
| | — |
| | — |
| | 350 |
|
| Net changes in amounts due to joint ventures | | — |
| | (9,161 | ) | | — |
| | — |
| | (9,161 | ) |
| Equity investments and other | | — |
| | 1,548 |
| | — |
| | — |
| | 1,548 |
|
| Advances/investments with affiliates | | (110,001 | ) | | 110,001 |
| | — |
| | — |
| | — |
|
| Net cash used in investing activities | | (111,348 | ) | | (67,082 | ) | | — |
| | — |
| | (178,430 | ) |
| Financing Activities: | | | | | | | | | | |
| Borrowings under EXCO Resources Credit Agreement | | 163,401 |
| | — |
| | — |
| | — |
| | 163,401 |
|
| Repayments under EXCO Resources Credit Agreement | | (265,592 | ) | | — |
| | — |
| | — |
| | (265,592 | ) |
| Proceeds received from issuance of 1.5 Lien Notes, net | | 295,530 |
| | — |
| | — |
| | — |
| | 295,530 |
|
| Payments on Second Lien Term Loans | | (11,602 | ) | | — |
| | — |
| | — |
| | (11,602 | ) |
| Payments of common share dividends | | (6 | ) | | — |
| | — |
| | — |
| | (6 | ) |
| Debt financing costs and other | | (23,062 | ) | | — |
| | — |
| | — |
| | (23,062 | ) |
| Net cash provided by financing activities | | 158,669 |
| | — |
| | — |
| | — |
| | 158,669 |
|
| Net increase (decrease) in cash, cash equivalents and restricted cash | | 24,560 |
| | 10,090 |
| | — |
| | — |
| | 34,650 |
|
| Cash, cash equivalents and restricted cash at beginning of period | | 24,610 |
| | (4,392 | ) | | — |
| | — |
| | 20,218 |
|
| Cash, cash equivalents and restricted cash at end of period | | $ | 49,170 |
| | $ | 5,698 |
| | $ | — |
| | $ | — |
| | $ | 54,868 |
|
| |
| 15. | Quarterly financial data (unaudited) |
The following are summarized quarterly financial data for the years ended December 31, 20172018 and 2016:2017:
| | | | | Quarter | | Quarter |
| (in thousands, except per share amounts) | | 1st | | 2nd | | 3rd | | 4th | | 1st | | 2nd | | 3rd | | 4th |
| 2017 | | | | | | | | | |
| 2018 | | | | | | | | | |
| Total revenues | | $ | 76,529 |
| | $ | 71,015 |
| | $ | 66,736 |
| | $ | 69,366 |
| | $ | 90,464 |
| | $ | 98,130 |
| | $ | 98,571 |
| | $ | 106,861 |
|
| Operating income (loss) (1) | | 13,587 |
| | 15,216 |
| | (5,142 | ) | | (64,217 | ) | | 146,737 |
| | 30,399 |
| | 31,121 |
| | 46,224 |
|
Net income (loss) (2) | | $ | 8,193 |
| | $ | 120,750 |
| | $ | (18,824 | ) | | $ | (85,757 | ) | | $ | (211,049 | ) | | $ | 7,744 |
| | $ | 3,684 |
| | $ | 16,924 |
|
| Basic earnings (loss) per share: | | | | | | | | | | | | | | | | |
| Net income (loss) | | $ | 0.44 |
| | $ | 6.13 |
| | $ | (0.81 | ) | | $ | (3.68 | ) | | $ | (9.64 | ) | | $ | 0.36 |
| | $ | 0.17 |
| | $ | 0.78 |
|
| Weighted average shares | | 18,726 |
| | 19,702 |
| | 23,319 |
| | 23,333 |
| | 21,902 |
| | 21,615 |
| | 21,616 |
| | 21,616 |
|
| Diluted earnings (loss) per share: | | | | | | | | | | | | | | | | |
| Net income (loss) | | $ | 0.44 |
| | $ | 6.07 |
| | $ | (0.81 | ) | | $ | (3.68 | ) | | $ | (9.64 | ) | | $ | 0.36 |
| | $ | 0.17 |
| | $ | 0.78 |
|
| Weighted average shares | | 18,749 |
| | 19,886 |
| | 23,319 |
| | 23,333 |
| | 21,902 |
| | 21,615 |
| | 21,616 |
| | 21,616 |
|
| | | | | | | | | | | | | | | | | |
| 2016 | | | | | | | | | |
| 2017 | | | | | | | | | |
| Total revenues | | $ | 56,090 |
| | $ | 58,791 |
| | $ | 77,186 |
| | $ | 78,934 |
| | $ | 76,529 |
| | $ | 71,015 |
| | $ | 66,736 |
| | $ | 69,366 |
|
Operating income (loss) (3)(2) | | (164,698 | ) | | (72,997 | ) | | 4,142 |
| | 12,604 |
| | 13,587 |
| | 15,216 |
| | (5,142 | ) | | (64,217 | ) |
Net income (loss) (4)(3) | | $ | (130,148 | ) | | $ | (111,347 | ) | | $ | 50,936 |
| | $ | (34,699 | ) | | $ | 8,193 |
| | $ | 120,750 |
| | $ | (18,824 | ) | | $ | (85,757 | ) |
| Basic earnings (loss) per share: | | | | | | | | | | | | | | | | |
| Net income (loss) | | $ | (7.01 | ) | | $ | (5.99 | ) | | $ | 2.73 |
| | $ | (1.86 | ) | | $ | 0.44 |
| | $ | 6.13 |
| | $ | (0.81 | ) | | $ | (3.68 | ) |
| Weighted average shares | | 18,568 |
| | 18,597 |
| | 18,670 |
| | 18,686 |
| | 18,726 |
| | 19,702 |
| | 23,319 |
| | 23,333 |
|
| Diluted earnings (loss) per share: | | | | | | | | | | | | | | | | |
| Net income (loss) | | $ | (7.01 | ) | | $ | (5.99 | ) | | $ | 2.72 |
| | $ | (1.86 | ) | | $ | 0.44 |
| | $ | 6.07 |
| | $ | (0.81 | ) | | $ | (3.68 | ) |
| Weighted average shares | | 18,568 |
| | 18,597 |
| | 18,749 |
| | 18,686 |
| | 18,749 |
| | 19,886 |
| | 23,319 |
| | 23,333 |
|
| |
(1) | Operating income for the first quarter of 2018 includes the gain of $119.5 million recognized in connection with the Appalachia JV Settlement. Operating income during 2018 was significantly impacted by costs associated with the Chapter 11 process, which includes $352.9 million, $16.4 million, $18.2 million and $21.8 million during the first, second, third, and fourth quarters of 2018, respectively, that were classified as “Reorganization items, net” in our Consolidated Statement of Operations. See "Note 1. Organization and basis of presentation" for further discussion. |
| |
| (2) | Operating loss for the fourth quarter of 2017 includes the acceleration of the remaining charges under a firm transportation agreement of $56.4 million. See "Note 8. Commitments and contingencies" for further discussion. |
| |
(2)(3) | Net income (loss) includes gains on the revaluation of the 2017 Warrants of $6.0 million, $122.3 million, $18.3 million and $12.6 million during the first, second, third, and fourth quarters of 2017, respectively, primarily due to a decrease in EXCO's share price. See "Note 4. Derivative financial instruments" for further discussion. |
| |
(3) | Operating loss for the first and second quarter of 2016 includes $134.6 million and $26.2 million, respectively, of impairments of oil and natural gas properties. See "Note 2. Summary of significant accounting policies" for further discussion. |
| |
(4) | Net income (loss) for the first, second and third quarter of 2016 includes $45.1 million, $16.8 million and $57.4 million net gains on extinguishment of debt. See "Note 5. Debt" for further discussion. |
| |
| 16. | Supplemental information relating to oil and natural gas producing activities (unaudited) |
The following supplemental information relating to our oil and natural gas producing activities for the years ended December 31, 2017, 20162018 and 20152017 is presented in accordance with ASC 932, Extractive Activities, Oil and Gas.
Presented below are costs incurred in oil and natural gas property acquisition, exploration and development activities:
| | | (in thousands, except per unit amounts) | | Amount | | Amount |
| 2017: | | | |
| Proved property acquisition costs | | $ | 18,940 |
| |
| Unproved property acquisition costs | | 5,228 |
| |
| 2018: | | | |
| Proved property acquisition costs (1) | | | $ | — |
|
| Unproved property acquisition costs (1) | | | — |
|
| Total property acquisition costs | | 24,168 |
| | — |
|
| Development | | 128,323 |
| | 146,834 |
|
| Exploration costs (1) | | 19,538 |
| |
| Exploration costs | | | — |
|
| Lease acquisitions and other | | 5,654 |
| | 9,931 |
|
| Capitalized asset retirement costs | | 12 |
| | — |
|
| Depletion per Boe | | $ | 3.45 |
| | $ | 4.44 |
|
| Depletion per Mcfe | | $ | 0.57 |
| | $ | 0.74 |
|
| 2016: | | | |
| 2017: | | | |
| Proved property acquisition costs | | $ | 638 |
| | $ | 18,940 |
|
| Unproved property acquisition costs | | 393 |
| | 5,228 |
|
| Total property acquisition costs | | 1,031 |
| | 24,168 |
|
| Development | | 62,328 |
| | 128,323 |
|
Exploration costs | | — |
| | 19,538 |
|
| Lease acquisitions and other | | 760 |
| | 5,654 |
|
| Capitalized asset retirement costs | | — |
| | 12 |
|
| Depletion per Boe | | $ | 4.28 |
| | $ | 3.45 |
|
| Depletion per Mcfe | | $ | 0.71 |
| | $ | 0.57 |
|
| 2015: | | | |
| Proved property acquisition costs | | $ | 7,608 |
| |
| Unproved property acquisition costs | | — |
| |
| Total property acquisition costs | | 7,608 |
| |
| Development | | 215,239 |
| |
| Exploration costs (1) | | 13,306 |
| |
| Lease acquisitions and other | | 13,017 |
| |
| Capitalized asset retirement costs | | 881 |
| |
| Depletion per Boe | | $ | 10.32 |
| |
| Depletion per Mcfe | | $ | 1.72 |
| |
| |
| (1) | The Appalachia JV Settlement resulted in the acquisition of $33.5 million and $72.5 million of unproved and proved oil and natural gas properties, respectively. Per the terms of the settlement agreement, the acquisition of interests in these oil and gas properties did not require us to transfer any cash consideration. See "Note 3. Acquisitions, divestitures and other significant events" for further discussion of the Appalachia JV Settlement. |
| |
| (2) | Exploration costs in 2017 related to the wells drilled in the Bossier shale in North Louisiana. Exploration costs in 2015 related to the wells drilled in the Buda formation in South Texas. |
We retain independent engineering firms to prepare or audit annual year-end estimates of our future net recoverable oil and natural gas reserves. The estimated proved net recoverable reserves we show below include only those quantities that we expect to be commercially recoverable at prices and costs in effect at the balance sheet dates under existing regulatory practices and with conventional equipment and operating methods. Proved Developed Reserves represent only those reserves that we may recover through existing wells. Proved Undeveloped Reserves include those reserves that we may recover from new wells on undrilled acreage or from existing wells on which we must make a relatively major expenditure for recompletion or secondary recovery operations. All of our reserves are located onshore in the continental United States of America.
Discounted future cash flow estimates like those shown below are not intended to represent estimates of the fair value of our oil and natural gas properties. Estimates of fair value should also consider unproved reserves, anticipated future oil and natural gas prices, interest rates, changes in development and production costs and risks associated with future production. Because of these and other considerations, any estimate of fair value is subjective and imprecise.
| | | | | Oil
(Mbbls) | | Natural
Gas
(Mmcf) | | Mmcfe (8) | | Oil
(Mbbls) | | Natural
Gas
(Mmcf) | | Mmcfe |
| December 31, 2014 | | 17,687 |
|
| 1,157,674 |
|
| 1,263,796 |
| |
| December 31, 2016 | | | 10,168 |
| | 415,719 |
| | 476,727 |
|
| Purchase of reserves in place (1) | | 459 |
|
| 122 |
|
| 2,876 |
| | — |
| | 50,456 |
| | 50,456 |
|
Discoveries and extensions (2) | | 7,602 |
|
| 152,473 |
|
| 198,085 |
| | 13 |
| | 21,880 |
| | 21,958 |
|
| Revisions of previous estimates: | | | | | | | |
|
| |
|
| |
|
|
| Changes in price | | (2,821 | ) |
| (598,865 | ) |
| (615,791 | ) | | 679 |
| | 30,200 |
| | 34,274 |
|
| Other factors (3) | | (145 | ) |
| 184,641 |
|
| 183,771 |
| |
| Performance and other factors (2) | | | (290 | ) | | 72,332 |
| | 70,593 |
|
| Sales of reserves in place | | (1 | ) |
| (1,445 | ) |
| (1,451 | ) | | — |
| | — |
| | — |
|
| Production | | (2,342 | ) |
| (109,926 | ) |
| (123,978 | ) | | (1,158 | ) | | (80,136 | ) | | (87,084 | ) |
| December 31, 2015 | | 20,439 |
|
| 784,674 |
|
| 907,308 |
| |
| December 31, 2017 | | | 9,412 |
| | 510,451 |
| | 566,924 |
|
Purchase of reserves in place | | — |
|
| 552 |
|
| 552 |
| | — |
| | 118,415 |
| | 118,415 |
|
Discoveries and extensions (4) | | — |
|
| 16,381 |
|
| 16,381 |
| | 1,387 |
| | 22,482 |
| | 30,804 |
|
| Revisions of previous estimates: | | | | | | | |
|
| |
|
| | — |
|
| Changes in price | | (2,061 | ) |
| (55,748 | ) |
| (68,114 | ) | | 690 |
| | 5,726 |
| | 9,866 |
|
| Other factors (5) | | (5,165 | ) |
| (208,714 | ) |
| (239,704 | ) | |
| Performance and other factors (4) | | | 3,170 |
| | 22,486 |
| | 41,502 |
|
| Sales of reserves in place | | (1,276 | ) |
| (27,597 | ) |
| (35,253 | ) | | — |
| | — |
| | — |
|
| Production | | (1,769 | ) |
| (93,829 | ) |
| (104,443 | ) | | (1,357 | ) | | (98,779 | ) | | (106,921 | ) |
| December 31, 2016 | | 10,168 |
|
| 415,719 |
|
| 476,727 |
| |
| Purchase of reserves in place (6) | | — |
| | 50,456 |
| | 50,456 |
| |
| Discoveries and extensions | | 13 |
| | 21,880 |
| | 21,958 |
| |
| Revisions of previous estimates: | | | | | | | |
| Changes in price | | 679 |
| | 30,200 |
| | 34,274 |
| |
| Other factors (7) | | (290 | ) | | 72,332 |
| | 70,593 |
| |
| Sales of reserves in place | | — |
|
| — |
|
| — |
| |
| Production | | (1,158 | ) | | (80,136 | ) | | (87,084 | ) | |
| December 31, 2017 | | 9,412 |
| | 510,451 |
| | 566,924 |
| |
| December 31, 2018 | | | 13,302 |
| | 580,781 |
| | 660,590 |
|
Estimated Quantities of Proved Developed and Proved Undeveloped Reserves
| | | | | Oil
(Mbbls) | | Natural
Gas
(Mmcf) | | Mmcfe | | Oil
(Mbbls) | | Natural
Gas
(Mmcf) | | Mmcfe |
| Proved developed: | | | | | | | | | | | | |
| December 31, 2018 | | | 13,302 |
| | 580,781 |
| | 660,590 |
|
| December 31, 2017 | | 9,412 |
| | 510,451 |
| | 566,924 |
| | 9,412 |
| | 510,451 |
| | 566,924 |
|
| December 31, 2016 | | 10,168 |
| | 415,719 |
|
| 476,727 |
| |
| December 31, 2015 | | 12,056 |
| | 364,932 |
|
| 437,268 |
| |
| Proved undeveloped: | | | | | | | | | | | | |
| December 31, 2018 | | | — |
| | — |
| | — |
|
| December 31, 2017 | | — |
| | — |
| | — |
| | — |
| | — |
| | — |
|
| December 31, 2016 | | — |
| | — |
|
| — |
| |
| December 31, 2015 | | 8,383 |
| | 419,742 |
|
| 470,040 |
| |
| |
| (1) | Purchases of reserves in place include the acquisition of certain proved developed producing properties in the Eagle Ford shale in connection with the Participation Agreement. |
| |
(2) | New discoveries and extensions in 2015 include 84.9 Bcfe and 41.0 Bcfe in the Haynesville shale and Bossier shale, respectively, related to our development of properties within the Shelby area of East Texas. Additionally, extensions and discoveries in 2015 included 24.7 Bcfe in the in the Haynesville shale related to the development of the Holly area in North Louisiana and 47.5 Bcfe in the Eagle Ford shale. |
| |
(3) | Total revisions due to Other factors include upward revisions of approximately 152.2 Bcfe in the North Louisiana Holly area and are primarily due to modifications in the well design to incorporate more proppant and longer laterals. The upward revisions also included 36.7 Bcfe from our East Texas region primarily due to strong results in both the Haynesville and Bossier shales based on our enhanced completion methods. The upward revisions also reflect a reduction in capital costs and operating expenses. |
| |
(4) | New discoveries and extensions in 2016 include 14.9 Bcfe in the Haynesville and Bossier shales related to our development of properties within the Shelby area of East Texas. |
| |
(5) | Total revisions due to Other factors include downward revisions of approximately 427.6 Bcfe as a result of the reclassification of our Proved Undeveloped Reserves to unproved during the first quarter of 2016 due to the uncertainty regarding the financing required to develop these reserves that existed on March 31, 2016. These reserves remained reclassified in unproved due to our inability to meet the Reasonable Certainty criteria for recording Proved Undeveloped Reserves, as prescribed under the SEC requirements, as the uncertainty regarding our ability of capital required to develop these reserves still existed at December 31, 2016. This was offset by approximately 99.0 Bcfe of upward revisions in the Marcellus shale primarily due to the narrowing of regional price differentials, reductions in our operating expenses, and improved well performance due to shallower declines than previously forecasted. The upward revision also reflects a reduction in operating expenses in other areas, primarily North Louisiana and South Texas, which increased our reserves by 51.4 Bcfe and 23.9 Bcfe, respectively. Lower operating costs were primarily the result of various cost reduction efforts, including significant reductions in labor costs, chemical treatment costs and saltwater disposal costs. Reductions in our operating costs extend the economic life of certain properties and resulted in upward revisions to our reserve quantities. In addition, the upward revisions in North Louisiana reflect improved performance of certain Haynesville shale wells that the Company turned-to-sales during 2016. These wells featured enhanced completion methods including more proppant per lateral foot. |
| |
(6) | Purchases of reserves in place2017 primarily related to the acquisition of incremental interests in certain oil and natural gas properties that we operate and undeveloped acreage in the North Louisiana region. |
| |
(7)(2) | Total revisions due to Other factors primarily include the reclassification of wells to Proved Reserves during 2017 that were previously reclassified to unproved reserves in prior years due to capital constraints. These reclassifications primarily related to conversions of wells to Proved Developed Reserves as a result of our development activities in the North Louisiana region. |
| |
(8)(3) | Purchases of reserves in place during 2018 related to the acquisition of incremental interests in the Appalachia JV Settlement on February 27, 2018. The above reserves do not include our equity interestProved Reserves acquired in OPCO, which was not significantthe Appalachia JV Settlement predominantly consists of proved producing properties in any period presented.the Marcellus shale. |
| |
| (4) | Total revisions due to Other factors primarily include the reclassification of wells to Proved Reserves during 2018 that were previously reclassified to unproved reserves in prior years due to capital constraints. These reclassifications primarily related to conversions of wells to Proved Developed Reserves as a result of our development activities in the North Louisiana and South Texas regions. |
Standardized measure of discounted future net cash flows
We have summarized the Standardized Measure related to our proved oil and natural gas reserves. We have based the following summary on a valuation of Proved Reserves using discounted cash flows based on prices as prescribed by the SEC, costs and economic conditions and a 10% discount rate. The additions to Proved Reserves from the purchase of reserves in place, and new discoveries and extensions could vary significantly from year to year; additionally, the impact of changes to reflect current prices and costs of reserves proved in prior years could also be significant. Furthermore, the ability to demonstrate the financing available to fund a development program with Reasonable Certainty could have a significant impact on our Proved Undeveloped Reserves. Accordingly, the information presented below should not be viewed as an estimate of the fair value of our oil and natural gas properties, nor should it be indicative of any trends.
|
| | | | |
(in thousands) | | Amount |
Year ended December 31, 2017: | | |
Future cash inflows | | $ | 1,690,056 |
|
Future production costs | | 863,847 |
|
Future development costs (1) | | 51,925 |
|
Future income taxes | | — |
|
Future net cash flows | | 774,284 |
|
Discount of future net cash flows at 10% per annum | | 291,537 |
|
Standardized measure of discounted future net cash flows | | $ | 482,747 |
|
Year ended December 31, 2016: | | |
|
Future cash inflows | | $ | 1,216,855 |
|
Future production costs | | 705,873 |
|
Future development costs (1) | | 39,956 |
|
Future income taxes | | — |
|
Future net cash flows | | 471,026 |
|
Discount of future net cash flows at 10% per annum | | 160,095 |
|
Standardized measure of discounted future net cash flows | | $ | 310,931 |
|
Year ended December 31, 2015: | | |
|
Future cash inflows | | $ | 2,684,362 |
|
Future production costs | | 1,280,795 |
|
Future development costs | | 641,768 |
|
Future income taxes | | — |
|
Future net cash flows | | 761,799 |
|
Discount of future net cash flows at 10% per annum | | 359,666 |
|
Standardized measure of discounted future net cash flows | | $ | 402,133 |
|
|
| | | | |
| (in thousands) | | Amount |
| Year Ended December 31, 2018: | | |
| Future cash inflows | | $ | 2,335,662 |
|
| Future production costs | | 1,048,606 |
|
| Future development costs (1) | | 65,033 |
|
| Future income taxes (2) | | — |
|
| Future net cash flows | | 1,222,023 |
|
| Discount of future net cash flows at 10% per annum | | 464,654 |
|
| Standardized measure of discounted future net cash flows | | $ | 757,369 |
|
| Year Ended December 31, 2017: | | |
|
| Future cash inflows | | $ | 1,690,056 |
|
| Future production costs | | 863,847 |
|
| Future development costs (1) | | 51,925 |
|
| Future income taxes (2) | | — |
|
| Future net cash flows | | 774,284 |
|
| Discount of future net cash flows at 10% per annum | | 291,537 |
|
| Standardized measure of discounted future net cash flows | | $ | 482,747 |
|
| |
| (1) | All of our Proved Undeveloped Reserves were reclassified to unproved during 2016 due to the uncertainty regarding the financing required to develop these reserves. These reserves remained classified as unproved due to our inability to meet the Reasonable Certainty criteria for recording Proved Undeveloped Reserves, as prescribed under the SEC requirements, as the uncertainty regarding our availability of capital required to develop these reserves still existed at December 31, 20172018 and 2016.2017. As such, future development costs at December 31, 20172018 and 20162017 consist primarily of estimated future plugging and abandonment costs. |
| |
| (2) | Our tax basis in oil and natural gas properties exceeded the pre-tax cash inflows at December 31, 2018 and 2017. As a result, we are not expected to generate future taxable income from our oil and natural gas properties in the preparation of the Standardized Measure. |
During recent years, prices paid for oil and natural gas have fluctuated significantly. The reference prices at December 31, 2017, 20162018 and 20152017 used in the above table, were $51.34, $42.75$65.56 and $50.28$51.34 per Bbl of oil, respectively, and $2.98, $2.48$3.10 and $2.59$2.98 per Mmbtu of natural gas, respectively. Each of the reference prices for oil and natural gas were adjusted for quality factors and regional differentials. These prices reflect the SEC rules requiring the use of simple average of the first day of the month price for the previous 12 month period for natural gas at Henry Hub and West Texas Intermediate crude oil at Cushing, Oklahoma.
The following are the principal sources of change in the Standardized Measure:
| | | (in thousands) | | Amount | | Amount |
| Year ended December 31, 2017: | | | |
| Year Ended December 31, 2018: | | | |
| Sales and transfers of oil and natural gas produced | | $ | (99,260 | ) | | $ | (239,007 | ) |
| Net changes in prices and production costs | | 91,998 |
| | 192,798 |
|
| Extensions and discoveries, net of future development and production costs | | 25,459 |
| | 70,394 |
|
| Development costs during the period to the extent previously estimated | | 1,913 |
| | 6,192 |
|
| Changes in estimated future development costs | | (4,758 | ) | | (6,314 | ) |
| Revisions of previous quantity estimates | | 88,825 |
| | 136,700 |
|
| Sales of reserves in place | | — |
| | — |
|
| Purchase of reserves in place | | 40,991 |
| | 63,146 |
|
| Accretion of discount | | 31,093 |
| | 48,275 |
|
| Changes in timing and other | | (4,444 | ) | | 2,438 |
|
| Net change in income taxes | | — |
| | — |
|
| Net change | | $ | 171,817 |
| | $ | 274,622 |
|
| Year ended December 31, 2016: | | |
| |
| Year Ended December 31, 2017: | | | |
|
| Sales and transfers of oil and natural gas produced | | $ | (92,200 | ) | | $ | (99,260 | ) |
| Net changes in prices and production costs | | (260,335 | ) | | 91,998 |
|
| Extensions and discoveries, net of future development and production costs | | 16,258 |
| | 25,459 |
|
| Development costs during the period to the extent previously estimated | | 46,499 |
| | 1,913 |
|
| Changes in estimated future development costs | | 384,644 |
| | (4,758 | ) |
| Revisions of previous quantity estimates | | (180,367 | ) | | 88,825 |
|
| Sales of reserves in place | | (11,814 | ) | | — |
|
| Purchase of reserves in place | | 347 |
| | 40,991 |
|
| Accretion of discount | | 40,213 |
| | 31,093 |
|
| Changes in timing and other | | (34,447 | ) | | (4,444 | ) |
| Net change in income taxes | | — |
| | — |
|
| Net change | | $ | (91,202 | ) | | $ | 171,817 |
|
| Year ended December 31, 2015: | | |
| |
| Sales and transfers of oil and natural gas produced | | $ | (153,404 | ) | |
| Net changes in prices and production costs | | (1,438,023 | ) | |
| Extensions and discoveries, net of future development and production costs | | 99,818 |
| |
| Development costs during the period to the extent previously estimated | | 109,895 |
| |
| Changes in estimated future development costs | | 407,780 |
| |
| Revisions of previous quantity estimates | | (232,325 | ) | |
| Sales of reserves in place | | (1,632 | ) | |
| Purchase of reserves in place | | 6,892 |
| |
| Accretion of discount | | 126,533 |
| |
| Changes in timing and other | | (65,988 | ) | |
| Net change in income taxes | | — |
| |
| Net change | | $ | (1,140,454 | ) | |
Costs not subject to amortization
The following table summarizes the categories of costs comprising the amount of unproved properties not subject to amortization by the year in which such costs were incurred. There are no individually significant properties or significant development projects included in costs not being amortized. A significant portion of our acreage is held-by-production, which allows us to develop these properties within an optimum time frame.
| | | (in thousands) | | Total | | 2017 | | 2016 | | 2015 | | 2014 and
prior | | Total | | 2018 | | 2017 | | 2016 | | 2015 and
prior |
| Property acquisition costs | | $ | 71,244 |
|
| $ | 10,890 |
|
| $ | 899 |
|
| $ | 11,121 |
|
| $ | 48,334 |
| | $ | 104,465 |
| | $ | 33,908 |
| | $ | 10,890 |
| | $ | 899 |
| | $ | 58,768 |
|
| Exploration and development | | 10,820 |
|
| 10,820 |
|
| — |
|
| — |
|
| — |
| | 13,900 |
| | 13,900 |
| | — |
| | — |
| | — |
|
| Capitalized interest | | 36,588 |
|
| 6,440 |
|
| 5,213 |
|
| 8,464 |
|
| 16,471 |
| | 37,281 |
| | 3,357 |
| | 6,440 |
| | 5,213 |
| | 22,271 |
|
| Total | | $ | 118,652 |
|
| $ | 28,150 |
|
| $ | 6,112 |
|
| $ | 19,585 |
|
| $ | 64,805 |
| | $ | 155,646 |
| | $ | 51,165 |
| | $ | 17,330 |
| | $ | 6,112 |
| | $ | 81,039 |
|
Chapter 11 Cases
Plan of Reorganization
On January 15, 2018,March 8, 2019, the CompanyDebtors filed the March 2019 Plan and related Disclosure Statement with the Filing Subsidiaries filed voluntary petitions for relief under Chapter 11Court. See further discussion of the Bankruptcy CodeMarch 2019 Plan in “Note 1. Organization and basis of presentation”.
Chesapeake Settlement Agreement
On February 21, 2019, EXCO executed an agreement with CEC and CEML to settle litigation, claims against the United States Bankruptcy Court forDebtors and other matters ("Chesapeake Settlement Agreement"). Per the Southern District of Texas. The Chapter 11 Cases are being jointly administered under the caption In Re EXCO Resources, Inc., Case No. 18-30155 (MI). The Court has granted allterms of the first day motionsChesapeake Settlement Agreement:
All claims filed by the Debtors that were designed primarily to minimize the impact of the Chapter 11 proceedings on our operations, customersCEC and employees. We will continue to operate our businesses as “debtorsCEML in possession” under the jurisdiction of the Court and in accordance with the applicable provisions of the Bankruptcy Code and orders of the Court. We expect to continue our operations without interruption during the pendency of the Chapter 11 proceedings.
Impact on indebtedness
As of January 15, 2018, we had approximately $1.4 billion in principal amount of indebtedness, including approximately: (i) $126.4 million outstanding under the EXCO Resources Credit Agreement, (ii) $317.0 million in outstanding under the 1.5 Lien Notes, (iii) $708.9 million outstanding under the 1.75 Lien Term Loans, (iv) $17.2 million outstanding under the Second Lien Term Loans, (v) $131.6 million outstanding under the 2018 Notes and (vi) $70.2 million outstanding under the 2022 Notes. The commencement of the Chapter 11 Cases described above constituted an eventshall be deemed disallowed and expunged. These claims primarily include costs related to the rejection of default that accelerateda marketing agreement in the North Louisiana region and pre-petition costs related to sales of natural gas in the South Texas region. As of December 31, 2018, our obligations underestimate of the following debt instruments:allowable claims classified as "Liabilities subject to compromise" was $8.6 million for the rejection of the marketing agreement and $2.0 million pre-petition costs related to sales of natural gas;
EXCO agreed to release CEC and CEML from pre-petition litigation including the wrongful termination of a natural gas sales contract in South Texas and improper charges for post-production costs in North Louisiana. See further discussion of the litigation with CEC and CEML in "Item 3. Legal proceedings"; and
EXCO will assume certain sales contracts with CEML and joint operating agreements with CEC.
EXCO Resources Credit Agreement;
1.5 Lien Notes;
1.75 Lien Term Loans;
2018 Notes;The Chesapeake Settlement Agreement will not be effective until it is approved by the Court. We filed a motion with the Court to approve the Chesapeake Settlement Agreement on February 25, 2019 and
2022 Notes. the hearing is scheduled for March 20, 2019.
These debt instruments provide that as a resultEnterprise Settlement Agreement
On November 13, 2018, EXCO and Bluescape executed an agreement with Enterprise and Acadian to settle the litigation described in "Item 3. Legal proceedings" and claims against the Debtors ("EPD Settlement Agreement"). Enterprise and Acadian are part of the commencementcorporate family of Enterprise Products Partners L.P. (“EPD”). Per the terms of the EPD Settlement Agreement:
The proofs of claim filed by EPD in the Chapter 11 Cases the principal and interest due thereunder shall be immediately due and payable. Any efforts to enforce such payment obligations under the debt instruments are automatically stayed as a resultsettled for an allowed general unsecured claim of the commencement of the Chapter 11 Cases, and the creditors’ rights of enforcement in respect of the debt instruments are subject$10.0 million. These claims primarily include costs related to the applicable provisionsrejection of a natural gas sales agreement and natural gas transportation agreement in the Bankruptcy Code. As a result of the bankruptcy proceedings, the Court may limit post-petition interest on debt that may be under secured or unsecured.North Louisiana region. On February 22, 2018, the Court approved our ability to make adequate protection payments for interest on the DIP Credit Agreement and the 1.5 Lien Notes.
DIP Credit Agreement
On January 22, 2018, we closed the DIP Credit Agreement with lenders including affiliates of Fairfax, Bluescape and JPMorgan Chase Bank, N.A. ("DIP Lenders"). Hamblin Watsa Investment Counsel Ltd. is the administrative agent (“DIP Agent”) for the DIP Credit Agreement. The DIP Credit Agreement includes the Revolver A Facility in an aggregate principal amount of $125.0 million and the Revolver B Facility in an aggregate principal amount of $125.0 million.
All amounts outstanding under the DIP Facilities bear interest at an adjusted LIBOR plus 4.00% per annum. During the continuance of an event of default, the outstanding amounts under the DIP Facilities bear interest at an additional 2.00% per annum above the interest rate otherwise applicable.
The DIP Facilities will mature on the earliest of (a) 12 months from the initial borrowings on January 22, 2018, (b) the effective date of a plan of reorganization, inBluescape shall be required to purchase the Chapter 11 Cases, or (c) the date of termination of all revolving commitments and/or the acceleration of the obligations under the DIP Facilities following an event of default. We have the option, subject to certain conditions, to extend the maturity of the DIP Facilities to the date that is 18 monthsclaim from the initial borrowing date. Borrowings under the DIP Credit Agreement are subject to a borrowing base basedEPD for $5.0 million;
The Debtors shall pay EPD: (i) $6.25 million on the value of our oil and gas reserves. Beginning on January 1, 2019, the borrowing base will be subject to adjustment semi-annually, on April 1 and October 1 of each year. The initial borrowing base under the DIP Facilities is $250.0 million. The DIP Lenders have considerable discretion in setting our borrowing base as part of the redetermination process. However, we may elect to redetermine the borrowing base to an amount equal to two-thirds of the net present value, discounted at nine percent, of our Proved Developed Reserves.
The proceeds of the DIP Facilities may be used in accordance with the DIP Credit Agreement to (i) repay obligations outstanding under the EXCO Resources Credit Agreement, (ii) pay for operating expenses incurred during the Chapter 11 Cases subject to a budget provided to the DIP Lenders under the DIP Credit Agreement, (iii) pay for certain transaction costs, fees and expenses, and (iv) pay for certain other costs and expenses of administering the Chapter 11 Cases. We used approximately $104.0 million of the proceeds provided through the DIP Facilities to refinance all obligations outstanding under the EXCO Resources Credit Agreement (the “ERCA Refinancing”). Under the DIP Credit Agreement, approximately $24.0 million of outstanding letters of credit were deemed issued under the Revolver A Facility, and approximately $21.6 million of loans outstanding under the EXCO Resources Agreement were deemed exchanged for loans under the Revolver B Facility. On January 18, 2018, the Court entered an interim order (the “DIP Interim Order”) that authorized us to enter into the DIP Facilities. Under the Interim Order, the ERCA Refinancing was subject to a challenge and review period that expired on theeffective date of the Court hearing on the final order (the “DIP Challenge Period”). On February 22, 2018, the Court entered into a final order authorizing entry into the DIP Credit Agreement on a final basis. The entry into the final order resulted in the expiration of the DIP Challenge Period and the termination of the EXCO Resources Credit Agreement. As of February 28, 2018, we had $156.4 million in outstanding indebtedness under the DIP Facilities, excluding letters of credit. Our available borrowing capacity under the DIP Facilities was $69.6 million as of February 28, 2018.
The DIP Lenders and the DIP Agent, subject to the Carve-Out (as defined below) and the terms of the Interim Order, at all times: (i) are entitled to joint and several super-priority administrative expense claim status in the Chapter 11 cases; (ii) have a first priority lien on substantially all of our assets; (iii) have a junior lien on any of our assets subject to a valid, perfected and non-avoidable lien as of the Petition Date, other than such liens securing the obligations under the EXCO Resources Credit Agreement, 1.5 Lien Notes, 1.75 Lien Term Loans and Second Lien Term Loans, and (iv) have a first priority pledge of 100% of the stock and other equity interests in each of our direct and indirect subsidiaries. Our obligations to the DIP Lenders and the liens and super-priority claims are subject in each case to a carve out (the “Carve-Out”) that accounts for certain administrative, court and legal fees payable in connection with the Chapter 11 Cases.
The DIP Credit Agreement contains certain financial covenants, including, but not limited to:
our cash (as defined in the DIP Credit Agreement) plus unused commitments under the DIP Credit Agreement cannot be less than of $20.0 million; and
aggregate disbursements cannot exceed 120% of the aggregate disbursements (excluding professional fees incurred in the Chapter 11 Cases) set forth in the 13-week forecasts provided to the administrative agent of the DIP Credit Agreement. The testing period is based on the immediately preceding four-week period and is measured every two weeks. The 13-week forecast is provided to the DIP Agent on a monthly basis and shall be consistent in all material respects with the applicable period covered by the 2018 budget that was previously delivered to the administrative agent of the DIP Credit Agreement.
The DIP Facilities contain events of default, including: (i) conversion of the Chapter 11 Cases to cases under Chapter 7 of the Bankruptcy Code and (ii) appointment of a trustee, examiner or receiver in the Chapter 11 Cases. The DIP Facilities contained an event of default if we failed to pursue a Court hearing no later than July 1, 2018 to consider the sale of all or substantially all of our assets. This requirement to pursue the court hearing to consider the sale of assets may have been waived by Fairfax, and the DIP Lenders and the Company were required negotiate in good faith the terms of a plan of reorganization, and (ii) $6.25 million on September 1, 2019; and
Upon completion of the payments from the Debtors and Bluescape to equitize certain indebtedness as an alternativeEPD, each party shall provide releases and take all actions to dismiss the sale process. On February 22, 2018, the final order entered by the Court deemed the requirement to pursue a Court hearing to consider the sale of all or substantially all of our assets to be no longer in force and effect.
aforementioned litigation.
The foregoing descriptionEPD Settlement Agreement will not be effective until it is approved by the Court. Furthermore, the EPD Settlement Agreement will be terminated if the effective date of a plan of reorganization does not purportoccur prior to beJuly 1, 2019. We filed a complete descriptionmotion with the Court to approve the EPD Settlement Agreement on March 13, 2019 and the hearing is scheduled for April 11, 2019. As of December 31, 2018, our estimate of the DIP Credit Agreement, a copy of which is filedallowable claims classified as an exhibit to the Current Report on Form 8-K, dated January 25, 2018.
Automatic stay
Subject to certain specific exceptions under the Bankruptcy Code, the Chapter 11 filings automatically stayed most judicial or administrative actions against the Company and the Filing Subsidiaries as well as efforts by creditors to collect on or otherwise exercise rights or remedies with respect to pre-petition claims. As a result, for example, most creditor actions to obtain possession of property from us or any of the Filing Subsidiaries, or to create, perfect or enforce any lien against our property or any of the Filing Subsidiaries, or to collect on or otherwise exercise rights or remedies with respect to a pre-petition claim are stayed.
Executory contracts
Subject to certain exceptions, under the Bankruptcy Code, the Company and the Filing Subsidiaries may assume, assign, or reject certain executory contracts and unexpired leases"Liabilities subject to the approval of the Court and fulfillment of certain other conditions. The rejection of an executory contract or unexpired lease is generally treated as a breach as of the petition date of such executory contract or unexpired lease and, subject to certain exceptions, relieves the Company and the Filing Subsidiaries of performing their future obligations under such executory contract or unexpired lease but may give rise to a general unsecured claim against us or the applicable Filing Subsidiariescompromise" was $298.5 million for damages caused by such rejection. The assumption of an executory contract or unexpired lease generally requires the Company and the Filing Subsidiaries to cure existing monetary or other defaults under such executory contract or unexpired lease and provide adequate assurance of future performance. Any description of the treatment of an executory contract or unexpired lease with the Company or any of the Filing Subsidiaries, including any description of the obligations under any such executory contract or unexpired lease, is qualified by and subject to any rights we have with respect to executory contracts and unexpired leases under the Bankruptcy Code.
On January 18, 2018, the Company and the Filings Subsidiaries filed motions to reject certain executory contracts as permitted under the Bankruptcy Code. The contracts include the following:
Firm transportation agreements with Acadian, which required us to transport 325,000 Mmbtu per day on the Acadian Gas Pipeline System or pay reservation charges through October, 31, 2025;
Natural gas sales agreements with Enterprise, which required us to sell 75,000 Mmbtu per day of natural gas to Enterprise or incur certain costs through October 31, 2025;
Firm transportation agreements with Regency, which required us to either transport 237,500 Mmbtu per day of natural gas or pay reservation charges through January 31, 2020;
Marketing agreement with Chesapeake, which required us to allow Chesapeake to purchase natural gas for certain wells in North Louisiana through 2021; and
Natural gas sales agreements with Shell, which required us to sell 100,000 Mmbtu per day of natural gas to Shell or incur certain costs through November 30, 2020.
On March 7, 2018, the Court approved the rejection of the aforementioned executory contractsnatural gas sales agreement with Regency, Chesapeake and Shell. The hearing to consider the motion to reject the Enterprise and Acadian contracts is scheduled for March 29, 2018. On March 1, 2018, the Company and the Filing Subsidiaries filed a motion to reject an agreement to deliver an aggregate minimum volume commitment of natural gas productiontransportation agreement with Acadian in East Texas andthe North Louisiana to certain gathering systems through November 30, 2018. The hearing to consider this motion is scheduled for March 29, 2018. See further discussion of the future minimum obligations under these contracts as of December 31, 2017 in "Note 8. Commitments and contingencies".
Chapter 11 filing impact on creditors and shareholders
Under the priority requirements established by the Bankruptcy Code, unless creditors agree otherwise, pre-petition liabilities to creditors and post-petition liabilities must be satisfied in full before the holders of our existing common shares are entitled to receive any distribution or retain any property under a plan of reorganization. The ultimate recovery to creditors, if any, will not be determined until confirmation and implementation of a plan of reorganization. The outcome of the Chapter 11 Cases remains uncertain at this time and, as a result, we cannot accurately estimate the amounts or value of distributions that creditors may receive. We believe it is highly likely that our existing common shares will be canceled at the conclusion of our Chapter 11 Cases, and the holders of our existing common shares will be entitled to a limited recovery, if any.
Restrictions on trading of our equity securities to protect our use of net operating losses
The Court has entered a final order pursuant to Sections 362(a)(3) and 541 of the Bankruptcy Code enabling the Company and the Filing Subsidiaries to avoid limitations on the use of our income tax net operating loss carryforwards and certain other tax attributes by imposing certain notice procedures and transfer restrictions on the trading of our equity securities. In general, the order applies to any person that, directly or indirectly, beneficially owns (or would beneficially own as a result of a proposed transfer) at least 4.5% of our outstanding common stock (a “Substantial Stockholder”), and requires that each Substantial Stockholder file with the Court and serve us with notice of such status. Under the order, prior to any proposed acquisition or disposition of equity securities that would result in an increase or decrease in the amount of our equity securities owned by a Substantial Stockholder, or that would result in a person or entity becoming a Substantial Stockholder, such person or entity is required to file with the Court and notify us of such acquisition or disposition. We have the right to seek an injunction from the Court to prevent certain acquisitions or sales of our common shares if the acquisition or sale would pose a material risk of adversely affecting our ability to utilize such tax attributes.
Risks associated with Chapter 11 proceedings
For the duration of our Chapter 11 proceedings, our operations and our ability to develop and execute our business plan are subject to the risks and uncertainties associated with the Chapter 11 proceedings as described in "Item 1A. Risk Factors”. As a result of these risks and uncertainties, our assets, liabilities, shareholders' equity, officers and/or directors could be significantly different following the outcome of the Chapter 11 proceedings, and the description of our operations, properties and capital plans included in this Annual Report may not accurately reflect our operations, properties and capital plans following the Chapter 11 process.
Appalachia JV Settlement
On January 26, 2018, we filed a motion to authorize the entry into a settlement agreement with a subsidiary of Shell to resolve arbitration regarding our right to participate in an area of mutual interest in the Appalachia region. The final order related to this settlement was approved on February 22, 2018 and we closed the settlement agreement on February 27, 2018. Under the terms of the settlement:
Shell transferred its interests to EXCO in each of BG Production Company (PA), LLC, BG Production Company (WV), LLC, OPCO, and the Appalachia Midstream JV;
Shell and EXCO terminated and considered to be fulfilled obligations and liabilities under certain specified agreements related to the Appalachia JV;
EXCO reconveyed its interests in certain leases, representing an interest in 364 net acres, that EXCO had previously acquired from Shell within the area of mutual interest, in exchange for consideration of $0.7 million;
EXCO and Shell mutually released all existing, future, known, and unknown claims for all existing, future, known, and unknown damages and remedies that each party may have against one another arising out of or relating to the joint development agreement, the area of mutual interest, the arbitration, the state court action, and all joint venture dealings among the parties and certain of their affiliates in the Appalachia region, except as expressly provided in the settlement; and
EXCO caused the arbitration and the state court action to be dismissed with prejudice.
The settlement increased our acreage in the Appalachia region by approximately 177,700 net acres, and the production from the additional interests in producing wells acquired was 26 net Mmcfe per day during December 2017. In addition, EXCO owns 100% of OPCO and the Appalachia Midstream JV subsequent to the settlement.
Item 9. Changes in and Disagreements with Accountants on Accounting and Financial Disclosure
None.
Item 9A. Controls and Procedures
Disclosure controls and procedures. Pursuant to Rule 13a-15(b) under the Exchange Act, EXCO's management has evaluated, under the supervision and with the participation of our principal executive officer and principal financial officer, the effectiveness of the design and operation of our disclosure controls and procedures (as defined in Rules 13a-15(e) and 15d-15(e) of the Exchange Act), as of the end of the period covered by this report. Based on this evaluation, our principal executive officer and principal financial officer have concluded that EXCO's disclosure controls and procedures were effective
as of December 31, 20172018 to ensure that information that is required to be disclosed by EXCO in the reports it files or submits under the Exchange Act is (i) recorded, processed, summarized and reported, within the time periods specified in the SEC's rules and forms and (ii) accumulated and communicated to EXCO's management, including our principal executive officer and principal financial officer, as appropriate to allow timely decisions regarding required disclosure.
Management's report on internal control over financial reporting. EXCO's management is responsible for establishing and maintaining adequate internal control over financial reporting (as defined in Rule 13a-15(f) or 15d-15(f) of the
Exchange Act). Management assessed the effectiveness of our internal control over financial reporting as of December 31, 2017,2018, using criteria established in Internal Control-Integrated Framework (2013) issued by the Committee of Sponsoring Organizations of the Treadway Commission (COSO). Even an effective internal control system, no matter how well designed, has inherent limitations, including the possibility of human error and circumvention or overriding of controls and therefore can provide only reasonable assurance with respect to reliable financial reporting. Furthermore, the effectiveness of an internal control system in future periods can change with conditions. Management's annual report of internal control over financial reporting and the audit report on our internal control over financial reporting of our independent registered public accounting firm, KPMG LLP, areis included in Item 8 of this Annual Report on Form 10-K and are incorporated by reference herein.10-K.
Changes in internal control over financial reporting. There were no changes in EXCO's internal control over financial reporting that occurred during the quarter ended December 31, 20172018 that have materially affected, or are reasonably likely to materially affect, EXCO's internal control over financial reporting.
Item 9B. Other Information
None.
PART III
Item 10. Directors, Executive Officers and Corporate Governance
The information required in response to this Item 10 will be provided in an amendment on Form 10-K/A and will be incorporated by reference therein.
Item 11. Executive Compensation
The information required in response to this Item 11 will be provided in an amendment on Form 10-K/A and will be incorporated by reference therein.
Item 12. Security Ownership of Certain Beneficial Owners and Management and Related Stockholder Matters
The information required in response to this Item 12 will be provided in an amendment on Form 10-K/A and will be incorporated by reference therein.
Item 13. Certain Relationships and Related Transactions and Director Independence
The information required in response to this Item 13 will be provided in an amendment on Form 10-K/A and will be incorporated by reference therein.
Item 14. Principal Accountant Fees and Services
The information required in response to this Item 14 will be provided in an amendment on Form 10-K/A and we be incorporated by reference therein.
PART IV
Item 15. Exhibits and Financial Statement Schedules
(a)(1) Financial Statements
See Part II, Item 8. Financial Statements and Supplementary Data of this Annual Report on Form 10-K.
(a)(2) Financial Statement Schedule
None.
(a)(3) Listing of Exhibits
See "Index to Exhibits" for a description of our exhibits.below.
INDEX TO EXHIBITS
|
| | |
Exhibit Number | | Description of Exhibits |
| | |
| 3.1 | | |
| | |
| 3.2 | | |
| | |
| 4.1 | | |
| | |
| 4.2 | | First Supplemental Indenture, dated September 15, 2010, by and among EXCO Resources, Inc., certain of its subsidiaries and Wilmington Trust Company, as trustee, including the form of 7.500% Senior Notes due 2018, filed as an Exhibit to EXCO’s Current Report on Form 8-K (File No. 001-32743), dated September 10, 2010 and filed on September 15, 2010 and incorporated by reference herein. |
| | |
| 4.3 | | Second Supplemental Indenture, dated as of February 12, 2013, by and among EXCO Resources, Inc., EXCO/HGI JV Assets, LLC, EXCO Holding MLP, Inc. and Wilmington Trust Company, as trustee, filed as an Exhibit to EXCO's Current Report on Form 8-K (File No. 001-32743), dated February 12, 2013 and filed on February 19, 2013 and incorporated by reference herein. |
| | |
| 4.4 | | Third Supplemental Indenture, dated April 16, 2014, by and among EXCO Resources, Inc., certain of its subsidiaries and Wilmington Trust Company, as trustee, including the form of 8.500% Senior Notes due 2022, filed as an Exhibit to EXCO’s Current Report on Form 8-K, dated April 11, 2014 and filed on April 16, 2014 and incorporated by reference herein. |
| | |
| 4.5 | | Fourth Supplemental Indenture, dated May 12, 2014, by and among EXCO Resources, Inc., EXCO Land Company, LLC and Wilmington Trust Company, as trustee, filed as an Exhibit to EXCO's Quarterly Report on Form 10-Q for the Quarter Ended June 30, 2014 and filed on July 30, 2014 and incorporated by reference herein. |
| | |
| 4.6 | | Fifth Supplemental Indenture, dated November 24, 2015, by and among EXCO Resources, Inc., certain of its subsidiaries, and Wilmington Trust Company, as trustee, filed as an Exhibit to EXCO’s Current Report on Form 8-K, dated November 24, 2015 and filed on November 25, 2015 and incorporated by reference herein. |
| | |
| 4.7 | | Sixth Supplemental Indenture, dated August 9, 2016, by and among EXCO Resources, Inc., certain of its subsidiaries, and Wilmington Trust Company, as trustee, filed as an Exhibit to EXCO's Current Report on Form 8-K, dated August 9, 2016 and filed on August 10, 2016 and incorporated by reference herein. |
| | |
| 4.8 | | Instrument of Resignation, Appointment and Acceptance, dated as of December 15, 2017, by and among EXCO Resources, Inc., Wilmington Trust, National Association and Wilmington Savings Fund Society, FSB filed as an Exhibit to EXCO’s Current Report on Form 8-K, dated December 15, 2017 and filed December 21, 2017 and incorporated by reference herein. |
| | |
| 4.9 | | |
| | |
| 4.10 | | Indenture, dated as of March 15, 2017, by and among EXCO Resources, Inc., as issuer, certain of its subsidiaries, as guarantors, and Wilmington Trust, National Association, as trustee and collateral trustee, filed as an Exhibit to EXCO’s Current Report on Form 8-K, dated March 15, 2017 and filed on March 15, 2017 and incorporated by reference herein. |
| | |
| 4.11 | | First Supplemental Indenture, dated as of April 4, 2017, by and among EXCO Resources, Inc., as issuer, certain of its subsidiaries, as guarantors, and Wilmington Trust, National Association, as trustee and collateral trustee, filed on May 10, 2017 as an Exhibit to EXCO's Quarterly Report on Form 10-Q for the Quarter Ended March 31, 2017 and incorporated by reference herein. |
| | |
|
| | |
| 4.12 | | Second Supplemental Indenture, dated as of April 14, 2017, by and among EXCO Resources, Inc., as issuer, certain of its subsidiaries, as guarantors, and Wilmington Trust, National Association, as trustee and collateral trustee, filed on May 10, 2017 as an Exhibit to EXCO's Quarterly Report on Form 10-Q for the Quarter Ended March 31, 2017 and incorporated by reference herein. |
| | |
| 4.13 | | |
| | |
| 4.14 | | |
| | |
| 4.15 | | |
| | |
| 4.16 | | |
| | |
| 4.17 | | Joinder Agreement to Registration Rights Agreement, dated January 17, 2014, by and among EXCO Resources, Inc. and WLR IV Exco AIV One, L.P., WLR IV Exco AIV Two, L.P., WLR IV Exco AIV Three, L.P., WLR IV Exco AIV Four, L.P., WLR IV Exco AIV Five, L.P., WLR IV Exco AIV Six, L.P., WLR Select Co-Investment XCO AIV, L.P., WLR/GS Master Co-Investment XCO AIV, L.P. and WLR IV Parallel ESC, L.P, filed as an Exhibit to EXCO’s Current Report on Form 8-K (File No. 001-32743), dated January 17, 2014 and filed on January 21, 2014 and incorporated by reference herein. |
| | |
| 4.18 | | Joinder Agreement to Registration Rights Agreement, dated January 17, 2014, by and among EXCO Resources, Inc. and Advent Syndicate 780, Clearwater Insurance Company, Northbridge General Insurance Company, Odyssey Reinsurance Company, Clearwater Select Insurance Company, Riverstone Insurance Limited, Zenith Insurance Company and Fairfax Master Trust Fund, filed as an Exhibit to EXCO’s Current Report on Form 8-K (File No. 001-32743), dated January 17, 2014 and filed on January 21, 2014 and incorporated by reference herein. |
| | |
| 4.19 | | |
| | |
| 4.20 | | |
| | |
| 4.21 | | |
| | |
| 4.22 | | |
| | |
| 10.1 | | |
| | |
| 10.2 | | |
| | |
| 10.3 | | |
| | |
|
| | |
| 10.4 | | |
| | |
| 10.5 | | |
| | |
| 10.6 | | |
| | |
| 10.7 | | |
| | |
| 10.8 | | |
| | |
| 10.9 | | |
| | |
| 10.10 | | |
| | |
| 10.11 | | |
| | |
| 10.12 | | |
| | |
| 10.13 | | |
| | |
| 10.14 | | |
| | |
| 10.15 | | |
| | |
| 10.16 | | |
| | |
| 10.17 | | |
| | |
| 10.18 | | |
| | |
| 10.19 | | |
|
| | |
| | |
| 10.20 | | |
| | |
| 10.21 | | |
| | |
| 10.22 | | |
| | |
| 10.23 | | |
| | |
| 10.24 | | |
| | |
| 10.25 | | |
| | |
| 10.26 | | Joint Development Agreement, dated August 14, 2009, by and among BG US Production Company, LLC, EXCO Operating Company, LP and EXCO Production Company, LP, filed as an Exhibit to EXCO’s Current Report on Form 8-K (File No. 001-32743), dated August 11, 2009 and filed on August 17, 2009 and incorporated by reference herein. |
| | |
| 10.27 | | |
| | |
| 10.28 | | |
| | |
| 10.29 | | Joint Development Agreement, dated as of June 1, 2010, by and among EXCO Production Company (PA), LLC, EXCO Production Company (WV), LLC, BG Production Company, (PA), LLC, BG Production Company, (WV), LLC and EXCO Resources (PA), LLC, filed as an Exhibit to EXCO’s Current Report on Form 8-K (File No. 001-32743), dated June 1, 2010 and filed on June 7, 2010 and incorporated by reference herein. |
| | |
| 10.30 | | Amendment to Joint Development Agreement, dated February 4, 2011, by and among EXCO Production Company (PA), LLC, EXCO Production Company (WV), LLC, BG Production Company, (PA), LLC, BG Production Company, (WV), LLC and EXCO Resources (PA), LLC, filed as an Exhibit to EXCO’s Annual Report on Form 10-K (File No. 001-32743) for 2010 filed February 24, 2011 and incorporated by reference herein. |
| | |
| 10.31 | | Amendment to Joint Development Agreement, dated October 14, 2014, by and among EXCO Production Company (PA), LLC, EXCO Production Company (WV), LLC, BG Production Company, (PA), LLC, BG Production Company, (WV), LLC and EXCO Resources (PA), LLC, filed as an Exhibit to EXCO's Annual Report on Form 10-K for 2014 filed on February 25, 2015 and incorporated by reference herein. |
| | |
| 10.32 | | Second Amended and Restated Limited Liability Company Agreement of EXCO Resources (PA), LLC, dated June 1, 2010, by and among EXCO Holding (PA), Inc., BG US Production Company, LLC and EXCO Resources (PA), LLC, filed as an Exhibit to EXCO’s Current Report on Form 8-K (File No. 001-32743), dated June 1, 2010 and filed on June 7, 2010 and incorporated by reference herein. |
| | |
| 10.33 | | Amendment to Second Amended and Restated Limited Liability Company Agreement of EXCO Resources (PA), LLC, dated October 14, 2014, by and among EXCO Holding (PA), Inc., BG US Production Company, LLC and EXCO Resources (PA), LLC, filed as an Exhibit to EXCO's Annual Report on Form 10-K for 2014 filed on February 25, 2015 and incorporated by reference herein. |
| | |
|
| | |
| 10.34 | | Second Amended and Restated Limited Liability Company Agreement of Appalachia Midstream, LLC, dated June 1, 2010, by and among EXCO Holding (PA), Inc., BG US Production Company, LLC and Appalachia Midstream, LLC, filed as an Exhibit to EXCO’s Current Report on Form 8-K (File No. 001-32743), dated June 1, 2010 and filed on June 7, 2010 and incorporated by reference herein. |
| | |
| 10.35 | | Amendment to Second Amended and Restated Limited Liability Company Agreement of Appalachia Midstream, LLC (n/k/a EXCO Appalachia Midstream, LLC), dated October 14, 2014, by and among EXCO Holding (PA), Inc., BG US Production Company, LLC and EXCO Appalachia Midstream, LLC, filed as an Exhibit to EXCO's Annual Report on Form 10-K for 2014 filed on February 25, 2015 and incorporated by reference herein. |
| | |
| 10.36 | | Letter Agreement, dated June 1, 2010 and effective as of May 9, 2010, by and between EXCO Holding (PA), Inc. and BG US Production Company, LLC, filed as an Exhibit to EXCO’s Current Report on Form 8-K (File No. 001-32743), dated June 1, 2010 and filed on June 7, 2010 and incorporated by reference herein. |
| | |
| 10.37 | | Guaranty, dated May 9, 2010, by BG Energy Holdings Limited in favor of EXCO Holding (PA), Inc., EXCO Production Company (PA), LLC and EXCO Production Company (WV), LLC, filed as an Exhibit to EXCO’s Current Report on Form 8-K (File No. 001-32743), dated June 1, 2010 and filed on June 7, 2010 and incorporated by reference herein. |
| | |
| 10.38 | | |
| | |
| 10.39 | | Guaranty, dated June 1, 2010, by BG North America, LLC in favor of (i) EXCO Production Company (PA), LLC, EXCO Production Company (WV), LLC and EXCO Resources (PA), LLC; and (ii) EXCO Resources (PA), LLC and EXCO Holding (PA), Inc, filed as an Exhibit to EXCO’s Current Report on Form 8-K (File No. 001-32743), dated June 1, 2010 and filed on June 7, 2010 and incorporated by reference herein. |
| | |
| 10.40 | | Forbearance Agreement, dated as of December 20, 2017, by and among EXCO Resources, Inc., the subsidiary guarantors party thereto, JPMorgan Chase Bank, N.A., as administrative agent and the RBL Supporting Lenders filed as an Exhibit to EXCO’s Current Report on Form 8-K, dated December 15, 2017 filed December 21, 2017 and incorporated by reference herein. |
| | |
| 10.41 | | Limited Consent, dated as of September 1, 2016, among EXCO Resources, Inc., as Borrower, certain subsidiaries of Borrower, as Guarantors, the lender parties thereto, and JPMorgan Chase Bank, N.A., as Administrative Agent, filed as an Exhibit to EXCO’s Quarterly Report on Form 10-Q for the Quarter Ended September 30, 2016 filed on November 2, 2016 and incorporated by reference herein. |
| | |
| 10.42 | | Limited Consent, dated as of December 30, 2016, among EXCO Resources, Inc., as Borrower, certain subsidiaries of Borrower, as Guarantors, the lender parties thereto, and JPMorgan Chase Bank, N.A., as Administrative Agent, filed as an Exhibit to EXCO's Current Report on Form 8- K, dated as of December 30, 2016 and filed on January 6, 2017 and incorporated by reference herein. |
| | |
| 10.43 | | Term Loan Credit Agreement, dated as of October 19, 2015, by and among EXCO Resources, Inc., as Borrower, certain subsidiaries of Borrower, as Guarantors, the lenders party thereto, and Wilmington Trust, National Association, as Administrative Agent and Collateral Trustee, filed as an Exhibit to EXCO’s Current Report on Form 8-K, dated as of October 19, 2015 and filed on October 22, 2015 and incorporated by reference herein. |
| | |
| 10.44 | | |
| | |
| 10.45 | | First Amendment to Term Loan Credit Agreement, dated as of March 15, 2017, by and among EXCO Resources, Inc., as borrower, certain subsidiaries of borrower, as guarantors, the lenders party thereto, and Wilmington Trust, National Association, as administrative agent and collateral trustee, filed as an Exhibit to EXCO’s Current Report on Form 8-K, dated March 15, 2017 and filed on March 15, 2017 and incorporated by reference herein. |
| | |
| 10.46 | | 1.75 Lien Term Loan Credit Agreement, dated as of March 15, 2017, by and among EXCO Resources, Inc., as borrower, certain subsidiaries of borrower, as guarantors, the lenders party thereto, and Wilmington Trust, National Association, as administrative agent and collateral trustee, filed as an Exhibit to EXCO’s Current Report on Form 8-K, dated March 15, 2017 and filed on March 15, 2017 and incorporated by reference herein. |
| | |
|
| | |
| 10.47 | | First Amendment to 1.75 Lien Term Loan Credit Agreement, dated as of April 4, 2017, by and among EXCO Resources, Inc., as borrower, certain subsidiaries of borrower, as guarantors, the lenders party thereto, and Wilmington Trust, National Association, as administrative agent and collateral trustee, filed on May 10, 2017 as an Exhibit to EXCO's Quarterly Report on Form 10-Q for the Quarter Ended March 31, 2017 and incorporated by reference herein. |
| | |
| 10.48 | | Second Amendment to 1.75 Lien Term Loan Credit Agreement, dated as of April 14, 2017, by and among EXCO Resources, Inc., as borrower, certain subsidiaries of borrower, as guarantors, the lenders party thereto, and Wilmington Trust, National Association, as administrative agent and collateral trustee, filed on May 10, 2017 as an Exhibit to EXCO's Quarterly Report on Form 10-Q for the Quarter Ended March 31, 2017 and incorporated by reference herein. |
| | |
| 10.49 | | |
| | |
| 10.50 | | |
| | |
| 10.51 | | Intercreditor Agreement, dated as of October 26, 2015 and amended as of March 15, 2017, by and among EXCO Resources, Inc., JPMorgan Chase Bank, N.A., as original priority lien agent, and Wilmington Trust, National Association, as second lien collateral trustee and original third lien collateral agent, filed as an Exhibit to EXCO’s Current Report on Form 8-K, dated March 15, 2017 and filed on March 15, 2017 and incorporated by reference herein. |
| | |
| 10.52 | | Amended and Restated Collateral Trust Agreement, dated as of October 26, 2015 and amended and restated as of March 15, 2017, by and among EXCO Resources, Inc., the grantors and guarantors from time to time party thereto, Wilmington Trust, National Association, as administrative agent and collateral trustee, and the other parity lien debt representatives from time to time party thereto, filed as an Exhibit to EXCO’s Current Report on Form 8-K, dated March 15, 2017 and filed on March 15, 2017 and incorporated by reference herein. |
| | |
| 10.53 | | Collateral Trust Agreement, dated as of March 15, 2017, by and among EXCO Resources, Inc., the grantors and guarantors from time to time party thereto, Wilmington Trust, National Association, as trustee under the second lien indenture and collateral trustee, and the other parity lien debt representatives from time to time party thereto, filed as an Exhibit to EXCO’s Current Report on Form 8-K, dated March 15, 2017 and filed on March 15, 2017 and incorporated by reference herein. |
| | |
| 10.54 | | 1.5 Lien Note Purchase Agreement, dated as of March 15, 2017, by and among EXCO Resources, Inc., certain of its subsidiaries, and the purchaser signatories thereto, filed as an Exhibit to EXCO’s Current Report on Form 8-K, dated March 15, 2017 and filed on March 15, 2017 and incorporated by reference herein. |
| | |
| 10.55 | | Second Lien Term Loan Purchase Agreement, dated as of March 15, 2017, by and among EXCO Resources, Inc., Hamblin Watsa Investment Counsel Ltd., as administrative agent under the Fairfax Second Lien Credit Agreement, Wilmington Trust, National Association, as administrative agent under the Exchange Second Lien Credit Agreement, and each of the other undersigned parties thereto, filed as an Exhibit to EXCO’s Current Report on Form 8-K, dated March 15, 2017 and filed on March 15, 2017 and incorporated by reference herein. |
| | |
| 10.56 | | Amended and Restated Participation Agreement, dated July 25, 2016, by and among Admiral A Holding L.P., TE Admiral A Holding L.P., Colt Admiral A Holding L.P. and EXCO Operating Company, LP., filed as an Exhibit to EXCO’s Current Report on Form 8-K, dated July 25, 2016 and filed on July 27, 2016 and incorporated by reference herein. |
| | |
| 10.57 | | |
| | |
| 10.58 | | MVC Letter Agreement, dated November 15, 2013, among BG US Production Company, LLC, BG US Gathering Company, LLC, EXCO Operating Company, LP, Azure Midstream Energy LLC (formerly known as TGGT Holdings, LLC) and TGG Pipeline, Ltd, filed as an Exhibit to EXCO’s Current Report on Form 8-K (File No. 001-32743), dated November 15, 2013 and filed on November 21, 2013 and incorporated by reference herein. |
| | |
|
| | |
| 10.59 | | |
| | |
| 10.60 | | |
| | |
| 10.61 | | |
| | |
| 10.62 | | |
| | |
| 10.63 | | |
| | |
| 10.64 | | |
| | |
| 10.65 | | |
| | |
| 10.66 | | |
| | |
| 10.67 | | Debtor-In-Possession Credit Agreement, dated as of January 22, 2018, among EXCO Resources, Inc., the Lenders party thereto, and Hamblin Watsa Investment Counsel Ltd., as Administrative Agent filed as an Exhibit to EXCO’s Current Report on Form 8-K, dated January 19, 2018 filed January 25, 2018 and incorporated by reference herein. |
| | |
| 10.68 | | Agreement Regarding Settlement, dated January 29, 2018, by and among EXCO Resources, Inc., EXCO Holding (PA), Inc., EXCO Resources (PA), LLC, EXCO Production Company (PA), LLC, EXCO Production Company (WV), LLC, EXCO Operating Company, LP, EXCO Appalachia Midstream, LLC, BG US Production Company, LLC, BG North America, LLC, BG Production Company (PA), LLC, BG Production Company (WV), LLC and SWEPI LP filed as an Exhibit to EXCO’s Current Report on Form 8-K, dated February 22, 2018 filed March 1, 2018 and incorporated by reference herein. |
| | |
| 10.69 | | Settlement Agreement and Mutual Release, dated February 27, 2018, by and among EXCO Holding (PA), Inc., EXCO Production Company (PA), LLC, EXCO Production Company (WV), LLC, EXCO Resources (PA), LLC, BG Production Company (PA), LLC, BG Production Company (WV), LLC and SWEPI LP filed as an Exhibit to EXCO’s Current Report on Form 8-K, dated February 22, 2018 filed March 1, 2018 and incorporated by reference herein. |
| | |
| 10.70 | | Membership Interest (BG PA) Transfer Agreement, dated February 27, 2018, by and among BG US Production Company, LLC, BG Production Company (PA), LLC and EXCO Production Company (PA), LLC filed as an Exhibit to EXCO’s Current Report on Form 8-K, dated February 22, 2018 filed March 1, 2018 and incorporated by reference herein. |
| | |
| 10.71 | | Membership Interest (BG WV) Transfer Agreement, dated February 27, 2018, by and among BG US Production Company, LLC, BG Production Company (WV), LLC and EXCO Production Company (WV), LLC filed as an Exhibit to EXCO’s Current Report on Form 8-K, dated February 22, 2018 filed March 1, 2018 and incorporated by reference herein. |
| | |
|
| | |
| 10.72 | | Membership Interest (ERPA) Transfer Agreement, dated February 27, 2018, by and among BG US Production Company, LLC, EXCO Resources (PA), LLC and EXCO Holding (PA), Inc. filed as an Exhibit to EXCO’s Current Report on Form 8-K, dated February 22, 2018 filed March 1, 2018 and incorporated by reference herein. |
| | |
| 10.73 | | Membership Interest (Midstream) Transfer Agreement, dated February 27, 2018, by and among BG US Production Company, LLC, EXCO Appalachia Midstream, LLC and EXCO Holding (PA), Inc. filed as an Exhibit to EXCO’s Current Report on Form 8-K, dated February 22, 2018 filed March 1, 2018 and incorporated by reference herein. |
| | |
| 10.74 | | Termination and Release Agreement, dated February 27, 2018, by and among BG US Production Company, LLC, BG North America, LLC, BG Production Company (PA), LLC, BG Production Company (WV), LLC, EXCO Resources, Inc., EXCO Holding (PA), Inc., EXCO Resources (PA), LLC, EXCO Production Company (PA), LLC, EXCO Production Company (WV), LLC, EXCO Operating Company, LP and EXCO Appalachia Midstream, LLC. filed as an Exhibit to EXCO’s Current Report on Form 8-K, dated February 22, 2018 filed March 1, 2018 and incorporated by reference herein. |
| | |
| 21.1 | | |
| | |
| 31.1 | | |
| | |
| 31.2 | | |
| | |
| 32.1 | | |
| | |
| 99.1 | | |
| | |
| 99.2 | | |
| | |
| 101.INS | | XBRL Instance Document. |
| | |
| 101.SCH | | XBRL Taxonomy Extension Schema Document. |
| | |
| 101.CAL | | XBRL Taxonomy Calculation Linkbase Document. |
| | |
| 101.DEF | | XBRL Taxonomy Definition Linkbase Document. |
| | |
| 101.LAB | | XBRL Taxonomy Label Linkbase Document. |
| | |
| 101.PRE | | XBRL Taxonomy Presentation Linkbase Document. |
| | |
| * | | These exhibits are management contracts. |
(b) Exhibits
See "Index to Exhibits" for a description of our exhibits.Item 15 (a)(3) above.
(c) Financial Statement Schedules
None.
Item 16. Form 10-K Summary
None.
SIGNATURES
Pursuant to the requirements of Section 13 or 15(d) of the Securities Exchange Act of 1934, the registrant has duly caused this report to be signed on its behalf by the undersigned thereunto duly authorized.
|
| | | |
| Date: | March 15, 201818, 2019 | | EXCO RESOURCES, INC. |
| | | | (Registrant) |
| | | | |
| | | | /s/ Harold L. Hickey |
| | | | Harold L. Hickey |
| | | | Chief Executive Officer and President |
| | | | (Principal Executive Officer) |
| | | | |
| | | | |
Pursuant to the requirements of the Securities Exchange Act of 1934, this report has been signed below by the following persons on behalf of the registrant and in the capacities and on the dates indicated. |
| | | |
| | | | |
| Date: | March 15, 201818, 2019 | | /s/ Harold L. Hickey |
| | | | Harold L. Hickey |
| | | | Chief Executive Officer and President |
| | | | (Principal Executive Officer) |
| | | | |
| | | | /s/ Tyler S. Farquharson |
| | | | Tyler S. Farquharson |
| | | | Vice President, Chief Financial Officer and Treasurer |
| | | | (Principal Financial Officer) |
| | | | |
| | | | /s/ Brian N. Gaebe |
| | | | Brian N. Gaebe |
| | | | Chief Accounting Officer and Corporate Controller |
| | | | (Principal Accounting Officer) |
| | | | |
| | | | /s/ Anthony R. Horton |
| | | | Anthony R. Horton |
| | | | Director |
| | | | |
| | | | /s/ Randall E. King |
| | | | Randall E. King |
| | | | Director |
| | | | |
| | | | /s/ Robert L. Stillwell |
| | | | Robert L. Stillwell |
| | | | Director |
INDEX TO EXHIBITS
|
| |
Exhibit | |
Number | Description of Exhibits |
| |
2.1# | |
| |
2.2# | |
| |
2.3# | |
| |
2.4# | |
| |
3.1 | |
| |
3.2 | |
| |
4.1 | |
| |
4.2 | First Supplemental Indenture, dated September 15, 2010, by and among EXCO Resources, Inc., certain of its subsidiaries and Wilmington Trust Company, as trustee, including the form of 7.500% Senior Notes due 2018, filed as an Exhibit to EXCO’s Current Report on Form 8-K (File No. 001-32743), dated September 10, 2010 and filed on September 15, 2010 and incorporated by reference herein. |
| |
4.3 | Second Supplemental Indenture, dated as of February 12, 2013, by and among EXCO Resources, Inc., EXCO/HGI JV Assets, LLC, EXCO Holding MLP, Inc. and Wilmington Trust Company, as trustee, filed as an Exhibit to EXCO's Current Report on Form 8-K (File No. 001-32743), dated February 12, 2013 and filed on February 19, 2013 and incorporated by reference herein. |
| |
4.4 | Third Supplemental Indenture, dated April 16, 2014, by and among EXCO Resources, Inc., certain of its subsidiaries and Wilmington Trust Company, as trustee, including the form of 8.500% Senior Notes due 2022, filed as an Exhibit to EXCO’s Current Report on Form 8-K, dated April 11, 2014 and filed on April 16, 2014 and incorporated by reference herein. |
| |
4.5 | Fourth Supplemental Indenture, dated May 12, 2014, by and among EXCO Resources, Inc., EXCO Land Company, LLC and Wilmington Trust Company, as trustee, filed as an Exhibit to EXCO's Quarterly Report on Form 10-Q for the Quarter Ended June 30, 2014 and filed on July 30, 2014 and incorporated by reference herein. |
| |
4.6 | Fifth Supplemental Indenture, dated November 24, 2015, by and among EXCO Resources, Inc., certain of its subsidiaries, and Wilmington Trust Company, as trustee, filed as an Exhibit to EXCO’s Current Report on Form 8-K, dated November 24, 2015 and filed on November 25, 2015 and incorporated by reference herein. |
| |
4.7 | Sixth Supplemental Indenture, dated August 9, 2016, by and among EXCO Resources, Inc., certain of its subsidiaries, and Wilmington Trust Company, as trustee, filed as an Exhibit to EXCO's Current Report on Form 8-K, dated August 9, 2016 and filed on August 10, 2016 and incorporated by reference herein. |
| |
|
| |
4.8 | Instrument of Resignation, Appointment and Acceptance, dated as of December 15, 2017, by and among EXCO Resources, Inc., Wilmington Trust, National Association and Wilmington Savings Fund Society, FSB filed as an Exhibit to EXCO’s Current Report on Form 8-K, dated December 15, 2017 filed December 21, 2017 and incorporated by reference herein. |
| |
4.9 | |
| |
4.10 | Indenture, dated as of March 15, 2017, by and among EXCO Resources, Inc., as issuer, certain of its subsidiaries, as guarantors, and Wilmington Trust, National Association, as trustee and collateral trustee, filed as an Exhibit to EXCO’s Current Report on Form 8-K, dated March 15, 2017 and filed on March 15, 2017 and incorporated by reference herein. |
| |
4.11 | First Supplemental Indenture, dated as of April 4, 2017, by and among EXCO Resources, Inc., as issuer, certain of its subsidiaries, as guarantors, and Wilmington Trust, National Association, as trustee and collateral trustee, filed on May 10, 2017 as an Exhibit to EXCO's Quarterly Report on Form 10-Q for the Quarter Ended March 31, 2017 and incorporated by reference herein. |
| |
4.12 | Second Supplemental Indenture, dated as of April 14, 2017, by and among EXCO Resources, Inc., as issuer, certain of its subsidiaries, as guarantors, and Wilmington Trust, National Association, as trustee and collateral trustee, filed on May 10, 2017 as an Exhibit to EXCO's Quarterly Report on Form 10-Q for the Quarter Ended March 31, 2017 and incorporated by reference herein. |
| |
4.13 | |
| |
4.14 | |
| |
4.15 | |
| |
4.16 | |
| |
4.17 | Joinder Agreement to Registration Rights Agreement, dated January 17, 2014, by and among EXCO Resources, Inc. and WLR IV Exco AIV One, L.P., WLR IV Exco AIV Two, L.P., WLR IV Exco AIV Three, L.P., WLR IV Exco AIV Four, L.P., WLR IV Exco AIV Five, L.P., WLR IV Exco AIV Six, L.P., WLR Select Co-Investment XCO AIV, L.P., WLR/GS Master Co-Investment XCO AIV, L.P. and WLR IV Parallel ESC, L.P, filed as an Exhibit to EXCO’s Current Report on Form 8-K, dated January 17, 2014 and filed on January 21, 2014 and incorporated by reference herein. |
| |
4.18 | Joinder Agreement to Registration Rights Agreement, dated January 17, 2014, by and among EXCO Resources, Inc. and Advent Syndicate 780, Clearwater Insurance Company, Northbridge General Insurance Company, Odyssey Reinsurance Company, Clearwater Select Insurance Company, Riverstone Insurance Limited, Zenith Insurance Company and Fairfax Master Trust Fund, filed as an Exhibit to EXCO’s Current Report on Form 8-K, dated January 17, 2014 and filed on January 21, 2014 and incorporated by reference herein. |
| |
4.19 | |
| |
4.20 | |
| |
|
| |
4.21 | |
| |
4.22 | |
| |
4.23 | |
| |
10.1 | |
| |
10.2 | |
| |
10.3 | |
| |
10.4 | |
| |
10.5 | |
| |
10.6 | |
| |
10.7 | |
| |
10.8 | |
| |
10.9 | |
| |
10.10 | |
| |
10.11 | |
| |
10.12 | |
| |
10.13 | |
| |
|
| |
10.14 | |
| |
10.15 | |
| |
10.16 | |
| |
10.17 | |
| |
10.18 | |
| |
10.19 | |
| |
10.20 | |
| |
10.21 | |
| |
10.22 | |
| |
10.23 | |
| |
10.24 | |
| |
10.25 | Joint Development Agreement, dated August 14, 2009, by and among BG US Production Company, LLC, EXCO Operating Company, LP and EXCO Production Company, LP, filed as an Exhibit to EXCO’s Current Report on Form 8-K (File No. 001-32743), dated August 11, 2009 and filed on August 17, 2009 and incorporated by reference herein. |
| |
10.26 | |
| |
10.27 | |
| |
10.28 | Joint Development Agreement, dated as of June 1, 2010, by and among EXCO Production Company (PA), LLC, EXCO Production Company (WV), LLC, BG Production Company, (PA), LLC, BG Production Company, (WV), LLC and EXCO Resources (PA), LLC, filed as an Exhibit to EXCO’s Current Report on Form 8-K (File No. 001-32743), dated June 1, 2010 and filed on June 7, 2010 and incorporated by reference herein. |
| |
|
| |
10.29 | Amendment to Joint Development Agreement, dated February 4, 2011, by and among EXCO Production Company (PA), LLC, EXCO Production Company (WV), LLC, BG Production Company, (PA), LLC, BG Production Company, (WV), LLC and EXCO Resources (PA), LLC, filed as an Exhibit to EXCO’s Annual Report on Form 10-K (File No. 001-32743) for 2010 filed February 24, 2011 and incorporated by reference herein. |
| |
10.30 | Amendment to Joint Development Agreement, dated October 14, 2014, by and among EXCO Production Company (PA), LLC, EXCO Production Company (WV), LLC, BG Production Company, (PA), LLC, BG Production Company, (WV), LLC and EXCO Resources (PA), LLC, filed as an Exhibit to EXCO's Annual Report on Form 10-K for 2014 filed on February 25, 2015 and incorporated by reference herein. |
| |
10.31 | Second Amended and Restated Limited Liability Company Agreement of EXCO Resources (PA), LLC, dated June 1, 2010, by and among EXCO Holding (PA), Inc., BG US Production Company, LLC and EXCO Resources (PA), LLC, filed as an Exhibit to EXCO’s Current Report on Form 8-K (File No. 001-32743), dated June 1, 2010 and filed on June 7, 2010 and incorporated by reference herein. |
| |
10.32 | Amendment to Second Amended and Restated Limited Liability Company Agreement of EXCO Resources (PA), LLC, dated October 14, 2014, by and among EXCO Holding (PA), Inc., BG US Production Company, LLC and EXCO Resources (PA), LLC, filed as an Exhibit to EXCO's Annual Report on Form 10-K for 2014 filed on February 25, 2015 and incorporated by reference herein. |
| |
10.33 | Second Amended and Restated Limited Liability Company Agreement of Appalachia Midstream, LLC, dated June 1, 2010, by and among EXCO Holding (PA), Inc., BG US Production Company, LLC and Appalachia Midstream, LLC, filed as an Exhibit to EXCO’s Current Report on Form 8-K (File No. 001-32743), dated June 1, 2010 and filed on June 7, 2010 and incorporated by reference herein. |
| |
10.34 | Amendment to Second Amended and Restated Limited Liability Company Agreement of Appalachia Midstream, LLC (n/k/a EXCO Appalachia Midstream, LLC), dated October 14, 2014, by and among EXCO Holding (PA), Inc., BG US Production Company, LLC and EXCO Appalachia Midstream, LLC, filed as an Exhibit to EXCO's Annual Report on Form 10-K for 2014 filed on February 25, 2015 and incorporated by reference herein. |
| |
10.35 | Letter Agreement, dated June 1, 2010 and effective as of May 9, 2010, by and between EXCO Holding (PA), Inc. and BG US Production Company, LLC, filed as an Exhibit to EXCO’s Current Report on Form 8-K (File No. 001-32743), dated June 1, 2010 and filed on June 7, 2010 and incorporated by reference herein. |
| |
10.36 | Guaranty, dated May 9, 2010, by BG Energy Holdings Limited in favor of EXCO Holding (PA), Inc., EXCO Production Company (PA), LLC and EXCO Production Company (WV), LLC, filed as an Exhibit to EXCO’s Current Report on Form 8-K (File No. 001-32743), dated June 1, 2010 and filed on June 7, 2010 and incorporated by reference herein. |
| |
10.37 | |
| |
10.38 | Guaranty, dated June 1, 2010, by BG North America, LLC in favor of (i) EXCO Production Company (PA), LLC, EXCO Production Company (WV), LLC and EXCO Resources (PA), LLC; and (ii) EXCO Resources (PA), LLC and EXCO Holding (PA), Inc, filed as an Exhibit to EXCO’s Current Report on Form 8-K (File No. 001-32743), dated June 1, 2010 and filed on June 7, 2010 and incorporated by reference herein. |
| |
10.39 | Guaranty, dated June 1, 2010, by EXCO Resources, Inc., in favor of: (i) BG Production Company (PA), LLC, BG Production Company (WV), LLC and EXCO Resources (PA), LLC; and (ii) EXCO Resources (PA), LLC and BG US Production Company, LLC, filed as an Exhibit to EXCO’s Current Report on Form 8-K (File No. 001-32743), dated June 1, 2010 and filed on June 7, 2010 and incorporated by reference herein. |
| |
10.40 | Amended and Restated Credit Agreement, dated as of July 31, 2013, among EXCO Resources, Inc., as Borrower, certain subsidiaries of Borrower, as Guarantors, the lender parties thereto, and JPMorgan Chase Bank, N.A., as Administrative Agent, filed as an Exhibit to EXCO's Current Report on Form 8-K, dated as of August 19, 2013 and filed on August 23, 2013 and incorporated by reference herein. |
| |
10.41 | First Amendment to Amended and Restated Credit Agreement, dated as of August 28, 2013, among EXCO Resources, Inc., as Borrower, certain subsidiaries of Borrower, as Guarantors, the lender parties thereto, and JPMorgan Chase Bank, N.A., as Administrative Agent, filed as an Exhibit to EXCO's Current Report on Form 8-K, dated as of August 28, 2013 and filed on September 4, 2013 and incorporated by reference herein. |
|
| |
| |
10.42 | Second Amendment to Amended and Restated Credit Agreement, dated as of July 14, 2014, by and among EXCO Resources, Inc., as Borrower, certain subsidiaries of Borrower, as Guarantors, the Lenders party thereto, and JPMorgan Chase Bank, N.A., as Administrative Agent, filed as an Exhibit to EXCO's Current Report on Form 8-K, dated as of July 14, 2014 and filed on July 18, 2014 and incorporated by reference herein. |
| |
10.43 | Third Amendment to Amended and Restated Credit Agreement, dated as of October 21, 2014, by and among EXCO Resources, Inc., as Borrower, certain subsidiaries of Borrower, as Guarantors, the Lenders party thereto, and JPMorgan Chase Bank, N.A., as Administrative Agent, filed as an Exhibit to EXCO’s Current Report on Form 8-K, dated October 21, 2014 and filed on October 27, 2014 and incorporated by reference herein. |
| |
10.44 | Fourth Amendment to Amended and Restated Credit Agreement, dated as of February 6, 2015, among EXCO Resources, Inc., as Borrower, certain subsidiaries of Borrower, as Guarantors, the lender parties thereto, and JPMorgan Chase Bank, N.A., as Administrative Agent, filed as an Exhibit to EXCO's Current Report Form 8-K, dated as of February 6, 2015 and filed on February 12, 2015 and incorporated by reference herein. |
| |
10.45 | Fifth Amendment to Amended and Restated Credit Agreement, dated July 27, 2015, among EXCO Resources, Inc., as Borrower, certain subsidiaries of Borrower, as Guarantors, the lender parties thereto, and JPMorgan Chase Bank, N.A., as Administrative Agent, filed as an Exhibit to EXCO's Current Report on Form 8-K, dated as of July 27, 2015 and filed July 28, 2015 and incorporated by reference herein. |
| |
10.46 | Sixth Amendment to Amended and Restated Credit Agreement, dated as of October 19, 2015, among EXCO Resources, Inc., as Borrower, certain subsidiaries of Borrower, as Guarantors, the lender parties thereto, and JPMorgan Chase Bank, N.A., as Administrative Agent, filed as an Exhibit to EXCO's Current Report on Form 8-K, dated as of October 19, 2015 and filed on October 22, 2015 and incorporated by reference herein. |
| |
10.47 | Seventh Amendment to Amended and Restated Credit Agreement, dated as of March 15, 2017, among EXCO Resources, Inc., as borrower, certain subsidiaries of borrower, as guarantors, the lender parties thereto, and JPMorgan Chase Bank, N.A., as administrative agent, filed as an Exhibit to EXCO’s Current Report on Form 8-K, dated March 15, 2017 and filed on March 15, 2017 and incorporated by reference herein. |
| |
10.48 | Eighth Amendment to Amended and Restated Credit Agreement, dated as of September 29, 2017, by and among EXCO Resources, Inc., certain of its subsidiaries, JPMorgan Chase Bank, N.A., as administrative agent, and the lenders party thereto, filed as an Exhibit to EXCO’s Current Report on Form 8-K, dated as of September 29, 2017 and filed on October 5, 2017 and incorporated by reference herein. |
| |
10.49 | Ninth Amendment to Amended and Restated Credit Agreement, dated as of November 20, 2017, among EXCO Resources, Inc., as borrower, certain subsidiaries of borrower, as guarantors, the lender parties thereto, and JPMorgan Chase Bank, N.A., as administrative agent, filed as an Exhibit to EXCO’s Current Report on Form 8-K, dated November 20, 2017 and filed on November 27, 2017 and incorporated by reference herein. |
| |
10.50 | Forbearance Agreement, dated as of December 20, 2017, by and among EXCO Resources, Inc., the subsidiary guarantors party thereto, JPMorgan Chase Bank, N.A., as administrative agent and the RBL Supporting Lenders filed as an Exhibit to EXCO’s Current Report on Form 8-K, dated December 15, 2017 filed December 21, 2017 and incorporated by reference herein. |
| |
10.51 | Limited Consent, dated as of September 1, 2016, among EXCO Resources, Inc., as Borrower, certain subsidiaries of Borrower, as Guarantors, the lender parties thereto, and JPMorgan Chase Bank, N.A., as Administrative Agent, filed as an Exhibit to EXCO’s Quarterly Report on Form 10-Q for the Quarter Ended September 30, 2016 filed on November 2, 2016 and incorporated by reference herein. |
| |
10.52 | Limited Consent, dated as of December 30, 2016, among EXCO Resources, Inc., as Borrower, certain subsidiaries of Borrower, as Guarantors, the lender parties thereto, and JPMorgan Chase Bank, N.A., as Administrative Agent, filed as an Exhibit to EXCO's Current Report on Form 8- K, dated as of December 30, 2016 and filed on January 6, 2017 and incorporated by reference herein. |
| |
10.53 | Term Loan Credit Agreement, dated as of October 19, 2015, by and among EXCO Resources, Inc., as Borrower, certain subsidiaries of Borrower, as Guarantors, the lenders party thereto, and Wilmington Trust, National Association, as Administrative Agent and Collateral Trustee, filed as an Exhibit to EXCO’s Current Report on Form 8-K, dated as of October 19, 2015 and filed on October 22, 2015 and incorporated by reference herein. |
| |
10.54 | |
|
| |
| |
10.55 | First Amendment to Term Loan Credit Agreement, dated as of March 15, 2017, by and among EXCO Resources, Inc., as borrower, certain subsidiaries of borrower, as guarantors, the lenders party thereto, and Wilmington Trust, National Association, as administrative agent and collateral trustee, filed as an Exhibit to EXCO’s Current Report on Form 8-K, dated March 15, 2017 and filed on March 15, 2017 and incorporated by reference herein. |
| |
10.56 | 1.75 Lien Term Loan Credit Agreement, dated as of March 15, 2017, by and among EXCO Resources, Inc., as borrower, certain subsidiaries of borrower, as guarantors, the lenders party thereto, and Wilmington Trust, National Association, as administrative agent and collateral trustee, filed as an Exhibit to EXCO’s Current Report on Form 8-K, dated March 15, 2017 and filed on March 15, 2017 and incorporated by reference herein. |
| |
10.57 | First Amendment to 1.75 Lien Term Loan Credit Agreement, dated as of April 4, 2017, by and among EXCO Resources, Inc., as borrower, certain subsidiaries of borrower, as guarantors, the lenders party thereto, and Wilmington Trust, National Association, as administrative agent and collateral trustee, filed on May 10, 2017 as an Exhibit to EXCO's Quarterly Report on Form 10-Q for the Quarter Ended March 31, 2017 and incorporated by reference herein. |
| |
10.58 | Second Amendment to 1.75 Lien Term Loan Credit Agreement, dated as of April 14, 2017, by and among EXCO Resources, Inc., as borrower, certain subsidiaries of borrower, as guarantors, the lenders party thereto, and Wilmington Trust, National Association, as administrative agent and collateral trustee, filed on May 10, 2017 as an Exhibit to EXCO's Quarterly Report on Form 10-Q for the Quarter Ended March 31, 2017 and incorporated by reference herein. |
| |
10.59 | |
| |
10.60 | |
| |
10.61 | Intercreditor Agreement, dated as of October 26, 2015 and amended as of March 15, 2017, by and among EXCO Resources, Inc., JPMorgan Chase Bank, N.A., as original priority lien agent, and Wilmington Trust, National Association, as second lien collateral trustee and original third lien collateral agent, filed as an Exhibit to EXCO’s Current Report on Form 8-K, dated March 15, 2017 and filed on March 15, 2017 and incorporated by reference herein. |
| |
10.62 | Amended and Restated Collateral Trust Agreement, dated as of October 26, 2015 and amended and restated as of March 15, 2017, by and among EXCO Resources, Inc., the grantors and guarantors from time to time party thereto, Wilmington Trust, National Association, as administrative agent and collateral trustee, and the other parity lien debt representatives from time to time party thereto, filed as an Exhibit to EXCO’s Current Report on Form 8-K, dated March 15, 2017 and filed on March 15, 2017 and incorporated by reference herein. |
| |
10.63 | Collateral Trust Agreement, dated as of March 15, 2017, by and among EXCO Resources, Inc., the grantors and guarantors from time to time party thereto, Wilmington Trust, National Association, as trustee under the second lien indenture and collateral trustee, and the other parity lien debt representatives from time to time party thereto, filed as an Exhibit to EXCO’s Current Report on Form 8-K, dated March 15, 2017 and filed on March 15, 2017 and incorporated by reference herein. |
| |
10.64 | 1.5 Lien Note Purchase Agreement, dated as of March 15, 2017, by and among EXCO Resources, Inc., certain of its subsidiaries, and the purchaser signatories thereto, filed as an Exhibit to EXCO’s Current Report on Form 8-K, dated March 15, 2017 and filed on March 15, 2017 and incorporated by reference herein. |
| |
10.65 | Second Lien Term Loan Purchase Agreement, dated as of March 15, 2017, by and among EXCO Resources, Inc., Hamblin Watsa Investment Counsel Ltd., as administrative agent under the Fairfax Second Lien Credit Agreement, Wilmington Trust, National Association, as administrative agent under the Exchange Second Lien Credit Agreement, and each of the other undersigned parties thereto, filed as an Exhibit to EXCO’s Current Report on Form 8-K, dated March 15, 2017 and filed on March 15, 2017 and incorporated by reference herein. |
| |
10.66 | Amended and Restated Participation Agreement, dated July 25, 2016, by and among Admiral A Holding L.P., TE Admiral A Holding L.P., Colt Admiral A Holding L.P. and EXCO Operating Company, LP., filed as an Exhibit to EXCO’s Current Report on Form 8-K, dated July 25, 2016 and filed on July 27, 2016 and incorporated by reference herein. |
| |
|
| |
10.67 | |
| |
10.68 | MVC Letter Agreement, dated November 15, 2013, among BG US Production Company, LLC, BG US Gathering Company, LLC, EXCO Operating Company, LP, Azure Midstream Energy LLC (formerly known as TGGT Holdings, LLC) and TGG Pipeline, Ltd, filed as an Exhibit to EXCO’s Current Report on Form 8-K, dated November 15, 2013 and filed on November 21, 2013 and incorporated by reference herein. |
| |
10.69 | |
| |
10.70 | |
| |
10.71 | |
| |
10.72 | |
| |
10.73 | |
| |
10.74 | |
| |
10.75 | |
| |
10.76 | |
| |
10.77 | |
| |
10.78 | |
| |
10.79 | Debtor-In-Possession Credit Agreement, dated as of January 22, 2018, among EXCO Resources, Inc., the Lenders party thereto, and Hamblin Watsa Investment Counsel Ltd., as Administrative Agent filed as an Exhibit to EXCO’s Current Report on Form 8-K, dated January 19, 2018 filed January 25, 2018 and incorporated by reference herein. |
| |
10.80 | Agreement Regarding Settlement, dated January 29, 2018, by and among EXCO Resources, Inc., EXCO Holding (PA), Inc., EXCO Resources (PA), LLC, EXCO Production Company (PA), LLC, EXCO Production Company (WV), LLC, EXCO Operating Company, LP, EXCO Appalachia Midstream, LLC, BG US Production Company, LLC, BG North America, LLC, BG Production Company (PA), LLC, BG Production Company (WV), LLC and SWEPI LP filed as an Exhibit to EXCO’s Current Report on Form 8-K, dated February 22, 2018 filed March 1, 2018 and incorporated by reference herein. |
| |
|
| |
10.81 | Settlement Agreement and Mutual Release, dated February 27, 2018, by and among EXCO Holding (PA), Inc., EXCO Production Company (PA), LLC, EXCO Production Company (WV), LLC, EXCO Resources (PA), LLC, BG Production Company (PA), LLC, BG Production Company (WV), LLC and SWEPI LP filed as an Exhibit to EXCO’s Current Report on Form 8-K, dated February 22, 2018 filed March 1, 2018 and incorporated by reference herein. |
| |
10.82 | Membership Interest (BG PA) Transfer Agreement, dated February 27, 2018, by and among BG US Production Company, LLC, BG Production Company (PA), LLC and EXCO Production Company (PA), LLC filed as an Exhibit to EXCO’s Current Report on Form 8-K, dated February 22, 2018 filed March 1, 2018 and incorporated by reference herein. |
| |
10.83 | Membership Interest (BG WV) Transfer Agreement, dated February 27, 2018, by and among BG US Production Company, LLC, BG Production Company (WV), LLC and EXCO Production Company (WV), LLC filed as an Exhibit to EXCO’s Current Report on Form 8-K, dated February 22, 2018 filed March 1, 2018 and incorporated by reference herein. |
| |
10.84 | Membership Interest (ERPA) Transfer Agreement, dated February 27, 2018, by and among BG US Production Company, LLC, EXCO Resources (PA), LLC and EXCO Holding (PA), Inc. filed as an Exhibit to EXCO’s Current Report on Form 8-K, dated February 22, 2018 filed March 1, 2018 and incorporated by reference herein. |
| |
10.85 | Membership Interest (Midstream) Transfer Agreement, dated February 27, 2018, by and among BG US Production Company, LLC, EXCO Appalachia Midstream, LLC and EXCO Holding (PA), Inc. filed as an Exhibit to EXCO’s Current Report on Form 8-K, dated February 22, 2018 filed March 1, 2018 and incorporated by reference herein. |
| |
10.86 | Termination and Release Agreement, dated February 27, 2018, by and among BG US Production Company, LLC, BG North America, LLC, BG Production Company (PA), LLC, BG Production Company (WV), LLC, EXCO Resources, Inc., EXCO Holding (PA), Inc., EXCO Resources (PA), LLC, EXCO Production Company (PA), LLC, EXCO Production Company (WV), LLC, EXCO Operating Company, LP and EXCO Appalachia Midstream, LLC. filed as an Exhibit to EXCO’s Current Report on Form 8-K, dated February 22, 2018 filed March 1, 2018 and incorporated by reference herein. |
| |
21.1 | |
| |
23.1 | |
| |
23.2 | |
| |
23.3 | |
| |
23.4 | |
| |
31.1 | |
| |
31.2 | |
| |
32.1 | |
| |
99.1 | |
| |
99.2 | |
| |
101.INS | XBRL Instance Document. |
| |
101.SCH | XBRL Taxonomy Extension Schema Document. |
| |
101.CAL | XBRL Taxonomy Calculation Linkbase Document. |
| |
|
| |
101.DEF | XBRL Taxonomy Definition Linkbase Document. |
| |
101.LAB | XBRL Taxonomy Label Linkbase Document. |
| |
101.PRE | XBRL Taxonomy Presentation Linkbase Document. |
| |
* | These exhibits are management contracts. |
| |
# | Schedules and exhibits have been omitted pursuant to Item 601(b)(2) of Regulation S-K. EXCO Resources, Inc. hereby undertakes to furnish supplemental copies of any of the omitted schedules and exhibits upon request by the Securities and Exchange Commission. |