Washington, D. C. 20549
PIONEER ENERGY SERVICES CORP.
with drilling rigs that have more varied capabilities for drilling in unconventional plays and improves our efficiency and safety.safety, as described in more detail below.
collars, casing, and other necessary items to the drilling rig floor. Its function has significant safety advantages and can reduce the overall time required to complete the well.
We believe that our drilling rigs and other related equipment are in good operating condition. Our employees perform periodic maintenance and minor repair work on our drilling rigs. We rely on various oilfield service companies for major repair work and overhaul of our drilling equipment when needed. We also engage in periodic improvement and upgrades of our drilling equipment. In the event of major breakdowns or mechanical problems, our rigs could be subject to significant idle time and a resulting loss of revenue if the necessary repair services are not immediately available.
Newly drilled wells require completion services to prepare the well for production. The completion process may involve selectively perforating the well casing in the productive zones to allow oil or gas to flow into the well bore, stimulating and testing these zones and installing the production string and other downhole equipment. The completion process typically requires a few days to several weeks, depending on the nature and type of the completion, and generally requires additional auxiliary equipment. Accordingly, completion services require less well-to-well mobilization of equipment and can provide higher operating margins than regular maintenance work. The demand for completion services is directly related to drilling activity levels, which are sensitive to changes in oil and gas prices.
Regular maintenance is required throughout the life of a well to sustain optimal levels of oil and gas production. Common maintenance services include repairing inoperable pumping equipment in an oil well, replacing defective tubing in a gas well, cleaning a live well, and servicing mechanical issues. Our maintenance services involve relatively low-cost, short-duration jobs which are part of normal well operating costs. The need for maintenance does not directly depend on the level of drilling activity, although it is somewhat impacted by short-term fluctuations in oil and gas prices. Accordingly, maintenance services generally experience relatively stable demand; however, when oil or gas prices are too low to justify additional expenditures, operating companies may choose to temporarily shut in producing wells rather than incur additional maintenance costs.
In addition to periodic maintenance, producing oil and gas wells occasionally require major repairs or modifications called workovers, which are typically more complex and more time consuming than maintenance operations. Workover services include extensions of existing wells to drain new formations either through perforating the well casing to expose additional productive zones not previously produced, deepening well bores to new zones, or the drilling of lateral well bores to improve reservoir drainage patterns. Workovers also include major subsurface repairs such as repair or replacement of well casing, recovery or replacement of tubing and removal of foreign objects from the well bore. A workover may require a few days to several weeks and generally requires additional auxiliary equipment. The demand for workover services is sensitive to oil and gas producers’ intermediate and long-term expectations for oil and gas prices.
At the end of the well life cycle, a process is required to permanently close oil and gas wells that are no longer capable of producing in economic quantities. Many well operators bid this work on a “turnkey” basis, requiring the service company to perform the entire job, including the sale or disposal of equipment salvaged from the well as part of the compensation received, and complying with state regulatory requirements. Plugging and abandonment work can provide favorable operating margins and is less sensitive to oil and gas pricing than drilling and workover activity since well operators must plug a well in accordance with state regulations when it is no longer productive.
Well servicing rigs are frequently used to complete newly drilled wells to minimize the use of higher cost drilling rigs in the completion process. Our well servicing rigs are also used to convert former producing wells to injection wells through which water or carbon dioxide is then pumped into the formation for enhanced oil recovery operations. Extensive workover operations are normally performed by a well servicing rig with additional specialized auxiliary equipment, which may include rotary drilling equipment, mud pumps, mud tanks and fishing tools, depending upon the particular type of workover operation. All of our well servicing rigs are designed to perform complex workover operations. We also perform plugging and abandonment work throughout our core areasAdditionally, all of operation in conjunction with equipment provided by other service companies.
Electric wireline contains a conduit that allows signals to be transmitted to or from tools located in the well. These tools can be used to measure pressures and temperatures as well as the condition of the casing and the cement that holds the casing in place. In order for oil and gas exploration and production companies to better understand the reservoirs they are drilling or producing, they require logging services to accurately characterize reservoir rocks and fluids. We provide both openopen- and cased-hole logging services. Other applications for wireline tools include placing equipment in or retrieving equipment (or debris) from the wellbore, installing bridge plugs, perforating the casing in order to prepare the well for production, or cutting off pipe that is stuck in the well so that the free section can be recovered.
We believe that an important competitive factor in establishing and maintaining long-term client relationships is having an experienced, skilled and well-trained work force. In recent years, many of our larger clients have placed increased
emphasis on the safety performance and quality of the crews, equipment and services provided by their contractors. We have devoted, and will continue to devote, substantial resources toward employee safety and training programs. Although price is generally the primary factor, we believe our clients consider all of these factors price is generally the primary factor in determining which service provider is awarded the work. However, we believework, and that many clients are willing to pay a slight premium for the quality and safe, efficient service we provide.
The need for our services fluctuates primarily in relation to the price (or anticipated price) of oil and natural gas, which in turn is driven by the supply of and demand for oil and natural gas. The level of our revenues, earnings and cash flows are substantially dependent upon, and affected by, the level of domestic and international oil and gas exploration and development activity, as well as the equipment capacity in any particular region. For a more detailed discussion, see Item 7—“Management’s Discussion and Analysis of Financial Condition and Results of Operations.”
The materials and supplies we use in our drilling and production services operations include fuels to operate our equipment, drilling mud, drill pipe, drill collars, drill bits, cement and other job materials such as explosives and perforating guns and
Our operations are subject to the many hazards inherent in exploration and production activity, including the risks of:
•damage to producing or potentially productive oil and gas formations through which we drill; and
•environmental damage.
We seek to protect ourselves from some but not all operating hazards through insurance coverage. However, some risks are either not insurable or insurance is available only at rates that we consider uneconomical. Those risks include, among other things, pollution liability in excess of relatively low limits. Depending on competitive conditions and other factors, we attempt to obtain contractual protection against uninsured operating risks from our clients. However, clients who provide contractual indemnification protection may not in all cases maintain adequate insurance or otherwise have the financial resources necessary to support their indemnification obligations. Our insurance or indemnification arrangements may not adequately protect us against liability or loss from all the hazards of our operations. The occurrence of a significant event that we have not fully insured or indemnified against or the failure of a client to meet its indemnification obligations to us could materially and adversely affect our results of operations and financial condition. Furthermore, we may be unable to maintain adequate insurance in the future at rates we consider reasonable.
Our current insurance coverage includes property insurance on our rigs, drilling equipment, production services equipment, and real property. Our insurance coverage for property damage to our rigs, drilling equipment and production services equipment is based on our estimates of the cost of comparable used equipment to replace the insured property. The policy provides for a deductible of no more than $750,000$750,000 per drilling rig and a deductible on production services equipment of $100,000$250,000 per occurrence.occurrence, with an additional $350,000 annual aggregate deductible. Our third-party liability insurance coverage is $101$101 million per occurrence and in the aggregate, with a $500,000 self-insured retention, an additional $500,000 aggregate deductible, of $250,000 per occurrence and an additional $250,000 annual aggregate deductible.deductible of $1,000,000 on the first layer of excess coverage. We also carry insurance coverage for pollution liability up to $20$20 million with a deductible of $500,000.$500,000. We believe that we are adequately insured for public liability and property damage to others with respect to our operations. However, such insurance may not be sufficient to protect us against liability for all consequences of well disasters, extensive fire damage or damage to the environment.
Employees
We currently have approximately 2,300 employees, the majority of which work in our drilling and production services operations and are primarily compensated on an hourly basis. The number of employees in operations fluctuates depending on the utilization of our drilling rigs, well servicing rigs, wireline units and coiled tubing units at any particular time. None of our employment arrangements are subject to collective bargaining arrangements.
Our operations require the services of employees having the technical training and experience necessary to achieve proper operational results. As a result, our operations depend, to a considerable extent, on the continuing availability of such personnel. From time to time, shortages of qualified personnel have occurred in our industry. If we should suffer any material
loss of personnel to competitors or be unable to employ additional or replacement personnel with the requisite level of training and experience to adequately operate our equipment, our operations could be materially and adversely affected. While we believe our wage rates are competitive and our relationships with our employees are satisfactory, a significant increase in the wages paid by other employers could result in a reduction in our workforce, increases in wage rates, or both. The occurrence of either of these events for a significant period of time could have a material adverse effect on our financial condition and results of operations.
Facilities
We lease our corporate office facilities located at 1250 N.E. Loop 410, Suite 1000 San Antonio, Texas 78209. We conduct our business operations through 50 other real estate locations, of which we own 12, located throughout the United States in Texas, Oklahoma, Colorado, Montana, North Dakota, Pennsylvania, Wyoming, Mississippi, Arkansas, Louisiana and Kansas, and one property is located internationally in Colombia. These real estate locations are primarily used for regional offices and storage and maintenance yards.
Governmental Regulation
Many aspects of our operations are subject to various federal, state and local laws and governmental regulations, including laws and regulations governing:
•remediation of contamination;
•preservation of natural resources;
Environment Protection. Our operations are subject to stringent federal, state and local laws, rules and regulations governing the protection of the environment and human health and safety.
Some of the laws, rules and regulations applicable to our industry relate to the disposal of hazardous substances, oilfield waste and other waste materials and restrict the types, quantities and concentrations of those substances that can be released into the environment. Several of those laws also require removal and remedial action and other cleanup under certain circumstances, commonly regardless of fault. Our operations routinely involve the handling of significant amounts of waste materials, some of which are classified as hazardous wastes and/or hazardous substances. Planning, implementation and maintenance of protective measures are required to prevent accidental discharges. Spills of oil, natural gas liquids, drilling fluids and other substances may subject us to penalties and cleanup requirements. Handling, storage and disposal of both hazardous and non-hazardous wastes are also subject to these regulatory requirements. In addition, our operations are often conducted in or near ecologically sensitive areas, such as wetlands or protected species habitats, which are subject to special protective measures and which may expose us to additional operating costs and liabilities for accidental discharges of oil, gas, drilling fluids, contaminated water or other substances, or for noncompliance with other aspects of applicable laws and regulations.
Environmental laws and regulations are complex and subject to frequent change.change, and the new Biden Administration is expected to revise existing environmental regulations and to pursue new initiatives. Failure to comply with governmental requirements or inadequate cooperation with governmental authorities could subject a responsible party to administrative, civil or criminal action. We may also be exposed to environmental or other liabilities originating from businesses and assets which we acquired from others. Our compliance with amended, new or more stringent requirements, stricter interpretations of existing requirements or the future discovery of contamination or regulatory
noncompliance may require us to make material expenditures or subject us to liabilities that we currently do not anticipate.
There are a variety of regulatory developments, proposals or requirements and legislative initiatives that have been introduced in the United States and international regions in which we operate that are focused on restricting the emission of carbon dioxide, methane and other greenhouse gases. Further, President Biden has announced that he intends to take aggressive action to address climate-related issues and to set the United States on a path to be carbon-neutral by 2050.
Hydraulic fracturing of wells and subsurface water disposal are also under public and governmental scrutiny due to concerns regarding potential environmental and physical impacts, including groundwater and drinking water impacts, as well as whether such activities may cause earthquakes. Increased regulation and attention given to the hydraulic fracturing process could lead to greater opposition, including litigation, to oil and gas production activities using hydraulic fracturing techniques. Additional legislation or regulation could also lead to operational delays or increased operating costs in the production of oil and natural gas, including from the developing shale plays, incurred by our clients. The adoption of any federal, state or local laws or the implementation of regulations or ordinances restricting or increasing the costs of hydraulic fracturing
could cause a decrease in the completion of new oil and natural gas wells and an associated decrease in demand for our drilling and well servicing activities, any or all of which could adversely affect our financial position, results of operations and cash flows.
Our wireline operations involve the use of radioactive isotopes along with other nuclear, electrical, acoustic, and mechanical devices. Our activities involving the use of isotopes are regulated by the U.S. Nuclear Regulatory Commission and specified agencies of certain states. Additionally, we use high explosive charges for perforating casing and formations, and we use various explosive cutters to assist in wellbore cleanout. Such operations are regulated by the U.S. Department of Justice, Bureau of Alcohol, Tobacco, Firearms, and Explosives and require us to obtain licenses or other approvals for the use of densitometers as well as explosive charges. We have obtained these licenses and approvals when necessary and believe that we are in substantial compliance with these federal requirements.
In addition, our business depends on the demand for land drilling and production services from the oil and gas industry and, therefore, is affected by tax, environmental and other laws relating to the oil and gas industry generally, by changes in those laws and by changes in related administrative regulations. It is possible that these laws and regulations may in the future add significantly to our operating costs or those of our clients, or otherwise directly or indirectly affect our operations. It is possible that the Biden Administration will severely restrict oil and gas development on public lands. For example, the President has already announced a hold on new drilling permits for federal lands and waters and has proposed a moratorium on hydraulic fracturing on federal lands and waters. In addition, the new administration may restrict new oil and gas leasing on public lands.
See Item 1A—“Risk Factors” in Part I of this Annual Report on Form 10-K for a detailed discussion of risks we face concerning laws and governmental regulations.
Transportation. Among the services we provide, we operate as a motor carrier for the transportation of our own equipment and therefore are subject to regulation by the U.S. Department of Transportation and by various state agencies. These regulatory authorities exercise broad powers, governing activities such as the authorization to engage in motor carrier operations and regulatory safety. There are additional regulations specifically relating to the trucking industry, including testing and specification of equipment and product handling requirements. The trucking industry is subject to possible regulatory and legislative changes that may affect the economics of the industry by requiring changes in operating practices or by changing the demand for common or contract carrier services or the cost of providing truckload services. Some of these possible changes include increasingly stringent environmental regulations, changes in the hours of service regulations which govern the amount of time a driver may drive in any specific period, onboard black box recorder devices or limits on vehicle weight and size.
Interstate motor carrier operations are subject to safety requirements prescribed by the U.S. Department of Transportation. To a large degree, intrastate motor carrier operations are subject to state safety regulations that mirror federal regulations. Such matters as weight and dimension of equipment are also subject to federal and state regulations.
From time to time, various legislative proposals are introduced, including proposals to increase federal, state, or local taxes, including taxes on motor fuels, which may increase our costs or adversely impact the recruitment of drivers. We cannot predict whether, or in what form, any increase in such taxes applicable to us will be enacted.
Worker safety. Our ability to retain existing customers and attract new business is dependent on many factors, including our ability to demonstrate that we can reliably and safely operate our business in a manner that is consistent with applicable laws, rules and permits. An accident or other event resulting in significant environmental or property damage, or injuries or fatalities involving our employees or other persons could also trigger investigations by federal, state or local authorities. Such an accident or other event could cause us to incur substantial expenses in connection with the investigation, remediation and resolution, as well as cause lasting damage to our reputation, loss of customers and an inability to obtain insurance.
Available Information
Our Websitewebsite address is www.pioneeres.com. Our annual reports on Form 10-K, quarterly reports on Form 10-Q, current reports on Form 8-K and amendments to those reports, are available free of charge through our Websitewebsite as soon as reasonably practicable after we electronically file those materials with, or furnish those materials to, the Securities and Exchange Commission. The public may read and copy these materials at the Securities and Exchange Commission’s Public Reference Room at 100 F Street, N.E., Washington, DC 20549. For additional information on the operations of the Securities and Exchange Commission’s Public Reference Room, please call 1-800-SEC-0330. In addition, the Securities and Exchange Commission maintains an Internet site at www.sec.gov that contains reports, proxy and information statements and other information regarding issuers that file electronically. We have also posted on our Websitewebsite our: Charters for the Audit, Compensation, and Nominating and Corporate Governance Committees of our Board; Code of Business Conduct and Ethics; Rules of Conduct Applicable to All Employees; Corporate Governance Guidelines; and Company Contact Information. Information on our website is not incorporated into this report or otherwise made part of this report.
| |
ITEM 1A. | RISK FACTORSITEM 1A. RISK FACTORS |
The information set forth in this Item 1A should be read in conjunction with the rest of the information included in this report, including “Management’s Discussion and Analysis of Financial Condition and Results of Operations” in Item 7 and the financial statements and related notes this report contains. While we attempt to identify, manage and mitigate risks and uncertainties associated with our business to the extent practical under the circumstances, some level of risk and uncertainty will always be present. Additional risks and uncertainties that are not presently known to us or that we currently believe are immaterial also may negatively impact our business, financial condition or operating results.
Set forth below are various risks and uncertainties that could adversely impact our business, financial condition, results of operations and cash flows.
Risks Relating to Our Emergence from Bankruptcy
•We recently emerged from bankruptcy, which may adversely affect our business and relationships.
As a result of our bankruptcy filing and recent emergence:
•key suppliers, vendors or other contract counterparties may terminate their relationships with us or require additional financial assurances or enhanced performance from us;
•our ability to renew existing contracts and compete for new business may be adversely affected;
•our ability to attract, motivate and/or retain key executives and employees may be adversely affected;
•our competitors may take business away from us, and our ability to attract and retain customers may be negatively impacted;
•our employees may be distracted from performance of their duties or more easily attracted to other employment opportunities; and
•we may have difficulty obtaining the capital we need to run and grow our business.
The occurrence of one or more of these events could have a material adverse effect on our operations, financial condition and reputation.
•Upon our emergence from Chapter 11, the composition of our stockholder base and concentration of equity ownership changed significantly.
As a result of the concentration of our equity ownership, the future strategy and plans of the Company may differ materially from those in the past. Upon our emergence from Chapter 11, twelve stockholder groups were the
beneficial owners of approximately 95% (the “Significant Stockholders”) of our issued and outstanding common stock and, therefore, have significant control on the outcome of matters submitted to a vote of stockholders, including, but not limited to, electing directors and approving corporate transactions. In addition, our incurrence of additional indebtedness requires the consent of each of our current stockholders that, together with their affiliates and related funds, owns more than 17.5% of our outstanding common stock on a fully-diluted basis, and the consent of one particular stockholder is required for us to issue additional equity as long as such stockholder, together with its affiliates and related funds, owns more than 12.5% of our outstanding common stock on a fully-diluted basis. As a result, our future strategy and plans may differ materially from those of the past. Circumstances may occur in which the interests of the Significant Stockholders could be in conflict with the interests of other stockholders, and the Significant Stockholders would have substantial influence to cause us to take actions that align with their interests. Should conflicts arise, we can provide no assurance that the Significant Stockholders would act in the best interests of other stockholders or that any conflicts of interest would be resolved in a manner favorable to our other stockholders.
•Upon our emergence from Chapter 11, the composition of our board of directors changed significantly.
Pursuant to the Plan, the composition of our board of directors (the “Board”) changed significantly. Upon emergence, our Board consisted of five directors, only one of whom, our former Chief Executive Officer, Wm. Stacy Locke, had served on the Board prior to our emergence from Chapter 11. In July 2020, Wm. Stacy Locke resigned his officer and director positions, at which time Matthew S. Porter, a member of the Board, was also appointed to serve as Interim Chief Executive Officer, and he was subsequently appointed to serve as the Company’s President and Chief Executive Officer, effective January 1, 2021. Our Board currently consists of four members.
The new directors have different backgrounds, experiences and perspectives from those individuals who previously served on our Board and, thus, may have different views on the issues that will determine our future. As a result, the future strategy and our plans may differ materially from those of the past.
•Certain information contained in our historical financial statements will not be comparable to the information contained in our financial statements after the application of fresh start accounting.
Upon our emergence from Chapter 11, we adopted fresh start accounting in accordance with ASC Topic 852 and became a new entity for financial reporting purposes. As a result, we revalued our assets and liabilities based on our estimate of our enterprise value and the fair value of each of our assets and liabilities. These estimates, projections and enterprise valuation were prepared solely for the purpose of the bankruptcy proceedings and should not be relied upon by investors for any other purpose. At the time they were prepared, the determination of these values reflected numerous estimates and assumptions, and the fair values recorded based on these estimates may not be fully realized in periods subsequent to our emergence from Chapter 11.
The consolidated financial statements after the Effective Date are not comparable with the consolidated financial statements on or before that date as indicated by the “black line” division in the financial statements and footnote tables, which emphasizes the lack of comparability between amounts presented. This will make it difficult for stockholders to assess our performance in relation to prior periods. Please see Note 2, Emergence from Voluntary Reorganization under Chapter 11, of the Notes to Consolidated Financial Statements included in Part II, Item 8 Financial Statements and Supplementary Data for further information.
Risks Relating to the Oil and Gas Industry
•We derive all our revenues from companies in the oil and gas exploration and production industry, a historically cyclical industry with levels of activity that are significantly affected by the levels and volatility of oil and gas prices.
As a provider of contract land drilling services and oil and gas production services, our business depends on the level of exploration and production activity in the geographic markets where we operate. The oil and gas exploration and production industry is a historically cyclical industry characterized by significant changes in the levels of exploration and development activities.
Oil and gas prices, and market expectations of potential changes in those prices, significantly affect the levels of those activities. Oil and gas prices have been volatile historically and, we believe, will continue to be so in the future. Worldwide political, economic, and military events as well as natural disasters have contributed to oil and gas price volatility historically and are likely to continue to do so in the future. Many factors beyond our control affect oil and gas prices, including:
•the worldwide supply and demand for oil and gas;
•domestic or global health concerns, including the outbreak of contagious or pandemic diseases, such as the recent coronavirus;
•the cost of exploring for, producing and delivering oil and gas;
•the discovery rate of new oil and gas reserves;
•the rate of decline of existing and new oil and gas reserves;
•available pipeline and other oil and gas transportation capacity;
•the levels of oil and gas storage;
•the ability of oil and gas exploration and production companies to raise capital;
•economic conditions in the United States and elsewhere;
•actions by the Organization of Petroleum Exporting Countries, which we refer to as OPEC;
•political instability in oil and gas producing regions;
•governmental regulations, both domestic and foreign;
•domestic and foreign tax policy;
•weather conditions in the United States and elsewhere;
•the pace adopted by foreign governments for the exploration, development and production of their national reserves, or their investments in oil and gas reserves located in other countries; and
•the price of foreign imports of oil and gas.
Additionally, the above factors can also be affected by technological advances affecting energy consumption and the supply and demand within the market for renewable energy resources.
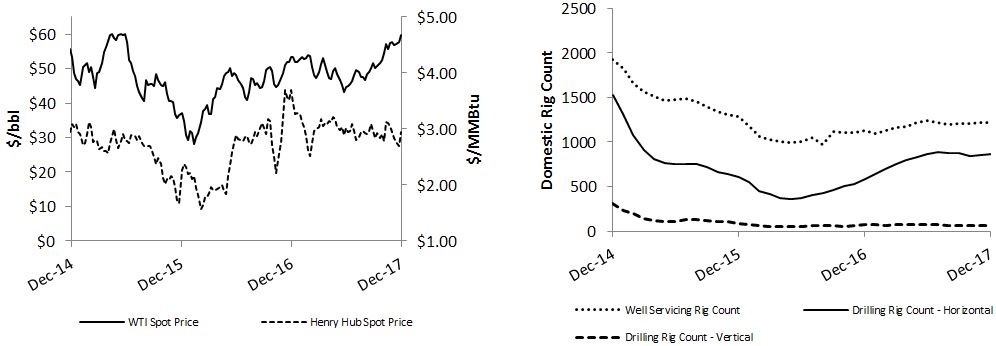
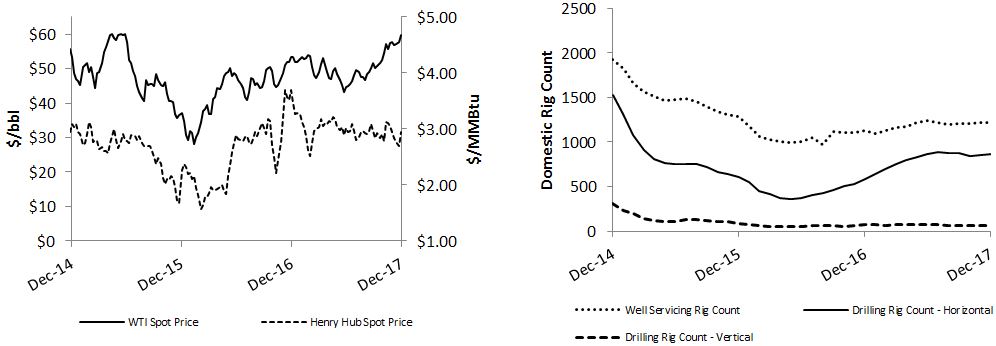
As a result of the decline in oil prices that began in late 2014, our clients reduced spending on exploration and production projects in 2015 and 2016, resulting in a significant decrease in demand for our services, which has improved during 2017.
•Oil and natural gas prices, and market expectations of potential changes in these prices, significantly impact the level of worldwide drilling and production services activities.
Reduced demand for oil and natural gas generally results in lower prices for these commodities and often impacts the economics of planned drilling projects and ongoing production projects, resulting in the curtailment, reduction, delay or postponement of such projects for an indeterminate period of time. When drilling and production activity and spending declines, both dayrates and utilization historically decline as well.
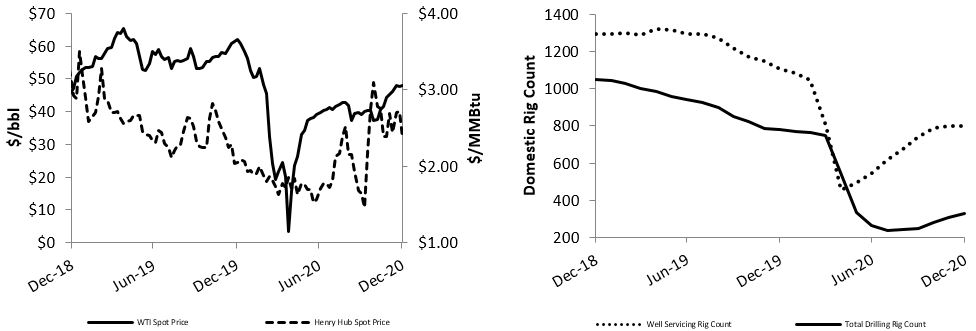
BeginningSince January 2020, the COVID-19 pandemic and oil and natural gas market volatility have resulted in October 2014,a significant decrease in oil prices worldwide dropped significantly. Our clients significantly reduced both their operating and capital expenditures during 2015significant disruption and 2016, which adversely affected our business. In 2017, our clients modestly increased their spending as compared to 2016 levels, and we expect continued increasesuncertainty in 2018. However, if the oil and natural gas market. Beginning in March 2020, the decline in demand due to the COVID-19 pandemic coincided with the announcement of price reductions and possible production increases by members of OPEC and other oil exporting nations, including Russia. Although OPEC and other oil exporting nations ultimately agreed to cut production, these extreme supply and demand dynamics caused significant crude oil price declines, negatively impacting our industry’s oil producers who responded with significant cuts in their recent and projected spending.
Additionally, because our business depends on the level of spending by our clients, we are also affected by our clients’ ability to access the capital markets. After several consecutive years without significant improvement in commodity prices, again decline, oil and gasmany exploration and production companies may cancelhave limited their spending to a level which can be supported by net operating cash flows alone, as access to the capital markets through debt or curtail their drilling programsequity financings has become more challenging in our industry. This challenge has increased recently due to the major stock market and further reduce production spending on existing wells, thereby reducing demand for our services. bond market indices experiencing elevated levels of volatility during 2020.
If the reduction in the overall level of exploration and development activities, whether resulting from changes in oil and gas prices or otherwise, continues or worsens, it could materially and adversely affect us further by negatively impacting:
•our revenues, cash flows and profitability;
•the fair market value of our drilling rig fleet and production services equipment;fleets;
•our ability to maintain or increase our borrowing capacity;obtain additional debt financing;
•our ability to obtain additional capital to finance our business or make acquisitions, and the cost of that capital;
•the collectability of our receivables; and
•our ability to retain skilled operations personnel.
Risks Relating to Our Business
•Reduced demand for or excess capacity of drilling services or production services could adversely affect our profitability.
Our profitability in the future will depend on many factors but largely on pricing and utilization rates for our drilling and production services. A reduction in the demand for drilling rigsour equipment and services or an increase in the supply of drilling rigs, whether through new constructioncomparable equipment in our industry or refurbishment, couldany particular regional market would likely decrease the dayratespricing and utilization rates for our drilling services,affected service offerings, which would adversely affect our revenues and profitability. An increaseThe commodity price environment and global oversupply of oil during 2020 resulted in supplyan oversupply of well servicing rigs, wireline unitsequipment in our industry, declining rig counts and coiled tubing units, without a corresponding increase in demand, could similarly decrease the pricingdayrates, and utilization rates ofsubstantially reduced activity for all our production services, which would adversely affect our revenues and profitability.service offerings.
•We operate in a highly competitive, fragmented industry in which price competition could reduce our profitability.
We encounter substantial competition from other drilling contractors and other oilfield service companies. Our primary market areas are highly fragmented and competitive. The fact that drilling and production services equipment are mobile and can be moved from one market to another in response to market conditions heightens the competition in the industry and may result in an oversupply of equipment in an area. Contract drilling companies and other oilfield service companies compete primarily on a regional basis, and the intensity of competition may vary significantly from region to region at any particular time. If demand for drilling or production services improves in a region where we operate, our competitors might respond by moving in suitable rigs and production services equipment from other regions. An influx of equipment from other regions could rapidly intensify competition, reduce profitability, and make any improvement in demand for our services short-lived.
Most drilling services contracts and production services contracts are awarded on the basis of competitive bids, which also results in price competition. In addition to pricing and equipment availability, we believe the following factors are also important to our clients in determining which drilling services or production services provider to select:
•the type, capability and condition of each of the competing drilling rigs, well servicing rigs, and wireline units and coiled tubing units;
•the mobility and efficiency of the equipment;
•the quality of service and experience of the crews;
•the reputation and safety record of the company providing the services;
•the offering of integrated and/or ancillary services; and
•the ability to provide drilling and production services equipment adaptable to, and personnel familiar with, new technologies and drilling and production techniques.
While we must be competitive in our pricing, our competitive strategy generally emphasizes the quality of our equipment, our safety record, our ability to offer ancillary services, the experience of our crews and the quality of service we provide to differentiate us from our competitors. This strategy is less effective when lower demand for drilling and production services intensifies price competition and makes it more difficult for us to compete on the basis of factors other than price. In all of the markets in which we compete, an oversupply of drilling rigs or production services equipment generally causes greater price competition and reduced profitability.
•We face competition from many competitors with greater resources.
Some of our competitors have greater financial, technical and other resources than we do. Their greater capabilities in these areas may enable them to:
•better withstand industry downturns;
•compete more effectively on the basis of price and technology;
•better attract and retain skilled personnel; and
•build new rigs or acquire and refurbish existing rigs and place them into service more quickly than us in periods of high drilling demand.
•Technological advancements and trends in our industry also affect the demand for certain types of equipment, and can affect the overall demand for equipment in our industry.
Technological advancements and trends inthe services our industry also affect the demand for certain types of equipment, and can affect the overall demand for equipment in our industry. For several years, prior to late 2014, higher oil prices drove industry equipment utilization and revenue rates up, particularly in oil-producing regions and certain shale regions. However, advancements in technology improved the efficiency of drilling rigs and overall demand remained steady, while the demand for certain drilling rigs decreased, particularly in vertical well markets. The decline was a result of higher demand for drilling rigs that are able to drill horizontally and the increased use of “pad drilling” which enables a series of horizontal wells to be drilled in succession by walking or skidding a drilling rig at a single pad-site location, thereby improving the productivity of exploration and production activities and minimizing mobilization costs. This trend, then coupled with the downturn, resulted in significantly reduced demand for drilling rigs that do not have the ability to walk or skid and to drill horizontal wells, and could further reduce the overall demand for all drilling rigs.
In drilling, all rig classes were severely impacted by the industry downturn. However, AC drilling rigs equipped with either a walking or skidding system are the best suited for horizontal pad drilling and we believe they are the most desirable rig design available.provides.
Although we take measures to ensure that we use advanced technologies for drilling and production services equipment, changes in technology or improvements in our competitors’ equipment could make our equipment less competitive or require significant capital investments to keep our equipment competitive, which could have an adverse effect on our financial condition and operating results.
•We derive a significant portion of our revenue from a limited number of major clients, and our business, financial condition and results of operations could be materially adversely affected if we are unable to maintain relationships with these clients, or if their demand for our services decreases.
In the past,Historically, we have derived a significant portion of our revenue from a limited number of major clients. ForWhile none of our clients individually accounted for more than 10% of our total revenues in either of the years ended December 31, 2017, 2016 and 2015,2020 or 2019, our drilling and production services provided to our top three clients accounted for approximately 20%, 26%,19% and 29%18%, respectively, of our revenue. The loss of one or more of our major clients, or their decrease in demand for our services, could have a material adverse effect on our business, financial condition and results of operations. We experienced significantly reduced demand for our services during 2015 and 2016 from all clients, including our major clients, but we experienced a modest recovery in demand during 2017. For a detail
•Certain of our three largestcontracts are subject to cancellation by our clients as a percentagewithout penalty and/or with little or no notice.
Some of our total revenuescurrent drilling contracts, and some drilling contracts that we may enter into in the future, may include terms allowing our clients to terminate the contracts without cause, with little or no prior notice and/or without penalty or early termination payments. The likelihood that a client may seek to terminate a contract is increased during periods of market weakness.
In periods of extended market weakness, our clients may not be able to honor the last three fiscal years, see Item 1—“Business”terms of existing contracts, may terminate contracts even where there may be onerous termination fees, or may seek to renegotiate contract dayrates and terms in Part Ilight of this Annual Report on Form 10-K.
Our indebtedness could restrict our operations and make us more vulnerable to adverse economicdepressed market conditions.
Our indebtedness is primarily During depressed market conditions, as a result of commodity prices, restricted credit markets, economic downturns, changes in priorities or strategy or other factors beyond our control, a client may no longer want or need a drilling rig that is currently under contract or may be able to obtain a comparable drilling rig at a lower dayrate. For these reasons, clients may seek to renegotiate the acquisitions of the well servicing and wireline services businesses which we acquired in 2008 and the coiled tubing business that we acquired in 2011, as well as organic growth investments. At December 31, 2017, our total debt consists of $300 million outstanding under our Senior Notes and $175 million outstanding under our Term Loan, with additional borrowing availability under our ABL Facility.
Our current and future indebtedness could have important consequences, including:
limiting our ability to use operating cash flow in other areasterms of our business because we must dedicate a substantial portion of these fundsexisting drilling contracts, terminate our contracts without justification, leverage their termination rights in an effort to make principal and interest payments on our indebtedness;
making us more vulnerable to a downturn in our business, our industry or the economy in general as a substantial portion of our operating cash flow could be required to make principal and interest payments on our indebtedness, making it more difficult to react to changes in our business, industry and market conditions;
limiting our flexibility in planning for, or reacting to, changes in our business and the industry in which we operate;
impairing our ability to make investments and obtain additional financing for working capital, capital expenditures, acquisitions or other general corporate purposes;
limiting our ability to obtain additional financing that may be necessary to operate or expand our business;
putting us at a competitive disadvantage to competitors that have less debt; and
increasing our vulnerability to rising interest rates.
We currently expect that cash and cash equivalents, cash generated from operations, proceeds from sales of certain non-strategic assets, and available borrowings under our ABL Facility are adequate to cover our liquidity requirements for at least the next 12 months. However, our ability to make payments on our indebtedness, and to fund planned capital expenditures, will depend on our ability to generate cash in the future. This, to a certain extent, is subject to:
conditions in the oil and gas industry;
general economic and financial conditions;
competition in the markets where we operate;
the impact of legislative and regulatory actions on how we conduct our business; and
other factors, all of which are beyond our control.
If our business does not generate sufficient cash flow from operations to service our outstanding indebtedness, we may have to undertake alternative financing plans, subject to the limitations imposed by our Term Loan, ABL Facility and Senior Notes, such as:
refinancing or restructuring our debt;
selling assets;
reducing or delaying acquisitions or capital investments, such as refurbishments of our rigs and related equipment; and/or
seeking to raise additional capital.
However, we may be unable to implement alternative financing plans, if necessary, on commercially reasonablerenegotiate contract terms, or at all, and any such alternative financing plans might be insufficient to allow us to meet our debt obligations. If we are unable to generate sufficient cash flow or are otherwise unable to obtain the funds required to make principal and interest payments on our indebtedness, or if we otherwise fail to comply withperform their obligations under our contracts.
Our clients may also seek to terminate contracts for cause, such as the various covenantsloss of or major damage to the drilling unit or other events that cause the suspension of drilling operations beyond a specified period of time. If we experience operational problems or if our equipment fails to function properly and cannot be repaired promptly, our clients will not be able to engage in our Term Loan, ABL Facility,drilling operations and Senior Notes, we could bemay have the right to terminate the contracts. If equipment is not timely delivered to a client or does not pass acceptance testing, a client may in default undercertain circumstances have the terms of such instruments. right to terminate the contract.
In the event of a default, our lenders could elect to declare allcancellation, the loans made under our Term Loan, ABL Facility, and Senior Notes to be due and payable together with accrued and unpaid interest and terminate their commitments thereunder and wepayment of a termination fee may not fully compensate us for the loss of the contract. Additionally, the early termination of a contract may result in a drilling rig or oneother equipment being idle for an extended period of time. The cancellation or morerenegotiation of a number of our subsidiaries could be forced into bankruptcy or liquidation. Any of the foregoing consequencescontracts could materially and adversely affect our business, financial condition, results of operations and prospects.
Our Term Loan, ABL Facility, and Senior Notes impose significant covenants on us that may affect our ability to successfully operate our business.
Our Term Loan contains customary restrictions that, among other things, and subject to certain exceptions, limit our ability to:
incur or permit liens on assets;
make investments and acquisitions;
consolidate or merge with another company;
engage in asset sales; and
pay dividends or make distributions.
In addition, our Term Loan requires us to maintain certain financial covenants and to satisfy certain financial conditions, which may require us to reduce our debt or take some other action in order to comply with them.revenues and profitability.
Our ABL Facility contains restrictive covenants that, among other things, and subject to certain exceptions, limit our ability to:
declare dividends and make other distributions;
issue or sell certain equity interests;
optionally prepay, redeem or repurchase certain of our subordinated indebtedness;
make loans or investments (including acquisitions);
incur additional indebtedness or modify the terms of permitted indebtedness;
grant liens;
change our business or the business of our subsidiaries;
merge, consolidate, reorganize, recapitalize, or reclassify our equity interests;
sell our assets, and
enter into certain types of transactions with affiliates.
The Indenture governing our Senior Notes, among other things, limits us and certain of our subsidiaries, subject to certain exceptions, in our ability to:
pay dividends on stock, repurchase stock, redeem subordinated indebtedness or make other restricted payments and investments;
incur, assume or guarantee additional indebtedness or issue preferred or disqualified stock;
create liens on our or their assets;
enter into sale and leaseback transactions;
borrow, pay dividends, or transfer other assets from certain of our subsidiaries;
consolidate with or merge with or into, or sell all or substantially all of our properties to any other person;
enter into transactions with affiliates; and
enter into new lines of business.
The failure to comply with any of these covenants would cause an event of default under our Term Loan, ABL Facility, or Senior Notes. An event of default, if not waived, could result in acceleration of the outstanding indebtedness, in which case the debt would become immediately due and payable. If this occurs, we may not be able to pay our debt or borrow sufficient funds to refinance it. Even if new financing is available, it may not be available on terms that are acceptable to us. These covenants could also limit our ability to obtain future financing, make needed capital expenditures, withstand a downturn in our business or the economy in general, or otherwise conduct necessary corporate activities. We also may be prevented from taking advantage of business opportunities that arise because of the limitations imposed on us by the restrictive covenants under our Term Loan, ABL Facility, and Senior Notes.
•Our operations involve operating hazards, which, if not insured or indemnified against, could adversely affect our results of operations and financial condition.
Our operations are subject to the many hazards inherent in exploration and production activity, including the risks of:
•fires and explosions;
•collapse of the borehole;
•damaged or lost drilling equipment; and
•damage or loss from natural disasters.
Any of these hazards can result in substantial liabilities or losses to us from, among other things:
•suspension of operations;
•damage to, or destruction of, our property and equipment and that of others;
•personal injury and loss of life;
•damage to producing or potentially productive oil and gas formations through which we drill; and
We seek to protect ourselves from some but not all operating hazards through insurance coverage. However, some risks are either not insurable or insurance is available only at rates that we consider uneconomical. Those risks include, among other things, pollution liability in excess of relatively low limits. Depending on competitive conditions and other factors, we attempt to obtain contractual protection against uninsured operating risks from our clients. However, clients who provide contractual indemnification protection may not in all cases maintain adequate insurance or otherwise have the financial resources necessary to support their indemnification obligations. Our insurance or indemnification arrangements may not adequately protect us against liability or loss from all the hazards of our operations. The occurrence of a significant event that we have not fully insured or indemnified against or the failure of a client to meet its indemnification obligations to us could materially and adversely affect our results of operations and financial condition. Furthermore, we may be unable to maintain adequate insurance in the future at rates we consider reasonable.
•We could be adversely affected if shortages of equipment, supplies or personnel occur.
FromWhile we are not currently experiencing a shortage of equipment or supplies, from time to time, there have been shortages of drilling and production services equipment and supplies during periods of high demand, which we believe could recur. Additionally, trade and economic sanctions or other restrictions imposed by the United States or other countries could also affect the supply of equipment and supplies which are needed in our operations. Shortages could result in increased prices for equipment or supplies that we may be unable to pass on to clients. In addition, during periods of shortages,clients and could substantially lengthen the delivery times for equipment and supplies can be substantially longer.supplies. Any significant delays in our obtaining equipment or supplies could limit our operations and jeopardize our relations with clients. In addition, shortages of equipment or suppliesclients and could delay and adversely affect our ability to obtain new contracts for our rigs, whichrigs. Any of the above could have a material adverse effect on our financial condition and results of operations.
Our strategy of constructing drilling rigs during periods of peak demand requires that we maintain an adequate supply of drilling rig components to complete our rig building program. Our suppliers may be unable to continue providing us the needed drilling rig components if their manufacturing sources are unable to fulfill their commitments.
Our operations require the services of employees having the technical training and experience necessary to achieve proper operational results. As a result, our operations depend, to a considerable extent, on the continuing availability of such personnel. ShortagesFrom time to time in the past, temporary shortages of qualified personnel have occurred in our industry. Recently, we have begun to experience the effects of a tightening labor market and the resulting increased labor costs associated with the limited availability of qualified personnel. If we should suffer any material loss of personnel to competitors or be unable to employ additional or replacement personnel with the requisite level of training and experience to adequately operate our equipment, our operations could be materially and adversely affected. A significant increase in the wages paid by other employers could result in a reduction in our workforce, increases in wage rates, or both. The occurrence of either of these events for a significant period of time could have a material adverse effect on our financial condition and results of operations.
Our acquisition strategy exposes us to various risks, including those relating to difficulties in identifying suitable acquisition opportunities and integrating businesses, assets and personnel, as well as difficulties in obtaining financing for targeted acquisitions and the potential for increased leverage or debt service requirements.
A component of our long-term business strategy is a pursuit of acquisitions of complementary assets and businesses, subject to the limitations imposed by our Term Loan, ABL Facility, and Senior Notes. This acquisition strategy in general involves numerous inherent risks, including:
unanticipated costs and assumption of liabilities and exposure to unforeseen liabilities of acquired businesses, including environmental liabilities;
difficulties in integrating the operations and assets of the acquired business and the acquired personnel;
limitations on our ability to properly assess and maintain an effective internal control environment over an acquired business in order to comply with applicable periodic reporting requirements;
potential losses of key employees and clients of the acquired businesses;
risks of entering markets in which we have limited prior experience; and
increases in our expenses and working capital requirements.
The process of integrating an acquired business may involve unforeseen costs and delays or other operational, technical and financial difficulties that may require a disproportionate amount of management attention and financial and other resources. Our failure to achieve consolidation savings, to incorporate the acquired businesses and assets into our existing operations successfully or to minimize any unforeseen operational difficulties could have a material adverse effect on our financial condition and results of operations.
In addition, we may not have sufficient capital resources to complete additional acquisitions. Historically, we have funded business acquisitions and the growth of our rig fleet through a combination of debt and equity financing. We may incur substantial additional indebtedness to finance future acquisitions and also may issue equity securities or convertible securities in connection with such acquisitions. Debt service requirements could represent a significant burden on our results of operations and financial condition and the issuance of additional equity or convertible securities could be dilutive to our existing shareholders. Furthermore, we may not be able to obtain additional financing on satisfactory terms or at all.
Even if we have access to the necessary capital, we may be unable to continue to identify additional suitable acquisition opportunities, negotiate acceptable terms or successfully acquire identified targets.
Our cash and cash equivalents and short term investments could be adversely affected if the financial institutions in which we hold our cash and cash equivalents fail.
We maintain cash balances at third-party financial institutions in excess of the Federal Deposit Insurance Corporation insurance limit. While we monitor the cash balances in the operating accounts and adjust the balances as appropriate, we may incur a loss to the extent such loss exceeds the insurance limitation, and there could be a material impact on our business, if one or more of the financial institutions with which we deposit fails or is subject to other adverse conditions in the financial or credit markets and bank regulators elect to impose losses on uninsured depositors. To date, we have experienced no loss or lack of access to our invested cash or cash equivalents. However, in the future, our invested cash and cash equivalents could be adversely affected by adverse conditions in the financial and credit markets.
•Our international operations are subject to political, economic and other uncertainties not generally encountered in our domestic operations.
Our international operations are subject to political, economic and other uncertainties not generally encountered in our U.S. operations which include, among potential others:
•risks of war, terrorism, civil unrest and kidnapping of employees;
•employee strikes, work stoppages, labor disputes and other slowdowns;
•expropriation, confiscation or nationalization of our assets;
•renegotiation or nullification of contracts;
foreign taxation, such as the tax for equality and the net-worth tax in Colombia;18
•foreign taxation;
•the inability to repatriate earnings or capital due to laws limiting the right and ability of foreign subsidiaries to pay dividends and remit earnings to affiliated companies;
•changing political conditions and changing laws and policies affecting trade and investment;
•trade and economic sanctions or other restrictions imposed by the United States or other countries;
•concentration of clients;
•regional economic downturns;
•the overlap of different tax structures;
•the burden of complying with multiple and potentially conflicting laws;
•the risks associated with the assertion of foreign sovereignty over areas in which our operations are conducted;
•the risks associated with any lack of compliance with the Foreign Corrupt Practices Act of 1977 (“FCPA”) or other anti-corruption laws;
•the risks associated with fluctuating currency values, hard currency shortages and controls of foreign currency exchange, and higher rates of inflation as compared to our domestic operations;
•difficulty in collecting international accounts receivable; and
•potentially longer payment cycles.
Additionally, we may be subject to foreign governmental regulations favoring or requiring the awarding of contracts to local contractors or requiring foreign contractors to employ citizens of, or purchase supplies from, a particular jurisdiction. These regulations could adversely affect our ability to compete.
We are committed to doing business in accordance with applicable anti-corruption laws and our code of conduct and ethics. We are subject, however, to the risk that our employees and agents may take action determined to be in violation of anti-corruption laws, including the FCPA or other similar laws. Any violation of the FCPA or other applicable anti-corruption laws could result in substantial fines, sanctions, civil and/or criminal penalties and curtailment of operations in certain jurisdictions and might materially adversely affect our business, results of operations or financial condition. In addition, actual or alleged violations could damage our reputation and ability to do business. Further, detecting, investigating, and resolving actual or alleged violations is expensive and can consume significant time and attention of our senior management.
•Our operations are subject to various laws and governmental regulations that could restrict our future operations and increase our operating costs.
Many aspects of our operations are subject to various federal, state and local laws and governmental regulations, including laws and regulations governing:
•remediation of contamination;
•preservation of natural resources;
Environment Protection. Our operations are subject to stringent federal, state and local laws, rules and regulations governing the protection of the environment and human health and safety.
Some of the laws, rules and regulations applicable to our industry relate to the disposal of hazardous substances, oilfield waste and other waste materials and restrict the types, quantities and concentrations of those substances that can be released into the environment. Several of those laws also require removal and remedial action and other cleanup under certain circumstances, commonly regardless of fault. Our operations routinely involve the handling of significant amounts of waste materials, some of which are classified as hazardous wastes and/or hazardous substances. Planning, implementation and maintenance of protective measures are required to prevent accidental discharges. Spills of oil, natural gas liquids, drilling fluids and other substances may subject us to penalties and cleanup requirements. Handling, storage and disposal of both hazardous and non-hazardous wastes are also subject to these regulatory requirements. In addition, our operations are often conducted in or near ecologically sensitive areas, such as wetlands or protected species habitats, which are subject to special protective measures and which
may expose us to additional operating costs and liabilities for accidental discharges of oil, gas, drilling fluids, contaminated water or other substances, or for noncompliance with other aspects of applicable laws and regulations.
The federal Clean Water Act; the Oil Pollution Act; the federal Clean Air Act; the federal Resource Conservation and Recovery Act; the federal Comprehensive Environmental Response, Compensation, and Liability Act (CERCLA); the Safe Drinking Water Act (SDWA); the federal Outer Continental Shelf Lands Act; the Occupational Safety and Health Act (OSHA); regulations implementing these federal statutes (such as the 2015“Navigable Waters of the United States rule, which may be rescinded pursuant to a proposalProtection Rule” issued in June 2017)on January 23, 2020); and their state counterparts and similar statutes are the primary statutes that impose the requirements described above and provide for civil, criminal and administrative penalties and other sanctions for violation of their requirements. The OSHA hazard communication standard, the Environmental Protection Agency (EPA) “community right-to-know” regulations under Title III of the federal Superfund Amendment and Reauthorization Act and comparable state statutes require us to organize and report information about the hazardous materials we use in our operations to employees, state and local government authorities and local citizens. In addition, CERCLA, also known as the “Superfund” law, and similar state statutes impose strict liability, without regard to fault or the legality of the original conduct, on certain classes of persons who are considered responsible for the release or threatened release of certain hazardous substances into the environment. These persons generally include the current owner or operator of a facility where a release has occurred, the owner or operator of a facility at the time a release occurred, and companies that disposed of or arranged for the disposal of hazardous substances found at a particular site. This liability may be joint and several. Such liability, which may be imposed for the conduct of others and for conditions others have caused, includes the cost of removal and remedial action as well as damages to natural resources. Few
defenses exist to the liability imposed by many environmental laws and regulations. It is also common for third parties to file claims for personal injury and property damage caused by substances released into the environment.
Environmental laws and regulations are complex and subject to frequent change.change, and the new Biden Administration is expected to revise existing environmental regulations and to pursue new initiatives. Failure to comply with governmental requirements or inadequate cooperation with governmental authorities could subject a responsible party to administrative, civil or criminal action. We may also be exposed to environmental or other liabilities originating from businesses and assets which we acquired from others. Our compliance with amended, new or more stringent requirements, stricter interpretations of existing requirements or the future discovery of contamination or regulatory noncompliance may require us to make material expenditures or subject us to liabilities that we currently do not anticipate.
There are a variety of regulatory developments, proposals or requirements and legislative initiatives that have been introduced in the United States and international regions in which we operate that are focused on restricting the emission of carbon dioxide, methane and other greenhouse gases. Further, President Biden has announced that he intends to take aggressive action to address climate-related issues and to set the United States on a path to be carbon-neutral by 2050. Among these developments at the international level is the United Nations Framework Convention on Climate Change, which produced the “Kyoto Protocol” (an internationally applied protocol, which has been ratified in Colombia, which is a location where we provide drilling services) in 1992. More recently, in December 2015, 195 countries adopted under the Framework Convention a resolution known as the “Paris Agreement” to reduce emissions of greenhouse gases with a goal of limiting global warming to below 2 °C (3.6 °F)2°C (36°F). The Paris Agreement does not establish enforceable emissions reduction targets, but countries may establish greenhouse gas reduction measures pursuant to the agreement. The agreement went into effect in November 2016. The United States ratified the Paris Agreement in September 2016. It2016 but withdrew in November 2020. President Biden has since notifiedsigned an order to rejoin the Paris Agreement. The new President has also announced a focus on climate-related issues and a goal of setting the United Nations of its intentStates on the path to withdraw from the Paris Agreement, but under the terms of the agreement the U.S. will remain a party until approximately August 2020. net-zero carbon emissions by 2050.
In addition, the U.S. Congress has from time to time considered legislation to reduce emissions of greenhouse gases, primarily through the development of greenhouse gas cap and trade programs. Also, more than one-third of the states already have begun implementing legal measures to reduce emissions of greenhouse gases. There have been two multi-state organizations devoted to climate action. The Regional Greenhouse Gas Initiative (RGGI) is located in the Northeastern and Mid-Atlantic United States. The Western Regional Climate Action Initiative once included multiple U.S. states and much of Canada, but allowance trading is now comprisedlimited to only California and Quebec, with a separate trading program administered for the province of California, British Columbia, Manitoba, Ontario, and Quebec.Nova Scotia.
In 2007, the United States Supreme Court, in Massachusetts, et al. v. EPA, held that carbon dioxide may be regulated as an “air pollutant” under the federal Clean Air Act. In December 2009, the EPA responded to this decision and issued a finding that the current and projected concentrations of greenhouse gases in the atmosphere threaten the public health and welfare of current and future generations, and that certain greenhouse gases from motor vehicles contribute to the atmospheric concentrations of greenhouse gases and hence to the threat of climate change.
Based on these findings, in 2010 Subsequently, the EPA adopted two setshas a number of climate change regulations, that restrict emissions of greenhouse gases under existing provisions of the federal Clean Air Act, including one that requires a reduction in emissions of greenhouse gases from motor vehicles and another that requires certain construction and operating permit reviews for greenhouse gas emissions from certain large stationary sources. In June 2014, the U.S. Supreme Court invalidated elements of the greenhouse gascontrol and permitting rule; however, the EPA can still impose certain greenhouse gas control requirements for certain large stationary sources. In addition, the EPA adopted rules requiring the monitoringsources, fuel economy standards for vehicles and reporting of greenhouse gases from certain sources, including, among others, onshore oil and natural gas production facilities.emissions standards for power plants.
In April 2012, the EPA issued regulations specifically applicableSpecific to the oil and gas industry, that require operatorsin April 2012, the EPA issued regulations to significantly reduce volatile organic compounds, or VOC, emissions from natural gas wells that are hydraulically fractured through the use of “green completions” to capture natural gas that would otherwise escape into the air. The EPA also issued regulations that establish standards for VOC emissions from several types of equipment at natural gas well sites, including storage tanks, compressors, dehydrators and pneumatic controllers.
In August 2015, the EPA finalized rules to limit carbon dioxide emissions from new and existing electric utility generating units. New units must meet specified carbon dioxide emissions limitations. The rules for existing units, known as the “Clean Power Plan,” were to require by 2030 an overall reduction in carbon dioxide emissions of 32% below the amount of carbon dioxide emitted in 2005. Although the EPA proposed repeal of the Clean Power Plan in October and December 2017, on December 28, 2017, the EPA issued an Advance Notice of Proposed Rulemaking soliciting comments on emissions reductions that might be promulgated in place of the Clean Power Plan.
In May 2016, the EPA issued a rule to reduce methane (a greenhouse gas) and VOC emissions from additional oil and gas operations. Among other requirements, the rules impose standards for hydraulically fractured oil wells and equipment leaks at oil and gas production sites and extend certain existing standards to downstream oil and gas operations. In April 2017,2020, the EPA granted reconsideration of aspects of this rule.amended the rule to relax regulatory requirements and to remove certain operations (relating to transport and storage) from rule applicability. We expect that the Biden Administration will reverse these changes. It is also possible that the new administration will impose more stringent requirements or promulgate additional rules concerning oil and gas emissions.
Although it is not possible at this time to predict whether proposed climate change initiatives will be adopted as initially written, if at all, or how legislation or new regulations that may be adopted to address greenhouse gas emissions would impact our business, any such future laws and regulations could result in increased compliance costs or additional operating restrictions. Any additional costs or operating restrictions associated with legislation or regulations regarding greenhouse gas emissions could have a material adverse effect on our operating results and cash flows. In addition, these developments could curtail the demand for fossil fuels such as oil and gas in areas of the world where our clients operate and thus adversely affect demand for our services, which may in turn adversely affect our future results of operations. Finally, we cannot predict with any certainty whether changes to temperature, storm intensity or precipitation patterns as a result of climate change will have a material impact on our operations.
In addition, our business depends on the demand for land drilling and production services from the oil and gas industry and, therefore, is affected by tax, environmental and other laws relating to the oil and gas industry generally, by changes in those laws and by changes in related administrative regulations. It is possible that these laws and regulations may in the future add significantly to our operating costs or those of our clients, or otherwise directly or indirectly affect our operations. It is possible that the Biden Administration will severely restrict oil and gas development on public lands. For example, the President has already announced a hold on new drilling permits for federal lands and waters and has proposed a moratorium on hydraulic fracturing on federal lands and waters. In addition, the new administration may restrict new oil and gas leasing on public lands.
Oil and gas development restrictions are also possible due to voter initiatives. For example, in 2018, Colorado voted on Proposition 112, which would have increased drilling location setbacks from 500 feet to 2,500 feet, severely limiting access to oil and gas minerals. Although Proposition 112 was defeated, future voter initiatives are possible in certain jurisdictions. Further, state legislators and regulators could seek to impose similar restrictions.
Our wireline operations involve the use of radioactive isotopes along with other nuclear, electrical, acoustic, and mechanical devices. Our activities involving the use of isotopes are regulated by the U.S. Nuclear Regulatory Commission and specified agencies of certain states. Additionally, we use high explosive charges for perforating casing and formations, and we use various explosive cutters to assist in wellbore cleanout. Such operations are regulated by the U.S. Department of Justice, Bureau of Alcohol, Tobacco, Firearms, and Explosives and require us to obtain licenses or other approvals for the use of densitometers as well as explosive charges. We have obtained these licenses and approvals when necessary and believe that we are in substantial compliance with these federal requirements.
Transportation. Among the services we provide, we operate as a motor carrier for the transportation of our own equipment and therefore are subject to regulation by the U.S. Department of Transportation and by various state agencies. These regulatory authorities exercise broad powers, governing activities such as the authorization to engage in motor carrier operations and regulatory safety. There are additional regulations specifically relating to the
trucking industry, including testing and specification of equipment and product handling requirements. The trucking industry is subject to possible regulatory and legislative changes that may affect the economics of the industry by requiring changes in operating practices or by changing the demand for common or contract carrier services or the cost of providing truckload services. Some of these possible changes include increasingly stringent environmental regulations, changes in the hours of service regulations which govern the amount of time a driver may drive in any specific period, onboard black box recorder devices or limits on vehicle weight and size.
Interstate motor carrier operations are subject to safety requirements prescribed by the U.S. Department of Transportation. To a large degree, intrastate motor carrier operations are subject to state safety regulations that mirror federal regulations. Such matters as weight and dimension of equipment are also subject to federal and state regulations.
From time to time, various legislative proposals are introduced, including proposals to increase federal, state, or local taxes, including taxes on motor fuels, which may increase our costs or adversely impact the recruitment of drivers. We cannot predict whether, or in what form, any increase in such taxes applicable to us will be enacted.
Worker safety. Our ability to retain existing customers and attract new business is dependent on many factors, including our ability to demonstrate that we can reliably and safely operate our business in a manner that is consistent with applicable laws, rules and permits. An accident or other event resulting in significant environmental or property damage, or injuries or fatalities involving our employees or other persons could also trigger investigations by federal, state or local authorities. Such an accident or other event could cause us to incur substantial expenses in connection with the investigation, remediation and resolution, as well as cause lasting damage to our reputation, loss of customers and an inability to obtain insurance.
•Federal and state legislative and regulatory initiatives related to hydraulic fracturing could result in operating restrictions or delays in the completion of oil and natural gas wells that may reduce demand for our drilling and well servicing activities and could adversely affect our financial position, results of operations and cash flows.
Hydraulic fracturing is a commonly used process that involves injection of water, sand, and a minor amount of certain chemicals to fracture the hydrocarbon-bearing rock formation to allow flow of hydrocarbons into the wellbore. Federal agencies have adopted new rules, such as the Bureau of Land Management’s (BLM) hydraulic fracturing rule finalized in March 2015, that impose additional requirements on the practice of hydraulic fracturing. In December 2017,The BLM has since rescinded the BLM rescinded this2016 rule, but therelitigation challenging the replacement rule is pending, and the Biden Administration may be litigationtake actions to reinstatere-propose the rule. In October 2016, the BLM updated its rules to restrict flaring associated with the development of oil and natural gas on public lands, including through hydraulic fracturing. Portions of the rule have been suspended until January 2019, but there may be litigation to reinstate the rule.
Additional federal regulations may also be developed. Several states are considering legislation to regulate hydraulic fracturing practices that could impose more stringent permitting, transparency, and well construction requirements on hydraulic-fracturing operations or otherwise seek to ban fracturing activities altogether. Hydraulic fracturing of wells and subsurface water disposal are also under public and governmental scrutiny due to concerns regarding potential environmental and physical impacts, including groundwater and drinking water impacts, as well as whether such activities may cause earthquakes.
The federal Energy Policy Act of 2005 amended the Underground Injection Control provisions of the federal Safe Drinking Water Act (SDWA) to exclude certain hydraulic fracturing practices from the definition of “underground injection.” The EPA has asserted regulatory authority over certain hydraulic fracturing activities involving diesel fuel and has developed guidance relating to such practices. In addition, repeal of the SDWA exclusion of hydraulic fracturing has been advocated by certain advocacy organizations and others in the public. Congress has from time to time considered legislation to repeal the exemption for hydraulic fracturing from the SDWA, which would have the effect of allowing the EPA to promulgate new regulations and permitting requirements for hydraulic fracturing, and to require the disclosure of the chemical constituents of hydraulic fracturing fluids to a regulatory agency, which would make the information public via the Internet. For example, in May 2014, the EPA responded to a petition by environmental groups by issuing an Advanced Notice of Proposed Rulemaking to solicit input regarding whether the agency should require manufacturers and processors of hydraulic fracturing chemicals to report composition and usage of such chemicals and to disclose associated health and safety studies.
Scrutiny of hydraulic fracturing activities continues in other ways, with the EPA having completed a multi-year study of the potential environmental impacts of hydraulic fracturing. The Final Report issued by the EPA in December 2016 concluded that hydraulic fracturing activities can impact drinking water resources under some circumstances and identified conditions under which impacts can be more frequent or severe. In addition, in April 2012, the EPA issued the first federal air standards for natural gas wells that are hydraulically fractured, which require operators to significantly reduce VOC emissions through the use of “green completions” to capture natural gas that would otherwise escape into the air. These new rules address emissions of various pollutants frequently associated with oil and natural gas production and processing activities by, among other things, requiring new or
reworked hydraulically-fractured gas wells to control emissions through flaring or reduced emission (or “green”) completions. The rules also establish specific new requirements, which were effective in 2012, for emissions from compressors, controllers, dehydrators, storage tanks, gas processing plants, and certain other equipment. The EPA has amended these rules several times. In May 2016, the EPA finalized a rule to reduce methane (a greenhouse gas) and VOC emissions from oil and gas operations. An amendment in 2020 relaxed some of the rule requirements and removed applicability for some sources (in the transport and storage segments of the oil and gas industry), but the Biden Administration is expected to reverse this amendment. It is also possible that the EPA will further amend its oil and gas regulations.regulations to impose more stringent requirements. These rules may require a number of modifications to our clients’ and our own operations, including the installation of new equipment to control emissions. Compliance with such rules could result in additional costs for us and our clients, including increased capital expenditures and operating costs, which may adversely impact our cash flows and results of operations.
The EPA has also developed effluent limitations for the treatment and discharge of wastewater resulting from hydraulic fracturing activities to publicly owned treatment works (POTW). The agency’s final regulations, published on June 28, 2016, prohibited any discharge of wastewater pollutants from onshore unconventional oil and gas extraction facilities to a POTW. The EPA willwas also be assessingrequired, pursuant to a Consent Decree with environmental groups, to reevaluate whether oil and gas wastes should continue to be exempt from being considered hazardous waste underwastes. Although the federal Resource Conservation and Recovery Act, pursuantEPA concluded in April 2019 that no changes to a Consent Decree with environmental groups approvedthe existing exemption are needed, similar lawsuits could be brought in federal court in December 2016.the future. The U.S. Department of the Interior has also finalized regulations relating to the use of hydraulic fracturing techniques on public lands and disclosure of fracturing fluid constituents (i.e. the BLM’s hydraulic fracturing rule issued in March 2015) and has finalized, in October 2016, a rule to reduce flaring and venting associated with oil and gas operations on public lands. The BLM rules have since been rescinded, or delayed, but it is possible that they will be reinstated through litigation.litigation or through rulemaking by the new Biden Administration.
In addition, some states and localities have adopted, and others are considering adopting, regulations or ordinances that could restrict hydraulic fracturing in certain circumstances, that would require, with some exceptions, disclosure of constituents of hydraulic fracturing fluids, or that would impose higher taxes, fees or royalties on natural gas production. Moreover, public debate over hydraulic fracturing and shale gas production continued to see strong public opposition, and has resulted in delays of well permits in some areas.
In June 2014, the State of New York’s Court of Appeals upheld the right of individual municipalities in the State of New York to ban hydraulic fracturing using zoning restrictions. In December 2014, New York State Governor Cuomo announced that hydraulic fracturing will be permanently banned in the state. Similarly situated municipalities in other states may seek to ban or restrict resource extraction operations within their borders using zoning and/or setback
restrictions, which could adversely affect the ability of resource extraction enterprises to operate in certain parts of the country, and thus adversely affect demand for our services, which may in turn adversely affect our future results of operations. It is also possible that similar actions will be taken at the federal level, in light of a proposal by President Biden to impose a moratorium on hydraulic fracturing on federal lands and waters pending further study of the impacts of fracking and oil and gas production.
Increased regulation and attention given to the hydraulic fracturing process could lead to greater opposition, including litigation, to oil and gas production activities using hydraulic fracturing techniques. Additional legislation or regulation could also lead to operational delays or increased operating costs in the production of oil and natural gas, including from the developing shale plays, incurred by our clients. The adoption of any federal, state or local laws or the implementation of regulations or ordinances restricting or increasing the costs of hydraulic fracturing could cause a decrease in the completion of new oil and natural gas wells and an associated decrease in demand for our drilling and well servicing activities, any or all of which could adversely affect our financial position, results of operations and cash flows.
•Our operations are subject to cybersecurity risks.
Our operations are increasingly dependent on information technologies and services. Threats to information technology systems associated with cybersecurity risks and cyber incidents or attacks continue to grow, and include, among other things, storms and natural disasters, terrorist attacks, utility outages, theft, viruses, malware, design defects, human error, or complications encountered as existing systems are maintained, repaired, replaced, or upgraded. Risks associated with these threats include, among other things:
•loss, corruption, or misappropriation of intellectual property, or other proprietary or confidential information (including client, supplier, or employee data);
•disruption or impairment of our and our customers’clients’ business operations and safety procedures;
•loss or damage to our worksite data delivery systems; and
•increased costs to prevent, respond to or mitigate cybersecurity events.
Although we utilize various procedures and controls to mitigate our exposure to such risk, cybersecurity attacks and other cyber events are evolving and unpredictable. Moreover, we do not have control over the information technology systems of our clients, suppliers, and others with which our systems may connect and communicate. As a result, the occurrence of a cyber incident could go unnoticed for a period time. Any such incident could have a material adverse effect on our business, financial condition and results of operations.
•Future acquisitions or dispositions may not result in the realization of savings and efficiencies, the generation of cash flow or income, or the reduction of risk as contemplated by management, and may have a material adverse effect on our liquidity, results of operations and financial condition.
From time to time and subject to any limitations set forth in our debt agreements, we may seek opportunities to maximize efficiency and value through various transactions including the sale of assets or businesses, or the pursuit of acquisitions of complementary assets or businesses. These transactions are subject to inherent risks, including:
•the use of capital for acquisitions may adversely affect our cash available for other uses;
•unanticipated costs, assumption of liabilities or exposure to unforeseen liabilities of acquired businesses;
•difficulties in integrating the operations, assets and employees of the acquired business;
•difficulties in maintaining an effective internal control environment over an acquired business;
•risks of entering markets in which we have limited prior experience;
•decreased earnings, revenues or cash flow resulting from dispositions; and
•increases in our expenses and working capital requirements.
The process of integrating an acquired business may involve unforeseen costs and delays or other operational, technical and financial difficulties that may require a disproportionate amount of management attention and financial and other resources. Our failure to achieve consolidation savings, to incorporate the acquired businesses and assets into our existing operations successfully or to minimize any unforeseen operational difficulties could have a material adverse effect on our financial condition and results of operations.
In addition, we may not have sufficient capital resources to complete additional acquisitions. Historically, we have funded business acquisitions and the growth of our fleets through a combination of debt and equity financing. Subject to the limitations set forth in our debt agreements, we may incur substantial additional indebtedness to finance future acquisitions and also may issue equity securities or convertible securities in connection with such acquisitions. Such debt service requirements could represent a significant burden on our results of operations and financial condition and the issuance of additional equity or convertible securities could be dilutive to our existing stockholders. Furthermore, we may not be able to obtain additional financing on satisfactory terms or at all. Even if we have access to the necessary capital, we may be unable to continue to identify additional suitable acquisition opportunities, negotiate acceptable terms or successfully acquire identified targets.
Our current debt agreements contain covenants that limit our ability to make acquisitions and incur, assume, or guarantee any additional indebtedness.
•The uncertainty regarding the potential phase-out of LIBOR may negatively impact our operating results.
On July 27, 2017, the Financial Conduct Authority in the United Kingdom announced that it would phase out LIBOR, the London Interbank Offer Rate, as a benchmark by the end of 2021, when private-sector banks are no
longer required to report the information used to set the rate. LIBOR is the basic rate of interest used in lending between banks on the London interbank market and is widely used as a reference for setting the interest rate on loans globally. It is unclear whether new methods of calculating LIBOR will be established such that it continues to exist after 2021. At this time, no consensus exists as to what rate or rates will become accepted alternatives to LIBOR, although the U.S. Federal Reserve is considering replacing U.S. dollar LIBOR with a newly created index called the Broad Treasury Financing Rate, calculated with a broad set of short-term repurchase agreements backed by treasury securities. In the future, we may need to renegotiate our current debt agreements or incur other indebtedness, and the phase-out of LIBOR may negatively impact the terms of such indebtedness. In addition, the overall financial market may be disrupted as a result of the phase-out or replacement of LIBOR. Disruption in the financial market could have a material adverse effect on our financial position, results of operations, and liquidity.
Risks Relating to Our Capital Resources and Organization
•We have a significant amount of debt and despite our current level of indebtedness, we may still be able to incur more debt. Our debt levels and the restrictions imposed on us by our debt agreements may have significant consequences, including limiting our liquidity and flexibility for successfully operating our business, pursuing business opportunities, and obtaining additional financing.
Our level of indebtedness could prevent us from engaging in transactions that might otherwise be beneficial to us and could put us at a competitive disadvantage relative to other less leveraged competitors that have more cash flow to devote to their operations. Because we may have to dedicate a substantial portion of our operating cash flow to make interest and principal payments, we could be limited in our ability to:
•make investments in working capital or capital expenditures;
•obtain additional financing that may be necessary to fund or expand our operations; and
•withstand and respond to changes or events in our business, our industry or the economy in general.
The incurrence of additional indebtedness could exacerbate the above risks and make it more difficult to satisfy our existing financial obligations.
We also may be prevented from taking advantage of business opportunities that arise because of the limitations imposed on us by the restrictive covenants under our debt agreements that, among other things, and subject to certain exceptions limit our ability to:
•incur, assume, or guarantee additional indebtedness;
•make investments;
•transfer or sell assets;
•create liens;
•enter into mergers or consolidations; and
•issue equity securities.
The failure to comply with any of these covenants would cause an event of default under our debt agreements which if not waived, could result in acceleration of the outstanding indebtedness under our debt agreements, in which case the debt would become immediately due and payable. If this occurs, we may not be able to pay our debt or borrow sufficient funds to refinance it.
•We may be unable to repay or refinance our debt as it becomes due, whether at maturity or as a result of acceleration.
Our ability to meet our debt service obligations depends on our ability to generate positive cash flows from operations. We have in the past incurred, and may incur in the future, negative cash flows from our operating activities. Our ability to generate positive cash flows in the future will be influenced by:
•general industry, economic and financial conditions;
•the level of commodity prices in our industry and the level of demand for our services;
•competition in the markets where we operate; and
•other factors affecting our operations, many of which are beyond our control.
If our business does not generate sufficient cash flow from operations to service our outstanding indebtedness, we may have to undertake alternative financing plans, such as:
•refinancing or restructuring our debt;
•selling assets;
•reducing or delaying capital investments, including maintenance or refurbishment of our equipment; and/or
•seeking to raise additional capital.
We may not be able to repay our debt as it comes due, or to refinance our debt on a timely basis or on terms acceptable to us and within the limitations contained in our debt agreements. Failure to repay or to timely refinance any portion of our debt could result in a default under the terms of all our debt instruments and the acceleration of all indebtedness outstanding.
•Our current operations and future growth may require significant additional capital, and the amount and terms of our indebtedness could impair our ability to fund our capital requirements.
Our business requires substantial capital, and we may require additional capital in the event of significant departures from our current business plan, unanticipated maintenance or capital requirements, or to pursue growth opportunities. However, additional financing may not be available on a timely basis or on terms acceptable to us and within the limitations contained in our debt agreements. To some extent, our ability to obtain additional capital is also reliant on the public perception of our industry, which may influence investors’ willingness to invest in the energy sector.
Failure to obtain additional financing, should the need for it develop, could impair our ability to fund working capital and capital expenditure requirements and meet debt service requirements, which could have a material adverse impact on our business.
•We expect that our ability to use our net operating losses and certain other tax attributes will be substantially limited.
Our ability to utilize our net operating loss carryforwards and certain other tax credit carryforwards might be limited.
attributes to offset future taxable income and to reduce our U.S. federal income tax liability is subject to certain governing rules and restrictions. Section 382 of the U.S. Internal Revenue Code (“Section 382”) contains rules that limit the ability of a company that undergoes an ownership change“ownership change” to utilize its net operating losses and certain other tax credit carryforwardsattributes existing as of the date of such ownership change. Under the rules, suchUpon our emergence from Chapter 11, we underwent an ownership change, is generally any change in ownership of more than 50% of a company’s stock within a rolling three-year period. The rules generally operate by focusing on changes in ownership among shareholders owning, directly or indirectly, 5% or more of the stock of a company and any change in ownership arising from new issuances of stock by the company.
If we were to undergo one or more “ownership changes” as defined by Section 382,in the IRC, which will result in future annual limitations on the usage of our remaining domestic net operating losses and certain of our tax credits existing as of the date of each ownership change may be unavailable, in whole or in part, to offset U.S. federal income tax resulting from our operations or any gains from the disposition of any of our assets and/or business, which could result in increased U.S. federal income tax liability.losses.
Risks Relating to Our CapitalizationCommon Stock
•We cannot assure you that an active trading market for our common stock will develop or be maintained, and Organizational Documentsthe market price of our common stock may be volatile, which could cause the value of your investment to decline.
Our shares of common stock are not currently listed on any stock exchange or quoted on any over-the-counter market. Although we anticipate the trading of our new common stock on the OTC market to commence again in the near future, we cannot assure you that an active public market for our common stock will develop or, if it develops, that it will be sustained. In the absence of an active public trading market, it may be difficult to liquidate your investment in our common stock.
In the event our common stock commences trading, the trading price of our common stock may fluctuate significantly. Numerous factors, including many over which we have no control, may have a significant impact on the market price of our common stock. These factors include, among other things:
•our operating and financial performance and prospects;
•our ability to repay our debt;
•investor perceptions of us and the industry and markets in which we operate;
•future sales, or the availability for sale, of equity or equity-related securities;
•changes in earnings estimates or buy/sell recommendations by analysts;
•conversion of our Convertible Notes;
•limited trading volume of our common stock; and
•general financial, domestic, economic and other market conditions.
•In the event our common stock commences trading, the trading price of our common stock may not accurately reflect the value of our business.
Upon our emergence from Chapter 11, ownership of our common stock is highly concentrated, and there are a limited number of shares available for trading on any public market. As a result, any future reported trading prices for our common stock at any given time may not accurately reflect the underlying economic value of our business at that time. Any future reported trading prices could be higher or lower than the price a stockholder would be able to receive in a sale transaction, and there can be no assurance that there will be sufficient public trading in our common stock in the future to create a liquid trading market that accurately reflects the underlying economic value of our business.
•We do not intend to pay dividends on our new common stock in the foreseeable future, and therefore only appreciation of the price of our new common stock will provide a return to our shareholders.stockholders.
We havedo not paidintend to pay or declareddeclare any dividends on our new common stock and currently intend to retain any earnings to fund our working capital needs, reduce debt and fund growth opportunities. Any future dividends will be at the discretion of our board of directors after taking into account various factors it deems relevant, including our financial condition and performance, cash needs, income tax consequences and restrictions imposed by the Texas Business Organizations CodeDelaware General Corporation Law and other applicable laws and by our Term Loan,Senior Secured Notes, ABL Credit Facility, and SeniorCovertible Notes. Our debt arrangements includeagreements includes provisions that generally prohibit us from paying dividends on our capital stock, including our new common stock.
•We may issue preferred stock whose terms could adversely affect the voting power or value of our new common stock.
Our articlescertificate of incorporation authorizeauthorizes us to issue, without the approval of our shareholders,stockholders, one or more classes or series of preferred stock having such designations, preferences, limitations and relative rights, including preferences over our new common stock respecting dividends and distributions, as our board of directors may determine; however, our issuance of preferred stock is subject to the limitations imposed on us by our ABL Facility and Senior Notes.debt agreements. The terms of one or more classes or series of preferred stock could adversely impact the voting power or value of our new common stock. For example, we might grant holders of preferred stock the right to elect some number of our directors in all events or on the happening of specified events or the right to veto specified transactions.
Similarly, the repurchase or redemption rights or liquidation preferences we might assign to holders of preferred stock could affect the residual value of theour new common stock.
•Provisions in our organizational documents could delay or prevent a change in control of our company even if that change would be beneficial to our shareholders.stockholders.
The existence of some provisions in our organizational documents could delay or prevent a change in control of our company even if that change would be beneficial to our shareholders.stockholders. Our articlescertificate of incorporation and bylaws contain provisions that may make acquiring control of our company difficult, including:
•provisions regulating the ability of our shareholdersstockholders to nominate candidates for election as directors or to bring matters for action at annual meetings of our shareholders;stockholders;
•limitations on the ability of our shareholdersstockholders to call a special meeting and act by written consent; and
provisions dividing our board of directors into three classes elected for staggered terms; and
•the authorization given to our board of directors to issue and set the terms of preferred stock.
| |
ITEM 1B. | UNRESOLVED STAFF COMMENTS |
ITEM 1B.UNRESOLVED STAFF COMMENTS
Not applicable.
ITEM 2. PROPERTIES
Our principal executive offices are located at 1250 N.E. Loop 410, Suite 1000, San Antonio, Texas 78209. For a description of our significant properties, see “Business—General”Company Overview” and “Business—Facilities”Facilities” in Item 1 of this report. We believe that we have sufficient properties to conduct our operations and that our significant properties are suitable and adequate for their intended use.
Due to the nature of our business, we are, fromITEM 3. LEGAL PROCEEDINGS
From time to time, we are involved in routine litigation or subject to disputes or claims related toarising out of our business activities, including workers’ compensation claims and employment-related disputes. In the opinion of our management, none of the pending litigation, disputes or claims against us will have a material adverse effect on our financial condition, or results of operations.operations or cash flows. For information on Legal Proceedings, see Note 14, Commitments and Contingencies, of the Notes to Consolidated Financial Statements, included in Part II, Item 8 Financial Statements and Supplementary Data, of this Annual Report on Form 10-K.
| |
ITEM 4. | MINE SAFETY DISCLOSURES |
ITEM 4. MINE SAFETY DISCLOSURES
Not applicable.
PART II
| |
ITEM 5. | ITEM 5.MARKET FOR REGISTRANT’S COMMON EQUITY, RELATED STOCKHOLDER MATTERS AND ISSUER PURCHASES OF EQUITY SECURITIES There is no established public trading market for our common stock. Our Predecessor common stock previously traded on the New York Stock Exchange (NYSE) under the symbol “PES.” As a result of our abnormally low trading price levels, the NYSE delisted our Predecessor common stock on August 14, 2019. Our Predecessor common stock subsequently traded on the OTC Markets under the symbol “PESX” until March 3, 2020, at which time, due to our voluntary Chapter 11 filing, it commenced trading on the OTC Pink marketplace under the trading symbol “PESXQ.” On May 29, 2020, upon emergence from Chapter 11, all outstanding shares of our Predecessor common stock were cancelled, and we issued a total of 1,049,804 shares of new common stock. As a result of the cancellation of our Predecessor common stock, the Company ceased trading on the OTC Pink marketplace. MARKET FOR REGISTRANT’S COMMON EQUITY, RELATED SHAREHOLDER MATTERS AND ISSUER PURCHASES OF EQUITY SECURITIES
|
As of January 31, 2018, 77,794,527February 26, 2021, 1,647,224 shares of our common stock were outstanding, held by 300 shareholders68 stockholders of record. The number of record holders does not necessarily bear any relationship to the number of beneficial owners of our common stock.
Our common stock trades on the New York Stock Exchange under the symbol “PES.” The following table sets forth, for each of the periods indicated, the high and low sales prices per share:
|
| | | | | | | |
| | Low | | High |
| Year ended December 31, 2017 | | | |
| First Quarter | $ | 3.65 |
| | $ | 7.20 |
|
| Second Quarter | 1.70 |
| | 4.50 |
|
| Third Quarter | 1.60 |
| | 2.65 |
|
| Fourth Quarter | 1.70 |
| | 3.20 |
|
| | | | |
| Year ended December 31, 2016 | | | |
| First Quarter | $ | 0.95 |
| | $ | 2.46 |
|
| Second Quarter | 1.98 |
| | 5.05 |
|
| Third Quarter | 2.64 |
| | 4.89 |
|
| Fourth Quarter | 3.35 |
| | 7.15 |
|
The last reported sales price for our common stock on the New York Stock Exchange on January 31, 2018 was $3.25 per share.
We have not paid or declared any dividends on our common stock and currently intend to retain earnings to fund our working capital needs and growth opportunities. Any future dividends will be at the discretion of our board of directors after taking into account various factors it deems relevant, including our financial condition and performance, cash needs, income tax consequences and the restrictions imposed by the Texas Business Organizations CodeDelaware General Corporation Law and other applicable laws andlaws. Additionally, our Term Loan, ABL Facility, and Senior Notes. Our debt arrangementsagreements include provisions that generally prohibit us from paying dividends on our capital stock.
We did not make any unregistered sales of equity securities during the quarter ended December 31, 2017.2020. No shares of our common stock were purchased by or on behalf of our company or any affiliated purchaser during the quarter ended December 31, 2017.2020.
Performance Graph
The following graph compares, for the periods from December 31, 2012 to December 31, 2017, the cumulative total shareholder return on our common stock with the cumulative total return on the companies that comprise the NYSE Composite Index and a peer group index that includes five companies that provide contract drilling services and/or production services.
The companies that comprise the peer group index are Patterson-UTI Energy, Inc., Nabors Industries Ltd., Basic Energy Services, Inc., Key Energy Services and Precision Drilling Corporation, and have been weighted according to each company’s stock market capitalization. Two of the companies in the peer group, Basic Energy Services, Inc. and Key Energy Services, filed for bankruptcy protection in 2016 under Chapter 11 of the United States Bankruptcy Code, which significantly decreased the market capitalization of these peers, as well as their impact on the total return calculated for the peer group.
The comparison assumes that $100 was invested on December 31, 2012 in our common stock, the companies that compose the NYSE Composite Index and the peer group index, and further assumes all dividends were reinvested.
| |
ITEM 6. | SELECTED FINANCIAL DATA |
The following information derives from our audited financial statements. This information should be reviewed in conjunction with “Management’s Discussion and Analysis of Financial Condition and Results of Operations” in Item 7 of this report and the financial statements and related notes this report contains.ITEM 6.SELECTED FINANCIAL DATA
Not applicable.
|
| | | | | | | | | | | | | | | | | | | |
| | Year ended December 31, |
| | 2017 | | 2016 | | 2015 | | 2014 | | 2013 |
| | (In thousands, except per share amounts) |
Statement of Operations Data (1) | | | | | | | | | |
| Revenues | $ | 446,455 |
| | $ | 277,076 |
| | $ | 540,778 |
| | $ | 1,055,223 |
| | $ | 960,186 |
|
| Income (loss) from operations | (51,230 | ) | | (113,448 | ) | | (166,700 | ) | | 23,984 |
| | (6,229 | ) |
| Income (loss) before income taxes | (79,321 | ) | | (139,123 | ) | | (192,719 | ) | | (49,322 | ) | | (55,778 | ) |
| Net earnings (loss) applicable to common shareholders | (75,118 | ) | | (128,391 | ) | | (155,140 | ) | | (38,018 | ) | | (35,932 | ) |
| Earnings (loss) per common share-basic | $ | (0.97 | ) | | $ | (1.96 | ) | | $ | (2.41 | ) | | $ | (0.60 | ) | | $ | (0.58 | ) |
| Earnings (loss) per common share-diluted | $ | (0.97 | ) | | $ | (1.96 | ) | | $ | (2.41 | ) | | $ | (0.60 | ) | | $ | (0.58 | ) |
| | | | | | | | | | |
Other Financial Data (1) | | | | | | | | | |
| Net cash provided by (used in) operating activities | $ | (5,817 | ) | | $ | 5,131 |
| | $ | 142,719 |
| | $ | 233,041 |
| | $ | 174,580 |
|
| Net cash used in investing activities | (47,364 | ) | | (24,767 | ) | | (101,656 | ) | | (151,918 | ) | | (150,676 | ) |
| Net cash provided by (used in) financing activities | 118,635 |
| | 15,670 |
| | (61,827 | ) | | (73,584 | ) | | (20,252 | ) |
| Capital expenditures | 61,447 |
| | 32,556 |
| | 142,907 |
| | 188,121 |
| | 125,420 |
|
|
| | | | | | | | | | | | | | | | | | | |
| | As of December 31, |
| | 2017 | | 2016 | | 2015 | | 2014 | | 2013 |
| | (In thousands) |
| Balance Sheet Data: | | | | | | | | | |
| Working capital | $ | 130,645 |
| | $ | 47,994 |
| | $ | 45,226 |
| | $ | 121,882 |
| | $ | 118,547 |
|
| Property and equipment, net | 549,623 |
| | 584,080 |
| | 702,585 |
| | 856,541 |
| | 937,657 |
|
| Long-term debt, excluding current portion, debt issuance costs and discount | 475,000 |
| | 346,000 |
| | 395,000 |
| | 455,053 |
| | 499,666 |
|
| Shareholders’ equity | 210,096 |
| | 281,398 |
| | 342,643 |
| | 495,064 |
| | 518,433 |
|
| Total assets | 766,869 |
| | 700,102 |
| | 821,975 |
| | 1,171,589 |
| | 1,229,623 |
|
| |
(1)
| The statement of operations and other financial data reflect the impact of impairment charges as follows: |
|
| | | | | | | | | | | | | | | | | | | |
| | Year ended December 31, |
| | 2017 | | 2016 | | 2015 | | 2014 | | 2013 |
| | (In thousands) |
| Property and equipment | $ | 1,902 |
| | $ | 12,815 |
| | $ | 114,813 |
| | $ | 73,025 |
| | $ | 9,492 |
|
| Intangible assets | — |
| | — |
| | 14,339 |
| | — |
| | 3,100 |
|
| Goodwill | — |
| | — |
| | — |
| | — |
| | 41,700 |
|
| |
ITEM 7. | MANAGEMENT’S DISCUSSION AND ANALYSIS OF FINANCIAL CONDITION AND RESULTS OF OPERATIONS |
ITEM 7. MANAGEMENT’S DISCUSSION AND ANALYSIS OF FINANCIAL CONDITION AND RESULTS OF OPERATIONS
Statements we make in the following discussion that express a belief, expectation or intention, as well as those that are not historical fact, are forward-looking statements made in good faith that are subject to risks, uncertainties and assumptions. These forward-looking statements are based on our current beliefs, intentions, and expectations and are not guarantees or indicators of future performance. Our actual results, performance or achievements, or industry results, could differ materially from those we express in the following discussion as a result of a variety of factors, including risks and uncertainties relating to the effects of our bankruptcy on our business and relationships, the concentration of our equity ownership following bankruptcy, the application of fresh start accounting, the effect of the coronavirus (COVID-19) pandemic on our industry, general economic and business conditions and industry trends, levels and volatility of oil and gas prices, the continued demand for drilling services or production services in the geographic areas where we operate, decisions about exploration and development projects to be made by oil and gas exploration and production companies, the highly competitive nature of our business, the supply of marketable equipment within the industry, technological advancements and trends in our industry and improvements in our competitors' equipment, the loss of one or more of our major clients or a decrease in their demand for our services, future compliance with covenants under debt agreements, including our senior secured term loan, our senior secured revolving asset-based credit facility, and our senior notes, operating hazards inherent in our operations, the supply of marketable drilling rigs, well servicing rigs, coiled tubing units and wireline units within the industry, the continued availability of new components for drilling rigs, well servicing rigs, coiled tubing unitssupplies, equipment and wireline units, the continued availability of qualified personnel the success or failure ofrequired to operate our acquisition strategy, including our ability to finance acquisitions, manage growth and effectively integrate acquisitions,fleets, the political, economic, regulatory and other uncertainties encountered by our operations, and changes in, or our failure or inability to comply with, governmental regulations, including those relating to the environment.environment, the occurrence of cybersecurity incidents, the success or failure of future acquisitions or dispositions, our level of indebtedness and future compliance with covenants under our debt agreements, and the impact of not having our common stock listed on a national securities exchange or quoted on an over-the-counter market. We have discussed many of these factors in more detail elsewhere in this report,, including under the headings “Risk Factors” in Item 1A and “Special Note Regarding Forward-Looking Statements”Statements and Risk Factor Summary” in the Introductory Note to Part I and “Risk Factors” in Item 1A.I. These factors are not necessarily all the important factors that could affect us.Other unpredictable or unknown factors could also have material adverse effects on actual results of matters that are the subject of our forward-looking statements. All forward-looking statements speak only as of the date on which they are made and we undertake no obligation to publicly update or revise any forward-looking statements whether as a result of new information, future events or otherwise. We advise our shareholdersstockholders that they should (1) recognize that important factors not referred to above could affect the accuracy of our forward-looking statements and (2) use caution and common sense when considering our forward-looking statements.
Recent Developments
Reorganization and Emergence from Chapter 11
On March 1, 2020, we filed a petition for reorganization under Chapter 11 of the Bankruptcy Code. On May 11, 2020, the Bankruptcy Court confirmed the plan of reorganization (the “Plan”) that was filed with the Bankruptcy Court on March 2, 2020, and on May 29, 2020 (the “Effective Date”), the conditions to effectiveness of the Plan were satisfied, and the Pioneer RSA Parties emerged from Chapter 11. Our completion of the Chapter 11 Cases has allowed us to significantly reduce our level of indebtedness and our future cash interest obligations.
On the Effective Date, all applicable agreements governing the obligations under the Term Loan, Prepetition Senior Notes and Prepetition ABL Facility were terminated. The Term Loan and Prepetition ABL Facility were paid in full and all outstanding obligations under the Prepetition Senior Notes were canceled in exchange for 94.25% of the pro forma common equity. On the Effective Date, we entered into a $75 million senior secured asset-based revolving credit agreement which was later amended and reduced to $40 million in August 2020 (the “ABL Credit Facility”), and issued $129.8 million of aggregate principal amount of 5% convertible senior unsecured pay-in-kind notes due 2025 (the “Convertible Notes”) and $78.1 million of aggregate principal amount of floating rate senior secured notes due 2025 (the “Senior Secured Notes”), the proceeds of which were used to repay our outstanding Term Loan and certain related fees, all of which are described in more detail in the Liquidity and Capital Resources section below, under the headings entitled ABL Credit Facility and Debt Instruments and Compliance Requirements.
Also on the Effective Date, by operation of the Plan, all agreements, instruments, and other documents evidencing, relating to or connected with any equity interests of the Company, including the existing common stock, issued and outstanding immediately prior to the Effective Date, and any rights of any holder in respect thereof, were deemed canceled, discharged and of no force or effect. Pursuant to the Plan, we issued a total of 1,049,804 shares of our new common stock, with approximately 94.25% of such new common stock being issued to holders of the Prepetition Senior Notes outstanding immediately prior to the Effective Date. Holders of the existing common stock received an aggregate of 5.75% of the proforma common equity (subject to the dilution from the Convertible Notes and new management incentive plan), at a conversion rate of 0.0006849838 new shares for each existing share.
As part of the transactions undertaken pursuant to the Plan, we converted from a Texas corporation to a Delaware corporation, filed the Certificate of Incorporation of the Company with the office of the Secretary of State of the State of Delaware, and adopted Amended and Restated Bylaws of the Company.
Shares of our Predecessor common stock were delisted from the OTC Pink Marketplace, and shares of our new common stock are not currently listed on any stock exchange or quoted on any over-the-counter market. We anticipate the trading of our new common stock on the OTC market to commence again in the near future.
For additional information concerning our bankruptcy proceedings under Chapter 11, see Note 2, Emergence from Voluntary Reorganization under Chapter 11,of the Notes to Consolidated Financial Statements included in Part II, Item 8 Financial Statements and Supplementary Data.
Fresh Start Accounting — The financial statements included herein have been prepared as if we are a going concern and in accordance with Financial Accounting Standards Board (FASB) Accounting Standards Codification (ASC) Topic 852, Reorganizations (ASC Topic 852). In connection with our emergence from bankruptcy and in accordance with ASC Topic 852, we qualified for and adopted fresh start accounting on the Effective Date. We were required to adopt fresh start accounting because (i) the holders of existing voting shares of the Predecessor Company received less than 50% of the voting shares of the Successor Company, and (ii) the reorganization value of our assets immediately prior to confirmation of the Plan was less than the post-petition liabilities and allowed claims.
We evaluated the events between May 29, 2020 and May 31, 2020 and concluded that the use of an accounting convenience date of May 31, 2020 (the “Fresh Start Reporting Date”) would not have a material impact on our consolidated financial statements. As such, the application of fresh start accounting was reflected in our consolidated balance sheet as of May 31, 2020 and related fresh start accounting adjustments were included in our consolidated statement of operations for the five months ended May 31, 2020.
In accordance with ASC Topic 852, with the application of fresh start accounting, we allocated the reorganization value to our individual assets and liabilities (except for deferred income taxes) based on their estimated fair values in
conformity with ASC Topic 805, Business Combinations. The amount of deferred taxes was determined in accordance with ASC Topic 740, Income Taxes. The Effective Date fair values of our assets and liabilities differed materially from their recorded values as reflected on the historical balance sheets. For additional information about the application of fresh start accounting, see Note 3, Fresh Start Accounting,of the Notes to Consolidated Financial Statements included in Part II, Item 8 Financial Statements and Supplementary Data.
As a result of the application of fresh start accounting and the effects of the implementation of the Plan, our consolidated financial statements after the Effective Date are not comparable with the consolidated financial statements on or before that date as indicated by the “black line” division in the financial statements and footnote tables, which emphasizes the lack of comparability between amounts presented. References to “Successor” relate to our financial position and results of operations after the Effective Date. References to “Predecessor” refer to our financial position and results of operations on or before the Effective Date.
Industry Impacts
Measures taken by federal, state and local governments, both globally and domestically, to reduce the rate of spread of COVID-19 resulted in a decrease in general economic activity and a corresponding decrease in global and domestic energy demand in 2020, which negatively impacted oil and gas prices, and which in turn reduced demand for, and the pricing of, products and services provided to the oil and gas industry, including the products and services which we provide. In addition, actions by OPEC and a group of other oil-producing nations led by Russia further disrupted the supply and demand economics and negatively impacted crude oil prices. These events pushed crude oil storage near capacity and drove prices down significantly, as described further in the below section entitled “Market Conditions and Outlook”. Although the recovery of supply chain disruptions and the approval of COVID-19 vaccinations in late 2020 have led to signs of stabilization and improvements in commodity pricing, to the extent that the previously described conditions continue to exist or worsen in future periods, our clients’ willingness and ability to explore for, develop and produce hydrocarbons will be adversely affected, which will impact the demand for our products and services and adversely affect our results of operations and liquidity. We have worked to respond to the recent and current market conditions in a number of ways, including:
•Safety Measures. We have taken proactive steps in our field operations and corporate offices to protect the health and safety of our employees and contractors, including temperature screenings at field job sites, remote working for our office employees, and we implemented procedures for hygiene and distancing at all our locations.
•Reduced Capital Spending. We significantly reduced our initial 2020 capital expenditure budget to a total spend of $15.6 million on capital expenditures, while our original budget contemplated capital expenditures of approximately $40 million.
•Closure of Under-performing Operations. In April 2020, we closed our coiled tubing operations and idled all our coiled tubing equipment, which were subsequently placed as held for sale. We have also closed or consolidated 9 operating locations within our wireline and well servicing operations and exited 13 long-term leases during 2020 as well as various other short-term leases that support our business, and renegotiated or otherwise downsized other leased locations in order to reduce overhead and improve profitability.
•Cost-Cutting Measures. Throughout 2020, we implemented various cost-cutting measures including, among other things, (i) a 50% reduction in our total headcount, (ii) the suspension of our Employee Incentive Plan and determining that no bonuses would be payable thereunder, (iii) a reduction in the base salaries of each of our executive officers (with the exception of our Interim Chief Executive Officer) by 24% to 35%, (iv) certain hourly, salary and incentive compensation reductions for administrative and operations personnel throughout the company, (v) a20% reduction in the cash compensation of each of our non-employee directors effective until June 30, 2021 (or such other date as determined by the Board) and (vi) the suspension of certain employee benefits, including matching 401(k) contributions.
•Liquidating Non-strategic Assets. During 2020, we completed the sales of various assets for cash proceeds of $12.6 million and have an additional $3.6 million designated as held for sale at December 31, 2020.
Company Overview
and Business Segments
Pioneer Energy Services Corp. provides land-based drilling services and production services to a diverse group of oil and gas exploration and production companies in the United States and internationally in Colombia. We also provide two of our services (coiled tubing and wireline services) offshore in the Gulf of Mexico. Drilling services and
production services are fundamental to establishing and maintaining the flow of oil and natural gas throughout the productive life of a well.
Business Segments
Our current business is comprised of two business lines — Drilling Services and Production Services. We report our Drilling Services business as two reportable segments: (i)(consisting of Domestic Drilling and (ii) International Drilling. We report ourDrilling reportable segments) and Production Services business as three reportable segments: (i)(consisting of Well Servicing (ii)and Wireline Services reportable segments). In April 2020, we closed our coiled tubing operations and (iii) Coiled Tubing Services. We revisedidled all our reportable business segmentscoiled tubing equipment, which were subsequently placed as held for sale as of the fourth quarter of 2017 to reflect changes in the basis used by management in making decisions regarding our business for resource allocation and performance assessment.June 30, 2020. Financial information about our operating segments is included in Note 10, 13, Segment Information, of the Notes to Consolidated Financial Statements, included in Part II, Item 8,, Financial Statements and Supplementary Data, of this Annual Report on Form 10-K.10-K.
•Drilling Services—Services — Our current drilling rig fleet is 100% pad-capable and offers the latest advancements in pad drilling. We have 16drilling, with 17 AC rigs in the US and eight8 SCR rigs in Colombia, all ofColombia. We provide a comprehensive service offering which have 1,500 horsepower or greater drawworks. In addition to our drilling rigs, we provideincludes the drilling rig, crews, supplies, and most of the ancillary equipment needed to operate our drilling rigs.
The drilling rigs, in our fleetwhich are currently deployed through our division offices in the following regions:
|
| | | | | |
| | Rig Count |
Domestic drillingdrilling: | | |
| Marcellus/Utica | | 65 |
|
Eagle Ford | | 1 |
|
| Permian Basin and Eagle Ford | | 710 |
|
| Bakken | | 2 |
|
| International drilling | | 8 |
|
| | 2425 |
|
•Production Services—Services — Ourproduction services business segments provide a range of well, wireline and coiled tubing services to a diverse group of exploration and production companies, with our operations concentratedproducers primarily in Texas, North Dakota, the major domestic onshore oil and gas producing regions in the Mid-Continent and Rocky Mountain statesregion, and in the Gulf Coast, both onshore and offshore.
Louisiana. As of December 31, 2017,2020, the fleet count and compositioncounts for each of our production services business segments iswere as follows:
| | | | | | | | | | | | | | | | | |
| 550 HP | | 600 HP | | Total |
| Well servicing rigs, by horsepower (HP) rating | 111 | | 12 | | 123 |
| | | | | |
| | | | | |
| Wireline services units | | 76 |
| | |
| | | | | |
| | | | | |
| | | | | |
| | | | | |
| | | | | |
| | | | | |
| | | | | |
|
| | | | | | |
| | 550 HP | 600 HP | Total |
| Well servicing rigs, by horsepower (HP) rating | 113 |
| 12 |
| 125 |
|
| | | | |
| | Offshore | Onshore | Total |
| Wireline services units | 4 |
| 108 | 112 |
|
| Coiled tubing services units | 4 |
| 10 |
| 14 |
|
Market Conditions in Our Industryand Outlook
Industry Overview — Demand for oilfield services offered by our industry is a function of our clients’ willingness and ability to make operating expenditures and capital expenditures to explore for, develop and produce hydrocarbons, which is primarily driven by current and expected oil and natural gas prices.
Our business is influenced substantially by exploration and production companies’ spending that is generally categorized as either a capital expenditure or an operating expenditure. Capital expenditures for the drilling and completion of exploratory and development wells in proven areas are more directly influenced by current and expected oil and natural gas prices and generally reflect the volatility of commodity prices. In contrast, operating expenditures for the maintenance of existing wells, for which a range of production services are required in order to maintain production, are relatively more stable and predictable.
DrillingAlthough over the longer term, drilling and production services have historically trended similarly in response to fluctuations in commodity prices. However,prices, because exploration and production companies often adjust their budgets for exploration and development drilling first in response to a shiftchange in commodity prices, the demand for drilling services is generally impacted first and to a greater extent than the demand for production services which is more dependent on ongoing expenditures that are necessary to maintain production. Additionally, within the range of production services businesses, those that derive more revenue from production relatedproduction-related activity, as opposed to completion of new wells, tend to be less affected by fluctuationsvolatility in commodity prices and temporary reductions in industry activity.prices.
However, in a severe downturn that is prolonged, both operating and capital expenditures are significantly reduced, and the demand for all our service offerings is significantly impacted. After a prolonged downturn among the production services, the demand for completion-orientedworkover services generally improves first, followed by the demand for completion-oriented services as exploration and production companies begin to complete wells that were previously drilled but not completed during the downturn, and to complete newly drilled wells as the demand for drilling services improves during recovery.
For additional information concerning the potential effects of the volatility in oil and gas prices and the effects of technological advancements andother industry trends, in our industry, see Item 1A – “Risk Factors” in Part I of this Annual Report on Form 10-K.
Market Conditions and Outlook — Our industry experiencedSince January 2020, the COVID-19 pandemic and oil and natural gas market volatility have resulted in a severe down cycle that begansignificant decrease in late 2014 and which persisted through 2016 with WTI oil prices that dipped below $30and significant disruption and uncertainty in early 2016. A modest recoverythe oil and natural gas market. Beginning in March 2020, the decline in demand due to the COVID-19 pandemic coincided with the announcement of price reductions and possible production increases by members of OPEC and other oil exporting nations, including Russia. Although OPEC and other oil exporting nations ultimately agreed to cut production, these extreme supply and demand dynamics caused significant crude oil price declines, negatively impacting our industry’s oil producers who responded with significant cuts in their recent and projected spending.
Additionally, because our business depends on the level of spending by our clients, we are also affected by our clients’ ability to access the capital markets. After several consecutive years without significant improvement in commodity prices, beganmany exploration and production companies have limited their spending to a level which can be supported by net operating cash flows alone, as access to the capital markets through debt or equity financings has become more challenging in our industry. This challenge has increased recently due to the latter halfmajor stock market and bond market indices experiencing elevated levels of 2016 which continued through 2017, with average oil pricesvolatility during 2020.
However, the last quarterrecovery of 2017 averaging approximately $55 per barrel.supply chain disruptions and the approval of COVID-19 vaccinations in late 2020 have led to signs of stabilization and improvements in commodity pricing.
The trends in spot prices of WTI crude oil and Henry Hub natural gas, and the resulting trends in domestic land rig counts (per Baker Hughes) and domestic well servicing rig counts (per Guiberson/Association of Energy Service Companies) over the last three yearsfrom January 2019 through December 2020 are illustrated in the graphs below.
The trendscommodity price environment and global oversupply of oil during 2020 resulted in commodity pricing and domestican oversupply of equipment in our industry, declining rig counts over the last 12 months are illustrated below:
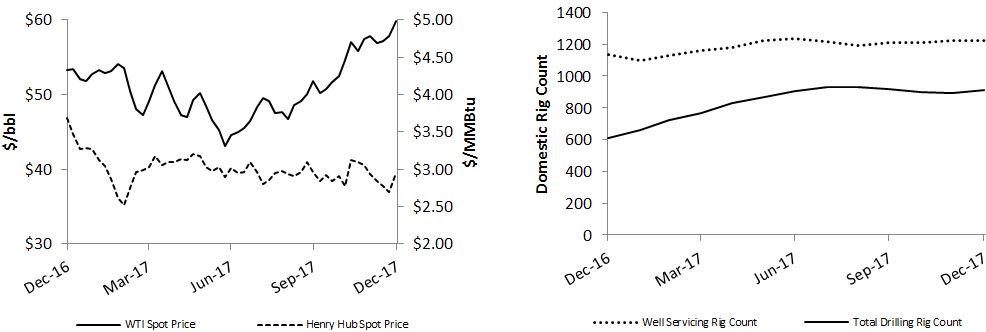
With the increases in commodity prices that began in late 2016, we experienced a resulting increase inand dayrates, and substantially reduced activity for all our service offerings. Oil and revenue ratesgas exploration and production companies reduced their previously planned capital spending programs for 2020, thereby reducing demand for our services. In March 2020, many operators began to curtail operations and several of our clients terminated their drilling contracts with us in April and May 2020. Utilization of our production services during 2017.fleets also dropped significantly in response to the market conditions described above, and in April 2020, we closed our coiled tubing operations and idled all our coiled tubing equipment, which were subsequently placed as held for sale.
OurWhile we cannot predict when and to what extent crude oil production activities will return to normalized levels, rig counts and oil prices have steadily increased in the latter half of 2020 and these indications of market stabilization led to improved activity levels for all of our business segments in the fourth quarter of 2020. Activity levels for our domestic drilling, international drilling, and well servicing rig hours, number of wireline jobs completed, and coiled tubingoperations (measured in revenue days duringand hours, respectively) in the fourth quarter ended December 31, 2017of 2020 increased by 2%17%, 11%81%, and 27%12%, respectively, as compared to the fourthprior quarter, while wireline stage counts increased by almost 400% in our wireline operations. At the end of 2016, while average revenues for services performed (on a per hour, job and day basis, respectively) during this same period increased as well, largely due to an increase in the proportion of the work performed attributable to completion-related activity and larger diameter coiled tubing services.
A year ago, the utilization2020, 16 of our AC fleet was 81% and there25 drilling rigs were four rigs earning revenues in Colombia. Since then, all of our idle domestic rigs have been placed on new contracts and the current utilization of our AC rig fleet is 100%. Of the eight rigs in Colombia, six are earning revenues, fiverevenue, 10 of which are under term contracts. The term contracts in Colombia are cancelable by our clients without penalty, although the contract would still require payment for demobilization services and requires 30 days notice. We are actively marketing our idle drilling rigs in Colombia to various operators and we are evaluating other options, including the possibility of the sale of some or all of our assets in Colombia.
As of December 31, 2017, 22 of our 24 drilling rigs are earning revenues, 19 of which arewere under term contracts with an aggregate average term remaining of approximately 7 months, including 3 which ifwere earning but not canceled or renewed priorworking.
As our clients continue to adjust their capital budgets and operations in response to the endpresently uncertain industry conditions, we are currently focusing our efforts on reducing costs and the realignment of their terms, will expire as follows:
|
| | | | | | | | | | | | | | | | | | | | |
| | Spot Market Contracts | | | | Term Contract Expiration by Period |
| | | Total Term Contracts | | Within
6 Months | | 6 Months
to 1 Year | | 1 Year to
18 Months | | 18 Months
to 2 Years | | 2 to 4 Years |
| Domestic rigs | 2 |
| | 14 |
| | 4 |
| | 8 |
| | 1 |
| | 1 |
| | — |
|
| International rigs | 1 |
| | 5 |
| | — |
| | 2 |
| | 1 |
| | 1 |
| | 1 |
|
| | 3 |
| | 19 |
| | 4 |
| | 10 |
| | 2 |
| | 2 |
| | 1 |
|
Absent a significant decline in commodity prices,certain businesses, while maintaining essential functions and readiness for the moderately improving market conditions which we expect continued improvement in activity and pricing during 2018. Although we expect a highly competitive environment willto continue in 2018, we2021. We believe our high-quality equipment, services, and excellent safety record makeposition us well positioned to compete.compete as our industry recovers.
Liquidity and Capital Resources
Liquidity Overview
Our completion of the Chapter 11 Cases has allowed us to significantly reduce our level of indebtedness and our future cash interest obligations. We currently expect that cash and cash equivalents, cash generated from operations, and available funds under the ABL Credit Facility are adequate to cover our liquidity requirements for at least the next 12 months. However, our ability to maintain sufficient liquidity and compliance with our debt instruments over the next 12 months, grow, make capital expenditures, and service our debt depends primarily upon (i) the level of demand for, and pricing of, our products and services; (ii) the level of spending by our clients; (iii) our ability to collect our receivables and access borrowings under the ABL Credit Facility; (iv) the supply and demand for oil and gas; (v) oil and gas prices; (vi) general economic and market conditions; and (vii) and other factors that are beyond our control.
The market competition between OPEC and non-OPEC countries coupled with the impact of the COVID-19 pandemic caused significant crude oil price declines, negatively impacting our industry’s oil producers who responded with significant cuts in their recent and projected spending which has affected, and to the extent it continues or worsens could continue to negatively affect, the amount of cash we generate and have available for working capital requirements, capital expenditures, and debt service.
Our availability under the ABL Credit Facility at December 31, 2020 was $15.9 million, which our access to would be subject to (i) our requirement to maintain 15% of the maximum revolver amount available or comply with a fixed charge coverage ratio and (ii) the requirement to maintain availability of at least $4 million, which may include up to $2 million of pledged cash. In addition, as a result of current market conditions, certain of our clients are facing financial pressures and liquidity issues. There can be no assurance that one or more of our clients will not delay or default on payments owed to us or file for bankruptcy protection, in which case we may be unable to collect all, or any portion, of the accounts receivable owed to us by such clients. Delays or defaults in payments of accounts receivable owed to us may also adversely affect our borrowing base and our ability to borrow under our ABL Credit Facility.
Sources of CapitalCapital Resources
Our principal sources of liquidity currently consist of:
•total cash and cash equivalents, including restricted cash ($73.632.3 million as of December 31, 2017)2020);
•cash generated from operations; and
proceeds from sales of certain non-strategic assets; and
•the unused portion of our asset-based lending facility (the “ABL Facility”).
Senior Secured Term Loan — Our senior secured term loan (the “Term Loan”) entered into on November 8, 2017 provided for one drawing inavailability under the amount of $175 million, net of a 2% original issue discount. Proceeds from the issuance of the Term Loan were used to repay the entire outstanding balance under our RevolvingABL Credit Facility plus fees and accrued and unpaid interest,($15.9 million as well as the fees and expenses associated with entering into the Term Loan and ABL Facility, which is further described below. The remainder of the proceeds are available to be used for other general corporate purposes. The Term Loan is set to mature on November 8, 2022, or earlier, subject to certain circumstances as described in the agreement, and including an earlier maturity date if the outstanding balance of the Senior Notes exceeds $15.0 million on December 14, 2021, at which time the Term Loan would then mature. The Term Loan contains certain covenants which are described in more detail in the Debt Compliance Requirements section below.
Asset-based Lending Facility — In addition to entering into the Term Loan, on November 8, 2017, we also entered into a senior secured revolving asset-based credit facility (the “ABL Facility”) providing for borrowings in the aggregate principal amount of up to $75 million, subject to a borrowing base and including a $30 million sub-limit for letters of credit. The ABL Facility bears interest, at our option, at the LIBOR rate or the base rate as defined in the ABL Facility, plus an applicable margin ranging from 1.75% to 3.25%, based on average availability on the ABL Facility. The ABL Facility is generally set to mature 90 days prior to the maturity of the Term Loan, subject to certain circumstances, including the future repayment, extinguishment or refinancing of our Term Loan and/or Senior Notes prior to their respective maturity dates. We have not drawn upon the ABL Facility to date. As of December 31, 2017, we had $9.7 million in committed letters of credit, which, after borrowing base limitations, resulted in borrowing availability of $53.1 million. Borrowings available under the ABL Facility are available for general corporate purposes and there are no limitations on our ability to access the borrowing capacity provided there is no default and compliance with the covenants under the ABL Facility is maintained. Additional information regarding these covenants is provided in the Debt Compliance Requirements section below.2020, as discussed below).
Shelf Registration Statement —In the future, we may also consider equity and/or debt offerings, as appropriate, to meet our liquidity needs. However, our ability to access the capital markets by issuing debt or equity securities will be dependent on market conditions, our financial condition, and other factors beyond our control. Additionally, the ABL Credit Facility and the indentures for our Convertible Notes and Senior Secured Notes contain covenants that limit our ability to incur additional indebtedness, the incurrence of which would also first require the approval of two of our principal stockholders, and our bylaws limit our ability to issue equity securities without the prior written consent of one of our principal stockholders.
ABL Credit Facility — On the Effective Date, pursuant to the terms of the Plan, we entered into a senior secured asset-based revolving credit agreement in an aggregate amount of $75 million among us and substantially all of our domestic subsidiaries as borrowers (the “Borrowers”), the lenders party thereto and PNC Bank, National Association as administrative agent. On August 7, 2020, we entered into a First Amendment to the ABL Credit Facility (together, herein referred to as the “ABL Credit Facility”) which, among other things, reduced the maximum amount of the revolving credit agreement to $40 million. Among other things, proceeds of loans under the ABL Credit Facility may be used to finance ongoing working capital and general corporate needs.
The maturity date of loans made under the ABL Credit Facility is the earliest of 90 days prior to maturity of the Senior Secured Notes or the Convertible Notes (both of which are described below in the section entitled Debt Instruments and Compliance Requirements) and May 15, 2015, we filed29, 2025. Borrowings under the ABL Credit Facility will bear interest at a registration statementrate of (i) the LIBOR rate (subject to a floor of 0%) plus an applicable margin of 375 basis points per annum or (ii) the base rate plus an applicable margin of 275 basis points per annum.
The ABL Credit Facility is guaranteed by the Borrowers and is secured by a first lien on the Borrowers’ accounts receivable and inventory, and the cash proceeds thereof, and a second lien on substantially all of the other assets and properties of the Borrowers. The ABL Credit Facility limits our annual capital expenditures to 125% of the budget set forth in the projections for any fiscal year and provides that permits us to sell equity or debt in one or more offeringsif our availability plus pledged cash of up to $3 million falls below $6 million (15% of the maximum revolver amount), we will be required to comply with a total dollar amountfixed charge coverage ratio of $300 million. 1.0 to 1.0, all of which is defined in the ABL Credit Facility.
As of December 31, 2017, $234.62020, we had no borrowings and approximately $7.3 million in outstanding letters of credit under the shelf registration statement is available for equity or debt offerings,ABL Credit Facility and subject to the limitations imposed byavailability requirements in the ABL Credit Facility, based on eligible accounts receivable and inventory balances at December 31, 2020, availability under the ABL Credit Facility was $15.9 million, which our Term Loan, ABL Facilityaccess to would be subject to (i) our requirement to maintain 15% of the maximum revolver amount available or comply with a fixed charge coverage ratio, as described above, and Senior Notes.
We currently expect that cash and cash equivalents, cash generated from operations, proceeds from sales(ii) the requirement to maintain availability of certain non-strategic assets, and available borrowings under our ABL Facility are adequate to cover our liquidity requirements for at least the next 12 months.
$4 million, which may include up to $2 million of pledged cash.
Uses of Capital Resources
For the years ended December 31, 2017Our principal liquidity requirements are currently for:
•working capital needs;
•capital expenditures; and 2016,
•debt service.
Our working capital needs typically fluctuate in relation to activity and pricing. Following a sustained period of low activity, our primary usesworking capital needs generally increase as we invest in reactivating previously idle equipment and in purchases of inventory and supplies for expected increasing activity. Our capital resources were for property and equipment additions, which consisted of the following (amounts in thousands):
|
| | | | | | | |
| | Year ended December 31, |
| | 2017 | | 2016 |
| Drilling services business: | | | |
| Routine | $ | 16,793 |
| | $ | 4,948 |
|
| Discretionary | 4,010 |
| | 2,454 |
|
| Fleet additions and major components | 7,337 |
| | 12,464 |
|
| | 28,140 |
| | 19,866 |
|
| Production services business: | | | |
| Routine | 13,185 |
| | 8,259 |
|
| Discretionary | 7,826 |
| | 4,256 |
|
| Fleet additions | 14,126 |
| | — |
|
| | 35,137 |
| | 12,515 |
|
| Net cash used for purchases of property and equipment | 63,277 |
| | 32,381 |
|
| Net impact of accruals | (1,830 | ) | | 175 |
|
| Total capital expenditures | $ | 61,447 |
| | $ | 32,556 |
|
In 2016, we lowered our capital expenditures by 77% from the prior year, limiting our capital spending to primarily routine expendituresrequirements to maintain our equipment also fluctuate in relation to activity, and deferring discretionary upgradesincrease following a period of sustained low activity. Our capital requirements are also increased during periods of expansion, at which times we have been more likely to access capital through equity or debt financing. During periods of sustained low activity and additionspricing, when our cash flow from operations are negatively impacted, we may also access additional capital through the use of available funds under the ABL Credit Facility.
Working Capital — Our working capital and current ratio, which we calculate by dividing current assets by current liabilities, were as follows as of December 31, 2020 and December 31, 2019 (amounts in thousands, except current ratio):
| | | | | | | | | | | | | | | | | | | | |
| Successor | | | Predecessor | | |
| December 31, 2020 | | | December 31, 2019 | | Change |
| | | | | | |
| | | | | | |
| | | | | | |
| | | | | | |
| | | | | | |
| | | | | | |
| | | | | | |
| | | | | | |
| | | | | | |
| | | | | | |
| Current assets | $ | 113,133 | | | | $ | 182,912 | | | $ | (69,779) | |
| | | | | | |
| | | | | | |
| | | | | | |
| | | | | | |
| | | | | | |
| | | | | | |
| | | | | | |
| | | | | | |
| | | | | | |
| | | | | | |
| Current liabilities | 59,018 | | | | 91,581 | | | (32,563) | |
| Working capital | $ | 54,115 | | | | $ | 91,331 | | | $ | (37,216) | |
| Current ratio | 1.9 | | | | 2.0 | | | (0.1) | |
The decrease in our working capital during 2020 is primarily due to a decrease of $57.2 million, or 62%, in our total trade and unbilled receivables, despite a decrease of $15.0 million, or 46%, in our accounts payable and a $6.5 million decrease in accrued employee costs, all of which are primarily a result of the significant decline in demand for our service offerings which resulted in decreased revenue and related costs.
Total cash, including cash equivalents and restricted cash, increased by $6.7 million, primarily due to $9.9 million of cash provided by the refinancing of our debt obligations upon emergence from Chapter 11, net of subsequent debt repayments, all of which was partially offset by a net investment of $2.9 million in capital expenditures and $0.3 million of net cash used in operating activities.
Other decreases in our current assets during 2020 included: (i) a $9.8 million decrease in inventory primarily due to the revaluation of assets upon our adoption of fresh start accounting as well as the classification of our coiled tubing inventory as held-for-sale after closing those operations in April 2020, (ii) a $6.2 million decrease in other receivables primarily due to an income tax refund in 2020 related to our international operations, and (iii) a $2.7 million decrease in prepaid and other current assets partially due to the usage of professional fee retainers associated with our bankruptcy proceedings as well as the amortization of deferred mobilization costs for our domestic drilling rigs.
Other decreases in our current liabilities during 2020 included: (i) a $4.7 million decrease in other accrued expenses primarily related to reduced sales tax accruals which was a result of reduced activity levels in our international drilling operations and the payment of sales tax obligations associated with several sales tax audits which were finalized in 2020, a $1.3 million decrease in current lease liabilities primarily associated with leases that we committed towere exited during 2020, and an approximate $1 million decrease in 2014 beforelegal and other professional fee accruals primarily associated with preparations for our bankruptcy proceedings, (ii) a $3.4 million decrease in accrued interest resulting from the market slowdown. In 2017, we maintained capital discipline by limitingrefinancing of our debt obligations upon emergence from Chapter 11, and (iii) a $2.0 million decrease in accrued insurance premiums and deductibles primarily resulting from a decrease in our estimated liability for the deductibles under our workers compensation and health insurance policies, partially as a result of fewer employees and reduced activity.
Capital Expenditures — During 2020 and 2019, our capital spendingexpenditures totaled $15.6 million and $50.0 million, respectively, primarily related to primarily routine expenditures that are necessary to maintain our fleets, while capital additions during 2019 also engagingincluded the completion of construction on our 17th AC drilling rig which we deployed in select asset acquisitions to optimize our production services fleets, including the exchange of 20 older well servicing rigs for 20 new-model rigs, the purchase of seven new wireline units,March 2019 and installments on one coiled tubing unit. Routine expenditures in 2017 primarily included refurbishmentsvarious vehicle and start-up costs to redeploy assets that had been idle, including two drilling rigs in Colombia.ancillary equipment purchases and upgrades.
Currently, we expect to spend approximately $55$20 million to $22 million on capital expenditures during 2018,2021, which we expect will be allocated approximately 35% foris limited to routine expenditures necessary to maintain our drilling services business segments and approximately 65% for our production services business segments. Our total planned capital expenditures include $15 million of discretionary spending for the purchase of one large-diameter coiled tubing unit and remaining payments on three wireline units, two of which were delivered in January, and additional drilling and production services equipment.fleets. Actual capital expenditures may vary depending on the climate of our industry and any resulting increase or decrease in activity levels, the timing of commitments and payments, availability of capital resources, and the level of rig build and other expansioninvestment opportunities that meet our strategic and return on capital employed criteria. We expect to fund the capital expenditures in 20182021 from cash and operating cash flow in excess of our working capital requirements, proceeds from sales of certain non-strategic assets, remaining proceeds from our Term Loan issuance, and fromalthough available borrowings under our ABL Credit Facility are also available, if necessary.
Working Capital Debt Instruments and Compliance Requirements— Our working capitalOn the Effective Date, we entered into a $75 million senior secured asset-based revolving credit agreement which was $130.6later amended and reduced to $40 million at December 31, 2017, compared to $48.0 million at December 31, 2016. Our current ratio, which we calculate by dividing current assets by current liabilities, was 2.5 at December 31, 2017, as compared to 1.7 at December 31, 2016.
Our operations have historically generated cash flows sufficient to meet our requirements for debt servicein August 2020 (the “ABL Credit Facility”), and normal capital expenditures. However, our working capital requirements generally increase during periods when rig construction projects are in progress or during periods of expansion in our production services business, at which times we have been more likely to access capital through equity or debt financing. Additionally, our working capital needs may increase in periods of increasing activity following a sustained period of low activity, which is the primary reason for the $5.8issued $129.8 million of net cash used in operating activities during the year ended December 31, 2017. During periodsaggregate principal amount of sustained low activity5% convertible senior unsecured pay-in-kind notes due 2025 (the “Convertible Notes”) and pricing, we may access additional capital through the use of available funds under our ABL Facility.
The changes in the components of our working capital were as follows (amounts in thousands), and as described below:
|
| | | | | | | | | | | |
| | December 31,
2017 | | December 31,
2016 | | Change |
| Cash and cash equivalents | $ | 73,640 |
| | $ | 10,194 |
| | $ | 63,446 |
|
| Restricted cash | 2,008 |
| | — |
| | 2,008 |
|
| Receivables: | | | | | |
| Trade, net of allowance for doubtful accounts | 79,592 |
| | 38,764 |
| | 40,828 |
|
| Unbilled receivables | 16,029 |
| | 7,417 |
| | 8,612 |
|
| Insurance recoveries | 13,874 |
| | 17,003 |
| | (3,129 | ) |
| Other receivables | 3,510 |
| | 8,939 |
| | (5,429 | ) |
| Inventory | 14,057 |
| | 9,660 |
| | 4,397 |
|
| Assets held for sale | 6,620 |
| | 15,093 |
| | (8,473 | ) |
| Prepaid expenses and other current assets | 6,229 |
| | 6,926 |
| | (697 | ) |
| Current assets | 215,559 |
| | 113,996 |
| | 101,563 |
|
| Accounts payable | 29,538 |
| | 19,208 |
| | 10,330 |
|
| Deferred revenues | 905 |
| | 1,449 |
| | (544 | ) |
| Accrued expenses: | | | | | |
| Payroll and related employee costs | 21,023 |
| | 14,813 |
| | 6,210 |
|
| Insurance premiums and deductibles | 6,742 |
| | 6,446 |
| | 296 |
|
| Insurance claims and settlements | 13,289 |
| | 13,667 |
| | (378 | ) |
| Interest | 6,624 |
| | 5,395 |
| | 1,229 |
|
| Other | 6,793 |
| | 5,024 |
| | 1,769 |
|
| Current liabilities | 84,914 |
| | 66,002 |
| | 18,912 |
|
| Working capital | $ | 130,645 |
| | $ | 47,994 |
| | $ | 82,651 |
|
Cash and cash equivalents— During 2017, we used $63.3$78.1 million of cash for the purchasesaggregate principal amount of property and equipment and used $5.8 million in operating activities, primarily funded by $119.2 million of net borrowings (net of debt issuance costs), $12.6 million of proceeds from the sale of assets, as well as $3.3 million of insurance proceeds received from drilling rig and wireline unit damages. Cash used in operations during 2017 was primarily for increased working capitalfloating rate senior secured notes due to the recent increase in activity.
Restricted cash— Our restricted cash balance at December 31, 2017 reflects the portion of net2025 (the “Senior Secured Notes”). The proceeds from the issuance of our Term Loan which are currently held in a restricted account until the completion of certain administrative tasks related to providing access rights to certain of our real property, which we expect to complete within 12 months. Accordingly,Convertible Notes and the related restricted cash is presented as current in the accompanying consolidated balance sheets.
Trade and unbilled receivables— The net increase in our total trade and unbilled receivables during 2017 is primarily due to the 77% increase in our revenues during the quarter ended December 31, 2017, as compared to the quarter ended December 31, 2016, as well as the timing of billing and collection cycles for long-term drilling contracts in Colombia. Our domestic trade receivables generally turn over within 90 days, and our Colombian trade receivables generally turn over within 120 days, which can take more time when setting up the billing process with new clients.
Insurance recoveries — The decrease in our insurance recoveries receivables during 2017 is primarily due to an insurance claim receivable of $3.1 million for a drilling rig that was damaged during 2016, for which the proceeds were received in early 2017.
Other receivables — The decrease in other receivables during 2017 is primarily due to the sale of two drilling rigs in December 2016, for which the proceeds of $6.3 million were received in January 2017. This decrease is partially offset by an increase in net income tax receivables for Colombia as well as $0.6 million remaining of a short-term note receivable from the sales of two mechanical drilling rigs that were sold during the third quarter of 2017.
Inventory — The increase in inventory during 2017 is primarily due to the increase in activity for our Colombian operations, as well as purchases of supplies and job materials for our wireline and coiled tubing operations.
Assets held for sale — As of December 31, 2017, our consolidated balance sheet reflects assets held for sale of $6.6 million, which primarily represents the fair value of three domestic SCR drilling rigs and one domestic mechanical drilling rig, as well as other drilling equipment, two wireline units and one coiled tubing unit and spare equipment. The decrease in assets held for sale as of December 31, 2017, when comparing to December 31, 2016, is primarily due to 20 older well servicing rigs that were designated as held for sale that were traded in for 20 new-model rigs in the first quarter of 2017, as well as the sale of two mechanical drilling rigs and 13 wireline units.
Prepaid expenses and other current assets— The decrease in prepaid expenses and other current assets during 2017 is primarily due to the amortization of mobilization costs for several domestic and international drilling rigs which were mobilized under new contracts in late 2016 and early 2017. For more information about rig mobilization service revenues and costs, see Note 1, Organization and Summary of Significant Accounting Policies, of theSenior Secured Notes to Consolidated Financial Statements, included in Part II, Item 8, Financial Statements and Supplementary Data, of this Annual Report on Form 10-K.
Accounts payable — Our accounts payable generally turn over within 90 days. The increase in accounts payable during 2017 is primarily due to the 64% increase in our operating costs for the quarter ended December 31, 2017 as compared to the quarter ended December 31, 2016, resulting from an increase in activity, and partially offset by a decrease of $1.8 million in our accruals for capital expenditures.
Accrued payroll and related employee costs — The increase in accrued payroll and related employee costs during 2017 is primarily due to an increase in the accrual for our 2017 annual bonuses due to improved company performance, as well as an increase in accrued salaries and wages due to a 25% increase in headcount during 2017 to accommodate the increased demand for our services.
Accrued interest — The increase in accrued interest expense during 2017 is primarily due to increased amount of debt outstanding as a result of the issuance of our Term Loan, from which a portion of the proceeds were used to repay and retire our Revolving Credit Facility, and for which interest incurs at a higher rate.
Other accrued expenses—The increase in other accrued expensesduring 2017 is primarily due to an increase in our accrued liability for value-added tax obligations (“VAT”) in Colombia as a result of an increase in activity in 2017.
Debt and Other Contractual Obligations — The following table includes information about the amount and timing of our contractual obligations at December 31, 2017 (amounts in thousands):
|
| | | | | | | | | | | | | | | | | | | |
| | Payments Due by Period |
| Contractual Obligations | Total | | Within 1 Year | | 2 to 3 Years | | 4 to 5 Years | | Beyond 5 Years |
| Debt | $ | 475,000 |
| | $ | — |
| | $ | — |
| | $ | 475,000 |
| | $ | — |
|
| Interest on debt | 144,899 |
| | 34,108 |
| | 68,215 |
| | 42,576 |
| | — |
|
| Purchase commitments | 8,170 |
| | 8,170 |
| | — |
| | — |
| | — |
|
| Operating leases | 9,902 |
| | 3,081 |
| | 3,534 |
| | 1,441 |
| | 1,846 |
|
| Incentive compensation | 15,722 |
| | 4,637 |
| | 11,085 |
| | — |
| | — |
|
| | $ | 653,693 |
| | $ | 49,996 |
| | $ | 82,834 |
| | $ | 519,017 |
| | $ | 1,846 |
|
Debt — Debt obligations at December 31, 2017 consisted of $300 million of principal amount outstanding under our Senior Notes which mature on March 15, 2022 and $175 million of principal amount outstanding under our Term Loan which is expected to mature on December 14, 2021. As of December 31, 2017, we had no debt outstanding under our ABL Facility.
Interest on debt— Interest payment obligations on our Senior Notes are calculated based on the coupon interest rate of 6.125% due semi-annually in arrears on March 15 and September 15 of each year until maturity on March 15, 2022. Interest payment obligations on our Term Loan were estimated based on (1) the 9.0% interest rate that was in effect at December 31, 2017, and (2) the principal balance of $175 million at December 31, 2017, and assuming repayment of the outstanding balance occurs at December 14, 2021.
Term Loan.Purchase commitments — Purchase commitments primarily pertain to deposits on one new coiled tubing unit, which was ordered in the fourth quarter of 2017, remaining installments on three new wireline units that were on order for delivery in 2018, as well as routine capital expenditures and inventory.
Operating leases — Our operating leases consist of lease agreements for office space, operating facilities, field personnel housing, and office equipment.
Incentive compensation — Incentive compensation is payable to our employees, generally contingent upon their continued employment through the date of each respective award’s payout. A portion of our long-term incentive compensation is performance-based and therefore the final amount will be determined based on our actual performance relative to a pre-determined peer group over the performance period.
Debt Compliance Requirements — The following is a summary of our debt instruments and compliance requirements including covenants, restrictions and guarantees, as it relates to our Convertible Notes and Senior Secured Notes, and a summary of our ABL Credit Facility is included in the above section entitled ABL Credit Facility.As of December 31, 2020, we were in compliance with all covenants required by our debt instruments. However, our ability to maintain compliance with our debt instruments is dependent upon the level of demand for our products and services, the level of spending by our clients, the supply and demand for oil, oil and gas prices, general economic and market conditions and other factors which are described in more detail in Note 3, Debtbeyond our control.
Convertible Notes Indenture and Convertible Notes due 2025. We entered into an indenture, dated as of the Effective Date, among the Company and Wilmington Trust, N.A., as trustee (the “Convertible Notes Indenture”), and Note 13, Guarantor/Non-Guarantor Condensed Consolidating Financial Statements,issued $129.8 million aggregate principal amount of convertible senior unsecured pay-in-kind notes due 2025 thereunder.
The Convertible Notes are general unsecured obligations which will mature on November 15, 2025, unless earlier accelerated, redeemed, converted or repurchased, and bear interest at a fixed rate of 5% per annum, which will be payable semi-annually in-kind in the form of an increase to the principal amount.
The Convertible Notes are convertible at the option of the Notes to Consolidated Financial Statements, included in Part II, Item 8, Financial Statementsholders at any time into shares of our common stock and Supplementary Data, of this Annual Report on Form 10-K.
The Term Loan contains a financial covenant requiringwill convert mandatorily into our common stock at maturity; provided, however, that if the ratio of (i) the net orderly liquidation value of our fixed assets (basedcommon stock otherwise deliverable in connection with a mandatory conversion of a Convertible Note on appraisals obtained as required by our lenders), on a consolidated basis, in which the lenders undermaturity date would be less than the Term Loan maintain a first priority securityprincipal amount of such Convertible Note plus accrued and unpaid interest, then the Convertible Note will
instead convert into an amount of cash equal to the principal amount thereof plus proceedsaccrued and unpaid interest. The initial conversion rate is 75 shares of asset dispositions not required to be used to effect a prepayment of the Term Loan to (ii) the outstandingcommon stock per $1,000 principal amount of the Term Loan,Convertible Notes, which in aggregate represents 9,732,825 shares of common stock and an initial conversion price of $13.33 per share. The conversion rate is subject to customary anti-dilution adjustments.
If we undergo a “fundamental change” as defined in the Convertible Notes Indenture, subject to certain conditions, holders may require us to repurchase all or any portion of their Convertible Notes for cash at an amount equal to 100% of the principal amount of the Convertible Notes to be repurchased plus any accrued and unpaid interest. In the case of certain fundamental change events that constitute merger events (as defined in the Convertible Notes Indenture), we have a superseding right to cause the mandatory conversion of all or part of the Convertible Notes into a number of shares of common stock, per $1,000 principal amount of Convertible Notes, equal to the then-current conversion rate or the cash value of such number of shares of common stock (but not less than the principal amount).
Holders of Convertible Notes are entitled to vote on all matters on which holders of our common stock generally are entitled to vote (or, if any, to take action by written consent of the holders of our common stock), voting together as a single class together with the shares of our common stock and not as a separate class, on an as-converted basis, at any annual or special meeting of holders of our common stock and each holder is entitled to such number of votes as such holder would receive on an as-converted basis on the record date for such vote.
The Convertible Notes Indenture contains covenants that limit our ability and the ability of certain of our subsidiaries to incur, assume or guarantee additional indebtedness and create liens and enter into mergers or consolidations.
The Convertible Notes Indenture contains customary events of default. In the case of an event of default arising from certain events of bankruptcy, insolvency or other similar law, with respect to us or any of our significant subsidiaries, all outstanding Convertible Notes will become due and payable immediately without further action or notice. If any other event of default occurs and is continuing, then the trustee or the holders of at least 25% in aggregate principal amount of the Convertible Notes then outstanding may declare the Convertible Notes due and payable immediately.
The Convertible Notes Indenture provides, subject to certain exceptions, that for so long as our common stock is registered under the Securities Exchange Act of 1934 (the “Exchange Act”), a beneficial owner of the Convertible Notes is not entitled to receive shares of our common stock upon an optional conversion of any Convertible Notes during any period of time in which the aggregate number of shares of our common stock that may be acquired by such beneficial owner upon conversion of Convertible Notes shall, when added to the aggregate number of shares of our common stock deemed beneficially owned, directly or indirectly, by such beneficial owner and each person subject to aggregation of our common stock with such beneficial owner under Section 13 or Section 16 of the Exchange Act at such time, exceed 9.99% of the total issued and outstanding shares of our common stock. Certain of the holders of Convertible Notes opted out of this provision at the Effective Date.
Senior Secured Notes Indenture and Senior Secured Notes due 2025. We entered into an indenture, dated as of the Effective Date, among the Company, the subsidiary guarantors party thereto and Wilmington Trust, N.A., as trustee (the “Senior Secured Notes Indenture”), and issued $78.1 million aggregate principal amount of floating rate senior secured notes due 2025 thereunder. The Senior Secured Notes are guaranteed on a senior secured basis by substantially all of our existing domestic subsidiaries, which also guarantee our obligations under the ABL Credit Facility, (the “Guarantors”) on a full and unconditional basis and are secured by a second lien on the accounts receivable and inventory and a first lien on substantially all of the other assets and properties (including the cash proceeds thereof) of the Company and the Guarantors.
The Senior Secured Notes will mature on May 15, 2025 and interest will accrue at the rate of LIBOR plus 9.5% per annum, with a LIBOR rate floor of 1.5%, payable quarterly in arrears on February 15, May 15, August 15 and November 15 of each year, commencing on August 15, 2020. With respect to any interest payment due on or prior to May 29, 2021, 50% of the interest will be payable in cash and 50% of the interest will be paid in-kind in the form of an increase to the principal amount; however, a majority in interest of the holders of the Senior Secured Notes may elect to have 100% of the interest due on or prior to May 29, 2021 payable in-kind. For all interest periods commencing on or after May 15, 2024, the interest rate for the Senior Secured Notes will be a rate equal to 1.50LIBOR plus 10.5%, with a LIBOR rate floor of 1.5%.
We may redeem all or part of the Senior Secured Notes on or after June 1, 2021 at redemption prices (expressed as percentages of the principal amount) equal to 1.00(i) 104% for the twelve-month period beginning on June 1, 2021; (ii) 102% for the twelve-month period beginning on June 1, 2022; (iii) 101% for the twelve-month period beginning on June 1, 2023 and (iv) 100% for the twelve-month period beginning June 1, 2024 and at any time thereafter, plus accrued and unpaid interest at the redemption date. Notwithstanding the foregoing, if a change of control (as defined in the Senior Secured Notes Indenture) occurs prior to June 1, 2022, we may elect to purchase all remaining outstanding Senior Secured Notes not tendered to us as described below at a redemption price equal to 103% of the principal amount thereof, plus accrued and unpaid interest, if any, thereon to the applicable redemption date. If a change of control (as defined in the Senior Secured Notes Indenture) occurs, holders of the Senior Secured Notes will have the right to require us to repurchase all or any part of their Senior Secured Notes at a purchase price equal to 101% of the aggregate principal amount of the Senior Secured Notes repurchased, plus accrued and unpaid interest, if any, to the repurchase date.
The Senior Secured Notes Indenture contains covenants that limit, among other things, our ability and the ability of certain of our subsidiaries, to incur, assume or guarantee additional indebtedness; pay dividends or distributions on capital stock or redeem or repurchase capital stock; make investments; repay junior debt; sell stock of our subsidiaries; transfer or sell assets; enter into sale and lease back transactions; create liens; enter into transactions with affiliates; and enter into mergers or consolidations. The Senior Secured Notes Indenture contains a minimum asset coverage ratio of 1.5 to 1.0 as of any June 30 or December 31, of any calendar year through maturity.beginning December 31, 2020. As of December 31, 2017,2020, the asset coverage ratio, as calculated under the Term Loan,Senior Secured Notes Indenture, was 2.053.2 to 1.00.1.0.
The Term Loan contains customary mandatory prepayments from the proceeds ofSenior Secured Notes Indenture also provides for certain transactions including certain asset dispositions and debt issuances, and has additional customary restrictions that limit our ability to enter into various transactions. In addition, the Term Loan contains customary events of default, upon the occurrence and during the continuationincluding, among others, nonpayment of anyprincipal or interest, breach of which the applicable margin would increase by 2% per year. Our obligations under the Term Loan are guaranteed by our wholly-owned domestic subsidiaries, and are secured by substantially allcovenants, failure to pay final judgments in excess of our domestic assets,a specified threshold, failure of a guarantee to remain in each case, subjecteffect, failure of a security document to certain exceptions and permitted liens.
The ABL Facility also contains customary restrictive covenants which, subject to certain exceptions, limit, among other things, our ability to enter into certain transactions. Additionally, if our availability under the ABL Facility is less than 15% of the maximum amount, we are required to maintain a minimum fixed charge coverage ratio, as defined in the ABL Facility, of at least 1.00 to 1.00, measured on a trailing 12 month basis.
Our obligations under the ABL Facility are guaranteed by us and our domestic subsidiaries, subject to certain exceptions, and are secured by (i) a first-priority perfectedcreate an effective security interest in collateral, bankruptcy and insolvency events, and cross acceleration, which would permit the principal, premium, if any, interest and other monetary obligations on all inventorythe then outstanding Senior Secured Notes to be declared due and cash,payable immediately.
Pursuant to the Senior Secured Notes Indenture, we commenced offers to purchase $2.6 million in aggregate principal amount of the Senior Secured Notes in October and (ii)December 2020 at a second-priority perfected security in substantially allpurchase price equal to 100% of our tangiblethe principal amount of the Senior Secured Notes purchased, plus accrued and intangible assets, in each case, subject to certain exceptions and permitted liens.unpaid interest through, but not including, the respective purchase dates. As of December 31, 2020, the aggregate principal amount of Senior Secured Notes outstanding is $77.4 million.
TheSupplemental Guarantor Information
Our Prepetition Senior Notes arewere fully and unconditionally guaranteed, jointly and severally, on a senior unsecured basis by certain of ourall existing 100% owned domestic subsidiaries, except for Pioneer Services Holdings, LLC. The Prepetition Senior Notes, the guarantees, and the Prepetition Senior Notes Indenture were terminated on the Effective Date pursuant to the Plan. See Note 2, Emergence from Voluntary Reorganization under Chapter 11, for more information.
Our Senior Secured Notes are issued by certain of our futurePioneer Energy Services Corp. (the “Parent Issuer”) and are fully and unconditionally guaranteed, jointly and severally, on a senior secured basis by all existing 100%-owned domestic subsidiaries.subsidiaries (the “Guarantors”), except for Pioneer Services Holdings, LLC. The subsidiaries that generally operate our non-U.S. business concentrated in Colombia do not guarantee our Senior Notes. OurSecured Notes (and did not guarantee our Prepetition Senior Notes). The non-guarantor subsidiaries do not have any payment obligations under the Senior Secured Notes, are not subjectthe guarantees, or the Senior Secured Notes Indenture. In the event of a bankruptcy, liquidation or reorganization of any non-guarantor subsidiary, such non-guarantor subsidiary would be obligated to pay the holders of its debt and other liabilities, including its trade creditors, before it would be able to distribute any sinking fund requirements. The Indenture governing our Senior Notes contains additional restrictive covenants that limit our abilityof its assets to enter into various transactions.
us. As of December 31, 2017, we2020, the aggregate principal amount of Senior Secured Notes outstanding is $77.4 million, and there were in compliance with all covenants required by our Term Loan, ABL Facility and Senior Notes.
no restrictions on the ability of subsidiary guarantors to transfer funds to the parent company.
The following tables present summarized financial information for the Parent Issuer and Guarantors, on a combined basis after the elimination of intercompany balances and transactions between the Parent Issuer and Guarantors and investments in any subsidiary that is a non-guarantor (amounts in thousands):
| | | | | |
| Successor |
| December 31, 2020 |
| |
| Current assets, excluding those due from non-guarantor subsidiaries | $ | 88,544 | |
| Current assets due from non-guarantor subsidiaries | 28,176 | |
| Property and equipment, net | 143,277 | |
| |
| Noncurrent assets, excluding property and equipment | 15,596 | |
| |
| |
| Current liabilities | $ | 55,362 | |
| |
| Long-term debt | 147,167 | |
| Noncurrent liabilities, excluding long-term debt | 6,348 | |
| | | | | | | | | | | | | | |
| Successor | | | Predecessor |
| Seven Months Ended December 31, 2020 | | | Five Months Ended May 31, 2020 |
| Revenues | $ | 91,654 | | | | $ | 126,442 | |
| Operating costs | 68,668 | | | | 100,372 | |
Loss from operations(1) | (17,636) | | | | (61,657) | |
Net loss(1) | (36,299) | | | | (95,631) | |
(1) Includes intercompany lease income from non-guarantor subsidiary totaling $2.8 million and $2.0 million during the Successor and Predecessor periods, respectively.
Results of Operations
StatementsAs a result of Operations Analysis - Year Endedour emergence from Chapter 11 on May 29, 2020, our financial results for the periods prior to the Fresh Start Reporting date of May 31, 2020 are referred to as those of the “Predecessor,” and our financial results for the periods subsequent to May 31, 2020 are referred to as those of the “Successor.”
Although the Successor period(s) and the Predecessor period(s) are distinct reporting periods, we have combined the Successor and Predecessor period results during the year ended December 31, 2017 Compared with Year Ended2020 in order to provide some comparability of such information to the corresponding Predecessor period ended December 31, 20162019. While this combined presentation is not presented according to generally accepted accounting principles in the United States of America (GAAP) and no comparable GAAP measures are presented, management believes that providing this financial information is the most relevant and useful method for making comparisons to the corresponding Predecessor period as reviewing the Successor period results in isolation would not be useful in identifying trends in or reaching conclusions regarding our overall operating performance.
The following table provides certain information about our operations, including a detaildetails of each of our business segments’ revenues, operating costs and gross margin and the percentage of the consolidated amount of each which is attributable to each business segment, for the years ended December 31, 2017 and 2016periods indicated (amounts in thousands, except percentages):thousands).
| | | | | | | | | | | | | | | | | | | | | | | | | | | | | | | | | | | | | | | |
| | | | | | | Successor | | | Predecessor | | Combined
(Non-GAAP) | | Predecessor | | |
| | | | | | | | | | | | | Seven Months Ended December 31, 2020 | | | Five Months Ended May 31, 2020 | | Year Ended December 31, 2020 | | Year Ended December 31, 2019 | | |
| Revenues: | | | | | | | | | | | | | | | | | | | | | |
| Domestic drilling | | | | | | | | | | | | $ | 44,205 | | | | $ | 53,341 | | | $ | 97,546 | | | $ | 151,769 | | | |
| International drilling | | | | | | | | | | | | 12,220 | | | | 15,928 | | | 28,148 | | | 88,932 | | | |
| Drilling services | | | | | | | | | | | | 56,425 | | | | 69,269 | | | 125,694 | | | 240,701 | | | |
| Well servicing | | | | | | | | | | | | 30,739 | | | | 31,947 | | | 62,686 | | | 115,715 | | | |
| Wireline services | | | | | | | | | | | | 16,710 | | | | 35,543 | | | 52,253 | | | 172,931 | | | |
| Coiled tubing services | | | | | | | | | | | | — | | | | 5,611 | | | 5,611 | | | 46,445 | | | |
| Production services | | | | | | | | | | | | 47,449 | | | | 73,101 | | | 120,550 | | | 335,091 | | | |
| Consolidated revenues | | | | | | | | | | | | $ | 103,874 | | | | $ | 142,370 | | | $ | 246,244 | | | $ | 575,792 | | | |
| | | | | | | | | | | | | | | | | | | | | |
| Operating costs: | | | | | | | | | | | | | | | | | | | | | |
| Domestic drilling | | | | | | | | | | | | $ | 26,846 | | | | $ | 33,101 | | | $ | 59,947 | | | $ | 92,183 | | | |
| International drilling | | | | | | | | | | | | 9,529 | | | | 13,676 | | | 23,205 | | | 65,007 | | | |
| Drilling services | | | | | | | | | | | | 36,375 | | | | 46,777 | | | 83,152 | | | 157,190 | | | |
| Well servicing | | | | | | | | | | | | 24,325 | | | | 26,877 | | | 51,202 | | | 83,461 | | | |
| Wireline services | | | | | | | | | | | | 17,090 | | | | 31,836 | | | 48,926 | | | 151,145 | | | |
| Coiled tubing services | | | | | | | | | | | | 408 | | | | 8,557 | | | 8,965 | | | 39,557 | | | |
| Production services | | | | | | | | | | | | 41,823 | | | | 67,270 | | | 109,093 | | | 274,163 | | | |
| Consolidated operating costs | | | | | | | | | | | | $ | 78,198 | | | | $ | 114,047 | | | $ | 192,245 | | | $ | 431,353 | | | |
| | | | | | | | | | | | | | | | | | | | | |
| Gross margin: | | | | | | | | | | | | | | | | | | | | | |
| Domestic drilling | | | | | | | | | | | | $ | 17,359 | | | | $ | 20,240 | | | $ | 37,599 | | | $ | 59,586 | | | |
| International drilling | | | | | | | | | | | | 2,691 | | | | 2,252 | | | 4,943 | | | 23,925 | | | |
| Drilling services | | | | | | | | | | | | 20,050 | | | | 22,492 | | | 42,542 | | | 83,511 | | | |
| Well servicing | | | | | | | | | | | | 6,414 | | | | 5,070 | | | 11,484 | | | 32,254 | | | |
| Wireline services | | | | | | | | | | | | (380) | | | | 3,707 | | | 3,327 | | | 21,786 | | | |
| Coiled tubing services | | | | | | | | | | | | (408) | | | | (2,946) | | | (3,354) | | | 6,888 | | | |
| Production services | | | | | | | | | | | | 5,626 | | | | 5,831 | | | 11,457 | | | 60,928 | | | |
| Consolidated gross margin | | | | | | | | | | | | $ | 25,676 | | | | $ | 28,323 | | | $ | 53,999 | | | $ | 144,439 | | | |
| | | | | | | | | | | | | | | | | | | | | |
| | | | | | | | | | | | | | | | | | | | | |
| | | | | | | | | | | | | | | | | | | | | |
| | | | | | | | | | | | | | | | | | | | | |
| | | | | | | | | | | | | | | | | | | | | |
| | | | | | | | | | | | | | | | | | | | | |
| | | | | | | | | | | | | | | | | | | | | |
| | | | | | | | | | | | | | | | | | | | | |
| | | | | | | | | | | | | | | | | | | | | |
| | | | | | | | | | | | | | | | | | | | | |
| | | | | | | | | | | | | | | | | | | | | |
| Consolidated: | | | | | | | | | | | | | | | | | | | | | |
| Net loss | | | | | | | | | | | | $ | (40,224) | | | | $ | (104,225) | | | $ | (144,449) | | | $ | (63,904) | | | |
Adjusted EBITDA (1) | | | | | | | | | | | | $ | 10,597 | | | | $ | 2,723 | | | $ | 13,320 | | | $ | 60,153 | | | |
|
| | | | | | | | | | | | | |
| | Year ended December 31, |
| | 2017 | | 2016 |
| Revenues: | | | | | | | |
| Domestic drilling | $ | 129,276 |
| | 29 | % | | $ | 112,399 |
| | 41 | % |
| International drilling | 41,349 |
| | 9 | % | | 6,808 |
| | 2 | % |
| Drilling services | 170,625 |
| | 38 | % | | 119,207 |
| | 43 | % |
| Well servicing | 77,257 |
| | 17 | % | | 71,491 |
| | 26 | % |
| Wireline services | 163,716 |
| | 37 | % | | 67,419 |
| | 24 | % |
| Coiled tubing services | 34,857 |
| | 8 | % | | 18,959 |
| | 7 | % |
| Production services | 275,830 |
| | 62 | % | | 157,869 |
| | 57 | % |
| Consolidated revenues | $ | 446,455 |
| | 100 | % | | $ | 277,076 |
| | 100 | % |
| | | | | | | | |
| Operating costs: | | | | | | | |
| Domestic drilling | $ | 83,122 |
| | 25 | % | | $ | 63,686 |
| | 31 | % |
| International drilling | 31,994 |
| | 10 | % | | 9,465 |
| | 5 | % |
| Drilling services | 115,116 |
| | 35 | % | | 73,151 |
| | 36 | % |
| Well servicing | 56,379 |
| | 17 | % | | 53,208 |
| | 26 | % |
| Wireline services | 128,137 |
| | 39 | % | | 57,634 |
| | 28 | % |
| Coiled tubing services | 31,248 |
| | 9 | % | | 19,956 |
| | 10 | % |
| Production services | 215,764 |
| | 65 | % | | 130,798 |
| | 64 | % |
| Consolidated operating costs | $ | 330,880 |
| | 100 | % | | $ | 203,949 |
| | 100 | % |
| | | | | | | | |
| Gross margin: | | | | | | | |
| Domestic drilling | $ | 46,154 |
| | 40 | % | | $ | 48,713 |
| | 67 | % |
| International drilling | 9,355 |
| | 8 | % | | (2,657 | ) | | (4 | )% |
| Drilling services | 55,509 |
| | 48 | % | | 46,056 |
| | 63 | % |
| Well servicing | 20,878 |
| | 18 | % | | 18,283 |
| | 25 | % |
| Wireline services | 35,579 |
| | 31 | % | | 9,785 |
| | 13 | % |
| Coiled tubing services | 3,609 |
| | 3 | % | | (997 | ) | | (1 | )% |
| Production services | 60,066 |
| | 52 | % | | 27,071 |
| | 37 | % |
| Consolidated gross margin | $ | 115,575 |
| | 100 | % | | $ | 73,127 |
| | 100 | % |
| | | | | | | | |
| Consolidated: | | | | | | | |
| Net loss | $ | (75,118 | ) | | | | $ | (128,391 | ) | | |
Adjusted EBITDA (1) | $ | 49,873 |
| | | | $ | 14,237 |
| | |
(1) Adjusted EBITDA represents income (loss) before interest expense, income tax (expense) benefit, depreciation and amortization, prepetition restructuring charges, impairment, reorganization items, and loss on extinguishment of debt and impairments.debt. Adjusted EBITDA is a non-GAAP measure that our management uses to facilitate period-to-period comparisons of our core operating performance and to evaluate our long-term financial performance against that of our peers. We believe that this measure is useful to investors and analysts in allowing for greater transparency of our core operating performance and makes it easier to compare our results with those of other companies within our industry. Adjusted EBITDA should not be considered (a) in isolation of, or as a substitute for, net income (loss), (b) as an indication of cash flows from operating activities or (c) as a measure of liquidity. In addition, Adjusted EBITDA does not represent funds available for discretionary use. Adjusted EBITDA may not be comparable to other similarly titled measures reported by other companies.
A reconciliation of net loss, as reported, to Adjusted EBITDA, and a reconciliation of net loss, as reported, to consolidated gross margin, are set forth in the following table.table (amounts in thousands):
| | | | | | | | | | | | | | | | | | | | | | | | | | | | | | | |
| | | | | Successor | | | Predecessor | | Combined
(Non-GAAP) | | Predecessor |
| | | | | | | Seven Months Ended December 31, 2020 | | | Five Months Ended May 31, 2020 | | Year Ended December 31, 2020 | | Year Ended December 31, 2019 |
| | | | | | | | | | | | | |
| Net loss | | | | | | $ | (40,224) | | | | $ | (104,225) | | | $ | (144,449) | | | $ | (63,904) | |
| Depreciation and amortization | | | | | | 33,613 | | | | 35,647 | | | 69,260 | | | 90,884 | |
| Prepetition restructuring charges | | | | | | — | | | | 16,822 | | | 16,822 | | | — | |
| Impairment | | | | | | 742 | | | | 17,853 | | | 18,595 | | | 2,667 | |
| Reorganization items, net | | | | | | 4,263 | | | | 21,903 | | | 26,166 | | | — | |
| Interest expense | | | | | | 14,831 | | | | 12,294 | | | 27,125 | | | 39,835 | |
| Loss on extinguishment of debt | | | | | | 188 | | | | 4,215 | | | 4,403 | | | — | |
| | | | | | | | | | | | | |
| Income tax benefit | | | | | | (2,816) | | | | (1,786) | | | (4,602) | | | (9,329) | |
| Adjusted EBITDA | | | | | | 10,597 | | | | 2,723 | | | 13,320 | | | 60,153 | |
| General and administrative | | | | | | 24,055 | | | | 22,047 | | | 46,102 | | | 91,185 | |
| Bad debt expense (recovery), net | | | | | | (227) | | | | 1,209 | | | 982 | | | (79) | |
| Gain on dispositions of property and equipment, net | | | | | | (6,132) | | | | (989) | | | (7,121) | | | (4,513) | |
| | | | | | | | | | | | | |
| | | | | | | | | | | | | |
| Other expense (income) | | | | | | (2,617) | | | | 3,333 | | | 716 | | | (2,307) | |
| Consolidated gross margin | | | | | | $ | 25,676 | | | | $ | 28,323 | | | $ | 53,999 | | | $ | 144,439 | |
|
| | | | | | | |
| | Year ended December 31, |
| | 2017 | | 2016 |
| | (amounts in thousands) |
| Reconciliation of net loss and Adjusted EBITDA to consolidated gross margin: | | | |
| Net loss | $ | (75,118 | ) | | $ | (128,391 | ) |
| Depreciation and amortization | 98,777 |
| | 114,312 |
|
| Impairment | 1,902 |
| | 12,815 |
|
| Interest expense | 27,039 |
| | 25,934 |
|
| Loss on extinguishment of debt | 1,476 |
| | 299 |
|
| Income tax benefit | (4,203 | ) | | (10,732 | ) |
| Adjusted EBITDA | 49,873 |
| | 14,237 |
|
| General and administrative | 69,681 |
| | 61,184 |
|
| Bad debt expense | 53 |
| | 156 |
|
| Gain on dispositions of property and equipment, net | (3,608 | ) | | (1,892 | ) |
| Other income | (424 | ) | | (558 | ) |
| Consolidated gross margin | $ | 115,575 |
| | $ | 73,127 |
|
Consolidated gross margin— We experienced a significant decline in demand for all our service offerings during 2020 as a result of the economic downturn caused by the COVID-19 pandemic and adverse global oil production and pricing decisions made by OPEC and non-OPEC countries, as described in more detail in the earlier section entitled, “Market Conditions and Outlook.” Our consolidated gross margin increaseddecreased by 58%$90.4 million, or 63%, during 2017,2020, as compared to 2016, as a result of higher activity for each of our drilling and2019. Our production services business segmentsofferings, which are heavily completion-oriented businesses, were most significantly impacted by the decline in demand, with a combined gross margin decrease of 81% during the year ended December 31, 2017,2020 as compared to 2016, as our industry continues to recover from an industry downturn. Spot prices have also improved for all of our business segments throughout 2017. Of the $42.4 million increase in consolidated gross margin, 78% is attributable to our production services segments, primarily due to improved demand for our wireline services, while the remaining increase attributable to2019. While our drilling services business segments is primarily due to higher activity for our international drilling operations.were also significantly impacted, and experienced a combined 49% gross margin decrease during this same period, the impact was somewhat mitigated by the longer-term nature of the operations, which are typically supported by term contracts.
•DrillingServices— Our drilling services revenues increased by $51.4 million, or 43%, during 2017, as compared to 2016, while operating costs increased by $42.0 million, or 57%. The increases inOn a percentage basis, our drilling services revenues and operating costs primarily resulted from a 42% increasedecreased in revenue days duetandem during 2020 as compared to the increasing demand in our industry, especially in Colombia.
2019, declining by 48% and 47%, respectively. The following table provides operating statistics for each of our drilling services segments for the years ended December 31, 2017 and 2016:segments:
| | | | | | Successor | | | Predecessor | | Combined
(Non-GAAP) | | | Predecessor | |
| | | | | Seven Months Ended December 31, 2020 | | | Five Months Ended May 31, 2020 | | Year Ended December 31, 2020 | | | Year Ended December 31, 2019 | |
| | | | | Year ended December 31, | |
| | 2017 | | 2016 | |
| Domestic drilling: | | | | Domestic drilling: | | | | | | | | | | | |
| Average number of drilling rigs | 16 |
| | 23 |
| Average number of drilling rigs | | 17 | | | | 17 | | | 17 | | | | 17 | | |
| Utilization rate | 95 | % | | 55 | % | Utilization rate | | 57 | % | | | 81 | % | | 67 | % | | | 92 | % | |
| Revenue days | 5,524 |
| | 4,628 |
| Revenue days | | 2,083 | | | | 2,100 | | | 4,183 | | | | 5,660 | | |
| | | | | | | | | | | | |
| Average revenues per day | $ | 23,403 |
| | $ | 24,287 |
| Average revenues per day | | $ | 21,222 | | | | $ | 25,400 | | | $ | 23,320 | | | | $ | 26,814 | | |
| Average operating costs per day | 15,047 |
| | 13,761 |
| Average operating costs per day | | 12,888 | | | | 15,762 | | | 14,331 | | | | 16,287 | | |
| Average margin per day | $ | 8,356 |
| | $ | 10,526 |
| Average margin per day | | $ | 8,334 | | | | $ | 9,638 | | | $ | 8,989 | | | | $ | 10,527 | | |
| | | | | | | | | | | | | | | | |
| International drilling: | | | | International drilling: | | | | | | | |
| Average number of drilling rigs | 8 |
| | 8 |
| Average number of drilling rigs | | 8 | | | | 8 | | | 8 | | | | 8 | | |
| Utilization rate | 46 | % | | 7 | % | Utilization rate | | 28 | % | | | 28 | % | | 28 | % | | | 75 | % | |
| Revenue days | 1,345 |
| | 218 |
| Revenue days | | 480 | | | | 335 | | | 815 | | | | 2,195 | | |
| | | | | | | | | | | | |
| Average revenues per day | $ | 30,743 |
| | $ | 31,229 |
| Average revenues per day | | $ | 25,458 | | | | $ | 47,546 | | | $ | 34,537 | | | | $ | 40,516 | | |
| Average operating costs per day | 23,787 |
| | 43,417 |
| Average operating costs per day | | 19,852 | | | | 40,824 | | | 28,472 | | | | 29,616 | | |
| Average margin per day | $ | 6,956 |
| | $ | (12,188 | ) | Average margin per day | | $ | 5,606 | | | | $ | 6,722 | | | $ | 6,065 | | | | $ | 10,900 | | |
Our domestic drilling fleet utilization reached 100%average margin per day decreased by mid-2017, and remained fully utilized through December 31, 2017. Our domestic drilling average15% during 2020 as compared to 2019, as revenue days decreased by 26%. Average revenues per day declined during 2017,2020 as compared to 2016, decreased, while ourdayrates for contracts that were renewed and renegotiated in late 2019 and during 2020 were reduced. Additionally, average operating costsrevenues and margin per day increased, due to the expirationduring 2019 benefited from $1.5 million of term contracts during 2016 that were entered into prior to the downturn at higheradditional revenue rates, many of which were terminated early. Thus, there were more revenue days during 2017 attributable to daywork activity versus revenue days associated with rigs that were earning but not working and incurring minimal operating costs during 2016.
Demand for drilling rigs influences the typesearly termination of two of our domestic drilling contracts we are able to obtain, andin 2019, which is net of $1.6 million of early termination revenue recognized in May 2020. These decreases were offset in part by the typebenefit of revenues we earn under our drilling contracts. As a result of the downturnrigs placed on standby in our industry, several2020. Beginning in late March 2020, rather than terminating their contracts with us, certain of our clients terminatedelected to temporarily stack three of our rigs, placing them on an extended standby for a numberreduced revenue rate and the option to reactivate the rigs through the remainder of theirthe contract term. Although these drilling contracts with us. Drilling rigs under contracts which are terminated early earn lower standby revenue rates as compared to daywork rates, operating costs incurred are minimal, which reduces operating costs per day and incur minimal operating costs. The following table providesbenefits overall margin per day. Two of these rigs recommenced operations in the percentagesfourth quarter of our consolidated drilling services revenues by contract type for2020 while the years ended December 31, 2017 and 2016:
|
| | | | | |
| | Year ended December 31, |
| | 2017 | | 2016 |
| Daywork contracts (not terminated early) | 100 | % | | 89 | % |
| Daywork contracts terminated early | — | % | | 11 | % |
Our international drilling fleet utilization steadily improved throughout 2017, culminatingaverage margin per day decreased by 44% during 2020, as compared to 2019, primarily driven by the 63% reduction in a 75% utilization rate atrevenue days during 2020 as certain customers terminated or suspended drilling contracts in response to the end of 2017, versus 50% utilization atdecline in industry conditions. These contract terminations and suspensions in 2020 also resulted in an increase in rig demobilization activity, for which revenues and costs are higher than daywork activity, and for which there are no associated revenue days. Average revenue per day during the year ended December 31, 2016, which resulted2019 also benefited from $2.5 million of revenues associated with the demobilization of five rigs during the second half of 2019. The decline in a significantutilization combined with the increase in ourrig standby and demobilization costs in 2020 and higher demobilization revenue in 2019 all contributed to the decreases in average margin per day. The substantial increase in average margin per day is largely a result of the low utilization in 2016, during which time we incurred certain fixed costs, as well as additional costs during the fourth quarter of 2016 to mobilize previously stacked rigs under new contracts, which resulted in a negative average margin per day during 2016.
•Production Services— Our revenues from production services increased by $118.0 million, or 75%,decreased 64% during 2017,2020 as compared to 2016,2019, while operating costs increased by $85.0 million, or 65%, respectively. The increases in revenues and operating costs in our production services segments are a result of the increased demand for our services, particularly those that perform completion-related activities.
decreased 60%. The following table provides operating statistics for each of our production services segmentssegments:
| | | | | | | | | | | | | | | | | | | | | | | | | | | | | | | | | |
| | | | | Successor | | | Predecessor | | Combined
(Non-GAAP) | | Predecessor | | |
| | | | | | | Seven Months Ended December 31, 2020 | | | Five Months Ended May 31, 2020 | | Year Ended December 31, 2020 | | Year Ended December 31, 2019 | | |
| Well servicing: | | | | | | | | | | | | | | | |
| Average number of rigs | | | | | | 123 | | | | 123 | | | 123 | | | 125 | | | |
| Utilization rate | | | | | | 31 | % | | | 40 | % | | 35 | % | | 58 | % | | |
| Rig hours | | | | | | 62,730 | | | | 56,797 | | | 119,527 | | | 201,768 | | | |
| Average revenue per hour | | | | | | $ | 490 | | | | $ | 562 | | | $ | 524 | | | $ | 574 | | | |
| | | | | | | | | | | | | | | |
| | | | | | | | | | | | | | | |
| Wireline services: | | | | | | | | | | | | | | | |
| | | | | | | | | | | | | | | |
| Average number of units | | | | | | 81 | | | | 93 | | | 86 | | | 97 | | | |
| Number of stages | | | | | | 3,430 | | | | 6,510 | | | 9,940 | | | 26,919 | | | |
| | | | | | | | | | | | | | | |
| | | | | | | | | | | | | | | |
| | | | | | | | | | | | | | | |
| | | | | | | | | | | | | | | |
| Coiled tubing services: | | | | | | | | | | | | | | | |
| Average number of units | | | | | | — | | | | 9 | | | 4 | | | 9 | | | |
| | | | | | | | | | | | | | | |
| Revenue days | | | | | | — | | | | 226 | | | 226 | | | 1,274 | | | |
| Average revenue per day | | | | | | $ | — | | | | $ | 24,827 | | | $ | 24,827 | | | $ | 36,456 | | | |
| | | | | | | | | | | | | | | |
| | | | | | | | | | | | | | | |
Our well servicing rig hours decreased by 41% during 2020 as compared to 2019, while average revenues per hour decreased by 9%. Although overall activity declined beginning in March 2020, especially for completion services, average revenues per hour remained relatively stable until June 2020 in regions where pricing was slower to respond to economic conditions. By late 2020, activity levels began to improve, resulting in fourth quarter rig hours that were 12% higher than those in the years ended December 31, 2017 and 2016:third quarter, but still approximately 35% less than in the first quarter of 2020.
|
| | | | | | | |
| | Year ended December 31, |
| | 2017 | | 2016 |
| | | | |
| Well servicing: | | | |
| Average number of rigs | 125 |
| | 125 |
|
| Utilization rate | 43 | % | | 41 | % |
| Rig hours | 150,240 |
| | 144,151 |
|
| Average revenue per hour | $ | 514 |
| | $ | 496 |
|
| | | | |
| Wireline services: | | | |
| Average number of units | 115 |
| | 122 |
|
| Number of jobs | 11,139 |
| | 8,169 |
|
| Average revenue per job | $ | 14,698 |
| | $ | 8,253 |
|
| | | | |
| Coiled tubing services: | | | |
| Average number of units | 16 |
| | 17 |
|
| Revenue days | 1,529 |
| | 1,352 |
|
| Average revenue per day | $ | 22,797 |
| | $ | 14,023 |
|
Increases in production services revenues and operating costs were led by ourOur wireline services business segment which experienced a significant increasedecreases of 63% and 21% in completion-related activity as wells that were drilled but not completed during the downturn created higher demand for completion services as our industry continues to recover. The number of wireline jobs we completed increased by 36%perforating stages performed and revenue per stage, respectively, during 2017,2020, as compared to 2016 while average2019. Already decreasing demand for completion-related services worsened with the sharp decline in industry conditions beginning in late February, and resulted in our decision to close several underperforming operating locations and downsize our fleet in 2020. Activity began improving in late 2020 with a nearly fourfold increase in perforating stages performed in the fourth quarter as compared to the third quarter, although the improved activity during the fourth quarter still represented less than half the number performed in the first quarter of 2020, with revenue per job increased by 78%,stage approximately 30% lower than that of the first quarter.
In April 2020, we closed our coiled tubing operations and idled all our coiled tubing equipment, which is largely due to completion-related jobs that earn higher revenue rates but also incur higher costswere subsequently placed as held for sale. This closure, combined with the job materials consumed on these types of jobs.
Our well servicing anddecline in demand for our coiled tubing services business segments experienced a more moderate increaseprior to April 2020, resulted in demand. Well servicing utilization increased to 43% during 2017, from 41% during 2016, representing a 4% increasethe 82% decrease in well servicing rig hours, while average revenue per hour also increased by 4%. Our coiled tubing revenue days increased by 13%, whileand the 32% decrease in average revenue per day increased by 63%, which was primarily due to a larger proportion of the work performed with larger diameter coiled tubing units which typically earn higher revenue ratesduring 2020 as compared to smaller diameter coiled tubing units.2019.
Depreciation and amortization expense — Our depreciation and amortization expense decreased by $15.5$21.6 million, or 24%, during 2017,2020 as compared to 2016,2019, primarily as a result of the impairments, dispositionsapplication of various equipment, andfresh start accounting which resulted in reductions to the values of our long-lived assets we placed as held for sale during 2016,of May 31, 2020 as well as reduced capital expenditures during 2016 and 2017the designation of all our coiled tubing assets as held-for-sale at June 30, 2020. The overall decrease in depreciation expense was partially offset by an increase due to the downturn. Duringdeployment of our 17th domestic AC drilling rig in March 2019 and an increase for the year ended Decemberamortization of intangibles which were established in connection with fresh start accounting at May 31, 2016,2020. Also, as a result of applying fresh start accounting, we recognized $11.6assigned new useful lives to our long-lived assets, several of which were assigned a remaining useful life of one year. Therefore, with no significant capital expenditures expected for 2021, we expect a decline in depreciation and amortization expense in mid-2021 as this class of assets becomes fully depreciated.
Prepetition restructuring charges— All expenses and losses incurred prior to the Petition Date which were related to the Chapter 11 proceedings are presented as prepetition restructuring charges in our Predecessor consolidated statements of operations, including $9.6 million of depreciation on drilling and well servicing rigs, wireline units, and certain other equipment which were subsequently sold or placed as heldexpense incurred for sale, and $1.3 million of amortization expense for certain intangible assets that were fully amortized by the end of 2016.
Impairment— DuringCommitment Premium pursuant to the years ended December 31, 2017 and 2016, we recognized impairment charges of $1.9 million and $12.8 million, respectively, primarily to reduce the carrying values of certain assets which were classified as held for sale, to their estimated fair values based on expected sale prices.Backstop Commitment Agreement. For more detail, see Note 2, Property and Equipment, Emergence from Voluntary Reorganization under Chapter 11, of the Notes to Consolidated Financial Statements, included in Part II, Item 8, Financial Statements and Supplementary Data, of this Annual Report on Form 10-K.
Impairment— Our interest expense increased by $1.1 million during the year ended December 31, 2017, as compared to 2016, primarily dueDue to the increased interest rate under our Revolving Credit Facility, which was amendedsignificant decline in June 2016,industry conditions, commodity prices, and the issuanceprojected utilization of our Term Loan in November 2017. Proceeds from the issuance of our Term Loan were used to repay and retire the Revolving Credit Facility, and resulted in an increase in our total debt outstanding,equipment, as well as an increased rate applicable to the outstanding borrowings. Weighted average debt outstanding underCOVID-19 pandemic’s impact on our Revolving Credit Facility and/or Term Loan (beginning in November 2017) was approximately $95.4industry, our projected cash flows declined during the first quarter of 2020, and we performed recoverability testing on all our reporting units. As a result of this analysis, we incurred impairment charges of $16.4 million and $96.0$2.2 million during 2020 to reduce the years ended December 31, 2017 and 2016, respectively, while the weighted average interest rate on these borrowings during these periods was approximately 6.9% and 5.7%, respectively.
Loss on extinguishment of debt — Our loss on extinguishment of debt in 2017 represents the write-off of net unamortized debt issuance costs associated with the extinguishmentcarrying values of our Revolving Credit Facility in November 2017. Our 2016 loss on debt extinguishment represents the write-off of net unamortized debt issuance costs resulting from the reduction of borrowing capacity under our Revolving Credit Facility when it was amended in 2016.
Income tax benefit — Our effective income tax rate for the year ended December 31, 2017 was lower than the federal statutory rate in the United States primarily duecoiled tubing assets and certain held-for-sale assets, respectively, to effects of recent tax law changes, valuation allowances, foreign currency translation, state taxes, and other permanent differences.their estimated fair values. For more detail, see Note 5, Income Taxes, Property and Equipment, of the Notes to Consolidated Financial Statements, included in Part II, Item 8, Financial Statements and Supplementary Data, of this Annual Report on Form 10-K.
GeneralReorganization items, net — Any expenses, gains, and administrative expense — Our generallosses incurred subsequent to the filing for Chapter 11 and administrative expense increased by approximately $8.5 million, or 14%, during 2017, as compared to 2016, primarilydirectly related to increased compensation costs. The increase in compensation cost was primarily due to a $7.1 million increase in salary, employee benefits and bonus expense during the year ended December 31, 2017, partiallysuch proceedings are presented as a result of increased headcount to accommodate higher activity levels, as well as increased incentive compensation based on improved company performance.
Gain on dispositions of property and equipment, net — Our net gain of $3.6 million on the disposition of various property and equipment during the year ended December 31, 2017 included sales of drilling and coiled tubing equipment and vehicles, as well as the loss of drill pipe in operation, for which we were reimbursed by our client. Net gains in 2017 also included the disposal of three cranes that were damaged, for which we received $0.2 million of the $0.8 million of insurance proceeds and expect to receive the remaining proceeds in early 2018. Our net gain of $1.9 million on the disposition of property and equipment during 2016 was primarily related to a net gain on the sale of drilling rigs and the disposal of excess drill pipe. These gains during 2016 were partially offset by a loss on the disposition of damaged drilling equipment.
Other income (expense), net— Our other income is primarily related to net foreign currency gains recognized for our Colombian operations.
Statements of Operations Analysis - Year Ended December 31, 2016 Compared with Year Ended December 31, 2015
The following table provides certain information about our operations, including a detail of each of our business segments’ revenues, operating costs and gross margin, and the percentage of the consolidated amount of each which is attributable to each business segment, for the years ended December 31, 2016 and 2015 (amounts in thousands, except percentages):
|
| | | | | | | | | | | | | |
| | Year ended December 31, |
| | 2016 | | 2015 |
| Revenues: | | | | | | | |
| Domestic drilling | $ | 112,399 |
| | 41 | % | | $ | 205,440 |
| | 38 | % |
| International drilling | 6,808 |
| | 2 | % | | 43,878 |
| | 8 | % |
| Drilling services | 119,207 |
| | 43 | % | | 249,318 |
| | 46 | % |
| Well servicing | 71,491 |
| | 26 | % | | 133,440 |
| | 25 | % |
| Wireline services | 67,419 |
| | 24 | % | | 120,387 |
| | 22 | % |
| Coiled tubing services | 18,959 |
| | 7 | % | | 37,633 |
| | 7 | % |
| Production services | 157,869 |
| | 57 | % | | 291,460 |
| | 54 | % |
| Consolidated revenues | $ | 277,076 |
| | 100 | % | | $ | 540,778 |
| | 100 | % |
| | | | | | | | |
| Operating costs: | | | | | | | |
| Domestic drilling | $ | 63,686 |
| | 31 | % | | $ | 108,602 |
| | 30 | % |
| International drilling | 9,465 |
| | 5 | % | | 35,594 |
| | 10 | % |
| Drilling services | 73,151 |
| | 36 | % | | 144,196 |
| | 40 | % |
| Well servicing | 53,208 |
| | 26 | % | | 91,125 |
| | 25 | % |
| Wireline services | 57,634 |
| | 28 | % | | 88,848 |
| | 26 | % |
| Coiled tubing services | 19,956 |
| | 10 | % | | 33,847 |
| | 9 | % |
| Production services | 130,798 |
| | 64 | % | | 213,820 |
| | 60 | % |
| Consolidated operating costs | $ | 203,949 |
| | 100 | % | | $ | 358,016 |
| | 100 | % |
| | | | | | | | |
| Gross margin: | | | | | | | |
| Domestic drilling | $ | 48,713 |
| | 67 | % | | $ | 96,838 |
| | 53 | % |
| International drilling | (2,657 | ) | | (4 | )% | | 8,284 |
| | 5 | % |
| Drilling services | 46,056 |
| | 63 | % | | 105,122 |
| | 58 | % |
| Well servicing | 18,283 |
| | 25 | % | | 42,315 |
| | 23 | % |
| Wireline services | 9,785 |
| | 13 | % | | 31,539 |
| | 17 | % |
| Coiled tubing services | (997 | ) | | (1 | )% | | 3,786 |
| | 2 | % |
| Production services | 27,071 |
| | 37 | % | | 77,640 |
| | 42 | % |
| Consolidated gross margin | $ | 73,127 |
| | 100 | % | | $ | 182,762 |
| | 100 | % |
| | | | | | | | |
| Consolidated: | | | | | | | |
| Net loss | $ | (128,391 | ) | | | | $ | (155,140 | ) | | |
Adjusted EBITDA (1) | $ | 14,237 |
| | | | $ | 110,780 |
| | |
(1) Adjusted EBITDA represents income (loss) before interest expense, income tax (expense) benefit, depreciation and amortization, loss on extinguishment of debt and impairments. Adjusted EBITDA is a non-GAAP measure that our management uses to facilitate period-to-period comparisons of our core operating performance and to evaluate our long-term financial performance against that of our peers. We believe that this measure is useful to investors and analysts in allowing for greater transparency of our core operating performance and makes it easier to compare our results with those of other companies within our industry. Adjusted EBITDA should not be considered (a) in isolation of, or as a substitute for, net income (loss), (b) as an indication of cash flows from operating activities or (c) as a measure of liquidity. In addition, Adjusted EBITDA does not represent funds available for discretionary use. Adjusted EBITDA may not be comparable to other similarly titled measures reported by other companies.
A reconciliation of net loss, as reported, to Adjusted EBITDA, and a reconciliation of net loss, as reported, to consolidated gross margin are set forth in the following table.
|
| | | | | | | |
| | Year ended December 31, |
| | 2016 | | 2015 |
| | (amounts in thousands) |
| Reconciliation of net loss and Adjusted EBITDA to consolidated gross margin: | | | |
| Net loss | $ | (128,391 | ) | | $ | (155,140 | ) |
| Depreciation and amortization | 114,312 |
| | 150,939 |
|
| Impairment | 12,815 |
| | 129,152 |
|
| Interest expense | 25,934 |
| | 21,222 |
|
| Loss on extinguishment of debt | 299 |
| | 2,186 |
|
| Income tax benefit | (10,732 | ) | | (37,579 | ) |
| Adjusted EBITDA | 14,237 |
| | 110,780 |
|
| General and administrative | 61,184 |
| | 73,903 |
|
| Bad debt expense (recovery) | 156 |
| | (188 | ) |
| Gain on dispositions of property and equipment, net | (1,892 | ) | | (4,344 | ) |
| Other (income) expense | (558 | ) | | 2,611 |
|
| Consolidated gross margin | $ | 73,127 |
| | $ | 182,762 |
|
Consolidated gross margin— Our consolidated gross margin decreased by 60% during 2016, as compared to 2015, primarily as a result of decreased activity and pricing pressure for all our service offerings. Of the $109.6 million decrease in consolidated gross margin, 54% was attributable to our drilling services business segments, primarily due to a reduction in domestic drilling activity. The remaining decrease attributable to our production services business segments is primarily due to a reduction in well servicing and wireline services activity.
In response to the downturnreorganization items in our industry, we took several actions during 2015 and 2016 to reduce costs and better scale our business to the reduced revenues. We reduced our total headcount by over 50%, reduced wage rates for our operations personnel, reduced incentive compensation and eliminated certain employment benefits. We closed ten field offices to reduce overhead and reduce associated lease payments, amended our Revolving Credit Facility, and sold 35 drilling rigs and other drilling equipment for aggregate net proceedsconsolidated statements of $65.5 million.
Drilling Services—Our drilling services revenues decreased by $130.1 million, or 52%, during 2016, as compared to 2015, while operating costs decreased by $71.0 million, or 49%. The decreases in our drilling services revenues and costs primarily resulted from a 46% decrease in revenue days due to the significant reduction in demand from an industry downturn that bottomed during the second quarter of 2016.
The following table provides operating statistics for each of our drilling services business segments for the years ended December 31, 2016 and 2015:
|
| | | | | | | |
| | Year ended December 31, |
| | 2016 | | 2015 |
| | | | |
| Domestic drilling: | | | |
| Average number of drilling rigs | 23 |
| | 31 |
|
| Utilization rate | 55 | % | | 70 | % |
| Revenue days | 4,628 |
| | 7,911 |
|
| | | | |
| Average revenues per day | $ | 24,287 |
| | $ | 25,969 |
|
| Average operating costs per day | 13,761 |
| | 13,728 |
|
| Average margin per day | $ | 10,526 |
| | $ | 12,241 |
|
| | | | |
| International drilling: | | | |
| Average number of drilling rigs | 8 |
| | 8 |
|
| Utilization rate | 7 | % | | 39 | % |
| Revenue days | 218 |
| | 1,129 |
|
| | | | |
| Average revenues per day | $ | 31,229 |
| | $ | 38,864 |
|
| Average operating costs per day | 43,417 |
| | 31,527 |
|
| Average margin per day | $ | (12,188 | ) | | $ | 7,337 |
|
Our domestic drilling average revenues per day during 2016 decreased relative to 2015, while our average operating costs per day increased, primarily due to the expiration of term contracts that were entered into in 2014 prior to the downturn at higher revenue rates, many of which were terminated early. Our domestic drilling average operating costs per day increased as a result of more revenue days attributable to daywork activity during 2016, versus more revenue days in 2015 from rigs that were earning but not working and incurring minimal costs under contracts that were terminated early. These increases in 2016 were partially offset by our reduced cost structure.
Demand for drilling rigs influences the types of drilling contracts we are able to obtain, and the type of revenues we earn under our drilling contracts. As a result of the downturn in our industry, several of our clients terminated a number of their drilling contracts with us. Drilling rigs under contracts which are terminated early earn lower standby revenue rates, as compared to daywork rates, and incur minimal operating costs. Alternatively, turnkey drilling contracts result in higher average revenues per day and higher average operating costs per day as compared to daywork drilling contracts.
The following table provides the percentages of our consolidated drilling services revenues by contract type for the years ended December 31, 2016 and 2015:
|
| | | | | |
| | Year ended December 31, |
| | 2016 | | 2015 |
| Daywork contracts (not terminated early) | 89 | % | | 77 | % |
| Daywork contracts terminated early | 11 | % | | 20 | % |
| Turnkey contracts | — | % | | 3 | % |
Our international drilling fleet utilization declined throughout 2016 and 2015 as several contracted rigs were placed on standby by our clients in response to weakening oil prices. In the fourth quarter of 2015, all three of the contracted rigs were placed on standby and remained idle until being redeployed in late 2016. As a result of the low utilization in 2016 and the contracts placed on standby, for which we continued to incur overhead costs until the rig was reactivated, our average international drilling revenues per day decreased while average operating costs per day increased. The increases were partially offset by our reduced cost structure in Colombia.
Production Services—Our production services revenues decreased by $133.6 million, or 46%, during 2016, as compared to 2015, while operating costs decreased by $83.0 million, or 39%, respectively. The decreases in revenues and operating costs are a result of reduced demand for our services, which similarly affected each of our production services business segments.
The following table provides operating statistics for each of our production services business segments for the years ended December 31, 2016 and 2015:
|
| | | | | | | |
| | Year ended December 31, |
| | 2016 | | 2015 |
| | | | |
| Well servicing: | | | |
| Average number of rigs | 125 |
| | 122 |
|
| Utilization rate | 41 | % | | 65 | % |
| Rig hours | 144,151 |
| | 225,938 |
|
| Average revenue per hour | $ | 496 |
| | $ | 591 |
|
| | | | |
| Wireline services: | | | |
| Average number of units | 122 |
| | 125 |
|
| Number of jobs | 8,169 |
| | 9,661 |
|
| Average revenue per job | $ | 8,253 |
| | $ | 12,461 |
|
| | | | |
| Coiled tubing services: | | | |
| Average number of units | 17 |
| | 17 |
|
| Revenue days | 1,352 |
| | 1,672 |
|
| Average revenue per day | $ | 14,023 |
| | $ | 22,507 |
|
The decreases in revenues and operating costs for each of our production services segments are a result of the significantly reduced demand for our services in response to the downturn in our industry, which led to decreased activity and increased pricing pressure for all our service offerings. Our well servicing utilization decreased to 41% during 2016, from 65% during 2015, representing a 36% decrease in rig hours, while average revenues per hour decreased by 16%. The the number of wireline jobs we completed during 2016 decreased by 15%, as compared to 2015, while average revenue per job decreased by 34%. Similarly, our coiled tubing services revenue days decreased by 19%, while the average revenue per day also decreased by 38%.
Depreciation and amortization expense — Our depreciation and amortization expense decreased by $36.6 million during 2016, as compared to 2015, primarily as a result of the impairment charges during 2015 to reduce the carrying values of domestic and Colombia drilling rigs, coiled tubing equipment, and intangible assets to their estimated fair values. The sales and disposals of drilling rigs and equipment during 2015 also contributed to the decrease in depreciation expense in 2016. During 2015, we recognized $10.3 million of depreciation on drilling rigs which were subsequently sold or placed as held for sale, and $3.8 million for the amortization of coiled tubing intangible assets which were impaired to zero at the end of 2015. The overall decrease in our depreciation expense was partially offset by $6.1 million of additional depreciation recognized during the year ended December 31, 2016 for the five new drilling rigs which we deployed in 2015.
Impairment— During the year ended December 31, 2016, we recognized impairment charges of $12.8 million, primarily to reduce the carrying values of assets which were classified as held for sale, to their estimated fair values, based on expected sales prices. During the year ended December 31, 2015, we recognized impairment charges of $129.2 million, primarily related to certain domestic and international drilling rigs, coiled tubing equipment, and intangibles and other equipment designated as held for sale.operations. For more detail, see Note 2, Property and Equipment, Emergence from Voluntary Reorganization under Chapter 11, of the Notes to Consolidated Financial Statements, included in Part II, Item 8, Financial Statements and Supplementary Data, of this Annual Report on Form 10-K.
Interest expense — Our interest expense increaseddecreased by $4.7$12.7 million, or 32% during 2016,2020 as compared to 2015,2019, primarily due tobecause the Prepetition Senior Notes stopped accruing interest as of March 1, 2020, in accordance with the terms of the Plan, and because our total outstanding debt was significantly reduced upon our emergence from Chapter 11. The overall decreases were slightly offset by an increase in amortization of debt discounts and issuance costs, which increased the total effective interest rate under our Revolving Credit Facility, which was amended in late 2015 and again in June 2016.during the period.
Loss on extinguishment of debt— Loss on extinguishment of debt — Our loss on debt extinguishment representsduring 2020 primarily related to the write off of debt costs associated with the reduced borrowing capacitytermination of our Revolving CreditPredecessor ABL Facility at the Petition Date, as a resultwell as tender offer repayments of the amendments in 2015 and 2016.
Income tax expense (benefit) — Our effective income tax rate for the year ended December 31, 2016 was 8%, which is lower than the federal statutory rateour Senior Secured Notes in the United States primarily due to valuation allowances, the effect of foreign currency translation, state taxes, and other permanent differences. For more detail, seeSuccessor period, as further described in Note 5, Income Taxes7, Debt,of the Notes to Consolidated Financial Statements, included in Part II, Item 8, Financial Statements and Supplementary Data, of this Annual Report on Form 10-K.
Income tax benefit— Our effective tax rates differ from the applicable U.S. statutory rates primarily due to the impact of valuation allowances, as well as the impact of state taxes, other permanent differences, and the mix of profit and loss between federal, state and international taxing jurisdictions with different tax rates. For more information, see Note 8, Taxes, of the Notes to Consolidated Financial Statements, included in Part II, Item 8, Financial Statements and Supplementary Data, of this Annual Report on Form 10-K.
General and administrative expense — Our general and administrative expense decreased by approximately $12.7$45.1 million, or 17%49%, during 2016,2020 as compared to 2015. This decrease2019, of which $30.7 million is attributable to reduced employee costs primarily due toin connection with the decline in operational activity but also including a $20.8 million decrease in incentive compensation primarily associated with the retention and benefit costs during 2016incentive compensation awards granted in the third quarter of $5.2 million, resulting primarily from2019, the reductiontermination of our previous annual and long-term cash incentive awards in 2019 and the suspension of incentive awards in early 2020. Other factors contributing to the overall decrease in our workforcegeneral and reduced employee benefitsadministrative expense include higher professional fees incurred in 2019 relating to the evaluation of strategic alternatives and other actions taken to minimize variousthe ultimate preparation for the filing for Chapter 11 reorganization in March 2020 as well as costs incurred in connection with the evaluation and selection of a company-wide enterprise resource planning system that has since been postponed. The overall decrease in general and administrative expense was partially offset by $3.6 million of severance costs such as rent, office and travel expenses.for certain executives whose employment was terminated during the third quarter of 2020.
Gain on dispositions of property and equipment, net— OurDuring the years ended December 31, 2020 and 2019, we recognized net gaingains of $1.9$7.1 million and $4.5 million, respectively, on the disposition or sale of various property and equipment, during the year ended December 31, 2016 was primarily related to a net gain on the sale of three domestic drilling rigsincluding coiled tubing equipment, drill pipe and the disposal of excess drill pipe. These gains were partially offset by a loss on the disposition of damaged drillingcollars and certain older and/or underutilized equipment. Our net gain of $4.3 million on the disposition of property and equipment during the year ended December 31, 2015 was primarily for the sale of 32 domestic drilling rigs and other drilling equipment.
Other (income) expense (income)—The increasedecrease in our other income during 2020 is primarily related to $1.2 million of net foreign currency gainslosses recognized for our Colombian operations, during the year ended December 31, 2016, as compared to $1.0 million of net foreign currency lossesgains during 2015.the corresponding period in 2019.
Inflation
When the demand for drilling and production services increases, we may be affected by inflation, which primarily impacts:
wage rates for our operations personnel which increase when the availability of personnel is scarce;
materials and supplies used in our operations;
equipment repair and maintenance costs;
costs to upgrade existing equipment; and
costs to construct new equipment.
With the recent increases in activity in our industry, we estimate that inflation has had a modest impact on our operations during 2016 and 2017. However, we expect that we will experience a moderate increase in inflation in 2018 if activity continues to improve.
Off-Balance Sheet Arrangements
We do not have any off-balance sheet arrangements.
Critical Accounting Policies and Estimates
The preparation of financial statements in conformity with USU.S. GAAP requires us to make estimates and assumptions that affect the amounts reported in our financial statements and accompanying notes. Actual results could differ from those estimates.
Revenues and Cost Recognition — Our drilling services business segments earn revenues by drilling oil and gas wells for our clients under daywork contracts. We recognize revenues on daywork contracts for the days completed based on the dayrate specified in each contract.
With most drilling contracts, we receive payments contractually designated for the mobilization of rigs and other equipment. Payments received, and costs incurred for the mobilization services are deferred and recognized on a straight line basis over the related contract term. Costs incurred to relocate rigs and other drilling equipment to areas in which a contract has not been secured are expensed as incurred. Reimbursements that we receive for out-of-pocket expenses are recorded as revenues and the out-of-pocket expenses for which they relate are recorded as operating costs.
With most term drilling contracts, we are entitled to receive a full or reduced rate of revenues from our clients if they choose to place a rig on standby or to early terminate the contract before its original expiration term. Revenues derived from rigs placed on standby or from the early termination of term drilling contracts are deferred and recognized as the amounts become fixed or determinable, over the remainder of the original term or when the rig is sold.
Our production services business segments earn revenues for well servicing, wireline services and coiled tubing services pursuant to master services agreements based on purchase orders, contracts or other arrangements with the client that include fixed or determinable prices. Production services jobs are generally short-term and are charged at current market rates. Production service revenue is recognized when the service has been rendered and collectability is reasonably assured.
All of our revenues are recognized net of sales taxes when applicable.
Long-lived assets Accounting estimates — We evaluate for potential impairment of long-lived assets when indicators of impairment are present, which may include, among other things, significant adverse changes in industry trends (including revenue rates, utilization rates, oil and natural gas market prices, and industry rig counts). In performing an impairment evaluation, we estimate the future undiscounted net cash flows from the use and eventual disposition of the assets grouped at the lowest level that independent cash flows can be identified. We perform an impairment evaluation and estimate future undiscounted cash flows for each of our reporting units separately, which are our domestic drilling services, international drilling services, well servicing, wireline services and coiled tubing services segments. If the sum of the estimated future undiscounted net cash flows is less than the carrying amount of the asset group, then we determine the fair value of the asset group. The amount of an impairment charge is measured as the difference between the carrying amount and the fair value of the assets.The assumptions used in the impairment evaluation are inherently uncertain and require management judgment.
Deferred taxes — We provide deferred taxes for the basis differences in our property and equipment between financial reporting and tax reporting purposes and other costs such as compensation, net operating loss carryforwards, employee benefit and other accrued liabilities which are deducted in different periods for financial reporting and tax reporting purposes. For property and equipment, differences arise from differences in depreciation periods and methods and the value of assets acquired in a business acquisition where we acquire an entity rather than just its assets. For financial reporting purposes, we depreciate the various components of our drilling rigs, well servicing rigs, wireline units and coiled tubing units over 1 to 25 years and refurbishments over 3 to 5 years, while federal income tax rules generally require that we depreciate drilling rigs, well servicing rigs, wireline units and coiled tubing units over 5 years. Therefore, in the first 5 years of our ownership of a drilling rig, well servicing rig, wireline unit or coiled tubing unit, our tax depreciation exceedsMaterial estimates affecting our financial reporting depreciation, resulting in our providing deferred taxes on this depreciation difference. After 5 years, financial reporting depreciation exceeds tax depreciation, and the deferred tax liability begins to reverse.
Accounting estimates — Material estimatesresults, including those that are particularly susceptible to significant changes in the near term, relate to our estimateapplication of the allowance for doubtful accounts,fresh start accounting, our determinationestimates of depreciationcertain variable revenues and amortization expenses,periods of certain deferred revenues and costs associated with drilling daywork contracts, our estimates of projected cash flows and fair values for impairment evaluations, our estimate of the valuation allowance for deferred tax assets, and our estimate of the liability relating to the self-insurance portion of our health and workers’ compensation insurance,insurance.
•Fresh Start Accounting. In connection with our estimateemergence from bankruptcy and in accordance with ASC Topic 852, we qualified for and adopted fresh start accounting on the Effective Date. We were required to adopt fresh start accounting because (i) the holders of compensation related accrualsexisting voting shares of the Predecessor Company received less than 50% of the voting shares of the Successor Company, and (ii) the reorganization value of our estimateassets immediately prior to confirmation of sales tax audit liability.the Plan was less than the post-petition liabilities and allowed claims.
We estimate an allowanceIn accordance with ASC Topic 852, with the application of fresh start accounting, we allocated the reorganization value to our individual assets and liabilities (except for doubtful accountsdeferred income taxes) based on the creditworthinesstheir estimated fair values in conformity with ASC Topic 805, Business Combinations. The amount of deferred taxes was determined in accordance with ASC Topic 740, Income Taxes. The Effective Date fair values of our clientsassets and liabilities differed materially from their recorded values as well as general economic conditions. We evaluatereflected on the creditworthinesshistorical balance sheets.
Fresh start accounting involved a comprehensive valuation process in which we determined the fair value of all our clients basedassets and liabilities on commercial credit reports, trade references, bank references, financialthe Effective Date. For more information, production informationsee Note 3, Fresh Start Accounting, of the Notes to Consolidated Financial Statements, included in Part II, Item 8, Financial Statements and any past experienceSupplementary Data, of this Annual Report on Form 10-K.
•Revenues. In accordance with ASC Topic 606, Revenue from Contracts with Customers, we haveestimate certain variable revenues associated with the client. Consequently, any change in those factors could affect our estimate of our allowance for doubtful accounts. In some instances, we require new clients to establish escrow accounts or make prepayments. We had an allowance for doubtful accounts of $1.2 million and $1.7 million at December 31, 2017 and December 31, 2016, respectively.
Our determination of the useful lives of our depreciable assets directly affects our determination of depreciation expense and deferred taxes. A decrease in the useful life of our property and equipment would increase depreciation expense and reduce deferred taxes. We provide for depreciationdemobilization of our drilling production, transportation and other equipment on a straight-line method over useful lives that we have estimated and that range from 1 to 25 years.rigs under daywork drilling contracts. We record the same depreciation expense whether a drilling rig, well servicing rig, wireline unit or coiled tubing unit is idle or working. Ouralso make estimates of the useful livesapplicable amortization periods for deferred mobilization costs, and for mobilization revenues related to cancelable term contracts which represent a material right to our clients. These estimates and assumptions are described in more detail in Note 4, Revenue from Contracts with Customers. In order to make these estimates, management considers all the facts and circumstances pertaining to each particular contract, our past experience and knowledge of our drilling, production, transportationcurrent market conditions. For more information, see Note 4, Revenue from Contracts with Customers, of the Notes to Consolidated Financial Statements, included in Part II, Item 8, Financial Statements and other equipment are basedSupplementary Data, of this Annual Report on our almost 50 years of experience in the oilfield services industryForm 10-K.
•Impairment Evaluation. In accordance with similar equipment.
We evaluate for potential impairment of long-lived assets when indicators of impairment are present, which may include, among other things, significant adverse changes in industry trends (including revenue rates, utilization rates, oilASC Topic 360, Property, Plant and natural gas market prices, and industry rig counts). Despite the modest recovery in commodity prices that began in late 2016 and continued through 2017,Equipment, we continue to monitor all indicators of potential impairments in accordance with ASC Topic 360, Property, Plant and Equipment.impairments. Due to continued performance at levels lower than anticipatedthe significant decline in industry conditions, commodity prices, and a
decline inprojected utilization of equipment, as well as the COVID-19 pandemic’s impact on our industry, our projected cash flows fordeclined during the coiled tubingfirst quarter of 2020, and we performed recoverability testing on all our reporting unit,units. As a result of this analysis, we again performed anincurred impairment evaluationcharges of $16.4 million to reduce the carrying values of our coiled tubing business asassets to their estimated fair values during the three months ended March 31, 2020. For all our other reporting units, excluding coiled tubing, we determined that the sum of June 30, 2017the estimated future undiscounted net cash flows were in excess of the carrying amounts and that no impairment existed for these reporting units at March 31, 2020. We continued to monitor potential indicators of impairment through December 31, 2020 and concluded that no impairment was present.none of our reporting units are currently at risk of impairment.
The assumptions usedwe use in the evaluation for impairment evaluation are inherently uncertain and require management judgment. Although we believe the assumptions and estimates used in our impairment analysesanalysis are reasonable, and appropriate, different assumptions and estimates could materially impact the analysesanalysis and resulting conclusions. The most significant inputs used in our impairment analysis include the projected utilization and pricing of our services, as well as the estimated proceeds upon any future sale or disposal of the assets, all of which are classified as Level 3 inputs as defined by ASC Topic 820, Fair Value Measurements and Disclosures. If commodity prices decrease or remain at current levels for an extended period of time, or if the demand for any of our assets become or remain idle for an extended amount of time, thenservices decreases below what we are currently projecting, our estimated cash flows may further decrease and thereforeour estimates of the probabilityfair value of a near term salecertain assets may increase.decrease as well. If any of the foregoing were to occur, we maycould incur additional impairment charges.
As of December 31, 2017, we had $106.2 million of deferred tax assetscharges on the related to domestic and foreign net operating losses that are available to reduce future taxable income. In assessing the realizability of our deferred tax assets, we consider whether it is more likely than not that some portion or all of the deferred tax assets will not be realized. The ultimate realization of deferred tax assets is dependent upon the generation of future taxable income during the periods in which those temporary differences become deductible. As a result, we have a valuation allowance that fully offsets our foreign and U.S. federal deferred tax assets as of December 31, 2017. The valuation allowance and the recent change in tax laws are the primary factors causing our effective tax rate to be significantly lower than the statutory rate of 35%.assets. For more information, see Note 5, Income TaxesProperty and Equipment, of the Notes to Consolidated Financial Statements, included in Part II, Item 8, Financial Statements and Supplementary Data, of this Annual Report on Form 10-K.
Our•Deferred Tax Assets. We provide a valuation allowance when it is more likely than not that some portion of our deferred tax assets will not be realized. We evaluated the impact of the reorganization, including the change in control, resulting from our bankruptcy emergence and determined it is more likely than not that we will not fully realize future income tax benefits related to our domestic net deferred tax assets based on the annual limitations that impact us, historical results, and expected market conditions known on the date of measurement. For more information, see Note 8, Income Taxes, of the Notes to Consolidated Financial Statements, included in Part II, Item 8, Financial Statements and Supplementary Data, of this Annual Report on Form 10-K.
•Insurance Claim Liabilities. We use a combination of self-insurance and third-party insurance for various types of coverage. We have stop-loss coverage of $225,000 per covered individual per year under our health insurance and deductibles of $500,000 and $250,000 per occurrence under our workers’ compensation and auto liability insurance, respectively. We have a $500,000 self-insured retention and an additional aggregate deductible of $500,000 under our general liability insurance as well as an annual aggregate deductible of $1,000,000 on the first layer of excess coverage. At December 31, 2020, our accrued insurance premiums and deductibles asinclude approximately $0.6 million of December 31, 2017 include accruals for costs incurred under the self-insurance portion of our health insurance ofand approximately $2.0 million andof accruals for costs associated with our workers’ compensation general liability and auto liability insurance of approximately $4.6 million. We have stop-loss coverage of $200,000 per covered individual per year under our health insurance and a deductible of $500,000 per occurrence under our workers’ compensation insurance. We have a deductible of $250,000 per occurrence under both our general liability insurance and auto liability insurance. We accrue for these costs as claims are incurred using an actuarial calculation that is based on industry and our company’s historical claim development data, and we accrue the costscost of administrative services associated with claims processing.
Recently Issued Accounting Standards
Our compensation expense includes estimates for certain of our long-term incentive compensation plans which have performance-based award components dependent upon our performance over a set performance period, as compared to the performance of a pre-defined peer group. The accruals for these awards include estimates which affect our compensation expense, employee related accruals and equity. The accruals are adjusted based on actual achievement levels at the end of the pre-determined performance periods. Additionally, our phantom stock unit awards are classified as liability awards under ASC Topic 718, Compensation—Stock Compensation, because we expect to settle the awards in cash when they vest, and are remeasured at fair value at the end of each reporting period until they vest. The change in fair value is recognized as a current period compensation expense in our statement of operations. Therefore, changes in the inputs used to measure fair value can result in volatility in our compensation expense. This volatility increases as the phantom stock awards approach the vesting date. For more information about recently issued accounting standards, see Note 8, Equity Transactions1, Organization and Stock-Based Compensation Plans, Summary of Significant Accounting Policies, of the Notes to Consolidated Financial Statements, included in Part II, Item 8, Financial Statements and Supplementary Data, of this Annual Report on Form 10-K.
We are currently undergoing sales and use tax audits for multi-year periods and we are working to resolve all relevant issues. As of December 31, 2017 and December 31, 2016, our accrued liability was $1.2 million and $0.6 million, respectively, based on our estimate of the sales and use tax obligations that are expected to result from these audits. For more information, see Note 11, Commitments and Contingencies, of the Notes to Consolidated Financial Statements, included in Part II, Item 8, Financial Statements and Supplementary Data, of this Annual Report on Form 10-K.
Recently Issued Accounting Standards
For a detail of recently issued accounting standards, see Note 1, Organization and Summary of Significant Accounting Policies, of the Notes to Consolidated Financial Statements, included in Part II, Item 8, Financial Statements and Supplementary Data, of this Annual Report on Form 10-K.
Recent Developments
On December 22, 2017, the Tax Cuts and Jobs Act of 2017 (the “Tax Reform Act”) was enacted, with an effective date of January 1, 2018. The legislation significantly changes U.S. tax law by, among other things, lowering corporate income tax rates from 35% to 21%, repealing the alternative minimum tax (AMT), limiting the deductibility of interest expense, implementing a territorial tax system and imposing a repatriation tax on deemed repatriated earnings of foreign subsidiaries. The net impact of the Tax Reform Act for the period ended December 31, 2017 is a $5.4 million benefit, net of valuation allowances.
For more information, see Note 5, Income Taxes, of the Notes to Consolidated Financial Statements, included in Part II, Item 8, Financial Statements and Supplementary Data, of this Annual Report on Form 10-K.
| |
ITEM 7A. | ITEM 7A. QUANTITATIVE AND QUALITATIVE DISCLOSURES ABOUT MARKET RISK |
Interest Rate Risk — We are subject to interest rate market risk on our variable rate debt. As of December 31, 2017, the principal amount under our Term Loan was $175 million, which is our only variable rate debt with an outstanding balance. The impact of a hypothetical 1% increase or decrease in interest rates on this amount of debt would have resulted in a corresponding increase or decrease, respectively, in interest expense of approximately $1.8 million during the year ended December 31, 2017. This potential increase or decrease is based on the simplified assumption that the level of variable rate debt remains constant with an immediate across-the-board interest rate increase or decrease as of January 1, 2017.
Foreign Currency Risk — While the U.S. dollar is the functional currency for reporting purposes for our Colombian operations, we enter into transactions denominated in Colombian Pesos. Nonmonetary assets and liabilities are translated at historical rates and monetary assets and liabilities are translated at exchange rates in effect at the end of the period. Income statement accounts are translated at average rates for the period. As a result, Colombian Peso denominated transactions are affected by changes in exchange rates. We generally accept the exposure to exchange rate movements without using derivative financial instruments to manage this risk. Therefore, both positive and negative movements in the Colombian Peso currency exchange rate against the U.S. dollar have and will continue to affect the reported amount of revenues, expenses, profit, and assets and liabilities in our consolidated financial statements. The impact of currency rate changes on our Colombian Peso denominated transactions and balances resulted in net foreign currency gains of $0.3 million for the year ended December 31, 2017.Not applicable.
| |
ITEM 8. | FINANCIAL STATEMENTS AND SUPPLEMENTARY DATA |
ITEM 8.FINANCIAL STATEMENTS AND SUPPLEMENTARY DATA
PIONEER ENERGY SERVICES CORP.
INDEX TO CONSOLIDATED FINANCIAL STATEMENTS
Report of Independent Registered Public Accounting Firm
The shareholders
To the Stockholders and boardBoard of directorsDirectors
Pioneer Energy Services Corp.:
Opinion on the Consolidated Financial Statements
We have audited the accompanying consolidated balance sheets of Pioneer Energy Services Corp. and subsidiaries (the Company) as of December 31, 20172020 (Successor) and 2016December 31, 2019 (Predecessor), the related consolidated statements of operations, shareholders’stockholders’ equity, and cash flows for each of the years in the three-year periodseven months ended December 31, 20172020 (Successor), for the five months ended May 31, 2020 (Predecessor), and for the year ended December 31, 2019 (Predecessor), and the related notes (collectively, the consolidated financial statements). In our opinion, the consolidated financial statements present fairly, in all material respects, the financial position of the Company as of December 31, 20172020 (Successor) and 2016,December 31, 2019 (Predecessor), and the results of its operations and its cash flows for each of the years in the three-year periodseven months ended December 31, 2017,2020 (Successor), for the five months ended May 31, 2020 (Predecessor), and for the year ended December 31, 2019 (Predecessor), in conformity with U.S. generally accepted accounting principles.
We also have audited, in accordance with the standards of the Public Company Accounting Oversight Board (United States) (PCAOB), the Company’s internal control over financial reporting as of December 31, 2017,2020 (Successor), based on criteria established in Internal Control—Control - Integrated Framework (2013) issued by the Committee of Sponsoring Organizations of the Treadway Commission, (COSO), and our report dated February 16, 2018March 5, 2021 expressed an unqualified opinion on the effectiveness of the Company’s internal control over financial reporting.
Basis of Presentation
As discussed in Note 1 to the consolidated financial statements, the Company emerged from bankruptcy on May 29, 2020 with a reporting date of May 31, 2020. Accordingly, the accompanying consolidated financial statements have been prepared in conformity with Accounting Standards Codification Topic 852, Reorganizations, for the Successor as a new entity with assets, liabilities and a capital structure having carrying amounts not comparable with prior periods.
Basis for Opinion
These consolidated financial statements are the responsibility of the Company’s management. Our responsibility is to express an opinion on these consolidated financial statements based on our audits. We are a public accounting firm registered with the PCAOB and are required to be independent with respect to the Company in accordance with the U.S. federal securities laws and the applicable rules and regulations of the Securities and Exchange Commission and the PCAOB.
We conducted our audits in accordance with the standards of the PCAOB. Those standards require that we plan and perform the audit to obtain reasonable assurance about whether the consolidated financial statements are free of material misstatement, whether due to error or fraud. Our audits included performing procedures to assess the risks of material misstatementsmisstatement of the consolidated financial statements, whether due to error or fraud, and performing procedures that respond to those risks. Such procedures included examining, on a test basis, evidence regarding the amounts and disclosures in the consolidated financial statements. Our audits also included evaluating the accounting principles used and significant estimates made by management, as well as evaluating the overall presentation of the consolidated financial statements. We believe that our audits provide a reasonable basis for our opinion.
Critical Audit Matters
The critical audit matters communicated below are matters arising from the current period audit of the consolidated financial statements that were communicated or required to be communicated to the audit committee and that: (1) relate to accounts or disclosures that are material to the consolidated financial statements and (2) involved our especially challenging, subjective, or complex judgments. The communication of critical audit matters does not alter in any way our opinion on the consolidated financial statements, taken as a whole, and we are not, by communicating the critical audit matters below, providing separate opinions on the critical audit matters or on the accounts or disclosures to which they relate.
Fair value of trademark and tradename intangible assets
As discussed in Note 3 to the consolidated financial statements, on May 29, 2020 the Company emerged from Chapter 11 Bankruptcy. In connection with the Company's emergence from bankruptcy, the Company qualified for and adopted fresh start accounting. The Company determined a reorganization value of $352.6 million, which represents the fair value of the Successor Company's assets before considering liabilities and allocated the value to its individual assets based on their estimated fair values. The Company used the relief-from-royalty income approach to determine the fair value of the trademark and tradename intangible assets, which was $9.4 million as of May 29, 2020.
We identified the assessment of the measurement of fair value of the trademark and tradename intangible assets as a critical audit matter. Due to the significant estimation uncertainty associated with the fair value of such intangible assets, subjective and challenging auditor judgment was required to evaluate certain assumptions used in the Company’s valuation, specifically the selection of the royalty rate used in the valuation of the trademark and tradename intangible assets. The audit effort associated with this evaluation required specialized skills and knowledge.
The following are the primary procedures we performed to address this critical audit matter. We evaluated the design and tested the operating effectiveness of certain internal controls over the determination of the fair value of trademark and tradename intangible assets, including certain controls over the selection of the royalty rate. To test the valuation of the trademark and tradename intangible assets, we involved valuation professionals with specialized skills and knowledge, who assisted in the evaluation of the royalty rate used by the Company by comparing it to publicly available market royalty rates for comparable trade names and by performing a sensitivity analysis to assess the impact of reasonably possible changes in the royalty rate on the Company’s determination of fair value.
Coiled tubing asset group impairment
As discussed in Note 5 to the consolidated financial statements, the Company evaluates for potential impairment of long-lived assets when indicators of impairment are present. Due to the significant decline in industry conditions, commodity prices, and projected utilization of equipment, as well as the COVID-19 pandemic’s impact on the Company’s industry, the Company’s projected cash flows declined during the first quarter of 2020 and the Company performed recoverability testing on its long-lived assets. As a result of this analysis, the Company recorded impairment charges of $16.4 million to reduce the carrying value of its coiled tubing asset group to estimated fair value.
We identified the assessment of the coiled tubing asset group impairment as a critical audit matter. Subjective and challenging auditor judgment was required to evaluate the Company’s determination of the fair value of such assets, specifically the valuation date market adjustments applied in the cost approach to market sales data for comparable assets, due to the lack of observable inputs. The audit effort related to the evaluation of the market adjustments required specialized skills and knowledge.
The following are the primary procedures we performed to address this critical audit matter. We evaluated the design and tested the operating effectiveness of certain internal controls over the Company’s property and equipment impairment process, including controls related to the valuation date market adjustments applied to market sales data for comparable assets. We involved valuation professionals with specialized skills and knowledge, who assisted in evaluating the valuation date market adjustments by performing independent research regarding current market conditions and testing the mathematical accuracy of the valuation date market adjustments calculations.
/s/ KPMG LLP
We have served as the Company’s auditor since 1979.
San Antonio, Texas
February 16, 2018March 5, 2021
Report of Independent Registered Public Accounting Firm
The shareholders
To the Stockholders and boardBoard of directorsDirectors
Pioneer Energy Services Corp.:
Opinion on Internal Control Over Financial Reporting
We have audited Pioneer Energy Services Corp.’s and subsidiaries’ (the Company) internal control over financial reporting as of December 31, 20172020 (Successor), based on criteria established in Internal Control—Control - Integrated Framework (2013), issued by the Committee of Sponsoring Organizations of the Treadway Commission. In our opinion, the Company maintained, in all material respects, effective internal control over financial reporting as of December 31, 2017,2020 (Successor), based on criteria established in Internal Control—Control - Integrated Framework (2013) issued by the Committee of Sponsoring Organizations of the Treadway Commission.
We also have audited, in accordance with the standards of the Public Company Accounting Oversight Board (United States) (PCAOB), the consolidated balance sheets of the Company as of December 31, 20172020 (Successor) and 2016,December 31, 2019 (Predecessor), the related consolidated statements of operations, shareholders’stockholders’ equity, and cash flows for each of the years in the three-year periodseven months ended December 31, 2017,2020 (Successor), for the five months ended May 31, 2020 (Predecessor), and for the year ended December 31, 2019 (Predecessor), and the related notes (collectively, the consolidated financial statements), and our report dated February 16, 2018March 5, 2021, expressed an unqualified opinion on those consolidated financial statements.
Basis for Opinion
The Company’s management is responsible for maintaining effective internal control over financial reporting and for its assessment of the effectiveness of internal control over financial reporting, included in the accompanying Management’s Annual Report on Internal Control overOver Financial Reporting. Our responsibility is to express an opinion on the Company’s internal control over financial reporting based on our audit. We are a public accounting firm registered with the PCAOB and are required to be independent with respect to the Company in accordance with the U.S. federal securities laws and the applicable rules and regulations of the Securities and Exchange Commission and the PCAOB.
We conducted our audit in accordance with the standards of the PCAOB. Those standards require that we plan and perform the audit to obtain reasonable assurance about whether effective internal control over financial reporting was maintained in all material respects. Our audit of internal control over financial reporting included obtaining an understanding of internal control over financial reporting, assessing the risk that a material weakness exists, and testing and evaluating the design and operating effectiveness of internal control based on the assessed risk. Our audit also included performing such other procedures as we considered necessary in the circumstances. We believe that our audit provides a reasonable basis for our opinion.
Definition and Limitations of Internal Control Over Financial Reporting
A company’s internal control over financial reporting is a process designed to provide reasonable assurance regarding the reliability of financial reporting and the preparation of financial statements for external purposes in accordance with generally accepted accounting principles. A company’s internal control over financial reporting includes those policies and procedures that (1) pertain to the maintenance of records that, in reasonable detail, accurately and fairly reflect the transactions and dispositions of the assets of the company; (2) provide reasonable assurance that transactions are recorded as necessary to permit preparation of financial statements in accordance with generally accepted accounting principles, and that receipts and expenditures of the company are being made only in accordance with authorizations of management and directors of the company; and (3) provide reasonable assurance regarding prevention or timely detection of unauthorized acquisition, use, or disposition of the company’s assets that could have a material effect on the financial statements.
Because of its inherent limitations, internal control over financial reporting may not prevent or detect misstatements. Also, projections of any evaluation of effectiveness to future periods are subject to the risk that controls may become inadequate because of changes in conditions, or that the degree of compliance with the policies or procedures may deteriorate.
/s/ KPMG LLP
San Antonio, Texas
February 16, 2018March 5, 2021
PIONEER ENERGY SERVICES CORP. AND SUBSIDIARIES
CONSOLIDATED BALANCE SHEETS
(in thousands, except share data)
| | | | | | | | | | | | | | |
| Successor | | | Predecessor |
| December 31, 2020 | | | December 31, 2019 |
| | | | |
| |
| ASSETS | | | | |
| | | | |
| Cash and cash equivalents | $ | 31,181 | | | | $ | 24,619 | |
| Restricted cash | 1,148 | | | | 998 | |
| Receivables: | | | | |
| Trade, net of allowance for doubtful accounts | 29,803 | | | | 79,135 | |
| Unbilled receivables | 4,740 | | | | 12,590 | |
| Insurance recoveries | 22,106 | | | | 22,873 | |
| Other receivables | 2,716 | | | | 8,928 | |
| Inventory | 12,641 | | | | 22,453 | |
| Assets held for sale | 3,608 | | | | 3,447 | |
| Prepaid expenses and other current assets | 5,190 | | | | 7,869 | |
| Total current assets | 113,133 | | | | 182,912 | |
| | | | |
| Property and equipment, at cost | 193,529 | | | | 1,119,546 | |
| Less accumulated depreciation | 31,760 | | | | 648,376 | |
| Net property and equipment | 161,769 | | | | 471,170 | |
| Intangible assets, net of accumulated amortization | 8,942 | | | | 0 | |
| | | | |
| Deferred income taxes | 12,746 | | | | 11,540 | |
| | | | |
| Operating lease assets | 4,383 | | | | 7,264 | |
| Other noncurrent assets | 13,457 | | | | 1,068 | |
| | | | |
| Total assets | $ | 314,430 | | | | $ | 673,954 | |
| | | | |
| LIABILITIES AND STOCKHOLDERS’ EQUITY | | | | |
| | | | |
| Accounts payable | $ | 17,516 | | | | $ | 32,551 | |
| Current portion of long-term debt | 150 | | | | 0 | |
| Deferred revenues | 1,019 | | | | 1,339 | |
| | | | |
| | | | |
| Accrued expenses: | | | | |
| Employee compensation and related costs | 7,325 | | | | 13,781 | |
| Insurance claims and settlements | 22,106 | | | | 22,873 | |
| Insurance premiums and deductibles | 3,928 | | | | 5,940 | |
| Interest | 2,015 | | | | 5,452 | |
| Other | 4,959 | | | | 9,645 | |
| | | | |
| Total current liabilities | 59,018 | | | | 91,581 | |
| | | | |
| Long-term debt, less unamortized discount and debt issuance costs | 147,167 | | | | 467,699 | |
| Noncurrent operating lease liabilities | 3,622 | | | | 5,700 | |
| Deferred income taxes | 947 | | | | 4,417 | |
| Other noncurrent liabilities | 1,779 | | | | 481 | |
| | | | |
| Total liabilities | 212,533 | | | | 569,878 | |
| | | | |
| Commitments and contingencies (Note 14) | | | | |
| | | | |
| | | | |
| Stockholders’ equity: | | | | |
| | | | |
| Predecessor common stock $0.10 par value; 200,000,000 shares authorized; 79,202,216 shares outstanding at December 31, 2019 | 0 | | | | 8,008 | |
| | | | |
| Successor common stock, $0.001 par value; 25,000,000 shares authorized; 1,647,224 shares outstanding at December 31, 2020 | 2 | | | | 0 | |
| Additional paid-in capital | 142,119 | | | | 553,210 | |
| Predecessor treasury stock, at cost; 877,047 shares at December 31, 2019 | 0 | | | | (5,090) | |
| | | | |
| Accumulated deficit | (40,224) | | | | (452,052) | |
| Total stockholders’ equity | 101,897 | | | | 104,076 | |
| Total liabilities and stockholders’ equity | $ | 314,430 | | | | $ | 673,954 | |
|
| | | | | | | |
| | December 31,
2017 | | December 31,
2016 |
| | (in thousands, except share data) |
| ASSETS | |
| Current assets: | | | |
| Cash and cash equivalents | $ | 73,640 |
| | $ | 10,194 |
|
| Restricted cash | 2,008 |
| | — |
|
| Receivables: | | | |
| Trade, net of allowance for doubtful accounts | 79,592 |
| | 38,764 |
|
| Unbilled receivables | 16,029 |
| | 7,417 |
|
| Insurance recoveries | 13,874 |
| | 17,003 |
|
| Other receivables | 3,510 |
| | 8,939 |
|
| Inventory | 14,057 |
| | 9,660 |
|
| Assets held for sale | 6,620 |
| | 15,093 |
|
| Prepaid expenses and other current assets | 6,229 |
| | 6,926 |
|
| Total current assets | 215,559 |
| | 113,996 |
|
| Property and equipment, at cost | 1,093,635 |
| | 1,058,261 |
|
| Less accumulated depreciation | 544,012 |
| | 474,181 |
|
| Net property and equipment | 549,623 |
| | 584,080 |
|
| Other long-term assets | 1,687 |
| | 2,026 |
|
| Total assets | $ | 766,869 |
| | $ | 700,102 |
|
| | | | |
| LIABILITIES AND SHAREHOLDERS’ EQUITY | | | |
| Current liabilities: | | | |
| Accounts payable | $ | 29,538 |
| | $ | 19,208 |
|
| Deferred revenues | 905 |
| | 1,449 |
|
| Accrued expenses: | | | |
| Payroll and related employee costs | 21,023 |
| | 14,813 |
|
| Insurance premiums and deductibles | 6,742 |
| | 6,446 |
|
| Insurance claims and settlements | 13,289 |
| | 13,667 |
|
| Interest | 6,624 |
| | 5,395 |
|
| Other | 6,793 |
| | 5,024 |
|
| Total current liabilities | 84,914 |
| | 66,002 |
|
| Long-term debt, less unamortized discount and debt issuance costs | 461,665 |
| | 339,473 |
|
| Deferred income taxes | 3,151 |
| | 8,180 |
|
| Other long-term liabilities | 7,043 |
| | 5,049 |
|
| Total liabilities | 556,773 |
| | 418,704 |
|
| Commitments and contingencies (Note 11) |
| |
|
| Shareholders’ equity: | | | |
| Preferred stock, 10,000,000 shares authorized; none issued and outstanding | — |
| | — |
|
| Common stock $.10 par value; 200,000,000 shares authorized at December 31, 2017; 77,719,021 and 77,146,906 shares outstanding at December 31, 2017 and December 31, 2016, respectively | 7,835 |
| | 7,766 |
|
| Additional paid-in capital | 546,158 |
| | 541,823 |
|
| Treasury stock, at cost; 630,688 and 515,546 shares at December 31, 2017 and December 31, 2016, respectively | (4,416 | ) | | (3,883 | ) |
| Accumulated deficit | (339,481 | ) | | (264,308 | ) |
| Total shareholders’ equity | 210,096 |
| | 281,398 |
|
| Total liabilities and shareholders’ equity | $ | 766,869 |
| | $ | 700,102 |
|
See accompanying notes to consolidated financial statements.
53
PIONEER ENERGY SERVICES CORP. AND SUBSIDIARIES
CONSOLIDATED STATEMENTS OF OPERATIONS
|
| | | | | | | | | | | |
| | Year ended December 31, |
| | 2017 | | 2016 | | 2015 |
| | (in thousands, except per share data) |
| | | | | | |
| Revenues | $ | 446,455 |
| | $ | 277,076 |
| | $ | 540,778 |
|
| | | | | | |
| Costs and expenses: | | | | | |
| Operating costs | 330,880 |
| | 203,949 |
| | 358,016 |
|
| Depreciation and amortization | 98,777 |
| | 114,312 |
| | 150,939 |
|
| General and administrative | 69,681 |
| | 61,184 |
| | 73,903 |
|
| Bad debt expense (recovery) | 53 |
| | 156 |
| | (188 | ) |
| Impairment | 1,902 |
| | 12,815 |
| | 129,152 |
|
| Gain on dispositions of property and equipment, net | (3,608 | ) | | (1,892 | ) | | (4,344 | ) |
| Total costs and expenses | 497,685 |
| | 390,524 |
| | 707,478 |
|
| Loss from operations | (51,230 | ) | | (113,448 | ) | | (166,700 | ) |
| | | | | | |
| Other income (expense): | | | | | |
| Interest expense, net of interest capitalized | (27,039 | ) | | (25,934 | ) | | (21,222 | ) |
| Loss on extinguishment of debt | (1,476 | ) | | (299 | ) | | (2,186 | ) |
| Other income (expense), net | 424 |
| | 558 |
| | (2,611 | ) |
| Total other expense, net | (28,091 | ) | | (25,675 | ) | | (26,019 | ) |
| | | | | | |
| Loss before income taxes | (79,321 | ) | | (139,123 | ) | | (192,719 | ) |
| Income tax benefit | 4,203 |
| | 10,732 |
| | 37,579 |
|
| Net loss | $ | (75,118 | ) | | $ | (128,391 | ) | | $ | (155,140 | ) |
| | | | | | |
| Loss per common share - Basic | $ | (0.97 | ) | | $ | (1.96 | ) | | $ | (2.41 | ) |
| | | | | | |
| Loss per common share - Diluted | $ | (0.97 | ) | | $ | (1.96 | ) | | $ | (2.41 | ) |
| | | | | | |
| Weighted average number of shares outstanding—Basic | 77,390 |
| | 65,452 |
| | 64,310 |
|
| | | | | | |
| Weighted average number of shares outstanding—Diluted | 77,390 |
| | 65,452 |
| | 64,310 |
|
See accompanying notes to consolidated financial statements.
PIONEER ENERGY SERVICES CORP. AND SUBSIDIARIES
CONSOLIDATED STATEMENTS OF SHAREHOLDERS’ EQUITYOPERATIONS
(in thousands, except per share data)
| | | | | | | | | | | | | | | | | | | | | | | | |
| Successor | | | Predecessor | | |
| | Seven Months Ended December 31, 2020 | | | Five Months Ended May 31, 2020 | | | | Year Ended December 31, 2019 | | |
| | | | | | | | | | |
| | | | | | | | | | |
| | | | | | | | | | |
| | | | | | | | | | |
| Revenues | $ | 103,874 | | | | $ | 142,370 | | | | | $ | 575,792 | | | |
| | | | | | | | | | |
| | | | | | | | | | |
| | | | | | | | | | |
| | | | | | | | | | |
| Costs and expenses: | | | | | | | | | | |
| Operating costs | 78,198 | | | | 114,047 | | | | | 431,353 | | | |
| | | | | | | | | | |
| | | | | | | | | | |
| Depreciation and amortization | 33,613 | | | | 35,647 | | | | | 90,884 | | | |
| General and administrative | 24,055 | | | | 22,047 | | | | | 91,185 | | | |
| Prepetition restructuring charges | 0 | | | | 16,822 | | | | | 0 | | | |
| Impairment | 742 | | | | 17,853 | | | | | 2,667 | | | |
| Bad debt expense (recovery), net | (227) | | | | 1,209 | | | | | (79) | | | |
| Gain on dispositions of property and equipment, net | (6,132) | | | | (989) | | | | | (4,513) | | | |
| Total costs and expenses | 130,249 | | | | 206,636 | | | | | 611,497 | | | |
| Loss from operations | (26,375) | | | | (64,266) | | | | | (35,705) | | | |
| | | | | | | | | | |
| Other income (expense): | | | | | | | | | | |
| Interest expense, net of interest capitalized | (14,831) | | | | (12,294) | | | | | (39,835) | | | |
| Reorganization items, net | (4,263) | | | | (21,903) | | | | | 0 | | | |
| Loss on extinguishment of debt | (188) | | | | (4,215) | | | | | 0 | | | |
| Other income (expense), net | 2,617 | | | | (3,333) | | | | | 2,307 | | | |
| Total other expense, net | (16,665) | | | | (41,745) | | | | | (37,528) | | | |
| | | | | | | | | | |
| Loss before income taxes | (43,040) | | | | (106,011) | | | | | (73,233) | | | |
| Income tax benefit | 2,816 | | | | 1,786 | | | | | 9,329 | | | |
| | | | | | | | | | |
| | | | | | | | | | |
| | | | | | | | | | |
| | | | | | | | | | |
| Net loss | $ | (40,224) | | | | $ | (104,225) | | | | | $ | (63,904) | | | |
| | | | | | | | | | |
| Loss per common share - Basic | $ | (36.01) | | | | $ | (1.32) | | | | | $ | (0.81) | | | |
| | | | | | | | | | |
| Loss per common share - Diluted | $ | (36.01) | | | | $ | (1.32) | | | | | $ | (0.81) | | | |
| | | | | | | | | | |
| | | | | | | | | | |
| | | | | | | | | | |
| | | | | | | | | | |
| | | | | | | | | | |
| | | | | | | | | | |
| | | | | | | | | | |
| | | | | | | | | | |
| | | | | | | | | | |
| | | | | | | | | | |
| | | | | | | | | | |
| Weighted average number of shares outstanding—Basic | 1,117 | | | | 78,968 | | | | | 78,423 | | | |
| | | | | | | | | | |
| Weighted average number of shares outstanding—Diluted | 1,117 | | | | 78,968 | | | | | 78,423 | | | |
|
| | | | | | | | | | | | | | | | | | | | | | | | | | | | | | |
| | Shares | | Amount | | Additional Paid In Capital | | Accumulated Earnings (Deficit) | | Total Shareholders’ Equity |
| Common | | Treasury | Common | | Treasury |
| | (In thousands) |
| Balance as of December 31, 2014 | 64,137 |
| | (317 | ) | | $ | 6,414 |
| | $ | (3,030 | ) | | $ | 472,457 |
| | $ | 19,223 |
| | $ | 495,064 |
|
| Net loss | — |
| | — |
| | — |
| | — |
| | — |
| | (155,140 | ) | | (155,140 | ) |
| Exercise of options and related income tax effect | 203 |
| | — |
| | 20 |
| | — |
| | 761 |
| | — |
| | 781 |
|
| Purchase of treasury stock | — |
| | (141 | ) | | — |
| | (729 | ) | | — |
| | — |
| | (729 | ) |
| Income tax effect of restricted stock vesting | — |
| | — |
| | — |
| | — |
| | (884 | ) | | — |
| | (884 | ) |
| Income tax effect of stock option forfeitures and expirations | — |
| | — |
| | — |
| | — |
| | (78 | ) | | — |
| | (78 | ) |
| Issuance of restricted stock | 616 |
| | — |
| | 62 |
| | — |
| | (62 | ) | | — |
| | — |
|
| Stock-based compensation expense | — |
| | — |
| | — |
| | — |
| | 3,629 |
| | — |
| | 3,629 |
|
| Balance as of December 31, 2015 | 64,956 |
| | (458 | ) | | $ | 6,496 |
| | $ | (3,759 | ) | | $ | 475,823 |
| | $ | (135,917 | ) | | $ | 342,643 |
|
| Net loss | — |
| | — |
| | — |
| | — |
| | — |
| | (128,391 | ) | | (128,391 | ) |
| Sale of common stock, net of offering costs | 12,075 |
| — |
| — |
| — |
| 1,208 |
| — |
| — |
| | 64,222 |
| — |
| — |
| — |
| 65,430 |
|
| Exercise of options and related income tax effect | 46 |
| | — |
| | 5 |
| | — |
| | 178 |
| | — |
| | 183 |
|
| Purchase of treasury stock | — |
| | (58 | ) | | — |
| | (124 | ) | | — |
| | — |
| | (124 | ) |
| Income tax effect of restricted stock vesting | — |
| | — |
| | — |
| | — |
| | (1,023 | ) | | — |
| | (1,023 | ) |
| Income tax effect of stock option forfeitures and expirations | — |
| | — |
| | — |
| | — |
| | (1,264 | ) | | — |
| | (1,264 | ) |
| Issuance of restricted stock | 586 |
| | — |
| | 57 |
| | — |
| | (57 | ) | | — |
| | — |
|
| Stock-based compensation expense | — |
| | — |
| | — |
| | — |
| | 3,944 |
| | — |
| | 3,944 |
|
| Balance as of December 31, 2016 | 77,663 |
| | (516 | ) | | $ | 7,766 |
| | $ | (3,883 | ) | | $ | 541,823 |
| | $ | (264,308 | ) | | $ | 281,398 |
|
| Net loss | — |
| | — |
| | — |
| | — |
| | — |
| | (75,118 | ) | | (75,118 | ) |
| Purchase of treasury stock | — |
| | (115 | ) | | — |
| | (533 | ) | | — |
| | — |
| | (533 | ) |
| Issuance of restricted stock | 687 |
| | — |
| | 69 |
| | — |
| | (69 | ) | | — |
| | — |
|
| Stock-based compensation expense | — |
| | — |
| | — |
| | — |
| | 4,404 |
| | (55 | ) | | 4,349 |
|
| Balance as of December 31, 2017 | 78,350 |
| | (631 | ) | | $ | 7,835 |
| | $ | (4,416 | ) | | $ | 546,158 |
| | $ | (339,481 | ) | | $ | 210,096 |
|
See accompanying notes to consolidated financial statements.
54
PIONEER ENERGY SERVICES CORP. AND SUBSIDIARIES
CONSOLIDATED STATEMENTS OF STOCKHOLDERS’ EQUITY
| | | | | | | | | | | | | | | | | | | | | | | | | | | | | | | | | | | | | | | | | | | |
| | Shares | | Amount | | Additional Paid In Capital | | Accumulated
Deficit | | | | Total Stockholders’ Equity |
| Common | | Treasury | Common | | Treasury | |
| | (in thousands) |
| | | | | | | | | | | | | | | |
| | | | | | | | | | | | | | | |
| | | | | | | | | | | | | | | |
| | | | | | | | | | | | | | | |
| | | | | | | | | | | | | | | |
| | | | | | | | | | | | | | | |
| | | | | | | | | | | | | | | |
| | | | | | | | | | | | | | | |
| | | | | | | | | | | | | | | |
| | | | | | | | | | | | | | | |
| Balance as of December 31, 2018 (Predecessor) | 79,004 | | | (790) | | | $ | 7,900 | | | $ | (4,965) | | | $ | 550,548 | | | $ | (388,425) | | | | | $ | 165,058 | |
| Net loss | — | | | — | | | — | | | — | | | — | | | (63,904) | | | | | (63,904) | |
| | | | | | | | | | | | | | | |
| | | | | | | | | | | | | | | |
| Purchase of treasury stock | — | | | (87) | | | — | | | (125) | | | — | | | — | | | | | (125) | |
| | | | | | | | | | | | | | | |
| Cumulative-effect adjustment due to adoption of ASC Topic 842 | — | | | — | | | — | | | — | | | — | | | 277 | | | | | 277 | |
| Equity awards vested or exercised | 1,075 | | | — | | | 108 | | | — | | | (108) | | | — | | | | | — | |
| Stock-based compensation expense | — | | | — | | | — | | | — | | | 2,770 | | | — | | | | | 2,770 | |
| Balance as of December 31, 2019 (Predecessor) | 80,079 | | | (877) | | | $ | 8,008 | | | $ | (5,090) | | | $ | 553,210 | | | $ | (452,052) | | | | | $ | 104,076 | |
| Net loss | — | | | — | | | — | | | — | | | — | | | (104,225) | | | | | (104,225) | |
| | | | | | | | | | | | | | | |
| | | | | | | | | | | | | | | |
| Purchase of treasury stock | — | | | (265) | | | — | | | (8) | | | — | | | — | | | | | (8) | |
| | | | | | | | | | | | | | | |
| | | | | | | | | | | | | | | |
| Equity awards vested in connection with the Plan | 7,946 | | | — | | | 795 | | | — | | | (795) | | | — | | | | | — | |
| | | | | | | | | | | | | | | |
| Equity awards vested or exercised | 905 | | | — | | | 90 | | | — | | | (90) | | | — | | | | | — | |
| Stock-based compensation expense | — | | | — | | | — | | | — | | | 1,306 | | | — | | | | | 1,306 | |
| Balance as of May 31, 2020 (Predecessor) | 88,930 | | | (1,142) | | | $ | 8,893 | | | $ | (5,098) | | | $ | 553,631 | | | $ | (556,277) | | | | | $ | 1,149 | |
| Cancellation of Predecessor equity | (88,930) | | | 1,142 | | | (8,893) | | | 5,098 | | | (553,631) | | | 556,277 | | | | | (1,149) | |
| Balance as of May 31, 2020 (Predecessor) | 0 | | | 0 | | | $ | 0 | | | $ | 0 | | | $ | 0 | | | $ | 0 | | | | | $ | 0 | |
| | | | | | | | | | | | | | | |
| | | | | | | | | | | | | | | |
| Balance as of June 1, 2020 (Successor) | — | | | — | | | $ | — | | | $ | — | | | $ | — | | | $ | — | | | | | $ | — | |
| Issuance of Successor common stock | 1,050 | | | (1) | | | 1 | | | 0 | | | 18,083 | | | — | | | | | 18,084 | |
| Equity component of Convertible Notes, net of offering costs | — | | | — | | | — | | | — | | | 120,875 | | | — | | | | | 120,875 | |
| Net loss | — | | | — | | | — | | | — | | | — | | | (40,224) | | | | | (40,224) | |
| Payment of in-kind interest on Convertible Notes | — | | | — | | | — | | | — | | | 1,913 | | | — | | | | | 1,913 | |
| Equity awards vested or issued | 599 | | | — | | | 1 | | | — | | | (1) | | | — | | | | | — | |
| Stock-based compensation expense | — | | | — | | | — | | | — | | | 1,249 | | | — | | | | | 1,249 | |
| Balance as of December 31, 2020 (Successor) | 1,649 | | | (1) | | | $ | 2 | | | $ | 0 | | | $ | 142,119 | | | $ | (40,224) | | | | | $ | 101,897 | |
See accompanying notes to consolidated financial statements.
55
PIONEER ENERGY SERVICES CORP. AND SUBSIDIARIES
CONSOLIDATED STATEMENTS OF CASH FLOWS
(in thousands)
| | | | | | | | | | | | | | | | | | | | | | |
| | Successor | | | Predecessor |
| | Seven Months Ended December 31, 2020 | | | Five Months Ended May 31, 2020 | | Year Ended December 31, 2019 | | |
| | | | | | | | | |
| Cash flows from operating activities: | | | | | | | | |
| Net loss | $ | (40,224) | | | | $ | (104,225) | | | $ | (63,904) | | | |
| | | | | | | | |
| | | | | | | | |
| Adjustments to reconcile net income (loss) to net cash provided by (used in) operating activities: | | | | | | | | |
| Depreciation and amortization | 33,613 | | | | 35,647 | | | 90,884 | | | |
| Allowance for doubtful accounts, net of recoveries | (227) | | | | 1,209 | | | (79) | | | |
| Write-off of obsolete inventory | 0 | | | | 0 | | | 570 | | | |
| Gain on dispositions of property and equipment, net | (6,132) | | | | (989) | | | (4,513) | | | |
| Reorganization items, net | 0 | | | | 18,713 | | | 0 | | | |
| | | | | | | | |
| Stock-based compensation expense | 1,249 | | | | 552 | | | 2,770 | | | |
| Phantom stock compensation expense | 0 | | | | 0 | | | (112) | | | |
| Amortization of debt issuance costs and discount | 5,665 | | | | 1,084 | | | 3,147 | | | |
| | | | | | | | |
| Interest paid in-kind | 4,956 | | | | 0 | | | 0 | | | |
| Loss on extinguishment of debt | 188 | | | | 4,215 | | | 0 | | | |
| | | | | | | | |
| Impairment | 742 | | | | 17,853 | | | 2,667 | | | |
| Deferred income taxes | (4,130) | | | | (546) | | | (10,811) | | | |
| Change in other noncurrent assets | (792) | | | | (800) | | | 3,122 | | | |
| Change in other noncurrent liabilities | 12 | | | | 1,524 | | | (4,328) | | | |
| Changes in current assets and liabilities: | | | | | | | | |
| Receivables | 11,726 | | | | 44,041 | | | 7,062 | | | |
| Inventory | 631 | | | | 1,441 | | | (4,088) | | | |
| Prepaid expenses and other current assets | 715 | | | | 1,121 | | | (809) | | | |
| Accounts payable | 1,162 | | | | (15,174) | | | 3,638 | | | |
| Deferred revenues | 899 | | | | (1,219) | | | (383) | | | |
| | | | | | | | |
| Accrued expenses | (8,127) | | | | (6,692) | | | (12,811) | | | |
| | | | | | | | |
| | | | | | | | |
| Net cash provided by (used in) operating activities | 1,926 | | | | (2,245) | | | 12,022 | | | |
| | | | | | | | |
| Cash flows from investing activities: | | | | | | | | |
| | | | | | | | |
| | | | | | | | |
| Purchases of property and equipment | (4,791) | | | | (10,848) | | | (50,046) | | | |
| Proceeds from sale of property and equipment | 10,923 | | | | 1,665 | | | 7,733 | | | |
| | | | | | | | |
| Proceeds from insurance recoveries | 155 | | | | 22 | | | 1,469 | | | |
| | | | | | | | |
| | | | | | | | |
| Net cash provided by (used in) investing activities | 6,287 | | | | (9,161) | | | (40,844) | | | |
| | | | | | | | |
| Cash flows from financing activities: | | | | | | | | |
| Debt repayments | (2,649) | | | | (175,000) | | | 0 | | | |
| Proceeds from debt issuance | 0 | | | | 195,187 | | | 0 | | | |
| | | | | | | | |
| Proceeds from DIP Facility | 0 | | | | 4,000 | | | 0 | | | |
| Repayment of DIP Facility | 0 | | | | (4,000) | | | 0 | | | |
| Payments of debt issuance costs | 0 | | | | (7,625) | | | 0 | | | |
| | | | | | | | |
| | | | | | | | |
| | | | | | | | |
| | | | | | | | |
| Purchase of treasury stock | 0 | | | | (8) | | | (125) | | | |
| | | | | | | | |
| | | | | | | | |
| | | | | | | | |
| Net cash provided by (used in) financing activities | (2,649) | | | | 12,554 | | | (125) | | | |
| | | | | | | | |
| Net increase (decrease) in cash, cash equivalents and restricted cash | 5,564 | | | | 1,148 | | | (28,947) | | | |
| Beginning cash, cash equivalents and restricted cash | 26,765 | | | | 25,617 | | | 54,564 | | | |
| Ending cash, cash equivalents and restricted cash | $ | 32,329 | | | | $ | 26,765 | | | $ | 25,617 | | | |
| | | | | | | | |
| Supplementary disclosure: | | | | | | | | |
| Interest paid | $ | 2,235 | | | | $ | 8,105 | | | $ | 37,342 | | | |
| Income tax paid | $ | 885 | | | | $ | 893 | | | $ | 3,964 | | | |
| Reorganization items paid | $ | 13,985 | | | | $ | 14,947 | | | 0 | | | |
| Noncash investing and financing activity: | | | | | | | | |
| Change in capital expenditure accruals | $ | 979 | | | | $ | (1,924) | | | $ | (5,217) | | | |
| | | | | | | | |
|
| | | | | | | | | | | |
| | Year ended December 31, |
| | 2017 | | 2016 | | 2015 |
| | (in thousands) |
| Cash flows from operating activities: | | | | | |
| Net loss | $ | (75,118 | ) | | $ | (128,391 | ) | | $ | (155,140 | ) |
| Adjustments to reconcile net loss to net cash provided by (used in) operating activities: | | | | | |
| Depreciation and amortization | 98,777 |
| | 114,312 |
| | 150,939 |
|
| Allowance for doubtful accounts, net of recoveries | 53 |
| | 156 |
| | 248 |
|
| Write-off of obsolete inventory | — |
| | 101 |
| | — |
|
| Gain on dispositions of property and equipment, net | (3,608 | ) | | (1,892 | ) | | (4,344 | ) |
| Stock-based compensation expense | 4,349 |
| | 3,944 |
| | 3,629 |
|
| Amortization of debt issuance costs and discount | 1,548 |
| | 1,776 |
| | 1,691 |
|
| Loss on extinguishment of debt | 1,476 |
| | 299 |
| | 2,186 |
|
| Impairment | 1,902 |
| | 12,815 |
| | 129,152 |
|
| Deferred income taxes | (5,030 | ) | | (11,608 | ) | | (39,286 | ) |
| Change in other long-term assets | (1 | ) | | 662 |
| | 420 |
|
| Change in other long-term liabilities | 1,994 |
| | 478 |
| | (132 | ) |
| Changes in current assets and liabilities: | | | | | |
| Receivables | (49,750 | ) | | 16,341 |
| | 114,644 |
|
| Inventory | (4,397 | ) | | (630 | ) | | 1,267 |
|
| Prepaid expenses and other current assets | 744 |
| | 310 |
| | 1,769 |
|
| Accounts payable | 12,409 |
| | 1,969 |
| | (30,514 | ) |
| Deferred revenues | (348 | ) | | (3,985 | ) | | 1,922 |
|
| Accrued expenses | 9,183 |
| | (1,526 | ) | | (35,732 | ) |
| Net cash provided by (used in) operating activities | (5,817 | ) | | 5,131 |
| | 142,719 |
|
| | | | | | |
| Cash flows from investing activities: | | | | | |
| Purchases of property and equipment | (63,277 | ) | | (32,381 | ) | | (159,615 | ) |
| Proceeds from sale of property and equipment | 12,569 |
| | 7,577 |
| | 57,674 |
|
| Proceeds from insurance recoveries | 3,344 |
| | 37 |
| | 285 |
|
| Net cash used in investing activities | (47,364 | ) | | (24,767 | ) | | (101,656 | ) |
| | | | | | |
| Cash flows from financing activities: | | | | | |
| Debt repayments | (120,000 | ) | | (71,000 | ) | | (60,002 | ) |
| Proceeds from issuance of debt | 245,500 |
| | 22,000 |
| | — |
|
| Debt issuance costs | (6,332 | ) | | (819 | ) | | (1,877 | ) |
| Proceeds from exercise of options | — |
| | 183 |
| | 781 |
|
| Proceeds from issuance of common stock, net of offering costs of $4,001 | — |
| | 65,430 |
| | — |
|
| Purchase of treasury stock | (533 | ) | | (124 | ) | | (729 | ) |
| Net cash provided by (used in) financing activities | 118,635 |
| | 15,670 |
| | (61,827 | ) |
| | | | | | |
| Net increase (decrease) in cash, cash equivalents and restricted cash | 65,454 |
| | (3,966 | ) | | (20,764 | ) |
| Beginning cash, cash equivalents and restricted cash | 10,194 |
| | 14,160 |
| | 34,924 |
|
| Ending cash, cash equivalents and restricted cash | $ | 75,648 |
| | $ | 10,194 |
| | $ | 14,160 |
|
| | | | | | |
| Supplementary disclosure: | | | | | |
| Interest paid | $ | 25,082 |
| | $ | 24,516 |
| | $ | 22,506 |
|
| Income tax paid | $ | 1,431 |
| | $ | 671 |
| | $ | 2,691 |
|
| Noncash investing and financing activity: | | | | | |
| Change in capital expenditure accruals | $ | (1,830 | ) | | $ | 175 |
| | $ | (16,708 | ) |
See accompanying notes to consolidated financial statements.
56
PIONEER ENERGY SERVICES CORP. AND SUBSIDIARIES
NOTES TO CONSOLIDATED FINANCIAL STATEMENTS
1. Organization and Summary of Significant Accounting Policies
Business
Pioneer Energy Services Corp. provides land-based drilling services and production services to a diverse group of oil and gas exploration and production companies in the United States and internationally in Colombia. We also provide two of our services (coiled tubing and wireline services) offshore in the Gulf of Mexico.
Our drilling services business segments provide contract land drilling services through four3 domestic divisions which are located in the Marcellus/Utica, Permian Basin and Eagle Ford, Permian Basin and Bakken regions, and internationally in Colombia. In addition to our drilling rigs, weWe provide a comprehensive service offering which includes the drilling rig, crews, supplies, and most of the ancillary equipment needed to operate our drilling rigs. Our drilling rig fleet is 100% pad-capable and offers the latest advancements in pad drilling. The following table summarizes our current rig fleet count and composition for each drilling services business segment:
| | | | | | | | | | | | | | | | | |
| Multi-well, Pad-capable |
| AC rigs | | SCR rigs | | Total |
| Domestic drilling | 17 | | | 0 | | | 17 |
| International drilling | 0 | | | 8 | | | 8 |
| | | | | 25 |
|
| | | | | |
| | Multi-well, Pad-capable |
| | AC rigs | SCR rigs | Total |
| Domestic drilling | 16 |
| — |
| 16 |
| International drilling | — |
| 8 |
| 8 |
| | | | 24 |
Our production services business segments provide a range of well, wireline and coiled tubing services to a diverse group of exploration and production companies, with our operations concentratedproducers primarily in Texas, North Dakota, the major domestic onshore oil and gas producing regions in the Mid-Continent and Rocky Mountain statesregion, and in the Gulf Coast, both onshore and offshore.Louisiana. As of December 31, 2017,2020, the fleet count and compositioncounts for each of our production services business segments iswere as follows:
| | | | 550 HP | 600 HP | Total | | 550 HP | | 600 HP | | Total |
| Well servicing rigs, by horsepower (HP) rating | 113 |
| 12 |
| 125 |
| Well servicing rigs, by horsepower (HP) rating | 111 | | 12 | | 123 |
| | Onshore | Offshore | Total | |
| | Wireline services units | 108 | 4 |
| 112 |
| Wireline services units | | 76 |
| Coiled tubing services units | 10 |
| 4 |
| 14 |
| |
| |
Basis of Presentation
The accompanying consolidated financial statements include the accounts of Pioneer Energy Services Corp. and our wholly ownedwholly-owned subsidiaries. All intercompany balances and transactions have been eliminated in consolidation. The accompanying consolidated financial statements have been prepared in accordance with accounting principles generally accepted in the United States of America. As described below, as a result of the application of fresh start accounting and the effects of the implementation of our Plan of Reorganization (as defined below), the consolidated financial statements after the Effective Date (as defined below) are not comparable with the consolidated financial statements on or before that date. See Note 3, Fresh Start Accounting, for additional information.
Periods Presented — We qualify for certain reduced disclosure requirements as permitted by the SEC for smaller reporting companies including, among other things, the presentation of the two most recent fiscal years’ statements of operations, stockholders’ equity, and cash flows.
Chapter 11 Cases — On March 1, 2020 (the “Petition Date”), Pioneer and certain of our domestic subsidiaries (collectively, the “Debtors”) filed voluntary petitions (the “Bankruptcy Petitions”) for reorganization under title 11 of the United States Code (the “Bankruptcy Code”) in the United States Bankruptcy Court for the Southern District of Texas (the “Bankruptcy Court”). On May 11, 2020, the Bankruptcy Court confirmed the plan of reorganization (the “Plan”) that was filed with the Bankruptcy Court on March 2, 2020, and on May 29, 2020 (the “Effective Date”), the conditions to effectiveness of the plan were satisfied and we emerged from Chapter 11. See Note 2, Emergence from Voluntary Reorganization under Chapter 11,for more information.
The accompanying consolidated financial statements have been prepared as if we are a going concern and in accordance with Financial Accounting Standards Board (FASB) Accounting Standards Codification (ASC) Topic 852, Reorganizations (ASC Topic 852). Upon our emergence from Chapter 11, we adopted fresh start accounting in accordance with ASC Topic 852 and became a new entity for financial reporting purposes. As a result, the consolidated financial statements after the Effective Date are not comparable with the consolidated financial statements on or before
that date as indicated by the “black line” division in the financial statements and footnote tables, which emphasizes the lack of comparability between amounts presented. References to “Successor” relate to our financial position and results of operations after the Effective Date. References to “Predecessor” refer to our financial position and results of operations on or before the Effective Date.
We evaluated the events between May 29, 2020 and May 31, 2020 and concluded that the use of an accounting convenience date of May 31, 2020 (the “Fresh Start Reporting Date”) would not have a material impact on our consolidated financial statements. As such, the application of fresh start accounting was reflected in our consolidated balance sheet as of May 31, 2020 and related fresh start accounting adjustments were included in our consolidated statement of operations for the five months ended May 31, 2020. See Note 3, Fresh Start Accounting, for additional information.
Use of Estimates — In preparing the accompanying consolidated financial statements, we make various estimates and assumptions that affect the amounts of assets and liabilities we report as of the dates of the balance sheets and income and expenses we report for the periods shown in the income statements and statements of cash flows. Our actual results could differ significantly from those estimates. Material estimates affecting our financial results, including those that are particularly susceptible to significant changes in the near term, relate to our estimateapplication of the allowance for doubtful accounts,fresh start accounting, our determinationestimates of depreciationcertain variable revenues and amortization expenses,periods of certain deferred revenues and costs associated with drilling daywork contracts, our estimates of projected cash flows and fair values for impairment evaluations, our estimate of the valuation allowance for deferred tax assets, and our estimate of the liability relating to the self-insurance portion of our health and workers’ compensation insurance,insurance. For information about our estimateuse of compensation related accruals and our estimate of sales tax audit liability.estimates relating to fresh start accounting, see Note 3, Fresh Start Accounting.
Subsequent Events — In preparing the accompanying consolidated financial statements, we have reviewed events that have occurred after December 31, 2017,2020, through the filing of this Form 10-K, for inclusion as necessary.
Foreign CurrenciesRecently Issued Accounting Standards and Securities and Exchange Commission Rules
Our functional currencyChanges to accounting principles generally accepted in the United States of America (“U.S. GAAP”) are established by the FASB in the form of Accounting Standards Updates (ASUs) to the FASB ASC. We consider the applicability and impact of all ASUs. Additionally, because we have securities registered under the Securities and Exchange Act of 1934, we consider the applicability and impact of releases issued by the Securities & Exchange Commission (the “SEC”). Other than the ASU and SEC release listed below, we have determined that there are currently no new or recently adopted ASUs or SEC releases which we believe will have a material impact on our consolidated financial position and results of operations.
•Convertible Instruments and Contracts in an Entity’s Own Equity. In August 2020, the FASB issued ASU No. 2020-06, Accounting for Convertible Instruments and Contracts in an Entity’s Own Equity, which simplifies the accounting for convertible instruments by reducing the number of accounting models available for convertible debt instruments and preferred stock. Additionally, this ASU improves the consistency of EPS calculations by requiring entities to apply one method, the if-converted method, to all convertible instruments in diluted earnings-per-share calculations. This ASU will be effective for us on January 1, 2022, however, early adoption is permitted on January 1, 2021. We are currently evaluating the effect that the ASU will have on our foreign subsidiary in Colombia isconsolidated financial statements.
•In March 2020, the U.S. dollar. Nonmonetary assetsSEC issued SEC Release No. 33-10762, effective January 4, 2021, which amends Rule 3-10 of Regulation S-X governing financial disclosure requirements for guarantors and liabilities are translated at historical ratesissuers of guaranteed registered securities. Among other changes, the amendment simplifies the disclosure requirements, eliminating the requirement to disclose condensed consolidating financial statements within the financial statements for qualifying entities and monetary assets and liabilities are translated at exchange rates in effect at the endallowing abbreviated disclosures of the guarantor/issuer relationship within Part II, Item 7, Management’s Discussion and Analysis of Financial Condition and Results of Operations. We adopted the amendment effective December 31, 2020 and have included supplemental guarantor information in the Liquidity and Capital Resources section of Part II, Item 7, Management’s Discussion and Analysis of Financial Condition and Results of Operations.
Significant Accounting Policies and Detail of Account Balances
period. Income statement accounts are translated at average rates for the period. Gains and losses from remeasurement of foreign currency financial statements into U.S. dollars and from foreign currency transactions are included in other income or expense.
Revenues and Cost Recognition
Drilling Services—Our drilling services business segments earn revenues by drilling oil and gas wells for our clients under daywork contracts. We recognize revenues on daywork contracts for the days completed based on the dayrate specified in each contract.
With most drilling contracts, we receive payments contractually designated for the mobilization of rigs and other equipment. Payments received, and costs incurred for the mobilization services are deferred and recognized on a straight line basis over the related contract term. Costs incurred to relocate rigs and other drilling equipment to areas in which a contract has not been secured are expensed as incurred. Reimbursements that we receive for out-of-pocket expenses are recorded as revenues and the out-of-pocket expenses for which they relate are recorded as operating costs.
Amortization of deferred revenues and costs during the years ended December 31, 2017, 2016 and 2015 were as follows (amounts in thousands):
|
| | | | | | | | | | | |
| | Year ended December 31, |
| | 2017 | | 2016 | | 2015 |
| Amortization of deferred revenues | $ | 2,400 |
| | $ | 1,566 |
| | $ | 1,099 |
|
| Amortization of deferred costs | 4,953 |
| | 2,813 |
| | 2,337 |
|
Our current and long-term deferred revenues and costs as of December 31, 2017 and 2016 were as follows (amounts in thousands):
|
| | | | | | | |
| | December 31, 2017 | | December 31, 2016 |
| Current: | | | |
| Deferred revenues | $ | 905 |
| | $ | 1,449 |
|
| Deferred costs | 1,377 |
| | 2,290 |
|
| Long-term: | | | |
| Deferred revenues | $ | 558 |
| | $ | 202 |
|
| Deferred costs | 402 |
| | 212 |
|
With most term drilling contracts, we are entitled to receive a full or reduced rate of revenues from our clients if they choose to place a rig on standby or to early terminate the contract before its original expiration term. Generally, these revenues are billed and collected over the remaining term of the contract, as the rig is often placed on standby rather than fully released from the contract, and thus may go back to work at the client’s decision any time before the end of the contract. Some of our drilling contracts contain “make-whole” provisions whereby if we are able to secure additional work for the rig with another client, then each party is entitled to a make-whole payment. If the dayrates under the new contract are less than the dayrates in the original contract, we would be entitled to a reduced revenue dayrate from the terminating client, and likewise, the terminating client may be entitled to a payment from us if the new contract dayrates exceed those of the original contract. A client may also choose to early terminate the contract and make an upfront early termination payment based on a per day rate for the remaining term of the contract. Revenues derived from rigs placed on standby or from the early termination of term drilling contracts are deferred and recognized as the amounts become fixed or determinable, over the remainder of the original term or when the rig is sold. Currently, there are no drilling rigs in our fleet with contracts placed on standby.
Drilling Contracts—As of December 31, 2017, all 16 of our domestic drilling rigs are earning revenues, 14 of which are under term contracts. Of the eight rigs in Colombia, six are earning revenues, five of which are under term contracts. The term contracts in Colombia are cancelable by our clients without penalty, although the contract would still require payment for demobilization services and requires 30 days notice. We are actively marketing our idle drilling rigs in Colombia to various operators and we are evaluating other options, including the possibility of the sale of some or all of our assets in Colombia.
Production Services—Our production services business segments earn revenues for well servicing, wireline services and coiled tubing services pursuant to master services agreements based on purchase orders, contracts or other arrangements with the client that include fixed or determinable prices. Production services jobs are generally short-term and are charged at current market rates. Production service revenue is recognized when the service has been rendered and collectability is reasonably assured.
All of our revenues are recognized net of sales taxes when applicable.
Concentration of Clients—We derive a significant portion of our revenue from a limited number of major clients. For the years ended December 31, 2017, 2016 and 2015, our drilling and production services to our top three clients accounted for approximately 20%, 26%, and 29%, respectively, of our revenue.
Cash and Restricted Cash
For purposes of the consolidated statements of cash flows, we consider all highly liquid instruments purchased with a maturity of three months or less to be cash equivalents. Equivalents — We had no0 cash equivalents at December 31, 2017 and 2016.2020. Cash equivalents at December 31, 2019 were $8.9 million, consisting of investments in highly-liquid money-market mutual funds.
Restricted Cash —Our restricted cash balance at December 31, 2017balance primarily reflects the portion of net proceeds from the issuance of our senior secured term loan which are currently held in a restricted account until the completion of certain administrative tasks related to providing access rights to certain of our real property, a condition which is still in effect under the terms of our post-emergence debt instruments, as well as $0.2 million of proceeds from asset sales at December 31, 2020 which were used to fund the redemption of Senior Secured Notes tendered in January 2021, as described further in Note 7, Debt.
Revenue— Production services jobs are varied in nature but typically represent a single performance obligation, either for a particular job, a series of distinct jobs, or a period of time during which we expectstand ready to complete within 12 months.provide services as our client needs them. Revenue is recognized for these services over time, as the services are performed. Our drilling services business segments earn revenues by drilling oil and gas wells for our clients under daywork contracts. Daywork contracts are comprehensive agreements under which we provide a comprehensive service offering, including the drilling rig, crew, supplies, and most of the ancillary equipment necessary to operate the rig. We account for our services provided under daywork contracts as a single performance obligation comprised of a series of distinct time increments which are satisfied over time. Accordingly, the related restricted cash is presented as currentdayrate revenues are recognized in the accompanying consolidated balance sheets. period during which the services are performed. All of our revenues are recognized net of sales taxes, when applicable. For more information, see Note 4, Revenue from Contracts with Customers.
Trade and Unbilled Accounts Receivable
— We record trade accounts receivable at the amount we invoice to our clients. These accounts do not bear interest. The allowance for doubtful accounts is our best estimate of the amount of probable credit losses in our accounts receivable as of the balance sheet date. We determine the allowance based on the credit worthiness of our clients and general economic conditions. Consequently, an adverse change in those factors could affect our estimate of our allowance for doubtful accounts.
We review our allowance for doubtful accounts on a monthly basis. Our typical drilling contract provides for payment of invoices in 30 days. We generally do not extend payment terms beyond 30 days and have not extended payment terms beyond 90 days for anySubstantially all of our domestic contracts in the last three fiscal years. Our production services terms generally provide for payment of invoices in 30 days. Balances more than 90 days past due are reviewed individually for collectability. We charge off account balances against the allowance after we have exhausted all reasonable means of collection and determined that the potential for recovery is remote. We do not have any off-balance sheet credit exposure related to our clients.
The changes in our allowance for doubtful accounts consist of the following (amounts in thousands):
|
| | | | | | | | | | | |
| | Year ended December 31, |
| | 2017 | | 2016 | | 2015 |
| Balance at beginning of year | $ | 1,678 |
| | $ | 2,254 |
| | $ | 2,547 |
|
| Increase (decrease) in allowance charged to expense | (197 | ) | | 404 |
| | 472 |
|
| Accounts charged against the allowance | (257 | ) | | (980 | ) | | (765 | ) |
| Balance at end of year | $ | 1,224 |
| | $ | 1,678 |
| | $ | 2,254 |
|
Unbilled Accounts Receivable
The asset “unbilled receivables” representsunbilled receivables represent revenues we have recognized in excess of amounts billed on drilling contractscontracts. For more information, see Note 4, Revenue from Contracts with Customers.
Other Receivables — Our other receivables primarily consist of recoverable taxes related to our international operations, as well as refundable payroll tax credit receivables associated with the CARES Act and production services completed. We typically bill our clients at 15-day intervals during the performance of daywork drilling contracts and upon completion of the daywork contract. Our unbilled receivables as of December 31, 2017 and 2016 were as follows (amounts in thousands):vendor rebates.
|
| | | | | | | |
| | December 31, 2017 | | December 31, 2016 |
| Daywork drilling contracts in progress | $ | 15,254 |
| | $ | 7,042 |
|
| Production services | 775 |
| | 375 |
|
| | $ | 16,029 |
| | $ | 7,417 |
|
Inventories
— Inventories primarily consist of drilling rig replacement parts and supplies held for use by our drilling operations in Colombia and job supplies held for use by our wireline andoperations (and previously our coiled tubing operations.operations). Inventories are valued at the lower of cost (first in, first out or actual) or net realizable value.
Prepaid Expenses and Other Current Assets
—Prepaid expenses and other current assets include items such as insurance, rent deposits, software subscriptions, and other fees. We routinely expense these items in the normal course of business over the periods that we benefit from these expenses benefit.expenses. Prepaid expenses and other current assets also include the current portion of deferred mobilization costs for certainshort-term drilling contracts that areand demobilization revenues recognized on a straight-line basis overdrilling contracts expiring in the contractnear term.
Property and Equipment
— Property and equipment are carried at cost less accumulated depreciation. Depreciation is provided for our assets over the estimated useful lives of the assets using the straight-line method. We record the same depreciation expense whether our equipment is idle or working. We charge our expenses for maintenance and repairs to operating costs. We capitalize expenditures for renewals and betterments to the appropriate property and equipment accounts. For more information, see Note 5, Property and Equipment.
Other Long-TermIntangible Assets
Other long-term — Our intangible assets consist of trademark and tradename assets established in connection with the adoption of fresh start accounting which are being amortized using the straight-line method over the ten-year estimated useful life. Amortization expense is estimated to be approximately $0.9 million for each of the five succeeding years ending December 31, 2021 through 2025, although actual amortization amounts could differ as a result of future acquisitions, impairments, changes in amortization periods, or other factors. For more information, see Note 3, Fresh Start Accounting.
Other Noncurrent Assets— Other noncurrent assets primarily consist of prepaid taxes in Colombia which are creditable against future income taxes, as well as the noncurrent portion of prepaid insurance premiums, unamortized debt issuance costs associated with our ABL Credit Facility, deferred mobilization costs on long-term drilling contracts, cash deposits related to the deductibles on our workers’ compensation insurance policies, and deferred compensation plan investments, the long-term portion of deferred mobilization costs, and intangible assets.investments.
Other Current Liabilities
Accrued Expenses — Our other accrued expenses include accruals for items such as sales taxes, property taxes and withholding tax sales tax,liabilities related to our international operations and accruals for professional and other fees. We routinely expense these items in the normal course of business over the periods these expenses benefit.
Other Long-Term Liabilities
Our other accrued expenses also includes the current portion of the lease liability associated with our long-term operating leases.
Other Noncurrent Liabilities — Our other noncurrent liabilities consist ofprimarily relate to the noncurrent portion of liabilities associatedpayroll taxes deferred in connection with our long-termthe CARES Act, as well as noncurrent deferred compensation plans, deferred lease liabilities, and the long-termnoncurrent portion of deferred mobilization revenues.
Insurance Recoveries, Accrued Insurance Claims and Settlements, and Accrued Premiums and Deductibles — We use a combination of self-insurance and third-party insurance for various types of coverage. Our accrued premiums and deductibles include the premiums and estimated liability for the self-insured portion of costs associated with our health, workers’ compensation, general liability and auto liability insurance. Our insurance recoveries receivables and our accrued liability for insurance claims and settlements represent our estimate of claims in excess of our deductible, which are covered and managed by our third-party insurance providers, some of which may ultimately be settled by the insurance provider in the long-term. These are presented in our consolidated balance sheets as current due to the uncertainty in the timing of reporting and payment of claims. For more information, see Note 12, Employee Benefit Plans and Insurance.
Debt — Due to the application of fresh start accounting, our debt obligations were recognized at fair value on our consolidated balance sheet at the Fresh Start Reporting Date as described further in Note 3, Fresh Start Accounting. Additionally, because the Convertible Notes contain an embedded conversion option whereby they, or a portion of them, may be settled in cash, we have separately accounted for the liability and equity components of the Convertible Notes in accordance with the accounting requirements for convertible debt instruments set forth in ASC Topic 470-20, Debt with Conversion and Other Options. We treat the issuance of new Convertible Notes for the payment of in-kind interest as an issuance of a new instrument that retains the original economics associated with the conversion option at inception, and therefore, the Convertible Notes issued in payment of in-kind interest are accounted for with their separate equity and liability components that are proportionally the same as the original issuance.For more information, seeNote 7, Debt.
Leases — As a drilling and production services provider, we provide the drilling rigs and production services equipment which are necessary to fulfill our performance obligations and which are considered leases under ASU No. 2016-02, Leases, (together with its amendments, herein referred to as “ASC Topic 842”). However, we elected to apply the practical expedient in ASU No. 2018-11, Leases: Targeted Improvements, which allows us to continue to recognize our revenues (both lease and service components) under ASC Topic 606, and present them as one revenue stream in our consolidated statements of operations.
As a lessee, we recognize an operating lease asset and a corresponding operating lease liability for all our long-term leases for which we elected to combine, or not separate, the lease and non-lease components, and therefore, all fixed charges associated with non-lease components are included in the lease payments and the calculation of the operating lease asset and associated lease liability. Due to the nature of our business, any option to renew our short-term leases, and the options to extend certain of our long-term real estate leases, are generally not considered reasonably certain to be exercised. Therefore, the periods covered by such optional periods are not included in the determination of the term of the lease, and the lease payments during these periods are similarly excluded from the calculation of operating lease asset and lease liability balances. For more information, see Note 6, Leases.
Treasury Stock
— Treasury stock purchases are accounted for under the cost method whereby the cost of the acquired common stock is recorded as treasury stock. Gains and losses on the subsequent reissuance of treasury stock shares are credited or charged to additional paid in capital using the average cost method.
Stock-based Compensation
— We recognize compensation cost for our stock-based compensation awards based on the fair value estimated in accordance with ASC Topic 718, Compensation—Stock Compensation,. and we recognize forfeitures when they occur. For our awards with graded vesting, we recognize compensation expense on a straight-line basis over the service period for each separately vesting portion of the award as if the award was,
in substance, multiple awards. We adopted ASU 2016-09 in the first quarter of 2017 and elected to prospectively recognize forfeitures when they occur, rather than estimating future forfeitures.For more information, see Note 11, Stock-Based Compensation Plans.
Income Taxes
— We follow the asset and liability method of accounting for income taxes, under which we recognize deferred tax assets and liabilities for the future tax consequences attributable to differences between the financial statement carrying amounts of existing assets and liabilities and their respective tax basis. We measure our deferred tax assets and liabilities by using the enacted tax rates we expect to apply to taxable income in the years in which we expect to recover or settle those temporary differences. The effect of a change in tax rates on deferred tax assets and liabilities is reflected in income in the period of enactment. The recent changeFor more information, see Note 8, Income Taxes.
Foreign Currencies — Our functional currency for our foreign subsidiary in taxColombia is the U.S. dollar. Nonmonetary assets and liabilities are translated at historical rates resulting fromand monetary assets and liabilities are translated at exchange rates in effect at the enactmentend of the Tax Cutsperiod. Income statement accounts are translated at average rates for the period. Gains and Jobs Act enacted on December 22, 2017 is describedlosses from remeasurement of foreign currency financial statements into U.S. dollars and from foreign currency transactions are included in more detail in Note 5, Income Taxes.other income or expense.
Related-PartyRelated Party Transactions
During the years ended December 31, 2017, 2016 and 2015, the Company — We paid approximately $0.2 million for consulting services provided during 2020 by one of our directors, Matthew S. Porter, in each period for trucking and equipment rental services, which represented arms-length transactions,connection with his appointment as Interim Chief Executive Officer in July 2020. On December 31, 2020, Mr. Porter was appointed by the Board of Directors to Gulf Coast Lease Service. Joe Freeman, our Senior Vice President of Well Servicing, serves asbe the President of Gulf Coast Lease Service,and Chief Executive Officer, at which is owned and operated by Mr. Freeman’s two sons. Mr. Freeman does not receive compensation from Gulf Coast Lease Service, and he serves primarily in an advisory role totime his sons.consulting agreement ended.
Comprehensive Income
— We have not reported comprehensive income due to the absence of items of other comprehensive income in the periods presented.
Recently Issued Accounting Standards
Changes to accounting principles generally accepted2. Emergence from Voluntary Reorganization under Chapter 11
Reorganization and Chapter 11 Proceedings
On March 1, 2020 (the “Petition Date”), Pioneer Energy Services Corp. (“Pioneer”) and its affiliates Pioneer Coiled Tubing Services, LLC, Pioneer Drilling Services, Ltd., Pioneer Fishing & Rental Services, LLC, Pioneer Global Holdings, Inc., Pioneer Production Services, Inc., Pioneer Services Holdings, LLC, Pioneer Well Services, LLC, Pioneer Wireline Services Holdings, Inc., Pioneer Wireline Services, LLC (collectively with Pioneer, the “Pioneer RSA Parties”) filed voluntary petitions (the “Bankruptcy Petitions”) for reorganization under title 11 of the United States Code (the “Bankruptcy Code”) in the United States Bankruptcy Court for the Southern District of America (“U.S. GAAP”Texas (the “Bankruptcy Court”). The Chapter 11 proceedings were being jointly administered under the caption In re Pioneer Energy Services Corp. et al (the “Chapter 11 Cases”).
In connection with the Bankruptcy Petitions, the Pioneer RSA Parties entered into a restructuring support agreement (the “RSA”) with holders of approximately 99% in aggregate principal amount of our outstanding Term Loan (the “Consenting Term Lenders”) and holders of approximately 75% in aggregate principal amount of our Prepetition Senior Notes (the “Consenting Noteholders” and together with the Consenting Term Lenders, the “Consenting Creditors”). Pursuant to the RSA, the Consenting Creditors and the Pioneer RSA Parties made certain customary commitments to each other, including the Consenting Noteholders committing to vote for, and the Consenting Creditors committing to support, the restructuring transactions (the “Restructuring”) to be effectuated through a plan of reorganization that incorporates the economic terms included in the RSA (the “Plan”). The Pioneer RSA Parties filed the Plan with the Bankruptcy Court on March 2, 2020.
After commencement of the Chapter 11 Cases, we continued to operate our businesses as “debtors-in-possession” under the jurisdiction of the Bankruptcy Court and in accordance with the applicable provisions of the Bankruptcy Code and orders of the Bankruptcy Court.
On May 11, 2020, the Bankruptcy Court entered an order, Docket No. 331 (the “Confirmation Order”) confirming the Plan. On May 29, 2020 (the “Effective Date”) the conditions to effectiveness of the Plan were satisfied, and we emerged from Chapter 11.
The commencement of the Chapter 11 Cases constituted an event of default that accelerated our obligations under our Prepetition Senior Notes, the Prepetition ABL Facility, and Term Loan. Under the Bankruptcy Code, holders of our Prepetition Senior Notes and the lenders under our Term Loan and the Prepetition ABL Facility were stayed from taking any action against us as a result of this event of default. On the Effective Date, all applicable agreements governing the obligations under the Term Loan, Prepetition Senior Notes and Prepetition ABL Facility were terminated. The Term Loan and Prepetition ABL Facility were paid in full and all outstanding obligations under the Prepetition Senior Notes were canceled in exchange for 94.25% of the pro forma common equity (subject to the dilution from the Convertible Notes and new management incentive plan).
On the Effective Date, we entered into a $75 million senior secured asset-based revolving credit agreement which was later amended and reduced to $40 million in August 2020 (the “ABL Credit Facility”), and issued $129.8 million of aggregate principal amount of 5% convertible senior unsecured pay-in-kind notes due 2025 (the “Convertible Notes”) and $78.1 million of aggregate principal amount of floating rate senior secured notes due 2025 (the “Senior Secured Notes”), all of which are establishedfurther described in Note 7, Debt.
Also on the Effective Date, by operation of the Financial Accounting Standards Board (FASB)Plan, all agreements, instruments, and other documents evidencing, relating to or connected with any equity interests of the Company, including the existing common stock, issued and outstanding immediately prior to the Effective Date, and any rights of any holder in respect thereof, were deemed canceled, discharged and of no force or effect. Pursuant to the Plan, we issued a total of 1,049,804 shares of our new common stock, with approximately 94.25% of such new common stock being issued to holders of the Prepetition Senior Notes outstanding immediately prior to the Effective Date. Holders of the existing common stock received an aggregate of 5.75% of the proforma common equity (subject to the dilution from the Convertible Notes and new management incentive plan), at a conversion rate of 0.0006849838 new shares for each existing share.
As part of the transactions undertaken pursuant to the Plan, we converted from a Texas corporation to a Delaware corporation, filed the Certificate of Incorporation of the Company with the office of the Secretary of State of the State of Delaware, and adopted Amended and Restated Bylaws of the Company.
Backstop Commitment Agreement
Prior to filing the Plan, we entered into a separate backstop commitment agreement with the Consenting Noteholders and certain members of our senior management (the “Backstop Commitment Agreement”), pursuant to which the Consenting Noteholders and certain members of our senior management committed to backstop approximately $118 million and $1.8 million, respectively, of new convertible bonds to be issued in a rights offering. As consideration for this commitment, we committed to make an aggregate payment of $9.4 million and $0.1 million to the Consenting Noteholders and certain members of our senior management, respectively, in the form of Accounting Standards Updates (ASUs)additional new convertible bonds, or in cash if the Backstop Commitment Agreement was terminated under certain circumstances as forth therein. As a result, we incurred a liability and expense at the time we entered into the Backstop Commitment Agreement for the aggregate amount of $9.6 million (the “Commitment Premium”) which was recognized in our Predecessor condensed consolidated financial statements as of and for the three months ended March 31, 2020. The Commitment Premium was settled in conjunction with our emergence from Chapter 11 and the issuance of the Convertible Notes.
Debtor-in-Possession Financing
On February 28, 2020, we received commitments pursuant to the FASBCommitment Letter from PNC Bank, N.A. for a $75 million asset-based revolving loan debtor-in-possession financing facility (the “DIP Facility”) and a $75 million asset-based revolving exit financing facility. On March 3, 2020, with the approval of the Bankruptcy Court, we entered into the DIP Facility and used the proceeds thereunder to refinance all outstanding letters of credit under the Prepetition ABL Facility in connection with the termination of the Prepetition ABL Facility and to pay fees and expenses in connection with the Chapter 11 proceedings and transaction and professional fees related thereto.
The DIP Facility provided financing with a 5-month maturity, bearing interest at a rate of LIBOR plus 200 basis points per annum, and contained customary covenants and events of default. The DIP Facility was terminated upon our emergence from the Chapter 11 Cases on May 29, 2020.
Chapter 11 Accounting Standards Codification (ASC)
Prepetition restructuring charges — All expenses and losses incurred prior to the Petition Date which were related to the Chapter 11 proceedings are presented as prepetition restructuring charges in our Predecessor consolidated statements of operations, including $9.6 million of expense incurred for the Commitment Premium pursuant to the Backstop Commitment Agreement.
Reorganization items, net — Any expenses, gains, and losses incurred subsequent to the filing for Chapter 11 and directly related to such proceedings are presented as reorganization items in our consolidated statements of operations. Reorganization items consisted of the following (amounts in thousands):
| | | | | | | | | | | | | | | | | | |
| | | Successor | | | | | Predecessor |
| | | Seven Months Ended December 31, 2020 | | | | | Five Months Ended May 31, 2020 |
| Gain on settlement of liabilities subject to compromise | | | $ | 0 | | | | | | $ | (291,378) | |
| Fresh start valuation adjustments | | | 0 | | | | | | 284,392 | |
| Legal and professional fees | | | 3,860 | | | | | | 26,038 | |
| Unamortized debt costs on liabilities subject to compromise | | | 0 | | | | | | 2,003 | |
| Accelerated stock-based compensation | | | 0 | | | | | | 713 | |
| Loss (gain) on rejected leases | | | 403 | | | | | | (378) | |
| DIP facility costs | | | 0 | | | | | | 513 | |
| | | $ | 4,263 | | | | | | $ | 21,903 | |
Contractual interest expense on our Prepetition Senior Notes totaled $7.6 million for the five months ended May 31, 2020, which is in excess of the $3.1 million included in interest expense on our Predecessor consolidated statements of operations because we discontinued accruing interest on the Petition Date in accordance with the terms of the Plan and ASC Topic 852.
3. Fresh Start Accounting
Fresh Start Accounting
In connection with our emergence from bankruptcy and in accordance with ASC Topic 852, we qualified for and adopted fresh start accounting on the Effective Date. We were required to adopt fresh start accounting because (i) the holders of existing voting shares of the Predecessor Company received less than 50% of the voting shares of the Successor Company, and (ii) the reorganization value of our assets immediately prior to confirmation of the Plan was less than the post-petition liabilities and allowed claims.
In accordance with ASC Topic 852, with the application of fresh start accounting, we allocated the reorganization value to our individual assets and liabilities (except for deferred income taxes) based on their estimated fair values in conformity with ASC Topic 805, Business Combinations. We considerThe amount of deferred taxes was determined in accordance with ASC Topic 740, Income Taxes. The Effective Date fair values of our assets and liabilities differed materially from their recorded values as reflected on the applicabilityhistorical balance sheets.
Reorganization Value
The reorganization value represents the fair value of the Successor Company’s total assets before considering liabilities and impactis intended to approximate the amount a willing buyer would pay for the Company’s assets immediately after restructuring. The reorganization value was derived from the enterprise value, which represents the estimated fair value of all ASUs; any ASUs not listedan entity’s long-term debt and equity. As set forth in the Plan, the enterprise value of the Successor Company was estimated to be in the range of $275 million to $335 million with a midpoint of $305 million. However, the third-party valuation advisor engaged to assist in determining the enterprise value subsequently revised this range to $249 million to $303 million, with a midpoint of $276 million, which was filed with the Bankruptcy Court in order to update the initial assumptions for current information. Based on the estimates and assumptions discussed below, we estimated the enterprise value to be the midpoint of the range of estimated enterprise value of $276 million.
The following table reconciles the enterprise value to the estimated fair value of our Successor Common Stock as of the Fresh Start Reporting Date (dollars in thousands, except per share data):
| | | | | |
| Enterprise value | $ | 276,000 | |
| Plus: cash and cash equivalents | 10,592 | |
| Less: fair value of debt | (145,420) | |
| |
| |
| Total implied equity (prior to debt issuance costs on equity component on Convertible Notes) | 141,172 | |
| Less: equity portion of Convertible Notes | (123,088) | |
| |
| |
| Fair value of Successor stockholders’ equity | $ | 18,084 | |
| Shares issued upon emergence | 1,049,804 | |
| Per share value | $ | 17.23 | |
The following table reconciles enterprise value to the reorganization value of our Successor’s assets to be allocated to our individual assets as of the Fresh Start Reporting Date (amounts in thousands):
| | | | | |
| Enterprise value | $ | 276,000 | |
| Plus: cash and cash equivalents | 10,592 | |
| Plus: current liabilities | 65,799 | |
| Plus: non-current liabilities excluding long-term debt | 6,626 | |
| Less: debt issuance costs on Successor debt | (6,394) | |
| Reorganization value of Successor assets | $ | 352,623 | |
With the assistance of our financial advisors, we determined the enterprise and corresponding equity value of the Successor using various valuation methods, including (i) discounted cash flow analysis, (ii) comparable company analysis and (iii) precedent transaction analysis. The use of each approach provides corroboration for the other approaches.
In order to estimate the enterprise value using the discounted cash flow (DCF) analysis approach, management’s estimated future cash flow projections through 2024, plus a terminal value calculated assuming a perpetuity growth rate and applying a multiple to the terminal year’s projected earnings before interest, tax, depreciation and amortization (EBITDA), were assesseddiscounted to an assumed present value using our estimated weighted average cost of capital (WACC), which represents the internal rate of return (IRR).
The comparable company analysis provides an estimate of the company’s value relative to other publicly traded companies with similar operating and financial characteristics, by which a range of EBITDA multiples of the comparable companies was then applied to management’s projected EBITDA to derive an estimated enterprise value.
Precedent transaction analysis provides an estimate of enterprise value based on recent sale transactions of similar companies, by deriving the implied EBITDA multiple of those transactions, based on sales prices, which was then applied to management’s projected EBITDA.
Certain inputs and assumptions used to estimate the enterprise value are considered significant unobservable inputs which are classified as Level 3 inputs under ASC Topic 820, Fair Value Measurements and Disclosures, including management’s estimated future cash flow projections. All estimates, assumptions, valuations and financial projections, including the fair value adjustments, the enterprise value and equity value projections, are inherently subject to significant uncertainties beyond our control, and accordingly, our actual results could vary materially.
Valuation Process
The fair values of our principal assets (including inventory, drilling and production services equipment, land and buildings, and intangible assets), and our liabilities were estimated with the assistance of third-party valuation advisors. The cost, income and market approaches were utilized in estimating these fair values. As more than one approach was used in our valuation analysis, the various approaches were reconciled to determine a final value conclusion. Further, economic obsolescence was considered in determining the fair value of our inventory and property and equipment. The fair value was allocated to our individual assets and liabilities as follows:
Inventory —Inventory valued consisted of spare parts and consumables that support our international, coiled tubing and wireline operations. The fair value of the international spare parts and coiled tubing inventory was determined using the
indirect method of the cost approach, with adjustments for economic obsolescence. For wireline inventory, the cost basis was adjusted to account for the changes in cost between the acquisition date and the valuation date.
Property and Equipment — Property and equipment valued consisted of leasehold improvements, machinery and equipment, transportation equipment, office furniture, fixtures and equipment, computers and software, construction-in-progress and assets held for sale. The fair value of our property and equipment was estimated using the cost approach and market approach, while the income approach was considered in the context of the economic obsolescence analysis which was applied to certain assets. As a part of the valuation process, the third-party advisors performed site inspections and utilized internal data to identify and value assets.
Land and Buildings — Land and buildings valued consisted of four facilities and the underlying land, for which the fair value was estimated using the cost approach and sales comparison (market) approach, with adjustments for economic obsolescence to certain assets.
Intangible Assets — Intangible assets valued consisted of trademark and tradename, for which the fair value was estimated using the relief-from-royalty income approach. As a part of the valuation process, the third-party advisors considered overall revenue and cash flow projections and guidance on long-term growth rates. Additionally, above or below market leases and contracts and relationships were examined and determined to have no fair value. The value of our intangible assets will be either not applicableamortized using the straight-line method over the economic useful life, which we estimated to be ten years.
Senior Secured Notes — The fair value of the Senior Secured Notes was estimated by applying a stochastic interest rate model implemented within a binomial lattice framework that considers the call provisions associated with the notes and captures the decision of prepaying the notes or are expectedholding to have an immaterial impact on our consolidated financial positionmaturity by evaluating the optimal decision at each time step constructed within the lattice model.
Convertible Notes — The fair value of the Convertible Notes was estimated by applying a binomial lattice model and results of operations.
Revenue Recognition. In May 2014,a recovery rate adjustment model, which provides a quantitative method for estimating the FASB issued ASU No. 2014-09,yield for a comprehensive new revenue recognition standard that will supersede nearly all existing revenue recognition guidance. The standard outlines a single comprehensive model for revenue recognitiondebt or debt-like security based on an observed market yield for a security of a different seniority. Certain inputs and assumptions used to derive the core principle that a company will recognize revenue when promised goods or services are transferred to clients, in an amount that reflects the consideration to which an entity expects to be entitled in exchange for those goods or services. We have substantially completed our assessmentfair value of the impact of this new standard.Convertible Notes are considered significant unobservable inputs which are classified as Level 3 inputs under ASC Topic 820, Fair Value Measurements and Disclosures, including the company’s stock price, the volatility and the market yield related to the Convertible Notes.
We expect thatConsolidated Balance Sheet
The adjustments set forth in the applicationfollowing consolidated balance sheet as of this new standard will resultMay 31, 2020 reflect the effects of the transactions contemplated by the Plan and executed on the fresh start reporting date (reflected in the column entitled “Reorganization Adjustments”), and fair value and other required accounting adjustments resulting from the adoption of Fresh Start Accounting (reflected in the column entitled “Fresh Start Accounting Adjustments”).
| | | | | | | | | | | | | | | | | | | | | | | | | | | | | |
| As of May 31, 2020 |
| (in thousands) | Predecessor | | Reorganization Adjustments | | | Fresh Start Accounting Adjustments | | | Successor |
| | | | | | | | | |
| | | | | | |
| ASSETS | | | | | | | | | |
| | | | | | | | | |
| Cash and cash equivalents | $ | 21,253 | | | $ | (10,661) | | (1) | | $ | 0 | | | | $ | 10,592 | |
| Restricted cash | 4,452 | | | 11,721 | | (2) | | 0 | | | | 16,173 | |
| Receivables: | | | | | | | | | |
| Trade, net of allowance for doubtful accounts | 33,537 | | | 0 | | | | 0 | | | | 33,537 | |
| Unbilled receivables | 9,163 | | | 0 | | | | 0 | | | | 9,163 | |
| Insurance recoveries | 23,636 | | | 0 | | | | 0 | | | | 23,636 | |
| Other receivables | 5,256 | | | 1,000 | | (3) | | 0 | | | | 6,256 | |
| Inventory | 21,012 | | | 0 | | | | (6,883) | | (18) | | 14,129 | |
| Assets held for sale | 1,825 | | | 0 | | | | 29 | | (19) | | 1,854 | |
| Prepaid expenses and other current assets | 4,817 | | | 0 | | | | 952 | | (20) | | 5,769 | |
| Total current assets | 124,951 | | | 2,060 | | | | (5,902) | | | | 121,109 | |
| | | | | | | | | |
| Property and equipment, at cost | 1,082,704 | | | 0 | | | | (886,733) | | (21) | | 195,971 | |
| Less accumulated depreciation | 655,512 | | | 0 | | | | (655,512) | | (21) | | 0 | |
| Net property and equipment | 427,192 | | | 0 | | | | (231,221) | | | | 195,971 | |
| Intangible assets, net of accumulated amortization | 0 | | | 0 | | | | 9,370 | | (22) | | 9,370 | |
| | | | | | | | | |
| Deferred income taxes | 10,897 | | | 0 | | | | (2,157) | | (23) | | 8,740 | |
| | | | | | | | | |
| Operating lease assets | 5,234 | | | 0 | | | | 0 | | | | 5,234 | |
| Other noncurrent assets | 13,247 | | | (5,023) | | (4) | | 3,975 | | (24) | | 12,199 | |
| | | | | | | | | |
| Total assets | $ | 581,521 | | | $ | (2,963) | | | | $ | (225,935) | | | | $ | 352,623 | |
| | | | | | | | | |
| LIABILITIES AND STOCKHOLDERS’ EQUITY | | | | | | | | | |
| | | | | | | | | |
| Accounts payable | $ | 24,601 | | | $ | (9,478) | | (5) | | $ | 0 | | | | $ | 15,123 | |
| | | | | | | | | |
| Deferred revenues | 121 | | | 0 | | | | 0 | | | | 121 | |
| Commitment premium | 9,584 | | | (9,584) | | (6) | | 0 | | | | 0 | |
| Debtor in possession financing | 4,000 | | | (4,000) | | (7) | | 0 | | | | 0 | |
| Accrued expenses: | | | | | | | | | |
| Employee compensation and related costs | 4,970 | | | 0 | | | | 0 | | | | 4,970 | |
| Insurance claims and settlements | 23,517 | | | 0 | | | | 0 | | | | 23,517 | |
| Insurance premiums and deductibles | 5,269 | | | 0 | | | | 0 | | | | 5,269 | |
| Interest | 3,775 | | | (3,731) | | (8) | | 0 | | | | 44 | |
| Other | 12,436 | | | 4,329 | | (9) | | (10) | | | | 16,755 | |
| | | | | | | | | |
| Total current liabilities | 88,273 | | | (22,464) | | | | (10) | | | | 65,799 | |
| | | | | | | | | |
| Long-term debt, less unamortized discount and debt issuance costs | 175,000 | | | (53,831) | | (10) | | 20,070 | | (25) | | 141,239 | |
| Noncurrent operating lease liabilities | 4,189 | | | 0 | | | | 0 | | | | 4,189 | |
| Deferred income taxes | 4,296 | | | 0 | | | | (3,225) | | (26) | | 1,071 | |
| Other noncurrent liabilities | 1,366 | | | 0 | | | | 0 | | | | 1,366 | |
| | | | | | | | | |
| Total liabilities not subject to compromise | 273,124 | | | (76,295) | | | | 16,835 | | | | 213,664 | |
| | | | | | | | | |
| | | | | | | | | |
| Liabilities subject to compromise | 308,422 | | | (308,422) | | (11) | | 0 | | | | 0 | |
| | | | | | | | | |
| Stockholders’ equity: | | | | | | | | | |
| | | | | | | | | |
| Predecessor common stock | 8,893 | | | (8,893) | | (12) | | 0 | | | | 0 | |
| | | | | | | | | |
| Successor common stock | 0 | | | 1 | | (13) | | 0 | | | | 1 | |
| Predecessor additional paid-in capital | 553,631 | | | (553,631) | | (14) | | 0 | | | | 0 | |
| Successor additional paid-in capital | 0 | | | 98,413 | | (15) | | 40,545 | | (27) | | 138,958 | |
| Predecessor treasury stock, at cost | (5,098) | | | 5,098 | | (16) | | 0 | | | | 0 | |
| Accumulated deficit | (557,451) | | | 840,766 | | (17) | | (283,315) | | (28) | | 0 | |
| Total stockholders’ equity | (25) | | | 381,754 | | | | (242,770) | | | | 138,959 | |
| Total liabilities and stockholders’ equity | $ | 581,521 | | | $ | (2,963) | | | | $ | (225,935) | | | | $ | 352,623 | |
(1)Represents the following net change in cash and cash equivalents:
| | | | | |
| Cash proceeds from Convertible Notes | $ | 120,187 | |
| Cash proceeds from Senior Secured Notes | 75,000 | |
| Payment to fund claims reserve | (950) | |
| Payment to escrow remaining professional fees | (10,771) | |
| Payment of professional fees | (9,468) | |
| Payment in full to extinguish DIP Facility | (4,000) | |
| Payment of accrued interest on DIP Facility | (55) | |
| Payment of DIP Facility fees | (177) | |
| Payment in full to extinguish Prepetition Term Loan | (175,000) | |
| Payment of accrued interest on Prepetition Term Loan | (3,677) | |
| Payment of prepayment penalty on Prepetition Term Loan | (1,750) | |
| $ | (10,661) | |
(2)Represents the following net change in restricted cash:
| | | | | |
| Payment to fund rejected leases claims reserve | $ | 950 | |
| Payment to escrow remaining professional fees | 10,771 | |
| $ | 11,721 | |
(3)Represents recognition of a receivable for a portion of the proceeds from the issuance of the Senior Secured Notes which was received in June 2020.
(4)Represents the reclassification of previously paid debt issuance costs from deferred assets to offset the carrying amount of long-term debt.
(5)Represents the payment of professional fees which were incurred prior to emergence.
(6)Represents the settlement of the Backstop Commitment Premium upon issuance of the Convertible Notes.
(7)Represents the payment to extinguish the DIP Facility.
(8)Represents the payment of accrued interest on the Prepetition Term Loan and DIP Facility.
(9)Represents the increase in accrued expenses for fees which were incurred upon our emergence from Chapter 11.
(10)Represents the following changes in long-term debt, less unamortized discount and debt issuance costs:
| | | | | |
| Payment in full to extinguish Prepetition Term Loan | $ | (175,000) | |
| Issuance of Senior Secured Notes at Par | 78,125 | |
| Recognition of debt issuance costs on Senior Secured Notes | (2,913) | |
| Recognition of liability component of Convertible Notes | 47,225 | |
| Recognition of debt issuance costs on liability component of Convertible Notes | (1,268) | |
| $ | (53,831) | |
Due to the Convertible Notes’ embedded conversion option, the liability and equity components were reported separately, as described further in Note 7, Debt.
(11)Represents the settlement of liabilities subject to compromise in accordance with the Plan, for which the resulting gain is as follows:
| | | | | |
| Prepetition Senior Notes | $ | 300,000 | |
| Accrued interest on Prepetition Senior Notes | 8,422 | |
| Liabilities subject to compromise | 308,422 | |
| Cash paid by holders of Prepetition Senior Notes | 118,013 | |
| Issuance of equity to Prepetition Senior Notes creditors | (17,044) | |
| Notes Received by Prepetition Senior Note holders | (118,013) | |
| $ | 291,378 | |
(12)Represents the cancellation of Predecessor common stock.
(13)Represents the issuance of Successor common stock to prior equity holders and to settle the Prepetition Senior Notes.
(14)Represents the cancellation of Predecessor additional paid-in capital.
(15)The changes in Successor additional paid-in capital were as follows:
| | | | | |
| Recognition of equity component of Convertible Notes | $ | 82,546 | |
| Issuance of Successor common stock to Prepetition Senior Notes creditors and prior equity holders | 18,083 | |
| Recognition of debt issuance costs on equity component of Convertible Notes | (2,216) | |
| $ | 98,413 | |
Due to the Convertible Notes’ embedded conversion option, the liability and equity components were reported separately, as described further in Note 7, Debt.
(16)Represents the cancellation of Predecessor treasury stock.
(17)Represents the cumulative impact to Predecessor retained earnings of the reorganization adjustments described above.
(18)Represents the fair value adjustment to inventory, as described further in the previous section under the heading “Valuation Process”.
(19)Represents the fair value adjustment to assets held for sale, as described further in the previous section under the heading “Valuation Process”.
(20)Represents deferred compensation associated with the excess of fair value over the par value of Convertible Notes purchased by senior management, which is compensation to the Successor and therefore was expensed in June 2020.
(21)Represents the following fair value adjustments to property and equipment:
| | | | | | | | | | | |
| Predecessor
Historical Value | Fair Value
Adjustment | Successor
Fair Value |
| Drilling rigs and equipment | $ | 1,010,612 | | $ | (832,294) | | $ | 178,318 | |
| Vehicles | 41,283 | | (28,561) | | 12,722 | |
| Building and improvements | 16,619 | | (13,742) | | 2,877 | |
| Office equipment | 12,231 | | (11,743) | | 488 | |
| Land | 1,959 | | (393) | | 1,566 | |
| $ | 1,082,704 | | $ | (886,733) | | $ | 195,971 | |
| Less: Accumulated Depreciation | (655,512) | | 655,512 | | 0 | |
| $ | 427,192 | | $ | (231,221) | | $ | 195,971 | |
(22)Represents the fair value adjustment to recognize the trademark and tradename of Pioneer Energy Services Corp. as an intangible, as described further in the above section under the heading “Valuation Process”.
(23)Represents the recognition of the noncurrent deferred tax asset as a result of the cumulative tax impact of the fresh start adjustments herein.
(24)Represents a prepaid tax asset established as part of the fresh start accounting adjustments.
(25)Represents the following fair value adjustments to long-term debt less unamortized discount and debt issuance costs:
| | | | | |
| Fair value adjustment to the liability component of the Convertible Notes | $ | 23,195 | |
| Discount on Senior Secured Notes | (3,125) | |
| $ | 20,070 | |
Due to the Convertible Notes’ embedded conversion option, the liability and equity components were reported separately, as described further in Note 7, Debt.
(26)Represents the derecognition of the deferred tax liability as a result of the cumulative tax impact of the fresh start adjustments herein.
(27)Represents the fair value adjustment to the equity component of the Convertible Notes.
(28)Represents the cumulative impact of the fresh start accounting adjustments discussed above and the elimination of Predecessor accumulated earnings.
4. Revenue from Contracts with Customers
Our production services business segments earn revenues for well servicing and wireline services pursuant to master services agreements based on purchase orders or other contractual arrangements with the client. Production services jobs are generally short-term (ranging in duration from several hours to less than 30 days) and are charged at current market rates for the labor, equipment and materials necessary to complete the job. Production services jobs are varied in nature but typically represent a single performance obligation, either for a particular job, a series of distinct jobs, or a period of time during which we stand ready to provide services as our client needs them. Revenue is recognized for these services over time, as the services are performed.
Our drilling services business segments earn revenues by drilling oil and gas wells for our clients under daywork contracts. Daywork contracts are comprehensive agreements under which we provide a comprehensive service offering, including the drilling rig, crew, supplies, and most of the ancillary equipment necessary to operate the rig. Contract modifications that extend the term of a dayrate contract are generally accounted for prospectively as a separate dayrate contract. We account for our services provided under daywork contracts as a single performance obligation comprised of a series of distinct time increments which are satisfied over time. Accordingly, dayrate revenues are recognized in the period during which the services are performed.
With most drilling contracts, we also receive payments contractually designated for the mobilization and demobilization of drilling rigs and other equipment to and from the client’s drill site. Revenues associated with the mobilization and demobilization whichof our drilling rigs to and from the client’s drill site do not relate to a distinct good or service will beand are recognized ratably over the related contract term. The amount of demobilization revenue that we ultimately collect is dependent upon the specific contractual terms, most of which include provisions for reduced (or no) payment for demobilization when, among other things, the contract is renewed or extended with the same client, or when the rig is subsequently contracted with another client prior to the termination of the current contract. Since revenues associated with demobilization activity are typically variable, at each period end, they are estimated at the most likely amount, and constrained when the likelihood of a significant reversal is probable. Any change in the expected amount of demobilization revenue is accounted for with the net cumulative impact of the change in estimate recognized in the period during which the revenue estimate is revised.
The upfront costs that we incur to mobilize the drilling rig to our client’s initial drilling site are capitalized and recognized ratably over the term of the contract. All other revenues associated with the services we provide,related contract, including dayrate revenues and production services revenues, will continue to be recognized inany contracted renewal or extension periods, which is our estimate of the period during which we expect to benefit from the services are performed. We expect our revenue recognition undercost of mobilizing the new standard to differ from our current revenue recognition pattern primarily as it relates to drillingrig. Costs associated with the final demobilization revenue, which, prior to the new standard, is recognized when the demobilization activity occurs at the end of the contract term but underare expensed when incurred, when the new guidance willdemobilization activity is performed.
From time to time, we may receive fees from our clients for capital improvements to our rigs to meet our client’s requirements. Such revenues are not considered to be estimateddistinct within the terms of the contract and recognizedare therefore allocated to the overall performance obligation, satisfied over the term of the contract. We record deferred revenue for such payments and recognize them ratably as revenue over the initial term of the related drilling contract.
This new standard is effectiveWe also act as a principal for certain reimbursable services and auxiliary equipment provided by us beginning January 1, 2018,to our clients, for which we have adopted usingincur costs and earn revenues, many of which are variable, or dependent upon the modified retrospective method,activity that is actually performed each day under the related contract. Accordingly, reimbursements that we receive for out-of-pocket expenses are recorded as revenues and the out-of-pocket expenses for which they relate are recorded as operating costs during the period to which they relate within the series of distinct time increments.
All of our revenues are recognized net of sales taxes, when applicable.
Trade and Unbilled Accounts Receivable
We record trade accounts receivable at the amount we invoice to our clients. These accounts do not bear interest. The allowance for doubtful accounts is our best estimate of the amount of probable credit losses in which the standard is applied to all contracts existingour accounts receivable as of the datebalance sheet date. We determine the allowance based on the credit worthiness of our clients and general economic conditions. Consequently, an adverse change in those factors could affect our estimate of our allowance for doubtful accounts.
Our production services terms generally provide for payment of invoices in 30 days. Our typical drilling contract provides for payment of invoices in 30 days, though the process for invoicing work performed in our international operations generally lengthens the billing cycle for those operations. We review our allowance for doubtful accounts on a monthly basis, and balances more than 90 days past due are reviewed individually for collectability. We charge off account balances against the allowance after we have exhausted all reasonable means of collection and determined that the potential for recovery is remote. We do not have any off-balance sheet credit exposure related to our clients.
The changes in our allowance for doubtful accounts consist of the following (amounts in thousands):
| | | | | | | | | | | | | | | | | | | | | | |
| Successor | | | Predecessor | | |
| | | | |
| | Seven Months Ended December 31, 2020 | | | Five Months Ended May 31, 2020 | | Year Ended December 31, 2019 | | |
| Balance at beginning of period | $ | 1,988 | | | | $ | 824 | | | $ | 1,423 | | | |
| Increase (decrease) in allowance charged to expense | (587) | | | | 1,164 | | | (167) | | | |
| Accounts charged against the allowance | (237) | | | | 0 | | | (432) | | | |
| Balance at end of period | $ | 1,164 | | | | $ | 1,988 | | | $ | 824 | | | |
Substantially all of our unbilled receivables represent revenues we have recognized in excess of amounts billed on drilling contracts. We typically bill our clients at 15-day intervals during the performance of daywork drilling contracts and upon completion of the daywork contract.
Contract Asset and Liability Balances and Contract Cost Assets
Contract asset and contract liability balances relate to demobilization and mobilization revenues, respectively. Demobilization revenue that we expect to receive is recognized ratably over the related contract term, but invoiced upon completion of the demobilization activity. Mobilization revenue, which is typically collected upon the completion of the initial application,mobilization activity, is deferred and recognized ratably over the related contract term. Contract asset and liability balances are netted at the contract level, with the cumulative effect of applyingnet current and noncurrent portions separately classified in our consolidated balance sheets, and the standardresulting contract liabilities are referred to herein as “deferred revenues.” When demobilization revenues are recognized prior to the activity being performed, they are not yet billable, and the resulting contract assets are included in retained earnings (the adoption date adjustments). We estimate thatour other current assets in our consolidated financial statements.
Contract cost assets represent the adoption of this standard resultscosts associated with the initial mobilization required in a cumulative effect adjustment of less than $1.0 million before applicable income taxes,order to fulfill the contract, which primarily consistsare deferred and recognized ratably over the period during which we expect to benefit from the mobilization, or the period during which we expect to satisfy the performance obligations of the impactrelated contract. Contract cost assets are presented as either current or noncurrent, according to the duration of the timing differenceoriginal contract to which it relates, and referred to herein as “deferred costs.”
Our current and noncurrent deferred revenues, contract assets and deferred costs as of December 31, 2020 and 2019 were as follows (amounts in thousands):
| | | | | | | | | | | | | | |
| Successor | | | Predecessor |
| |
| December 31, 2020 | | | December 31, 2019 |
| | | | |
| Current deferred revenues | $ | 1,019 | | | | $ | 1,339 | |
| Current deferred costs | 361 | | | | 1,071 | |
| Current contract assets | 300 | | | | 0 | |
| | | | |
| | | | |
| Noncurrent deferred revenues | 0 | | | | 57 | |
| Noncurrent deferred costs | 194 | | | | 267 | |
The changes in contract balances during the year ended December 31, 2020 are primarily related to the amortization of deferred revenues and costs during the period, partially offset by increases related to 7 rigs deployed under new contracts in 2020 as well as an increase in deferred revenues associated with prepayments made by our domestic drilling clients for capital improvements to our rigs to meet their requirements and the recognition of demobilization revenue for affected contracts.1 international contract which expired in January 2021. Amortization of deferred revenues and costs were as follows (amounts in thousands):
| | | | | | | | | | | | | | | | | | | | | | | | | | |
| | | | | Successor | | | Predecessor | | |
| | | | | | |
| | | | | | Seven Months Ended December 31, 2020 | | | Five Months Ended May 31, 2020 | | Year Ended December 31, 2019 | | |
| Amortization of deferred revenues | | | | | $ | 1,024 | | | | $ | 2,705 | | | $ | 6,203 | | | |
| Amortization of deferred costs | | | | | 659 | | | | 1,876 | | | 4,786 | | | |
As we work towards finalizingBeginning in late March 2020, rather than terminating their contracts with us, certain of our assessment, we are continuingclients elected to evaluatetemporarily stack 3 of our rigs, placing them on an extended standby for a reduced revenue rate and the requirements of this standard and complete other implementation activities such as implementing new procedures, finalizingoption to reactivate the adoption date adjustment and drafting disclosures.
Leases. In February 2016,rigs through the FASB issued ASU No. 2016-02, Leases, which among other things, requires lessees to recognize substantially all leases on the balance sheet, with expense recognition that is similar to the current lease standard, and aligns the principles of lessor accounting with the principlesremainder of the FASB’s new revenue guidance (referenced above). This ASU is effective for us beginning Januarycontract term. In May 2020, 1 2019 and requires a modified retrospective application, although certain practical expedients are permitted.
We have performed a scoping and preliminary assessment of the impact of this new standard. As a lessee, this standard will impact us in situations where we lease real estate and office equipment, for which we will recognize a right-of-use asset and a corresponding lease liability on our consolidated balance sheet. The future lease obligations disclosed in Note 4, Leases, provides some insight to the estimated impact of adoption for us as a lessee. As a lessor, we expect the adoption of this new standard will apply to our drilling contracts and as a result, we expect to have a lease component and a service component of our revenues derived from these contracts. We have not yet determined the impact this standard may have on our production services businesses. We continue to evaluate the impact of this guidance and have not yet determined its impact on our financial position and results of operations.
Stock-Based Compensation. In March 2016, the FASB issued ASU No. 2016-09, Stock Compensation: Improvements to Employee Share-Based Payment Accounting, to reduce complexity in accounting standards involving several aspects of the accounting for employee share-based payment transactions, including the income tax consequences, classification of awards as either equity or liabilities, and classification on the statement of cash flows.
We adopted this ASU as of January 1, 2017 and we recognized a $3.1 million deferred tax asset for previously unrecognized tax benefits, which was then fully reserved by a valuation allowance (see Note 5, Income Taxes). Additionally, wedomestic clients elected to prospectively accountearly terminate their contract with us and make an upfront early termination payment based on a per day rate for forfeitures as they occur, rather than estimating future forfeitures. The total cumulative-effect impactthe respective remaining contract term, resulting in $1.6 million of adoption, net of valuation allowances, was approximately $55,000 relating to our change in accounting for forfeitures, and wasrevenues recognized as a reduction to retained earnings in our consolidated statement of shareholders’ equity, together with the impact of stock-based compensation expense. The adoption of this ASU also results in the presentation of any excess tax benefits resulting from the exercise of stock options as operating cash flows in the statement of cash flows, which we apply retrospectively for any comparative periods affected.
Restricted Cash in Statement of Cash Flows. In November 2016, the FASB issued ASU No. 2016-18, Restricted Cash (a consensus of the FASB Emerging Issues Task Force), which requires that restricted cash be included with cash and cash equivalents when reconciling the beginning and end-of-period total amounts shown on the statement of cash flows. This guidance must be applied retrospectively to all periods presented. We early adopted this ASU effective December 31, 2017. See Cash and Restricted Cashsection above, included in this Note 1, Organization and Summary of Significant Accounting Policies, for detail regarding the nature of our restricted cash.
Reclassifications
Certain amounts in the consolidated financial statements for the prior years have been reclassified to conform to the current year’s presentation.
We revised our reportable business segments as of the fourth quarter of 2017, which now include five operating segments, comprised of two drilling services business segments (domestic and international drilling) and three production services business segments (well servicing, wireline services and coiled tubing services). We revised our segments to reflect changes in the basis used by management in making decisions regarding our business for resource allocation and performance assessment. These changes reflect our current operating focus as is required by ASC Topic 280, Segment Reporting. See Note 10, Segment Informationfor this revised presentation.
2. Property and Equipment
Predecessor period. As of December 31, 20172020, 16 of our 25 rigs are earning under daywork contracts, of which 6 are under domestic term contracts including 1 that is earning but not working, and 2016,2 are international rigs which are currently on standby.
Unlike our domestic term contracts, our international drilling contracts are cancelable by our clients without penalty, although the contracts require 15 to 30 days notice and payment for demobilization services. Revenues associated with the initial mobilization and/or demobilization of drilling rigs under cancelable contracts are deferred and recognized ratably over the anticipated duration of the original contract, which is the period during which we expect our client to benefit from the mobilization of the rig, and represents a separate performance obligation because the payment for mobilization and/or demobilization creates a material right to our client during the cancelable period, for which the transaction price is allocated to the optional goods and services expected to be provided.
Remaining Performance Obligations
We have elected to apply the practical expedients in ASC Topic 606, Revenue from Contracts with Customers, which allow entities to omit disclosure of (i) the transaction price allocated to the remaining performance obligations associated with short-term contracts, and (ii) the estimated variable consideration related to wholly unsatisfied performance obligations, or to distinct future time increments within a series of performance obligations. Therefore, we have not disclosed the remaining amount of fixed mobilization revenue (or estimated future variable demobilization revenue) associated with short-term contracts, and we have not disclosed an estimate of the amount of future variable dayrate drilling revenue. However, the amount of fixed mobilization revenue associated with remaining performance obligations is reflected in the net unamortized balance of deferred mobilization revenues, which is presented in both current and noncurrent portions in our consolidated balance sheet, and discussed in more detail in the section above entitled, Contract Asset and Liability Balances and Contract Cost Assets.
Disaggregation of Revenue
ASC Topic 606 requires disclosure of the disaggregation of revenue into categories that depict how the nature, amount, timing, and uncertainty of revenue and cash flows are affected by economic factors. We believe the disclosure of revenues by operating segment achieves the objective of this disclosure requirement. See Note 13, Segment Information, for the disaggregation of revenues by operating segment, which reflects the disaggregation of revenues by the type of services provided and by geography (international versus domestic).
Concentration of Clients
We derive a significant portion of our revenue from a limited number of major clients. While none of our clients individually accounted for more than 10% of our total revenues in either of the years ended December 31, 2020 or 2019, our drilling and production services provided to our top three clients accounted for approximately 19% and 18%, respectively, of our revenue.
5. Property and Equipment
The following table presents the estimated useful lives and costs of our asset classes are as follows:
|
| | | | | | | | | |
| | | | As of December 31, |
| | | | 2017 | | 2016 |
| | Lives | | Cost (amounts in thousands) |
| Drilling rigs and equipment | 3 - 25 | | $ | 594,743 |
| | $ | 582,477 |
|
| Well servicing rigs and equipment | 3 - 20 | | 244,747 |
| | 225,125 |
|
| Wireline units and equipment | 1 - 10 | | 142,224 |
| | 141,959 |
|
| Coiled tubing units and equipment | 1 - 7 | | 18,141 |
| | 16,347 |
|
| Vehicles | 3 - 10 | | 47,932 |
| | 45,424 |
|
| Office equipment | 3 - 10 | | 12,717 |
| | 11,628 |
|
| Buildings and improvements | 3 - 40 | | 24,013 |
| | 23,884 |
|
| Property and equipment not yet placed in service | — | | 6,751 |
| | 9,050 |
|
| Land | — | | 2,367 |
| | 2,367 |
|
| | | | $ | 1,093,635 |
| | $ | 1,058,261 |
|
Capital Expenditures—Our capital expenditures were $61.4 million, $32.6 million and $142.9 million during the years ended December 31, 2017, 2016, and 2015, respectively, which includes $0.4 million, $0.2 million and $3.0 million, respectively, of capitalized interest costs incurred in connection with the expansion of our well servicing fleet in 2017 and the construction of new drilling rigs and other drilling equipment in 2016 and 2015.
Capital expenditures during 2017 primarily related to the acquisition of 20 well servicing rigs and expansion of our wireline fleet, upgrades to certain domestic drilling rigs, routine capital expenditures necessary to deploy assets that were previously idle, and other new drilling equipment and trucks. Capital expenditures during 2016 consisted primarily of routine expenditures to maintain our drilling and production services fleets, and expenditures for equipment ordered in 2014 before the market slowdown. During 2015, capital expenditures primarily related to our five drilling rigs which began construction during 2014 and were completed in 2015, as well as unit additions to our production services fleets that were ordered in 2014.
Capital expenditures incurred for property and equipment not yet placed in serviceby class as of December 31, 20172020 (amounts in thousands, except useful lives):
| | | | | | | | | | | | | | | | |
| Successor | | | |
| | | |
| Lives | | December 31, 2020 | | | | | |
| | | |
| Drilling rigs and equipment | 3 - 25 | | $ | 136,982 | | | | | | |
| Well servicing rigs and equipment | 5 - 17 | | 32,346 | | | | | | |
| Wireline units and equipment | 1 - 10 | | 6,057 | | | | | | |
| | | | | | | | |
| | | | | | | | |
| Vehicles | 3 - 5 | | 12,128 | | | | | | |
| Buildings and improvements | 2 - 40 | | 2,702 | | | | | | |
| Office equipment | 3 - 5 | | 478 | | | | | | |
| Property and equipment not yet placed in service | 0 | | 1,207 | | | | | | |
| Land | 0 | | 1,629 | | | | | | |
| | | $ | 193,529 | | | | | | |
Due to the application of fresh start accounting, the carrying value of our property and equipment was reduced to the estimated fair value and a new historical cost basis was established at the Fresh Start Reporting Date, as described further in Note 3, Fresh Start Accounting.
Capital Expenditures — Capital additions during 2020 primarily related to routine refurbishments on one international drilling rig in preparation for its deployment in 2018, installments on the purchase of three wireline units and one coiled tubing unit, and scheduled refurbishments on drilling and production services equipment. At December 31, 2016, property and equipment not yet placed in service was primarily relatedexpenditures that are necessary to new drilling equipment that was ordered in 2014 but required a long lead-time for delivery, as well as deposits for 20 well servicing rigs and four new wireline units that were on order for delivery in 2017.
Gain/Loss on Disposition of Property—We recorded a net gainmaintain our fleets, while capital additions during the year ended December 31, 2017 of $3.6 million on the disposition of property and equipment, primarily for sales of drilling and coiled tubing equipment and vehicles, as well as the loss of drill pipe in operation, for which we were reimbursed by our client. Net gains in 20172019 also included the disposalcompletion of three cranes that were damaged, forconstruction on our 17th AC drilling rig which we received $0.2 million of the $0.8 million of insurance proceedsdeployed in March 2019, and expect to receive the remaining proceeds in early 2018.various vehicle and ancillary equipment purchases and upgrades.
During 2016, we recorded a net gain of $1.9 million on the disposition of property and equipment, primarily for the sale of three SCR drilling rigs and other drilling equipment for aggregate net proceeds of $11.9 million, and the disposal of excess drill pipe for a gain. The net gains on disposition of assets were partially offset by a loss on the disposition of damaged property when one of our AC drilling rigs sustained damages that resulted in a disposal of damaged components with an aggregate net carrying value of $4.0 million, for which we received insurance proceeds of $3.1 million in January 2017.
During 2015, we recorded a net gain of $4.3 million primarily from the sale of 32 drilling rigs and other drilling equipment which we sold for aggregate net proceeds of $53.6 million.
Assets Held for Sale—As In April 2020, we closed our coiled tubing services business and placed all of December 31, 2017, our consolidated balance sheet reflectscoiled tubing services assets as held for sale at June 30, 2020, which represents $3.3 million of our total assets held for sale of $6.6 million, which primarily represents the fair value of three domestic SCR drilling rigs and one domestic mechanical drilling rig, as well as two wireline units and one coiled tubing unit and spare equipment. As ofat December 31, 2016, our consolidated balance sheet reflects assets2020. We have various other equipment designated as held for sale which is carried at fair value. When the net carrying value of $15.1 million, which primarily represents thean asset designated as held for sale exceeds its estimated fair value, which we estimate based on expected sales prices, which are classified as Level 3 inputs as defined by ASC Topic 820, Fair Value Measurements and Disclosures, we recognize the difference as an impairment charge.
Impairments — In accordance with ASC Topic 360, Property, Plant and Equipment, we monitor all indicators of six domestic mechanical and SCR drilling rigs and drilling equipment, 13 wireline units, 20 older well servicing rigs that were traded in for 20 new-model rigs in the first quarter of 2017, and certain coiled tubing equipment.
Impairments—potential impairments. We evaluate for potential impairment of long-lived assets when indicators of impairment are present, which may include, among other things, significant adverse changes in industry trends (including revenue rates, utilization rates, oil and natural gas market prices, and industry rig counts). In performing an impairment evaluation, we estimate the future undiscounted net cash flows from the use and eventual disposition of the assets grouped at the lowest level that independent cash flows can be identified. We perform an impairment evaluation and estimate future undiscounted cash flows for each of our reporting unitsasset groups separately, which are our domestic drilling services, international drilling services, well servicing and wireline services segments, and, prior to being placed as held for sale, our coiled tubing services segments. segment. If the sum of the estimated future undiscounted net cash flows is less than the carrying amount of the asset group, then we determine the fair value of the asset group. Thegroup, and the amount of an impairment charge iswould be measured as the difference between the carrying amount and the fair value of the assets.
BeginningDue to the significant decline in late 2014, oilindustry conditions, commodity prices, declined significantly resulting in a downturn inand projected utilization of equipment, as well as the COVID-19 pandemic’s impact on our industry, that persisted through 2016, affecting both drillingour projected cash flows declined during the first quarter of 2020, and production services. As a result, we performed several impairment evaluations on our long-lived assets, in accordance with ASC Topic 360, Property, Plant and Equipment, summarized below.
As of December 31, 2014, we owned a total of 31 mechanical and lower horsepower electric drilling rigs, all of which were subsequently sold or placed as held for sale during 2015. As the downturn worsened through 2015, resulting in significantly reduced revenue and utilization rates, and our projections reflected a more delayed recovery than previously anticipated, we performed impairmentrecoverability testing in 2015 on all the SCR drilling rigs in our domestic and international fleets, and our coiled tubing operations.
reporting units. As a result of the impairment testing performed in 2015,this analysis, we recognized $9.7 million to reduce the carrying values of the six SCR drilling rigs that were not pad-capable, and $18.6 million to reduce the carrying values of the six domestic pad-capable SCR rigs in our fleet (those equipped with either a walking or skidding system), to their estimated fair values, based on market appraisals which are considered Level 3 inputs as defined by ASC Topic 820, Fair Value Measurements and Disclosures. All of these drilling rigs were subsequently either sold, retired, or placed as held for sale during 2015 and 2016.
We also recognizedincurred impairment charges during 2015 of $60.2 million related to our international drilling operations in Colombia ($50.2 million to reduce the carrying values of all eight drilling rigs and related drilling equipment, $3.6 million to reduce the carrying value of inventory, and $6.4 million to reduce the carrying value of nonrecoverable prepaid taxes) and $30.9 million related to our coiled tubing operations ($14.3 million related to our coiled tubing intangibles and $16.6$16.4 million to reduce the carrying values of our coiled tubing units and equipmentassets to their estimated fair value, based on market appraisals).
As business conditions andvalues during the three months ended March 31, 2020. For all our projected cash flows for our Colombian operations improved as compared to the projections used for the impairment analysis in 2015, we did not perform any impairment testing on this business in 2016 or 2017. However, due to lower than anticipated operating results in 2016 and 2017 and a decline in our projected cash flows for theother reporting units, excluding coiled tubing, reporting unit, we performed an impairment analysisdetermined that the sum of our coiled tubing long-lived assets at September 30, 2016 and again at June 30, 2017, which indicated that our projectedthe estimated future undiscounted net undiscounted cash flows associated with the coiled tubing reporting unit were in excess of the net carrying valueamounts and that no impairment existed for these reporting units at March 31, 2020. We continued to monitor potential indicators of impairment through December 31, 2020 and concluded that none of our reporting units are currently at risk of impairment.
The assumptions we use in the evaluation for impairment are inherently uncertain and require management judgment. Although we believe the assumptions and estimates used in our impairment analysis are reasonable, different assumptions and estimates could materially impact the analysis and resulting conclusions. The most significant inputs used in our impairment analysis include the projected utilization and pricing of our services, as well as the estimated
proceeds upon any future sale or disposal of the assets, at both dates and thus no impairment was present.
During the years ended December 31, 2017, 2016 and 2015, we recognized impairment chargesall of $1.9 million, $11.9 million, and $9.9 million, respectively, to reduce the carrying values of assets which were classified as held for sale, to their estimated fair values, based on expected sales prices which are classified as Level 3 inputs as defined by ASC Topic 820, Fair Value Measurements and Disclosures. DuringIf commodity prices decrease or remain at current levels for an extended period of time, or if the year ended December 31, 2016, we also recognized $0.9 million of impairment charges to reduce the carrying value of a portion of steel that is on handdemand for the construction of drilling rigs, which we no longer believe is likely to be used.
The following table summarizes impairment expense recognized during the years ended December 31, 2017, 2016, and 2015 (amounts in thousands):
|
| | | | | | | | | | | |
| | Year ended December 31, |
| | 2017 | | 2016 | | 2015 |
| Assets held for sale | $ | 1,902 |
| | $ | 11,897 |
| | $ | 9,858 |
|
| Colombian assets | — |
| | — |
| | 60,130 |
|
| Domestic drilling rigs and equipment | — |
| | 918 |
| | 28,228 |
|
| Coiled tubing assets | — |
| | — |
| | 30,936 |
|
| | $ | 1,902 |
| | $ | 12,815 |
| | $ | 129,152 |
|
In order to estimate our future undiscounted cash flows from the use and eventual disposition of our drilling assets, we incorporated probabilities of selling these assets in the near term, versus working them at a significantly reduced expected rate of utilization through the end of their remaining useful lives. The most significant assumptions used in our analysis are the expected margin per day and utilization, as well as the estimated proceeds upon any future sale or disposal of the assets. We used an income approach to estimate the fair value of our coiled tubing services reporting unit in 2016 and 2017. The most significant inputs used in our impairment analysis of our coiled tubing operations include the projected utilization and pricing of our coiled tubing services, which are classified as Level 3 inputs as defined by ASC Topic 820, Fair Value Measurements and Disclosures.
Although we believe the assumptions and estimates used in our impairment analyses are reasonable and appropriate, different assumptions and estimates could materially impact the analyses and resulting conclusions. The assumptions used in the impairment evaluation are inherently uncertain and require management judgment.These impairment charges are not expected to have an impact on our liquidity or debt covenants; however, they are a reflection of the overall downturn in our industry and decline in our projected future cash flows. If any of our assets become or remain idle for an extended amount of time, thenservices decreases below what we are currently projecting, our estimated cash flows may further decrease and thereforeour estimates of the probabilityfair value of a near term salecertain assets may increase.decrease as well. If any of the foregoing were to occur, we maycould incur additional impairment charges.charges on the related assets.
3.6. Leases
As a drilling and production services provider, we provide the drilling rigs and production services equipment which are necessary to fulfill our performance obligations and which are considered leases under ASU No. 2016-02, Leases, (together with its amendments, herein referred to as “ASC Topic 842”). However, ASU No. 2018-11, Leases: Targeted Improvements, allows lessors to (i) combine the lease and non-lease components of revenues when the revenue recognition pattern is the same and when the lease component, when accounted for separately, would be considered an operating lease, and (ii) account for the combined lease and non-lease components under ASC Topic 606, Revenue from Contracts with Customers, when the non-lease component is the predominant element of the combined component. We elected to apply this expedient and therefore recognize our revenues (both lease and service components) under ASC Topic 606, and present them as one revenue stream in our consolidated statements of operations.
As a lessee, we lease our corporate office headquarters in San Antonio, Texas, and we conduct our business operations through 15 other regional offices located throughout the United States and internationally in Colombia. These operating locations typically include regional offices, storage and maintenance yards and employee housing sufficient to support our operations in the area. We lease most of these properties under non-cancelable term and month-to-month operating leases, many of which contain renewal options that can extend the lease term from one year to five years and some of which contain escalation clauses. We also lease supplemental equipment, typically under cancelable short-term and very short term (less than 30 days) leases. Due to the nature of our business, any option to renew these short-term leases, and the options to extend certain of our long-term real estate leases, are generally not considered reasonably certain to be exercised. Therefore, the periods covered by such optional periods are not included in the determination of the term of the lease, and the lease payments during these periods are similarly excluded from the calculation of operating lease asset and lease liability balances.
In accordance with ASC Topic 842, we recognize an operating lease asset and a corresponding operating lease liability for all our long-term leases, which include real estate and office equipment leases, for which we elected to combine, or not separate, the lease and non-lease components, and therefore, all fixed charges associated with non-lease components are included in the lease payments and the calculation of the operating lease asset and associated lease liability. The operating lease asset and operating lease liability are discounted at the rate which represents our secured incremental borrowing rate, as our leases do not provide an implicit rate, and which we estimate based on the rate in effect under our asset-based lending facility.
We recognize rent expense on a straight-line basis, except for certain variable expenses which are recognized when the variability is resolved, typically during the period in which they are paid. Variable lease payments typically include charges for property taxes and insurance, and some leases contain variable payments related to non-lease components, including common area maintenance and usage of office equipment (for example, copiers). The following table summarizes our lease expense recognized, excluding variable lease costs (amounts in thousands):
| | | | | | | | | | | | | | | | | | | | | | | | |
| | | | | Successor | | | Predecessor |
| | | | | | |
| | | | | Seven Months Ended December 31, 2020 | | | Five Months Ended May 31, 2020 | | Year Ended December 31, 2019 |
| Long-term operating lease expense | | | | | $ | 853 | | | | $ | 1,080 | | | $ | 3,699 | |
| Short-term operating lease expense | | | | | 3,370 | | | | 4,456 | | | 15,187 | |
The following table summarizes the amount and timing of our obligations associated with our long-term operating leases (amounts in thousands):
| | | | | | | | | | | | | | |
| Successor | | | Predecessor |
| December 31, 2020 | | | December 31, 2019 |
| | | | |
| Within 1 year | $ | 1,069 | | | | $ | 2,496 | |
| In the second year | 985 | | | | 1,933 | |
| In the third year | 921 | | | | 1,447 | |
| In the fourth year | 874 | | | | 1,117 | |
| In the fifth year | 895 | | | | 912 | |
| Thereafter | 299 | | | | 811 | |
| Total undiscounted lease obligations | $ | 5,043 | | | | $ | 8,716 | |
| Impact of discounting | (532) | | | | (818) | |
| Discounted value of operating lease obligations | $ | 4,511 | | | | $ | 7,898 | |
| | | | |
| Current operating lease liabilities | $ | 889 | | | | $ | 2,198 | |
| Noncurrent operating lease liabilities | 3,622 | | | | 5,700 | |
| $ | 4,511 | | | | $ | 7,898 | |
| | | | |
| | | | |
| | | | |
| | | | |
During 2020, leased assets obtained in exchange for new operating lease liabilities totaled approximately $2.1 million.
The following table summarizes the weighted-average remaining lease term and discount rate associated with our long-term operating leases:
| | | | | | | | | | | | | | |
| | | | |
| | | | |
| | | | |
| | | | |
| | | | |
| | | | |
| | | | |
| | | | |
| | | | |
| | | | |
| | | | |
| | | | |
| | | | |
| | | | |
| | | | |
| | | | |
| Successor | | | Predecessor |
| December 31, 2020 | | | December 31, 2019 |
| Weighted-average remaining lease term (in years) | 5.0 | | | 4.5 |
| Weighted-average discount rate | 4.5 | % | | | 4.5 | % |
7. Debt
OurAt December 31, 2019, our debt consistsconsisted of the following (amounts in thousands):
| | | | | | | |
| | | Predecessor |
| | | December 31, 2019 |
| Term Loan | | | $ | 175,000 | |
| Prepetition Senior Notes | | | 300,000 | |
| | | 475,000 | |
| Less unamortized discount | | | (1,869) | |
| Less unamortized debt issuance costs | | | (5,432) | |
| | | $ | 467,699 | |
The commencement of the Chapter 11 Cases constituted an event of default that accelerated our obligations under our Prepetition Senior Notes, the Prepetition ABL Facility, and Term Loan. Under the Bankruptcy Code, holders of our Prepetition Senior Notes and the lenders under our Term Loan and the Prepetition ABL Facility were stayed from taking any action against us as a result of this event of default.
On the Effective Date, all applicable agreements governing the obligations under the Term Loan, Prepetition Senior Notes and Prepetition ABL Facility were terminated. The Term Loan and Prepetition ABL Facility were paid in full and all outstanding obligations under the Prepetition Senior Notes were canceled in exchange for 94.25% of the pro forma common equity. For additional information concerning our bankruptcy proceedings under Chapter 11, see Note 2, Emergence from Voluntary Reorganization under Chapter 11.
|
| | | | | | | |
| | December 31, 2017 | | December 31, 2016 |
| Senior secured term loan | $ | 175,000 |
| | $ | — |
|
| Senior secured revolving credit facility | — |
| | 46,000 |
|
| Senior notes | 300,000 |
| | 300,000 |
|
| | 475,000 |
| | 346,000 |
|
| Less unamortized discount (based on imputed interest rate of 10.44%) | (3,387 | ) | | — |
|
| Less unamortized debt issuance costs | (9,948 | ) | | (6,527 | ) |
| | $ | 461,665 |
| | $ | 339,473 |
|
| | | | | | | |
| Successor | | |
| December 31, 2020 | | |
| Convertible Notes | 132,763 | | | |
| Senior Secured Notes | 77,439 | | | |
Due to the application of fresh start accounting, our debt obligations were recognized at fair value on our consolidated balance sheet at the Fresh Start Reporting Date, as described further in Note 3, Fresh Start Accounting. Additionally, a portion of the fair value of our Convertible Notes is classified as equity, as described further below.
ABL Credit Facility
On the Effective Date, pursuant to the terms of the Plan, we entered into a senior secured asset-based revolving credit agreement in an aggregate amount of $75 million (the “ABL Credit Facility”) among us and substantially all of our domestic subsidiaries as borrowers (the “Borrowers”), the lenders party thereto and PNC Bank, National Association as administrative agent, and on August 7, 2020, we entered into a First Amendment to the ABL Credit Facility (together, herein referred to as the “ABL Credit Facility”) which, among other things, reduced the maximum amount of the revolving credit agreement to $40 million.
Among other things, proceeds of loans under the ABL Credit Facility may be used to finance ongoing working capital and general corporate needs.
The maturity date of loans made under the ABL Credit Facility is the earliest of 90 days prior to maturity of the Senior Secured Notes or the Convertible Notes (both of which are described further below) and May 29, 2025. Borrowings under the ABL Credit Facility will bear interest at a rate of (i) the LIBOR rate (subject to a floor of 0%) plus an applicable margin of 375 basis points per annum or (ii) the base rate plus an applicable margin of 275 basis points per annum.
The ABL Credit Facility is guaranteed by the Borrowers and is secured by a first lien on the Borrowers’ accounts receivable and inventory, and the cash proceeds thereof, and a second lien on substantially all of the other assets and properties of the Borrowers.
The ABL Credit Facility limits our annual capital expenditures to 125% of the budget set forth in the projections for any fiscal year and provides that if our availability plus pledged cash of up to $3 million falls below $6 million (15% of the maximum revolver amount), we will be required to comply with a fixed charge coverage ratio of 1.0 to 1.0, all of which is defined in the ABL Credit Facility. As of December 31, 2020, we had 0 borrowings and approximately $7.3 million in outstanding letters of credit under the ABL Credit Facility and subject to the availability requirements in the ABL Credit Facility, based on eligible accounts receivable and inventory balances at December 31, 2020, availability under the ABL Credit Facility was $15.9 million, which our access to would be subject to (i) our requirement to maintain 15% available or comply with a fixed charge coverage ratio, as described above and (ii) the requirement to maintain availability of at least $4.0 million, which may include up to $2.0 million of pledged cash.
Convertible Notes
We entered into an indenture, dated as of the Effective Date, among the Company and Wilmington Trust, N.A., as trustee (the “Convertible Notes Indenture”), and issued $129.8 million aggregate principal amount of convertible senior unsecured pay-in-kind notes due 2025 thereunder (the “Convertible Notes”). We received net issuance proceeds of $120.2 million, which was net of the $9.6 million Backstop Commitment Premium.
The Convertible Notes are general unsecured obligations which will mature on November 15, 2025, unless earlier accelerated, redeemed, converted or repurchased, and bear interest at a fixed rate of 5% per annum, which will be payable semi-annually on May 15 and November 15 in-kind in the form of an increase to the principal amount. The Convertible Notes are convertible at the option of the holders at any time into shares of our common stock and will convert mandatorily into our common stock at maturity; provided, however, that if the value of our common stock otherwise deliverable in connection with a mandatory conversion of a Convertible Note on the maturity date would be less than the principal amount of such Convertible Note plus accrued and unpaid interest, then the Convertible Note will
instead convert into an amount of cash equal to the principal amount thereof plus accrued and unpaid interest. The initial conversion rate is 75 shares of common stock per $1,000 principal amount of the Convertible Notes, which in aggregate represents 9,732,825 shares of common stock and an initial conversion price of $13.33 per share. The conversion rate is subject to customary anti-dilution adjustments.
If we undergo a “fundamental change” as defined in the Convertible Notes Indenture, subject to certain conditions, holders may require us to repurchase all or any portion of their Convertible Notes for cash at an amount equal to 100% of the principal amount of the Convertible Notes to be repurchased plus any accrued and unpaid interest. In the case of certain fundamental change events that constitute merger events (as defined in the Convertible Notes Indenture), we have a superseding right to cause the mandatory conversion of all or part of the Convertible Notes into a number of shares of common stock, per $1,000 principal amount of Convertible Notes, equal to the then-current conversion rate or the cash value of such number of shares of common stock (but not less than the principal amount).
Holders of Convertible Notes are entitled to vote on all matters on which holders of our common stock generally are entitled to vote (or, if any, to take action by written consent of the holders of our common stock), voting together as a single class together with the shares of our common stock and not as a separate class, on an as-converted basis, at any annual or special meeting of holders of our common stock and each holder is entitled to such number of votes as such holder would receive on an as-converted basis on the record date for such vote.
The Convertible Notes Indenture contains customary events of default and covenants that limit our ability and the ability of certain of our subsidiaries to incur, assume or guarantee additional indebtedness and create liens and enter into mergers or consolidations.
Because the Convertible Notes contain an embedded conversion option whereby they, or a portion of them, may be settled in cash, we have separately accounted for the liability and equity components of the Convertible Notes in accordance with the accounting requirements for convertible debt instruments set forth in ASC Topic 470-20, Debt with Conversion and Other Options. The initial fair value of the Convertible Notes was estimated in accordance with the application of Fresh Start Accounting, as described further in Note 3, Fresh Start Accounting. In order to allocate the initial fair value, we first calculated the value of the liability component by estimating the fair value for the debt instrument as if it did not contain a conversion feature. The amount by which the initial fair value of the Convertible Notes exceeded the estimated fair value of the liability component represented the estimated fair value of the equity component. We also allocated the debt issuance costs incurred to the liability and equity components, for which the portion attributable to the equity component is netted with the respective equity component in additional paid-in capital.
The below table summarizes the allocation of issuance proceeds, fair value and debt issuance costs to the liability and equity components of the Convertible Notes at the Fresh Start Reporting Date (in thousands):
| | | | | | | | | | | |
| Successor |
| Liability Component | Equity Component | Total |
| | | |
| Issuance proceeds, net of Backstop Commitment Premium | $ | 43,738 | | $ | 76,449 | | $ | 120,187 | |
| | | |
| Face value | 47,225 | | 82,546 | | 129,771 | |
| Issuance discount | 23,195 | | 40,542 | | 63,737 | |
| Fair value | $ | 70,420 | | $ | 123,088 | | $ | 193,508 | |
| Debt issuance costs | (1,268) | | (2,216) | | (3,484) | |
| Net carrying value at Fresh Start Reporting Date | $ | 69,152 | | $ | 120,872 | | $ | 190,024 | |
We treat the issuance of new Convertible Notes for the payment of in-kind interest as an issuance of a new instrument that retains the original economics associated with the conversion option at inception, and therefore, the Convertible Notes issued in payment of in-kind interest are accounted for with their separate equity and liability components that are proportionally the same as the original issuance.
Senior Secured Notes
We entered into an indenture, dated as of the Effective Date, among the Company, the subsidiary guarantors party thereto and Wilmington Trust, N.A., as trustee (the “Senior Secured Notes Indenture”), and issued $78.1 million aggregate principal amount of floating rate senior secured notes due 2025 (the “Senior Secured Notes”) thereunder. The Senior Secured Notes are guaranteed on a senior secured basis by substantially all of our existing domestic subsidiaries,
which also guarantee our obligations under the ABL Credit Facility, (the “Guarantors”) on a full and unconditional basis and are secured by a second lien on the accounts receivable and inventory and a first lien on substantially all of the other assets and properties (including the cash proceeds thereof) of the Company and the Guarantors. We received net issuance proceeds of $75 million, which was net of the original issue discount of $3.1 million.
The Senior Secured Notes will mature on May 15, 2025 and interest will accrue at the rate of LIBOR plus 9.5% per annum, with a LIBOR rate floor of 1.5%, payable quarterly in arrears on February 15, May 15, August 15 and November 15 of each year, commencing on August 15, 2020. With respect to any interest payment due on or prior to May 29, 2021, 50% of the interest will be payable in cash and 50% of the interest will be paid in-kind in the form of an increase to the principal amount; however, a majority in interest of the holders of the Senior Secured Notes may elect to have 100% of the interest due on or prior to May 29, 2021 payable in-kind. For all interest periods commencing on or after May 15, 2024, the interest rate for the Senior Secured Notes will be a rate equal to LIBOR plus 10.50%, with a LIBOR rate floor of 1.5%.
We may redeem all or part of the Senior Secured Notes on or after June 1, 2021 at redemption prices (expressed as percentages of the principal amount) equal to (i) 104% for the twelve-month period beginning on June 1, 2021; (ii) 102% for the twelve-month period beginning on June 1, 2022; (iii) 101% for the twelve-month period beginning on June 1, 2023 and (iv) 100% for the twelve-month period beginning June 1, 2024 and at any time thereafter, plus accrued and unpaid interest at the redemption date. Notwithstanding the foregoing, if a change of control (as defined in the Senior Secured Notes Indenture) occurs prior to June 1, 2022, we may elect to purchase all remaining outstanding Senior Secured Notes not tendered to us as described below at a redemption price equal to 103% of the principal amount thereof, plus accrued and unpaid interest, if any, thereon to the applicable redemption date. If a change of control (as defined in the Senior Secured Notes Indenture) occurs, holders of the Senior Secured Notes will have the right to require us to repurchase all or any part of their Senior Secured Notes at a purchase price equal to 101% of the aggregate principal amount of the Senior Secured Notes repurchased, plus accrued and unpaid interest, if any, to the repurchase date.
The Senior Secured Notes Indenture contains a minimum asset coverage ratio of 1.5 to 1.0 as of any June 30 or December 31, beginning December 31, 2020. The Senior Secured Notes Indenture provides for certain customary events of default and contains covenants that limit, among other things, our ability and the ability of certain of our subsidiaries, to incur, assume or guarantee additional indebtedness; pay dividends or distributions on capital stock or redeem or repurchase capital stock; make investments; repay junior debt; sell stock of our subsidiaries; transfer or sell assets; enter into sale and lease back transactions; create liens; enter into transactions with affiliates; and enter into mergers or consolidations.
Having completed qualifying asset sales in the aggregate of $7.6 million, we commenced and completed offers to purchase $2.6 million in aggregate principal amount of the Senior Secured Notes in October and December 2020 in accordance with the Senior Secured Notes Indenture, at a purchase price equal to 100% of the principal amount, plus accrued and unpaid interest through, but not including, the purchase date. We recognized loss on extinguishment of debt associated with these repayments of $0.2 million.
In December, we completed asset sales which required us to commence an offer to purchase another $0.2 million of Senior Secured Notes which is presented as a current liability in our consolidated balance sheet and for which the purchase will be funded through cash on hand, classified as “restricted cash” as of December 31, 2020. In January 2021, we completed additional qualifying asset sales totaling $0.5 million, and we completed an offer to purchase the aggregate $0.6 million principal amount of the Senior Secured Notes in February 2021, at a purchase price equal to 100% of the principal amount, plus accrued and unpaid interest.
Successor Debt Issuance Costs and Discount
Costs incurred in connection with the issuance of our Convertible Notes (which were allocated to the liability component, as described above) and Senior Secured Notes, as well as the issuance discounts, were capitalized and are being amortized using the effective interest method over the term of the related debt instrument. Costs incurred in connection with our ABL Credit Facility were capitalized and are being amortized using the straight-line method over the expected term of the agreement. Our unamortized debt issuance costs and discounts are presented below (amounts in thousands):
| | | | | |
| Successor |
| December 31, 2020 |
| |
| |
| Unamortized discount on Convertible Notes (based on imputed interest rate of 20.9%) | $ | 56,438 | |
| Unamortized discount on Senior Secured Notes (based on imputed interest rate of 13.2%) | 2,733 | |
| Unamortized debt issuance costs | 3,714 | |
Predecessor Senior Secured Term Loan
Our senior secured term loan (the “Term Loan”) entered into on November 8,in 2017 provided for one drawing in the amount of $175 million, net of a 2% original issue discount. Proceeds from the issuance of the Term Loan were used to repay the entire outstanding balance under our Revolving Credit Facility,previous credit facility, plus fees and accrued and unpaid interest, as well as the fees and expenses associated with entering into the Term Loan and Prepetition ABL Facility, which is further described below.Facility. The remainder of the proceeds are available to bewere used for other general corporate purposes.
The Term Loan is not subject to amortization payments of principal. Interest on the principal amount accruesaccrued at the LIBOR rate or the base rate as defined in the agreement, at our option, plus an applicable margin of 7.75% and 6.75%, respectively. The Term Loan iswas set to mature on November 8, 2022, or earlier, subject to certain circumstances as described in the agreement, and including an earlier maturity date if the outstanding balance of the Senior Notes exceeds $15.0 million on December 14, 2021, at which time the Term Loan would then mature. However, the Term Loan may be prepaid, at our option, at any time, in whole or in part, subject to a minimum of $5 million, and subject to a declining call premium as defined in the agreement.
The Term Loan contains a financial covenant requiring the ratio of (i) the net orderly liquidation value of our fixed assets (based on appraisals obtained as required by our lenders), on a consolidated basis, in which the lenders under the Term Loan maintain a first priority security interest, plus proceeds of asset dispositions not required to be used to effect a prepayment of the Term Loan to (ii) the outstanding principal amount of the Term Loan, to be at least equal to 1.50 to 1.00 as of any June 30 or December 31 of any calendar year through maturity.
The Term Loan contains customary mandatory prepayments from the proceeds of certain transactions including certain asset dispositions and debt issuances, and has additional customary restrictions that, among other things, and subject to certain exceptions, limit our ability to:
incur or permit liens on assets;
make investments and acquisitions;
consolidate or merge with another company;
engage in asset sales; and
pay dividends or make distributions.
In addition, the Term Loan contains customary events of default, upon the occurrence and during the continuation of any of which the applicable margin would increase by 2% per year, including without limitation:
payment defaults;
covenant defaults;
material breaches of representations or warranties;
event of default under, or acceleration of, other material indebtedness;
bankruptcy or insolvency;
material judgments against us;
failure of any security document supporting the Term Loan; and
change of control.
Our obligations under the Term Loan arewere guaranteed by our wholly-owned domestic subsidiaries, and are secured by substantially all of our domestic assets, in each case, subject to certain exceptions and permitted liens.liens, and were not subject to compromise as defined by ASC Topic 852, Reorganizations.
Prepetition Asset-based Lending Facility
In addition to enteringAt the same time as we entered into the Term Loan on November 8,in 2017, we also entered into a senior secured revolving asset-based credit facility (the “ABL“Prepetition ABL Facility”) providingwhich provided for borrowings in the aggregate principal amount of up to $75 million, subject to a borrowing base and including a $30 million sub-limit for letters of credit. TheAs a part of the Chapter 11 process, the Prepetition ABL Facility bears interest, at our option,was terminated at the LIBOR rate or the base rate as definedPetition Date and all remaining unamortized debt issuance costs were written off in the ABL Facility, plus an applicable margin ranging from 1.75% to 3.25%, based on average availability on the ABL Facility. The ABL Facility requires a commitment fee due monthly based on the average monthly unused amount of the commitments of the lenders, a fronting fee due for each letter of credit issued, and a monthly letter of credit fee due based on the average undrawn amount of letters of credit outstanding during such period. The ABL Facility is generally set to mature 90 days prior to the maturity of the Term Loan, subject to certain circumstances, including the future repayment, extinguishment or refinancing of our Term Loan and/or Senior Notes prior to their respective maturity dates. Availability under the ABL Facility will be determined by reference to a borrowing base as defined in the agreement, generally comprised of a percentage of our accounts receivable and inventory.March 2020.
We have not drawn upon the ABL Facility to date. As of December 31, 2017, we had $9.7 million in committed letters of credit, which, after borrowing base limitations, resulted in borrowing availability of $53.1 million. Borrowings available under the ABL Facility are available for general corporate purposes and there are no limitations on our ability to access the borrowing capacity provided there is no default and compliance with the covenants under the ABL Facility is maintained. Additionally, if our availability under the ABL Facility is less than 15% of the maximum amount, we are required to maintain a minimum fixed charge coverage ratio, as defined in the ABL Facility, of at least 1.00 to 1.00, measured on a trailing 12 month basis.
The ABL Facility also contains customary restrictive covenants which, subject to certain exceptions, limit, among other things, our ability to:
declare dividends and make other distributions;
issue or sell certain equity interests;
optionally prepay, redeem or repurchase certain of our subordinated indebtedness;
make loans or investments (including acquisitions);
incur additional indebtedness or modify the terms of permitted indebtedness;
change our business or the business of our subsidiaries;
merge, consolidate, reorganize, recapitalize, or reclassify our equity interests;
enter into certain types of transactions with affiliates.
Our obligations under the ABL Facility are guaranteed by us and our domestic subsidiaries, subject to certain exceptions, and are secured by (i) a first-priority perfected security interest in all inventory and cash, and (ii) a second-priority perfected security in substantially all of our tangible and intangible assets, in each case, subject to certain exceptions and permitted liens.
Predecessor Senior Notes
In 2014, we issued $300 million of unregistered senior notes at face value, with a coupon interest rate of 6.125% that arewere due in 2022 (the “Senior Notes”). The Senior Notes willwere set to mature on March 15, 2022 with interest due semi-annually in arrears on March 15 and September 15 of each year. We have the option to redeem the Senior Notes, in whole or in part, at any time on or after March 15, 2017 in each case at the redemption price specified in the Indenture dated March 18, 2014 (the “Indenture”) plus any accrued and unpaid interest and any additional interest (as defined in the Indenture) thereon to the date of redemption.
In accordance with a registration rights agreement with the holders of our Senior Notes, we filed an exchange offer registration statement on Form S-4 with the Securities and Exchange Commission that became effective on October 2, 2014. The exchange offer registration statement enabled the holders of our Senior Notes to exchange their senior notes for publicly registered notes with substantially identical terms. References to the “Senior Notes” herein include the senior notes issued in the exchange offer.
If we experience a change of control (as defined in the Indenture), we will be required to make an offer to each holder of the Senior Notes to repurchase all or any part of the Senior Notes at a purchase price equal to 101% of the principal amount of each Senior Note, plus accrued and unpaid interest, if any, to the date of repurchase. If we engage in certain asset sales, within 365 days of such sale we will be required to use the net cash proceeds from such sale, to the extent we do not reinvest those proceeds in our business, to make an offer to repurchase the Senior Notes at a price equal to 100% of the principal amount of each Senior Note, plus accrued and unpaid interest to the repurchase date.
The Indenture, among other things, limits us and certain of our subsidiaries, subject to certain exceptions, in our ability to:
pay dividends on stock, repurchase stock, redeem subordinated indebtedness or make other restricted payments and investments;
incur, assume or guarantee additional indebtedness or issue preferred or disqualified stock;
create liens on our or their assets;
enter into sale and leaseback transactions;
borrow, pay dividends, or transfer other assets from certain of our subsidiaries;
consolidate with or merge with or into, or sell all or substantially all of our properties to any other person;
enter into transactions with affiliates; and
enter into new lines of business.
The Senior Notes are not subject to any sinking fund requirements. The Senior Notes arewere fully and unconditionally guaranteed, jointly and severally, on a senior unsecured basis by certain of our existing domestic subsidiaries and by certain of our future domestic subsidiaries. (See Note 13, Guarantor/Non-Guarantor Condensed Consolidated Financial Statements.)
Senior Secured Revolving Credit Facility and Loss on Extinguishment of Debt
We hadAs a credit agreement, most recently amended on June 30, 2016, with Wells Fargo Bank, N.A. and a syndicate of lenders which provided for a senior secured revolving credit facility, with sub-limits for letters of credit and swing-line
loans, of up to an aggregate commitment amount of $150 million, all of which was set to mature in March 2019 (the “Revolving Credit Facility”). However, in connection with our entry into the Term Loan in November 2017, as described above, all indebtedness outstanding under the Revolving Credit Facility was repaid, together with related costs and expenses, and the Revolving Credit Facility was retired. In connection with the retirementresult of the Revolving Credit Facility in 2017, we recognized $1.5 million of loss on extinguishment of debt for the write off of the unamortized debt issuance costs, which were being amortized using the straight-line method over the term of the agreement. Additionally, during the years ended December 31, 2016 and 2015, we recognized $0.3 million and $2.2 million, respectively, of loss on extinguishment of debt for the reduction of borrowing capacity under our Revolving Credit Facility.
Debt Issuance Costs and Original Issue Discount
Costs incurred in connection with the issuance of our Senior Notes were capitalized and are being amortized using the effective interest method over the term ofChapter 11 Cases, the Senior Notes which matureceased accruing interest as of the Petition Date, in March 2022. The original issue discount and costs incurred in connectionaccordance with the issuance of the Term LoanPlan, and were capitalized and are being amortized using the effective interest method over the expected term of the agreement. Costs incurredsubsequently accounted for as liabilities subject to compromise in connectionaccordance with the ABL Facility were capitalized and are being amortized using the straight-line method over the expected term of the agreement.
4. Leases
We lease our corporate office facilities in San Antonio, Texas, and we lease real estate at 38 other locations, which are primarily used for field offices, storage and maintenance yards, and field personnel housing. We lease these properties, as well as office and other equipment, under non-cancelable operating leases, most of which contain renewal options and some of which contain escalation clauses. We recognize rent expense on a straight-line basis for our leases with escalating payments.
Rent expense under operating leases, including rental exit costs, was $4.8 million, $5.0 million and $6.2 million for the years ended December 31, 2017, 2016 and 2015, respectively. Future lease obligations required under non-cancelable operating leases as of December 31, 2017 were as follows (amounts in thousands):ASC Topic 852, Reorganizations.
|
| | | |
| Year ended December 31, | |
| 2018 | $ | 3,081 |
|
| 2019 | 2,273 |
|
| 2020 | 1,261 |
|
| 2021 | 818 |
|
| 2022 | 623 |
|
| Thereafter | 1,846 |
|
| | $ | 9,902 |
|
5.8. Income Taxes
The jurisdictional components of lossincome (loss) before income taxes consist of the following (amounts in thousands):
| | | | | | | | | | | | | | | | | | | | | | |
| Successor | | | Predecessor | | |
| | | | |
| | Seven Months Ended December 31, 2020 | | | Five Months Ended May 31, 2020 | | Year Ended December 31, 2019 | | |
| Domestic | $ | (36,216) | | | | $ | (98,773) | | | $ | (85,133) | | | |
| Foreign | (6,824) | | | | (7,238) | | | 11,900 | | | |
| Loss before income taxes | $ | (43,040) | | | | $ | (106,011) | | | $ | (73,233) | | | |
|
| | | | | | | | | | | |
| | Year ended December 31, |
| | 2017 | | 2016 | | 2015 |
| Domestic | $ | (76,078 | ) | | $ | (122,277 | ) | | $ | (123,499 | ) |
| Foreign | (3,243 | ) | | (16,846 | ) | | (69,220 | ) |
| Loss before income taxes | $ | (79,321 | ) | | $ | (139,123 | ) | | $ | (192,719 | ) |
The components of our income tax expense (benefit) consist of the following (amounts in thousands):
| | | | | | | | | | | | | | | | | | | | | | |
| Successor | | | Predecessor | | |
| | | | |
| Seven Months Ended December 31, 2020 | | | Five Months Ended May 31, 2020 | | Year Ended December 31, 2019 | | |
| Current: | | | | | | | | |
| Federal | $ | (55) | | | | $ | (67) | | | $ | (206) | | | |
| State | 88 | | | | 86 | | | 663 | | | |
| Foreign | 309 | | | | 189 | | | 654 | | | |
| 342 | | | | 208 | | | 1,111 | | | |
| Deferred: | | | | | | | | |
| | | | | | | | |
| State | (123) | | | | (3,347) | | | 729 | | | |
| Foreign | (3,035) | | | | 1,353 | | | (11,169) | | | |
| (3,158) | | | | (1,994) | | | (10,440) | | | |
| | | | | | | | |
| Income tax benefit | $ | (2,816) | | | | $ | (1,786) | | | $ | (9,329) | | | |
|
| | | | | | | | | | | |
| Year ended December 31, |
| 2017 | | 2016 | | 2015 |
| Current: | | | | | |
| Federal | $ | (81 | ) | | $ | (219 | ) | | $ | (535 | ) |
| State | 146 |
| | (95 | ) | | 401 |
|
| Foreign | 978 |
| | 1,189 |
| | 1,238 |
|
| | 1,043 |
| | 875 |
| | 1,104 |
|
| Deferred: | | | | | |
| Federal | (5,417 | ) | | (12,500 | ) | | (42,113 | ) |
| State | 143 |
| | 902 |
| | 29 |
|
| Foreign | 28 |
| | (9 | ) | | 3,401 |
|
| | (5,246 | ) | | (11,607 | ) | | (38,683 | ) |
| | | | | | |
| Income tax benefit | $ | (4,203 | ) | | $ | (10,732 | ) | | $ | (37,579 | ) |
The difference between the income tax benefit and the amount computed by applying the federal statutory income tax rate of 35%to loss before income taxes consists of the following (amounts in thousands):
| | | | | | | | | | | | | | | | | | | | | | |
| Successor | | | Predecessor | | |
| | | | |
| | Seven Months Ended December 31, 2020 | | | Five Months Ended May 31, 2020 | | Year Ended December 31, 2019 | | |
| Expected tax benefit | $ | (9,038) | | | | $ | (22,262) | | | $ | (15,379) | | | |
| Valuation allowance: | | | | | | | | |
| Valuation allowance | 2,579 | | | | 10,623 | | | 12,638 | | | |
| Reversal of valuation allowance on foreign operations | 0 | | | | 0 | | | (14,756) | | | |
| | | | | | | | |
| | | | | | | | |
| State income taxes | (28) | | | | 73 | | | 614 | | | |
| Foreign currency translation loss (gain) | (891) | | | | 1,579 | | | 742 | | | |
| Net tax benefits and nondeductible expenses in foreign jurisdictions | (227) | | | | (537) | | | 940 | | | |
| GILTI tax | 0 | | | | 0 | | | 1,579 | | | |
| Stock-based compensation | 0 | | | | 1,449 | | | 595 | | | |
| Compensation expense nondeductible for tax purposes | 784 | | | | 0 | | | 1,684 | | | |
| Reorganization and restructuring costs | 2,418 | | | | 7,528 | | | 1,388 | | | |
| Convertible Notes interest and issuance costs | 1,838 | | | | 0 | | | 0 | | | |
| Other nondeductible expenses for tax purposes | (4) | | | | 190 | | | 575 | | | |
| | | | | | | | |
| | | | | | | | |
| | | | | | | | |
| | | | | | | | |
| Other, net | (247) | | | | (429) | | | 51 | | | |
| Income tax benefit | $ | (2,816) | | | | $ | (1,786) | | | $ | (9,329) | | | |
|
| | | | | | | | | | | |
| | Year ended December 31, |
| | 2017 | | 2016 | | 2015 |
| Expected tax expense (benefit) | $ | (27,762 | ) | | $ | (48,693 | ) | | $ | (67,452 | ) |
| Valuation allowance: | | | | | |
| Valuation allowance on operations | 24,265 |
| | 38,324 |
| | 20,329 |
|
| Impact of Tax Reform Act on valuation allowance | (25,564 | ) | | — |
| | — |
|
| Change in tax rate | 20,147 |
| | 516 |
| | — |
|
| State income taxes | 339 |
| | (3,033 | ) | | (2,066 | ) |
| Foreign currency translation loss | 599 |
| | 838 |
| | 8,660 |
|
| Net tax benefits and nondeductible expenses in foreign jurisdictions | 1,493 |
| | 407 |
| | 2,135 |
|
| Incentive stock options | 1,297 |
| | 97 |
| | 83 |
|
| Nondeductible expenses for tax purposes | 796 |
| | 386 |
| | 577 |
|
| Expiration of capital loss | — |
| | 641 |
| | — |
|
| Other, net | 187 |
| | (215 | ) | | 155 |
|
| Income tax benefit | $ | (4,203 | ) | | $ | (10,732 | ) | | $ | (37,579 | ) |
Income tax expense (benefit) was allocated as follows (amounts in thousands):
|
| | | | | | | | | | | |
| | Year ended December 31, |
| | 2017 | | 2016 | | 2015 |
| Continuing operations | $ | (4,203 | ) | | $ | (10,732 | ) | | $ | (37,579 | ) |
| Shareholders’ equity | — |
| | 2,287 |
| | 962 |
|
| | $ | (4,203 | ) | | $ | (8,445 | ) | | $ | (36,617 | ) |
Deferred income taxes arise from temporary differences between the tax basis of assets and liabilities and their reported amounts in the consolidated financial statements. The components of our deferred income tax assets and liabilities were as follows (amounts in thousands):
| | | | | | | | | | | | | | |
| Successor | | | Predecessor |
| |
| December 31, 2020 | | | December 31, 2019 |
| Deferred tax assets: | | | | |
| Net operating loss carryforward | $ | 82,901 | | | | $ | 110,834 | |
| Intangibles | 7,653 | | | | 12,145 | |
| | | | |
| Interest expense deduction limitation carryforward | 3,200 | | | | 6,649 | |
| | | | |
| Employee stock-based compensation | 63 | | | | 3,124 | |
| Employee benefits and insurance claims accruals | 866 | | | | 2,422 | |
| Operating lease liabilities | 1,027 | | | | 1,832 | |
| Accounts receivable reserve | 278 | | | | 187 | |
| Inventory | 918 | | | | 202 | |
| Accrued expenses | 451 | | | | 233 | |
| Deferred revenue | 0 | | | | 124 | |
| | | | |
| 97,357 | | | | 137,752 | |
| Valuation allowance | (74,676) | | | | (59,842) | |
| | | | |
| | | | |
| Deferred tax liabilities: | | | | |
| Property and equipment | (9,816) | | | | (68,694) | |
| Operating lease assets | (998) | | | | (1,686) | |
| | | | |
| Unbilled revenue | (68) | | | | (407) | |
| | | | |
| | | | |
| Net deferred tax assets | $ | 11,799 | | | | $ | 7,123 | |
|
| | | | | | | |
| | Year ended December 31, |
| | 2017 | | 2016 |
| Deferred tax assets: | | | |
| Domestic net operating loss carryforward | $ | 94,598 |
| | $ | 122,769 |
|
| Foreign net operating loss carryforward | 11,619 |
| | 8,640 |
|
| Intangibles | 18,058 |
| | 33,722 |
|
| Property and equipment | 9,280 |
| | 11,809 |
|
| Employee benefits and insurance claims accruals | 5,652 |
| | 6,802 |
|
| Employee stock-based compensation | 3,753 |
| | 6,732 |
|
| Accounts receivable reserve | 284 |
| | 626 |
|
| Inventory | 295 |
| | 613 |
|
| Accrued expenses not deductible for tax purposes | — |
| | 232 |
|
| Accrued revenue not income for book purposes | 316 |
| | 277 |
|
| | 143,855 |
| | 192,222 |
|
| Valuation allowance | (59,766 | ) | | (57,820 | ) |
| | | | |
| Deferred tax liabilities: | | | |
| Accrued expenses not deductible for book purposes | (112 | ) | | — |
|
| Property and equipment | (87,128 | ) | | (142,582 | ) |
| Net deferred tax assets (liabilities) | $ | (3,151 | ) | | $ | (8,180 | ) |
AsUpon our emergence from Chapter 11, we underwent an ownership change, as defined in the IRC, which will result in future annual limitations on the usage of December 31,our remaining domestic net operating losses. The majority of our remaining domestic net operating losses will begin to expire in 2030, while losses generated after 2017 we had $106.2 millionare carried forward indefinitely but are limited in usage to 80% of deferred tax assets related to domestic andtaxable income beginning in 2021. The majority of our foreign net operating losses that are availablecarried forward indefinitely, but losses generated after 2016 are carried forward for 12 years and will begin to reduce future taxable income. In assessing the realizability of our deferred tax assets, we consider whetherexpire in 2029.
We provide a valuation allowance when it is more likely than not that some portion or all of theour deferred tax assets will not be realized. The ultimate realizationWe evaluated the impact of deferred tax assetsthe reorganization, including the change in control, resulting from our bankruptcy emergence and determined it is dependent upon the generation ofmore likely than not that we will not fully realize future taxable income during the periods in which those temporary differences become deductible.
In performing this analysis as of December 31, 2017 in accordance with ASC Topic 740, Income Taxes, we assessed the available positive and negative evidence to estimate whether sufficient future taxable income will be generated to permit the use of deferred tax assets. A significant piece of negative evidence evaluated is the cumulative loss incurred during previous years. Such negative evidence limits the ability to consider other positive evidence that is subjective, such as projections for taxable income in future years. Due to the downturn in our industry, we are in a net deferred tax asset position, and as a result, we recognized a benefit only to the extent that reversals of deferred income tax liabilities are expectedbenefits related to generate taxable income in each relevant jurisdiction in future periods which would offset our deferred tax assets.
Our domestic net operating losses have a 20 year carryforward period and can be used to offset future domestic taxable income until their expiration, beginning in 2030, with the latest expiration in 2037, while the majority of our foreign net operating losses (any generated prior to 2017) have an indefinite carryforward period. However, we have a valuation allowance that fully offsets our foreign and U.S. federal deferred tax assets as of December 31, 2017. We also have net operating loss carryforwards in many of the states that we operate in. Most of these are filed on a unitary or combined basis. These states have carryover periods between 5 and 20 years, with most being 15 or 20. We have determined that a valuation allowance should be recorded against some of the state benefits through December 31, 2017. The valuation allowance and the recent change in tax laws, as described further below, are the primary factors causing our effective tax rate to be significantly lower than the statutory rate of 35%. The amount of the deferred tax asset considered realizable, however, would increase if cumulative losses are no longer present and additional weight is given to subjective evidence in the form of projected future taxable income.
On December 22, 2017, the Tax Cuts and Jobs Act of 2017 (the “Tax Reform Act”) was enacted. The legislation significantly changes U.S. tax law by, among other things, permanently reducing the U.S. corporate income tax rate from a maximum of 35% to a flat rate of 21%, repealing the alternative minimum tax (AMT), implementing a territorial tax system and imposing a repatriation tax on deemed repatriated earnings of foreign subsidiaries.
As a result of the reduction in the U.S. corporate income tax rate, we revalued our ending net deferred tax assets at December 31, 2017based on the annual limitations that impact us, historical results, and recognized a $20.1 million tax expenseexpected market conditions known on the date of measurement.
On March 27, 2020, the Coronavirus Aid, Relief, and Economic Security Act (“CARES Act”) was enacted in 2017, which is fully offset by a $20.1 million reduction of the valuation allowance.
Dueresponse to the repealCOVID-19 pandemic. The CARES Act contains numerous corporate income tax provisions, some of the AMT, we have reduced the valuation allowance by $5.2 million to remove the effectswhich impact our calculation of AMT on the realizability of our deferred tax assets in future years. In addition, we reversed the valuation allowance on the AMT credit carryforward of $0.2 million that will now be refundable through 2021 and has been reclassified from a deferred tax asset to a non-current receivable.
The Tax Reform Act provides for a one-time deemed mandatory repatriation of post-1986 undistributed foreign subsidiary earnings and profits through the year ended December 31, 2017. We have an accumulated deficit from our foreign operations, and therefore we have not included any tax impacts for this provision.
To minimize tax base erosion with a territorial tax system, beginning in 2018, the Tax Reform Act provides for a new global intangible low-taxed income (GILTI) provision. Under the GILTI provision, certain foreign subsidiary earnings in excess of an allowable return on the foreign subsidiary’s tangible assets are included in U.S. taxable income. We expect to be subject to GILTI; however, the inclusion is expected to be offset by net operating loss carry forwards in the U.S. We are still evaluating, pending further interpretive guidance, whether to make a policy election to treat the GILTI tax as a period expense or to provide U.S. deferred taxes, on foreign temporary differences that are expected to generate GILTI income when they reverse in future years.
Given the significance of the legislation, the SEC staff issued Staff Accounting Bulletin No. 118 (SAB 118), which allows registrants to record provisional amounts during a one year “measurement period” similar to that used when accounting for business combinations. However, the measurement period is deemed to have ended earlier when the registrant has obtained, prepared and analyzed the information necessary to finalize its accounting. During the measurement period, impacts of the law are expected to be recorded at the time a reasonable estimate for all or a portion of the effects can be made, and provisional amounts can be recognized and adjusted as information becomes available, prepared or analyzed. SAB 118 summarizes a three-step process to be applied at each reporting period to account for and qualitatively disclose: (1) the effects of the change in tax law for which accounting is complete; (2) provisional amounts (or adjustments to provisional amounts)including providing for the effectscarryback of the tax law where accounting is not complete, but that a reasonable estimate has been determined; and (3) a reasonable estimate cannot yet be made and therefore taxes are reflected in accordance with law prior to the enactment of the Tax Reform Act.
Our accounting is complete for the year ended December 31, 2017 as related to the re-measurement of deferred taxes to the new tax rate of 21%, repeal of the AMT, and mandatory repatriation. We are awaiting further interpretive guidance regarding the possible application of deferred taxes to GILTI, and thus taxes are reflected in accordance with law prior to the enactment of the Tax Reform Act.
Other significant provisions that are not yet effective for the year ended December 31, 2017, but may impact income taxes in future years include a limitation on the current deductibility of net interest expense in excess of 30% of adjusted taxable income, and a limitation ofcertain net operating losses, generated after 2017modifications to 80%the net interest deduction limitations, refundable payroll tax credits, and deferment of taxable income.
Because weemployer social security payments. However, the provisions did not have an accumulated foreign deficit of $52.4 million at December 31, 2017, we have not recorded a tax liability from the mandatory repatriation provision of the Tax Reform Act. We do not intend to distribute earnings in a taxable manner, and therefore, we intend to limit any potential distributions to earnings previously taxed in the U.S., or earnings that would qualify for the 100% dividends received deduction provided for in the Tax Reform Act. As a result, we have not recognized a deferred tax liabilitymaterial impact on our investment in foreign subsidiaries.Predecessor or Successor financial statements.
On December 29, 2016, the Colombian government enacted a tax reform bill that eliminated the tax for equality (“CREE”), increased the general corporate tax rate from 25% to 40% in 2017, 37% in 2018, 33% in 2019 and created a new 5% dividend tax, among other things. Deferred tax assets and liabilities were adjusted to the new rates; however, the valuation allowance fully offset the impact to tax expense. A few other notable provisions include a shorter twelve-year carryforward period for net operating losses generated after 2016, a longer statute of limitations for returns filed after 2016 and annual limits on tax depreciation allowed.
We have no unrecognized tax benefits relating to ASC Topic 740 and no unrecognized tax benefit activity during the year ended December 31, 2017.
2020. We record interest and penalty expense related to income taxes as interest and other expense, respectively. At December 31, 2017,2020, no interest or penalties have been or are required to be accrued. Our open tax years are 20102017 and forward for our federal and most state income tax returns in the United States and 20122015 and forward for our income tax returns in Colombia. Net operating losses generated in years prior to our open years and carried forward are available for adjustment and subject to the statute of limitation provisions of such year when the net operating losses are utilized.
| |
6. | Fair Value of Financial Instruments |
On December 28, 2018, the Colombian government enacted a new tax reform bill that decreases the general corporate tax rate from 33% to 30% by 2022, phases out the presumptive tax system by 2021, increases withholding tax rates on payments abroad for various services, and taxes indirect transfers of Colombian assets, among other things. Deferred tax assets and liabilities were adjusted to the new tax rates as of December 31, 2018; however, the adjustments to the valuation allowance fully offset the impact to tax expense in the year of enactment.
On October 19, 2019, the Colombian Constitutional Court declared Colombia’s 2018 Tax Reform unconstitutional due to procedural flaws in the approval process. On December 27, 2019, Colombia re-enacted the tax reform effective January 1, 2020, mirroring most of the provisions contained in the 2018 Tax Reform that was ruled unconstitutional.
9. Fair Value of Financial Instruments
The FASB’s Accounting Standards Codification (ASC) Topic 820, Fair Value Measurements and Disclosures, defines fair value and provides a hierarchalhierarchical framework associated with the level of subjectivity used in measuring assets and liabilities at fair value. OurCurrently, our financial instruments consist primarily of cash and cash equivalents, trade and other receivables, trade payables phantom stock unit awards and long-term debt.
The carrying value of cash and cash equivalents, trade and other receivables, and trade payables are considered to be representative of their respective fair values due to the short-term nature of these instruments. At December 31, 2017As a result of the application of fresh start accounting, and December 31, 2016,subsequent stability in the aggregate estimated fair value of our phantom stock unit awards was $6.1 million and $7.0 million, respectively,market for whichenergy bonds, we estimate that the vested portion recognized as a liability in our consolidated balance sheets was $3.6 million and $2.0 million, respectively. The phantom stock unit awards, and the measurement of fair value for these awards, are described in more detail in Note 8, Equity Transactions and Stock-Based Compensation Plans.
The faircarrying value of our long-term debt approximates fair value.
10. Earnings (Loss) Per Common Share
Basic earnings (loss) per share (EPS) is estimated using a discounted cash flow analysis,computed by dividing net income (loss) by the weighted-average number of common shares outstanding during the period.
Diluted EPS is computed based on rates that we believe we would currently paythe sum of the weighted average number of common shares and potentially dilutive common shares outstanding during the period. Potentially dilutive common shares consist of shares issuable from stock-based compensation awards and the Convertible Notes. Potentially dilutive common shares from outstanding stock-based compensation awards are determined using the average share price for similar typeseach period under the treasury stock method. Potentially dilutive shares from the Convertible Notes are determined using the if-converted method, whereby the Convertible Notes are assumed to be converted and included in the denominator of debt instruments. This discounted cash flow analysisthe EPS calculation and the interest expense, net of tax, recorded in connection with the Convertible Notes is based on inputs defined by ASC Topic 820 as Level 2 inputs, which are observable inputs for similar types of debt instruments. The following table presents supplemental fair value information about our long-term debt at December 31, 2017 and December 31, 2016 (amounts in thousands):added back to net income (loss).
|
| | | | | | | | | | | | | | | |
| | December 31, 2017 | | December 31, 2016 |
| | Carrying Amount | | Fair Value | | Carrying Amount | | Fair Value |
| Total debt, net of discount and debt issuance costs | $ | 461,665 |
| | $ | 415,561 |
| | $ | 339,473 |
| | $ | 326,249 |
|
| |
7. | Earnings (Loss) Per Common Share |
The following table presents a reconciliation of the numerators and denominators of the basic earnings per share and diluted earnings per shareEPS computations (amounts in thousands, except per share data):
| | | | | | | | | | | | | | | | | | | | | | | | | | | |
| | | | Successor | | | Predecessor | | |
| | | | | | Seven Months Ended December 31, 2020 | | | Five Months Ended May 31, 2020 | | | Year Ended December 31, 2019 | | |
| Numerator: | | | | | | | | | | | | | |
| | | | | | | | | | | | | |
| | | | | | | | | | | | | |
| Net loss (numerator for basic EPS) | | | | | $ | (40,224) | | | | $ | (104,225) | | | | $ | (63,904) | | | |
| Interest expense on Convertible Notes, net of tax | | | | | 0 | | | | 0 | | | | 0 | | | |
| Numerator for diluted EPS, if-converted method | | | | | (40,224) | | | | (104,225) | | | | (63,904) | | | |
| | | | | | | | | | | | | |
| Denominator: | | | | | | | | | | | | | |
| Weighted-average shares (denominator for basic EPS) | | | | | 1,117 | | | | 78,968 | | | | 78,423 | | | |
| Potentially dilutive shares issuable from Convertible Notes, if-converted method | | | | | 0 | | | | 0 | | | | 0 | | | |
| Potentially dilutive shares issuable from outstanding stock-based compensation awards, treasury stock method | | | | | 0 | | | | 0 | | | | 0 | | | |
| Denominator for diluted EPS | | | | | 1,117 | | | | 78,968 | | | | 78,423 | | | |
| | | | | | | | | | | | | |
| | | | | | | | | | | | | |
| Loss per common share - Basic | | | | | $ | (36.01) | | | | $ | (1.32) | | | | $ | (0.81) | | | |
| Loss per common share - Diluted | | | | | $ | (36.01) | | | | $ | (1.32) | | | | $ | (0.81) | | | |
| Potentially dilutive securities excluded as anti-dilutive | | | | | 9,782 | | | | 4,517 | | | | 4,842 | | | |
| | | | | | | | | | | | | |
|
| | | | | | | | | | | |
| | Year ended December 31, |
| | 2017 | | 2016 | | 2015 |
| Numerator (both basic and diluted): | | | | | |
| Net loss | $ | (75,118 | ) | | $ | (128,391 | ) | | $ | (155,140 | ) |
| Denominator: | | | | | |
| Weighted-average shares (denominator for basic earnings (loss) per share) | 77,390 |
| | 65,452 |
| | 64,310 |
|
| Dilutive effect of outstanding stock options, restricted stock and restricted stock unit awards | — |
| | — |
| | — |
|
| Denominator for diluted earnings (loss) per share | 77,390 |
| | 65,452 |
| | 64,310 |
|
| Loss per common share - Basic | $ | (0.97 | ) | | $ | (1.96 | ) | | $ | (2.41 | ) |
| Loss per common share - Diluted | $ | (0.97 | ) | | $ | (1.96 | ) | | $ | (2.41 | ) |
| Potentially dilutive securities excluded as anti-dilutive | 5,116 |
| | 4,953 |
| | 4,832 |
|
8. Equity Transactions and11. Stock-Based Compensation Plans
Equity Transactions
On May 15, 2015, we filed a registration statement that permits us to sell equity or debt in one or more offerings up to a total dollar amount of $300 million. In December 2016, we sold 12,075,000 shares of common stock in a public offering and received proceeds of $65.4 million, net of underwriting discounts and offering expenses. As of December 31, 2017,
$234.6 million under the shelf registration statement is available for equity or debt offerings, subject to the limitations imposed by our Term Loan, ABL Facility and Senior Notes.
Stock-based Compensation Plans
We haveOur stock-based award plans that areplan is administered by the Compensation Committee of our Board of Directors, which selects persons eligible to receive awards and determines the number, terms, conditions, and other provisions of the awards.
At December 31, 2017, the total shares available for future grants to employees and directors under existing plans were 3,204,802, which excludes awards we grant in the form of phantom stock unit awards which are expected to be paid in cash. In January 2018, our Board of Directors approved the grant of the following awards:
|
| | | | |
| Vesting Period | | Number of Shares or Units |
Restricted stock unit awards | 3 years | | 788,377 |
Phantom stock unit awards | 39 months | | 1,188,216 |
|
We grant stock option and restricted stock awards with vesting based on time of service conditions. We grant restricted stock unit awards with vesting based on time of service conditions, and in certain cases, subject to performance and market conditions. We grant phantom stock unit awards with vesting based on time of service, performance and market conditions, which are classified as liability awards under ASC Topic 718, Compensation—Stock Compensation since we expect to settle the awards in cash when they become vested.
We recognize compensation cost for our stock-based compensation awards based on the fair value estimated in accordance with ASC Topic 718.718, Compensation—Stock Compensation, and we recognize forfeitures when they occur. For our awards with graded vesting, we recognize compensation expense on a straight-line basis over the service period for each separately vesting portion of the award as if the award was, in substance, multiple awards. We adopted ASU 2016-09 in the first quarter of 2017 and elected to prospectively recognize forfeitures when they occur, rather than estimating future forfeitures.
The following table summarizes theour stock-based compensation expense recognized, by award type, and the compensation expense (benefit) recognized for phantom stock unit awards during the years ended December 31, 2017, 2016 and 2015(amounts in thousands):
| | | | | | | | | | | | | | | | | | | | | | | | | | | |
| | | | | Successor | | | Predecessor | | |
| | | | | | | Seven Months Ended December 31, 2020 | | | Five Months Ended May 31, 2020 | | Year Ended December 31, 2019 | | |
| Stock option awards | | | | | | $ | 0 | | | | $ | 9 | | | $ | 137 | | | |
| Restricted stock awards | | | | | | 1,249 | | | | 202 | | | 504 | | | |
| Restricted stock unit awards | | | | | | 0 | | | | 341 | | | 2,129 | | | |
| | | | | | $ | 1,249 | | | | $ | 552 | | | $ | 2,770 | | | |
| | | | | | | | | | | | | |
| Phantom stock unit awards | | | | | | $ | 0 | | | | $ | 0 | | | $ | (112) | | | |
|
| | | | | | | | | | | |
| | Year ended December 31, |
| | 2017 | | 2016 | | 2015 |
| Stock option awards | $ | 974 |
| | $ | 766 |
| | $ | 923 |
|
| Restricted stock awards | 461 |
| | 421 |
| | 399 |
|
| Restricted stock unit awards | 2,914 |
| | 2,757 |
| | 2,307 |
|
| | $ | 4,349 |
| | $ | 3,944 |
| | $ | 3,629 |
|
| | | | | | |
| Phantom stock unit awards | $ | 1,609 |
| | $ | 1,971 |
| | $ | — |
|
The following table summarizesPrior to the unrecognized compensation cost (amounts in thousands) to be recognized and the weighted-average period remaining (in years) over which the compensation cost is expected to be recognized, by award type, as of December 31, 2017:
|
| | | | | |
| | Weighted-Average Period Remaining | | Unrecognized Compensation Cost |
| Stock options | 0.66 | | $ | 599 |
|
| Restricted stock awards | 0.38 | | 174 |
|
| Restricted stock unit awards | 1.32 | | 3,655 |
|
| Phantom stock unit awards | 1.33 | | 2,491 |
|
| |
| | $ | 6,919 |
|
Stock Options
We grantEffective Date, we had various outstanding stock option, restricted stock, and restricted stock unit (RSU) awards, as well as phantom stock unit awards which generally become exercisable overwere classified as liability awards under ASC Topic 718, Compensation—Stock Compensation. Certain of these awards were subject to performance and market conditions, and as a three-year periodresult, their fair values were measured using either the Black-Scholes pricing model or the Monte Carlo simulation model with inputs that are defined as Level 3 inputs under ASC Topic 820, Fair Value Measurements and expire ten years afterDisclosures. Upon our emergence from the date of grant. Our stock-basedChapter 11 Cases in May 2020, all unvested equity-based incentive compensation plans require that all stock option awards have an exercise price that is not less than the fair market valuevested in full and settled in shares of our new post-emergence common stock at the conversion rate of 0.0006849838 new shares for each existing share, resulting in $0.7 million of accelerated compensation expense which was included in
reorganization costs in the Predecessor period, as described further in Note 2, Emergence from Voluntary Reorganization under Chapter 11.
Successor Awards
Pursuant to the terms of the Plan, we adopted the Pioneer Energy Services Corp. 2020 Employee Incentive Plan (the “Employee Incentive Plan”) providing for the issuance from time to time, as approved by our new board of directors, of equity and equity-based awards with respect to the Common Stock in the aggregate and on a fully-diluted basis, of up to 1,198,074 shares of Common Stock, representing approximately 114% of the shares of Common Stock issued on the dateEffective Date, but representing 10% of grant. We issuethe shares of Common Stock issued on the Effective Date on a fully-diluted basis. The shares of Common Stock issued under the Employee Incentive Plan in the future will dilute all of the shares of Common Stock issued on the Effective Date and all shares of Common Stock issued upon conversion of the Convertible Notes equally.
In July 2020, we issued to our former Chief Executive Officer in connection with his resignation 90,000 shares of restricted stock, which vested immediately upon issuance and converted to shares of our common stock when vested stock option awards are exercised.
We estimate thewith an aggregate fair value of each option grant on the date of grant using a Black-Scholes option pricing model. The following table summarizes the assumptions used in the Black-Scholes option pricing model based on a weighted-average calculation for the options$1.0 million. In December 2020, we granted during the years ended December 31, 2017, 2016 and 2015:
|
| | | | | | | | |
| | Year ended December 31, |
| | 2017 | | 2016 | | 2015 |
| Expected volatility | 76 | % | | 70 | % | | 64 | % |
| Risk-free interest rates | 2.1 | % | | 1.5 | % | | 1.4 | % |
| Expected life in years | 5.86 |
| | 5.70 |
| | 5.52 |
|
| Grant-date fair value | $4.28 | | $0.80 | | $2.31 |
The assumptions used in the Black-Scholes option pricing model are based on multiple factors, including historical exercise patterns of homogeneous groups with respect to exercise and post-vesting employment termination behaviors, expected future exercising patterns for these same homogeneous groups and volatility of our stock price. As we have not declared dividends since we became a public company, we did not use a dividend yield. In each case, the actual value that will be realized, if any, will depend on the future performance of our common stock and overall stock market conditions. There is no assurance the value an optionee actually realizes will be at or near the value we have estimated using the Black-Scholes options-pricing model.
The following table summarizes our stock option activity from December 31, 2016 through December 31, 2017:
|
| | | | | | | |
| | Number of Shares | | Weighted-Average Exercise Price Per Share | | Weighted-Average Remaining Contract Term in Years | | Aggregate Intrinsic Value (in thousands)(1) |
| Outstanding stock options as of December 31, 2016 | 4,384,425 | | $7.42 | | | | |
| Granted | 268,185 | | 6.40 | | | | |
| Forfeited | (382,700) | | 13.82 | | | | |
| Outstanding stock options as of December 31, 2017 | 4,269,910 | | $6.78 | | 4.5 | | $1,576 |
| | | | | | | | |
| Stock options exercisable as of December 31, 2017 | 3,288,463 | | $7.90 | | 3.4 | | $525 |
| | | | | | | | |
| (1) Intrinsic value is the amount by which the market price of our common stock exceeds the exercise price of the stock options. |
The following table presents the aggregate intrinsic value of stock options exercised during the years ended December 31, 2017, 2016 and 2015 (amounts in thousands):
|
| | | | | | | | | | | |
| | Year ended December 31, |
| | 2017 | | 2016 | | 2015 |
| Aggregate intrinsic value of stock options exercised | $ | — |
| | $ | 12 |
| | $ | 361 |
|
The following table summarizes our nonvested stock option activity from December 31, 2016 through December 31, 2017:
|
| | | |
| | Number of Shares | | Weighted-Average Grant-Date Fair Value Per Share |
| Nonvested stock options as of December 31, 2016 | 1,186,917 | | $1.29 |
| Granted | 268,185 | | 4.28 |
| Vested | (473,655) | | 1.69 |
| Nonvested stock options as of December 31, 2017 | 981,447 | | $1.91 |
Restricted Stock
We grant509,039 restricted stock awards, thatwhich will vest over a one-year period with a fair value based on the closing price of our common stock on the date of the grant.three-year period. When restricted stock awards are granted, or when restricted stock unit awards are converted to restricted stock, shares of our common stock are considered issued, but subject to certain restrictions.
The following table presents the weighted-average grant-date fair value per share of restricted stock awards granted and the aggregate fair value of restricted stock awards vested during the years ended December 31, 2017, 2016 and 2015:
|
| | | | | | | | | | | |
| | Year ended December 31, |
| | 2017 | | 2016 | | 2015 |
| Grant-date fair value (per share) | $ | 2.75 |
| | $ | 2.76 |
| | $ | 7.40 |
|
| Aggregate fair value of awards vested (in thousands) | $ | 483 |
| | $ | 137 |
| | $ | 368 |
|
The following table summarizes our restricted stock activity from December 31, 2016 through December 31, 2017:
|
| | | |
| | Number of Shares | | Weighted-Average Grant-Date Fair Value per Share |
| Nonvested restricted stock as of December 31, 2016 | 166,664 | | $2.76 |
| Granted | 167,272 | | 2.75 |
| Vested | (166,664) | | 2.76 |
| Nonvested restricted stock as of December 31, 2017 | 167,272 | | $2.75 |
Restricted Stock Units
We grant restricted stock unit awards with vesting based on time of service conditions only (“time-based RSUs”), and we grant restricted stock unit awards with vesting based on time of service, which are also subject to performance and market conditions (“performance-based RSUs”). Shares of our common stock are issued to recipients of restricted stock units only when they have satisfied the applicable vesting conditions. Our time-based RSUs generally vest over a three-yearSuccessor period with fair valueswas $10.81, based on the closing price of our common stock on the date of grant. Our performance-based RSUs generally cliff vest after 39 months from the date of grant and are granted at a target number of issuable shares, for which the final number of shares of common stock is adjusted based on our actual achievement levels that are measured against predetermined performance conditions. The number of shares of common stock awarded will be based upon the Company’s achievement in certain performance conditions, as compared to a predefined peer group, over the performance period, generally three years.
Approximately half of the performance-based RSUs outstanding are subject to a market condition based on relative total shareholder return, as compared to that of our predetermined peer group, and therefore the fair value of these awards is measuredestimated by third-party specialists using a Monte Carlo simulation model. Compensation expense for equity awardsdiscounted cash flow model with a market condition is reduced only for actual forfeitures; no adjustment to expense is otherwise made, regardless of the number of shares issued. The remaining performance-based RSUs are subject to performance conditions, based on our EBITDA and EBITDA return on capital employed, relative to our predetermined peer group, and therefore the fair value is based on the closing price of our common stock on the date of grant, applied to the estimated number of shares that will be awarded. Compensation expense ultimately recognized for awards with performance conditions will be equal to the fair value of the restricted stock unit award based on the actual outcome of the service and performance conditions.
In April 2017, we determined that 121% of the target number of shares granted during 2014 were actually earned based on the Company’s achievement of the performance measures as described above, resulting in an increase of 54,429 shares being issued. As of December 31, 2017, we estimate that the weighted average achievement level for our outstanding performance-based RSUs granted in 2015 and 2017 will be approximately 100% of the predetermined performance conditions.
The following table summarizes our restricted stock unit activity from December 31, 2016 through December 31, 2017:
|
| | | | | | | | | | | |
| | Time-Based Award | | Performance-Based Award |
| | Number of Time-Based Award Units | | Weighted-Average Grant-Date Fair Value per Unit | | Number of Performance-Based Award Units | | Weighted-Average
Grant-Date
Fair Value
per Unit |
Nonvested restricted stock units as of
December 31, 2016 | 397,790 |
| | $3.45 | | 685,817 |
| | $7.28 |
| Granted | 96,728 |
| | 5.61 | | 563,469 |
| | 7.75 |
|
| Achieved performance adjustment | — |
| | — |
| | 54,429 |
| | 9.66 |
|
| Vested | (202,387) |
| | 4.90 | | (317,598 | ) | | 9.66 |
|
| Forfeited | (40,245) |
| | 2.66 | | — |
| | — |
|
Nonvested restricted stock units as of
December 31, 2017 | 251,886 |
| | $3.24 | | 986,117 |
| | $6.91 |
The following table presents the weighted-average grant-date fair value per share of restricted stock units granted and the aggregate intrinsic value of restricted stock units vested (converted) during the years ended December 31, 2017, 2016 and 2015:
|
| | | | | | | | | | | |
| | Year ended December 31, |
| | 2017 | | 2016 | | 2015 |
| Time-based RSUs: | | | | | |
| Grant-date fair value of awards granted (per share) | $ | 5.61 |
| | $ | 1.47 |
| | $ | 4.08 |
|
| Aggregate intrinsic value of awards vested (in thousands) | $ | 1,206 |
| | $ | 314 |
| | $ | 1,575 |
|
| Performance-based RSUs: | | | | | |
| Grant-date fair value of awards granted (per share) | $ | 7.75 |
| | $ | — |
| | $ | 6.66 |
|
| Aggregate intrinsic value of awards vested (in thousands) | $ | 969 |
| | $ | 609 |
| | $ | 1,402 |
|
Phantom Stock Unit Awards
In 2016, we granted 1,268,068 phantom stock unit awards with a weighted-average grant-date fair value of $1.35 per share. These awards cliff-vest after 39 months from the date of grant, with vesting based on time of service, performance and market conditions. The number of units ultimately awarded will be based upon the Company’s achievement in certain performance conditions, as compared to a predefined peer group, over the three-year performance period, and each unit awarded will entitle the employee to a cash payment equal to the stock price of our common stock on the date of vesting, subject to a maximum of $8.08 (which is four times the stock price on the date of grant).
The fair value of these awards is measured using inputs that are defined as Level 3 inputs under ASC Topic 820, Fair Value Measurements and Disclosures. Half of the phantom stock unit awards granted are subject to a market condition based on relative total shareholder return, as compared to that of our predetermined peer group, and therefore the fair value of these awards is measured using a Monte Carlo simulation model. The remaining phantom stock unit awards are subject to performance conditions, based on our EBITDA and EBITDA return on capital employed, relative to our predetermined peer group, and the fair value of these awards is measured using a Black-Scholes pricing model. As of December 31, 2017, our achievement level for2020, the awards granted during 2016 is estimatedaggregate unrecognized compensation cost to be approximately 150%.recognized for our outstanding awards is $5.2 million with a weighted-average period remaining of 1.9 years.
These awards are classified as liability awards under ASC Topic 718, Compensation—Stock Compensation, because we expect to settle the awards in cash when they vest, and are remeasured at fair value at the end of each reporting period until they vest. The change in fair value is recognized as a current period compensation expense in our statement of operations. Therefore, changes in the inputs used to measure fair value can result in volatility in our compensation expense. This volatility increases as the phantom stock awards approach the vesting date. We estimate that a hypothetical increase of $1 in the market price of our common stock as ofAt December 31, 2017, if all other inputs2020, the total shares available for future grants to employees and directors under the Employee Incentive Plan were unchanged, would result in an increase in cumulative compensation expense of $0.9 million, which represents the hypothetical increase in fair value of the liability which would be recognized as compensation expense in our statement of operations.599,035.
9.12. Employee Benefit Plans and Insurance
We maintain a 401(k) retirement plan for our eligible employees. Under this plan, we may make a matching contribution, on a discretionary basis, equal to a percentage of each eligible employee’s annual contribution, which we determine annually. Our matching contributions for the years ended December 31, 2017, 2016 and 2015 were $3.1 million, $0.3 million and $4.2 million, respectively. In an effort to reduce costs in response to the downturn in our industry, we suspended matching contributions were suspended from February 2016July 2020 to January 2017.2021. Our matching contributions were as follows (amounts in thousands):
| | | | | | | | | | | | | | | | | | | | | | | | | | |
| | | | | Successor | | | Predecessor | | |
| | | | | | |
| | | | | | Seven Months Ended December 31, 2020 | | | Five Months Ended May 31, 2020 | | Year Ended December 31, 2019 | | |
| Matching contributions | | | | | $ | 114 | | | | $ | 1,473 | | | $ | 5,277 | | | |
We use a combination of self-insurance and third-party insurance for various types of coverage. We are self-insured for up to $500,000 per incident for all workers’ compensation claims submitted by employees for on-the-job injuries. We accrue our workers’ compensation claim cost estimates using an actuarial calculation that is based on industry and our company’s historical claim development data, and we accrue the cost of administrative services associated with claims processing. We maintain a self-insurance program for major medical and hospitalization coverage for employees and their dependents, which is partially funded by employee payroll deductions. We have a maximum health insurance liability of $225,000 per covered individual per year, while amounts in excess of this maximum are covered under a separate policy provided by an insurance company. We have provided for reported claims costs as well as incurred but not reported medical costs in the accompanying consolidated balance sheets. We have a maximumdeductible of $250,000 per occurrence under our auto liability insurance, and we have a $500,000 self-insured retention and an additional aggregate deductible of $200,000 per covered individual per year. Amounts in$500,000 under our general liability insurance as well as an annual aggregate deductible of $1,000,000 on the first layer of excess of the stated maximum are covered under a separate policy provided by an insurance company. coverage.
Accrued insurance premiums and deductibles included $2.0 million forrelated to our estimate of incurred but unpaid costs related to the self-insurance portion of our health insurance at both December 31, 2017 and 2016.
We are self-insured for up to $500,000 per incident for all workers’ compensation claims submitted by employees for on-the-job injuries. We accrue our workers’ compensation claim cost estimates based on historical claims development data and we accrue the cost of administrative services associated with claims processing. We also have a deductible of $250,000 per occurrence under both our general liability insurance and auto liability insurance. Accrued insurance premiums and deductibles at December 31, 2017 and 2016 include $4.6 million and $4.4 million, respectively, for our estimate of costs
relative to the self-insured portion of costs associated with our health, workers’ compensation, general liability and auto liability insurance. insurance are as follows (amounts in thousands):
| | | | | | | | | | | | | | |
| Successor | | | Predecessor |
| |
| December 31, 2020 | | | December 31, 2019 |
| Workers’ compensation | $ | 1,976 | | | | $ | 3,269 | |
| Health insurance | 646 | | | | 1,282 | |
| General liability and auto liability | 1,306 | | | | 1,389 | |
| $ | 3,928 | | | | $ | 5,940 | |
Based upon our past experience, management believes that we have adequately provided for potential losses. However, future multiple occurrences of serious injuries to employees could have a material adverse effect on our financial position and results of operations.
We revisedOur insurance recoveries receivables and our reportable business segmentsaccrued liability for insurance claims and settlements represent our estimate of claims in excess of our deductible, which are covered and managed by our third-party insurance providers, some of which may ultimately be settled by the insurance provider in the long-term. These are presented in our consolidated balance sheets as current due to the uncertainty in the timing of the fourth quarterreporting and payment of 2017, which now include fiveclaims.
13. Segment Information
As of December 31, 2020, we have 4 operating segments, comprised of two2 drilling services business segments (domestic and international drilling) and three2 production services business segments (well servicing and wireline services and coiled tubing services). We revised our segments to reflect changes in, which reflects the basis used by management in making decisions regarding our business for resource allocation and performance assessment. These changes reflect our current operating focusassessment, as is required by ASC Topic 280, Segment Reporting. The followingIn April 2020, we closed our coiled tubing services business and placed all of our coiled tubing services assets as held for sale at June 30, 2020. Historical financial information for our coiled tubing services business, which had previously been presented as a separate operating segment, continues to be presented in the following tables as a component of and for the years ended December 31, 2017, 2016, and 2015 have been restated to reflect this change.continuing operations.
Our domestic and international drilling services segments provide contract land drilling services to a diverse group of exploration and production companies through our four3 drilling divisions in the US and internationally in Colombia. In addition to our drilling rigs, weWe provide a comprehensive service offering which includes the drilling rig, crews, supplies, and most of the ancillary equipment needed to operate our drilling rigs.
Our well servicing wireline services and coiled tubingwireline services segments provide a range of production services to a diverse group of exploration and production companies, with our operations concentratedproducers primarily in Texas, North Dakota, the major domestic onshore oil and gas producing regions in the Mid-Continent and Rocky Mountain statesregion, and Louisiana. Our former coiled tubing services segment also provided various production services primarily in the Gulf Coast, both onshoreTexas, Wyoming, and offshore.surrounding areas.
The following table setstables set forth certain financial information for each of our segments and corporate (amounts in thousands):
| | | | As of and for the year ended December 31, | | | | | | | | | | | | | | | | | | | |
| | 2017 | | 2016 | | 2015 | | | Successor | | | Predecessor | |
| | | | | | | | | Seven Months Ended December 31, 2020 | | | Five Months Ended May 31, 2020 | | Year Ended December 31, 2019 | |
| Revenues: | | | | | | Revenues: | | | | | | | | |
| Domestic drilling | $ | 129,276 |
| | $ | 112,399 |
| | $ | 205,440 |
| Domestic drilling | | $ | 44,205 | | | | $ | 53,341 | | | $ | 151,769 | | |
| International drilling | 41,349 |
| | 6,808 |
| | 43,878 |
| International drilling | | 12,220 | | | | 15,928 | | | 88,932 | | |
| Drilling services | 170,625 |
| | 119,207 |
| | 249,318 |
| Drilling services | | 56,425 | | | | 69,269 | | | 240,701 | | |
| Well servicing | 77,257 |
| | 71,491 |
| | 133,440 |
| Well servicing | | 30,739 | | | | 31,947 | | | 115,715 | | |
| Wireline services | 163,716 |
| | 67,419 |
| | 120,387 |
| Wireline services | | 16,710 | | | | 35,543 | | | 172,931 | | |
| Coiled tubing services | 34,857 |
| | 18,959 |
| | 37,633 |
| Coiled tubing services | | 0 | | | | 5,611 | | | 46,445 | | |
| Production services | 275,830 |
| | 157,869 |
| | 291,460 |
| Production services | | 47,449 | | | | 73,101 | | | 335,091 | | |
| Consolidated revenues | $ | 446,455 |
| | $ | 277,076 |
| | $ | 540,778 |
| Consolidated revenues | | $ | 103,874 | | | | $ | 142,370 | | | $ | 575,792 | | |
| | | | | | | | | | | | | | | |
| Operating costs: | | | | | | |
| Domestic drilling | $ | 83,122 |
| | $ | 63,686 |
| | $ | 108,602 |
| |
| International drilling | 31,994 |
| | 9,465 |
| | 35,594 |
| |
| Drilling services | 115,116 |
| | 73,151 |
| | 144,196 |
| |
| Well servicing | 56,379 |
| | 53,208 |
| | 91,125 |
| |
| Wireline services | 128,137 |
| | 57,634 |
| | 88,848 |
| |
| Coiled tubing services | 31,248 |
| | 19,956 |
| | 33,847 |
| |
| Production services | 215,764 |
| | 130,798 |
| | 213,820 |
| |
| Consolidated operating costs | $ | 330,880 |
| | $ | 203,949 |
| | $ | 358,016 |
| |
| | | | | | | |
| Gross margin: | | | | | | |
| Domestic drilling | $ | 46,154 |
| | $ | 48,713 |
| | $ | 96,838 |
| |
| International drilling | 9,355 |
| | (2,657 | ) | | 8,284 |
| |
| Drilling services | 55,509 |
| | 46,056 |
| | 105,122 |
| |
| Well servicing | 20,878 |
| | 18,283 |
| | 42,315 |
| |
| Wireline services | 35,579 |
| | 9,785 |
| | 31,539 |
| |
| Coiled tubing services | 3,609 |
| | (997 | ) | | 3,786 |
| |
| Production services | 60,066 |
| | 27,071 |
| | 77,640 |
| |
| Consolidated gross margin | $ | 115,575 |
| | $ | 73,127 |
| | $ | 182,762 |
| |
| | | | | | | |
| | | | | | | | | | | Successor | | | Predecessor | |
| | As of and for the year ended December 31, | | | Seven Months Ended December 31, 2020 | | | Five Months Ended May 31, 2020 | | Year Ended December 31, 2019 | |
| Operating costs: | | Operating costs: | | | | | |
| Domestic drilling | | Domestic drilling | | $ | 26,846 | | | | $ | 33,101 | | | $ | 92,183 | | |
| International drilling | | International drilling | | 9,529 | | | | 13,676 | | | 65,007 | | |
| Drilling services | | Drilling services | | 36,375 | | | | 46,777 | | | 157,190 | | |
| Well servicing | | Well servicing | | 24,325 | | | | 26,877 | | | 83,461 | | |
| Wireline services | | Wireline services | | 17,090 | | | | 31,836 | | | 151,145 | | |
| Coiled tubing services | | Coiled tubing services | | 408 | | | | 8,557 | | | 39,557 | | |
| Production services | | Production services | | 41,823 | | | | 67,270 | | | 274,163 | | |
| Consolidated operating costs | | Consolidated operating costs | | $ | 78,198 | | | | $ | 114,047 | | | $ | 431,353 | | |
| | 2017 | | 2016 | | 2015 | | | | | | | | | |
| Gross margin: | | Gross margin: | | | | | |
| Domestic drilling | | Domestic drilling | | $ | 17,359 | | | | $ | 20,240 | | | $ | 59,586 | | |
| International drilling | | International drilling | | 2,691 | | | | 2,252 | | | 23,925 | | |
| Drilling services | | Drilling services | | 20,050 | | | | 22,492 | | | 83,511 | | |
| Well servicing | | Well servicing | | 6,414 | | | | 5,070 | | | 32,254 | | |
| Wireline services | | Wireline services | | (380) | | | | 3,707 | | | 21,786 | | |
| Coiled tubing services | | Coiled tubing services | | (408) | | | | (2,946) | | | 6,888 | | |
| Production services | | Production services | | 5,626 | | | | 5,831 | | | 60,928 | | |
| Consolidated gross margin | | Consolidated gross margin | | $ | 25,676 | | | | $ | 28,323 | | | $ | 144,439 | | |
| | | | | | | | | | | | | | | |
| Identifiable Assets: | | | | | | Identifiable Assets: | | | | | |
| Domestic drilling | $ | 404,144 |
| | $ | 415,953 |
| | $ | 463,618 |
| |
International drilling (1) | 36,403 |
| | 36,337 |
| | 54,590 |
| |
Domestic drilling (1) | | Domestic drilling (1) | | $ | 145,916 | | | | $ | 158,283 | | | $ | 347,036 | | |
International drilling (1) (2) | | International drilling (1) (2) | | 44,229 | | | | 49,611 | | | 60,026 | | |
| Drilling services | 440,547 |
| | 452,290 |
| | 518,208 |
| Drilling services | | 190,145 | | | | 207,894 | | | 407,062 | | |
| Well servicing | 125,951 |
| | 126,917 |
| | 155,421 |
| Well servicing | | 44,138 | | | | 49,388 | | | 116,473 | | |
| Wireline services | 92,081 |
| | 80,502 |
| | 94,777 |
| Wireline services | | 21,182 | | | | 23,948 | | | 71,887 | | |
| Coiled tubing services | 30,254 |
| | 26,062 |
| | 31,332 |
| Coiled tubing services | | 3,491 | | | | 6,336 | | | 30,834 | | |
| Production services | 248,286 |
| | 233,481 |
| | 281,530 |
| Production services | | 68,811 | | | | 79,672 | | | 219,194 | | |
| Corporate | 78,036 |
| | 14,331 |
| | 22,237 |
| Corporate | | 55,474 | | | | 65,057 | | | 47,698 | | |
| Consolidated identifiable assets | $ | 766,869 |
| | $ | 700,102 |
| | $ | 821,975 |
| Consolidated identifiable assets | | $ | 314,430 | | | | $ | 352,623 | | | $ | 673,954 | | |
| | | | | | | | | | | | | | | |
| Depreciation and Amortization: | | | | | | |
| Depreciation and amortization: | | Depreciation and amortization: | | | | | |
| Domestic drilling | $ | 45,243 |
| | $ | 53,900 |
| | $ | 68,651 |
| Domestic drilling | | $ | 14,363 | | | | $ | 18,058 | | | $ | 43,162 | | |
| International drilling | 5,718 |
| | 6,869 |
| | 11,614 |
| International drilling | | 7,575 | | | | 2,144 | | | 5,665 | | |
| Drilling services | 50,961 |
| | 60,769 |
| | 80,265 |
| Drilling services | | 21,938 | | | | 20,202 | | | 48,827 | | |
| Well servicing | 19,943 |
| | 22,925 |
| | 25,810 |
| Well servicing | | 8,023 | | | | 7,820 | | | 19,894 | | |
| Wireline services | 18,451 |
| | 20,707 |
| | 26,837 |
| Wireline services | | 3,320 | | | | 5,088 | | | 14,772 | | |
| Coiled tubing services | 8,181 |
| | 8,661 |
| | 16,688 |
| Coiled tubing services | | 0 | | | | 2,164 | | | 6,447 | | |
| Production services | 46,575 |
| | 52,293 |
| | 69,335 |
| Production services | | 11,343 | | | | 15,072 | | | 41,113 | | |
| Corporate | 1,241 |
| | 1,250 |
| | 1,339 |
| Corporate | | 332 | | | | 373 | | | 944 | | |
| Consolidated depreciation and amortization | $ | 98,777 |
| | $ | 114,312 |
| | $ | 150,939 |
| |
| Consolidated depreciation | | Consolidated depreciation | | $ | 33,613 | | | | $ | 35,647 | | | $ | 90,884 | | |
| | | | | | | | | | | | | |
| Capital Expenditures: | | | | | | Capital Expenditures: | | | | | |
| Domestic drilling | $ | 19,219 |
| | $ | 19,118 |
| | $ | 111,839 |
| Domestic drilling | | $ | 4,327 | | | | $ | 3,862 | | | $ | 17,889 | | |
| International drilling | 6,319 |
| | 678 |
| | 1,221 |
| International drilling | | 474 | | | | 1,273 | | | 4,812 | | |
| Drilling services | 25,538 |
| | 19,796 |
| | 113,060 |
| Drilling services | | 4,801 | | | | 5,135 | | | 22,701 | | |
| Well servicing | 17,776 |
| | 5,274 |
| | 15,716 |
| Well servicing | | 649 | | | | 1,918 | | | 10,185 | | |
| Wireline services | 11,883 |
| | 3,499 |
| | 9,101 |
| Wireline services | | 320 | | | | 1,684 | | | 5,907 | | |
| Coiled tubing services | 5,496 |
| | 3,548 |
| | 4,411 |
| Coiled tubing services | | 0 | | | | 166 | | | 4,736 | | |
| Production services | 35,155 |
| | 12,321 |
| | 29,228 |
| Production services | | 969 | | | | 3,768 | | | 20,828 | | |
| Corporate | 754 |
| | 439 |
| | 619 |
| Corporate | | 0 | | | | 21 | | | 1,300 | | |
| Consolidated capital expenditures | $ | 61,447 |
| | $ | 32,556 |
| | $ | 142,907 |
| Consolidated capital expenditures | | $ | 5,770 | | | | $ | 8,924 | | | $ | 44,829 | | |
(1) Identifiable assets for our drilling segments include the impact of a $28.4 million and $36.1 million intercompany balance, as of December 31, 2020 and 2019, respectively, between our domestic drilling segment (intercompany receivable) and our
international operations in Colombiadrilling segment (intercompany payable).
(2) Identifiable assets for our international drilling segment include five5 drilling rigs that are owned by our Colombia subsidiary and three3 drilling rigs that are owned by one of our domestic subsidiaries and leased to our Colombia subsidiary.
The following table reconciles theis a reconciliation of consolidated gross margin of our segments reported above to loss from operations as reported on the consolidated statements of operations (amounts in thousands):
| | | | | | | | | | | | | | | | | | | | | | | | | | | |
| | | Successor | | | Predecessor | | |
| | | | | Seven Months Ended December 31, 2020 | | | Five Months Ended May 31, 2020 | | | Year Ended December 31, 2019 | | |
| Consolidated gross margin | | | | | $ | 25,676 | | | | $ | 28,323 | | | | $ | 144,439 | | | |
| Depreciation and amortization | | | | | (33,613) | | | | (35,647) | | | | (90,884) | | | |
| General and administrative | | | | | (24,055) | | | | (22,047) | | | | (91,185) | | | |
| Prepetition restructuring charges | | | | | 0 | | | | (16,822) | | | | 0 | | | |
| Impairment | | | | | (742) | | | | (17,853) | | | | (2,667) | | | |
| Bad debt (expense) recovery, net | | | | | 227 | | | | (1,209) | | | | 79 | | | |
| Gain on dispositions of property and equipment, net | | | | | 6,132 | | | | 989 | | | | 4,513 | | | |
| | | | | | | | | | | | | |
| | | | | | | | | | | | | |
| Loss from operations | | | | | $ | (26,375) | | | | $ | (64,266) | | | | $ | (35,705) | | | |
14. Commitments and Contingencies
|
| | | | | | | | | | | |
| | Year ended December 31, |
| | 2017 | | 2016 | | 2015 |
| Consolidated gross margin | $ | 115,575 |
| | $ | 73,127 |
| | $ | 182,762 |
|
| Depreciation and amortization | (98,777 | ) | | (114,312 | ) | | (150,939 | ) |
| General and administrative | (69,681 | ) | | (61,184 | ) | | (73,903 | ) |
| Bad debt (expense) recovery | (53 | ) | | (156 | ) | | 188 |
|
| Impairment | (1,902 | ) | | (12,815 | ) | | (129,152 | ) |
| Gain on dispositions of property and equipment, net | 3,608 |
| | 1,892 |
| | 4,344 |
|
| Loss from operations | $ | (51,230 | ) | | $ | (113,448 | ) | | $ | (166,700 | ) |
| |
11. | Commitments and Contingencies
|
In connection with our operations in Colombia, our foreign subsidiaries have obtainedroutinely obtain bonds for bidding on drilling contracts, performing under drilling contracts, and remitting customs and importation duties. We have guaranteed paymentsBased on historical experience and information currently available, we believe the likelihood of $59.2 million relating to our performancedemand for payment under these bonds asand guarantees is remote.
In February 2021, we received a $2.5 million assessment from the Colombian tax and customs authority related to an administrative delay in documentation provided for one of December 31, 2017.our drilling rigs. After evaluating the assessment with our customs advisors, we do not believe that it is probable that we will be required to pay the customs duty assessment.
We are currently undergoingroutinely subject to various states’ sales and use tax audits for multi-year periods and we are working to resolve all relevant issues.audits. As of December 31, 20172020 and December 31, 2016,2019, our accrued liability was $1.2$0.9 million and $0.6$2.0 million,, respectively, based on our estimate of the salesindirect tax obligations. During 2020, we finalized a number of audits with the state of Texas and usedirectly paid the amount of additional tax obligations that are expected to result from these audits.due, resulting in a reduction of our accrued liability. Due to the inherent uncertainty of the audit process, we believe that it is reasonably possible that we may incur additional tax assessments with respect to one or more of thepotential audits in excess of the amount accrued. We believe that such an outcome would not have a material adverse effect on our results of operations or financial position. Because certainposition, but because of these audits are in a preliminary stage,the aforementioned uncertainty, an estimate of the possible loss or range of loss from an adverse result in all or substantially all of these casesaudit results cannot reasonably be made.
Due to the nature of our business, we are, from time to time, involved in litigation or subject to disputes or claims related to our business activities, including workers’ compensation claims and employment-related disputes. Legal costs relating to these matters are expensed as incurred. In the opinion of our management, none of the pending litigation, disputes or claims against us will have a material adverse effect on our financial condition, results of operations or cash flow from operations.
12. Quarterly Results of Operations (unaudited)
The following table summarizes quarterly financial data for the years ended December 31, 2017 and 2016 (in thousands, except per share data):
|
| | | | | | | | | | | | | | | | | | | |
| | First Quarter | | Second Quarter | | Third Quarter | | Fourth Quarter | | Total |
| Year ended December 31, 2017 | | | | | | | | | |
| Revenues | $ | 95,757 |
| | $ | 107,130 |
| | $ | 117,281 |
| | $ | 126,287 |
| | $ | 446,455 |
|
| Loss from operations | (18,873 | ) | | (12,729 | ) | | (10,892 | ) | | (8,736 | ) | | (51,230 | ) |
| Income tax benefit (expense) | (48 | ) | | (1,135 | ) | | (17 | ) | | 5,403 |
| | 4,203 |
|
| Net loss | (25,124 | ) | | (20,209 | ) | | (17,227 | ) | | (12,558 | ) | | (75,118 | ) |
| Loss per share: | | | | | | | | | |
| Basic | $ | (0.33 | ) | | $ | (0.26 | ) | | $ | (0.22 | ) | | $ | (0.16 | ) | | $ | (0.97 | ) |
| Diluted | $ | (0.33 | ) | | $ | (0.26 | ) | | $ | (0.22 | ) | | $ | (0.16 | ) | | $ | (0.97 | ) |
| | | | | | | | | | |
| Year ended December 31, 2016 | | | | | | | | | |
| Revenues | $ | 74,952 |
| | $ | 62,290 |
| | $ | 68,353 |
| | $ | 71,481 |
| | $ | 277,076 |
|
| Loss from operations | (23,014 | ) | | (26,025 | ) | | (29,885 | ) | | (34,524 | ) | | (113,448 | ) |
| Income tax benefit | 1,958 |
| | 1,990 |
| | 1,698 |
| | 5,086 |
| | 10,732 |
|
| Net loss | (27,699 | ) | | (29,991 | ) | | (34,620 | ) | | (36,081 | ) | | (128,391 | ) |
| Loss per share: | | | | | | | | | |
| Basic | $ | (0.43 | ) | | $ | (0.46 | ) | | $ | (0.53 | ) | | $ | (0.53 | ) | | $ | (1.96 | ) |
| Diluted | $ | (0.43 | ) | | $ | (0.46 | ) | | $ | (0.53 | ) | | $ | (0.53 | ) | | $ | (1.96 | ) |
| |
13. | Guarantor/Non-Guarantor Condensed Consolidating Financial Statements
|
Our Senior Notes are fully and unconditionally guaranteed, jointly and severally, on a senior unsecured basis by all existing 100% owned domestic subsidiaries, except for Pioneer Services Holdings, LLC. The subsidiaries that generally operate our non-U.S. business concentrated in Colombia do not guarantee our Senior Notes. The non-guarantor subsidiaries do not have any payment obligations under the Senior Notes, the guarantees or the Indenture.
In the event of a bankruptcy, liquidation or reorganization of any non-guarantor subsidiary, such non-guarantor subsidiary will pay the holders of its debt and other liabilities, including its trade creditors, before it will be able to distribute any of its assets to us. In the future, any non-U.S. subsidiaries, immaterial subsidiaries and subsidiaries that we designate as unrestricted subsidiaries under the Indenture will not guarantee the Senior Notes. As of December 31, 2017, there were no restrictions on the ability of subsidiary guarantors to transfer funds to the parent company.
As a result of the guarantee arrangements, we are presenting the following condensed consolidating balance sheets, statements of operations and statements of cash flows of the issuer, the guarantor subsidiaries and the non-guarantor subsidiaries.
CONDENSED CONSOLIDATING BALANCE SHEETS
(in thousands)
|
| | | | | | | | | | | | | | | | | | | |
| | December 31, 2017 |
| | Parent | | Guarantor Subsidiaries | | Non-Guarantor Subsidiaries | | Eliminations | | Consolidated |
| ASSETS | | | | | | | | | |
| Current assets: | | | | | | | | | |
| Cash and cash equivalents | $ | 72,258 |
| | $ | (1,881 | ) | | $ | 3,263 |
| | $ | — |
| | $ | 73,640 |
|
| Restricted cash | 2,008 |
| | — |
| | — |
| | — |
| | 2,008 |
|
| Receivables, net of allowance | 7 |
| | 93,866 |
| | 19,174 |
| | (42 | ) | | 113,005 |
|
| Intercompany receivable (payable) | (24,836 | ) | | 51,532 |
| | (26,696 | ) | | — |
| | — |
|
| Inventory | — |
| | 7,741 |
| | 6,316 |
| | — |
| | 14,057 |
|
| Assets held for sale | — |
| | 6,620 |
| | — |
| | — |
| | 6,620 |
|
| Prepaid expenses and other current assets | 1,238 |
| | 3,193 |
| | 1,798 |
| | — |
| | 6,229 |
|
| Total current assets | 50,675 |
| | 161,071 |
| | 3,855 |
| | (42 | ) | | 215,559 |
|
| Net property and equipment | 2,011 |
| | 521,080 |
| | 26,532 |
| | — |
| | 549,623 |
|
| Investment in subsidiaries | 596,927 |
| | 20,095 |
| | — |
| | (617,022 | ) | | — |
|
| Deferred income taxes | 38,028 |
| | — |
| | — |
| | (38,028 | ) | | — |
|
| Other long-term assets | 496 |
| | 788 |
| | 403 |
| | — |
| | 1,687 |
|
| Total assets | $ | 688,137 |
| | $ | 703,034 |
| | $ | 30,790 |
| | $ | (655,092 | ) | | $ | 766,869 |
|
| LIABILITIES AND SHAREHOLDERS’ EQUITY | | | | | | | | | |
| Current liabilities: | | | | | | | | | |
| Accounts payable | $ | 286 |
| | $ | 24,174 |
| | $ | 5,078 |
| | $ | — |
| | $ | 29,538 |
|
| Deferred revenues | — |
| | 97 |
| | 808 |
| | — |
| | 905 |
|
| Accrued expenses | 12,504 |
| | 37,814 |
| | 4,195 |
| | (42 | ) | | 54,471 |
|
| Total current liabilities | 12,790 |
| | 62,085 |
| | 10,081 |
| | (42 | ) | | 84,914 |
|
| Long-term debt, less unamortized discount and debt issuance costs | 461,665 |
| | — |
| | — |
| | — |
| | 461,665 |
|
| Deferred income taxes | — |
| | 41,179 |
| | — |
| | (38,028 | ) | | 3,151 |
|
| Other long-term liabilities | 3,586 |
| | 2,843 |
| | 614 |
| | — |
| | 7,043 |
|
| Total liabilities | 478,041 |
| | 106,107 |
| | 10,695 |
| | (38,070 | ) | | 556,773 |
|
| Total shareholders’ equity | 210,096 |
| | 596,927 |
| | 20,095 |
| | (617,022 | ) | | 210,096 |
|
| Total liabilities and shareholders’ equity | $ | 688,137 |
| | $ | 703,034 |
| | $ | 30,790 |
| | $ | (655,092 | ) | | $ | 766,869 |
|
| | | | | | | | | | |
| | December 31, 2016 |
| | Parent | | Guarantor Subsidiaries | | Non-Guarantor Subsidiaries | | Eliminations | | Consolidated |
| ASSETS | | | | | | | | | |
| Current assets: | | | | | | | | | |
| Cash and cash equivalents | $ | 9,898 |
| | $ | (764 | ) | | $ | 1,060 |
| | $ | — |
| | $ | 10,194 |
|
| Receivables, net of allowance | 480 |
| | 64,946 |
| | 7,210 |
| | (513 | ) | | 72,123 |
|
| Intercompany receivable (payable) | (24,836 | ) | | 35,427 |
| | (10,591 | ) | | — |
| | — |
|
| Inventory | — |
| | 5,659 |
| | 4,001 |
| | — |
| | 9,660 |
|
| Assets held for sale | — |
| | 15,035 |
| | 58 |
| | — |
| | 15,093 |
|
| Prepaid expenses and other current assets | 1,280 |
| | 4,014 |
| | 1,632 |
| | — |
| | 6,926 |
|
| Total current assets | (13,178 | ) | | 124,317 |
| | 3,370 |
| | (513 | ) | | 113,996 |
|
| Net property and equipment | 2,501 |
| | 556,062 |
| | 25,517 |
| | — |
| | 584,080 |
|
| Investment in subsidiaries | 577,965 |
| | 24,270 |
| | — |
| | (602,235 | ) | | — |
|
| Deferred income taxes | 65,041 |
| | — |
| | — |
| | (65,041 | ) | | — |
|
| Other long-term assets | 583 |
| | 1,029 |
| | 414 |
| | — |
| | 2,026 |
|
| Total assets | $ | 632,912 |
| | $ | 705,678 |
| | $ | 29,301 |
| | $ | (667,789 | ) | | $ | 700,102 |
|
| LIABILITIES AND SHAREHOLDERS’ EQUITY | | | | | | | | | |
| Current liabilities: | | | | | | | | | |
| Accounts payable | $ | 546 |
| | $ | 16,317 |
| | $ | 2,345 |
| | $ | — |
| | $ | 19,208 |
|
| Deferred revenues | — |
| | 680 |
| | 769 |
| | — |
| | 1,449 |
|
| Accrued expenses | 9,316 |
| | 34,765 |
| | 1,777 |
| | (513 | ) | | 45,345 |
|
| Total current liabilities | 9,862 |
| | 51,762 |
| | 4,891 |
| | (513 | ) | | 66,002 |
|
| Long-term debt, less unamortized discount and debt issuance costs | 339,473 |
| | — |
| | — |
| | — |
| | 339,473 |
|
| Deferred income taxes | — |
| | 73,249 |
| | (28 | ) | | (65,041 | ) | | 8,180 |
|
| Other long-term liabilities | 2,179 |
| | 2,702 |
| | 168 |
| | — |
| | 5,049 |
|
| Total liabilities | 351,514 |
| | 127,713 |
| | 5,031 |
| | (65,554 | ) | | 418,704 |
|
| Total shareholders’ equity | 281,398 |
| | 577,965 |
| | 24,270 |
| | (602,235 | ) | | 281,398 |
|
| Total liabilities and shareholders’ equity | $ | 632,912 |
| | $ | 705,678 |
| | $ | 29,301 |
| | $ | (667,789 | ) | | $ | 700,102 |
|
CONDENSED CONSOLIDATING STATEMENTS OF OPERATIONS
(in thousands)
|
| | | | | | | | | | | | | | | | | | | |
| | Year ended December 31, 2017 |
| | Parent | | Guarantor Subsidiaries | | Non-Guarantor Subsidiaries | | Eliminations | | Consolidated |
| Revenues | $ | — |
| | $ | 405,106 |
| | $ | 41,349 |
| | $ | — |
| | $ | 446,455 |
|
| Costs and expenses: | | | | | | | | | |
| Operating costs | — |
| | 298,898 |
| | 31,982 |
| | — |
| | 330,880 |
|
| Depreciation and amortization | 1,242 |
| | 91,817 |
| | 5,718 |
| | — |
| | 98,777 |
|
| General and administrative | 22,869 |
| | 45,387 |
| | 1,922 |
| | (497 | ) | | 69,681 |
|
| Bad debt expense | — |
| | 53 |
| | — |
| | — |
| | 53 |
|
| Impairment | — |
| | 1,902 |
| | — |
| | — |
| | 1,902 |
|
| Gain (loss) on dispositions of property and equipment, net | 2 |
| | (3,454 | ) | | (156 | ) | | — |
| | (3,608 | ) |
| Intercompany leasing | — |
| | (4,860 | ) | | 4,860 |
| | — |
| | — |
|
| Total costs and expenses | 24,113 |
| | 429,743 |
| | 44,326 |
| | (497 | ) | | 497,685 |
|
| Income (loss) from operations | (24,113 | ) | | (24,637 | ) | | (2,977 | ) | | 497 |
| | (51,230 | ) |
| Other income (expense): | | | | | | | | | |
| Equity in earnings of subsidiaries | 4,317 |
| | (3,936 | ) | | — |
| | (381 | ) | | — |
|
| Interest expense, net of interest capitalized | (27,061 | ) | | 20 |
| | 2 |
| | — |
| | (27,039 | ) |
| Loss on extinguishment of debt | (1,476 | ) | | — |
| | — |
| | — |
| | (1,476 | ) |
| Other income (expense), net | 54 |
| | 896 |
| | (29 | ) | | (497 | ) | | 424 |
|
| Total other (expense) income | (24,166 | ) | | (3,020 | ) | | (27 | ) | | (878 | ) | | (28,091 | ) |
| Income (loss) before income taxes | (48,279 | ) | | (27,657 | ) | | (3,004 | ) | | (381 | ) | | (79,321 | ) |
Income tax (expense) benefit 1 | (26,839 | ) | | 31,974 |
| | (932 | ) | | — |
| | 4,203 |
|
| Net income (loss) | $ | (75,118 | ) | | $ | 4,317 |
| | $ | (3,936 | ) | | $ | (381 | ) | | $ | (75,118 | ) |
| | | | | | | | | | |
| | Year ended December 31, 2016 |
| | Parent | | Guarantor Subsidiaries | | Non-Guarantor Subsidiaries | | Eliminations | | Consolidated |
| Revenues | $ | — |
| | $ | 270,268 |
| | $ | 6,808 |
| | $ | — |
| | $ | 277,076 |
|
| Costs and expenses: | | | | | | | | | |
| Operating costs | — |
| | 194,515 |
| | 9,434 |
| | — |
| | 203,949 |
|
| Depreciation and amortization | 1,250 |
| | 106,193 |
| | 6,869 |
| | — |
| | 114,312 |
|
| General and administrative | 21,657 |
| | 38,564 |
| | 1,515 |
| | (552 | ) | | 61,184 |
|
| Bad debt expense | — |
| | 156 |
| | — |
| | — |
| | 156 |
|
| Impairment | — |
| | 12,260 |
| | 555 |
| | — |
| | 12,815 |
|
| Gain on dispositions of property and equipment, net | — |
| | (1,838 | ) | | (54 | ) | | — |
| | (1,892 | ) |
| Intercompany leasing | — |
| | (4,860 | ) | | 4,860 |
| | — |
| | — |
|
| Total costs and expenses | 22,907 |
| | 344,990 |
| | 23,179 |
| | (552 | ) | | 390,524 |
|
| Income (loss) from operations | (22,907 | ) | | (74,722 | ) | | (16,371 | ) | | 552 |
| | (113,448 | ) |
| Other income (expense): | | | | | | | | | |
| Equity in earnings of subsidiaries | (63,374 | ) | | (17,835 | ) | | — |
| | 81,209 |
| | — |
|
| Interest expense, net of interest capitalized | (25,845 | ) | | (88 | ) | | (1 | ) | | — |
| | (25,934 | ) |
| Loss on extinguishment of debt | (299 | ) | | — |
| | — |
| | — |
| | (299 | ) |
| Other income (expense), net | 18 |
| | 1,430 |
| | (338 | ) | | (552 | ) | | 558 |
|
| Total other (expense) income | (89,500 | ) | | (16,493 | ) | | (339 | ) | | 80,657 |
| | (25,675 | ) |
| Income (loss) before income taxes | (112,407 | ) | | (91,215 | ) | | (16,710 | ) | | 81,209 |
| | (139,123 | ) |
Income tax (expense) benefit 1 | (15,984 | ) | | 27,841 |
| | (1,125 | ) | | — |
| | 10,732 |
|
| Net income (loss) | $ | (128,391 | ) | | $ | (63,374 | ) | | $ | (17,835 | ) | | $ | 81,209 |
| | $ | (128,391 | ) |
| | | | | | | | | | |
1 The income tax expense (benefit) reflected in each column does not include any tax effect of the equity in earnings (losses) of subsidiaries. |
CONDENSED CONSOLIDATING STATEMENTS OF OPERATIONS
(Continued)
(in thousands)
|
| | | | | | | | | | | | | | | | | | | |
| | Year ended December 31, 2015 |
| | Parent | | Guarantor
Subsidiaries | | Non-Guarantor
Subsidiaries | | Eliminations | | Consolidated |
| Revenues | $ | — |
| | $ | 496,900 |
| | $ | 43,878 |
| | $ | — |
| | $ | 540,778 |
|
| Costs and expenses: | | | | | | | | | |
| Operating costs | — |
| | 322,458 |
| | 35,558 |
| | — |
| | 358,016 |
|
| Depreciation and amortization | 1,338 |
| | 137,987 |
| | 11,614 |
| | — |
| | 150,939 |
|
| General and administrative | 21,515 |
| | 50,710 |
| | 2,230 |
| | (552 | ) | | 73,903 |
|
| Bad debt expense (recovery) | — |
| | 571 |
| | (759 | ) | | — |
| | (188 | ) |
| Impairment | — |
| | 73,270 |
| | 56,632 |
| | (750 | ) | | 129,152 |
|
| Gain (loss) on dispositions of property and equipment, net | 117 |
| | (4,350 | ) | | (111 | ) | | — |
| | (4,344 | ) |
| Intercompany leasing | — |
| | (4,860 | ) | | 4,860 |
| | — |
| | — |
|
| Total costs and expenses | 22,970 |
| | 575,786 |
| | 110,024 |
| | (1,302 | ) | | 707,478 |
|
| Income (loss) from operations | (22,970 | ) | | (78,886 | ) | | (66,146 | ) | | 1,302 |
| | (166,700 | ) |
| Other income (expense): | | | | | | | | | |
| Equity in earnings of subsidiaries | (126,553 | ) | | (74,459 | ) | | — |
| | 201,012 |
| | — |
|
| Interest expense, net of interest capitalized | (21,128 | ) | | (117 | ) | | 23 |
| | — |
| | (21,222 | ) |
| Loss on extinguishment of debt | (2,186 | ) | | — |
| | — |
| | — |
| | (2,186 | ) |
| Other income (expense), net | 6 |
| | 1,687 |
| | (3,752 | ) | | (552 | ) | | (2,611 | ) |
| Total other (expense) income | (149,861 | ) | | (72,889 | ) | | (3,729 | ) | | 200,460 |
| | (26,019 | ) |
| Income (loss) before income taxes | (172,831 | ) | | (151,775 | ) | | (69,875 | ) | | 201,762 |
| | (192,719 | ) |
Income tax (expense) benefit 1 | 16,941 |
| | 25,222 |
| | (4,584 | ) | | — |
| | 37,579 |
|
| Net income (loss) | $ | (155,890 | ) | | $ | (126,553 | ) | | $ | (74,459 | ) | | $ | 201,762 |
| | $ | (155,140 | ) |
| | | | | | | | | | |
1 The income tax expense (benefit) reflected in each column does not include any tax effect of the equity in earnings (losses) of subsidiaries. |
CONDENSED CONSOLIDATING STATEMENTS OF CASH FLOWS
(in thousands)
|
| | | | | | | | | | | | | | | | | | | |
| | Year ended December 31, 2017 |
| | Parent | | Guarantor Subsidiaries | | Non-Guarantor Subsidiaries | | Eliminations | | Consolidated |
| Cash flows from operating activities | $ | (40,068 | ) | | $ | 25,492 |
| | $ | 8,759 |
| | $ | — |
| | $ | (5,817 | ) |
| | | | | | | | | | |
| Cash flows from investing activities: | | | | | | | | | |
| Purchases of property and equipment | (745 | ) | | (56,556 | ) | | (6,407 | ) | | 431 |
| | (63,277 | ) |
| Proceeds from sale of property and equipment | — |
| | 12,768 |
| | 232 |
| | (431 | ) | | 12,569 |
|
| Proceeds from insurance recoveries | — |
| | 3,344 |
| | — |
| | — |
| | 3,344 |
|
| | (745 | ) | | (40,444 | ) | | (6,175 | ) | | — |
| | (47,364 | ) |
| | | | | | | | | | |
| Cash flows from financing activities: | | | | | | | | | |
| Debt repayments | (120,000 | ) | | — |
| | — |
| | — |
| | (120,000 | ) |
| Proceeds from issuance of debt | 245,500 |
| | — |
| | — |
| | — |
| | 245,500 |
|
| Debt issuance costs | (6,332 | ) | | — |
| | — |
| | — |
| | (6,332 | ) |
| Purchase of treasury stock | (533 | ) | | — |
| | — |
| | — |
| | (533 | ) |
| Intercompany contributions/distributions | (13,454 | ) | | 13,835 |
| | (381 | ) | | — |
| | — |
|
| | 105,181 |
| | 13,835 |
| | (381 | ) | | — |
| | 118,635 |
|
| | | | | | | | | | |
| Net increase (decrease) in cash, cash equivalents and restricted cash | 64,368 |
| | (1,117 | ) | | 2,203 |
| | — |
| | 65,454 |
|
| Beginning cash, cash equivalents and restricted cash | 9,898 |
| | (764 | ) | | 1,060 |
| | — |
| | 10,194 |
|
| Ending cash, cash equivalents and restricted cash | $ | 74,266 |
| | $ | (1,881 | ) | | $ | 3,263 |
| | $ | — |
| | $ | 75,648 |
|
| | | | | | | | | | |
| | Year ended December 31, 2016 |
| | Parent | | Guarantor Subsidiaries | | Non-Guarantor Subsidiaries | | Eliminations | | Consolidated |
| Cash flows from operating activities | $ | (39,344 | ) | | $ | 45,035 |
| | $ | (560 | ) | | $ | — |
| | $ | 5,131 |
|
| | | | | | | | | | |
| Cash flows from investing activities: | | | | | | | | | |
| Purchases of property and equipment | (452 | ) | | (31,049 | ) | | (880 | ) | | — |
| | (32,381 | ) |
| Proceeds from sale of property and equipment | — |
| | 7,523 |
| | 54 |
| | — |
| | 7,577 |
|
| Proceeds from insurance recoveries | — |
| | 37 |
| | — |
| | — |
| | 37 |
|
| | (452 | ) | | (23,489 | ) | | (826 | ) | | — |
| | (24,767 | ) |
| | | | | | | | | | |
| Cash flows from financing activities: | | | | | | | | | |
| Debt repayments | (71,000 | ) | | — |
| | — |
| | — |
| | (71,000 | ) |
| Proceeds from issuance of debt | 22,000 |
| | — |
| | — |
| | — |
| | 22,000 |
|
| Debt issuance costs | (819 | ) | | — |
| | — |
| | — |
| | (819 | ) |
| Proceeds from exercise of options | 183 |
| | — |
| | — |
| | — |
| | 183 |
|
| Proceeds from common stock, net of offering costs | 65,430 |
| | — |
| |
|
| | — |
| | 65,430 |
|
| Purchase of treasury stock | (124 | ) | | — |
| | — |
| | — |
| | (124 | ) |
| Intercompany contributions/distributions | 16,803 |
| | (16,698 | ) | | (105 | ) | | — |
| | — |
|
| | 32,473 |
| | (16,698 | ) | | (105 | ) | | — |
| | 15,670 |
|
| | | | | | | | | | |
| Net increase (decrease) in cash and cash equivalents | (7,323 | ) | | 4,848 |
| | (1,491 | ) | | — |
| | (3,966 | ) |
| Beginning cash and cash equivalents | 17,221 |
| | (5,612 | ) | | 2,551 |
| | — |
| | 14,160 |
|
| Ending cash and cash equivalents | $ | 9,898 |
| | $ | (764 | ) | | $ | 1,060 |
| | $ | — |
| | $ | 10,194 |
|
| | |
CONDENSED CONSOLIDATING STATEMENTS OF CASH FLOWS
(Continued)
(in thousands)
|
| | | | | | | | | | | | | | | | | | | |
| | Year ended December 31, 2015 |
| | Parent | | Guarantor Subsidiaries | | Non-Guarantor Subsidiaries | | Eliminations | | Consolidated |
| Cash flows from operating activities | $ | 4,067 |
| | $ | 147,643 |
| | $ | (8,991 | ) | | $ | — |
| | $ | 142,719 |
|
| | | | | | | | | | |
| Cash flows from investing activities: | | | | | | | | | |
| Purchases of property and equipment | (663 | ) | | (157,336 | ) | | (1,885 | ) | | 269 |
| | (159,615 | ) |
| Proceeds from sale of property and equipment | 32 |
| | 57,444 |
| | 467 |
| | (269 | ) | | 57,674 |
|
| Proceeds from insurance recoveries | — |
| | 285 |
| | — |
| | — |
| | 285 |
|
| | (631 | ) | | (99,607 | ) | | (1,418 | ) | | — |
| | (101,656 | ) |
| | | | | | | | | | |
| Cash flows from financing activities: | | | | | | | | | |
| Debt repayments | (60,000 | ) | | (2 | ) | | — |
| | — |
| | (60,002 | ) |
| Debt issuance costs | (1,877 | ) | | — |
| | — |
| | — |
| | (1,877 | ) |
| Proceeds from exercise of options | 781 |
| | — |
| | — |
| | — |
| | 781 |
|
| Purchase of treasury stock | (729 | ) | | — |
| | — |
| | — |
| | (729 | ) |
| Intercompany contributions/distributions | 47,922 |
| | (48,130 | ) | | 208 |
| | — |
| | — |
|
| | (13,903 | ) | | (48,132 | ) | | 208 |
| | — |
| | (61,827 | ) |
| | | | | | | | | | |
| Net increase (decrease) in cash and cash equivalents | (10,467 | ) | | (96 | ) | | (10,201 | ) | | — |
| | (20,764 | ) |
| Beginning cash and cash equivalents | 27,688 |
| | (5,516 | ) | | 12,752 |
| | — |
| | 34,924 |
|
| Ending cash and cash equivalents | $ | 17,221 |
| | $ | (5,612 | ) | | $ | 2,551 |
| | $ | — |
| | $ | 14,160 |
|
| |
ITEM 9. | CHANGES IN AND DISAGREEMENTS WITH ACCOUNTANTS ON ACCOUNTING AND FINANCIAL DISCLOSURE |
ITEM 9.CHANGES IN AND DISAGREEMENTS WITH ACCOUNTANTS ON ACCOUNTING AND FINANCIAL DISCLOSURE
Not applicable.
| |
ITEM 9A. | CONTROLS AND PROCEDURES |
ITEM 9A. CONTROLS AND PROCEDURES
Management’s Evaluation of Disclosure Controls and Procedures
In accordance with Exchange Act Rules 13a-15 and 15d-15, we carried out an evaluation, under the supervision and with the participation of management, including our Chief Executive Officer and Chief Financial Officer, of the effectiveness of our disclosure controls and procedures as of the end of the period covered by this report. Based upon that evaluation, our Chief Executive Officer and Chief Financial Officer concluded that our disclosure controls and procedures were effective as of December 31, 2017,2020, to ensureprovide reasonable assurance that information required to be disclosed in our reports filed or submitted under the Exchange Act is (1) recorded, processed, summarized and reported within the time periods specified in the Securities and Exchange Commission’s rules and forms and (2) accumulated and communicated to our management, including our Chief Executive Officer and Chief Financial Officer, as appropriate to allow timely decisions regarding required disclosure.
In the ordinary course of business, we may make changes to our systems and processes to improve controls and increase efficiency, and make changes to our internal controls over financial reporting in order to ensure that we maintain an effective internal control environment.
There has been no change in our internal control over financial reporting that occurred during the three months ended December 31, 20172020 that has materially affected, or is reasonably likely to materially affect, our internal control over financial reporting.
Management’s Annual Report on Internal Control Over Financial Reporting
The management of Pioneer Energy Services Corp. is responsible for establishing and maintaining adequate internal control over financial reporting. Pioneer Energy Services Corp.’s internal control over financial reporting is a process designed to provide reasonable assurance regarding the reliability of financial reporting and the preparation of financial statements for external purposes in accordance with generally accepted accounting principles. A company’s internal control over financial reporting includes those policies and procedures that: (1) pertain to the maintenance of records that, in reasonable detail, accurately and fairly reflect the transactions and dispositions of the assets of the company; (2) provide reasonable assurance that transactions are recorded as necessary to permit preparation of financial statements in accordance with generally accepted accounting principles, and that receipts and expenditures of Pioneer Energy Services Corp. are being made only in accordance with authorizations of management and directors of the company; and (3) provide reasonable assurance regarding prevention or timely detection of unauthorized acquisition, use, or disposition of the company’s assets that could have a material effect on the financial statements. Because of its inherent limitations, internal control over financial reporting may not prevent or detect misstatements. Also, projections of any evaluation of effectiveness to future periods are subject to the risk that controls may become inadequate because of changes in conditions, or that the degree of compliance with the policies or procedures may deteriorate.
Pioneer Energy Services Corp.’s management assessed the effectiveness of Pioneer Energy Services Corp.’s internal control over financial reporting as of December 31, 2017.2020. In making this assessment, it used the criteria set forth by the Committee of Sponsoring Organizations of the Treadway Commission (COSO) in Internal Control-Integrated Framework (2013). Based on our assessment we have concluded that, as of December 31, 2017,2020, Pioneer Energy Services Corp.’s internal control over financial reporting was effective based on those criteria.
KPMG LLP, the independent registered public accounting firm that audited the consolidated financial statements of Pioneer Energy Services Corp. included in this Annual Report on Form 10-K, has issued an attestation report on the effectiveness of Pioneer Energy Services Corp.’s internal control over financial reporting as of December 31, 2017.2020. This report is included in Item 8, Financial Statements and Supplementary Data.
| |
ITEM 9B. | OTHER INFORMATION |
ITEM 9B. OTHER INFORMATION
Not applicable.