I
UNITED STATES
SECURITIES AND EXCHANGE COMMISSION
Washington, D.C. 20549
Form 10-K
☒⌧ANNUAL REPORT PURSUANT TO SECTION 13 OR 15(d) OF THE SECURITIES EXCHANGE ACT OF 1934
For the fiscal year ended December 31 2017, 2021
OR
☐◻TRANSITION REPORT PURSUANT TO SECTION 13 OR 15(d) OF THE SECURITIES EXCHANGE ACT OF 1934
For the transition period from to
Commission file number 0-10537000-10537


| | |
Delaware | | 36-3143493 |
(State of Incorporation) | | (IRS Employer Identification Number) |
37 South River Street, Aurora, Illinois60507
(Address of principal executive offices, including zip code)
(630)892-0202
(Registrant's telephone number, including Area Code)
Securities registered pursuant to Section 12(b) of the Act:
| | |
Title of Class | Trading Symbol(s) | Name of each exchange on which registered |
Common Stock, $1.00 par value | OSBC | The Nasdaq Stock Market |
Preferred Securities of Old Second Capital Trust I
| | The Nasdaq Stock Market
|
Securities registered pursuant to Section 12(g) of the Act:
Preferred Share Purchase RightsNone
(Title of Class)
Indicate by check mark if the registrant is a well-known seasoned issuer, as defined in Rule 405 of the Securities Act. Yes☐ No☒Yes◻ No⌧
Indicate by check mark if the registrant is not required to file reports pursuant to Section 13 or Section 15(d) of the Exchange Act.
Indicate by check mark whether the registrant (1) has filed all reports required to be filed by Section 13 or 15(d) of the Securities Exchange Act of 1934 during the preceding 12 months (or for such shorter period that the registrant was required to file such reports) and (2) has been subject to such filing requirements for the past 90 days. Yes☒ No☐Yes⌧ No◻
Indicate by check mark whether the registrant has submitted electronically and posted on its corporate Website, if any, every Interactive Data File required to be submitted and posted pursuant to Rule 405 of Regulation S-T (§232.405 of this chapter) during the preceding 12 months (or for such shorter period that the registrant was required to submit and post such files). Yes☒ No☐Yes⌧ No◻
Indicate by check mark if disclosure of delinquent filers pursuant to Item 405 of Regulation S-K is not contained herein, and will not be contained, to the best of registrant’s knowledge, in definitive proxy or information statements incorporated by Reference in Part III of this Form 10-K or any amendment to this Form 10-K. ☐
Indicate by check mark whether the registrant is a large accelerated filer, an accelerated filer, a non-accelerated filer, smaller reporting company, or an emerging growth company. See the definitions of ‘‘large accelerated filer,’’ ‘‘accelerated filer,’’ ‘‘smaller reporting company,’’ and ‘‘emerging growth company’’ in Rule 12b–2 of the Exchange Act.
| | | |
Large accelerated filer ◻ | | Accelerated filer ⌧ | |
Large accelerated filer ☐
| | Accelerated filer ☒
| |
Non-accelerated filer ☐◻ | | Smaller reporting company ☐◻ | Emerging growth company☐ |
(Do not check if smaller reporting company)
| | company◻ |
If an emerging growth company, indicate by check mark if the registrant has elected not to use the extended transition period for complying with any new or revised financial accounting standards provided pursuant to Section 13(a) of the Exchange Act. ☐◻
Indicate by check mark whether the registrant has filed a report on and attestation to its management’s assessment of the effectiveness of its internal control over financial reporting under Section 404(b) of the Sarbanes-Oxley Act (15 U.S.C. 7262(b)) by the registered public accounting firm that prepared or issued its audit report. ⌧
Indicate by check mark whether the registrant is a shell company (as defined in Exchange Act Rule 12b-2). Yes☐ No☒Yes☐ No⌧
The aggregate market value of the voting and non-voting common equity held by non-affiliates of the registrant, on June 30, 2017,2021, the last business day of the registrant’s most recently completed second fiscal quarter, was approximately $336.7$341.6 million. The number of shares outstanding of the registrant's common stock, par value $1.00 per share, was 29,693,15044,461,045 at March 10, 2018.7, 2022.
DOCUMENTS INCORPORATED BY REFERENCE:
Certain information required by Part III of this Annual Report on Form 10-K is incorporated by reference from the registrant's definitive proxy statement relating to the 20182022 Annual Meeting of Stockholders, which will be filed with the Securities and Exchange Commission within 120 days after the end of the fiscal year to which this Annual Report on Form 10-K relates.
OLD SECOND BANCORP, INC.
Form 10-K
INDEX
CAUTIONARY NOTE REGARDING FORWARD-LOOKING STATEMENTS
This report and other publicly available documents of the Company including the documents incorporated herein by reference, contain forward-looking statements within the meaning of the Private Securities Litigation Reform Act, including, with respectbut not limited to, management’s expectations regarding future plans, strategies and financial performance, including the anticipated timing of the closing of the merger transaction with Greater Chicago Financial Corp., regulatory developments, industry and economic trends and other matters.estimates and assumptions underlying accounting policies. Forward-looking statements which may beare based uponon our current beliefs, expectations and assumptions of the Company's management and on information currently available to management,and, can be identified by the inclusionuse of words such qualifications as “expects,” “intends,” “believes,” “may,” “will,” “would,” “could,” “should,” “plan,” “anticipate,” “estimate,” “possible,” “likely” or the negative thereof as well as other indications thatsimilar words and expressions of the particularfuture. Forward-looking statements are not historical facts and refer to future periods. Because forward-looking statements relate to the future, they are subject to inherentrisks, uncertainties risks and changes in circumstancesassumptions that are difficult to predict as to timing, extent, likelihood and may be outsidedegree of the Company’s control. Actual events andoccurrence, which could cause our actual results mayto differ significantlymaterially from those describedanticipated in or by such forward-looking statements, duestatements. Potential risks and uncertainties include, but are not limited to, numerous factors, including:the following:
| ·
● | our ability to execute our growth strategy; |
| ● | the continuing impact of COVID-19 and its variants on our business, including the impact of the actions taken by governmental authorities to try and contain the virus or address the impact of the virus on the United States economy and the resulting effect of these items on our operations, liquidity and capital position, and on the financial condition of our borrowers and other customers; |
| ● | negative economic conditions that adversely affect the economy, real estate values, the job market and other factors nationally and in our market area, in each case that may affect our liquidity and the performance of our loan portfolio; |
| ·
● | | defaultsrisks with respect to our ability to successfully expand and losses on our loan portfolio;
|
| ·
| | completion of the merger transaction is dependent on, among other things, receipt of regulatory approvals, the timing of which cannot be predicted with precision at this point and which may not be received at all;
|
| ·
| | the impact of the completion of the merger transaction on the Company’s and Greater Chicago Financial Corp.’s financial statements will be affected by the timing of the transaction;
|
| ·
| | the merger transaction may be more expensive to complete and the anticipated benefits, including estimated cost savings and anticipated strategic gains, may be significantly harder or take longer to achieve than expected or may not be achieved in their entirety as a result of unexpected factors or events;
|
| ·
| | the integration of Great Chicago Financial Corp.’s businessintegrate businesses and operations intothat we acquire, such as the Company, which will include conversionrecent acquisition of Great Chicago Financial Corp.’s operating systems and procedures, may take longer than anticipated or be more costly than anticipated or have unanticipated adverse results relating to Great Chicago Financial Corp.’s or the Company’s existing businesses;
|
| ·
| | the Company’sWest Suburban Bancorp, Inc., as well our ability to achieve anticipated results from the transaction is dependent on the state of the economicidentify and financial markets going forward. Specifically, the Company may incur more credit losses than expected, cost savings may be less than expected and customer attrition may be greater than expected;
complete future mergers or acquisitions; |
| ·
● | | the financial success and viability of the borrowers of our commercial loans; |
| ·
● | | market conditions in the commercial and residential real estate markets in our market area;
|
| ·
| | changes in U.S. monetary policy, the level and volatility of interest rates, the capital markets and other market conditions that may affect, among other things, our liquidity and the value of our assets and liabilities; |
| ·
● | the transition away from LIBOR to an alternative reference rate; |
| ● | competitive pressures in thefrom other financial services business;service businesses and from nontraditional financial technology (“FinTech”) companies; |
| ·
● | | any negative perception of our reputation or financial strength; |
| ·
● | | our ability to raise additional capital on acceptable terms when needed; |
| ·
● | our ability to raise cost-effective funding to support business plans when needed: |
| ● | our ability to use technology to provide products and services that will satisfy customer demands and create efficiencies in operations; |
| ·
● | | adverse effects on our information technology systems resulting from system failures, human error or cyberattacks; |
| ·
● | | adverse effects of failures by our vendors to provide agreed upon services in the manner and at the cost agreed, particularly our information technology vendors; vendors and those vendors performing a service on the Company’s behalf; |
| ·
● | | the impact of any claims or legal actions, including any effect on our reputation; |
| ·
● | | losses incurred in connection with repurchases and indemnification payments related to mortgages; |
| ·
● | | the soundness of other financial institutions; institutions and other counter-party risk; |
| ·
● | | changes in accounting standards, rules and interpretations and the related impact on our financial statements; statements, including assumptions surrounding the ongoing impact of our adoption of the Current Expected Credit Losses (“ CECL”) model, which are subject to change based on a number of factors including changes in our macroeconomic forecasts, credit quality, loan composition and other factors; |
| ·
● | | our ability to receive dividends from our subsidiaries; |
| ·
● | | a decrease in our regulatory capital ratios; |
| ·
● | adverse federal or state tax assessments, or changes in tax laws or policies; |
| ● | risks associated with actual or potential litigation or investigations by customers, regulatory agencies or others; |
| ● | legislative or regulatory changes, particularly changes in regulation of financial services companies; |
| ·
● | | increased costs of compliance, heightened regulatory capital requirements and other risks associated with changes in regulation and the current regulatory environment, including changes as a result of the Dodd-Frank Act; new presidential administration and Democratic control of Congress; |
| ·
● | | the impact of heightenednegative changes in our capital requirements; and
position; |
| ·
● | the adverse effects of events beyond our control that may have a destabilizing effect on financial markets and the economy, such as epidemics and pandemics (including COVID-19), war or terrorist activities, essential utility outages, deterioration in the global economy, instability in the credit markets, disruptions in our customers’ supply chains or disruption in transportation; |
| ● | changes in trade policy and any related tariffs; and |
| ● | each of the factors and risks under the heading “Risk Factors.”Factors” in our 2021 Annual Report on Form 10-K and in subsequent filings we make with the SEC. |
Because the Company’s ability to predict results or the actual effect of future plans or strategies is inherently uncertain, there can be no assurances that future actual results will correspond to any forward-looking statements and you should not rely on any forward-looking statements. Additionally, all statements in this Form 10-K, including forward-looking statements, speak only as of the date they are made, and the Company undertakes no obligation to update any statement in light of new information or future events.events, except as required by applicable law.
PART I
Item 1. Business
Business
General
Old Second Bancorp, Inc. (the “Company” or the “Registrant”) wasis a corporation organized under the laws of the State of Delaware on September 8,in 1981 and is a registeredthat serves as the bank holding company underfor its wholly-owned subsidiary bank, Old Second National Bank. Old Second National Bank (the “Bank”) is a national banking association headquartered in Aurora, Illinois, that operates through 63 banking centers located in Cook, DeKalb, DuPage, Kane, Kendall, LaSalle and Will counties in Illinois.
In this report, unless the context suggests otherwise, references to the “Company” refer to Old Second Bancorp, Inc. and references to “we,” “us,” and “our” mean the combined business of the Company, the Bank Holding Company Act of 1956 (the “BHCA”). and its wholly-owned subsidiaries.
The Company conductsWe conduct a full service community banking and trust business through the following wholly ownedBank and its wholly-owned subsidiaries, as follows:
●Old Second Affordable Housing Fund, L.L.C., which togetherwas formed for the purpose of providing down payment assistance for home ownership to qualified individuals;
●Station I, LLC, which was formed to hold property acquired by the Bank through foreclosure or in the ordinary course of collecting a debt previously contracted with borrowers;
●River Street Advisors, LLC, which was formed in May 2010 to provide investment advisory/management services;
●West Suburban Insurance Services, Inc., which we acquired in our acquisition of West Suburban Bank (discussed below). This subsidiary, which provided a review of customer insurance policies and coverages and offerings, as a broker for third party insurance companies, various insurance products, was sold on December 31, 2021, and is in the Registrantprocess of dissolution; and
●14 additional subsidiaries acquired in our acquisition of West Suburban Bank, which were formed by West Suburban Bank to hold foreclosed real estate (12 of which are referred to ascurrently inactive and are in the “Company”: | ·
| | Old Second National Bank (the “Bank”).
|
| ·
| | Old Second Capital Trust I, which was formed for the exclusive purpose of issuing trust preferred securities in an offering that was completed in July 2003.
|
| ·
| | Old Second Capital Trust II, which was formed for the exclusive purpose of issuing trust preferred securities in an offering that was completed in April 2007.
|
| ·
| | Old Second Affordable Housing Fund, L.L.C., which was formed for the purpose of providing down payment assistance for home ownership to qualified individuals.
|
| ·
| | Station I, LLC, which is wholly owned by the Bank to hold property acquired by the Bank through foreclosure or in the ordinary course of collecting a debt previously contracted with borrowers.
|
| ·
| | River Street Advisors, LLC, a wholly owned subsidiary of the Bank, which was formed in May 2010 to provide investment advisory/management services.
|
| ·
| | Old Second Bancorp Merger Subsidiary, Inc., which was formed in December 2017 in connection with the Company’s proposed merger with Greater Chicago Financial Corp.
|
process of dissolution).
Intercompany transactions and balances are eliminated in consolidation. We evaluate our operations as one operating segment, which is community banking. Financial information concerning our operations can be found in the financial statements in this annual report.
The Bank’s full serviceRecent Developments
Merger with West Suburban Bancorp, Inc.
On December 1, 2021, we completed our merger with West Suburban Bancorp, Inc. (“West Suburban”), the holding company for West Suburban Bank. Under the terms of the merger agreement, each share of West Suburban common stock was converted into 42.413 shares of our common stock and $271.15 in cash. Total cash and stock consideration paid was approximately $295.2 million. With the acquisition of West Suburban, we acquired 34 branches in DuPage, Kane, Kendall and Will counties in Illinois.
Principal Business and Services
We are a full-service banking businesses include the customary consumerbusiness offering a broad range of deposit products, trust and commercial productswealth management services, and lending services, that banking institutions typically provide including demand, NOW, money market, savings, time deposit and individual retirement accounts; commercial, industrial, consumer and real estate lending, including installment loans, agricultural loans, lines of credit, lease financing receivables and overdraft checking; safe deposit operations; trust services; wealth management services;operations, and an extensive variety of additional services tailored to the needs of individual customers, such as the acquisition of U.S. Treasury notes and bonds, money orders, cashiers’ checks and foreign currency, direct deposit, discount brokerage, debit cards, credit cards, and other special services. The Bank’sOur lending activities include making commercial and consumer loans, primarily on a secured basis. Commercial lending focuses on business, capital, construction, inventory, health care and real estate lending.lending, as well as lease financing. Installment lending includes direct and indirect loans to consumers and commercial customers.
The BankWe also offersoffer a full complement of electronic banking services such as online and mobile banking and corporate cash management products including remote deposit capture, mobile deposit capture, investment sweep accounts, zero balance accounts, automated tax payments, ATM access, telephone banking, lockbox accounts, automated clearing house transactions, account reconciliation, controlled disbursement, detail and general information reporting, foreign and domestic wire transfers, vault services for currency and coin, and checking accounts. Additionally, the Bank provideswe provide a wide range of wealth management, investment, agency, and custodial services for individual, corporate, and not-for-profit clients. These services include the administration of estates and personal trusts, as well as the management of investment accounts for individuals, employee benefit plans, and charitable foundations. The BankWe also originatesoriginate residential mortgages, offering a wide range of mortgage products including conventional, government, and jumbo loans. SecondaryWe also handle secondary marketing of those mortgages is also handled at the Bank.mortgages.
The Company’s management evaluates the operations of the Company as one operating segment, which is community banking. Financial information concerning the Company’s operations can be found in the financial statements in this annual report.
Proposed Merger with Greater Chicago Financial Corp.
On December 26, 2017, the Company announced the signing of a definitive agreement and plan of merger (the “Merger Agreement”) to acquire Greater Chicago Financial Corp. and its wholly-owned bank subsidiary, ABC Bank, in an all-cash transaction. Under the terms of the Merger Agreement, the Company will acquire all of the outstanding common stock of Greater Chicago Financial Corp. in a transaction valued at approximately $41.1 million. The Company will acquire and simultaneously retire $6.3 million of outstanding subordinated debentures of Greater Chicago Financial Corp. The ultimate per share consideration for shareholders of Greater Chicago Financial Corp. will depend upon the conversion election of holders of approximately $2.0 million of subordinated debentures that are convertible to common stock. The Merger Agreement requires the purchase price to be increased by an amount equal to the aggregate amount of outstanding principal and accrued but unpaid interest of such converted indebtedness actually converted into Greater
Chicago Financial Corp. common stock. ABC Bank had total assets of $342.6 million as of December 31, 2017, including $234.4 million of net loans. The boards of the Company and Greater Chicago Financial Corp. unanimously approved the transaction which is subject to regulatory approval and customary closing conditions. Greater Chicago Financial Corp.’s shareholders have approved the transaction, which is expected to close in the second quarter of 2018.
Market Area
The Company’sOur main office is located at 37 South River Street, Aurora, Illinois 60507. The city of Aurora is located in northeastern Illinois, approximately 40 miles west of Chicago. The Bank operates primarily in Cook, DeKalb, DuPage, Kane, Kendall, DeKalb, DuPage, LaSalle, Will and CookWill counties in Illinois, and it has developed a strong presence in these counties. The Bank offers its services to retail, commercial, industrial, and public entity customers in the Aurora, Bartlett, Batavia, Bensenville, Bloomingdale, Bolingbrook, Burlington, Carol Stream, Chicago, Chicago Heights, Darien, Downers Grove, Elburn, Elgin, Frankfort, Glendale Heights, Joliet, Kaneville, Lisle, Lombard, Montgomery, Naperville, North Aurora, Batavia,Oakbrook Terrace, Oswego, Ottawa, Plano, Romeoville, St. Charles, Burlington, Elburn, Elgin, Kaneville, Sugar Grove, Naperville, Lisle, Joliet,Sycamore, Villa Park, Warrenville, Wasco, Westmont, Wheaton, and Yorkville Plano, Wasco, Ottawa, Oswego, Sycamore, Frankfort, Chicago and Chicago Heights communities and surrounding areas through its 2563 banking locations that are located primarily westin the western and southsouthern portions of the Chicago metropolitan area. The Bank is continually assessing its market presence to ensure it meets the needs of these communities and the Company’s stockholders. The Bank closed its Maple Park Branch in February 2017. The pending acquisition of ABC Bank, as discussed above, will result in four additional operating branches within our network in the Chicago and Bensenville markets following the closing.
Lending Activities
The Bank providesWe provide a broad range of commercial and retail lending services to corporations, partnerships, individuals and government agencies. The Bank actively markets itsWe market our services to qualified borrowers. Lendingborrowers, and our lending officers actively solicit the business of new borrowers entering our market areas as well as long-standing members of the local business community. The Bank hasWe have established lending policies that include a number of underwriting factors to be considered in making a loan, including location, amortization, loan to value ratio, cash flow, pricing, documentation and the credit history of the borrower. In 2017, the Bank originated approximately $656.1 million in loans. The Bank’s2021, our total loan portfolio grew $138.8$1.39 billion year over year due primarily to the $1.50 billion of loans acquired in the West Suburban acquisition, which was partially offset by paydowns, net of originations, during the year. We had approximately $992.2 million in 2017 due toloan originations and select portfolio purchasesin 2021, including $62.3 million of leases and home equityPaycheck Protection Program (”PPP”) loan originations (with $38.4 million of PPP loans from third parties. In addition,outstanding at December 31, 2021). We originated approximately $314.3 million of residential mortgage loans of approximately $197.0 million were originated in 2017,2021, which includes originations of loans held for sale of $146.9$239.2 million. Proceeds from the sales of residential mortgage loans to third parties were $151.3 million.$254.4 million in 2021.
The Bank’sOur loan portfolios areportfolio is comprised primarily of loans in the areas of commercial real estate, residential real estate, general commercial, construction real estate, leases, and consumer lending. As of December 31, 2017,2021, commercial real estate loans represented approximately 46.4% (49.8%44.8% (45.0% at year-end 2016)2020) of the Bank’sour loan portfolio, residential mortgages represented approximately 26.3% (25.6%17.1% (17.8% at year-end 2016)2020), general commercial loans represented approximately 16.9% (15.4%22.5% (20.0% at year-end 2016)2020), home equity lines of credit represented approximately 3.7% (5.0% at year-end 2020), construction lending represented approximately 5.3% (4.4%6.0% (4.8% at year-end 2016)2020), leases represented approximately 4.2% (3.8%5.1% (7.0% at year-end 2016)2020), and consumer and other lending represented less than 1.0% (1.0%(less than 1.0% at year-end 2016)2020). It is the Bank’sour policy to comply at all times with the various consumer protection laws and regulations including, but not limited to, the Equal Credit Opportunity Act, the Fair Housing Act, the Community Reinvestment Act, the Truth in Lending Act, and the Home Mortgage Disclosure Act.
Commercial Loans. The Bank continues We continue to focus on identifying commercial and industrial prospects in itsour new business pipeline, withwhich led to favorable results in 2017.2021. As noted above, the Bank iswe are an active commercial lender in the Chicago metropolitan area, with primary markets in the city of Chicago, as well as west and south of Chicago. In 2019, we enhanced our commercial lending team with new hires specializing in health care, bringing additional expertise to our developing presence in the Chicago metropolitan market, which led to continued growth in our loan portfolio. In 2021, we continued to grow our commercial lending team with the addition of a sponsor finance team, which began to grow their line of business in early 2022, focusing on lower middle market private equity-backed businesses. Commercial lending reflectsis comprised of revolving lines of credit for working capital, lending for capital expenditures on manufacturing equipment and lending to small business manufacturers, service companies, medical and dental entities as well as specialty contractors. The BankWe also hashave commercial and industrial loans to customers in food product manufacturing, food process and packing, machinery tooling manufacturing as well as service and technology companies. Collateral for these loans generally includes accounts receivable, inventory, equipment and real estate. In addition, the Bankwe often securesobtain personal guarantees to help assure repayment. Loans may be made on an unsecured basis if warranted by the overall financial condition of the borrower. Commercial term loans range principally from one to seven years with the majority falling in the one to five year range. Interest rates on commercial loans are a mixture of fixed and variable rates, with these rates often tied to the prime rate, a spread over the FHLB Chicago index rate, a Treasury constant maturity index, LIBOR, or LIBOR. an alternative rate, such as SOFR.
Repayment of commercial loans is largely dependent upon the cash flows generated by the operations of the commercial enterprise. The Bank’sborrower. Our underwriting procedures identify the sources of those cash flows and seek to match the repayment terms of the commercial loans to thethose sources. Secondary repayment sources are typically found in collateralization and guarantor support.
Lease Financing Receivables.The BankWe continued growth of theour lease portfolio in 20172021 with the acquisition of leases originated by other equipment financing companies, as well as organic growth by the Bank.lease originations. The collateral for lease financing receivables primarily includes manufacturingconstruction and transportation equipment, and lease terms typically range from one to seven years, with the majority falling in the one to five year range. Growth in this portfolio reflects management’s efforts to diversify lending product offerings, and improvelessen our commercial real estate loan concentration metrics.concentration.
Commercial Real Estate Loans. While management has been actively working to reduce the Bank’sour concentration in real estate loans, including commercial real estate loans, a large portion of the loan portfolio continues to be comprised of commercial real estate loans.
As of December 31, 2017,2021, approximately $317.0$574.4 million, or 42.2% (42.8%37.5% (36.3%, at year-end 2016)2020) of the total commercial real estate loan portfolio of $751.0 million$1.53 billion consisted of loans to borrowers secured by owner occupied property. A primary repayment risk for aowner occupied commercial real estate loanloans is interruptiona reduction
of or discontinuance of cash flows from operations, which are usually derived from rent inunderlying operations; for non-owner occupied loans, cash flow disruptions may occur with the caseloss of nonowner occupied commercial properties.a tenant or rental income reductions. Repayment could also be influenced by economic events, which may or may not be under the control of the borrower, or changes in regulations that negatively impact the future cash flow and market values of the affected properties. Repayment risk can also arise from general downward shifts in the valuations of classes of properties over a given geographic area, such as the significant price adjustments that were observed by the Company in 2008 through 2011. Propertyand property valuations could continue to be affected by changes in demand and other economic factors, which could further influence cash flows associated with the borrower and/or the property. The Bank attemptsWe seek to mitigate these risks by staying apprised of market conditions and by maintaining underwriting practices that provide for adequate cash flow margins and multiple repayment sources as well as remaining in regular contact with itsour borrowers. In most cases, the Bank haswe have collateralized these loans and/or hashave taken personal guarantees to help assure repayment. Commercial real estate loans are primarily made based on the identified cash flow of the borrower and/or the property at origination and secondarily on the underlying real estate acting as collateral. Additional credit support is provided by the borrower for most of these loans and the probability of repayment is based on the liquidation value of the real estate and enforceability of personal and corporate guarantees if any exist.
Construction Loans. The Bank’s Our construction and development portfolio increased from $64.7$98.5 million at December 31, 2016,2020, to $85.2$206.1 million at December 31, 2017,2021, primarily due primarily to the West Suburban acquisition, as well as organic loan originations in strengthening markets. The Bank usesgrowth. We use underwriting and construction loan guidelines to determine whether to issue loans on build-to-suit or build out arrangements of existing borrower properties.
Construction loans are structured most often to be converted to permanent loans at the end of the construction phase or, infrequently, to be paid off upon receiving financing from another financial institution. Construction loans are generally limited to our local market area. Lending decisions have been based on the “as-is” and “prospective” appraised value of the property as determined by an independent appraiser, an analysis of the potential marketability and profitability of the project and identification of a cash flow source to service the permanent loan or verification of a refinancing source. Construction loans generally have terms of 12 to 1824 months, with extensions as needed. The Bank disburses loan proceeds in increments as construction progresses and as inspections warrant.
Development lending often involves the disbursement of substantial funds with repayment dependent, in part, on the success of the ultimate project rather than the ability of the borrower or guarantor to repay principal and interest. Therefore, constructiondevelopment lending generally involves more risk than other lending because it is based on future estimates of value and economic circumstances. While appraisals are required prior to funding, and loan advances are limited to the lesser of the cost to complete or “prospective” value determined by the appraisal, therefore there is the possibility of an unforeseen event affecting the value and/or costs of the project. Development loans are primarily used for single-familymulti-family developments, where the saleleasing of lots and houses areunits is tied to customer preferenceslocal demand and interestrental rates, and commercial developments, where the success of the project is tied to the demand for commercial space, cap rates and leasing rates. If the borrower defaults prior to completion of the project, the Bankwe may be required to fund additional amounts so that another developer can complete the project. The Bank isWe are located in an area where a large amount of development activity has occurred as rural and semi-rural areas are being suburbanized. This type of growth presents some economic risks should local demand for commercial buildings and multi-family housing shift. The Bank addressesWe address these risks by closely monitoring local real estate activity, adhering to proper underwriting procedures, closely monitoring construction projects, and limiting the amount of construction development lending.lending by project type and obligor.
Residential Real Estate Loans. Residential first mortgage loans second mortgages, and home equity line of creditsecond mortgages are included in this category. First mortgage loans may include fixed rate loans that are generally sold to investors. The Bank isWe are a direct seller to the Federal National Mortgage Association (“FNMA”), Federal Home Loan Mortgage Corporation (“FHLMC”) and to several large financial institutions. The Bank typically retainsWe retain servicing rights for mortgages sold mortgages.to FNMA and FHLMC. The retention of such servicing rights is a source of noninterest income and also allows the Bankus an opportunity to have regular contact with mortgage customers and can help to solidify our community involvement. Other loans that are not sold include adjustable rate mortgages, lot loans, and construction loans that are held in our portfolio. Federal Housing Administration (“FHA”) and the Bank’s portfolio. ResidentialVeterans Administration (“VA”) loans are sold to third party investors with servicing released. We experienced significant growth in residential mortgage purchase activity has reflected a moderate level of activityin 2020, as the real estate market in our market area continues to stabilize. However, withfalling interest rates risingresulted in 2017 in our market area, the Bank’s residential mortgage lending reflected a reductionan increase in volume and mixture of both refinance and purchase financing opportunities. Home equity lending reflectedThe growth in 2017mortgage activity slowed in 2021, due to the continued reduced housing inventory, and in a portfolio purchaserising rate environment, mortgage activity is anticipated to experience minimal to moderate growth rates.
Home Equity Lines of high-qualityCredit. Our home equity lines of credit, (“HELOCs”) from a third partyor HELOCs, consist of $16.7 million; this HELOC purchase was made at a 4.25% premium, and the average annualized yield on the portfoliooriginated as well as purchased HELOCs acquired in 2017 and 2018. We experienced a decline in our organic home equity lending in 2021, as HELOC payoffs were accelerated on both the organic and purchased portfolios held. This decline was 4.43%, netoffset by the purchase of the premium accretion.HELOCs with our West Suburban acquisition.
Consumer Loans. The Bank We also providesprovide many types of consumer loans including primarily motor vehicle, home improvement and signature loans. Consumer loans typically have shorter terms and lower balances with higher yields as compared to other loans but generally carry higher risks of default. Consumer loan collections are dependent on the borrower’s continuing financial stability and thus are more likely to be affected by adverse personal circumstances. In addition, with the West Suburban acquisition, we acquired a small credit card portfolio of approximately $5.2 million at December 31, 2021, but we are anticipating exiting this line of business in 2022.
Deposit Products
Competition
We offer a full range of deposit products and services that are typically available from most banks and savings institutions. These include consumer and business checking accounts, savings accounts, money market accounts and other time deposits of various types and
maturity options. Interest bearing transaction accounts and time deposits are tailored to and offered at rates competitive with those offered in our primary market areas. In addition, we offer certain retirement account services. We solicit accounts from individuals, businesses, associations, organizations and governmental authorities. We believe that our significant branch network will assist us in continuing to attract and retain deposits from local customers in our market areas.
Wealth Management
We offer wide range of wealth management, investment, agency, and custodial services for individual, corporate, and not-for-profit clients. These services include the administration of estates and personal trusts, as well as the management of investment accounts for individuals, employee benefit plans, and charitable foundations. At December 31, 2021, we had approximately $1.74 billion in assets under administration and/or management.
Competition
Our market area is highly competitive and the Bank’sour business activities require itus to compete with many other financial institutions. A number of these financial institutions are affiliated with large bank holding companies headquartered outside of our
principal market area as well as other institutions that are based in Aurora's surrounding communities and in Chicago, Illinois. All of these financial institutions operate banking offices in the greater AuroraChicago area or actively compete for customers within the Company'sour market area. The BankWe also facesface competition from finance companies, insurance companies, credit unions, mortgage companies, securities brokerage firms, money market funds, loan production offices and other providers of financial services.services, including nontraditional financial technology companies or FinTech companies. Many of our nonbank competitors which are not subject to the same extensive federal regulations that govern bank holding companies and banks, such as the Company and the Bank, may have certain competitive advantages.
The Bank competesWe compete for loans principally through the quality of itsour client service and itsour responsiveness to client needs in addition to competing on interest rates and loan fees. Management believes that itsour long-standing presence in the community and personal one-on-one service philosophy enhances itsour ability to compete favorably in attracting and retaining individual and business customers. The BankWe actively solicitssolicit deposit-related clients and competescompete for deposits by offering personal attention, competitive interest rates, and professional services made available through experienced bankers and multiple delivery channels that fit the needs of itsour market. In wealth management and trust services, we compete with a variety of custodial banks as well as a diverse group of investment managers.
We believe the financial services industry will likely continue to become more competitive as further technological advances enable more financial institutions to provide expanded financial services without having a physical presence in our market.
EmployeesHuman Capital Resources
Our business is relationship-driven, and we believe that our continued growth and future success will depend in large part on the quality of service provided by our employees. Accordingly, we seek to attract, develop and retain employees who can drive our financial and strategic growth objectives and build long-term stockholder value. We respect, value and invite diversity in our team members, customers, suppliers, marketplace, and community.
We seek to provide a compelling value proposition to our employees by providing market-competitive pay and benefits which include retirement programs, broad-based bonuses, health and welfare benefits, financial counseling, paid time off, family leave and flexible work schedules. We have also created internal programs to support employee development and retention, which has contributed to our long-term tenure rates, with 39% of our employees having tenure of over ten years and 29% of our employees having at least 15 years of service as of December 31, 2021. We believe that employee development and retention starts with relationships, both among employees and with the communities we serve. Our “O2 Cares Committee,” led by three members of our executive management team, provides oversight and direction to employee ambassadors that are tasked with fulfilling the O2 Cares Mission to “Positively affect company culture through employee led initiatives focused on career development, building strong relationships, celebrating success and community service.” In 2021, we continued to focus on the development of our employees, providing self-directed, virtual and in person opportunities to build critical skills relative to career advancement. A few examples of offerings include titles such as Onboarding through Connections, Coaching to Connect and Leading Career Conversations. We believe these programs improve job satisfaction, retention and advancement. In addition, we had hundreds of attendees at our very popular Executive Coffee Break sessions where we strive to make executives accessible to all employees in a casual and fun venue.
The COVID-19 pandemic presented challenges to maintain employee and customer safety, while continuing to be open for business. In March 2020, as part of our efforts to exercise social distancing, we closed all of our banking lobbies (other than by appointment) and conducted most of our business through drive-thru tellers and through electronic and online means. At this time, our lobbies have reopened, but we continue to encourage customers to use electronic and online means to conduct their banking activity, and we are following social distancing and personal protective protocols as directed by the Centers for Disease Control and Prevention. In addition, a significant percentage of our workforce has been working from home since mid-March 2020, and we expect this to continue through the majority of 2022. In response to the pandemic, we are also monitoring employee morale and stress levels, developing new paid leave practices and providing personal protective equipment.
At December 31, 2017, the Company2021, we employed 450891 full-time equivalent employees.
Available Information
The Company maintains a corporate website at http://www.oldsecond.com. The Company makes available free of charge on or through its websiteWe file reports with the Annual ReportSecurities and Exchange Commission (“SEC”). Those reports include our annual report on Form 10-K, quarterly reports on Form 10-Q, current reports on Form 8-K and proxy statements. The SEC maintains an internet site that contains reports, proxy and information statements and other information regarding issuers that file electronically with the SEC at www.sec.gov.
Our annual report on Form 10-K, quarterly reports on Form 10-Q, current reports on Form 8-K and proxy statements, and amendments to those reports filed or furnished pursuant to Section 13(a) or 15(d) of the Securities Exchange Act of 1934 may be obtained without charge upon written request to Investor Relations, Old Second Bancorp, Inc., 37 South River Street, Aurora, Illinois 60507 and are accessible at no cost on our website at www.oldsecond.com in the “Investor Relations” section, as soon as reasonably practicable after the Companythey are electronically files such materialfiled with or furnishes itfurnished to the Securities and Exchange Commission (the “SEC”). Many of the Company’sSEC. Certain governance policies, committee charters and other investor information including our Code of Business Conduct and Ethics are also available on the Company’sour website. No information contained on our website is intended to be included as part of, or incorporated by reference into, this Annual Report on Form 10-K. The Company’s reports, proxy and informational statements and other information regarding the Company are also available free of charge on the SEC’s website (www.sec.gov). The Company will also provide copies of its filings free of charge upon written request to: Investor Relations, Old Second Bancorp, Inc., 37 South River Street, Aurora, Illinois 60507.
SUPERVISION AND REGULATION
General
FDIC-insured institutions, their holding companies and their affiliates, are extensively regulated under federal and state law. As a result, the Company’sour growth and earnings performance may be affected not only by management decisions and general economic conditions, but also by the requirements of federal and state statutes and by the regulations and policies of various bank regulatory agencies, including the Office of the Comptroller of the Currency (the “OCC”), the Board of Governors of the Federal Reserve System (the “Federal Reserve”), the Federal Deposit Insurance Corporation (the “FDIC”) and the Consumer Financial Protection Bureau (the “CFPB”). Furthermore, taxation laws administered by the Internal Revenue Service (the “IRS”) and state taxing authorities, accounting rules developed by the Financial Accounting Standards Board (“FASB”), securities laws administered by the Securities and Exchange Commission (the “SEC”)SEC and state securities authorities, and anti-money laundering laws enforced by the U.S. Department of the Treasury (“Treasury”) have an impact on the Company'sour business. The effect of these statutes, regulations, regulatory policies and accounting rules are significant to the Company'sour operations and results.
Federal and state banking laws impose a comprehensive system of supervision, regulation and enforcement on the operations of FDIC-insured institutions, their holding companies and affiliates that is intended primarily for the protection of the FDIC-insured deposits and depositors of banks, rather than stockholders. These laws, and the regulations of the bank regulatory agencies issued under them, affect, among other things, the scope of the Company’sour business, the kinds and amounts of investments the Company and the Bankwe may make, reserve requirements, required capital levels relative to assets, the nature and amount of collateral for loans, the establishment of branches, the Company’sour ability to merge, consolidate and acquire, dealings with the Company's and the Bank'sour insiders and affiliates and the Company’sour payment of dividends. In the last several years, the Company hasWe experienced heightened regulatory requirements and scrutiny following the 2008 global financial crisis, and as a result of the Dodd-Frank Wall Street Reform and Consumer Protection Act (the “Dodd-Frank Act”). AlthoughIn addition, newer regulatory developments implemented in response to the reforms primarily targeted systemically important financial service providers, their influence filtered down in varying degrees to community banks over time,COVID-19 pandemic, including the Coronavirus Aid, Relief, and Economic Security Act (the “CARES Act”) and the reforms have caused the Company’s complianceConsolidated Appropriations Act, 2021, which enhanced and risk management processes, and the costs thereof, to increase. While it is anticipated that the Trump administration will not increase the regulatory burden on community banks and may reduce someexpanded certain provisions of the burdens associated with implementation of the Dodd-FrankCARES Act, the truehad an impact of the new administration is impossible to predict with any certainty.
on our operations.
This supervisory and regulatory framework subjects banks and their bank holding companies to regular examination by their respective regulatory agencies, which results in examination reports and ratings that are not publicly available and that can impact the conduct and growth of their business. These examinations consider not only compliance with applicable laws and regulations, but also capital levels, asset quality and risk, management ability and performance, earnings, liquidity, and various other factors. The regulatory agencies generally have broad discretion to impose restrictions and limitations on the operations of a regulated entity where the agencies determine, among other things, that such operations are unsafe or unsound, fail to comply with applicable law or are otherwise inconsistent with laws and regulations or with the supervisory policies of these agencies.
The following is a summary of certain of the material elements of the supervisory and regulatory framework applicable to the Company and the Bank, beginning with a discussion of the continuing regulatory emphasis on the Company's capital levels.Bank. It does not describe all of the statutes, regulations and regulatory policies that apply, nor does it restate all of the requirements of those that are described. The descriptions are qualified in their entirety by reference to the particular statutory and regulatory provision. These statutes and regulations are subject to change, and additional statutes, regulations, and corresponding guidance may be adopted. We are unable to predict these future changes or the effects, if any, that these changes could have on our business, revenues, and results of operations.
Legislative and Regulatory Responses to the COVID-19 Pandemic
The COVID-19 pandemic has continued to cause extensive disruptions to the global economy, to businesses, and to the lives of individuals throughout the world. On March 27, 2020, the CARES Act was signed into law. The CARES Act was a $2.2 trillion economic stimulus bill that was intended to provide relief in the wake of the COVID-19 pandemic. There have also been a number of regulatory actions intended to help mitigate the adverse economic impact of the COVID-19 pandemic on borrowers, including several mandates from the bank regulatory agencies, requiring financial institutions to work constructively with borrowers affected by the COVID-19
pandemic. Although these programs generally have expired, governmental authorities may take additional actions in the future to limit the adverse impact of COVID-19 on borrowers and tenants.
The Paycheck Protection Program (“PPP”), originally established under the CARES Act and extended under the Consolidated Appropriations Act of 2021, authorized financial institutions to make federally-guaranteed loans to qualifying small businesses and non-profit organizations. These loans carry an interest rate of 1% per annum and a maturity of two years for loans originated prior to June 5, 2020 and five years for loans originated on or after June 5, 2020. The PPP provides that such loans may be forgiven if the borrowers meet certain requirements with respect to maintaining employee headcount and payroll and the use of the loan proceeds after the loan is originated. The initial phase of the PPP, after being extended multiple times by Congress, expired on August 8, 2020. However, on January 11, 2021, the SBA reopened the PPP for First Draw PPP loans to small businesses and non-profit organizations that did not receive a loan through the initial PPP phase. Further, on January 13, 2021, the SBA reopened the PPP for Second Draw PPP loans to small businesses and non-profit organizations that did receive a loan through the initial PPP phase. Maximum loan amounts were also increased for accommodation and food service businesses. Although the PPP ended in accordance with its terms on May 31, 2021, outstanding PPP loans continue to go through the process of either obtaining forgiveness from the SBA or pursuing claims under the SBA guaranty.
The CARES Act, as extended by certain provisions of the Consolidated Appropriations Act, 2021, initially permitted banks to suspend requirements under GAAP for loan modifications to borrowers affected by COVID-19 that would otherwise had been characterized as troubled debt restructurings and suspended any determination related thereto if (i) the borrower was not more than 30 days past due as of December 31, 2019, (ii) the modifications were related to COVID-19, and (iii) the modification occurred between March 1, 2020 and the earlier of 60 days after the date of termination of the national emergency or January 1, 2022. Federal bank regulatory authorities also issued guidance to encourage banks to make loan modifications for borrowers affected by COVID-19.
Regulatory Emphasis on Capital
Regulatory capital represents the net assets of a banking organization available to absorb losses. Because of the risks attendant to their business, FDIC-insured institutions are generally required to hold more capital than other businesses, which directly affects the Company’sour earnings capabilities. While capital has historically been one of the key measures of the financial health of both bank holding companies and banks, its role became fundamentally more important in the wake of the 2008 global financial crisis, as the banking regulators recognized that the amount and quality of capital held by banks prior to the crisis was insufficient to absorb losses during periods of severe stress. Certain provisions of the Dodd-Frank Act and Basel III, discussed below, establish strengthened capital standards for banks and bank holding companies that are meaningfully more stringent than those in place previously.
Minimum RequiredBasel III Capital Levels. Banks have been required to hold minimum levels ofStandards. Regulatory capital based on guidelines established byrules known as the bank regulatory agencies since 1983. The minimums have been expressed in terms of ratios of capital divided by total assets. As discussed below, bank capital measures have become more sophisticated over the years and have focused more on the quality of capital and the risk of assets. Bank holding companies have historically had to comply with less stringent capital standards than their bank subsidiaries and have been able to raise capital with hybrid instruments such as trust preferred securities. The Dodd-Frank Act mandated the Federal Reserve to establishBasel III rules, impose minimum capital levelsrequirements for holding companies on a consolidated basis as stringent as those required for FDIC-insured institutions. A result of this change is that the proceeds of hybrid instruments, such as trust preferred securities, are being excluded from capital over a phase-out period. However, if such securities were issued prior to May 19, 2010 by bank holding companies with less than $15 billion of assets, they may be retained, subject to certain restrictions. Because the Company has assets of less than $15 billion, the Company is able to maintain its trust preferred proceeds as capital but the Company has to comply with new capital mandates in other respects and will not be able to raise capital in the future through the issuance of trust preferred securities.
The Basel International Capital Accords. The risk-based capital guidelines for U.S. banks since 1989 were based upon the 1988 capital accord known as “Basel I” adopted by the international Basel Committee on Banking Supervision, a committee of central banks and bank supervisors that acts as the primary global standard-setter for prudential regulation, as implemented by the U.S. bank regulatory agencies on an interagency basis. The accord recognized that bank assets for the purpose of the capital ratio calculations needed to be risk weighted (the theory being that riskier assets should require more capital) and that off-balance sheet exposures needed to be factored in the calculations. Basel I had a very simple formula for assigning risk weights to bank assets from 0% to 100% based on four categories. In 2008, the banking agencies collaboratively began to phase-in capital standards based on a second capital accord, referred to as “Basel II,” for large or “core” international banks (generally defined for U.S. purposes as having total assets of $250 billion or more, or consolidated foreign exposures of $10 billion or more) known as “advanced approaches” banks. The primary focus of Basel II was on the calculation of risk weights based on complex models developed by each advanced approaches bank. Because most banks were not subject to Basel II, the U.S. bank regulators worked to improve the risk sensitivity of Basel I standards without imposing the complexities of Basel II. This “standardized approach” increased the number of risk-weight categories and recognized risks well above the original 100% risk weighting. The standardized approach is institutionalized by the Dodd-Frank Act for all banking organizations as a floor.
On September 12, 2010, the Group of Governors and Heads of Supervision, the oversight body of the Basel Committee on Banking Supervision, announced agreement on a strengthened set of capital requirements for banking organizations around the world, known as Basel III, to address deficiencies recognized in connection with the global financial crisis.
The Basel III Rule. In July of 2013, the U.S. federal banking agencies approved the implementation of the Basel III regulatory capital reforms in pertinent part, and, at the same time, promulgated rules effecting certain changes required by the Dodd-Frank Act (the “Basel III Rule”). In contrast to capital requirements historically, which were in the form of guidelines, Basel III was released in the form of enforceable regulations by each of the regulatory agencies. The Basel III Rule is applicableapply to all banking organizations that are subject to minimum capital requirements, including federalnational and state banks and savings and loan associations as well as toregardless of size and bank holding companies and savings and loan holding companies other than “small bank holding companies” (generallycompanies,” generally holding companies with consolidated assets of less than $1 billion that do not have securities registered$3 billion. Following the merger with West Suburban, the SEC).
December 31, 2021.
The Basel III Rule required higherrules require the Company and the Bank to maintain the following minimum capital levels, increasedlevels:
| ● | a common equity Tier 1 (“CET1”), risk-based capital ratio of 4.5%; |
| ● | a Tier 1 risk-based capital ratio of 6%; |
| ● | a total risk-based capital ratio of 8%; and |
In order to avoid restrictions on capital distributions or discretionary bonus payments to executives, under Basel III, a banking organization must maintain a “capital conservation buffer” on top of its minimum risk-based capital requirements. This buffer must consist solely of CET1 capital, but the required qualitybuffer applies to all three risk-based measurements (CET1, Tier 1 capital and total capital). The 2.5% capital conservation buffer effectively results in the following effective minimum capital ratios (taking into account the capital conservation buffer): (i) a CET1 capital ratio of 7.0%, (ii) a Tier 1 risk-based capital ratio of 8.5%, and (iii) a total risk-based capital ratio of 10.5%.
As part of its response to the impact of the COVID-19 pandemic, in the first quarter of 2020, U.S. federal regulatory authorities issued an interim final rule that provides banking organizations that adopted the new credit impairment model, the Current Expected Credit Loss, or CECL, during the 2020 calendar year with the option to delay for two years the estimated impact of CECL on regulatory capital relative to regulatory capital determined under the prior incurred loss methodology, followed by a three-year transition period to phase out the aggregate amount of the capital benefit provided during the initial two-year delay (i.e., a five-year transition in total). In connection with our adoption of CECL on January 1, 2020, we elected to utilize the five-year CECL transition. The cumulative amount that is not recognized in regulatory capital, in addition to the $3.8 million Day One impact of CECL adoption, will be phased in at 25% per year beginning January 1, 2022. As of December 31, 2021, this additional component added to capital has been materially reversed over the past year, as provision for credit loss reversals of $10.3 million were recorded in 2021, excluding the impact of the West Suburban acquisition and resultant PCD loan marks, As of December 31, 2021, capital measures of the Company exclude $3.8 million, which is primarily the Day One impact of CECL adoption to retained earnings recorded in 2020.
In November 2019, the federal banking regulators published final rules implementing a simplified measure of capital adequacy for certain banking organizations that have less than $10 billion in total consolidated assets. Under the final rules, which went into effect on January 1, 2020, depository institutions and required more detailed categoriesdepository institution holding companies that have less than $10 billion in total consolidated assets and meet other qualifying criteria, including a leverage ratio of risk weightinggreater than 9%, off-balance-sheet exposures of riskier, more opaque assets. For nearly every class25% or less of total consolidated assets, and trading assets plus trading liabilities of 5% or less of total consolidated assets, are deemed “qualifying community banking organizations” and are eligible to opt into the “community bank leverage ratio framework.” A qualifying community banking organization that elects to use the community bank leverage ratio framework and that maintains a leverage ratio of greater than 9% is considered to have satisfied the generally applicable risk-based and leverage capital requirements under the Basel III Rule requires a more complex, detailedrules and, calibrated assessmentif applicable, is considered to have met the “well capitalized” ratio requirements for purposes of credit risk and calculation of risk weightings.
Not only did the Basel III Rule increase most of the required minimum capital ratios in effect prior to January 1, 2015, but it introduced the concept of Common Equity Tier 1 Capital, which consists primarily of common stock, related surplus (net of Treasury stock), retained earnings, and Common Equity Tier 1 minority interests subject to certain regulatory adjustments. The Basel III Rule also changed the definition of capital by establishing more stringent criteria that instruments must meet to be considered Additional Tier 1 Capital (primarily non-cumulative perpetual preferred stock that meets certain requirements) and Tier 2 Capital (primarily other types of preferred stock and subordinated debt, subject to limitations). A number of instruments that qualified as Tier 1 Capital under Basel I do not qualify, or their qualifications changed. For example, noncumulative perpetual preferred stock, which qualified as simple Tier 1 Capital under Basel I, does not qualify as Common Equity Tier 1 Capital, but qualifies as Additional Tier 1 Capital. The Basel III Rule also constrained the inclusion of minority interests, mortgage-servicing assets, and deferred tax assets in capital and requires deductions from Common Equity Tier 1 Capital in the event that such assets exceed a certain percentage of a banking institution’s Common Equity Tier 1 Capital.
The Basel III Rule required minimum capital ratios as of January 1, 2015, as follows:
| ·
| | A ratio of minimum Common Equity Tier 1 Capital equal to 4.5% of risk-weighted assets;
|
| ·
| | An increase in the minimum required amount of Tier 1 Capital from 4% to 6% of risk-weighted assets;
|
| ·
| | A continuation of the minimum required amount of Total Capital (Tier 1 plus Tier 2) at 8% of risk-weighted assets; and
|
| ·
| | A minimum leverage ratio of Tier 1 Capital to total quarterly average assets equal to 4% in all circumstances.
|
In addition, institutions that seek the freedom to make capital distributions (including for dividends and repurchases of stock) and pay discretionary bonuses to executive officers without restriction must also maintain 2.5% in Common Equity Tier 1 Capital attributable to a capital conservation buffer being phased in over three years beginning in 2016 (which, as of January 1, 2017, was phased in half-way to 1.25%). The purpose of the conservation buffer is to ensure that banking institutions maintain a buffer of capital that can be used to absorb losses during periods of financial and economic stress. Factoring in the fully phased-in conservation buffer increases the minimum ratios depicted above to 7% for Common Equity Tier 1 Capital, 8.5% for Tier 1 Capital and 10.5% for Total Capital.
Banking organizations (except for large, internationally active banking organizations) became subject to the new rules on January 1, 2015. However, there are separate phase-in/phase-out periods for: (i) the capital conservation buffer; (ii) regulatory capital adjustments and deductions; (iii) nonqualifying capital instruments; and (iv) changes to theits primary federal regulator’s prompt corrective action rules, discussed below. The phase-in periods commenced on January 1, 2016 and extend until 2019.We do not have any immediate plans to elect to use the community bank leverage ratio framework but may make such an election in the future.
Well-Capitalized Requirements. The ratios described above are minimum standards in order for banking organizations to be considered “adequately capitalized.” Bank regulatory agencies uniformly encourage banks to hold more capital and be “well-capitalized” and, to that end, federal law and regulations provide various incentives for banking organizations to maintain regulatory capital at levels in excess of minimum regulatory requirements. For example, a banking organization that is well-capitalized may: (i) qualify for exemptions from prior notice or application requirements otherwise applicable to certain types of activities; (ii) qualify for expedited processing of other required notices or applications; and (iii) accept, roll-over or renew brokered deposits. Higher capital levels could also be required if warranted by the particular circumstances or risk profiles of individual banking organizations. For example, the Federal Reserve’s capital guidelines contemplate that additional capital may be required to take adequate account of, among other things, interest rate risk, or the risks posed by concentrations of credit, nontraditional activities or securities trading activities. Further, any banking organization experiencing or anticipating significant growth would be expected to maintain capital ratios, including tangible capital positions (i.e., Tier 1 Capital less all intangible assets), well above the minimum levels.
Under the capital regulations of the OCC, in order to be well‑capitalized,well-capitalized, a banking organization must maintain:
| ·
● | | A Common Equity Tier 1 CapitalCET1 ratio to risk-weighted assets of 6.5% or more; |
| ·
● | | A ratio of Tier 1 Capital to total risk-weighted assets of 8% (6% under Basel I); |
| ·
● | | A ratio of Total Capital to total risk-weighted assets of 10% (the same as Basel I); and |
| ·
● | | A leverage ratio of Tier 1 Capital to total adjusted average quarterly assets of 5% or greater. |
It is possible under the Basel III Rule to be well-capitalized while remaining out of compliance with the capital conservation buffer discussed above.
As of December 31, 2017: (i) the Bank was not subject to a directive from the OCC to increase its capital and (ii)2021, the Bank was well-capitalized, as defined by OCC regulations. As of December 31, 2017, the Company2021, we had regulatory capital in excess of the Federal Reserve’s requirements and met the Basel III Rule requirements to be well-capitalized.
Prompt Corrective Action. An FDIC-insured institution’s capital plays an important role in connection with regulatory enforcement as well. Federal law provides the federal banking regulators with broad power to take prompt corrective action to resolve the problems of undercapitalized institutions. The extent of the regulators’ powers depends on whether the institution in question is “adequately capitalized,” “undercapitalized,” “significantly undercapitalized” or “critically undercapitalized,” in each case as defined by regulation. Depending upon the capital category to which an institution is assigned, the regulators’ corrective powers include: (i) requiring the institution to submit a capital restoration plan; (ii) limiting the institution’s asset growth and restricting its activities; (iii) requiring the
institution to issue additional capital stock (including additional voting stock) or to sell itself; (iv) restricting transactions between the institution and its affiliates; (v) restricting the interest rate that the institution may pay on deposits; (vi) ordering a new election of directors of the institution; (vii) requiring that senior executive officers or directors be dismissed; (viii) prohibiting the institution from accepting deposits from correspondent banks; (ix) requiring the institution to divest certain subsidiaries; (x) prohibiting the payment of principal or interest on subordinated debt; and (xi) ultimately, appointing a receiver for the institution.
Regulation and Supervision of the Company
General. The Company, as the sole stockholder of the Bank, is a bank holding company. As a bank holding company, the Company is registered with, and subject to regulation, supervision and enforcement by, the Federal Reserve under the BHCA.Bank Holding Company Act, as amended (the “BHCA”). The Company is legally obligated to act as a source of financial and managerial strength to the Bank and to commit resources to support the Bank in circumstances where the Company might not otherwise do so. Under the BHCA, the Company is subject to periodic examination by the Federal Reserve and is required to file with the Federal Reserve periodic reports of the Company'sCompany’s operations and such additional information regarding the Company and the Bank as the Federal Reserve may require.
Acquisitions, Activities and Change in Control.The primary purpose of a bank holding company is to control and manage banks.The BHCA generally requires the prior approval of the Federal Reserve for any merger involving a bank holding company or any acquisition by a bank holding company of another bank or bank holding company. Subject to certain conditions (including deposit concentration limits established by the BHCA), the Federal Reserve may allow a bank holding company to acquire banks located in any state of the United States. In approving interstate acquisitions, the Federal Reserve is required to give effect to applicable state law limitations on the aggregate amount of deposits that may be held by the acquiring bank holding company and its FDIC-insured institution affiliates in the state in which the target bank is located (provided that those limits do not discriminate against out-of-state institutions or their holding companies) and state laws that require that the target bank have been in existence for a minimum period of time (not to exceed five years) before being acquired by an out-of-state bank holding company. Furthermore, in accordance with the Dodd-Frank Act, bank holding companies must be well-capitalized and examiners must rate them well-managed in order to effect interstate mergers or acquisitions. For a discussion of the capital requirements, see “Regulatory Emphasis on Capital” above.
Permitted Activities. The BHCA generally prohibits the Company from acquiring direct or indirect ownership or control of more than 5% of the voting shares of any company that is not a bank and from engaging in any business other than that of banking, managing and controlling banks or furnishing services to banks and their subsidiaries. This general prohibition is subject to a number of exceptions. The principal exception allows bank holding companies to engage in, and to own shares of companies engaged in, certain businesses found by the Federal Reserve prior to November 11, 1999, to be “so closely related to banking ... as to be a proper incident thereto.” This authority would permit the Company to engage in a variety of banking-related businesses, including the ownership and operation of a savings association, or any entity engaged in consumer finance, equipment leasing, the operation of a computer service bureau (including software development)
and mortgage banking and brokerage services. The BHCA does not place territorial restrictions on the domestic activities of nonbank subsidiaries of bank holding companies.
Additionally,As a bank holding companies that meet certain eligibility requirements prescribed by the BHCA andcompany, we also can elect to operatebe treated as a “financial holding company,” which would allow us to engage in a broader array of activities. In sum, a financial holding companies maycompany can engage in or own shares in companies engaged in, a wider range of nonbanking activities including securities and insurance underwriting and sales, merchant banking and any other activity that the Federal Reserve, in consultation with the Secretary of the Treasury, determines by regulation or order isare financial in nature or incidental or complementary to any such financial activity oractivities, including insurance underwriting, sales and brokerage activities; providing financial and investment advisory services and underwriting services; and engaging in limited merchant banking activities. We have not sought financial holding company status, but we may elect that status in the future as our business matures. If we were to elect in writing for financial holding company status, we would be required to be well capitalized and well managed, and each insured depository institution we control would also have to be well capitalized, well managed and have at least a satisfactory rating under the Community Reinvestment Act (discussed below).
Acquisition Activities. The primary purpose of a bank holding company is to control and manage banks.The BHCA generally requires the prior approval of the Federal Reserve determinesfor any merger involving a bank holding company or any acquisition by ordera bank holding company of another bank or bank holding company. In addition, the prior approval of the OCC is required for a national bank to merge with another bank or purchase the assets or assume the deposits of another bank. In determining whether to approve a proposed bank acquisition, federal bank regulators will consider, among other factors, the effect of the acquisition on competition, the public benefits expected to be complementaryreceived from the acquisition, the projected capital ratios and levels on a post-acquisition basis, and the acquiring institution’s record of addressing the credit needs of the communities it serves, including the needs of low and moderate income neighborhoods, consistent with the safe and sound operation of the bank, under the CRA.
On July 9, 2021, President Biden issued an Executive Order on Promoting Competition in the American Economy. Among other initiatives, the Executive Order encouraged the federal banking agencies to review their current merger oversight practices under the BHCA and the Bank Merger Act and adopt a plan for revitalization of such practices. There are many steps that must be taken by the agencies before any such financial activity and does not pose a substantial riskformal changes to the safetyframework for evaluating bank mergers can be finalized and the prospects for such action are uncertain at this time; however, the adoption of more expansive or soundness of FDIC-insured institutions orprescriptive standards may have an impact on our acquisition activities.
Change in Control. Under the financial system generally. The Company has not elected to operate asChange in Bank Control Act, a financial holding company.
Federal law also prohibits any person or company from acquiring “control”is required to file a notice with the Federal Reserve if it will, as a result of an FDIC-insured depository institutionthe transaction, own or its holding company without prior notice to the appropriate federal bank regulator. “Control” is conclusively presumed to exist upon the acquisition of 25%control 10% or more of the outstandingany class of voting securities or direct the management or policies of a bank or bank holding company but may arise under certain circumstances between 10% and 24.99% ownership.
Capital Requirements. Bankeither if the bank or bank holding companies are required to maintain capitalcompany has registered securities or if the acquirer would be the largest holder of that class of voting securities after the acquisition. For a change in accordance withcontrol at the holding company level, both the Federal Reserve capital adequacy requirements. Forand the subsidiary bank’s primary federal regulator must approve the change in control; at the bank level, only the bank’s primary federal regulator is involved.
In addition, the BHCA prohibits any entity from acquiring 25% (5% if the acquirer is a discussionbank holding company) or more of a bank holding company’s voting securities, or otherwise obtaining control or a controlling influence over the management or policies of a bank or bank holding company without regulatory approval. On January 30, 2020, the Federal Reserve issued a final rule (which became effective September 30, 2020) that clarified and codified the Federal Reserve’s standards for determining whether one company has control over another. The final rule established four categories of tiered presumptions of noncontrol that are based on the percentage of voting shares held by the investor (less than 5%, 5-9.9%, 10-14.9% and 15-24.9%) and the presence of other indicia of control. As the percentage of ownership increases, fewer indicia of control are permitted without falling outside of the presumption of noncontrol. These indicia of control include nonvoting equity ownership, director representation, management interlocks, business relationship and restrictive contractual covenants. Under the final rule, investors can hold up to 24.9% of the voting securities and up to 33% of the total equity of a company without necessarily having a controlling influence.
Capital Requirements. The Federal Reserve imposes certain capital requirements seeon a bank holding company under the BHCA, including a minimum leverage ratio and a minimum ratio of “qualifying” capital to risk-weighted assets. These requirements are essentially the same as those that apply to the Bank and are described above under “Regulatory Emphasis on Capital” above.
Capital.” Subject to certain restrictions, we are able to borrow money to make a capital contribution to the Bank, and these loans may be repaid from dividends paid from the Bank to the Company. Our ability to pay dividends depends on, among other things, the Bank’s ability to pay dividends to us, which is subject to regulatory restrictions as described below in “Regulation and Supervision of the Bank—Dividend Payments.” We are also able to raise capital for contribution to the Bank by issuing securities without having to receive regulatory approval, subject to compliance with federal and state securities laws.
Dividend Payments.The Company’s ability to pay dividends to its stockholders may be affected by both general corporate law considerations and policies of the Federal Reserve applicable to bank holding companies.As a Delaware corporation, the Company is subject to the limitations of the Delaware General Corporation Law (the “DGCL”). The DGCL allows the Company to pay dividends only out of its surplus (as defined and computed in accordance with the provisions of the DGCL) or if the Company has no such surplus, out of its net profits for the fiscal year in which the dividend is declared and/or the preceding fiscal year.
As a general matter, the Federal Reserve has indicated that the board of directors of a bank holding company should eliminate, defer or significantly reduce dividends to stockholders if: (i) the company's net income available to stockholders for the past four quarters, net of dividends previously paid during that period, is not sufficient to fully fund the dividends; (ii) the prospective rate of earnings retention is inconsistent with the company's capital needs and overall current and prospective financial condition; or (iii) the company will not meet, or is in danger of not meeting, its minimum regulatory capital adequacy ratios. The Federal Reserve also possesses enforcement powers over bank holding companies and their non-bank subsidiaries to prevent or remedy actions that represent unsafe or unsound practices or violations of applicable statutes and regulations. Among these powers is the ability to proscribe the payment of dividends by banks and
bank holding companies. In addition, under the Basel III Rule, financial institutions that seek the freedom to pay
dividends will have to maintain the 2.5% in Common Equity Tier 1 Capital attributable to the capital conservation buffer to be phased in over three years beginning in 2016.buffer. See “Regulatory Emphasis on Capital”Capital – Basel III Capital Standards” above.
Incentive Compensation. ThereIn addition to the potential restrictions on discretionary bonus compensation under the Basel III rules, the federal bank regulatory agencies have been a number of developments in recent years focusedissued guidance on incentive compensation plans sponsored by bank holding companies and banks, reflecting recognition bypolicies (the “Incentive Compensation Guidance”) intended to ensure that the bank regulatory agencies and Congress that flawed incentive compensation practices inpolicies of financial institutions do not undermine the safety and soundness of such institutions by encouraging excessive risk-taking. The Incentive Compensation Guidance, which covers all employees that have the ability to materially affect the risk profile of an institution, either individually or as part of a group, is based upon the key principles that a financial industry were one of many factors contributing to the global financial crisis. Layered on top of that are the abuses in the headlines dealing with product cross-selling incentive plans. The result is interagency guidance on soundinstitution’s incentive compensation practices and proposed rulemaking byarrangements should comply with the agencies required under Section 956 of the Dodd-Frank Act.
The interagency guidance recognized three core principles; effective incentive plans are required to:following principles: (i) provide employees incentives that appropriately balance risk and reward; (ii) be compatible with effective controls and risk-management; and (iii) be supported by strong corporate governance, including active and effective oversight by the organization’s board of directors. Much
The scope and content of federal bank regulatory agencies’ policies on executive compensation are continuing to develop and are likely to continue evolving in the guidance addresses large banking organizationsnear future. In 2016, federal agencies proposed regulations which could significantly change the regulation of incentive compensation programs at financial institutions. The proposal would create four tiers of institutions based on asset size. Institutions in the top two tiers would be subject to rules much more detailed and because of the size and complexity of their operations,proscriptive than are currently in effect. If interpreted aggressively by the regulators, expect those organizationsthe proposed rules could be used to maintain systematicprevent, as a practical matter, larger institutions from engaging in certain lines of business where substantial commission and formalized policies, procedures, and systems for ensuring that the incentive compensation arrangements for all executive and non-executive employees covered by this guidance are identified and reviewed, and appropriately balance risks and rewards. Smaller banking organizations like the Company that use incentive compensationbonus pool arrangements are expected to be less extensive, formalized, and detailed than those of the larger banks.
Section 956 ofnorm. In the Dodd-Frank Act required2016 proposal, the banking agencies, the National Credit Union Administration, the SEC and the Federal Housing Finance Agency to jointly prescribe regulations that prohibit types of incentive-based compensation that encourage inappropriate risk taking and to disclose certain information regarding such plans. On June 10, 2016, the agencies released an updated proposed rule for comment. Section 956 will only apply to banking organizationstop two tiers included institutions with assets of greater than $1 billion. The Company has consolidated assets greater than $1 billion and lessmore than $50 billion of assets, which would not currently apply to us. We cannot predict what final rules may be adopted, nor how they may be implemented and, the Company is considered a Level 3 banking organization under the proposed rules. The proposed rules contain mostly general principlestherefore, it cannot be determined at this time whether compliance with such policies will adversely affect our ability to hire, retain and reporting requirements for Level 3 institutions so there are no specific prescriptions or limits, deferral requirements or claw-back mandates. Risk management and controls are required, as is board or committee level approval and oversight. Management expects to review its incentive plans in light of the proposed rulemaking and guidance and implement policies and procedures that mitigate unreasonable risk. No final rule has been issued yet.motivate our key employees.
Monetary Policy. The monetary policy of the Federal Reserve has a significant effect on the operating results of financial or bank holding companies and their subsidiaries. Among the tools available to the Federal Reserve to affect the money supply are open market transactions in U.S. government securities, changes in the discount rate on bank borrowings and changes in reserve requirements against bank deposits. These means are used in varying combinations to influence overall growth and distribution of bank loans, investments and deposits, and their use may affect interest rates charged on loans or paid on deposits.
Federal Securities Regulation. The Company’s common stock is registered with the SEC under the Securities Exchange Act of 1934, as amended (the “Exchange Act”). Consequently, the Company is subject to the information, proxy solicitation, insider trading and other restrictions and requirements of the SEC under the Exchange Act.
Corporate Governance. The Dodd-Frank Act addressed many investor protection, corporate governance and executive compensation matters that will affect most U.S. publicly traded companies. It increased stockholder influence over boardsThe Dodd-Frank Act (i) grants stockholders of directors by requiringU.S. publicly traded companies to give stockholders a non-bindingan advisory vote on executive compensation and so-called “golden parachute” payments, and authorizing(ii) enhances independence requirements for compensation committee members, (iii) requires the SEC to promulgateadopt rules directing national securities exchanges to establish listing standards requiring all listed companies to adopt incentive-based compensation clawback policies for executive officers, and (iv) provides the SEC with authority to adopt proxy access rules that would allow stockholders of publicly traded companies to nominate candidates for election as a director and solicit voters for their own candidates usinghave those nominees included in a company’s proxy materials. The legislation also directedSEC has completed the Federal Reservebulk (although not all) of the rulemaking necessary to promulgate rules prohibiting excessive compensation paid to executivesimplement these provisions. However, on October 14, 2021, the SEC signaled a renewed interest in this rulemaking initiative by re-opening the comment period on a proposed rule issued originally in 2015 regarding clawbacks of bank holding companies, regardless of whether such companies are publicly traded.incentive-based executive compensation.
Regulation and Supervision of the Bank
General. The Bank is a national bank, chartered by the OCC under the National Bank Act. The deposit accounts of the Bank are insured by the FDIC’s Deposit Insurance Fund (the “DIF”) to the maximum extent provided under federal law and FDIC regulations, currently $250,000 per insured depositor category, and the Bank is a member of the Federal Reserve System.category. As a national bank, the Bank is subject to the examination, supervision, reporting and enforcement requirements of the OCC, the chartering authority for national banks. The FDIC, as administrator of the DIF, also has regulatory authority over the Bank.
Deposit Insurance. As an FDIC-insured institution, the Bank is required to pay deposit insurance premium assessments to the FDIC. Effective July 1, 2016, the FDIC changed its pricing system for banks under $10 billion, so that minimum and maximum initial base assessment rates are based on supervisory ratings. The initial base assessment rates currently range from three basis points to 30 basis points. At least semi-annually, the FDIC updates its loss and income projections for the DIF and, if needed, increases or decreases the assessment rates, following notice and comment on proposed rulemaking.
The assessment base against which an FDIC-insured institution’s deposit insurance premiums paid to the DIF are calculated based on its average consolidated total assets less its average tangible equity. This method shifts the burden of deposit insurance premiums toward those large depository institutions that rely on funding sources other than U.S. deposits.
The reserve ratio is the DIF balance divided by estimated insured deposits. The Dodd-Frank Act altered the minimum reserve ratio of the DIF, increasing the minimum from 1.15% to 1.35% of the estimated amount of total insured deposits, and eliminating the requirement that the FDIC pay dividends to FDIC-insured institutions when the reserve ratio exceeds certain thresholds. The reserve ratio reached 1.15%1.36% on JuneSeptember 30, 2016, when revised factors were put in place for calculating the assessment. If2018. Because the reserve ratio does not reachhas reached 1.35% by December 31, 2018, (provided it is at least 1.15%), thetwo deposit insurance assessment changes occurred under FDIC will impose a shortfall assessment on March 31,
2019,regulations: (1) surcharges on insured depository institutions with total consolidated assets of $10 billion or more. The FDIC will provide assessment credits to insured depository institutions, like the Bank,more (large institutions) ceased; and (2) banks with total consolidated assets of less than $10 billion, such as us, received assessment credits for the portion of their regular assessments that contributecontributed to the growth in the reserve ratio from between 1.15% and 1.35%. The FDIC will apply the credits each quarter that, which were applied when the reserve ratio iswas at leastor above 1.38% to offset. These assessment credits started with the regular deposit insurance assessments June 30, 2019, assessment invoiced in September 2019 and were fully used by March 31, 2020.
FICO Assessments. In addition to paying basic deposit insurance assessments, FDIC-insured institutions must pay Financing Corporation (“FICO”) assessments. FICO is a mixed-ownership governmental corporation chartered by the former Federal Home Loan Bank Board pursuant to the Competitive Equality Banking Act of 1987 to function as a financing vehicle for the recapitalization of the former Federal Savings and Loan Insurance Corporation. FICO issued 30-year noncallable bonds of approximately $8.1 billion that mature in 2017 through 2019. FICO’s authority to issue bonds ended on December 12, 1991. Since 1996, federal legislation has required that all FDIC-insured institutions pay assessments to cover interest payments on FICO’s outstanding obligations. The FICO assessment rate is adjusted quarterly and for the fourth quarter of 2017 was 0.46 basis points (46 cents per $100 dollars of assessable deposits).
Supervisory Assessments. National banks are required to pay supervisory assessments to the OCC to fund the operations of the OCC. The amount of the assessment is calculated using a formula that takes into accountconsiders the bank’sBank’s size and its supervisory condition.During the year ended December 31, 2017,2021, the Bank paid supervisory assessments to the OCC totaling $467,000.$474,000.
Capital Requirements. Banks are generally required to maintain capital levels in excess of other businesses. For a discussion of capital requirements, see “Regulatory Emphasis on Capital” above.
Liquidity Requirements. Liquidity is a measure of the ability and ease with which bank assets may be converted to cash. Liquid assets are those that can be converted to cash quickly if needed to meet financial obligations. To remain viable, FDIC-insured institutions must have enough liquid assets to meet their near-term obligations, such as withdrawals by depositors. Because the global financial crisis was in part a liquidity crisis, Basel III also includes a liquidity framework that requires FDIC-insured institutions to measure their liquidity against specific liquidity tests. One test, referred to asthe Liquidity Coverage Ratio (“LCR”), is designed to ensure that the banking entity has an adequate stock of unencumbered high-quality liquid assets that can be converted easily and immediately in private markets into cash to meet liquidity needs for a 30-calendar day liquidity stress scenario. The other test, known as the Net Stable Funding Ratio ("NSFR") is designed to promote more medium- and long-term funding of the assets and activities of FDIC-insured institutions over a one-year horizon. These tests provide an incentive for banks and holding companies to increase their holdings in Treasury securities and other sovereign debt as a component of assets, increase the use of long-term debt as a funding source and rely on stable funding like core deposits (in lieu of brokered deposits).
In addition to liquidity guidelines already in place, the federal bank regulatory agencies implemented the Basel III LCR in 2014 and have proposed the NSFR. While the LCR only applies to the largest banking organizations in the country, as will the NSFR, certain elements are expected to filter down to all FDIC-insured institutions. The Company has adopted a modified version of the LCR as a part of measuring the liquidity at the Bank. The Company has no plans to adopt the NSFR and has not received regulatory guidance indicating a requirement to do so.
Stress Testing.A stress test is an analysis or simulation designed to determine the ability of a given FDIC-insured institution to deal with an economic crisis, In October 2012, U.S. bank regulators unveiled new rules mandated by the Dodd-Frank Act that require the largest U.S. banks to undergo stress tests twice per year, once internally and once conducted by the regulators. Stress tests are not required for banks with less than $10 billion in assets; however, the FDIC now recommends stress testing as means to identify and quantify loan portfolio risk and the Bank is engaged in the process.
Dividend Payments. The primary source of funds for the Company is dividends from the Bank. Under the National Bank Act, a national bank may pay dividends out of its undivided profits in such amounts and at such times as the bank’s board of directors deems prudent. Without prior OCC approval, however, a national bank may not pay dividends in any calendar year that, in the aggregate, exceed the bank’s year-to-date net income plus the bank’s retained net income for the two preceding years. The payment of dividends by any FDIC-insured institution is affected by the requirement to maintain adequate capital pursuant to applicable capital adequacy guidelines and regulations, and an FDIC-insured institution generally is prohibited from paying any dividends if, following payment thereof, the institution would be undercapitalized. As described above, the Bank exceeded its capital requirements under applicable guidelines as of December 31, 2017.2021. Notwithstanding the availability of funds for dividends, however, the OCC may prohibit the payment of dividends by the Bank if it determines such payment would constitute an unsafe or unsound practice. In addition, under the Basel III Rule, institutions that seek the freedom to pay dividends will have to maintain the 2.5% in Common Equity Tier 1 Capital attributable to the capital conservation buffer to be phased in over three years beginning in 2016.buffer. See “Regulatory Emphasis on Capital” above.
Affiliate and Insider Transactions. The Bank is subject to certain restrictions imposed by federal law on “covered transactions” between the Bank and its “affiliates.” The Company is an affiliate of the Bank for purposes of these restrictions, and covered transactions subject to the restrictions include extensions of credit to the Company, investments in the stock or other securities of the Company and the acceptance of the stock or other securities of the Company as collateral for loans made by the Bank. The Dodd-Frank Act enhanced the requirements for certain transactions with affiliates, including an expansion of the definition of “covered transactions” and an increase in the amount of time for which collateral requirements regarding covered transactions must be maintained.
Certain limitations and reporting requirements are also placed on extensions of credit by the Bank to its directors and officers, to directors and officers of the Company and its subsidiaries, to principal stockholders of the Company and to “related interests” of such directors, officers and principal stockholders. In addition, federal law and regulations may affect the terms upon which any person who
is a director or officer of the Company or the Bank, or a principal stockholder of the Company, may obtain credit from banks with which the Bank maintains a correspondent relationship.
On December 22, 2020, the federal banking agencies issued an interagency statement extending the temporary relief from enforcement action against banks or asset managers, which become principal stockholders of banks, with respect to certain extensions of credit by banks that otherwise would violate Regulation O, provided the asset managers and banks satisfy certain conditions designed to ensure that there is a lack of control by the asset manager over the bank. This relief has been extended and will expire on the sooner of January 1, 2023, or the effective date of a final Federal Reserve rule having a revision to Regulation O that addresses the treatment of extensions of credit by a bank to fund complex-controlled portfolio companies that are insiders of a bank.
Safety and Soundness Standards/Risk Management. The federal banking agencies have adopted guidelines that establish operational and managerial standards to promote the safety and soundness of FDIC-insured institutions. The guidelines set forth standards for internal controls, information systems, internal audit systems, loan documentation, credit underwriting, interest rate exposure, asset growth, compensation, fees and benefits, asset quality and earnings.
In general, the safety and soundness guidelines prescribe the goals to be achieved in each area, and each institution is responsible for establishing its own procedures to achieve those goals. If an institution fails to comply with any of the standards set forth in the guidelines, the FDIC-insured institution’s primary federal regulator may require the institution to submit a plan for achieving and maintaining compliance. If an FDIC-insured institution fails to submit an acceptable compliance plan, or fails in any material respect to implement a compliance plan that has been accepted by its primary federal regulator, the regulator is required to issue an order directing the institution to cure the deficiency. Until the deficiency cited in the regulator’s order is cured, the regulator may restrict the FDIC-insured institution’s rate of growth, require the FDIC-insured institution to increase its capital, restrict the rates the institution pays on deposits or require the institution to take any action the regulator deems appropriate under the circumstances. Noncompliance with the standards established by the safety and soundness guidelines may also constitute grounds for other enforcement action by the federal bank regulatory agencies, including cease and desist orders and civil money penalty assessments.
During the past decade, theThe bank regulatory agencies have increasingly emphasized the importance of sound risk management processes and strong internal controls when evaluating the activities of the FDIC-insured institutions they supervise. Properly managing risks has been identified as critical to the conduct of safe and sound banking activities and has become even more important as new technologies, product innovation, and the size and speed of financial transactions have changed the nature of banking markets. The agencies have identified a spectrum of risks facing a banking institution including, but not limited to, credit, market, liquidity, operational, legal and reputational risk. In particular, recent regulatory pronouncements have focused on operational risk, which arises from the potential that inadequate information systems, operational problems, breaches in internal controls, fraud, or unforeseen catastrophes will result in unexpected losses. New products and services, third-party risk and cybersecurity are critical sources of operational risk that FDIC-insured institutions are expected to address in the current environment.address. The Bank is expected to have active board and senior management oversight; adequate policies, procedures, and limits; adequate risk measurement, monitoring, and management information systems; and comprehensive internal controls.
Branching Authority.National banks headquartered in Illinois, such as the Bank, have the same branching rights in Illinois as banks chartered under Illinois law, subject to OCC approval. Illinois law grants Illinois-chartered banks the authority to establish branches anywhere in the State of Illinois, subject to receipt of all required regulatory approvals.
The Dodd-Frank Act permits well-capitalized and well-managed banks to establish new interstate branches or acquire individual branches of a bank in another state (rather than the acquisition of an out-of-state bank in its entirety) without impediments.
Financial Subsidiaries.Under federal law and OCC regulations, national banks are authorized to engage, through “financial subsidiaries,” in any activity that is permissible for a financial holding company and any activity that the Secretary of the Treasury, in consultation with the Federal Reserve, determines is financial in nature or incidental to any such financial activity, except (i) insurance underwriting, (ii) real estate development or real estate investment activities (unless otherwise permitted by law), (iii) insurance company portfolio investments and (iv) merchant banking. The authority of a national bank to invest in a financial subsidiary is subject to a number of conditions, including, among other things, requirements that the bank must be well-managed and well-capitalized (after deducting from capital the bank’s outstanding investments in financial subsidiaries). The Bank has not applied for approval to establish any financial subsidiaries.
Federal Home Loan Bank System. The Bank is a member of the Federal Home Loan Bank of Chicago (the “FHLBC”), which serves as a central credit facility for its members. The FHLBC is funded primarily from proceeds from the sale of obligations of the FHLBC system. It makes loans to member banks in the form of FHLBC advances. All advances from the FHLBC are required to be fully collateralized as determined by the FHLBC.
Transaction Account Reserves.Federal Reserve regulations requirehave historically required FDIC-insured institutions to maintain reserves against their transaction accounts (primarily NOW and regular checking accounts). For 2017As of March 26, 2020, the first $15.5 million of otherwise reservable balances are exempt from reserves and have a zero percentFRBC eliminated reserve requirement;requirements for transaction accounts aggregating more than $15.5 million to $115.1 million,certain depository institutions, including the Bank. As such, there was no reserve requirement is 3%as of total transaction accounts; and for net transaction accounts in excess of $115.1 million, the reserve requirement is 3% up to $115.1 million plus 10%December 31, 2020 or 2021. The nature of the aggregate amount of total transaction accountsCompany’s business requires that it maintain amounts with other banks and federal funds which, at times, may exceed federally insured limits. Management monitors these correspondent relationships, and the Company has not experienced any losses in excess of $115.1 million.such accounts. These reserve requirements are subject to annual adjustment by the Federal Reserve.
Community Reinvestment Act Requirements. The Community Reinvestment Act (“CRA”) requires the Bank to have a continuing and affirmative obligation in a safe and sound manner to help meet the credit needs of its entire community, including low- and moderate-income neighborhoods. Federal regulators regularly assess the Bank’s record of meeting the credit needs of its communities. Applications for additional acquisitions would be affected by the evaluation of the Bank’s effectiveness in meeting its Community ReinvestmentCRA requirements. The Bank received an overall “outstanding” rating on its most recent CRA performance evaluation.
In December 2019, the OCC and the FDIC issued a notice of proposed rulemaking intended to (i) clarify which activities qualify for CRA credit; (ii) update where activities count for CRA credit; (iii) create a more transparent and objective method for measuring CRA performance; and (iv) provide for more transparent, consistent, and timely CRA-related data collection, recordkeeping, and reporting. However, the Federal Reserve has not joined the proposed rulemaking. In May 2020, the OCC issued its final CRA rule, which was later rescinded in December 2021, replacing it with a rule based on the rules adopted jointly by the federal banking agencies in 1995. On the same day that the OCC announced its plans to rescind the CRA final rule, the OCC, FDIC, and Federal Reserve announced that they are working together to “strengthen and modernize the rules implementing the CRA.” The effects on the Bank of any potential change to the CRA rules will depend on the final form of any federal rulemaking and cannot be predicted at this time. Management will continue to evaluate any changes to the CRA’s regulations and their impact to the Bank.
Fair Lending Requirements. We are subject to certain fair lending requirements and reporting obligations involving lending operations. A number of laws and regulations provide these fair lending requirements and reporting obligations, including, at the federal level, the Equal Credit Opportunity Act requirements.
Anti-Money Laundering. The Uniting(“ECOA”), as amended by the Dodd-Frank Act, and Strengthening America by Providing Appropriate Tools Required to InterceptRegulation B, as well as the Fair Housing Act (“FHA”) and Obstruct Terrorism Actregulations implementing the FHA. ECOA and Regulation B prohibit discrimination in any aspect of 2001 (the “Patriot Act”) is designed to deny terroristsa credit transaction based on a number of prohibited factors, including race or color, religion, national origin, sex, marital status, age, the applicant’s receipt of income derived from public assistance programs, and criminals the applicant’s exercise, in good faith, of any right under the Consumer Credit Protection Act. ECOA and Regulation B include lending acts and practices that are specifically prohibited, permitted, or required, and these laws and regulations proscribe data collection requirements, legal action statute of limitations, and disclosure of the consumer’s ability to obtain accessreceive a copy of any appraisal(s) and valuation(s) prepared in connection with certain loans secured by dwellings. FHA prohibits discrimination in all aspects of residential real-estate related transactions based on prohibited factors, including race or color, national origin, religion, sex, familial status, and handicap.
In addition to prohibiting discrimination in credit transactions on the basis of prohibited factors, these laws and regulations can cause a lender to be liable for policies that result in a disparate treatment of or have a disparate impact on a protected class of persons. If a pattern or practice of lending discrimination is alleged by a regulator, then the matter may be referred by the agency to the U.S. Department of Justice (“DOJ”) for investigation. In December 2012, the DOJ and CFPB entered into a Memorandum of Understanding under which the agencies have agreed to share information, coordinate investigations, and have generally committed to strengthen their coordination efforts. In addition to substantive penalties and corrective measures that may be required for a violation of certain fair lending laws, the federal banking agencies may take compliance with fair lending requirements into account when regulating and supervising other activities of the bank, including in acting on expansionary proposals.
Anti-Money Laundering. As a financial systeminstitution, we must maintain anti-money laundering programs that include established internal policies, procedures and has significant implicationscontrols, a designated compliance officer, an ongoing employee training program, and testing of the program by an independent audit function. The program must comply with the anti-money laundering provisions of the Bank Secrecy Act (“BSA”). Financial institutions are prohibited from entering into specified financial transactions and account relationships and must meet enhanced standards for FDIC-insureddue diligence and “knowing your customer” in their dealings with foreign financial institutions, brokers, dealersforeign customers and other businesses involved inhigh risk customers. Financial institutions must also take reasonable steps to conduct enhanced scrutiny of account relationships to guard against money laundering and to report any suspicious transactions. Financial institutions must comply with requirements regarding risk-based procedures for conducing ongoing customer due diligence, which requires us to take appropriate steps to understand the transfernature and purpose of
money. The Patriot Act mandates financial services companies to have policies customer relationships and procedures with respect to measures designed to address any or allidentify and verify the identity of the following matters: (i) customer identification programs; (ii) money laundering; (iii) terrorist financing; (iv) identifying and reporting suspicious activities and currency transactions; (v) currency crimes; and (vi) cooperation between FDIC-insured institutions andbeneficial owners of legal entity customers.
Current laws, such as the USA PATRIOT Act (which amended the BSA), as described below, provide law enforcement authorities.authorities with increased access to financial information maintained by banks. Anti-money laundering obligations have been substantially strengthened as a result of the USA PATRIOT Act. Bank regulators routinely examine institutions for compliance with these obligations, and this area has become a particular focus of the regulators in recent years. Federal regulators evaluate the effectiveness of an applicant in combating money laundering when determining whether to approve a proposed bank merger, acquisition, restructuring, or other expansionary activity. The regulators and other governmental authorities have been active in imposing “cease and desist” orders and significant money penalty sanctions against institutions found to be in violation of the anti-money laundering regulations.
On January 1, 2021, Congress overrode former President Trump’s veto and thereby enacted the National Defense Authorization Act for Fiscal Year 2021 (“NDAA”). The NDAA provides for one of the most significant overhauls of the BSA and related anti-money laundering laws since the USA Patriot Act. Notably, changes include:
| ● | expansion of coordination and information sharing efforts among the agencies tasked with administering anti-money laundering and countering the financing of terrorism requirements, including the Financial Crimes Enforcement Network (“FinCEN”), the primary federal banking regulators, federal law enforcement agencies, national security agencies, the intelligence community, and financial institutions; |
| ● | providing additional penalties with respect to violations of BSA and enhancing the powers of FinCEN; |
| ● | significant updates to the beneficial ownership collection rules and the creation of a registry of beneficial ownership which will track the beneficial owners of reporting companies which may be shared with law enforcement and financial institutions conducting due diligence under certain circumstances; |
| ● | improvements to existing information sharing provisions that permit financial institutions to share information relating to SARs with foreign branches, subsidiaries, and affiliates (except those located in China, Russia, or certain other jurisdictions) for the purpose of combating illicit finance risks; and |
| ● | enhanced whistleblower protection provisions, allowing whistleblower(s) who provide original information which leads to successful enforcement of anti-money laundering laws in certain judicial or administrative actions resulting in certain monetary sanctions to receive up to 30% of the amount that is collected in monetary sanctions as well as increased protections. |
Concentrations in Commercial Real Estate. Concentration risk exists when FDIC-insured institutions deploy too many assets to any one industry or segment. A concentration in commercial real estate is one example of regulatory concern. The interagency Concentrations in Commercial Real Estate Lending, Sound Risk Management Practices guidance (“CRE Guidance”) provides supervisory criteria, including the following numerical indicators, to assist bank examiners in identifying banks with potentially significant commercial real estate loan concentrations that may warrant greater supervisory scrutiny: (i) non-owner occupied commercial real estate loans outstanding plus any undrawn commitment exceeding 300% of capital and increasing 50% or more in the preceding three years; or (ii) construction and land development loans outstanding plus any undrawn commitment exceeding 100% of capital. The CRE Guidance does not limit banks’ levels of commercial real estate lending activities, but rather guides institutions in developing risk management practices and levels of capital that are commensurate with the level and nature of their commercial real estate concentrations. On December 18, 2015, the federal banking agencies issued a statement to reinforce prudent risk-management practices related to CRE lending, having observed substantial growth in many CRE asset and lending markets, increased competitive pressures, rising CRE concentrations in banks, and an easing of CRE underwriting standards. The federal bank agencies reminded FDIC-insured institutions to maintain underwriting discipline and exercise prudent risk-management practices to identify, measure, monitor, and manage the risks arising from CRE lending. In addition, FDIC-insured institutions must maintain capital commensurate with the level and nature of their CRE concentration risk.
Based on the Bank'sBank’s loan portfolio as of December 31, 2017,2021, concentrations in commercial real estate did not exceedexceeded the 300% guideline for non-owner occupied commercial real estate loans, primarily due to additional loans acquired from the West Suburban acquisition. We continue to monitor concentration levels as we seek to manage to an acceptable level of risk with all loan portfolio segments.
Financial Privacy and Cybersecurity. Under privacy protection provisions of the Gramm-Leach-Bliley Act of 1999 and related regulations, we are limited in our ability to disclose non-public information about consumers to nonaffiliated third parties. These limitations require disclosure of privacy policies to consumers and, in some circumstances, allow consumers to prevent disclosure of certain personal information to a nonaffiliated third party. Federal banking agencies have adopted guidelines for establishing information security standards and cybersecurity programs for implementing safeguards under the supervision of the board of directors. These
guidelines, along with related regulatory materials, increasingly focus on risk management and processes related to information technology and the use of third parties in the provision of financial services.
Consumers must be notified in the event of a data breach under applicable state laws. Multiple states and Congress are considering laws or regulations which could create new individual privacy rights and impose increased obligations on companies handling personal data. For example, on November 18, 2021, the 100% guidelinefederal financial regulatory agencies published a final rule that will impose upon banking organizations and their service providers new notification requirements for constructionsignificant cybersecurity incidents. Specifically, the final rule requires banking organizations to notify their primary federal regulator as soon as possible and development loans.no later than 36 hours after the discovery of a “computer-security incident” that rises to the level of a “notification incident” within the meaning attributed to those terms by the final rule. Banks’ service providers are required under the final rule to notify any affected bank to or on behalf of which the service provider provides services “as soon as possible” after determining that it has experienced an incident that materially disrupts or degrades, or is reasonably likely to materially disrupt or degrade, covered services provided to such bank for as much as four hours. The final rule will take effect on April 1, 2022 and banks and their service providers must be in compliance with the requirements of the rule by May 1, 2022.
Consumer Protection Regulations. The activities of the Bank are subject to a variety of statutes and regulations designed to protect consumers. This includes Title X of the Dodd-Frank Act, which prohibits engaging in any unfair, deceptive, or abusive acts or practices (“UDAAP”). UDAAP claims involve detecting and assessing risks to consumers and to markets for consumer financial products and services. Interest and other charges collected or contracted for by the Bank are subject to state usury laws and federal laws concerning interest rates. The loan operations of the Bank are also subject to federal laws applicable to credit transactions, such as:
| ● | the Truth-In-Lending Act (“TILA”) and Regulation Z, governing disclosures of credit and servicing terms to consumer borrowers and including substantial requirements for mortgage lending and servicing, as mandated by the Dodd-Frank Act; | |
| ● | the Home Mortgage Disclosure Act and Regulation C, requiring financial institutions to provide information to enable the public and public officials to determine whether a financial institution is fulfilling its obligation to help meet the housing needs of the communities they serve; | |
| ● | ECOA and Regulation B, prohibiting discrimination on the basis of race, color, religion, or other prohibited factors in any aspect of a credit transaction; | |
| ● | the Fair Credit Reporting Act, as amended by the Fair and Accurate Credit Transactions Act and Regulation V, as well as the rules and regulations of the FDIC governing the use of consumer reports, provision of information to credit reporting agencies, certain identity theft protections and certain credit and other disclosures; | |
| ● | the Fair Debt Collection Practices Act and Regulation F, governing the manner in which consumer debts may be collected by collection agencies and intending to eliminate abusive, deceptive, and unfair debt collection practices; | |
| ● | the Real Estate Settlement Procedures Act (“RESPA”) and Regulation X, which governs various aspects of residential mortgage loans, including the settlement and servicing process, dictates certain disclosures to be provided to consumers, and imposes other requirements related to compensation of service providers, insurance escrow accounts, and loss mitigation procedures; |
| ● | the Secure and Fair Enforcement for Mortgage Licensing Act (“SAFE Act”) which mandates a nationwide licensing and registration system for residential mortgage loan originators. The SAFE Act also prohibits individuals from engaging in the business of a residential mortgage loan originator without first obtaining and maintaining annually registration as either a federal or state licensed mortgage loan originator; |
| ● | the Homeowners Protection Act, or the PMI Cancellation Act, provides requirements relating to private mortgage insurance on residential mortgages, including the cancelation and termination of PMI, disclosure and notification requirements, and the requirement to return unearned premiums; |
| ● | the Fair Housing Act prohibits discrimination in all aspects of residential real-estate related transactions based on race or color, national origin, religion, sex, and other prohibited factors; |
| ● | the Servicemembers Civil Relief Act and Military Lending Act, providing certain protections for servicemembers, members of the military, and their respective spouses, dependents and others; and |
| ● | Section 106(c)(5) of the Housing and Urban Development Act requires making home ownership available to eligible homeowners. |
The deposit operations of the Bank are also subject to federal laws, such as:
| ● | the Federal Deposit Insurance Act (“FDIA”), which, among other things, limits the amount of deposit insurance available per insured depositor category to $250,000 and imposes other limits on deposit-taking; | |
| ● | the Right to Financial Privacy Act, which imposes a duty to maintain the confidentiality of consumer financial records and prescribes procedures for complying with administrative subpoenas of financial records; | |
| ● | the Electronic Funds Transfer Act and Regulation E, which governs the rights, liabilities, and responsibilities of consumers and financial institutions using electronic fund transfer services, and which generally mandates disclosure requirements, establishes limitations on liability applicable to consumers for unauthorized electronic fund transfers, | |
| | dictates certain error resolution processes, and applies other requirements relating to automatic deposits to and withdrawals from deposit accounts; | |
| ● | the Expedited Funds Availability Act and Regulation CC, setting forth requirements to make funds deposited into transaction accounts available according to specified time schedules, disclose funds availability policies to customers, and relating to the collection and return of checks and electronic checks, including the rules regarding the creation or receipt of substitute checks; and | |
| ● | the Truth in Savings Act and Regulation DD, which requires depository institutions to provide disclosures so that consumers can make meaningful comparisons about depository institutions and accounts. | |
The Consumer Financial Services. Protection Bureau (the “CFPB”) is an independent regulatory authority housed within the Federal Reserve. The historical structure of federal consumer protection regulation applicableCFPB has broad authority to all providersregulate the offering and provision of consumer financial products and services changed significantly on July 21, 2011, whenservices. The CFPB has the CFPB commenced operationsauthority to supervise and enforce consumer protection laws. The CFPB has broad rulemaking authority for a wide range of consumer protection laws that apply to all providers of consumer products and services, including the Bank, as well as the authority to prohibit “unfair, deceptive or abusive” acts and practices. The CFPB has examination and enforcement authority over providersexamine depository institutions with more than $10 billion in assets. FDIC-insuredassets for compliance with federal consumer laws. The authority to supervise and examine depository institutions with $10 billion or less in assets, likesuch as us, for compliance with federal consumer laws remains largely with those institutions’ primary regulators. However, the Bank, continueCFPB may participate in examinations of these smaller institutions on a “sampling basis” and may refer potential enforcement actions against such institutions to be examined by their applicable bankprimary regulators.
Because abuses As such, the CFPB may participate in connection with residential mortgages were a significant factor contributingexaminations of the Bank. In addition, states are permitted to adopt consumer protection laws and regulations that are stricter than the global financial crisis, many new rules issuedregulations promulgated by the CFPB, and requiredstate attorneys general are permitted to enforce consumer protection rules adopted by the CFPB against certain institutions.
The CFPB has issued a number of significant rules that impact nearly every aspect of the lifecycle of consumer financial products and services, including rules regarding residential mortgage loans. These rules implement Dodd-Frank Act address mortgageamendments to ECOA, TILA and mortgage-related products, their underwriting, origination,RESPA. Among other things, the rules adopted by the CFPB require banks to: (i) develop and implement procedures to ensure compliance with a “reasonable ability-to-repay” test; (ii) implement new or revised disclosures, policies and procedures for originating and servicing mortgages, including, but not limited to, pre-loan counseling, early intervention with delinquent borrowers and sales. The Dodd-Frank Act significantly expanded underwriting requirements applicable tospecific loss mitigation procedures for loans secured by 1-4 family residential real propertya borrower’s principal residence, and augmented federal law combating predatory lending practices. In addition to numerousmortgage origination disclosures, which integrate existing requirements under TILA and RESPA; (iii) comply with additional restrictions on mortgage loan originator hiring and compensation; and (iv) comply with new disclosure requirements the Dodd‑Frank Act imposed newand standards for mortgage loan originations on all lenders, including all FDIC-insured institutions, in an effort to strongly encourage lenders to verify a borrower’s “ability to repay,” while also establishing a presumption of compliance forappraisals and certain “qualified mortgages.” In addition, the Dodd-Frank Act generally required lenders or securitizers to retain an economic interest in the credit risk relating to loans that the lender sells, and other asset‑backed securities that the securitizer issues, if the loans have not complied with the ability-to-repay standards. The Company does not currently expect the CFPB’s rules to have a significant impact on the Bank’s operations, except for higher compliance costs.financial products.
GUIDE 3 STATISTICAL DATA REQUIREMENTS
The statistical data required by Guide 3 of the Guides for Preparation and Filing of Reports and Registration Statements under the Securities Exchange Act of 1934 is set forth in the following pages. This data should be read in conjunction with the consolidated financial statements, related notes and "Management's Discussion and Analysis of Financial Condition and Results of Operations" as set forth in Part II Items 7 and 8. All dollars in the tables are expressed in thousands.
I.Distribution of Assets, Liabilities and Stockholders’ Equity; Interest Rate and Interest Differential.
The following table sets forth certain information relating to the Company’s average consolidated balance sheets and reflects the yield on average interest earning assets and cost of average interest bearing liabilities for the years indicated obtained by dividing the related interest by the average balance of assets or liabilities. Average balances are derived from daily balances.
Analysis of Average Balances,
Tax Equivalent Interest and Rates
Years ended December 31, 2017, 2016 and 2015
| | | | | | | | | | | | | | | | | | | | | | | | |
| 2017 | | 2016 | | 2015 |
| Average | | | | | Rate | | Average | | | | | Rate | | Average | | | | | Rate |
| Balance | | Interest | | % | | Balance | | Interest | | % | | Balance | | Interest | | % |
Assets | | | | | | | | | | | | | | | | | | | | | | | | |
Interest bearing deposits with financial institutions | $ | 12,224 | | $ | 134 | | 1.08 | | $ | 33,226 | | $ | 169 | | 0.50 | | $ | 20,066 | | | $ | 55 | | 0.27 |
Securities: | | | | | | | | | | | | | | | | | | | | | | | | |
Taxable | | 347,712 | | | 10,202 | | 2.93 | | | 635,914 | | | 15,865 | | 2.49 | | | 642,132 | | | | 14,037 | | 2.19 |
Non-taxable (TE) | | 208,142 | | | 9,137 | | 4.39 | | | 36,643 | | | 1,295 | | 3.53 | | | 22,311 | | | | 834 | | 3.74 |
Total securities | | 555,854 | | | 19,339 | | 3.48 | | | 672,557 | | | 17,160 | | 2.55 | | | 664,443 | | | | 14,871 | | 2.24 |
Dividends from FHLBC and FRBC | | 8,127 | | | 370 | | 4.55 | | | 7,944 | | | 333 | | 4.19 | | | 8,545 | | | | 306 | | 3.58 |
Loans and loans held-for-sale1 | | 1,537,742 | | | 70,950 | | 4.55 | | | 1,218,931 | | | 56,263 | | 4.54 | | | 1,149,590 | | | | 53,327 | | 4.58 |
Total interest earning assets | | 2,113,947 | | | 90,793 | | 4.25 | | | 1,932,658 | | | 73,925 | | 3.78 | | | 1,842,644 | | | | 68,559 | | 3.68 |
Cash and due from banks | | 33,738 | | | - | | - | | | 31,689 | | | - | | - | | | 29,659 | | | | - | | - |
Allowance for loan and lease losses | | (16,390) | | | - | | - | | | (15,955) | | | - | | - | | | (19,323) | | | | - | | - |
Other noninterest bearing assets | | 187,503 | | | - | | - | | | 194,356 | | | - | | - | | | 212,142 | | | | - | | - |
Total assets | $ | 2,318,798 | | | | | | | $ | 2,142,748 | | | | | | | $ | 2,065,122 | | | | | | |
| | | | | | | | | | | | | | | | | | | | | | | | |
Liabilities and Stockholders' Equity | | | | | | | | | | | | | | | | | | | | | | | | |
NOW accounts | $ | 425,435 | | $ | 424 | | 0.10 | | $ | 389,266 | | $ | 358 | | 0.09 | | $ | 345,472 | | | $ | 300 | | 0.09 |
Money market accounts | | 278,826 | | | 349 | | 0.13 | | | 273,101 | | | 274 | | 0.10 | | | 292,725 | | | | 282 | | 0.10 |
Savings accounts | | 261,974 | | | 177 | | 0.07 | | | 256,905 | | | 157 | | 0.06 | | | 249,570 | | | | 152 | | 0.06 |
Time deposits | | 389,771 | | | 4,227 | | 1.08 | | | 404,285 | | | 3,640 | | 0.90 | | | 410,691 | | | | 3,201 | | 0.78 |
Interest bearing deposits | | 1,356,006 | | | 5,177 | | 0.38 | | | 1,323,557 | | | 4,429 | | 0.33 | | | 1,298,458 | | | | 3,935 | | 0.30 |
Securities sold under repurchase agreements | | 31,478 | | | 17 | | 0.05 | | | 34,016 | | | 4 | | 0.01 | | | 28,194 | | | | 3 | | 0.01 |
Other short-term borrowings | | 67,959 | | | 741 | | 1.08 | | | 26,518 | | | 102 | | 0.38 | | | 21,945 | | | | 30 | | 0.13 |
Junior subordinated debentures | | 57,615 | | | 4,002 | | 6.95 | | | 57,567 | | | 4,334 | | 7.53 | | | 57,520 | | | | 4,287 | | 7.45 |
Senior notes | | 44,010 | | | 2,689 | | 6.11 | | | 2,050 | | | 112 | | 5.46 | | | - | | | | - | | - |
Subordinated debt | | - | | | - | | - | | | 42,910 | | | 949 | | 2.18 | | | 45,000 | | | | 814 | | 1.78 |
Notes payable and other borrowings | | - | | | - | | - | | | 477 | | | 8 | | 1.65 | | | 500 | | | | 7 | | 1.38 |
Total interest bearing liabilities | | 1,557,068 | | | 12,626 | | 0.81 | | | 1,487,095 | | | 9,938 | | 0.67 | | | 1,451,617 | | | | 9,076 | | 0.62 |
Noninterest bearing deposits | | 547,719 | | | - | | - | | | 476,422 | | | - | | - | | | 429,403 | | | | - | | - |
Other liabilities | | 22,131 | | | - | | - | | | 12,929 | | | - | | - | | | 10,712 | | | | - | | - |
Stockholders' equity | | 191,880 | | | - | | - | | | 166,302 | | | - | | - | | | 173,390 | | | | - | | - |
Total liabilities and stockholders' equity | $ | 2,318,798 | | | | | | | $ | 2,142,748 | | | | | | | $ | 2,065,122 | | | | | | |
Net interest income (TE) | | | | $ | 78,167 | | | | | | | $ | 63,987 | | | | | | | | $ | 59,483 | | |
Net interest income (TE) to total earning assets | | | | | | | 3.70 | | | | | | | | 3.31 | | | | | | | | | 3.23 |
Interest bearing liabilities to earning assets | | 73.66 | % | | | | | | | 76.95 | % | | | | | | | 78.78 | % | | | | | |
1 Interest income from loans is shown tax equivalent as discussed below and includes fees of $2.4 million, $2.5 million and $1.8 million for 2017, 2016 and 2015, respectively. Nonaccrual loans are included in the above stated average balances.
For purposes of discussion, net interest income and net interest income to interest earning assets have been adjusted to a non-GAAP tax equivalent (“TE”) basis using a marginal rate of 35% to more appropriately compare returns on tax-exempt loans and securities to other earning assets. The table below provides a reconciliation of each non-GAAP TE measure to the GAAP equivalent:
| | | | | | | | | | |
| | Effect of Tax Equivalent Adjustment | |
| | 2017 | | 2016 | | 2015 | |
Interest income (GAAP) | | $ | 87,505 | | $ | 73,379 | | $ | 68,164 | |
Taxable equivalent adjustment - loans | | | 90 | | | 93 | | | 103 | |
Taxable equivalent adjustment - securities | | | 3,198 | | | 453 | | | 292 | |
Interest income (TE) | | | 90,793 | | | 73,925 | | | 68,559 | |
Less: interest expense (GAAP) | | | 12,626 | | | 9,938 | | | 9,076 | |
Net interest income (TE) | | $ | 78,167 | | $ | 63,987 | | $ | 59,483 | |
Net interest income (GAAP) | | $ | 74,879 | | $ | 63,441 | | $ | 59,088 | |
Average interest earning assets | | $ | 2,113,947 | | $ | 1,932,658 | | $ | 1,842,644 | |
Net interest income to total interest earning assets | | | 3.54 | % | | 3.28 | % | | 3.21 | % |
Net interest income to total interest earning assets (TE) | | | 3.70 | % | | 3.31 | % | | 3.23 | % |
The following table allocates the changes in net interest income to changes in either average balances or average rates for interest earning assets and interest bearing liabilities. Interest income is measured on a tax-equivalent basis using a 35% marginal rate. Interest income not yet received on nonaccrual loans is reversed upon transfer to nonaccrual status; future receipt of interest income is a reduction to principal while in nonaccrual status.
Analysis of Year-to-Year Changes in Net Interest Income1
| | | | | | | | | | | | | | | | | | | |
| | 2017 Compared to 2016 | | 2016 Compared to 2015 | |
| | Change Due to | | | | | Change Due to | | | | |
| | Average | | Average | | Total | | Average | | Average | | Total | |
| | Balance | | Rate | | Change | | Balance | | Rate | | Change | |
Interest and dividend income | | | | | | | | | | | | | | | | | | | |
Interest bearing deposits | | $ | 42 | | $ | (77) | | $ | (35) | | $ | 50 | | $ | 64 | | $ | 114 | |
Securities: | | | | | | | | | | | | | | | | | | | |
Taxable | | | (9,260) | | | 3,597 | | | (5,663) | | | (135) | | | 1,963 | | | 1,828 | |
Tax-exempt | | | 7,456 | | | 386 | | | 7,842 | | | 504 | | | (43) | | | 461 | |
Dividends from FHLBC and FRBC | | | 8 | | | 29 | | | 37 | | | (19) | | | 46 | | | 27 | |
Loans and loans held-for-sale | | | 14,557 | | | 130 | | | 14,687 | | | 3,364 | | | (428) | | | 2,936 | |
Total interest and dividend income | | | 12,803 | | | 4,065 | | | 16,868 | | | 3,764 | | | 1,602 | | | 5,366 | |
Interest expense | | | | | | | | | | | | | | | | | | | |
NOW accounts | | | 35 | | | 31 | | | 66 | | | 40 | | | 18 | | | 58 | |
Money market accounts | | | 6 | | | 69 | | | 75 | | | (21) | | | 13 | | | (8) | |
Savings accounts | | | 3 | | | 17 | | | 20 | | | 4 | | | 1 | | | 5 | |
Time deposits | | | (125) | | | 712 | | | 587 | | | (49) | | | 488 | | | 439 | |
Securities sold under repurchase agreements | | | - | | | 13 | | | 13 | | | 1 | | | - | | | 1 | |
Other short-term borrowings | | | 293 | | | 346 | | | 639 | | | 7 | | | 65 | | | 72 | |
Junior subordinated debentures | | | 4 | | | (336) | | | (332) | | | 4 | | | 43 | | | 47 | |
Senior notes | | | 2,562 | | | 15 | | | 2,577 | | | 112 | | | - | | | 112 | |
Subordinated debt | | | (475) | | | (474) | | | (949) | | | (36) | | | 171 | | | 135 | |
Notes payable and other borrowings | | | (4) | | | (4) | | | (8) | | | - | | | 1 | | | 1 | |
Total interest expense | | | 2,299 | | | 389 | | | 2,688 | | | 62 | | | 800 | | | 862 | |
Net interest and dividend income | | $ | 10,504 | | $ | 3,676 | | $ | 14,180 | | $ | 3,702 | | $ | 802 | | $ | 4,504 | |
1 The changes in net interest income are created by changes in both interest rates and volumes. In the table above, volume variances are computed using the change in volume multiplied by previous year’s rate. Rate variances are computed using the change in rate multiplied by the previous year’s volume. The change in interest due to both rate and volume has been allocated between factors in proportion to the relationship of absolute dollar amounts of the change in each.
II.Investment Portfolio
The following table presents the composition of the securities portfolio by major category as of December 31 of each year indicated:
Securities Portfolio Composition
| | | | | | | | | | | | | | | | | | | |
| | 2017 | | 2016 | | 2015 | |
| | Amortized | | Fair | | Amortized | | Fair | | Amortized | | Fair | |
| | Cost | | Value | | Cost | | Value | | Cost | | Value | |
Securities available-for-sale | | | | | | | | | | | | | | | | | | | |
U.S. Treasury | | $ | 4,002 | | $ | 3,947 | | $ | - | | $ | - | | $ | 1,509 | | $ | 1,509 | |
U.S. government agencies | | | 13,062 | | | 13,061 | | | - | | | - | | | 1,683 | | | 1,556 | |
U.S. government agency mortgage-backed | | | 12,372 | | | 12,214 | | | 42,511 | | | 41,534 | | | 2,040 | | | 1,996 | |
States and political subdivisions | | | 272,240 | | | 278,092 | | | 68,718 | | | 68,703 | | | 30,341 | | | 30,526 | |
Corporate bonds | | | 823 | | | 833 | | | 10,957 | | | 10,630 | | | 30,157 | | | 29,400 | |
Collateralized mortgage obligations | | | 66,892 | | | 65,939 | | | 174,352 | | | 170,927 | | | 68,743 | | | 66,920 | |
Asset-backed securities | | | 113,983 | | | 112,932 | | | 146,391 | | | 138,407 | | | 241,872 | | | 231,908 | |
Collateralized loan obligations | | | 54,271 | | | 54,421 | | | 102,504 | | | 101,637 | | | 94,374 | | | 92,251 | |
Total securities available-for-sale | | $ | 537,645 | | $ | 541,439 | | $ | 545,433 | | $ | 531,838 | | $ | 470,719 | | $ | 456,066 | |
| | | | | | | | | | | | | | | | | | | |
Held-to-maturity | | | | | | | | | | | | | | | | | | | |
U.S. government agency mortgage-backed | | $ | - | | $ | - | | $ | - | | $ | - | | $ | 36,505 | | $ | 38,097 | |
Collateralized mortgage obligations | | | - | | | - | | | - | | | - | | | 211,241 | | | 213,578 | |
Total held-to-maturity | | $ | - | | $ | - | | $ | - | | $ | - | | $ | 247,746 | | $ | 251,675 | |
Some of the Company’s holdings of U.S. government agency mortgage-backed securities (“MBS”) and collateralized mortgage obligations (“CMOs”) are issuances of government-sponsored enterprises, such as Fannie Mae and Freddie Mac, which are not backed by the full faith and credit of the U.S. government. Some holdings of MBS and CMOs are issued by Ginnie Mae, which does carry the full faith and credit of the U.S. government. The Company also holds some MBS and CMOs that were not issued by U.S. government agencies and are typically credit-enhanced via over-collateralization and/or subordination. Holdings of asset-backed securities (“ABS”) were largely comprised of securities backed by student loans issued under the U.S. Department of Education’s (“DOE”) FFEL program, which generally provides a minimum 97% U.S. DOE guarantee of principal. These ABS securities also have added credit enhancement through over-collateralization and/or subordination. The majority of holdings issued by states and political subdivisions are general obligation bonds that have S&P or Moody’s ratings of AA- or higher. Other state and political subdivision issuances are unrated and generally consist of smaller investment amounts that involve issuers in the Company’s markets. The credit quality of these issuers is monitored and none have been identified as posing a material risk of loss. The Company also holds collateralized loan obligation (“CLOs”) securities that are generally backed by a pool of debt issued by multiple middle-sized and large businesses. The Company’s CLOs are roughly split between tranches that have S&P or Moody’s ratings of A and those that are rated AA. CLO credit enhancement is achieved through over-collateralization and/or subordination.
Securities Portfolio Maturity and Yields
The following table presents the expected maturities or call dates and weighted average yield (nontax equivalent) of securities by major category as of December 31, 2017. Securities not due at a single maturity date are shown only in the total column.
| | | | | | | | | | | | | | | | | | | | | | | | | |
| | | | | | After One But | | After Five But | | | | | | | | | | | |
| Within One Year | | Within Five Years | | Within Ten Years | | After Ten Years | | Total | | | |
| Amount | | Yield | | Amount | | Yield | | Amount | | Yield | | Amount | | Yield | | Amount | | Yield | |
Securities available-for-sale | | | | | | | | | | | | | | | | | | | | | | | | | |
U.S. Treasury | $ | - | | - | | $ | 3,947 | | 1.85 | % | $ | - | | - | | $ | - | | - | | $ | 3,947 | | 1.85 | % |
U.S. government agencies | | - | | - | | | - | | - | | | - | | - | | | 13,061 | | 1.93 | % | | 13,061 | | 1.93 | |
States and political subdivisions | | 6,185 | | 2.41 | % | | - | | - | | | 5,733 | | 3.27 | % | | 266,174 | | 3.00 | | | 278,092 | | 2.99 | |
Corporate bonds | | - | | - | | | 332 | | 4.10 | | | 501 | | 3.60 | | | - | | - | | | 833 | | 3.81 | |
| | 6,185 | | 2.41 | | | 4,279 | | 2.03 | | | 6,234 | | 3.29 | | | 279,235 | | 2.95 | | | 295,933 | | 2.93 | |
Mortgage-backed securities and collateralized mortgage obligations | | - | | - | | | - | | - | | | - | | - | | | - | | - | | | 78,153 | | 2.94 | |
Asset-backed securities | | - | | - | | | - | | - | | | - | | - | | | - | | - | | | 112,932 | | 2.56 | |
Collateralized loan obligations | | | | | | | | | | | | | | | | | | | | | | 54,421 | | 4.32 | |
Total securities available-for-sale | $ | 6,185 | | 2.41 | % | $ | 4,279 | | 2.03 | % | $ | 6,234 | | 3.29 | % | $ | 279,235 | | 2.95 | % | $ | 541,439 | | 2.99 | % |
| | | | | | | | | | | | | | | | | | | | | | | | | |
As of December 31, 2017, net unrealized gains on available-for-sale securities was $3.8 million, which offset by deferred income taxes resulted in an overall increase to equity capital of $2.2 million. As of December 31, 2016, net unrealized losses on available-for-sale securities was $13.6 million, which offset by deferred income taxes resulted in an overall reduction to equity capital of $8.2 million.
At December 31, 2017, there were three issuers of ABS and CMOs where the book value of the Company’s holdings were greater than 10% of stockholders’ equity, as follows:
| | | | | | |
| | December 31, 2017 |
| | Amortized | | Fair |
Issuer | | Cost | | Value |
GCO Education Loan Funding Corp | | $ | 27,625 | | $ | 26,588 |
Towd Point Mortgage Trust | | | 29,312 | | | 29,210 |
Student Loan Marketing Association | | | 25,696 | | | 25,917 |
III.Loan Portfolio
Types of Loans
The following table presents the composition of the loan portfolio at December 31 for the years indicated:
| | | | | | | | | | | | | | | | |
| | 2017 | | 2016 | | 2015 | | 2014 | | 2013 | |
Commercial | | $ | 273,234 | | $ | 229,030 | | $ | 116,343 | | $ | 119,717 | | $ | 95,211 | |
Leases | | | 68,325 | | | 55,451 | | | 25,712 | | | 8,038 | | | 10,069 | |
Real estate - commercial | | | 750,991 | | | 736,247 | | | 605,721 | | | 600,629 | | | 560,233 | |
Real estate - construction | | | 85,162 | | | 64,720 | | | 19,806 | | | 44,795 | | | 29,351 | |
Real estate - residential | | | 425,330 | | | 377,197 | | | 350,557 | | | 369,870 | | | 389,931 | |
Consumer | | | 3,971 | | | 4,191 | | | 4,963 | | | 4,004 | | | 3,040 | |
Other1 | | | 10,609 | | | 11,973 | | | 10,613 | | | 12,279 | | | 13,421 | |
Gross loans | | | 1,617,622 | | | 1,478,809 | | | 1,133,715 | | | 1,159,332 | | | 1,101,256 | |
Allowance for loan and lease losses | | | (17,461) | | | (16,158) | | | (16,223) | | | (21,637) | | | (27,281) | |
Loans, net | | $ | 1,600,161 | | $ | 1,462,651 | | $ | 1,117,492 | | $ | 1,137,695 | | $ | 1,073,975 | |
1The “Other” class includes overdrafts.
The above gross loan totals include net deferred loan fees and costs.
Maturity and Rate Sensitivity of Loans to Changes in Interest Rates
The following table sets forth the remaining contractual maturities for loan categories at December 31, 2017:
| | | | | | | | | | | | | | | | | | | |
| | | | | Over 1 Year | | | | | | | | | | |
| | | | | Through 5 Years | | Over 5 Years | | | | |
| | One Year | | Fixed | | Floating | | Fixed | | Floating | | | | |
| | or Less | | Rate | | Rate | | Rate | | Rate | | Total | |
Commercial | | $ | 92,902 | | $ | 67,371 | | $ | 90,506 | | $ | 19,906 | | $ | 2,549 | | $ | 273,234 | |
Leases | | | 203 | | | 59,785 | | | - | | | 7,914 | | | 423 | | | 68,325 | |
Real estate - commercial | | | 169,745 | | | 314,527 | | | 90,787 | | | 49,987 | | | 125,945 | | | 750,991 | |
Real estate - construction | | | 20,660 | | | 2,525 | | | 51,007 | | | 2,902 | | | 8,068 | | | 85,162 | |
Real estate - residential | | | 36,133 | | | 85,196 | | | 40,097 | | | 36,682 | | | 227,222 | | | 425,330 | |
Consumer | | | 765 | | | 3,139 | | | - | | | 67 | | | - | | | 3,971 | |
Other1 | | | 2,592 | | | 1,840 | | | 5,683 | | | 158 | | | 336 | | | 10,609 | |
Total | | $ | 323,000 | | $ | 534,383 | | $ | 278,080 | | $ | 117,616 | | $ | 364,543 | | $ | 1,617,622 | |
1The “Other” class includes overdrafts.
The above loan total includes deferred loan fees and costs; column one includes demand notes.
While there are no significant concentrations of loans where the customers’ ability to honor loan terms is dependent upon a single economic sector, the real estate related categories represented 78.0% and 79.7% of the portfolio at December 31, 2017 and 2016, respectively. The Company had no concentration of loans exceeding 10% of total loans that were not otherwise disclosed as a category of loans at December 31, 2017.
Risk Elements
The following table sets forth the amounts of nonperforming assets at December 31 of the years indicated:
| | | | | | | | | | | | | | | | |
| | 2017 | | 2016 | | 2015 | | 2014 | | 2013 | |
Nonaccrual loans | | $ | 14,388 | | $ | 15,283 | | $ | 14,389 | | $ | 26,926 | | $ | 38,911 | |
Performing troubled debt restructured loans accruing interest | | | 988 | | | 718 | | | 165 | | | 154 | | | 796 | |
Loans past due 90 days or more and still accruing interest | | | 248 | | | - | | | 65 | | | - | | | 87 | |
Total nonperforming loans | | | 15,624 | | | 16,001 | | | 14,619 | | | 27,080 | | | 39,794 | |
Other real estate owned | | | 8,371 | | | 11,916 | | | 19,141 | | | 31,982 | | | 41,537 | |
Total nonperforming assets | | $ | 23,995 | | $ | 27,917 | | $ | 33,760 | | $ | 59,062 | | $ | 81,331 | |
| | | | | | | | | | | | | | | | |
Other real estate owned ("OREO") as % of nonperforming assets | | | 34.9 | % | | 42.7 | % | | 56.7 | % | | 54.1 | % | | 51.1 | % |
Accrual of interest is discontinued on a loan when principal or interest is 90 days or more past due, unless the loan is well secured and in the process of collection. When a loan is placed on nonaccrual status, interest previously accrued but not collected in the current period is reversed against current period interest income. Interest income of approximately $47,000, $230,000 and $116,000 was recorded and collected during 2017, 2016 and 2015, respectively, on loans that subsequently went to nonaccrual status by year-end. Interest income, which would have been recognized during 2017, 2016 and 2015, had these loans been on an accrual basis throughout the year, was approximately $781,000, $918,000 and $815,000, respectively. There were approximately $5.7 million and $5.0 million in restructured residential mortgage loans that were still accruing interest based upon their prior performance history at December 31, 2017 and 2016, respectively. Additionally, the nonaccrual loans above include $2.5 million and $2.9 million in restructured loans for the years ending December 31, 2017 and 2016.
Potential Problem Loans
The Company utilizes an internal asset classification system as a means of reporting problem and potential problem assets. At the scheduled board of directors meetings of the Bank loan listings are presented, which show significant loan relationships listed as “Special Mention,” “Substandard,” and “Doubtful.” Loans classified as Substandard include those that have a well-defined weakness or weaknesses that jeopardize the liquidation of the debt. They are characterized by the distinct possibility that the Company will sustain some loss if the deficiencies are not corrected. Assets classified as Doubtful have all the weaknesses inherent as those classified Substandard with the added characteristic that the weaknesses make collection or liquidation in full, on the basis of currently existing facts, conditions and values, highly questionable and improbable. Assets that do not currently expose us to sufficient risk to warrant classification in one of the aforementioned categories, but possess weaknesses that deserve management’s close attention, are deemed to be Special Mention.
Management defines potential problem loans as performing loans rated Substandard that do not meet the definition of a nonperforming loan. These potential problem loans carry a higher probability of default and require additional attention by management. A more detailed description of these loans can be found in Note 5 to the Consolidated Financial Statements.
IV.Summary of Loan Loss Experience
Analysis of Allowance for Loan and Lease Losses
The following table summarizes, for the years indicated, activity in the allowance for loan and lease losses (“ALLL”), including amounts charged-off, amounts of recoveries, additions to the allowance charged to operating expense, and the ratio of net charge-offs to average loans outstanding:
| | | | | | | | | | | | | | | | |
| | 2017 | | 2016 | | 2015 | | 2014 | | 2013 | |
Average total loans (exclusive of loans held-for-sale) | | $ | 1,534,673 | | $ | 1,214,804 | | $ | 1,144,618 | | $ | 1,124,335 | | $ | 1,102,197 | |
Allowance at beginning of year | | | 16,158 | | | 16,223 | | | 21,637 | | | 27,281 | | | 38,597 | |
Charge-offs: | | | | | | | | | | | | | | | | |
Commercial | | | 25 | | | 95 | | | 993 | | | 578 | | | 316 | |
Leases | | | 215 | | | 23 | | | - | | | - | | | - | |
Real estate - commercial | | | 309 | | | 1,633 | | | 1,653 | | | 1,972 | | | 2,985 | |
Real estate - construction | | | 23 | | | 23 | | | 2 | | | 174 | | | 1,014 | |
Real estate - residential | | | 1,347 | | | 1,072 | | | 1,639 | | | 3,393 | | | 6,293 | |
Consumer and other loans | | | 387 | | | 344 | | | 483 | | | 526 | | | 597 | |
Total charge-offs | | | 2,306 | | | 3,190 | | | 4,770 | | | 6,643 | | | 11,205 | |
Recoveries: | | | | | | | | | | | | | | | | |
Commercial | | | 30 | | | 32 | | | 451 | | | 58 | | | 119 | |
Leases | | | - | | | 5 | | | - | | | - | | | - | |
Real estate - commercial | | | 161 | | | 640 | | | 1,595 | | | 1,346 | | | 5,325 | |
Real estate - construction | | | 377 | | | 96 | | | 276 | | | 633 | | | 1,266 | |
Real estate - residential | | | 980 | | | 1,331 | | | 1,075 | | | 1,842 | | | 1,221 | |
Consumer and other loans | | | 261 | | | 271 | | | 359 | | | 420 | | | 508 | |
Total recoveries | | | 1,809 | | | 2,375 | | | 3,756 | | | 4,299 | | | 8,439 | |
Net charge-offs | | | 497 | | | 815 | | | 1,014 | | | 2,344 | | | 2,766 | |
Provision (release) for loan and lease losses | | | 1,800 | | | 750 | | | (4,400) | | | (3,300) | | | (8,550) | |
Allowance at end of year | | $ | 17,461 | | $ | 16,158 | | $ | 16,223 | | $ | 21,637 | | $ | 27,281 | |
| | | | | | | | | | | | | | | | |
Net charge-offs to average loans | | | 0.03 | % | | 0.07 | % | | 0.09 | % | | 0.21 | % | | 0.25 | % |
Allowance at year end to average loans | | | 1.14 | % | | 1.33 | % | | 1.42 | % | | 1.92 | % | | 2.48 | % |
The provision for loan and lease losses is based upon management’s estimate of losses inherent in the loan and lease portfolio and its evaluation of the adequacy of the ALLL. Factors which influence management’s judgment in estimating loan and lease losses are the composition of the portfolio, past loss experience, loan delinquencies, nonperforming loans and other credit risk considerations that, in management’s judgment, deserve evaluation in estimating loan and lease losses.
Allocation of the Allowance for Loan and Lease Losses
The following table shows the Company’s allocation of the ALLL by type of loans and the amount of unallocated allowance at December 31 of the years indicated, and, for each category of loans, the percent of total loans represented by that category:
| | | | | | | | | | | | | | | | | | | | | | | | | | |
| | 2017 | | 2016 | | 2015 | | 2014 | | 2013 | |
| | | | | Loan Type | | | | | Loan Type | | | | | Loan Type | | | | | Loan Type | | | | | Loan Type | |
| | | | | to Total | | | | | to Total | | | | | to Total | | | | | to Total | | | | | to Total | |
| | Amount | | Loans | | Amount | | Loans | | Amount | | Loans | | Amount | | Loans | | Amount | | Loans | |
| | | | | | | | | | | | | | | | | | | | | | | | | | |
Commercial | | $ | 2,453 | | 16.9 | % | $ | 2,225 | | 15.4 | % | $ | 2,096 | | 12.5 | % | $ | 1,644 | | 11.0 | % | $ | 2,250 | | 9.5 | % |
Leases | | | 692 | | 4.2 | | | 37 | | 3.8 | | | - | | - | | | - | | - | | | - | | - | |
Real estate - commercial | | | 9,522 | | 46.4 | | | 9,547 | | 49.8 | | | 9,013 | | 53.4 | | | 12,577 | | 51.8 | | | 16,763 | | 50.9 | |
Real estate - construction | | | 923 | | 5.3 | | | 389 | | 4.4 | | | 265 | | 1.7 | | | 1,475 | | 3.9 | | | 1,980 | | 2.7 | |
Real estate - residential | | | 1,805 | | 26.3 | | | 2,692 | | 25.6 | | | 1,694 | | 31.0 | | | 1,981 | | 31.9 | | | 2,837 | | 35.4 | |
Consumer | | | 1,524 | | 0.6 | | | 833 | | 0.2 | | | 1,190 | | 0.4 | | | 1,454 | | 0.3 | | | 1,439 | | 0.3 | |
Unallocated | | | 542 | | 0.3 | | | 435 | | 0.8 | | | 1,965 | | 1.0 | | | 2,506 | | 1.1 | | | 2,012 | | 1.2 | |
Total | | $ | 17,461 | | 100.0 | % | $ | 16,158 | | 100.0 | % | $ | 16,223 | | 100.0 | % | $ | 21,637 | | 100.0 | % | $ | 27,281 | | 100.0 | % |
The ALLL is a valuation allowance, which increased by the provision for loan and lease losses of $1.8 million in 2017 and $750,000 in 2016, and decreased by loan loss reserve releases of $4.4 million in 2015, adjusted for charge-offs less recoveries. Allocations of the allowance may be made for specific loans, but the entire allowance is available for losses inherent in the loan portfolio. In addition, the OCC, as part of their examination process, periodically reviews the ALLL. Regulators can require management to record adjustments to the allowance level based upon their assessment of the information available to them at the time of examination. The OCC, in conjunction with the other federal banking agencies, has adopted an interagency policy statement on the ALLL. The policy statement provides guidance for financial institutions on both the responsibilities of management for the assessment and establishment of adequate allowances and guidance for banking agency examiners to use in determining the adequacy of general valuation guidelines. Generally, the policy statement recommends that (1) institutions have effective systems and controls to identify, monitor
and address asset quality problems; (2) management has analyzed all significant factors that affect the collectability of the portfolio in a reasonable manner; and (3) management has established acceptable allowance evaluation processes that meet the objectives set forth in the policy statement and that the Company is in fullregulators take into account compliance with the policy statement. Management believes it has established an adequate estimated allowance for probable loan and lease losses. Management reviews its process quarterly as evidenced by an extensive and detailed loan review process, makes changes as needed, and reports those results at meetingsconsumer protection laws when considering approval of the Company’s Board of Directors and Audit Committee. Although management believes the ALLL is sufficient to cover probable losses inherent in the loan portfolio, there can be no assurance that the allowance will prove sufficient to cover actual loan and lease losses or that regulators, in reviewing the loan portfolio, would not request us to materially adjust our ALLL at the time of their examination.any proposed expansionary proposals.
V.Deposits
The following table sets forth the amount and maturities of deposits of $100,000 or more at December 31 of the years indicated:
| | | | | | | |
| | 2017 | | 2016 | |
3 months or less | | $ | 25,233 | | $ | 41,462 | |
Over 3 months through 6 months | | | 16,875 | | | 16,651 | |
Over 6 months through 12 months | | | 37,086 | | | 37,727 | |
Over 12 months | | | 87,084 | | | 77,415 | |
| | $ | 166,278 | | $ | 173,255 | |
YTD Average Balances and Interest Rates
| | | | | | | | | | | | | | | | |
| | 2017 | | 2016 | | 2015 | |
| | Average | | | | Average | | | | Average | | | |
| | Balance | | Rate | | Balance | | Rate | | Balance | | Rate | |
Noninterest bearing demand | | $ | 547,719 | | - | % | $ | 476,422 | | - | % | $ | 429,403 | | - | % |
Interest bearing: | | | | | | | | | | | | | | | | |
NOW and money market | | | 704,261 | | 0.11 | | | 662,367 | | 0.10 | | | 638,197 | | 0.09 | |
Savings | | | 261,974 | | 0.07 | | | 256,905 | | 0.06 | | | 249,570 | | 0.06 | |
Time | | | 389,771 | | 1.08 | | | 404,285 | | 0.90 | | | 410,691 | | 0.78 | |
Total deposits | | $ | 1,903,725 | | | | $ | 1,799,979 | | | | $ | 1,727,861 | | | |
VI.Return on Equity and Assets
The following table presents selected financial ratios as of December 31 for the years indicated:
| | | | | | | |
| | 2017 | | 2016 | | 2015 | |
Return on average total assets | | 0.65 | % | 0.73 | % | 0.74 | % |
Return on average equity | | 7.89 | | 9.43 | | 8.87 | |
Average equity to average assets | | 8.28 | | 7.76 | | 8.40 | |
Dividend payout ratio | | 7.84 | | 5.66 | | - | |
VII.Short-Term Borrowings
Other short-term borrowings, which consisted of FHLBC advances, totaled $115.0 million as of December 31, 2017, and reflected a weighted average rate of 1.42%. Average other short-term borrowings totaled $68.0 million, and reflected a weighted average rate of 1.08%, for the year ended December 31, 2017; this average borrowing balance was 33.9% of total equity as of the year ended December 31, 2017. The maximum amount of FHLBC advances outstanding at any month end in 2017 was $125.0 million as of September 30, 2017. FHLBC advances are short-term, usually overnight, and amounts borrowed are dependent upon the daily cash flow needs of the Company.
There were no other categories of short-term borrowings that had an average balance greater than 30% of the Company’s stockholders’ equity as of December 31, 2017, and no categories of short-term borrowings had an average balance greater than 30% of the Company’s stockholders’ equity as of December 31, 2016 and 2015.
Item 1A. Risk Factors
RISK FACTORS
The materialThere are risks, that management believes affect the Companymany beyond our control, which could cause our results to differ significantly from management’s expectations. Some of these risk factors are described below. Before making an investment decision with respect to any of the Company’s securities, you should carefully consider the risks asAny factor described below,in this Annual Report on Form 10-K could, by itself or together with all of the information included herein. The risks described below are not the only risks the Company faces. Additional risks not presently
known also may have a material adverse effect on the Company’sone or more other factors, adversely affect our business, results of operations andand/or financial condition. Additional risks and uncertainties not currently known to us or that we currently consider to not be material also may materially and adversely affect us. In assessing these risks, you should also refer to other information disclosed in our SEC filings, including the financial statements and notes thereto. The risks discussed below also include forward-looking statements, and actual results may differ substantially from those discussed or implied in these forward-looking statements.
Risks RelatingRelated to Economic Conditions, including the Impact of COVID-19
The ongoing COVID-19 pandemic could have an adverse impact on our financial performance and results of operations.
As the COVID-19 pandemic has evolved from its emergence in early 2020, so has its impact. Many states have re-instituted, or strongly encouraged, varying levels of quarantines and restrictions on travel and in some cases have at times limited operations of certain businesses and taken other restrictive measures designed to help slow the spread of COVID-19 and its variants. Governments and businesses have also instituted vaccine mandates and testing requirements for employees. While vaccine availability and uptake has increased, the longer-term macro-economic effects on global supply chains, inflation, labor shortages and wage increases continue to impact many industries, including the collateral underlying certain of our loans. Moreover, with the potential for new strains of COVID-19 to emerge, governments and businesses may re-impose aggressive measures to help slow its spread in the future. For this reason, among others, as the COVID-19 pandemic continues, the potential impacts are uncertain and difficult to assess.
Although financial markets have largely rebounded from the significant declines that occurred earlier in the pandemic and global economic conditions showed signs of improvement during the second half of 2020 and throughout 2021, many of the circumstances that arose or became more pronounced after the onset of the COVID-19 pandemic persist, which may subject us to a number of risks, including, without limitation, the following:
| ● | lower loan demand and an increased risk of loan delinquencies, defaults, and foreclosures due a number of factors, including continuing supply chain issues, decreased consumer and business confidence and economic activity; |
| ● | collateral for loans, especially real estate, may decline in value, which may reduce our ability to liquidate such collateral and could cause loan losses to increase and impair our ability over the long run to maintain our loan origination volume; |
| ● | volatility in financial and capital markets, interest rates, and exchange rates; |
| ● | a significant decline in the market value of our common stock, which may result in us recording a goodwill impairment charge, which could adversely affect our results of operations; |
| ● | increased demands on capital and liquidity; |
| ● | a reduction in the value of the assets that we manage or otherwise administer or service for others, affecting related fee income and demand for our services; |
| ● | heightened cybersecurity, information security, and operational risks as cybercriminals attempt to profit from the disruption resulting from the pandemic given increased online and remote activity, including as a result of work-from-home arrangements; |
| ● | disruptions to business operations experienced by counterparties and service providers; |
| ● | increased risk of business disruption from the loss of employees due to their inability to work effectively because of illness, quarantines, government actions, failures in systems or technology that disrupt work-from-home arrangements, or other effects of the COVID-19 pandemic, including the increase in employee resignations currently taking place throughout the United States in connection with the COVID-19 pandemic, which is commonly referred to as the “great resignation”; and |
| ● | decreased demands for our products and services. |
We have also experienced and may experience other negative impacts to our business as a result of the pandemic that could exacerbate other risks discussed in this “Risk Factors” section. The ongoing fluidity of this situation precludes any prediction as to the Company’s Businessultimate adverse impact of COVID-19 on economic and market conditions, and, as a result, presents material uncertainty and risk with respect to us.
In addition, COVID-19 initially caused us to materially increase our allowance for credit losses (“ACL”) under the current expected credit losses, or CECL, methodology. During the year ended December 31, 2020, we recorded a $14.1 million net increase in our ACL, bringing our total ACL to $33.9 million as of December 31, 2020. During the year ended December 31, 2021, we recorded an aggregate $9.5 million decrease in our ACL related to legacy Company credit losses, a $12.1 million increase related to the West Suburban acquired loan Day One fair valuation, a $12.2 million increase related to the West Suburban Day Two non-PCD life of loan credit loss estimates, and $4.4 million of net charge-offs, bringing our total ACL to $44.3 million as of December 31, 2021. The ACL reflects, among other things, the macroeconomic impact of the COVID-19 pandemic. If the adverse macroeconomic effects of the COVID-19 pandemic persist or worsen, we may further materially increase our ACL, which may have a material adverse effect on our business, financial condition and results of operations.
A return
Our business may be adversely affected by economic conditions.
Our financial performance generally, and in particular, the ability of recessionary conditionsborrowers to pay interest on and repay principal of outstanding loans and the value of collateral securing those loans, as well as demand for loans and other products and services we offer and whose success we rely on to drive our growth, is highly dependent upon the business environment in the primary markets where we operate and in the United States as a whole. Unlike larger financial institutions that are more geographically diversified, our banking franchise is headquartered in Aurora, Illinois, and is concentrated in the suburbs west and south of the Chicago metropolitan area. In addition, the State of Illinois continues to experience severe fiscal challenges, which could result in future state tax increases, impact the economic vitality of the businesses operating in Illinois, encourage businesses to leave the state or discourage new employers to start or move businesses to Illinois, all of which could have a material adverse effect on our financial condition and results of operations.
Unfavorable market conditions can result in a deterioration in the credit quality of our borrowers and the demand for our products and services, an increase in the number of loan delinquencies, defaults and charge-offs, foreclosures, additional provisions for loan losses, adverse asset values of the collateral securing our loans and an overall material adverse effect on the quality of our loan portfolio, and a reduction in assets under management or administration. Unfavorable or uncertain economic and market conditions can be caused by declines in economic growth, business activity or investor or business confidence; limitations on the availability of or increases in the Company’scost of credit and capital; increases in inflation or interest rates; high unemployment; natural disasters; epidemics and pandemics (such as COVID-19); state or local government insolvency; or a combination of these or other factors.
The impact of the COVID-19 pandemic is fluid and continues to evolve and there is pervasive uncertainty surrounding the future economic conditions that will emerge in the months and years following the onset of the pandemic. Moreover, as economic conditions relating to the pandemic have improved over time, the Federal Reserve has shifted its focus to limiting inflationary and other potentially adverse effects of the extensive pandemic-related government stimulus, which signals the potential for a continued period of economic uncertainty even if the pandemic subsides. In addition, there are continuing concerns related to, among other things, the level of nonperforming loansU.S. government debt and fiscal actions that may be taken to address that debt, the potential resurgence of economic and political tensions with China, the Russian invasion of Ukraine and increasing oil prices due to Russian supply disruptions, each of which may have a destabilizing effect on financial markets and economic activity. Economic pressure on consumers and overall economic uncertainty may result in changes in consumer and business spending, borrowing and saving habits. These economic conditions and/or reduced demand for the Company’s products and services, which could lead to lower revenue, higher loan and lease losses and lower earnings.
A return of recessionary conditions and/orother negative developments in the domestic andor international credit markets may significantly affect the markets in which the Company doeswe do business, the value of itsour loans and investments, and itsour ongoing operations, costs and profitability. Despite a general improvement in the overall economy and the real estate market, the economic environment remains challenging, particularly in the Company’s market area. Declines in real estate values and sales volumes and increasedhigh unemployment or underemployment levels may also result in higher than expected loan delinquencies, increases in the Company’sour levels of nonperforming
and classified assets and a decline in demand for itsour products and services. These negative events may cause the Companyus to incur losses and may adversely affect itsour capital, liquidity and financial condition.
Our trust and wealth management business may be negatively impacted by changes in economic and market conditions and clients may seek legal remedies for investment performance.
Our trust and wealth management business may be negatively impacted by changes in general economic and market conditions because the performance of this businesses is directly affected by conditions in the financial and securities markets. The sizefinancial markets and businesses operating in the securities industry are highly volatile (meaning that performance results can vary greatly within short periods of time) and are directly affected by, among other factors, domestic and foreign economic conditions and general trends in business and finance, and by the threat, as well as the occurrence of global conflicts, all of which are beyond our control. We cannot assure you that broad market performance will be favorable in the future. Declines in the financial markets or a lack of sustained growth may result in a decline in the performance of our wealth management business and may adversely affect the market value and performance of the Company’sinvestment securities that we manage, which could lead to reductions in our wealth management fees, because they are based primarily on the market value of the securities we manage, and could lead some of our clients to reduce their assets under management by us or seek legal remedies for investment performance. If any of these events occur, the financial performance of our wealth management business could be materially and adversely affected.
Credit and Interest Rate Risks
If we fail to effectively manage credit risk, our business and financial condition will suffer.
We must effectively manage credit risk. As a lender, we are exposed to the risk that our borrowers will be unable to repay their loans according to their original contractual terms, and that the collateral securing repayment of their loans, if any, may not be sufficient to ensure repayment. This risk has been and may be further exacerbated by the effects of the COVID-19 pandemic. In addition, there are risks inherent in making any loan, including risks relating to proper loan underwriting, risks resulting from changes in economic and industry conditions and risks inherent in dealing with individual borrowers, including the risk that a borrower may not provide information to us about its business in a timely manner, and/or may present inaccurate or incomplete information to us, and risks relating to the value of collateral. In order to manage credit risk successfully, we must, among other things, maintain disciplined and prudent underwriting standards and ensure that our lenders follow those standards. The weakening of these standards for any reason, such as an attempt to attract higher yielding loans, a lack of discipline or diligence by our employees in underwriting and monitoring loans, the inability of our employees to adequately adapt policies and procedures to changes in economic or any other conditions affecting borrowers and the quality of our loan portfolio, has grownmay result in recent years, but, if the Company is unableloan defaults, foreclosures and additional charge-offs and may necessitate that we significantly increase our allowance for credit losses, each of which could adversely affect our net income. Our inability to sustain loan growth, its profitabilitysuccessfully manage credit risk could have a material adverse effect on our business, financial condition or results of operations.
Our allowance for credit losses, or ACL, and fair value adjustments with respect to acquired loans, may be insufficient to absorb potential losses in our loan portfolio, which may adversely affected.affect our business, financial condition and results of operations.
Since December 31, 2011,Our success depends significantly on the Company’s grossquality of our assets, particularly loans. Like other financial institutions, we are exposed to the risk that our borrowers may not repay their loans heldaccording to their terms, and the collateral securing the payment of these loans may be insufficient to fully compensate us for investmentthe outstanding balance of the loan plus the costs to dispose of the collateral. As a result, we may experience significant loan, lease or commitment credit losses that may have increased from $1.37 billiona material adverse effect on our operating results and financial condition.
We maintain an ACL at a level we believe is adequate to $1.62 billion at December 31, 2017.absorb estimated credit losses that are expected to occur within the existing loan portfolio through their contractual terms. The Talmer acquisition in 2016 resulted in $221.0 millionlevel of additional loans, primarily classified as commercialthe ACL is inherently subjective and commercial real estate. During some years in this period, the Company was managing its balance sheet composition to manage its capital levels and position the Bank to meet and exceed its targeted capital levels. The Company’s ability to increase profitability will depend onis dependent upon a variety of factors beyond our control, including, its ability to originate attractive new lending relationships. While the Company believes it has the management resources and lending staff in place to continue the successful implementation of its strategic plan, if the Company is unable to increase the size of its loan portfolio, its strategic plan maybut not be successful and its profitability may be adversely affected.
Nonperforming assets take significant time to resolve, adversely affect the Company’s results of operations and financial condition and could result in further losses in the future.
The Company’s nonperforming loans (which consist of nonaccrual loans and loans past due 90 days or more, still accruing interest and restructured loans still accruing interest) and its nonperforming assets (which include nonperforming loans plus OREO) are reflected in the table below at December 31 (in millions):
| | | | | | | | | |
| | | | | | | | | |
| | 2017 | | 2016 | | % Change | |
Nonperforming loans | | $ | 15.6 | | $ | 16.0 | | (2.5) | |
OREO | | | 8.4 | | | 11.9 | | (29.4) | |
Total nonperforming assets | | $ | 24.0 | | $ | 27.9 | | (14.0) | |
The Company’s nonperforming assets adversely affect its net income in various ways. For example, the Company does not accrue interest income on nonaccrual loans and OREO may have expenses in excess of any lease revenues collected, thereby adversely affecting the Company’s net income, return on assets and return on equity. The Company’s loan administration costs also increase because of its nonperforming assets. The resolution of nonperforming assets requires significant time commitments from management, which can be detrimentallimited to, the performance of theirthe loan portfolio, consideration of current economic trends, changes in interest rates and property values, estimated losses on pools of homogeneous loans based on an analysis that uses historical loss experience for prior periods that are determined to have like characteristics with management’s economic forecast period, such as pre-recessionary, recessionary, or recovery periods, portfolio growth and concentration risk, management and staffing changes, the interpretation of loan risk classifications by regulatory authorities and other responsibilities. There is no assurance thatcredit market factors. We expect economic uncertainty to continue into 2022, which may result in a significant increase to our ACL in future periods. In addition, bank regulatory agencies periodically review our ACL and may require an increase in the Companyprovision for credit losses or the recognition of additional loan charge-offs, based on judgments different from those of management. If charge-offs in future periods exceed the ACL, we will not experienceneed additional provisions to increase the allowance. Any increases in nonperforming assetsthe ACL will result in a decrease in net income and capital and may have a material adverse effect on our financial condition and results of operations. We may be required to make significant increases in the future, or that its nonperforming assets will not result inprovision for credit losses and to charge-off additional loans in the future.
The Company’sapplication of the purchase method of accounting in our acquisition of West Suburban and any future acquisitions will impact our ACL. Under the purchase method of accounting, all acquired loans are recorded in our consolidated financial statements at their estimated fair value at the time of acquisition and any related acquired ACL is eliminated, as new credit marks are established on acquired loans
based on an assessment of credit quality as of the acquisition date. To the extent that our estimates of fair value are too high, we will incur losses associated with the acquired loans.
Our loan portfolio is concentrated heavily in commercial and residential real estate loans, including exposure to construction loans, which involve risks specific to real estate values and the real estate markets in general, all of which have experienced significant weakness.general.
The Company’sOur loan portfolio generally reflects the profile of the communities in which the Company operates.we operate. Because the Company operateswe operate in areas that saw rapid historical growth, real estate lending of all types is a significant portion of itsour loan portfolio. Total real estate lending excluding deferred fees, was $1.26$2.45 billion, or approximately 78.0%71.6%, of the Company’sour loan portfolio at December 31, 2017,2021, compared to $1.18$1.48 billion, or approximately 79.7%72.5%, at December 31, 2016.2020. Given that the primary (if not only) source of collateral on these loans is real estate, additional adverse developments affecting real estate values in the Company’sour market area could increase the credit risk associated with the Company’sour real estate loan portfolio.
In addition, with respect to commercial real estate loans, the banking regulators are examining commercial real estate lending activity with greater scrutiny, and may require banks with higher levels of commercial real estate loans to implement improvedenhanced underwriting, internal controls, risk management policies and portfolio stress testing, as well as possibly higher levels of allowances for credit losses and
capital levels as a result of commercial real estate lending growth and exposures. At December 31, 2017,2021, primarily as a result of the Company’sacquisition of West Suburban, our outstanding commercial real estate loans includingand undrawn commercial real estate commitments, excluding owner occupied real estate were equal to 298.7%313.4% of its total risk-based capital.our Tier 1 capital plus allowance for credit losses, compared to 274.1% at December 31, 2020. It is management’s intent to manage our non-owner occupied commercial real estate loans back under 300% capital, as outlined in regulatory guidance, and are performing heightened monitoring over commercial real estate exposures, including concentration limits on commercial real estate type, sub-types and individual tenant exposure, frequent loan portfolio stress testing, as well as sensitivity analysis and using current and prospective market data during underwriting. Executive management and the Board are actively involved in the review of our commercial real estate portfolio and the approval of individual transactions, with transactions over $5.0 million approved by a management loan committee that includes our chief executive officer, vice chairman, senior lending officer and the chief operating officer. Commercial real estate transactions over $20.0 million require the additional approval of the Board. Commercial real estate loans rated watch or worse are actively monitored and reviewed by management and the Board no less than quarterly. If the Company’sour regulators require us to maintain higher levels of capital than we would otherwise be expected to maintain due to our commercial real estate concentration, this could limit the Company’sour ability to leverage itsour capital and have a material adverse effect on the Company’sour business, financial condition, results of operations and prospects.
Real estate market volatility and future changes in disposition strategies could result in net proceeds that differ significantly from our fair value appraisals of loan collateral and OREO and could negatively impact the Company’sour operating performance.performance.
Many of the Company’sour nonperforming real estate loans are collateral-dependent, meaning the repayment of the loan is largely dependent upon the cash flows from the operationvalue of the property securing the loan and the borrower’s ability to refinance, recapitalize or the sale ofsell the property. For collateral-dependent loans, the Company estimateswe estimate the value of the loan based on the appraised value of the underlying collateral less costs to sell. The Company’sOur OREO portfolio essentially consists of properties acquired through foreclosure or deed in lieu of foreclosure in partial or total satisfaction of certain loans as a result of borrower defaults. Some property in OREO reflects property formerly utilized as a bank premise or land that was acquired with the expectation that a bank premise would be established at the location. In some cases, the market for such properties has been significantly depressed, and we have been unable to sell them at prices or within timeframes that we deem acceptable
acceptable. OREO is recorded at the lowerfair value of the recorded investment in the loans for which property served as collateral or estimated fair value,when acquired, less estimated selling costs. In determining the value of OREO properties and loan collateral, an orderly disposition of the property is generally assumed. Significant judgment is required in estimating the fair value of property, and the period of time within which such estimates can be considered current is significantly shortened during periods of market volatility. In response to market conditions and other economic factors, we may utilize alternative sale strategies other than orderly disposition as part of our OREO disposition strategy, such as immediate liquidation sales. In this event, as a result of the significant judgments required in estimating fair value and the variables involved in different methods of disposition, the net proceeds realized from such sales transactions could differ significantly from appraisals, comparable sales and other estimates used to determine the fair value of our OREO properties.
We are subject to interest rate risk, and a change in interest rates could have a negative effect on our net income.
Our earnings and cash flows are largely dependent upon our net interest income. Interest rates are highly sensitive to many factors that are beyond our control, including general economic conditions, our competition and policies of various governmental and regulatory agencies, particularly the Federal Reserve. Changes in monetary policy could influence our earnings. In March 2020, in response to the COVID-19 pandemic, the Federal Reserve reduced the target Federal Funds rate to between zero and 0.25%. If the Company failsshort-term interest rates continue to effectively manage credit risk, itsremain at their historically low levels for a prolonged period and assuming longer-term interest rates fall further, we could experience net interest margin compression as our interest-earning assets would continue to reprice downward while our interest-bearing liability rates could fail to decline in tandem, which would have an adverse effect on our net interest income and could have an adverse effect on our business, and financial condition will suffer.
The Company must effectively manage credit risk. Asand results of operations. However, due in part to rising inflation, in its December 2021 meeting, the Federal Reserve signaled its intention to raise interest rates, potentially three times, in 2022. When interest-bearing liabilities mature or reprice more quickly, or to a lender, we are exposed to the risk that our borrowers will be unable to repay their loans according to their terms, and that the collateral securing repayment of their loans, if any, may not be sufficient to ensure repayment. In addition, there are risks inherent in making any loan, including risks relating to proper loan underwriting, risks resulting from changes in economic and industry conditions and risks inherent in dealing with individual borrowers, including the risk that a borrower may not provide information to the Company about its businessgreater degree than interest-earning assets in a timely manner, and/period, an increase in interest rates could reduce net interest income. Similarly, when interest-earning assets mature or reprice more quickly, or to a greater degree than interest-bearing liabilities, falling interest rates could reduce net interest income. Additionally, an increase in the general level of interest rates may present inaccurate or incomplete information to the Company, and risks relating to the value also,
among other things, maintain disciplined and prudent underwriting standards and ensure that its lenders follow those standards. The weakening of these standards for any reason, such as an attemptadversely affect our current borrowers’ ability to attract higher yielding loans, a lack of discipline or diligence by the Company’s employees in underwriting and monitoringrepay variable rate loans, the inabilitydemand for loans and our ability to originate loans and decrease loan prepayment rates. Conversely, a decrease in the general level of the Company’s employeesinterest rates, among other things, may lead to adequately adapt policiesincreased prepayments on our loan and procedures tomortgage-backed securities portfolios and increased competition for deposits. Accordingly, changes in economic or any other conditions affecting borrowers and the qualitygeneral level of the Company’s loan portfolio,market interest rates may result in loan defaults, foreclosures and additional charge-offs and may necessitate that we significantly increase the Company’s ALLL, each of which could adversely affect our net yield on interest-earning assets, loan origination volume and our overall results. Although management believes it has implemented effective asset and liability management strategies to reduce the Company’s net income. As a result, the Company’s inability to successfully manage credit riskpotential effects of changes in interest rates on our results of operations, any substantial, unexpected, prolonged change in market interest rates could have a material adverse effect on the Company’s business, financial condition or results of operations.
The Company’s Allowance for Loan and Lease Losses may be insufficient to absorb potential losses in the Company’s loan portfolio.
The Company’s success depends significantly on the quality of our assets, particularly loans. Like other financial institutions, the Company is exposed to the risk that our borrowers may not repay their loans according to their terms, and the collateral securing the payment of these loans may be insufficient to fully compensate the Company for the outstanding balance of the loan plus the costs to dispose of the collateral. As a result, the Company may experience significant loan and lease losses that may have a material adverse effect on the Company’s operating results and financial condition.
The Company maintains an ALLL at a level the Company believes adequate to absorb estimated losses inherent in its existing loan portfolio. The level of the allowance reflects management’s continuing evaluation of industry concentrations; specific credit risks; credit loss experience; current loan portfolio quality; present economic, political, and regulatory conditions; and unidentified losses inherent in the current loan portfolio.
While the Company had loan loss reserve releases in 2014 and 2015, its provision for loan and lease losses was increased in 2016 and 2017, which is commensurate with the loan and lease portfolio growth experienced in those years. The Bank may be required to make significant increases in the provision for loan and lease losses and to charge-off additional loans in the future.
Determination of the allowance is inherently subjective since it requires significant estimates and management judgment of credit risks and future trends, all of which may undergo material changes. For example, the final allowance for December 31, 2017, December 31, 2016 and December 31, 2015, included an amount reserved for other not specifically identified risk factors. New information regarding existing loans, identification of additional problem loans, and other factors, both within and outside of the Company’s control, may require an increase in the ALLL. In addition, bank regulatory agencies periodically review the Company’s allowance and may require an increase in the provision for loan and lease losses or the recognition of additional loan charge-offs, based
on judgments different from those of management. If charge-offs in future periods exceed the ALLL, the Company will need additional provisions to increase the allowance. Any increases in the allowance will result in a decrease in net income and capital and may have a material adverse effect on the Company’s financial condition and results of operations.
Finally,Nonperforming assets take significant time to resolve, adversely affect our results of operations and financial condition and could result in further losses in the measurefuture.
Our nonperforming loans (which consist of nonaccrual loans, loans past due 90 days or more still accruing interest and restructured loans still accruing interest), were $44.7 million at December 31, 2021, an increase of 93.8%, compared to $23.0 million at December 31, 2020, primarily due to the loans acquired with the West Suburban acquisition. Other real estate owned, or OREO, totaled $2.4 million at December 31, 2021, a decrease of 4.8%, compared to $2.5 million at December 31, 2020. Our nonperforming assets adversely affect our net income in various ways. For example, we do not accrue interest income on nonaccrual loans and OREO may have expenses in excess of any lease revenues collected, thereby adversely affecting our net income, return on assets and return on equity. Our loan administration costs also increase because of our nonperforming assets. The resolution of nonperforming assets requires significant time commitments from management, which can be detrimental to the performance of their other responsibilities. There is no assurance that we will not experience increases in nonperforming assets in the future, or that our nonperforming assets will not result in losses in the future.
Operational Risks
We are a community bank and our ability to maintain our reputation is critical to the success of our business and the failure to do so may materially adversely affect our performance.
We are a community bank, and our reputation is one of the Company’s ALLLmost valuable components of our business. As such, we strive to conduct our business in a manner that enhances our reputation. This is dependentdone, in part, by recruiting, hiring and retaining employees who share our core values: being an integral part of the communities we serve; delivering superior service to our customers; and caring about our customers and associates. Damage to our reputation could undermine the confidence of our current and potential clients in our ability to provide financial services. Such damage could also impair the confidence of our counterparties and business partners, and ultimately affect our ability to effect transactions. Maintenance of our reputation depends not only on our success in maintaining our core values and controlling and mitigating the adoptionvarious risks described herein, but also on our success in identifying and interpretation of accounting standards. The Financial Accounting Standards Board, or FASB, recently issued a new credit impairment model, the Current Expected Credit Loss, or CECL model, which will become applicable to the Companyappropriately addressing issues that may arise in 2020. Under the CECL model, the Company will be required to present certain financial assets carried at amortized cost,areas such as loans held for investmentpotential conflicts of interest, anti-money laundering, client personal information and held-to-maturity debt securities, at the net amount expected to be collected. The measurement of expected credit losses is to be based on information about past events, including historical experience, current conditions,privacy issues, record-keeping, regulatory investigations and reasonable and supportable forecastsany litigation that affect the collectability of the reported amount. This measurement will take place at the time the financial asset is first added to the balance sheet and periodically thereafter. This differs significantlymay arise from the “incurred loss” model currently required under GAAP,failure or perceived failure of us to comply with legal and regulatory requirements. If our reputation is negatively affected, by the actions of our employees or otherwise, our business and, therefore, our operating results may be materially adversely affected. Further, negative public opinion can expose us to litigation and regulatory action as we seek to implement our growth strategy, which delays recognition until it is probable a loss has been incurred. Accordingly, the Company expects that the adoption of the CECL model will materially affect how we determine our ALLL and could require the Company to significantly increase its allowance. Moreover, the CECL model may create more volatility in the level of the Company’s ALLL. If the Company is required to materially increase its level of ALLL for any reason, such increase could adversely affect the Company’sour business, financial condition and results of operations.
The Company’s business is concentrated in and dependent upon the welfare of several counties in Illinois specifically and the State of Illinois generally.
The Company’s primary market area is Aurora, Illinois, and its surrounding communities as well as Cook County. The city of Aurora is located in northeastern Illinois, approximately 40 miles west of Chicago. The Bank operates primarily in Kane, Kendall, DeKalb, DuPage, LaSalle, Will and Cook counties in Illinois, and, as a result, the Company’s financial condition, results of operations and cash flows are subject to changes and fluctuations in the economic conditions in those areas.
The communities that the Company serves grew rapidly during the early 21st century, and despite the relative severity of the economic downturn that hit the Company’s key markets, the Company intends to continue concentrating its business efforts in these communities. The Company’s future success is largely dependent upon the overall economic health of these communities and the ability of the communities to continue to rebound from the difficulties that began in 2007. While the economies in our market have stabilized, difficult economic conditions remain, and the State of Illinois continues to experience severe fiscal challenges. Payment lapses by the State of Illinois to its vendors and government sponsored entities may have negative effects on our primary market area. To the extent that these issues, or any future state tax increases, impact the economic vitality of the businesses operating in Illinois, encourage businesses to leave the state or discourage new employers to start or move businesses to Illinois, they could have a material adverse effect on the Company’s financial condition and results of operations.
If the overall economic conditions do not continue to improve, particularly within the Company’s primary market areas, the Company could experience a lack of demand for its products and services, an increase in loan delinquencies and defaults and high or increased levels of problem assets and foreclosures with little prospect of state governmental issue resolution or assistance, even contractual assistance. Moreover, because of the Company’s geographic concentration, it is less able than other regional or national financial institutions to diversify its credit risks across multiple markets.
Credit downgrades, partial charge-offs and specific reserves could develop in selected exposures with resulting impact on the Company’s financial condition if the State of Illinois encounters more severe financial difficulties. Management continues to closely monitor the impact of developments on our markets and customers.
The Company operatesWe operate in a highly competitive industry and market area and may face severe competitive disadvantages.disadvantages.
The Company facesWe face substantial competition in all areas of itsour operations from a variety of different competitors, many of which are larger and have more financial resources. The Company’s competitors primarily include nationalWe compete with commercial banks, credit unions, savings and regional banksloan associations, mortgage banking firms, other financial service businesses, including investment advisory and wealth management firms, mutual fund companies, and securities brokerage and investment banking firms, as well as community banks within the markets the Company serves. Recently, localsuper-regional, national and international financial institutions that operate offices in our primary market areas and elsewhere. Local competitors have expandedcontinue to expand their presence in the western suburbs of Chicago, including the communities that surround Aurora, Illinois, and these competitors may be better positioned than the Companyus to compete for loans, acquisitions and personnel. The Company also faces competition from savings and loan associations, credit unions, personal loan and finance companies, retail and discount stockbrokers, investment advisors, mutual funds, insurance companies, and other financial intermediaries. As customers’ preferences and expectations continue to evolve, technology has lowered barriers to entry and made it possible for banks to expand their geographic reach by providing services over the Internet and for non-banks to offer products and services traditionally provided by banks, such as business and consumer lending, automatic transfer and automatic payment systems. There has also been significant advancement in the exchange of digital assets (“cryptocurrency”) that could materially impact the financial services industry in the future. Because of this rapidly changing technology, the Company’sour future success will depend in part on itsour ability to address itsour customers’ needs by using technology. Customer loyalty can be easily influenced by a competitor’s new products, especially offerings that could provide cost savings or a higher return to the customer. Moreover, the financial services industry could become even more competitive as a result of legislative and regulatory changes, and many large scale competitors can leverage economies of scale to offer better pricing for products and services compared to what the Companywe can offer.
We compete with these institutions in attracting deposits and assets under management, processing payment transactions, and in making loans. We may not be able to compete successfully with other financial institutions in our markets, particularly with larger financial institutions operating in our markets that have significantly greater resources than us and offer financial products and services that we are unable to offer, putting us at a disadvantage in competing with them for loans and deposits and wealth management clients, and we may have to pay higher interest rates to attract deposits, accept lower yields on loans to attract loans and pay higher wages for new employees,
resulting in lower net interest margin and reduced profitability. In addition, competitors that are not depository institutions are generally not subject to the extensive regulations that apply to us. If we are unable to compete effectively with those banking or other financial services businesses, we could find it more difficult to attract new and retain existing clients and our net interest margin, net interest income and wealth management fees could decline, which would adversely affect our results of operations and could cause us to incur losses in the future.
The Company’s
In addition, our ability to successfully attract and retain wealth management clients is dependent on our ability to compete successfully dependswith competitors’ investment products, level of investment performance, client services and marketing and distribution capabilities. If we are not successful in attracting new and retaining existing clients, our business, financial condition, results of operations and prospects may be materially and adversely affected.
We depend on developingour executive officers and maintainingother key employees, and our ability to attract additional key personnel, to continue the implementation of our long-term customer relationships, offering community bankingbusiness strategy, and we could be harmed by the unexpected loss of their services with features.
We believe that our continued growth and pricingfuture success will depend in line with customer interestslarge part on the skills of our executive officers and expectations, consistently achieving outstanding levels of customer serviceother key employees and adaptingour ability to manymotivate and frequent changes in bankingretain these individuals, as well as localour ability to attract, motivate and retain highly qualified senior and middle management and other skilled employees. Our business is primarily relationship-driven in that many of our key personnel have extensive customer or regional economies. asset management relationships. Loss of key personnel with such relationships may lead to the loss of business if the customers were to follow that employee to a competitor or if asset management expertise was not replaced in a timely manner. Competition for employees is intense, and the process of locating key personnel with the combination of skills and attributes required to execute our business strategy may be lengthy. In 2021, there has been a dramatic increase in workers leaving their positions throughout our industry and other industries that is being referred to as the “great resignation,” and the market to build, retain and replace talent has become even more highly competitive. We may not be successful in retaining key personnel, and the unexpected loss of services of one or more of our key personnel could have a material adverse effect on our business because of their skill, knowledge of our primary markets, years of industry experience and the difficulty of promptly finding qualified replacement personnel. If the services of any of our key personnel should become unavailable for any reason, we may not be able to identify and hire qualified persons on terms acceptable to the Company, or at all, which could have a material adverse effect on our business, financial condition, results of operation and future prospects.
If we are unable to offer our key management personnel long-term incentive compensation, including options, restricted stock, and restricted stock units, as part of their total compensation package, we may have difficulty retaining such personnel, which would adversely affect our operations and financial performance.
We have historically granted equity awards, including restricted stock units and stock options, to key management personnel as part of a competitive compensation package. Our ability to grant equity compensation awards as a part of our total compensation package has been vital to attracting, retaining and aligning stockholder interest with a talented management team in a highly competitive marketplace.
In the future, we may seek stockholder approval to adopt or amend equity compensation plans so that we may issue additional equity awards to management in order for the equity component of our compensation packages to remain competitive in the industry. Stockholder advisory groups have implemented guidelines and issued voting recommendations related to how much equity companies should be able to grant to employees. These advisors influence certain shareholder votes regarding approval of a company’s request for approval of new equity compensation plans. The factors used to formulate these guidelines and voting recommendations include the volatility of a company’s share price and are influenced by broader macro-economic conditions that can change year to year. The variables used by stockholder advisory groups to formulate equity plan recommendations may limit our ability to obtain approval to adopt or amend equity plans in the future. If we are limited in our ability to grant equity compensation awards, we would need to explore offering other compelling alternatives to supplement our compensation, including long-term cash compensation plans or significantly increased short-term cash compensation, in order to continue to attract and retain key management personnel. If we used these alternatives to long-term equity awards, our compensation costs could increase and our financial performance could be adversely affected. If we are unable to offer key management personnel long-term incentive compensation, including stock options, restricted stock or restricted stock units, as part of their total compensation package, we may have difficulty attracting and retaining such personnel, which would adversely affect our operations and financial performance.
We depend on outside third parties for the processing and handling of our records and data.
We rely on software developed by third party vendors to process various Company transactions. In some cases, we have contracted with third parties to run their proprietary software on our behalf at a location under the control of the third party. These systems include, but are not limited to, core data processing, payroll, loan origination, wealth management record keeping, and securities portfolio management. While we perform a review of controls instituted by the vendor over these programs in accordance with industry standards and institute our own user controls, we must rely on the continued maintenance of the performance controls by these outside parties, including safeguards over the security of customer data. In addition, we create backup copies of key processing output daily in the event of a failure on the part of any of these systems. Nonetheless, we may incur a temporary disruption in our ability to conduct our business or process our transactions, or incur damage to our reputation if a third-party vendor fails to adequately maintain internal controls or
institute necessary changes to systems. A disruption or breach of security may ultimately have a material adverse effect on our financial condition and results of operations.
Our use of third party vendors and our other ongoing third party business relationships are subject to regulatory requirements and attention.
We regularly use third party vendors as part of our business. We also have substantial ongoing business relationships with other third parties. These types of third party relationships are subject to demanding regulatory requirements and attention by our federal bank regulators. Recent regulation requires us to enhance our due diligence, risk assessment, ongoing monitoring and control over our third party vendors and other ongoing third party business relationships. We expect that our regulators will hold us responsible for deficiencies in our oversight and control of our third party relationships and in the performance of the parties with which we have these relationships. As a result, if our regulators conclude that we have not exercised adequate oversight and control over our third party vendors or other ongoing third party business relationships or that such third parties have not performed appropriately, we could be subject to enforcement actions, including civil money penalties or other administrative or judicial penalties or fines as well as requirements for customer remediation, any of which could have a material adverse effect our business, financial condition or results of operations.
We are at risk of increased losses from fraud.
Criminals committing fraud increasingly are using more sophisticated techniques and in some cases are part of larger criminal rings, which allow them to be more effective. The fraudulent activity has taken many forms, ranging from check fraud, mechanical devices attached to ATMs, social engineering and phishing attacks to obtain personal information or impersonation of our clients through the use of falsified or stolen credentials. Additionally, an individual or business entity may properly identify themselves, particularly when banking online, yet seek to establish a business relationship for the purpose of perpetrating fraud. Further, in addition to fraud committed against us, we may suffer losses as a result of fraudulent activity committed against third parties. Increased deployment of technologies, such as chip card technology, multi-factor authentication, and active customer alerts defray and reduce aspects of fraud; however, criminals are turning to other sources to steal personally identifiable information, such as unaffiliated healthcare providers and government entities, in order to impersonate the consumer to commit fraud. Many of these data compromises are widely reported in the media. Further, as a result of the increased sophistication of fraud activity, we have increased our spending on systems and controls to detect and prevent fraud. This will result in continued ongoing investments in the future.
Privacy and Technology-Related Risks
Failure to excel in these areas could significantly weaken the Company’s competitive position, whichkeep pace with technological change could adversely affect our business.
The financial services industry is continually undergoing rapid technological change with frequent introductions of new technology-driven products and services. The effective use of technology increases efficiency and enables financial institutions to better serve customers and to reduce costs. Our future success depends, in part, upon our ability to address the Company’s growthneeds of our customers by using technology to provide products and profitability. These weaknessesservices that will satisfy customer demands, as well as to create additional efficiencies in our operations. Many of our competitors have substantially greater resources to invest in technological improvements. We may not be able to effectively implement new technology-driven products and services or be successful in marketing these products and services to our customers. Failure to successfully keep pace with technological change affecting the financial services industry could have a significant negativematerial adverse impact on the Company’sour business, financial condition and results of operations.
Our information systems may experience an interruption or breach in security and cyber-attacks, all of which could have a material adverse effect on our business.
We rely heavily on internal and outsourced technologies, communications, and information systems to conduct our business. Additionally, in the normal course of business, we collect, process and retain sensitive and confidential information regarding our customers. As our reliance on technology has increased, so have the potential risks of a technology-related operation interruption (such as disruptions in our customer relationship management, general ledger, deposit, loan, or other systems) or the occurrence of a cyber-attack (such as unauthorized access to our systems). These risks have increased for all financial institutions as new technologies have emerged, including the use of the Internet and the expansion of telecommunications technologies (including mobile devices) to conduct financial and other business transactions, and as the sophistication of organized criminals, perpetrators of fraud, hackers, terrorists and others have increased.
In addition to cyber-attacks or other security breaches involving the theft of sensitive and confidential information, hackers have engaged in attacks against large financial institutions, particularly denial of service attacks that are designed to disrupt key business services, such as customer-facing web sites. We operate in an industry where otherwise effective preventive measures against security breaches become vulnerable as breach strategies change frequently and cyber-attacks can originate from a wide variety of sources. It is possible that a cyber-incident, such as a security breach, may be undetected for a period of time. However, applying guidance from the Federal Financial Institutions Examination Council, we have identified security risks and employ risk mitigation controls. Following a layered security approach, we have analyzed and will continue to analyze security related to device specific considerations, user access topics, transaction-processing and network integrity. We expect that we will spend additional time and will incur additional costs going forward to modify
and enhance protective measures and that effort and spending will continue to be required to investigate and remediate any information security vulnerabilities.
We also face risks related to cyber-attacks and other security breaches in connection with credit card and debit card transactions that typically involve the transmission of sensitive information regarding our customers through various third parties, including merchant-acquiring banks, payment processors, payment card networks and their processors. Some of these parties have in the past been the target of security breaches and cyber-attacks. Because these third parties and related environments such as the point-of-sale are not under our direct control, future security breaches or cyber-attacks affecting any of these third parties could impact us and in some cases we may have exposure and suffer losses for breaches or attacks. We offer our customers protection against fraud and attendant losses for unauthorized use of debit cards in order to stay competitive in the marketplace. Offering such protection exposes us to potential losses which, in the event of a data breach at one or more retailers of considerable magnitude, may adversely affect our business, financial condition, and results of operation. Further cyber-attacks or other breaches in the future, whether affecting us or others, could intensify consumer concern and regulatory focus and result in reduced use of payment cards and increased costs, all of which could have a material adverse effect on our business. To the extent we are involved in any future cyber-attacks or other breaches, our reputation could be affected which may have a material adverse effect on our business, financial condition or results of operations.
Growth and Strategic Risks
We may not be able to implement our growth strategy or manage costs effectively, resulting in lower earnings or profitability.
There can be no assurance that we will be able to continue to grow and to be profitable in future periods, or, if profitable, that our overall earnings will remain consistent or increase in the future. Our strategy is focused on organic growth, supplemented by opportunistic acquisitions, such as our acquisition of West Suburban Bank and ABC Bank. Our growth requires that we increase our loans and deposits while managing risks by following prudent loan underwriting standards without increasing interest rate risk or compressing our net interest margin, maintaining more than adequate capital and liquidity levels at all times, hiring and retaining qualified employees and successfully implementing strategic projects and initiatives. Even if we are able to increase our interest income, our earnings may nonetheless be reduced by increased expenses, such as additional employee compensation or other general and administrative expenses and increased interest expense on any liabilities incurred or deposits solicited to fund increases in assets. Additionally, if our competitors extend credit on terms we find to pose excessive risks, or at interest rates which we believe do not warrant the credit exposure, we may not be able to maintain our lending volume and could experience deteriorating financial performance. Our inability to manage our growth successfully or to continue to expand into new markets could have a material adverse effect on our business, financial condition or results of operations.
Our strategic growth plans contemplate additional organic growth and potential growth through additional mergers and acquisitions, which exposes us to additional risks.
Our strategic growth plans include organic growth and growth through additional mergers and acquisitions. To the extent that we are unable to increase loans through organic loan growth, or to identify and consummate attractive acquisitions, we may be unable to successfully implement our growth strategy, which could materially and adversely affect our financial condition and earnings.
We routinely evaluate opportunities to acquire additional financial institutions or branches or to open new branches. As a result, we regularly engage in discussions or negotiations that, if they were to result in a transaction, could have a material effect on our operating results and financial condition, including short- and long-term liquidity. Our merger and acquisition activities could be material and could require us to use a substantial amount of common stock, cash, other liquid assets, and/or incur debt. In addition, if goodwill recorded in connection with our prior or potential future acquisitions were determined to be impaired, then we would be required to recognize a charge against our earnings, which could materially and adversely affect our results of operations during the period in which the impairment was recognized. Moreover, these types of expansions involve various risks, including:
Management of Growth. We may be unable to successfully:
| ● | maintain loan quality in the context of significant loan growth; |
| ● | identify and expand into suitable markets; |
| ● | retain employees and customers of the Company or the businesses that we acquire or merge with; |
| ● | attract sufficient deposits and capital to fund anticipated loan growth; |
| ● | maintain adequate common equity and regulatory capital; |
| ● | avoid diversion or disruption of our management and existing operations as well as those of the acquired or merged institution; |
| ● | maintain adequate management personnel and systems to oversee such growth; |
| ● | maintain adequate internal audit, risk management, loan review and compliance functions; and |
| ● | implement additional policies, procedures and operating systems required to support such growth. |
Operating Results. There is no assurance that existing branches or future branches will maintain or achieve deposit levels, loan balances or other operating results necessary to avoid losses or produce profits. Our growth may entail an increase in overhead expenses as we
add new branches and staff. There are considerable costs involved in opening branches, and new branches generally do not generate sufficient revenues to offset their costs until they have been in operation for at least a year or more. Accordingly, any new branches we establish can be expected to negatively impact our earnings for some period of time until they reach certain economies of scale. Our historical results may not be indicative of future results or results that may be achieved, particularly if we continue to expand. Failure to successfully address these and other issues related to our expansion could have a material adverse effect on our business, financial condition and results of operations, including short-term and long-term liquidity, and could adversely affect our ability to successfully implement our business strategy.
Future acquisitions may be delayed, impeded, or prohibited due to regulatory issues.
Our future acquisitions, particularly those of financial institutions, are subject to approval by a variety of federal and state regulatory agencies. Regulatory approvals could be delayed, impeded, restrictively conditioned or denied due to existing or new regulatory issues we have, or may have, with regulatory agencies, including, without limitation, issues related to anti-money laundering/Bank Secrecy Act compliance, fair lending laws, fair housing laws, consumer protection laws, unfair, deceptive, or abusive acts or practices regulations, Community Reinvestment Act issues, and other similar laws and regulations. We may fail to pursue, evaluate or complete strategic and competitively significant acquisition opportunities as a result of our inability, or perceived or anticipated inability, to obtain regulatory approvals in a timely manner, under reasonable conditions or at all. Difficulties associated with potential acquisitions that may result from these factors could have a material adverse effect on our business, and, in turn, our financial condition and results of operations.
Moreover, in July 2021, President Biden issued an Executive Order on Promoting Competition in the American Economy which encouraged the federal banking agencies to review their current merger oversight practices. The Executive Order has received significant public support from members of Congress as well as a majority of the board members of the FDIC. In addition, the Director of the CFPB has publicly sought a greater role for the CFPB in the evaluation of proposed bank mergers. Any enhanced regulatory scrutiny of bank mergers and acquisitions and revision of the framework for merger application review may adversely affect the marketplace for such transactions, could result in our acquisitions in future periods being delayed, impeded or restricted in certain respects and result in new rules that possibly limit the size of financial institutions we may be able to acquire in the future and alter the terms for such transactions.
We may be exposed to difficulties in combining the operations of acquired or merged businesses, including West Suburban, into our own operations, which may prevent us from achieving the expected benefits from our merger and acquisition activities.
We may not be able to fully achieve the strategic objectives and operating efficiencies that we anticipate in our merger and acquisition activities, including with respect to our merger with West Suburban. Inherent uncertainties exist in integrating the operations of an acquired or merged business. We may lose our customers or the customers of acquired or merged entities as a result of an acquisition. We may also lose key personnel from the acquired entity as a result of an acquisition. We may not discover all known and unknown factors when examining a company for acquisition or merger during the due diligence period. These factors could produce unintended and unexpected consequences for us. Undiscovered factors as a result of an acquisition or merger could bring civil, criminal, and financial liabilities against us, our management, and the management of those entities we acquire or merge with. In addition, if difficulties arise with respect to the integration process, the economic benefits expected to result from acquisitions and mergers might not occur. Failure to successfully integrate businesses that we acquire or merge with could have an adverse effect on our profitability, return on equity, return on assets, or our ability to implement our strategy, any of which in turn could have a material adverse effect on our business, financial condition and results of operations. These factors could contribute to our not achieving the expected benefits from our mergers and acquisitions within desired time frames, if at all.
New lines of business, products, product enhancements or services may subject us to additional risks.
From time to time, we may implement new lines of business or offer new products, and product enhancements as well as new services within our existing lines of business. There are substantial risks and uncertainties associated with these efforts, particularly in instances in which the markets are not fully developed. In implementing, developing or marketing new lines of business, products, product enhancements or services, we may invest significant time and resources, although we may not assign the appropriate level of resources or expertise necessary to make these new lines of business, products, product enhancements or services successful or to realize their expected benefits. Further, initial timetables for the introduction and development of new lines of business, products, product enhancements or services may not be achieved, and price and profitability targets may not prove feasible. The introduction of such new products requires continued innovative efforts on the part of our management and may require significant time and resources as well as ongoing support and investment. External factors, such as compliance with regulations, competitive alternatives and shifting market preferences, may also affect the ultimate implementation of a new line of business or offerings of new products, product enhancements or services. Furthermore, any new line of business, product, product enhancement or service or system conversion could have a significant impact on the effectiveness of our system of internal controls. Failure to successfully manage these risks in the development and implementation of new lines of business or offerings of new products, product enhancements or services could have a material adverse effect on our business, financial condition or results of operations.
Industry-Related Risks
The phase-out of LIBOR could negatively impact our net interest income and require significant operational work.
The Company facesUnited Kingdom’s Financial Conduct Authority (“FCA”) regulates the London Interbank Offered Rate (“LIBOR”), the reference rate previously used for many of our transactions, including our lending and borrowing and our purchase and sale of securities, as well as the derivatives that we use to manage risk related to such transactions. The FCA announced in July 2017 that the sustainability of LIBOR could not be guaranteed. Accordingly, although the FCA confirmed the extension of overnight and 1-, 3-, 6-, and 12-month LIBOR through June 30, 2023 in order to accord financial institutions greater time with which to manage the transition from LIBOR, the FCA is no longer persuading, or compelling, banks to submit to LIBOR. The federal banking agencies, including the OCC, previously determined that banks must cease entering into any new contract that uses LIBOR as a reference rate by no later than December 31, 2021. In addition, banks have been encouraged to identify contracts that extend beyond June 30, 2023 and implement plans to identify and address insufficient contingency provisions in those contracts. The discontinuance of LIBOR has resulted in significant uncertainty regarding the transition to suitable alternative reference rates and could adversely impact our business, operations, and financial results.
The Federal Reserve, in conjunction with the Alternative Reference Rates Committee, a steering committee comprised of large U.S. financial institutions, has endorsed replacing the U.S. dollar LIBOR with a new index calculated by short-term repurchase agreements, backed by Treasury securities (“SOFR”). SOFR is observed and backward looking, which stands in contrast with LIBOR under the current methodology, which is an estimated forward-looking rate and relies, to some degree, on the expert judgment of submitting panel members. Given that SOFR is a secured rate backed by government securities, it will be a rate that does not take into account bank credit risk (as is the case with LIBOR).
The discontinuation of LIBOR, changes in LIBOR, or changes in market perceptions of the acceptability of LIBOR as a benchmark could result in changes to our risk exposures (for example, if the anticipated discontinuation of LIBOR adversely affects the availability or cost of floating-rate funding and, therefore, our exposure to fluctuations in interest rates) or otherwise result in losses on a product or having to pay more or receive less on securities that we own or have issued. In addition, such uncertainty could result in pricing volatility and increased capital requirements, loss of market share in certain products, adverse tax or accounting impacts, and compliance, legal and operational costs and risks associated with client disclosures, discretionary actions taken or negotiation of fallback provisions, systems disruption, business continuity, and model disruption. We have substantial exposure to LIBOR-based products, including loans, securities, derivatives and hedges, and we have transitioned away from the use of LIBOR to alternative rates for all new contracts as of December 31, 2021. We continue to prepare for the transition of our existing LIBOR exposures prior to the final LIBOR cessation date of June 30, 2023. During the fourth quarter of 2019, we began the process of incorporating fallback language in legacy LIBOR-based commercial loans, and began indexing new retail adjustable rate mortgages to SOFR after July 31, 2021 and new commercial originations and renewals to alternative indexes, including SOFR in the fourth quarter of 2021. We continue to monitor market developments and regulatory updates, including recent announcements from the ICE Benchmark Administrator, as well as collaborate with regulators and industry groups on the transition of existing exposures.
In addition, the implementation of LIBOR reform proposals may result in increased compliance costs and operational costs, including costs related to continued participation in LIBOR and the transition to a replacement reference rate or rates. We cannot reasonably estimate the expected cost.
Our estimate of fair values for our investments may not be realizable if we were to sell these securities today.
Our available-for-sale securities are carried at fair value. The determination of fair value for securities categorized in Level 3 involves significant judgment due to the complexity of the factors contributing to the valuation, many of which are not readily observable in the market. Recent market disruptions and the resulting fluctuations in fair value have made the valuation process even more difficult and subjective. If the valuations are incorrect, it could harm our financial results and financial condition.
Monetary policies and regulations of the Federal Reserve could adversely affect our business, financial condition and results of operations.
In addition to being affected by general economic conditions, our earnings and growth are affected by the policies of the Federal Reserve. An important function of the Federal Reserve is to regulate the money supply and credit conditions. Among the instruments used by the Federal Reserve to implement these objectives are open market purchases and sales of U.S. government securities, adjustments of the discount rate and changes in banks’ reserve requirements against bank deposits. These instruments are used in varying combinations to influence overall economic growth and the distribution of credit, bank loans, investments and deposits. Their use also affects interest rates charged on loans or paid on deposits. The monetary policies and regulations of the Federal Reserve have had a significant effect on the operating results of commercial banks in the past and are expected to continue to do so in the future. The effects of such policies upon our business, financial condition and results of operations cannot be predicted.
Our deposit insurance premiums could be substantially higher in the future, which could have a material adverse effect on our future earnings.
The FDIC insures deposits at FDIC-insured depository institutions, such as the Bank, up to $250,000 per insured depositor category. The amount of a particular institution’s deposit insurance assessment is based on that institution’s risk classification under an FDIC risk-based assessment system. An institution’s risk classification is assigned based on its capital levels and the level of supervisory concern the institution poses to its regulators. As a result of recent FDIC assessment charges, banks are now assessed deposit insurance premiums based on the bank’s average consolidated total assets less the sum of its average tangible equity, and the FDIC has modified certain risk-based adjustments, which increase or decrease a bank’s overall assessment rate. In addition to ordinary assessments described above, the FDIC has the ability to impose special assessments in certain instances. We are generally unable to control the amount of premiums that we are required to pay for FDIC insurance. If there are additional bank or financial institution failures, we may be required to pay higher FDIC premiums than the recent levels. Any future additional assessments, increases or required prepayments in FDIC insurance premiums could reduce our profitability, may limit our ability to pursue certain business opportunities or otherwise negatively impact our operations.
Legal, Accounting, Regulatory and Compliance Risks
We face a risk of noncompliance with the Bank Secrecy Act and other anti-money laundering statutes and regulations and corresponding enforcement proceedings.proceedings.
The federal Bank Secrecy Act, the Uniting and Strengthening America by Providing Appropriate Tools Required to Intercept and Obstruct TerrorismPATRIOT Act, of 2001, or the “PATRIOT Act,” and other laws and regulations require financial institutions, among our other duties, to institute and maintain effective anti-money laundering programs and to file suspicious activity and currency transaction reports as appropriate. The federal Financial Crimes Enforcement Network, established by the U.S. Treasury Department to administer the Bank Secrecy Act, is authorized to impose significant civil money penalties for violations of those requirements and has recently engaged in coordinated enforcement efforts with the individual federal banking regulators, as well as the U.S. Department of Justice, Drug Enforcement Administration and Internal Revenue Service. There is also increased scrutiny of compliance with the rules enforced by the Office of Foreign Assets Control. Federal and state bank regulators also have begun to focus on compliance with Bank Secrecy Act and anti-money laundering regulations. If the Company’sour policies, procedures and systems are deemed deficient or the policies, procedures and systems of the financial institutions that the Company haswe have already acquired or may acquire in the future are deficient, the Companywe would be subject to liability, including fines and regulatory actions such as restrictions on itsour ability to pay dividends and the necessity to obtain regulatory approvals to proceed with certain aspects of the Company’sour business plan, including itsour acquisition plans, which would negatively impact the Company’sour business, financial condition and results of operations. Failure to maintain and implement adequate programs to combat money laundering and terrorist financing could also have serious reputational consequences for the Company.us.
The Company’s strategic growth plans contemplate additional organic growth and potential growth through additional acquisitions, which exposes us to additional risks.
The Company’s strategic growth plans contemplate additional organic growth and potential growth through additional acquisitions. To the extent that the Company is unable to increase loans through organic loan growth, or to identify and consummate attractive acquisitions, the CompanyWe may be unable to successfully implement its growth strategy, which could materially and adversely affected by the highly regulated environment in which we operate.
We are subject to extensive federal and state regulation, supervision and examination. Banking regulations are primarily intended to protect depositors’ funds, FDIC funds, customers and the banking system as a whole, rather than our stockholders. Compliance with banking regulations is costly and these regulations affect the Company’s financial conditionour lending practices, capital structure, investment practices, mergers and earnings. acquisitions, dividend policy, and growth, among other things.
The Company routinely evaluates opportunitiesand the Bank also undergo periodic examinations by their regulators, who have extensive discretion and authority to acquire additional financial institutionsprevent or branchesremedy unsafe or unsound practices or violations of law. Failure to open new branches. As a result, the Company regularly engages in discussionscomply with applicable laws, regulations or negotiations that, if they were topolicies could also result in heightened regulatory scrutiny and in sanctions by regulatory agencies (such as a transaction,memorandum of understanding, a written supervisory agreement or a cease and desist order), civil money penalties and/or reputation damage. Any of these consequences could have a material effect on the Company’s operating results and financial condition, including short- and long-term liquidity. The Company’s acquisition activitiesrestrict our ability to expand our business or could require itus to use a substantial amount of common stock, cash, other liquidraise additional capital or sell assets and/on terms that are not advantageous to us or incur debt. Moreover, these types of expansions involve various risks, including:
Management of Growth. The Company may be unable to successfully:
| ·
| | maintain loan quality in the context of significant loan growth;
|
| ·
| | identifyour stockholders and expand into suitable markets;
|
| ·
| | obtain regulatory and other approvals necessary to consummate acquisitions or other expansion activities;
|
| ·
| | retain customers of businesses that it acquires;
|
| ·
| | attract sufficient deposits and capital to fund anticipated loan growth;
|
| ·
| | maintain adequate common equity and regulatory capital;
|
| ·
| | avoid diversion or disruption of its management and existing operations as well as those of the acquired institution;
|
| ·
| | maintain adequate management personnel and systems to oversee such growth;
|
| ·
| | maintain adequate internal audit, loan review and compliance functions; and
|
| ·
| | implement additional policies, procedures and operating systems required to support such growth.
|
Operating Results. There is no assurance that existing branches or future branches will maintain or achieve deposit levels, loan balances or other operating results necessary to avoid losses or produce profits. The Company’s growth may entail growth in overhead expenses as it adds new branches and staff. There are considerable costs involved in opening branches, and new branches generally do not generate sufficient revenues to offset their costs until they have been in operation for at least a year or more. Accordingly, any new branches the Company establishes can be expected to negatively impact the Company’s earnings for some period of time until they reach certain economies of scale. The Company’s historical results may not be indicative of future results or results that may be achieved, particularly if the Company continues to expand.
Failure to successfully address these and other issues related to the Company’s expansion could have a material adverse effect on the Company’sour business, financial condition and results of operations,operations.
A more detailed description of the primary federal banking laws and could adverselyregulations that affect the Company’s ability to successfully implement its business strategy.
TheCompany and the Bank is included in this Form 10-K under the section captioned “Supervision and Regulation” in Item 1. Since the 2008 financial crisis, federal and state banking laws and regulations, as well as interpretations and implementations of these laws and regulations, have undergone substantial review and change. In particular, the Dodd-Frank Act drastically revised the laws and regulations under which we operate. The burden of regulatory compliance has increased under the Dodd-Frank Act and has increased our costs of doing business and, as a community bankresult, may create an advantage for our competitors who may not be subject to similar legislative and its ability to maintain its reputation is criticalregulatory requirements.
We face risks related to the successadoption of its businessfuture legislation and potential changes in federal regulatory agency leadership, policies, and priorities.
With a new Congress taking office in 2021, Democrats retained control of the U.S. House of Representatives, and have gained control of the U.S. Senate, albeit with a majority found only in the tie-breaking vote of Vice President Harris. However slim the majorities, though, the net result was a unified Democratic control of the White House and both chambers of Congress, and consequently Democrats are able to set the agenda both legislatively, in the Administration, and in the regulatory agencies that have rulemaking and supervisory authority over the financial services industry generally and the failureCompany and the Bank specifically. Congressional committees with jurisdiction
over the banking sector have pursued oversight and legislative initiatives in a variety of areas, including addressing climate-related risks, promoting diversity and equality within the banking industry and addressing other Environmental, Social, and Governance matters, improving competition in the banking sector and enhancing oversight of bank mergers and acquisitions, establishing a regulatory framework for digital assets and markets, and oversight of the COVID-19 pandemic response and economic recovery. The prospects for the enactment of major banking reform legislation are unclear at this time.
Moreover, the turnover of the presidential administration resulted in certain changes in the leadership and senior staffs of the federal banking agencies, the CFPB, CFTC, SEC, and the Treasury Department, with certain significant leadership positions yet to be filled, including the Comptroller of the Currency, the Chair of the FDIC, and three vacancies among the Governors of the Federal Reserve Board, including the Vice Chair for Supervision. These changes have impacted the rulemaking, supervision, examination and enforcement priorities and policies of the agencies and likely will continue to do so may materially adversely affect its performance.
over the next several years. The Bank is a community bank,potential impact of any changes in agency personnel, policies and its reputation is one ofpriorities on the most valuable components of its business. As such,financial services sector, including the Company strives to conduct its business in a manner that enhances its reputation. This is done, in part, by recruiting, hiring and retaining employees who share the Company’s core values: being an integral part of the communities the Company serves; delivering superior service to the Company’s customers;Bank, cannot be predicted at this time. Regulations and caring about the Company’s customers and associates. If the Company’s reputation is negatively affected, by the actions of its employees or otherwise, its business and operating resultslaws may be adversely affected.
The Company is subject to interest rate risk,modified at any time, and a change in interest rates could have a negative effect on its net income.
The Company’s earnings and cash flows are largely dependent upon the Company’s net interest income. Interest rates are highly sensitive to many factorsnew legislation may be enacted that are beyond the Company’s control, including general economic conditions, the Company’s competition and policies of various governmental and regulatory agencies, particularly the Federal Reserve. Changes in monetary policy could influence Company earnings. When interest-bearing liabilities mature or reprice more quickly, or to a greater degree than interest-earning assets in a period, an increase in interest rates could reduce net interest income. Similarly, when interest-earning assets mature or reprice more quickly, or to a greater degree than interest-bearing liabilities, falling interest rates could reduce net interest income. Additionally, an increase in the general level of interest rates may also, among other things, adverselywill affect our current borrower’s ability to repay variable rate loans, the demand for loans and the Company’s ability to originate loans and decrease loan prepayment rates. Conversely, a decrease in the general level of interest rates, among other things, may lead to prepayments on the Company’s loan and mortgage-backed securities portfolios and increased competition for deposits. Accordingly,us. Any future changes in federal and state laws and regulations, as well as the general levelinterpretation and implementation of market interest rates may adverselysuch laws and regulations, could affect the Company’s net yield on interest-earning assets, loan origination volumeus in substantial and the Company’s overall results.
Although management believes it has implemented effective asset and liability management strategies to reduce the potential effects of changes in interest rates on the Company’s results of operations, any substantial, unexpected, prolonged change in market interest ratesunpredictable ways, including those listed above or other ways that could have a material adverse effect on our business, financial condition or results of operations.
Our accounting estimates and risk management processes and controls rely on analytical and forecasting techniques and models and assumptions, which may not accurately predict future events.
Our accounting policies and methods are fundamental to how we record and report our financial condition and results of operations. Our management must exercise judgment in selecting and applying many of these accounting policies and methods so they comply with GAAP and reflect management’s judgment of the Company’smost appropriate manner in which to report our financial condition and results. In some cases, management must select the accounting policy or method to apply from two or more alternatives, any of which may be reasonable under the circumstances, yet which may result in our reporting materially different results than would have been reported under a different alternative.
Certain accounting policies are critical to presenting our financial condition and results of operations. They require management to make difficult, subjective or complex judgments about matters that are uncertain. Materially different amounts could be reported under different conditions or using different assumptions or estimates. These critical accounting policies include the allowance for credit losses and fair value methodologies. Because of the uncertainty of estimates involved in these matters, we may be required to significantly increase the ACL or sustain loan losses that are significantly higher than the reserve provided, reduce the carrying value of an asset measured at fair value, or significantly increase liabilities measured at fair value. Any of these could have a material adverse effect on our business, financial condition or results of operations.
Our internal controls, disclosure controls, processes and procedures, and corporate governance policies and procedures are based in part on certain assumptions and can provide only reasonable (not absolute) assurances that the objectives of the system are met. Any failure or circumvention of our controls, processes and procedures or failure to comply with regulations related to controls, processes and procedures could necessitate changes in those controls, processes and procedures, which may increase our compliance costs, divert management attention from our business or subject us to regulatory actions and increased regulatory scrutiny. Any of these could have a material adverse effect on our business, financial condition or results of operations.
We are subject to federal and state fair lending laws, and failure to comply with these laws could lead to material penalties.
Federal and state fair lending laws and regulations, such as the Equal Credit Opportunity Act and the Fair Housing Act, impose nondiscriminatory lending requirements on financial institutions. The Department of Justice, the CFPB and other federal and state agencies are responsible for enforcing these laws and regulations. Private parties may also have the ability to challenge an institution’s performance under fair lending laws in private class action litigation. A successful challenge to our performance under the fair lending laws and regulations could adversely impact our rating under the Community Reinvestment Act and result in a wide variety of sanctions, including the required payment of damages and civil money penalties, injunctive relief, imposition of restrictions on merger and acquisition activity and restrictions on expansion activity, which could negatively impact our reputation, business, financial condition and results of operations.
We could be subject to changes in tax laws, regulations, and interpretations or challenges to our income tax provision.
We compute our income tax provision based on enacted tax rates in the jurisdictions in which we operate. Any change in enacted tax laws, rules or regulatory or judicial interpretations, or any change in the pronouncements relating to accounting for income taxes could adversely affect our effective tax rate, tax payments and results of operations. The taxing authorities in the jurisdictions in which we operate may challenge our tax positions, which could increase our effective tax rate and harm our financial position and results of operations. We are subject to audit and review by U.S. federal and state tax authorities. Any adverse outcome of such a review or audit could have a negative effect on our financial position and results of operations.
In addition, deferred tax assets are reported as assets on our balance sheet and represent the decrease in taxes expected to be paid in the future because of net operating losses (“NOLs”) and tax credit carryforwards and because of future reversals of temporary differences in the bases of assets and liabilities as measured by enacted tax laws and their bases as reported in the financial statements. As of December 31, 2021, we had net deferred tax assets of $6.1 million, which included a $2.3 million federal net operating loss carryforward. Realization of deferred tax assets is dependent upon the generation of sufficient future taxable income during the periods in which existing deferred tax assets are expected to become deductible for income tax purposes. Changes in enacted tax laws, such as adoption of a lower income tax rate in any of the jurisdictions in which we operate, could impact our ability to obtain the future tax benefits represented by our deferred tax assets. Our deferred tax asset may be further reduced in the future if estimates of future income or our tax planning strategies do not support the amount of the deferred tax asset. Charges to establish a valuation allowance with respect to our deferred tax asset could have a material adverse effect on our financial condition and results of operations.
In addition, the determination of our provision for income taxes and other liabilities requires significant judgment by management. Although we believe that our estimates are reasonable, the ultimate tax outcome may differ from the amounts recorded in our financial statements and could have a material adverse effect on our financial results in the period or periods for which such determination is made.
We could become subject to claims and litigation pertaining to our fiduciary responsibility.
Some of the services we provide, such as wealth management services through River Street Advisors, LLC, require us to act as fiduciaries for our customers and others. Customers make claims and on occasion take legal action pertaining to our performance of our fiduciary responsibilities. Whether customer claims and legal action related to our performance of our fiduciary responsibilities are founded or unfounded, if such claims and legal action are not resolved in a manner favorable to us, they may result in significant financial liability and/or adversely affect the market perception of us and our products and services as well as impact customer demand for those products and services. Any financial liability or reputational damage could have a material adverse effect on our business, which, in turn, could have a material adverse impact on our financial condition and results of operations.
We are defendants in a variety of litigation and other actions.
Currently, there are certain other legal proceedings pending against the Company and our subsidiaries in the ordinary course of business. While the outcome of any legal proceeding is inherently uncertain, based on information currently available, the Company’s management believes that any liabilities arising from pending legal matters would not have a material adverse effect on us or our consolidated financial statements. However, if actual results differ from management’s expectations, it could have a material adverse effect on our financial condition, results of operations, or cash flows.
From time to time we are, or may become, involved in suits, legal proceedings, information-gatherings, investigations and proceedings by governmental and self-regulatory agencies that may lead to adverse consequences.
Many aspects of the banking business involve a substantial risk of legal liability. From time to time, we are, or may become, the subject of information-gathering requests, reviews, investigations and proceedings, and other forms of regulatory inquiry, including by bank regulatory agencies, self-regulatory agencies, the SEC and law enforcement authorities. The results of such proceedings could lead to significant civil or criminal penalties, including monetary penalties, damages, adverse judgements, settlements, fines, injunctions, restrictions on the way we conduct our business or reputational harm.
Capital and Liquidity Risks
Our business needs and future growth may require the Companyus to raise additional capital, but that capital may not be available or may be dilutive.
The CompanyWe may need to raise additional capital, in the form of debt or equity securities, in the future to have sufficient capital resources to meet itsour commitments and fund itsour business needs and future growth, particularly if the quality of the Company’sour assets or earnings were to deteriorate significantly. In addition, the Company and the Bank are each required by federal regulatory authorities to maintain adequate levels of capital to support their operations.
The Company’sOur ability to raise capital will depend on, among other things, conditions in the capital markets, which are outside of the Company’sour control, and itsour financial performance. Accordingly, the Companywe cannot provide assurance that such capital will be available on terms acceptable to the Companyus or at all. Any occurrence that limits the Company’sour access to capital, may adversely affect the Company’sour capital costs and the Company’sour ability to raise capital and, in turn, itsour liquidity. Further, if the Company needswe need to raise capital in the future the Companywe may have to do so when many other financial institutions are also seeking to raise capital and would then have to compete with those institutions for investors. Any inability to raise capital on acceptable terms when needed could have a material adverse effect on the Company’sour business, financial condition and results of operations and could be dilutive to both tangible book value and the Company’sour share price.
In addition, an inability to raise capital when needed may subject the Companyus to increased regulatory supervision and the imposition of restrictions on the Company’sour growth and business. These restrictions could negatively affect the Company’sour ability to operate or further expand itsour operations through
loan growth, acquisitions or the establishment of additional branches. These restrictions may also result in increases in operating expenses and reductions in revenues that could have a material adverse effect on the Company’sour financial condition, results of operations and share price.
The CompanyWe could experience an unexpected inability to obtain needed liquidity.
Liquidity measures the ability to meet current and future cash flow needs as they become due. The liquidity of a financial institution reflects its ability to meet loan requests, to accommodate possible outflows in deposits, and to take advantage of interest rate market opportunities and is essential to a financial institution’s business. The ability of a financial institution to meet its current financial obligations is a function of its balance sheet structure, its ability to liquidate assets and its access to alternative sources of funds. The Company seeksWe seek to ensure that itsour funding needs are met by maintaining an appropriate level of liquidity through asset and liability management. In 2016,2021, the Bank also securedexperienced ample liquidity due to customer deposits received related to federal stimulus programs responding to the COVID-19 pandemic, as well as funds received as PPP loans were forgiven, and short-term borrowing facilities were not required to be significantly utilized. However, if funds were needed, we could seek to secure liquidity under the advance program provided under terms offered by the FHLBC. If the Company or the Bank becomeswe are unable to obtain funds when needed, it could have a material adverse effect on itsour business, financial condition and results of operations.
Loss of customer deposits dueWe may not be able to increased competition could increase the Company’smaintain a strong core deposit base or access other low-cost funding costs.sources.
The Company reliesWe rely on bank deposits to be a low cost and stable source of funding. In addition, the Company’sour future growth will largely depend on itsour ability to maintain and grow a strong deposit base. If the Company iswe are unable to continue to attract and retain core deposits, to obtain third party financing on favorable terms, or to have access to interbank or other liquidity sources, the Companywe may not be able to grow itsour assets as quickly. The Company competesWe compete with banks and other financial services companies for deposits. If the Company’sour competitors raise the rates they pay on deposits in response to interest rate changes initiated by the FRBC Open Market Committee or for other reasons of their choice, the Company’sour funding costs may increase, either because the Company raises itswe raise our rates to avoid losing deposits or because the Company loseswe lose deposits and must rely on more expensive sources of funding. Higher funding costs could reduce the Company’sour net interest margin and net interest income. Any decline in available funding could adversely affect the Company’sour ability to continue to implement itsour business strategy which could have a material adverse effect on the Company’sour liquidity, business, financial condition and results of operations.
The Company’s estimate of fair values for its investments may not be realizable if it were to sell these securities today.
The Company’s available-for-sale securities are carried at fair value. The Company’s held-to-maturity securities were carried at amortized cost.
The determination of fair value for securities categorized in Level 3 involves significant judgment due to the complexity of the factors contributing to the valuation, many of which are not readily observable in the market. Recent market disruptions and the resulting fluctuations in fair value have made the valuation process even more difficult and subjective. If the valuations are incorrect, it could harm the Company’s financial results and financial condition.
The Company may be materially and adversely affected by the highly regulated environment in which it operates.
The Company is subject to extensive federal and state regulation, supervision and examination. Banking regulations are primarily intended to protect depositors’ funds, FDIC funds, customers and the banking system as a whole, rather than the Company’s stockholders. Compliance with banking regulations is costly and these regulations affect the Company’s lending practices, capital structure, investment practices, mergers and acquisitions, dividend policy, and growth, among other things.
The Company and the Bank also undergo periodic examinations by their regulators, who have extensive discretion and authority to prevent or remedy unsafe or unsound practices or violations of law. Failure to comply with applicable laws, regulations or policies could result in sanctions by regulatory agencies, civil monetary penalties, and/or damage to the Company’s reputation, which could have a material adverse effect on the Company’s business, financial condition or results of operations.
A more detailed description of the primary federal and state banking laws and regulations that affect the Company and the Bank is included in this Form 10-K under the section captioned “Supervision and Regulation” in Item 1. Since the economic recession, federal and state banking laws and regulations, as well as interpretations and implementations of these laws and regulations, have undergone substantial review and change. In particular, the Dodd-Frank Act drastically revised the laws and regulations under which the Company operates. The burden of regulatory compliance has increased under the Dodd-Frank Act and has increased the Company’s costs of doing business and, as a result, may create an advantage for the Company’s competitors who may not be subject to similar legislative and regulatory requirements. Regulations and laws may be modified at any time, and new legislation may be enacted that will affect the Company or our subsidiaries. Any future changes in federal and state laws and regulations, as well as the interpretation and implementation of such laws and regulations, could affect the Company in substantial and unpredictable ways, including those listed above or other ways that could have a material adverse effect on the Company’s business, financial condition or results of operations.
The Company’s deposit insurance premiums could be substantially higher in the future, which could have a material adverse effect on the Company’s future earnings.
The FDIC insures deposits at FDIC-insured depository institutions, such as the Bank, up to $250,000 per account. The amount of a particular institution’s deposit insurance assessment is based on that institution’s risk classification under an FDIC risk-based
assessment system. An institution’s risk classification is assigned based on its capital levels and the level of supervisory concern the institution poses to its regulators. As a result of recent FDIC assessment charges, banks are now assessed deposit insurance premiums based on the bank’s average consolidated total assets less the sum of its average tangible equity, and the FDIC has modified certain risk-based adjustments, which increase or decrease a bank’s overall assessment rate. This has resulted in increases to the deposit insurance assessment rates and thus raised deposit premiums for many insured depository institutions. If these increases are insufficient for the Deposit Insurance Fund to meet its funding requirements, further special assessments or increases in deposit insurance premiums may be required. The Company is generally unable to control the amount of premiums that it is required to pay for FDIC insurance. If there are additional bank or financial institution failures, the Company may be required to pay higher FDIC premiums than the recent levels. Any future additional assessments, increases or required prepayments in FDIC insurance premiums could reduce the Company’s profitability, may limit its ability to pursue certain business opportunities or otherwise negatively impact its operations.
The Company is subject to federal and state fair lending laws, and failure to comply with these laws could lead to material penalties.
Federal and state fair lending laws and regulations, such as the Equal Credit Opportunity Act and the Fair Housing Act, impose nondiscriminatory lending requirements on financial institutions. The Department of Justice, the Consumer Financial Protection Bureau and other federal and state agencies are responsible for enforcing these laws and regulations. Private parties may also have the ability to challenge an institution’s performance under fair lending laws in private class action litigation. A successful challenge to the Company’s performance under the fair lending laws and regulations could adversely impact the Company’s rating under the Community Reinvestment Act and result in a wide variety of sanctions, including the required payment of damages and civil money penalties, injunctive relief, imposition of restrictions on merger and acquisition activity and restrictions on expansion activity, which could negatively impact the Company’s reputation, business, financial condition and results of operations.
The financial services industry, as well as the broader economy, may be subject to new legislation, regulation, and government policy.
At this time, it is difficult to predict the legislative and regulatory changes that will result from the current Presidential administration. However, both the President and senior members of the House of Representatives have advocated for significant reduction of financial services regulation, to include amendments to the Dodd-Frank Act and structural changes to the CFPB. The current administration and Congress also may cause broader economic changes due to changes in governing ideology and governing style. New appointments to the Board of Governors of the Federal Reserve could affect monetary policy and interest rates, and changes in fiscal policy could affect broader patterns of trade and economic growth. Future legislation, regulation, and government policy could affect the banking industry as a whole, including the Company’s business and results of operations, in ways that are difficult to predict. In addition, the Company’s results of operations also could be adversely affected by changes in the way in which existing statutes and regulations are interpreted or applied by courts and government agencies.
The Company’s ability to realize its deferred tax asset may be reduced, which may adversely impact its results of operations.
Deferred tax assets are reported as assets on the Company’s balance sheet and represent the decrease in taxes expected to be paid in the future because of net operating losses (“NOLs”) and tax credit carryforwards and because of future reversals of temporary differences in the bases of assets and liabilities as measured by enacted tax laws and their bases as reported in the financial statements. As of December 31, 2017, the Company had net deferred tax assets of $25.4 million, which included deferred tax assets for a federal net operating loss carryforward of $7.2 million that is expected to expire in 2031 thru 2033. Realization of deferred tax assets is dependent upon the generation of sufficient future taxable income during the periods in which existing deferred tax assets are expected to become deductible for income tax purposes. Based on projections of future taxable income in periods in which deferred tax assets are expected to become deductible, management determined that the realization of the Company’s net deferred tax asset was more likely than not. As a result, the Company did not recognize a valuation allowance on its net deferred tax asset as of December 31, 2017 or December 31, 2016. If it becomes more likely than not that some portion or the entire deferred tax asset will not be realized, a valuation allowance must be recognized. In July 2017, the State of Illinois enacted an income tax rate increase which resulted in the Company recording an additional income tax benefit and increase to the deferred tax asset of $1.6 million. In December 2017, the President signed the Tax Cuts and Jobs Act into law, which reduced the corporate federal income tax rate to 21% and resulted in a $9.5 million write-down of the Company’s deferred tax asset in the fourth quarter of 2017, through income tax expense. These tax rate changes, in conjunction with the Company’s net income in 2017, have resulted in a significant reduction of the deferred tax asset over the last year. The Company’s deferred tax asset may be further reduced in the future if estimates of future income or our tax planning strategies do not support the amount of the deferred tax assets. Charges to establish a valuation allowance with respect to our deferred tax asset could have a material adverse effect on the Company’s financial condition and results of operations.
The Company and its subsidiaries could become subject to claims and litigation pertaining to the Company’s or the Bank’s fiduciary responsibility.
Customers make claims and on occasion take legal action pertaining to the Company’s performance of its fiduciary responsibilities. Whether customer claims and legal action related to the Company’s performance of its fiduciary responsibilities are founded or unfounded, if such claims and legal action are not resolved in a manner favorable to the Company, they may result in significant
financial liability and/or adversely affect the market perception of the Company and its products and services as well as impact customer demand for those products and services. Any financial liability or reputational damage could have a material adverse effect on the Company’s business, which, in turn, could have a material adverse impact on its financial condition and results of operations.
The Company depends on its executive officers and other key employees, and its ability to attract additional key personnel, to continue the implementation of the Company’s long-term business strategy, and the Company could be harmed by the unexpected loss of their services.
The Company believes that its continued growth and future success will depend in large part on the skills of its executive officers and other key employees and its ability to motivate and retain these individuals, as well as its ability to attract, motivate and retain highly qualified senior and middle management and other skilled employees. The Company’s business is primarily relationship-driven in that many of its key personnel have extensive customer or asset management relationships. Loss of key personnel with such relationships may lead to the loss of business if the customers were to follow that employee to a competitor or if asset management expertise was not timely replaced. Competition for employees is intense, and the process of locating key personnel with the combination of skills and attributes required to execute the Company’s business strategy may be lengthy. We may not be successful in retaining key personnel, and the unexpected loss of services of one or more of the Company’s key personnel could have a material adverse effect on the Company’s business because of their skill, knowledge of the Company’s primary markets, years of industry experience and the difficulty of promptly finding qualified replacement personnel. If the services of any of the Company’s key personnel should become unavailable for any reason, the Company may not be able to identify and hire qualified persons on terms acceptable to the Company, or at all, which could have a material adverse effect on the Company’s business, financial condition, results of operation and future prospects.
The Company’s information systems may experience an interruption or breach in security and cyber-attacks, all if which could have a material adverse effect on the Company’s business.
The Company relies heavily on internal and outsourced technologies, communications, and information systems to conduct its business. Additionally, in the normal course of business, the Company collects, processes and retains sensitive and confidential information regarding our customers. As the Company’s reliance on technology has increased, so have the potential risks of a technology-related operation interruption (such as disruptions in the Company’s customer relationship management, general ledger, deposit, loan, or other systems) or the occurrence of a cyber-attack (such as unauthorized access to the Company’s systems). These risks have increased for all financial institutions as new technologies have emerged, including the use of the Internet and the expansion of telecommunications technologies (including mobile devices) to conduct financial and other business transactions, and as the sophistication of organized criminals, perpetrators of fraud, hackers, terrorists and others have increased.
In addition to cyber-attacks or other security breaches involving the theft of sensitive and confidential information, hackers recently have engaged in attacks against large financial institutions, particularly denial of service attacks, that are designed to disrupt key business services, such as customer-facing web sites. The Company operates in an industry where otherwise effective preventive measures against security breaches become vulnerable as breach strategies change frequently and cyber-attacks can originate from a wide variety of sources. It is possible that a cyber incident, such as a security breach, may be undetected for a period of time. However, applying guidance from the Federal Financial Institutions Examination Council, the Company has identified security risks and employs risk mitigation controls. Following a layered security approach, the Company has analyzed and will continue to analyze security related to device specific considerations, user access topics, transaction-processing and network integrity. The Company expects that it will spend additional time and will incur additional cost going forward to modify and enhance protective measures and that effort and spending will continue to be required to investigate and remediate any information security vulnerabilities.
The Company also faces risks related to cyber-attacks and other security breaches in connection with credit card and debit card transactions that typically involve the transmission of sensitive information regarding the Company’s customers through various third parties, including merchant acquiring banks, payment processors, payment card networks and its processors. Some of these parties have in the past been the target of security breaches and cyber-attacks. Because these third parties and related environments such as the point-of-sale are not under the Company’s direct control future security breaches or cyber-attacks affecting any of these third parties could impact the Company and in some cases the Company may have exposure and suffer losses for breaches or attacks. The Company offers its customers protection against fraud and attendant losses for unauthorized use of debit cards in order to stay competitive in the market place. Offering such protection exposes the Company to potential losses which, in the event of a data breach at one or more retailers of considerable magnitude, may adversely affect its business, financial condition, and results of operation. Further cyber-attacks or other breaches in the future, whether affecting the Company or others, could intensify consumer concern and regulatory focus and result in reduced use of payment cards and increased costs, all of which could have a material adverse effect on the Company’s business. To the extent we are involved in any future cyber-attacks or other breaches, the Company’s reputation could be affected with a potentially material adverse effect on the Company’s business, financial condition or results of operations.
The Company is dependent upon outside third parties for the processing and handling of Company records and data.
The Company relies on software developed by third party vendors to process various Company transactions. In some cases, the Company has contracted with third parties to run their proprietary software on behalf of the Company at a location under the control of
the third party. These systems include, but are not limited to, core data processing, payroll, wealth management record keeping, and securities portfolio management. While the Company performs a review of controls instituted by the vendor over these programs in accordance with industry standards and institutes its own user controls, the Company must rely on the continued maintenance of the performance controls by these outside parties, including safeguards over the security of customer data. In addition, the Company creates backup copies of key processing output daily in the event of a failure on the part of any of these systems. Nonetheless, the Company may incur a temporary disruption in its ability to conduct its business or process its transactions, or incur damage to its reputation if a third party vendor fails to adequately maintain internal controls or institute necessary changes to systems. A disruption or breach of security may ultimately have a material adverse effect on the Company’s financial condition and results of operations.
The Company and its subsidiaries are defendants in a variety of litigation and other actions.
Currently, there are certain other legal proceedings pending against the Company and its subsidiaries in the ordinary course of business. While the outcome of any legal proceeding is inherently uncertain, based on information currently available, the Company’s management believes that any liabilities arising from pending legal matters would not have a material adverse effect on the Bank or on the consolidated financial statements of the Company. However, if actual results differ from management’s expectations, it could have a material adverse effect on the Company’s financial condition, results of operations, or cash flows.
RisksRelated to the Company’s Proposed Merger with Greater Chicago Financial Corp. (“Greater Chicago Financial”)
Combining with Greater Chicago Financial may be more difficult, costly or time consuming than expected, and the anticipated benefits and cost savings of the merger may not be realized.
The Company and Greater Chicago Financial have operated and, until the completion of the merger, will continue to operate, independently. The success of the merger, including anticipated benefits and cost savings, will depend,an Investment in part, on the Company’s and Greater Chicago Financial’s ability to successfully combine and integrate the businesses of the Company and Greater Chicago Financial in a manner that permits growth opportunities and does not materially disrupt the existing customer relations or result in decreased revenues due to loss of customers. It is possible that the integration process could result in the loss of key employees, the disruption of either company’s ongoing businesses or inconsistencies in standards, controls, procedures and policies that adversely affect the combined company’s ability to maintain relationships with customers, depositors, clients and employees or to achieve the anticipated benefits and cost savings of the merger. If the combined companies experience difficulties with the integration process, the anticipated benefits of the merger may not be realized fully or at all, or may take longer to realize than expected. There also may be business disruptions that cause the Company and/or Greater Chicago Financial to lose customers or cause customers to remove their accounts from the Company and/or Greater Chicago Financial and move their business to competing financial institutions. Integration efforts will also divert management attention and resources. These integration matters could have an adverse effect on each of the Company and Greater Chicago Financial during this transition period and for an undetermined period after completion of the merger on the combined company.
Additionally, the combined company may not be able to successfully achieve the level of cost savings, revenue enhancements and other synergies that it expects, and may not be able to capitalize upon the existing customer relationships of each party to the extent anticipated, or it may take longer, or be more difficult or expensive than expected, to achieve these goals. These circumstances could have an adverse effect on the combined company's business, results of operation and stock price.
The merger may distract the Company’s management from their other responsibilities.
The merger could cause the Company’s management to focus their time and energies on matters related to the merger that otherwise would be directed to the Company’s business and operations. Any such distraction on the part of the Company’s management, if significant, could affect the Company’s ability to service existing business and develop new business and adversely affect its business and earnings before the merger, or the business and earnings of the combined company after the merger.
Regulatory approvals may not be received, may take longer than expected, or may impose conditions that are not presently anticipated or that could have an adverse effect on the combined company following the merger.
Before the merger may be completed, the Company must obtain approvals (or waivers of such approvals) from the Office of the Comptroller of the Currency and the Board of Governors of the Federal Reserve System. Other approvals, waivers or consents from regulators may also be required. These regulators may impose conditions on the completion of the merger or require changes to the terms of the merger. Although the Company does not currently expect that any such conditions or changes would be imposed, there can be no assurance that they will not be, and such conditions or changes could have the effect of delaying or preventing completion of the merger or imposing additional costs on or limiting the revenues of the combined company following the merger, any of which might have an adverse effect on the combined company following the merger.
If the merger with Greater Chicago Financial is not completed, the Company will have incurred substantial expenses without realizing the expected benefits of the merger.
The Company has incurred and will continue to incur substantial expenses in connection with the negotiation and completion of the transactions contemplated by the Merger Agreement with Greater Chicago Financial. If the merger is not completed, we would have to recognize these expenses without realizing the expected benefits of the merger.
Risks Associated with the Company’sOur Common Stock
The Company has not established a minimum dividend payment level, and it cannot ensure itsOur future ability to pay dividends in the future.
For several years prior to January 2014, the Company was under a Written Agreement with the Federal Reserve that included among other requirements and restrictions, limitations on the Company’s payment of dividends on its common stock. Although the Written Agreement was terminated in January 2014, the Company only resumed paying dividends during the second quarter of 2016 on its common stock.
Despite the termination of the Written Agreement, the Company is still subject to various restrictions on its ability to pay dividends imposed by the Federal Reserve. The Company.
We currently conduct substantially all of our operations through our subsidiaries, and a significant part of our income is also subjectattributable to the limitations of the DGCL. The DGCL allows the Company to pay dividends only out of its surplus (as defined and computed in accordance with the provisions of the DGCL) or, if the Company has no such surplus, out of its net profits for the fiscal year in which the dividend is declared and/or the preceding fiscal year. In addition, the Company is a legal entity separate and distinct from our bank subsidiary. The Company’s principal source of cash flow, including cash flow to pay dividends to our stockholders and principal and interest on our outstanding debt, is dividends from the Bank. There are statutory and regulatory limitationsWe principally rely on the paymentprofitability of dividends by the Bank to conduct operations and satisfy obligations. As is the Company, as well as by us to our stockholders. Ifcase with all financial institutions, the profitability of the Bank is unable to make dividend paymentssubject to the Companyfluctuating cost and sufficient cash or liquidity is not otherwise available, the Company may not be able to make dividend payments to its stockholders.availability of money, changes in interest rates, and in economic conditions in general.
Holders of the Company’sour common stock are also only entitled to receive such cash dividends as the Company’sour board of directors may declare out of funds legally available for such payments. Any declaration and payment of dividends on common stock will depend upon our earnings and financial condition, liquidity and capital requirements, the general economic and regulatory climate, our ability to service any equity or debt obligations senior to the common stock, and other factors deemed relevant by the board of directors. Furthermore, consistent with our business plans, growth initiatives, capital availability, projected liquidity needs, and other factors, we have made, and will continue to make, capital management decisions and policies that could adversely impact the amount of dividends, if any, paid to our stockholders. Although we currently expect to continue to pay quarterly dividends, any future determination relating to our dividend policy will be made by our board of directors and will depend on a number of factors. We are subject to certain restrictions on the payment of cash dividends as a result of banking laws, regulations and policies. Finally, our ability to pay dividends to our stockholders depends on our receipt of dividends from the Bank, which is also subject to restrictions on dividends as a result of banking laws, regulations and policies. See Part II, Item 5. “Dividends.”
The trading volumes in the Company’sour common stock may not provide adequate liquidity for investors.investors.
Shares of the Company’sour common stock are listed on the NasdaqNASDAQ Global Select Market; however, the average daily trading volume in itsour common stock is less than that of most larger financial services companies. A public trading market having the desired characteristics of depth, liquidity and orderliness depends on the presence in the marketplace of a sufficient number of willing buyers and sellers of the common stock at any given time. This presence depends on the individual decisions of investors and general economic and market conditions over which the Company haswe have no control. Given the current daily average trading volume of the Company’sour common stock, significant sales of the Company’sour common stock in a brief period of time, or the expectation of these sales, could cause a significant decline in the price of the Company’sour common stock.
The trading price of the Company’sour common stock may be subject to continued significant fluctuations and volatility.volatility.
The market price of the Company’sour common stock could be subject to significant fluctuations due to, among other things:
| ·
● | | actual or anticipated quarterly fluctuations in itsour operating and financial results, particularly if such results vary from the expectations of management, securities analysts and investors, including with respect to further loan and leasecredit losses the Companyon loans or unfunded commitments we may incur; |
| ·
● | | announcements regarding significant transactions in which the Companywe may engage; |
| ·
● | | market assessments regarding such transactions; |
| ·
● | | changes or perceived changes in itsour operations or business prospects; |
| ·
● | | legislative or regulatory changes affecting itsour industry generally or itsour businesses and operations; |
| ·
● | | the failurea weakening of general market and economic conditions, to stabilize and recover, particularly with respect to economic conditions in Illinois, and the pace of any such stabilization and recovery;
Illinois; |
| ·
● | | the operating and share price performance of companies that investors consider to be comparable to the Company; us; |
| ·
● | | future offerings by the Companyus of debt, preferred stock or trust preferred securities, each of which would be senior to itsour common stock upon liquidation and for purposes of dividend distributions; |
| ·
● | | actions of itsour current stockholders, including future sales of common stock by existing stockholders and itsour directors and executive officers; and |
| ·
● | | other changes in U.S. or global financial markets, economies and market conditions, such as interest or foreign exchange rates, stock, commodity, credit or asset valuations or volatility. |
Stock markets in general, and the Company’s common stock in particular, have experienced significant volatility since 2007 and continue to experience significant price and volume volatility. As a result, the market price of the Company’sour common stock may continue to be subject to similar market fluctuations that may or may not be related to itsour operating performance or prospects. Increased volatility could result in a decline in the market price of the Company’sour common stock.
Shares of the Company’sour common stock are subject to dilution, which could cause the Company’sour common stock price to decline.decline.
The Company isWe are generally not restricted from issuing additional shares of itsour common stock up to the number of shares authorized in itsour Certificate of Incorporation. The CompanyWe may issue additional shares of itsour common stock (or securities convertible into common stock) in the future for a number of reasons, including to finance the Company’sour operations and business strategy (including mergers and acquisitions), to adjust itsour ratio of debt to equity, to address regulatory capital concerns, or to satisfy the Company’sour obligations upon the exercise of outstanding options or warrants. The Companystock awards. We may issue equity securities in transactions that generate cash proceeds, transactions that free up regulatory capital but do not immediately generate or preserve substantial amounts of cash, and transactions that generate regulatory or balance sheet capital only and do not generate or preserve cash. If the Company chooseswe choose to raise capital by selling shares of itsour common stock or securities convertible into common stock for any reason, the issuance would have a dilutive effect on the holders of the Company’sour common stock and could have a material negative effect on the market price of the Company’sour common stock.
Certain banking laws and the Company’sour governing documents may have an anti-takeover effect.effect and may make it difficult and expensive to remove current management.
Certain federal banking laws, including regulatory approval requirements, could make it more difficult for a third party to acquire the Company,us, even if doing so would be perceived to be beneficial to the Company’sour stockholders. In addition, certain provisions in our certificate of incorporation and bylaws could make it more difficult for a third party to acquire control of the Company, haseven if such event was perceived by you to be beneficial to your interests. These include, among others, (a) provisions that empower our board of directors, without stockholder approval, to issue preferred stock, the terms of which, including voting power, are set by the board of directors, (b) we have a classified board of directors with three-year staggered terms, which may delay the ability of stockholders to change the membership of a majority of our board, and has adopted an Amended and Restated Rights Plan and Tax Benefits Preservation Plan as amended (the “Rights Plan”), which expires on September 12, 2018, and is intended to discourage any person from acquiring 5% or more(c) the approval of certain business combinations require the Company’saffirmative vote of at least 75% of our outstanding stock (with certain limited exceptions), in order to help preserve the valueshares of its deferred tax asset.common stock. The combination of these laws and provisions in our certificate of incorporation may inhibit certain business combinations, including a non-negotiated merger or other business combination, which, in turn, could adversely affect the market price of the Company’sour common stock.These provisions in our certificate of incorporation could also discourage proxy contests and make it more difficult and expensive for holders of our common stock to elect directors other than the candidates nominated by our board of directors or otherwise remove existing directors and management, even if current management is not performing adequately.
Item 1B. Unresolved Staff Comments
Comments
None.
Item 2. Properties
Properties
We conduct our business primarily at 2563 banking locations in various communities throughout the greater western and southern Chicago metropolitan area. The principal business office of the Company is located at 37 South River Street, Aurora, Illinois. We own 2357 of our properties and lease twosix of our locations. The Company’s twoOur six leased locations are under agreement from March 31, 2022 through March 2018 and December 31, 2018, with the December 2018 lease expiration under an option to extend through December 31, 2021.June 30, 2030. We believe that
all of our properties and equipment are well maintained, in good operating condition and adequate for all of our present and anticipated needs.
Item 3. Legal ProceedingsProceedings
The Company and its subsidiaries have, from time to time, collection suits and other actions that arise in the ordinary course of business against its borrowers and are defendants in legal actions arising from normal business activities. Management, after consultation with legal counsel, believes that the ultimate liabilities, if any, resulting from these actions will not have a material adverse effect on the financial position of the Bank or on the consolidated financial position of the Company.
Item 4. Mine Safety Disclosures
Disclosures
Not applicable.
PART II
PART IIItem 5. Market for Registrant’s Common Equity, Related Stockholder Matters and Issuer Purchases of Equity Securities
For information regarding securities authorized for issuance under the Company’s equity compensation plans, see Part III, Item 12.
Market for the Company’s Common Stock
The Company’sOur common stock trades on The Nasdaqthe NASDAQ Global Select Market under the symbol “OSBC”.“OSBC.” As of December 31, 2017, the Company2021, we had 891872 stockholders of record of itsfor our common stock. The following table sets forth the high and low trading prices of the Company’sour common stock on the NASDAQ Global Select Market, and information about declared dividends during each quarter for 20172021 and 2016.2020.
| | | | | | | | | | | | | | | | | | | |
| | 2021 | | 2020 | |
| | High | | Low | | Dividend | | High | | Low | | Dividend | |
First quarter | | $ | 14.16 | | $ | 9.75 | | $ | 0.01 | | $ | 13.33 | | $ | 6.09 | | $ | 0.01 | |
Second quarter | | | 14.45 | | | 12.29 | | | 0.05 | | | 9.18 | | | 5.96 | | | 0.01 | |
Third quarter | | | 13.30 | | | 11.16 | | | 0.05 | | | 8.97 | | | 6.95 | | | 0.01 | |
Fourth quarter | | | 14.23 | | | 11.95 | | | 0.05 | | | 10.78 | | | 7.38 | | | 0.01 | |
| | | | | | | | | | | | | | | | | | | |
| | 2017 | | 2016 | |
| | High | | Low | | Dividend | | High | | Low | | Dividend | |
First quarter | | $ | 11.50 | | $ | 9.65 | | $ | 0.01 | | $ | 7.78 | | $ | 6.22 | | $ | - | |
Second quarter | | | 12.75 | | | 10.95 | | | 0.01 | | | 7.55 | | | 6.37 | | | 0.01 | |
Third quarter | | | 13.50 | | | 10.75 | | | 0.01 | | | 8.65 | | | 6.67 | | | 0.01 | |
Fourth quarter | | | 14.90 | | | 12.15 | | | 0.01 | | | 11.64 | | | 7.45 | | | 0.01 | |
Dividends
The Company resumed paying dividends in 2016 as set forth in the table above.
The Company’s stockholders are entitled to receive dividends when, as and if declared by the board of directors out of funds legally available therefor. The Company’s ability to pay dividends to stockholders is largely dependent upon the dividends it receives from the Bank; however, certain regulatory restrictions and the terms of its debt and equity securities, limit the amount of cash dividends it may pay. See “Supervision and Regulation—Regulation and Supervision of the Bank.”
Although we currently expect to continue to pay quarterly dividends, any future determination relating to our dividend policy will be made by our board of directors and will depend on a number of factors, including: (1) our historic and projected financial condition, liquidity and results of operations, (2) our capital levels and needs, (3) tax considerations, (4) any acquisitions or potential acquisitions that we may examine, (5) statutory and regulatory prohibitions and other limitations, (6) the terms of any credit agreements or other borrowing arrangements that restrict our ability to pay cash dividends, (7) general economic conditions and (8) other factors deemed relevant by our board of directors. We are not obligated to pay dividends on our common stock and are subject to restrictions on paying dividends on our common stock.
As a Delaware corporation, we are subject to certain restrictions on dividends under the DGCL. Generally, a Delaware corporation may only pay dividends either out of surplus or out of the current or the immediately preceding year’s net profits. Surplus is defined as the excess, if any, at any given time, of the total assets of a corporation over its total liabilities and statutory capital. The value of a corporation’s assets can be measured in a number of ways and may not necessarily equal their book value.
In addition, we are subject to certain restrictions on the payment of cash dividends as a result of banking laws, regulations and policies. See “Supervision and Regulation—Regulation and Supervision of the Company.”
Stock Repurchases
In September 2019, our board of directors authorized the repurchase of up to 1,494,826 shares of our common stock (the “Repurchase Program”). The Repurchase Program expired on September 19, 2020. However, on October 20, 2020, the Company received notice of non-objection from the Federal Reserve Bank of Chicago to extend the Repurchase Program through October 20, 2021. During 2021, we repurchased 766,034 shares at a weighted average share price of $12.81 per share. In total, we repurchased 1,485,307 shares of our common stock at a weighted average price of $10.31 per share under our stock repurchase program over the two year period. We made no repurchases under the Repurchase Program in the fourth quarter of 2021. The Repurchase Program expired on October 21, 2021, and no other repurchase program is in effect as of December 31, 2021.
Recent Sales of Unregistered Securities
None.
Form 10-K and Other Information
Transfer Agent/Stockholder Services
Inquiries related to stockholdersstockholders’ records, stock transfers, changes of ownership, change of address and dividend payments should be sent to the transfer agent at the following address:
Old Second Bancorp, Inc.
c/o Shirley Cantrell,
ShareholderStockholder Relations Department
37 South River Street
Aurora, Illinois 60507
(630) 906-2303
scantrell@oldsecond.com
Stockholder Return Performance Graph. The following graph indicates, for the period commencing December 31, 2012,2016, and ending December 31, 2017,2021, a comparison of cumulative total returns for the Company, S&P 500 Index and the SNL U.S.KBW NASDAQ Bank Nasdaq.Index. The information assumes that $100 was invested at the closing price at December 31, 2012,2016, in the common stock of the Company and each index and that all dividends were reinvested.
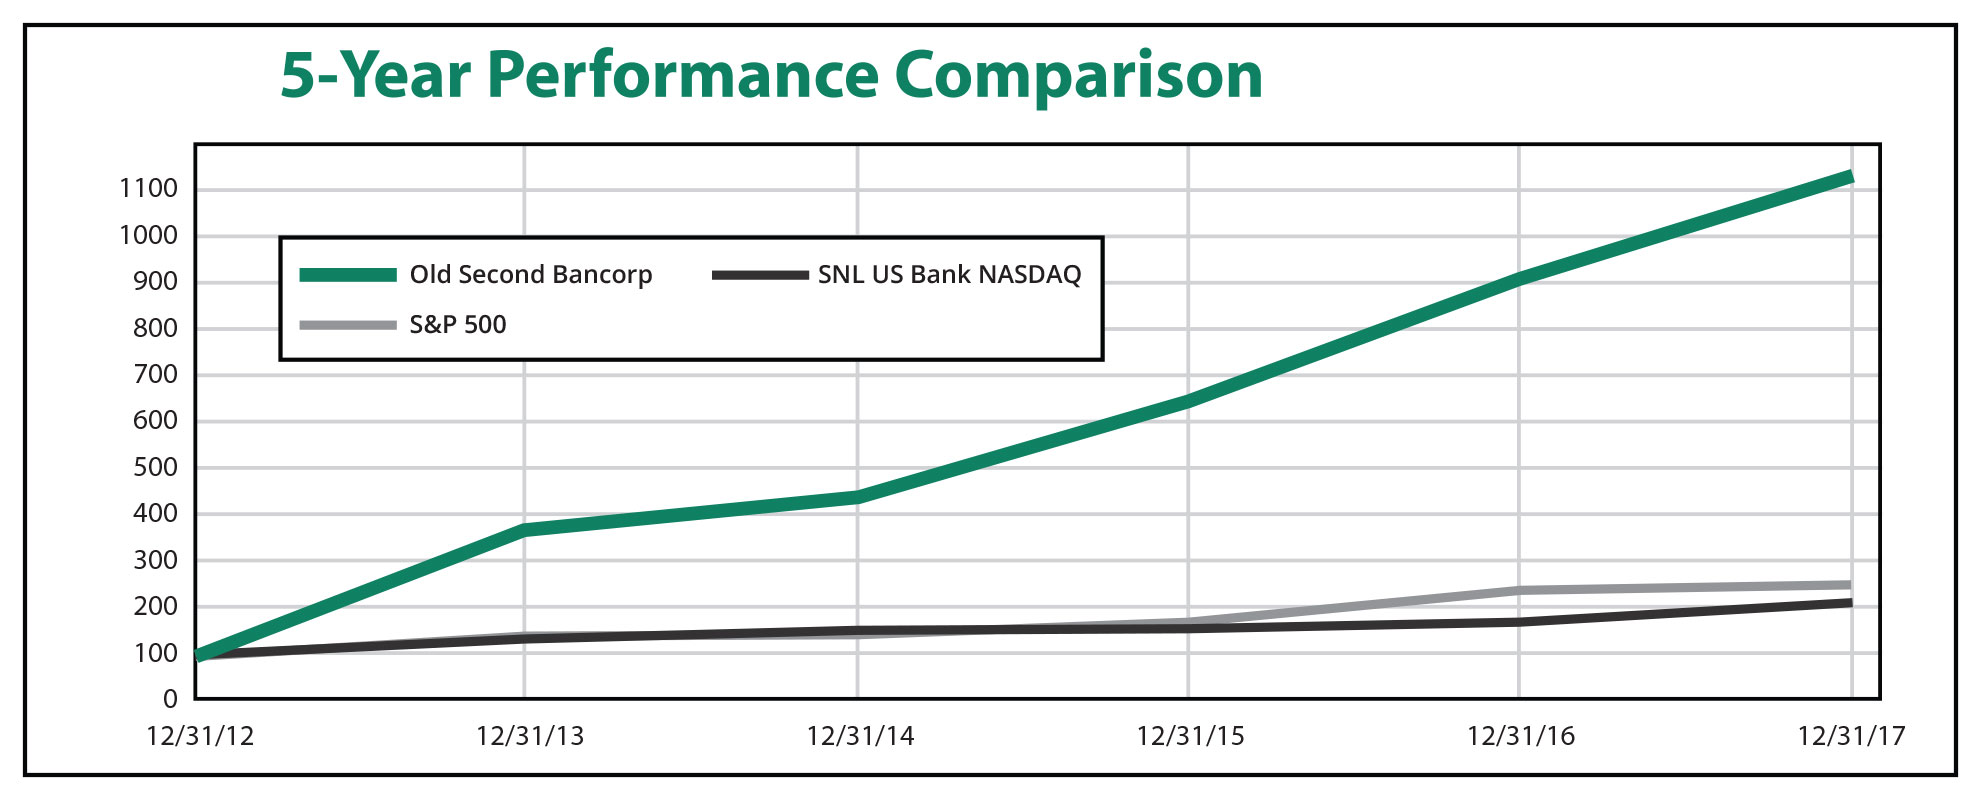
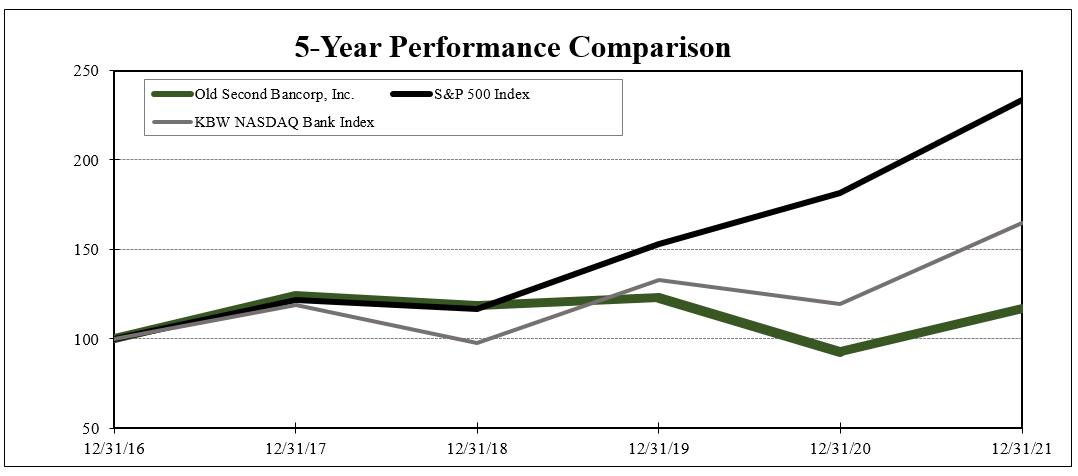
| | | | | | | | | | | | | |
| | Period Ending | |
Index | | 12/31/2012 | | 12/31/2013 | | 12/31/2014 | | 12/31/2015 | | 12/31/2016 | | 12/31/2017 | |
Old Second Bancorp, Inc. | | 100.00 | | 378.69 | | 440.16 | | 642.62 | | 909.35 | | 1,127.10 | |
S&P 500 | | 100.00 | | 132.39 | | 150.51 | | 152.59 | | 170.84 | | 208.14 | |
SNL U.S. Bank NASDAQ | | 100.00 | | 143.73 | | 148.86 | | 160.70 | | 222.81 | | 234.58 | |
| | | | | | | | | | | | | |
| | Period Ending | |
Index | | 12/31/2016 | | 12/31/2017 | | 12/31/2018 | | 12/31/2019 | | 12/31/2020 | | 12/31/2021 | |
Old Second Bancorp, Inc. | | 100.00 | | 123.95 | | 118.37 | | 123.03 | | 92.64 | | 116.96 | |
S&P 500 Index | | 100.00 | | 121.83 | | 116.49 | | 153.17 | | 181.35 | | 233.41 | |
KBW Nasdaq Bank Index | | 100.00 | | 118.59 | | 97.58 | | 132.84 | | 119.14 | | 164.80 | |
Purchases of Equity Securities By the Issuer and Affiliated Purchasers
None.
Item 6. Selected Financial Data
[Reserved]
Old Second Bancorp, Inc. and Subsidiaries
Financial Highlights
(In thousands, except share data)
| | | | | | | | | | | | | | | | |
| | 2017 | | 2016 | | 2015 | | 2014 | | 2013 | |
Balance sheet items at year-end | | | | | | | | | | | | | | | | |
Total assets | | $ | 2,383,429 | | $ | 2,251,188 | | $ | 2,077,028 | | $ | 2,060,905 | | $ | 2,003,104 | |
Total earning assets | | | 2,191,685 | | | 2,037,012 | | | 1,862,257 | | | 1,832,714 | | | 1,758,582 | |
Average assets | | | 2,318,798 | | | 2,142,748 | | | 2,065,122 | | | 2,036,493 | | | 1,961,734 | |
Loans, gross | | | 1,617,622 | | | 1,478,809 | | | 1,133,715 | | | 1,159,332 | | | 1,101,256 | |
Allowance for loan and lease losses | | | 17,461 | | | 16,158 | | | 16,223 | | | 21,637 | | | 27,281 | |
Deposits | | | 1,922,925 | | | 1,866,785 | | | 1,759,086 | | | 1,685,055 | | | 1,682,128 | |
Securities sold under agreement to repurchase | | | 29,918 | | | 25,715 | | | 34,070 | | | 21,036 | | | 22,560 | |
Other short-term borrowings | | | 115,000 | | | 70,000 | | | 15,000 | | | 45,000 | | | 5,000 | |
Junior subordinated debentures | | | 57,639 | | | 57,591 | | | 57,543 | | | 57,496 | | | 57,448 | |
Senior notes | | | 44,058 | | | 43,998 | | | - | | | - | | | - | |
Subordinated debt | | | - | | | - | | | 45,000 | | | 45,000 | | | 45,000 | |
Note payable | | | - | | | - | | | 500 | | | 500 | | | 500 | |
Stockholders’ equity | | | 200,350 | | | 175,210 | | | 155,929 | | | 194,163 | | | 147,692 | |
| | | | | | | | | | | | | | | | |
Results of operations for the year ended | | | | | | | | | | | | | | | | |
Interest and dividend income | | | 87,505 | | | 73,379 | | | 68,164 | | | 68,044 | | | 69,040 | |
Interest expense | | | 12,626 | | | 9,938 | | | 9,076 | | | 10,984 | | | 13,786 | |
Net interest and dividend income | | | 74,879 | | | 63,441 | | | 59,088 | | | 57,060 | | | 55,254 | |
Provision (release) for loan and lease losses | | | 1,800 | | | 750 | | | (4,400) | | | (3,300) | | | (8,550) | |
Noninterest income | | | 30,372 | | | 28,574 | | | 29,294 | | | 29,216 | | | 31,183 | |
Noninterest expense | | | 69,149 | | | 66,761 | | | 68,421 | | | 73,679 | | | 83,144 | |
Income before taxes | | | 34,302 | | | 24,504 | | | 24,361 | | | 15,897 | | | 11,843 | |
Provision (benefit) for income taxes | | | 19,164 | | | 8,820 | | | 8,976 | | | 5,761 | | | (70,242) | |
Net income | | | 15,138 | | | 15,684 | | | 15,385 | | | 10,136 | | | 82,085 | |
Preferred stock dividends and accretion | | | - | | | - | | | 1,873 | | | (1,719) | | | 5,258 | |
Net income available to common stockholders | | $ | 15,138 | | $ | 15,684 | | $ | 13,512 | | $ | 11,855 | | $ | 76,827 | |
| | | | | | | | | | | | | | | | |
Loan quality ratios | | | | | | | | | | | | | | | | |
Allowance for loan and lease losses to total loans at end of year | | | 1.08 | % | | 1.09 | % | | 1.43 | % | | 1.87 | % | | 2.48 | % |
Provision for loan and lease losses to total loans | | | 0.11 | % | | 0.05 | % | | (0.39) | % | | (0.28) | % | | (0.78) | % |
Net loans charged-off to average total loans | | | 0.03 | % | | 0.07 | % | | 0.09 | % | | 0.21 | % | | 0.25 | % |
Nonaccrual loans to total loans at end of year | | | 0.89 | % | | 1.03 | % | | 1.27 | % | | 2.32 | % | | 3.53 | % |
Nonperforming assets to total assets at end of year | | | 1.01 | % | | 1.24 | % | | 1.63 | % | | 2.87 | % | | 4.06 | % |
Allowance for loan and lease losses to nonaccrual loans | | | 121.36 | % | | 105.73 | % | | 112.75 | % | | 80.36 | % | | 70.11 | % |
| | | | | | | | | | | | | | | | |
Per share data | | | | | | | | | | | | | | | | |
Basic earnings | | $ | 0.51 | | $ | 0.53 | | $ | 0.46 | | $ | 0.46 | | $ | 5.45 | |
Diluted earnings | | | 0.50 | | | 0.53 | | | 0.46 | | | 0.46 | | | 5.45 | |
Common book value per share | | | 6.76 | | | 5.93 | | | 5.29 | | | 4.99 | | | 5.37 | |
| | | | | | | | | | | | | | | | |
Weighted average diluted shares outstanding | | | 30,038,417 | | | 29,838,931 | | | 29,730,074 | | | 25,549,193 | | | 14,106,033 | |
Weighted average basic shares outstanding | | | 29,600,702 | | | 29,532,510 | | | 29,476,821 | | | 25,300,909 | | | 13,939,919 | |
Shares outstanding at year-end | | | 29,627,086 | | | 29,556,216 | | | 29,483,429 | | | 29,442,508 | | | 13,917,108 | |
The following represents unaudited quarterly financial information for the periods indicated:
| | | | | | | | | | | | | | | | | | | | | | | | | |
| | 2017 | | 2016 | |
| | 4th | | 3rd | | 2nd | | 1st | | 4th | | 3rd | | 2nd | | 1st | |
Interest income | | $ | 22,664 | | $ | 22,425 | | $ | 21,800 | | $ | 20,616 | | $ | 20,196 | | $ | 17,825 | | $ | 17,779 | | $ | 17,579 | |
Interest expense | | | 3,278 | | | 3,142 | | | 3,139 | | | 3,067 | | | 2,686 | | | 2,478 | | | 2,416 | | | 2,358 | |
Net interest income | | | 19,386 | | | 19,283 | | | 18,661 | | | 17,549 | | | 17,510 | | | 15,347 | | | 15,363 | | | 15,221 | |
Loan loss reserve | | | 750 | | | 300 | | | 750 | | | - | | | 750 | | | - | | | - | | | - | |
Securities gains (losses), net | | | 639 | | | 102 | | | (131) | | | (136) | | | (193) | | | (1,959) | | | - | | | (61) | |
Income before taxes | | | 10,629 | | | 9,908 | | | 7,242 | | | 6,523 | | | 7,973 | | | 5,359 | | | 5,940 | | | 5,232 | |
Net (loss) income | | | (2,512) | | | 8,077 | | | 5,146 | | | 4,427 | | | 5,018 | | | 3,499 | | | 3,845 | | | 3,322 | |
Basic (losses) earnings per share | | | (0.08) | | | 0.27 | | | 0.17 | | | 0.15 | | | 0.17 | | | 0.12 | | | 0.13 | | | 0.11 | |
Diluted (losses) earnings per share | | | (0.08) | | | 0.27 | | | 0.17 | | | 0.15 | | | 0.17 | | | 0.12 | | | 0.13 | | | 0.11 | |
Item 7. Management’s Discussion and Analysis of Financial Condition and Results of Operations
Operations
The following discussion provides additional information regarding the Company’sour operations for the twelve-month periods ending December 31, 2017, 20162021, 2020 and 2015,2019, and financial condition at December 31, 20172021 and 2016. This discussion2020, and should be read in conjunction with “Selected Financial Data” and the Company’sour consolidated financial statements and the accompanying notes theretorelated notes. Historical results of operations and the percentage relationships among any amounts included, elsewhereand any trends that may appear, may not indicate trends in this document. operations or results of operations for any future periods.
We have made, and will continue to make, various forward-looking statements with respect to financial and business matters. Comments regarding our business that are not historical facts are considered forward-looking statements that involve inherent risks and uncertainties. Actual results may differ materially from those contained in these forward-looking statements. For additional information regarding our cautionary disclosures, see the “Cautionary Note Regarding Forward-Looking Statements” at the beginning of this annual report.
Business overview
The Company providesWe provide a wide range of financial services through its 25our 63 banking locations located in Cook, DeKalb, DuPage, Kane, Kendall, DeKalb, DuPage, LaSalle Will and CookWill counties in Illinois. These banking centers offer access to a full range of traditional retail and commercial banking services including treasury management operations as well as fiduciary and wealth management services. The Company focuses itsWe focus our business uponon establishing and maintaining relationships with itsour clients while maintaining a commitment to providing for the financial services needs of the communities in which it operateswe operate through itsour retail branch network. The Company emphasizesWe emphasize relationships with individual customers as well as small to medium-sized businesses throughout our market area. The Company’sOur market area includes a mix of commercial and industrial, real estate, and consumer related lending opportunities, and provides a stable, loyal core deposit base. The CompanyWe also hasoffer extensive wealth management
services, which includesinclude a registered investment advisory platform in addition to trust administration and trust services related to personal and corporate trusts, including employee benefit plan administration services.
The Company’sOur primary deposit products are checking, NOW, money market, savings, and certificate of deposit accounts, and the Company’sour primary lending products are commercial mortgages, leases, construction lending, commercial loans, residential mortgages, leases and consumer loans. Major portionsMany of the Company’sour loans are secured by various forms of collateral including real estate, business assets, and consumer property although borrower cash flow is the primary source of repayment at the time of loan origination.
On December 1, 2021, we closed on our acquisition of West Suburban Bancorp, Inc. (“West Suburban”), and its wholly owned subsidiary, West Suburban Bank. As a result of this transaction, we acquired $1.07 billion of securities available-for sale at fair value, $1.50 billion of loans, net of fair value adjustments, and $2.69 billion of deposits, net of fair value adjustments. The transaction resulted in us increasing our presence in the west suburban Chicago area, as 34 branches were acquired with a retail and commercial client mix of loans and deposits. Historical periods before December 1, 2021, reflect results of our legacy operations. Subsequent to closing, results reflect all post-acquisition activity of the combined company.
COVID-19 Update
Our historically careful underwriting practices and diverse loan portfolio has helped minimize the adverse impact of the pandemic on the Company. In addition, the combination of the vaccine rollout, government stimulus payments, and reduced spending during the pandemic are likely contributing factors mitigating the impact of the pandemic on our business, financial condition, results of operations, and our customers as of December 31, 2021. However, there are continuing concerns that indicate a slower return to pre-pandemic routines, such increases in new COVID-19 cases, hospitalizations and deaths leading to additional government imposed restrictions; refusals to receive the vaccine along with concerns related to new strains of the virus; supply chain issues remaining unresolved longer than anticipated; labor shortages and wage increases continuing to impact many industries; consumer confidence and spending falls; and rising geopolitical tensions. Given the ongoing and dynamic nature of the circumstances surrounding the pandemic, it is difficult to predict its future adverse financial impact to the Company, although we expect to continue to be impacted by the pandemic in 2022.
Results of Operation and Financial Condition
We are monitoring the continuing impact of the COVID-19 pandemic on our results of operation and financial condition. To date, the COVID-19 pandemic has not significantly impacted the health of the overall real estate industry in our markets, which have reflected relative stability over the Company’s markets continuedpast three years. In addition, we have not experienced significant incurred losses on loans or received communications from our borrowers that significant losses were imminent. While management does not currently expect the next year to improveresult in 2017. While the precipitous decline in the value of certain real estate assets slowedsimilar to the declines seen in 2009 to 2010, our forecast includes assumptions for certain loss scenarios that may occur due to market volatility stemming from the pandemic, unrest overseas or fluctuations in interest rates. In 2020, we increased our allowance for credit losses by $14.1 million, which was due to both our anticipation of continued market risk and uncertainty related to the pandemic and our adoption of the new CECL methodology. In 2021, due to the lack of significant net charge-offs projected with the 2020 forecast, and a more favorable forecast for the estimated life of loans, we reversed $9.5 million of our legacy allowance for credit losses, but recorded $12.1 million of Day One credit marks to the allowance for credit losses, as well as $12.2 million of Day Two adjustments on non-purchase credit deteriorated life of loan loss estimates, each stemming from the West Suburban acquisition. We continue to monitor the impact of COVID-19, as periods ending after December 31, 2021 may be materially impacted by the COVID-19 pandemic.
We also adjust our investment securities portfolio to fair value each period end and review for any impairment that would require a provision for credit losses. At this time, we have determined there is no need for a provision for credit losses related to our investment securities portfolio. Because of changing economic and market conditions affecting issuers, we may be required to recognize impairments in the latterfuture on the securities we hold as well as experience reductions in other comprehensive income. We cannot currently determine the ultimate impact of the pandemic on the long-term value of our portfolio.
As of December 31, 2021, we had $86.3 million of goodwill. At November 30, 2021, we performed our recurring annual review for any goodwill impairment. We determined no goodwill impairment existed. However, further delayed recovery or further deterioration in market conditions related to the general economy, financial markets, and the associated impacts on our customers, employees and vendors, among other factors, could significantly impact the impairment analysis and may result in future goodwill impairment charges that, if incurred, could have a material adverse effect on our results of operations and financial condition.
Lending Operations and Accommodations to Borrowers
To more fully support our customers during the pandemic, we established client assistance programs, including offering commercial, consumer, and mortgage loan payment deferrals for certain clients. During 2020 and 2021, we executed 509 of these deferrals on loan balances of $242.7 million. In accordance with interagency guidance issued in March 2020, these short term deferrals were not considered troubled debt restructurings. As of December 31, 2021, 502 loans previously in deferral status, representing loan balances of $234.9 million, had resumed payments or paid off, and 7 loans totaling $7.8 million remained in active deferral status, of which only $7.7 million were in nonaccrual status. In addition, we paused new foreclosure and repossession actions through December 31, 2020, and we continue
to re-evaluate these activities based on the ongoing COVID-19 pandemic. These programs may negatively impact our revenue and other results of operations in the near term and, if not effective in mitigating the effect of COVID-19 on our customers, may adversely affect our business and results of operations more substantially over a longer period of time. Future governmental actions may require these and other types of customer-related responses.
During 2020, as part of 2010, continued difficult market conditionsthe first round of the SBA Paycheck Protection Program (“PPP”), we processed 746 PPP loan applications, representing a total of $136.7 million. In January through 2015 generated smaller declines in valuesMay 2021, we processed an additional 574 PPP loans, totaling $62.3 million, as part of real estate and associated asset types. Overall stable market conditions over the past two years are reflected insecond round of the financials presentedprogram, before the program expired on May 31, 2021. We started the application process for loan forgiveness for the reporting period that endedfirst round of PPP loans in October 2020, and we continued to receive funds for forgiven loans from both the first and second round of PPP loans during 2021. As of December 31, 2017. The availability2021, we had 316 loans, which totaled $38.4 million, still outstanding under the PPP program, which includes $20.8 million of ready local markets for real estate, while improved, remained limited and continued to affect the ability of many borrowers to pay on their obligations.
On October 28, 2016, the Company closed on itsPPP loan acquired with our acquisition of West Suburban. We expect the Chicago branchapplication process for loan forgiveness to continue through the first half of Talmer Bank2022, with funds to be received from the SBA for the forgiven loans through June 2022. We recorded $3.1 million of net fee and Trust,interest income on PPP loans in 2021 and in 2020. As of December 31, 2021, unearned net fee income on both first and second round PPP loans totaled $188,000.
Capital and Liquidity
As of December 31, 2021, all of our capital ratios were in excess of all regulatory requirements. While we believe that we have sufficient capital to withstand an extended economic recession brought about by the banking subsidiary of Talmer Bancorp, Inc. (“Talmer”). AsCOVID-19 pandemic, our reported and regulatory capital ratios could be adversely impacted by credit losses.
We believe there could be potential stresses on liquidity management as a result of this transaction, the Company acquired $223.8 million of loans, prior to fair value adjustment, and $48.9 million of deposits. The purchase resultedCOVID-19 pandemic. For instance, as customers manage their own liquidity stress, we could experience an increase in the Company establishingutilization of existing lines of credit.
We have developed new processes to monitor our liquidity on a metropolitan Chicago office presence with a strong commercial client focus,daily basis, and retention have run stress testing based on various economic assumptions under stress and severe stress scenarios.
Summary Financial Data
Old Second Bancorp, Inc. and Subsidiaries
Financial overviewHighlights
(Dollars in thousands, except per share data)
| | | | | | | | | | |
| | 2021 | | 2020 | | 2019 | |
Balance sheet items at year-end | | | | | | | | | | |
Total assets | | $ | 6,212,189 | | $ | 3,040,837 | | $ | 2,635,545 | |
Total earning assets | | | 5,845,972 | | | 2,859,154 | | | 2,444,974 | |
Average assets | | | 3,483,100 | | | 2,860,770 | | | 2,623,443 | |
Loans, gross | | | 3,421,948 | | | 2,034,851 | | | 1,930,812 | |
Allowance for credit losses on loans | | | 44,281 | | | 33,855 | | | 19,789 | |
Deposits | | | 5,466,232 | | | 2,537,073 | | | 2,126,749 | |
Securities sold under agreement to repurchase | | | 50,337 | | | 66,980 | | | 48,693 | |
Other short-term borrowings | | | - | | | - | | | 48,500 | |
Junior subordinated debentures | | | 25,773 | | | 25,773 | | | 57,734 | |
Subordinated debentures | | | 59,212 | | | - | | | - | |
Senior notes | | | 44,480 | | | 44,375 | | | 44,270 | |
Notes payable and other borrowings | | | 19,074 | | | 23,393 | | | 6,673 | |
Stockholders’ equity | | | 502,027 | | | 307,087 | | | 277,864 | |
| | | | | | | | | | |
Results of operations for the year ended | | | | | | | | | | |
Interest and dividend income | | $ | 105,215 | | $ | 104,215 | | $ | 115,594 | |
Interest expense | | | 8,451 | | | 12,464 | | | 18,835 | |
Net interest and dividend income | | | 96,764 | | | 91,751 | | | 96,759 | |
Provision for credit losses | | | 4,326 | | | 10,413 | | | 1,600 | |
Noninterest income | | | 39,230 | | | 37,487 | | | 35,800 | |
Noninterest expense | | | 103,801 | | | 81,417 | | | 79,102 | |
Income before taxes | | | 27,867 | | | 37,408 | | | 51,857 | |
Provision for income taxes | | | 7,823 | | | 9,583 | | | 12,402 | |
Net income available to common stockholders | | $ | 20,044 | | $ | 27,825 | | $ | 39,455 | |
| | | | | | | | | | |
Performance ratio | | | | | | | | | | |
Return on average total assets | | | 0.58 | % | | 0.97 | % | | 1.50 | % |
Return on average equity | | | 6.04 | | | 9.67 | | | 15.37 | |
Average equity to average assets | | | 9.53 | | | 10.06 | | | 9.78 | |
Dividend payout ratio | | | 23.01 | | | 4.26 | | | 3.03 | |
| | | | | | | | | | |
Per share data | | | | | | | | | | |
Basic earnings | | $ | 0.66 | | $ | 0.94 | | $ | 1.32 | |
Diluted earnings | | | 0.65 | | | 0.92 | | | 1.30 | |
Common book value per share | | | 11.29 | | | 10.47 | | | 9.28 | |
Weighted average diluted shares outstanding | | | 30,737,862 | | | 30,174,072 | | | 30,416,348 | |
Weighted average basic shares outstanding | | | 30,208,663 | | | 29,623,333 | | | 29,891,046 | |
Shares outstanding at year-end | | | 44,461,045 | | | 29,328,723 | | | 29,931,809 | |
| | | | | | | | | | |
Loan quality ratios | | | | | | | | | | |
Allowance for credit losses on loans to total loans at end of the year | | | 1.29 | % | | 1.66 | % | | 1.02 | % |
Provision for credit losses on loans to total loans | | | 0.13 | % | | 0.45 | % | | 0.08 | % |
Net loans charged-off to average total loans | | | 0.22 | % | | 0.05 | % | | 0.04 | % |
Nonaccrual loans to total loans at end of the year | | | 1.21 | % | | 1.09 | % | | 0.64 | % |
Nonperforming assets to total assets at end of the year | | | 0.76 | % | | 0.84 | % | | 0.79 | % |
Allowance for credit losses on loans to nonaccrual loans | | | 106.62 | % | | 151.95 | % | | 159.18 | % |
| | | | | | | | | | |
Old Second Bancorp, Inc. and Subsidiaries
Quarterly Financial Information
(Dollars in thousands, except per share data)
| | | | | | | | | | | | | | | | | | | | | | | | | |
| | 2021 | | 2020 | |
| | 4th | | 3rd | | 2nd | | 1st | | 4th | | 3rd | | 2nd | | 1st | |
Interest income | | $ | 30,839 | | $ | 24,791 | | $ | 24,194 | | $ | 25,391 | | $ | 26,006 | | $ | 25,046 | | $ | 25,712 | | $ | 27,451 | |
Interest expense | | | 2,190 | | | 2,173 | | | 2,240 | | | 1,848 | | | 2,129 | | | 2,537 | | | 3,005 | | | 4,793 | |
Net interest income | | | 28,649 | | | 22,618 | | | 21,954 | | | 23,543 | | | 23,877 | | | 22,509 | | | 22,707 | | | 22,658 | |
Provision for credit losses | | | 12,326 | | | (1,500) | | | (3,500) | | | (3,000) | | | - | | | 300 | | | 2,129 | | | 7,984 | |
Securities gains, net | | | (14) | | | 244 | | | 2 | | | - | | | - | | | (1) | | | - | | | (24) | |
Income (loss) before taxes | | | (11,539) | | | 11,329 | | | 11,972 | | | 16,105 | | | 11,409 | | | 13,628 | | | 12,377 | | | (6) | |
Net income | | | (9,067) | | | 8,412 | | | 8,820 | | | 11,879 | | | 8,047 | | | 10,265 | | | 9,238 | | | 275 | |
Basic earnings per share | | | (0.27) | | | 0.30 | | | 0.30 | | | 0.41 | | | 0.27 | | | 0.35 | | | 0.31 | | | 0.01 | |
Diluted earnings per share | | | (0.26) | | | 0.29 | | | 0.30 | | | 0.40 | | | 0.27 | | | 0.34 | | | 0.31 | | | 0.01 | |
Dividends paid per share | | | 0.05 | | | 0.05 | | | 0.05 | | | 0.01 | | | 0.01 | | | 0.01 | | | 0.01 | | | 0.01 | |
2021 Financial Overview
In 2017, the Company2021, we recorded net income of $15.1$20.0 million, or $0.50$0.65 per fully diluted share, which compares with a net income of $15.7compared to $27.8 million, or $0.53$0.92 per fully diluted share, in 2016,2020, and $15.4$39.5 million, or $0.46$1.30 per fully diluted share, in 2015. The2019. Our basic earnings per share for the periods presented was $0.51were $0.66 in 2017, $0.532021, $0.94 in 20162020 and $0.46$1.32 in 2015. The Company’s 20172019.
Our 2021 net income decreased primarily as a result of the accounting impact of, and the expenses related to, our acquisition of West Suburban Bancorp, Inc. (“West Suburban”), which resulted in our recording of $14.6 million of Day Two provision for credit losses expense (consisting of $12.2 million related to estimated future credit losses on loans, that as of the acquisition date, had not experienced a more-than-insignificant deterioration in credit quality since origination (“non-PCD loans”) and $2.4 million for unfunded commitments) and $13.2 million in acquisition-related costs. Adjusted net income, a non-GAAP financial measure that excludes both the Day Two provision expense and acquisition-related costs, was negatively$41.9 million in 2021. See the discussion entitled “Non-GAAP Presentations” on page 42 and the table below, which provides a reconciliation of this non-GAAP measure and related items, to the most comparable GAAP equivalents.
| | | | | | | | | |
| | Year Ended |
| | December 31, |
| | 2021 | | 2020 | | 2019 |
Net Income | | | | | | | | | |
(Loss) income before income taxes (GAAP) | | $ | 27,867 | | $ | 37,408 | | $ | 51,857 |
Pre-tax income adjustments: | | | | | | | | | |
Provision for credit losses - Day Two | | | 14,625 | | | - | | | - |
Merger-related costs | | | 13,190 | | | - | | | - |
Adjusted net income before taxes | | | 55,682 | | | 37,408 | | | 51,857 |
Taxes on adjusted net income | | | 13,800 | | | 9,583 | | | 12,402 |
Adjusted net income (non-GAAP) | | $ | 41,882 | | $ | 27,825 | | $ | 39,455 |
| | | | | | | | | |
Basic earnings per share (GAAP) | | $ | 0.66 | | $ | 0.94 | | $ | 1.32 |
Diluted earnings per share (GAAP) | | | 0.65 | | | 0.92 | | | 1.30 |
Basic earnings per share including adjusting items (non-GAAP) | | | 1.39 | | | 0.94 | | | 1.32 |
Diluted earnings per share including adjusting items (non-GAAP) | | | 1.36 | | | 0.92 | | | 1.30 |
The West Suburban acquisition required us to value all assets and liabilities acquired at fair value. Based on the Day One valuation, the loan portfolio was marked to fair value, segregating the non-PCD loans from the loans that, as of the acquisition date, had experienced a more-than-insignificant deterioration in credit quality since origination (“PCD loans”). Non-PCD loans received an adjustment to the loans’ carrying value for the interest and credit marks, while the carrying value of PCD loans was adjusted only for the interest mark. The Day One credit mark on PCD loans, of $12.1 million as of December 1, 2021, was recorded as additional ACL for those individually evaluated loans. In addition, under CECL guidance, a Day Two credit mark of $12.2 was recorded on non-PCD loans for estimated lifetime credit losses. Finally, the ACL on unfunded commitments also received Day One and Day Two credit adjustments, with the Day One adjustment of $1.8 million recorded directly as an additional liability, and the Day Two credit mark recorded as provision for credit losses expense. All recorded Day One fair value marks were offset to goodwill, and the marks that were not directly credited to the ACL are accretable over the life of the loan or the unfunded commitments, as applicable, and will be fully earned when the loan pays off, or the commitment matures or has a material advance. Finally, the ACL was also impacted by net loan charge-off activity in all years presented. Net loan charge-offs were $4.4 million in 2021 and $979,000 in 2020, compared to net loan recoveries of $817,000 in 2019.
Net interest and dividend income increased $5.0 million, or 5.5% for 2021 compared to 2020, due primarily to the West Suburban acquisition and the reduction of interest rates by the Federal Reserve in 2020, which resulted in a nonrecurring income tax expensedecrease in our cost of $9.5 millionfunds. Excluding the acquisition-related adjustments recorded in the fourth quarter of 2017 due to the “Tax Cuts and Jobs Act,” which was signed into law in late 2017. The federal income tax rate reduction approved under this law decreased the Company’s deferred tax asset. The Company’s2021, net income was favorably impacted by a nonrecurring income tax creditour acquisition of $1.6West Suburban on December 1, 2021, which added $5.8 million, recorded in July 2017 due to a State of Illinois tax rate increase, which increased the deferred tax asset by a like amount. In addition, the Company recorded an additional provision for loan and lease losses in 2017 of $1.8 million compared to a $750,000 provision for loan and lease losses in 2016, and a $4.4 million release of reserves for loan and lease losses in 2015. Net charge-offs were $497,000 in 2017, $815,000 in 2016, and $1.0included $4.6 million in 2015.
Netnet interest and dividend income increased $11.4 million, or 18.0%, for the year ended December 31, 2017 compared to the year ended December 31, 2016. and $876,000 of noninterest income.
Average loans, including loans held-for-sale, increased $318.8$37.8 million, or 26.2%1.9%, in 20172021 compared to 2016. The Talmer branch2020. Contributing to this growth was our acquisition inof West Suburban and the fourth quarter of 2016 contributedresultant loan portfolio acquired. Other factors contributing to the full year 2017 averagegrowth included organic loan growth with additional growth realized primarily in theour commercial, leases, construction, and commercial real estate-owner occupiedestate-investor loan portfolios. Offsetting our loan growth in 2021, compared to 2020, was a 69 basis point decrease in average rates earned on interest earning assets. Average interest bearing deposits increased $32.4$320.9 million, or 2.5%20.8%, for 2021 compared to 2020, while average deposit rates increased fivedecreased 30 basis points. This increasepoints over the same period. The decrease in rates was primarily due to risingthe falling interest rate environment in 2021, due to the Federal Reserve rate reductions, and deposit accounts repricing to the lower rates offered on time or certificates of deposit.as the year progressed, which impacted all interest-bearing deposit categories. Average noninterest bearing deposits increased by $71.3$211.6 million, or 15.0%25.4%, from 20162020 to 2017,2021, as a result of our acquisition of West Suburban, as well as growth in commercial demand deposit growthdeposits which correlated with the increase in commercial loan growth.
Net interest and dividend income increased $4.4 million, or 7.4%, for the year ended December 31, 2016 compared to the year ended December 31, 2015. Average loans, including loans held-for-sale, increased $69.3 million, or 6.0%, in 2016 compared to 2015. The
Talmer branch acquisition contributed approximately $38.6 million of the average loan growth, with additional growth realized primarily in the commercial loan portfolio. Average interest bearing deposits increased $25.1 million, or 1.9%, while average rates increased three basis points. This increase was primarilyfederal stimulus funds received due to rising rates offered on time or certificates of deposit. Average noninterest bearing deposits increased by $47.0 million, primarily due to the Talmer branch acquisitionCOVID-19, as well as growth in late 2016 of $48.9 million of deposits, of which $28.9 million were noninterest bearing.our commercial, leases, construction, and commercial real estate loans.
In 2016 and 2017, the CompanyWe continued to reposition itsour balance sheet in 2021 to ensureprovide appropriate funding was available for loan growth, and branch acquisition needs, to furtherensure adequate liquidity during the COVID-19 pandemic, reduce asset quality risk, and grow deposits organicallydecrease our cost of funds through organic deposit growth. In 2021, our available-for-sale securities portfolio increased $1.20 billion, compared to 2020, due primarily to the $1.07 billion of securities acquired in our acquisition of West Suburban, and additional purchases of $886.1 million during 2021, less sales, maturities, and calls of $744.8 million, the majority of which occurred immediately after our acquisition of West Suburban to reposition the portfolio based on our investment strategy. The unrealized mark to market adjustment on securities totaled $15.5 million as a less expensive funding source. Inof December 31, 2021, compared to $24.2 million at December 31, 2020, due to market interest rate fluctuations as well as changes year over year in the second quartercomposition of 2016, the securities held-to-maturity portfolio was reclassified to available-for sale to allow portfolio restructuring and to fund loan growth. This transfer of $244.8 million was approved by the Board of Directors, and will preclude any holdings of securities held-to-maturity for a two-year period from that date.portfolio. Average interest bearing liabilities increased $354.2 million, to $1.56$2.1 billion in 20172021 from $1.49$1.7 billion in 2016,2020, as the need for funding began to rise with the balance sheet growth experienced.needs in 2021 were also met by an increase in average noninterest bearing deposits year over year.
Management also continued to emphasize credit quality and maintain itsmaintained our capital ratios with continued strong liquidity. In 2017, the Company2021, we experienced loan growth of $138.8 million,$1.39 billion, or 9.4%68.2%, over 2016 year end loans.2020. The growth was driven primarily by our acquisition of West Suburban, and the resultant $1.50 billion of loans acquired, as well as an active commercial lending team in new and existing markets, as well asand the continued development of a select portfolio purchase of home equity lines of credit of $16.7 million from a third party and $17.1 million of lease purchases.lending team. Asset quality levels have improved steadilyremained relatively stable over the last few years relative to total assets, with nonperforming assets decreasing to $24.0of $47.0 million asor 0.76% of year end 2017, astotal assets for 2021, compared to $27.9$25.5 million, or 0.84% of total assets for year end 20162020, and $33.8$20.9 million, or 0.79% of total assets, for December 31, 2015. Corresponding2019, with the total dollar increase in 2021 primarily due to the reduction in problem loans and nonperforming assets, the CompanyWest Suburban acquisition. We also continued to take steps to reducecontrol operating expenses and increase net income. ReducedA decline in other real estate owned holdings of $118,000 in 2021 resulted in lowera decrease of $484,000 in net other real estate owned expenses each year for 2017, 20162021 compared to 2020, and 2015.a decline in other real estate owned holdings of $2.5 million in 2020 compared to 2019 resulted in a minimal increase in expenses of $228,000 in the like period. As the Companywe focused on reducing all noninterest expenses, it wasexclusive of acquisition-related activity, we were also able to maintain itsour profitable wealth management business and secondary residential real estate originations and sales as important sources of noninterest income.
Recent developments
On December 26, 2017, the Company announced the signing of a definitive agreement and plan of merger (the “Merger Agreement”) to acquire Greater Chicago Financial Corp. and its wholly-owned bank subsidiary, ABC Bank, in an all-cash transaction. Under the terms of the Merger Agreement, the Company will acquire all of the outstanding common stock of Greater Chicago Financial Corp. in a transaction valued at approximately $41.1 million. The Company will acquire and simultaneously retire $6.3 million of outstanding subordinated debentures of Greater Chicago Financial Corp. ABC Bank had total assets of $342.6 million as of December 31, 2017, including $234.4 million of net loans. The merger is expected to close in the second quarter of 2018.
Critical accounting policiesestimates
The Company’sOur consolidated financial statements are prepared based on the application of accounting policies in accordance with generally accepted accounting principles (“GAAP”) and follow general practices within the banking industry. These policies require the reliance on estimates, assumptions and assumptions,judgements, which may prove inaccurate or are subject to variations. Changes in underlying factors, estimates, assumptions or estimatesjudgements could have a material impact on the Company’sour future financial condition and results of operations. The most critical
Certain policies inherently have a greater reliance on the use of these significant accounting policies are the policies related to the allowance for loan and lease losses, fair valuation methodologies and income taxes. These estimates, assumptions and judgments are based on information availableand, as such, have a greater possibility of producing results that could be materially different than originally reported. We have identified the determination of the date ofallowance for credit losses and fair value measurements to be the consolidated financial statements. Futureaccounting areas that require the most subjective or complex judgments and, as such, could be most subject to revision as new or additional information becomes available or circumstances change, including overall changes in information may affectthe economic climate and/or market interest rates. Therefore, we consider these policies, discussed below, to be critical accounting estimates assumptions, and judgments, which, in turn, may affect amounts reported indiscuss them directly with the consolidated financial statements. Audit Committee of our board of directors.
Significant accounting policies are presented in Note 1 of the financial statements included in this annual report. These policies, along with the disclosures presented in the other financial statement notes and in this discussion, provide information on how significant assets and liabilities are valued in the financial statements and how those values are determined. Recent accounting pronouncements and standards that have impacted or could potentially affect the Companyus are also discussed in Note 1 of the consolidated financial statements.
Allowance for loan and leasecredit losses for loans
The allowance for loan and leasecredit losses (“ALLL”ACL”) for loans represents management’s estimate of probableall expected credit losses inherent inover the expected contractual life of our loan and lease portfolio. Determination ofDetermining the ALLL is inherently subjective since it requires significant estimates and management judgment, including the amounts and timing of expected future cash flows on impaired loans, estimated losses on pools of homogeneous loans based on a migration analysis that uses historical loss experience, consideration of current economic trends, portfolio growth and concentration risk, management and staffing changes, and other credit market factors.
The ALLL methodology consists of (i) specific reserves established for probable losses on individual loans or leases for which the recorded investment in the loan or lease exceeds the present value of expected future cash flows or the net realizable value of the underlying collateral, if collateral dependent, (ii) an allowance based on an analysis that uses historical credit loss experience for each loan or lease category, and (iii) the impact of other internal and external qualitative and credit market factors as assessed by management through detailed loan review, allowance analysis and credit discussions.
The ALLL is a valuation allowance for losses, increased by the provision for loan and lease losses and decreased by both loan loss reserve releases and charge-offs less recoveries. Management estimates the allowance balance required using an assessment of various risk factors including, but not limited to, past loan loss experience, known and inherent risks in the portfolio, information about specific borrower situations, estimated collateral values, volume trends in delinquencies, nonaccruals, economic conditions, and other credit market considerations. Allocationsappropriateness of the allowance is complex and requires judgment by management about the effect of matters that are inherently uncertain. Subsequent evaluations of the then-existing loan portfolio, in light of the factors then prevailing, may be made for specific loans or leases, but the entire allowance is available for losses inherentresult in the loan and lease portfolio.
Management incorporated methodologysignificant changes in the ALLL calculationallowance for credit losses in both 2016those future periods.
The ACL involves critical accounting estimates because:
| ● | changes in the provision for credit losses can materially affect our financial results; |
| ● | estimates relating to the ACL require us to project future borrower performance, including cash flows, delinquencies and charge-offs, along with, when applicable, collateral values, based on a reasonable and supportable forecast period utilizing forward-looking economic scenarios in order to estimate probability of default and loss given default; and |
| ● | the ACL is influenced by factors outside of our control such as industry and business trends, geopolitical events and the effects of laws and regulations as well as economic conditions such as trends in housing prices, interest rates, GDP, inflation, energy prices and unemployment; and |
| ● | considerable judgment is required to determine whether the models used to generate the ACL produce an estimate that is sufficient to encompass the current view of lifetime expected credit losses. |
Because our estimates of the ACL involve judgments and 2017 to further refine the process. These methodology changes are describedinfluenced by factors outside of our control, there is uncertainty inherent in these estimates. Changes in such estimates could significantly impact our ACL and provision for credit losses. See Note 1 – Basis of Presentation and Changes in Significant Accounting Policies in the “Allowanceaccompanying notes to the consolidated financial statements included elsewhere in this annual report for Loan and Lease Losses” sectiona discussion of this “Management Discussion and Analysis of Financial Condition and Results of Operations.” our ACL.
As a result of management’s analysismodeling, we recorded an ACL on loans of the adequacy$44.3 million as of the ALLL,December 31, 2021; in addition, we recorded an ACL on unfunded commitments of $6.2 million as of December 31, 2021, included within other liabilities. We recorded provision for credit losses of $4.3 million in 2021, comprised of a loan$9.4 million release of provision for credit losses expense on loans, a $12.2 million Day Two non-PCD credit mark on West Suburban acquired loans, and lease lossa $1.5 million provision wasfor credit losses on unfunded commitments, compared to $10.4 million and $1.6 million of provision expense on loans recorded in 20172020 and 2016, and loan loss reserve releases were recorded for the year ended December 31, 2015.
A loan is considered impaired when it is probable that not all contractual principal or interest due will be received according to the original terms of the loan agreement. Management defines the measured value of an impaired loan based upon the present value of the future cash flows, discounted at the loan’s original effective interest rate, or the fair value reflecting costs to sell the underlying collateral, if the loan is collateral dependent. Impaired loans were $20.1 million at December 31, 2017. This total compares to $22.3 million and $20.9 million December 31, 2016 and 2015,2019, respectively. In addition, a discussion of the factors driving changes in the amount of the ALLLACL is included in the “Allowances for Loan and LeaseCredit Losses” section that follows.below.
Income Taxes
The Company recognizes expense for federal and state income taxes currently payable as well as deferred federal and state taxes, estimated future tax effects of temporary differences between the tax basis of assets and liabilities and amounts reported in the consolidated balance sheets, as well as loss carryforwards and tax credit carryforwards. Federal deferred tax assets related to net operating losses totaled $34.5 million as of December 31, 2017. The Company maintains deferred tax assets for deductible temporary differences, the largest of which related to the goodwill amortization/impairment. For income tax return purposes this relates to Section 197 goodwill amortization and goodwill impairment charges. Realization of deferred tax assets is dependent upon generating sufficient taxable income in either the carryforward or carryback periods to cover net operating losses generated by the reversal of temporary differences. Any change in tax rate will be recorded in the period enacted, which was evidenced by the $1.6 million income tax credit recorded in the third quarter of 2017 due to the State of Illinois tax rate change in July 2017, as well as the $9.5 million income tax expense recorded in the fourth quarter of 2017 for the enactment of the “Tax Cuts and Jobs Act.”
Future issuances or sales of common stock or other equity securities could also result in an “ownership change” as defined for U.S. federal income tax purposes. If an ownership change were to occur, the Company could realize a loss of a portion of its U.S. federal and state deferred tax assets, including certain built-in losses that have not been recognized for tax purposes, as a result of the operation of Section 382 of the Internal Revenue Code of 1986, as amended. The amount of the permanent loss would be determined by the annual limitation period and the carryforward period (generally up to 20 years for federal net operating losses) and any resulting loss could have a material adverse effect on the results of operations and financial condition. On September 12, 2012, the Company and the Bank, as rights agent, entered into a Rights Plan which was designed to protect the Company’s deferred tax assets against an unsolicited ownership change.
On September 2, 2015, the Company and the Bank, as Rights Agent, entered into a Second Amendment to the Amended and Restated Rights Agreement and Tax Benefits Preservation Plan (the “Amendment”). The Amendment, which was approved by the Company’s shareholders at the Company’s 2016 annual meeting, extended the final expiration date of the Company’s Amended and Restated Rights Agreement and Tax Benefits Preservation Plan from September 12, 2015 to September 12, 2018. The purpose of the Rights Plan is to protect the Company’s deferred tax asset against an unsolicited ownership change, which could significantly limit the Company’s ability to utilize its deferred tax assets. For a description of the Rights Plan, please refer to the Company’s Form 8-A, filed September 2, 2015.
Income tax returns are also subject to audit by the Internal Revenue Service (the “IRS”) and state taxing authorities. Income tax expense for current and prior periods is subject to adjustment based upon the outcome of such audits. The Company is currently open to audit under the statute of limitations by the Internal Revenue Service from 2014 to 2016, the state of Illinois from 2014 to 2016, and the states of Wisconsin and Indiana from 2009 to 2016. The Company believes it has adequately accrued for all probable income taxes payable.
Fair Value Measurements
The use of fair values is required in determining the carrying values of certain assets and liabilities, as well as for specific disclosures. Fair value is an estimate of the exchange price that would be received to sell an asset or paid to transfer a liability in the principal or most advantageous market for the asset or liability in an orderly transaction (i.e., not a forced transaction, such as a liquidation or distressed sale) between market participants at the measurement date and is based on the assumptions market participants would use when pricing an asset or liability.
In determining the fair value of financial instruments, market prices of the same or similar instruments are used whenever such prices are available. If observable market prices are unavailable or impracticable to obtain, we are required to make judgments about assumptions market participants would use in estimating the fair value of the financial instrument. Fair value is estimated using modeling techniques and incorporates assumptions about interest rates, duration, prepayment speeds, risks inherent in a particular valuation technique and the risk of nonperformance. These assumptions are inherently subjective as they require material estimates, all of which may be susceptible to significant change.
In 2018, we adopted ASU 2016-01, which, among other topics addressed, required business entities to use the exit price notion, as defined in ASC 820, for the measurement of the fair value of financial instruments. Adoption of this standard resulted in our use of an exit price rather than an entrance price to determine the fair value of loans and deposits not already measured at fair value on a non-recurring basis in the consolidated balance sheet disclosures. See Note 17 “Fair Value Measurements” and Note 18 “Fair Value Measurements,Values of Financial Instruments,” to the consolidated financial statements includeswhich include information about the extent to which fair value is used to measure assets and liabilities, and the valuation methodologies and key inputs used.used for further information regarding the valuation processes.
Non-GAAP Financial Measures
This annual report contains references to financial measures that are not defined in GAAP. Such non-GAAP financial measures include the presentation of adjusted net income, net interest income and net interest income to interest earning assets on a tax equivalent (“TE”) basis and our tangible common equity to tangible assets ratio. Management believes that the presentation of these non-GAAP financial measures (a) provides important supplemental information that contributes to a proper understanding of our operating performance, (b) enables a more complete understanding of factor and trends affecting our business, and (c) allows investors to evaluate our performance in a manner similar to management, the financial services industry, bank stock analysts, and bank regulators. Management uses non-GAAP measures as follows: in the preparation of our operating budgets, monthly financial performance reporting, and in our presentation
to investors of our performance. However, we acknowledge that these non-GAAP financial measures have a number of limitations. Limitations associated with non-GAAP financial measures include the risk that persons might disagree as to the appropriateness of items comprising these measures and that different companies might calculate these measures differently. These disclosures should not be considered an alternative to our GAAP results. A reconciliation of non-GAAP financial measures to the most directly comparable GAAP financial measures is presented below or alongside the first instance where each non-GAAP financial measure is used.
Results of operations
Net interest income
Net interest income, which is our primary source of earnings, is the difference between interest income earned on interest-earning assets, such as loans and investment securities, as well as accretion income on purchased loans, and interest incurred on interest-bearing liabilities, such as deposits and borrowings. Net interest income depends upon the relative mix of interest-earning assets and interest-bearing liabilities, the ratio of interest-earning assets to total assets and of interest-bearing liabilities to total funding sources, and movements in market interest rates. The Company’sOur net interest income can be significantly influenced by a variety of factors, including overall loan demand, economic conditions, credit risk, the amount of nonearning assets including nonperforming loans, and OREO, the amounts of and rates at which assets and liabilities reprice, variances in prepayment of loans and securities, early withdrawal of deposits, exercise of call options on borrowings or securities, a general rise or decline in interest rates, changes in the slope of the yield-curve, and balance sheet growth or contraction. The Company’sOur asset and liability committee (“ALCO”) seeks to manage interest rate risk under a variety of rate environments by structuring the Company’sour balance sheet and off-balance sheet positions. This process is discussed in more detail in the section entitled “Interest rate risk” in “Quantitative and Qualitative Disclosures about Market Rate Risk.”
NetOur net interest income increased $11.4$5.0 million, or 18.0%5.5%, from the year ended December 31, 2016, to $74.9$96.8 million for the year ended December 31, 2017.2021, from $91.8 million for 2020. The increase in interest2021 was primarily driven by our December 1, 2021 acquisition of West Suburban, and dividend incomethe resultant $4.6 million in 2017 was partially offset by increases in interest expense. The Company’s net interest income. Our net interest margin, on a taxable equivalent basis, which is net interest income divided by total interest-earning assets, was 3.70%2.96% for the year ended 2017,2021, compared to 3.31%3.43% for the year ended 2016, an increase2020, a decrease of 3947 basis points. The growth in the Company’s net interest margin was due primarily to higher loan volumes in 2017, coupled with $1.3 million of discount accretion on purchase loans as a result of our Talmer branch acquisition in late 2016. The increase in interest expense in 2017 compared to 2016 was due primarily to higher rates paid on time deposits, as well as a full year of interest expense on senior notes issued in December 2016, which were issued at a higher rate than the subordinated notes simultaneously retired in December 2016.
Net interest income increased $4.4 million, or 7.4%, from the year ended December 31, 2015, to $63.4 million for the year ended December 31, 2016. The increase in net interest income in 2016 was partially offset by increases in interest expense. The Company’sOur net interest margin on a taxable equivalent (TE) basis, was 3.31%3.00% for the year ended 2016,2021, compared to 3.23%3.48% for the year ended 2015, an increase2020, a decrease of eight48 basis points. Although average interest earning assets increased $598.0 million during 2021, the market rate reductions were more impactful than the volume growth of lower yielding assets. The growthdecrease in the Company’s net interest marginexpense in 2021 compared to 2020 was due primarily to higher loan volumes in 2016, coupled with $604,000 of discount accretionlower rates paid on purchased loansall interest bearing deposits, as well as a resultreduction of our Talmer branch acquisitionshort-term funding needs, as our excess liquidity on hand allowed us to utilize minimal short-term borrowings for the majority of 2021.
Our net interest income decreased $5.0 million, or 5.2%, to $91.8 million for 2020, from $96.8 million for 2019. The decrease in late 2016.
Average2020 was primarily driven by the reduction in market interest rates on loans and securities, and was partially offset by decreases in interest rates on deposits and reductions in short and long-term borrowings. Our net interest margin, which is net interest income divided by total interest-earning assets, was 3.43% for the year ended 2020, compared to 3.98% for the year ended 2019, a decrease of 55 basis points. Our net interest margin on a taxable equivalent (TE) basis, was 3.48% for the year ended 2020, compared to 4.06% for the year ended 2019, a decrease of 58 basis points. Although average interest earning assets increased $181.3$241.3 million during 2020, the market rate reductions were more impactful than the volume growth of lower yielding assets. The decrease in interest expense in 2020 compared to 2019 was due primarily to lower rates paid on all interest bearing deposits, as well as a reduction of our short-term funding needs, as our excess liquidity on hand allowed us to utilize minimal short-term borrowings for the majority of 2020.
Our average earning assets increased $598.0 million, or 9.4%22.4%, to $2.11$3.27 billion in 2017,2021, from $1.93$2.67 billion in 2016.2020. The increase was primarily attributable to growth in our interest earning assets with financial institutions of $312.9 million stemming from the result of a $318.8 million increase in average loans and loans held-for-sale, partially offset by a $116.7 million decrease in average total securities. The increase in average loans in 2017 reflects growth due to our Talmer branchWest Suburban acquisition, as well as an increase in our loan portfolio, also primarily due to the West Suburban acquisition, in addition to organic commercial, lease financing, construction, and commercial real estate and lease financingloan growth. AverageOur average earning assets increased $90.0$241.3 million, or 4.9%9.9%, to $1.93$2.67 billion in 2016,2020, from $1.84$2.43 billion in 2015.2019. The increase was primarily the result ofattributable to growth in average loans and loans held-for-sale and average total
securities. The increase in average loans in 2016 reflect growths due to our Talmer branch acquisition,$158.7 million stemming from federal stimulus funds received, as well as an increase in our loan portfolio, primarily due to PPP loans originated, in addition to organic commercial, lease financing, construction, and commercial real estate and lease financingloan growth.
AverageOur average interest bearing liabilities increased $70.0$354.2 million, or 20.8%, to $1.56$2.1 billion for 2021, from $1.7 billion in 2017, from $1.49 billion in 2016,2020, due primarily to growth in NOW accounts, an increase in all deposit categories, other short-termthan time deposits. Interest bearing deposits increased by $320.9 million to $1.86 billion in 2021, compared to $1.54 billion in 2020, due primarily to the West Suburban acquisition. Deposit growth was also driven by federal stimulus funds received by depositors, as well as growth in commercial deposit accounts stemming from new commercial loans. Our average other borrowings and the restructuring of the Company’s debt. The debt structure of the Company was revised in late 2016, with the retirement of $45.5increased $33.3 million of subordinated and senior debt due in 2018, and simultaneous public offering of $45.0 million of senior notes, which pay at a higher rate. The impact of this debt offering will be seen in future years as interest expense is projected to increase going forward. The interest rate on the retired subordinated debt reset quarterly at three-month LIBOR plus 150 basis points. The $45.0$196.6 million in new senior2021 from $163.3 million in 2020. This was mainly due to an increase of $7.1 million in average securities sold under repurchase agreements and an increase of $43.8 million in average subordinated debentures due to the issuance of $60 million in privately placed subordinated notes have a fixed rate at 5.75% for five years, which converts to a floating rate tied to three month LIBOR plus 385 basis points in April 2021. AverageOur average interest bearing liabilities increased $35.5$10.8 million, to $1.49or 0.6%, from $1.69 billion in 2016, from $1.452019 to $1.70 billion in 2015,2020, due primarily to an increase in all deposit categories, other than time deposits. Deposit growth was driven by federal stimulus funds received by depositors, as well as growth in NOW accounts.commercial deposit accounts stemming from new commercial loans. Our other short-term borrowings declined due to our excess liquidity on hand, while our average junior subordinated debentures decreased due to our March 2020 redemption of the Old Second Capital Trust I trust preferred securities and related junior subordinated debentures totaling $32.6 million.
AnalysisThe following table sets forth certain information relating to our average consolidated balance sheets and reflects the yield on average interest earning assets and cost of average interest bearing liabilities for the years indicated obtained by dividing the related interest by the average balance of assets or liabilities. Average Balancesbalances are derived from daily balances.
| | | | | | | | | | | | | | | | | | | | | | | |
Analysis of Average Balances, |
Tax Equivalent Income / Expense and Rates |
(Dollars in thousands - unaudited) |
| | | | | | | | | | | | | | | | | | | | | | | |
| Year Ended December 31, |
| 2021 | | 2020 | | 2019 |
| Average | | Income / | | Rate | | Average | | Income / | | Rate | | Average | Income / | | Rate |
| Balance | | Expense | | % | | Balance | | Expense | | % | | Balance | Expense | | % |
Assets | | | | | | | | | | | | | | | | | | | | | | | |
Interest earning deposits with financial institutions | $ | 493,313 | | $ | 656 | | 0.13 | | $ | 180,439 | | $ | 258 | | 0.14 | | $ | 21,783 | | $ | 459 | | 2.11 |
Securities: | | | | | | | | | | | | | | | | | | | | | | | |
Taxable | | 522,794 | | | 8,099 | | 1.55 | | | 265,312 | | | 6,773 | | 2.55 | | | 253,260 | | | 9,256 | | 3.65 |
Non-taxable (TE)1 | | 188,952 | | | 6,549 | | 3.47 | | | 199,386 | | | 6,926 | | 3.47 | | | 249,976 | | | 9,399 | | 3.76 |
Total securities (TE)1 | | 711,746 | | | 14,648 | | 2.06 | | | 464,698 | | | 13,699 | | 2.95 | | | 503,236 | | | 18,655 | | 3.71 |
Dividends from FHLBC and FRBC | | 10,201 | | | 456 | | 4.47 | | | 9,917 | | | 484 | | 4.88 | | | 10,730 | | | 602 | | 5.61 |
Loans and loans held-for-sale 1 , 2 | | 2,057,691 | | | 90,848 | | 4.42 | | | 2,019,903 | | | 91,241 | | 4.52 | | | 1,897,909 | | | 97,866 | | 5.16 |
Total interest earning assets | | 3,272,951 | | | 106,608 | | 3.26 | | | 2,674,957 | | | 105,682 | | 3.95 | | | 2,433,658 | | | 117,582 | | 4.83 |
Cash and due from banks | | 30,621 | | | - | | - | | | 31,143 | | | - | | - | | | 34,027 | | | - | | - |
Allowance for credit losses on loans | | (32,183) | | | - | | - | | | (29,771) | | | - | | - | | | (19,548) | | | - | | - |
Other noninterest bearing assets | | 211,711 | | | - | | - | | | 184,441 | | | - | | - | | | 175,306 | | | - | | - |
Total assets | $ | 3,483,100 | | | | | | | $ | 2,860,770 | | | | | | | $ | 2,623,443 | | | | | |
| | | | | | | | | | | | | | | | | | | | | | | |
Liabilities and Stockholders' Equity | | | | | | | | | | | | | | | | | | | | | | | |
NOW accounts | $ | 532,507 | | $ | 380 | | 0.07 | | $ | 456,284 | | $ | 564 | | 0.12 | | $ | 432,028 | | $ | 1,386 | | 0.32 |
Money market accounts | | 407,352 | | | 344 | | 0.08 | | | 296,398 | | | 497 | | 0.17 | | | 289,745 | | | 1,086 | | 0.37 |
Savings accounts | | 556,730 | | | 237 | | 0.04 | | | 363,331 | | | 508 | | 0.14 | | | 308,847 | | | 488 | | 0.16 |
Time deposits | | 365,167 | | | 1,510 | | 0.41 | | | 424,831 | | | 5,033 | | 1.18 | | | 431,377 | | | 6,736 | | 1.56 |
Interest bearing deposits | | 1,861,756 | | | 2,471 | | 0.13 | | | 1,540,844 | | | 6,602 | | 0.43 | | | 1,461,997 | | | 9,696 | | 0.66 |
Securities sold under repurchase agreements | | 60,895 | | | 82 | | 0.13 | | | 53,808 | | | 202 | | 0.38 | | | 43,698 | | | 577 | | 1.32 |
Other short-term borrowings | | - | | | - | | - | | | 11,255 | | | 179 | | 1.59 | | | 73,757 | | | 1,755 | | 2.38 |
Junior subordinated debentures | | 25,773 | | | 1,133 | | 4.40 | | | 31,101 | | | 2,215 | | 7.12 | | | 57,710 | | | 3,724 | | 6.45 |
Subordinated debentures | | 43,820 | | | 1,610 | | 3.67 | | | - | | | - | | - | | | - | | | - | | - |
Senior note | | 44,429 | | | 2,692 | | 6.06 | | | 44,323 | | | 2,692 | | 6.07 | | | 44,212 | | | 2,699 | | 6.10 |
Notes payable and other borrowings | | 21,700 | | | 463 | | 2.13 | | | 22,812 | | | 574 | | 2.52 | | | 12,008 | | | 384 | | 3.20 |
Total interest bearing liabilities | | 2,058,373 | | | 8,451 | | 0.41 | | | 1,704,143 | | | 12,464 | | 0.73 | | | 1,693,382 | | | 18,835 | | 1.11 |
Noninterest bearing deposits | | 1,043,739 | | | - | | - | | | 832,180 | | | - | | - | | | 650,400 | | | - | | - |
Other liabilities | | 49,105 | | | - | | - | | | 36,758 | | | - | | - | | | 22,984 | | | - | | - |
Stockholders' equity | | 331,883 | | | - | | - | | | 287,689 | | | - | | - | | | 256,677 | | | - | | - |
Total liabilities and stockholders' equity | $ | 3,483,100 | | | | | | | $ | 2,860,770 | | | | | | | $ | 2,623,443 | | | | | |
Net interest income (GAAP) | | | | $ | 96,764 | | | | | | | $ | 91,751 | | | | | | | $ | 96,759 | | |
Net interest margin (GAAP) | | | | | | | 2.96 | | | | | | | | 3.43 | | | | | | | | 3.98 |
| | | | | | | | | | | | | | | | | | | | | | | |
Net interest income (TE)1 | | | | $ | 98,157 | | | | | | | $ | 93,218 | | | | | | | $ | 98,747 | | |
Net interest margin (TE)1 | | | | | | | 3.00 | | | | | | | | 3.48 | | | | | | | | 4.06 |
Core net interest margin (TE - excluding PPP loans)1 | | | | | | | 2.96 | | | | | | | | 3.48 | | | | | | | | 4.06 |
Interest bearing liabilities to earning assets | | 62.89 | % | | | | | | | 63.71 | % | | | | | | | 69.58 | % | | | | |
1 Tax Equivalent Interestequivalent basis is calculated using a marginal tax rate of 21% in 2021, 2020 and Rates2019. See the discussion entitled “Non-GAAP Presentations” below and the table on page 43 that provides a reconciliation of each non-GAAP measure to the most comparable GAAP equivalent.
Years ended December 31, 2017, 2016 and 2015
(In thousands – unaudited)
| | | | | | | | | | | | | | | | | | | | | | | | |
| 2017 | | 2016 | | 2015 |
| Average | | | | | Rate | | Average | | | | | Rate | | Average | | | | | Rate |
| Balance | | Interest | | % | | Balance | | Interest | | % | | Balance | | Interest | | % |
Assets | | | | | | | | | | | | | | | | | | | | | | | | |
Interest bearing deposits with financial institutions | $ | 12,224 | | $ | 134 | | 1.08 | | $ | 33,226 | | $ | 169 | | 0.50 | | $ | 20,066 | | | $ | 55 | | 0.27 |
Securities: | | | | | | | | | | | | | | | | | | | | | | | | |
Taxable | | 347,712 | | | 10,202 | | 2.93 | | | 635,914 | | | 15,865 | | 2.49 | | | 642,132 | | | | 14,037 | | 2.19 |
Non-taxable (TE) | | 208,142 | | | 9,137 | | 4.39 | | | 36,643 | | | 1,295 | | 3.53 | | | 22,311 | | | | 834 | | 3.74 |
Total securities | | 555,854 | | | 19,339 | | 3.48 | | | 672,557 | | | 17,160 | | 2.55 | | | 664,443 | | | | 14,871 | | 2.24 |
Dividends from FHLBC and FRBC | | 8,127 | | | 370 | | 4.55 | | | 7,944 | | | 333 | | 4.19 | | | 8,545 | | | | 306 | | 3.58 |
Loans and loans held-for-sale1 | | 1,537,742 | | | 70,950 | | 4.55 | | | 1,218,931 | | | 56,263 | | 4.54 | | | 1,149,590 | | | | 53,327 | | 4.58 |
Total interest earning assets | | 2,113,947 | | | 90,793 | | 4.25 | | | 1,932,658 | | | 73,925 | | 3.78 | | | 1,842,644 | | | | 68,559 | | 3.68 |
Cash and due from banks | | 33,738 | | | - | | - | | | 31,689 | | | - | | - | | | 29,659 | | | | - | | - |
Allowance for loan and lease losses | | (16,390) | | | - | | - | | | (15,955) | | | - | | - | | | (19,323) | | | | - | | - |
Other noninterest bearing assets | | 187,503 | | | - | | - | | | 194,356 | | | - | | - | | | 212,142 | | | | - | | - |
Total assets | $ | 2,318,798 | | | | | | | $ | 2,142,748 | | | | | | | $ | 2,065,122 | | | | | | |
| | | | | | | | | | | | | | | | | | | | | | | | |
Liabilities and Stockholders' Equity | | | | | | | | | | | | | | | | | | | | | | | | |
NOW accounts | $ | 425,435 | | $ | 424 | | 0.10 | | $ | 389,266 | | $ | 358 | | 0.09 | | $ | 345,472 | | | $ | 300 | | 0.09 |
Money market accounts | | 278,826 | | | 349 | | 0.13 | | | 273,101 | | | 274 | | 0.10 | | | 292,725 | | | | 282 | | 0.10 |
Savings accounts | | 261,974 | | | 177 | | 0.07 | | | 256,905 | | | 157 | | 0.06 | | | 249,570 | | | | 152 | | 0.06 |
Time deposits | | 389,771 | | | 4,227 | | 1.08 | | | 404,285 | | | 3,640 | | 0.90 | | | 410,691 | | | | 3,201 | | 0.78 |
Interest bearing deposits | | 1,356,006 | | | 5,177 | | 0.38 | | | 1,323,557 | | | 4,429 | | 0.33 | | | 1,298,458 | | | | 3,935 | | 0.30 |
Securities sold under repurchase agreements | | 31,478 | | | 17 | | 0.05 | | | 34,016 | | | 4 | | 0.01 | | | 28,194 | | | | 3 | | 0.01 |
Other short-term borrowings | | 67,959 | | | 741 | | 1.08 | | | 26,518 | | | 102 | | 0.38 | | | 21,945 | | | | 30 | | 0.13 |
Junior subordinated debentures | | 57,615 | | | 4,002 | | 6.95 | | | 57,567 | | | 4,334 | | 7.53 | | | 57,520 | | | | 4,287 | | 7.45 |
Senior notes | | 44,010 | | | 2,689 | | 6.11 | | | 2,050 | | | 112 | | 5.46 | | | - | | | | - | | - |
Subordinated debt | | - | | | - | | - | | | 42,910 | | | 949 | | 2.18 | | | 45,000 | | | | 814 | | 1.78 |
Notes payable and other borrowings | | - | | | - | | - | | | 477 | | | 8 | | 1.65 | | | 500 | | | | 7 | | 1.38 |
Total interest bearing liabilities | | 1,557,068 | | | 12,626 | | 0.81 | | | 1,487,095 | | | 9,938 | | 0.67 | | | 1,451,617 | | | | 9,076 | | 0.62 |
Noninterest bearing deposits | | 547,719 | | | - | | - | | | 476,422 | | | - | | - | | | 429,403 | | | | - | | - |
Other liabilities | | 22,131 | | | - | | - | | | 12,929 | | | - | | - | | | 10,712 | | | | - | | - |
Stockholders' equity | | 191,880 | | | - | | - | | | 166,302 | | | - | | - | | | 173,390 | | | | - | | - |
Total liabilities and stockholders' equity | $ | 2,318,798 | | | | | | | $ | 2,142,748 | | | | | | | $ | 2,065,122 | | | | | | |
Net interest income (TE) | | | | $ | 78,167 | | | | | | | $ | 63,987 | | | | | | | | $ | 59,483 | | |
Net interest income (TE) to total earning assets | | | | | | | 3.70 | | | | | | | | 3.31 | | | | | | | | | 3.23 |
Interest bearing liabilities to earning assets | | 73.66 | % | | | | | | | 76.95 | % | | | | | | | 78.78 | % | | | | | |
12Interest income from loans is shown on a tax equivalent asbasis, which is a non-GAAP financial measure, discussed below, and includes fees of $2.4 million, $2.5 million and $1.8$5.8 million for 2017, 20162021, $4.3 million for 2020 and 2015, respectively.$1.1 million for 2019. Nonaccrual loans are included in the above stated average balances. See Guide 3”Statistical Data Requirements”, Item I for further details in
For purposes of discussion, net interest income and net interest income to interest earning assets have been adjusted to a non-GAAP tax equivalent adjustment.(“TE”) basis to more appropriately compare returns on tax-exempt loans and securities to other earning assets. The table below provides a reconciliation of each non-GAAP (TE) measure to the GAAP equivalent:
| | | | | | | | | | | | |
| | Effect of Tax Equivalent Adjustment | |
(In thousands) | | 2021 | | | 2020 | | | 2019 | |
Interest income (GAAP) | | $ | 105,215 | | | $ | 104,215 | | | $ | 115,594 | |
Taxable equivalent adjustment - loans | | | 18 | | | | 12 | | | | 14 | |
Taxable equivalent adjustment - securities | | | 1,375 | | | | 1,455 | | | | 1,974 | |
Interest income (TE) | | | 106,608 | | | | 105,682 | | | | 117,582 | |
Less: interest expense (GAAP) | | | 8,451 | | | | 12,464 | | | | 18,835 | |
Net interest income (TE) | | $ | 98,157 | | | $ | 93,218 | | | $ | 98,747 | |
PPP loan - interest and net fee income | | $ | 3,146 | | | $ | 3,116 | | | $ | N/A | |
Net interest income (TE - excluding PPP loans) | | $ | 95,011 | | | $ | 90,102 | | | $ | 98,747 | |
Net interest income (GAAP) | | $ | 96,764 | | | $ | 91,751 | | | $ | 96,759 | |
Average interest earning assets | | $ | 3,272,951 | | | $ | 2,674,957 | | | $ | 2,433,658 | |
Average PPP loans | | $ | 67,008 | | | | 83,251 | | | | N/A | |
Average interest earning assets - excluding PPP loans | | $ | 3,205,943 | | | $ | 2,591,706 | | | $ | 2,433,658 | |
Net interest margin (GAAP) | | | 2.96 | % | | | 3.43 | % | | | 3.98 | % |
Net interest margin (TE) | | | 3.00 | % | | | 3.48 | % | | | 4.06 | % |
Core net interest margin (TE - excluding PPP loans) | | | 2.96 | % | | | 3.48 | % | | | 4.06 | % |
The following table allocates the changes in net interest income to changes in either average balances or average rates for interest earning assets and interest bearing liabilities. Interest income is measured on a tax-equivalent basis using a 21% marginal rate for all periods presented. Interest income not yet received on nonaccrual loans is reversed upon transfer to nonaccrual status; future receipt of interest income is a reduction to principal while in nonaccrual status.
Analysis of Year-to-Year Changes in Net Interest Income1
| | | | | | | | | | | | | | | | | | | |
| | 2021 Compared to 2020 | | 2020 Compared to 2019 | |
| | Change Due to | | | | | Change Due to | | | | |
| | Average | | Average | | Total | | Average | | Average | | Total | |
(In thousands) | | Balance | | Rate | | Change | | Balance | | Rate | | Change | |
Interest and dividend income | | | | | | | | | | | | | | | | | | | |
Interest earning deposits | | $ | 414 | | $ | (17) | | $ | 397 | | $ | (230) | | $ | 29 | | $ | (201) | |
Securities: | | | | | | | | | | | | | | | | | | | |
Taxable | | | 2,229 | | | (903) | | | 1,326 | | | 465 | | | (2,948) | | | (2,483) | |
Tax-exempt | | | (362) | | | (15) | | | (377) | | | (1,797) | | | (676) | | | (2,473) | |
Dividends from FHLBC and FRBC | | | 14 | | | (42) | | | (28) | | | (43) | | | (75) | | | (118) | |
Loans and loans held-for-sale | | | 1,893 | | | (2,285) | | | (392) | | | 7,130 | | | (13,755) | | | (6,625) | |
Total interest and dividend income | | | 4,188 | | | (3,262) | | | 926 | | | 5,525 | | | (17,425) | | | (11,900) | |
Interest expense | | | | | | | | | | | | | | | | | | | |
NOW accounts | | | 120 | | | (304) | | | (184) | | | 83 | | | (905) | | | (822) | |
Money market accounts | | | 469 | | | (622) | | | (153) | | | 26 | | | (615) | | | (589) | |
Savings accounts | | | 883 | | | (1,154) | | | (271) | | | 58 | | | (38) | | | 20 | |
Time deposits | | | (625) | | | (2,898) | | | (3,523) | | | (101) | | | (1,602) | | | (1,703) | |
Securities sold under repurchase agreements | | | 31 | | | (151) | | | (120) | | | 179 | | | (554) | | | (375) | |
Other short-term borrowings | | | (90) | | | (90) | | | (180) | | | (1,133) | | | (443) | | | (1,576) | |
Junior subordinated debentures | | | (335) | | | (747) | | | (1,082) | | | (1,947) | | | 438 | | | (1,509) | |
Senior notes | | | - | | | - | | | - | | | 7 | | | (14) | | | (7) | |
Subordinated debt | | | 1,610 | | | - | | | 1,610 | | | - | | | - | | | - | |
Notes payable and other borrowings | | | (27) | | | (84) | | | (111) | | | 250 | | | (60) | | | 190 | |
Total interest expense | | | 2,036 | | | (6,050) | | | (4,014) | | | (2,578) | | | (3,793) | | | (6,371) | |
Net interest and dividend income | | $ | 2,152 | | $ | 2,788 | | $ | 4,940 | | $ | 8,103 | | $ | (13,632) | | $ | (5,529) | |
1The changes in net interest income are created by changes in both interest rates and volumes. In the table above, volume variances are computed using the change in volume multiplied by previous year’s rate. Rate variances are computed using the change in rate multiplied by the previous year’s volume. The change in interest due to both rate and volume has been allocated between factors in proportion to the relationship of absolute dollar amounts of the change in each.
Provision for loan and leasecredit losses
The Companyprovision for credit losses is the expense necessary to maintain the ACL at levels appropriate to absorb our estimate of credit losses expected over the life of our loan portfolio and unfunded lending commitments.
We recorded a $4.3 million provision for loan and leasecredit losses in 20172021, a decrease of $1.8$6.1 million, as comparedfrom 2020. The decrease in provision expense over the prior year was primarily due to $750,000 of loan and lease losses provision in 2016, and a $4.4$9.4 million release of reservesprovision for loancredit losses expense on loans, as economic conditions began to improve in 2021 and leasethe projected impact of the COVID-19 pandemic on our future credit losses was anticipated to be less than our prior projections, partially offset by the Day Two provision expense related to our acquisition of West Suburban of $14.6 million (consisting of a $12.2 million on non-PCD loans and a $2.4 million on acquired unfunded commitments). Our provision for credit losses in 2015. 2020 reflected the forecasted impact of COVID-19 and related uncertainty.
For additional discussion of the loan and lease losscredit provision and allowance for credit losses, see the section below “Allowance for Loan and LeaseCredit Losses” in Item 7. Management’s Discussion and Analysis of Financial Condition.
Noninterest income
| | | | | | | | | | | |
| | | | | | | | | |
(in thousands) | Noninterest Income for the Twelve Months ending December 31, | | Percent Change From | |
| 2017 | | 2016 | | 2015 | | 2017-2016 | | 2016-2015 | |
Trust income | $ | 6,203 | | $ | 5,670 | | $ | 5,953 | | 9.4 | | (4.8) | |
| | | | | | | | | | | |
| | | | | | | | | |
| | Noninterest Income for the Twelve Months ending December 31, | | Percent Change From |
(Dollars in thousands) | | 2021 | | 2020 | | 2019 | | 2021-2020 | | 2020-2019 |
Wealth management | | $ | 9,334 | | $ | 7,905 | | $ | 8,045 | | 18.1 | | (1.7) |
Service charges on deposits | | 6,720 | | 6,684 | | 6,820 | | 0.5 | | (2.0) | | 5,408 | | 5,512 | | 7,715 | | (1.9) | | (28.6) |
Residential mortgage banking revenue: | | | | | | | | | | | |
Residential mortgage banking revenue | | | | | | | | | | | |
Secondary mortgage fees | | 776 | | 1,038 | | 907 | | (25.2) | | 14.4 | | 1,044 | | 1,654 | | 772 | | (36.9) | | 114.2 |
Mortgage servicing rights mark to market loss | | (802) | | (919) | | (1,141) | | 12.7 | | 19.5 | |
Mortgage servicing rights mark to market gain (loss) | | | 1,261 | | (3,999) | | (2,662) | | 131.5 | | (50.2) |
Mortgage servicing income | | 1,778 | | 1,724 | | 1,628 | | 3.1 | | 5.9 | | 2,180 | | 1,950 | | 1,881 | | 11.8 | | 3.7 |
Net gain on sales of mortgage loans | | 4,803 | | | 6,343 | | | 5,775 | | (24.3) | | 9.8 | | 9,300 | | | 15,519 | | | 5,112 | | (40.1) | | 203.6 |
Total residential mortgage banking revenue | | 6,555 | | | 8,186 | | | 7,169 | | (19.9) | | 14.2 | | 13,785 | | | 15,124 | | | 5,103 | | (8.9) | | 196.4 |
Securities gains (losses), net | | 474 | | (2,213) | | (178) | | N/M | | N/M | | 232 | | (25) | | 4,511 | | 1,028.0 | | (100.6) |
Increase in cash surrender value of BOLI | | 1,432 | | | 1,283 | | | 1,396 | | 11.6 | | (8.1) | | 1,390 | | | 1,233 | | | 1,415 | | 12.7 | | (12.9) |
Debit card interchange income | | 4,200 | | | 4,027 | | | 4,028 | | 4.3 | | (0.0) | |
Gains (losses) on disposal and transfer of fixed assets | | 10 | | | (1) | | | (1,119) | | N/M | | N/M | |
Death benefit realized on bank-owned life insurance | | | - | | | 57 | | | 872 | | (100.0) | | (93.5) |
Card related income | | | 6,704 | | | 5,532 | | | 5,861 | | 21.2 | | (5.6) |
Other income | | 4,778 | | | 4,938 | | | 5,225 | | (3.2) | | (5.5) | | 2,377 | | | 2,149 | | | 2,278 | | 10.6 | | (5.7) |
Total noninterest income | $ | 30,372 | | $ | 28,574 | | $ | 29,294 | | 6.3 | | (2.5) | $ | 39,230 | | $ | 37,487 | | $ | 35,800 | | 4.6 | | 4.7 |
| | | | | | | | | | | |
N/M - Not meaningful
TotalOur total noninterest income increased $1.8$1.7 million, or 4.6%, to $30.4$39.2 million in 2017, asfor 2021, compared to $28.6$37.5 million for 2020. The increase was primarily due to:
| ● | Mark to market gains on mortgage servicing rights (MSRs) of $1.3 million in 2021, compared to a mark to market loss on MSRs of $4.0 million recorded in 2020, primarily due to rising market interest rates in late 2021. |
| ● | A $1.4 million, or 18.1%, increase in wealth management income in 2021, from $7.9 million in 2020, due to growth in assets under management due to rising interest rates and an increase in wealth management clients. |
| ● | Net securities gains of $232,000 in 2021, compared to net losses of $25,000 in 2020. The gains in 2021 were primarily due to portfolio sales of $605.8 million in 2021, the majority of which occurred following our acquisition of West Suburban to reposition the portfolio based on our investment strategy. |
| ● | A $1.2 million, or 21.2%, increase in card-related income in 2021, compared to 2020, due to increased consumer spending and card-related income acquired in our acquisition of West Suburban. |
| ● | Other income increased $228,000, or 10.6% in 2021, compared to 2020, primarily due to the sale of an unconsolidated subsidiary in May 2021. |
Partially offsetting these increases were reductions in 2016. The Company continuessecondary mortgage fees of $610,000, or 36.9%, in 2021 compared to develop strategic plans2020, as well as a reduction in the net gain on sales of mortgage loans of $6.2 million, or 40.1%, over the same period, each due to grow its trust income anda reduction in mortgage loan origination volumes in 2021 due to the rising rate environment. Finally, service charges on deposits subjectdecreased $104,000, or 1.9%, in 2021 compared to 2020, due to a reduction in overdraft fees assessed, and a change in the banking industry’s regulatory environment. Trustposting order of checks and electronic payments processed, and we had no BOLI death benefit proceeds in 2021, compared to $57,000 in 2020.
Our total noninterest income increased $533,000 in 2017 from 2016,$1.7 million, or 4.7%, to $37.5 million for 2020, compared to $35.8 million for 2019. This increase was due primarily to growth in estatestotal residential mortgage banking revenues, primarily attributable to net gain on sales of mortgage loans.
Originations of residential loans held-for-sale increased by 133.4 % in 2020 over 2019, and net gain on the sales of mortgage loans increased by over 200% year over year, due to the low market interest rates for the majority of 2020. Secondary mortgage service fees and management emphasismortgage servicing income also increased in 2020 compared to 2019. These positive variances were partially offset by growth in mark to market losses on advisory fee growth.mortgage servicing rights, which increased $1.3 million, or 50.2%, in 2020, compared to 2019. Service charges on deposits increased $36,000decreased $2.2 million, or 28.6%, and card-related income decreased $329,000, or 5.6%, in 2017 from 2016 due primarily2020, compared to growth in commercial demand related account fees,2019, as consumer spending was muted as a result of increases in commercial demand deposit balances commensurate with management’s focus on growing commercial loans. Residential mortgage banking revenue declined $1.6 million in 2017 from 2016, due primarily to a rising interest rate environment. Mortgage originations decreased $47.0 million in 2017 from 2016, and proceeds from mortgage sales declined $45.4 million in 2017 compared to 2016. However, mortgage servicing rights showed a slight improvement of $117,000 for 2017, compared to 2016. Securities gains were $474,000 for 2017, compared tothe COVID-19 pandemic. We had net losses on securities of $2.2 million$25,000 in 2016,2020, primarily due to securitysales of $18.0 million, compared to a net gain of $4.5 million in 2019, due to portfolio sales of $191.3 million in 2019. Security sales in 2016 stemming from funding needs related2019 were executed to take advantage of the Talmer branch acquisition. The cash surrender value of bank owned life insurance (“BOLI”) increased $149,000tightening credit spreads in 2017, compared to 2016, due to the risingfalling interest rate environment.
Total noninterest income decreased $720,000 to $28.6 millionFinally, BOLI death benefit proceeds of $57,000 were realized in 2016, as2020, compared to $29.3 million$872,000 of BOLI death benefit proceeds realized in 2015. Trust income decreased $283,000 in 2016 from 2015, due primarily to declines in personal trust2019, and estate fees in 2016. Residential mortgage banking revenue increased $1.0 million in 2016, compared to 2015, despite the rising rate environment. Valuations in the mortgage business also improved in 2016, compared to 2015. Net losses on securities were $2.2 million for 2016, compared to net losses of $178,000 in 2015, with the increase in net losses primarily due to security sales in 2016 stemming from funding needs related to the Talmer branch acquisition. The cash surrender value of BOLI decreased $113,000 in 2016,declined by $182,000 for the year ended December 31, 2020, compared to 2015, primarily due to minimal rising interest rates and modest increases in the cash surrender value of the policies. Noninterest income in 2015 included a noncash impairment charge of approximately $1.1 million on the now closed branch in Batavia, Illinois and revenue of approximately $917,000 related to a one-time payment from a long term service provider, which is included in “other income.”2019 like period.
Noninterest expense
| | | | | | | | | | | |
| | | | | | | | | |
(in thousands) | Noninterest Expense for the Twelve Months ending December 31, | | Percent Change From | |
| 2017 | | 2016 | | 2015 | | 2017-2016 | | 2016-2015 | |
| | | | | | | | | | | |
| | | | | | | | | |
| | Noninterest Expense for the Twelve Months ending December 31, | | Percent Change From |
(Dollars in thousands) | | 2021 | | 2020 | | 2019 | | 2021-2020 | | 2020-2019 |
Salaries | $ | 31,096 | | $ | 28,823 | | $ | 28,173 | | 7.9 | | 2.3 | $ | 42,444 | | $ | 38,058 | | $ | 36,413 | | 11.5 | | 4.5 |
Officers incentive | | 2,637 | | 1,988 | | 1,320 | | 32.6 | | 50.6 | | 5,352 | | 3,574 | | 3,378 | | 49.7 | | 5.8 |
Benefits and other | | 6,347 | | | 5,423 | | | 5,568 | | 17.0 | | (2.6) | | 9,895 | | | 7,915 | | | 7,078 | | 25.0 | | 11.8 |
Total salaries and employee benefits | | 40,080 | | | 36,234 | | | 35,061 | | 10.6 | | 3.3 | | 57,691 | | | 49,547 | | | 46,869 | | 16.4 | | 5.7 |
Occupancy, furniture and equipment | | 5,951 | | | 6,063 | | | 6,260 | | (1.8) | | (3.1) | | 13,583 | | | 8,498 | | | 8,289 | | 59.8 | | 2.5 |
Computer and data processing | | 4,387 | | | 4,349 | | | 4,357 | | 0.9 | | (0.2) | | 7,938 | | | 5,143 | | | 5,631 | | 54.3 | | (8.7) |
FDIC insurance | | 658 | | | 865 | | | 1,334 | | (23.9) | | (35.2) | | 975 | | | 597 | | | 176 | | 63.3 | | 239.2 |
General bank insurance | | 1,031 | | | 1,109 | | | 1,273 | | (7.0) | | (12.9) | | 1,214 | | | 1,030 | | | 1,002 | | 17.9 | | 2.8 |
Amortization of core deposit intangible | | 96 | | | 16 | | | - | | N/M | | N/M | | 644 | | | 494 | | | 539 | | 30.4 | | (8.3) |
Advertising expense | | 1,505 | | | 1,633 | | | 1,340 | | (7.8) | | 21.9 | | 343 | | | 298 | | | 1,225 | | 15.1 | | (75.7) |
Debit card interchange expense | | 1,329 | | | 1,455 | | | 1,514 | | (8.7) | | (3.9) | |
Card related expense | | | 2,538 | | | 2,195 | | | 1,956 | | 15.6 | | 12.2 |
Legal fees | | 650 | | | 800 | | | 1,175 | | (18.8) | | (31.9) | | 1,105 | | | 761 | | | 675 | | 45.2 | | 12.7 |
Consulting & management fees | | | 5,005 | | | 760 | | | 242 | | 558.6 | | 214.0 |
Other real estate owned expense, net | | 2,165 | | | 2,743 | | | 5,191 | | (21.1) | | (47.2) | | 167 | | | 651 | | | 423 | | (74.3) | | 53.9 |
Other expense | | 11,297 | | | 11,494 | | | 10,916 | | (1.7) | | 5.3 | | 12,598 | | | 11,443 | | | 12,075 | | 10.1 | | (5.2) |
Total noninterest expense | $ | 69,149 | | $ | 66,761 | | $ | 68,421 | | 3.6 | | (2.4) | $ | 103,801 | | $ | 81,417 | | $ | 79,102 | | 27.5 | | 2.9 |
| | | | | | | | | | | |
| | | | | | | | | | | |
| | | | | | | | | | | |
| | | | | | | | | | | |
N/M - Not meaningful
TotalOur total noninterest expense increased by $2.4$22.4 million, or 3.6%27.5%, in 20172021 compared to 2016. Total salaries and employee benefits increased 10.6% in 2017 compared to 2016, primarily as a result of growth in salaries, insurance and other benefits costs, and increased officer incentives due to improved corporate performance. Other real estate owned expenses, net, decreased $578,000 in 2017 compared to 2016, reflecting the declining balances held in other real estate owned.
Total noninterest expense decreased by $1.7 million , or 2.4%, in 2016 compared to 2015.2020. The reductionincrease was primarily due to:
| ● | An $8.1 million, or 16.4%, increase in total salaries and employee benefits, comprised of a $4.4 million increase in salaries primarily due to the West Suburban acquisition, a $1.8 million increase in officers’ incentives primarily due to higher incentive accruals in 2021, and a $2.0 million increase in benefits and other expense primarily due to increases stemming from additional employees from our acquisition of West Suburban and increases in employee insurance costs as more employees returned to more routine medical appointments, many of which were on hold during 2020 due to the COVID-19 pandemic. Our number of full-time equivalent employees was 891 as of December 31, 2021, compared to 533 as of December 31, 2020, with the increase due primarily to the West Suburban acquisition. We are currently facing challenges in achieving a fully-staffed work force due to the current labor market conditions. Many of our staff members continue to work remotely, or have a hybrid schedule of both in-office and remote workdays. |
| ● | A $5.1 million, or 59.8%, increase in occupancy, furniture and equipment expense primarily due to the acquisition of West Suburban related assets, which included $3.8 million of branch write-downs in the fourth quarter of 2021, based on our deployment of a branch assessment to determine overlap following the merger. |
| ● | A $2.8 million, or 54.3%, increase in computer and data processing expense, primarily due to merger-related costs incurred related to our acquisition of West Suburban. |
| ● | A $4.2 million, or 558.6%, increase in consulting and management fees, primarily due to merger-related costs incurred related to our acquisition of West Suburban. This significant increase included $3.0 million of fees for financial advisory and investment banking services related to the West Suburban acquisition. |
| ● | A $1.2 million, or 10.1%, increase in other expense in 2021, compared to 2020, primarily attributable to merger-related costs incurred related to our acquisition of West Suburban. |
Partially offsetting these increases to noninterest expense was a decrease$484,000, or 74.3%, reduction in other real estate owned expense primarily due to a $278,000 reduction in valuation reserve expenses net, and other reductions in insurance and taxes, professional, closing cost, and other expenses relating to OREO.
Our total noninterest expense increased by $2.3 million, or 2.9%, in 20162020 compared to 2015, reflecting the declining balances held in other real estate owned. This decrease2019. The increase was partially offset by anprimarily attributable to a $2.7 million increase in total salaries and employee benefits, driven bydue primarily to an increase in salary costs as 2020 reflected a full year of the commercial lending team hires in mid-year 2019, annual merit increases in early 2020, growth in mortgage commissions paid due to an increase in residential loan origination volumes, higher employee insurance costs and an increase in company matches on 401k deferrals due to the earlier eligibility allowed to enter our 401k plan. In addition, occupancy, furniture and equipment expense increased $209,000 due to planned building repairs at various branch locations in 2020. FDIC insurance expense increased $421,000, due to assessment credits received in 2019 after the FDIC reached its required reserve ratio, that were not repeated in 2020; see “Supervision and Regulation Deposit Insurance” for further discussion of 17 full-time equivalent employees.these assessment credits. Partially offsetting these increases to noninterest expense were reductions in computer and data processing, advertising expense, and other expense. Advertising expense decreased in 2020, as we continued to assess our marketing strategy and opportunities for future promotion of our 150th anniversary in 2021.
The Company’s number of full-time equivalent employees declined by 17 in 2017. Management continues to be diligent in controlling the hiring of replacements as positions become open, as the Company looks to efficiently utilize its current staff.
Income taxes
The Company’sOur provision for income taxes includes both federal and state income tax expense (benefit). An analysis of the provision for income taxes for the three years ended December 31, 2017,2021, is detailed in Note 1211 of the consolidated financial statements and the Company’sour income tax accounting policies are described in Note 1 to the consolidated financial statements.
IncomeOur income tax expense totaled $19.2$7.8 million for the year ended December 31, 20172021 compared to an income tax expense of $8.8$9.6 million in 2016for 2020 and $9.0$12.4 million in 2015.for 2019. Income tax expense reflected all relevant statutory tax rates and GAAP accounting. The Company’sOur effective tax rate was 55.8%, 36.0%28.1% for 2021, 25.6% for 2020, and 36.8% in 2017, 2016 and 2015, respectively.23.9% for 2019. Any changes in tax rates will be recorded in the period enacted.
On December 22, 2017, the Tax Cuts and Jobs Act was signed into law, which resulted in a reduction in the Federal income tax rate from 35% to 21%, thereby decreasing the Company’s deferred tax asset by $9.5 million and increasing the Company’s income tax expense. In addition, in July 2017, the State of Illinois enacted a tax rate change which resulted in the Company recording a $1.6 million increase to the deferred tax asset and an income tax credit.
On September 2, 2015, the Company and the Bank, as rights agent (the “Rights Agent”), entered into a Second Amendment to Amended and Restated Rights Agreement and Tax Benefits Preservation Plan (the “Amendment”), which amended the Amended and Restated Rights Agreement and Tax Benefits Preservation Plan, dated as of September 12, 2012, between the Company and the Rights Agent (as amended, the “Tax Benefits Plan”). This amendment was submitted and approved by the Company’s stockholders at the
Company’s 2016 annual meeting, which extended the final expiration date of the Tax Benefits Plan from September 12, 2015 to September 12, 2018. The Company’s board has determined not to renew the Tax Benefits Plan beyond the September 12, 2018 expiration date.
The determination of whether the Companywe will be able to realize theour deferred tax assets is highly subjective and dependent upon judgment concerning management’s evaluation of both positive and negative evidence, including forecasts of future income, available tax planning strategies, and assessments of theboth current and future economic and business conditions. Management considered both positive and negative evidence regarding the Company’sour ability to ultimately realize the deferred tax assets, which is largely dependent upon theon our ability to derive benefits based uponon future taxable income. For all periods presented, management determined that the realization of the deferred tax asset was “more likely than not” as required by GAAP.
There have been no significant changes in the Company's ability to utilize the deferred tax assets through December 31, 2017. The Company has no valuation reserve on the deferred tax assets as of December 31, 2017.
Financial condition
General
TotalOur total assets were $2.38$6.21 billion at December 31, 2017,2021, an increase of $132.2 million,$3.17 billion, or 5.9%104.3%, from December 31, 2016. Loans2020. Our total cash and cash equivalents increased $422.2 million, driven by an increase in interest earning deposits with financial institutions, primarily due to the acquisition of West Suburban.
Our loans increased by 9.4%$1.39 billion, or 68.2%, to $1.62$3.42 billion for the year ended December 31, 2017,2021, compared to 2016. For2020. This increase is primarily due to the year ended December 31, 2017,1, 2021 acquisition of West Suburban, and the largest changes byresultant $1.50 billion loan type included increasesportfolio acquired. In addition, we also had organic loan growth in 2021, primarily in our commercial, leases, construction and commercial real estate–commercial, and real estate-residential, while allestate investor loan types, excluding consumer and overdrafts, grew due to organic loan originations and select portfolio purchases. Totalportfolios.
Our total securities increased by $9.6 million,$1.20 billion, or 1.8%241.1%, for the year ended December 31, 2017, while2021, compared to 2020, primarily due to the totalacquisition of $1.07 billion of securities with our acquisition of West Suburban, immediately followed by security sales of approximately $605.8 million to reposition the portfolio mix was moved into states and political subdivision issuances and outbased on our investment strategy, offset by additional purchases from the liquidity provided from such sales. We recorded pretax net security gains of collateralized mortgage obligations and asset back securities. $232,000 in 2021.
In 2017,2021, management continuedemphasized a desire for excess liquidity due to emphasize balance sheet stabilizationuncertainty related to the COVID-19 pandemic, as well as short duration investments and credit quality in all investing and lending deliberations anddecisions. We also continued to encounterexperience a high levelslevel of competition for loans in the Company’sour target markets. Balance sheet stabilization was reflected in reducedThe balance of our other real estate balances, whichowned decreased $3.5to $2.4 million or 29.8%, for the year endedas of December 31, 2017, compared to2021, from $2.5 million as of December 31, 2016, as sale activity2020. In December 2021, we acquired three OREO properties in our acquisition of West Suburban, with a total net book value of $5.6 million, and valuation write-downs exceeded newwe sold two of these properties added. in December, which had a net book value of $5.2 million.
TotalOur total liabilities were $2.18$5.71 billion at December 31, 2017,2021, an increase of $107.1 million,$2.98 billion, or 5.2%108.9%, from December 31, 2016.2020. Total deposits increased by 3.0%$2.93 billion, or 115.5%, to $1.92$5.47 billion for the year ended December 31, 2017,2021, compared to $2.54 billion for the year ended December 31, 2016.2020, primarily due to $2.69 billion of deposits acquired in our acquisition of West Suburban. In addition, organic growth in demand deposits, savings, NOW and money market accounts also contributed to the increase. Management continued to fund new lending with deposit growth and securities sold under repurchase agreements, and we were able to reduce our short term borrowings from the Federal Home Loan Bank of Chicago (the “FHLBC”), and modest levels of security sales. due to our liquidity on hand.
At December 31, 2017,2021, total stockholders’ equity was $200.4$502.0 million, compared to $175.2$307.1 million at December 31, 2016.2020.
Investments
As shown below, we experienced significant changes in our securities portfolio in 2021, primarily due to the $1.07 billion of securities we acquired with our West Suburban acquisition. We also purchased $886.1 million of securities during 2021, less sales, maturities, calls and paydowns of $744.7 million, primarily to align the securities portfolio to our investment strategy of higher credit, lower duration holdings immediately after the West Suburban acquisition. In addition to rebalancing the portfolio, we added high quality floating-rate or shorter duration fixed-rate assets that will likely increase our book value over a range of interest rate scenarios. The size of the portfolio increased in 2021 compared to 2020 primarily from the West Suburban acquisition, but there were unrealized mark to market net investment sales during 2017 changedlosses of $8.7 million in 2021. We had minimal changes in the overall composition of our securities portfolio from 2019 to 2020. However, the Company’s securities portfolio.size of the portfolio increased in 2020 compared to 2019 primarily due to an increase in unrealized mark to market gains of $14.7 million in 2020.
| | | | | | | | | | | | | |
| | | | | | | | | | | |
(in thousands) | | Securities Portfolio as of December 31, | | Percent Change From |
| | 2017 | | 2016 | | 2015 | | 2017-2016 | | 2016-2015 |
Securities available-for-sale, at fair value | | | | | | | | | | | | | |
U.S. Treasury | | $ | 3,947 | | $ | - | | $ | 1,509 | | N/M | | N/M |
U.S. government agencies | | | 13,061 | | | - | | | 1,556 | | N/M | | N/M |
U.S. government agency mortgage-backed | | | 12,214 | | | 41,534 | | | 1,996 | | (70.6) | | N/M |
States and political subdivisions | | | 278,092 | | | 68,703 | | | 30,526 | | 304.8 | | 125.1 |
Corporate bonds | | | 833 | | | 10,630 | | | 29,400 | | (92.2) | | (63.8) |
Collateralized mortgage obligations | | | 65,939 | | | 170,927 | | | 66,920 | | (61.4) | | 155.4 |
Asset-backed securities | | | 112,932 | | | 138,407 | | | 231,908 | | (18.4) | | (40.3) |
Collateralized loan obligations | | | 54,421 | | | 101,637 | | | 92,251 | | (46.5) | | 10.2 |
Total securities available-for-sale | | $ | 541,439 | | $ | 531,838 | | $ | 456,066 | | 1.8 | | 16.6 |
| | | | | | | | | | | | | |
Securities held-to-maturity, at amortized cost | | | | | | | | | | | | | |
U.S. government agency mortgage-backed | | $ | - | | $ | - | | $ | 36,505 | | N/M | | N/M |
Collateralized mortgage obligations | | | - | | | - | | | 211,241 | | N/M | | N/M |
Total securities held-to-maturity | | $ | - | | $ | - | | $ | 247,746 | | N/M | | N/M |
| | | | | | | | | | | | | |
Total securities | | $ | 541,439 | | $ | 531,838 | | $ | 703,812 | | 1.8 | | (24.4) |
N/M - Not meaningfulSecurities Available-for-Sale Portfolio
| | | | | | | | | | | | | | | | | | | | | | | | | |
| | 2021 | | | | 2020 | | | | 2019 | | | |
| | Amortized | | Fair | | % of | | Amortized | | Fair | | % of | | Amortized | | Fair | | % of | |
(Dollars in thousands) | | Cost | | Value | | Total | | Cost | | Value | | Total | | Cost | | Value | | Total | |
Securities available-for-sale | | | | | | | | | | | | | | | | | | | | | | | | | |
U.S. Treasury | | $ | 202,251 | | $ | 202,339 | | 12.0 | | $ | 4,014 | | $ | 4,117 | | 0.8 | | $ | 4,010 | | $ | 4,036 | | 0.8 | |
U.S. government agencies | | | 62,587 | | | 61,888 | | 3.6 | | | 6,811 | | | 6,657 | | 1.3 | | | 8,502 | | | 8,337 | | 1.7 | |
U.S. government agency mortgage-backed | | | 172,016 | | | 172,302 | | 10.2 | | | 16,098 | | | 17,209 | | 3.5 | | | 16,164 | | | 16,588 | | 3.4 | |
States and political subdivisions | | | 240,793 | | | 256,465 | | 15.1 | | | 229,352 | | | 249,259 | | 50.2 | | | 240,399 | | | 249,175 | | 51.4 | |
Corporate bonds | | | 10,000 | | | 9,887 | | 0.6 | | | - | | | - | | 0.0 | | | - | | | - | | 0.0 | |
Collateralized mortgage obligations | | | 673,238 | | | 672,967 | | 39.8 | | | 53,999 | | | 56,585 | | 11.4 | | | 57,059 | | | 57,984 | | 12.0 | |
Asset-backed securities | | | 236,293 | | | 236,877 | | 14.0 | | | 130,959 | | | 131,818 | | 26.6 | | | 82,114 | | | 81,844 | | 16.9 | |
Collateralized loan obligations | | | 79,838 | | | 79,763 | | 4.7 | | | 30,728 | | | 30,533 | | 6.2 | | | 66,898 | | | 66,684 | | 13.8 | |
Total securities available-for-sale | | $ | 1,677,016 | | $ | 1,692,488 | | 100.0 | | $ | 471,961 | | $ | 496,178 | | 100.0 | | $ | 475,146 | | $ | 484,648 | | 100.0 | |
| | | | | | | | | | | | | | | | | | | | | | | | | |
Our investment portfolio serves as both an important source of liquidity and as a source of income for the Company.income. Accordingly, the size and composition of the portfolio reflects our liquidity needs, loan demand and interest income objectives.
Portfolio We will adjust the size and composition will be adjustedof the portfolio from time to time. While a significant portion of the portfolio consists of readily marketable securities to address future liquidity needs, other parts of the portfolio may reflect funds invested pending future loan demand or to maximize interest income without undue interest rate risk.
The Company’sOur total securities as of December 31, 2017,2021, reflected a net increase of $9.6 million,$1.20 billion, or 1.8%241.1%, sincefrom December 31, 2016. While2020, primarily due to the size$1.07 billion of securities we acquired with our West Suburban acquisition. We executed security purchase and sales in 2021 to rebalance the portfolio did not change significantly,to our investment strategies which generally focus on higher credit, lower duration securities. As 2021 progressed, we focused on shorter duration issuances, but we retained a higher credit rating requirement for purchases. Of the portfolio composition underwent a material restructuring. Market conditions madetotal $744.7 million recorded in security sales, call, maturities and paydowns in 2021, $279.4 million were related to U.S. government agency mortgage-backed securities, (“MBS”) and $321.6 million were related to collateralized mortgage obligations (“CMOs”) issued by federal agencies less attractive, while issuances of states and political subdivisions became more attractive. These conditions prompted the sales of a significant portion of our MBS and CMO portfolio, which were reinvested into issuances of states and political subdivisions. Market conditions also increased the value of the Company’s collateralized loan obligations (“CLOs”), which led many holdings to be called during 2017. Some reinvestment into newer issue CLOs occurred, but the overall CLO portfolio size was reduced significantly. Netobligations. We recorded net securities gains of $474,000 were recorded$232,000 in 20172021 related to sales and calls during the year. We executed securities purchases during 2021 to use a portion of the liquidity from the rebalancing of the overall portfolio, with investments primarily in U.S. Treasuries, collateralized mortgage obligations, and asset-backed securities.
Some of our holdings of U.S. government agency MBS and CMOs are issuances of government-sponsored enterprises, such as Fannie Mae and Freddie Mac, which are not backed by the full faith and credit of the U.S. government. Some holdings of MBS and CMOs are issued by Ginnie Mae, which do carry the full faith and credit of the U.S. government. We also hold some MBS and CMOs that were not issued by U.S. government agencies and are typically credit-enhanced via over-collateralization and/or subordination. Holdings of ABS were largely comprised of securities backed by student loans issued under the U.S. Department of Education’s (“DOE”) FFEL program, which generally provides a minimum 97% U.S. DOE guarantee of principal. These ABS securities also have added credit enhancement through over-collateralization and/or subordination. The majority of holdings issued by states and political subdivisions are general obligation or revenue bonds that have S&P or Moody’s ratings of AA- or higher. Other state and political subdivision issuances are unrated and generally consist of smaller investment amounts that involve issuers in our markets. The credit quality of these issuers is monitored and none have been identified as posing a material risk of loss. We also hold collateralized loan obligation (“CLOs”) securities that are generally backed by a pool of debt issued by multiple middle-sized and large businesses. Our CLO S&P or Moody’s ratings distribution consists of 100% rated AAA. CLO credit enhancement is achieved through over-collateralization and/or subordination.
The Company’s totalfollowing table presents the expected maturities or call dates and weighted average yield (nontax equivalent) of securities by major category as of December 31, 2016 declined from2021. Securities not due at a single maturity date are shown only in the total column.
Securities Portfolio Maturity and Yields
| | | | | | | | | | | | | | | | | | | | | | | | | |
| | | | | | After One But | | After Five But | | | | | | | | | | | |
| Within One Year | | Through Five Years | | Through Ten Years | | After Ten Years | | Total | | | |
(Dollars in thousands) | Amount | | Yield | | Amount | | Yield | | Amount | | Yield | | Amount | | Yield | | Amount | | Yield | |
Securities available-for-sale | | | | | | | | | | | | | | | | | | | | | | | | | |
U.S. Treasury | $ | 4,050 | | 1.85 | % | $ | 198,289 | | 0.88 | % | $ | - | | - | % | $ | - | | - | % | $ | 202,339 | | 1.85 | % |
U.S. government agencies | | - | | - | | | 56,879 | | 0.81 | | | 5,009 | | 1.37 | | | - | | - | | | 61,888 | | 1.28 | |
States and political subdivisions | | 4,657 | | 0.72 | | | 9,482 | | 1.75 | | | 40,461 | | 2.57 | | | 201,865 | | 2.98 | | | 256,465 | | 2.98 | |
Corporate bonds | | - | | - | | | 9,887 | | 0.75 | | | - | | - | | | - | | - | | | 9,887 | | 0.75 | |
| | 8,707 | | 1.24 | | | 274,537 | | 0.89 | | | 45,470 | | 2.43 | | | 201,865 | | 2.98 | | | 530,579 | | 1.79 | |
Mortgage-backed securities and collateralized mortgage obligations | | - | | - | | | - | | - | | | - | | - | | | - | | - | | | 845,269 | | 1.19 | |
Asset-backed securities | | - | | - | | | - | | - | | | - | | - | | | - | | - | | | 236,877 | | 1.12 | |
Collateralized loan obligations | | | | | | | | | | | | | | | | | | | | | | 79,763 | | 1.60 | |
Total securities available-for-sale | $ | 8,707 | | 1.24 | % | $ | 274,537 | | 0.89 | % | $ | 45,470 | | 2.43 | % | $ | 201,865 | | 2.98 | % | $ | 1,692,488 | | 1.38 | % |
| | | | | | | | | | | | | | | | | | | | | | | | | |
As of December 31, 2021, net unrealized gains on available-for-sale securities totaled $15.5 million, which offset by deferred income taxes resulted in an overall increase to equity capital of $11.1 million. As of December 31, 2020, net unrealized gains on available-for-sale securities totaled $24.2 million, which offset by deferred income taxes resulted in an overall increase to equity capital of $17.4 million.
Loans
The following table presents the composition of the loan portfolio at December 31 for the year end 2015indicated:
Loan Portfolio
| | | | | | | | | | | | | | | |
| | | | % of | | | | % of | | | | % of |
(Dollars in thousands) | | 2021 | | Total | | 2020 | | Total | | 2019 | | Total |
Commercial | | $ | 771,474 | | 22.5 | | $ | 407,159 | | 20.0 | | $ | 332,842 | | 17.2 |
Leases | | | 176,031 | | 5.2 | | | 141,601 | | 7.0 | | | 119,751 | | 6.2 |
Commercial real estate - Investor | | | 957,389 | | 28.0 | | | 582,042 | | 28.6 | | | 520,095 | | 26.9 |
Commercial real estate - Owner occupied | | | 574,384 | | 16.8 | | | 333,070 | | 16.4 | | | 345,504 | | 17.9 |
Construction | | | 206,132 | | 6.0 | | | 98,486 | | 4.8 | | | 69,617 | | 3.6 |
Residential real estate - Investor | | | 63,399 | | 1.9 | | | 56,137 | | 2.8 | | | 71,105 | | 3.7 |
Residential real estate - Owner occupied | | | 213,248 | | 6.2 | | | 116,388 | | 5.7 | | | 136,023 | | 7.0 |
Multifamily | | | 309,164 | | 9.0 | | | 189,040 | | 9.3 | | | 189,773 | | 9.8 |
HELOC | | | 115,664 | | 3.4 | | | 80,908 | | 4.0 | | | 91,605 | | 4.7 |
HELOC - Purchased | | | 10,626 | | 0.3 | | | 19,487 | | 1.0 | | | 31,852 | | 1.6 |
Other1 | | | 24,437 | | 0.7 | | | 10,533 | | 0.4 | | | 12,258 | | 0.9 |
Total loans (which excludes deferred loans costs and PCI loans for December 31, 2019)2 | | | 3,421,948 | | 100.0 | | | 2,034,851 | | 100.0 | | | 1,920,425 | | 99.5 |
Net deferred loans costs | | | - | | - | | | - | | - | | | 1,786 | | 0.1 |
PCI loans | | | - | | - | | | - | | - | | | 8,601 | | 0.4 |
Total loans (including deferred loan costs and PCI loans for December 31, 2019 only)2 | | $ | 3,421,948 | | 100.0 | | $ | 2,034,851 | | 100.0 | | $ | 1,930,812 | | 100.0 |
1 The “Other” class includes consumer loans and overdrafts.
2 As noted in the paragraph below, for the period ended December 31, 2019 (before the Company’s adoption of CECL on January 1, 2020), purchased credit impaired (“PCI”) loans and their related deferred loan costs (now PCD loans) were excluded from nonperforming loan disclosures and were therefore separately reported. After the adoption of CECL, all PCD loans are now included within each relevant loan type and are not separately reported as PCI loans, because such loans are now included within the Company’s nonperforming loan disclosures, if such loans otherwise meet the definition of a nonperforming loan.
Our total securities balance by $172.0 million, or 24.4%.loans were $3.4 billion as of December 31, 2021, an increase of $1.4 billion from $2.0 billion as of December 31, 2020. This reduction stemmed from funding needs relatedincrease was primarily due to the Talmer branchDecember 1, 2021 acquisition of West Suburban, and the resultant $1.5 billion loan growth. Primarily asset backed securities and CMOs were sold to complete the Company’s plans, which resulted in net security losses portfolio acquired.
Growth in the year over year period such as states and political subdivisions and CLOs. Purchases totaling $92.3also included PPP loan originations of $62.3 million, were executed in these portfolios during 2016 due to favorable pricing in the rising interest rate environment. These portfolio increases were more than offset by reductions in holdingsrecorded within commercial loans, with $38.4 million of asset-backed securities and CMOs; these reductions were comprised of sales of $287.7 million and paydowns of $31.8 million.
Securities held-to-maturity were held in 2015 and early 2016; in the second quarter of 2016, the portfolio was transferred to available-for-sale to allow for portfolio restructuring and to fund loan growth. Securities held-to-maturity presented above were carried at amortized cost and the discount or premium was accreted or amortized to the maturity or expected payoff date but not an earlier call. Due to the transfer to available-for-sale in 2016, the Company is precluded from holding any securities as held-to-maturity for a two year period after the date of transfer.
Loans
| | | | | | | | | | | | |
| | | | | | | | | | |
(in thousands) | Major Classification of Loans as of December 31, | | Percent Change From |
| 2017 | | 2016 | | 2015 | | 2017-2016 | | 2016-2015 |
Commercial | $ | 272,851 | | $ | 228,113 | | $ | 115,603 | | 19.6 | | 97.3 |
Leases | | 68,325 | | | 55,451 | | | 25,712 | | 23.2 | | 115.7 |
Real estate - commercial | | 750,991 | | | 736,247 | | | 605,721 | | 2.0 | | 21.5 |
Real estate - construction | | 85,162 | | | 64,720 | | | 19,806 | | 31.6 | | 226.8 |
Real estate - residential | | 426,230 | | | 377,851 | | | 351,007 | | 12.8 | | 7.6 |
Consumer | | 2,774 | | | 3,237 | | | 4,216 | | (14.3) | | (23.2) |
Other | | 10,609 | | | 11,973 | | | 10,613 | | (11.4) | | 12.8 |
| | 1,616,942 | | | 1,477,592 | | | 1,132,678 | | 9.4 | | 30.5 |
Net deferred loan costs | | 680 | | | 1,217 | | | 1,037 | | (44.1) | | 17.4 |
Total loans | $ | 1,617,622 | | $ | 1,478,809 | | $ | 1,133,715 | | 9.4 | | 30.4 |
TotalPPP loans were $1.62 billionoutstanding as of December 31, 2017, an increase2021, consisting of $138.8$17.7 million from $1.48 billion asrelated to 131 PPP loans originated by the Company, which includes five first round PPP originations of December 31, 2016. The company’s$2.4 million not yet paid off or forgiven, and $20.8 million related to PPP loans originated by West Suburban before the acquisition. In addition, we experienced organic loan growth primarily in 2017 compared to 2016 was driven by our continued efforts to build business origination pipelines, as well as select portfolio purchases. In 2017, the Company purchased a select portfoliocommercial, leases, commercial real estate—investor and construction loan portfolios. We recorded total loan originations and renewals of home equity lines of credit totaling $16.7 million, included within the $48.4 million growth in real estate-residential, above, at year end 2017 compared to 2016. The Company also purchased $17.1$892.5 million in leases from a third party originator2021, but we also experienced accelerated paydowns in 2017. The Company continued its focus in 2017 on identifying commercial and industrial loan prospects that conform2021 due to the Company’s loan policies and increased commercial loans by $44.7 million at year end 2017, compared to 2016. high levels of customer liquidity.
We strive to serve customers in and around our geographic locations and continue to seek opportunities in our primary lending markets; however, our markets remain very competitive for new loan business.
Total loans were $1.48 billion as of December 31, 2016, an increase of $345.1 million from $1.13 billion as of December 31, 2015. The Company’sManagement continues to emphasize loan growth in 2016, compared to 2015, included $221.0 million of loans purchased in our Talmer branch acquisition and organic loan growth of $124.1 million. We experienced organic growth largely in the multi-family, commercial real estate (both owner occupied and nonowner occupied) and commercial & industrial classifications in 2016, compared to 2015. Other commercial real estate credits were realized with relationships in our targeted customer and geographic markets, and additional lease financing
receivables were recorded in 2016, with numerous purchases of equipment financing contracts originated by a larger Illinois based financial institution.
The Company worked diligently to build loan origination pipelines during 2016 and 2017, asportfolio quality, which was evidenced by the stable nonperforming loan growth of 9.4% in 2017 and 30.4% in 2016. Asmetrics, excluding acquired loans from West Suburban, discussed in the “Asset Quality” section below, management continued to emphasize loan portfolio quality in 2017 and 2016 and, asbelow. As a result, $497,000 ofwe recorded net loan charge-offs were recordedof $4.4 million in 2017, and $815,000 of2021, net loan charge-offs were recordedof $979,000 in 2016, compared to $1.0 million of2020, and net loan charge-offs recordedof $817,000 in 2015.2019.
The quality of theour loan portfolio is in large part a reflection of the economic health of the communities in which the Company operates. Thewe operate. Our local economiescommunities have displayed improved economic conditionsbeen relatively stable in the past few years, as reflected infive years. While there are no significant concentrations of loans where the Company’scustomers’ ability to honor loan growthterms is dependent upon a single economic sector, the real estate categories represented 71.6% and declines in classified assets, as discussed in72.5% of the “Asset Quality” section below. Real estate lending categories comprised the largest group in the portfolio for all years presented. In addition, the commercial loan portfolio increased $44.7 million to $272.9 million at December 31, 2017, from $228.1 million2021 and 2020, respectively. Our lending exposure is diversified across our commercial, leasing, commercial real estate, residential real estate, construction loan, multifamily and HELOC portfolios, with total loan portfolio growth in each of the three years presented above. We had no concentration of loans exceeding 10% of total loans that were not otherwise disclosed as a category of loans at December 31, 2016. The Company remains2021. We remain committed to overseeing and managing itsour loan portfolio to avoid unnecessarily high credit concentrations in accordance with the general interagency guidance on risk management. Consistent with those commitments, management updated itsmonitors our asset diversification plan and policy and anticipates that the percentage of real estate lending in relation to the overall portfolio will decrease in the future.
The ALLLfollowing table sets forth the remaining contractual maturities for loan categories at December 31, 2021:
Maturity and Rate Sensitivity of Loans to Changes in Interest Rate
| | | | | | | | | | | | | | | | | | | | | | | | | |
| | | | | After One Year | | After Five Years | | | | | | | | | | |
| | | | | Through Five Years | | Through 15 Years | | After 15 Years | | | | |
| | One Year | | Fixed | | Floating | | Fixed | | Floating | | Fixed | | Floating | | | | |
(In thousands) | | or Less | | Rate | | Rate | | Rate | | Rate | | Rate | | Rate | | Total | |
Commercial Loans | | $ | 246,404 | | $ | 276,200 | | | 176,546 | | | 58,967 | | | 10,936 | | | 1,115 | | | 1,306 | | $ | 771,474 | |
Leases | | | 2,808 | | | 145,652 | | | 1,297 | | | 26,274 | | | - | | | - | | | - | | | 176,031 | |
Commercial real estate - Investor | | | 164,728 | | | 448,961 | | | 203,958 | | | 71,608 | | | 68,035 | | | - | | | 99 | | | 957,389 | |
Commercial real estate - Owner Occupied | | | 64,727 | | | 275,132 | | | 70,836 | | | 46,030 | | | 107,922 | | | - | | | 9,737 | | | 574,384 | |
Construction | | | 82,271 | | | 59,750 | | | 40,281 | | | 13,464 | | | 9,849 | | | 75 | | | 442 | | | 206,132 | |
Real estate - Investor | | | 11,276 | | | 23,195 | | | 4,182 | | | 4,765 | | | 4,975 | | | 1,050 | | | 13,956 | | | 63,399 | |
Real estate - Owner Occupied | | | 6,062 | | | 5,130 | | | 4,968 | | | 67,505 | | | 12,483 | | | 44,945 | | | 72,155 | | | 213,248 | |
Multifamily | | | 44,766 | | | 188,517 | | | 12,547 | | | 41,932 | | | 20,012 | | | - | | | 1,390 | | | 309,164 | |
HELOC | | | 5,380 | | | 1,055 | | | 21,085 | | | 2,635 | | | 9,135 | | | 5,526 | | | 70,848 | | | 115,664 | |
HELOC - Purchased | | | - | | | - | | | - | | | 10,446 | | | - | | | 180 | | | - | | | 10,626 | |
Other1 | | | 14,957 | | | 6,461 | | | 2,367 | | | 399 | | | 253 | | | - | | | - | | | 24,437 | |
Total | | $ | 643,379 | | $ | 1,430,053 | | $ | 538,067 | | $ | 344,025 | | $ | 243,600 | | $ | 52,891 | | $ | 169,933 | | $ | 3,421,948 | |
1The “Other” class includes consumer loans and overdrafts; column one includes demand notes.
Asset Quality
Nonperforming loans consist of nonaccrual loans, performing troubled debt restructured loans accruing interest and loans 90 days or more past due still accruing interest. Remediation work continues in all segments. Management believes that the full impacts of the COVID-19 pandemic are not yet known. The fiscal stimulus and relief programs appear to have delayed any materially adverse financial impact to the Bank. Once these stimulus programs have been fully exhausted, however, we believe our credit metrics could worsen and loan losses could ultimately materialize. Any potential loan losses will be contingent upon a number of factors beyond our control, including a slower return to pre-pandemic routines, due to concerns related to increases in new COVID-19 cases, hospitalizations and deaths leading to additional government imposed restrictions; refusals to receive the vaccine along with concerns related to new strains of the virus; supply chain issues remaining unresolved longer than anticipated; labor shortages and wage increases continuing to impact many industries; consumer confidence and spending falls; and rising geopolitical tensions.
Nonperforming loans increased by $21.6 million to $44.7 million at December 31, 2021, from $23.0 million at December 31, 2020. Nonperforming assets, which includes nonperforming loans plus other real estate owned, totaled $47.0 million as of December 31, 2021, compared to $25.5 million as of December 31, 2020. Purchased credit deteriorated loans, or PCD loans, are purchased loans that, as of the date of acquisition, the Company determined had experienced a more-than-insignificant deterioration in credit quality since origination. Credit metrics, excluding the impact of the West Suburban acquisition, continued to be relatively stable regarding nonperforming loan levels, and management is carefully monitoring loans considered to be in a classified status. Nonperforming loans as a percent of total loans increased to 1.2% as of December 31, 2021, from 1.1% as of December 31, 2020, and 0.8% December 31, 2019. The distribution of our nonperforming loans is shown in the following table.
Risk Elements
The following table sets forth the amounts of nonperforming assets at December 31 for the years indicated:
| | | | | | | | | | |
(Dollars in thousands) | | 2021 | | 2020 | | 2019 | |
Nonaccrual loans | | $ | 41,531 | | $ | 22,280 | | $ | 12,432 | |
Performing troubled debt restructured loans accruing interest | | | 25 | | | 331 | | | 872 | |
Loans past due 90 days or more and still accruing interest | | | 3,110 | | | 434 | | | 2,545 | |
Total nonperforming loans | | | 44,666 | | | 23,045 | | | 15,849 | |
Other real estate owned | | | 2,356 | | | 2,474 | | | 5,004 | |
Total nonperforming assets | | $ | 47,022 | | $ | 25,519 | | $ | 20,853 | |
| | | | | | | | | | |
PCI loans, net of purchase accounting adjustments (applicable for December 31, 2019 only) 1 | | $ | - | | $ | - | | $ | 8,601 | |
| | | | | | | | | | |
Other real estate owned ("OREO") as % of nonperforming assets (and excluding PCI loans for December 31, 2019 only) | | | 5.0 | % | | 9.7 | % | | 24.0 | % |
| 1 | In 2020, due to the adoption of CECL, PCD loans (formerly PCI loans) are now included in total nonperforming assets, if their risk rating at period end so indicates. For the period ended December 31, 2019, PCI loans were not included within total nonperforming assets since we were accreting interest income over the expected life of the loan. |
Accrual of interest is discontinued on a loan when principal or interest is 90 days or more past due, unless the loan is well secured and in the process of collection. When a loan is placed on nonaccrual status, interest previously accrued but not collected in the current period is reversed against current period interest income. Interest income of approximately $280,000, $70,000 and $347,000 was $17.5recorded and collected during 2021, 2020 and 2019, respectively, on loans that subsequently went to nonaccrual status by year-end. Interest income, which would have been recognized during 2021, 2020 and 2019, had these loans been on an accrual basis throughout the year, was approximately $1.6 million, $461,000 and $1.3 million, respectively. There were approximately $5.1 million and $1.3 million in restructured residential mortgage loans that were still accruing interest based upon their prior performance history at December 31, 2021 and 2020, respectively. Additionally, the nonaccrual loans above include $3.7 million and $2.7 million in restructured loans for the years ending December 31, 2021 and 2020.
Total past due loans, including accruing and nonaccrual loans, totaled $27.3 million at year-end 2017, as2021, a $4.4 million increase from year end 2020, resulting in the rate of past due loans to total loans decreasing to 0.8% at year-end 2021 compared to $16.21.13% at year-end 2020, and 1.33% at year-end 2019. Refer to Note 4, “Loans”, in our consolidated financial statements, below, for further detail of past due loans by classification for 2021 and 2020.
Classified Assets
| | | | | | | | | | | | |
| Classified assets as of December 31, | | Percent Change From |
(Dollars in thousands) | 2021 | | 2020 | | 2019 | | 2021-2020 | | 2020-2019 |
Commercial | $ | 32,712 | | $ | 2,679 | | $ | 11,688 | | N/M | | (77.1) |
Leases | | 3,754 | | | 3,222 | | | 329 | | 16.5 | | 879.3 |
Commercial real estate - Investor | | 10,667 | | | 5,117 | | | 4,926 | | 108.5 | | 3.9 |
Commercial real estate - Owner occupied | | 15,429 | | | 11,187 | | | 7,956 | | 37.9 | | 40.6 |
Construction | | 2,104 | | | 5,192 | | | 262 | | (59.5) | | N/M |
Residential real estate - Investor | | 1,265 | | | 1,516 | | | 1,390 | | (16.6) | | 9.1 |
Residential real estate - Owner occupied | | 5,099 | | | 4,040 | | | 3,631 | | 26.2 | | 11.3 |
Multifamily | | 2,278 | | | 7,558 | | | 503 | | (69.9) | | N/M |
HELOC | | 1,243 | | | 1,540 | | | 1,789 | | (19.3) | | (13.9) |
HELOC - Purchased | | 180 | | | - | | | 180 | | N/M | | (100.0) |
Other(1) | | 10 | | | 4 | | | 359 | | 150.0 | | (98.9) |
Total classified loans (excluding PCI loans for December 31, 2019 only)2 | | 74,741 | | | 42,055 | | | 33,013 | | 77.7 | | 27.4 |
Other real estate owned | | 2,356 | | | 2,474 | | | 5,004 | | (4.8) | | (50.6) |
Total classified assets, excluding PCI loans2 | | 77,097 | | | 44,529 | | | 38,017 | | 73.1 | | 17.1 |
PCI, net of purchase accounting adjustments2 | | - | | | - | | | 8,601 | | - | | (100.0) |
Total classified assets | $ | 77,097 | | $ | 44,529 | | $ | 46,618 | | 73.1 | | (4.5) |
| | | | | | | | | | | | |
N/M - Not meaningful
1The “Other” class includes consumer loans and overdrafts.
2 In 2020, due to the adoption of CECL, PCD loans (formerly PCI loans) are now included in total classified loans, if their risk rating at period end so indicates. For the period ended December 31, 2019, PCI loans were not included within total classified loans since we were accreting interest income over the expected life of the loan.
Classified loans include nonaccrual, performing troubled debt restructurings and all other loans considered substandard. Classified assets include both classified loans and OREO. Loans classified as substandard are inadequately protected by either the current net worth and ability to meet payment obligations of the obligor, or by the collateral pledged to secure the loan, if any. These loans have a well-defined weakness or weaknesses that jeopardize the liquidation of the debt and carry the distinct possibility that we will sustain some loss if deficiencies remain uncorrected.
Total classified loans increased in 2021 compared to 2020, but decreased in 2020 compared to 2019. The increase in classified loans in 2021 was primarily attributable to our acquisition of West Suburban. Total classified assets increased in 2021 compared to both 2020 and 2019. Classified assets, which includes classified loans and OREO, was favorably impacted by a $118,000 decrease in our OREO portfolio, in 2021 from 2020, and a $2.5 million decrease in our OREO portfolio in 2020 from 2019. Management monitors a metric of classified assets to the sum of Bank Tier 1 capital and the ACL, which is referred to as the “classified assets ratio.” Our classified assets ratio increased to 14.97% at December 31, 2021, compared to 12.64% at December 31, 2020, from 11.11% at December 31, 2019.
Potential Problem Loans
We utilize an internal asset classification system as a means of reporting problem and potential problem assets. At the scheduled board of directors meetings of the Bank, loan listings are presented, which show significant loan relationships listed as “Special Mention,” “Substandard,” and “Doubtful.” Loans classified as Substandard include those that have a well-defined weakness or weaknesses that jeopardize the liquidation of the debt. They are characterized by the distinct possibility that we will sustain some loss if the deficiencies are not corrected. Assets classified as Doubtful have all the weaknesses inherent as those classified Substandard with the added characteristic that the weaknesses make collection or liquidation in full, on the basis of currently existing facts, conditions and values, highly questionable and improbable. Assets that do not currently expose us to sufficient risk to warrant classification in one of the aforementioned categories, but possess weaknesses that deserve management’s close attention, are deemed to be Special Mention.
Management defines potential problem loans as performing loans rated Substandard that do not meet the definition of a nonperforming loan. These potential problem loans carry a higher probability of default and require additional attention by management. A more detailed description of these loans can be found in Note 5 to the Consolidated Financial Statements, as listed in the credit quality indicators discussion.
Allowance for Credit Losses
On January 1, 2020, we began calculating our ACL using the CECL methodology, rather than the incurred losses methodology. Upon adoption of CECL on January 1, 2020, (Day One), we recognized an increase in our ACL on outstanding loans of $5.9 million and an increase in our ACL on unfunded commitments of $1.7 million as a cumulative effect adjustment from change in accounting policies. Approximately $2.5 million of the increase to the ACL resulted from the transfer of the non-accretable purchase accounting adjustments on PCD loans. The Day One adjusting entries resulted in a $3.8 million reduction to retained earnings, and a deferred tax asset adjustment of $1.4 million.
At December 31, 2021, the ACL on loans totaled $44.3 million, and the ACL on unfunded commitments, included in other liabilities, totaled $6.2 million, compared to the ACL on loans of $33.9 million and ACL on unfunded commitments of $3.0 million at year-end 2016December 31, 2020. The increase was primarily related to our West Suburban acquisition and 2015. associated allowance attributable to the acquired loans and unfunded lending commitments, partially offset by the improvement in the forecasted macroeconomic conditions.
One measure of the adequacy of the ALLLACL is the ratio of the allowanceACL on loans to total loans. The ALLLACL as a percentage of total loans was 1.1%1.3% as of December 31, 20172021 and 2016 and 1.4% at year-end 2015.1.7% as of December 31, 2020. In management’s judgment, an adequate allowance for estimated losses has been established; however, there can be no assurance that losses will not exceed the estimated amounts in the future. Excluding
The increase in the balancesACL during 2020 was driven by forecast assumptions due to the COVID-19 pandemic, primarily related to unemployment and GDP expectations over the remaining life of the loans, as well as the following:
| ● | An initial forecast period of one year for all portfolio segments and off-balance-sheet credit exposures. This period reflects management’s expectation of losses based on forward-looking economic scenarios over that time. |
| ● | A historical reversion loss forecast period covering the remaining contractual life, adjusted for prepayments, by portfolio segment based on the historical loss rate of loans within those segments. |
| ● | The initial loss forecast period and historical reversion loss rate is based on economic conditions at the measurement date. |
| ● | We primarily utilized the static pool and migration analysis methods to estimate credit losses. Such methods would obtain estimated life-time credit losses using the conceptual components described above. |
See Note 1 – Basis of Presentation and Changes in Significant Accounting Policies in the accompanying notes to the consolidated financial statements in this annual report for discussion of our ACL methodology on loans.
The provision for credit losses, which includes a provision for losses on unfunded commitments, is a charge to earnings to maintain the ACL at a level consistent with management’s assessment of expected losses over the expected life of the loan portfolio as well as considering changes in macroeconomic conditions.
During 2021, we recorded a $9.4 million release of provision for credit losses expense on loans, a $12.2 Day Two non-PCD credit mark for estimated lifetime credit losses on West Suburban acquired fromloans, and a $1.5 million provision for credit losses on unfunded commitments, compared to $9.2 million of provision for credit losses on loans and $1.2 million of provision for credit losses on unfunded commitments for 2020.The provision for credit losses in 2020 was due to the Talmer branch purchase,COVID-19 pandemic and market interest rate reductions, as our assumptions under the newly adopted CECL methodology, which require a provision based on expected credit losses over the life of the loans.
Summary of Loan Loss Experience
The following table summarizes, for the years indicated, activity in the ACL, including amounts charged-off, amounts of recoveries, additions to the allowance charged to operating expense, and the ratio of allowancenet charge-offs to loans outstanding:
Analysis of Allowance for Credit Losses
| | | | | | | | | | | |
(Dollars in thousands) | | 2021 | | 2020 | | 2019 | | |
Total Outstanding loans (exclusive of loans held-for-sale) | | $ | 3,421,948 | | $ | 2,034,851 | | $ | 1,930,812 | | |
Allowance at beginning of year | | | 33,855 | | | 19,789 | | | 19,006 | | |
Charge-offs: | | | | | | | | | | | |
Commercial | | | 963 | | | 39 | | | 109 | | |
Leases | | | 69 | | | 206 | | | 49 | | |
Commercial real estate - Investor | | | 2,724 | | | 512 | | | 303 | | |
Commercial real estate - Owner occupied | | | 1,797 | | | 1,763 | | | 716 | | |
Construction | | | - | | | 60 | | | 9 | | |
Real estate - Investor | | | - | | | 8 | | | 7 | | |
Real estate - Owner occupied | | | - | | | 43 | | | 111 | | |
Multifamily | | | 183 | | | - | | | - | | |
HELOC | | | 17 | | | 127 | | | 109 | | |
HELOC - Purchased | | | - | | | 66 | | | 229 | | |
Other1 | | | 180 | | | 244 | | | 409 | | |
Total charge-offs | | | 5,933 | | | 3,068 | | | 2,051 | | |
Recoveries: | | | | | | | | | | | |
Commercial | | | 352 | | | 56 | | | 74 | | |
Leases | | | - | | | 98 | | | - | | |
Commercial real estate - Investor | | | 78 | | | 165 | | | 679 | | |
Commercial real estate - Owner occupied | | | 235 | | | 697 | | | 5 | | |
Construction | | | - | | | 172 | | | 1 | | |
Real estate - Investor | | | 291 | | | 57 | | | 11 | | |
Real estate - Owner occupied | | | 158 | | | 287 | | | 77 | | |
Multifamily | | | - | | | - | | | 15 | | |
HELOC | | | 234 | | | 387 | | | 172 | | |
HELOC - Purchased | | | - | | | - | | | - | | |
Other1 | | | 141 | | | 170 | | | 200 | | |
Total recoveries | | | 1,489 | | | 2,089 | | | 1,234 | | |
Net charge-offs / (recoveries) | | | 4,444 | | | 979 | | | 817 | | |
Adoption of ASU 326 | | | - | | | 5,879 | | | - | | |
Day 1 PCD credit evaluation | | | 12,075 | | | - | | | - | | |
Provision for credit losses on loans | | | 2,795 | | | 9,166 | | | 1,600 | | |
Allowance at end of year | | $ | 44,281 | | $ | 33,855 | | $ | 19,789 | | |
| | | | | | | | | | | |
Net charge-offs / (recoveries) to total loans outstanding | | | 0.1 | % | | 0.0 | % | | 0.0 | % | |
ACL on loans at year end to total loans outstanding | | | 1.3 | % | | 1.7 | % | | 1.0 | % | |
Nonaccrual loans to total loans outstanding | | | 1.2 | % | | 1.1 | % | | 0.6 | % | |
ACL on loans at year end to nonaccrual loans | | | 106.6 | % | | 152.0 | % | | 159.2 | % | |
1The “Other” class includes consumer loans and overdrafts.
The following table summarizes, for the years indicated, net charge-offs per loan class and the percentage of total average loans asper class:
| | | | | | | | | | | | | | |
| | | % of Total | | | | % of Total | | | | % of Total |
| | | | Average | | | | | Average | | | | | Average |
| | | | Loans Per | | | | | Loans Per | | | | | Loans Per |
| 2021 | | Class | | 2020 | | Class | | 2019 | | Class |
Commercial | $ | 611 | | 0.1 | | $ | (17) | | (0.0) | | $ | 35 | | 0.0 |
Leases | | 69 | | 0.1 | | | 108 | | 0.1 | | | 49 | | 0.0 |
Commercial real estate - Investor | | 2,646 | | 0.5 | | | 347 | | 0.1 | | | (376) | | (0.1) |
Commercial real estate - Owner occupied | | 1,562 | | 0.5 | | | 1,066 | | 0.3 | | | 711 | | 0.2 |
Construction | | - | | - | | | (112) | | (0.1) | | | 8 | | 0.0 |
Residential real estate - Investor | | (291) | | (0.7) | | | (49) | | (0.1) | | | (4) | | (0.0) |
Residential real estate - Owner occupied | | (158) | | (0.1) | | | (244) | | (0.2) | | | 34 | | 0.0 |
Multifamily | | 183 | | 0.1 | | | - | | - | | | (15) | | (0.0) |
HELOC | | (217) | | (0.3) | | | (260) | | (0.3) | | | (63) | | (0.1) |
HELOC - Purchased | | - | | - | | | 66 | | 0.3 | | | 229 | | 0.7 |
Other 1 | | 39 | | 0.3 | | | 74 | | 0.9 | | | 209 | | 1.7 |
Net charge-offs | $ | 4,444 | | 0.2 | | $ | 979 | | 0.0 | | $ | 817 | | 0.0 |
1The “Other” class includes consumer loans and overdrafts.
The provision for credit losses on loans is based upon management’s estimate of year-end 2017 was 1.13%. The loans acquiredfuture expected credit losses in the Talmer branch purchase are carried at contractual loan values lessand lease portfolio and its evaluation of the adequacy of the ACL. Our provision for credit losses in 2021 totaled $4.3 million, compared to $10.4 million in 2020, and $1.6 million recorded in 2019. Net charge-offs recorded in 2021 totaled $4.4 million, compared to net charge-offs of $979,000 recorded in 2020, and net charge-offs of $817,000 in 2019. The increase of net charge offs in 2021 was primarily due to the acquisition and a fair market value adjustment$2.2 million charge off on a commercial real estate-investor loan. Our ACL on loans to average loans was 2.16% as of date of acquisition. As of December 31, 2017, this acquisition adjustment totaled $835,000.
Management remains cautious about the continued recovery in the local2021, compared to 1.68% at both December 31, 2020 and overall economic environment. Furthermore, the sustained difficulties in the commercial and investor real estate sector, while showing signs of improvement, could continue to adversely affect collateral values. These events may adversely affect cash flows generally for both commercial and individual borrowers. While we believe portfolio stability has taken hold, the Company could experience undesirable levels of problem assets, delinquencies, and losses on loans in future periods if economic recession or politically triggered economic instability develops.
Asset Quality
Nonperforming loans consist of nonaccrual loans, performing restructured accruing loans and loans 90 days or more past due but still accruing. Management believes recovery in the overall commercial real estate segment is evident but could be stifled by macroeconomic events. Negative changes in the economy could increase the Company’s nonperforming loans. Total nonperforming loans were $15.6 million1.04% at December 31, 2017, a modest decrease from $16.0 million at December 31, 2016. In addition, total classified assets experienced significant reductions in the last few years, reflecting the improved economy and the Company’s continued diligent remediation efforts.2019.
The Company had net charge-offs of $497,000 in 2017, $815,000 in 2016 and $1,014,000 in 2015.
The following table shows classified assetsour allocation of the ACL by segmentloan type at December 31 for the following periods.years indicated, and, for each category of loans, the percent of total loans represented by that category:
| | | | | | | | | | | | |
(in thousands) | Classified assets as of December 31, | | Percent Change From |
| 2017 | | 2016 | | 2015 | | 2017-2016 | | 2016-2015 |
Commercial | $ | - | | $ | 2,527 | | $ | 2,029 | | N/M | | 24.5 |
Leases | | 825 | | | 1,109 | | | - | | (25.6) | | N/M |
Real estate - commercial, nonfarm | | 7,262 | | | 9,946 | | | 10,568 | | (27.0) | | (5.9) |
Real estate - commercial, farm | | 2,486 | | | 1,782 | | | 1,272 | | 39.5 | | 40.1 |
Real estate - construction | | 376 | | | 458 | | | 83 | | (17.9) | | 451.8 |
Real estate - residential: | | | | | | | | | | | | |
Investor | | 448 | | | 1,096 | | | 1,136 | | (59.1) | | (3.5) |
Multifamily | | 4,723 | | | - | | | - | | N/M | | N/M |
Owner occupied | | 5,266 | | | 7,225 | | | 7,079 | | (27.1) | | 2.1 |
Revolving and junior liens | | 1,899 | | | 2,340 | | | 3,055 | | (18.8) | | (23.4) |
Other | | 20 | | | 1 | | | 1 | | N/M | | - |
Total classified loans | | 23,305 | | | 26,484 | | | 25,223 | | (12.0) | | 5.0 |
Other real estate owned | | 8,371 | | | 11,916 | | | 19,141 | | (29.7) | | (37.7) |
Total classified assets | $ | 31,676 | | $ | 38,400 | | $ | 44,364 | | (17.5) | | (13.4) |
Allocation of the Allowance for Credit Losses
| | | | | | | | | | | | | | | | |
| | 2021 | | 2020 | | 2019 | |
| | | | | % of Loans | | | | | % of Loans | | | | | % of Loans | |
| | | | | in Each | | | | | in Each | | | | | in Each | |
| | | | | Category to | | | | | Category to | | | | | Category to | |
(Dollars in thousands) | | Amount | | Total Loans | | Amount | | Total Loans | | Amount | | Total Loans | |
Commercial | | $ | 11,751 | | 22.5 | | $ | 2,812 | | 20.0 | | $ | 3,015 | | 17.2 | |
Leases | | | 3,480 | | 5.2 | | | 3,888 | | 7.0 | | | 1,262 | | 6.2 | |
Commercial real estate - Investor | | | 13,093 | | 28.0 | | | 9,205 | | 28.6 | | | 6,218 | | 26.9 | |
Commercial real estate - Owner occupied | | | 2,615 | | 16.8 | | | 2,251 | | 16.4 | | | 3,678 | | 17.9 | |
Construction | | | 3,373 | | 6.0 | | | 4,054 | | 4.8 | | | 513 | | 3.6 | |
Real estate - Investor | | | 760 | | 1.9 | | | 1,740 | | 2.8 | | | 601 | | 3.7 | |
Real estate - Owner occupied | | | 2,832 | | 6.2 | | | 2,714 | | 5.7 | | | 1,257 | | 7.0 | |
Multifamily | | | 3,675 | | 9.0 | | | 3,625 | | 9.3 | | | 1,444 | | 9.8 | |
HELOC | | | 2,379 | | 3.4 | | | 1,749 | | 4.0 | | | 1,161 | | 4.7 | |
HELOC - Purchased | | | 131 | | 0.3 | | | 199 | | 1.0 | | | - | | 1.6 | |
Other1 | | | 192 | | 0.7 | | | 1,618 | | 0.4 | | | 640 | | 1.4 | |
Total | | $ | 44,281 | | 100.0 | | $ | 33,855 | | 100.0 | | $ | 19,789 | | 100.0 | |
N/M - Not meaningful1The “Other” class includes consumer loans, overdrafts and the unallocated allowance balance for each year presented.
Allocations of the allowance may be made for specific loans, but the entire allowance is available for losses in the loan portfolio. In addition, the OCC, as part of their examination process, periodically reviews the ACL. Regulators can require management to record adjustments to the allowance level based upon their assessment of the information available to them at the time of examination. The OCC, in conjunction with the other federal banking agencies, has adopted an interagency policy statement on the ACL. The policy statement provides guidance for financial institutions on both the responsibilities of management for the assessment and establishment of adequate allowances and guidance for banking agency examiners to use in determining the adequacy of general valuation guidelines. Generally, the policy statement recommends that (1) institutions have effective systems and controls to identify, monitor and address asset quality problems; (2) management has analyzed all significant factors that affect the collectability of the portfolio in a reasonable manner; and (3) management has established acceptable allowance evaluation processes that meet the objectives set forth in the policy statement. Management believes it has established an adequate estimated allowance for expected credit losses over the
estimated life of our loan portfolio. Management reviews its process quarterly using an extensive and detailed loan review process, makes changes as needed, and reports those results at meetings of our Board of Directors and Audit Committee.
Classified loans include nonaccrual, performing troubled debt restructurings and all other loans considered substandard. Classified assets include both classified loans and OREO. Total classified loans and total classified assets both declined in 2017 from 2016. Classified loans decreased primarily dueAlthough management believes the ACL is sufficient to reductions incover expected losses over the estimated life of our commercial and real estate – commercial, nonfarm portfolios, while classified assets, which includes classified loans and OREO, decreased as our OREOloan portfolio, decreased $3.5 million in 2017 from 2016. Management monitors a ratio of classified assets to the sum of Bank Tier 1 capital andthere can be no assurance that the allowance forwill prove sufficient to cover actual loan and lease losses which is referred to as the “classified assets ratio.” Our classified assets ratio decreased to 11.87% at December 31, 2017, from 16.18% at December 31, 2016, and 20.31% at December 31, 2015, reflecting overall improvementor that regulators, in loan related asset quality.
Other positive trends included continued stability within nonaccrual loan levels and total past due loans in 2017, compared to 2016. Nonaccrual loans totaled $14.4 million at December 31, 2017, a decrease of $900,000 from year end 2016. Nonaccrual loans totaled $15.3 million at December 31, 2016, an increase of $900,000 from year end 2015. Total past due loans, including accruing and nonaccrual loans, totaled $15.5 million at year end 2017, a $900,000 decrease from year end 2016; the rate of past dues to total loans decreased to 0.96% at year-end 2017 from 1.11% at both year-end 2016 and 2015.
Allowance for Loan and Lease Losses
The Company’s ALLL methodology is designed to produce reasonable estimates of loan and lease losses as of the financial statement date(s) and incorporates management’s judgments about the credit quality ofreviewing the loan portfolio, throughwould not request us to materially adjust our ACL at the time of their examination. Continued loan growth in future periods, a disciplineddecline in our current level of recoveries, or an increase in charge-offs could result in an increase in provision expense. Additionally, with the adoption of CECL, provision expense may be more volatile due to changes in CECL model assumptions of credit quality, macroeconomic factors and consistently applied methodology. The methodology follows GAAP including, but not limited to, guidance included in Accounting Standards Codification (“ASC”) 310conditions, and ASC 450. Analysis is prepared in accordance with guidelines established byloan composition, which drive the SEC, the Federal Financial Institutions Examination Council, the American Institute of Certified Public Accountants Audit and Accounting Guide for Depository and Lending Institutions, and banking industry practices. The total ALLL was $17.5 million as of December 31, 2017.
In accordance with accounting guidance for business combinations, there was no allowance for loan or leasecredit losses brought forward on any purchased non-credit impaired loans in our Talmer branch acquisition, as we adjusted the unpaid principal balance of such loans to reflect credit discounts representing the principal losses expected over the life of the loans which was a component of the initial fair value. All of the loans we acquired in our Talmer branch acquisition were purchased non-credit impaired loans, and these loans totaled $145.6 million at December 31, 2017. After the acquisition date, the method used to evaluate the sufficiency of the credit discount is similar to the method the Company uses for originated loans, and if necessary, the Company recognizes additional reserves in the ALLL. The total ALLL as of December 31, 2017, includes a $750,000 reserve for loans recorded in our 2016 Talmer branch acquisition. Of the $2.8 million purchase accounting valuation discount recorded in our 2016 Talmer branch acquisition, the remaining total discount is $835,000, $527,000 of which is attributable to the remaining Day One credit mark on this portfolio. Any future charge-offs will be taken first against this credit mark discount. As of December 31, 2017, no charge-offs have been recorded on this acquired portfolio.balance.
The ALLL consists of three components: (i) specific allocations established for losses resulting from an analysis developed through reviews of individual impaired loans for which the recorded investment in the loan exceeds the measured value of the loan; (ii) reserves based on historical loss experience for each loan category; and (iii) reserves based on general current economic conditions as well as specific economic and other factors believed to be relevant to the Company’s loan portfolio. The components of the ALLL represent an estimation performed pursuant to ASC Topic 450, “Contingencies”, and ASC Topic 310, “Receivables” including “Accounting by Creditors for Impairment of a Loan – Income Recognition and Disclosures.” See Note 1 of the consolidated financial statements, “Summary of Significant Accounting Policies” for further detail.
The historical loss experience component is based on actual loss experience for a rolling 20-quarter period and the related internal risk rating and category of loans charged-off, including any charge-offs on TDRs. The loss migration analysis is performed quarterly, and the loss factors are updated based on actual experience.
Management takes into consideration many internal and external qualitative factors when estimating the additional adjustment for management factors, including:
| ·
| | Changes in the composition of the loan portfolio, trends in the volume and terms of loans, and trends in delinquent and nonaccrual loans that could indicate that historical trends do not reflect current conditions.
|
| ·
| | Changes in credit policies and procedures, such as underwriting standards and collection, charge-off, and recovery practices.
|
| ·
| | Changes in the experience, ability, and depth of credit management and other relevant staff.
|
| ·
| | Changes in the quality of the Company’s loan review system and board of directors’ oversight.
|
| ·
| | Changes in the value of the underlying collateral for collateral-dependent loans.
|
| ·
| | Changes in the national and local economy that affect the collectability of various segments of the portfolio.
|
| ·
| | Changes in other external factors, such as competition and legal or regulatory requirements are considered when determining the level of estimated loss in various segments of the portfolio.
|
Management conducts an annual review of all Home Equity Lines of Credit (“HELOC”) by looking at credit scores. When the Company is notified of a foreclosure on a first mortgage, the HELOC loan is moved to nonaccrual and a decision is made if the loan is collectible. Loan balances are actively charged-off in the absence of sufficient equity unless the borrower reaffirms or notifies us of an intention to reaffirm.
The analysis of these factors involves a high degree of judgment by management. Because of the imprecision surrounding these factors, the Company estimates a range of inherent losses and maintains a general allowance that is not allocated to a specific category. As of December 31, 2017, the unallocated allowance increased to $542,000, from the unallocated balance of $435,000 as of December 31, 2016. Changes in the ALLL are detailed in Note 6 on the consolidated financial statements of this annual report.
The ALLL methodology is periodically reviewed by the Company’s independent accountants and banking regulators, and select methodology changes were made in 2017 and 2016.
In 2016, the Company significantly refined its ALLL methodology to further stratify the loan portfolio and apply unique factors to each segment. The changes implemented in 2016 segregate the total loan portfolio into further detail, moving from seven loan classifications to nine when applying management risk factors, and from four loan classifications to nine when applying historical loss rates. The Company also enhanced the prior process of applying management risk factors for changes in loans portfolio trends, such as factors for changes in the trend or volume of past due and classified loans, changes in the nature and volume of the portfolio and concentrations, changes in lending policy, procedures, management and staffing, and other external factors. These factors were historically analyzed in the aggregate to arrive at one risk factor per loan classification; under the revised methodology, the Company assigns each of these components its own risk factor, as well as encompasses an additional risk rating for loans rated as pass/watch.
The Company continued to refine its ALLL methodology in 2017, with implementation of additional management factor classifications for new loan types offered, such as the Company’s recent purchase of home equity lines of credit (“HELOCs”) and the recently expanded business development company loan portfolio, as these new offerings have not been outstanding long enough to be sufficiently seasoned and may pose more risk. In addition, the Company revised the risk weightings for the historical loss factors to reflect a five basis point increase to the loss factor applied in the earliest quarter, and a reduction of five basis points in the most recent quarter, as management believes the lower charge-off levels experienced in the more recent quarters will likely not continue long-term.
These modifications to the Company’s ALLL methodology are intended to more accurately reflect all portfolio risk, and resulted in a decrease to the overall unallocated component of the allowance over the past two years. The unallocated component of the allowance was $542,000 as of December 31, 2017, compared to $435,000 as of December 31, 2016, and $2.0 million as of December 31, 2015.
The coverage ratio of the ALLL to nonperforming loans was 111.8% as of December 31, 2017, which reflects an increase from 101.0% as of December 31, 2016. A modest decrease of $400,000, or 2.4%, in nonperforming loans in 2017 was more than offset by the increase in the ALLL, which drove the overall coverage ratio change. Following established methodology, management updated the estimated specific allocations each quarter after receiving more recent appraisal valuations or information on cash flow trends related to the impaired credits. Allocations for general risk and management factors increased by $2.6 million from December 31, 2017 while the overall loan balances subject to allowance increased by approximately $139.3 million at December 31, 2017. Management determined the estimated amount to include in the ALLL based upon a number of factors, including an evaluation of credit market circumstances, loan growth or contraction, the quality and composition of the loan portfolio and loan loss experience, .
Management reviews the performance of the management risk factors including higher risk loan pools rated as special mention and problem loans, and adjusts the population and the related loss factors taking into account adverse market trends including collateral valuation as well as its assessments of the credits in that pool. Changes are identified in the Company’s comprehensive loan review process and made in the related risk factors when needed with a formal affirmation at each quarter end. Those assessments capture management’s estimate of the potential for adverse migration to an impaired status as well as its estimation of what potential valuation impact would result from that migration. Management has also observed that many stresses in those credits were generally attributable to cyclical economic events that continued to show some signs of stabilization in 2017.
The above changes in estimates were made by management to be consistent with observable trends on asset quality within loan portfolio segments (as discussed in the “Asset Quality” section above) and in conjunction with market conditions and credit review administration activities. Several environmental factors are also evaluated monthly, when appropriate, with formal affirmation each quarter end and are included in the assessment of the adequacy of the ALLL. Further, significant improvement was seen in net charge-offs from year-end 2015 through 2017. Net charge-offs of $815,000 in 2016 declined by 39.0% to $497,000 in 2017. Nonperforming loans of $16.0 million at year-end 2016 decreased 2.4% to $15.6 million at December 31, 2017. Based on these quarterly assessments, management determined that, excluding the impact of the West Suburban acquisition and related Day Two ACL adjustment for non-PCD loans acquired, a $9.4 million release of provision for loancredit losses expense on loans was required for 2021, and lease losses of $1.8a $9.2 million and $750,000 were$1.6 million provision for credit losses was required for 20172020 and 2016,2019, respectively. When measured as a percentage of average loans outstanding, the total ALLL decreasedACL increased from 1.3%1.0% of total loans as of December 31, 2016,2019, to 1.1%1.7% of total loans at December 31, 2017. In management’s judgment, an adequate allowance for estimated losses has been established for potential incurred losses2020, and increased to 2.2% of total loans at December 31, 2017; however, there can be2021.
The provision for credit losses on unfunded commitments totaled $1.6 million in 2021, and the allowance for unfunded commitments totaled $4.5 million as of December 31, 2021. Management reviewed the securities portfolio for credit loss exposure, and determined that no assurance that actualallowance for credit losses will not exceedon securities was required for 2021. See Note 4 to the estimated amounts inconsolidated financial statements for more detail on the future.ACL for securities analysis performed.
Other Real Estate Owned
Other real estate owned (“OREO”) decreased to $8.4$2.4 million as of December 31, 2017,2021, compared to $2.5 million as of December 31, 2020, reflecting a $3.5$118,000 decline. In the fourth quarter of 2021, we acquired three OREO properties in our acquisition of West Suburban, with a total fair value of $5.6 million, decline from $11.9 million at year end 2016.and we sold two of these properties in December, which had a net book value of $5.2 million. Of the 35ten properties we held as of year-end 2017,2021, the largest net book value property was a vacant commercialcomprised of one industrial zoned property carried at $1.8 million.$549,000. Reductions in theour OREO balance during 2017 include2021 included the sale of three commercialsix properties which were transferred into OREO from premises totaling $1.1resulting in proceeds of $5.8 million. Net gains on the sale of 29 OREO properties during 20172021 totaled $474,000.$41,000, compared to net gains on sale of $204,000 in 2020 and $264,000 in 2019. The trend of year over year reductions in valuation adjustments continued but at decreasing levels in 20152019 through 2017.2021.
| | | | | | | | | | | | |
(in thousands) | OREO Properties by Type as of December 31, | | Percent Change From | |
| | 2017 | | | 2016 | | | 2015 | | 2017-2016 | | 2016-2015 | |
| | | | | | | | | | | |
| | OREO Properties by Type as of December 31, | | Percent Change From |
(Dollars in thousands) | | | 2021 | | | 2020 | | | 2019 | | 2021-2020 | | 2020-2019 |
Single family residence | $ | 900 | | $ | 225 | | $ | 2,334 | | 300.0 | | (90.4) | $ | 645 | | $ | 430 | | $ | 174 | | 50.0 | | 147.3 |
Lots (single family and commercial) | | 5,329 | | | 7,322 | | 10,042 | | (27.2) | | (27.1) | | 1,411 | | | 1,387 | | | 3,945 | | 1.7 | | (64.8) |
Vacant land | | 479 | | | 636 | | 2,104 | | (24.7) | | (69.8) | | 300 | | 352 | | 41 | | (14.8) | | 758.5 |
Multi-family | | - | | | 264 | | 314 | | (100.0) | | (15.9) | |
Commercial property | | 1,663 | | | 3,469 | | | 4,347 | | (52.1) | | (20.2) | | - | | | 305 | | | 844 | | (100.0) | | (63.8) |
Total OREO properties | $ | 8,371 | | $ | 11,916 | | $ | 19,141 | | (29.7) | | (37.7) | $ | 2,356 | | $ | 2,474 | | $ | 5,004 | | (4.8) | | (50.6) |
RealOther real estate assets acquired in settlement of loans are recorded at the fair value of the property when acquired, less estimated costs to sell, establishing a new cost basis. The OREO valuation reserve for the year ended 2017 at $8.22021 was $1.2 million, which was 49.5%33.3% of gross OREO, at year-end 2017.2021. This compares to $10.0$1.6 million, or 45.6%39.9%, of gross OREO, net of participations, at year-end 2016.2020.
Deposits & Borrowings
Deposits
The Company
We grew total deposits by $56.1 million,$2.93 billion, or 3.0%115.5%, to a total of $1.92$5.47 billion at year end 2017year-end 2021, compared to year end 2016. A reduced level of time or certificates of deposits was reflected in 2017 as higher yielding certificates matured in the current lower rate environment. This reduction was offset by larger increases in transactional commercial demand, money market and savings account balances. Growth in the commercial loan portfolio stimulated growth in commercial deposit accountsyear-end 2020, primarily due to the treasury management services offered. Deposits also increased in 2016 compared to 2015; one catalyst for this increase was the $48.9 million$2.69 billion of deposits acquired with the Talmer branchin our acquisition in late 2016. Excluding this acquisition, deposit growth was $58.8of West Suburban. Total deposits grew by $410.3 million, or 3.3%19.3%, to a total of $2.54 billion at year-end 2020 compared to year-end 2019. We had no brokered certificates of deposit as of December 31, 2021 or December 31, 2020.
Average Balances and Interest Rates
| | | | | | | | | | | | | | | | |
| | 2021 | | 2020 | | 2019 | |
| | Average | | Rate | | Average | | Rate | | Average | | Rate | |
(Dollars in thousands) | | Balance | | % | | Balance | | % | | Balance | | % | |
Noninterest bearing demand | | $ | 1,043,739 | | - | | $ | 832,180 | | - | | $ | 650,400 | | - | |
Interest bearing: | | | | | | | | | | | | | | | | |
NOW and money market | | | 939,859 | | 0.08 | | | 752,682 | | 0.14 | | | 721,773 | | 0.34 | |
Savings | | | 556,730 | | 0.04 | | | 363,331 | | 0.14 | | | 308,847 | | 0.16 | |
Time | | | 365,167 | | 0.41 | | | 424,831 | | 1.18 | | | 431,377 | | 1.56 | |
Total deposits | | $ | 2,905,495 | | | | $ | 2,373,024 | | | | $ | 2,112,397 | | | |
The following table sets forth the amounts and maturities of time deposits of $250,000 or more at December 31 of the year over year. indicated:
OtherMaturities of Time Deposits of $250,000 or More
| | | | | | |
(Dollars in thousands) | | 2021 | | 2020 |
3 months or less | | $ | 17,050 | | $ | 21,148 |
Over 3 months through 6 months | | | 10,698 | | | 7,059 |
Over 6 months through 12 months | | | 22,759 | | | 27,429 |
Over 12 months | | | 18,211 | | | 4,709 |
| | $ | 68,718 | | $ | 60,345 |
The following table reflects the portion of deposits accounts in U.S offices that exceed the FDIC insurance limit or similar deposit insurance regimes:
| | | | | | |
| | December 31, |
(Dollars in thousands) | | 2021 | | 2020 |
Uninsured deposits | | $ | 1,422,553 | | $ | 698,150 |
Borrowings
In addition to deposits, we used other liquidity sources were utilized for short-term funding needs of the Company,in 2021, such as other short-term borrowings with the FHLBC. The Company’s borrowings atrepurchase agreements. We also have contingency funding available from the FHLBC, requirewhich requires the Bank to be a member and invest in the stock of the FHLBC, and total borrowings are generally limited to the lower of 35% of total assets or 60% of the book value of certain mortgagemortgage-backed loans. The Company primarily usesWe have historically used these borrowings as a source of short-term funding, and borrowing levelsfunding; however, our excess liquidity on hand during 2021 allowed us to fund our short-term liquidity needs with the FHLBC increased by $45.0 million in 2017 compared to 2016, to end at $115.0 millioncash on hand. Our other short-term borrowings have no outstanding balances as of December 31, 2017.2021.
We recorded long-term FHLBC borrowings in our ABC Bank acquisition in April 2018 of $23.4 million, net of purchase accounting adjustments. These borrowings were issued at favorable rates compared to the overnight borrowing rate as of the date of ABC Bank acquisition, and matured over a seven year period. As of December 31, 2021, the balance of these borrowings consists of one remaining advance in long-term status which totaled $6.1 million and matures in February 2026. In addition, we have an unused line of credit of $20.0 million available with a third-party bank, which can be used for the Company’s operating needs at the holding company level. This line of credit renews every February and must be repaid within 360 days, if drawn. This line of credit has not been drawn upon since January 2019.
There were no other categories of short-term borrowings that had an average balance greater than 30% of our stockholders’ equity as of December 31, 2021, 2020 or 2019.
The average junior subordinated debentures included one issuance of trust preferred securities for 2021, but included two issuances of trust preferred securities by our subsidiaries, Old Second Capital Trust I (“Trust I”) which totaled $32.0 million as of December 31, 2019, and Old Second Capital Trust II (“Trust II”), which totaled $25.0 million as of December 31, 2019. On March 2, 2020, we redeemed all of the subordinated debentures due June 30, 2033, relating to the outstanding 7.80% cumulative trust preferred securities (the “Trust Securities”) issued by Trust I. Also on March 2, 2020, we redeemed all of the outstanding Trust Securities at a redemption price of $10.00 per Trust Security, which reflects 100% of the liquidation amount, plus accrued and unpaid distributions through the redemption date. In connection with the redemption, the Trust Securities were delisted from The NASDAQ Stock Market. See Note 10 to the consolidated financial statements Junior Subordinated Debentures for further discussion of the Capital Trusts I and II. The junior subordinated debentures outstanding at December 31, 2021 consists of $25.8 million of the Trust II issuance.
In the second quarter of 2021, we entered into Subordinated Note Purchase Agreements with certain qualified institutional buyers pursuant to which we sold and issued $60.0 million in aggregate principal amount of our 3.50% Fixed-to-Floating Rate Subordinated Notes due April 15, 2031 (the “Notes”). We sold the Notes to eligible purchasers in a private offering, and the proceeds of this issuance are intended to be used for general corporate purposes, which may include, without limitation, the redemption of existing senior debt, common stock repurchases and strategic acquisitions. The Notes bear interest at a fixed annual rate of 3.50% through April 14, 2026, payable semi-annually in arrears. As of April 15, 2026 forward, the interest rate on the Notes will generally reset quarterly to a rate equal to Three-Month Term SOFR (as defined by the Note) plus 273 basis points, payable quarterly in arrears. The Notes have a stated maturity of April 15, 2031, and are redeemable, in whole are in part, on April 15, 2026, or any interest payment date thereafter, and at any time upon the occurrence of certain events. As of December 31, 2021, we had $59.2 million of subordinated debentures outstanding, net of deferred issuance costs
In December 2016, we completed the Company completed a subordinated debt retirement and simultaneous senior debt offering. Subordinated debt of $45.0 million and $500,000 of seniorsubordinated debt outstanding were paid off with the proceeds of a $45.0 million senior notes issuance and cash on hand. The senior notes mature in ten years, and terms include interest payable semiannually at 5.75% for five years. Beginning December 31, 2021, the senior debt will pay interest at a floating rate, with interest payable quarterly at three month LIBOR plus 385 basis points. As of December 31, 2017, the company2021, we had $44.1$44.5 million of senior debt outstanding, net of deferred issuance costs.
At December 31, 2017, the Company was2021, we were in compliance with all of the financial covenants contained within the creditsenior debt agreement.
Capital
As of December 31, 2017,2021, we had total stockholders’ equity was $200.4of $502.0 million, which was an increase of $25.1$194.9 million, or 14.3%63.5%, from the $175.2$307.1 million as of December 31, 2016.2020. This increase was largely attributable to the West Suburban acquisition, which results in consideration paid to West Suburban shareholders of $194.5 million, or 15.7 million shares, of our common stock. In addition, we had net income of $15.1$20.0 million in 2017, and2021, less a more favorable$6.0 million reduction in the fair value adjustment on securities available for sale, net of the fair value adjustments related to swaps, within accumulated other comprehensive income. At December 31, 2017,2021, accumulated other comprehensive income, net of deferred taxes, was $1.5$8.8 million, compared to an $8.8$14.8 million accumulated other comprehensive loss,income, net of tax, as of year end 2016.year-end 2020. Equity in 20172021 was reduced for the payment of dividends to common stockholders, which totaled $1.2$4.6 million for the year, as well as treasury stock purchases pursuant to our stock repurchase plan, which totaled $5.5 million for the year. TotalOur total stockholders’ equity increased in 2016,2020, ending at $175.2$307.1 million, as compared to $155.9$277.9 million at year end 2015,2019, due primarily to net income of $15.7$27.8 million in 2020 and declines in unrealized lossesa favorable fair value adjustment on securities available for sale, in 2016.net of fair value adjustments related to swaps, of $10.2 million.
The Company completed the sale ofWe issued $32.6 million of cumulative trust preferred securities by itsthrough our consolidated subsidiary, Old Second Capital Trust I, in July 2003. These trust preferred securities remainAs noted above, we redeemed all of the outstanding forTrust Securities on March 2, 2020, at a 30-year term, but subject to regulatory approval, they can be called in whole or in part atredemption price of $10.00 per Trust Security, which reflects 100% of the Company’s discretion after an initial five-year period, which has since passed. The Company does not currently intend to seek regulatory approval to call these securities. Dividends are payable quarterly at an annual rate liquidation amount, plus accrued and unpaid distributions through the redemption date.
The CompanyWe issued an additional $25.8 million of cumulative trust preferred securities through a private placement completed by a second unconsolidated subsidiary, Old Second Capital Trust II, in April 2007. These trust preferred securities also mature in 30 years, but subject to regulatory approval, can also now be called in whole or in part beginning in 2017.part. The quarterly cash distributions on the securities were fixed at 6.77% through June 15, 2017, and converted to a floating rate at 150 basis points over the three-month LIBOR rate thereafter. The CompanyWe entered into a forward starting interest rate swap on August 18, 2015, with an effective date of June 15, 2017. This transaction had a notional amount totaling $25.8 million as of December 31, 2015, and was designated as a cash flow hedge of certain junior subordinated debentures and continues to be fully effective during the period presented. As such, no amount of ineffectiveness has been included in net income. Therefore, the aggregate fair value of the swap is recorded in other liabilities with changes in fair value recorded in other comprehensive income, net of tax. The amount included in other comprehensive income would be reclassified to current earnings should all or a portion of the hedge no longer be considered effective. The Company expectsWe expect the hedge to remain fully effective during the remaining term of the swap. The Company willWe pay the counterparty a fixed rate and receive a floating rate based on three month LIBOR. Management concluded that it would be advantageous to enter into this transaction given that the Company’sour trust preferred securitiesissued in 2007 changed from a fixed to floating rate on June 15, 2017. The cash flow hedge has a maturity date of June 15, 2037.
The Company isWe are currently paying interest on all trustthe Trust II preferred securities as that interest comes due. As of December 31, 2017,2021, and December 31, 2020, total trust preferred proceeds of $56.6 million qualified as Tier 1 regulatory capital. As of December 31, 2016, trust preferred proceeds of $48.0$25.0 million qualified as Tier 1 regulatory capital and $8.6 million qualified as Tier 2 regulatory capital. at the bank holding company level.
In January 2009, the Company issued and sold (i) 73,000 shares of Fixed Rate Cumulative Perpetual Preferred Stock, Series B (the “Series B Stock”) and (ii) a warrant to purchase 815,339 shares of its common stock at an exercise price of $13.43 per share to the U.S. Treasury. The total liquidation value of the Series B Stock and the warrant was $73.0 million at issuance. All of the Series B Stock held by the U.S. Treasury was sold to third parties, including certain of the Company’s directors, in public auctions that were completed in the first quarter of 2013. The warrant was also sold at a subsequent auction to a third party. During 2015, the Company redeemed $15.8 million of Series B Stock in the first quarter of 2015, and redeemed the remaining shares in the third quarter of 2015. As2019, our Board of December 31, 2015Directors authorized a stock repurchase program, under which we were authorized to repurchase up to approximately 1.5 million shares (or approximately 5%) of our outstanding common stock through open market purchases, trading plans established in accordance with U.S. Securities and Exchange Commission rules, privately negotiated transactions, or by other means. The stock repurchase program expired on September 19, 2020; however, we received a notice of non-objection from the Series B Stock was fully redeemed.Federal Reserve Bank of Chicago to extend the previously authorized stock repurchase program through October 20, 2021. The warrant hasactual means and timing of any repurchases, quantity of purchased shares and prices will be, subject to certain limitations, at the discretion of management and will depend on a carrying valuenumber of $4.8 million, expiresfactors, including, without limitation, market prices of our common stock, general market and economic condition, and applicable legal and regulatory requirements. These share purchases were funded by our cash on hand. No shares were repurchased in January 2019, and is included within additional paid-in capitalduring 2020, we repurchased 719,273 shares of our common stock at a weighted average price of $7.65 per share pursuant to our stock repurchase program. During 2021, we repurchased 766,034 shares at a weighted average share price of $12.81 per share. In total, we repurchased 1,485,307 shares of our common stock at a weighted average price of $10.31 per share under our stock repurchase program. The repurchase program expired on October 21, 2021, and no other repurchase program was in effect as of December 31, 20172021.
We withheld 48,902 shares for $605,397 to satisfy RSU vesting tax withholding obligations in 2021, and 2016.repurchased 766,034 shares for $9.8 million under our stock repurchase program, which increased treasury stock. This increase was offset by issuances of 199,492 shares for RSU vestings, which totaled $2.4 million. In addition, due to the acquisition of West Suburban, we issued 6.0 million treasury shares, for $103.6 million, which was part of the 15.7 million total shares issued for the stock component of the merger consideration paid. The net impact was a decrease to treasury stock of 5.4 million shares, to 244,105 shares totaling $5.9 million as of December 31, 2021. The net decrease in treasury stock increased stockholders’ equity, and also decreased earnings per share by increasing the number of shares outstanding.
Federal regulationsWe withheld 33,765 shares for $423,000 to satisfy RSU vesting tax withholding obligations in 2020, and repurchased 719,273 shares for $5.5 million under our stock repurchase program, which increased treasury stock. This increase was offset by issuances of 46,325 shares for RSU vestings, which totaled $431,000. The net impact was an increase to treasury stock of 706,713 shares, to 5,628,661 shares totaling $101.4 million as of December 31, 2020. The increase in treasury stock decreased stockholders’ equity, and also increased earnings per share by decreasing the number of shares outstanding
The Basel III rules, impose minimum regulatory capital requirements on all institutions with deposits insured by the FDIC. On January 1, 2015, the U.S.for bank holding companies and banks. The Basel III final rule replaced the existing Basel I-based approach for calculating risk-weighted assets. Basel III introducedrules apply to all national and state banks and savings associations regardless of size and bank holding companies and savings and loan holding companies other than “small bank holding companies” which are generally holding companies with consolidated assets of less than $3 billion. Following our acquisition of West Suburban, we no longer qualify as a new minimum ratio of common equity Tier 1 capital (“CET1”) and raised the minimum ratios for Tier 1 capital, total capital, and Tier 1 leverage. The final rule emphasizes common equity Tier 1 capital and implements strict eligibility criteria for regulatory capital instruments and changed the methodology for calculating risk-weighted assets to enhance risk sensitivity. The methods for calculating the risk-based capital ratios have changed and will change as the provisions of the Basel III final rule related to the numerator (capital) and denominator (risk-weighted assets) are fully phased in by January 1, 2019. The ongoing methodological changes will result in differences in the reported capital ratios from one reporting period to the next that are independent of applicable changes in the capital base, asset composition, off-balance sheet exposures or risk profile.small bank holding company. In addition, in order to avoid restrictions on capital distributions or discretionary bonus payments to executives, a covered banking organization must maintain a “capital conservation buffer” on top of itsour minimum risk-based capital requirements. This buffer must consist solely of CET1, but the buffer applies to all three measurements (CET1, Tier 1 capital and total capital). The capital conservation buffer will be phased in incrementally over time, becoming fully effective on January 1, 2019, and will consistconsists of an additional amount of common equity equal to 2.5% of risk-weighted asset.assets.
The following table shows the regulatory capital ratios and the current minimum and well capitalized regulatory requirements for the Company and the Bank at the dates indicated:
| | | | | | | | |
| | | | December 31, | | December 31, |
| Well-Capitalized (1) | | 2017 | | 2016 |
The Company | | | | | | | | |
Common equity tier 1 capital ratio | N/A | | | 9.25 | % | | 8.76 | % |
Total risk-based capital ratio | N/A | | | 12.93 | % | | 12.29 | % |
Tier 1 risk-based capital ratio | N/A | | | 12.03 | % | | 10.88 | % |
Tier 1 leverage ratio | N/A | | | 10.08 | % | | 8.90 | % |
| | | | | | | | |
The Bank | | | | | | | | |
Common equity tier 1 capital ratio | 6.50 | % | | 12.88 | % | | 12.53 | % |
Total risk-based capital ratio | 10.00 | % | | 13.78 | % | | 13.45 | % |
Tier 1 risk-based capital ratio | 8.00 | % | | 12.88 | % | | 12.53 | % |
Tier 1 leverage ratio | 5.00 | % | | 10.79 | % | | 10.24 | % |
indicated:
(1)
Risk Based Capital Ratios
| | | | | | | | | | | | | | | |
| | Minimum Capital | | Well Capitalized | | | | | | | | | |
| | Adequacy with | | Under Prompt | | | | | | | | | |
| | Capital Conservation | | | Corrective Action | | December 31, | | December 31, | | December 31, |
| | Buffer, if applicable1 | | Provisions2 | | 2021 | | 2020 | | 2019 |
The Company | | | | | | | | | | | | | | | |
Common equity tier 1 capital ratio | | 7.00 | % | | N/A | | | 9.46 | % | | 11.94 | % | | 11.14 | % |
Total risk-based capital ratio | | 10.50 | % | | N/A | | | 12.55 | % | | 14.26 | % | | 14.53 | % |
Tier 1 risk-based capital ratio | | 8.50 | % | | N/A | | | 10.06 | % | | 13.01 | % | | 13.65 | % |
Tier 1 leverage ratio | | 4.00 | % | | N/A | | | 7.81 | % | | 10.21 | % | | 11.93 | % |
| | | | | | | | | | | | | | | |
The Bank | | | | | | | | | | | | | | | |
Common equity tier 1 capital ratio | | 7.00 | % | | 6.50 | % | | 12.41 | % | | 13.75 | % | | 14.35 | % |
Total risk-based capital ratio | | 10.50 | % | | 10.00 | % | | 13.46 | % | | 15.00 | % | | 15.23 | % |
Tier 1 risk-based capital ratio | | 8.50 | % | | 8.00 | % | | 12.41 | % | | 13.75 | % | | 14.35 | % |
Tier 1 leverage ratio | | 4.00 | % | | 5.00 | % | | 9.58 | % | | 10.74 | % | | 12.50 | % |
1 Amounts are shown inclusive of a capital conservation buffer of 2.50%.
2 Prompt corrective action provisions are only applicable at the Bank level.
The Company, on a consolidated basis, exceeded the minimum capital ratios to be deemed “well capitalized” at December 31, 2017,2021, pursuant to the capital requirements in effect at that time. All ratios conform to the regulatory calculation requirements in effect as of the date noted.
In addition to the above regulatory ratios, the Company’s non-GAAPour common equity to total assets ratio decreased from 10.10% to 8.08%, while our tangible common equity to tangible assets ratio which management(non-GAAP), decreased from 9.49% at December 31, 2020 to 6.59% at December 31, 2021. The declines in these ratios was primarily due to an increase in each denominator due to growth in assets in 2021, due to the West Suburban acquisition and interest earning deposits with financial institutions. In addition, growth in total intangibles related to the West Suburban acquisition impacted the tangible equity to tangible assets ratio. Management considers this non-GAAP measure a valuable performance measurement for capital analysis, increased from 7.42% at December 31, 2016 to 8.07% at December 31, 2017.
analysis. The following table provides a reconciliation of the GAAP tangible common equity to tangible assets ratio to the non-GAAP ratio for the periods indicated. indicated:
| | | | | | | | | | | | | | | |
| As of December 31, | | | As of December 31, | |
| 2017 | | 2016 | |
(in thousands) | GAAP | | | Non-GAAP | | GAAP | | | Non-GAAP | |
| | | | | | | | | | | | | | | |
| | | | | | | | | | | | | | | |
| | December 31, 2021 | | | December 31, 2020 | |
Tangible common equity | | | | | | | | | | | | | | | | GAAP | | | Non-GAAP | | | GAAP | | | Non-GAAP | |
(Dollars in thousands) | | | | | | | | | | | | | | | | |
| | | | | | | | | | | | | | | | |
Total Equity | $ | 200,350 | | | $ | 200,350 | | | $ | 175,210 | | | $ | 175,210 | | $ | 502,027 | | | $ | 502,027 | | | $ | 307,087 | | | $ | 307,087 | |
Less: Intangible assets | | 8,922 | | | | 8,813 | | | | 9,018 | | | | 8,761 | | |
Less: Goodwill and intangible assets | | | 102,636 | | | | 102,636 | | | | 20,781 | | | | 20,781 | |
Add: Limitation of exclusion of core deposit intangible (80%) | | | N/A | | | | 3,261 | | | | N/A | | | | 435 | |
Adjusted goodwill and intangible assets | | | 102,636 | | | | 99,375 | | | | 20,781 | | | | 20,346 | |
Tangible common equity | $ | 191,428 | | | $ | 191,537 | | | $ | 166,192 | | | $ | 166,449 | | $ | 399,391 | | | $ | 402,652 | | | $ | 286,306 | | | $ | 286,741 | |
| | | | | | | | | | | | | | | | |
Tangible assets | | | | | | | | | | | | | | | | | | | | | | | | | | | | | | |
Total assets | $ | 2,383,429 | | | $ | 2,383,429 | | | $ | 2,251,188 | | | $ | 2,251,188 | | $ | 6,212,189 | | | $ | 6,212,189 | | | $ | 3,040,837 | | | $ | 3,040,837 | |
Less: Goodwill and intangible assets | | 8,922 | | | | 8,813 | | | | 9,018 | | | | 8,761 | | |
Less: Adjusted goodwill and intangible assets | | | 102,636 | | | | 99,375 | | | | 20,781 | | | | 20,346 | |
Tangible assets | $ | 2,374,507 | | | $ | 2,374,616 | | | $ | 2,242,170 | | | $ | 2,242,427 | | $ | 6,109,553 | | | $ | 6,112,814 | | | $ | 3,020,056 | | | $ | 3,020,491 | |
| | | | | | | | | | | | | | | | |
| | | | | | | | | | | | | | | |
Common equity to total assets | | 8.41 | % | | | 8.41 | % | | | 7.78 | % | | | 7.78 | % | | 8.08 | % | | | 8.08 | % | | | 10.10 | % | | | 10.10 | % |
Tangible common equity to tangible assets | | 8.06 | % | | | 8.07 | % | | | 7.41 | % | | | 7.42 | % | | 6.54 | % | | | 6.59 | % | | | 9.48 | % | | | 9.49 | % |
The non-GAAP intangible asset exclusion reflects the 80% core deposit limitation per Basel III guidelines within risk based capital calculations, and is useful for the Company when reviewing risk based capital ratios and equity performance metrics.
59
The Company repurchased 20,630 shares for $236,000 in 2017, resulting in an increase in treasury stock to 4,998,648 shares and $96.5 million as
Liquidity
Liquidity
Liquidity is the Company’sour ability to fund operations, to meet depositor withdrawals, to provide for customer’s credit needs, and to meet maturing obligations and existing commitments. TheOur liquidity of the Company principally depends on cash flows from net operating activities, including pledging requirements, investment in, and both maturity and repayment of assets, changes in balances of deposits and borrowings, and itsour ability to borrow funds. In addition, the Company’s liquidity depends on the Bank’s ability to pay dividends, which is subject to certain regulatory requirements. See “Supervision and Regulation” in Item 1. “Business”. The CompanyRegulation Dividend Payments.” We continually monitors itsmonitor our cash position and borrowing capacity as well as performs monthlyperform stress tests of contingency funding no less frequently than quarterly as part of itsour liquidity management process. Stress testing of liquidity for contingency funding purposes includes tests that outline scenarios for
specifically identified liquidity risk events, which are then aggregated into a Bank-wide assessment of liquidity risk stress levels. The outcomes of these tests are reviewed by management monthly and the Company’sour Board of Directors monthly.quarterly. Cash and cash equivalents at the end of 20172021 totaled $55.8$752.1 million, compared to $47.3$329.9 million at December 31, 2020, and $50.6 million as of December 31, 2016, and $40.3 million as of December 31, 2015.2019.
Net cash inflows from operating activities were $37.1$31.0 million during 2017,2021, compared with inflows of $27.3$26.0 million in 20162020 and inflows of $21.1$52.6 million in 2015.2019. Proceeds from sales of loans held-for-sale, net of funds used to originate loans held-for-sale, was a significant source of inflows for 2017 at $4.4 million.2021, 2020 and 2019. Interest received, net of interest paid, combined with changes in other assets and liabilities were a source of outflows for 2017,in 2021 and 2020, and inflows for 2016.in 2019. Management of investing and financing activities, as well as market conditions, determines the level and the stability of net interest cash flows.flows in 2021. Management’s policy is to mitigate the impact of changes in market interest rates to the extent possible as part of theour balance sheet management process.
Net cash outflowsinflows from investing activities were $132.5$132.9 million in 2017,2021, compared to $103.8 million of outflows in 2020, and $42.2 million of inflows in 2019. The West Suburban acquisition in December 2021 resulted in net cash inflows of $149.0 million in 2021. Excluding the West Suburban acquisition, loans decreased by $122.1 million in 2021, primarily due to the forgiveness or payoff of PPP loans issued in 2020 and early 2021. Loan growth resulted in $103.9 million of cash outflows for 2020, compared to $34.4 million of cash outflows in 2019. In 2021, security transactions resulted in net cash outflows of $123.1$141.3 million, primarily to utilize the excess liquidity on hand as well as reposition the portfolio to higher credit, lower duration securities after the West Suburban acquisition, and proceeds from the sale of OREO assets resulted in 2016 and net cash outflows of $32.2 million in 2015. Loan growth in 2017 resulted in $141.7 million of net outflows, compared to $125.5 million of net outflows in 2016 and net inflows of $16.1 million in 2015. The Talmer branch acquisition in 2016 was a significant source of outflows for the Company in 2016, resulting in $181.4 million of cash paid for the net assets acquired.$5.8 million. In 2017,2020, securities transactions accounted for net inflows of $4.1 million,$831,000, and proceeds from the sales of OREO assets accounted for inflows of $6.1$3.3 million. In 2016,2019, securities transactions accounted for net inflows of $178.0$77.0 million, whereas proceeds from the sale of OREO assets accounted for inflows of $7.8$2.8 million.
Net cash inflows from financing activities in 20172021 were $103.9$258.2 million, primarily due to the issuance of $60.0 million of subordinated debentures in April 2021, compared withto net cash inflows in 2020 of $102.8$357.1 million, in 2016, while 2015 hadprimarily due to deposit growth, and net cash outflows for financing activities of $3.9 million.$99.5 million in 2019. Significant cash inflows from financing activities in 20172021 also included increasesgrowth in deposit accounts of $56.1$235.1 million, excluding the impact of the West Suburban deposits acquired, and significant outflows from financing activities in deposits and $45.0 million2020 also included a reduction in other short-term borrowings fromof $48.5 million, and redemption of the FHLBC. Significant cash inflows from financing activities in 2016 included increasesOSBC Capital Trust I junior subordinated debentures of $58.8 million in deposits, $55.0 million in other short-term borrowings and $44.0 million in proceeds from the issuance of senior notes.$32.6 million. Significant cash outflows from financing activities in 2016 include the repayments for $45.5 million2019 included decreases of subordinated debt and senior note and $8.4$101.0 million in other short-term borrowings with the reductionsFHLBC and the US Bank line of securities sold under repurchase agreements.credit payoff.
Contractual Obligations,
Commitments Contingent Liabilities, and Off-balance sheet arrangements
The Company has various financial obligations that may require future cash payments. The following table presents, as of December 31, 2017, significant fixed and determinable contractual obligations (all dollars in thousands) to third parties by payment date:
| | | | | | | | | | | | | | | | |
| | Within | | One to | | Three to | | Over | | | | |
| | One Year | | Three Years | | Five Years | | Five Years | | Total | |
Deposits without a stated maturity | | $ | 1,540,154 | | $ | - | | $ | - | | $ | - | | $ | 1,540,154 | |
Certificates of deposit | | | 158,547 | | | 186,560 | | | 37,664 | | | - | | | 382,771 | |
Securities sold under repurchase agreements | | | 29,918 | | | - | | | - | | | - | | | 29,918 | |
Other short-term borrowings | | | 115,000 | | | - | | | - | | | - | | | 115,000 | |
Junior subordinated debentures | | | - | | | - | | | - | | | 57,639 | | | 57,639 | |
Senior notes | | | - | | | - | | | - | | | 44,058 | | | 44,058 | |
Purchase obligations | | | 3,639 | | | 3,215 | | | 35 | | | - | | | 6,889 | |
Automatic teller machine leases | | | 72 | | | 65 | | | 6 | | | - | | | 143 | |
Operating leases | | | 308 | | | - | | | - | | | - | | | 308 | |
Nonqualified voluntary deferred compensation plan | | | 102 | | | 104 | | | 87 | | | 1,871 | | | 2,164 | |
Total | | $ | 1,847,740 | | $ | 189,944 | | $ | 37,792 | | $ | 103,568 | | $ | 2,179,044 | |
Purchase obligations represent obligations under agreements to purchase goods or services that are enforceable and legally binding on the Company and that specify all significant terms, including: fixed or minimum quantities to be purchased; fixed, minimum or variable price provisions; and the approximate timing of the transaction. The purchase obligation amounts presented above primarily relate to certain contractual payments for services provided for information technology, capital expenditures, and the outsourcing of certain operational activities. The Company routinely enters into contracts for services. These contracts may require payment for services to be provided in the future and may also contain penalty clauses for early termination. In this disclosure, the Company has made an effort to estimate such payments, where applicable. Additionally, where necessary, all data reflects reasonable management estimates as to certain purchase obligations as of December 31, 2017. Management has used the information available to make the estimations necessary to value the related purchase obligations.
Derivative contracts, which include contracts under which the Companywe either receivesreceive cash from, or payspay cash to, counterparties reflecting changes in interest rates are carried at fair value on theour Consolidated Balance Sheet as disclosed in Note 2018 of the Notes to the Consolidated Financial Statements provided in Part II, Item 8, “Financial Statements and Supplementary Data”. Because the fair value of derivative contracts changes daily as market interest rates change, the derivative assets and liabilities recorded on the balance sheet at December 31, 2017,2021, do not necessarily represent the amounts that may ultimately be paid. As a result, these assets and liabilities are not included in the table of contractual obligations presented above.
Assets under management and assets under custody are held in fiduciary or custodial capacity for clients. In accordance with GAAP, these assets are not included on the Company’sour balance sheet.
Financial instruments with off-balance sheet risk address the financing needs of our clients. These instruments include commitments to extend credit as well as performance, standby and commercial letters of credit. Further discussion of these commitments is included in Note 15 14 – Commitments in the accompanying notes to the consolidated financial statements.
The following table details the amounts and expected maturities of significant commitments to extend credit as of December 31, 2017:2021:
| | | | | | | | | | | | | | | | |
| | Within | | One to | | Three to | | Over | | | | |
| | One Year | | Three Years | | Five Years | | Five Years | | Total | | |
Commitment to extend credit: | | | | | | | | | | | | | | | | | |
| | | | | | | | | | | | | | | | |
| | | Within | | One to | | Three to | | Over | | | |
(In thousands) | | | One Year | | Three Years | | Five Years | | Five Years | | Total | |
Commercial secured by real estate | | $ | 13,991 | | $ | 25,452 | | $ | 5,244 | | $ | 3,408 | | $ | 48,095 | | | $ | 83,934 | | $ | 89,325 | | $ | 67,742 | | $ | 6,402 | | $ | 247,403 | |
Revolving open end residential | | | 18,218 | | | 12,388 | | | 9,923 | | | 67,972 | | | 108,501 | | | | 66,806 | | | 46,999 | | | 10,593 | | | 84,127 | | | 208,525 | |
Other unused loan commitments, including commercial and industrial | | | 130,755 | | | 33,739 | | | 19,102 | | | 2,811 | | | 186,407 | | | | 374,507 | | | 134,648 | | | 13,398 | | | 1,409 | | | 523,962 | |
Financial standby letters of credit (borrowers) | | | 3,637 | | | 300 | | | 10 | | | - | | | 3,947 | | | | 16,270 | | | 1,503 | | | 85 | | | - | | | 17,858 | |
Performance standby letters of credit (borrowers) | | | 7,757 | | | 78 | | | - | | | - | | | 7,835 | | | | 8,581 | | | 6,437 | | | 345 | | | - | | | 15,363 | |
Commercial letters of credit (borrowers) | | | 24 | | | 330 | | | - | | | - | | | 354 | | |
Performance standby letters of credit (others) | | | 142 | | | - | | | - | | | - | | | 142 | | | | 67 | | | - | | | - | | | - | | | 67 | |
Total | | $ | 174,524 | | $ | 72,287 | | $ | 34,279 | | $ | 74,191 | | $ | 355,281 | | | $ | 550,165 | | $ | 278,912 | | $ | 92,163 | | $ | 91,938 | | $ | 1,013,178 | |
| | | | | | | | | | | | | | | | |
Item 7A. Quantitative and Qualitative Disclosures about Market Risk
Risk
Interest rate riskRate Risk
As part of itsour normal operations, the Company iswe are subject to interest-rate risk on the assets it investswe invest in (primarily loans and securities)(loans, securities, fed funds) and the liabilities it fundswe carry (primarily customer deposits and borrowed funds), as well as its ability to manage such risk.. Fluctuations in interest rates may result in changes in the fair market values of the Company’sour financial instruments, cash flows, and net interest income. Like most financial institutions, the Company haswe have an exposure to changes in both short-term and long-term interest rates.
The Federal Reserve has kept the target fed funds range of 0% to 0.25% since the first quarter of 2020. In December 2017,the past year, the Federal Reserve raised short-termhas maintained a stance of no interest rates by 0.25%. Thererate increases before 2024. However, that projection has changed recently as the current market sentiment is a general market expectationminimum of 0.25% increase in March 2022 and a faster pace of increases. The Federal Reserve balance sheet has elevated to $8.8 trillion by the end of December 2021, and it is widely expected that the Federal Reserve will move short-term interest rates higher during 2018. Generally, Federal Reserve action has not had a significant impact on long-term rates, although Federal Reserve officials have announced a schedule to end reinvestmentasset purchases in their securities portfolio starting in October 2017 which could result in increased long-term rates. The Company manages2022. We manage interest rate risk within guidelines established by policy which limitsare intended to limit the amount of rate exposure. In practice, we seek to manage our interest rate risk exposure well within our guidelines so that such exposure does not pose a material risk to our future earnings.
The Company managesWe manage various market risks in itsthe normal course of our operations, including credit, liquidity risk, and interest-rate risk. Other types of market risk, such as foreign currency exchange risk and commodity price risk, do not arise in the normal course of the Company’sour business activities and operations. In addition, since the Company doeswe do not hold a trading portfolio, it iswe are not exposed to significant market risk from trading activities. The Company’sOur interest rate risk exposures at December 31, 2017,2021 and December 31, 2016,2020 are outlined in the table below.
The Company'sOur net income can be significantly influenced by a variety of external factors, including: overall economic conditions, policies and actions of regulatory authorities, the amounts of and rates at which assets and liabilities reprice, variances in prepayment of loans and securities other than those that are assumed, early withdrawal of deposits, exercise of call options on borrowings or securities, competition, a general rise or decline in interest rates, changes in the slope of the yield-curve, changes in historical relationships between indices (such as SOFR, LIBOR and prime), and balance sheet growth or contraction. The Company's ALCOOur asset-liability committee seeks to manage interest rate risk under a variety of rate environments by structuring the Company'sour balance sheet and off-balance sheet positions, which includes interest rate swap derivatives as discussed in Note 2019 of theour consolidated financial statements included in this annual report. TheWe seek to monitor and manage interest rate risk is monitored and managed within approved policy guidelines and limits.
The Company utilizesWe use simulation analysis to quantify the impact of various rate scenarios on our net interest income. Specific cash flows, repricing characteristics, and embedded options of the assets and liabilities held by the Companyus are incorporated into the simulation model.model, such as interest rate floors on our loans. Earnings at risk isare calculated by comparing the net interest income of a stable interest rate environment to the net interest income of a different interest rate environment in order to determine the percentage change. Significant declines in interest rates that occurred during the first half of 2012 had made it impossible to calculate valid interest rate scenarios for rate declines of 2.0% or more until December 2017, when increases in short-term interest rates again made it possible to compute a valid minus 2.0% scenario. As of December 31, 2016, the Company had modest amounts2021, we have a significant amount of earnings gains (in both dollars and percentage) should interest rates rise and limited earnings reductions should interest rates fall. Thewhen compared to December 31, 2020. This was driven by changes in income acrossour balance sheet mix from the variousacquisition of West Suburban. Notably, we have a higher balance of floating rate bonds and variable rate loans from the acquisition. In addition, we made changes to our asset liability management model to better reflect interest rate scenarios assensitivity of December 2017 were similar to those of December 2016. Overall, management considers current level of interest rate risk to be moderate, but
intends to continue closely monitoring changes in that risk in case corrective actions might be needed in the future. The Federal Funds rate and the Bank’s prime rate remained unchanged at 1.5% and 4.5% for the periods ended December 31, 2017 and 2016, respectively.
The following table summarizes the effect on annual income before income taxes based upon an immediate increase or decrease in interest rates of 0.5%, 1%, and 2% and no change in the slope of the yield curve. The -2% sectionDue to relatively low current market interest rates, it was not possible to calculate any down rate scenarios because many of the table for December 31, 2016 does not show model changes formarket interest rates would fall below zero in that magnitude of decrease due to the low interest rate environment at that time. scenario.
| | | | | | | | | | | | | | | | | | | | | | | | | |
| | Analysis of Net Interest Income Sensitivity | |
(dollars in thousands) | | Immediate Changes in Rates | |
| | | (2.0) | % | | | (1.0) | % | | | (0.5) | % | | | 0.5 | % | | | 1.0 | % | | | 2.0 | % | |
December 31, 2017 | | | | | | | | | | | | | | | | | | | | | | | | | |
| | | | | | | | | | | | | | | | | | | | |
| | | Analysis of Net Interest Income Sensitivity |
| | | Immediate Changes in Rates |
(Dollars in thousands) | | | | (2.0) | % | | | (1.0) | % | | | (0.5) | % | | | 0.5 | % | | | 1.0 | % | | | 2.0 | % |
December 31, 2021 | | | | | | | | | | | | | | | | | | | | |
Dollar change | | $ | (9,447) | | | $ | (5,272) | | | $ | (2,382) | | | $ | 1,375 | | | $ | 2,764 | | | $ | 5,273 | | | | N/M | | | N/M | | | N/M | | $ | 13,404 | | $ | 27,689 | | $ | 54,007 | |
Percent change | | | (12.0) | % | | | (6.7) | % | | | (3.0) | % | | | 1.7 | % | | | 3.5 | % | | | 6.7 | % | | | N/M | | | N/M | | | N/M | | | 9.4 | % | | | 19.5 | % | | | 38.0 | % |
| | | | | | | | | | | | | | | | | | | | | | | | | |
December 31, 2016 | | | | | | | | | | | | | | | | | | | | | | | | | |
| | | | | | | | | | | | | | | | | | | | |
December 31, 2020 | | | | | | | | | | | | | | | | | | | | |
Dollar change | | | N/A | | | $ | (4,404) | | | $ | (2,141) | | | $ | 1,145 | | | $ | 2,406 | | | $ | 4,866 | | | | N/M | | | N/M | | | N/M | | $ | 3,405 | | $ | 6,879 | | $ | 13,145 | |
Percent change | | | N/A | | | | (6.6) | % | | | (3.2) | % | | | 1.7 | % | | | 3.6 | % | | | 7.3 | % | | | N/M | | | N/M | | | N/M | | | 3.9 | % | | | 7.8 | % | | | 14.9 | % |
The amounts and assumptions used in the simulation model should not be viewed as indicative of expected actual results. Actual results will differ from simulated results due to timing, magnitude and frequency of interest rate changes as well as changes in market conditions and management strategies. The above results do not take into account any management action to mitigate potential risk.
Effects of Inflation
In management’s opinion, changes in interest rates affect the financial condition of a financial institution to a far greater degree than changes in the inflation rate. While interest rates are greatly influenced by changes in the inflation rate, they do not change at the same rate or in the same magnitude as the inflation rate. Rather, interest rate volatility is based on changes in the expected rate of inflation, as well as on changes in monetary and fiscal policies. A financial institution’s ability to be relatively unaffected by changes in interest rates is a good indicator of its capability to perform in today’s volatile economic environment. The Company seeksWe seek to insulate itselfthe Company from interest rate volatility by using itsour best efforts to ensure that rate sensitive assets and rate sensitive liabilities respond to changes in interest rates in a similar time frame and to a similar degree.
.
Item 8. Financial Statements and Supplementary Data
Data
Old Second Bancorp, Inc. and Subsidiaries
Consolidated Balance Sheets
December 31, 20172021 and 20162020
(In thousands, except per share data)
| | | | | | |
| | | | | |
| | December 31, | | December 31, |
| | 2017 | | 2016 |
Assets | | | | | | |
Cash and due from banks | | $ | 37,444 | | $ | 33,805 |
Interest bearing deposits with financial institutions | | | 18,389 | | | 13,529 |
Cash and cash equivalents | | | 55,833 | | | 47,334 |
Securities available-for-sale, at fair value | | | 541,439 | | | 531,838 |
Federal Home Loan Bank Chicago ("FHLBC") and Federal Reserve Bank Chicago ("FRBC") stock | | | 10,168 | | | 7,918 |
Loans held-for-sale | | | 4,067 | | | 4,918 |
Loans | | | 1,617,622 | | | 1,478,809 |
Less: allowance for loan and lease losses | | | 17,461 | | | 16,158 |
Net loans | | | 1,600,161 | | | 1,462,651 |
Premises and equipment, net | | | 37,628 | | | 38,977 |
Other real estate owned | | | 8,371 | | | 11,916 |
Mortgage servicing rights, net | | | 6,944 | | | 6,489 |
Goodwill and core deposit intangible | | | 8,922 | | | 9,018 |
Bank-owned life insurance ("BOLI") | | | 61,764 | | | 60,332 |
Deferred tax assets, net | | | 25,356 | | | 53,464 |
Other assets | | | 22,776 | | | 16,333 |
Total assets | | $ | 2,383,429 | | $ | 2,251,188 |
| | | | | | |
Liabilities | | | | | | |
Deposits: | | | | | | |
Noninterest bearing demand | | $ | 572,404 | | $ | 513,688 |
Interest bearing: | | | | | | |
Savings, NOW, and money market | | | 967,750 | | | 950,849 |
Time | | | 382,771 | | | 402,248 |
Total deposits | | | 1,922,925 | | | 1,866,785 |
Securities sold under repurchase agreements | | | 29,918 | | | 25,715 |
Other short-term borrowings | | | 115,000 | | | 70,000 |
Junior subordinated debentures, net | | | 57,639 | | | 57,591 |
Senior notes, net | | | 44,058 | | | 43,998 |
Other liabilities | | | 13,539 | | | 11,889 |
Total liabilities | | | 2,183,079 | | | 2,075,978 |
| | | | | | |
Stockholders’ Equity | | | | | | |
Common stock | | | 34,626 | | | 34,534 |
Additional paid-in capital | | | 117,742 | | | 116,653 |
Retained earnings | | | 142,959 | | | 129,005 |
Accumulated other comprehensive income (loss) | | | 1,479 | | | (8,762) |
Treasury stock | | | (96,456) | | | (96,220) |
Total stockholders’ equity | | | 200,350 | | | 175,210 |
Total liabilities and stockholders’ equity | | $ | 2,383,429 | | $ | 2,251,188 |
| | | | | | |
| | December 31, | | December 31, |
| | 2021 | | 2020 |
Assets | | | | | | |
Cash and due from banks | | $ | 38,565 | | $ | 24,306 |
Interest earning deposits with financial institutions | | | 713,542 | | | 305,597 |
Cash and cash equivalents | | | 752,107 | | | 329,903 |
Securities available-for-sale, at fair value | | | 1,692,488 | | | 496,178 |
Federal Home Loan Bank Chicago ("FHLBC") and Federal Reserve Bank Chicago ("FRBC") stock | | | 13,257 | | | 9,917 |
Loans held-for-sale | | | 4,737 | | | 12,611 |
Loans | | | 3,421,948 | | | 2,034,851 |
Less: allowance for credit losses on loans | | | 44,281 | | | 33,855 |
Net loans | | | 3,377,667 | | | 2,000,996 |
Premises and equipment, net | | | 88,005 | | | 45,477 |
Other real estate owned | | | 2,356 | | | 2,474 |
Mortgage servicing rights, at fair value | | | 7,097 | | | 4,224 |
Goodwill | | | 86,332 | | | 18,604 |
Core deposit intangible | | | 16,304 | | | 2,177 |
Bank-owned life insurance ("BOLI") | | | 105,300 | | | 63,102 |
Deferred tax assets, net | | | 6,100 | | | 8,121 |
Other assets | | | 60,439 | | | 47,053 |
Total assets | | $ | 6,212,189 | | $ | 3,040,837 |
| | | | | | |
Liabilities | | | | | | |
Deposits: | | | | | | |
Noninterest bearing demand | | $ | 1,428,055 | | $ | 909,505 |
Interest bearing: | | | | | | |
Savings, NOW, and money market | | | 3,534,367 | | | 1,202,134 |
Time | | | 503,810 | | | 425,434 |
Total deposits | | | 5,466,232 | | | 2,537,073 |
Securities sold under repurchase agreements | | | 50,337 | | | 66,980 |
Junior subordinated debentures | | | 25,773 | | | 25,773 |
Subordinated debentures | | | 59,212 | | | - |
Senior notes | | | 44,480 | | | 44,375 |
Notes payable and other borrowings | | | 19,074 | | | 23,393 |
Other liabilities | | | 45,054 | | | 36,156 |
Total liabilities | | | 5,710,162 | | | 2,733,750 |
| | | | | | |
Stockholders’ Equity | | | | | | |
Common stock | | | 44,705 | | | 34,957 |
Additional paid-in capital | | | 202,443 | | | 122,212 |
Retained earnings | | | 252,011 | | | 236,579 |
Accumulated other comprehensive income | | | 8,768 | | | 14,762 |
Treasury stock | | | (5,900) | | | (101,423) |
Total stockholders’ equity | | | 502,027 | | | 307,087 |
Total liabilities and stockholders’ equity | | $ | 6,212,189 | | $ | 3,040,837 |
| | | | | | |
| | | | | |
| December 31, 2021 | | December 31, 2020 |
| Common | | Common |
| Stock | | Stock |
Par value | $ | 1.00 | | $ | 1.00 |
Shares authorized | | 60,000,000 | | | 60,000,000 |
Shares issued | | 44,705,150 | | | 34,957,384 |
Shares outstanding | | 44,461,045 | | | 29,328,723 |
Treasury shares | | 244,105 | | | 5,628,661 |
| | | | | |
| December 31, 2017 | | December 31, 2016 |
| Common | | Common |
| Stock | | Stock |
Par value | $ | 1.00 | | $ | 1.00 |
Shares authorized | | 60,000,000 | | | 60,000,000 |
Shares issued | | 34,625,734 | | | 34,534,234 |
Shares outstanding | | 29,627,086 | | | 29,556,216 |
Treasury shares | | 4,998,648 | | | 4,978,018 |
See accompanying notes to consolidated financial statements.
Old Second Bancorp, Inc. and Subsidiaries
Consolidated Statements of Income
Years Ended December 31, 2017, 20162021, 2020 and 20152019
(In thousands, except per share data)
| | | | | | | | | |
| | | | | |
| | Year Ended December 31, |
| | 2017 | | 2016 | | 2015 |
Interest and dividend income | | | | | | | | | |
Loans, including fees | | $ | 70,737 | | $ | 56,019 | | $ | 53,035 |
Loans held-for-sale | | | 123 | | | 151 | | | 189 |
Securities: | | | | | | | | | |
Taxable | | | 10,202 | | | 15,865 | | | 14,037 |
Tax exempt | | | 5,939 | | | 842 | | | 542 |
Dividends from FHLBC and FRBC stock | | | 370 | | | 333 | | | 306 |
Interest bearing deposits with financial institutions | | | 134 | | | 169 | | | 55 |
Total interest and dividend income | | | 87,505 | | | 73,379 | | | 68,164 |
Interest expense | | | | | | | | | |
Savings, NOW, and money market deposits | | | 950 | | | 789 | | | 734 |
Time deposits | | | 4,227 | | | 3,640 | | | 3,201 |
Other short-term borrowings | | | 758 | | | 106 | | | 33 |
Junior subordinated debentures | | | 4,002 | | | 4,334 | | | 4,287 |
Senior notes | | | 2,689 | | | 112 | | | - |
Subordinated debt | | | - | | | 949 | | | 814 |
Notes payable and other borrowings | | | - | | | 8 | | | 7 |
Total interest expense | | | 12,626 | | | 9,938 | | | 9,076 |
Net interest and dividend income | | | 74,879 | | | 63,441 | | | 59,088 |
Provision (release) for loan and lease losses | | | 1,800 | | | 750 | | | (4,400) |
Net interest and dividend income after provision (release) for loan and lease losses | | | 73,079 | | | 62,691 | | | 63,488 |
Noninterest income | | | | | | | | | |
Trust income | | | 6,203 | | | 5,670 | | | 5,953 |
Service charges on deposits | | | 6,720 | | | 6,684 | | | 6,820 |
Secondary mortgage fees | | | 776 | | | 1,038 | | | 907 |
Mortgage servicing rights mark to market loss | | | (802) | | | (919) | | | (1,141) |
Mortgage servicing income | | | 1,778 | | | 1,724 | | | 1,628 |
Net gain on sales of mortgage loans | | | 4,803 | | | 6,343 | | | 5,775 |
Securities gains (losses), net | | | 474 | | | (2,213) | | | (178) |
Increase in cash surrender value of BOLI | | | 1,432 | | | 1,283 | | | 1,277 |
Death benefit realized on bank-owned life insurance | | | - | | | - | | | 115 |
Debit card interchange income | | | 4,200 | | | 4,027 | | | 4,028 |
Gains (losses) on disposal and transfer of fixed assets, net | | | 10 | | | (1) | | | (1,119) |
Other income | | | 4,778 | | | 4,938 | | | 5,229 |
Total noninterest income | | | 30,372 | | | 28,574 | | | 29,294 |
Noninterest expense | | | | | | | | | |
Salaries and employee benefits | | | 40,080 | | | 36,234 | | | 35,061 |
Occupancy, furniture and equipment | | | 5,951 | | | 6,063 | | | 6,260 |
Computer and data processing | | | 4,387 | | | 4,349 | | | 4,357 |
FDIC insurance | | | 658 | | | 865 | | | 1,334 |
General bank insurance | | | 1,031 | | | 1,109 | | | 1,273 |
Amortization of core deposit intangible | | | 96 | | | 16 | | | - |
Advertising expense | | | 1,505 | | | 1,633 | | | 1,340 |
Debit card interchange expense | | | 1,329 | | | 1,455 | | | 1,514 |
Legal fees | | | 650 | | | 800 | | | 1,175 |
Other real estate expense, net | | | 2,165 | | | 2,743 | | | 5,191 |
Other expense | | | 11,297 | | | 11,494 | | | 10,916 |
Total noninterest expense | | | 69,149 | | | 66,761 | | | 68,421 |
Income before income taxes | | | 34,302 | | | 24,504 | | | 24,361 |
Provision for income taxes | | | 19,164 | | | 8,820 | | | 8,976 |
Net income | | | 15,138 | | | 15,684 | | | 15,385 |
Preferred stock dividends and accretion of discount | | | - | | | - | | | 1,873 |
Net income available to common stockholders | | $ | 15,138 | | $ | 15,684 | | $ | 13,512 |
| | | | | | | | | |
Basic earnings per share | | $ | 0.51 | | $ | 0.53 | | $ | 0.46 |
Diluted earnings per share | | | 0.50 | | | 0.53 | | | 0.46 |
| | | | | | | | | |
| | Year Ended December 31, |
| | 2021 | | 2020 | | 2019 |
Interest and dividend income | | | | | | | | | |
Loans, including fees | | $ | 90,665 | | $ | 90,923 | | $ | 97,719 |
Loans held-for-sale | | | 165 | | | 306 | | | 133 |
Securities: | | | | | | | | | |
Taxable | | | 8,099 | | | 6,773 | | | 9,256 |
Tax exempt | | | 5,174 | | | 5,471 | | | 7,425 |
Dividends from FHLBC and FRBC stock | | | 456 | | | 484 | | | 602 |
Interest bearing deposits with financial institutions | | | 656 | | | 258 | | | 459 |
Total interest and dividend income | | | 105,215 | | | 104,215 | | | 115,594 |
Interest expense | | | | | | | | | |
Savings, NOW, and money market deposits | | | 961 | | | 1,569 | | | 2,960 |
Time deposits | | | 1,510 | | | 5,033 | | | 6,736 |
Securities sold under repurchase agreements | | | 82 | | | 202 | | | 577 |
Other short-term borrowings | | | - | | | 179 | | | 1,755 |
Junior subordinated debentures | | | 1,133 | | | 2,215 | | | 3,724 |
Subordinated debentures | | | 1,610 | | | - | | | - |
Senior notes | | | 2,692 | | | 2,692 | | | 2,699 |
Notes payable and other borrowings | | | 463 | | | 574 | | | 384 |
Total interest expense | | | 8,451 | | | 12,464 | | | 18,835 |
Net interest and dividend income | | | 96,764 | | | 91,751 | | | 96,759 |
Provision for credit losses | | | 4,326 | | | 10,413 | | | 1,600 |
Net interest and dividend income after provision for credit losses | | | 92,438 | | | 81,338 | | | 95,159 |
Noninterest income | | | | | | | | | |
Wealth management | | | 9,334 | | | 7,905 | | | 8,045 |
Service charges on deposits | | | 5,408 | | | 5,512 | | | 7,715 |
Secondary mortgage fees | | | 1,044 | | | 1,654 | | | 772 |
Mortgage servicing rights mark to market gain (loss) | | | 1,261 | | | (3,999) | | | (2,662) |
Mortgage servicing income | | | 2,180 | | | 1,950 | | | 1,881 |
Net gain on sales of mortgage loans | | | 9,300 | | | 15,519 | | | 5,112 |
Securities (losses) gains, net | | | 232 | | | (25) | | | 4,511 |
Change in cash surrender value of BOLI | | | 1,390 | | | 1,233 | | | 1,415 |
Death benefit realized on BOLI | | | - | | | 57 | | | 872 |
Card related income | | | 6,704 | | | 5,532 | | | 5,861 |
Other income | | | 2,377 | | | 2,149 | | | 2,278 |
Total noninterest income | | | 39,230 | | | 37,487 | | | 35,800 |
Noninterest expense | | | | | | | | | |
Salaries and employee benefits | | | 57,691 | | | 49,547 | | | 46,869 |
Occupancy, furniture and equipment | | | 13,583 | | | 8,498 | | | 8,289 |
Computer and data processing | | | 7,938 | | | 5,143 | | | 5,631 |
FDIC insurance | | | 975 | | | 597 | | | 176 |
General bank insurance | | | 1,214 | | | 1,030 | | | 1,002 |
Amortization of core deposit intangible | | | 644 | | | 494 | | | 539 |
Advertising expense | | | 343 | | | 298 | | | 1,225 |
Card related expense | | | 2,538 | | | 2,195 | | | 1,956 |
Legal fees | | | 1,105 | | | 761 | | | 675 |
Consulting & management fees | | | 5,005 | | | 760 | | | 242 |
Other real estate expense, net | | | 167 | | | 651 | | | 423 |
Other expense | | | 12,598 | | | 11,443 | | | 12,075 |
Total noninterest expense | | | 103,801 | | | 81,417 | | | 79,102 |
Income before income taxes | | | 27,867 | | | 37,408 | | | 51,857 |
Provision for income taxes | | | 7,823 | | | 9,583 | | | 12,402 |
Net income | | $ | 20,044 | | $ | 27,825 | | $ | 39,455 |
| | | | | | | | | |
Basic earnings per share | | $ | 0.66 | | $ | 0.94 | | $ | 1.32 |
Diluted earnings per share | | | 0.65 | | | 0.92 | | | 1.30 |
Dividends declared per share | | | 0.16 | | | 0.04 | | | 0.04 |
See accompanying notes to consolidated financial statements.
Old Second Bancorp, Inc. and Subsidiaries
Consolidated Statements of Comprehensive Income
Years Ended December 31, 2021, 2020 and 2019
(In thousands)
| | | | | | | | | |
| | Year Ended December 31, |
| | 2021 | | 2020 | | 2019 |
Net Income | | $ | 20,044 | | $ | 27,825 | | $ | 39,455 |
| | | | | | | | | |
Unrealized holding (losses) gains on available-for-sale securities arising during the period | | | (8,513) | | | 14,690 | | | 19,630 |
Related tax benefit (expense) | | | 2,406 | | | (4,122) | | | (5,521) |
Holding (losses) gains, after tax, on available-for-sale securities | | | (6,107) | | | 10,568 | | | 14,109 |
| | | | | | | | | |
Less: Reclassification adjustment for the net gains (losses) realized during the period | | | | | | | | | |
Net realized gains (losses) | | | 232 | | | (25) | | | 4,511 |
Related tax (expense) benefit | | | (65) | | | 7 | | | (1,267) |
Net realized gains (losses) after tax | | | 167 | | | (18) | | | 3,244 |
Other comprehensive (loss) income on available-for-sale securities | | | (6,274) | | | 10,586 | | | 10,865 |
| | | | | | | | | |
Changes in fair value of derivatives used for cash flow hedges | | | 389 | | | (533) | | | (3,092) |
Related tax (expense) benefit | | | (109) | | | 147 | | | 868 |
Other comprehensive income (loss) on cash flow hedges | | | 280 | | | (386) | | | (2,224) |
| | | | | | | | | |
Total other comprehensive (loss) income | | | (5,994) | | | 10,200 | | | 8,641 |
Total comprehensive income | | $ | 14,050 | | $ | 38,025 | | $ | 48,096 |
| | | | | | | | | |
| | | | | | | | | |
| | | | | | |
| | Accumulated | | Accumulated | | Total |
| | Unrealized Gain | | Unrealized Gain | | Accumulated Other |
| | (Loss) on Securities | | (Loss) on Derivative | | Comprehensive |
| | Available-for -Sale | | Instruments | | Income/(Loss) |
| | | | | | | | | |
Balance, December 31, 2018 | | $ | (4,038) | | $ | (41) | | $ | (4,079) |
Other comprehensive income (loss), net of tax | | | 10,865 | | | (2,224) | | | 8,641 |
Balance, December 31, 2019 | | $ | 6,827 | | $ | (2,265) | | $ | 4,562 |
| | | | | | | | | |
Balance, December 31, 2019 | | $ | 6,827 | | $ | (2,265) | | $ | 4,562 |
Other comprehensive income (loss), net of tax | | | 10,586 | | | (386) | | | 10,200 |
Balance, December 31, 2020 | | $ | 17,413 | | $ | (2,651) | | $ | 14,762 |
| | | | | | | | | |
Balance, December 31, 2020 | | $ | 17,413 | | $ | (2,651) | | $ | 14,762 |
Other comprehensive (loss) income, net of tax | | | (6,274) | | | 280 | | | (5,994) |
Balance, December 31, 2021 | | $ | 11,139 | | $ | (2,371) | | $ | 8,768 |
| | | | | | | | | |
See accompanying notes to consolidated financial statements.
Old Second Bancorp, Inc. and Subsidiaries
Consolidated Statements of Comprehensive IncomeCash Flows
Years Ended December 31, 2017, 20162021, 2020 and 20152019
(In thousands)
| | | | | | | | | |
| | Year Ended December 31, |
| | 2021 | | 2020 | | 2019 |
Cash flows from operating activities | | | | | | | | | |
Net income | | $ | 20,044 | | $ | 27,825 | | $ | 39,455 |
Adjustments to reconcile net income to net cash provided by operating activities: | | | | | | | | | |
Net premium / discount amortization on securities | | | 2,932 | | | 2,329 | | | 2,726 |
Securities (gains) losses, net | | | (232) | | | 25 | | | (4,511) |
Provision (release) for credit losses | | | 4,326 | | | 10,413 | | | 1,600 |
Originations of loans held-for-sale | | | (239,175) | | | (384,379) | | | (164,696) |
Proceeds from sales of loans held-for-sale | | | 254,374 | | | 388,538 | | | 168,472 |
Net gains on sales of mortgage loans | | | (9,300) | | | (15,519) | | | (5,112) |
Mortgage servicing rights mark to market loss | | | (1,261) | | | 3,999 | | | 2,662 |
Net accretion of discount on loans | | | (1,177) | | | (911) | | | (1,025) |
Net change in cash surrender value of BOLI | | | (1,390) | | | (1,233) | | | (1,415) |
Net gains on sale of other real estate owned | | | (41) | | | (204) | | | (264) |
Provision for other real estate owned valuation losses | | | 79 | | | 357 | | | 519 |
Depreciation of fixed assets and amortization of leasehold improvements | | | 3,152 | | | 2,798 | | | 2,462 |
Write-down of fixed assets | | | 3,809 | | | - | | | - |
Amortization of core deposit intangibles | | | 644 | | | 494 | | | 539 |
Change in current income taxes receivable | | | (9,286) | | | 811 | | | 1,546 |
Deferred tax expense (benefit) | | | 6,479 | | | (646) | | | 6,436 |
Change in accrued interest receivable and other assets | | | 6,865 | | | (17,692) | | | (6,350) |
Accretion of purchase accounting adjustment on time deposits | | | (155) | | | - | | | (38) |
Amortization of purchase accounting adjustment on notes payable and other borrowings | | | (4) | | | 27 | | | 92 |
Amortization of junior subordinated debentures issuance costs | | | - | | | 643 | | | 48 |
Amortization of subordinated debentures issuance costs | | | 64 | | | - | | | - |
Amortization of senior notes issuance costs | | | 105 | | | 105 | | | 112 |
Change in accrued interest payable and other liabilities | | | (11,240) | | | 6,118 | | | 6,863 |
Stock based compensation | | | 1,435 | | | 2,089 | | | 2,516 |
Net cash provided by operating activities | | | 31,047 | | | 25,987 | | | 52,637 |
Cash flows from investing activities | | | | | | | | | |
Proceeds from maturities and calls, including pay down of securities available-for-sale | | | 138,874 | | | 48,054 | | | 41,752 |
Proceeds from sales of securities available-for-sale | | | 605,846 | | | 18,006 | | | 191,298 |
Purchases of securities available-for-sale | | | (886,103) | | | (65,229) | | | (159,544) |
Proceeds from sales of FHLBC/FRBC stock | | | - | | | - | | | 6,875 |
Purchases of FHLBC/FRBC stock | | | - | | | - | | | (3,359) |
Net change in loans | | | 122,102 | | | (103,887) | | | (34,440) |
Purchases of BOLI policies | | | (591) | | | (590) | | | - |
Proceeds from claims on BOLI, net of claims receivable | | | - | | | 484 | | | 1,196 |
Proceeds from sales of other real estate owned, net of participations and improvements | | | 5,828 | | | 3,275 | | | 2,779 |
Proceeds from disposition of fixed assets | | | - | | | - | | | 32 |
Net purchases of premises and equipment | | | (2,033) | | | (3,921) | | | (4,377) |
Cash and cash equivalents acquired, net of cash paid for acquisition | | | 148,995 | | | - | | | - |
Net cash provided by (used in) investing activities | | | 132,918 | | | (103,808) | | | 42,212 |
Cash flows from financing activities | | | | | | | | | |
Net change in deposits | | | 235,078 | | | 410,324 | | | 10,114 |
Net change in securities sold under repurchase agreements | | | (16,643) | | | 18,287 | | | 2,061 |
Net change in other short-term borrowings | | | - | | | (48,500) | | | (101,000) |
Redemption of junior subordinated debentures | | | - | | | (32,604) | | | - |
Issuance of subordinated debentures, net of issuance costs | | | 59,148 | | | - | | | |
Issuance of term note | | | - | | | 20,000 | | | - |
Repayment of term note | | | (4,000) | | | (3,000) | | | - |
Net change in notes payable and other borrowings, excluding term note | | | (315) | | | (307) | | | (8,798) |
Proceeds from exercise of stock options | | | - | | | - | | | 32 |
Dividends paid on common stock | | | (4,612) | | | (1,186) | | | (1,195) |
Purchase of treasury stock | | | (10,417) | | | (5,922) | | | (666) |
Net cash provided by (used in) financing activities | | | 258,239 | | | 357,092 | | | (99,452) |
Net change in cash and cash equivalents | | | 422,204 | | | 279,271 | | | (4,603) |
Cash and cash equivalents at beginning of period | | | 329,903 | | | 50,632 | | | 55,235 |
Cash and cash equivalents at end of period | | $ | 752,107 | | $ | 329,903 | | $ | 50,632 |
| | | | | | | | | |
66
| | | | | | | | | |
| | Year Ended December 31, |
| | 2017 | | 2016 | | 2015 |
Net Income | | $ | 15,138 | | $ | 15,684 | | $ | 15,385 |
| | | | | | | | | |
Unrealized holding gains (losses) on available-for-sale securities arising during the period | | | 17,863 | | | (1,155) | | | (8,624) |
Related tax (expense) benefit | | | (7,183) | | | 445 | | | 3,382 |
Holding gains (losses) after tax on available-for-sale securities | | | 10,680 | | | (710) | | | (5,242) |
| | | | | | | | | |
Less: Reclassification adjustment for the net gains (losses) realized during the period | | | | | | | | | |
Net realized gains (losses) | | | 474 | | | (2,213) | | | (178) |
Income tax (expense) benefit on net realized gains (losses) | | | (198) | | | 882 | | | 71 |
Net realized gains (losses) after tax | | | 276 | | | (1,331) | | | (107) |
Other comprehensive income (loss) on available-for-sale securities | | | 10,404 | | | 621 | | | (5,135) |
| | | | | | | | | |
Accretion and reversal of net unrealized holding gains on held-to-maturity securities | | | - | | | 5,939 | | | 964 |
Related tax expense | | | - | | | (2,446) | | | (396) |
Other comprehensive income on held-to-maturity securities | | | - | | | 3,493 | | | 568 |
| | | | | | | | | |
Changes in fair value of derivatives used for cash flow hedges | | | (293) | | | (363) | | | (631) |
Related tax benefit | | | 130 | | | 146 | | | 252 |
Other comprehensive loss on cash flow hedges | | | (163) | | | (217) | | | (379) |
| | | | | | | | | |
Total other comprehensive income (loss) | | | 10,241 | | | 3,897 | | | (4,946) |
Total comprehensive income | | $ | 25,379 | | $ | 19,581 | | $ | 10,439 |
See accompanying notes to consolidated financial statements.
Old Second Bancorp, Inc. and Subsidiaries
Consolidated Statements of Cash Flows
Years Ended December 31, 2017, 2016 and 2015
(In thousands)
| | | | | | | | |
| |
| Year Ended December 31, |
| 2017 | | 2016 | | 2015 |
Cash flows from operating activities | | | | | | | | |
Net income | $ | 15,138 | | $ | 15,684 | | $ | 15,385 |
Adjustments to reconcile net income to net cash provided by (used in) operating activities: | | | | | | | | |
Depreciation of fixed assets and amortization of leasehold improvements | | 2,306 | | | 2,288 | | | 2,386 |
Change in fair value of mortgage servicing rights | | 802 | | | 919 | | | 1,141 |
Provision (release) for loan and lease losses | | 1,800 | | | 750 | | | (4,400) |
Provision for deferred tax expense | | 13,662 | | | 8,421 | | | 8,756 |
Net deferred tax expense due to DTA revaluation | | 7,909 | | | - | | | - |
Originations of loans held-for-sale | | (146,867) | | | (194,901) | | | (190,041) |
Proceeds from sales of loans held-for-sale | | 151,289 | | | 197,654 | | | 196,431 |
Net gains on sales of mortgage loans | | (4,803) | | | (6,343) | | | (5,775) |
Net discount accretion of purchase accounting adjustment on loans | | (1,328) | | | (604) | | | - |
Change in current income taxes receivable | | (2,519) | | | 260 | | | 100 |
Increase in cash surrender value of BOLI | | (1,432) | | | (1,283) | | | (1,277) |
Death claim on bank-owned life insurance | | - | | | - | | | 273 |
Change in accrued interest receivable and other assets | | (4,492) | | | (53) | | | (4,213) |
Change in accrued interest payable and other liabilities | | 1,582 | | | 967 | | | (2,668) |
Net premium amortization/discount (accretion) on securities | | 1,881 | | | (638) | | | 79 |
Securities (gains) losses, net | | (474) | | | 2,213 | | | 178 |
Amortization of core deposit | | 96 | | | 16 | | | - |
Amortization of junior subordinated debentures issuance costs | | 48 | | | 48 | | | 47 |
Amortization of senior notes issuance costs | | 102 | | | 4 | | | - |
Stock based compensation | | 1,181 | | | 657 | | | 613 |
Net gains on sale of other real estate owned | | (474) | | | (374) | | | (1,073) |
Provision for other real estate owned valuation losses | | 1,708 | | | 1,570 | | | 4,076 |
Net (gains) losses on disposal and transfer of fixed assets | | (10) | | | 1 | | | (20) |
Loss on transfer of premises to other real estate owned | | - | | | - | | | 1,139 |
Net cash provided by operating activities | | 37,105 | | | 27,256 | | | 21,137 |
Cash flows from investing activities | | | | | | | | |
Proceeds from maturities and calls including pay down of securities available-for-sale | | 117,389 | | | 78,305 | | | 46,230 |
Proceeds from sales of securities available-for-sale | | 232,462 | | | 306,400 | | | 70,176 |
Purchases of securities available-for-sale | | (343,470) | | | (210,681) | | | (196,082) |
Proceeds from maturities and calls including pay down of securities held-to-maturity | | - | | | 3,372 | | | 13,281 |
Net disbursements/proceeds from (purchases) sales of FHLBC stock | | (2,250) | | | 600 | | | 540 |
Net change in loans | | (141,683) | | | (125,540) | | | 16,073 |
Improvements in other real estate owned | | - | | | (16) | | | - |
Proceeds from sales of other real estate owned, net of participation purchase | | 6,107 | | | 7,830 | | | 18,836 |
Proceeds from disposition of premises and equipment | | 13 | | | - | | | 30 |
Net purchases of premises and equipment | | (1,055) | | | (1,986) | | | (1,280) |
Cash paid for acquisition, net of cash and cash equivalent retained | | - | | | (181,357) | | | - |
Net cash used in investing activities | | (132,487) | | | (123,073) | | | (32,196) |
Cash flows from financing activities | | | | | | | | |
Net change in deposits | | 56,140 | | | 58,805 | | | 74,031 |
Net change in securities sold under repurchase agreements | | 4,203 | | | (8,355) | | | 13,034 |
Net change in other short-term borrowings | | 45,000 | | | 55,000 | | | (30,000) |
Redemption of preferred stock | | - | | | - | | | (47,331) |
Proceeds from the issuance of senior notes | | - | | | 43,994 | | | - |
Payment of senior note issuance costs | | (42) | | | - | | | |
Repayment of subordinate debt | | - | | | (45,000) | | | - |
Repayment of note payable | | - | | | (500) | | | - |
Proceeds from exercise of stock options | | - | | | 11 | | | - |
Dividends paid on preferred stock | | - | | | - | | | (2,417) |
Dividends paid on common stock | | (1,184) | | | (888) | | | - |
Purchase of treasury stock | | (236) | | | (254) | | | (117) |
Net cash provided by financing activities | | 103,881 | | | 102,813 | | | 7,200 |
Net change in cash and cash equivalents | | 8,499 | | | 6,996 | | | (3,859) |
Cash and cash equivalents at beginning of period | | 47,334 | | | 40,338 | | | 44,197 |
Cash and cash equivalents at end of period | $ | 55,833 | | $ | 47,334 | | $ | 40,338 |
Old Second Bancorp, Inc. and Subsidiaries
Consolidated Statements of Cash Flows – Continued
Years Ended December 31, 2017, 20162021, 2020 and 20152019
| | | | | | | | | |
| | |
| | Year Ended December 31, |
Supplemental cash flow information | | 2017 | | 2016 | | 2015 |
Income taxes paid, net | | $ | 430 | | $ | 211 | | $ | 118 |
Interest paid for deposits | | | 5,145 | | | 4,275 | | | 3,958 |
Interest paid for borrowings | | | 7,362 | | | 5,330 | | | 5,142 |
Non-cash transfer of loans to other real estate owned | | | 3,701 | | | 1,223 | | | 8,530 |
Non-cash transfer of premises to other real estate owned | | | 95 | | | 562 | | | 468 |
Non-cash transfer of securities held-to-maturity to securities available-for-sale | | | - | | | 244,823 | | | - |
Change in preferred stock dividends accrued and declared but not paid | | | - | | | - | | | (544) |
| | | | | | | | | |
| | |
| | Year Ended December 31, |
Supplemental cash flow information | | 2021 | | 2020 | | 2019 |
Income taxes paid, net | | $ | 10,612 | | $ | 7,922 | | $ | 4,425 |
Interest paid for deposits | | | 2,752 | | | 7,255 | | | 9,686 |
Interest paid for borrowings | | | 5,366 | | | 5,093 | | | 9,073 |
Non-cash transfer of loans to other real estate owned | | | 196 | | | 898 | | | 863 |
See accompanying notes to consolidated financial statements.statements.
Old Second Bancorp, Inc. and Subsidiaries
Consolidated Statements of Changes in Stockholders’ Equity
Years Ended December 31, 2017, 20162021, 2020 and 20152019
(In thousands)
| | | | | | | | | | | | | | | | | | | | | |
| | | | | | | | | | | | | | Accumulated | | | | | | |
| | | | | | | | Additional | | | | | Other | | | | | Total |
| | Common | | Preferred | | Paid-In | | Retained | | Comprehensive | | Treasury | | Stockholders’ |
| | Stock | | Stock | | Capital | | Earnings | | Income (Loss) | | Stock | | Equity |
Balance, December 31, 2014 | | $ | 34,365 | | $ | 47,331 | | $ | 115,332 | | $ | 100,697 | | $ | (7,713) | | $ | (95,849) | | $ | 194,163 |
Net income | | | | | | | | | | | | 15,385 | | | | | | | | | 15,385 |
Other comprehensive loss, net of tax | | | | | | | | | | | | | | | (4,946) | | | | | | (4,946) |
Change in restricted stock | | | 62 | | | | | | (62) | | | | | | | | | | | | - |
Tax effect from vesting of restricted stock | | | | | | | | | 35 | | | | | | | | | | | | 35 |
Stock based compensation | | | | | | | | | 613 | | | | | | | | | | | | 613 |
Purchase of treasury stock | | | | | | | | | | | | | | | | | | (117) | | | (117) |
Redemption of preferred stock | | | | | | (47,331) | | | | | | | | | | | | | | | (47,331) |
Preferred stock accretion and declared dividends | | | | | | | | | | | | (1,873) | | | | | | | | | (1,873) |
Balance, December 31, 2015 | | $ | 34,427 | | $ | - | | $ | 115,918 | | $ | 114,209 | | $ | (12,659) | | $ | (95,966) | | $ | 155,929 |
| | | | | | | | | | | | | | | | | | | | | |
Balance, December 31, 2015 | | $ | 34,427 | | $ | - | | $ | 115,918 | | $ | 114,209 | | $ | (12,659) | | $ | (95,966) | | $ | 155,929 |
Net income | | | | | | | | | | | | 15,684 | | | | | | | | | 15,684 |
Other comprehensive income, net of tax | | | | | | | | | | | | | | | 3,897 | | | | | | 3,897 |
Dividends declared and paid | | | | | | | | | | | | (888) | | | | | | | | | (888) |
Vesting of restricted stock | | | 106 | | | | | | (106) | | | | | | | | | | | | - |
Tax effect from vesting of restricted stock | | | | | | | | | 174 | | | | | | | | | | | | 174 |
Stock option exercised | | | 1 | | | | | | 10 | | | | | | | | | | | | 11 |
Stock based compensation | | | | | | | | | 657 | | | | | | | | | | | | 657 |
Purchase of treasury stock | | | | | | | | | | | | | | | | | | (254) | | | (254) |
Balance, December 31, 2016 | | $ | 34,534 | | $ | - | | $ | 116,653 | | $ | 129,005 | | $ | (8,762) | | $ | (96,220) | | $ | 175,210 |
| | | | | | | | | | | | | | | | | | | | | |
Balance, December 31, 2016 | | $ | 34,534 | | $ | - | | $ | 116,653 | | $ | 129,005 | | $ | (8,762) | | $ | (96,220) | | $ | 175,210 |
Net income | | | | | | | | | | | | 15,138 | | | | | | | | | 15,138 |
Other comprehensive income, net of tax | | | | | | | | | | | | | | | 10,241 | | | | | | 10,241 |
Dividends declared and paid | | | | | | | | | | | | (1,184) | | | | | | | | | (1,184) |
Vesting of restricted stock | | | 92 | | | | | | (92) | | | | | | | | | | | | - |
Stock based compensation | | | | | | | | | 1,181 | | | | | | | | | | | | 1,181 |
Purchase of treasury stock | | | | | | | | | | | | | | | | | | (236) | | | (236) |
Balance, December 31, 2017 | | $ | 34,626 | | $ | - | | $ | 117,742 | | $ | 142,959 | | $ | 1,479 | | $ | (96,456) | | $ | 200,350 |
| | | | | | | | | | | | | | | | | | |
| | | | | | | | | | | Accumulated | | | | | | |
| | | | | Additional | | | | | Other | | | | | Total |
| | Common | | Paid-In | | Retained | | Comprehensive | | Treasury | | Stockholders’ |
| | Stock | | Capital | | Earnings | | Income (Loss) | | Stock | | Equity |
| | | | | | | | | | | | | | | | | | |
Balance, December 31, 2018 | | $ | 34,720 | | $ | 119,081 | | $ | 175,463 | | $ | (4,079) | | $ | (96,104) | | $ | 229,081 |
Net income | | | | | | | | | 39,455 | | | | | | | | | 39,455 |
Other comprehensive income, net of tax | | | | | | | | | | | | 8,641 | | | | | | 8,641 |
Dividends declared and paid, ($0.04 per share) | | | | | | | | | (1,195) | | | | | | | | | (1,195) |
Vesting of restricted stock | | | 132 | | | (634) | | | | | | | | | 502 | | | - |
Tax effect from vesting of restricted stock | | | | | | | | | | | | | | | | | | - |
Reclassification of stranded tax effects | | | | | | | | | | | | | | | | | | - |
Stock option exercised | | | 2 | | | 7 | | | | | | | | | 23 | | | 32 |
Stock warrants exercised | | | | | | (313) | | | | | | | | | 313 | | | - |
Stock based compensation | | | | | | 2,516 | | | | | | | | | | | | 2,516 |
Purchase of treasury stock from taxes withheld on stock awards | | | | | | | | | | | | | | | (666) | | | (666) |
Balance, December 31, 2019 | | $ | 34,854 | | $ | 120,657 | | $ | 213,723 | | $ | 4,562 | | $ | (95,932) | | $ | 277,864 |
| | | | | | | | | | | | | | | | | | |
| | | | | | | | | | | | | | | | | | |
Balance, December 31, 2019 | | $ | 34,854 | | $ | 120,657 | | $ | 213,723 | | $ | 4,562 | | $ | (95,932) | | $ | 277,864 |
Adoption of ASU 2016-13 (CECL) | | | | | | | | | (3,783) | | | | | | | | | (3,783) |
Net income | | | | | | | | | 27,825 | | | | | | | | | 27,825 |
Other comprehensive income, net of tax | | | | | | | | | | | | 10,200 | | | | | | 10,200 |
Dividends declared and paid, ($0.04 per share) | | | | | | | | | (1,186) | | | | | | | | | (1,186) |
Vesting of restricted stock | | | 103 | | | (534) | | | | | | | | | 431 | | | - |
Stock based compensation | | | | | | 2,089 | | | | | | | | | | | | 2,089 |
Purchase of treasury stock from taxes withheld on stock awards | | | | | | | | | | | | | | | (423) | | | (423) |
Purchase of treasury stock from stock repurchase program | | | | | | | | | | | | | | | (5,499) | | | (5,499) |
Balance, December 31, 2020 | | $ | 34,957 | | $ | 122,212 | | $ | 236,579 | | $ | 14,762 | | $ | (101,423) | | $ | 307,087 |
| | | | | | | | | | | | | | | | | | |
| | | | | | | | | | | | | | | | | | |
Balance, December 31, 2020 | | $ | 34,957 | | $ | 122,212 | | $ | 236,579 | | $ | 14,762 | | $ | (101,423) | | $ | 307,087 |
Net income | | | | | | | | | 20,044 | | | | | | | | | 20,044 |
Other comprehensive loss, net of tax | | | | | | | | | | | | (5,994) | | | | | | (5,994) |
Dividends declared and paid, ($0.16 per share) | | | | | | | | | (4,612) | | | | | | | | | (4,612) |
Acquisitions, WSB | | | 9,748 | | | 81,154 | | | | | | | | | 103,582 | | | 194,484 |
Vesting of restricted stock | | | | | | (2,358) | | | | | | | | | 2,358 | | | - |
Stock based compensation | | | | | | 1,435 | | | | | | | | | | | | 1,435 |
Purchase of treasury stock from taxes withheld on stock awards | | | | | | | | | | | | | | | (605) | | | (605) |
Purchase of treasury stock from stock repurchase program | | | | | | | | | | | | | | | (9,812) | | | (9,812) |
Balance, December 31, 2021 | | $ | 44,705 | | $ | 202,443 | | $ | 252,011 | | $ | 8,768 | | $ | (5,900) | | $ | 502,027 |
| | | | | | | | | | | | | | | | | | |
See accompanying notes to consolidated financial statements.
Old Second Bancorp, Inc. and Subsidiaries
Notes to Consolidated Financial Statements
December 31, 2017, 20162021, 2020 and 20152019
(Table amounts in thousands, except per share data)
Note 1: Summary of Significant Accounting Policies
Nature of Operations - Old Second Bancorp, Inc. (the “Company”) is a corporation organized under the laws of the State of Delaware in 1981 that serves as the bank holding company for its wholly-owned subsidiary bank, Old Second National Bank. Old Second National Bank (the “Bank”) is a national banking association headquartered in Aurora, Illinois, that operates through 63 banking centers located in Cook, DeKalb, DuPage, Kane, Kendall, LaSalle and Will counties in Illinois. The Bank is a full-service banking business, offering a broad range of deposit products, trust and wealth management services, and lending services, including commercial, residential and consumer loans. We also offer a full complement of electronic banking services, such as online and mobile banking and corporate cash management products.
The consolidated financial statements of Old Second Bancorp, Inc., and Subsidiaries (the “Company”)the Company include the financial statements of Old Second Bancorp, Inc., a registered bank holding company,the Bank and its wholly-owned bank,subsidiaries, River Street Advisors, LLC, an investment advisory/management service company, Old Second NationalAffordable Housing Fund, L.L.C., which provides down payment assistance for home ownership to qualified individuals, and Melrose Holdings LLC and Station I, LLC, both of which hold property acquired by the Bank (the “Bank”).through foreclosure or in the ordinary course of collecting a debt previously contracted with borrowers. The Company uses the accrual basis of accounting for financial reporting purposes. Certain amounts in prior year financial statements have been reclassified to conform to the 20172021 presentation.
Use of Estimates – The preparation of consolidated financial statements in conformity with generally accepted accounting principles (“GAAP”) and following general practices within the banking industry requires management to make estimates and assumptions that affect the amounts reported in the consolidated financial statements and accompanying notes. Although these estimates and assumptions are based on the best available information, actual results could differ from those estimates.
Principles of Consolidation – The accompanying consolidated financial statements include the accounts and results of operations of the Company and its subsidiaries after elimination of all significant intercompany accounts and transactions. Assets held in a fiduciary or agency capacity are not assets of the Company or its subsidiaries and are not included in the consolidated financial statements.
Segment Reporting – An operating segment is a component of a business entity that engages in business activity from which it may earn revenues and/or incur expenses. ItThe Company has operating results that are reviewed regularly by the entity’s chief operating decision maker in order to make decisions about resource allocation and performance assessment, and the segment has discrete financial information available for this assessment. As of December 31, 2017, the Company had one1 operating segment, which is community banking. While our management monitors the revenue streams of our various products and services, the Company’s operations are managed and financial performance is evaluated on a company-wide basis. Accordingly, all of the Company’s operations are considered to be aggregated in 1 reportable segment.
Concentration of Credit Risk – Most of the Company’s business activity is with customers located within Cook, DeKalb, DuPage, Kane, Kendall, LaSalle and Will counties in Illinois. These banking centers surround or are within the Chicago metropolitan area. Therefore, segment reportingthe Company’s exposure to credit risk is not required.significantly affected by changes in the economy in that market area since the Bank generally makes loans within this market. There are no significant concentrations of loans where the customers’ ability to honor loan terms is dependent upon a single economic sector.
Cash and Cash Equivalents – For purposes of the Consolidated Statements of Cash Flows, management has defined cash and cash equivalents to include cash and due from banks, interest-bearinginterest-earning deposits in other banks,financial institutions, and other short-term investments, such as federal funds sold and securities purchased under agreements to resell. The classification of cash and cash equivalents includes those assets held in the form of cash or liquid instruments with an original maturity of 90 days or less.
Securities – SecuritiesAll of the Company’s securities are classified as available-for-sale, or held-to-maturity at the time of purchase or transfer.
Securities that are classified as available-for-saleand are carried at fair value. Unrealizedvalue, with unrealized gains andor losses, net of related deferred income taxes, aretax, recorded in stockholders’ equity as a separate component of accumulated other comprehensive income (loss).
Realized securities gains or loss. Unrealizedlosses, which are reported in securities gains and losses are not included(losses), net, in the calculationConsolidated Statements of regulatory capital.
Securities held-to-maturityIncome, are carried at amortized costrecognized on a trade date basis and are determined using the discount or premium created at acquisition or in the transfer from available-for-sale is accreted or amortized to the maturity or expected payoff date but not an earlier call.
specific identification method. Discounts are accreted into interest income over the estimated life of the related security and premiums are amortized into income to the earlier of the call date or estimated life of the related security using the level yield method.
PurchasesThe Company has made a policy election to exclude accrued interest income from the amortized cost basis of available-for-sale debt securities and sales of securities are recognized on a trade date basis. Realized securities gains or losses are reportedreport accrued interest separately in securities gains (losses), net,other assets in the Consolidated Statements of Income. The cost of securities soldBalance Sheets. A debt security is basedplaced on nonaccrual status at the specific identification method. On a quarterly basis, the Company makes an assessment (at the individual security level)time we no longer expect to determine whether there have been any events or circumstances indicating thatreceive all contractual amounts due, which is generally at 90 days past due. Accrued interest for a security withplaced on nonaccrual is reversed against interest income. Accordingly, we do not recognize an allowance for credit loss against accrued interest receivable.
For available-for-sale debt securities in an unrealized loss is other-than-temporarily impaired (“OTTI”). In evaluating OTTI, the Company considers many factors, including the severity and duration of the impairment; the financial condition and near-term prospects of the issuer, which for debt securities considers external credit ratings and recent downgrades; its ability and intent to hold the security for a period of time sufficient for a recovery in value; and the likelihood that it will be requiredposition, we first assess whether we intend to sell, the security before a recovery in value, which may be at maturity. The amount of the impairment related to other factors is recognized in other comprehensive income (loss) unless management intends to sell the security or believes it is more likely than not that itwe will be required to sell the security, prior to full recovery.the recovery of its amortized cost basis. If either of the above criteria is met, the security’s amortized cost basis is written down to fair value through earnings. When the criteria above is not met, we evaluate whether the decline in fair value is the result of credit losses or other factors. In making this assessment, we review changes to the rating of the security by a rating agency, an increase in defaults on the underlying collateral, and the extent to which the securities are issued by the federal government or its agencies, including the amount of the guarantee issued by those agencies, among other factors. If this assessment indicates that a credit loss exists, we compare the present value of cash flows expected to be collected from the security with the amortized cost basis of the security. If the present value of cash flows expected to be collected is less than the amortized cost basis for the security, a credit loss exists and an allowance for credit losses is recorded through earnings, limited to the amount that the fair value of the security is less than its amortized cost basis. Any impairment that has not been recorded through an allowance for credit losses is recognized in other comprehensive income (loss), net of taxes.
Changes in the allowance for credit losses are recorded as a provision for (or reversal of) credit loss expense. Losses are charged against the allowance when management believes the uncollectibility of an available for sale debt security is confirmed or when either of the criteria regarding intent or requirement to sell is met.
Federal Home Loan Bank and Federal Reserve Bank Stock – The Company owns the stock of the Federal Home Loan Bank of Chicago (“FHLBC”) and the Federal Reserve Bank of Chicago (“FRBC”). Both of these entities require the Bank to invest in their nonmarketable stock as a condition of membership. The FHLBC is a governmental sponsored entity. The Bank continues to utilize the various products and services of the FHLBC and management considers this stock to be a long-term investment. FHLBC members are required to own a certain amount of stock based on the level of borrowings and other factors, and may invest in additional amounts. FHLBC stock is carried at cost, classified as a restricted security, and periodically evaluated for impairment based on ultimate recovery
of par value. The Company’s ability to redeem the shares owned is dependent on the redemption practices of the FHLBC. The Company records dividends in income on the ex-dividend date. FRBC stock is redeemable at par, and therefore fair value equals cost.
Loans Held-for-Sale – The Bank originates residential mortgage loans, which consist of loan products eligible for sale to the secondary market. Residential mortgage loans eligible for sale in the secondary market are carried at fair market value. The fair value of loans held-for-sale is determined using quoted secondary market prices on similar loans.
Loans – Loans held-for-investment are carried at the principal amount outstanding, including certain net of premiums and discounts associated with acquisition date fair value adjustments on acquired loans, deferred loan origination fees and costs. Acquiredcosts, and any direct principal charge-offs. The Company has made a policy election to exclude accrued interest from the amortized cost basis of loans were assessed for credit impairment upon acquisition. As no impairment was noted,and report accrued interest separately from the loans are carried atrelated loan balance in other assets in the purchased amount, less any purchase accounting discount recorded to mark the loans to fair value. If impairment was noted, the purchase accounting credit mark accretion would be discontinued, and the loan would be evaluated for charge-off to be taken against the remaining mark. Consolidated Balance Sheets.
Interest income on loans is accrued based on principal amounts outstanding. Loan and lease origination fees, commitment fees, and certain direct loan origination costs are deferred and amortized over the life of the related loans or commitments as a yield adjustment. The acquisition adjustment discount related to purchased loans is accreted into interest income over the contractual life of each loan, or is generally taken into income immediately upon payoff or renewal of the loan. Fees related to standby letters of credit, whose ultimate exercise is remote, are amortized into fee income over the estimated life of the commitment. Other credit-relatedrelated fees are recognized as fee income when earned.
Concentration of Credit Risk – MostPast Due and Nonaccrual Loans
Loans are considered past due or delinquent when the contractual principal or interest due in accordance with the terms of the Company’s business activity is with customers located within Kane, Kendall, DeKalb, DuPage, LaSalle, Will and Cook counties in Illinois. These banking centers surroundloan agreement or are withinany portion thereof remains unpaid after the Chicago metropolitan area. Therefore, the Company’s exposure to credit risk is significantly affected by changes in the economy in that market area since the Bank generally makes loans within its market. There are no significant concentrations of loans where the customers’ ability to honor loan terms is dependent upon a single economic sector.
Commercial Loans – Such credits typically comprise working capital loans, loans for physical asset expansion, asset acquisition loans and other commercial and industrial business loans. Loans to closely held businesses will generally be guaranteed in full or for a meaningful amount by the businesses’ major owners. Commercial loans are made based primarily on the historical and projected cash flowdue date of the borrower and secondarily on the underlying collateral provided by the borrower. The cash flows of borrowers, however, may not behave as forecasted and collateral securingscheduled payment. Generally, loans may fluctuate in value due to economic or individual performance factors. Minimum standards and underwriting guidelines have been established for all commercial loan types.
Lease Financing Receivables – Lease financing receivables are subject to underwriting standards and processes similar to commercial loans. These loans are often secured by equipment or transportation assets, and are made based primarily on the historical and projected cash flow of the borrower and secondarily on the underlying collateral provided by the borrower. The cash flows of borrowers, however, may not behave as forecasted and collateral securing loans may fluctuate in value due to economic or individual performance factors.
Real Estate - Commercial Loans – Real estate - commercial loans are subject to underwriting standards and processes similar to commercial and industrial loans. These are loans secured by mortgages on real estate collateral. Commercial real estate loans are viewed primarily as cash flow loans and the repayment of these loans is largely dependent on the successful operation of the property. Loan performance may be adversely affected by factors impacting the general economy or conditions specific to the real estate market such as geographic location and/or property type.
Real Estate - Construction Loans – The Company defines real estate - construction loans as loans where the loan proceeds are controlled by the Company and used exclusively for the improvement or development of real estate in which the Company holds a mortgage. Due to the inherent risk in this type of loan, they are subject to other industry specific policy guidelines outlined in the Company’s Credit Risk Policy and are monitored closely.
Real Estate - Residential Loans – These are loans that are extended to purchase or refinance 1-4 family residential dwellings, or to purchase or refinance vacant lots intended for the construction of a 1-4 family home. Residential real estate loans are considered homogenous in nature. Homes may be the primary or secondary residence of the borrower or may be investment properties of the borrower.
Consumer Loans – Consumer loans include loans extended primarily for consumer and household purposes. These also include overdrafts and other items not captured by the definitions above.
Nonaccrual Loans – Generally, commercial and consumer loans, as well as loans secured by real estate are placed on nonaccrual status (i) when either principal or interest payments become 90 days or more past due based on contractual terms unless the loan is sufficiently collateralized such that full repayment of both principal and interest is expected and is in the process of collection within a reasonable period or (ii) when an individual analysis of a borrower’s creditworthiness indicates a credit should be placed on nonaccrual status whether or not the loan is 90 days or more past due. When a loan is placed on nonaccrual status, unpaid interest credited to income is reversed. Generally, afterInterest received on such loans is accounted for on the cash-basis or cost recovery method, until qualifying for return to accrual. Under the cost-recovery method, interest income is not recognized until the loan balance is placed on nonaccrual, all debt service payments are appliedreduced to zero. Under the principal oncash basis method, interest income is recorded when the loan.
payment is received in cash. Nonaccrual loans are returned to accrual status when the financial position of the borrower and other relevant factors indicate there is no longer doubt that the Company will collect all principal and interest due.
Commercial, consumer and real estate loans are generally charged-off when deemed uncollectible. A loss is recorded at that time if the net realizable value can be quantified and it is less than the associated principal outstanding.
Troubled Debt Restructurings (“TDRs”) –
A restructuring of debt is considered a TDR when (i) the borrower is experiencing financial difficulties and (ii) the creditor grants a concession, such as forgiveness of principal, reduction of the interest rate, changes in payments, or extension of the maturity, that it would not otherwise consider. Loans are not classified as TDRs when the modification is short-term or results in only an insignificant delay or shortfall in the payments to be received. The Company’s TDRs are determined on a case-by-case basis in connection with ongoing loan collection processes.
The Company does not accrue interest on any TDRs unless it believes collection of all principal and interest under the modified terms is reasonably assured. For TDRs to accrue interest, the borrower must demonstrate both some level of past performance and the capacity to perform under the modified terms. Generally, six months of consecutive payment performance by the borrower under the restructured terms is required before TDRs are returned to accrual status. However, the period could vary depending on the individual facts and circumstances of the loan. An evaluation of the borrower’s current creditworthiness is used to assess whether the borrower has the capacity to repay the loan under the modified terms. This evaluation includes an estimate of expected cash flows, evidence of strong financial position, and estimates of the value of collateral, if applicable.
ImpairedPurchase Credit Deteriorated (PCD) Loans – Impaired
Purchased credit deteriorated loans consist(“PCD loans”) are purchased loans, that, as of nonaccrualthe date of acquisition, have experienced a more-than-insignificant deterioration in credit quality since origination, as determined by the Company’s assessment. An allowance for credit losses is determined using the same methodology as other loans held for investment. The initial allowance for credit losses determined on an individual loan basis from an evaluation of each specific loan and TDRs (both accruingits related credit metrics. The sum of the loan’s purchase price and on nonaccrual). Ainitial allowance for credit losses becomes its initial amortized cost basis. The difference between the initial amortized cost basis and the par value of the loan is considered impaired when ita noncredit discount or premium, which is probable thataccreted or amortized into interest income over the Company will be unable to collect alllife of the loan. Expected cash flows in excess of the amount paid are recorded as interest income over the remaining life of the loans (accretable yield). The excess of the loan’s contractual principal and interest due accordingover expected cash flows is not recorded (nonaccretable difference).
Subsequent changes to the termsallowance for credit losses are recorded through provision for credit losses. Over the life of the loan, agreement based on current information and events. With the exception of TDRs still accruing interest, loans deemedexpected cash flows continue to be impairedestimated. If the present value of expected cash flows is less than the carrying amount, a loss is recorded as a provision for credit losses. If the present value of expected cash flows is greater than the carrying value, it is recognized as part of future interest income.
Non-Purchase Credit Deteriorated (Non-PCD) Loans
Non-purchased credit deteriorated loans (“non-PCD loans”) are classifiedpurchased loans, that, as nonaccrualof the date of acquisition, have not experienced a significant deterioration in credit quality since origination, as determined by the Company’s assessment. An allowance for credit losses is determined using the same methodology as other loans held for investment, and are exclusiveno allowance is established as a Day One fair valuation allowance. The sum of smaller homogeneous loans, such as home equity, 1-4 family mortgages, and consumer loans.
90-Days or Greater Past Due Loans – 90-days or greater past due loans are loans with principal or interest payments three months or more past due, but that still accrue interest.the loan’s purchase price becomes its initial amortized cost basis. The Company continues to accrue interest if it determines these loans are sufficiently collateralizeddifference between the initial amortized cost basis and the processpar value of collection will conclude withinthe loan is a reasonable time period.discount or premium, which is comprised of an interest component and a credit component, and is accreted or amortized into interest income over the life of the loan. Expected cash flows in excess of the amount paid are recorded as interest income over the remaining life of the loans (accretable yield). The excess of the loan’s contractual principal and interest over expected cash flows is not recorded (nonaccretable difference).
A subsequent Day Two adjustment on non-PCD loans is recorded to the allowance for credit losses immediately after acquisition, which reflects the future estimated lifetime credit losses on the non-PCD loans, recorded through the provision for credit losses. Over the life of the loan, expected cash flows continue to be estimated. If the present value of expected cash flows is less than the carrying amount, a loss is recorded as a provision for credit losses. If the present value of expected cash flows is greater than the carrying value, it is recognized as part of future interest income.
On January 1, 2020, the Company implemented ASU No. 2016-13, “Financial Instruments – Credit Measurement of Credit Losses on Financial Instruments (Topic 326),” also known as Current Expected Credit Losses, or CECL. As a result of CECL implementation, the Company’s purchase credit impaired loans (“PCI loans”) became PCD loans.
Allowance for Loan and LeaseCredit Losses (“ALLL”ACL”) –
ACL on Loans
The ALLLACL on loans is calculated accordinga valuation account that is deducted from the amortized cost basis of loans to GAAP standards and is maintained by management at a level believed adequatepresent the net amount expected to absorb estimatedbe collected on loans. The Company’s estimate of the ACL for loans reflects losses inherent inexpected over the existing loan portfolio. remaining contractual life of the loans. The contractual term does not consider extensions, renewals or modifications unless the Company has identified an expected troubled debt restructuring.
Determination of the ALLLACL on loans is inherently subjective in nature since it requires significant estimates and management judgment, and includes a level of imprecision given the difficulty of identifying and assessing the factors impacting loan repayment and estimating the timing and amount of losses. While management utilizes its best judgment and information available, the ultimate adequacy of the ALLLACL is dependent upon a variety of factors beyond the Company’s direct control, including, but not limited to, the performance of the loan portfolio, consideration of current economic trends, changes in interest rates and property values, the amounts and timing of expected future cash flows on impaired loans, estimated losses on pools of homogeneous loans based on an analysis that uses historical loss experience for prior periods that are determined to have like characteristics with the current period such as pre-recessionary, recessionary, or recovery periods, portfolio growth and concentration
risk, management and staffing changes, the interpretation of loan risk classifications by regulatory authorities and other credit market factors. While each component of the ALLLACL on loans is determined separately, the entire balance is available for the entire loan portfolio.
Loans deemed to be uncollectible are charged-off against the ALLL while recoveries of amounts previously charged-off are credited to the ALLL. Approved releases from previously established loan loss reserves authorized under our allowance methodology also reduce the ALLL. Additions to the allowance are established through the provision for loan and lease losses charged to expense.
The ALLLACL methodology consists of (i) specific reserves established for probable lossesmeasuring loans on individuala collective (pool) basis when similar risk characteristics exist. The type of credit composition and risk characteristics of each portfolio segment are as follows:
Commercial loans – Such credits typically comprise working capital loans, loans for whichphysical asset expansion, asset acquisition loans and other commercial and industrial business loans. Loans to closely held businesses will generally be guaranteed in full or for a meaningful amount by the recorded investment inbusinesses’ major owners. Commercial loans are made based primarily on the loan exceedshistorical and projected cash flow of the present value of expected future cash flows or the net realizable value ofborrower and secondarily on the underlying collateral ifprovided by the borrower. The cash flows of borrowers, however, may not behave as forecasted and collateral dependent, (ii) an allowancesecuring loans may fluctuate in value due to economic or individual performance factors. Minimum standards and underwriting guidelines have been established for all commercial loan types. The Company classifies five different risk levels for this segment to assign a loss rate based on historical losses, and also performs an analysis using expectations for the weighted risk rating trends to run a regression analysis to a severe loss scenario to determine adjustments needed within the special mention and substandard sub-segments.
Lease financing receivables – Lease financing receivables are subject to underwriting standards and processes similar to commercial loans. These loans are often secured by equipment or transportation assets, and are made based primarily on the historical and projected cash flow of the borrower and secondarily on the underlying collateral provided by the borrower. The cash flows of borrowers, however, may not behave as forecasted and collateral securing loans may fluctuate in value due to economic or individual performance factors. In accordance with accounting standards, a peer group has been identified and is used to estimate losses for this portfolio, as this segment is relatively new to the Company and more than four years of the Company’s own historical loss analysis that uses credit loss experiencedata is not available.
Real estate - commercial loans – Real estate - commercial loans are subject to underwriting standards and processes similar to commercial and industrial loans. These are loans secured by mortgages on real estate collateral. Commercial real estate loans are viewed primarily as cash flow loans and the repayment of these loans is largely dependent on the successful operation of the property. Loan performance may be adversely affected by factors impacting the general economy or conditions specific to the real estate market such as geographic location and/or property type. The real estate – commercial segments utilized for the ACL on loans are:
| ● | CRE owner occupied – the Company classifies five different risk levels within this segment to assign a loss rate based on historical losses, as well as utilizing a forecasted average unemployment rate for the next twelve months as a loss driver. |
| ● | CRE investor – the Company classifies five different risk levels within this segment to assign a loss rate based on historical losses, as well as utilizing a forecasted average unemployment rate for the next twelve months as a loss driver. The primary difference between this segment and CRE owner occupied is within the slightly elevated historical loss rates and qualitative factors used, as the CRE investor properties are sponsored compared to owner occupied. |
Real estate – construction loans – The Company defines real estate - construction loans as loans where the loan proceeds are controlled by the Company and used exclusively for the improvement or development of real estate in which the Company holds a mortgage. Due to the inherent risk in this type of loan, they are subject to other industry specific policy guidelines outlined in the Company’s Credit Risk Policy and are monitored closely. The Company’s historical loss rates are utilized from the prior 20 quartersperiods which align to the current unemployment projections.
Real estate - residential loans– These are loans that are extended to purchase or refinance 1-4 family residential dwellings, or to purchase or refinance vacant lots intended for the construction of a 1-4 family home. Residential real estate loans are considered homogenous in nature. Homes may be the primary or secondary residence of the borrower or may be investment properties of the borrower. The real estate – residential segments utilized for the ACL on loans are:
| ● | Residential owner-occupied – the Company applies historical loss rates from periods with like characteristics as the current period, with a longer remaining life than other segments, due to the usually longer-term nature of these loans. |
| ● | Residential investor – the Company applies historical loss rates from periods with like characteristics as the current period, with a slightly longer remaining life than other segments, but shorter duration than residential owner-occupied. |
| ● | Multifamily– the Company classifies five different risk levels within this segment to assign a loss rate based on historical losses, as well as utilizing a forecasted average unemployment rate for the next twelve months as a loss driver. |
Home equity lines of credit (“HELOCs”) – These are lines of credit that are extended to refinance 1-4 family residential dwellings, or to finance the borrower’s needs and collateralized by the borrower’s residence. These lines may be fixed or variable in nature, and the home serving as collateral may also have a first lien outstanding. The HELOC segments utilized for the ACL on loans are:
| ● | HELOC legacy - The Company’s historical loss rates are utilized from the prior periods which align to the current unemployment projections. |
| ● | HELOC purchased - The Company’s historical loss rates are utilized from the prior periods which align to the current unemployment projections; in addition, the peer data source used for loss rate analysis is the correspondent bank from which we purchased the HELOCs. |
Consumer loans – Consumer loans include loans extended primarily for consumer and household purposes. These also include overdrafts and other items not captured by the definitions above. The primary loss factor for this segment included the unemployment rate forecast for the next twelve months.
The methodologies used for calculating the ACL on each loan segment include (i) a migration analysis for commercial, CRE owner occupied, CRE investor, and multifamily segments; (ii) a static analysis for construction, residential investor, residential owner occupied and the legacy HELOC segments; and (iii) a WARM (weighted average remaining life) methodology is used for lease financing receivables, HELOCs purchased, and consumer segments. For loan pools sub-segmented by risk level, which include commercial, real estate-commercial and multifamily segments, linear regression methods were utilized along with expected industry performance over the next twelve months to determine what level of qualitative adjustment would be necessary to account for expected risk rating migration. This methodology relied heavily on existing and anticipated weighted risk ratings by industry or property type. The forecast period used for each segment calculation was one year, with an immediate reversion to historical loss rates following this one year period. In addition, the Company applies qualitative adjustments to each different loan category, and (iii)or lease segment, as described below.
The qualitative factors applied to eachloanportfolio consist of the impact of other internal and external qualitative and credit market factors as assessed by management through a detailed loan review, allowanceACL analysis and credit discussions. These internal and external qualitative and credit market factors include:
| ● | changes in lending policies and procedures, including changes in underwriting standards and collections, charge-offs and recovery practices; |
| ● | changes in international, national, regionally and local conditions (specific factors which impact portfolios or discrepancies with national economic factors which are utilized within the economic forecast); |
| ● | changes in the experience, depth and ability of lending management; |
| ● | changes in the volume and severity of past due loans and other similar loan conditions; |
| ● | changes in the nature and volume of the loan portfolio and terms of loans; |
| ● | the existence and effect of any concentrations of credit and changes in the levels of such concentrations (this characteristic requires any portfolio exceeding 25% of capital to have a factor considered unless the pool is otherwise well diversified or holds a relatively low inherent risk); |
| ● | effects of other external factors, such as competition, legal or regulatory factors, on the level of estimated credit losses; |
| ● | changes in the quality of our loan review functions; and |
| ● | changes in the value of underlying collateral for collateral dependent loans. |
In 2016,The impact of the Company significantly refined its ALLL methodologyabove listed internal and external qualitative and credit market risk factors is assessed within predetermined ranges to further stratifyadjust the loan portfolioACL totals calculated. Changes in the above factors are assessed no less than quarterly, and apply unique factors to each segment. The changes implemented in 2016 segregatedirectly impact the total estimated credit losses recorded. Specific factor updates that drove the changes to the total ACL in 2021 included a reduction in the unemployment rate for the forecast period, a decrease in line utilization rates due to continuing borrower liquidity, and the acquisition of West Suburban, which increased loan portfolio into further detail, moving from seven loan classifications to nine when applying management risk factors,volumes and from four loan classifications to nine when applying historical loss rates.total nonperforming loans year over year. The Company also enhancedabove methods are consistent with the methods utilized in the prior processyear, since the adoption of applying managementCECL as of January 1, 2020.
Loans that do not share risk factors for changes incharacteristics are evaluated on an individual basis. Such loans portfolio trends, such as factors for changesevaluated individually are not also included in the trendcollective evaluation. The amount of expected credit loss is measured based upon the present value of expected future cash flows discounted at the loan’s effective interest rate or volume of past due and classified loans, changes in the nature and volumefair value of the portfolio and concentrations, changes in lending policy, procedures,underlying collateral less applicable selling costs. When management and staffing, and other external factors. These factors were historically analyzed indetermines that foreclosure is probable, the amount of credit loss is determined using the fair value of collateral, less costs to sell.
Loans are charged off against the ACL when management believes the uncollectibility of a loan balance is confirmed, while recoveries of amounts previously charged-off are credited to the ACL. Expected recoveries do not exceed the aggregate of amounts previously charged-off and expected to arrive at one risk factor per loan classification;be charged off. Approved releases from previously established ACL reserves authorized under our ACL methodology also reduce the revised methodology,ACL. Additions to the Company assigns each of these components its own risk factor, as well as encompasses an additional risk ratingACL are established through the provision for credit losses on loans, rated as pass/watch. which is charged to expense.
The Company continuedCompany’s ACL methodology is intended to refine its ALLL methodologyreflect all loan portfolio risk, but management recognizes the inability to accurately depict all future credit losses in 2017, with implementation of additional management factor classifications for newer loan portfolios, sucha current ACL estimate, as the Company’s recent purchaseimpact of home equity linesvarious factors cannot be fully known. Accrued interest receivable on loans is excluded from the amortized cost basis of financing receivables for the purpose of determining the allowance for credit (“HELOCs”) and the recently
ACL on Unfunded Loan Commitments
expanded business development companyThe Company estimates expected credit losses over the contractual period in which the Company is exposed to credit risk by a contractual obligation to extend credit, unless that obligation is unconditionally cancellable by the Company. The ACL related to off-balance sheet credit exposures, which is within other liabilities on the Company’s Consolidated Balance Sheets, is estimated at each balance sheet date under the CECL model, and is adjusted as determined necessary through the provision for credit losses on the income statement. The estimate for ACL on unfunded loan portfolio, as these portfolios have not been outstanding long enoughcommitments includes consideration of the likelihood that funding will occur and an estimate of expected credit losses on commitments expected to be sufficiently seasoned. In addition, the Company revised the risk weightings for the historical loss factors to reflect a five basis point increase to the loss factor applied in the earliest quarter, and a reduction of five basis points in the most recent quarter, as management believes the lower charge-off levels in the more recent quarters will likely not continue long-term.funded over its estimated life.
These modifications to the Company’s ALLL methodology are intended to more accurately reflect all portfolio risk, and resulted in a decrease to the overall unallocated component of the allowance over the past two years. The unallocated component of the allowance was $542,000 as of December 31, 2017, compared to $435,000 as of December 31, 2016 and $2.0 million as of December 31, 2015. All calculations conform to GAAP.
Premises and Equipment – Premises, furniture, equipment, and leasehold improvements are stated at cost less accumulated depreciation and amortization. Depreciation expense is determined by the straight-line method over the estimated useful lives of the assets. Leasehold improvements are amortized on a straight-line basis over the shorter of the life of the asset or the lease term including anticipated renewals. Rates of depreciation are generally based on the following useful lives: buildings, 25 to 40 years; building improvements, 3 to 15 years or longer under limited circumstances; and furniture and equipment, 3 to 10 years. Gains and losses on dispositions are included in other noninterest incomeexpense in the Consolidated Statements of Income. Maintenance and repairs are charged to operating expenses as incurred, while improvements that conform to definitions of tangible property improvements are capitalized and depreciated over the estimated remaining life.
Whenever events or changes in circumstances dictate, the Company tests its long-lived assets for impairment by determining whether the sum of the estimated undiscounted future cash flows attributable to a long-lived asset or asset group is less than the carrying value of the long-lived asset or asset group through a probability-weighted approach. In the event the carrying amount of the long-lived asset or asset group is not recoverable, an impairment loss is measured as the amount by which the carrying amount of the long-lived asset or asset group exceeds its fair value.
Other Real Estate Owned (“OREO”) – Real estate assets acquired in settlement of loans are recorded at the fair value of the property when acquired, less estimated costs to sell, establishing a new cost basis. Physical possession of residential real estate property collateralizing a consumer mortgage loan occurs when legal title is obtained upon foreclosure or when the borrower conveys all interest in the property to satisfy the loan through completion of a deed in lieu of foreclosure or through a similar legal agreement. Any deficiency between the net book value and fair value at the foreclosure or deed in lieu date is charged to the ALLL.ACL. Any reduction in OREO carrying value within 90 days of transfer to OREO would be charged to the ACL. If the fair value subsequently declines,of the property when acquired, less estimated costs to sell, is greater than the net book value of the loan, a gain on transfer is recorded. If a determination is made more than 90 days after the transfer to OREO that the fair value for the OREO property has declined, an OREO valuation allowance is established for the decrease between the recorded value and the updated fair value less costs to sell. Such declines are included in other noninterest expense in the Consolidated Statements of Income. A subsequent reversal of an OREO valuation adjustment can occur, but the resultant carrying value cannot exceed the cost basis established at transfer of the loan to OREO. Operating costs after acquisition are also expensed.
Mortgage Servicing Rights – The Bank is also involved in the business of servicing mortgage loans. Servicing activities include collecting principal, interest, and escrow payments from borrowers, making tax and insurance payments on behalf of the borrowers, monitoring delinquencies, executing foreclosure proceedings, and accounting for and remitting principal and interest payments to the investors. Mortgage servicing rights represent the right to a stream of cash flows and an obligation to perform specified residential mortgage servicing activities.
Mortgage loans that the Company is servicing for others aggregated to $695.1$801.9 million and $668.2$793.5 million at December 31, 2017,2021, and 2016,2020, respectively. Mortgage loans that the Company is servicing for others are not included in the consolidated balance sheets. Fees received in connection with servicing loans for others are recognized as earned. Loan servicing costs are charged to expense as incurred.
Servicing rights are recognized separately as assets when they are acquired through sales of loans and servicing rights are retained. Servicing rights are initially recorded at fair value with the effect recorded in net gains on sales of mortgage loans in the Consolidated Statements of Income. Fair value is based on market prices for comparable mortgage servicing contracts, when available, or alternatively, is based on a valuation model that calculates the present value of estimated future net servicing income. The valuation model incorporates assumptions that market participants would use in estimating future net servicing income, such as the cost to service, the discount rate, the custodial earnings rate, an inflation rate, ancillary income, prepayment speeds and default rates and losses.
Servicing fee income, which is included in the Consolidated Statements of Income as mortgage servicing income, is recorded for fees earned for servicing loans. The fees are based on a contractual percentage of the outstanding principal or a fixed amount per loan and are recorded as income when earned.
Under the fair value measurement method, the Company measures mortgage servicing rights at fair value at each reporting date, reports changes in fair value of servicing assets in earnings in the period in which the changes occur, and includes these changes in mortgage servicing rights mark to market in the Consolidated Statements of Income. The fair values of mortgage servicing rights are subject to significant fluctuations as a result of changes in estimated and actual prepayment speeds and default rates and losses.
Bank-Owned Life Insurance (“BOLI”) – BOLI represents life insurance policies on the lives of certain Company employees (both current and former) for which the Company is the sole owner and beneficiary. These policies are recorded as an asset on the Consolidated
Balance Sheets at their cash surrender value (“CSV”) or the amount that could be realized. The change in CSV and insurance proceeds received areis recorded as an increase in cash surrender value of bank-owned life insurance in the Consolidated Statements of Income in noninterest income. In addition, insurance proceeds received, net of the original premium investment, are recorded as death benefit realized on bank-owned life insurance in the Consolidated Statements of Income in noninterest income.
Goodwill and Core Deposit Intangible – Goodwill is the excess of an acquisition’s purchase price over the fair value of identified net assets acquired in an acquisition. Goodwillacquisition and is not deemed to have definitive life span, and therefore is not amortized, but is subject to annual reviewevaluated at least annually for impairment. The Company performs its annual evaluation for goodwill impairment at November 30 each year and may elect to perform a quantitative or qualitative analysis or first conduct a qualitative analysis to determine if a quantitative analysis is necessary. In addition, the Company evaluates goodwill impairment on an interim basis if events or changes in circumstances indicate the asset might be impaired. The factors reviewed by the Company when completing a qualitative analysis include, but are not limited to, macroeconomic data, industry specific data, current market conditions, and the Company’s overall financial performance.
The Company’s November 30, 2021 and 2020 qualitative goodwill assessments resulted in the Company determining goodwill was not impaired, as it was more likely than not the Company’s fair value exceeded its carrying value. Due to the significant deterioration of economic conditions stemming from the COVID-19 pandemic during 2020, the Company performed interim impairment evaluations at March 31, June 30 and September 30, 2020, to assess impairment indicators, due to the decline in the trading price of our common stock, an elevated U.S. unemployment rate, and the expected impact of the pandemic on our business, operations, and financial condition. As the negative market indicators were not observed over a sustained period of time, we determined it was more likely than not the Company’s fair value exceeded its carrying value. Accordingly, a quantitative analysis was not performed.
The core deposit intangible (“CDI”) is being amortized on an accelerated method over a ten year estimated useful life. As of December 31, 2021, CDI totaled $16.3 million, which reflected growth of $14.8 million due to the addition of CDI stemming from the West Suburban acquisition. As of December 31, 2020, CDI totaled $2.2 million, stemming from the Company’s purchase of ABC Bank in 2018 and the Talmer branch purchase in 2016. Total CDI amortization expense of $644,000, $494,000, and $539,000 was recorded in 2021, 2020, and 2019, respectively. The expected future annual amortization expense for each of the next five years (2022-2026) is approximately $2.6 million, $2.5 million, $2.3 million, $2.1 million, and $1.8 million, respectively.
Debt Issuance Costs – Costs associated with the issuance of debt are presented in the Consolidated Balance Sheet as a direct reduction from the carrying value of that debt liability. The deferred issuance costs are amortized over the life the related debt instrument, and included within the debt’s interest expense.
Loss Contingencies – Loss contingencies, including claims and legal actions arising in the ordinary course of business, are recorded as liabilities when the likelihood of loss is probable and an amount or range of loss can be reasonably estimated. Management does not believe there are such matters that will have a material effect on the financial statements.
Wealth ManagementNoninterest Income – Assets heldThe Company recognizes revenue when the performance obligations related to the transfer of goods or services are satisfied. Certain obligations are satisfied at one point in time, while other obligations may be satisfied over a fiduciary or agency capacity for customersperiod of time. Revenues are not included insegregated based on the consolidated financial statements as they are not assetsnature of the Companyproduct or its subsidiaries. Feeservice offered. Wealth management fees, service charges on deposits and card related income isare included as a componentcomponents of noninterest income in the Consolidated Statements of Income.
Wealth management – includes fees generated from personal, commercial and institutional clients. The Company also provides asset management services, cash management services and income tax reporting. Revenue is recognized over the period of time in which these services are performed.
Service charges on deposits – includes fees and income received by the Company for performing various services, such as deposit account maintenance fees, overdraft coverage and processing fees, stop payment charges, and other deposit account related services. Revenue is recognized based on the service agreement in place, and is recorded when the service is provided to the customer. This item is net of any service charge refunds or return charge refunds.
Card related income – includes interchange fees earned on debit cards and credit cards, ATM/ITM related fee income, and gift card related income. Annual fees and interest income on card-related products are recognized within interest income in accordance with ASC 310. The Company recognizes card related income when the cardholder’s transaction with the merchant or ATM/ITM occurs, thus satisfying the performance obligation. Card related expenses, such as disbursements to the payment network, reward program costs, and other operational costs are carried within card related expense, as a component of noninterest expense, on the Consolidated Statements of Income.
Advertising Costs – All advertising costs incurred by the Company are expensed in the period in which they are incurred.
Equity Incentive Plan – Compensation cost is recognized for stock options and restricted stock awards issued to employees based upon the fair value of the awards at the date of grant. A binomial model is utilized to estimate the fair value of stock options, which utilizes assumptions for expected volatilities based on the previous five-year historical volatilities of the Company's common stock. Historical
data is used to estimate option exercise rates and post-vesting termination behavior, and the risk-free interest rate for the expected term of the option is based on the Treasury yield curve in effect at the time of grant. The market price of the Company’s common stock at the date of grant is used for restricted stock awards, which include restricted stock units. Compensation cost is recognized over the required service period, generally defined as the vesting period.period, and is net of a 5% forfeiture assumption for group grants. Upon vesting, compensation costs for the award expense is trued up based on actual forfeitures incurred. Once the award is settled, the Company would determine whether the cumulative tax deduction exceeded the cumulative compensation cost recognized in the Consolidated Statement of Income. The cumulative tax deduction would include both the deductions from the dividends and the deduction from the exercise or vesting of the award. If the tax benefit received from the cumulative deductions exceeds the tax effect of the recognized cumulative compensation cost, the excess would be recognized as a credit to income tax expense.
IncomeIncome Taxes – The Company files income tax returns in the U.S. federal jurisdiction, and in the states of Illinois, Arizona, California, Florida, Indiana, Michigan, New Hampshire, Pennsylvania, Tennessee, Texas, and Wisconsin. The provision for income taxes is based on income in the consolidated financial statements, rather than amounts reported on the Company’s income tax return. Income tax expense is the total of the current year income tax due or refundable and the change in deferred tax assets and liabilities. Any change in tax rates will be recorded in the period in which the law is enacted.
Deferred tax assets and liabilities are recognized for the future tax consequences attributable to differences between the financial statement carrying amounts of existing assets and liabilities and their respective tax bases. Deferred tax assets and liabilities are measured using the enacted tax rates that are expected to apply to taxable income in years in which those temporary differences are expected to be recovered or settled.
As of December 31, 20172021 and 2016,2020 the Company evaluated tax positions taken for filingfilings with the Internal Revenue Service and all state jurisdictions in which it operates. The Company believes that income tax filing positions will be sustained under examination and does not anticipate any adjustments that would result in a material adverse effect on the Company’s financial condition, results of operations, or cash flows. Accordingly, the Company has not recorded any reserves or related accruals for interest and penalties for uncertain tax positions at December 31, 2017 and 2016.2021 or 2020. The Company is currently open to audit under the statute of limitations by the Internal Revenue Servicefor Federal taxes from 20142018 to 2020 and various state jurisdictions from 2016 the state of Illinois from 2014 to 2016, and the states of Wisconsin and Indiana from 2009 to 2016.2020.
Earnings Per Common Share (“EPS”) – Basic EPS is computed by dividing net income applicable to common stockholders by the weighted-average number of common shares outstanding for the period. Diluted EPS is computed by dividing net income applicable to common stockholders by the weighted-average number of common shares outstanding plus the number of additional common shares that would have been outstanding if the dilutive potential shares had been issued. The Company’s potential common shares represent shares issuable under its long-term incentive compensation plans and under the common stock warrant issued to preferred stockholders.plans. Such common stock equivalents are computed based on the treasury stock method using the average market price for the period.
Treasury Stock – Treasury stock acquired is recorded at cost and is carried as a reduction of stockholders’ equity in the Consolidated Balance Sheet.Sheets. Treasury stock issued is valued based on the “last in, first out” inventory method. The difference between the consideration received upon issuance and the carrying value is charged or credited to additional paid-in capital.
Mortgage Banking Derivatives – As part of the ongoing residential mortgage business, the Company enters into mortgage banking derivatives such as forward contracts and interest rate lock commitments. The derivatives and loans held-for-sale are carried at fair
value with the changes in fair value recorded in current earnings. The net gain or loss on mortgage banking derivatives is included in net gains on sales of loans in the Consolidated Statements of Income.
Derivative Financial Instruments – The Company occasionally enters into derivative financial instruments as part of its interest rate risk management strategies. These derivative financial instruments consist primarily of interest rate swaps; in addition, three risk participation agreements were held by the Company as of December 31, 2017, and one was held as of December 31, 2016. All risk participation agreements are recorded at fair value and are immaterial.
swaps. The Company records all derivatives on the balance sheet at fair value. The accounting for changes in the fair value of derivatives depends on the intended use of the derivative and whether the Company has elected to designate a derivative as a hedging relationship and apply hedge accounting. A further consideration involves a determination on whether the hedging relationship has satisfied the criteria necessary to apply hedge accounting. Derivatives designated and qualifying as a hedge of the exposure to changes in the fair value of an asset, liability, or firm commitment attributable to a particular risk, such as interest rate risk, are considered fair value hedges. Hedge accounting generally provides for the matching of the timing of gain or loss recognition on the hedging instrument with the recognition of the changes in the fair value of the hedged asset or liability that are attributable to the hedged risk in a fair value hedge or the earnings effect of the hedged forecasted transactions in a cash flow hedge. The Company may enter into derivative contracts that are intended to economically hedge certain risks, even though hedge accounting does not apply or the Company elects not to apply hedge accounting.
If it is determined that the derivative instrument is not highly effective as a hedge, hedge accounting is discontinued, and the adjustment to fair value of the derivative instrument is recorded in earnings. For a derivative used to hedge changes in cash flows associated with forecasted transactions, the gain or loss on the effective portion of the derivative areis deferred and reported as a component of accumulated other comprehensive income, which is a component of stockholders’ equity, until such time the hedged transaction affects earnings. For derivative instruments not accounted for as hedges, changes in fair value are recognized in noninterest income/expense. Counterparty risk with correspondent banksloan customers is consideredmanaged through loan covenant agreements and, as such, does not have a significant impact on the fair value
of the swaps. Counterparty risk with other banks is managed through bilateral collateralization agreements. Deferred gains and losses from derivatives not accounted for as hedges and that are terminated are amortized over the shorter of the original remaining term of the derivative or the remaining life of the underlying asset or liability.
Comprehensive Income – Comprehensive income is the total of reported earnings for all other revenues, expenses, gains, and losses that are not reported in earnings under GAAP. The Company includes the following items, net of tax, in other comprehensive income in the Consolidated Statements of Comprehensive Income: (i) changes in unrealized gains or losses on securities available-for-sale, (ii) changes in unrealized gains or losses on securities held-to-maturity established upon transfer from securities available-for-sale and (iii) the effective portion of a derivative used to hedge cash flows.
Accumulated other comprehensive income (loss) at December 31, 2017 and 2016, is comprised of unrealized gains on securities of $2.2 million and unrealized losses on securities of $8.2 million, respectively, and unrealized losses on a cash flow hedge of $760,000 and $596,000, respectively.
Recent Accounting Pronouncements – The following is a summary of recent accounting pronouncements that have impacted or could potentially affect the Company:
ASU 2018-16, ASU 2020-04 and ASU 2021-01 - In May 2014,October 2018 the FASB issued ASU No. 2014-09 "Revenue from Contracts with Customers2018-16 “Derivatives and Hedging (Topic 606)." The core principle815): Inclusion of the guidanceSecured Overnight Financing Rate (SOFR) Overnight Index Swap (OIS) Rate as a Benchmark Interest Rate for Hedge Accounting.” ASU 2018-16 adds the SOFR overnight index swap rate to the list of United States (U.S.) benchmark rates eligible for hedge accounting purposes, which is that an entity should recognize revenue to depict the transfer of promised goods or services to customers in an amount that reflects the consideration to which the entity expectsfourth rate permissible to be entitled in exchange for those goods and services. In August 2015, the FASB issued ASU 2015-14 “Revenue from Contracts with Customers (Topic 606) Deferral of the Effective Date.”used as a U.S. benchmark rate. This accounting standards update defers the effective date of ASU 2014-09 for an additional year. ASU 2015-14 will beguidance is effective for annual reportingand interim periods beginning after December 15, 2017. The amendments can be applied retrospectively to each prior reporting period or retrospectively with the cumulative effect of initially applying this update recognized at the date of initial application. Early application is not permitted. In March 2016, the FASB issued ASU 2016-08 “Revenue from Contracts with Customers (TOPIC 606): Principal versus Agent Considerations (Reporting Revenue Gross versus Net)”2018, and in April 2016, the FASB issued ASU 2016-10 “Revenue from Contracts with Customers (TOPIC 606): Identifying Performance Obligations and Licensing.” ASU 2016-08 requires the entity to determine if it is acting as a principal with control over the goods or services it is contractually obligated to provide, or an agent with no control over specified goods or services provided by another party to a customer. ASU 2016-10 was issued to further clarify ASU 2014-09 implementation regarding identifying performance obligation materiality, identification of key contract components, and scope. The Company is assessing the impact of ASU 2014-09 and other related ASUs as noted above on its accounting and disclosures within noninterest income, as any interest income impact was scoped out of this final ASU pronouncement.
The Company will adopt ASU 2014-09 and related issuances on January 1, 2018. The Company has performed an analysis of the impact of adoption of this ASU, reviewing revenue recorded from service charges on deposit accounts, asset management fees, gains (losses) on other real estate owned, and debit card interchange fees. Certain revenue received, such as service charges on deposit accounts and interchange fees, is recorded immediately or as the service is performed. Asset management fees recorded by the Company take the form of wealth management income and brokerage income, and both types of fees are recorded after services are
rendered, with no contractual requirement of refund to a customer based on non-achievement of fund performance objectives. Finally, the methodology used to record revenue from gains (losses) due to the sale of other real estate owned is not anticipated to change, as the Company currently records income or expense only upon consummation of the sale, and any revenue recorded stemming from seller financed transactions is reviewed for deferral, as appropriate. The Company doeswe do not expect to recognize a cumulative adjustment to equity upon implementation of this standard.
In February 2016, the FASB issued ASU No. 2016-02 “Leases (Topic 842).” This ASU was issuedguidance to increase transparency and comparability among organizations by recognizing lease assets and liabilities on the balance sheet and disclosing key information about leasing arrangements. One key revision from prior guidance was to include operating leases within assets and liabilities recorded; another revision was included which created a new model to follow for sale-leaseback transactions. The impact of this pronouncement will affect lessees primarily, as virtually all of their assets will be recognized on the balance sheet, by recording a right of use asset and lease liability. This pronouncement is effective for fiscal years beginning after December 15, 2018. The Company is assessing the impact of ASU 2016-02 on its accounting and disclosures.
In March 2016, the FASB issued ASU No. 2016-09 “Stock Compensation - Improvements to Employee Share-Based Payment Accounting (Topic 718).” FASB issued this ASU as part of the Simplification Initiative. This ASU involves several aspects of the accounting for share-based payment transactions, including the income tax consequences, classification of awards as either equity or liability, and classification on the statement of cash flows. ASU 2016-09 was effective for financial statements issued for fiscal years beginning after December 15, 2016. The Company adopted this standard as of January 1, 2017, which impacted income tax expense and additional paid-in capital within stockholders’ equity, but did not have a material impact on the Company’s operating resultsfinancial condition or financial condition.
In June 2016, the FASB issued ASU No. 2016-13 “Measurement of Credit Losses on Financial Instruments (Topic 326).” ASU 2016-13 was issued to provide financial statement users with more useful information about the expected credit losses on financial instruments and other commitments to extend credit held by a reporting entity at each reporting date to enhance the decision making process. The new methodology to be used should reflect expected credit losses based on relevant vintage historical information, supported by reasonable forecasts of projected loss given defaults, that will affect the collectabilityliquidity of the reported amounts. This new methodology will also require available-for-sale debt securitiesCompany. ASU 2020-04 and ASU 2021-01 Reference Rate Reform (Topic 848) were issued on March 12, 2020 and January 7, 2021, respectively, and each provide further guidance on optional expedients and exceptions for applying GAAP to have a credit loss recorded through an allowance rather than write-downs. ASU 2016-13 is effective for financial statements issued for fiscal years beginning after December 15, 2019. The Company is assessing the impact of ASU 2016-13 on its accountingcontract modifications and disclosures, and is in the process of accumulating data to support future risk assessments.
In January 2017, the FASB issued ASU 2017-04 “Intangibles – Goodwill and Other (Topic 350).” The FASB issued this guidance to simplify the annual test for goodwill impairment by eliminating Step 2 from the prior two step guidance. Previous guidance required the quantitative measurement of an entity’s goodwill impairment loss by comparing the implied fair value of a reporting unit’s goodwill with the carrying amount of that goodwill. The amended guidance allows a more qualitative analysis of comparing the reporting unit’s fair value to its carrying value, and recording the resultant impairment charge, not to exceed the total amount of goodwill allocated to that reporting unit, if applicable. ASU 2017-04 is effective for financial statements issued for fiscal years beginning after December 15, 2019, with early adoption permitted for annual and interim goodwill impairment tests after January 1, 2017. The Company adopted this ASU as of December 31, 2017, and applied the new guidance to the annual goodwill impairment test performed as of that date; no impairment was noted.
In March 2017, the FASB issued ASU No. 2017-08 “Receivables-Nonrefundable Fees and Other Costs – Premium Amortization on Purchased Callable Debt Securities (Subtopic 310-20).” This ASU was issued to shorten the amortization period for the premium to the earliest call date on debt securities. This premium is required to be recorded as a reduction to net interest margin during the shorter yield to call period, as compared to prior practice of amortizing the premium as a reduction to net interest margin over the contractual life of the instrument. This ASU does not change the current method of amortizing any discount over the contractual life of the debt security, and this pronouncement is effective for fiscal years beginning after December 15, 2018, with earlier adoption permitted. The Company adopted ASU 2017-08 as a change in accounting principle in the third quarter of 2017 on a modified retrospective basis, which required the Company to reflect its adoption effective January 1, 2017. The effect of amortizing the premium over a shorter period negatively impacted the net interest margin in 2017, and will continue to decrease future net interest income by approximately 10 basis points a quarter until the premium is fully amortized. As a result of management’s analysis, the impact of the change in accounting principle as a result of ASU 2017-08 to adjust beginning of year retained earnings was considered insignificant and, accordingly, the impact was adjusted through current period earnings.
In August 2017, the FASB issued ASU 2017-12 “Derivatives and Hedging:Targeted Improvements to Accounting for Hedging Activities.”. The purpose of this updated guidance is to better align a company’s financial reporting for hedging activities with the economic objectives of those activities. ASU 2017-12 is effective for public business entities for fiscal years beginning after December 15, 2018, with early adoption, including adoption in an interim period, permitted. The Company plans to adopt ASU 2017-12 on January 1, 2018. ASU 2017-12 requires a modified retrospective transition method in which the Company will recognize the cumulative effect of the change on the opening balance of each affected component of equity in the statement of financial position as of
the date of adoption. While the Company continues to assess all potential impacts of the standard, we currently expect adoption to have an immaterial impact on our consolidated financial statements.
In February 2018, the FASB issued ASU 2018-02 “Income Statement-Reporting Comprehensive Income (Topic 220): Reclassification of Certain Tax Effects from Accumulated Other Comprehensive Income”. This ASU provides financial statement preparers an option to reclassify stranded tax effects within AOCI to retained earnings, which were recordedrelationships due to the changediscontinuation of LIBOR. In addition, on March 5, 2021, the International Swaps and Derivatives Association (“ISDA”) issued a statement with an “Index Cessation Event Announcement”, which confirmed the extension of the cessation of LIBOR-referenced rates from December 31, 2021, to June 30, 2023, for certain rate tenors.
The Company formed a LIBOR transition team in 2019, and has developed a project plan to assess the U.S. Federal corporate income taxuse of alternative indexes and to ensure all financial instruments that reference LIBOR are identified, quantified, and researched for the LIBOR fallback language available or needed. The Company has completed the International Swaps and Derivatives Association (“ISDA”) protocol adherence for LIBOR fallback language for all commercial swaps, has met with our commercial loan clients to also guide their swap fallback language adherence, and worked to revise all credit documents being issued by our Bank for new loans to ensure appropriate fallback language is included. We have discontinued the use of LIBOR as a reference rate in the “Tax Cutsfor all consumer loans issued after July 31, 2021, and Jobs Act”, signed into law in December 2017. ASU 2018-02 is effective for fiscal years beginningall commercial loans issued after December 15, 2018,31, 2021, with certain exceptions for those loans in process of funding at the end of 2021. The Company’s systems have been updated to handle multiple SOFR-based indexes and interim periods within those fiscal years. Early adoption is permitted. The Company planswe continue to adopt ASU 2018-02 on January 1, 2018. The estimated stranded disproportionate tax expense, net, recorded asmeet regularly to plan for the transition of December 31, 2017, totaled $318,000, and was comprisedexisting LIBOR exposures prior to the final LIBOR cessation date of both swap and securities available for sale adjustments.June 30, 2023.
Subsequent Events
On January 16, 2018,18, 2022, the Company’s Board of Directors declared a cash dividend of $0.01$0.05 per share payable on February 5, 2018,7, 2022, to stockholders of record as of January 26, 2018.28, 2022.
On February 20, 2018, the Company’s board of directors determined not to renew the Second Amendment to the Amended and Restated Rights Agreement and Tax Benefits Preservation Plan (the “Amendment”), dated September 2, 2015, that was approved by the Company’s stockholders, which expires on September 12, 2018. The Amendment was approved in 2015 to protect the Company’s ability to utilize deferred tax assets, which could be significantly limited if it experienced an “ownership change” for U.S. federal income tax purposes.
Note 2: AcquisitionsAcquisition
On December 26, 2017,1, 2021, the Company announced the signingcompleted its acquisition of West Suburban Bancorp, Inc. ("West Suburban"), a definitive agreement and plan of merger (the “Merger Agreement”) to acquire Greater Chicago Financial Corp.bank holding company, and its wholly-owned bankwholly owned subsidiary, ABCWest Suburban Bank, based in an all-cash transaction.Lombard, Illinois, with operations throughout our existing market footprint. This acquisition brought increased scale and new markets to the Company, and provided new product offerings and line of business opportunities. At closing, the Company acquired $2.94 billion of assets, $1.50 billion of loans, $1.07 billion of securities, and $2.69 billion of deposits, net of fair value adjustments. Under the terms of the Merger Agreement,merger agreement, each outstanding share of West Suburban common stock was exchanged for 42.413 shares of Company common stock, plus $271.15 of cash. This resulted in merger consideration of $295.2 million, based on the closing price of the Company’s common stock on the date of acquisition, which consisted of 15.7 million shares of the Company’s common stock and $100.7 million of cash. Goodwill of $67.7 million associated with the acquisition was recorded by the Company, which was the result of expected synergies, operational efficiencies and other factors.
The acquisition of West Suburban has been accounted for as a business combination. We recorded the estimate of fair value based on initial valuations available at December 1, 2021. The determination of estimated fair value required management to make assumptions related to discount rates, expected future cash flows, market conditions and other future events that are often subjective in nature and may require adjustments, which can be subject to adjustment for up to one year after December 1, 2021. While the Company believes that the information available on the merger date provided a reasonable basis for estimating fair value, additional information and evidence may be provided during the first quarter of 2022 or later which will acquirebe utilized to finalize all valuations and record final adjustments during the one year subsequent measurement period. These adjustments may include: (i) changes in deferred tax assets or liabilities related to fair value estimates and changes in the expected realization of items considered to be net operating loss carryforwards due to tax calculations still in process, and (ii) changes in goodwill as a result of the outstanding common stocknet effect of Greater Chicago Financial Corp. in a transaction valued at approximately $41.1 million. The Company will acquire and simultaneously retire $6.3any adjustments. None of the $67.7 million of outstanding subordinated debentures goodwill recorded is expected to be deductible for income tax purposes.
The ultimate per share consideration for shareholders of Greater Chicago Financial Corp. will depend upon the conversion election of holders of approximately $2.0 million of subordinated debentures that are convertible to common stock. The Merger Agreement requiresfollowing table provides the purchase price to be increased by an amount equal to the aggregate amount of outstanding principal and accrued but unpaid interest of such converted indebtedness actually converted into Greater Chicago Financial Corp. common stock. ABC Bank had total assets of $342.6 millionallocation as of the December 31, 2017, including $234.4 million of net loans. The boards1, 2021 merger date of the Company and Greater Chicago Financial Corp. unanimously approvedWest Suburban and the transactionassets acquired and liabilities assumed at their estimated fair values as of that date, as recorded by the Company.
| | | |
West Suburban Acquisition Summary | | | |
As of Date of Acquisition | | | |
| | December 1, 2021 |
Assets | | | |
Cash and due from banks | | $ | 16,794 |
Interest bearing deposits with financial institutions | | | 232,880 |
Securities available-for-sale and held-to maturity, at fair value | | | 1,066,373 |
FHLBC stock | | | 3,340 |
Loans | | | 1,502,118 |
Premises and equipment | | | 47,456 |
Other real estate owned | | | 5,552 |
Core deposit intangible | | | 14,772 |
Deferred tax assets | | | 2,093 |
Other assets | | | 52,710 |
Total assets | | $ | 2,944,088 |
| | | |
Liabilities | | | |
Noninterest bearing demand | | $ | 409,141 |
Savings, NOW and money market | | | 2,069,890 |
Time | | | 215,205 |
Total deposits | | | 2,694,236 |
Reserve for unfunded commitments | | | 1,787 |
Other liabilities | | | 20,629 |
Total liabilities | | | 2,716,652 |
| | | |
Cash consideration paid | | | 100,679 |
Stock issued for acquisition | | | 194,484 |
Total Liabilities Assumed and Cash and Stock Consideration Paid for Acquisition | | $ | 3,011,815 |
Goodwill | | $ | 67,727 |
Expenses related to the West Suburban acquisition totaled $13.2 million during the year ended December 31, 2021, and are reported within noninterest expense based on the line items impacted, which is subject to regulatory approvalare primarily salaries and customary closing conditions. Greater Chicago Financial Corp.’s shareholders have approved the transaction, which is expected to closeemployee benefits, occupancy, furniture and equipment, computer and data processing, legal fees, and other expense in the second quarterConsolidated Statements of 2018. Acquisition costs incurredIncome.
Purchased loans and leases that reflect a more-than-insignificant deterioration of credit from origination are considered PCD. For PCD loans and leases, the initial estimate of expected credit losses is recognized in the ACL on the date of acquisition using the same methodology as other loans and leases held-for-investment. The following table provides a summary of loans and leases purchased as part of the West Suburban acquisition which were individually evaluated and determined to have credit deterioration at acquisition.
| | | |
| | As of |
West Suburban Acquired PCD Loans | | December 1, 2021 |
Par value of acquired loans | | $ | 108,241 |
Allowance for credit losses | | | (12,075) |
Non-credit discount | | | (1,723) |
Purchase price of PCD loans at acquisition | | $ | 94,443 |
The Company's operating results for the year endingended December 31, 2017, related2021 includes the operating results of the acquired assets and assumed liabilities of West Suburban subsequent to the pending merger with Greater Chicago Financial Corp. were $65,000, and were expensed as incurred.
On October 28, 2016, the Bank completed its previously announced acquisition of the Chicago branch of Talmer Bank and Trust, the banking subsidiary of Talmer Bancorp, Inc. (“Talmer”). As a result of this transaction, the Bank acquired $223.8 million of loans, prior to fair value adjustment, and $48.9 million of deposits. The purchase resulted in the Company establishing a metropolitan Chicago office presence with a strong commercial client focus, and retention of an experienced lending team. The acquisition was funded with security sales and cash on hand, and was recorded applying the acquisition method of accounting.December 1, 2021. The following table presents unaudited pro forma information as if the assets acquired andacquisition of West Suburban had occurred on January 1, 2020, under the liabilities assumed, both tangible and intangible, net“Unaudited Pro Forma” columns. The pro forma adjustments give effect to any change in interest income due to the accretion of the discount (premium) associated with the fair value adjustments to acquired loans and leases, any change in interest expense due to estimated premium amortization/discount accretion associated with the fair value adjustment to acquired interest-bearing deposits, and the amortization of the CDI that would have resulted had the deposits been acquired as of January 1, 2020. Pro forma results include Old Second and West Suburban acquisition-related expenses which primarily included, but were not limited to, severance costs, professional services, data processing fees, and advertising expenses totaling $25.1 million for the acquisition date:
| | | |
Talmer Branch Acquisition Summary | | | |
As of Date of Acquisition | | | |
| | | 10/28/2016 |
Assets acquired: | | | |
Cash on hand | | $ | 122 |
Loans, net of purchase accounting adjustments | | | 220,988 |
Premises and equipment, net | | | 230 |
Goodwill | | | 8,375 |
Core deposit intangible | | | 659 |
Other assets acquired, including accrued interest, prepaids | | | 573 |
Liabilities assumed: | | | |
Deposits - noninterest bearing demand | | | 28,850 |
Deposits - interest bearing - Savings, NOW and Money market | | | 17,941 |
Deposits - Time | | | 2,103 |
Other liabilities assumed, including escrow deposits and payables | | | 574 |
Net assets acquired, or total cash paid for acquisition | | $ | 181,479 |
year ended December 31, 2021. The pro forma information does not necessarily reflect the results
Acquisition expenses incurred in 2016of operations that would have occurred had the Company acquired West Suburban on January 1, 2020. Furthermore, cost savings and other business synergies related to the Talmer branch purchase totaled $269,000 as of December 31, 2016; all material acquisition costs identified were paid or accrued as of year end 2016. As of December 31, 2016,are not reflected in the Company recorded $8.5 million of goodwill and acquisition costs that were tax deductible.pro forma amounts.
| | | | | | | | | | | | | | |
| | | | | | | | | | Unaudited Pro Forma for the Years Ended |
| | | | | | | | | | 2021 | | 2020 |
Net interest income | | | | | | | | | | $ | 166,495 | | $ | 165,283 |
Noninterest income | | | | | | | | | | | 59,036 | | | 48,937 |
Net income attributable to Old Second Bancorp, Inc. | | | | | | | | | | | 67,779 | | | 12,349 |
Note 3: Cash and Due from Banks
The Bank is required to maintain reserve balances with the FRBC. In accordance withTotal cash and cash equivalents were $752.1 million and $329.9 million at December 31, 2021 and 2020, respectively.
As of March 26, 2020, the FRBC eliminated reserve requirements for certain depository institutions, including the averageBank. As such, there was 0 reserve balances were $10.6 million and $10.5 million, for the years December 31, 2017, and 2016, respectively. Asrequirement as of December 31, 2017 and 2016, the required reserve balance was $11.0 million and $11.8 million, respectively.2020 or 2021. The nature of the Company’s business requires that it maintain amounts with other banks and federal funds which, at times, may exceed federally insured limits. Management monitors these correspondent relationships, and the Company has not experienced any losses in such accounts.
Note 4: Securities
Investment Portfolio Management
The following table summarizes the amortized cost and fair value of the securities portfolio at December 31, 2017 and December 31, 2016, and the corresponding amounts of gross unrealized gains and losses (in thousands):were as follows:
| | | | | | | | | | | | | |
| | | | | Gross | | Gross | | | | |
| | Amortized | | Unrealized | | Unrealized | | Fair | |
December 31, 2017 | | Cost | | Gains | | Losses | | Value | |
| | | | | | | | | | | | |
| | | | | | Gross | | Gross | | | |
| | | Amortized | | Unrealized | | Unrealized | | Fair |
December 31, 2021 | | | Cost1 | | Gains | | Losses | | Value |
Securities available-for-sale | | | | | | | | | | | | | | | | | |
U.S. Treasuries | | $ | 4,002 | | $ | - | | $ | (55) | | $ | 3,947 | |
U.S. Treasury | | | $ | 202,251 | | $ | 125 | | $ | (37) | | $ | 202,339 |
U.S. government agencies | | | 13,062 | | | 8 | | | (9) | | | 13,061 | | 62,587 | | | - | | | (699) | | | 61,888 |
U.S. government agencies mortgage-backed | | | 12,372 | | | 7 | | | (165) | | | 12,214 | | 172,016 | | | 856 | | | (570) | | | 172,302 |
States and political subdivisions | | | 272,240 | | | 7,116 | | | (1,264) | | | 278,092 | | | 240,793 | | | 16,344 | | | (672) | | | 256,465 |
Corporate bonds | | | 823 | | | 21 | | | (11) | | | 833 | | | 10,000 | | | - | | | (113) | | | 9,887 |
Collateralized mortgage obligations | | | 66,892 | | | 202 | | | (1,155) | | | 65,939 | | | 673,238 | | | 2,014 | | | (2,285) | | | 672,967 |
Asset-backed securities | | | 113,983 | | | 862 | | | (1,913) | | | 112,932 | | | 236,293 | | | 1,245 | | | (661) | | | 236,877 |
Collateralized loan obligations | | | 54,271 | | | 251 | | | (101) | | | 54,421 | | | 79,838 | | | 3 | | | (78) | | | 79,763 |
Total securities available-for-sale | | $ | 537,645 | | $ | 8,467 | | $ | (4,673) | | $ | 541,439 | | $ | 1,677,016 | | $ | 20,587 | | $ | (5,115) | | $ | 1,692,488 |
| | | | | | | | | | | | |
| | | | | | | | | | | | |
| | | | | Gross | | Gross | | | |
| | Amortized | | Unrealized | | Unrealized | | Fair |
December 31, 2016 | | Cost | | Gains | | Losses | | Value |
Securities available-for-sale | | | | | | | | | | | | |
U.S. government agencies mortgage-backed | | $ | 42,511 | | $ | - | | $ | (977) | | $ | 41,534 |
States and political subdivisions | | | 68,718 | | | 258 | | | (273) | | | 68,703 |
Corporate bonds | | | 10,957 | | | 9 | | | (336) | | | 10,630 |
Collateralized mortgage obligations | | | 174,352 | | | 374 | | | (3,799) | | | 170,927 |
Asset-backed securities | | | 146,391 | | | 341 | | | (8,325) | | | 138,407 |
Collateralized loan obligations | | | 102,504 | | | 29 | | | (896) | | | 101,637 |
Total securities available-for-sale | | $ | 545,433 | | $ | 1,011 | | $ | (14,606) | | $ | 531,838 |
During the twelve months ended December 31, 2017, the total securities portfolio increased $9.6 million. Select collateralized mortgage obligations, mortgage-backed securities, corporate bonds and asset-backed securities were liquidated to allow for portfolio repositioning in favor
| | | | | | | | | | | | |
| | | | | Gross | | Gross | | | |
| | Amortized | | Unrealized | | Unrealized | | Fair |
December 31, 2020 | | Cost1 | | Gains | | Losses | | Value |
Securities available-for-sale | | | | | | | | | | | | |
U.S. Treasury | | $ | 4,014 | | $ | 103 | | $ | - | | $ | 4,117 |
U.S. government agencies | | | 6,811 | | | - | | | (154) | | | 6,657 |
U.S. government agencies mortgage-backed | | | 16,098 | | | 1,112 | | | (1) | | | 17,209 |
States and political subdivisions | | | 229,352 | | | 21,269 | | | (1,362) | | | 249,259 |
Collateralized mortgage obligations | | | 53,999 | | | 2,866 | | | (280) | | | 56,585 |
Asset-backed securities | | | 130,959 | | | 1,370 | | | (511) | | | 131,818 |
Collateralized loan obligations | | | 30,728 | | | 15 | | | (210) | | | 30,533 |
Total securities available-for-sale | | $ | 471,961 | | $ | 26,735 | | $ | (2,518) | | $ | 496,178 |
| | | | | | | | | | | | |
1 Excludes interest receivable of high quality state and municipal securities. Purchases totaling $270.2 million were executed in this security type during 2017 due to favorable pricing in the rising interest rate environment. These portfolio increases were more than offset by reductions in holdings of asset-backed securities and collateralized mortgage obligations; these reductions were comprised of sales of $146.9$4.3 million and paydowns of $13.0 million.
Nonmarketable equity investments include FHLBC stock and FRBC stock. FHLBC stock was $5.4 million and $3.1$2.7 million at December 31, 20172021 and December 31, 2016,2020, respectively, that is recorded in other assets on the consolidated balance sheet.
FHLBC stock was $7.1 million and $3.7 million at December 31, 2021 and December 31, 2020 respectively. FRBC stock was $4.8$6.2 million at December 31, 20172021 and December 31, 2016.2020. Our FHLBC stock is necessary to maintain access to FHLBC advances.
Securities valued at $301.0$501.3 million as of December 31, 2017, an increase from $262.6 million at year-end 2016,2021, were pledged to secure deposits and borrowings, and for other purposes.purposes, an increase from $335.8 million at year-end 2020, primarily due to the West Suburban acquisition in 2021.
The fair value, amortized cost and weighted average yield of debt securities at December 31, 2017,2021, by contractual maturity, were as follows in the table below. Securities not due at a single maturity date are shown separately.
| | | | | | | | | | | |
| | | | | Weighted | | | | | | |
| | Amortized | | Average | | | Fair | | |
| | | | | | | | | | | |
| | | | | | Weighted | | | | | |
| | | Amortized | | Average | | | Fair | |
Securities available-for-sale | | Cost | | Yield | | | Value | | | Cost | | Yield | | | Value | |
Due in one year or less | | $ | 6,200 | | 2.41 | % | | $ | 6,185 | | | $ | 8,671 | | 1.24 | % | | $ | 8,707 | |
Due after one year through five years | | | 4,346 | | 2.03 | | | | 4,279 | | | | 274,984 | | 0.89 | | | | 274,537 | |
Due after five years through ten years | | | 6,013 | | 3.29 | | | | 6,234 | | | | 43,770 | | 2.43 | | | | 45,470 | |
Due after ten years | | | 273,568 | | 2.95 | | | | 279,235 | | | | 188,206 | | 2.98 | | | | 201,865 | |
| | | 290,127 | | 2.93 | | | | 295,933 | | |
| | | | 515,631 | | 1.79 | | | | 530,579 | |
Mortgage-backed and collateralized mortgage obligations | | | 79,264 | | 2.94 | | | | 78,153 | | | | 845,254 | | 1.19 | | | | 845,269 | |
Asset-backed securities | | | 113,983 | | 2.56 | | | | 112,932 | | | | 236,293 | | 1.12 | | | | 236,877 | |
Collateralized loan obligations | | | 54,271 | | 4.32 | | | | 54,421 | | | | 79,838 | | 1.60 | | | | 79,763 | |
Total securities available-for-sale | | $ | 537,645 | | 2.99 | % | | $ | 541,439 | | | $ | 1,677,016 | | 1.38 | % | | $ | 1,692,488 | |
At December 31, 2017,2021, the Company’s investments include asset-backed securities totaling $96.0$194.4 million that are backed by student loans originated under the Federal Family Education Loan program (“FFEL”). Under the FFEL, private lenders made federally guaranteed student loans to parents and students. While the program was modified several times before elimination in 2010, FFEL securities are generally guaranteed by the U.S. Department of Education (“DOE”) at not less than 97% of the principal amount of the loans. The guarantee will reduce to 85% if the DOE receives reimbursement requests in excess of 5% of insured loans; reimbursement will drop to 75% if reimbursement requests exceed 9% of insured loans. As of December 31, 2017,2021, the likelihood of the decrease in the government guarantee was minimal as the average rate of reimbursement for 20162021 was less than 1.0%.
TheAs of December 31, 2021, the Company has accumulated0 securities issued from 1 originator, other than the securities of the following three different originatorsU.S. Government and its agencies, that individually amountamounted to over 10% of the Company’s stockholders equity. The amortized cost and fair value of securities related to these three issuers are as follows:
| | | | | | |
| | December 31, 2017 |
| | Amortized | | Fair |
Issuer | | Cost | | Value |
GCO Education Loan Funding Corp | | $ | 27,625 | | $ | 26,588 |
Towd Point Mortgage Trust | | | 29,312 | | | 29,210 |
Student Loan Marketing Association | | | 25,696 | | | 25,917 |
Securities with unrealized losses with no corresponding allowance for credit losses at December 31, 2017, and December 31, 2016, aggregated by investment category and length of time that individual securities have been in a continuous unrealized loss position, were as follows (in thousands except for number of securities):
| | | | | | | | | | | | | | | | | | | | | | | | |
| | Less than 12 months | | 12 months or more | | | | | | | | | |
December 31, 2017 | | in an unrealized loss position | | in an unrealized loss position | | Total | |
| | Number of | | Unrealized | | Fair | | Number of | | Unrealized | | Fair | | Number of | | Unrealized | | Fair | |
| | | | | | | | | | | | | | | | | | | | | | | | | |
| | | Less than 12 months | | 12 months or more | | | | | | | | |
December 31, 2021 | | | in an unrealized loss position | | in an unrealized loss position | | Total |
| | | Number of | | Unrealized | | Fair | | Number of | | Unrealized | | Fair | | Number of | | Unrealized | | Fair |
Securities available-for-sale | | Securities | | Losses | | Value | | Securities | | Losses | | Value | | Securities | | Losses | | Value | | Securities | | Losses | | Value | | Securities | | Losses | | Value | | Securities | | Losses | | Value |
U.S. Treasuries | | 1 | | $ | 55 | | $ | 3,947 | | - | | $ | - | | $ | - | | 1 | | $ | 55 | | $ | 3,947 | | 1 | | $ | 37 | | $ | 49,719 | | - | | $ | - | | $ | - | | 1 | | $ | 37 | | $ | 49,719 |
U.S. government agencies | | 2 | | 9 | | | 6,550 | | - | | | - | | | - | | 2 | | | 9 | | | 6,550 | | 5 | | $ | 592 | | $ | 56,879 | | 4 | | $ | 107 | | $ | 5,008 | | 9 | | $ | 699 | | $ | 61,887 |
U.S. government agencies mortgage-backed | | 4 | | 24 | | | 5,501 | | 5 | | | 141 | | | 4,843 | | 9 | | | 165 | | | 10,344 | | 63 | | | 505 | | | 78,711 | | 1 | | | 65 | | | 1,663 | | 64 | | | 570 | | | 80,374 |
States and political subdivisions | | 13 | | 1,237 | | | 45,985 | | 1 | | | 27 | | | 1,512 | | 14 | | | 1,264 | | | 47,497 | | 7 | | | 55 | | | 8,430 | | 1 | | | 617 | | | 4,051 | | 8 | | | 672 | | | 12,481 |
Corporate bonds | | - | | | - | | | - | | 1 | | | 11 | | | 332 | | 1 | | | 11 | | | 332 | | 2 | | | 113 | | | 9,887 | | - | | | - | | | - | | 2 | | | 113 | | | 9,887 |
Collateralized mortgage obligations | | 3 | | | 31 | | | 11,534 | | 8 | | | 1,124 | | | 40,219 | | 11 | | | 1,155 | | | 51,753 | | 133 | | | 2,285 | | | 381,658 | | - | | | - | | | - | | 133 | | | 2,285 | | | 381,658 |
Asset-backed securities | | - | | | - | | | - | | 7 | | | 1,913 | | | 61,745 | | 7 | | | 1,913 | | | 61,745 | | 20 | | | 608 | | | 103,819 | | 3 | | | 53 | | | 3,276 | | 23 | | | 661 | | | 107,095 |
Collateralized loan obligations | | 3 | | | 101 | | | 29,313 | | - | | | - | | | - | | 3 | | | 101 | | | 29,313 | | 10 | | | 35 | | | 45,132 | | 2 | | | 43 | | | 10,628 | | 12 | | | 78 | | | 55,760 |
Total securities available-for-sale | | 26 | | $ | 1,457 | | $ | 102,830 | | 22 | | $ | 3,216 | | $ | 108,651 | | 48 | | $ | 4,673 | | $ | 211,481 | | 241 | | $ | 4,230 | | $ | 734,235 | | 11 | | $ | 885 | | $ | 24,626 | | 252 | | $ | 5,115 | | $ | 758,861 |
| | | | | | | | | | | | | | | | | | | | | | | | | |
| | Less than 12 months | | 12 months or more | | | | | | | | | |
December 31, 2016 | | in an unrealized loss position | | in an unrealized loss position | | Total | |
| | Number of | | Unrealized | | | Fair | | Number of | | Unrealized | | | Fair | | Number of | | Unrealized | | | Fair | |
| | | | | | | | | | | | | | | | | | | | | | | | | |
| | | Less than 12 months | | 12 months or more | | | | | | | | |
December 31, 2020 | | | in an unrealized loss position | | in an unrealized loss position | | Total |
| | | Number of | | Unrealized | | | Fair | | Number of | | Unrealized | | | Fair | | Number of | | Unrealized | | | Fair |
Securities available-for-sale | | Securities | | Losses | | | Value | | Securities | | Losses | | | Value | | Securities | | Losses | | | Value | | Securities | | Losses | | | Value | | Securities | | Losses | | | Value | | Securities | | Losses | | | Value |
U.S. government agencies | | | - | | $ | - | | $ | - | | 4 | | $ | 154 | | $ | 6,657 | | 4 | | $ | 154 | | $ | 6,657 |
U.S. government agencies mortgage-backed | | 11 | | $ | 957 | | $ | 40,636 | | 1 | | $ | 20 | | $ | 898 | | 12 | | $ | 977 | | $ | 41,534 | | 1 | | | 1 | | | 141 | | - | | | - | | | - | | 1 | | | 1 | | | 141 |
States and political subdivisions | | 12 | | | 273 | | | 35,241 | | - | | | - | | | - | | 12 | | | 273 | | | 35,241 | | - | | | - | | | - | | 1 | | | 1,362 | | | 3,433 | | 1 | | | 1,362 | | | 3,433 |
Corporate bonds | | 1 | | | 183 | | | 4,817 | | 2 | | | 153 | | | 5,328 | | 3 | | | 336 | | | 10,145 | |
Collateralized mortgage obligations | | 16 | | | 3,402 | | | 117,752 | | 7 | | | 397 | | | 18,109 | | 23 | | | 3,799 | | | 135,861 | | 4 | | | 279 | | | 8,142 | | 1 | | | 1 | | | 146 | | 5 | | | 280 | | | 8,288 |
Asset-backed securities | | 4 | | | 328 | | | 17,604 | | 12 | | | 7,997 | | | 107,112 | | 16 | | | 8,325 | | | 124,716 | | 1 | | | 2 | | | 251 | | 3 | | | 509 | | | 49,572 | | 4 | | | 511 | | | 49,823 |
Collateralized loan obligations | | - | | | - | | | - | | 12 | | | 896 | | | 81,613 | | 12 | | | 896 | | | 81,613 | | 1 | | | 31 | | | 7,468 | | 4 | | | 179 | | | 21,477 | | 5 | | | 210 | | | 28,945 |
Total securities available-for-sale | | 44 | | $ | 5,143 | | $ | 216,050 | | 34 | | $ | 9,463 | | $ | 213,060 | | 78 | | $ | 14,606 | | $ | 429,110 | | 7 | | $ | 313 | | $ | 16,002 | | 13 | | $ | 2,205 | | $ | 81,285 | | 20 | | $ | 2,518 | | $ | 97,287 |
| | | | | | | | | | | | | | | | | | | | | | | | | |
The unrealized loss attributable to our collateralized loan obligations are the result of spread widening in that sector due to the current economic environment, specifically rising interest rates. The unrealized loss attributable to our U.S. government agencies is associated with our SBA positions. Shortly after purchase a structural change in the SBA program occurred that led to higher prepayments which negatively affected these positions. The unrealized loss attributable to states and political subdivisions, collateralized mortgage obligations, and asset-backed securities are due to limited liquidity as a result of a few securities with uncommon structures and lesser known issuers. The asset-backed securities are primarily backed by student loans under the FFEL program, these securities are 97% guaranteed by U.S. DOE and have a long history of no credit losses. At December 31, 2021, we have no intent to sell any securities that were in an unrealized loss position nor is it expected that we would be required to sell the securities prior to their anticipated recovery.
Recognition of other-than-temporary impairment was not necessary inThe following table presents net realized gains (losses) on securities available-for-sale for the year ended December 31, 2017, or the year ended December 31, 2016. The changes in fair value related primarily to interest rate fluctuations. The Company’s review of other-than-temporary impairment confirmed no credit quality deterioration.years ended:
| | | | | | | | | | |
| | Year Ended | |
| | December 31, | |
Securities available-for-sale | | 2021 | | 2020 | | 2019 | |
Proceeds from sales of securities | | $ | 605,846 | | $ | 18,006 | | $ | 191,298 | |
Gross realized gains on securities | | | 270 | | | 17 | | | 5,521 | |
Gross realized losses on securities | | | (38) | | | (42) | | | (1,010) | |
Net realized gains (losses) | | $ | 232 | | $ | (25) | | $ | 4,511 | |
Income tax (expense) benefit on net realized gains (losses) | | $ | (65) | | $ | 7 | | $ | (1,267) | |
Effective tax rate applied | | | 28.0 | % | | 28.0 | % | | 28.1 | % |
| | | | | | | | | | |
| | | Years ended December 31, |
Securities available-for-sale | | | 2017 | | 2016 | | 2015 |
Proceeds from sales of securities | | | $ | 232,462 | | $ | 306,400 | | $ | 70,176 |
Gross realized gains on securities | | | | 2,367 | | | 1,675 | | | 106 |
Gross realized losses on securities | | | | (1,893) | | | (3,888) | | | (284) |
Securities realized gains (losses), net | | | $ | 474 | | $ | (2,213) | | $ | (178) |
Income tax expense (benefit) on net realized gains (losses) | | | $ | 198 | | $ | (882) | | $ | (71) |
Note 5: Loans and Allowance for Credit Losses on Loans
Major classificationsThe composition of loans by portfolio segment as of December 31, were as follows:
| | | | | | | |
| | December 31, 2017 | | December 31, 2016 | |
Commercial | | $ | 272,851 | | $ | 228,113 | |
Leases | | | 68,325 | | | 55,451 | |
Real estate - commercial | | | 750,991 | | | 736,247 | |
Real estate - construction | | | 85,162 | | | 64,720 | |
Real estate - residential | | | 426,230 | | | 377,851 | |
Consumer | | | 2,774 | | | 3,237 | |
Other1 | | | 10,609 | | | 11,973 | |
| | | 1,616,942 | | | 1,477,592 | |
Net deferred loan costs | | | 680 | | | 1,217 | |
Total loans | | $ | 1,617,622 | | $ | 1,478,809 | |
| | | | | | |
| | December 31, 2021 | | December 31, 2020 |
Commercial 1 | | $ | 771,474 | | $ | 407,159 |
Leases | | | 176,031 | | | 141,601 |
Commercial real estate - Investor | | | 957,389 | | | 582,042 |
Commercial real estate - Owner occupied | | | 574,384 | | | 333,070 |
Construction | | | 206,132 | | | 98,486 |
Residential real estate - Investor | | | 63,399 | | | 56,137 |
Residential real estate - Owner occupied | | | 213,248 | | | 116,388 |
Multifamily | | | 309,164 | | | 189,040 |
HELOC | | | 115,664 | | | 80,908 |
HELOC - Purchased | | | 10,626 | | | 19,487 |
Other 2 | | | 24,437 | | | 10,533 |
Total loans | | | 3,421,948 | | | 2,034,851 |
Allowance for credit losses on loans | | | (44,281) | | | (33,855) |
Net loans3 | | $ | 3,377,667 | | $ | 2,000,996 |
1The “Other” class includes overdrafts.
Total Includes $38.4 million and $74.1 million of PPP loans reflects growth of $138.8 million for the year endedoutstanding at December 31, 2017. There2021 and 2020, respectively.
2Unless otherwise noted, the “Other” segment includes consumer loans and overdrafts in this table and in subsequent tables within Note 5 - Loans and Allowance for Credit Losses on Loans.
3 Excludes accrued interest receivable of $9.2 million and $7.0 million at December 31, 2021 and December 31, 2020, respectively, which is recorded in other assets on the consolidated balance sheet.
It is the policy of the Company to review each prospective credit prior to making a loan in order to determine if an adequate level of security or collateral has been obtained. The type of collateral, when required, will vary from liquid assets to real estate. The Company’s access to collateral, in the event of borrower default, is assured through adherence to lending laws, the Company’s lending standards and credit monitoring procedures. Although the Bank makes loans primarily within its market area, there are no significant concentrations of loans where the customers’ ability to honor loan terms is dependent upon a single economic sector although thesector. The real estate related categories listed above represent 78.0%71.6% and 79.7%72.5% of the portfolio at December 31, 2017,2021 and December 31, 2016, respectively.2020, respectively, and include a mix of owner and non-owner occupied, residential, construction and multifamily loans.
The following table represent the activity in the ACL for loans for the year ended December 31, 2021 and 2020:
| | | | | | | | | | | | | | | | | | |
| | | | | | | | | | | | | | | | | | |
| | | | Impact of | | Provision for | | | | | | |
| | Beginning | | WSB Acquisition | | (Release of) | | | | | | Ending |
Allowance for credit losses | | Balance | | with PCD Loans | | Credit Losses | | Charge-offs | | Recoveries | | Balance |
| | | | | | | | | | | | | | | | | | |
Commercial | | $ | 2,812 | | $ | 7,161 | | $ | 2,389 | | $ | 963 | | $ | 352 | | $ | 11,751 |
Leases | | | 3,888 | | | - | | | (339) | | | 69 | | | - | | | 3,480 |
Commercial real estate - Investor | | | 9,205 | | | 1,877 | | | 4,657 | | | 2,724 | | | 78 | | | 13,093 |
Commercial real estate - Owner occupied | | | 2,251 | | | 2,771 | | | (845) | | | 1,797 | | | 235 | | | 2,615 |
Construction | | | 4,054 | | | 102 | | | (783) | | | - | | | - | | | 3,373 |
Residential real estate - Investor | | | 1,740 | | | 23 | | | (1,294) | | | - | | | 291 | | | 760 |
Residential real estate - Owner occupied | | | 2,714 | | | 136 | | | (176) | | | - | | | 158 | | | 2,832 |
Multifamily | | | 3,625 | | | - | | | 233 | | | 183 | | | - | | | 3,675 |
HELOC | | | 1,749 | | | 5 | | | 408 | | | 17 | | | 234 | | | 2,379 |
HELOC - Purchased | | | 199 | | | - | | | (68) | | | - | | | - | | | 131 |
Other | | | 1,618 | | | - | | | (1,387) | | | 180 | | | 141 | | | 192 |
Ending Balance, December 31, 2021 | | $ | 33,855 | | $ | 12,075 | | $ | 2,795 | | $ | 5,933 | | $ | 1,489 | | $ | 44,281 |
| | | | | | | | | | | | | | | | | | |
| | | | | | | | | | | | | | | | | | |
| | | | | | | | | | | | | | | | | | |
| | | | Impact of | | Provision for | | | | | | |
Allowance for credit losses | | Beginning | | Adopting | | (Release of) | | | | | | Ending |
| | Balance | | ASC 326 | | Credit Losses | | Charge-offs | | Recoveries | | Balance |
Commercial | | $ | 3,015 | | $ | (292) | | $ | 72 | | $ | 39 | | $ | 56 | | $ | 2,812 |
Leases | | | 1,262 | | | 501 | | | 2,233 | | | 206 | | | 98 | | | 3,888 |
Commercial real estate - Investor | | | 6,218 | | | (741) | | | 4,075 | | | 512 | | | 165 | | | 9,205 |
Commercial real estate - Owner occupied | | | 3,678 | | | (848) | | | 487 | | | 1,763 | | | 697 | | | 2,251 |
Construction | | | 513 | | | 1,334 | | | 2,095 | | | 60 | | | 172 | | | 4,054 |
Residential real estate - Investor | | | 601 | | | 740 | | | 350 | | | 8 | | | 57 | | | 1,740 |
Residential real estate - Owner occupied | | | 1,257 | | | 1,320 | | | (107) | | | 43 | | | 287 | | | 2,714 |
Multifamily | | | 1,444 | | | 1,732 | | | 449 | | | - | | | - | | | 3,625 |
HELOC | | | 1,161 | | | 1,526 | | | (1,198) | | | 127 | | | 387 | | | 1,749 |
HELOC - Purchased | | | - | | | - | | | 265 | | | 66 | | | - | | | 199 |
Other | | | 640 | | | 607 | | | 445 | | | 244 | | | 170 | | | 1,618 |
Ending Balance, December 31, 2020 | | $ | 19,789 | | $ | 5,879 | | $ | 9,166 | | $ | 3,068 | | $ | 2,089 | | $ | 33,855 |
| | | | | | | | | | | | | | | | | | |
The following table presents activity in the allowance for loan and lease losses for the years ended December 31, 2019, as determined in accordance with ASC 310 prior to the adoption of ASU 2016-13:
| | | | | | | | | | | | | | | | | | |
| | | | | | Provision | | | | | | |
| | | | Beginning | | for Loan | | | | | | Ending |
Allowance for loan and lease losses: | | | | Balance | | Losses | | Charge-offs | | Recoveries | | Balance |
Commercial | | | | | $ | 2,832 | | $ | 218 | | $ | 109 | | $ | 74 | | $ | 3,015 |
Leases | | | | | | 734 | | | 577 | | | 49 | | | - | | | 1,262 |
Commercial real estate - Investor | | | | | | 6,339 | | | (497) | | | 303 | | | 679 | | | 6,218 |
Commercial real estate - Owner occupied | | | | | | 3,515 | | | 874 | | | 716 | | | 5 | | | 3,678 |
Construction | | | | | | 969 | | | (448) | | | 9 | | | 1 | | | 513 |
Residential real estate - Investor | | | | | | 554 | | | 43 | | | 7 | | | 11 | | | 601 |
Residential real estate - Owner occupied | | | | | | 1,377 | | | (86) | | | 111 | | | 77 | | | 1,257 |
Multifamily | | | | | | 616 | | | 813 | | | - | | | 15 | | | 1,444 |
HELOC | | | | | | 1,449 | | | (351) | | | 109 | | | 172 | | | 1,161 |
HELOC - Purchased | | | | | | - | | | 229 | | | 229 | | | - | | | - |
Other | | | | | | 621 | | | 228 | | | 409 | | | 200 | | | 640 |
Ending Balance, December 31, 2019 | | | | | $ | 19,006 | | $ | 1,600 | | $ | 2,051 | | $ | 1,234 | | $ | 19,789 |
| | | | | | | | | | | | | | | | | | |
The following table presents the collateral dependent loans and the related ACL allocated by segment of loans as of December 31:
| | | | | | | | | | | | | | | | | | |
| | | | | Accounts | | | | | | | | ACL |
December 31, 2021 | | Real Estate | | Receivable | | Equipment | | Other | | Total | | Allocation |
Commercial | | $ | 1,986 | | $ | 9,901 | | $ | - | | $ | - | | $ | 11,887 | | $ | 2,677 |
Leases | | | - | | | - | | | 3,249 | | | 505 | | | 3,754 | | | 811 |
Commercial real estate - Investor | | | 5,693 | | | - | | | - | | | - | | | 5,693 | | | - |
Commercial real estate - Owner occupied | | | 9,147 | | | - | | | - | | | 2,490 | | | 11,637 | | | 362 |
Construction | | | 2,104 | | | - | | | - | | | - | | | 2,104 | | | 992 |
Residential real estate - Investor | | | 925 | | | - | | | - | | | - | | | 925 | | | - |
Residential real estate - Owner occupied | | | 4,271 | | | - | | | - | | | - | | | 4,271 | | | 276 |
Multifamily | | | 1,845 | | | - | | | - | | | - | | | 1,845 | | | 75 |
HELOC | | | 826 | | | - | | | - | | | - | | | 826 | | | 190 |
HELOC - Purchased | | | 180 | | | - | | | - | | | - | | | 180 | | | - |
Other | | | - | | | - | | | - | | | 7 | | | 7 | | | 4 |
Total | | $ | 26,977 | | $ | 9,901 | | $ | 3,249 | | $ | 3,002 | | $ | 43,129 | | $ | 5,387 |
| | | | | | | | | | | | | | | | | | |
| | | | | | | | | | | | | | | | | | |
| | | | | Accounts | | | | | | | | ACL |
December 31, 2020 | | Real Estate | | Receivable | | Equipment | | Other | | Total | | Allocation |
Commercial | | $ | - | | $ | 1,070 | | $ | - | | $ | 55 | | $ | 1,125 | | $ | 56 |
Leases | | | - | | | - | | | 2,377 | | | 597 | | | 2,974 | | | 880 |
Commercial real estate - Investor | | | 4,179 | | | - | | | - | | | - | | | 4,179 | | | 84 |
Commercial real estate - Owner occupied | | | 9,726 | | | - | | | - | | | - | | | 9,726 | | | 195 |
Construction | | | 1,891 | | | - | | | - | | | - | | | 1,891 | | | 952 |
Residential real estate - Investor | | | 928 | | | - | | | - | | | - | | | 928 | | | - |
Residential real estate - Owner occupied | | | 3,535 | | | - | | | - | | | - | | | 3,535 | | | 10 |
Multifamily | | | 3,838 | | | - | | | - | | | - | | | 3,838 | | | 378 |
HELOC | | | 1,053 | | | - | | | - | | | - | | | 1,053 | | | 78 |
HELOC - Purchased | | | - | | | - | | | - | | | - | | | - | | | - |
Other | | | - | | | - | | | - | | | 4 | | | 4 | | | 4 |
Total | | $ | 25,150 | | $ | 1,070 | | $ | 2,377 | | $ | 656 | | $ | 29,253 | | $ | 2,637 |
| | | | | | | | | | | | | | | | | | |
Aged analysis of past due loans by class of loans as of December 31, 2017, and December 31, 2016,2021 were as follows:
| | | | | | | | | | | | | | | | | | | | | | | | |
| | | | | | | | | | | | | | | | | | | | | | | Recorded |
| | | | | | | | | | | | | | | | | | | | | | | Investment |
| | | | | | | | | | | | | | | | | | | | | | | 90 days or |
| | | | | | | | 90 Days or | | | | | | | | | | | | | | Greater Past |
| | 30-59 Days | | 60-89 Days | | Greater Past | | Total Past | | | | | | | | | | | Due and |
December 31, 2017 | | Past Due | | Past Due | | Due | | Due | | Current | | Nonaccrual | | Total Loans | | Accruing |
Commercial | | $ | 995 | | $ | 275 | | $ | - | | $ | 1,270 | | $ | 271,581 | | $ | - | | $ | 272,851 | | $ | - |
Leases | | | - | | | - | | | - | | | - | | | 68,147 | | | 178 | | | 68,325 | | | - |
Real estate - commercial | | | | | | | | | | | | | | | | | | | | | | | | |
Owner occupied general purpose | | | 1,136 | | | - | | | - | | | 1,136 | | | 144,267 | | | 455 | | | 145,858 | | | - |
Owner occupied special purpose | | | 226 | | | - | | | - | | | 226 | | | 170,546 | | | 342 | | | 171,114 | | | - |
Non-owner occupied general purpose | | | - | | | 593 | | | - | | | 593 | | | 273,203 | | | 1,163 | | | 274,959 | | | - |
Non-owner occupied special purpose | | | - | | | - | | | 248 | | | 248 | | | 92,923 | | | - | | | 93,171 | | | 254 |
Retail properties | | | - | | | - | | | - | | | - | | | 49,538 | | | 1,081 | | | 50,619 | | | - |
Farm | | | - | | | - | | | - | | | - | | | 15,270 | | | - | | | 15,270 | | | - |
Real estate - construction | | | | | | | | | | | | | | | | | | | | | | | | |
Homebuilder | | | 129 | | | - | | | - | | | 129 | | | 2,221 | | | - | | | 2,350 | | | - |
Land | | | 1,124 | | | - | | | - | | | 1,124 | | | 1,319 | | | - | | | 2,443 | | | - |
Commercial speculative | | | - | | | - | | | - | | | - | | | 32,028 | | | - | | | 32,028 | | | - |
All other | | | - | | | - | | | - | | | - | | | 48,140 | | | 201 | | | 48,341 | | | - |
Real estate - residential | | | | | | | | | | | | | | | | | | | | | | | | |
Investor | | | - | | | - | | | - | | | - | | | 55,248 | | | 372 | | | 55,620 | | | - |
Multifamily | | | - | | | - | | | - | | | - | | | 125,049 | | | 4,723 | | | 129,772 | | | - |
Owner occupied | | | 74 | | | - | | | - | | | 74 | | | 123,838 | | | 4,674 | | | 128,586 | | | - |
Revolving and junior liens | | | 491 | | | 278 | | | - | | | 769 | | | 110,291 | | | 1,192 | | | 112,252 | | | - |
Consumer | | | - | | | - | | | - | | | - | | | 2,767 | | | 7 | | | 2,774 | | | - |
Other1 | | | 37 | | | - | | | - | | | 37 | | | 11,252 | | | - | | | 11,289 | | | - |
Total | | $ | 4,212 | | $ | 1,146 | | $ | 248 | | $ | 5,606 | | $ | 1,597,628 | | $ | 14,388 | | $ | 1,617,622 | | $ | 254 |
| | | | | | | | | | | | | | | | | | | | | |
| | | | | | | | | | | | | | | | | | | | 90 days or |
| | | | | | | | 90 Days or | | | | | | | | | | | Greater Past |
| | 30-59 Days | | 60-89 Days | | Greater Past | | Total Past | | | | | | | | Due and |
December 31, 20211 | | Past Due | | Past Due | | Due | | Due | | Current | | Total Loans | | Accruing |
Commercial | | $ | 3,407 | | $ | 1,413 | | $ | 1,828 | | $ | 6,648 | | $ | 764,826 | | $ | 771,474 | | $ | 1,396 |
Leases | | | 125 | | | - | | | 1,571 | | | 1,696 | | | 174,335 | | | 176,031 | | | - |
Commercial real estate - Investor | | | - | | | 267 | | | 1,107 | | | 1,374 | | | 956,015 | | | 957,389 | | | - |
Commercial real estate - Owner occupied | | | 2,324 | | | 500 | | | 4,848 | | | 7,672 | | | 566,712 | | | 574,384 | | | 1,594 |
Construction | | | 854 | | | - | | | - | | | 854 | | | 205,278 | | | 206,132 | | | - |
Residential real estate - Investor | | | 395 | | | 470 | | | 792 | | | 1,657 | | | 61,742 | | | 63,399 | | | 23 |
Residential real estate - Owner occupied | | | 1,994 | | | 591 | | | 3,077 | | | 5,662 | | | 207,586 | | | 213,248 | | | 97 |
Multifamily | | | - | | | 1,046 | | | - | | | 1,046 | | | 308,118 | | | 309,164 | | | - |
HELOC | | | 193 | | | 23 | | | 218 | | | 434 | | | 115,230 | | | 115,664 | | | - |
HELOC - Purchased | | | - | | | - | | | 180 | | | 180 | | | 10,446 | | | 10,626 | | | - |
Other | | | 50 | | | 46 | | | 23 | | | 119 | | | 24,318 | | | 24,437 | | | - |
Total | | $ | 9,342 | | $ | 4,356 | | $ | 13,644 | | $ | 27,342 | | $ | 3,394,606 | | $ | 3,421,948 | | $ | 3,110 |
701 Loans modified under the CARES Act are considered current if they are in compliance with the modified terms.
There were 509 loans which totaled $242.7 million modified under the CARES Act in 2020 and 2021. As of December 31, 2021, 7 loans of the original 509 loans deferred, or $7.8 million, had an active deferral request and were in compliance with modified terms; 502 loans which totaled $234.9 million had resumed payments or paid off. As of December 31, 2021, 6 of the 7 deferred loans, or $7.7 million, are in nonaccrual status.
| | | | | | | | | | | | | | | | | | | | | | | | |
| | | | | | | | | | | | | | | | | | | | | | | Recorded |
| | | | | | | | | | | | | | | | | | | | | | | Investment |
| | | | | | | | | | | | | | | | | | | | | | | 90 days or |
| | | | | | | | 90 Days or | | | | | | | | | | | | | | Greater Past |
| | 30-59 Days | | 60-89 Days | | Greater Past | | Total Past | | | | | | | | | | | Due and |
December 31, 2016 | | Past Due | | Past Due | | Due | | Due | | Current | | Nonaccrual | | Total Loans | | Accruing |
Commercial | | $ | 57 | | $ | 74 | | $ | - | | $ | 131 | | $ | 227,742 | | $ | 240 | | $ | 228,113 | | $ | - |
Leases | | | - | | | 286 | | | - | | | 286 | | | 54,799 | | | 366 | | | 55,451 | | | - |
Real estate - commercial | | | | | | | | | | | | | | | | | | | | | | | | |
Owner occupied general purpose | | | 758 | | | - | | | - | | | 758 | | | 135,599 | | | 879 | | | 137,236 | | | - |
Owner occupied special purpose | | | - | | | - | | | - | | | - | | | 177,755 | | | 385 | | | 178,140 | | | - |
Non-owner occupied general purpose | | | 667 | | | 379 | | | - | | | 1,046 | | | 229,315 | | | 1,930 | | | 232,291 | | | - |
Non-owner occupied special purpose | | | - | | | - | | | - | | | - | | | 118,052 | | | 1,013 | | | 119,065 | | | - |
Retail properties | | | - | | | - | | | - | | | - | | | 53,474 | | | 1,179 | | | 54,653 | | | - |
Farm | | | 1,353 | | | - | | | - | | | 1,353 | | | 13,509 | | | - | | | 14,862 | | | - |
Real estate - construction | | | | | | | | | | | | | | | | | | | | | | | | |
Homebuilder | | | - | | | - | | | - | | | - | | | 3,883 | | | - | | | 3,883 | | | - |
Land | | | - | | | - | | | - | | | - | | | 3,029 | | | - | | | 3,029 | | | - |
Commercial speculative | | | - | | | - | | | - | | | - | | | 22,654 | | | 74 | | | 22,728 | | | - |
All other | | | 364 | | | - | | | - | | | 364 | | | 34,509 | | | 207 | | | 35,080 | | | - |
Real estate - residential | | | | | | | | | | | | | | | | | | | | | | | | |
Investor | | | 237 | | | - | | | - | | | 237 | | | 54,924 | | | 936 | | | 56,097 | | | - |
Multifamily | | | - | | | - | | | - | | | - | | | 96,502 | | | - | | | 96,502 | | | - |
Owner occupied | | | 274 | | | - | | | - | | | 274 | | | 116,900 | | | 6,452 | | | 123,626 | | | - |
Revolving and junior liens | | | 225 | | | 405 | | | - | | | 630 | | | 99,374 | | | 1,622 | | | 101,626 | | | - |
Consumer | | | 10 | | | 36 | | | - | | | 46 | | | 3,191 | | | - | | | 3,237 | | | - |
Other1 | | | 14 | | | - | | | - | | | 14 | | | 13,176 | | | - | | | 13,190 | | | - |
Total | | $ | 3,959 | | $ | 1,180 | | $ | - | | $ | 5,139 | | $ | 1,458,387 | | $ | 15,283 | | $ | 1,478,809 | | $ | - |
1The “Other” class includes overdraftsfollowing table presents the age analysis of past due loans as of December 31, 2020 were as follows:
| | | | | | | | | | | | | | | | | | | | | |
| | | | | | | | | | | | | | | | | | | | 90 days or |
| | | | | | | | 90 Days or | | | | | | | | | | | Greater Past |
| | 30-59 Days | | 60-89 Days | | Greater Past | | Total Past | | | | | | | | Due and |
December 31, 2020 1 | | Past Due | | Past Due | | Due | | Due | | Current | | Total Loans | | Accruing |
Commercial | | $ | - | | $ | - | | $ | 52 | | $ | 52 | | $ | 407,107 | | $ | 407,159 | | $ | - |
Leases | | | 613 | | | 59 | | | 316 | | | 988 | | | 140,613 | | | 141,601 | | | 163 |
Commercial real estate - Investor | | | 1,439 | | | - | | | 1,108 | | | 2,547 | | | 579,495 | | | 582,042 | | | - |
Commercial real estate - Owner occupied | | | 1,848 | | | 958 | | | 7,309 | | | 10,115 | | | 322,955 | | | 333,070 | | | - |
Construction | | | 1,237 | | | - | | | - | | | 1,237 | | | 97,249 | | | 98,486 | | | - |
Residential real estate - Investor | | | 1,022 | | | 20 | | | 484 | | | 1,526 | | | 54,611 | | | 56,137 | | | 157 |
Residential real estate - Owner occupied | | | 859 | | | 286 | | | 717 | | | 1,862 | | | 114,526 | | | 116,388 | | | 114 |
Multifamily | | | 3,282 | | | 467 | | | - | | | 3,749 | | | 185,291 | | | 189,040 | | | - |
HELOC | | | 549 | | | 50 | | | 206 | | | 805 | | | 80,103 | | | 80,908 | | | - |
HELOC - Purchased | | | 47 | | | - | | | - | | | 47 | | | 19,440 | | | 19,487 | | | - |
Other | | | 20 | | | - | | | - | | | 20 | | | 10,513 | | | 10,533 | | | - |
Total | | $ | 10,916 | | $ | 1,840 | | $ | 10,192 | | $ | 22,948 | | $ | 2,011,903 | | $ | 2,034,851 | | $ | 434 |
1 Loans modified under the CARES Act are considered current if they are in compliance with the modified terms.
The following table presents all nonaccrual loans and net deferred costs.loans on nonaccrual for which there was no related allowance for credit losses as of:
| | | | | | | | | | | | |
Nonaccrual loan detail | | December 31, 2021 | | With no ACL | | December 31, 2020 | | With no ACL |
Commercial | | $ | 11,894 | | $ | 9,217 | | $ | 1,125 | | $ | 1,070 |
Leases | | | 3,754 | | | 2,943 | | | 2,638 | | | 309 |
Commercial real estate - Investor | | | 5,694 | | | 5,694 | | | 1,632 | | | 1,632 |
Commercial real estate - Owner occupied | | | 11,637 | | | 11,205 | | | 9,262 | | | 6,780 |
Construction | | | 160 | | | 160 | | | - | | | - |
Residential real estate - Investor | | | 876 | | | 876 | | | 928 | | | 928 |
Residential real estate - Owner occupied | | | 4,898 | | | 4,622 | | | 3,206 | | | 3,206 |
Multifamily | | | 1,573 | | | 1,573 | | | 2,437 | | | 2,437 |
HELOC | | | 862 | | | 672 | | | 1,052 | | | 845 |
HELOC - Purchased | | | 180 | | | 180 | | | - | | | - |
Other | | | 3 | | | 3 | | | - | | | - |
Total | | $ | 41,531 | | $ | 37,145 | | $ | 22,280 | | $ | 17,207 |
The Company recognized $280,000 of interest on nonaccrual loans during the year ended December 31, 2021. The amount of accrued interest reversed against interest income totaled $237,000 for the year ended December 31, 2021.
Credit Quality Indicators:
The Company categorizes loans into credit risk categories based on current financial information, overall debt service coverage, comparison against industry averages, historical payment experience, and current economic trends. This analysis includes loans with outstanding balances or commitments greater than $50,000 and excludes homogeneous loans such as home equity lines of credit and residential mortgages. Loans with a classified risk rating are reviewed quarterly regardless of size or loan type. The Company uses the following definitions for classified risk ratings:
Special Mention. Loans classified as special mention have a potential weakness that deserves management’s close attention. If left uncorrected, these potential weaknesses may result in deterioration of the repayment prospects for the loan at some future date.
Substandard. Loans classified as substandard are inadequately protected by the current net worth and paying capacity of the obligor or of the collateral pledged, if any. Loans so classified have a well-defined weakness or weaknesses that jeopardize the liquidation of the debt. They are characterized by the distinct possibility that the institution will sustain some loss if the deficiencies are not corrected.
Doubtful. Loans classified as doubtful have all the weaknesses inherent in those classified as substandard, with the added characteristic that the weaknesses make collection or liquidation in full, on the basis of currently existing facts, conditions, and values, highly questionable and improbable.
Credits that are not covered by the definitions above are pass credits, which are not considered to be adversely rated.
Credit Quality Indicators by class of loans as of December 31, 2017, and2021 were as follows in the vintage table below:
| | | | | | | | | | | | | | | | | | | | | | | | | | | |
| | | | | | | | | | | | | | | | | | | | | | Revolving | | |
| | | | | | | | | | | | | | | | | | | | | | Loans | | |
| | | | | | | | | | | | | | | | | | | | | | Converted | | |
| | | | | | | | | | | | | | | | | | | | Revolving | | To Term | | |
| | 2021 | | 2020 | | 2019 | | 2018 | | 2017 | | Prior | | Loans | | Loans | | Total |
Commercial | | | | | | | | | | | | | | | | | | | | | | | | | | | |
Pass | | $ | 192,258 | | $ | 50,638 | | $ | 38,614 | | $ | 28,177 | | $ | 5,176 | | $ | 10,945 | | $ | 408,394 | | $ | 30 | | $ | 734,232 |
Special Mention | | | 44 | | | 84 | | | 694 | | | - | | | - | | | - | | | 3,708 | | | - | | | 4,530 |
Substandard | | | 9,498 | | | 4,048 | | | 14,121 | | | 326 | | | - | | | 75 | | | 4,644 | | | - | | | 32,712 |
Total commercial | | | 201,800 | | | 54,770 | | | 53,429 | | | 28,503 | | | 5,176 | | | 11,020 | | | 416,746 | | | 30 | | | 771,474 |
| | | | | | | | | | | | | | | | | | | | | | | | | | | |
Leases | | | | | | | | | | | | | | | | | | | | | | | | | | | |
Pass | | | 83,402 | | | 44,129 | | $ | 32,259 | | | 8,950 | | | 1,170 | | | 2,367 | | | - | | | - | | | 172,277 |
Special Mention | | | - | | | - | | | - | | | - | | | - | | | - | | | - | | | - | | | - |
Substandard | | | - | | | - | | | 2,834 | | | 623 | | | - | | | 297 | | | - | | | - | | | 3,754 |
Total leases | | | 83,402 | | | 44,129 | | | 35,093 | | | 9,573 | | | 1,170 | | | 2,664 | | | - | | | - | | | 176,031 |
| | | | | | | | | | | | | | | | | | | | | | | | | | | |
Commercial real estate - Investor | | | | | | | | | | | | | | | | | | | | | | | | | | | |
Pass | | | 315,247 | | | 233,964 | | | 147,511 | | | 85,049 | | | 64,810 | | | 55,523 | | | 18,602 | | | - | | | 920,706 |
Special Mention | | | 15,466 | | | - | | | 10,550 | | | - | | | - | | | - | | | - | | | - | | | 26,016 |
Substandard | | | 2,238 | | | 2,378 | | | 451 | | | 181 | | | 3,612 | | | 1,807 | | | - | | | - | | | 10,667 |
Total commercial real estate - investor | | | 332,951 | | | 236,342 | | | 158,512 | | | 85,230 | | | 68,422 | | | 57,330 | | | 18,602 | | | - | | | 957,389 |
| | | | | | | | | | | | | | | | | | | | | | | | | | | |
Commercial real estate - Owner occupied | | | | | | | | | | | | | | | | | | | | | | | | | | | |
Pass | | | 220,324 | | | 96,607 | | | 61,511 | | | 60,915 | | | 54,236 | | | 59,887 | | | 2,522 | | | - | | | 556,002 |
Special Mention | | | - | | | - | | | 2,953 | | | - | | | - | | | - | | | - | | | - | | | 2,953 |
Substandard | | | 8,318 | | | 942 | | | 1,686 | | | - | | | 1,251 | | | 3,232 | | | - | | | - | | | 15,429 |
Total commercial real estate - owner occupied | | | 228,642 | | | 97,549 | | | 66,150 | | | 60,915 | | | 55,487 | | | 63,119 | | | 2,522 | | | - | | | 574,384 |
| | | | | | | | | | | | | | | | | | | | | | | | | | | |
Construction | | | | | | | | | | | | | | | | | | | | | | | | | | | |
Pass | | | 88,620 | | | 65,629 | | | 37,169 | | | 2,727 | | | 477 | | | 1,193 | | | 1,143 | | | - | | | 196,958 |
Special Mention | | | - | | | 2,138 | | | 4,932 | | | - | | | - | | | - | | | - | | | - | | | 7,070 |
Substandard | | | 160 | | | - | | | - | | | 1,944 | | | - | | | - | | | - | | | - | | | 2,104 |
Total construction | | | 88,780 | | | 67,767 | | | 42,101 | | | 4,671 | | | 477 | | | 1,193 | | | 1,143 | | | - | | | 206,132 |
| | | | | | | | | | | | | | | | | | | | | | | | | | | |
Residential real estate - Investor | | | | | | | | | | | | | | | | | | | | | | | | | | | |
Pass | | | 13,371 | | | 9,758 | | | 13,084 | | | 6,392 | | | 7,059 | | | 10,602 | | | 1,868 | | | - | | | 62,134 |
Special Mention | | | - | | | - | | | - | | | - | | | - | | | - | | | - | | | - | | | - |
Substandard | | | 121 | | | 144 | | | - | | | 197 | | | 385 | | | 418 | | | - | | | - | | | 1,265 |
Total residential real estate - investor | | | 13,492 | | | 9,902 | | | 13,084 | | | 6,589 | | | 7,444 | | | 11,020 | | | 1,868 | | | - | | | 63,399 |
| | | | | | | | | | | | | | | | | | | | | | | | | | | |
Residential real estate - Owner occupied | | | | | | | | | | | | | | | | | | | | | | | | | | | |
Pass | | | 48,009 | | | 31,912 | | | 20,990 | | | 13,304 | | | 30,562 | | | 60,661 | | | 2,052 | | | - | | | 207,490 |
Special Mention | | | 659 | | | - | | | - | | | - | | | - | | | - | | | - | | | - | | | 659 |
Substandard | | | 322 | | | 183 | | | 6 | | | 1,219 | | | 176 | | | 3,193 | | | - | | | - | | | 5,099 |
Total residential real estate - owner occupied | | | 48,990 | | | 32,095 | | | 20,996 | | | 14,523 | | | 30,738 | | | 63,854 | | | 2,052 | | | - | | | 213,248 |
| | | | | | | | | | | | | | | | | | | | | | | | | | | |
Multifamily | | | | | | | | | | | | | | | | | | | | | | | | | | | |
Pass | | | 109,175 | | | 71,748 | | | 39,293 | | | 61,190 | | | 11,399 | | | 7,117 | | | 64 | | | - | | | 299,986 |
Special Mention | | | - | | | - | | | 6,900 | | | - | | | - | | | - | | | - | | | - | | | 6,900 |
Substandard | | | 433 | | | - | | | - | | | 1,543 | | | 302 | | | - | | | - | | | - | | | 2,278 |
Total multifamily | | | 109,608 | | | 71,748 | | | 46,193 | | | 62,733 | | | 11,701 | | | 7,117 | | | 64 | | | - | | | 309,164 |
| | | | | | | | | | | | | | | | | | | | | | | | | | | |
HELOC | | | | | | | | | | | | | | | | | | | | | | | | | | | |
Pass | | | 907 | | | 2,091 | | | 2,131 | | | 805 | | | 1,667 | | | 1,869 | | | 104,843 | | | - | | | 114,313 |
Special Mention | | | - | | | - | | | - | | | - | | | - | | | - | | | 108 | | | - | | | 108 |
Substandard | | | - | | | - | | | - | | | 17 | | | 12 | | | 196 | | | 1,018 | | | - | | | 1,243 |
Total HELOC | | | 907 | | | 2,091 | | | 2,131 | | | 822 | | | 1,679 | | | 2,065 | | | 105,969 | | | - | | | 115,664 |
| | | | | | | | | | | | | | | | | | | | | | | | | | | |
HELOC - Purchased | | | | | | | | | | | | | | | | | | | | | | | | | | | |
Pass | | | - | | | - | | | - | | | - | | | - | | | 10,446 | | | - | | | - | | | 10,446 |
Special Mention | | | - | | | - | | | - | | | - | | | - | | | - | | | - | | | - | | | - |
Substandard | | | - | | | - | | | - | | | - | | | - | | | 180 | | | - | | | - | | | 180 |
Total HELOC - purchased | | | - | | | - | | | - | | | - | | | - | | | 10,626 | | | - | | | - | | | 10,626 |
| | | | | | | | | | | | | | | | | | | | | | | | | | | |
Other | | | | | | | | | | | | | | | | | | | | | | | | | | | |
Pass | | | 8,659 | | | 1,099 | | | 437 | | | 254 | | | 1,414 | | | 5,358 | | | 7,206 | | | - | | | 24,427 |
Special Mention | | | - | | | - | | | - | | | - | | | - | | | - | | | - | | | - | | | - |
Substandard | | | - | | | 3 | | | - | | | 7 | | | - | | | - | | | - | | | - | | | 10 |
Total other | | | 8,659 | | | 1,102 | | | 437 | | | 261 | | | 1,414 | | | 5,358 | | | 7,206 | | | - | | | 24,437 |
| | | | | | | | | | | | | | | | | | | | | | | | | | | |
Total loans | | | | | | | | | | | | | | | | | | | | | | | | | | | |
Pass | | | 1,079,972 | | | 607,575 | | | 392,999 | | | 267,763 | | | 177,970 | | | 225,968 | | | 546,694 | | | 30 | | | 3,298,971 |
Special Mention | | | 16,169 | | | 2,222 | | | 26,029 | | | - | | | - | | | - | | | 3,816 | | | - | | | 48,236 |
Substandard | | | 21,090 | | | 7,698 | | | 19,098 | | | 6,057 | | | 5,738 | | | 9,398 | | | 5,662 | | | - | | | 74,741 |
Total loans | | $ | 1,117,231 | | $ | 617,495 | | $ | 438,126 | | $ | 273,820 | | $ | 183,708 | | $ | 235,366 | | $ | 556,172 | | $ | 30 | | $ | 3,421,948 |
| | | | | | | | | | | | | | | | | | | | | | | | | | | |
Credit quality indicators by loan class at December 31, 2016,2020 were as follows:
| | | | | | | | | | | | | | | | | | | | | | | | | | | |
| | | | | | | | | | | | | | | | | | | | | | Revolving | | |
| | | | | | | | | | | | | | | | | | | | | | Loans | | |
| | | | | | | | | | | | | | | | | | | | | | Converted | | |
| | | | | | | | | | | | | | | | | | | | Revolving | | To Term | | |
| | 2020 | | 2019 | | 2018 | | 2017 | | 2016 | | Prior | | Loans | | Loans | | Total |
Commercial | | | | | | | | | | | | | | | | | | | | | | | | | | | |
Pass | | $ | 101,796 | | $ | 42,294 | | $ | 14,519 | | $ | 6,265 | | $ | 1,825 | | $ | 1,691 | | $ | 230,388 | | $ | - | | $ | 398,778 |
Special Mention | | | 5,130 | | | 425 | | | 68 | | | - | | | 3 | | | - | | | 76 | | | - | | | 5,702 |
Substandard | | | 273 | | | 52 | | | 1,524 | | | - | | | - | | | - | | | 830 | | | - | | | 2,679 |
Total commercial | | | 107,199 | | | 42,771 | | | 16,111 | | | 6,265 | | | 1,828 | | | 1,691 | | | 231,294 | | | - | | | 407,159 |
| | | | | | | | | | | | | | | | | | | | | | | | | | | |
Leases | | | | | | | | | | | | | | | | | | | | | | | | | | | |
Pass | | | 56,605 | | | 52,168 | | | 16,830 | | | 6,545 | | | 5,242 | | | 651 | | | - | | | - | | | 138,041 |
Special Mention | | | 175 | | | 163 | | | - | | | - | | | - | | | - | | | - | | | - | | | 338 |
Substandard | | | - | | | 1,434 | | | 798 | | | 59 | | | 450 | | | 481 | | | - | | | - | | | 3,222 |
Total leases | | | 56,780 | | | 53,765 | | | 17,628 | | | 6,604 | | | 5,692 | | | 1,132 | | | - | | | - | | | 141,601 |
| | | | | | | | | | | | | | | | | | | | | | | | | | | |
Commercial real estate - Investor | | | | | | | | | | | | | | | | | | | | | | | | | | | |
Pass | | | 173,781 | | | 158,677 | | | 92,156 | | | 66,762 | | | 55,963 | | | 15,966 | | | 1,319 | | | - | | | 564,624 |
Special Mention | | | 2,394 | | | 9,592 | | | 220 | | | - | | | 95 | | | - | | | - | | | - | | | 12,301 |
Substandard | | | 2,709 | | | 1,126 | | | 71 | | | - | | | 340 | | | 871 | | | - | | | - | | | 5,117 |
Total commercial real estate - investor | | | 178,884 | | | 169,395 | | | 92,447 | | | 66,762 | | | 56,398 | | | 16,837 | | | 1,319 | | | - | | | 582,042 |
| | | | | | | | | | | | | | | | | | | | | | | | | | | |
Commercial real estate - Owner occupied | | | | | | | | | | | | | | | | | | | | | | | | | | | |
Pass | | | 72,605 | | | 52,809 | | | 73,719 | | | 45,315 | | | 50,000 | | | 25,507 | | | 1,324 | | | - | | | 321,279 |
Special Mention | | | 604 | | | - | | | - | | | - | | | - | | | - | | | - | | | - | | | 604 |
Substandard | | | 1,564 | | | 2,154 | | | 1,780 | | | 1,664 | | | 501 | | | 3,524 | | | - | | | - | | | 11,187 |
Total commercial real estate - owner occupied | | | 74,773 | | | 54,963 | | | 75,499 | | | 46,979 | | | 50,501 | | | 29,031 | | | 1,324 | | | - | | | 333,070 |
| | | | | | | | | | | | | | | | | | | | | | | | | | | |
Construction | | | | | | | | | | | | | | | | | | | | | | | | | | | |
Pass | | | 50,170 | | | 24,163 | | | 7,203 | | | 539 | | | 218 | | | 1,261 | | | 9,702 | | | - | | | 93,256 |
Special Mention | | | 38 | | | - | | | - | | | - | | | - | | | - | | | - | | | - | | | 38 |
Substandard | | | - | | | 3,135 | | | 2,057 | | | - | | | - | | | - | | | - | | | - | | | 5,192 |
Total construction | | | 50,208 | | | 27,298 | | | 9,260 | | | 539 | | | 218 | | | 1,261 | | | 9,702 | | | - | | | 98,486 |
| | | | | | | | | | | | | | | | | | | | | | | | | | | |
Residential real estate - Investor | | | | | | | | | | | | | | | | | | | | | | | | | | | |
Pass | | | 9,371 | | | 14,194 | | | 8,522 | | | 7,775 | | | 2,431 | | | 11,184 | | | 1,144 | | | - | | | 54,621 |
Special Mention | | | - | | | - | | | - | | | - | | | - | | | - | | | - | | | - | | | - |
Substandard | | | 349 | | | - | | | 610 | | | - | | | 91 | | | 466 | | | - | | | - | | | 1,516 |
Total residential real estate - investor | | | 9,720 | | | 14,194 | | | 9,132 | | | 7,775 | | | 2,522 | | | 11,650 | | | 1,144 | | | - | | | 56,137 |
| | | | | | | | | | | | | | | | | | | | | | | | | | | |
Residential real estate - Owner occupied | | | | | | | | | | | | | | | | | | | | | | | | | | | |
Pass | | | 18,308 | | | 23,450 | | | 10,808 | | | 15,409 | | | 10,394 | | | 31,325 | | | 2,654 | | | - | | | 112,348 |
Special Mention | | | - | | | - | | | - | | | - | | | - | | | - | | | - | | | - | | | - |
Substandard | | | 47 | | | - | | | 412 | | | 219 | | | 526 | | | 2,836 | | | - | | | - | | | 4,040 |
Total residential real estate - owner occupied | | | 18,355 | | | 23,450 | | | 11,220 | | | 15,628 | | | 10,920 | | | 34,161 | | | 2,654 | | | - | | | 116,388 |
| | | | | | | | | | | | | | | | | | | | | | | | | | | |
Multifamily | | | | | | | | | | | | | | | | | | | | | | | | | | | |
Pass | | | 40,671 | | | 30,849 | | | 44,301 | | | 38,133 | | | 12,147 | | | 7,735 | | | 197 | | | - | | | 174,033 |
Special Mention | | | - | | | 6,901 | | | - | | | 548 | | | - | | | - | | | - | | | - | | | 7,449 |
Substandard | | | 69 | | | - | | | 4,254 | | | 927 | | | 118 | | | 2,190 | | | - | | | - | | | 7,558 |
Total multifamily | | | 40,740 | | | 37,750 | | | 48,555 | | | 39,608 | | | 12,265 | | | 9,925 | | | 197 | | | - | | | 189,040 |
| | | | | | | | | | | | | | | | | | | | | | | | | | | |
HELOC | | | | | | | | | | | | | | | | | | | | | | | | | | | |
Pass | | | 2,511 | | | 2,174 | | | 1,679 | | | 2,120 | | | 504 | | | 803 | | | 69,483 | | | - | | | 79,274 |
Special Mention | | | - | | | - | | | - | | | - | | | - | | | - | | | 94 | | | - | | | 94 |
Substandard | | | - | | | - | | | 86 | | | 37 | | | 271 | | | 91 | | | 1,055 | | | - | | | 1,540 |
Total HELOC | | | 2,511 | | | 2,174 | | | 1,765 | | | 2,157 | | | 775 | | | 894 | | | 70,632 | | | - | | | 80,908 |
| | | | | | | | | | | | | | | | | | | | | | | | | | | |
HELOC - Purchased | | | | | | | | | | | | | | | | | | | | | | | | | | | |
Pass | | | - | | | - | | | - | | | - | | | - | | | 19,487 | | | - | | | - | | | 19,487 |
Special Mention | | | - | | | - | | | - | | | - | | | - | | | - | | | - | | | - | | | - |
Substandard | | | - | | | - | | | - | | | - | | | - | | | - | | | - | | | - | | | - |
Total HELOC - purchased | | | - | | | - | | | - | | | - | | | - | | | 19,487 | | | - | | | - | | | 19,487 |
| | | | | | | | | | | | | | | | | | | | | | | | | | | |
Other | | | | | | | | | | | | | | | | | | | | | | | | | | | |
Pass | | | 1,555 | | | 574 | | | 569 | | | 229 | | | 559 | | | 341 | | | 6,702 | | | - | | | 10,529 |
Special Mention | | | - | | | - | | | - | | | - | | | - | | | - | | | - | | | - | | | - |
Substandard | | | - | | | - | | | 4 | | | - | | | - | | | - | | | - | | | - | | | 4 |
Total other | | | 1,555 | | | 574 | | | 573 | | | 229 | | | 559 | | | 341 | | | 6,702 | | | - | | | 10,533 |
| | | | | | | | | | | | | | | | | | | | | | | | | | | |
Total loans | | | | | | | | | | | | | | | | | | | | | | | | | | | |
Pass | | | 527,373 | | | 401,352 | | | 270,306 | | | 189,092 | | | 139,283 | | | 115,951 | | | 322,913 | | | - | | | 1,966,270 |
Special Mention | | | 8,341 | | | 17,081 | | | 288 | | | 548 | | | 98 | | | - | | | 170 | | | - | | | 26,526 |
Substandard | | | 5,011 | | | 7,901 | | | 11,596 | | | 2,906 | | | 2,297 | | | 10,459 | | | 1,885 | | | - | | | 42,055 |
Total loans | | $ | 540,725 | | $ | 426,334 | | $ | 282,190 | | $ | 192,546 | | $ | 141,678 | | $ | 126,410 | | $ | 324,968 | | $ | - | | $ | 2,034,851 |
| | | | | | | | | | | | | | | |
December 31, 2017 | | | | | Special | | | | | | | | | |
| | Pass | | Mention | | Substandard 1 | | Doubtful | | Total |
Commercial | | $ | 270,889 | | $ | 1,962 | | $ | - | | $ | - | | $ | 272,851 |
Leases | | | 67,500 | | | - | | | 825 | | | - | | | 68,325 |
Real estate - commercial | | | | | | | | | | | | | | | |
Owner occupied general purpose | | | 142,843 | | | 1,927 | | | 1,088 | | | - | | | 145,858 |
Owner occupied special purpose | | | 169,621 | | | 1,152 | | | 341 | | | - | | | 171,114 |
Non-owner occupied general purpose | | | 271,731 | | | 2,065 | | | 1,163 | | | - | | | 274,959 |
Non-owner occupied special purpose | | | 89,582 | | | - | | | 3,589 | | | - | | | 93,171 |
Retail Properties | | | 48,321 | | | 1,217 | | | 1,081 | | | - | | | 50,619 |
Farm | | | 11,755 | | | 1,029 | | | 2,486 | | | - | | | 15,270 |
Real estate - construction | | | | | | | | | | | | | | | |
Homebuilder | | | 2,350 | | | - | | | - | | | - | | | 2,350 |
Land | | | 2,443 | | | - | | | - | | | - | | | 2,443 |
Commercial speculative | | | 32,028 | | | - | | | - | | | - | | | 32,028 |
All other | | | 46,913 | | | 1,052 | | | 376 | | | - | | | 48,341 |
Real estate - residential | | | | | | | | | | | | | | | |
Investor | | | 55,172 | | | - | | | 448 | | | - | | | 55,620 |
Multifamily | | | 125,049 | | | - | | | 4,723 | | | - | | | 129,772 |
Owner occupied | | | 122,759 | | | 561 | | | 5,266 | | | - | | | 128,586 |
Revolving and junior liens | | | 110,353 | | | - | | | 1,899 | | | - | | | 112,252 |
Consumer | | | 2,754 | | | - | | | 20 | | | - | | | 2,774 |
Other | | | 11,289 | | | - | | | - | | | - | | | 11,289 |
Total | | $ | 1,583,352 | | $ | 10,965 | | $ | 23,305 | | $ | - | | $ | 1,617,622 |
| | | | | | | | | | | | | | | |
December 31, 2016 | | | | | Special | | | | | | | | | |
| | Pass | | Mention | | Substandard 1 | | Doubtful | | Total |
Commercial | | $ | 214,028 | | $ | 11,558 | | $ | 2,527 | | $ | - | | $ | 228,113 |
Leases | | | 53,366 | | | 976 | | | 1,109 | | | - | | | 55,451 |
Real estate - commercial | | | | | | | | | | | | | | | |
Owner occupied general purpose | | | 135,503 | | | 53 | | | 1,680 | | | - | | | 137,236 |
Owner occupied special purpose | | | 172,353 | | | 5,402 | | | 385 | | | - | | | 178,140 |
Non-owner occupied general purpose | | | 229,448 | | | 913 | | | 1,930 | | | - | | | 232,291 |
Non-owner occupied special purpose | | | 114,293 | | | - | | | 4,772 | | | - | | | 119,065 |
Retail Properties | | | 52,207 | | | 1,267 | | | 1,179 | | | - | | | 54,653 |
Farm | | | 11,840 | | | 1,240 | | | 1,782 | | | - | | | 14,862 |
Real estate - construction | | | | | | | | | | | | | | | |
Homebuilder | | | 3,883 | | | - | | | - | | | - | | | 3,883 |
Land | | | 3,029 | | | - | | | - | | | - | | | 3,029 |
Commercial speculative | | | 22,654 | | | - | | | 74 | | | - | | | 22,728 |
All other | | | 34,696 | | | - | | | 384 | | | - | | | 35,080 |
Real estate - residential | | | | | | | | | | | | | | | |
Investor | | | 55,001 | | | - | | | 1,096 | | | - | | | 56,097 |
Multifamily | | | 96,502 | | | - | | | - | | | - | | | 96,502 |
Owner occupied | | | 115,831 | | | 570 | | | 7,225 | | | - | | | 123,626 |
Revolving and junior liens | | | 99,286 | | | - | | | 2,340 | | | - | | | 101,626 |
Consumer | | | 3,236 | | | - | | | 1 | | | - | | | 3,237 |
Other | | | 13,165 | | | 25 | | | - | | | - | | | 13,190 |
Total | | $ | 1,430,321 | | $ | 22,004 | | $ | 26,484 | | $ | - | | $ | 1,478,809 |
1The substandard credit quality indicator includes both potential problem loans that are currently performing and nonperforming loans.
The Company had $1.3 million$488,000 and $1.8 million$546,000 in consumer mortgage loans in the process of foreclosure as of December 31, 20172021 and December 31, 2016,2020, respectively.
Impaired loans, which include nonaccrual loans and troubled debt restructurings, by class of loan as of December 31 were as follows:
| | | | | | | | | | | | | | | | | | |
| | December 31, 2017 | | December 31, 2016 |
| | | | | Unpaid | | | | | | | Unpaid | | |
| | Recorded | | Principal | | Related | | Recorded | | Principal | | Related |
| | Investment | | Balance | | Allowance | | Investment | | Balance | | Allowance |
With no related allowance recorded | | | | | | | | | | | | | | | | | | |
Commercial | | $ | - | | $ | - | | $ | - | | $ | 240 | | $ | 388 | | $ | - |
Leases | | | 178 | | | 213 | | | - | | | 366 | | | 371 | | | - |
Commercial real estate | | | | | | | | | | | | | | | | | | |
Owner occupied general purpose | | | 455 | | | 495 | | | - | | | 1,881 | | | 2,131 | | | - |
Owner occupied special purpose | | | 342 | | | 498 | | | - | | | 385 | | | 518 | | | - |
Non-owner occupied general purpose | | | 1,163 | | | 1,538 | | | - | | | 1,744 | | | 2,010 | | | - |
Non-owner occupied special purpose | | | - | | | - | | | - | | | 1,013 | | | 1,649 | | | - |
Retail properties | | | 1,081 | | | 1,177 | | | - | | | 1,179 | | | 1,235 | | | - |
Farm | | | - | | | - | | | - | | | - | | | - | | | - |
Construction | | | | | | | | | | | | | | | | | | |
Homebuilder | | | - | | | - | | | - | | | - | | | - | | | - |
Land | | | - | | | - | | | - | | | - | | | - | | | - |
Commercial speculative | | | - | | | - | | | - | | | 74 | | | 81 | | | - |
All other | | | 201 | | | 229 | | | - | | | 207 | | | 221 | | | - |
Residential | | | | | | | | | | | | | | | | | | |
Investor | | | 372 | | | 676 | | | - | | | 1,841 | | | 2,308 | | | - |
Multifamily | | | 4,723 | | | 4,965 | | | - | | | - | | | - | | | - |
Owner occupied | | | 5,208 | | | 6,680 | | | - | | | 9,824 | | | 11,391 | | | - |
Revolving and junior liens | | | 1,125 | | | 1,313 | | | - | | | 2,484 | | | 3,018 | | | - |
Consumer | | | 7 | | | 8 | | | - | | | - | | | - | | | - |
Total impaired loans with no recorded allowance | | | 14,855 | | | 17,792 | | | - | | | 21,238 | | | 25,321 | | | - |
| | | | | | | | | | | | | | | | | | |
With an allowance recorded | | | | | | | | | | | | | | | | | | |
Commercial | | | - | | | - | | | - | | | - | | | - | | | - |
Leases | | | - | | | - | | | - | | | - | | | - | | | - |
Commercial real estate | | | | | | | | | | | | | | | | | | |
Owner occupied general purpose | | | - | | | - | | | - | | | - | | | - | | | - |
Owner occupied special purpose | | | - | | | - | | | - | | | - | | | - | | | - |
Non-owner occupied general purpose | | | - | | | - | | | - | | | 246 | | | 595 | | | 246 |
Non-owner occupied special purpose | | | - | | | - | | | - | | | - | | | - | | | - |
Retail properties | | | - | | | - | | | - | | | - | | | - | | | - |
Farm | | | - | | | - | | | - | | | - | | | - | | | - |
Construction | | | | | | | | | | | | | | | | | | |
Homebuilder | | | - | | | - | | | - | | | - | | | - | | | - |
Land | | | - | | | - | | | - | | | - | | | - | | | - |
Commercial speculative | | | - | | | - | | | - | | | - | | | - | | | - |
All other | | | - | | | - | | | - | | | - | | | - | | | - |
Residential | | | | | | | | | | | | | | | | | | |
Investor | | | 829 | | | 829 | | | 10 | | | - | | | - | | | - |
Multifamily | | | - | | | - | | | - | | | - | | | - | | | - |
Owner occupied | | | 3,443 | | | 3,443 | | | 43 | | | 803 | | | 853 | | | 803 |
Revolving and junior liens | | | 985 | | | 985 | | | 91 | | | - | | | - | | | - |
Consumer | | | - | | | - | | | - | | | - | | | - | | | - |
Total impaired loans with a recorded allowance | | | 5,257 | | | 5,257 | | | 144 | | | 1,049 | | | 1,448 | | | 1,049 |
Total impaired loans | | $ | 20,112 | | $ | 23,049 | | $ | 144 | | $ | 22,287 | | $ | 26,769 | | $ | 1,049 |
Average recorded investment and interest income recognized on impaired loans by class of loan for the years ending December 31 were as follows:
| | | | | | | | | | | | | | | | | | |
| | Year to date | | Year to date | | Year to date |
| | December 31, 2017 | | December 31, 2016 | | December 31, 2015 |
| | Average | | Interest | | Average | | Interest | | Average | | Interest |
| | Recorded | | Income | | Recorded | | Income | | Recorded | | Income |
| | Investment | | Recognized | | Investment | | Recognized | | Investment | | Recognized |
With no related allowance recorded | | | | | | | | | | | | | | | | | | |
Commercial | | $ | 120 | | $ | - | | $ | 155 | | $ | - | | $ | 785 | | $ | - |
Lease | | | 272 | | | - | | | 183 | | | - | | | - | | | - |
Commercial real estate | | | | | | | | | | | | | | | | | | |
Owner occupied general purpose | | | 1,168 | | | - | | | 2,098 | | | 87 | | | 4,720 | | | 82 |
Owner occupied special purpose | | | 364 | | | - | | | 574 | | | - | | | 1,280 | | | - |
Non-owner occupied general purpose | | | 1,453 | | | - | | | 1,395 | | | 2 | | | 2,939 | | | 3 |
Non-owner occupied special purpose | | | 507 | | | - | | | 507 | | | - | | | 712 | | | - |
Retail properties | | | 1,130 | | | - | | | 589 | | | - | | | - | | | - |
Farm | | | - | | | - | | | 636 | | | - | | | 636 | | | - |
Construction | | | | | | | | | | | | | | | | | | |
Homebuilder | | | - | | | - | | | - | | | - | | | 895 | | | - |
Land | | | - | | | - | | | - | | | - | | | - | | | - |
Commercial speculative | | | 37 | | | - | | | 79 | | | - | | | 42 | | | - |
All other | | | 204 | | | - | | | 103 | | | - | | | 145 | | | - |
Residential | | | | | | | | | | | | | | | | | | |
Investor | | | 1,106 | | | - | | | 1,874 | | | 47 | | | 2,251 | | | 51 |
Multifamily | | | 2,362 | | | - | | | - | | | - | | | - | | | - |
Owner occupied | | | 7,516 | | | 44 | | | 10,181 | | | 158 | | | 10,979 | | | 160 |
Revolving and junior liens | | | 1,804 | | | 1 | | | 2,608 | | | 29 | | | 2,484 | | | 7 |
Consumer | | | 4 | | | - | | | - | | | - | | | - | | | - |
Total impaired loans with no recorded allowance | | | 18,047 | | | 45 | | | 20,982 | | | 323 | | | 27,868 | | | 303 |
| | | | | | | | | | | | | | | | | | |
With an allowance recorded | | | | | | | | | | | | | | | | | | |
Commercial | | | - | | | - | | | 2 | | | - | | | 2 | | | - |
Leases | | | - | | | - | | | - | | | - | | | - | | | - |
Commercial real estate | | | | | | | | | | | | | | | | | | |
Owner occupied general purpose | | | - | | | - | | | - | | | - | | | - | | | - |
Owner occupied special purpose | | | - | | | - | | | - | | | - | | | - | | | - |
Non-owner occupied general purpose | | | 123 | | | - | | | 123 | | | - | | | 38 | | | - |
Non-owner occupied special purpose | | | - | | | - | | | - | | | - | | | - | | | - |
Retail properties | | | - | | | - | | | - | | | - | | | - | | | - |
Farm | | | - | | | - | | | - | | | - | | | - | | | - |
Construction | | | | | | | | | | | | | | | | | | |
Homebuilder | | | - | | | - | | | - | | | - | | | - | | | - |
Land | | | - | | | - | | | - | | | - | | | - | | | - |
Commercial speculative | | | - | | | - | | | - | | | - | | | - | | | - |
All other | | | - | | | - | | | - | | | - | | | 135 | | | - |
Residential | | | | | | | | | | | | | | | | | | |
Investor | | | 414 | | | 43 | | | - | | | - | | | 67 | | | - |
Multifamily | | | - | | | - | | | - | | | - | | | - | | | - |
Owner occupied | | | 2,123 | | | 123 | | | 457 | | | - | | | 68 | | | - |
Revolving and junior liens | | | 493 | | | 35 | | | 23 | | | - | | | 208 | | | 3 |
Consumer | | | - | | | - | | | - | | | - | | | - | | | - |
Total impaired loans with a recorded allowance | | | 3,153 | | | 201 | | | 605 | | | - | | | 518 | | | 3 |
Total impaired loans | | $ | 21,200 | | $ | 246 | | $ | 21,587 | | $ | 323 | | $ | 28,386 | | $ | 306 |
Troubled debt restructurings (“TDRs”) are loans for which the contractual terms have been modified and both of these conditions exist: (1) there is a concession to the borrower and (2) the borrower is experiencing financial difficulties. Loans are restructured on a case-by-case basis during the loan collection process with modifications generally initiated at the request of the borrower. These modifications may include reduction in interest rates, extension of term, deferrals of principal, and other modifications. The Bank participates in the U.S. Department of the Treasury’s (the “Treasury”) Home Affordable Modification Program (“HAMP”) which gives qualifying homeowners an opportunity to refinance into more affordable monthly payments.
The specific allocationamount of expected loan losses for TDRs is measured based upon the ALLL on a TDR is determined by either discounting the modifiedpresent value of expected future cash flows discounted at the originalloan’s effective interest rate, of the loan before modification or is based onfair value of the underlying collateral value less applicable selling costs, to sell, if repaymentor the observable market price of the loan is collateral-dependent. If the resulting amount is less than the recorded book value, the Bank either establishes a valuation allowance (i.e. specific reserve)loan.
The CARES Act, as a componentextended by certain provisions of the ALLL or charges offConsolidated Appropriations Act of 2021, permits banks to suspend requirements under GAAP for loan modifications to borrowers affected by COVID-19 that may otherwise be characterized as troubled debt restructurings and suspend any determination related thereto if (i) the impaired balance if it determines that such amount is a confirmed loss. This method is used consistently for all segmentsborrower was not more than 30 days past due as of December 31, 2019, (ii) the modifications are related to COVID-19, and (iii) the modification occurs between March 1, 2020 and the earlier of 60 days after the date of termination of the portfolio.national emergency or January 1, 2022.
LoansThe number of loans that were modified during the period, including the amortized cost basis pre- and post-modification are summarized as follows:
| | | | | | | | | | | | | | | | | |
| | TDR Modifications | | TDR Modifications | |
| | Three Months Ended December 31, 2021 | | Year Ended December 31, 2021 | |
| | # of | | Pre-modification | | Post-modification | | # of | | Pre-modification | | Post-modification | |
|
| contracts | | recorded investment | | recorded investment |
| contracts | | recorded investment | | recorded investment |
|
Troubled debt restructurings | | | | | | | | | | | | | | | | | |
Residential real estate - Owner occupied | | | | | | | | | | | | | | | | | |
HAMP1 | | - | | $ | - | | $ | - | | - | | $ | - | | $ | - | |
Total | | - | | $ | - | | $ | - | | - | | $ | - | | $ | - | |
| | | | | | | | | |
| | TDR Modifications | |
| | Twelve months ended December 31, 2017 | |
| | # of | | Pre-modification | | Post-modification | |
| | contracts | | recorded investment | | recorded investment | |
Troubled debt restructurings | | | | | | | | | |
Real estate - commercial | | | | | | | | | |
Other1 | | 1 | | $ | 97 | | $ | 131 | |
Real estate - residential | | | | | | | | | |
Owner occupied | | | | | | | | | |
HAMP2 | | 2 | | | 184 | | | 189 | |
Other1 | | 1 | | | 41 | | | 42 | |
Revolving and junior liens | | | | | | | | | |
HAMP2 | | 1 | | | 49 | | | 49 | |
Other1 | | 6 | | | 319 | | | 350 | |
Total | | 11 | | $ | 690 | | $ | 761 | |
| | | | | | | | | | | | | | | | | |
| | TDR Modifications | | TDR Modifications | |
| | Three Months Ended December 31, 2020 | | Year Ended December 31, 2020 | |
| | # of | | Pre-modification | | Post-modification | | # of | | Pre-modification | | Post-modification | |
| | contracts | | recorded investment | | recorded investment | | contracts | | recorded investment | | recorded investment | |
Troubled debt restructurings | | | | | | | | | | | | | | | | | |
Residential real estate - Owner occupied | | | | | | | | | | | | | | | | | |
HAMP1 | | 1 | | $ | 154 | | $ | 153 | | 3 | | $ | 410 | | $ | 395 | |
Total | | 1 | | $ | 154 | | $ | 153 | | 3 | | $ | 410 | | $ | 395 | |
| | | | | | | | | |
| | TDR Modifications | |
| | Twelve months ended December 31, 2016 | |
| | # of | | Pre-modification | | Post-modification | |
| | contracts | | recorded investment | | recorded investment | |
Troubled debt restructurings | | | | | | | | | |
Real estate - commercial | | | | | | | | | |
Other1 | | 2 | | $ | 312 | | $ | 205 | |
Real estate - residential | | | | | | | | | |
Owner occupied | | | | | | | | | |
HAMP2 | | 2 | | | 419 | | | 262 | |
Revolving and junior liens | | | | | | | | | |
HAMP2 | | 3 | | | 252 | | | 228 | |
Other1 | | 3 | | | 808 | | | 777 | |
Total | | 10 | | $ | 1,791 | | $ | 1,472 | |
1 Other: Change of terms from bankruptcy court
2HAMP: Home Affordable Modification Program
TDRs are classified as being in default on a case-by-case basis when they fail to be in compliance with the modified terms. There were no0 TDRs that defaulted during year 20172021 and 2016.2020.
The Bank had noAs of December 31, 2021 and 2020, there were 0 commitments to borrowerslend additional funds to debtors whose terms have been modified in a TDR.
There were 0 loans were classified as impaired at December 31, 2017.purchased and/or sold during 2021 and 2020.
Loans to principal officers, directors, and their affiliates, which are made in the ordinary course of business, were as follows at December 31:
| | | | | | | |
| | 2017 | | 2016 | |
Beginning balance | | $ | 1,703 | | $ | 1,787 | |
New loans | | | 20 | | | 157 | |
Repayments and other reductions | | | (199) | | | (241) | |
Change in related party status | | | - | | | - | |
Ending balance | | $ | 1,524 | | $ | 1,703 | |
No loans to principal officers, directors, and their affiliates were past due greater than 90 days at eitherof December 31, 2017, or December 31, 2016.
Note 6: Allowance for Loan and Lease losses
Changes in the ALLL by segment of loans based on method of impairment for the year ended December 31, 2017, were as follows:
| | | | | | | | | | | | | | | | | | | | | | | | |
| | | | | | Real Estate | | Real Estate | | Real Estate | | | | | | |
Allowance for loan and lease losses: | | Commercial | | Leases | | Commercial | | Construction | | Residential | | Consumer | | Other | | Total |
Beginning balance | | $ | 1,629 | | $ | 633 | | $ | 9,547 | | $ | 389 | | $ | 2,692 | | $ | 833 | | $ | 435 | | $ | 16,158 |
Charge-offs | | | 25 | | | 215 | | | 309 | | | 23 | | | 1,347 | | | 386 | | | 1 | | | 2,306 |
Recoveries | | | 30 | | | - | | | 161 | | | 377 | | | 980 | | | 243 | | | 18 | | | 1,809 |
Provision (Release) | | | 819 | | | 274 | | | 123 | | | 180 | | | (520) | | | 834 | | | 90 | | | 1,800 |
Ending balance | | $ | 2,453 | | $ | 692 | | $ | 9,522 | | $ | 923 | | $ | 1,805 | | $ | 1,524 | | $ | 542 | | $ | 17,461 |
| | | | | | | | | | | | | | | | | | | | | | | | |
Ending balance: Individually evaluated for impairment | | $ | - | | $ | - | | $ | - | | $ | - | | $ | 53 | | $ | 91 | | $ | - | | $ | 144 |
Ending balance: Collectively evaluated for impairment | | $ | 2,453 | | $ | 692 | | $ | 9,522 | | $ | 923 | | $ | 1,752 | | $ | 1,433 | | $ | 542 | | $ | 17,317 |
| | | | | | | | | | | | | | | | | | | | | | | | |
Loans: | | | | | | | | | | | | | | | | | | | | | | | | |
Ending balance | | $ | 272,851 | | $ | 68,325 | | $ | 750,991 | | $ | 85,162 | | $ | 426,230 | | $ | 2,774 | | $ | 11,289 | | $ | 1,617,622 |
Ending balance: Individually evaluated for impairment | | $ | - | | $ | 178 | | $ | 3,041 | | $ | 201 | | $ | 14,575 | | $ | 2,117 | | $ | - | | $ | 20,112 |
Ending balance: Collectively evaluated for impairment | | $ | 272,851 | | $ | 68,147 | | $ | 747,950 | | $ | 84,961 | | $ | 411,655 | | $ | 657 | | $ | 11,289 | | $ | 1,597,510 |
| | | | | | | |
| | 2021 | | 2020 | |
Beginning balance | | $ | 783 | | $ | 961 | |
New loans, including acquired related party loans | | | 11,836 | | | 644 | |
Repayments and other reductions | | | (2,457) | | | (822) | |
Change in related party status | | | - | | | - | |
Ending balance | | $ | 10,162 | | $ | 783 | |
| | | | | | | |
Changes in the ALLL by segment of loans based on method of impairment for December 31, 2016, were as follows:
| | | | | | | | | | | | | | | | | | | | | | | | |
| | | | | | Real Estate | | Real Estate | | Real Estate | | | | | | |
Allowance for loan and lease losses: | | Commercial | | Leases | | Commercial | | Construction | | Residential | | Consumer | | Other | | Total |
Beginning balance | | $ | 1,463 | | $ | 633 | | $ | 9,013 | | $ | 265 | | $ | 1,694 | | $ | 1,190 | | $ | 1,965 | | $ | 16,223 |
Charge-offs | | | 95 | | | 23 | | | 1,633 | | | 23 | | | 1,072 | | | 344 | | | - | | | 3,190 |
Recoveries | | | 32 | | | 5 | | | 640 | | | 96 | | | 1,331 | | | 253 | | | 18 | | | 2,375 |
Provision (Release) | | | 229 | | | 18 | | | 1,527 | | | 51 | | | 739 | | | (266) | | | (1,548) | | | 750 |
Ending balance | | $ | 1,629 | | $ | 633 | | $ | 9,547 | | $ | 389 | | $ | 2,692 | | $ | 833 | | $ | 435 | | $ | 16,158 |
| | | | | | | | | | | | | | | | | | | | | | | | |
Ending balance: Individually evaluated for impairment | | $ | - | | $ | - | | $ | 246 | | $ | - | | $ | 803 | | $ | - | | $ | - | | $ | 1,049 |
Ending balance: Collectively evaluated for impairment | | $ | 1,629 | | $ | 633 | | $ | 9,301 | | $ | 389 | | $ | 1,889 | | $ | 833 | | $ | 435 | | $ | 15,109 |
| | | | | | | | | | | | | | | | | | | | | | | | |
Loans: | | | | | | | | | | | | | | | | | | | | | | | | |
Ending balance | | $ | 228,113 | | $ | 55,451 | | $ | 736,247 | | $ | 64,720 | | $ | 377,851 | | $ | 3,237 | | $ | 13,190 | | $ | 1,478,809 |
Ending balance: Individually evaluated for impairment | | $ | 240 | | $ | 366 | | $ | 6,448 | | $ | 281 | | $ | 14,952 | | $ | - | | $ | - | | $ | 22,287 |
Ending balance: Collectively evaluated for impairment | | $ | 227,873 | | $ | 55,085 | | $ | 729,799 | | $ | 64,439 | | $ | 362,899 | | $ | 3,237 | | $ | 13,190 | | $ | 1,456,522 |
Changes in the ALLL by segment of loans based on method of impairment for the year ended December 31, 2015, were as follows:
| | | | | | | | | | | | | | | | | | | | | |
| | Commercial | | Real Estate | | Real Estate | | Real Estate | | | | | | | | |
Allowance for loan and lease losses: | | & Leases | | Commercial | | Construction | | Residential | | Consumer | | Other | | Total |
Beginning balance | | $ | 1,644 | | $ | 12,577 | | $ | 1,475 | | $ | 1,981 | | $ | 1,454 | | $ | 2,506 | | $ | 21,637 |
Charge-offs | | | 993 | | | 1,653 | | | 2 | | | 1,639 | | | 483 | | | - | | | 4,770 |
Recoveries | | | 451 | | | 1,595 | | | 276 | | | 1,075 | | | 359 | | | - | | | 3,756 |
Provision (Release) | | | 994 | | | (3,506) | | | (1,484) | | | 277 | | | (140) | | | (541) | | | (4,400) |
Ending balance | | $ | 2,096 | | $ | 9,013 | | $ | 265 | | $ | 1,694 | | $ | 1,190 | | $ | 1,965 | | $ | 16,223 |
| | | | | | | | | | | | | | | | | | | | | |
Ending balance: Individually evaluated for impairment | | $ | 3 | | $ | - | | $ | - | | $ | 31 | | $ | - | | $ | - | | $ | 34 |
Ending balance: Collectively evaluated for impairment | | $ | 2,093 | | $ | 9,013 | | $ | 265 | | $ | 1,663 | | $ | 1,190 | | $ | 1,965 | | $ | 16,189 |
| | | | | | | | | | | | | | | | | | | | | |
Loans: | | | | | | | | | | | | | | | | | | | | | |
Ending balance | | $ | 141,315 | | $ | 605,721 | | $ | 19,806 | | $ | 351,007 | | $ | 4,216 | | $ | 11,650 | | $ | 1,133,715 |
Ending balance: Individually evaluated for impairment | | $ | 73 | | $ | 5,396 | | $ | 83 | | $ | 15,334 | | $ | - | | $ | - | | $ | 20,886 |
Ending balance: Collectively evaluated for impairment | | $ | 141,242 | | $ | 600,325 | | $ | 19,723 | | $ | 335,673 | | $ | 4,216 | | $ | 11,650 | | $ | 1,112,829 |
The Company’s allowance for loan and lease loss is calculated in accordance with GAAP and relevant supervisory guidance. All management estimates were made in light of observable trends within loan portfolio segments, market conditions and established credit review administration practices.
Note 7:6: Other Real Estate Owned
Details related to the activity in the other real estate owned (“OREO”) portfolio, net of valuation reserve, for the periods presented are itemized in the following table.
| | | | | | | | | | | |
| | Twelve Months Ended | | |
| | December 31, | | |
| | | | | | | | | | | |
| | | Twelve Months Ended | |
| | | December 31, | |
Other real estate owned | | 2017 | | 2016 | | 2015 | | | 2021 | | 2020 | | 2019 | |
Balance at beginning of period | | $ | 11,916 | | $ | 19,141 | | $ | 31,982 | | | $ | 2,474 | | $ | 5,004 | | $ | 7,175 | |
Property additions | | | 3,796 | | | 1,785 | | | 8,998 | | |
Property improvements | | | - | | | 16 | | | - | | |
Property additions, net of acquisition adjustments | | | | 5,748 | | | 898 | | | 872 | |
Less: | | | | | | | | | | | | | | | | | | | | |
Proceeds from property disposals, net of participation purchase and of gains/losses | | | 5,633 | | | 7,456 | | | 17,763 | | | | 5,787 | | | 3,071 | | | 2,515 | |
Period valuation adjustments | | | 1,708 | | | 1,570 | | | 4,076 | | |
Period valuation (write-up)/write-down | | | | 79 | | | 357 | | | 519 | |
Other adjustments | | | | - | | | - | | | 9 | |
Balance at end of period | | $ | 8,371 | | $ | 11,916 | | $ | 19,141 | | | $ | 2,356 | | $ | 2,474 | | $ | 5,004 | |
Activity in the valuation allowance was as follows:
| | | | | | | | | | | |
| | Twelve Months Ended | | |
| | December 31, | | |
| | 2017 | | 2016 | | 2015 | | |
| | | | | | | | | | | |
| | | Twelve Months Ended | |
| | | December 31, | |
| | | 2021 | | 2020 | | 2019 | |
Balance at beginning of period | | $ | 9,982 | | $ | 14,127 | | $ | 19,229 | | | $ | 1,643 | | $ | 6,712 | | $ | 8,027 | |
Provision for unrealized losses | | | 1,708 | | | 1,570 | | | 4,076 | | | | 79 | | | 357 | | | 519 | |
Reductions taken on sales | | | (3,482) | | | (5,867) | | | (9,271) | | | | (543) | | | (5,426) | | | (1,834) | |
Other adjustments | | | - | | | 152 | | | 93 | | |
Balance at end of period | | $ | 8,208 | | $ | 9,982 | | $ | 14,127 | | | $ | 1,179 | | $ | 1,643 | | $ | 6,712 | |
| | | | | | | | | | | |
Expenses related to OREO, net of lease revenue includes:
| | | | | | | | | | | |
| | Twelve Months Ended | | |
| | December 31, | | |
| | 2017 | | 2016 | | 2015 | | |
Gain on sales, net | | $ | (474) | | $ | (374) | | $ | (1,073) | | |
| | | | | | | | | | | |
| | | Twelve Months Ended | |
| | | December 31, | |
| | | 2021 | | 2020 | | 2019 | |
(Gain) on sales, net | | | $ | (41) | | $ | (204) | | $ | (264) | |
Provision for unrealized losses | | | 1,708 | | | 1,570 | | | 4,076 | | | | 79 | | | 357 | | | 519 | |
Operating expenses | | | 1,227 | | | 1,765 | | | 2,888 | | | | 133 | | | 535 | | | 173 | |
Less: | | | | | | | | | | | | | | | | | | | | |
Lease revenue | | | 296 | | | 218 | | | 700 | | | | 4 | | | 37 | | | 5 | |
Net OREO expense | | $ | 2,165 | | $ | 2,743 | | $ | 5,191 | | | $ | 167 | | $ | 651 | | $ | 423 | |
Note 8:7: Premises and Equipment
Premises and equipment at December 31, were as follows:
| | | | | | | | | | | | | | | | | | | | | |
| | 2017 | | 2016 | | | |
| | | | | Accumulated | | | | | | | | Accumulated | | | | | | |
| | | | | Depreciation/ | | Net Book | | | | | Depreciation/ | | Net Book | | | |
| | Cost | | Amortization | | Value | | Cost | | Amortization | | Value | | | |
| | | | | | | | | | | | | | | | | | | | | |
| | | 2021 | | 2020 | | |
| | | | | | Accumulated | | | | | | | | Accumulated | | | | | |
| | | | | | Depreciation/ | | Net Book | | | | | Depreciation/ | | Net Book | | |
| | | Cost | | Amortization | | Value | | Cost | | Amortization | | Value | | |
Land | | $ | 16,124 | | $ | - | | $ | 16,124 | | $ | 16,141 | | $ | - | | $ | 16,141 | | | | $ | 42,375 | | $ | - | | $ | 42,375 | | $ | 18,501 | | $ | - | | $ | 18,501 | | |
Buildings | | | 41,499 | | | 22,935 | | | 18,564 | | | 41,409 | | | 21,966 | | | 19,443 | | | | | 59,313 | | | 26,959 | | | 32,354 | | | 43,579 | | | 25,909 | | | 17,670 | | |
Leasehold improvements | | | 156 | | | 144 | | | 12 | | | 156 | | | 86 | | | 70 | | | | | 2,324 | | | 1,004 | | | 1,320 | | | 2,324 | | | 699 | | | 1,625 | | |
Furniture and equipment | | | 42,910 | | | 39,982 | | | 2,928 | | | 42,875 | | | 39,552 | | | 3,323 | | | | | 57,533 | | | 45,577 | | | 11,956 | | | 51,461 | | | 43,780 | | | 7,681 | | |
Total Premises and Equipment | | $ | 100,689 | | $ | 63,061 | | $ | 37,628 | | $ | 100,581 | | $ | 61,604 | | $ | 38,977 | | | | $ | 161,545 | | $ | 73,540 | | $ | 88,005 | | $ | 115,865 | | $ | 70,388 | | $ | 45,477 | | |
Total premises and equipment increased $42.5 million at December 31, 2021, compared to December 31, 2020, due to the West Suburban acquisition. Subsequent to the acquisition, the Company evaluated all branches for overlap and potential closure. NaN locations were identified for closure and potential future sale, which are expected to occur in the second and third quarters of 2022.
The Company performs assessments of the recoverability of long-lived assets when events or changes in circumstances indicate the branch carrying value may not be recoverable. For the year ended December 31, 2021, impairment charges of $3.8 million were recorded within occupancy, furniture and equipment expense in the Consolidated Statements of Income related to 4 branches identified for closure.
Note 9:8: Deposits
Major classifications of deposits at December 31, were as follows:
| | | | | | | | |
| | 2017 | | 2016 | | |
| | | | | | | | |
| | | 2021 | | 2020 | |
Noninterest bearing demand | | $ | 572,404 | | $ | 513,688 | | | $ | 1,428,055 | | $ | 909,505 | |
Savings | | | 262,220 | | | 256,159 | | | | 1,826,346 | | | 399,057 | |
NOW accounts | | | 429,448 | | | 419,417 | | | | 605,056 | | | 486,612 | |
Money market accounts | | | 276,082 | | | 275,273 | | | | 1,102,965 | | | 316,465 | |
Certificates of deposit of less than $100,000 | | | 216,493 | | | 228,993 | | | | 287,238 | | | 200,107 | |
Certificates of deposit of $100,000 through $250,000 | | | 122,489 | | | 110,992 | | | | 147,854 | | | 164,982 | |
Certificates of deposit of more than $250,000 | | | 43,789 | | | 62,263 | | | | 68,718 | | | 60,345 | |
Total deposits | | $ | 1,922,925 | | $ | 1,866,785 | | | $ | 5,466,232 | | $ | 2,537,073 | |
| | | | | | | | |
Growth in total deposits stemmed from the late 2016 Talmer branch acquisition; the Company assumed $48.9 million of additional deposits, primarily noninterest bearing demand accounts. The Company had $18.8$10.1 million and $59.1 million in brokered certificates of depositlisting service deposits as of December 31, 2017. The Company had $5.9 million in brokered certificates of deposit as of December 31, 2016.2021 and 2020. Deposits held by senior officers and directors, including their related interests, totaled $2.6$26.8 million and $1.6$2.3 million as of December 31, 20172021 and 2016.2020.
At December 31, 2017,2021, scheduled maturities of time deposits were as follows:
| | | | |
2018 | | $ | 158,547 | |
2019 | | | 101,609 | |
2020 | | | 84,951 | |
2021 | | | 32,271 | |
2022 | | | 5,393 | |
Total time deposits | | $ | 382,771 | |
| | | | |
2022 | | $ | 337,822 | |
2023 | | | 78,697 | |
2024 | | | 38,599 | |
2025 | | | 30,858 | |
2026 | | | 17,834 | |
Total time deposits | | $ | 503,810 | |
Note 9: Borrowings
Note 10: Borrowings
The following table is a summary of borrowings as of December 31, 2017,2021 and December 31, 2016.2020:
| | | | | | | |
| | 2021 | | 2020 | |
Securities sold under repurchase agreements | | $ | 50,337 | | $ | 66,980 | |
Junior subordinated debentures1 | | | 25,773 | | | 25,773 | |
Subordinated debentures | | | 59,212 | | | - | |
Senior notes | | | 44,480 | | | 44,375 | |
Notes payable and other borrowings | | | 19,074 | | | 23,393 | |
Total borrowings | | $ | 198,876 | | $ | 160,521 | |
| | | | | | | |
1 See Note 10: Junior subordinated debentures are discussed in detail in Note 11:Subordinated Debentures, below.
| | | | | | | |
| | 2017 | | 2016 | |
Securities sold under repurchase agreements | | $ | 29,918 | | $ | 25,715 | |
FHLBC advances1 | | | 115,000 | | | 70,000 | |
Junior subordinated debentures | | | 57,639 | | | 57,591 | |
Senior notes | | | 44,058 | | | 43,998 | |
Total borrowings | | $ | 246,615 | | $ | 197,304 | |
1 Included in other short-term borrowing on the balance sheet.
The Company enters into deposit sweep transactions where the transaction amounts are secured by pledged securities. These transactions consistently mature within 1 to 90 days from the transaction date and are governed by sweep repurchase agreements. All sweep repurchase agreements are treated as financings secured by U.S. government agencies, and collateralized mortgage obligations, mortgage-backed securities and/or highly-rated issues of State and political subdivisions, and had a carrying amount of $29.9$50.3 million and $67.0 million at December 31, 2017,2021 and $25.72020, respectively. The fair value of the pledged collateral was $113.0 million and $94.4 million at December 31, 2016. The fair value
of the pledged collateral was $40.0 million and $43.0 million at December 31, 20172021 and December 31, 2016,2020, respectively. At December 31, 2017,2021, there were no0 customers with secured balances exceeding 10% of stockholders’ equity.
Total FHLBC advances are generally limited to the lower of 35% of total assets and the amount of acceptable collateral adjusted for applicable funding percentages as determined by the FHLBC. As of December 31, 2017,2021 and 2020, the Bank had 0 outstanding advances in the amount of $115.0 million with $110.0 million at an interest rate of 1.42% and $5.0 million at an interest rate at 1.44%.short-term FHLBC advances. As of December 31, 2016, the Bank had outstanding advances in the amount of $70.0 million at an interest rate of 0.70%. As of December 31, 2017,2021, FHLBC stock owned by the Bank was valued at $5.4$7.1 million, and the principal balance of loans pledged was $536.9 million. As of December 31, 2020, FHLBC stock owned by the Bank was valued at $3.7 million, the fair value of securities pledged to the FHLBC was $80.9$54.7 million, and the principal balance of loans pledged was $277.4$625.8 million. In 2018, the Bank assumed $23.4 million of long-term FHLBC advances with the ABC acquisition. At December 31, 2021, one remaining long-term FHLBC advance, which is included in notes payable and other borrowings, has a total outstanding balance of $6.1 million and is
scheduled to mature over the next 4.25 years with an interest rate of 2.83%. At December 31, 2020, the long-term FHLBC advance had a total outstanding balance of $6.4 million and was scheduled to mature over the next 5.25 years with interest rate of 2.83%. Based on the total amount of securities and loans pledged, the Bank had total borrowing capacity of $286.3$390.4 million. Adjusting for the outstanding advances and letters of credit, the Bank had a remaining funding availability of $132.0$313.1 million on December 31, 2017.2021.
The Company completed a debt retirement and simultaneous senior debt offering inIn the fourthsecond quarter of 2016.2021, we entered into Subordinated debtNote Purchase Agreements with certain qualified institutional buyers pursuant to which we sold and issued $60.0 million in aggregate principal amount of $45.0 millionour 3.50% Fixed-to-Floating Rate Subordinated Notes due April 15, 2031 (the “Notes”). We sold the Notes to eligible purchasers in a private offering, and $500,000 of senior debt outstanding, scheduled to mature in March 2018, were paid off with the proceeds of this issuance are intended to be used for general corporate purposes, which may include, without limitation, the redemption of existing senior debt, common stock repurchases and strategic acquisitions. The Notes bear interest at a $45.0fixed annual rate of 3.50% through April 14, 2026, payable semi-annually in arrears. As of April 15, 2026 forward, the interest rate on the Notes will generally reset quarterly to a rate equal to Three-Month Term SOFR (as defined by the Note) plus 273 basis points, payable quarterly in arrears. The Notes have a stated maturity of April 15, 2031, and are redeemable, in whole are in part, on April 15, 2026, or any interest payment date thereafter, and at any time upon the occurrence of certain events. As of December 31, 2021, we had $59.2 million of subordinated debentures outstanding, net of deferred issuance costs
The Company also has $44.5 million of senior notes outstanding, net of deferred issuance costs, as of December 31, 2021 and cash on hand.$44.4 million as of December 31, 2020. The senior notes maturewere issued in 2016, had an original maturity of ten years, and terms include interest payable semiannually at 5.75% for five years. Beginning December 31, 2021, the senior debt will pay interest at a floating rate, with interest payable quarterly at three month LIBOR plus 385 basis points. The effective interest rate at December 31, 2021 was 6.06%. The notes are redeemable, in whole or in part, at the option of the Company, beginning with the interest payment date on December 31, 2021, and on any floating rate interest payment date thereafter, at a redemption price equal to 100% of the principal amount of the notes plus accrued and unpaid interest. As of December 31, 20172021 and 2016,2020, unamortized debt issuance costs related to the senior notes were $942,000$520,000 and $1.0 million,$625,000, respectively, and are included as a reduction of the balance of the senior notes on the Consolidated Balance Sheet.Sheets. These deferred issuance costs will be amortized to interest expense over the ten year term of the notes and included in the Consolidated Statements of Income.
On February 24, 2020, the Company originated a $20.0 million term note, of which $13.0 million is outstanding as of December 31, 2021, with a correspondent bank, the proceeds of which were used in the redemption of the Company’s 7.80% cumulative trust preferred securities issued by Old Second Capital Trust I and related junior subordinated debentures. See the discussion in Note 10 – Junior Subordinated Debentures. The term note was issued for a three year term at one-month LIBOR plus 175 basis points, requires principal and interest payments quarterly, with no prepayment penalties; any remaining balances are due on February 24, 2023. The effective interest rate at December 31, 2021 was 1.85%. The balance of this note is included within Notes payable and other borrowings on the Consolidated Balance Sheet. The Company also has an undrawn line of credit of $20.0 million with a correspondent bank to be used for short-term funding needs; advances under this line can be outstanding up to 360 days from the date of issuance. This line of credit has not been utilized since early 2019.
Scheduled maturities and weighted average rates of borrowings for the years ended December 31, were as follows:
| | | | | | | | | | | | |
| | 2017 | | 2016 | | |
| | | | | Weighted | | | | | Weighted | | |
| | | | | Average | | | | | Average | | |
| | Balance | | Rate | | Balance | | Rate | | |
2017 | | | N/A | | N/A | | $ | 95,715 | | 0.51 | % | |
2018 | | $ | 144,918 | | 0.86 | % | | - | | - | | |
2019 | | | - | | - | | | - | | - | | |
2020 | | | - | | - | | | - | | - | | |
| | | | | | | | | | | | |
| | | 2021 | | 2020 | |
| | | | | | Weighted | | | | | Weighted | |
| | | | | | Average | | | | | Average | |
| | | Balance | | Rate | | Balance | | Rate | |
2021 | | | - | | - | | | - | | - | | | $ | - | | - | | $ | 70,980 | | 0.46 | % |
2022 | | | - | | - | | | - | | - | | | | 58,337 | | 0.37 | % | | 4,000 | | 1.91 | |
2023 | | | | 9,000 | | 1.85 | | | 9,000 | | 1.91 | |
2024 | | | | - | | - | | | - | | - | |
2025 | | | | - | | - | | | - | | - | |
2026 | | | | 46,554 | | 5.88 | | | - | | - | |
Thereafter | | | 101,697 | | 6.01 | | | 101,589 | | 6.65 | | | | 84,985 | | 3.89 | | | 76,541 | | 5.24 | |
Total borrowings | | $ | 246,615 | | 2.98 | % | $ | 197,304 | | 3.67 | % | | $ | 198,876 | | 3.23 | % | $ | 160,521 | | 2.86 | % |
Note 11:10: Junior Subordinated Debentures
TheOn March 2, 2020, the Company completed the sale of $27.5 million ofredeemed 7.80% cumulative trust preferred securities issued by its unconsolidated subsidiary, Old Second Capital Trust I (“OSBCP”) and related debentures, which totaled $32.6 million. These debentures were originally issued in June 2003. An additional $4.1 million of cumulative trust preferred securities were sold in July 2003. The costs associated with the issuance of the cumulative trust preferred securities are being amortized over 30 years. The trust preferred securities may remain outstanding2003 for a 30‑year term but,of 30 years at 7.80%, and subject to regulatory approval, canwere able to be called in whole or in part by the Company after June 30, 2008,2008. The Company received regulatory approval to redeem the debentures in early 2020, and can be exercisednotified OSBCP stockholders of the redemption in late January 2020. Cash disbursed for the redemption, including accrued interest on the debentures, totaled $33.0 million, or $10.13 per OSBCP share. The OSBCP redemption was funded by cash on hand and the $20.0 million term note discussed in Note 9 – Borrowings. Upon redemption of the junior subordinated debentures related to OSBCP in March 2020, the Company from time to time thereafter. When not in deferral, distributions onrecognized the securities are payable quarterly at an annual rateremaining unamortized debt issuance costs of 7.80%. The Company issued a new $32.6 million subordinated debenture to Old Second Capital Trust I in return for the aggregate net proceeds $635,000.
The Company sold an additional $25.0 million of cumulative trust preferred securities through a private placement completed by an additional, unconsolidated subsidiary, Old Second Capital Trust II, in April 2007. These trust preferred securities also mature in 30 years, but subject to the aforementioned regulatory approval, can be called in whole or in part on a quarterly basis commencing June 15, 2017. The quarterly cash distributions on the securities arewere fixed at 6.77% through June 15, 2017, and float at 150 basis points over three-month LIBOR thereafter. The Trust II issuance converted from fixed to float rate at three month LIBOR plus 150 basis points on June 16, 2017; as of December 31, 2017, the rate effective for the Trust II issuance was 3.09%. Upon conversion to a floating rate on June 16, 2017, a cash flow hedge was initiated, which resulted inwhereby the total interestCompany swapped the three-month LIBOR for a fixed rate period onof 2.8%. Accordingly, the debteffective rate of 4.30%the instrument was 4.4% as of December 31, 2017, compared to the rate paid prior to June 15, 2017 of 6.77%.2021 and 2020. The Company issued a new $25.8 million subordinated debenture to the Old Second Capital Trust II in return for the aggregate net proceeds of this trust preferred offering. The interest rate and payment frequency on the debenture are equivalent to the cash distribution basis on the trust preferred securities. Both of
The Trust I and Trust II the debentures issued by the Company are disclosed on the Consolidated Balance SheetSheets as junior subordinated debentures and the related interest expense for each issuance is included in the Consolidated Statements of Income. As of December 31, 2017,2021 and 2016,2020, unamortized debt issuance costs
related to the junior subordinated debentures were $739,000 and $787,000$1,000 respectively, and are included as a reduction to the balance of the junior subordinated debentures on the Consolidated Balance Sheet.Sheets.
Under the terms of the subordinated debenturesdebenture issued to each of Old Second Capital Trust I and II, the Company is allowed to defer payments of interest for 20 quarterly periods without default or penalty, but such amounts continue to accrue. Also during a deferral period, the Company generally may not pay cash dividends on or repurchase its common stock or preferred stock. As of December 31, 2017,2021, the Company is current on the payments due on these securities.
Note 12:11: Income Taxes
Income tax expense (benefit) for the years ending December 31, were as follows:
| | | | | | | | | | |
| | | | | | | | | | |
| | 2017 | | 2016 | | 2015 | |
| | | | | | | | | | |
| | | | | | | | | | |
| | | 2021 | | 2020 | | 2019 |
Current federal | | $ | (2,407) | | $ | 399 | | $ | 220 | | $ | 750 | | $ | 6,269 | | $ | 4,815 |
Current state | | | | 594 | | | 3,960 | | | 1,151 |
Deferred federal | | | 11,724 | | | 6,824 | | | 7,023 | | | 4,445 | | | (135) | | | 3,177 |
Deferred state | | | 372 | | | 1,597 | | | 1,733 | | | 2,034 | | | (511) | | | 3,259 |
Expense due to enactment of federal tax reform | | | 9,475 | | | - | | | - | |
Total income tax expenses | | $ | 19,164 | | $ | 8,820 | | $ | 8,976 | | $ | 7,823 | | $ | 9,583 | | $ | 12,402 |
| | | | | | | | | | |
The following were the components of the deferred tax assets and liabilities as of December 31:
| | | | | | | |
| | 2017 | | 2016 | |
Allowance for loan and lease losses | | $ | 5,377 | | $ | 7,057 | |
| | | | | | | |
| | | 2021 | | 2020 |
Allowance for credit losses | | | $ | 15,601 | | $ | 11,058 |
Deferred compensation | | | 650 | | | 735 | | | 1,378 | | | 1,093 |
Amortization of core deposit intangible | | | 827 | | | 1,401 | |
Goodwill amortization/impairment | | | 6,087 | | | 10,127 | | | 980 | | | 2,212 |
Stock based compensation | | | 866 | | | 946 | | | 971 | | | 1,356 |
Business combination adjustments | | | | 940 | | | 255 |
OREO write-downs | | | 2,385 | | | 5,110 | | | 573 | | | 614 |
Federal net operating loss (“NOL”) carryforward | | | 7,240 | | | 19,362 | |
State net operating loss (“NOL”) carryforward | | | 7,020 | | | 7,735 | |
Deferred tax credit | | | - | | | 2,058 | |
Federal recognized built-in loss ("RBIL") carryforward | | | | 493 | | | 142 |
State net operating loss and RBIL carryforward | | | | - | | | 60 |
Other assets | | | 1,017 | | | 1,199 | | | 2,129 | | | 2,182 |
Total deferred tax assets | | | 31,469 | | | 55,730 | | | 23,065 | | | 18,972 |
| | | | | | | |
| | | | | | | |
Accumulated depreciation on premises and equipment | | | (384) | | | (681) | | | (1,701) | | | (1,237) |
Mortgage servicing rights | | | (2,086) | | | (2,760) | | | (2,113) | | | (1,261) |
Amortization of core deposit intangible | | | | (4,550) | | | (171) |
State tax benefits | | | (2,389) | | | (4,127) | | | (641) | | | (930) |
Securities | | | | (2,620) | | | - |
Other liabilities | | | (545) | | | (526) | | | (1,931) | | | (1,481) |
Total deferred tax liabilities | | | (5,404) | | | (8,094) | | | (13,556) | | | (5,080) |
Net deferred tax asset before adjustments related to other comprehensive loss | | | 26,065 | | | 47,636 | |
Tax effect of adjustments related to other comprehensive loss | | | (709) | | | 5,828 | |
Net deferred tax asset before adjustments related to other comprehensive income | | | | 9,509 | | | 13,892 |
Tax effect of adjustments related to other comprehensive income | | | | (3,410) | | | (5,771) |
Net deferred tax asset | | $ | 25,356 | | $ | 53,464 | | $ | 6,099 | | $ | 8,121 |
| | | | | | | |
On December 22, 2017, H.R.1, commonly known as the Tax Cuts and Jobs Act (the “Act”), was signed into law. Among other things, the Act reduces the corporate federal tax rate from 35% to 21% effective January 1, 2018. As a result the Company is required to remeasure, through income tax expense, deferred tax assets and liabilities using the enacted rate at which these items are expected to recover or settle. The re-measurement of the Company’s net deferred tax asset resulted in additional income tax expense of approximately $9.5 million. The Company also re-measured the net deferred tax asset as a result of the Illinois income tax increase effective as of July 1, 2017, resulting in a benefit of approximately $1.6 million.
At December 31, 2017,2021, the Company had a $34.5 million$2,348,000 of federal net operating loss carryforward, of which $10.6 million expires in 2031, $8.6 million expires in 2032,may be carried forward indefinitely, and $15.3 million expires in 2033. The Company had a $74.1 million0 state net operating loss carryforward of which $73.6 million expires in 2025, and the rest expires starting in 2026. In addition, the Company had a $2.6 million alternative minimum tax credit carryforwards which do not expire and are now carried as tax receivables since, under the new federal law, the Company expects to recover the entire amount by 2022 via refund.
The components of the provision for deferred income tax expense (benefit) for the years ending December 31, were as follows:
| | | | | | | | | |
| | | | | | | | | |
| 2017 | | 2016 | | 2015 | |
Provision for loan and lease losses | $ | 1,680 | | $ | 42 | | $ | 2,480 | |
Deferred Compensation | | 85 | | | (45) | | | 97 | |
| | | | | | | | | |
| | | | | | | | | |
| | 2021 | | 2020 | | 2019 |
Provision for credit losses | | $ | (78) | | $ | (4,976) | | $ | (279) |
Deferred compensation | | | 1,388 | | | (186) | | | (242) |
Amortization of core deposit intangible | | 574 | | | 228 | | | 230 | | (18) | | | 27 | | | 14 |
Stock based compensation | | 80 | | | (132) | | | (151) | | 385 | | | 266 | | | (245) |
Business combination adjustments | | | 80 | | | 1,292 | | | 985 |
OREO write-downs | | 2,725 | | | 1,807 | | | 1,722 | | 1,543 | | | 1,317 | | | 406 |
Federal net operating loss carryforward | | 12,122 | | | 4,743 | | | 2,896 | |
State net operating loss carryforward | | 715 | | | 1,011 | | | 659 | |
Deferred tax credit | | 2,058 | | | (309) | | | (198) | |
Federal net operating loss and RBIL carryforward | | | (351) | | | 198 | | | 1,859 |
State net operating loss and RBIL carryforward | | | 60 | | | 266 | | | 3,708 |
Depreciation | | (297) | | | 80 | | | (201) | | (1,737) | | | 491 | | | 303 |
Mortgage servicing rights | | (674) | | | 276 | | | 164 | | 852 | | | (518) | | | (431) |
Goodwill amortization/impairment | | 4,040 | | | 1,496 | | | 1,506 | | 1,232 | | | 1,244 | | | 1,242 |
State tax benefits | | (1,738) | | | (559) | | | (604) | | (491) | | | 3 | | | (912) |
Securities | | | 4,188 | | | - | | | - |
Other, net | | 201 | | | (217) | | | 156 | | (574) | | | (70) | | | 28 |
Total deferred tax expense | $ | 21,571 | | $ | 8,421 | | $ | 8,756 | |
Total deferred tax (benefit) expense | | $ | 6,479 | | $ | (646) | | $ | 6,436 |
| | | | | | | | | |
Effective tax rates differ from federal statutory rates applied to financial statement income for the years ended December 31, due to the following:
| | | | | | | | | | |
| | 2017 | | 2016 | | 2015 | |
| | | | | | | | | | |
| | | 2021 | | 2020 | | 2019 |
Tax at statutory federal income tax rate | | $ | 11,817 | | $ | 8,577 | | $ | 8,526 | | $ | 5,852 | | $ | 7,856 | | $ | 10,890 |
Nontaxable interest income, net of disallowed interest deduction | | | (1,976) | | | (347) | | | (253) | | | (1,069) | | | (1,067) | | | (1,409) |
BOLI income | | | (501) | | | (449) | | | (487) | | | (292) | | | (271) | | | (480) |
State income taxes, net of federal benefit | | | 1,775 | | | 1,148 | | | 1,126 | | | 2,054 | | | 2,570 | | | 3,496 |
Impact of Federal tax rate change | | | 9,475 | | | - | | | - | |
Impact of Illinois tax rate change | | | (1,566) | | | - | | | - | |
Stock based compensation | | | | 54 | | | 297 | | | (207) |
Transaction costs | | | | 396 | | | - | | | - |
Other, net | | | 140 | | | (109) | | | 64 | | | 828 | | | 198 | | | 112 |
Total tax at effective tax rate | | $ | 19,164 | | $ | 8,820 | | $ | 8,976 | | $ | 7,823 | | $ | 9,583 | | $ | 12,402 |
| | | | | | | | | | |
The Company evaluated positive and negative evidence in order to determine if it was more likely than not that the deferred tax asset would be recovered through future income. Significant positive evidence evaluated included recent and projected earnings, significantly improved asset quality and an improved capital position. No significant negative evidence was noted.
Note 13:12: Equity Compensation Plans
The Company’s 2008 Equity Incentive Plan was in effect for years prior to 2014, and authorized the issuance of the Company’s common stock, which included share grants in the form of qualified stock options, non-qualified stock options, restricted stock, restricted stock units and stock appreciation rights. Under the 2008 Equity Incentive Plan, stock basedStock-based awards were eligible to be granted to selected directors, officers or employees at the discretion of the Board of Directors. All stock options granted under the 2008 Incentive Plan have vested; however, all such options issued prior to 2009 have expired as of December 31, 2017. The Company granted 16,500 stock options in 2009 under the 2008 Equity Incentive Plan, 9,000 of which are vested and outstanding as of December 31, 2017. The stock option awards had a vesting period of three years, and a term of ten years. No other stock options were granted in 2009 through 2017 period. There were no stock option shares exercised during the years ending December 31, 2017 and 2015, and 1,500 stock options were exercised during the year ending December 31, 2016. At December 31, 2017, there is no unrecognized compensation cost related to unvested stock options as all stock options of the Company’s common stock have fully vested.
A summary of stock option activity in the Plans for the year ending December 31, 2017, is as follows (in dollars):
| | | | | | | | | | |
| | | | | | | Weighted- | | | |
| | | | Weighted | | Average | | | |
| | | | Average | | Remaining | | | |
| | | | Exercise | | Contractual | | Aggregate |
| | Shares | | Price | | Term (years) | | Intrinsic Value |
Beginning outstanding | | 94,500 | | $ | 25.82 | | - | | | - |
Canceled | | (44,500) | | | 27.75 | | - | | | - |
Expired | | (41,000) | | | 27.75 | | - | | | - |
Ending outstanding | | 9,000 | | $ | 7.49 | | 1.1 | | $ | 55,440 |
| | | | | | | | | | |
Exercisable at end of period | | 9,000 | | $ | 7.49 | | 1.1 | | $ | 55,440 |
A summary of stock option activity as of each year is as follows (in dollars):
| | | | | | | |
| | | 2017 | | 2016 | | 2015 |
Intrinsic value of options exercised | | $ | - | $ | 2,790 | $ | - |
Cash received from option exercises | | | - | | 11,235 | | - |
Tax benefit realized from option exercises | | | - | | 91 | | - |
Weighted average fair value of options granted | | | - | | - | | - |
There are stock-based awards outstanding under the Company’s 20082019 Equity Incentive Plan, as amended and restated (the “2008“2019 Plan”) and the Company’s 2014 Equity Incentive Plan (the “2014 Plan,” and together with the 2008 Plan, the “Plans”). The 20142019 Plan was originally approved at the 2014May 2019 annual stockholders’ meeting and authorized 600,000 shares, and at the May 2021 annual stockholders’ meeting, the Company obtained stockholder approval to increase the number of stockholders; a maximumshares of 375,000common stock authorized for issuance under the plan by 1,200,000 shares, were authorizedfrom 600,000 shares to be issued under this plan.1,800,000 shares. Following the approval of the 20142019 Plan, no further awards will be granted under the 2008 Plan or any other Company equity compensationprior plan.At the May 2016 annual stockholders meeting, an amendment to the 2014 Plan authorized an additional 600,000 shares to be issued, which resulted in a total of 975,000 shares authorized for issuance under this plan.
The 2019 Plan authorizes the granting of qualified stock options, non-qualified stock options, restricted stock, restricted stock units, and stock appreciation rights.rights (“SARs”). Awards may be granted to selected directors, and officers, employees or employeeseligible service providers under the 20142019 Plan at the discretion of the Compensation Committee of the Company’s Board of Directors. As of December 31, 2017, 453,2092021, 1,395,981 shares remained available for issuance under the 20142019 Plan.
TotalThe Company granted 16,500 stock options in 2009 under the 2008 Equity Incentive Plan, and there are 0 remaining outstanding stock options as of December 31, 2021. NaN stock options were granted in 2009 through 2021. There were 4,500 stock options exercised during 2019 and 0 stock options exercised during 2020 or 2021. At December 31, 2021, the Company had 0 unrecognized compensation cost thatrelated to unvested stock options as all stock options have fully vested.
A summary of stock option activity as of each year is as follows:
| | | | | | | |
| | | 2021 | | 2020 | | 2019 |
Intrinsic value of options exercised | | $ | - | $ | - | $ | 27 |
Cash received from option exercises | | | - | | - | | 32 |
Tax benefit realized from option exercises | | | - | | - | | 5 |
Weighted average fair value of options granted | | | - | | - | | - |
Generally, restricted stock and restricted stock units granted under the 2019 Plan vest three years from the grant date, but the Compensation Committee of the Company’s Board of Directors has been charged fordiscretionary authority to change the 2014 Plan was $1.2 million, $657,000 and $613,000 forterms of particular awards including the years ending December 31, 2017, 2016 and 2015, respectively.vesting schedule.
Under the 20142019 Plan, unless otherwise provided in an award agreement, upon the occurrence of a change in control, ofall stock options and SARs then held by the Company,participant will become fully exercisable immediately if, and all stock awards and cash incentive awards will become fully earned and vested immediately if, (i) the 20142019 Plan is not an obligation of the successor entity following thea change in control or (ii) the 20142019 Plan is an obligation of the successor entity following thea change in control and the participant incurs a termination of service without cause or for good reason following the change in control. Notwithstanding the immediately preceding sentence, if the vesting of an involuntary termination,award is conditioned upon the achievement of performance measures, then such vesting will generally be subject to the stock options, stock appreciation rights, stock awards and cash incentive awards underfollowing: if, at the 2014 Plan will become fully exercisable and vested. Performance-based awards generally will vesttime of the change in control, the performance measures are less than 50% attained (pro rata based upon the level of achievementtime of the applicable performance measuresperiod through the change in control), the award will become vested and exercisable on a fractional basis with the numerator being equal to the percentage of attainment and the denominator being 50%; and if, at the time of the change in control, the performance measures are at least 50% attained (pro rata based upon the time of the period through the change in control), the award will become fully earned and vested immediately upon the change in control.
RestrictedAwards of restricted stock awardsunits under the 20142019 Plan generally entitleentitled holders to voting and dividend rights upon grant and are subject to forfeiture until certain restrictions have lapsed including employment for a specific period. RestrictedAwards of restricted stock units under the Plans2019 Plan are also subject to forfeiture until certain restrictions have lapsed including employment for a specific period, but do not entitle holders to voting rights until the restricted period ends and shares are transferred in connection with the units.
Total compensation cost that has been charged for the 2019 Plan and prior plans was $1.4 million, $2.1 million and $2.5 million for the years ending December 31, 2021, 2020 and 2019 respectively.
There were 161,500274,881 and 140,944 restricted awards issuedstock units granted during the yearyears ending December 31, 2017. There were 170,000 restricted awards issued during the year ending December 31, 2016.2021 and 2020, respectively. Compensation expense is recognized over the vesting period of the restricted awardstock unit based on the market value of the award on the issuegrant date.
A summary of changes in the Company’s unvested restricted awards for the yearyears ending December 31, 2017,2021, is as follows:
| | | | | | |
| | December 31, 2017 | |
| | | | Weighted | |
| | Restricted | | Average | |
| | Stock Shares | | Grant Date | |
| | and Units | | Fair Value | |
| | | | | | |
| | | December 31, 2021 |
| | | | | Weighted |
| | | Restricted | | Average |
| | | Stock Shares | | Grant Date |
| | | and Units | | Fair Value |
Unvested at January 1 | | 409,000 | | $ | 5.89 | | 532,609 | | $ | 13.15 |
Granted | | 161,500 | | | 11.04 | | 274,881 | | | 11.61 |
Vested | | (91,500) | | | 5.07 | | (199,492) | | | 13.88 |
Forfeited | | (14,000) | | | 7.53 | | (67,692) | | | 13.54 |
Unvested at December 31 | | 465,000 | | $ | 7.79 | | 540,306 | | $ | 12.42 |
| | | | | | |
Total unrecognized compensation cost of restricted stock unit awards was $1.7$3.1 million as of December 31, 2017,2021, which is expected to be recognized over a weighted-average period of 2.171.96 years.
Note 14:13: Earnings Per Share
The earnings per share, both basic and diluted, are included below as of December 31, (in thousands except for per share data):
| | | | | | | | | |
| | | | | | | | | |
| | 2017 | | 2016 | | 2015 | |
| | | | | | | | | | |
| | | | | | | | | | |
| | | | 2021 | | 2020 | | 2019 |
Basic earnings per share: | | | | | | | | | | | | | | | | | |
Weighted-average common shares outstanding | | | 29,600,702 | | | 29,532,510 | | 29,476,821 | | | | 30,208,663 | | | 29,623,333 | | 29,891,046 |
Net income | | $ | 15,138 | | $ | 15,684 | | $ | 15,385 | | | $ | 20,044 | | $ | 27,825 | | $ | 39,455 |
Preferred stock dividends and accretion | | | - | | | - | | | 1,873 | |
Net income available to common stockholders | | $ | 15,138 | | $ | 15,684 | | $ | 13,512 | |
Basic earnings per share | | $ | 0.51 | | $ | 0.53 | | $ | 0.46 | | | $ | 0.66 | | $ | 0.94 | | $ | 1.32 |
| | | | | | | | | | |
Diluted earnings per share: | | | | | | | | | | | | | | | | | |
Weighted-average common shares outstanding | | | 29,600,702 | | | 29,532,510 | | 29,476,821 | | | | 30,208,663 | | | 29,623,333 | | 29,891,046 |
Dilutive effect of unvested restricted awards1 | | | 435,142 | | | 305,678 | | 253,253 | |
Dilutive effect of stock options | | | 2,573 | | | 743 | | | - | |
Dilutive effect of unvested restricted awards 1 | | | | | 529,199 | | | 550,739 | | 525,302 |
Diluted average common shares outstanding | | | 30,038,417 | | | 29,838,931 | | 29,730,074 | | | | 30,737,862 | | | 30,174,072 | | 30,416,348 |
| | | | | | | | | | |
Net Income | | $ | 15,138 | | $ | 15,684 | | $ | 13,512 | | | $ | 20,044 | | $ | 27,825 | | $ | 39,455 |
Diluted earnings per share | | $ | 0.50 | | $ | 0.53 | | $ | 0.46 | | | $ | 0.65 | | $ | 0.92 | | $ | 1.30 |
| | | | | | | | | |
Number of antidilutive options and warrants excluded from the diluted earnings per share calculation | | | 815,339 | | | 900,839 | | 977,839 | |
| | �� | | | | | | | |
1 Includes the common stock equivalents for restricted share awards that are dilutive. | | | | | | | | | |
| | | | | | | | | | |
| | | | | | | | | | |
1 Includes the common stock equivalents for restricted share rights that are dilutive. | | 1 Includes the common stock equivalents for restricted share rights that are dilutive. | | | | | | | | |
The above earnings per share calculation did not include a warrant for 815,339 shares of common stock that was outstanding as of December 31, 2017, 2016 and 2015, because the warrant was anti-dilutive at an exercise price of $13.43. Of note, the warrant was sold at auction by the Treasury in June 2013 to a third party investor.
Note 14: Commitments
Note 15: Commitments
In the normal course of business, there are outstanding commitments that are not reflected in the Consolidated Financial Statements. Commitments include financial instruments that involve, to varying degrees, elements of credit, interest rate, and liquidity risk. In management’s opinion, these do not represent unusual risks and management does not anticipate significant losses as a result of these transactions. The Company uses the same credit policies in making commitments and conditional obligations for borrowers as it does for on-balance sheet instruments.
The following table is a summary of financial instrument commitments (in thousands):as of December 31, were as follows:
| | | | | | | | | | | | | | | | | | | |
| | December 31, 2021 | | December 31, 2020 | |
| | Fixed | | Variable | | Total | | Fixed | | Variable | | Total | |
Letters of credit: | | | | | | | | | | | | | | | | | | | |
Borrower: | | | | | | | | | | | | | | | | | | | |
Financial standby | | $ | 384 | | $ | 17,474 | | $ | 17,858 | | $ | 329 | | $ | 9,051 | | $ | 9,380 | |
Commercial standby | | | - | | | - | | | - | | | - | | | - | | | - | |
Performance standby | | | 456 | | | 14,907 | | | 15,363 | | | 356 | | | 4,517 | | | 4,873 | |
| | | 840 | | | 32,381 | | | 33,221 | | | 685 | | | 13,568 | | | 14,253 | |
Non-borrower: | | | | | | | | | | | | | | | | | | | |
Performance standby | | | - | | | 67 | | | 67 | | | - | | | 67 | | | 67 | |
Total letters of credit | | $ | 840 | | $ | 32,448 | | $ | 33,288 | | $ | 685 | | $ | 13,635 | | $ | 14,320 | |
| | | | | | | | | | | | | | | | | | | |
Unused loan commitments: | | $ | 84,225 | | $ | 895,665 | | $ | 979,890 | | $ | 88,883 | | $ | 316,298 | | $ | 405,181 | |
| | December 31, 2017 | | December 31, 2016 | |
| | Fixed | | Variable | | Total | | Fixed | | Variable | | Total | |
Letters of credit: | | | | | | | | | | | | | | | | | | | |
Borrower: | | | | | | | | | | | | | | | | | | | |
Financial standby | | $ | 177 | | $ | 3,770 | | $ | 3,947 | | $ | 137 | | $ | 4,047 | | $ | 4,184 | |
Commercial standby | | | - | | | 354 | | | 354 | | | - | | | 126 | | | 126 | |
Performance standby | | | 241 | | | 7,594 | | | 7,835 | | | 83 | | | 8,499 | | | 8,582 | |
| | | 418 | | | 11,718 | | | 12,136 | | | 220 | | | 12,672 | | | 12,892 | |
Non-borrower: | | | | | | | | | | | | | | | | | | | |
Performance standby | | | - | | | 142 | | | 142 | | | 95 | | | 524 | | | 619 | |
Total letters of credit | | $ | 418 | | $ | 11,860 | | $ | 12,278 | | $ | 315 | | $ | 13,196 | | $ | 13,511 | |
| | | | | | | | | | | | | | | | | | | |
Unused loan commitments: | | $ | 82,942 | | $ | 260,061 | | $ | 343,003 | | $ | 68,996 | | $ | 270,989 | | $ | 339,985 | |
The Bank occupies facilities under long-term operating leases, some of which include provisions for future rent increases. In addition, the Company leases space at sites that house automatic teller machines (ATMs). As of December 31, 2017, the estimated aggregate minimum annual rental commitments under these leases totaled $380,000 in 2018, $45,000 in 2019, $20,000 in 2020 and $6,000 in 2021. The Company also receives rental income on certain leased properties. As of December 31, 2017,2021, aggregate future minimum rental income to be received under noncancelable leases totaled $232,000.$425,000. Total facility net operating lease expense or revenue recorded under all operating leases was a net expense of $64,000$361,000, $223,000, and $248,000 in 2017, net revenue $25,000 in 20162021, 2020 and net expense of $11,000 in 2015.2019, respectively. Total ATM lease expense, including the costs related to servicing those ATM’s, was $679,000, $685,000$1.2 million, $1.0 million, and $826,000$916,000 in 2017, 20162021, 2020 and 2015,2019, respectively.
The following table below is the estimated aggregate minimum annual rental commitments at December 31, 2021:
| | | | | | | | | | | | | | | | | |
| | | | | | | | | | | | | | | | 2027 |
| 2022 | | 2023 | | 2024 | | 2025 | | 2026 | | and there after |
Rental commitment | $ | 864 | | $ | 792 | | $ | 771 | | $ | 738 | | $ | 662 | | $ | 2,635 |
Legal proceedings
The Company and its subsidiaries, from time to time, pursue collection suits and other actions that arise in the ordinary course of business against their borrowers and are defendants in legal actions arising from normal business activities. Management, after consultation with legal counsel, believes that the ultimate liabilities, if any, resulting from these actions will not have a material adverse effect on the financial position of the Bank or on the consolidated financial position of the Company based on all known information at this time.
Note 16:15: Regulatory & Capital Matters
The Bank is subject to the risk-based capital regulatory guidelines, which include the methodology for calculating the risk-weighted Bank assets, developed by the Office of the Comptroller of the Currency (the “OCC”) and the other bank regulatory agencies. In connection with the current economic environment, the Bank’s current level of nonperforming assets and the risk-based capital guidelines, the Bank’s board of directors’ guidelines are for the Bank to maintain a Tier 1 leverage capital ratio at or above eight8 percent (8%) and a total risk-based capital ratio at or above twelve12 percent (12%). The Bank currently exceeds those thresholds.
Bank holding companies are required to maintain minimum levels of capital in accordance with capital guidelines implemented by the Board of Governors of the Federal Reserve System. The general bank and holding company capital adequacy guidelines in force as of the periods reported are shown in the accompanying table, as are the capital ratios of the Company and the Bank, as of December 31, 2017,2021, and December 31, 2016.2020.
In July 2013, the U.S. federal banking authorities issued final rules (the “Basel III Rules”) establishing more stringent regulatory capital requirements for U.S. banking institutions, which went into effect on January 1, 2015. A detailed discussion of the Basel III Rules is included in Part I, Item 1 of the under the heading “Supervision and Regulation.”
At December 31, 2017 and 2016, the Company, on a consolidated basis, exceeded the minimum thresholds to be considered “well capitalized” under current regulatory defined capital ratios.
The Company and the Bank are subject to regulatory capital requirements administered by federal banking agencies. The capital ratios below are calculated pursuant to the capital requirements in effect for the periods reported below.
Capital levels and industry defined regulatory minimum required levels:levels at December 31, were as follows:
| | | | | | | | | | | | | | | | | | | |
| | | | | | | | Minimum Capital | | To Be Well Capitalized Under | | |
| | | | | | | | Adequacy with Capital | | Prompt Corrective | | |
| | Actual | | Conservation Buffer if applicable1 | | Action Provisions2 | | |
| | Amount | | Ratio | | Amount | | Ratio | | Amount | | Ratio | | |
2017 | | | | | | | | | | | | | | | | | | | |
| | | | | | | | | | | | | | | | | | | |
| | | | | | | | | | | | | | | |
| | | | | | | | | Minimum Capital | | Well Capitalized | |
| | | | | | | | | Adequacy with Capital | | Under Prompt Corrective | |
| | | Actual | | Conservation Buffer, if applicable1 | | Action Provisions2 | |
| | | Amount | | Ratio | | Amount | | Ratio | | Amount | | Ratio | |
2021 | | | | | | | | | | | | | | | | | | | |
Common equity tier 1 capital to risk weighted assets | | | | | | | | | | | | | | | | | | | | | | | | | | | | | | | | | | | | |
Consolidated | | $ | 179,853 | | 9.25 | % | | $ | 111,801 | | 5.750 | % | | | N/A | | N/A | | | $ | 394,421 | | 9.46 | % | | $ | 291,855 | | 7.00 | % | | | N/A | | N/A | |
Old Second Bank | | | 249,417 | | 12.88 | | | | 111,347 | | 5.750 | | | $ | 125,870 | | 6.50 | % | | | 514,992 | | 12.41 | | | | 290,487 | | 7.00 | | | $ | 269,738 | | 6.50 | % |
Total capital to risk weighted assets | | | | | | | | | | | | | | | | | | | | | | | | | | | | | | | | | | | | |
Consolidated | | | 251,383 | | 12.93 | | | | 179,837 | | 9.250 | | | | N/A | | N/A | | | | 522,932 | | 12.55 | | | | 437,513 | | 10.50 | | | | N/A | | N/A | |
Old Second Bank | | | 266,873 | | 13.78 | | | | 179,142 | | 9.250 | | | | 193,667 | | 10.00 | | | | 558,503 | | 13.46 | | | | 435,682 | | 10.50 | | | | 414,935 | | 10.00 | |
Tier 1 capital to risk weighted assets | | | | | | | | | | | | | | | | | | | | | | | | | | | | | | | | | | | | |
Consolidated | | | 233,927 | | 12.03 | | | | 140,978 | | 7.250 | | | | N/A | | N/A | | | | 419,421 | | 10.06 | | | | 354,382 | | 8.50 | | | | N/A | | N/A | |
Old Second Bank | | | 249,417 | | 12.88 | | | | 140,394 | | 7.250 | | | | 154,917 | | 8.00 | | | | 514,992 | | 12.41 | | | | 352,734 | | 8.50 | | | | 331,985 | | 8.00 | |
Tier 1 capital to average assets | | | | | | | | | | | | | | | | | | | | | | | | | | | | | | | | | | | | |
Consolidated | | | 233,927 | | 10.08 | | | | 92,828 | | 4.00 | | | | N/A | | N/A | | | | 419,421 | | 7.81 | | | | 214,812 | | 4.00 | | | | N/A | | N/A | |
Old Second Bank | | | 249,417 | | 10.79 | | | | 92,462 | | 4.00 | | | | 115,578 | | 5.00 | | | | 514,992 | | 9.58 | | | | 215,028 | | 4.00 | | | | 268,785 | | 5.00 | |
| | | | | | | | | | | | | | | | | | | |
2016 | | | | | | | | | | | | | | | | | | | |
| | | | | | | | | | | | | | | | | | | |
2020 | | | | | | | | | | | | | | | | | | | |
Common equity tier 1 capital to risk weighted assets | | | | | | | | | | | | | | | | | | | | | | | | | | | | | | | | | | | | |
Consolidated | | $ | 154,537 | | 8.76 | % | | $ | 90,411 | | 5.125 | % | | | N/A | | N/A | | | $ | 277,199 | | 11.94 | % | | $ | 162,512 | | 7.00 | % | | | N/A | | N/A | |
Old Second Bank | | | 221,153 | | 12.53 | | | | 90,456 | | 5.125 | | | $ | 114,724 | | 6.50 | % | | | 318,466 | | 13.75 | | | | 162,128 | | 7.00 | | | $ | 150,548 | | 6.50 | % |
Total capital to risk weighted assets | | | | | | | | | | | | | | | | | | | | | | | | | | | | | | | | | | | | |
Consolidated | | | 216,769 | | 12.29 | | | | 152,126 | | 8.625 | | | | N/A | | N/A | | | | 331,178 | | 14.26 | | | | 243,855 | | 10.50 | | | | N/A | | N/A | |
Old Second Bank | | | 237,306 | | 13.45 | | | | 152,176 | | 8.625 | | | | 176,436 | | 10.00 | | | | 347,408 | | 15.00 | | | | 243,186 | | 10.50 | | | | 231,605 | | 10.00 | |
Tier 1 capital to risk weighted assets | | | | | | | | | | | | | | | | | | | | | | | | | | | | | | | | | | | | |
Consolidated | | | 191,988 | | 10.88 | | | | 116,904 | | 6.625 | | | | N/A | | N/A | | | | 302,199 | | 13.01 | | | | 197,440 | | 8.50 | | | | N/A | | N/A | |
Old Second Bank | | | 221,153 | | 12.53 | | | | 116,930 | | 6.625 | | | | 141,199 | | 8.00 | | | | 318,466 | | 13.75 | | | | 196,870 | | 8.50 | | | | 185,289 | | 8.00 | |
Tier 1 capital to average assets | | | | | | | | | | | | | | | | | | | | | | | | | | | | | | | | | | | | |
Consolidated | | | 191,988 | | 8.90 | | | | 86,287 | | 4.00 | | | | N/A | | N/A | | | | 302,199 | | 10.21 | | | | 118,393 | | 4.00 | | | | N/A | | N/A | |
Old Second Bank | | | 221,153 | | 10.24 | | | | 86,388 | | 4.00 | | | | 107,985 | | 5.00 | | | | 318,466 | | 10.74 | | | | 118,609 | | 4.00 | | | | 148,262 | | 5.00 | |
| 1
| | As of December 31, 2017, amounts shown are inclusive of a capital conservation buffer of 1.25% as compared to December 31, 2016, of 0.625%.
|
| 2
| | The Bank exceeded the general minimum regulatory requirements to be considered “well capitalized”.
|
1 Amounts are shown inclusive of a capital conservation buffer of 2.50%.
2The prompt corrective action provisions are only applicable at the Bank level. The Bank exceeded the general minimum regulatory requirements to be considered “well capitalized.”
As part of its response to the impact of the COVID-19 pandemic, in the first quarter of 2020, U.S. federal regulatory authorities issued an interim final rule that provided banking organizations that adopted CECL during the 2020 calendar year with the option to delay for two years the estimated impact of CECL on regulatory capital relative to regulatory capital determined under the prior incurred loss methodology, followed by a three-year transition period to phase out the aggregate amount of the capital benefit provided during the initial two-year delay (i.e., a five-year transition in total). In connection with our adoption of CECL on January 1, 2020, we elected to utilize the five-year CECL transition. The cumulative amount that is not recognized in regulatory capital, in addition to the $3.8 million Day 1 impact of CECL adoption, will be phased in at 25% per year beginning January 1, 2022. As of December 31, 2021, the capital measures of the Company exclude $3.8 million, which is the Day 1 impact to retained earnings and 25% of the increase in the allowance for credit losses during 2020 and 2021, excluding PCD loans and acquisition related adjustments.
Dividend Restrictions and Deferrals
In addition to the above requirements, banking regulations and capital guidelines generally limit the amount of dividends that may be paid by a Bank without prior regulatory approval. Under these regulations, the amount of dividends that may be paid in any calendar year is limited to the current year’s profits, combined with the retained profit of the previous two years, subject to the capital requirements described above. As of December 31, 2021, the Company had total dividend availability of $9.5 million from the Bank, per regulatory guidelines. Pursuant to the Basel III rules that came into effectwere fully phased-in at January 1, 2015,2019, the Bank must keep a capital conservation buffer of 0.625% in 2016, 1.25% in 2017, 1.875% in 2018, and 2.5% in 2019 and thereafter of minimumon all risk-based capital requirements in order to avoid additional limitations on capital distributions.
Note 17:16: Mortgage Banking Derivatives
Commitments to fund certain mortgage loans (interest rate locks) to be sold into the secondary market and forward commitments for the future delivery of mortgage loans to third party investors are considered derivatives. It is the Company’s practice to sell mortgage-backed securities (“MBS”) contracts for the future delivery to economically hedge the effect of changes in interest rates resulting from its commitments to fund the loans. These contracts are also derivatives and collectively with the forward commitments for the future delivery of mortgage loans are considered forward contracts. These mortgage banking derivatives, which are not designated in hedge relationships using the accepted accounting for derivative instruments and hedging activities at December 31, (dollars in thousands):were as follows:
| | | | | | | | |
| | 2017 | | 2016 | | |
| | | | | | | | |
| | | 2021 | | 2020 | |
Forward contracts: | | | | | | | | | | | | | | |
Notional amount | | $ | 16,500 | | $ | 19,500 | | | $ | 20,000 | | $ | 46,500 | |
Fair value | | | 3 | | | 190 | | | | 17 | | | (228) | |
| | | | | | | | |
| | | | | | | | |
Rate lock commitments: | | | | | | | | | | | | | | |
Notional amount | | $ | 10,478 | | $ | 12,480 | | | $ | 14,414 | | $ | 37,972 | |
Fair value | | | 235 | | | 97 | | | | 491 | | | 1,068 | |
Fair values were estimated based on changes in mortgage interest rates from the date of the commitments. The Company sold $147.7$239.2 million in loans to investors receiving proceeds of $151.3$254.4 million and resulting in a gain on sale of $4.8$9.3 million for the year ended December 31, 2017, inclusive of a fair market valuation gain of $1.3 million.2021. Sales to investors included $88.9$187.5 million, or 60.3%76.5% to FNMA and $28.9$39.0 million, or 19.6%15.9%, to FHLMC for the year ended December 31, 2017.2021. No other individual investor was sold more than 10% of the total loans sold.
Note 18:17: Fair Value Measurements
Fair value is defined as the exchange price that would be received for an asset or paid to transfer a liability (an exit price) in the principal or most advantageous market for the asset or liability in an orderly transaction between market participants on the measurement date. The fair value hierarchy established by the Company also requires an entity to maximize the use of observable inputs and minimize the use of unobservable inputs when measuring fair value. Three levels of inputs that may be used to measure fair value are:
Level 1: Quoted prices (unadjusted) for identical assets or liabilities in active markets that the Company has the ability to access as of the measurement date.
Level 2: Significant observable inputs other than Level 1 prices, such as quoted prices for similar assets or liabilities, quoted prices in markets that are not active, and other inputs that are observable or can be corroborated by observable market data.
Level 3: Significant unobservable inputs that reflect a company’s own view about the assumptions that market participants would use in pricing an asset or liability.
Transfers between levels are deemed to have occurred at the end of the reporting period. At year end December 31,2017, the Company had no securities transferred from Level 2 to Level 3.31, 2021 and 2020, there were 0 transfers between levels.
The majority of securities are valued by external pricing services or dealer market participants and are classified in Level 2 of the fair value hierarchy. Both market and income valuation approaches are utilized. Quarterly, the Company evaluates the methodologies used by the external pricing services or dealer market participants to develop the fair values to determine whether the results of the valuations are representative of an exit price in the Company’s principal markets and an appropriate representation of fair value. The Company uses the following methods and significant assumptions to estimate fair value:
| ·
● | | Government-sponsored agency debt securities are primarily priced using available market information through processes such as benchmark spreads, market valuations of like securities, like securities groupings and matrix pricing. |
| ·
● | | Other government-sponsored agency securities, MBS and some of the actively traded real estate mortgage investment conduits and collateralized mortgage obligations are priced using available market information including benchmark yields, prepayment speeds, spreads, volatility of similar securities and trade date. |
| ·
● | | State and political subdivisions are largely grouped by characteristics (e.g., geographical data and source of revenue in trade dissemination systems). Because some securities are not traded daily and due to other grouping limitations, active market quotes are often obtained using benchmarking for like securities. |
| ·
● | | Beginning March 31, 2015, auctionAuction rate asset backed securities are priced using market spreads, cash flows, prepayment speeds, and loss analytics. This process supports the transfer to Level 2 valuations.
|
| ·
● | | Annually every security holding is priced by a pricing service independent of the regular and recurring pricing services used. The independent service provides a measurement to indicate if the price assigned by the regular service is within or outside of a reasonable range. Management reviews this report and applies judgment in adjusting calculations at year end related to securities pricing. |
| ·
● | | Residential mortgage loans available for sale in the secondary market are carried at fair market value. The fair value of loans held-for-sale is determined using quoted secondary market prices. |
| ·
● | | Lending related commitments to fund certain residential mortgage loans, e.g. residential mortgage loans with locked interest rates to be sold in the secondary market and forward commitments for the future delivery of mortgage loans to third party investors as well as forward commitments for future delivery of MBS are considered derivatives. Fair values are estimated based on observable changes in mortgage interest rates including prices for MBS from the date of the commitment and do not typically involve significant judgments by management. |
| ·
● | | The fair value of mortgage servicing rights is based on a valuation model that calculates the present value of estimated net servicing income. The valuation model incorporates assumptions that market participants would use in estimating future net servicing income to derive the resultant value. The Company is able to compare the valuation model inputs, such as the discount rate, prepayment speeds, weighted average delinquency and foreclosure/bankruptcy rates to widely available published industry data for reasonableness. |
| ·
● | | Interest rate swap positions, both assets and liabilities, are based on valuation pricing models using an income approach reflecting readily observable market parameters such as interest rate yield curves. |
| ·
● | | The fair value of impaired loans with specific allocations of the ALLLACL is essentially based on recent real estate appraisals or the fair value of the collateralized asset. These appraisals may utilize a single valuation approach or a combination of approaches including comparable sales and the income approach. Adjustments are made in the appraisal process by the appraisers to reflect differences between the available comparable sales and income data. Such adjustments are usually significant and typically result in a Level 3 classification of the inputs for determining fair value. |
| ·
● | | Nonrecurring adjustments to certain commercial and residential real estate properties classified as OREO are measured at the lower of carrying amount or fair value, less costs to sell. Fair values are based on third party appraisals of the property, resulting in a Level 3 classification. In cases where the carrying amount exceeds the fair value, less costs to sell, an impairmenta valuation loss is recognized. |
Assets and Liabilities Measured at Fair Value on a Recurring Basis:
The tables below present the balance of assets and liabilities (dollars in thousands) at December 31, 2017, and December 31, 2016, respectively, measured by the Company at fair value on a recurring basis:basis are as follows:
| | | | | | | | | | | | | |
| | December 31, 2017 | |
| | Level 1 | | Level 2 | | Level 3 | | Total | |
| | | | | | | | | | | | | |
| | | December 31, 2021 |
| | | Level 1 | | Level 2 | | Level 3 | | Total |
Assets: | | | | | | | | | | | | | | | | | | | | | | | | |
Securities available-for-sale | | | | | | | | | | | | | | | | | | | | | | | | |
U.S. Treasury | | $ | 3,947 | | $ | - | | $ | - | | $ | 3,947 | | $ | 202,339 | | $ | - | | $ | - | | $ | 202,339 |
U.S. government agencies | | | - | | | 13,061 | | | - | | | 13,061 | | | - | | | 61,888 | | | - | | | 61,888 |
U.S. government agencies mortgage-backed | | | - | | | 12,214 | | | - | | | 12,214 | | | - | | | 172,302 | | | - | | | 172,302 |
States and political subdivisions | | | - | | | 263,831 | | | 14,261 | | | 278,092 | | | - | | | 242,373 | | | 14,092 | | | 256,465 |
Corporate bonds | | | - | | | 833 | | | - | | | 833 | | | - | | | 9,887 | | | - | | | 9,887 |
Collateralized mortgage obligations | | | - | | | 63,671 | | | 2,268 | | | 65,939 | | | - | | | 672,967 | | | - | | | 672,967 |
Asset-backed securities | | | - | | | 112,932 | | | - | | | 112,932 | | | - | | | 236,877 | | | - | | | 236,877 |
Collateralized loan obligations | | | - | | | 54,421 | | | - | | | 54,421 | | | - | | | 79,763 | | | - | | | 79,763 |
Loans held-for-sale | | | - | | | 4,067 | | | - | | | 4,067 | | | - | | | 4,737 | | | - | | | 4,737 |
Mortgage servicing rights | | | - | | | - | | | 6,944 | | | 6,944 | | | - | | | - | | | 7,097 | | | 7,097 |
Interest rate swap agreements | | | - | | | 727 | | | - | | | 727 | | | - | | | 3,494 | | | - | | | 3,494 |
Mortgage banking derivatives | | | - | | | 238 | | | - | | | 238 | | | - | | | 508 | | | - | | | 508 |
Total | | $ | 3,947 | | $ | 525,995 | | $ | 23,473 | | $ | 553,415 | | $ | 202,339 | | $ | 1,484,796 | | $ | 21,189 | | $ | 1,708,324 |
| | | | | | | | | | | | | |
| | | | | | | | | | | | | |
Liabilities: | | | | | | | | | | | | | | | | | | | | | | | | |
Interest rate swap agreements, including risk participation agreements | | $ | - | | $ | 2,014 | | $ | - | | $ | 2,014 | | $ | - | | $ | 6,809 | | $ | - | | $ | 6,809 |
Total | | $ | - | | $ | 2,014 | | $ | - | | $ | 2,014 | | $ | - | | $ | 6,809 | | $ | - | | $ | 6,809 |
| | | | | | | | | | | | | |
| | | | | | | | | | | | |
| | December 31, 2016 |
| | Level 1 | | Level 2 | | Level 3 | | Total |
Assets: | | | | | | | | | | | | |
Securities available-for-sale | | | | | | | | | | | | |
U.S. government agencies mortgage-backed | | $ | - | | $ | 41,534 | | $ | - | | $ | 41,534 |
States and political subdivisions | | | - | | | 46,477 | | | 22,226 | | | 68,703 |
Corporate bonds | | | - | | | 10,630 | | | - | | | 10,630 |
Collateralized mortgage obligations | | | - | | | 167,808 | | | 3,119 | | | 170,927 |
Asset-backed securities | | | - | | | 138,407 | | | - | | | 138,407 |
Collateralized loan obligations | | | - | | | 101,637 | | | - | | | 101,637 |
Loans held-for-sale | | | - | | | 4,918 | | | - | | | 4,918 |
Mortgage servicing rights | | | - | | | - | | | 6,489 | | | 6,489 |
Interest rate swap agreements | | | - | | | 673 | | | - | | | 673 |
Mortgage banking derivatives | | | - | | | 287 | | | - | | | 287 |
Total | | $ | - | | $ | 512,371 | | $ | 31,834 | | $ | 544,205 |
| | | | | | | | | | | | |
Liabilities: | | | | | | | | | | | | |
Interest rate swap agreements, including risk participation agreements | | $ | - | | $ | 1,667 | | $ | - | | $ | 1,667 |
Total | | $ | - | | $ | 1,667 | | $ | - | | $ | 1,667 |
| | | | | | | | | | | | |
| | December 31, 2020 |
| | Level 1 | | Level 2 | | Level 3 | | Total |
Assets: | | | | | | | | | | | | |
Securities available-for-sale | | | | | | | | | | | | |
U.S. Treasury | | $ | 4,117 | | $ | - | | $ | - | | $ | 4,117 |
U.S. government agencies | | | - | | | 6,657 | | | - | | | 6,657 |
U.S. government agencies mortgage-backed | | | - | | | 17,209 | | | - | | | 17,209 |
States and political subdivisions | | | - | | | 244,940 | | | 4,319 | | | 249,259 |
Collateralized mortgage obligations | | | - | | | 56,585 | | | - | | | 56,585 |
Asset-backed securities | | | - | | | 131,818 | | | - | | | 131,818 |
Collateralized loan obligations | | | - | | | 30,533 | | | - | | | 30,533 |
Loans held-for-sale | | | - | | | 12,611 | | | - | | | 12,611 |
Mortgage servicing rights | | | - | | | - | | | 4,224 | | | 4,224 |
Interest rate swap agreements | | | - | | | 9,388 | | | - | | | 9,388 |
Mortgage banking derivatives | | | - | | | 840 | | | - | | | 840 |
Total | | $ | 4,117 | | $ | 510,581 | | $ | 8,543 | | $ | 523,241 |
| | | | | | | | | | | | |
Liabilities: | | | | | | | | | | | | |
Interest rate swap agreements, including risk participation agreements | | $ | - | | $ | 13,159 | | $ | - | | $ | 13,159 |
Total | | $ | - | | $ | 13,159 | | $ | - | | $ | 13,159 |
The changes in Level 3 assets and liabilities (dollars in thousands) measured at fair value on a recurring basis are as follows:
| | | | | | | | | | |
| | Year Ended December 31, 2017 | |
| | Securities available-for-sale | | | | |
| | Collateralized | | States and | | Mortgage | |
| | Mortgage | | Political | | Servicing | |
| | Obligation | | Subdivisions | | Rights | |
Beginning balance January 1, 2017 | | $ | 3,119 | | $ | 22,226 | | $ | 6,489 | |
| | | | | | |
| | | Year Ended December 31, 2021 |
| | | Securities available-for-sale | | |
| | | States and | | Mortgage |
| | | Political | | Servicing |
| | | Subdivisions | | Rights |
Beginning balance January 1, 2021 | | | $ | 4,319 | | $ | 4,224 |
Total gains or losses | | | | | | | | | | | | | | |
Included in earnings (or changes in net assets) | | | 40 | | | - | | | (270) | |
Included in earnings | | | | (20) | | 2,420 |
Included in other comprehensive income | | | 21 | | | (796) | | | - | | | 801 | | - |
Purchases, issuances, sales, and settlements | | | | | | | | | | | | | | |
Purchases | | | - | | | 16,712 | | | - | | | 9,919 | | - |
Issuances | | | - | | | - | | | 1,257 | | | - | | 1,612 |
Settlements | | | (912) | | | (23,881) | | | (532) | | | (927) | | | (1,159) |
Ending balance December 31, 2017 | | $ | 2,268 | | $ | 14,261 | | $ | 6,944 | |
Ending balance December 31, 2021 | | | $ | 14,092 | | $ | 7,097 |
| | | | | | |
| | | | | | | | | | |
| | Year Ended December 31, 2016 | |
| | | Securities available-for-sale | | | | |
| | Collateralized | | States and | | Mortgage | |
| | Mortgage | | Political | | Servicing | |
| | Obligation | | Subdivisions | | Rights | |
Beginning balance January 1, 2016 | | $ | - | | $ | 111 | | $ | 5,847 | |
Transfers into Level 3 | | | 3,201 | | | 7,813 | | | - | |
| | | | | |
| | | Year Ended December 31, 2020 |
| | | Securities available-for-sale | | |
| | | States and | | Mortgage |
| | | Political | | Servicing |
| | | Subdivisions | | Rights |
Beginning balance January 1, 2020 | | | $ | 5,419 | | $ | 5,935 |
Total gains or losses | | | | | | | | | | | | | |
Included in earnings (or changes in net assets) | | | - | | | - | | | (215) | |
Included in earnings | | | (20) | | (2,483) |
Included in other comprehensive income | | | (82) | | | 87 | | | - | | (628) | | - |
Purchases, issuances, sales, and settlements | | | | | | | | | | | | | |
Purchases | | | - | | | 14,296 | | | - | | 13,086 | | - |
Issuances | | | - | | | - | | | 1,561 | | - | | 2,288 |
Settlements | | | - | | | (81) | | | (704) | | | (13,538) | | | (1,516) |
Ending balance December 31, 2016 | | $ | 3,119 | | $ | 22,226 | | $ | 6,489 | |
Ending balance December 31, 2020 | | | $ | 4,319 | | $ | 4,224 |
| | | | | | | |
The following table and commentary presents quantitative (dollars in thousands) and qualitative information about Level 3 fair value measurements as of December 31, 2017:2021:
| | | | | | | | | | | | | |
| | | | | | | | | | | Weighted | |
| | | | | | | | | | | | | |
| | | | | | | | | | | | Weighted |
Measured at fair value | | | | | | | Unobservable | | | | Average | | | | | | | Significant Unobservable | | | | Average |
on a recurring basis: | | Fair Value | | Valuation Methodology | | Inputs | | Range of Input | | of Inputs | | Fair Value | | Valuation Methodology | | Inputs | | Range of Input | | of Inputs |
| | | | | | | | | | | | | |
| | | | | | | | | | | | | |
Mortgage servicing rights | | $ | 6,944 | | Discounted Cash Flow | | Discount Rate | | 10.0 - 34.3% | | 10.2 | % | | $ | 7,097 | | Discounted Cash Flow | | Discount Rate | | 11.0 - 15.0% | | 11.0 | % |
| | | | | | | Prepayment Speed | | 7.0 - 68.4% | | 9.6 | % | |
| | | | | | | | | | | | | |
| | | | | | | | | | | | | |
| | | | | | | | Prepayment Speed | | 0.0 - 36.6% | | 11.9 | % |
| | | | | | | | | | | | | |
| | | | | | | | | | | | | |
The following table and commentary presents quantitative (dollars in thousands) and qualitative information about Level 3 fair value measurements as of December 31, 2016:2020:
| | | | | | | | | | | | | |
| | | | | | | | | | | Weighted | |
| | | | | | | | | | | | | |
| | | | | | | | | | | | Weighted |
Measured at fair value | | | | | | | Unobservable | | | | Average | | | | | | | Significant Unobservable | | | | Average |
on a recurring basis: | | Fair Value | | Valuation Methodology | | Inputs | | Range of Input | | of Inputs | | Fair Value | | Valuation Methodology | | Inputs | | Range of Input | | of Inputs |
| | | | | | | | | | | | | |
| | | | | | | | | | | | | |
Mortgage servicing rights | | $ | 6,489 | | Discounted Cash Flow | | Discount Rate | | 10.0 - 17.0% | | 10.2 | % | | $ | 4,224 | | Discounted Cash Flow | | Discount Rate | | 11.0 - 15.0% | | 11.0 | % |
| | | | | | | Prepayment Speed | | 6.5 - 77.8% | | 9.6 | % | |
| | | | | | | | | | | | | |
| | | | | | | | | | | | | |
| | | | | | | | | | | | | |
| | | | | | | | | | | | | |
| | | | | | | | Prepayment Speed | | 5.5 - 59.1% | | 19.5 | % |
| | | | | | | | | | | | | |
In addition to the above, Level 3 fair value measurement included $14.3$14.1 million for state and political subdivisions representing various local municipality securities and $2.3 million of collateralized mortgage obligations at December 31, 2017.2021. Level 3 fair value measurement included $22.2$4.3 million on the state and political subdivisions line and $3.1 million of collateralized mortgage obligations at December 31, 2016.2020. Given the small dollar amount and size of the municipality issuances involved, this is categorized as Level 3 based on the payment stream received by the Company from the municipality.municipalities. That payment stream is otherwise an unobservable input.
Assets and Liabilities Measured at Fair Value on a Nonrecurring Basis:
The Company may be required, from time to time, to measure certain other assets at fair value on a nonrecurring basis in accordance with GAAP. These assets consist of impaired loans and OREO. For assets measured at fair value on a nonrecurring basis at December 31, 2017, and December 31, 2016, respectively,2021 the following tables provide the level of valuation assumptions used to determine each valuation and the carrying value of the related assets:
| | | | | | | | | | | | | |
| | December 31, 2017 | |
| | Level 1 | | Level 2 | | Level 3 | | Total | |
Impaired loans1 | | $ | - | | $ | - | | $ | 5,113 | | $ | 5,113 | |
| | | | | | | | | | | | | |
| | | December 31, 2021 |
| | | Level 1 | | Level 2 | | Level 3 | | Total |
Individually evaluated loans1 | | | $ | - | | $ | - | | $ | 13,138 | | $ | 13,138 |
Other real estate owned, net2 | | | - | | | - | | | 8,371 | | | 8,371 | | | - | | | - | | | 2,356 | | | 2,356 |
Total | | $ | - | | $ | - | | $ | 13,484 | | $ | 13,484 | | $ | - | | $ | - | | $ | 15,494 | | $ | 15,494 |
| 1 | 1
| | Represents carrying value and related write-downs of loans for which adjustments are substantially based on the appraised value of collateral for collateral-dependent loans, had a carrying amount of $5.3$18.5 million and a valuation allowance of $144,000,$5.4 million, resulting in an increase of specific allocations within the ALLLprovision for credit losses of $856,000$2.7 for the year ending December 31, 2017. 2021. |
| 2 | 2
| | OREO is measured at the lower of carrying or fair value less costs to sell, and had a net carrying amount of $8.4$2.4 million, which is made up of the outstanding balance of $17.4$3.7 million, net of a valuation allowance of $8.2$1.2 million and participationspurchase accounting adjustments of $900,000,$131,000 at December 31, 2017. 2021. |
| | | | | | | | | | | | | |
| | December 31, 2016 | |
| | Level 1 | | Level 2 | | Level 3 | | Total | |
Impaired loans1 | | $ | - | | $ | - | | $ | - | | $ | - | |
| | | | | | | | | | | | | |
| | | December 31, 2020 |
| | | Level 1 | | Level 2 | | Level 3 | | Total |
Individually evaluated loans1 | | | $ | - | | $ | - | | $ | 9,675 | | $ | 9,675 |
Other real estate owned, net2 | | | - | | | - | | | 11,916 | | | 11,916 | | | - | | | - | | | 2,474 | | | 2,474 |
Total | | $ | - | | $ | - | | $ | 11,916 | | $ | 11,916 | | $ | - | | $ | - | | $ | 12,149 | | $ | 12,149 |
| 1 | 1
| | Represents carrying value and related write-downs of loans for which adjustments are substantially based on the appraised value of collateral for collateral-dependent loans, had a carrying amount of $12.3 million and a valuation allowance of $1.0,$2.6 million, resulting in a decreasean increase of specific allocations within the provision for loan and lease losses of $1.0$1.4 million for the year ending December 31, 2016. 2020. |
| 2 | 2
| | OREO is measured at the lower of carrying or fair value less costs to sell, and had a net carrying amount of $11.9$2.5 million, which is made up of the outstanding balance of $23.5$4.1 million, net of a valuation allowance of $14.1 million and participations of $1.7$1.6 million, at December 31, 2016. 2020. |
The Company also has assets that under certain conditions are subject to measurement at fair value on a nonrecurring basis. These assets include OREO and impaired loans. The Company has estimated the fair values of these assets based primarily on Level 3 inputs. OREO and impaired loans are generally valued using the fair value of collateral provided by third party appraisals. These valuations include assumptions related to cash flow projections, discount rates, and recent comparable sales. The numerical range of unobservable inputs for these valuation assumptions are not meaningful.
Note 19:18: Fair ValuesValue of Financial Instruments
The estimated fair values approximate carrying amount for all items except those described in the following table. Investment securitySecurities available-for-sale fair values are based upon market prices or dealer quotes, and if no such information is available, on the rate and term of the security. The carrying value of FHLBC stock approximates fair value as the stock is nonmarketable and can only be sold to the FHLBC or another member institution at par. During the years ended December 31, 2017 and 2016, the Company participated in redemptions and purchases with the FHLBC and, using these transactions values as the carrying value, FHLBC stock is carried at cost and considered a Level 2 fair value. FairFor December 31, 2021 and 2020, the fair values of loans wereand leases are estimated on an exit price basis incorporating discounts for portfolios of loans with similar financial characteristics, such as typecredit, liquidity and fixed or variable interest rate terms. Cash flows were discounted using current rates at which similar loans would be made to borrowers with similar ratings and for similar maturities.marketability factors. The fair value of time deposits is estimated using discounted future cash flows at current rates offered for deposits of similar remaining maturities. The fair values of borrowings were estimated based on interest rates available to the Company for debt with similar terms and remaining maturities. The fair value of off balance sheet volume is not considered material. The fair value of mortgage banking derivatives is discussed above in Note 17.16: Mortgage Banking Derivatives, above.
The carrying amount and estimated fair values of financial instruments at December 31, were as follows:
| | | | | | | | | | | | | | | | |
| | December 31, 2017 | |
| | Carrying | | Fair | | | | | | | | | | |
| | Amount | | Value | | Level 1 | | Level 2 | | Level 3 | |
| | | | | | | | | | | | | | | | |
| | | December 31, 2021 |
| | | Carrying | | Fair | | | | | | | | | |
| | | Amount | | Value | | Level 1 | | Level 2 | | Level 3 |
Financial assets: | | | | | | | | | | | | | | | | | | | | | | | | | | | | | | |
Cash and due from banks | | $ | 37,444 | | $ | 37,444 | | $ | 37,444 | | $ | - | | $ | - | | $ | 38,565 | | $ | 38,565 | | $ | 38,565 | | $ | - | | $ | - |
Interest bearing deposits with financial institutions | | | 18,389 | | | 18,389 | | | 18,389 | | | - | | | - | |
Interest earning deposits with financial institutions | | | | 713,542 | | | 713,542 | | | 713,542 | | | - | | | - |
Securities available-for-sale | | | 541,439 | | | 541,439 | | | 3,947 | | | 520,963 | | | 16,529 | | | 1,692,488 | | | 1,692,488 | | | 202,339 | | | 1,476,057 | | | 14,092 |
FHLBC and FRBC Stock | | | 10,168 | | | 10,168 | | | - | | | 10,168 | | | - | |
FHLBC and FRBC stock | | | | 13,257 | | | 13,257 | | | - | | | 13,257 | | | - |
Loans held-for-sale | | | 4,067 | | | 4,067 | | | - | | | 4,067 | | | - | | | 4,737 | | | 4,737 | | | - | | | 4,737 | | | - |
Loans, net | | | 1,600,161 | | | 1,586,722 | | | - | | | - | | | 1,586,722 | |
Accrued interest receivable | | | 8,595 | | | 8,595 | | | - | | | 8,595 | | | - | |
| | | | | | | | | | | | | | | | |
Net loans | | | | 3,377,667 | | | 3,408,199 | | | - | | | - | | | 3,408,199 |
Mortgage servicing rights | | | | 7,097 | | | 7,097 | | | - | | | - | | | 7,097 |
Interest rate swap agreements | | | | 3,494 | | | 3,494 | | | - | | | 3,494 | | | - |
Interest rate lock commitments and forward contracts | | | | 508 | | | 508 | | | - | | | 508 | | | - |
Interest receivable on securities and loans | | | | 13,431 | | | 13,431 | | | - | | | 13,431 | | | - |
| | | | | | | | | | | | | | | | |
Financial liabilities: | | | | | | | | | | | | | | | | | | | | | | | | | | | | | | |
Noninterest bearing deposits | | $ | 572,404 | | $ | 572,404 | | $ | 572,404 | | $ | - | | $ | - | | $ | 1,428,055 | | $ | 1,428,055 | | $ | 1,428,055 | | $ | - | | $ | - |
Interest bearing deposits | | | 1,350,521 | | | 1,346,339 | | | - | | | 1,346,339 | | | - | | | 4,038,177 | | | 4,041,369 | | | - | | | 4,041,369 | | | - |
Securities sold under repurchase agreements | | | 29,918 | | | 29,918 | | | - | | | 29,918 | | | - | | | 50,377 | | | 50,377 | | | - | | | 50,377 | | | - |
Other short-term borrowings | | | 115,000 | | | 115,000 | | | - | | | 115,000 | | | - | |
Junior subordinated debentures | | | 57,639 | | | 59,471 | | | 33,267 | | | 26,204 | | | - | | | 25,773 | | | 18,557 | | | - | | | 18,557 | | | - |
Subordinated debentures | | | | 59,212 | | | 60,111 | | | | | | 60,111 | | | |
Senior notes | | | 44,058 | | | 46,743 | | | - | | | 46,743 | | | - | | | 44,480 | | | 44,480 | | | 44,480 | | | - | | | - |
Note payable and other borrowings | | | | 19,074 | | | 19,411 | | | - | | | 19,411 | | | - |
Interest rate swap agreements | | | 1,287 | | | 1,287 | | | - | | | 1,287 | | | - | | | 6,788 | | | 6,788 | | | - | | | 6,788 | | | - |
Borrowing interest payable | | | 140 | | | 140 | | | - | | | 140 | | | - | |
Deposit interest payable | | | 631 | | | 631 | | | - | | | 631 | | | - | |
Interest payable on deposits and borrowings | | | | 1,706 | | | 1,706 | | | - | | | 1,706 | | | - |
| | | | | | | | | | | | | | | | |
| | | | | | | | | | | | | | | |
| | December 31, 2016 |
| | Carrying | | Fair | | | | | | |
| | Amount | | Value | | Level 1 | | Level 2 | | Level 3 |
Financial assets: | | | | | | | | | | | | | | | |
Cash and due from banks | | $ | 33,805 | | $ | 33,805 | | $ | 33,805 | | $ | - | | $ | - |
Interest bearing deposits with financial institutions | | | 13,529 | | | 13,529 | | | 13,529 | | | - | | | - |
Securities available-for-sale | | | 531,838 | | | 531,838 | | | - | | | 506,493 | | | 25,345 |
FHLBC and FRBC Stock | | | 7,918 | | | 7,918 | | | - | | | 7,918 | | | - |
Loans held-for-sale | | | 4,918 | | | 4,918 | | | - | | | 4,918 | | | - |
Loans, net | | | 1,462,651 | | | 1,453,429 | | | - | | | - | | | 1,453,429 |
Accrued interest receivable | | | 5,928 | | | 5,928 | | | - | | | 5,928 | | | - |
| | | | | | | | | | | | | | | |
Financial liabilities: | | | | | | | | | | | | | | | |
Noninterest bearing deposits | | $ | 513,688 | | $ | 513,688 | | $ | 513,688 | | $ | - | | $ | - |
Interest bearing deposits | | | 1,353,097 | | | 1,351,000 | | | - | | | 1,351,000 | | | - |
Securities sold under repurchase agreements | | | 25,715 | | | 25,715 | | | - | | | 25,715 | | | - |
Other short-term borrowings | | | 70,000 | | | 70,000 | | | - | | | 70,000 | | | - |
Junior subordinated debentures | | | 57,591 | | | 55,163 | | | 32,404 | | | 22,759 | | | - |
Subordinated debenture | | | 43,998 | | | 43,998 | | | - | | | 43,998 | | | - |
Interest rate swap agreements | | | 994 | | | 994 | | | - | | | 994 | | | - |
Borrowing interest payable | | | 202 | | | 202 | | | - | | | 202 | | | - |
Deposit interest payable | | | 599 | | | 599 | | | - | | | 599 | | | - |
| | | | | | | | | | | | | | | |
| | December 31, 2020 |
| | Carrying | | Fair | | | | | | |
| | Amount | | Value | | Level 1 | | Level 2 | | Level 3 |
Financial assets: | | | | | | | | | | | | | | | |
Cash and due from banks | | $ | 24,306 | | $ | 24,306 | | $ | 24,306 | | $ | - | | $ | - |
Interest earning deposits with financial institutions | | | 305,597 | | | 305,597 | | | 305,597 | | | - | | | - |
Securities available-for-sale | | | 496,178 | | | 496,178 | | | 4,117 | | | 487,742 | | | 4,319 |
FHLBC and FRBC stock | | | 9,917 | | | 9,917 | | | - | | | 9,917 | | | - |
Loans held-for-sale | | | 12,611 | | | 12,611 | | | - | | | 12,611 | | | - |
Net loans | | | 2,000,996 | | | 2,009,773 | | | - | | | - | | | 2,009,773 |
Mortgage servicing rights | | | 4,224 | | | 4,224 | | | - | | | - | | | 4,224 |
Interest rate swap agreements | | | 9,388 | | | 9,388 | | | - | | | 9,388 | | | - |
Interest rate lock commitments and forward contracts | | | 840 | | | 840 | | | - | | | 840 | | | - |
Interest receivable on securities and loans | | | 9,698 | | | 9,698 | | | - | | | 9,698 | | | - |
| | | | | | | | | | | | | | | |
Financial liabilities: | | | | | | | | | | | | | | | |
Noninterest bearing deposits | | $ | 909,505 | | $ | 909,505 | | $ | 909,505 | | $ | - | | $ | - |
Interest bearing deposits | | | 1,627,568 | | | 1,630,109 | | | - | | | 1,630,109 | | | - |
Securities sold under repurchase agreements | | | 66,980 | | | 66,980 | | | - | | | 66,980 | | | - |
Junior subordinated debentures | | | 25,773 | | | 14,658 | | | - | | | 14,658 | | | - |
Senior notes | | | 44,375 | | | 44,600 | | | 44,600 | | | - | | | - |
Note payable and other borrowings | | | 23,393 | | | 24,043 | | | - | | | 24,043 | | | - |
Interest rate swap agreements | | | 13,071 | | | 13,071 | | | - | | | 13,071 | | | - |
Interest payable on deposits and borrowings | | | 418 | | | 418 | | | - | | | 418 | | | - |
| | | | | | | | | | | | | | | |
Note 20:19: Financial Instruments with Off-Balance Sheet Risk and Derivative Transactions
To meet the financing needsRisk Management Objective of Using Derivatives
The Company is exposed to certain risk arising from both its business operations and economic conditions. The Company principally manages its exposures to a wide variety of business and operational risks through management of its customers,core business activities. The Company manages economic risks, including interest rate, liquidity, and credit risk primarily by managing the Bank, as a subsidiaryamount, sources, and duration of its assets and liabilities and the use of derivative financial instruments. Specifically, the Company enters into derivative financial instruments to manage exposures that arise from business activities that result in the receipt or payment of future known and uncertain cash amounts, the value of which are determined by interest rates. The Company’s derivative financial instruments are used to manage differences in the amount, timing, and duration of the Company, is a partyCompany’s known or expected cash receipts and its known or expected cash payments principally related to various financial instruments with off-balance-sheet riskthe Company’s loan portfolio.
Cash Flow Hedges of Interest Rate Risk
The Company’s objectives in the normal course of business. These off-balance-sheet financial instruments include commitments to originate and sell loans as well as financial standby, performance standby and commercial letters of credit. The instruments involve, to varying degrees, elements of credit andusing interest rate risk in excess of the amount recognized in the consolidated balance sheet. The Bank’sderivatives are to add stability to interest expense and to manage its exposure to credit loss for loan commitments and letters of credit is represented by the dollar amount of those instruments. Management generally uses the same credit policies and collateral requirements in making commitments and conditional obligations as it does for on-balance-sheet instruments.
Interest Rate Swap Designated as a Cash Flow Hedge
The Company entered into a forward starting interest rate swap on August 18, 2015, with an effective date of June 15, 2017. This transaction had a notional amount totaling $25.8 million as of December 31, 2017, was designated as a cash flow hedge of certain junior subordinated debentures and was determined to be fully effective during the period presented. As such, no amount of ineffectiveness has been included in net income. Therefore, the aggregate fair value of the swap is recorded in other liabilities with changes in fair value recorded in other comprehensive income, net of tax. The amount included in other comprehensive income would be reclassified to current earnings should all or a portion of the hedge no longer be considered effective. The Company expects the hedge to remain fully effective during the remaining term of the swap. The Bank will pay the counterparty a fixed rate and receive a floating rate based on three month LIBOR. Management concluded that it would be advantageous to enter intomovements. To accomplish this transaction given thatobjective, the Company has trust preferred securitiesthat will change from fixed rate to floating rate on June 15, 2017. The cash flow hedge has a maturity date of June 15, 2037.
Summary information about theprimarily uses interest rate swap designatedswaps as a cash flow hedge is as follows:
| | | | | | | | |
| | As of |
| | December 31, 2017 | | December 31, 2016 |
Notional amount | | $ | 25,774 | | | $ | 25,774 | |
Unrealized loss | | | (1,287) | | | | (994) | |
Interest Rate Swaps
The Bank also has interest rate derivative positions to assist with risk management that are not designated as hedging instruments. These derivative positions relate to transactions in which the Bank enters an interest rate swap with a client while at the same time entering into an offsetting interest rate swap with another financial institution. Due to financial covenant violations relating to nonperforming loans, the Bank had $4.2 million in investment securities pledged to support interest rate swap activity with two correspondent financial institutions at December 31, 2017. The Bank had $6.2 million in investment securities pledged to support interest rate swap activity with three correspondent financial institutions at December 31, 2016.
In connection with each transaction, the Bank agreed to pay interest to the client on a notional amount at a variable interest rate and receive interest from the client on the same notional amount at a fixed interest rate. At the same time, the Bank agreed to pay another financial institution the same fixed interest rate on the same notional amount and receive the same variable interest rate on the same notional amount. The transaction allows the client to convert a variable rate loan to a fixed rate loan and is part of the Company’sits interest rate risk management strategy. BecauseInterest rate swaps designated as cash flow hedges involve the Bank actsreceipt of variable-rate amounts from a counterparty in exchange for the Company making fixed-rate payments over the life of the agreements without exchange of the underlying notional amount. Prior to 2019, such derivatives were used to hedge the variable cash flows associated with existing variable-rate borrowings. In December of 2019, the Company also executed a loan pool hedge of $50 million to convert variable rate loans to a fixed rate index for a five year term.
For derivatives designated and that qualify as cash flow hedges of interest rate risk, the gain or loss on the derivative is recorded in Accumulated Other Comprehensive Income and subsequently reclassified into interest income or interest expense in the same period(s) during which the hedged transaction affects earnings. Amounts reported in accumulated other comprehensive income related to derivatives will be reclassified to interest income or expense as interest payments are received on the variable rate loan pool or the Company’s variable-rate borrowings. During the next twelve months, the Company estimates that an additional $190,000 will be reclassified as an intermediary forincrease to interest income and an additional $174,000 will be reclassified as an increase to interest expense.
Non-designated Hedges
Derivatives not designated as hedges are not speculative and result from a service the client,Company provides to certain customers. The Company executes interest rate swaps with commercial banking customers to facilitate their respective risk management strategies. Those interest rate swaps are simultaneously hedged by offsetting derivatives that the Company executes with a third party, such that the Company minimizes its net risk exposure resulting from such transactions. As the interest rate derivatives associated with this program do not meet the strict hedge accounting requirements, changes in the fair value of both the underlying derivative contracts offset each othercustomer derivatives and do not generally affect the results offsetting derivatives are recognized directly in earnings.
The BankCompany also grants mortgage loan interest rate lock commitments to borrowers, subject to normal loan underwriting standards. The interest rate risk associated with these loan interest rate lock commitments is managed with contracts for future deliveries of loans as well as selling forward mortgage-backed securities contracts. Loan interest rate lock commitments generally have fixed expiration dates or other termination clauses and may require payment of a fee. Since a portionmany of the commitments are expected to expire without being drawn upon, the total commitment amounts do not necessarily represent future cash requirements. Commitments to originate residential mortgage loans held-for-sale and forward commitments to sell residential mortgage loans or forward MBS contracts are considered derivative instruments and changes in the fair value are recorded to mortgage banking revenue. Fair values are estimated based on observable changes in mortgage interest rates including mortgage-backed securities prices from the date of the commitment.
Disclosure of Fair Values of Derivative Instruments on the Balance Sheet
The following table presents derivativesCompany entered into a forward starting interest rate swap on August 18, 2015, with an effective date of June 15, 2017. This transaction had a notional amount totaling $25.8 million as of December 31, 2021 and 2020, was designated as a cash flow hedge of certain junior subordinated debentures and was determined to be fully effective during the period presented. As such, 0 amount of ineffectiveness has been included in net income. Therefore, the aggregate fair value of the swap is recorded in other liabilities with changes in fair value recorded in other comprehensive income, net of tax. The amount included in other comprehensive income would be reclassified to current earnings should all or a portion of the hedge no longer be considered effective. We expect the hedge to remain fully effective during the remaining term of the swap. The Bank pays the counterparty a fixed rate and receives a floating rate based on three month LIBOR. The trust preferred securitieschanged from fixed rate to floating rate in June 15, 2017. The cash flow hedge has a maturity date of June 15, 2037.
In December of 2019, the Company also executed a loan pool hedge of $50.0 million to convert variable rate loans to a fixed rate index for a five year term. This transaction falls under hedge accounting standards and is paired against a pool the Bank’s Libor-based loans. Overall, the new swap only bolsters income in down rate scenarios by a modest degree. We consider the current level of interest rate risk to be moderate but intend to continue looking for market opportunities for further hedging opportunities.
The Bank also has interest rate derivative positions to assist with risk management that are not designated as hedging instruments. These derivative positions relate to transactions in which the Bank enters an interest rate swap with a client while at the same time entering into an offsetting interest rate swap with another financial institution. The Bank had $17.2 million of cash collateral pledged with 1 correspondent financial institution and held $180,000 of cash pledged from another correspondent bank to support interest rate swap activity at December 31, 2021, and 0 investment securities were required to be pledged to any correspondent financial institutions. The Bank had $17.2 million of cash collateral pledged with 1 correspondent financial institution and held $1.4 million of cash pledged from another correspondent bank to support interest rate swap activity at December 31, 2020, and 0 investment securities were required to be pledged to any correspondent financial institutions. At December 31, 2021, the notional amount of non-hedging interest rate swaps was $165.0 million with a weighted average maturity of 3.9 years. At December 31, 2020, the notional amount of non-hedging interest rate swaps was $189.1 million with a weighted average maturity of 4.7 years. The Bank offsets derivative assets and liabilities that are subject to a master netting arrangement.
The table below presents the fair value of the Company’s derivative financial instruments as well as their classification on the Balance Sheets as of December 31, 2017, and periodic changes in the valueswere as follows:
Fair Value of Derivative Instruments
| | | | | | | | | |
| | | | | December 31, 2021 |
| No. of Trans. | | Notional Amount $ | | Balance Sheet Location | Fair Value $ | | Balance Sheet Location | Fair Value $ |
Derivatives designated as hedging instruments | | | | | | | | | |
Interest rate swap agreements | 2 | | 75,774 | | Other Assets | 808 | | Other Liabilities | 4,102 |
Total derivatives designated as hedging instruments | | | | | | 808 | | | 4,102 |
| | | | | | | | | |
Derivatives not designated as hedging instruments | | | | | | | | | |
Interest rate swaps with commercial loan customers | 26 | | 165,005 | | Other Assets | 2,686 | | Other Liabilities | 2,686 |
Interest rate lock commitments and forward contracts | 87 | | 34,414 | | Other Assets | 508 | | Other Liabilities | - |
Other contracts | 3 | | 17,173 | | Other Assets | - | | Other Liabilities | 21 |
Total derivatives not designated as hedging instruments | | | | | | 3,194 | | | 2,707 |
| | | | | | | | | |
| | | | | | | | | |
| | | | | December 31, 2020 |
| No. of Trans. | | Notional Amount $ | | Balance Sheet Location | Fair Value $ | | Balance Sheet Location | Fair Value $ |
Derivatives designated as hedging instruments | | | | | | | | | |
Interest rate swap agreements | 2 | | 75,774 | | Other Assets | 2,697 | | Other Liabilities | 6,380 |
Total derivatives designated as hedging instruments | | | | | | 2,697 | | | 6,380 |
| | | | | | | | | |
Derivatives not designated as hedging instruments | | | | | | | | | |
Interest rate swaps with commercial loan customers | 28 | | 189,126 | | Other Assets | 6,691 | | Other Liabilities | 6,691 |
Interest rate lock commitments and forward contracts | 205 | | 84,472 | | Other Assets | 840 | | Other Liabilities | - |
Other contracts | 4 | | 26,523 | | Other Assets | - | | Other Liabilities | 88 |
Total derivatives not designated as hedging instruments | | | | | | 7,531 | | | 6,779 |
Disclosure of the interest rate swaps are reported in other noninterest income. Periodic changes in theEffect of Fair Value and Cash Flow Hedge Accounting
The fair value of the forward contractsand cash flow hedge accounting related to mortgage loan origination are reportedderivatives covered under ASC Subtopic 815-20 impacted Accumulated Other Comprehensive Income (“AOCI”) and the Income Statement. The loss recognized in the net gainAOCI on sales of mortgage loans.
| | | | | | | | | | | | | |
| | | | | Asset Derivatives | | Liability Derivatives |
| | Notional or | | | | | | | | |
| | Contractual | | Balance Sheet | | | | | Balance Sheet | | | |
| | Amount | | Location | | Fair Value | | Location | | Fair Value |
Interest rate swap contracts net of credit valuation | | $ | 153,433 | | Other Assets | | $ | 727 | | Other Liabilities | | $ | 727 |
Interest rate lock commitments and forward contracts | | | 26,978 | | Other Assets | | | 238 | | N/A | | | - |
Total | | | | | | | $ | 965 | | | | $ | 727 |
The following table presents derivatives not designated as hedging instrumentstotaled $2.4 million as of December 31, 2016.
| | | | | | | | | | | | | |
| | | | | Asset Derivatives | | Liability Derivatives |
| | Notional or | | | | | | | | |
| | Contractual | | Balance Sheet | | | | | Balance Sheet | | | |
| | Amount | | Location | | Fair Value | | Location | | Fair Value |
Interest rate swap contracts net of credit valuation | | $ | 85,807 | | Other Assets | | $ | 673 | | Other Liabilities | | $ | 673 |
Interest rate lock commitments and forward contracts | | | 31,980 | | Other Assets | | | 287 | | N/A | | | - |
Total | | | | | | | $ | 960 | | | | $ | 673 |
Note 21: Preferred Stock
The Series B Stock preferred stock was issued2021, and $2.7 million as part of the Treasury’s Troubled Asset Relief Program and Capital Purchase Program in 2009. Concurrent with issuing the Series B Stock in 2009, the Company issued to the Treasury a ten year warrant to purchase 815,339 shares of the Company’s common stock at an exercise price of $13.43 per share. The Company recorded the warrant as equity, and the allocation was based on their relative fair values in accordance with accounting guidance. The fair value was determined for both the Series B Stock and the warrant as part of the allocation process in the amounts of $68.2 million and $4.8 million, respectively.
In 2014 and 2015, the Company completed redemption of all 73,000 shares of Series B Stock preferred stock issued in 2009. As of December 31, 2017 and 2016, the only remaining component2020. The amount of the 2009 issuanceloss reclassified from AOCI to interest income or interest expense on the income statement totaled $56,000 and $57,000 for the years ended December 31, 2021, and December 31, 2020, respectively.
Credit-risk-related Contingent Features
For derivative transactions involving counterparties who are lending customers of the Company, the derivative credit exposure is managed through the warrant outstanding for 815,339 shares, valued at $4.8 millionnormal credit review and carried within stockholders’ equity. monitoring process, which may include collateralization, financial covenants and/or financial guarantees of affiliated parties. Agreements with such customers require that losses associated with derivative transactions receive payment priority from any funds recovered should a customer default and ultimate disposition of collateral or guarantees occur.
Credit exposure to broker/dealer counterparties is managed through agreements with each derivative counterparty that require collateralization of fair value gains owed by such counterparties. Some small degree of credit exposure exists due to timing differences between when a gain may occur and the subsequent point in time that collateral is delivered to secure that gain. This is monitored by the Company and procedures are in place to minimize this exposure. Such agreements also require the Company to collateralize counterparties in circumstances wherein the fair value of the derivatives result in loss to the Company.
Other provisions of such agreements define certain events that may lead to the declaration of default and/or the early termination of the derivative transaction(s), including the following:
| ● | if the Company either defaults or is capable of being declared in default on any of its indebtedness (exclusive of deposit obligations); |
| ● | if a merger occurs that materially changes the Company's creditworthiness in an adverse manner; or |
| ● | if certain specified adverse regulatory actions occur, such as the issuance of a Cease and Desist Order, or citations for actions considered Unsafe and Unsound or that may lead to the termination of deposit insurance coverage by the Federal Deposit Insurance Corporation. |
Note 20: Preferred Stock
Preferred stock of 300,000 shares is authorized but unissued as of December 31, 20172021 and 2016.2020.
Note 22:21: Parent Company Condensed Financial Information
Condensed Balance Sheets as offor the years ended December 31, were as follows:
| | | | | | | |
| | 2017 | | 2016 | |
Assets | | | | | | | |
Noninterest bearing deposit with bank subsidiary | | $ | 23,011 | | $ | 26,925 | |
Investment in subsidiaries | | | 263,389 | | | 228,646 | |
Other assets | | | 17,139 | | | 23,304 | |
Total assets | | $ | 303,539 | | $ | 278,875 | |
| | | | | | | |
Liabilities and Stockholders’ Equity | | | | | | | |
Junior subordinated debentures | | $ | 57,639 | | $ | 57,591 | |
Senior notes | | | 44,058 | | | 43,998 | |
Other liabilities | | | 1,492 | | | 2,076 | |
Stockholders’ equity | | | 200,350 | | | 175,210 | |
Total liabilities and stockholders' equity | | $ | 303,539 | | $ | 278,875 | |
| | | | | | | |
| | 2021 | | 2020 | |
Assets | | | | | | | |
Noninterest bearing deposit with bank subsidiary | | $ | 25,112 | | $ | 47,601 | |
Investment in subsidiaries | | | 626,325 | | | 353,722 | |
Other assets | | | 1,111 | | | 3,270 | |
Total assets | | $ | 652,548 | | $ | 404,593 | |
| | | | | | | |
Liabilities and Stockholders’ Equity | | | | | | | |
Junior subordinated debentures | | $ | 25,773 | | $ | 25,773 | |
Subordinated debt | | | 59,212 | | | - | |
Senior notes | | | 44,480 | | | 44,375 | |
Notes payable | | | 13,000 | | | 17,000 | |
Other liabilities | | | 8,056 | | | 10,358 | |
Stockholders’ equity | | | 502,027 | | | 307,087 | |
Total liabilities and stockholders' equity | | $ | 652,548 | | $ | 404,593 | |
Condensed Statements of Income for the years ended December 31 were as follows:
| | | | | | | | | |
| | 2017 | | 2016 | | 2015 |
Operating Income | | | | | | | | | |
Cash dividends received from subsidiaries | | $ | - | | $ | - | | $ | 82,777 |
Other income | | | 114 | | | 130 | | | 131 |
Total operating income | | | 114 | | | 130 | | | 82,908 |
Operating Expenses | | | | | | | | | |
Junior subordinated debentures | | | 4,002 | | | 4,334 | | | 4,287 |
Senior notes | | | 2,689 | | | 112 | | | - |
Subordinated debt | | | - | | | 949 | | | 814 |
Other interest expense | | | - | | | 8 | | | 7 |
Other expenses | | | 2,639 | | | 1,975 | | | 1,978 |
Total operating expense | | | 9,330 | | | 7,378 | | | 7,086 |
Loss before income taxes and equity in undistributed net income of subsidiaries | | | (9,216) | | | (7,248) | | | 75,822 |
Income tax benefit | | | (16) | | | (2,909) | | | (2,771) |
Loss before equity in undistributed net income of subsidiaries | | | (9,200) | | | (4,339) | | | 78,593 |
Equity in undistributed (over distributed) net income of subsidiaries | | | 24,338 | | | 20,023 | | | (63,208) |
Net income | | | 15,138 | | | 15,684 | | | 15,385 |
Preferred stock dividends and accretion of discount | | | - | | | - | | | 1,873 |
Net income available to common stockholders | | $ | 15,138 | | $ | 15,684 | | $ | 13,512 |
| | | | | | | | | |
| | 2021 | | 2020 | | 2019 |
Operating Income | | | | | | | | | |
Cash dividends received from subsidiaries | | $ | 40,000 | | $ | 41,300 | | $ | 20,000 |
Other income | | | 15 | | | 32 | | | 109 |
Total operating income | | | 40,015 | | | 41,332 | | | 20,109 |
Operating Expenses | | | | | | | | | |
Junior subordinated debentures | | | 1,133 | | | 2,216 | | | 3,724 |
Subordinated debt | | | 1,610 | | | - | | | - |
Senior notes | | | 2,692 | | | 2,693 | | | 2,700 |
Notes payable | | | 291 | | | 362 | | | - |
Other interest expense | | | - | | | - | | | 13 |
Other expenses | | | 6,918 | | | 3,669 | | | 4,025 |
Total operating expense | | | 12,644 | | | 8,940 | | | 10,462 |
Income before income taxes and equity in undistributed net income of subsidiaries | | | 27,371 | | | 32,392 | | | 9,647 |
Income tax benefit | | | (2,986) | | | (2,215) | | | (3,187) |
Income before equity in undistributed net income of subsidiaries | | | 30,357 | | | 34,607 | | | 12,834 |
Equity in undistributed net income of subsidiaries | | | (10,313) | | | (6,782) | | | 26,621 |
Net income available to common stockholders | | $ | 20,044 | | $ | 27,825 | | $ | 39,455 |
Condensed Statements of Cash Flows for the years ended December 31, were as follows:
| | | | | | | | | |
| | 2017 | | 2016 | | 2015 |
Cash Flows from Operating Activities | | | | | | | | | |
Net Income | | $ | 15,138 | | $ | 15,684 | | $ | 15,385 |
Adjustments to reconcile net income to net cash from operating activities: | | | | | | | | | |
Equity in (undistributed) over distributed net income of subsidiaries | | | (24,338) | | | (20,023) | | | 63,208 |
Provision for deferred tax expense (benefit) | | | 6,397 | | | (1,039) | | | (2,806) |
Net deferred tax expense due to DTA revaluation | | | 3,908 | | | - | | | - |
Change in taxes payable | | | (4,797) | | | 330 | | | (199) |
Change in other assets | | | 74 | | | 171 | | | 36 |
Stock-based compensation | | | 1,181 | | | 657 | | | 613 |
Other, net | | | (15) | | | 282 | | | 69 |
Net cash (used in) provided by operating activities | | | (2,452) | | | (3,938) | | | 76,306 |
| | | | | | | | | |
Cash Flows from Investing Activities | | | | | | | | | |
Net cash provided by investing activities | | | - | | | - | | | - |
| | | | | | | | | |
Cash Flows from Financing Activities | | | | | | | | | |
Dividend paid on preferred stock | | | - | | | - | | | (2,417) |
Dividend paid on common stock | | | (1,184) | | | (888) | | | - |
Purchases of treasury stock | | | (236) | | | (254) | | | (117) |
Proceeds from the issuance of common stock | | | - | | | - | | | - |
Proceeds from the issuance of senior notes | | | - | | | 43,994 | | | - |
Payment of senior note issuance costs | | | (42) | | | - | | | - |
Repayment of subordinated debt | | | - | | | (45,000) | | | - |
Repayment of note payable | | | - | | | (500) | | | - |
Proceeds from exercise of stock option | | | - | | | 11 | | | - |
Redemption of preferred stock | | | - | | | - | | | (47,331) |
Net cash used in financing activities | | | (1,462) | | | (2,637) | | | (49,865) |
Net change in cash and cash equivalents | | | (3,914) | | | (6,575) | | | 26,441 |
Cash and cash equivalents at beginning of year | | | 26,925 | | | 33,500 | | | 7,059 |
Cash and cash equivalents at end of year | | $ | 23,011 | | $ | 26,925 | | $ | 33,500 |
| | | | | | | | | |
| | 2021 | | 2020 | | 2019 |
Cash Flows from Operating Activities | | | | | | | | | |
Net Income | | $ | 20,044 | | $ | 27,825 | | $ | 39,455 |
Adjustments to reconcile net income to net cash from operating activities: | | | | | | | | | |
Equity in undistributed net income of subsidiaries | | | 10,313 | | | 6,782 | | | (26,621) |
Provision for deferred tax expense (benefit) | | | (248) | | | (514) | | | 4,186 |
Change in taxes payable | | | (695) | | | 5,933 | | | 3,896 |
Change in other assets | | | (12) | | | 954 | | | - |
Stock-based compensation | | | 1,435 | | | 2,089 | | | 2,516 |
Other, net | | | 961 | | | 682 | | | (80) |
Net cash provided by (used in) operating activities | | | 31,798 | | | 43,751 | | | 23,352 |
| | | | | | | | | |
Cash Flows from Investing Activities | | | | | | | | | |
Cash paid for acquisition, net of cash and cash equivalents retained | | | (94,406) | | | - | | | - |
Net cash used in investing activities | | | (94,406) | | | - | | | - |
| | | | | | | | | |
Cash Flows from Financing Activities | | | | | | | | | |
Net change in other short-term borrowings | | | - | | | - | | | (4,000) |
Dividend paid on common stock | | | (4,612) | | | (1,186) | | | (1,195) |
Purchases of treasury stock | | | (10,417) | | | (5,922) | | | (666) |
Redemption of junior subordinated debentures | | | - | | | (32,604) | | | - |
Issuance of term note | | | - | | | 20,000 | | | - |
Issuance of sub debt | | | 59,148 | | | - | | | - |
Repayment of term note | | | (4,000) | | | (3,000) | | | - |
Proceeds from exercise of stock option | | | - | | | - | | | 32 |
Net cash (used in) provided by financing activities | | | 40,119 | | | (22,712) | | | (5,829) |
Net change in cash and cash equivalents | | | (22,489) | | | 21,039 | | | 17,523 |
Cash and cash equivalents at beginning of year | | | 47,601 | | | 26,562 | | | 9,039 |
Cash and cash equivalents at end of year | | $ | 25,112 | | $ | 47,601 | | $ | 26,562 |
| | | | | | | | | |
Note 23:22: Employee Benefit Plans
Old Second Bancorp, Inc. Employees 401(k) Savings Plan and Trust
The Company sponsors a qualified, tax-exempt defined contribution plan (the “Plan”“401(k) Plan”) qualifying under section 401(k) of the Internal Revenue Code. Virtually all employees are eligible to participate after meeting certain age and service requirements.requirements; these service requirements were shortened in 2020 from eligibility the first day of a quarter after 90 days of service to the first day of a month after 30 days of service. Eligible employees are permitted to contribute up to a dollar limit set by law of their compensation to the 401(k) Plan. For the years ended December 31, 2017, 20162021, 2020 and 2015,2019, a discretionary match equal to 100% of the first 3% and 50% of the participant’s compensationnext 2% was contributedmade to participants of the 401(k) Plan. Participants are 100% vested in the discretionary matching contributions. Participants can choose between several different investment options under the 401(k) Plan, including shares of the Company’s common stock. An additional component of the 401(k) Plan arrangement allows for the Company to make annual discretionary contributions under a profit sharing portioncontributions based on the Company’s profitability in a given year, and on each participant’s annual compensation. The Company elected not to make a discretionary profit sharing contribution for the years end December 31, 2017, 20162021, 2020 and 2015. 2019.
The total expense relating to the 401(k) Plan was approximately $698,000, $464,000$1.4 million in 2021, $1.2 million in 2020 and $477,000$1.1 million in 2017, 2016 and 2015, respectively.2019.
Old Second Bancorp, Inc. Voluntary Deferred Compensation Plan for Executives and Directors
The Company sponsors an executivea deferred compensation plan, which is a means by which certain executives and directors may voluntarily defer a portion of their salary, or bonus.bonus and directors fees, as applicable. This plan is an unfunded, nonqualified deferred compensation arrangement. Company obligations under this arrangement as of December 31, 2017, 20162021, 2020 and 2015 were $1.7 million, $1.6 million and $1.9 million, respectively, and2019 are included in other liabilities.
Report of Independent Registered Public Accounting Firm
To the Stockholders and Board of Directors and Stockholders
Old Second Bancorp, Inc. and Subsidiaries
OpinionOpinions on the Financial Statements and Internal Control over Financial Reporting
We have audited the accompanying consolidated balance sheets of Old Second Bancorp, Inc. and Subsidiariesits subsidiaries (the “Company”) as of December 31, 20172021 and 2016,2020, and the related consolidated statements of income, comprehensive income, stockholders' equity, and cash flows for each of the years in the three-year period ended December 31, 2017, and2021, including the related notes (collectively referred to as the “financial statements”). We also have audited the Company's internal control over financial reporting as of December 31, 2021, based on criteria established in Internal Control-Integrated Framework (2013) issued by the Committee of Sponsoring Organizations of the Treadway Commission (the “COSO framework”).
In our opinion, the financial statements referred to above present fairly, in all material respects, the financial position of the Company as of December 31, 20172021 and 2016,2020, and the results of its operations and its cash flows for each of the years in the three-year period ended December 31, 2017,2021, in conformity with accounting principles generally accepted in the United States of America.
We also have audited Also, in our opinion, the Company’sCompany maintained, in all material respects, effective internal control over financial reporting as of December 31, 2017, in accordance with the standards of the Public Company Accounting Oversight Board (United States) (“PCAOB”),2021, based on criteria established in the COSO framework.
As described in Management’s Report on Internal Control-Integrated Framework (2013) issued byControl Over Financial Reporting, management excluded from its assessment the Committeeinternal control over financial reporting at West Suburban Bancorp (“WSB”), which was acquired on December 1, 2021, and whose financial statements constitute 47.5% of Sponsoring Organizationstotal assets and 4.1% of total revenue of the Treadway Commission (COSO). Our report dated March 9, 2018, expresses an unqualified opinion.consolidated financial statement amounts as of and for the year ended December 31, 2021. Accordingly, our audit did not include the internal control over financial reporting at WSB.
Change in Accounting Principle
As discussed in Note 1 to the financial statements, the Company changed the manner in which it accounts for the allowance for credit losses as of January 1, 2020.
Basis for Opinion
The Company's management is responsible for these financial statements.statements, for maintaining effective internal control over financial reporting, and for its assessment of the effectiveness of internal control over financial reporting, included in the accompanying Management’s Report on Internal Control Over Financial Reporting. Our responsibility is to express an opinion on the Company’s financial statements and an opinion on the Company's internal control over financial reporting based on our audits. We are a public accounting firm registered with the PCAOBPublic Company Accounting Oversight Board (United States) (“PCAOB”) and are required to be independent with respect to the Company in accordance with the U.S. federal securities laws and the applicable rules and regulations of the Securities and Exchange Commission and the PCAOB.
We conducted our audits in accordance with the standards of the PCAOB. Those standards require that we plan and perform the auditaudits to obtain reasonable assurance about whether the financial statements are free of material misstatement, whether due to error or fraud. fraud, and whether effective internal control over financial reporting was maintained in all material respects.
Our audits of the financial statements included performing procedures to assess the risks of material misstatement of the financial statements, whether due to error or fraud, and performing procedures that respond to those risks. Such procedures included examining, on a test basis, evidence regarding the amounts and disclosures in the financial statements. Our audits also included evaluating the accounting principles used and significant estimates made by management, as well as evaluating the overall presentation of the financial statements. We believe that our audits provide a reasonable basis for our opinion.
/s/ Plante & Moran PLLC
We have served as the Company’s auditor since 2010.
Chicago, Illinois
March 9, 2018
Item 9. Changes in and Disagreements with Accountants on Accounting and Financial Disclosure
None
Item 9A. Controls and Procedures
Evaluation of Disclosure Controls and Procedures
The Chief Executive Officer and Chief Financial Officer have evaluated the effectiveness of the design and operation of the Company’s disclosure controls and procedures, as defined in Rule 13a-15(e) promulgated under the Securities and Exchange Act of 1934, as amended, as of December 31, 2017. Based on that evaluation, the Chief Executive Officer and Chief Financial Officer concluded that as of December 31, 2017, the Company’s disclosure controls and procedures are effective to ensure that information required to be disclosed by the Company in reports that it files or submits under the Securities Exchange Act of 1934 is recorded, processed, summarized, and reported within the time periods specified in the SEC’s rules and forms and such information is accumulated and communicated to the issuer’s management, including its principal executive and principal financial officers as appropriate to allow timely decisions regarding required disclosure.
There were no changes in the Company’s internal control over financial reporting during the quarter ended December 31, 2017, that have materially affected or are reasonably likely to affect, the Company’s internal control over financial reporting.
Management’s Report on Internal Control Over Financial Reporting
The management of the Company is responsible for establishing and maintaining adequate internal control over financial reporting, as defined in Rule 13a–15(f) under the Securities Exchange Act of 1934. The Company’s internal control over financial reporting is a process designed under the supervision of the Company’s Chief Executive Officer and Chief Financial Officer to provide reasonable assurance regarding the reliability of financial reporting and the preparation of the Company’s financial statements for external reporting purposes in accordance with U.S. generally accepted accounting principles.
As of December 31, 2017, management assessed the effectiveness of the Company’s internal control over financial reporting based on the framework established in the “Internal Control - Integrated Framework” issued by the Committee of Sponsoring Organizations of the Treadway Commission (COSO). Based on this evaluation, management has determined that the Company’s internal control over financial reporting was effective as of December 31, 2017, based on the criteria specified.
Plante & Moran PLLC, the independent registered public accounting firm that audited the consolidated financial statements of the Company incorporated by reference to this Annual Report on Form 10-K, has issued an attestation report, included herein, on the Company’s internal control over financial reporting as of December 31, 2017.
Report of Independent Registered Public Accounting Firm
To the Board of Directors and Stockholders
Old Second Bancorp, Inc. and Subsidiaries
Opinion on Internal Control over Financial Reporting
We have audited the internal control over financial reporting as of December 31, 2017 of Old Second Bancorp, Inc. and Subsidiaries (the “Company”), based on criteria established in Internal Control-Integrated Framework (2013) issued by the Committee of Sponsoring Organizations of the Treadway Commission (the “COSO framework”). In our opinion, the Company maintained, in all material respects, effective internal control over financial reporting as of December 31, 2017, based on criteria established in the COSO framework.
We also have audited the accompanying consolidated balance sheets of the Company as of December 31, 2017 and 2016, the related consolidated statements of income, comprehensive income, stockholders' equity, and cash flows for each of the years in the three-year period ended December 31, 2017, in accordance with the standards of the Public Company Accounting Oversight Board (United States). Our report dated March 9, 2018, expresses an unqualified opinion.
Basis for Opinion
The Company's management is responsible for maintaining effective internal control over financial reporting and for its assessment of the effectiveness of internal control over financial reporting included in the accompanying “Management’s Report on Internal Control Over Financial Reporting”. Our responsibility is to express an opinion on the Company's internal control over financial reporting based on our audit. We are a public accounting firm registered with the PCAOB and are required to be independent with respect to the Company in accordance with the U.S. federal securities laws and the applicable rules and regulations of the Securities and Exchange Commission and the PCAOB.
We conducted our audit in accordance with the standards of the PCAOB. Those standards require that we plan and perform the audit to obtain reasonable assurance about whether effective internal control over financial reporting was maintained in all material respects. Our audit of internal control over financial reporting included obtaining an understanding of internal control over financial reporting, assessing the risk that a material weakness exists, and testing and evaluating the design and operating effectiveness of internal control based on the assessed risk. Our auditaudits also included performing such other procedures as we considered necessary in the circumstances. We believe that our audit providesaudits provide a reasonable basis for our opinion.opinions.
Definition and Limitations of Internal Control over Financial Reporting
A company's internal control over financial reporting is a process designed to provide reasonable assurance regarding the reliability of financial reporting and the preparation of financial statements for external purposes in accordance with generally accepted accounting principles. A company's internal control over financial reporting includes those policies and procedures that (1) pertain to the maintenance of records that, in reasonable detail, accurately and fairly reflect the transactions and dispositions of the assets of the company; (2) provide reasonable assurance that transactions are recorded as necessary to permit preparation of financial statements in accordance with generally accepted accounting principles, and that receipts and expenditures of the company are being made only in accordance with authorizations of management and directors of the company; and (3) provide reasonable assurance regarding prevention or timely detection of unauthorized acquisition, use, or disposition of the company's assets that could have a material effect on the financial statements.
Because of its inherent limitations, internal control over financial reporting may not prevent or detect misstatements. Also, projections of any evaluation of effectiveness to future periods are subject to the risk that controls may become inadequate because of changes in conditions, or that the degree of compliance with the policies or procedures may deteriorate.
Critical Audit Matters
The critical audit matters communicated below are matters arising from the current period audit of the consolidated financial statements that was communicated or required to be communicated to the audit committee and that (1) relates to accounts or disclosures that are material to the financial statements and (2) involved our especially challenging, subjective, or complex judgments. The communication of critical audit matters does not alter in any way our opinion on the financial statements, taken as a whole, and we are not, by communicating the critical audit matters below, providing a separate opinion on the critical audit matters or on the accounts or disclosures to which they relate.
Allowance for Credit Losses on Collectively Evaluated Loans – Refer to Notes 1 and 5 to the Consolidated Financial Statements
Critical Audit Matter Description
As described in Notes 1 and 5 to the consolidated financial statements, management’s estimate of the allowance for credit losses at December 31, 2021, includes a reserve on collectively evaluated loans. Significant assumptions in management’s estimate of the reserve on collectively evaluated loans include (i) the length of the reasonable and supportable forecast period, (ii) the estimated remaining life of each segment, and (iii) qualitative factor adjustments. In evaluating whether qualitative adjustments are necessary, management considers internal and external qualitative and credit market risk factors as described in Note 1 to the consolidated financial statements. As of December 31, 2021, the qualitative factor determined to have the most significant impact on expected credit losses was management’s assessment of changes in the volume and severity of past due loans and other similar loan conditions.
Significant judgment was required by management in the selection and application of subjective assumptions. Accordingly, performing audit procedures to evaluate the Company’s estimated ACL involved a high degree of auditor judgment and required significant effort, including the involvement of professionals with specialized skill and knowledge.
How the Critical Audit Matter Was Addressed in the Audit
Our audit procedures related to the Company’s estimate of ACL included, but was not limited to, the following:
| ● | We tested the design and operating effectiveness of management’s controls over key assumptions and judgments, the CECL estimation model for loan portfolios, and management’s determination of qualitative adjustments. |
| ● | We tested management’s process for determining reserves on collectively evaluated loans including: |
| o | Evaluation of the appropriateness of management’s methodology. |
| o | Testing the completeness and accuracy of data utilized by management. |
| o | Evaluation of the relevance and reliability of information used by management in the development of the estimate. |
| o | Evaluation of the reasonableness of significant assumptions used in the estimate, including consideration of whether assumptions used were reasonable given portfolio composition; relevant external factors, including economic conditions; and consideration of historical or recent experience and conditions and events affecting the company. |
Valuation of the Acquired Loan Portfolio – Refer to Note 2 to the Consolidated Financial Statements
Critical Audit Matter Description
As described in Note 2 to the consolidated financial statements, during 2021 the Company acquired West Suburban Bancorp. In connection with the acquisition, management estimated the fair value of acquired loans based on a discounted cash flow methodology that involves assumptions about credit risk, prepayments, discount rates, and either expected lifetime losses or credit risk and losses at default.
Significant judgment was required by management in the selection and application of certain subjective assumptions. Accordingly, performing audit procedures to evaluate the Company’s estimate of the fair value of acquired loans involved a high degree of auditor judgment and required significant effort, including the involvement of professionals with specialized skill and knowledge.
How the Critical Audit Matter Was Addressed in the Audit
Our audit procedures related to the Company’s accounting for the acquired loan portfolio included, but was not limited to, the following:
| ● | We tested the design and operating effectiveness of controls including management’s review of the fair value calculations performed by a third-party valuation specialist, completeness and accuracy of data, and key assumptions and inputs used in the estimate. |
| ● | We tested management’s process for estimating the fair value of acquired loans including: |
| o | Involvement of valuation specialists to assist us in testing management’s methodology and significant assumptions used in the estimate. |
| o | Assessment of management’s selection of valuation methodology and application of significant assumptions. |
| o | Evaluation of the completeness and accuracy of data used in the estimate. |
| o | Evaluation of the relevance and reliability of information used in the development of the estimate. |
| o | Evaluation of the reasonableness of significant assumptions used in the estimate, including comparison to third party market sources, where available, and comparison to independently developed assumptions. |
/s/ Plante & Moran PLLC
We have served as the Company’s auditor since 2010.
Chicago, Illinois
March 9, 201810, 2022
Item 9. Changes in and Disagreements with Accountants on Accounting and Financial Disclosure
None
Item 9A. Controls and Procedures
Evaluation of Disclosure Controls and Procedures
The Chief Executive Officer and Chief Financial Officer have evaluated the effectiveness of the design and operation of the Company’s disclosure controls and procedures, as defined in Rule 13a-15(e) promulgated under the Securities and Exchange Act of 1934, as amended (the “Exchange Act”), as of December 31, 2021. Based on that evaluation, the Chief Executive Officer and Chief Financial Officer concluded that as of December 31, 2021, the Company’s disclosure controls and procedures are effective to ensure that information required to be disclosed by the Company in reports that it files or submits under the Exchange Act is recorded, processed, summarized, and reported within the time periods specified in the SEC’s rules and forms and such information is accumulated and communicated to the issuer’s management, including its principal executive and principal financial officers as appropriate to allow timely decisions regarding required disclosure.
There were no changes in the Company’s internal control over financial reporting during the quarter ended December 31, 2021, that have materially affected or are reasonably likely to materially affect, the Company’s internal control over financial reporting.
Management’s Report on Internal Control Over Financial Reporting
The management of the Company is responsible for establishing and maintaining adequate internal control over financial reporting, as defined in Rule 13a–15(f) under the Exchange Act. The Company’s internal control over financial reporting is a process designed under the supervision of the Company’s Chief Executive Officer and Chief Financial Officer to provide reasonable assurance regarding the reliability of financial reporting and the preparation of the Company’s financial statements for external reporting purposes in accordance with U.S. generally accepted accounting principles.
On December 1, 2021, the Company completed the merger with West Suburban. The Company is in the process of evaluating the existing controls and procedures of West Suburban and integrating West Suburban into the Company’s internal controls over financial reporting. In accordance with the SEC Staff guidance permitting a company to exclude an acquired business from management’s assessment of the effectiveness of internal controls over financial reporting for the year in which the acquisition is completed, the Company has excluded West Suburban from the assessment of the effectiveness of internal controls over financial reporting as of December 31, 2021. West Suburban represented 47.5% of the Company’s total assets as of December 31, 2021. Operations of West Suburban comprised approximately 4.1% of total revenues for the year ended December 31, 2021.
As of December 31, 2021, management assessed the effectiveness of the Company’s internal control over financial reporting based on the framework established in the “Internal Control - Integrated Framework” issued by the Committee of Sponsoring Organizations of the Treadway Commission (COSO). Based on this evaluation, management has determined that the Company’s internal control over financial reporting was effective as of December 31, 2021, based on the criteria specified.
Plante & Moran PLLC, the independent registered public accounting firm that audited the consolidated financial statements of the Company incorporated by reference into this Annual Report on Form 10-K, has issued an attestation report, included herein, on the Company’s internal control over financial reporting as of December 31, 2021.
Item 9B. Other Information
None.
Item 9C. Disclosure Regarding Foreign Jurisdictions that Prevent Inspections
Not applicable.
PART III
Item 10. Directors, Executive Officers and Corporate Governance
The Company incorporates by reference the information required by Item 10 that is contained in the Proxy Statement for the 20182022 Annual Meeting of Stockholders to be filed with the SEC within 120 days after December 31, 2017,2021, on form DEF 14A (the “Proxy Statement”), under the caption “Director Qualifications.”following captions:
Other information required by this Item is incorporated by reference from the information contained under the headings “Section 16(a) Beneficial Ownership Reporting Compliance.,” “Director Nominations and Qualifications,” “Audit Committee,” and “CorporateTableof Contents
| ● | “Proposal 1—Election of Directors,” including “—Director Experience” and “—Biographical Information for Executive Officers;” |
| ● | “Corporate Governance and the Board of Directors—Code of Business Conduct and Ethics;” and |
| ● | “Corporate Governance and the Board of Directors —Committees of the Board of Directors—Audit Committee;” and |
| ● | “Delinquent Section 16(a) Reports.” |
There have been no material changes to the procedures by which security holders may recommend nominees to our Board of Directors-General” in the Proxy Statement.Directors.
Item 11. Executive CompensationCompensation
The Company incorporates by reference the information required by Item 11 that is contained in theour Proxy Statement under the captions “Compensation Discussion and Analysis,” “Board’s Role in Risk Oversight,” “Compensation Committee Interlocks and Insider Participation,” and “Director Compensation.”following captions:
| ● | “Compensation Discussion and Analysis;” |
| ● | “Compensation Committee Report;” |
| ● | “Executive Compensation;” |
| ● | “Director Compensation;” and |
| ● | “Corporate Governance and the Board of Directors—Compensation Committee Interlocks and Insider Participation.” |
Item 12. Security Ownership of Certain Beneficial Owners and Management and Related Stockholder Matters
The following table sets forth information for (i) all equity compensation plans previously approved by the Company’s stockholders and (ii) all equity compensation plans not previously approved by the Company’s stockholders. Equity compensation includes options, warrants, rights and restricted stock units which may be granted from time to time. As of December 31, 2017,2021, the below equity awards were outstanding:
Equity Compensation Plan Information
| | | | | | | | |
| | Number of securities | | Weighted-average | | | |
| | to be issued upon the | | exercise price of | | Number of | |
| | exercise of outstanding | | outstanding options | | securities remaining | |
| | options and restricted | | and restricted | | available for future | |
| | | | | | | | |
| | | Number of securities | | Weighted-average | | |
| | | to be issued upon the | | exercise price of | | Number of |
| | | exercise of outstanding | | outstanding options | | securities remaining |
| | | options and restricted | | and restricted | | available for future |
Plan category | | stock units | | stock units | | issuance | | stock units | | stock units | | issuance |
Equity compensation plans approved by security holders1 | | 474,000 | | $ | 7.77 | | 453,209 | | 540,306 | | $ | 12.42 | | 1,395,981 |
Equity compensation plans not approved by security holders | | - | | | - | | - | | - | | | - | | - |
Total | | 474,000 | | $ | 7.77 | | 453,209 | | 540,306 | | $ | 12.42 | | 1,395,981 |
1 Reflects the outstanding awards under our 2014 Equity Incentive Plan and our 2008 Equity Incentive Plan, as well as the total remaining share reserve under our 20142019 Equity Incentive Plan.
The Company incorporates by reference the other information that is required by this Item 12 that is contained in theour Proxy Statement under the caption “Security Ownership of Certain Beneficial Owners and Management.”
Item 13. Certain Relationships and Related Transactions, and Director Independence
Independence
The Company incorporates by reference the information that is required by this Item 13 that is contained in theour Proxy Statement under the captions “Corporate Governance and the Board of Directors”Directors - Director Independence” and “Transactions with Management.“ - Certain Relationships and Related Party Transactions.”
Item 14. Principal Accountant Fees and Services
Services
The Company incorporates by reference the information required by this Item 14 that is contained in theour Proxy Statement under the caption “Accountant Fees.“Ratification of our Independent Public Accountants.”
98Independent Registered Public Accounting Firm:
Name: Plante & Moran, PLLC
Location: Chicago, Illinois
PCAOB ID: 166
PART IV
PART IV
Item 15. Exhibits and Financial Statement Schedules
Schedules
| (1) | | Index to Financial Statements: See Part II--Item 8. Financial Statements and Supplementary Data. |
| (2) | | Financial Statement Schedules |
All financial statement schedules as required by Item 8 of Form 10-K have been omitted because the information requested is either not applicable or has been included in the consolidated financial statements or notes thereto.
| (3) | | Exhibits: See Exhibit Index. |
Item 16. Form 10-K Summary
Not Applicable.
Exhibits:
99
| SIGNATURES
Pursuant to the requirements of the Securities and Exchange Act of 1934, the registrant has duly caused this report to be signed on its behalf by the undersigned thereunto duly authorized.
| | | | | OLD SECOND BANCORP, INC.
| | | | | | BY:
| /s/ James L. Eccher
| | | James L. Eccher
| | | President and Chief Executive Officer
| | | | DATE: March 13, 2018
| |
SIGNATURES (Continued)
Pursuant to the requirements of the Securities Exchange Act of 1934, this report has been signed below by the following persons on behalf of the Registrant and in the capacities and on the dates indicated.
| | | | | Signature
| | Title
| | Date
| | | | | | | | | | | /s/ William B. Skoglund
| | Chairman of the Board, Director
| | March 13, 2018
| William B. Skoglund
| | | | | | | President and Chief Executive Officer, Director Old Second Bancorp and
| | | /s/ James L. Eccher
| | Old Second National Bank (principal executive officer)
| | March 13, 2018
| James L. Eccher
| | | | | | | Executive Vice President and
| | | /s/ Bradley S. Adams
| | Chief Financial Officer
(principal financial and accounting officer)
| | March 13, 2018
| Bradley S. Adams
| | | | | | | | | | /s/ Gary Collins
| | Executive Vice President and Vice Chairman of the Board, Director
| | March 13, 2018
| Gary Collins
| | | | | | | | | | /s/ Edward Bonifas
| | Director
| | March 13, 2018
| Edward Bonifas
| | | | | | | | | | /s/ Barry Finn
| | Director
| | March 13, 2018
| Barry Finn
| | | | | | | | | | /s/ William Kane
| | Director
| | March 13, 2018
| William Kane
| | | | | | | | | | /s/ John Ladowicz
| | Director
| | March 13, 2018
| John Ladowicz
| | | | | | | | | | /s/ Duane Suits
| | Director
| | March 13, 2018
| Duane Suits
| | | | | | | | | | /s/ James F. Tapscott
| | Director
| | March 13, 2018
| James F. Tapscott
| | | | | | | | | | /s/ Patti Temple Rocks
| | Director
| | March 13, 2018
| Patti Temple Rocks
| | | | | | | | | | | | | | |
| | EXHIBIT
NO. | EXHIBIT INDEX
Description of Exhibits | 2.1 | Agreement and Plan of Merger between Old Second Bancorp, Inc. and West Suburban Bancorp, Inc. dated as of July 25, 2021 (incorporated by reference to Exhibit 2.1 of the Old Second Bancorp, Inc. Current Report on Form 8-K filed on July 26, 2021).+ | 3.1 | Restated Certificate of Incorporation of Old Second Bancorp, Inc. (incorporated by reference to Exhibit 3.1 of the Company’s Annual Report on Form 10-K filed on March 11, 2016. | 3.2 | Amended and Restated Bylaws ofAmendment to Old Second Bancorp, Inc.’s Restated Certificate of Incorporation (incorporated by reference to Exhibit 3.2 of the Company’s Annual Report on Form 10-K filed on March 11, 2016).
| 4.1
| Amended and Restated Rights Agreement and Tax Benefits Preservation Plan, dated September 12, 2012 (incorporated by reference to Exhibit 99.13.1 of the Company’s Current Report on Form 8-K filed on September 13, 2012)May 22, 2019).
| 4.23.3
| First AmendmentCertificate of Elimination Eliminating References to Series A Junior Participating Preferred Stock From the Restated Certificate of Incorporation, as Amended, and Restated Rights Agreement and Tax Benefits Preservation Plan, dated April 3, 2014of Old Second Bancorp. Inc. (incorporated by reference to Exhibit 10.2 of the Company’s Quarterly Report on Form 10-Q filed on August 13, 2014).
| 4.3
| Second Amendment to Amended and Restated Rights Agreement and Tax Benefits Preservation Plan, dated as of September 2, 2015 (incorporated by reference to Exhibit 4.1 to the Company's Current Report on Form 8-K filed on September 4, 2015).
| 4.4
| Form of Stock Certificate for Series B Fixed Rate Cumulative Perpetual Preferred Stock (incorporated by reference to Exhibit 4.13.1 of the Company’s Current Report on Form 8-K filed on January 16, 2009)June 5, 2019).
| 4.53.4
| Warrant to Purchase SharesBylaws of Common Stock, dated January 16, 2009Old Second Bancorp, Inc., as amended and restated through November 4, 2020 (incorporated by reference to Exhibit 4.23.1 of the Company’s Current Report on Form 8-K10-Q filed on January 16, 2009)November 6, 2020).
| 4.64.1
| Specimen Common Stock Certificate of Old Second Bancorp, Inc. (incorporated by reference to Exhibit 4.1 of the Company’s Registration Statement on Form S-1 filed on January 17, 2014). | 4.74.2
| Indenture, dated as of December 15, 2016, between the Company and Wells Fargo Bank, National Association(incorporated (incorporated by reference to Exhibit 4.1 of the Company’s Current Report on Form 8-K filed on December 15, 2016). | 4.84.3
| First Supplemental Indenture, dated as of December 15, 2016, between the Company and Wells Fargo Bank National Association (incorporated by reference to Exhibit 4.2 of the Company’s Current Report on Form 8-K filed on December 15, 2016). | 4.94.4
| Form of 5.750% Fixed-to-Floating Rate Senior Notes Due 2026 (incorporated by reference to Exhibit 5.1 of the Company’s Current Report on Form 8-K filed on December 15, 2016). | 4.5# | Description of Capital Stock. | 4.6 | Form of 3.50% Fixed-to-Floating Subordinated Note due April 15, 2031 of Old Second Bancorp, Inc. (incorporated by reference to Exhibit 4.1 of the Company’s Current Report on Form 8-K filed on April 7, 2021). |
10.1 | Form of Indenture relating to trust preferred securities (incorporated by reference to Exhibit 4.1 to the Company’s Registration Statement on Form S-3 filed on May 20, 2003). | 10.2 | Indenture between Old Second Bancorp, Inc. as issuer, and Wells Fargo Bank, National Association, as Trustee, dated as of April 30, 2007 (incorporated by reference to Exhibit 99(b)(2) of the Company’s Amendment No. 1 to Schedule TO filed on May 2, 2007). | 10.3* | Old Second Bancorp, Inc. 2008 Equity Incentive Plan (incorporated by reference to Appendix A to the Company’s Proxy Statement on Form DEF 14A filed on March 17, 2008). | 10.4* | Employment Agreement, dated September 16, 2014, by and among Old Second Bancorp, Inc. and James L. Eccher (incorporated by reference to Exhibit 10.1 of the Company’s Current Report on Form 8-K filed on September 18, 2014). | 10.5* | Old Second Bancorp, Inc. Amended and Restated Voluntary Deferred Compensation Plan for Executives and Directorsdated September 1, 2008 (incorporated by reference to Exhibit 10.5 of the Company’s CurrentAnnual Report on Form 8-K10-K filed on March 28, 2005)6, 2020). | 10.6* | Amendment to the Old Second Bancorp, Inc. Supplemental ExecutiveAmended and RetirementRestated Voluntary Deferred Compensation Plan for Directors dated September 1, 2008 (incorporated by reference to Exhibit 10.110.6 of the Company’s CurrentAnnual Report on Form 8-K10-K filed on October 24, 2005)March 6, 2020).
| 10.7* | |
10.7
| Letter Agreement, dated January 16, 2009, by and between Old Second Bancorp, Inc., and the United States Department of the Treasury, which includes the Securities Purchase Agreement – Standard Terms with respect to the issuance and sale of the Series B Stock and the Warrant (incorporated by reference to Exhibit 10.1 of the Company’s Current Report on Form 8-K filed on January 16, 2009).
| 10.8*
| 2008 Equity Incentive Plan Restricted Stock Award Agreement (incorporated by reference to Exhibit 10.1 of the Company’s Current Report on Form 8-K filed on February 23, 2009). | 10.9*10.8*
| 2008 Equity Incentive Plan Restricted Stock Unit Award Agreement (incorporated by reference to Exhibit 10.2 of the Company’s Current Report on Form 8-K filed on February 23, 2009). | 10.10*10.9*
| 2008 Equity Incentive Plan Incentive Stock Option (incorporated by reference to Exhibit 10.3 of the Company’s Current Report on Form 8-K filed on February 23, 2009). | 10.11*10.10*
| 2008 Equity Incentive Plan Non-Qualified Stock Option (incorporated by reference to Exhibit 10.4 of the Company’s Current Report on Form 8-K filed on February 23, 2009). | 10.12*10.11*
| Restated Old Second Bancorp, Inc. 2014 Equity Incentive Plan (incorporated by reference(restated to combine the 2014 Equity Incentive Plan included as Appendix A to the Company’s Proxy Statement filed on Form DEF 14ADEFA filed on April 21, 2014). | 10.13*
| 2014, and the First Amendment thereto and to the Old Second Bancorp, Inc. 2014 Equity Incentive Plan (incorporated by reference tocorrect a scrivener’s error in such First Amendment included as Appendix A to the Company’s Proxy Statement filed on Form DEF 14ADEF14A filed on April 12, 2016) (incorporated by reference to Exhibit 10.1 of the Company’s Quarterly Report on Form 10-Q filed on November 7, 2018). | 10.14*10.12*
| Offer Letter, dated August 1, 2016, between Old Second National Bank and Gary Collins - (incorporated by reference to Exhibit 10.1 of the Company’s Quarterly Report on Form 10-Q filed on November 8, 2016). | 10.15*†10.13*
| Compensation and Benefits Assurance Agreement dated as of October 29, 2016, between Old Second National Bank and Gary Collins (incorporated by reference to Exhibit 10.2 of the Company’s Quarterly Report on Form 10-Q filed on November 8, 2016).
| 10.16*
| 2014 Equity Incentive Plan Restricted Stock Award Agreement (Incorporated(incorporated by reference to Exhibit 4.3 of the Company’s Registration Statement on Form S-8 filed on June 24, 2014). | 10.17*10.14*
| 2014 Equity Incentive Plan Restricted Stock Unit Award Agreement (Incorporated(incorporated by reference to Exhibit 4.4 of the Company’s Registration Statement on Form S-8 filed on June 24, 2014). | 10.18*10.15*
| Old Second Bancorp, Inc. 2002 Long-Term Incentive Plan (incorporated by reference to Exhibit 10.1 of the Company’s Registration Statement on Form S-8 filed on September 12, 2006). | 10.19*10.16*
| Retirement Agreement and Release by and between Old Second Bancorp, Inc. and J. Douglas Cheatham, effective March 15, 2017 (incorporated by reference to Exhibit 10.1 of the Company’s 8-K filed on March 17, 2017).
| 10.20*
| Offer letter, dated April 3, 2017, between the Company and Bradley Adams (incorporated by reference to Exhibit 10.1 of the Company’s Quarterly Report on Form 10-Q filed on August 7, 2017). | 10.21*10.17*
| Revised Compensation and Benefits Assurance Agreement, dated as of April 25, 2017, between the Company and Gary Collins (incorporated by reference to Exhibit 10.1 of the Company’s Current Report on Form 8-K filed on April 28, 2017). |
10.21* | 12.1Executive Annual Incentive Plan dated February 19, 2018 (incorporated by reference to Exhibit 10.1 of the Company’s Current Report on Form 8-K filed on February 23, 2018).
| 10.22* | Form of Performance-Based Restricted Stock Unit Agreement (incorporated by reference to Exhibit 10.1 of the Company’s Current Report on Form 8-K filed on April 18, 2018). | 10.23* | ComputationForm of RatioDirector Performance-Based Restricted Stock Agreement (incorporated by reference to Exhibit 10.2 of Earnings to Fixed Charges and Ratio of Earnings to Fixed Charges and Preferred Stock Dividendsthe Company’s Quarterly Report on Form 10-Q filed on August 7, 2018).
| 21.110.24*
| Old Second Bancorp, Inc. 2019 Equity Incentive Plan (incorporated by reference to Appendix A to the Company’s definitive proxy statement for the Annual Meeting filed with the SEC on April 19, 2019). | 10.25* | Form of Time Vesting Restricted Stock Unit Award Agreement (incorporated by reference to Exhibit 4.8 to the Company’s Registration Statement on Form S-8 filed on May 29, 2019). | 10.26* | Form of Director Time Vesting Restricted Stock Unit Award Agreement (incorporated by reference to Exhibit 4.9 to the Company’s Registration Statement on Form S-8 filed on May 29, 2019). | 10.27* | Old Second Bancorp, Inc. Voluntary Deferred Compensation Plan (incorporated by reference to Exhibit 10.1 to the Company’s Current Report on Form 8-K filed on September 29, 2020). | 10.28* | Form of Performance-Based Restricted Stock Unit Agreement (incorporated by reference to Exhibit 10.1 to the Company’s Current Report on Form 8-K filed on February 18, 2021). | 10.29* | Compensation and Benefits Assurance Agreement dated as of March 16, 2021, between Old Second Bancorp, Inc. and Richard A. Gartelmann, Jr., Executive Vice President (incorporated by reference to Exhibit 10.1 to the Company’s Current Report on Form 8-K filed on March 19, 2021). | 10.30 | Form of Subordinated Note Purchase Agreement, dated as of April 6, 2021, by and among Old Second Bancorp, Inc. and the Purchasers (incorporated by reference to Exhibit 10.1 of the Company’s Current Report on Form 8-K filed on April 7, 2021). | 10.31* | Employment Agreement, dated July 25, 2021, between Old Second Bancorp, Inc. and Keith Acker (incorporated by reference to Exhibit 10.1 to the Company’s Current Report on Form 8-K filed on December 1, 2021). | 21.1# | A list of all subsidiaries of the Company. | 23.123.1#
| Consent of Plante & Moran, PLLC. | 31.124.1#
| Power of Attorney (contained herein as part of the signature pages). | 31.1# | Certification of Chief Executive Officer Pursuant to Rule 13a-14(a)/15d-14(a). | 31.231.2#
| Certification of Chief Financial Officer Pursuant to Rule 13a-14(a)/15d-14(a). |
32.132.1#
| Certification of Chief Executive Officer Pursuant to 18 U.S.C. Section 1350, as adopted Pursuant to Section 906 of the Sarbanes-Oxley Act of 2002. | 32.232.2#
| Certification of Chief Executive Officer Pursuant to 18 U.S.C. Section 1350, as adopted Pursuant to Section 906 of the Sarbanes-Oxley Act of 2002. | 101101#
| Interactive data files pursuant to Rule 405 of Regulation S-T: (i) Consolidated Balance Sheets atdated December 31, 2017,2021, and December 31, 2016;2020; (ii) Consolidated Statements of Income for year endedthe Years Ended December 31, 2017, 20162021, 2020 and 2015;2019; (iii) Consolidated Statements of Stockholders’ EquityComprehensive Income for the twelve months endedYears Ended December 31, 2017, 20162021, 2020 and 2015;2019; (iv) Consolidated Statements of Cash Flows for the twelve months endedYears Ended December 31, 2017, 20162021, 2020 and 2015;2019; (v) Changes in Stockholders’ Equity for the Years Ended December 31, 2021, 2020 and (v)2019; and (vi) Notes to Consolidated Financial Statements, tagged as blocks of text and in detail. | 104# | The cover page from the Company’s Annual Report on Form 10-K Report for the year ended December 31, 2021, formatted in inline XBRL and contained in Exhibit 101. |
*Management contract or compensatory plan or arrangement. †Exhibit 10.15
+Schedules and similar attachments have been omitted pursuant to Item 601(b)(2) of Regulation S-K. The registrant will furnish supplementally a copy of any omitted schedules or similar attachment to the SEC upon request. # Filed herewith. SIGNATURES Pursuant to the requirements of the Securities and Exchange Act of 1934, the registrant has duly caused this report to be signed on its behalf by the undersigned thereunto duly authorized. | | | | | OLD SECOND BANCORP, INC. | | | | | | BY: | /s/ James L. Eccher | | | James L. Eccher | | | President and Chief Executive Officer | | | | DATE: March 10, 2022 | |
SIGNATURES (Continued) KNOW ALL MEN BY THESE PRESENTS, that each person whose signature appears below constitutes and appoints James L. Eccher, his true and lawful attorney-in-fact and agent, with full power of substitution and resubstitution, for him or and in his or her name, place and stead, in any and all capacities, to sign any and all amendments to this Annual Report on Form 10-K, and to file the same, with all exhibits thereto, and other documents in connection therewith, with the Securities and Exchange Commission, granting unto attorney-in-fact and agent full power and authority to do and perform each and every act and thing requisite or necessary to be done in and about the premises, as fully to all intents and purposes as he might or could do in person, hereby ratifying and confirming all that attorney-in-fact and agent, or his substitute or substitutes, may lawfully do or cause to be done by virtue hereof. Pursuant to the requirements of Section 13 or 15(d) of the Securities Exchange Act of 1934, this report has been superseded and replacedsigned below by the Compensationfollowing persons on behalf of the Registrant and Benefits Assurance Agreement, dated as in the capacities and on the dates indicated. | | | | | Signature | | Title | | Date | | | | | | /s/ William B. Skoglund | | Chairman of the Board, Director | | March 10, 2022 | William B. Skoglund | | | | | | | President and Chief Executive Officer, Director Old Second Bancorp and | | | /s/ James L. Eccher | | Old Second National Bank (principal executive officer) | | March 10, 2022 | James L. Eccher | | | | | | | Executive Vice President and Chief Financial Officer | | | /s/ Bradley S. Adams | | (principal financial and accounting officer) | | March 10, 2022 | Bradley S. Adams | | | | | | | | | | /s/ Gary Collins | | Vice Chairman of the Board, Director | | March 10, 2022 | Gary Collins | | | | | | | | | | /s/ Keith W. Acker | | Director | | March 10, 2022 | Keith W. Acker | | | | | | | | | | /s/ Edward Bonifas | | Director | | March 10, 2022 | Edward Bonifas | | | | | | | | | | /s/ Barry Finn | | Director | | March 10, 2022 | Barry Finn | | | | | | | | | | /s/ William Kane | | Director | | March 10, 2022 | William Kane | | | | | | | | | | /s/ Dennis Klaeser | | Director | | March 10, 2022 | Dennis Klaeser | | | | | | | | | | /s/ Keith Kotche | | Director | | March 10, 2022 | Keith Kotche | | | | | | | | | | /s/ John Ladowicz | | Director | | March 10, 2022 | John Ladowicz | | | | | | | | | | /s/ Billy J. Lyons | | Director | | March 10, 2022 | Billy J. Lyons | | | | | | | | | | /s/ Hugh McLean | | Director | | March 10, 2022 | Hugh McLean | | | | | | | | | | /s/ Duane Suits | | Director | | March 10, 2022 | Duane Suits | | | | | | | | | | /s/ James F. Tapscott | | Director | | March 10, 2022 | James F. Tapscott | | | | | | | | | |
/s/ Patti Temple Rocks | | Director | | March 10, 2022 | Patti Temple Rocks | | | | | | | | | | /s/ John Williams, Jr. | | Director | | March 10, 2022 | John Williams, Jr. | | | | | | | | | | /s/ Jill E. York | | Director | | March 10, 2022 | Jill E. York | | | | | | | | | |
|