PART I
PART I
NORFOLK SOUTHERN CORPORATION AND SUBSIDIARIES (NS)
Item 1. Business and Item 2. Properties
GENERAL - – Norfolk Southern Corporation (Norfolk Southern) is a Norfolk, Virginia based company that controlsowns a major freight railroad, Norfolk Southern Railway Company. Norfolk Southern Corporation was incorporated on July 23, 1980, under the laws of the Commonwealth of Virginia. Our common stock (Common Stock) is listed on the New York Stock Exchange (NYSE) under the symbol “NSC.”
Unless indicated otherwise, Norfolk Southern Corporation and its subsidiaries, including Norfolk Southern Railway Company, isare referred to collectively as NS, we, us, and our.
We are primarily engaged in the rail transportation of raw materials, intermediate products, and finished goods primarily in the Southeast, East, and Midwest and, via interchange with rail carriers, to and from the rest of the United States. Norfolk SouthernWe also transportstransport overseas freight through several Atlantic and Gulf Coast ports. Norfolk Southern providesWe provide comprehensive logistics services and offersoffer the most extensive intermodal network in the eastern half of the United States.
Norfolk Southern was incorporated on July 23, 1980, under the laws of the Commonwealth of Virginia. Norfolk Southern common stock (Common Stock) is listed on the New York Stock Exchange (NYSE) under the symbol “NSC.”
Norfolk Southern makesWe make available free of charge through itsour website, www.nscorp.com, itsour annual report on Form 10-K, quarterly reports on Form 10-Q, current reports on Form 8-K, and all amendments to those reports as soon as reasonably practicable after such material is electronically filed with or furnished to the U.S. Securities and Exchange Commission (SEC). In addition, the following documents are available on the company’sour website and in print to any shareholder who requests them:
• Corporate Governance Guidelines
• Charters of the Committees of the Board of Directors
• The Thoroughbred Code of Ethics
• Code of Ethical Conduct for Senior Financial Officers
• Categorical Independence Standards for Directors
Unless otherwise indicated, Norfolk Southern and its subsidiaries are referred to collectively as NS.
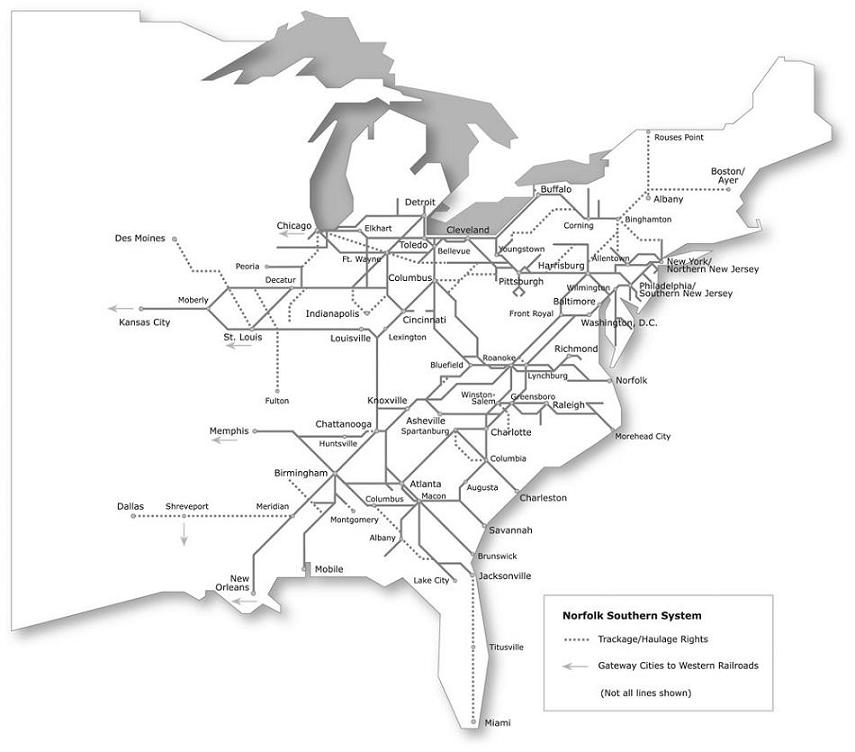
RAILROAD OPERATIONS - As of – At December 31, 2011, NS’2012, our railroads operated approximately 20,000 route miles of road in 22 states and the District of Columbia.
The system’s line reach
Our system reaches many individual industries, electric generating facilities, mines (in western Virginia, eastern Kentucky, southern and northern West Virginia, and western Pennsylvania), distribution centers, transload facilities, and other businesses located in smaller communities in itsour service area.
Corridors with heaviest freight volume:
• New York City area to Chicago (via Allentown and Pittsburgh)
• Chicago to Macon (via Cincinnati, Chattanooga, and Atlanta)
• Appalachian coal fields of Virginia, West Virginia, and Kentucky to Norfolk, Virginia and Sandusky, Ohio
• Cleveland to Kansas City
• Birmingham to Meridian
• Memphis to Chattanooga
The miles operated, which include major leased lines between Cincinnati, Ohio, and Chattanooga, Tennessee, and an exclusive operating agreement for trackage rights over property owned by North Carolina Railroad Company, were as follows:
| | | Mileage Operated as of December 31, 2011 |
| | | | | | | | | | | | |
| | | | | Second | Passing | | | | |
| | | | | and | Track, | | | | |
| | | Miles | | Other | Crossovers | Way and | | |
| | | of | | Main | and | Yard | | |
| | | Road | | Track | Turnouts | Switching | Total | |
| | | | | | | | | | | | |
| Owned | | 15,493 | | 2,782 | | 2,005 | | 8,310 | | 28,590 | |
| Operated under lease, contract or trackage rights | | 4,648 | | 1,881 | | 381 | | 802 | | 7,712 | |
| Total | | 20,141 | | 4,663 | | 2,386 | | 9,112 | | 36,302 | |
| Mileage Operated at December 31, 2012 |
|
| |
| |
| |
| |
|
| | | Second | | Passing | | | | |
| | | and | | Track, | | | | |
| Miles | | Other | | Crossovers | | Way and | | |
| of | | Main | | and | | Yard | | |
| Road | | Track | | Turnouts | | Switching | | Total |
|
| |
| |
| |
| |
|
Owned | 15,375 | | 2,780 | | 2,001 | | 8,292 | | 28,448 |
Operated under lease, contract or trackage rights | 4,648 | | 1,881 | | 381 | | 802 | | 7,712 |
| | | | | | | | | |
Total | 20,023 | | 4,661 | | 2,382 | | 9,094 | | 36,160 |
|
| |
| |
| |
| |
|
Triple Crown Operations - Triple Crown Services Company (Triple Crown), an NS subsidiary,one of our subsidiaries, provides bimodal truckload transportation service utilizing RoadRailer® trailers, a hybrid technology that facilitates both over-the-road and on-the-rail transportation utilizing enclosed trailers that are pulled over the highways in tractor-trailer configuration and over the rails by locomotives. In addition, Triple Crown utilizes conventional trailers that are also moved on rail flatcars. Triple Crown provides service in the eastern two-thirds of the United States as well as Ontario and Quebec through a network of terminals strategically located in 13 cities.
The following table sets forth certain statistics relating to NS’our railroads’ operations for the past 5 years:
| | Years Ended December 31, |
| | 2011 | | 2010 | | 2009 | | 2008 | | 2007 |
| | | | | | | | | | |
| Revenue ton miles (billions) | 192 | | 182 | | 159 | | 195 | | 196 |
| Freight train miles traveled (millions) | 75.7 | | 72.6 | | 67.5 | | 80.0 | | 81.9 |
| Revenue per ton mile | $0.0582 | | $0.0523 | | $0.0503 | | $0.0546 | | $0.0481 |
| Revenue ton miles per employee-hour worked | 3,207 | | 3,218 | | 2,900 | | 3,075 | | 3,066 |
| Ratio of railway operating expenses to railway operating revenues | 71.2% | | 71.9% | | 75.4% | | 71.1% | | 72.6% |
| Years ended December 31, |
| 2012 | | 2011 | | 2010 | | 2009 | | 2008 |
|
| |
| |
| |
| |
|
Revenue ton miles (billions) | 186 | | 192 | | 182 | | 159 | | 195 |
Freight train miles traveled (millions) | 76.3 | | 75.7 | | 72.6 | | 67.5 | | 80.0 |
Revenue per ton mile | $0.0595 | | $0.0582 | | $0.0523 | | $0.0503 | | $0.0546 |
Revenue ton miles per employee-hour worked | 3,153 | | 3,207 | | 3,218 | | 2,900 | | 3,075 |
Ratio of railway operating expenses to railway operating revenues | 71.7% | | 71.2% | | 71.9% | | 75.4% | | 71.1% |
RAILWAY OPERATING REVENUES - NS’ total– Total railway operating revenues were $11.2$11.0 billion in 2011. See the financial information by traffic segment in Part II, Item 7, “Management’s Discussion and Analysis2012. Following is an overview of Financial Condition and Results of Operations.”our three major market groups.
COAL TRAFFIC -– Coal is NS’our largest commodity group as measured by revenues. Revenues from coal accounted for about 31%26% of NS’our total railway operating revenues in 2011. NS2012. We handled a total of 177.9156.1 million tons, or 1.4 million carloads, in 2011,2012, most of which originated on NS’our lines from major eastern coal basins, with the balance from major western coal basins via Memphis and Chicago gateways. NS’Our coal franchise servessupports the electric generation market, serving slightly overapproximately 100 coal generation plants, as well as the export, metallurgical and industrial markets primarily through direct rail and river, lake, and coastal facilities, including Lambert’s Point and various terminals on the Ohio River, Lambert’s Point in Norfolk, Virginia, the Port of Baltimore, and Lake Erie.
See the discussion of coal traffic,revenues and tonnage, by type of coal, in Part II, Item 7, “Management’s Discussion and Analysis of Financial Condition and Results of Operations.”
GENERAL MERCHANDISE TRAFFIC - General– Our general merchandise trafficmarket group is composed of five major commodity groupings: automotive; chemicals; metals and construction; agriculture, consumer products and government; metals and construction; automotive; and paper, clay and forest products. The automotive group includes finished vehicles for BMW, Chrysler, Ford Motor Company, General Motors, Honda, Hyundai, Mercedes-Benz, Mitsubishi, Subaru, Toyota and Volkswagen, and auto parts for Ford Motor Company, General Motors, Honda, Mazda, Mitsubishi, Nissan, Subaru, and Toyota. The chemicals group
• Chemicals includes sulfur and related chemicals, petroleum products, chlorine and bleaching compounds, plastics, rubber, industrial chemicals, chemical wastes, and municipal wastes. The metals and construction group includes steel, aluminium products, machinery, scrap metals, cement, aggregates, bricks, and minerals. The agriculture,
• Agriculture, consumer products, and government group includes soybeans, wheat, corn, fertilizer, animallivestock and poultry feed, food oils, flour, beverages, canned goods, sweeteners, consumer products, ethanol, and items for the military. The paper,
• Metals and construction includes steel, aluminum products, machinery, scrap metals, cement, aggregates, bricks, and minerals.
• Automotive includes finished vehicles for BMW, Chrysler, Ford, General Motors, Honda, Hyundai, Mercedes-Benz, Mitsubishi, Subaru, Toyota and Volkswagen, and auto parts for Chrysler, Ford, General Motors, Honda, Mazda, Mitsubishi, Nissan, Subaru, and Toyota.
• Paper, clay and forest products group includes lumber and wood products, pulp board and paper products, wood fibers, wood pulp, scrap paper, and clay.
In 2011, 1202012, 119 million tons of general merchandise freight, or approximately 66%65% of total general merchandise tonnage we handled, by NS, originated online. The balance of general merchandise trafficfreight was received from connecting carriers at interterritorial gateways. TheOur principal interchange points for NS-received trafficreceived freight included Chicago, Memphis, New Orleans, Cincinnati, Kansas City, Detroit, Hagerstown, St. Louis/East St. Louis, Memphis, Buffalo, and Louisville.Detroit. General merchandise carloads handled in 20112012 were 2.3 million, the revenues from which accounted for 50%54% of NS’our total railway operating revenues in 2011.revenues.
See the discussion of general merchandise rail trafficrevenues by commodity group in Part II, Item 7, “Management’s Discussion and Analysis of Financial Condition and Results of Operations.”
INTERMODAL TRAFFIC - The– Our intermodal market group consists of shipments moving in trailers, domestic and international containers, and RoadRailer® equipment. These shipments are handled on behalf of intermodal marketing companies, international steamship lines, truckers, and other shippers. Intermodal units handled in 20112012 were
3.2 3.4 million, the revenues from which accounted for 19%20% of NS’our total railway operating revenues for the year.revenues.
See the discussion of intermodal trafficrevenues in Part II, Item 7, “Management’s Discussion and Analysis of Financial Condition and Results of Operations.”
FREIGHT RATES -– In 2011, NS’ railroads2012, we continued theirour reliance on private contracts and exempt price quotes as theirthe predominant pricing mechanisms. Thus, a major portion of NS’our freight business is not currently economically regulated by the government. In general, market forces have been substituted for government regulation and now are the primary determinant of rail service prices.
In 2011, NS’2012, our railroads were found by the STBSurface Transportation Board (STB), the regulatory board that has broad jurisdiction over railroad practices, to not be “revenue adequate” on an annual basis based on results for the year 2010.2011. The STB has not made its revenue adequacy determination for the year 2011.2012. A railroad is “revenue adequate” on an annual basis under the applicable law when its return on net investment exceeds the rail industry’s composite cost of capital. This determination is made pursuant to a statutory requirement.
PASSENGER OPERATIONS
- –Amtrak operates regularly scheduled passenger trains on
NS’our lines between the following locations:– • Alexandria Virginia, and New Orleans, Louisiana
– Lynchburg, Virginia
• Alexandria and Orange, Virginia
• Petersburg and Norfolk, Virginia
• Raleigh and Charlotte, North Carolina
–
• Selma and Charlotte, North Carolina
–
• Chicago, Illinois, and Porter, Indiana
–
• Chicago, Illinois, and Cleveland, Ohio
• Chicago, Illinois, and Pittsburgh, Pennsylvania
• Kalamazoo and Battle Creek, Michigan
– Chicago, Illinois, and Pittsburgh, Pennsylvania
– Chicago, Illinois,
• Kalamazoo and Detroit, Michigan
–
• Pittsburgh and Harrisburg, Pennsylvania
K6
Two transportation commissions of the Commonwealth of Virginia operate commuter trains on the NSour line between Manassas and Alexandria
NS leasesAlexandria.We lease the Chicago to Manhattan, Illinois, line to the Commuter Rail Division of the Regional Transportation Authority of Northeast Illinois (METRA)
NS operates.We operate freight service over lines with significant ongoing Amtrak and commuter passenger operations, and is conductingconduct freight operations over trackage owned or leased by:
– • Amtrak
–
• New Jersey Transit
–
• Southeastern Pennsylvania Transportation Authority
–
• Metro-North Commuter Railroad Company
–
• Maryland Department of Transportation
Amtrak orand various commuter agencies conduct passenger operations over trackage owned by Conrail in the Shared Assets Areas (see Note(Note 5 to the Consolidated Financial Statements)
.
NONCARRIER OPERATIONS - NS’– Our noncarrier subsidiaries engage principally in the acquisition, leasing, and management of coal, oil, gas and minerals; the development of commercial real estate; telecommunications; and the leasing or sale of rail property and equipment. In 2011,2012, no such noncarrier subsidiary or industry segment grouping of noncarrier subsidiaries met the requirements for a reportable business segment under relevant authoritative accounting guidance.
RAILWAY PROPERTY
The NS
Our railroad system extends across 22 states and the District of Columbia. The railroad infrastructure makes the companyus capital intensive with net property of approximately $24$26 billion on a historical cost basis.
Property Additions -– Property additions for the past five years were as follows (including capitalized leases):
| | | | | | Property Additions | | | |
| | | 2011 | | | 2010 | | | 2009 | | | 2008 | | | 2007 |
| | | | | | ($ in millions) | | | |
| | | | | | | | | | | | | | | |
| Road and all other property | $ | 1,222 | | $ | 1,153 | | $ | 1,128 | | $ | 1,070 | | $ | 894 |
| Equipment | | 938 | | | 317 | | | 171 | | | 488 | | | 447 |
| Total | $ | 2,160 | | $ | 1,470 | | $ | 1,299 | | $ | 1,558 | | $ | 1,341 |
Capital
| 2012 | | 2011 | | 2010 | | 2009 | | 2008 |
| ($ in millions) |
| |
| | |
| | |
| | |
| | |
|
Road and all other property | $ | 1,465 | | $ | 1,222 | | $ | 1,153 | | $ | 1,128 | | $ | 1,070 |
Equipment | | 776 | | | 938 | | | 317 | | | 171 | | | 488 |
| | | | | | | | | | | | | | |
Total | $ | 2,241 | | $ | 2,160 | | $ | 1,470 | | $ | 1,299 | | $ | 1,558 |
Our capital spending and replacement programs are and have been designed to assure the ability to provide safe, efficient, and reliable rail transportation services. For 2012, NS has2013, we have budgeted $2.4$2.0 billion of property additions.
NS has
We have invested and will continue to invest in various projects and corridor initiatives to expand itsour rail network to increase capacity and improve transit times, while returning value to shareholders. Initiatives include the following:
• The MidAmerica Corridor is ana proposed arrangement between NSus and Canadian National Railway (CN) to share track between Chicago, St. Louis, Kentucky, and Mississippi in order to establish more efficient routes for trafficshipments moving between the Midwest and Southeast, including potential coal traffic moving to NS-served southeastern utility plantsshipments from CN-served Illinois Basin coal producers.
- producers to southeastern utility plants we serve.
• Pan Am Southern LLC, a joint venture between NS andwith Pan Am Railways, Inc., is a 155-mile main line track that runs between Mechanicville, New York and Ayer, Massachusetts, along with 281 miles of secondary and branch lines, including trackage rights in New York, Connecticut, Massachusetts, New Hampshire, and Vermont designed to increase intermodal and automotive capacity.
K7
- • The Crescent Corridor consists of a
planned program of projects for infrastructure and other facility improvements geared toward creating a seamless, high-capacity intermodal routeroutes spanning 11 states from New Jersey to Louisiana and offering truck-competitive service along several major interstate highway corridors, including I-81, I-85, I-20,
I-40, I-59, I-78, and I-75. • The Heartland Corridor, which opened in 2010, iswas a package of clearance improvements and other facilities that created a seamless, high-capacity intermodal route across Virginia and West Virginia to Midwest markets.
• Meridian Speedway LLC, a joint venture between NS andwith Kansas City Southern, is a 320-mile rail line between Meridian, Mississippi and Shreveport, Louisiana designed to increase capacity and improve service.
• The CREATE project is a public-private partnership to reduce rail and highway congestion and add freight and passenger capacity in the metropolitan Chicago area. NSWe and other railroads have agreed to participate in CREATE.
Equipment - As of– At December 31, 2011, NS2012, we owned or leased the following units of equipment:
| | | | | | | | Capacity of |
| | | Owned* | | Leased** | | Total | Equipment |
| | | | | | | | (Horsepower) |
| Locomotives: | | | | | | | | | |
| Multiple purpose | | 3,666 | | 238 | | 3,904 | | 13,753,400 | |
| Switching | | 123 | | -- | | 123 | | 184,750 | |
| Auxiliary units | | 116 | | -- | | 116 | | -- | |
| Total locomotives | | 3,905 | | 238 | | 4,143 | | 13,938,150 | |
| | | | | | | | | | |
| Freight cars: | | | | | | | | (Tons) | |
| Hopper | | 16,969 | | 1,308 | | 18,277 | | 2,006,214 | |
| Box | | 12,928 | | 1,572 | | 14,500 | | 1,206,307 | |
| Covered hopper | | 10,671 | | 633 | | 11,304 | | 1,247,800 | |
| Gondola | | 31,381 | | 3,922 | | 35,303 | | 3,801,663 | |
| Flat | | 2,559 | | 1,072 | | 3,631 | | 336,988 | |
| Caboose | | 165 | | -- | | 165 | | -- | |
| Other | | 4,447 | | 88 | | 4,535 | | 225,212 | |
| Total freight cars | | 79,120 | | 8,595 | | 87,715 | | 8,824,184 | |
| | | | | | | | | | |
| Other: | | | | | | | | | |
| Work equipment | | 4,461 | | 313 | | 4,774 | | | |
| Vehicles | | 3,810 | | -- | | 3,810 | | | |
| Highway trailers and containers | | 7,083 | | 8,212 | | 15,295 | | | |
| RoadRailer® | | 6,399 | | 27 | | 6,426 | | | |
| Miscellaneous | | 9,790 | | 9,329 | | 19,119 | | | |
| Total other | | 31,543 | | 17,881 | | 49,424 | | | |
| | | | | | | Capacity of |
| Owned* | | Leased** | | Total | | Equipment |
| | | | | | | (Horsepower) |
Locomotives: | | | | | | | |
Multiple purpose | 3,763 | | 79 | | 3,842 | | 13,606,600 |
Auxiliary units | 122 | | - | | 122 | | - |
Switching | 110 | | - | | 110 | | 165,250 |
| | | | | | | |
Total locomotives | 3,995 | | 79 | | 4,074 | | 13,771,850 |
| | | | | | | |
| | | | | | | (Tons) |
Freight cars: | | | | | | | |
Gondola | 33,820 | | 3,839 | | 37,659 | | 4,098,830 |
Hopper | 15,234 | | 521 | | 15,755 | | 1,737,636 |
Box | 12,356 | | 1,470 | | 13,826 | | 1,151,821 |
Covered hopper | 10,558 | | 158 | | 10,716 | | 1,182,466 |
Flat | 2,506 | | 1,133 | | 3,639 | | 335,196 |
Other | 4,608 | | 87 | | 4,695 | | 225,067 |
| | | | | | | |
Total freight cars | 79,082 | | 7,208 | | 86,290 | | 8,731,016 |
| | | | | | | |
Other: | | | | | | | |
Highway trailers and containers | 8,199 | | 8,179 | | 16,378 | | |
RoadRailer® | 6,378 | | 27 | | 6,405 | | |
Work equipment | 4,525 | | 313 | | 4,838 | | |
Vehicles | 4,011 | | - | | 4,011 | | |
Miscellaneous | 12,765 | | 9,031 | | 21,796 | | |
| | | | | | | |
Total other | 35,878 | | 17,550 | | 53,428 | | |
* | Includes equipment leased to outside parties and equipment subject to equipment trusts, conditional sale agreements, and capitalized leases. |
** | Includes short-term and long-term operating leases. Freight cars include 791521 leased from Consolidated Rail Corporation (CRC). |
K8
The following table indicates the number and year built for locomotives and freight cars owned at December 31, 2011:2012:
| | | | | | | | | | | | 2002- | | 1997- | | 1996 & | | |
| | 2011 | | 2010 | | 2009 | | 2008 | | 2007 | | 2006 | | 2001 | | Before | | Total |
| Locomotives: | | | | | | | | | | | | | | | | | |
| No. of units | 90 | | 42 | | -- | | 40 | | 90 | | 538 | | 768 | | 2,337 | | 3,905 |
| % of fleet | 2% | | 1% | | --% | | 1% | | 2% | | 14% | | 20% | | 60% | | 100% |
| | | | | | | | | | | | | | | | | | |
| Freight cars: | | | | | | | | | | | | | | | | | |
| No. of units | 3,840 | | 150 | | 514 | | 2,349 | | 1,198 | | 493 | | 4,975 | | 65,601 | | 79,120 |
| % of fleet | 5% | | --% | | 1% | | 3% | | 1% | | 1% | | 6% | | 83% | | 100% |
| | | | | | | | | | | 2003- | | 1998- | | 1997& | | |
| 2012 | | 2011 | | 2010 | | 2009 | | 2008 | | 2007 | | 2002 | | Before | | Total |
Locomotives: | | | | | | | | | | | | | | | | | |
No. of units | 60 | | 90 | | 42 | | - | | 40 | | 628 | | 648 | | 2,487 | | 3,995 |
% of fleet | 2% | | 2% | | 1% | | -% | | 1% | | 16% | | 16% | | 62% | | 100% |
| | | | | | | | | | | | | | | | | |
Freight cars: | | | | | | | | | | | | | | | | | |
No. of units | 2,025 | | 3,840 | | 150 | | 514 | | 2,349 | | 1,691 | | 3,317 | | 65,196 | | 79,082 |
% of fleet | 3% | | 5% | | -% | | 1% | | 3% | | 2% | | 4% | | 82% | | 100% |
The following table shows the average age of NS’our owned locomotive and freight car fleets at December 31, 2011,2012, and the number of retirements in 2011:information regarding 2012 retirements:
| Locomotives | Locomotives
| | | |
Average age -– in service | 21.6 years | 21.0
| 30.2 years | | | | | 30.3 years | | |
Retirements | 49 units | 44 units
| | | | | 2,035 units | | 2,482 cars |
Average age -– retired | 41.2 years | 31.7
| 42.4 years |
|
|
| | | 41.6 years | |
|
OngoingOur ongoing locomotive and freight car maintenance programs are intended to ensure the highest standards of safety, reliability, customer satisfaction, and equipment marketability.availability. The locomotive bad order ratio includes all units (owned and leased) out of service for required periodic inspections, every 92 days,unscheduled maintenance and program work which includes such activity as overhauls, and unscheduled maintenance.overhauls.
| | | Annual Average Bad Order Ratio | |
| | | 2011 | | 2010 | | 2009 | | 2008 | | 2007 | |
| Locomotives | | 7.3% | | 6.7% | | 6.1% | | 5.8% | | 5.7% | |
| Freight Cars | | 5.7% | | 5.8% | | 4.5% | | 4.5% | | 4.9% | |
| Annual Average Bad Order Ratio |
| 2012 | | 2011 | | 2010 | | 2009 | | 2008 |
Locomotives | 7.1% | | 7.3% | | 6.7% | | 6.1% | | 5.8% |
Freight cars | 5.3% | | 5.7% | | 5.8% | | 4.5% | | 4.5% |
|
| |
| |
| |
| |
|
Encumbrances - – Certain railroad equipment is subject to the prior lien of equipment financing obligations amounting to approximately $69totaling $34 million as ofat December 31, 2011, and $112 million as of December 31, 2010.2012.
Track Maintenance -– Of the approximately 36,30036,160 total miles of track operated, NS had the responsibilitywe operate, we are responsible for maintaining about 29,40029,220 miles, of track, with the remainder being operated under trackage rights from other parties responsible for maintenance.
Over 80%81% of the main line trackage (including first, second, third, and branch main tracks, all excluding rail operated pursuant to trackage rights) has rail ranging from 131 to 155 pounds per yard with the standard installation currently at 136 pounds per yard. Approximately 44%42% of NSour lines, excluding rail operated pursuant to trackage rights, carried
20 million or more gross tons per track mile during 2011.2012.
The following table summarizes several measurements regarding NS’our track roadway additions and replacements during the past five years:
| | | 2011 | | 2010 | | 2009 | | 2008 | | 2007 | |
| Track miles of rail installed | | 484 | | 422 | | 434 | | 459 | | 401 | |
| Miles of track surfaced | | 5,441 | | 5,326 | | 5,568 | | 5,209 | | 5,014 | |
| New crossties installed (millions) | | 2.7 | | 2.6 | | 2.7 | | 2.7 | | 2.7 | |
K9
| 2012 | | 2011 | | 2010 | | 2009 | | 2008 |
Track miles of rail installed | 509 | | 484 | | 422 | | 434 | | 459 |
Miles of track surfaced | 5,642 | | 5,441 | | 5,326 | | 5,568 | | 5,209 |
New crossties installed (millions) | 2.6 | | 2.7 | | 2.6 | | 2.7 | | 2.7 |
Microwave System - The NS– Our microwave system, consisting of approximately 7,4006,968 radio route miles, 427421 core stations, 30 secondary stations, and fivefour passive repeater stations, provides communications between most operating locations. TheWe use the microwave system is used primarily for voice communications, VHF radio control circuits, data and facsimile transmissions, traffic control operations, and AEI data transmissions.
Traffic Control -– Of the approximately 16,500 route miles dispatched by NS,we dispatch, about 11,025 miles are signalized, including 8,150 miles of centralized traffic control (CTC) and 2,875 miles of automatic block signals. Of the 8,150 miles of CTC, approximately 5,0505,100 miles are controlled by data radio originating at 312340 base station radio sites.
Computers -– A computer network consisting of a centralized production and backup data center innear Atlanta, Georgia, and various distributed computers throughout the company connects the yards, terminals, transportation offices, rolling stock repair points, sales offices, and other key system locations. Operating and traffic data are processed and stored to provide customers with information on their shipments throughout the system. Computer systems provide current information on the location of every train and each car on line, as well as related waybill and other train and car movement data. In addition, theour computer systems are utilized to assist managementus in the performance of a
variety of functions and services including payroll, car and revenue accounting, billing, material management activities and controls, and special studies.
ENVIRONMENTAL MATTERS -– Compliance with federal, state, and local laws and regulations relating to the protection of the environment is a principal NS goal.goal of ours. To date, such compliance has not affected materially NS’ property additions, earnings,had a material effect on our financial position, results of operations, liquidity, or competitive position. See “Legal Proceedings,” Part I, Item 3; “Personal Injury, Environmental, and Legal Liabilities” in Part II, Item 7, “Management’s Discussion and Analysis of Financial Condition and Results of Operations,” and Note 16 to the Consolidated Financial Statements.
EMPLOYEES -– The following table shows the average number of employees and the average cost per employee for wages and benefits:
| | | 2011 | | 2010 | | 2009 | | 2008 | | 2007 | |
| Average number of employees | | 30,329 | | 28,559 | | 28,593 | | 30,709 | | 30,806 | |
| Average wage cost per employee | | $71,000 | | $69,000 | | $63,000 | | $66,000 | | $62,000 | |
| Average benefit cost per employee | | $39,000 | | $37,000 | | $32,000 | | $31,000 | | $30,000 | |
| 2012 | | 2011 | | 2010 | | 2009 | | 2008 |
Average number of employees | | 30,943 | | | 30,329 | | | 28,559 | | | 28,593 | | | 30,709 |
Average wage cost per employee | $ | 69,000 | | $ | 71,000 | | $ | 69,000 | | $ | 63,000 | | $ | 66,000 |
Average benefit cost per employee | $ | 38,000 | | $ | 39,000 | | $ | 37,000 | | $ | 32,000 | | $ | 31,000 |
| |
| | |
| | |
| | |
| | |
|
More than 80% of NS’our railroad employees are covered by collective bargaining agreements with various labor unions. See the discussion of “Labor Agreements” in Part II, Item 7, “Management’s Discussion and Analysis of Financial Condition and Results of Operations.”
GOVERNMENT REGULATION -– In addition to environmental, safety, securities, and other regulations generally applicable to all business, NS’our railroads are subject to regulation by the STB. The STB has jurisdiction over some rates, routes, fuel surcharges, conditions of service, and the extension or abandonment of rail lines. The STB also has jurisdiction over the consolidation, merger, or acquisition of control of and by rail common carriers. The Federal Railroad Administration (FRA) regulates certain track and mechanical equipment standards.
The relaxation of economic regulation of railroads, underfollowing the Staggers Rail Act of 1980, includes exemptionsincluded exemption from STB regulation of the rates and most service terms for intermodal business (trailer-on-flat-car, container-on-flat-car), rail boxcar traffic,shipments, lumber, manufactured steel, automobiles, and certain bulk commodities such as sand, gravel, pulpwood, and wood chips for paper manufacturing. Transportation contracts on theseFurther, all shipments and on regulated shipmentsthat we have under contract are effectively remove those shipmentsremoved from regulation as well for the duration of the contract. About 86% of NS’ freightour revenues comecomes from either exempt trafficshipments or trafficshipments moving under transportation contracts.contracts; the remainder comes from shipments moving under public tariff rates.
Efforts werehave been made in 2011over the past several years to re-subject the rail industry to increased federal economic regulation, and such efforts are expected to continue in 2012.2013. The Staggers Rail Act of 1980, which substantially balanced such regulation, encouraged and enabled rail carriers to innovate, invest in their infrastructure, and compete for business, thereby contributing to the economic health of the nation and to the revitalization of the industry. Accordingly, NSwe will continue to oppose efforts to reimpose increased economic regulation.
K10
Government regulations concerning the safety and security of our railroads are discussed within the “Security of Operations” section contained herein.
COMPETITION -– There is continuing strong competition among rail, water, and highway carriers. Price is usually only one factor of importance as shippers and receivers choose a transport mode and specific hauling company. Inventory carrying costs, service reliability, ease of handling, and the desire to avoid loss and damage during transit are also important considerations, especially for higher-valued finished goods, machinery, and consumer products. Even for raw materials, semi-finished goods, and work-in progress,work-in-progress, users are increasingly sensitive to transport arrangements that minimize problems at successive production stages.
NS’
Our primary rail competitor is the CSX system;Corporation; both railroads operate throughout much of the same territory. Other railroads also operate in parts of the territory. NSWe also competescompete with motor carriers, water carriers, and with shippers who have the additional options of handling their own goods in private carriage, sourcing products from different geographic areas, and using substitute products.
Certain marketing strategies among railroads and between railroads and motor carriers enable carriersrailroads to compete more effectively in specific markets.
SECURITY OF OPERATIONS - NS has– We have taken significant steps to provide enhanced security for the NSour rail system.
In particular, NS haswe have developed and implemented a comprehensive security plan that is modeled on and was developed in conjunction with the security plan prepared by the Association of American Railroads (AAR) post September 11, 2001. The AAR Security Plan defines four Alert Levels and details the actions and countermeasures that are being applied across the railroad industry as thea terrorist threat increases or decreases. The Alert Level actions include countermeasures that will be applied in three general areas: (1) operations (including transportation, engineering, and mechanical); (2) information technology and communications; and, (3) railroad police. Although security concerns preclude public disclosure of its contents, the NS Departmentalour System Security Plan outlines the protocol within NSour company for all concerned to be notified of AAR Alert Level changes. All NSof our Operations Division employees are advised by their supervisors or train dispatchers, as appropriate, of any change in Alert Level and any additional responsibilities they may incur due to such change.
The NS
Our plan also effectively addresses and complies with U.S. Department of Transportation (DOT) security regulations pertaining to training and security plans with respect to the transportation of hazardous materials. As part of the plan, security awareness training is given to all railroad employees who directly affect hazardous material transportation safety, and this training is integrated into recurring hazardous material training and re-certification programs. Toward that end, NS,we, working closely with the National Transit Institute at Rutgers University, hashave developed a four-module uniform national training program. NSWe have also has worked with the Transportation Security Administration (TSA) in developing other industry training programs. More in-depth security training has been given to those select NS employees of ours who have been given specific security responsibilities, and additional, location-specific security plans have been developed for certain metropolitan areas and each of the six port facilities served by NS.we serve. With respect to the ports, each facility plan has been approved by the applicable Captain of the Port and is subject to inspection by the U.S. Coast Guard.
Additionally, NS engageswe engage in close and regular coordination with numerous federal and state agencies, including the U.S. Department of Homeland Security (DHS), the TSA, the Federal Bureau of Investigation (FBI), the Federal Railroad Administration (FRA),FRA, the U.S. Coast Guard, U.S. Customs and Border Protection, and various state Homeland Security offices. As one notable example, an NSone of our Police Special AgentAgents in Charge (SAC), under the auspices of the AAR, has been assigned to the National Joint Terrorism Task Force (NJTTF) operated by the FBI, and located at the National Counter Terrorism Center (NCTC) in Arlington, VAVirginia to represent and serve as liaison to the North American rail industry. This arrangement improves logistical flow of vital security and law enforcement information with respect to the rail industry as a whole, while having the post filled by an NS SACone of our SACs has also served to foster a strong working relationship between NSus and the FBI. NSWe also hashave become a member of the Customs-Trade Partnership Against Terrorism (C-TPAT) program sponsored by U.S. Customs. C-TPAT allows NSus to work closely with U.S. Customs and itsour customers to develop measures that will help ensure the integrity of freight shipments moving on NS,our railroads, particularly those moving to or from a foreign country. Based on participation in C-TPAT, NS haswe have ensured that itsour plan meets all current applicable security recommendations made by U.S. Customs.
K11
Similarly, NS iswe are guided in itsour operations by various supplemental security action items issued by DHS and U.S. Department of Transportation (DOT),DOT, U.S. Coast Guard Maritime Security requirements, as well as voluntary security action items developed in collaboration with TSA, DOT, and the freight railroads. Many of the action items are based on lessons learned from DHS and DOT security assessments of rail corridors in High Threat Urban Areas (HTUA). Particular attention is aimed at reducing risk in HTUA by: (1) the establishment of secure storage areas for rail cars carrying toxic-by-inhalation (TIH) materials; (2) the expedited movement of trains transporting rail cars carrying TIH materials; (3) the minimization of unattended loaded tank cars carrying TIH materials; and (4) cooperation with
federal, state, local and tribal governments to identify, through risk assessments, those locations where security risks are the highest. These action items and NS’our compliance initiatives are outlined in the various departmental sections of the NS Departmentalour System Security Plan. NS hasWe have taken appropriate actions to be compliant with the TSA Final Security Rule addressing Rail Security Sensitive Materials (RSSM) to ensure these shipments are properly inspected and that positive chain-of-custody is maintained when required. NS isWe are in compliance with the Pipeline and Hazardous Materials Safety Administration (PHMSA) rail-routing regulations outlined in Docket HM-232E. NS conducts annual, on-goingWe conduct ongoing route evaluations. In 2011, as part of the FRA’s bi-annual review, this methodology and selected routes were reviewed by the Federal Railroad Administration, and found to be compliant with the regulation as part ofregulation. The next review by the annual review conducted by FRA.FRA is expected mid-year 2013.
In 2011,2012, through participation in the Transportation Community Awareness and Emergency Response (TRANSCAER) Program, NSwe provided rail accident response training to approximately 5,3165,087 emergency responders, such as local police and fire personnel, representing over 18,98619,023 hours of emergency response training. NSWe also conducted railroad operations classes for FBI agents and the railroad liaison agents from NJTTF. NS’ other training efforts throughout 2011 included participationNJTTF and participated in 17four drills for local, state, and federal agencies. NSWe also hashave ongoing programs to sponsor local emergency responders at the Security and Emergency Response Training Course (SERTC) conducted at the AAR Transportation Technology Center in Pueblo, Colorado.
Improvements in equipment design also are expected to play a role in enhancing rail security. PHMSA, in coordination with the FRA, is amendinghas amended the Hazardous Materials Regulations to prescribe enhanced safety measures for rail transportation of TIH materials, includinghas provided interim design standards for railroad tank cars. The rule mandates commodity-specific improvements in safety features and design standards for newly manufactured DOT specification tank cars and an improved top fittings performance standard. The interim standards established in this rule will enhance the accident survivability of TIH tank cars.
Item 1A. Risk Factors
NS is
We are subject to significant governmental legislation and regulation over commercial, operating and environmental matters. Railroads are subject to the enactment of laws by Congress that could increase economic regulation of the industry. Railroads presently are subject to commercial regulation by the STB, which has jurisdiction over some routes, rates, androutes, fuel surcharges, conditions of service, and the extension or abandonment of rail lines. The STB also has jurisdiction over consolidations, mergers,the consolidation, merger, or acquisitions involvingacquisition of control of and by rail common carriers. Additional economic regulation of the rail industry by CongressCongress or the STB, whether under new or existing laws, could have a significant negative impact on NS’our ability to determine prices for rail services and result in a material adverse effect in the future on NS’our financial position, results of operations, or liquidity in a particular year or quarter. This potential material adverse effect could also result in reduced capital spending on NS’our rail network or abandonment of lines.
Railroads are subject to safety and security regulation by the DOT and the DHS, which regulate most aspects of NS’our operations. Compliance with the Rail Safety Improvement Act of 2008 will result in additional operating costs associated with the statutorily mandated implementation of positive train control by 2015. In addition to increased capital expenditures, implementation may result in reduced operational efficiency and service levels, as well as increased compensation and benefits expenses, and increased claims and litigation costs.
NS’
Our operations are subject to extensive federal and state environmental laws and regulations concerning, among other things, emissions to the air; discharges to waterways or ground watergroundwater supplies; handling, storage, transportation, and disposal of waste and other materials; and the cleanup of hazardous material or petroleum releases. The risk of incurring environmental liability -– for acts and omissions, past, present, and future -– is inherent in the railroad business. This risk includes property owned by NS,us, whether currently or in the past, that is or has been subject to a variety of uses, including NSour railroad operations and other industrial activity by past owners or our past and present tenants of NS.tenants.
K12
Environmental problems that are latent or undisclosed may exist on these properties, and NSwe could incur environmental liabilities or costs, the amount and materiality of which cannot be estimated reliably at this time,
with respect to one or more of these properties. Moreover, lawsuits and claims involving other unidentified environmental sites and matters are likely to arise from time to time, and the resulting liabilities could have a significant effect on our financial position, results of operations, or liquidity in a particular year or quarter.
NS, as
As a common carrier by rail, we must offer to transport hazardous materials, regardless of risk. Transportation of certain hazardous materials could create catastrophic losses in terms of personal injury and property damage costs, and compromise critical parts of our rail network.
NS
We may be affected by terrorism or war. Any terrorist attack, or other similar event, any government response thereto, and war or risk of war could cause significant business interruption and may adversely affect NS’our financial position, results of operations, financial position, or liquidity in a particular year or quarter. Because NS playswe play a critical role in the nation’s transportation system, itwe could become the target of such an attack or have a significant role in the government’s preemptive approach or response to an attack or war.
Although NSwe currently maintainsmaintain insurance coverage for third-party liability arising out of war and acts of terrorism, it maintainswe maintain only limited insurance coverage for first-party property damage and damage to property in NS’our care, custody, or control caused by certain acts of terrorism. In addition, premiums for some or all of NS’our current insurance programs covering these losses could increase dramatically, or insurance coverage for certain losses could be unavailable to NSus in the future.
NS
We may be affected by general economic conditions. Prolonged negative changes in domestic and global economic conditions affecting the producers and consumers of the commodities NS carrieswe carry may have an adverse effect on its operating results,our financial position, results of operations, or liquidity.liquidity in a particular year or quarter. Economic conditions resulting in bankruptcies of one or more large customers could have a significant impact on NS’our financial position, results of operations, or liquidity in a particular year or quarter.
NS
We may be affected by climate change legislation or regulation. Concern over climate change has led to significant federal, state, and international legislative and regulatory efforts to limit greenhouse gas (GHG) emissions. Moreover, even without such legislation or regulation, government incentives and adverse publicity relating to GHG’sGHGs could affect certain of our customers and the markets for certain of the commodities we carry. Restrictions, caps, taxes, or other controls on GHG emissions, including diesel exhaust, could significantly increase NS’our operating costs, decrease the amount of traffic handled, and decrease the value of coal reserves owned by NS,we own, and thus could have an adverse effect on NS’ operating results,our financial position, and liquidity.results of operations, or liquidity in a particular year or quarter. Such restrictions could affect NS’our customers that (1) use commodities that NS carrieswe carry to produce energy, including coal, (2) use significant amounts of energy in producing or delivering the commodities NS carries,we carry, or (3) manufacture or produce goods that consume significant amounts of energy.
NS faces
We face competition from other transportation providers. NS is We are subject to competition from motor carriers, railroads and, to a lesser extent, ships, barges, and pipelines, on the basis of transit time, pricing, and the quality and reliability of service. While NS haswe have used primarily internal resources to build or acquire and maintain itsour rail system, trucks and barges have been able to use public rights-of-way maintained by public entities. Any future improvements or expenditures materially increasing the quality or reducing the cost of alternative modes of transportation in the regions in which NS operates,we operate, or legislation granting materially greater latitude for motor carriers with respect to size or weight limitations, could have a material adverse effect on itsour financial position, results of operations, or liquidity in a particular year or quarter.
The operations of carriers with which NS interchangeswe interchange may adversely affect itsour operations. NS’ Our ability to provide rail service to customers in the U.S. and Canada depends in large part upon itsour ability to maintain cooperative relationships with connecting carriers with respect to, among other matters, freight rates, revenue division, car supply and locomotive availability, data exchange and communications, reciprocal switching, interchange, and trackage rights. Deterioration in the operations of or service provided by connecting carriers, or in NS’our relationship with those connecting carriers, could result in NS’our inability to meet itsour customers’ demands or require NSus to use alternate train routes, which could result in significant additional costs and network inefficiencies.
NS reliesWe rely on technology and technology improvements in itsour business operations. If NS experienceswe experience significant disruption or failure of one or more of itsour information technology systems, including computer hardware, software, and communications equipment, NSwe could experience a service interruption, a security breach, or other operational difficulties, which could have a material adverse impact on its results of operations, financial condition, and liquidity in a particular year or quarter.difficulties. Additionally, if NS doeswe do not have sufficient capital to acquire new technology or it iswe are unable to implement new technology, NSwe may suffer a competitive disadvantage within the rail industry and with companies providing other modes of transportation service, whichservice. Any of these factors could have a material adverse effect on itsour financial position, results of operations, or liquidity in a particular year or quarter.
The vast majority of NSour employees belong to labor unions, and labor agreements, strikes, or work stoppages could adversely affect itsour operations.More than 80% of NSour railroad employees are covered by collective bargaining agreements with various labor unions. If unionized workers were to engage in a strike, work stoppage, or other slowdown, NSwe could experience a significant disruption of itsour operations. Additionally, future national labor agreements, or renegotiation of labor agreements or provisions of labor agreements, could significantly increase NS’our costs for healthcare, wages, and other benefits. Any of these factors could have a material adverse impact on NS’our financial position, results of operations, or liquidity in a particular year or quarter.
NS
We may be subject to various claims and lawsuits that could result in significant expenditures. The nature of NS’our business exposes itus to the potential for various claims and litigation related to labor and employment, personal injury, commercial disputes, freight loss and other property damage, and other matters. Job-related personal injury and occupational claims are subject to the Federal Employer’s Liability Act (FELA), which is applicable only to railroads. FELA’s fault-based tort system produces results that are unpredictable and inconsistent as compared with a no-fault worker’s compensation system. The variability inherent in this system could result in actual costs being very different from the liability recorded.
Any material changes to current litigation trends or a catastrophic rail accident involving any or all of freight loss or property damage, personal injury, and environmental liability could have a material adverse effect on NS’ operatingour financial position, results financial condition, andof operations, or liquidity to the extent not covered by insurance. NS hasWe have obtained insurance for potential losses for third-party liability and first-party property damages. Specified levels of risk are retained on a self-insurance basis (currently up to $50 million and above $1 billion per occurrence for bodily injury and property damage to third parties and up to $25 million and above $175 million per occurrence for property owned by NSus or in itsour care, custody, or control). Insurance is available from a limited number of insurers and may not continue to be available or, if available, may not be obtainable on terms acceptable to NS.us.
Severe weather could result in significant business interruptions and expenditures. Severe weather conditions and other natural phenomena, including hurricanes, floods, fires, and earthquakes, may cause significant business interruptions and result in increased costs, increased liabilities, and decreased revenues, which could have an adverse effect on NS’our financial position, results of operations, or liquidity in a particular year or quarter.
Unpredictability of demand for rail services resulting in the unavailability of qualified personnel could adversely affect NS’our operational efficiency and ability to meet demand. Workforce demographics, training requirements, and the availability of qualified personnel, particularly engineers and trainmen, could each have a negative impact on NS’our ability to meet demand for rail service. Unpredictable increases in demand for rail services may exacerbate such risks, which could have a negative impact on NS’our operational efficiency and otherwise have a material adverse effect on itsour financial position, results of operations, or liquidity in a particular year or quarter.
NS
We may be affected by supply constraints resulting from disruptions in the fuel markets or the nature of some of itsour supplier markets. NS We consumed about 475460 million gallons of diesel fuel in 2011.2012. Fuel availability could be affected by any limitation in the fuel supply or by any imposition of mandatory allocation or rationing regulations. If aA severe fuel supply shortage arosearising from production curtailments, increased demand in existing or emerging foreign markets, disruption of oil imports, disruption of domestic refinery production, damage to
refinery or pipeline infrastructure, political unrest, war or other factors, NS’could have a material adverse effect on our financial position, results of operations, or liquidity in a particular year or quarter could be materially adversely affected.quarter. Also, such an event wouldcould impact NSus as well as itsour customers and other transportation companies.
K14
Due to the capital intensive nature and industry-specific requirements of the rail industry, there are high barriers of entry exist for potential new suppliers of core railroad items, such as locomotives and rolling stock equipment. Additionally, NS competeswe compete with other industries for available capacity and raw materials used in the production of certain track materials, such as rail and ties. Changes in the competitive landscapes of these limited-supplier markets could result in increased prices or materialsignificant shortages of materials that could have a material affectadverse effect on NS’our financial position, results of operations, or liquidity in a particular year or quarter.
The state of capital markets could adversely affect NS’our liquidity. NS from From time-to-time relieswe rely on the capital markets to provide some of itsour capital requirements, including the issuance of long-term debt instruments and commercial paper, as well as the sale of certain receivables. Significant instability or disruptions of the capital markets, including the credit markets, or deterioration of NS’our financial condition due to internal or external factors could restrict or eliminate NS’our access to, and/or significantly increase the cost of, various financing sources, including bank credit facilities and issuance of corporate bonds. Instability or disruptions of the capital markets and deterioration of NS’our financial condition, alone or in combination, could also result in a reduction in NS’our credit rating to below investment grade, which could prohibit or restrict NSus from accessing external sources of short- and long-term debt financing and/or significantly increase the associated costs.
Item 1B. Unresolved Staff Comments
None.
None.
Item 3. Legal Proceedings
On June 25, 2010, the Ohio Attorney General filed a complaint in the Ashtabula Court of Common Pleas alleging certain violations of water laws by NS’ coal dock in Ashtabula, Ohio and seeking injunctive relief and civil penalties. The complaint was filed simultaneously with a Consent Order for Preliminary Injunction that governs the installation of additional pollution control equipment at the dock. This matter relates to previously disclosed enforcement activity initiated by the Ohio Environmental Protection Agency in early 2008. A final Consent Order was entered by the court on August 11, 2011 and a penalty in excess of $100,000 was paid. The outcome of this proceeding did not have a material effect on NS’ financial position, results of operations, or liquidity.
On November 6, 2007, various antitrust class actions filed against NSus and other Class 1I railroads in various Federal district courts regarding fuel surcharges were consolidated in the District of Columbia by the Judicial Panel on Multidistrict Litigation. NS believesOn June 21, 2012, the court certified the case as a class action. The defendant railroads have appealed such certification, and a decision by the court to either reject the appeal outright or proceed with ruling on its merits is pending. We believe the allegations in the complaints are without merit and intendsintend to vigorously defend the cases. NS doesWe do not believe that the outcome of these proceedings will have a material effect on itsour financial position, results of operations, or liquidity. A lawsuit containing similar allegations against NSus and four other major railroads that was filed on March 25, 2008, in the U.S. District Court for the District of Minnesota was voluntarily dismissed by the plaintiff subject to a tolling agreement entered into in August 2008.
NS previously had outstanding two Notices
We received a Notice of Probable Violation (NPV)(NOV) issued by the PHMSATennessee Department of Environmental Conservation concerning soil runoff in connection with construction of the 5.5-mile locomotive fuel pipeline servingMemphis Regional Intermodal Facility in Rossville, Tennessee. Although we will contest liability and the railroad’s Brosnan Yard in Macon, Georgia. The NPVs were settled by NS’ paymentimposition of any penalties, exceeding $100,000. Resolutionthis matter is described here consistent with SEC rules and requirements concerning governmental proceedings with respect to environmental laws and regulations. We do not believe that the outcome of these claims did notthis proceeding will have a material effect on NS’our financial position, results of operation,operations, or liquidity. In addition, on December 13, 2010, NS made voluntary disclosures to PHMSA regarding potential violations relative to a 5.5-mile pipeline in Goldsboro, North Carolina, that is owned by a wholly owned subsidiary and that supplies jet fuel to the United States Air Force. No further penalties are expected at this time as NS in mid-2011 retained the services of a nationally recognized pipeline operator to operate its Macon Pipeline and the Airforce pipeline.
Item 4. Mine Safety Disclosures
Not applicable.
Executive Officers of the Registrant.Registrant
Norfolk Southern’s
Our executive officers generally are elected and designated annually by the Board of Directors at its first meeting held after the annual meeting of stockholders, and they hold office until their successors are elected. Executive officers also may be elected and designated throughout the year as the Board of Directors considers appropriate. There are no family relationships among theour officers, nor any arrangement or understanding between any officer and any other person pursuant to which the officer was selected. The following table sets forth certain information, as of
at February 1, 2012,2013, relating to the executiveour officers.
Name, Age, Present Position | | Business Experience During Past Five Years |
| | |
| | |
Charles W. Moorman, 59,60,
Chairman, President and
Chief Executive Officer | | Present position since February 1, 2006. |
| | |
Deborah H. Butler, 57,58,
Executive Vice President –
Planning and Chief
Information Officer | | Present position since June 1, 2007.
Served as Vice President – Customer Service from July 1, 2004 to
June 1, 2007. |
| | |
James A. Hixon, 58,59,
Executive Vice President –
Law and Corporate Relations | | Present position since October 1, 2005.
|
| | |
Mark D. Manion, 59,60,
Executive Vice President and
Chief Operating Officer | | Present position since April 1, 2009.
Served as Executive Vice President – Operations from October 1, 2004
|
| | |
John P. Rathbone, 59,60,
Executive Vice President –
Administration Finance and Chief Financial Officer | | Present position since August 1, 2012. Served as Executive Vice President – Administration from October 1, 2004.2004 to August 1, 2012. |
| | |
Donald W. Seale, 59,60,
Executive Vice President and
Chief Marketing Officer | | Present position since April 1, 2006. |
| | |
James A. Squires, 50,51,
Executive Vice President –
Finance and Chief Financial Officer Administration | | Present position since JulyAugust 1, 2007.2012.
Served as Executive Vice President – Finance and Chief Financial Officer from AprilJuly 1, 2007 to
July2007 and as Senior Vice President – Financial Planning from
April 1, 2006 to April 1, 2007.2012. |
| | |
Clyde H. Allison, Jr., 48,49,
Vice President and Controller | | Present position since April 1, 2009.
Served as Assistant Vice President Corporate Accounting from
2009 and as Assistant Vice President
Accounting Operations from June 1, 2006 to February 1, 2008.2009. |
K16
PART II
NORFOLK SOUTHERN CORPORATION AND SUBSIDIARIES (NS)
Item 5. Market for Registrant’s Common Equity, Related Stockholder Matters and Issuer Purchases of Equity Securities
NORFOLK SOUTHERN CORPORATION AND SUBSIDIARIES
STOCK PRICE AND DIVIDEND INFORMATION
Common Stock is owned by 33,38132,347 stockholders of record as of December 31, 20112012 and is traded on the New York Stock Exchange under the symbol “NSC.” The following table shows the high and low sales prices as reported by Bloomberg L.P. on its internet-based service and dividends per share, by quarter, for 20112012 and 2010.2011.
| | | Quarter |
| | | | | | | | | | | | |
2011 | | 1st | | | 2nd | | | 3rd | | | 4th |
| Market Price | | | | | | | | | | | |
| High | $ | 69.56 | | $ | 74.93 | | $ | 76.99 | | $ | 75.75 |
| Low | | 60.38 | | | 66.27 | | | 60.44 | | | 60.01 |
| Dividends per share | | 0.40 | | | 0.40 | | | 0.43 | | | 0.43 |
2010 | | 1st | | | 2nd | | | 3rd | | | 4th |
| Market Price | | | | | | | | | | | |
| High | $ | 56.20 | | $ | 61.15 | | $ | 59.88 | | $ | 62.99 |
| Low | | 46.31 | | | 52.19 | | | 50.50 | | | 58.37 |
| Dividends per share | | 0.34 | | | 0.34 | | | 0.36 | | | 0.36 |
| Quarter |
| |
| | |
| | |
| | |
|
2012 | 1st | | 2nd | | 3rd | | 4th |
Market Price | |
| | |
| | |
| | |
|
High | $ | 78.24 | | $ | 74.41 | | $ | 75.10 | | $ | 67.71 |
Low | | 64.45 | | | 63.67 | | | 63.63 | | | 56.34 |
Dividends per share | | 0.47 | | | 0.47 | | | 0.50 | | | 0.50 |
| |
| | |
| | |
| | |
|
2011 | 1st | | 2nd | | 3rd | | 4th |
Market Price | |
| | |
| | |
| | |
|
High | $ | 69.56 | | $ | 74.93 | | $ | 76.99 | | $ | 75.75 |
Low | | 60.38 | | | 66.27 | | | 60.44 | | | 60.01 |
Dividends per share | | 0.40 | | | 0.40 | | | 0.43 | | | 0.43 |
ISSUER PURCHASES OF EQUITY SECURITIES
| | | | | | | | | (c) Total Number of | | (d) Maximum Number |
| | (a) Total Number | | (b) Average | | Shares (or Units) | | (or Approximate Dollar |
| | of Shares | | Price Paid | | Purchased as Part of | | Value) of Shares (or Units) |
| | (or Units) | | per Share | | Publicly Announced | | that may yet be Purchased |
Period | Purchased(1) | | (or Unit) | | Plans or Programs(2) | | Under the Plans or Programs(2) |
| | | | | | | | | | | | | | | | | | | |
| October 1-31, 2011 | | 2,584,233 | | | $ | 65.30 | | | | 2,577,686 | | | | | 19,163,350 |
| November 1-30, 2011 | | 2,207,760 | | | | 72.62 | | | | 2,201,290 | | | | | 16,962,060 |
| December 1-31, 2011 | | 1,569,107 | | | | 72.12 | | | | 1,564,115 | | | | | 15,397,945 |
| | | | | | | | | | | | | | | | | | | |
| Total | | 6,361,100 | | | | | | | | 6,343,091 | | | | | | | | |
(1)
| | | | | | Total | | Maximum Number | |
| | | | | | Number of | | (or Approximate | |
| | | | | | Shares (or Units) | | Dollar Value) | |
| | Total Number | | Average | | Purchased as | | of Shares (or Units) | |
| | of Shares | | Price Paid | | Part of Publicly | | that may yet be | |
| | (or Units) | | per Share | | Announced Plans | | Purchased under | |
Period | | Purchased | (1) | | (or Unit) | | or Programs | (2) | | the Plans or Programs | (2) |
| |
|
| | | |
| |
|
| | |
|
|
October 1-31, 2012 | |
| 310,189 | | | $ | 62.31 | |
| 307,000 | | | 48,616,759 |
|
November 1-30, 2012 | |
| 2,029,148 | | | | 58.70 | |
| 2,029,148 | | | 46,587,611 |
|
December 1-31, 2012 | |
| 2,917 | | | | 61.55 | |
| - | | | 46,587,611 |
|
| | | | | | | | | | | | | | |
Total | |
| 2,342,254 | | | |
| |
| 2,336,148 | | |
|
|
(1) | Of this amount, 18,0096,106 represents shares tendered by employees in connection with the exercise of stock options under the Long-termstockholder-approved Long-Term Incentive Plan. |
(2) | On November 22, 2005, theOur Board of Directors authorized a share repurchase program, pursuant to which up to 50125 million shares of Common Stock could be purchased through December 31, 2015.2014. On March 27, 2007, the Board of Directors amended the program and increased the number of shares that may be repurchased to
75 million, and shortened the repurchase term by five years to December 31, 2010. On July 27, 2010, NS’August 1, 2012, our Board of Directors authorized the repurchase of up to an additional 50 million shares of Common Stock through December 31, 2014.2017. |
K17
Item 6. Selected Financial Data
NORFOLK SOUTHERN CORPORATION AND SUBSIDIARIES
FIVE-YEAR FINANCIAL REVIEW
| | | | | 2011 | | | 2010 | | | 2009 | | | 2008 | | | 2007 |
| | | | | ($ in millions, except per share amounts) |
| | | | | | | | | | | | | | | | | |
| RESULTS OF OPERATIONS | | | | | | | | | | | | | | | | |
Railway operating revenues | | | $ | 11,172 | | $ | 9,516 | | $ | 7,969 | | $ | 10,661 | | $ | 9,432 |
| Railway operating expenses | | | | 7,959 | | | 6,840 | | | 6,007 | | | 7,577 | | | 6,847 |
| Income from railway operations | | | | 3,213 | | | 2,676 | | | 1,962 | | | 3,084 | | | 2,585 |
| | | | | | | | | | | | | | | | | |
| Other income - net | | | | 160 | | | 153 | | | 127 | | | 110 | | | 93 |
| Interest expense on debt | | | | 455 | | | 462 | | | 467 | | | 444 | | | 441 |
| Income before income taxes | | | | 2,918 | | | 2,367 | | | 1,622 | | | 2,750 | | | 2,237 |
| | | | | | | | | | | | | | | | | |
| Provision for income taxes | | | | 1,002 | | | 871 | | | 588 | | | 1,034 | | | 773 |
| Net income | | | $ | 1,916 | | $ | 1,496 | | $ | 1,034 | | $ | 1,716 | | $ | 1,464 |
| | | | | | | | | | | | | | | | | |
| PER SHARE DATA | | | | | | | | | | | | | | | | |
| Net income - basic | | | $ | 5.52 | | $ | 4.06 | | $ | 2.79 | | $ | 4.58 | | $ | 3.73 |
| - diluted | | | | 5.45 | | | 4.00 | | | 2.76 | | | 4.52 | | | 3.68 |
| Dividends | | | | 1.66 | | | 1.40 | | | 1.36 | | | 1.22 | | | 0.96 |
| Stockholders’ equity at year end | | | | 30.00 | | | 29.85 | | | 28.06 | | | 26.23 | | | 25.64 |
| | | | | | | | | | | | | | | | | |
| FINANCIAL POSITION | | | | | | | | | | | | | | | | |
| Total assets | | | $ | 28,538 | | $ | 28,199 | | $ | 27,369 | | $ | 26,297 | | $ | 26,144 |
| Total debt | | | | 7,540 | | | 7,025 | | | 7,153 | | | 6,667 | | | 6,368 |
| Stockholders’ equity | | | | 9,911 | | | 10,669 | | | 10,353 | | | 9,607 | | | 9,727 |
| | | | | | | | | | | | | | | | | |
| OTHER | | | | | | | | | | | | | | | | |
| Property additions | | | $ | 2,160 | | $ | 1,470 | | $ | 1,299 | | $ | 1,558 | | $ | 1,341 |
| | | | | | | | | | | | | | | | | |
| Average number of shares outstanding (thousands) | | | | 345,484 | | | 366,522 | | | 367,077 | | | 372,276 | | | 389,626 |
| Number of stockholders at year end | | | | 33,381 | | | 35,416 | | | 37,486 | | | 35,466 | | | 36,955 |
| Average number of employees: | | | | | | | | | | | | | | | | |
| Rail | | | | 29,933 | | | 28,160 | | | 28,173 | | | 30,241 | | | 30,336 |
| Nonrail | | | | 396 | | | 399 | | | 420 | | | 468 | | | 470 |
| Total | | | | 30,329 | | | 28,559 | | | 28,593 | | | 30,709 | | | 30,806 |
| 2012 | | 2011 | | 2010 | | 2009 | | 2008 |
| ($ in millions, except per share amounts) |
RESULTS OF OPERATIONS | |
| | |
| | |
| | |
| | |
|
Railway operating revenues | $ | 11,040 | | $ | 11,172 | | $ | 9,516 | | $ | 7,969 | | $ | 10,661 |
Railway operating expenses | | 7,916 | | | 7,959 | | | 6,840 | | | 6,007 | | | 7,577 |
Income from railway operations | | 3,124 | | | 3,213 | | | 2,676 | | | 1,962 | | | 3,084 |
| |
| | |
| | |
| | |
| | |
|
Other income – net | | 129 | | | 160 | | | 153 | | | 127 | | | 110 |
Interest expense on debt | | 495 | | | 455 | | | 462 | | | 467 | | | 444 |
Income before income taxes | | 2,758 | | | 2,918 | | | 2,367 | | | 1,622 | | | 2,750 |
| |
| | |
| | |
| | |
| | |
|
Provision for income taxes | | 1,009 | | | 1,002 | | | 871 | | | 588 | | | 1,034 |
| | | | | | | | | | | | | | |
Net income | $ | 1,749 | | $ | 1,916 | | $ | 1,496 | | $ | 1,034 | | $ | 1,716 |
| |
| | |
| | |
| | |
| | |
|
PER SHARE DATA | |
| | |
| | |
| | |
| | |
|
Net income | – basic | $ | 5.42 | | $ | 5.52 | | $ | 4.06 | | $ | 2.79 | | $ | 4.58 |
| – diluted | | 5.37 | | | 5.45 | | | 4.00 | | | 2.76 | | | 4.52 |
Dividends | | 1.94 | | | 1.66 | | | 1.40 | | | 1.36 | | | 1.22 |
Stockholders' equity at year end | | 31.08 | | | 30.00 | | | 29.85 | | | 28.06 | | | 26.23 |
| |
| | |
| | |
| | |
| | |
|
FINANCIAL POSITION | |
| | |
| | |
| | |
| | |
|
Total assets | $ | 30,342 | | $ | 28,538 | | $ | 28,199 | | $ | 27,369 | | $ | 26,297 |
Total debt | | 8,682 | | | 7,540 | | | 7,025 | | | 7,153 | | | 6,667 |
Stockholders' equity | | 9,760 | | | 9,911 | | | 10,669 | | | 10,353 | | | 9,607 |
| |
| | |
| | |
| | |
| | |
|
OTHER | |
| | |
| | |
| | |
| | |
|
Property additions | $ | 2,241 | | $ | 2,160 | | $ | 1,470 | | $ | 1,299 | | $ | 1,558 |
| |
| | |
| | |
| | |
| | |
|
Average number of shares outstanding (thousands) | | 320,864 | | | 345,484 | | | 366,522 | | | 367,077 | | | 372,276 |
Number of stockholders at year end | | 32,347 | | | 33,381 | | | 35,416 | | | 37,486 | | | 35,466 |
Average number of employees: | |
| | |
| | |
| | |
| | |
|
Rail | | 30,543 | | | 29,933 | | | 28,160 | | | 28,173 | | | 30,241 |
Nonrail | | 400 | | | 396 | | | 399 | | | 420 | | | 468 |
| | | | | | | | | | | | | | |
Total | | 30,943 | | | 30,329 | | | 28,559 | | | 28,593 | | | 30,709 |
| |
| | |
| | |
| | |
| | |
|
See accompanying Consolidated Financial Statementsconsolidated financial statements and notes thereto.
Item 7. Management’s Discussion and Analysis of Financial Condition and Results of Operations
Norfolk Southern Corporation and Subsidiaries
Management’s Discussion and Analysis of
Financial Condition and Results of Operations
The following discussion and analysis should be read in conjunction with the Consolidated Financial Statements and Notes and the Selected Financial Data.
OVERVIEW
With globalOVERVIEW
We are one of the nation’s premier transportation companies. Our Norfolk Southern Railway Company subsidiary operates approximately 20,000 miles of road in 22 states and domestic economiesthe District of Columbia, serves every major container port in the eastern United States, and provides efficient connections to other rail carriers. We operate the most extensive intermodal network in the East and are a major transporter of coal, automotive, and industrial products. In 2012, as part of our Crescent Corridor initiative, we opened the new Memphis Regional Intermodal Facility in Rossville, TN as well as the new Birmingham Regional Intermodal Facility in McCalla, AL, in order to position ourselves to handle increased intermodal volumes faster and more reliably.
Financial results for 2012 were adversely affected as utility coal volumes declined, reflecting pent-upcompetition from low natural gas prices and reduced electrical demand NS’ net income grew for the second consecutive year. NS’ 2011 net income rose 28% as a result of a 20% increase in income from railway operations and a lower effective income tax rate. Railway operating revenues increased 17% as a result of higherNS-served regions. In addition, export coal average revenue per unit (including fuel surcharges)dropped, a result of market-based pricing pressure. These decreases more than offset gains in our intermodal and increased traffic volume. Railwaymerchandise sectors, resulting in a 1% decline in railway operating expenses increased 16%revenues, reflecting higher fuel prices and increased traffic volume. Thewhich more than offset the 1% reduction in railway operating expenses. As a result, the railway operating ratio (a measure of the amount of operating revenues consumed by operating expenses) improvedrose to 71.2%71.7%, as compared with 71.9%71.2% in 2010.2011, and net income declined 9%.
Cash provided by operating activities totaled $3.2$3.1 billion which, along with proceeds from borrowings and cash on hand, and proceeds from borrowings allowed for property additions, share repurchases, dividend payments, and debt repayments, and dividend payments.repayments. During 2011, 30.2 million shares of Common Stock were2012, we repurchased at a total cost of $2.1 billion. Since inception of the stock repurchase program in 2006, NS has repurchased and retired 109.618.8 million shares of Common Stock at a total cost of $6.2$1.3 billion. Since inception of our stock repurchase program in 2006, we have repurchased and retired 128.4 million shares of Common Stock at a total cost of $7.5 billion. At December 31, 2011,2012, cash, cash equivalents, and short-term investments totaled $301$668 million.
Looking forward to 2012, NS expects
In 2013, we expect revenues to increase, reflecting higher traffic volumes but at a more moderate pace than seen in 2011 given the slow-growing economy, and higher average revenue per unit that will meet or slightly exceed the rate of rail inflation. NS plansvolumes. We plan to continue to focus on safety, improving servicecost control, increased productivity, improved serviced levels and operational efficiency, and maintaining aan ongoing market-based approach to pricing.
SUMMARIZED RESULTS OF OPERATIONS
2011
2012 Compared with 2010with 2011
Net income in 20112012 was $1.7 billion, or $5.37 per diluted share, down $167 million, or 9%, compared with $1.9 billion, or $5.45 per diluted share, up $420 million, or 28%, compared with $1.5 billion, or $4.00 per diluted share, in 2010.2011. The increasedecrease in net income was primarily due to higherlower income from railway operations, lower nonoperating income items, higher interest expense on debt, and a lowerhigher effective income tax rate (see Note(Note 3). Railway operating revenues increased $1.7 billion,decreased modestly, $132 million, reflecting higherlower average revenue per unit, including fuel surcharges, and higher traffic volumes.surcharges. Railway operating expenses increased
$1.1 billion, principally duealso decreased modestly, $43 million, largely driven by the absence of the $58 million unfavorable arbitration ruling in 2011 and declines related to network efficiency and productivity gains, offset by higher fuel pricesdepreciation and intermodal volume-related expenses.
Oil prices affect NS’our results of operations in a variety of ways and can have an overall favorable or unfavorable impact in any particular period. In addition to the impact of oil prices on general economic conditions and traffic volume, oil prices directly affect NS’our revenues through market-based fuel surcharges and contract escalators (see “Railway Operating Revenues”) and also affect fuel costs (see “Railway Operating Expenses”). For 2011,2012, excluding the impact of increaseddecreased consumption, the increase in fuel surcharge revenue was greaterless than the increase in fuel expense. Future changes in oil prices may cause volatility in operating results that could be material to a particular year or quarter.
2010
2011 Compared with 20092010
Net income in 20102011 was $1.5$1.9 billion, or $5.45 per diluted share, up $420 million, or 28%, compared with
$1.5 billion, or $4.00 per diluted share, up $462 million, or 45%, compared with $1.0 billion, or $2.76 per diluted share, in 2009.2010. The increase in net income was primarily due to higher income from railway operations that was offset in part by higher income taxes (see Noteand a lower effective tax rate (Note 3). Railway operating revenues increased $1.5$1.7 billion, reflecting higher traffic volumes and higher average revenue per unit, including fuel surcharges.surcharges, and higher volumes. Railway operating expenses increased $833 million,$1.1 billion, primarily due to higher fuel prices and volume-related expenses and fuel prices.expenses.
K19
DETAILED RESULTS OF OPERATIONS
Railway OperatingOperating Revenues
Railway operating revenues were $11.0 billion in 2012, $11.2 billion in 2011, and $9.5 billion in 2010, and $8.0 billion in 2009.2010. The following table presents a three-year comparison of revenues, volumes, and average revenue per unit by market group.
| | | Revenues | | Units | | | Revenue per Unit |
| | | 2011 | | | 2010 | | | 2009 | | 2011 | | 2010 | | 2009 | | | 2011 | | | 2010 | | | 2009 | |
| | | ($ in millions) | | (in thousands) | | | ($ per unit) |
| | | | | | | | | | | | | | | | | | | | | | | | | |
| Coal | $ | 3,458 | | $ | 2,719 | | $ | 2,264 | | 1,619.6 | | 1,556.7 | | 1,418.5 | | $ | 2,135 | | $ | 1,747 | | $ | 1,596 | |
| General merchandise: | | | | | | | | | | | | | | | | | | | | | | | | |
| Agr./consumer/gov’t. | | 1,439 | | | 1,326 | | | 1,181 | | 599.4 | | 627.7 | | 563.3 | | | 2,400 | | | 2,113 | | | 2,097 | |
| Chemicals | | 1,368 | | | 1,302 | | | 1,056 | | 373.7 | | 406.1 | | 345.0 | | | 3,662 | | | 3,207 | | | 3,061 | |
| Metals/construction | | 1,241 | | | 1,013 | | | 745 | | 665.0 | | 628.4 | | 504.2 | | | 1,867 | | | 1,612 | | | 1,478 | |
| Automotive | | 780 | | | 648 | | | 527 | | 332.2 | | 290.4 | | 289.4 | | | 2,348 | | | 2,232 | | | 1,821 | |
| Paper/clay/forest | | 756 | | | 712 | | | 666 | | 314.3 | | 327.7 | | 306.4 | | | 2,404 | | | 2,171 | | | 2,172 | |
| General merchandise | | 5,584 | | | 5,001 | | | 4,175 | | 2,284.6 | | 2,280.3 | | 2,008.3 | | | 2,444 | | | 2,193 | | | 2,079 | |
| | | | | | | | | | | | | | | | | | | | | | | | | |
| Intermodal | | 2,130 | | | 1,796 | | | 1,530 | | 3,210.5 | | 2,927.1 | | 2,530.5 | | | 663 | | | 614 | | | 605 | |
| | | | | | | | | | | | | | | | | | | | | | | | | |
| Total | $ | 11,172 | | $ | 9,516 | | $ | 7,969 | | 7,114.7 | | 6,764.1 | | 5,957.3 | | $ | 1,570 | | $ | 1,407 | | $ | 1,338 | |
| Revenues | | Units | | Revenue per Unit |
| 2012 | | 2011 | | 2010 | | 2012 | | 2011 | | 2010 | | 2012 | | 2011 | | 2010 |
| ($ in millions) | | (in thousands) | | ($ per unit) |
| |
| | |
| | |
| |
| |
| |
| | |
| | |
| | |
|
Coal | $ | 2,879 | | $ | 3,458 | | $ | 2,719 | | 1,414.1 | | 1,619.6 | | 1,556.7 | | $ | 2,036 | | $ | 2,135 | | $ | 1,747 |
General merchandise: | |
| | |
| | |
| |
| |
| |
| | |
| | |
| | |
|
Chemicals | | 1,467 | | | 1,368 | | | 1,302 | | 388.8 | | 373.7 | | 406.1 | | | 3,772 | | | 3,662 | | | 3,207 |
Agr./consumer/gov’t. | | 1,446 | | | 1,439 | | | 1,326 | | 595.9 | | 599.4 | | 627.7 | | | 2,427 | | | 2,400 | | | 2,113 |
Metals/construction | | 1,335 | | | 1,241 | | | 1,013 | | 669.7 | | 665.0 | | 628.4 | | | 1,993 | | | 1,867 | | | 1,612 |
Automotive | | 897 | | | 780 | | | 648 | | 374.6 | | 332.2 | | 290.4 | | | 2,395 | | | 2,348 | | | 2,232 |
Paper/clay/forest | | 775 | | | 756 | | | 712 | | 305.8 | | 314.3 | | 327.7 | | | 2,536 | | | 2,404 | | | 2,171 |
General merchandise | | 5,920 | | | 5,584 | | | 5,001 | | 2,334.8 | | 2,284.6 | | 2,280.3 | | | 2,536 | | | 2,444 | | | 2,193 |
| | | | | | | | | | | | | | | | | | | | | | | |
Intermodal | | 2,241 | | | 2,130 | | | 1,796 | | 3,358.3 | | 3,210.5 | | 2,927.1 | | | 667 | | | 663 | | | 614 |
| | | | | | | | | | | | | | | | | | | | | | | |
Total | $ | 11,040 | | $ | 11,172 | | $ | 9,516 | | 7,107.2 | | 7,114.7 | | 6,764.1 | | $ | 1,553 | | $ | 1,570 | | $ | 1,407 |
| |
| | |
| | |
| |
| |
| |
| | |
| | |
| | |
|
Revenues decreased $132 million in 2012, but increased $1.7 billion in 2011 and $1.5 billion in 2010.2011. As reflected in the table below, the decrease in 2012 was due to lower average revenue per unit (as the negative effects of changes in the mix of traffic offset rate increases and slightly higher fuel surcharges) and slightly lower volume. The increase in 2011 was due to higher average revenue per unit (which was driven by rate increases and higher fuel surcharges, offset in part by the effects of changes in the mix of traffic)business) and increased traffic volumes. The increase in 2010 was due to increased traffic volumes and higher average revenue per unit, which was driven by higher fuel surcharges and rate increases, offset in part by the effects of changes in the mix of traffic. Fuel surcharge revenue amounted toincreased $23 million in 2012 and $531 million in 2011, and totaled $1.3 billion in 2011, compared with $724 million in 2010, and $370 million in 2009.both years. If fuel prices remain at or near year-end 20112012 levels, fuel surcharge revenue will be higherlower in 2012.2013.
Many of NS’our negotiated fuel surcharges for coal and general merchandise trafficshipments are based on the monthly average price of West Texas Intermediate Crude Oil (WTI Average Price). These surcharges are reset the first day of each calendar month based on the WTI Average Price for the second preceding calendar month. This two-month lag in applying WTI Average Price increased fuel surcharge revenue by approximately $39 million in 2012, but decreased fuel surcharge revenue by approximately $44 million in 2011 and $28 million in 2010, and
$50 million in 2009.2010.
| | Revenue Variance Analysis |
| | Increases |
| | | |
| | 2011 vs. 2010 | 2010 vs. 2009 |
| | | | ($ in millions) | | |
| | | | | | | | | | | |
| Revenue per unit | | $ | 1,163 | | | | $ | 468 | | |
| Traffic volume (units) | | | 493 | | | | | 1,079 | | |
| Total | | $ | 1,656 | | | | $ | 1,547 | | |
K20
| Revenue Variance Analysis |
| Increase (Decrease) |
| |
| | | |
|
| 2012 vs. 2011 | | | 2011 vs. 2010 |
| ($ in millions) |
| |
| | | |
|
Revenue per unit | $ | (120) | | | $ | 1,163 |
Traffic volume (units) | | (12) |
|
|
| 493 |
| | | | | | | | |
Total | $ | (132) | | | $ | 1,656 |
For 2012, the unfavorable revenue per unit variance accounted for 91% of the total revenues decrease, reflecting the negative effect of changes in the mix of business, offset in part by higher rates. The slightly unfavorable volume variance was a reflection of lower coal, paper/clay/forest products, and agriculture/consumer products/government shipments, which offset gains in the automotive, intermodal, chemicals, and metals/construction commodity groups.
In 2011, the favorable revenue per unit variance accounted for 70% of the total revenues increase, reflecting higher rates and increased fuel surcharges, offset in part by the effects of changes in the mix of traffic.mix. The favorable volume variance reflected increases for all commodity groups, except chemicals, agriculture/consumer products/government, and paper/clay/forest products, driven primarily by increased consumer demand.
In 2010, the favorable volume variance accounted for 70%
One of the total revenues increase, reflecting traffic volume improvements in all commodity groups. Volumes increased by 806,800 units, or 14%, reflecting the strengthening of the economy. The favorable revenue per unit variance reflected increased fuel surcharges and higher rates, offset in part by the effects of changes in the mix of traffic.
Two of NS’our customers, DuPont, and South Mississippi Electric Power Association (SMEPA), filedhas a rate reasonableness complaints atcomplaint pending before the Surface Transportation Board (STB)STB alleging that the NSour tariff rates for transportation of regulated movements are unreasonable. NS disputes these allegations, however, in August 2011, NS agreed to settle the rate reasonableness complaint with SMEPA. Settlement ofWe dispute this claim did not have a material effect on NS’ financial position, results of operations, or liquidity.allegation. Since June 1, 2009, in the case of DuPont, NS haswe have been billing and collecting from DuPont amounts based on the challenged tariff rates. ManagementWe presently expectsexpect resolution of the DuPont case to occur in 20132014 and believesbelieve the estimate of reasonably possible loss will not have a material effect on NS’our financial position, results of operations, or liquidity. With regard to rate cases, management recordswe record adjustments to revenues in the periods, if and when, such adjustments are probable and estimable.
COAL revenues decreased $579 million, or 17%, compared with 2011, reflecting a 13% decrease in carload volume primarily due to fewer shipments of utility coal. Coal average revenue per unit was down 5%, the result of lower pricing (mainly market-based export metallurgical coal) and decreased fuel surcharge revenue, partially offset by the positive effect of changes in mix.
In 2011, coal revenues increased $739 million, or 27%, compared with 2010, reflecting higher average revenue per unit and a 4% increase in volume principally due to a rise in domestic and global steel production. Coal average revenue per unit was up 22%, compared with 2010, reflecting improved pricing and increased fuel surcharge revenue.
In 2010, coal revenues increased $455 million, or 20%, compared with 2009, reflecting higher average revenue per unit and a 10% increase in volume principally due to a rise in domestic and global steel production. Coal average revenue per unit was up 9% compared with 2009, reflecting increased fuel surcharge revenue and improved pricing.
For 2012,2013, coal revenues are expected to increasedecrease due to higherlower average revenue per unit driven by continued market-based pricing improvement,pressure in additionthe export coal market. Coal carload volumes are also anticipated to increased volumes as a result of more shipments of export coal.be lower in 2013.
Coal represented 31%26% of NS’our revenues in 20112012 and 80% of shipments handled originated on NS’our lines. As shown in the following table, tonnage increaseddecreased in three of the foureach coal markets.market.
| | | Coal Tonnage by Market |
| | | | | | | | |
| | | 2011 | | 2010 | | 2009 | |
| | | (tons in thousands) | |
| | | | | | | | |
| Utility | | 122,004 | | 120,737 | | 120,278 | |
| Export | | 28,461 | | 22,750 | | 17,885 | |
| Domestic metallurgical | | 19,702 | | 19,771 | | 11,848 | |
| Industrial | | 7,713 | | 7,573 | | 7,509 | |
| Total | | 177,880 | | 170,831 | | 157,520 | |
| Coal Tonnage by Market |
|
|
|
|
|
|
| 2012 | | 2011 | | 2010 |
| (tons in thousands) |
|
|
|
|
|
|
Utility | 101,636 |
| 122,004 |
| 120,737 |
Export | 28,304 |
| 28,461 |
| 22,750 |
Domestic metallurgical | 18,793 |
| 19,702 |
| 19,771 |
Industrial | 7,376 |
| 7,713 |
| 7,573 |
| | | | | |
Total | 156,109 |
| 177,880 |
| 170,831 |
Utility coal tonnage dropped 17% in 2012, reflecting competition from low natural gas prices and reduced electrical demand in NS-served regions. Additional tonnage declines resulted from coal plant closures and plant maintenance.
In 2011, utility coal tonnage improved a modest 1% in 2011,, primarily a result of new business and the resumption in the first quarter of shipments to electrical generation units that had been idled since the first quarter ofin 2009. These increases were tempered by the effects of increased natural gas generation due to low natural gas prices, reduced electrical demand in NS servedNS-served regions, and severe weather disruptions in 2011.
K21
In 2010, utility coal tonnage improved slightly as residential demand increased due to severe winter weather and above average summer temperatures on the East Coast. Additionally, electricity demand in the industrial sector was higher. These increases more than offset the effects of low natural gas prices and the diversion of utility coal to the export market.
For 2012,2013, we expect utility coal tonnage to decrease, as new business gains will be more than offset byreflecting the effects of reduced electricity demand as a result of very mild winter weather conditions andplant closures, continued low natural gas prices.prices, and higher-than-normal utility stockpiles.
Export coal tonnage decreased 1% compared to 2011, a reflection of weaker global demand for metallurgical coal used in steel production in NS-served markets, in addition to the negative impact of the return of Australian supply, offset in part by increased thermal shipments. Tonnage handled through Norfolk was down 1.3 million tons, or 6%, whereas tonnage through Baltimore increased 0.3 million tons, or 4%. Other export tonnage handled increased 0.8 million tons.
In 2011, export coal tonnage increased 25% compared towith 2010, reflecting increased global demand for coal used in steel production and tightened supply from Australia due to flooding in the first half of 2011. Tonnage handled through Norfolk was up 4.7 million tons, or 30%, and Baltimore tonnage handled increased 0.8 million tons, or 11%.
In 2010, export coal tonnage increased 27% compared with 2009, reflecting increased global demand for coal used in steel production. Tonnage handled through Norfolk was up 1.3 million tons, or 9%, and Baltimore tonnage handled increased 3.5 million tons, or 97%.
For 2012,2013, export coal tonnage is expected to increasedecrease as a result of sluggish demand from Europe partially offset by improvement in Asia beginning in the second half of 2013.
Domestic metallurgical coal tonnage was down 5% in 2012, compared with 2011, as declines in coke and iron ore shipments (primarily due to port capacity improvement projects, new coala plant closure) offset improved domestic steel production driven by planned mine expansions and worldwide demand, and new steam coal opportunities to Europe and Asia.experienced in the first half of 2012.
Domestic metallurgical coal tonnage was flat in 2011, compared with 2010.
In 2010, domestic metallurgical coal tonnage increased 67% compared with 2009, as domestic steel production improved due to an increase in steel demand as blast furnaces resumed operations.
For 2012,2013, domestic metallurgical coal tonnage is expected to decrease as greater coking coal availability in the second half of 2011 leddomestic steel production continues to inventory replenishment in late 2011 and anticipated lesser 2012 demand for domestic metallurgical coal.decelerate.
Industrial coal tonnage decreased 4% in 2012, compared with 2011, as weak industrial demand was partially offset by new business.
In 2011, industrial coal tonnage increased 2% in 2011, compared withto 2010, as new business completely offset the impact of tight coal supply and network delays experienced in the early part of the year.
In 2010, industrial coal tonnage increased 1% compared to 2009, primarily due to new business and increased demand in the steel market.
For 2012,2013, new business is expected to drive increases in industrial coal tonnage.
GENERAL MERCHANDISE revenues in 2012 increased $336 million, or 6%, compared with 2011, reflecting a 4% rise in average revenue per unit as a result of higher rates and fuel surcharges. Carload volume increased 2%.
In 2011, general merchandise revenues increased $583 million, or 12%, compared with 2010, reflecting an
11% rise in average revenue per unit as a result of higher rates and increased fuel surcharges. Overall, trafficcarload volume was relatively flat.
In 2010, general merchandise
Chemicals revenues in 2012 increased $826 million, or 20%7%, compared with 2009,2011, reflecting 4% growth in volume and a 3% increase in average revenue per unit that resulted from higher rates and fuel surcharges. The volume improvement was primarily the result of more carloads of crude oil from the Bakken and Canadian oil fields. Additionally, there were more carloads of liquefied petroleum gas, as well as higher shipments of plastics driven by greater demand for plastic bottles. These increases were offset in part by fewer shipments of rock salt as a mild winter resulted in higher inventory levels throughout 2012.
In 2011, chemicals revenues grew 5%, compared with 2010, as a 14% increase in trafficaverage revenue per unit that resulted from higher rates and fuel surcharges more than offset the effects of an 8% decrease in volume. The decline in volume was primarily a result of reduced shipments of fly ash, due to the completion of the Tennessee Valley Authority ash project in the fourth quarter of 2010.
For 2013, chemicals revenues are anticipated to increase as a result of higher shipments of crude oil, as well as more carloads of plastics linked to the projected resurgence of the housing market and continued growth in the automotive market. Additionally, average revenue per unit is expected to be higher.
Agriculture, consumer products, and government revenues were relatively flat in 2012, compared with 2011, as higher average revenue per unit was offset by lower volume. The volume decline was driven by reduced corn shipments (due to plant closures), fewer carloads of fertilizer (led by certain network classification changes), and reduced shipments of wheat to the eastern U.S. (due to customer sourcing changes). These volume declines were offset in part by more shipments of soybean and soybean meal due to a 5%poor South American bean crop, as well as higher shipments of corn-based feed to Texas.
In 2011, agriculture, consumer products, and government revenues increased 9%, compared with 2010, the result of a 14% improvement in average revenue per unit, reflecting increased fuel surcharge revenue and higher rates.
Agriculture, consumer products, and government revenues increased 9% in 2011, compared with 2010, the result of 14% higher average revenue per unit, which reflected increasedhigher rates and higher fuel surcharges. Traffic volumeVolume declined 5% as a result of fewer shipments of fertilizer due to certain network classification changes and reduced shipments of corn to the Midwest due to the impact of a healthier Midwest crop.
In 2010, agriculture, consumer products, and government revenues increased 12%, compared with 2009, due to an 11% increase in traffic volume and a 1% increase in average revenue per unit. The increase in traffic volume was a result of: more shipments of sweeteners and corn due to continued strength in the demand for ethanol; higher fertilizer volumes due to farmers replenishing nutrients to meet increased crop demand; and increased feed volumes due to a strong export market.
For 2012,2013, agriculture, consumer products, and government revenues are expected to improve as a result of increased volumes and higher average revenue per unit reflecting projected growth drivenoffset in part by gains in the ethanol market in addition to more feed product and corn shipments due to slightly improved demand for animal feed.
K22
Chemicals revenues in 2011 increased 5%, compared with 2010, as a 14% increase in average revenue per unit that resulted from increased rates and higher fuel surcharges more than offset the effects of an 8% decrease in traffic volume. The projected decline in volume wasis primarily a result of reduceddue to fewer shipments of fly ash due to the completion of the Tennessee Valley Authority ash project in the fourth quarter of 2010.
In 2010, chemicals revenue increased 23%, compared with 2009, due to an 18% increase in traffic volumefeed and a 5% growth in average revenue per unit, reflecting higher rates and increased fuel surcharges. Volume gains reflected new business of fly ash in addition to higher shipments of petroleum, industrial intermediates, plastics, and miscellaneous chemicals resulting from improvements in the economy.
For 2012, chemicals revenues are anticipated to increasecorn as a result of higher shipmentsthe negative impact of crude oil from the 2012 Midwest destined for eastern refineries and more carloadsdrought, in addition to fewer revenue movements of liquefied petroleum gas as a previously idled refinery restarts. Improvements in the economy are also expected to generate higher plastic volumes. Additionally, average revenue per unitempty equipment, which is expected to be higher.offset in part by more fertilizer carloads.
Metals and construction revenues increased 23%8% in 2011,2012, compared with 2010.2011. The revenue improvement resulted from 16%7% higher average revenue per unit, which reflected increasedhigher rates and higher fuel surcharges. Traffic volumeVolume improved 1%, reflecting more coil steel shipments driven by increased automotive production. The mild winter weather experienced in early and late 2012 led to more shipments of cement for construction projects. There were also higher shipments of fractionating sand for natural gas drilling. These increases were partially offset by fewer
aggregates carloads, primarily driven by weak market conditions in road/highway construction, and as lower coal utility burn led to fewer shipments of scrubber stone.
In 2011, metals and construction revenues increased 23%, compared with 2010. The improvement resulted from 16% growth in average revenue per unit, which reflected higher rates and fuel surcharges. Volume improved 6%, reflecting increased automotive production that led to more shipments of coil steel and more shipmentscarloads of fractionating sand for natural gas drilling.
In 2010, metals and construction revenues increased 36%, reflecting a 25% increase in traffic volume and a 9% increase in average revenue per unit, driven by pricing gains and increased fuel surcharges. The increase in traffic volume was principally due to more shipments of coil, iron and steel, and scrap metal due to increased steel and automotive production, as well as higher shipments of fractionating sand for natural gas drilling.
For 2012,2013, metals and construction revenues are expected to be modestlyincrease reflecting higher reflecting continuedaverage revenue per unit and a modest increase in volume due to more shipments of fractionating sand and other materials as a result of expected growth in the natural gas drilling sector and higher metal-related traffic volumessector.
Automotive revenues rose 15%, compared to 2011, reflecting 13% growth in volume due to increased domesticNorth American light vehicle production at NS-served plants and global steel production. Additionally,a 2% improvement in average revenue per unit, is expected to be higher.including fuel surcharges.
Automotive
In 2011, automotive revenues rose 20%, compared to 2010, reflecting a 14% increaserise in traffic volume due to increased domestic production of North American light vehicles and a 5% improvement in average revenue per unit, driven by pricing gains and increasedhigher fuel surcharges.
In 2010, automotive revenues rose 23%, compared to 2009. A network redesign that eliminated reloadings at mixing centers resulted in fewer carloads and higher revenue per unit. Approximately 33,200 carloads were eliminated in 2010 as a result of the design changes in the automotive network. This reduction in carloadings was completely offset by higher volumes associated with the 40% increase in production of North American light vehicles.
For 2012,2013, automotive revenues are expected to modestly increasegrow as a result of volume gains driven by ana continued increase in domestic production of North American light vehicles at NS-served plants, served by NS, in addition to slightly higher average revenue per unit related to rate increases from escalators and contract renegotiations.unit.
Paper, clay and forest products revenues increased 6%3% in 2012, compared with 2011, reflecting a 5% improvement in average revenue per unit due to increased rates, which more than offset the effects of a 3% volume decline. The lower volume was due to reduced shipments of miscellaneous wood driven by the loss of business and fewer carloads of pulp as a result of declining export market demand.
In 2011, paper, clay, and forest products revenues increased 6%, compared with 2010, reflecting an 11% improvement in average revenue per unit due to increasedhigher rates and higher fuel surcharges, which more than offset the effects of thea 4% traffic volume decline. The decline inlower volume was principally due to fewer shipments of wood chips as dryerdrier weather in the Southeast prompted customer sourcing changes, in addition to the closure of a plant in the third quarter of 2011. Reduced shipments of kaolin and newsprint associated with lower demand and the loss of some lower-rated business also impacted the year.year.
In 2010, paper, clay, and forest products revenues increased 7%, compared with 2009. The improvement resulted from a 7% increase in traffic volumes, a reflection of increased pulp board, pulp, kaolin, lumber, and newsprint shipments as a result of improvements in the domestic and global economies.
For 2012,2013, paper, clay, and forest products revenues are expected to be slightlyincrease reflecting higher volumes of lumber as increasedhousing starts continue to improve, in addition to higher average revenue per unit.
INTERMODAL revenues increased $111 million, or 5%, compared with 2011, reflecting 5% growth in volume largely due to increased domestic units resulting from continued highway-to-rail conversions. Average revenue per unit is expected to beimproved 1% as a result of higher fuel surcharges, partially offset by reduced volumeslower pricing.
Domestic volume (which includes truckload and intermodal marketing companies) increased 11%, reflecting continued highway conversions.
Premium business, which includes parcel and less-than-truckload (LTL) carriers, rose 1%, as a result of stronger market demand stays soft.and new business.
K23
INTERMODALInternational traffic volume fell 1%, as the loss of business from a shipping line was partially offset by growth across remaining international customers.
Triple Crown Services (Triple Crown), a service with rail-to-highway trailers, experienced a 1% volume decline, reflecting the elimination of some lower-margin business.
In 2011, intermodal revenues increased $334 million, or 19%, compared with 2010, reflecting a 10% increasegrowth in traffic volume and an 8% improvement in average revenue per unit as a result of higher fuel surcharges and increased rates. In 2011, all intermodal segments experienced volume increases, reflecting a steadily improving economy as well as tight truck capacity. Domestic volume (which includes truckload and intermodal marketing companies’ volumes) increased 15%; international traffic volume improved 5%; premium business which includes parcel and less-than-truckload (LTL) carriers, increasedrose 9%; and Triple Crown Services (Triple Crown), a service with rail-to-highway trailers, experienced agrew 1% growth in volume..
In 2010, intermodal revenues increased $266 million, or 17%, compared with 2009, reflecting a 16% increase in traffic volume and a 1% improvement in average revenue per unit. In 2010, all intermodal segments experienced volume increases, reflecting a steadily improving economy as well as an increase in market demand. Domestic volume increased 27%; international traffic volume improved 7%; premium business increased 16%; and Triple Crown experienced a 5% growth in volume.
For 2012,2013, intermodal revenues are expected to increase due to higher traffic volume and average revenue per unit as a result of an increase instronger market demand and a steadily improving economy.due to continued highway conversions.
Railway Operating Expenses
Railway operating expenses in 2012 were $7.9 billion, down $43 million, or 1% compared to 2011. Expenses in 2011 were $8.0 billion, up $1.1 billion, or 16% compared to 2010. ExpensesThe decrease in 20102012 reflected the absence of last year’s $58 million unfavorable arbitration ruling and lower equipment rents due to gains in network efficiency. These favorable decreases were $6.8 billion, up $833 million, or 14% comparedoffset in part by higher depreciation expense, which resulted from an increased capital base, in addition to 2009.higher purchased services. The increase in 2011 and 2010 werewas primarily due to higher fuel prices, and increased volume-related expenses, while 2011 also reflected a $58 millionand the unfavorable arbitration ruling. The railway operating ratio, which measures the percentage of operating revenues consumed by operating expenses, improved to 71.2% in 2011, compared with 71.9% in 2010 and 75.4% in 2009.
The following table shows the changes in railway operating expenses summarized by major classifications.
| | | Operating Expense Variances |
| | | Increases (Decrease) |
| | | 2011 vs. 2010 | | 2010 vs. 2009 |
| | | ($ in millions) |
| | | | | | | | | | | | | |
| Fuel | | | $ | 510 | | | | | $ | 354 | | |
| Compensation and benefits | | | | 266 | | | | | | 307 | | |
| Materials and other | | | | 167 | | | | | | 116 | | |
| Purchased services and rents | | | | 133 | | | | | | 74 | | |
| Depreciation | | | | 43 | | | | | | (18) | | |
| Net Increase | | | $ | 1,119 | | | | | $ | 833 | | |
Fuel expense, which includes the cost of locomotive fuel as well as other fuel used in railway operations, increased
$510 million, or 47%, in 2011, and increased $354 million, or 49%, in 2010. The increase in 2011 was principally the result of higher fuel prices (locomotive fuel prices rose 37%) which had an impact of $431 million, as well as increased fuel consumption (locomotive fuel consumption grew 8%) which had an impact of $79 million.
| Operating Expense Variances |
| Increase (Decrease) |
| |
| | | |
|
| 2012 vs. 2011 | | | 2011 vs. 2010 |
| ($ in millions) |
| |
| | | |
|
Materials and other | $ | (65) | | | $ | 167 |
Compensation and benefits | | (14) | | | | 266 |
Fuel | | (12) | | | | 510 |
Purchased services and rents | | (6) | | | | 133 |
Depreciation | | 54 | | | | 43 |
| | | | | | | | |
Total | $ | (43) | | | $ | 1,119 |
| |
| | | |
|
The increase in 2010 reflected higher fuel prices (locomotive fuel prices increased 33%) which had an effect of
$271 million, as well as increased fuel consumption (locomotive fuel consumption rose 12%) which had an effect of
$83 million.
K24
Compensation and benefits, which represents 37% of total operating expenses, increased $266 million, or 10%, in 2011. The rise was principally the result of higher:
agreement employee activity levels associated with increased traffic volumes (up $70 million),agreement health and welfare benefit costs for active employees (up $50 million),incentive compensation (up $39 million),payroll taxes (up $37 million),pension expenses (up $19 million), andwage rates (up $16 million).
In 2010, compensation and benefits increased $307 million, or 13%, compared with 2009, primarily due to higher employee activity levels associated with increased traffic volumes (up $88 million); increased health and welfare benefit costs for active and retired employees (up $67 million); increased wage rates (up $51 million); higher incentive and stock-based compensation (up $48 million); increased pension expenses (up $30 million); and higher payroll taxes (up $19 million).
NS employment averaged 30,329 in 2011, compared with 28,559 in 2010, and 28,593 in 2009. The 2011 increase was a result of higher volume demands during the year. Looking forward to 2012, NS expects employment levels to be higher than 2011. Accordingly, NS also expects increased compensation and benefits costs as a result of anticipated volume increases and NS’ emphasis on service, in addition to higher health and welfare benefit costs and wage rates.
Materials and other expenses (including the estimates of costs related to personal injury, property damage, and environmental matters) decreased $65 million, or 7%, in 2012, but increased $167 million, or 22%, in 2011, and increased $116 million, or 18%, in 2010, as shown in the following table.
| | | | 2011 | | | 2010 | | | 2009 | |
| | | | ($ in millions) | |
| | | | | | | | | | | |
| Materials | | $ | 408 | | $ | 346 | | $ | 309 | |
| Casualties and other claims | | | 216 | | | 142 | | | 102 | |
| Other | | | 300 | | | 269 | | | 230 | |
| Total | | $ | 924 | | $ | 757 | | $ | 641 | |
| 2012 | | 2011 | | 2010 |
| ($ in millions) |
| |
| | |
| | |
|
Materials | $ | 408 | | $ | 408 | | $ | 346 |
Casualties and other claims | | 130 | | | 216 | | | 142 |
Other | | 321 | | | 300 | | | 269 |
| | | | | | | | |
Total | $ | 859 | | $ | 924 | | $ | 757 |
The decrease in 2012 reflected the absence of the prior year’s unfavorable arbitration ruling discussed below and more favorable personal injury claims development for prior years’ claims ($34 million). These favorable items were partially offset by higher costs associated with property taxes and environmental remediation.
The increase in 2011 reflected the unfavorable arbitration ruling discussed below and higher costs associated with locomotive and railcar materials, taxes (primarily sales and use, property, and excise), employee travel, and employee travel. The increase for 2011 also reflectedsupply costs, as well as less favorable personal injury claims development and higher supply costs.development.
The increase in 2010 reflected increased locomotive and roadway materials expenses, reduced level of favorable personal injury claims development, the absence of the $21 million favorable settlement of a multi-year state tax dispute that benefited 2009, and higher costs associated with supplies, employee travel, derailments, environmental remediation, and property taxes.
The Consolidated Balance Sheets reflect long-term receivables for estimated recoveries from NS’our insurance carriers for claims associated with the January 6, 2005, derailment in Graniteville, S.C. In the first quarter of 2011, NSwe received an unfavorable ruling for an arbitration claim with an insurance carrier and waswere denied recovery of the contested portion ($43 million) of the claim. As a result, NSwe recorded a $43 million charge during the first quarter of 2011 for the receivables associated with the contested portion of the claim and a $15 million charge for other receivables affected by the ruling for which recovery iswas no longer probable. During the first quarter of 2010, NS settled an arbitration claim ($100 million) with another insurance carrier with no adverse effect on NS’ financial position, results of operations, or liquidity.
K25
The largest component of casualties and other claims expense is personal injury costs. Cases involving occupational injuries comprised about 44%40% of total employee injury cases resolved and about 31%25% of total employee injury payments made. With itsour long-established commitment to safety, NS continueswe continue to work actively to eliminate all employee injuries and to reduce the associated costs. With respect to occupational injuries, which are not caused by a specific accident or event but allegedly result from a claimed exposure over time, the benefits of any existing safety initiatives may not be realized immediately. The majority of these types of claims are being asserted by former or retired employees, some of whom have not been actively employed in the rail industry for decades. The rail industry remains uniquely susceptible to litigation involving job-related accidental injury and occupational claims because of the Federal Employers’ Liability Act (FELA), which is applicable only to railroads. FELA’s fault-based system, which covers employee claims for job-related injuries, produces results that are unpredictable and inconsistent as compared with a no-fault workers’ compensation system.
NS maintains
We maintain substantial amounts of insurance for potential third-party liability and property damage claims. ItWe also retainsretain reasonable levels of risk through self-insurance (see Note(Note 16).
Compensation and benefits, which represents 37% of total operating expenses, decreased $14 million in 2012, reflecting changes in:
• employee activity levels (down $40 million),
• incentive and stock-based compensation (down $35 million),
• pay rates (up $43 million), and
• pension and postretirement benefit costs (up $16 million).
In 2011, compensation and benefits increased $266 million, or 10%, compared with 2010, primarily due to higher:
• agreement employee activity levels associated with increased volumes (up $70 million),
• health and welfare benefit costs for agreement employees (up $50 million),
• incentive compensation (up $39 million),
• payroll taxes (up $37 million),
• pension benefit costs (up $19 million), and
• wage rates (up $16 million).
Our employment averaged 30,943 in 2012, compared with 30,329 in 2011, and 28,559 in 2010. The 2012 increase was a result of additional mechanical and maintenance of way personnel to support field operations. Looking forward to 2013, we expect employment levels to be lower than 2012 as we continue to benefit from productivity increases and operational efficiencies. We also expect increased compensation and benefits costs as a result of higher wage rates.
Fuel expense, which includes the cost of locomotive fuel as well as other fuel used in railway operations, decreased $12 million, or 1%, in 2012, but increased $510 million, or 47%, in 2011. The decline in 2012 was principally the result of lower fuel consumption (locomotive fuel consumption declined 3%), which had an impact of $52 million, offset in part by higher fuel prices (locomotive fuel prices rose 3%), which had an impact of $40 million.
The increase in 2011 reflected higher fuel prices (locomotive fuel prices increased 37%), which had an effect of
$431 million, as well as increased fuel consumption (locomotive fuel consumption rose 8%), which had an effect of $79 million.
Purchased services and rents includes the costs of services purchased from outside contractors, including the net costs of operating joint (or leased) facilities with other railroads and the net cost of equipment rentals. This category of expenses decreased $6 million in 2012, but increased $133 million, or 9%, in 2011 and increased $74 million, or 5%,2011.
| 2012 | | 2011 | | 2010 |
| ($ in millions) |
| |
| | |
| | |
|
Purchased services | $ | 1,321 | | $ | 1,272 | | $ | 1,151 |
Equipment rents | | 283 | | | 338 | | | 326 |
| | | | | | | | |
Total | $ | 1,604 | | $ | 1,610 | | $ | 1,477 |
The increase in 2010.
Purchased2012 for purchased services costs reflected higher professional and consulting fees, intermodal operations expenses, Conrail-related casualty costs ($15 million), and advertising expenses. These increases were $1.3 billionpartially offset by lower haulage expenses. The increase in 2011 $1.2 billion in 2010, and $1.1 billion in 2009. The increases in 2011 and 2010 werewas principally driven by higher costs associated with highergreater volumes.
Equipment rents, which includes theour cost to NS of using equipment (mostly freight cars) owned by other railroads or private owners less the rent paid to NSus for the use of itsour equipment, amounted to $338 million, $326 million,decreased in 2012 as a result of increased velocity and
$316 million for 2011, 2010, and 2009, respectively. The increases improved equipment utilization, whereas the increase in 2011 and 2010 werewas principally due to higher traffic volumes.
Depreciation expense increasedgrew $54 million, or 6%, in 2012, and $43 million, or 5%, in 2011, but decreased $18 million, or 2%, in 2010. The increase in 2011 reflects NS’2011. These increases reflect our larger roadway and equipment capital base as NS continueswe continue to invest in its infrastructure.our infrastructure and rolling stock.
The decrease in 2010 reflected lower depreciation rates that resulted from an equipment study that was completed in the first quarter of 2010 which more than offset the effects of NS’ larger roadway and equipment capital base.
Other Income – Net
Other income – net was $129 million in 2012, $160 million in 2011, and $153 million in 2010 and $127 million in 2009 (see Note(Note 2). The decline in 2012 reflected fewer gains on the sale of property, decreased coal royalties, and higher interest expense (net) on uncertain tax positions offset in part by higher net returns from corporate-owned life insurance (COLI), increased equity in the earnings of Conrail, and higher rental income. During the fourth quarter of 2012, we closed on the sale of certain assets to the Michigan Department of Transportation. The associated gain on the sale has been deferred until we cease to have ongoing obligations associated with the assets, which is expected to occur within the next 12 months.
The increase in 2011 reflected reduced interest expense (net) on uncertain tax positions, (down $9 million), higher net corporate-owned life insuranceCOLI returns, (up $7 million), and increased coal royalties (up $6 million).royalties. The increases were offset in part by fewer gains on the sale of property (down $9 million) and increased professional and legal fees associated with the third quarter debt exchange and the fourth quarter credit facility renewal (up $7 million).
The increase in 2010 reflected higher gains on the sale of property, including a $35 million gain on the sale of land to the City of Virginia Beach, Virginia and a $13 million favorable coal royalty settlement. These increases were offset in part by increased interest expense (net) on uncertain tax positions and other tax contingencies (which includes the absence of 2009 favorable resolution of prior years’ tax matters).
Income Taxes
Income tax expense in 20112012 was $1 billion, for an effective rate of 34%37%, compared with effective rates of34% in 2011 and 37% in 20102010. The increase in the rate for 2012 primarily reflects the absence of the prior year’s favorable resolution of the Internal Revenue Service (IRS) examination of our 2008 return and 36%review of certain claims for refund ($40 million) and the absence of a favorable reduction in 2009.deferred tax expense for state law changes ($28 million). The decrease in the rate for 2011 was primarily due to the favorable resolution of an IRS examination of NS’ 2008 return and review of certain claims for refund ($40 million), a decrease in deferred tax expense for state tax law changes ($28 million),adjustments discussed above and the absence of a first quarter 2010 charge to deferred tax expense ($27 million) due to a change in the tax law impacting the Medicare Part D retiree drug subsidy program. These decreases were offset in part by the absence of a fourth quarter 2010 $34 million benefit resulting from a change in estimate related to NS’for deferred taxes. The increase in the rate for 2010 was primarily due to the Medicare-related charge, a lower benefit from Conrail equity, and an increase in state taxes, offset in part by the $34 million deferred tax benefit mentioned above.
K26
Fifty-percent bonus depreciation was allowed for federal income taxes for 2008 through 2010. In December 2010, the Tax Relief, Unemployment Insurance Reauthorization and Job Creation Act increased bonus depreciation to 100 percent for the period September 2010 through the end of 2011 and allows 50 percentallowed fifty-percent bonus depreciation in 2012. BonusThe American Taxpayer Relief Act of 2012, which was signed into law on January 2, 2013, extended fifty-percent bonus depreciation for an additional year. While bonus depreciation does not affect NS’our total provision for income taxes or effective tax rate, but does significantly lowerthe absence of bonus depreciation after 2013 is expected to increase current income tax expense and the related cash outflows for the payment of income taxes paid.beginning in 2014. The American Taxpayer Relief Act also reinstated certain business tax credits retroactively to January 1, 2012. The effects of changes in tax laws, including retroactive changes, are recognized in the period in which the changes are enacted. Accordingly, we expect to recognize approximately $9 million of income tax benefits in the first quarter of 2013 for these tax law changes.
NS’
IRS examinations have been completed for all years prior to 2011. We expect the IRS will begin auditing our 2011 and 2012 consolidated income tax returns for 2009 and 2010 are undergoing routine audit by the IRS.in late 2013.
FINANCIAL CONDITION, LIQUIDITY, AND CAPITAL RESOURCES
Cash provided by operating activities, NS’ our principal source of liquidity, was $3.2$3.1 billion in 2012 compared with $3.2 billion in 2011 compared with
$2.7and $2.7 billion in 2010 and $1.9 billion2010. The decline in 2009.2012 reflects increased tax payments driven by reduced bonus depreciation, in addition to lower operating results. The improvementincrease in 2011 reflectsreflected better operating results and lower income taxes paid due to additional bonus depreciation. The increase in 2010 reflected improved operating results, in addition to a reduction in working capital components. Operating cash flows in 2010 also benefited from the favorable settlement of an insurance claim related to the 2005 Graniteville derailment. NSWe had working capital of $161 million at December 31, 2012, compared with $50 million at December 31, 2011, compared with working capital of $389 million at December 31, 2010,primarily reflecting a lowerhigher cash balance offset in part byas a result of new debt issued and lower current maturities of long-term debt as no senior notes will matureshare repurchase activity in 2012. NS’ portfolio of cash,Cash, cash equivalents, and short-term investment balances totaled $301$668 million and $1.1 billion$301 million at December 31, 20112012 and 2010,2011, respectively, and waswere invested in accordance with NS’our corporate investment policy as approved by the Board of Directors. The portfolio contains securities that are subject to market risk. There are no limits or restrictions on NS’our access to these assets. NS expects thatWe expect cash on hand combinedcombined with cash provided by operating activities will be sufficient to meet itsour ongoing obligations.
Contractual obligations at December 31, 2011,2012, were comprised of NS’interest on fixed-rate long-term debt (includingand capital leases) (see Noteleases, long-term debt and capital leases (Note 8), operating leases (see Note(Note 9), unconditional purchase obligations (Note 16), agreements with CRC and long-term advances from Conrail (see Note(Note 5), unconditional purchase obligations (see Note 16), and unrecognized tax benefits (see Note(Note 3), were as follows::
| | | | | | | | | | | 2013- | | | | 2015- | 2017 and | | | |
| | | Total | | | | 2012 | | | | 2014 | | | | 2016 | Subsequent | Other |
| | | | | | | | | | | ($ in millions) | | | | | | | | | |
| | | | | | | | | | | | | | | | | | | | | | | | |
| Long-term debt and capital lease principal | $ | 7,440 | | | $ | 50 | | | $ | 492 | | | $ | 501 | | | $ | 6,397 | | | $ | -- | |
| Operating leases | | 585 | | | | 96 | | | | 156 | | | | 72 | | | | 261 | | | | -- | |
| Agreements with CRC | | 408 | | | | 33 | | | | 66 | | | | 66 | | | | 243 | | | | -- | |
| Unconditional purchase obligations | | 603 | | | | 294 | | | | 252 | | | | 23 | | | | 34 | | | | -- | |
| Long-term advances from Conrail | | 133 | | | | -- | | | | -- | | | | -- | | | | 133 | | | | -- | |
| Unrecognized tax benefits* | | 105 | | | | 38 | | | | -- | | | | -- | | | | -- | | | | 67 | |
| Total | $ | 9,274 | | | $ | 511 | | | $ | 966 | | | $ | 662 | | | $ | 7,068 | | | $ | 67 | |
| | | | | 2014 - | | 2016 - | | 2018 and | | |
| Total | | 2013 | | 2015 | | 2017 | | Subsequent | | Other |
| ($ in millions) |
| |
| | |
| | |
| | |
| | | |
| | |
|
Interest on fixed-rate long-term debt | |
| | |
| | |
| | |
| | | |
| | |
|
and capital lease principal | $ | 12,951 | | $ | 503 | | $ | 974 | | $ | 887 | | $ | | 10,587 | | $ | - |
Long-term debt and capital lease principal | | 8,482 | | | 50 | | | 447 | | | 1,050 | | | | 6,935 | | | - |
Operating leases | | 749 | | | 91 | | | 141 | | | 95 | | | | 422 | | | - |
Unconditional purchase obligations | | 560 | | | 385 | | | 108 | | | 37 | | | | 30 | | | - |
Agreements with CRC | | 382 | | | 33 | | | 66 | | | 66 | | | | 217 | | | - |
Long-term advances from Conrail | | 133 | | | - | | | - | | | - | | | | 133 | | | - |
Unrecognized tax benefits* | | 63 | | | - | | | - | | | - | | | | - | | | 63 |
| | | | | | | | | | | | | | | | | | |
Total | $ | 23,320 | | $ | 1,062 | | $ | 1,736 | | $ | 2,135 | | $ | | 18,324 | | $ | 63 |
* When the amount and timing of liabilities for unrecognized tax benefits can be reasonably estimated, the amount is shown in the table under the appropriate period. When the year of settlement cannot be reasonably estimated, the amount is shown in the Other column.
Off balance sheet arrangements consist of obligations related to operating leases, which are included in the table of contractual obligations above and disclosed in Note 9.
K27
Cash used in investing activities was $2.0 billion in 2012, compared with $1.8 billion in 2011, and $1.5 billion in both 2010 and 2009.2010. The increase in 2012 primarily reflects a decrease in investment sales, net of purchases, and increased property additions that were offset in part by proceeds from property sales. The 2011 reflectsincrease resulted from higher property additions offset in part by a decrease in investment purchases. In 2010, higher property additions were offset by lower net investment activity.
Property additions account for most of the recurring spending in this category. The following tables show capital spending (including capital leases) and track and equipment statistics for the past five years.
Property Additions |
| | | | | | | | | | | | | | | | | | | |
| | | 2011 | | | | 2010 | | | | 2009 | | | | 2008 | | | | 2007 |
| | | | | | | ($ in millions) | | | | |
| | | | | | | | | | | | | | | | | | | |
| Road and other property | $ | 1,222 | | | $ | 1,153 | | | $ | 1,128 | | | $ | 1,070 | | | $ | 894 |
| Equipment | | 938 | | | | 317 | | | | 171 | | | | 488 | | | | 447 |
| Total | $ | 2,160 | | | $ | 1,470 | | | $ | 1,299 | | | $ | 1,558 | | | $ | 1,341 |
Property Additions |
| |
| | |
| | |
| | |
| | |
|
| 2012 | | 2011 | | 2010 | | 2009 | | 2008 |
| ($ in millions) |
| |
| | |
| | |
| | |
| | |
|
Road and other property | $ | 1,465 | | $ | 1,222 | | $ | 1,153 | | $ | 1,128 | | $ | 1,070 |
Equipment | | 776 | | | 938 | | | 317 | | | 171 | | | 488 |
| | | | | | | | | | | | | | |
Total | $ | 2,241 | | $ | 2,160 | | $ | 1,470 | | $ | 1,299 | | $ | 1,558 |
Track Structure Statistics (Capital and Maintenance) |
| |
| | |
| | |
| | |
| | | �� |
| 2012 | | 2011 | | 2010 | | 2009 | | 2008 |
| |
| | |
| | |
| | |
| | |
|
Track miles of rail installed | | 509 | | | 484 | | | 422 | | | 434 | | | 459 |
Miles of track surfaced | | 5,642 | | | 5,441 | | | 5,326 | | | 5,568 | | | 5,209 |
New crossties installed (millions) | | 2.6 | | | 2.7 | | | 2.6 | | | 2.7 | | | 2.7 |
Average Age of Owned Railway Equipment |
| |
| | |
| | |
| | |
| | |
|
| 2012 | | 2011 | | 2010 | | 2009 | | 2008 |
| (years) |
| |
| | |
| | |
| | |
| | |
|
Freight cars | | 30.2 | | | 30.3 | | | 31.0 | | | 30.3 | | | 29.9 |
Locomotives | | 21.6 | | | 21.0 | | | 20.5 | | | 19.9 | | | 18.9 |
Retired locomotives | | 41.2 | | | 31.7 | | | 28.4 | | | 31.2 | | | 34.4 |
For 2012, NS has2013, we budgeted $2.4$2.0 billion for property additions. The anticipated spending includes $840$831 million for roadway assets, including the normalized replacement of rail, ties and ballast and the improvement or replacement of bridges. Planned equipment spending of $588$420 million includes new and rebuilt locomotives, rebodying of coal cars, intermodal containers and chassis, and multilevel automobile racks. Investments in facilities and terminals are anticipated to be $322$203 million, primarily forand include intermodal terminals and equipment to add capacity to the intermodal network including(including the Crescent Corridor program,initiative), mechanical service shops and bulk transfer facilities and mechanical service shops. NS hasfacilities. We budgeted $247$229 million for the continued implementation of positive train control (PTC) and expectsexpect additional PTC-related property additions of at least $800$674 million in the years 2013 through2014 and 2015. NSWe also expectsexpect to spend $134$84 million on infrastructure improvements which includeto increase mainline capacity, accommodate business growth and provide our share of funding for various public/private partnership investments for thesuch as Crescent and MidAmerica Corridors, CREATE project,Corridor and the Pan Am Southern venture.Chicago CREATE project. Technology investments of $92$57 million are planned for new or upgraded systems and computers.
K28
The Crescent Corridor consists of a program of projects for infrastructure and other facility improvements geared toward creating a seamless, high-capacity intermodal route spanning 11 states from New Jersey to Louisiana and offering truck-competitive service along several major interstate highway corridors, including I-81, I-85, I-20,
I-40, I-59, I-78, and
I-75. Based on the public benefits that stand to be derived in the form of highway congestion relief, NS planswe plan to implement certain elements of the Crescent Corridor through a series of public-private partnerships. Currently, the Crescent Corridor has received or expects to receive a total of $267$295 million in public capital funding commitments from the Commonwealths of Pennsylvania and Virginia, the stateState of Tennessee, the federal TIGER Stimulus Program and other federal funding sources related to projects in Alabama, Pennsylvania, Tennessee, and North Carolina. NSWith respect to the private funding component, we currently estimatesanticipate spending up to $360$300 million for the substantial completion of work on these projects, which is expected in 2014. Planned 20122013 investments for the Crescent Corridor approximate $128$42 million.
Cash used in financing activities was $694 million in 2012, compared with $2.0 billion in 2011, compared with $1.4and
$1.4 billion in 2010,2010. The change in 2012 reflects lower share repurchases, increased proceeds from borrowings, reduced debt repayments and $31 millionmaturities, offset in 2009.part by higher dividends. The change in 2011 primarily reflectsreflected increased share repurchases, offset in part by higher proceeds from borrowing, net of debt repayments. The change in 2010 reflected the resumed repurchase and retirement of Common Stock as part of NS’ share repurchase program, in addition to lower borrowings, net of debt repayments.
Share repurchases totaled $1.3 billion in 2012, $2.1 billion in 2011, and $863 million in 2010 and zero in 2009 for the purchase and retirement of 18.8 million, 30.2 million, and 14.7 million and zero shares, respectively. On August 1, 2012, our Board of Directors authorized the repurchase of up to an additional 50 million shares of Common Stock through December 31, 2017. The timing and volume of future share repurchases will be guided by management’sour assessment of market conditions and other pertinent factors. Any near-term purchases under the program are expected to be made with internally generated cash, cash on hand, or proceeds from borrowings. As of December 31, 2011, NS2012, we had remaining authority from itsour Board of Directors to repurchase 15.446.6 million shares through
December 31, 2014.2017.
During the fourth quarter of 2011, NS issued $5002012, we issued:
• $600 million of 3.25%3.00% senior notes due 2021 and an additional
2022,
• $100600 million of 6%3.95% senior notes due 2111.2042, and
During the third quarter of 2011, NS issued $600• $600 million of unsecured2.90% senior notes ($596 million at 4.837% due 2041 and
$4 million at 6% due 2111)2023 and paid $146$115 million of premium in cash in exchange for $526$521 million of its previously issued unsecured notes ($422156 million at 7.25% due 2031, $140 million at 5.64% due 2029, $115 million at 5.59% due 2025, $72 million at 7.80% due 2027, and $38 million at 7.05% due 2037, $77 million at 7.9% due 2097, and $27 million at 7.25% due 2031)2037). The exchange premium iswas reflected as a reduction of debt in the 20112012 Consolidated Balance Sheet and reflected within “Debt repayments” in the 2012 Statement of Cash Flows, and will be amortized as additional interest expense over the termsterm of the new debt. No gain or loss was recognized as a result of the debt exchange.
During the second quarter of 2011, NS issued an additional $400 million of 6% senior notes due 2111.
NS’Our debt-to-total capitalization ratio was 47.1% at December 31, 2012, compared with 43.2% at December 31, 2011, compared with 39.7% at December 31, 2010.2011.
As of December 31, 2011, NS has2012, we had authority from itsour Board of Directors to issue an additional $1 billion$600 million of debt or equity securities through public or private sale. NS hasWe have on file with the Securities and Exchange CommissionSEC a Form S-3 automatic shelf registration statement for well-known seasoned issuers under which securities may be issued pursuant to this authority.
In December 2011, NS renewed
We also have in place and amended itsavailable a $750 million, five-year credit agreement expiring in 2016, which provides for borrowings at prevailing rates and includes covenants. The renewed and amended five-year agreement, which expires in 2016, reduced the total amount that can be borrowed from $1 billion to $750 million to more closely match NS’ liquidity requirements. NSWe had no amounts outstanding under this facility at December 31, 2011,2012 and NS isare in compliance with all of its covenants. In October 2011, NS2012, we renewed itsour $350 million accounts receivable securitization program with a 364-day term to run until October 2012.2013. There was $200$300 million outstanding under this program at December 31, 2012 and $200 million outstanding at December 31, 2011 and 2010 (see Note(Note 8).
Looking forward, NS’
Upcoming annual debt maturities are relatively modest (see Note(Note 8). Overall, NS’our goal is to maintain a capital structure with appropriate leverage to support NS’our business strategy and provide flexibility through business cycles.
K29
APPLICATION OF CRITICAL ACCOUNTING ESTIMATES
The preparation of financial statements in accordance with U.S. generally accepted accounting principlesGenerally Accepted Accounting Principles (GAAP) requires managementus to make estimates and assumptions that affect the reported amounts of assets and liabilities, the disclosure of contingent assets and liabilities at the date of the financial statements, and the reported amounts of revenue and expenses during the reporting period. These estimates and assumptions may require significant judgment about matters that are inherently uncertain, and future events are likely to occur that may require managementus to make changes to these estimates and assumptions. Accordingly, managementwe regularly reviewsreview these estimates and assumptions based on historical experience, changes in the business environment, and other factors that management believeswe believe to be reasonable under the circumstances. ManagementWe regularly discussesdiscuss the development, selection, and disclosures concerning critical accounting estimates with the Audit Committee of itsthe Board of Directors.
Pensions and Other Postretirement Benefits
Accounting for pensions and other postretirement benefit plans requires managementus to make several estimates and assumptions (see Note(Note 11). These include the expected rate of return from investment of the plans’ assets, projected increases in medical costs, and the expected retirement age of employees as well as their projected earnings and mortality. In addition, the amounts recorded are affected by changes in the interest rate environment because the associated liabilities are discounted to their present value. Management makesWe make these estimates based on the company’sour historical experience and other information that it deemswe deem pertinent under the circumstances (for example, expectations of future stock market performance). Management utilizesWe utilize an independent actuarial consulting firm’s studies to assist itus in selecting appropriate assumptions and valuing its related liabilities.
Net pension expense, which is included in “Compensation and benefits” in itsthe Consolidated Statements of Income, was $50$60 million for 2011.2012. In recording this amount, NSwe assumed a long-term investment rate of return of 8.75%8.25%, which was supported by the long-term total rate of return on plan assets since inception. A one percentage point change to this rate of return assumption would result in a $16$17 million change in pension expense and, as a result, an equal change in “Compensation and benefits” expense. Changes that are reasonably likely to occur in assumptions concerning retirement age, projected earnings, and mortality would not be expected to have a material effect on NS’our net pension expense or net pension liability in the future. The net pension liability is recorded at its net present value using a discount rate that is based on the current interest rate environment in light of the timing of expected benefit payments. NS utilizesWe utilize analyses in which the projected annual cash flows from the pension and postretirement benefit plans are matched with yield curves based on an appropriate universe of high-quality corporate bonds. NS usesWe use the results of the yield curve analyses to select the discount rates that match the payment streams of the benefits in these plans.
NS’ net
Net cost for other postretirement benefits, which is also included in “Compensation and benefits,” was $101$107 million for 2011.2012. In recording this expense and valuing the net liability for other postretirement benefits, which is included in “Other postretirement benefits,” managementwe estimated future increases in health-carehealthcare costs. These assumptions, along with the effect of a one percentageone-percentage point change in them, are described in Note 11.
Properties and Depreciation
Most of NS’our total assets are long-lived railway properties (see Note(Note 6). As disclosed in Note 1, NS’ properties are depreciated using group depreciation. The primary depreciation method for NS’our asset base is group life. Units of production is the principal method of depreciation for rail in high density corridors and for depletion of natural resources. Remaining properties are depreciated generally using the straight-line method over the lesser of estimated service or lease lives.
NS’ depreciation
Depreciation expense is based on management’s assumptions concerning expected service lives of its properties as well as the expected net salvage that will be received upon their retirement. In developing these assumptions, NS’ management utilizeswe utilize periodic depreciation studies that are performed by an independent outside firm of consulting engineers and approved by the Surface Transportation Board (STB), the regulatory board that has broad jurisdiction over railroad practices. NS’ depreciationSTB. Depreciation studies are conducted about every three years for equipment and every six years for track assets and other roadway property. The frequency of these studies correlates with guidelines established by the STB.
K30
Key factors which are considered in developing average service life and salvage estimates include:
• statistical analyses of historical retirement data and surviving asset records;
• review of historical salvage received and current market rates;
• review of NS’our operations including expected changes in technology, customer demand, maintenance practices and asset management strategies;
• review of accounting policies and assumptions; and
• industry review and analysis.
The units of production depreciation rate for rail in high density corridors is derived based on consideration of annual gross ton miles as compared to the total or ultimate capacity of rail in these corridors. NS’Our experience has shown that traffic density is a leading factor in determination of the expected service life of rail in high density corridors. In developing the respective depreciation rate, consideration is also given to several rail characteristics including age, weight, condition (new or second hand) and type (curve or straight). As a result, a composite depreciation rate is developed which is applied to the depreciable base.
NS’ recent
Recent experience with these studies has been that while they do result in changes in thedepreciation rates, used to depreciate its properties, these changes have not caused a significant effect to its annual depreciation expense. Changes in rates as a result of depreciation studies are implemented prospectively. These studies may also indicate that the recorded amount of accumulated depreciation is deficient (or in excess) of the amount indicated by the study. Any such deficiency (or excess) is amortized as a component of depreciation expense over the remaining service lives of the affected class
of property, as determined by the study. NS’ depreciationDepreciation expense for 2011 amounted to $8622012 totaled $916 million. NS’Our composite depreciation rates for 20112012 are disclosed in Note 6; a one-tenth percentage point increase (or decrease) in these rates would have resulted in a $32$33 million increase (or decrease) to depreciation expense. For 2011,2012, roadway depreciation rates ranged from 0.83% to 33.3% and equipment depreciation rates ranged from 1.32% to 37.84%.
When properties other than land and nonrail assets are sold or retired in the ordinary course of business, the cost of the assets, net of sale proceeds or salvage, is charged to accumulated depreciation, and no gain or loss is recognized in earnings. Actual historical cost values are retired when available, such as with equipment assets. The use of estimates in recording the retirement of certain roadway assets is necessary based on the impracticality of tracking individual asset costs. When retiring rail, ties, and ballast, NS useswe use statistical curves that indicate the relative distribution of the age of the assets retired. The historical cost of other roadway assets is estimated using a combination of inflation indices specific to the rail industry and those published by the U.S. Bureau of Labor Statistics. The indices are applied to the replacement value based on the age of the retired assets. These indices are used because they closely correlate with the costs of roadway assets. Gains and losses on disposal of land and nonrail assets are included in “Other income – net” (see Note(Note 2) since such income is not a product of NS’our railroad operations.
A retirement is considered abnormal if it does not occur in the normal course of business, if it relates to disposition of a large segment of an asset class and if the retirement varies significantly from the retirement profile identified through our depreciation studies, which inherently consider the impact of normal retirements on expected service lives and depreciation rates. Gains or losses from abnormal retirements would be recognized in earnings,earnings; however, there were no such gains or losses in 2012, 2011, 2010, or 2009.2010.
NS reviews
We review the carrying amount of properties whenever events or changes in circumstances indicate that such carrying amount may not be recoverable based on future undiscounted cash flow. Assets that are deemed impaired as a result of such review arewould be recorded at the lesser of carrying amount or fair value.value; however, there were no such impairments in 2012, 2011, or 2010.
Personal Injury, Environmental, and Legal Liabilities
NS’ expense for casualties
Casualties and other claims expense, included in “Materials and other,” amounted to $216totaled $130 million in 2011.2012. Typically, most of this expense relates to NS’our accrual for personal injury liabilities. Job-related personal injury and occupationaloccupational claims are subject to FELA, which is applicable only to railroads. FELA’s fault-based tort system produces results that are unpredictable and inconsistent as compared with a no-fault worker’s compensation system. The variability inherent in this system could result in actual costs being very different from the liability recorded. In all cases, NS recordswe record a liability when the expected loss for the claim is both probable and estimable.
K31
To aid in valuing its personal injury liability and determining the amount to accrue during each period, NS utilizeswe utilize studies prepared by an independent consulting actuarial firm. For employee personal injury cases, the actuarial firm studies NS’our historical patterns of reserving for claims and subsequent settlements, taking into account relevant outside influences. AnWe estimate of the ultimate amount of the liability, which includes amounts for incurred but unasserted claims, is based on the results of this analysis. For occupational injury claims, the actuarial firm studies NS’our history of claim filings, severity, payments and other relevant facts. Additionally, theour estimate of the ultimate loss for occupational injuries includes a provision for those claims that have been incurred but not reported by projecting NS’our experience into the future as far as can be reasonably determined. NS hasWe have recorded this actuarially determined liability. The liability is dependent upon many individual judgments made as to the specific case reserves, as well as our and the actuarial firm’s judgments of the consulting actuary and management in the periodic studies. Accordingly, there could be significant changes in the liability, which NSwe would recognize when such a change became known. While actuarial studies reflected a reduced level of favorable claims development between 2009 and 2010 (resulting in an increase of the annual cost related to personal injuries from $51 million to $75 million), a continued reduced level of favorable development in 2011 resulted in an increase in the annual cost related to personal injuries to $88 million in 2011 from $75 million in 2010. While the liability recorded is supported by the most recent study, it is possible that the ultimate liability could be higher or lower. The operating expenses for personal injury claims totaled $54 million in 2012, $88 million in 2011, and $75 million in 2010.
NS is
We are subject to various jurisdictions’ environmental laws and regulations. It is NS’ policy toWe record a liability where such liability or loss is probable and its amount can be estimated reasonably (see Note(Note 16). Claims, if any, against third
parties for recovery of cleanup costs we’ve incurred, by NS, are reflected as receivables (when collection is probable) in the Consolidated Balance Sheets and are not netted against the associated NS liability. Environmental engineers regularly participate in ongoing evaluations of all known sites and in determining any necessary adjustments to liability estimates. NS also has establishedWe have an Environmental Policy Council, composed of senior managers, to oversee and interpret itsour environmental policy.
Operating expenses for environmental matters totaled approximately$40 million in 2012, $32 million in 2011, and $26 million in 2010, and
$20 million in 2009, and property additions for environmental matters totaled approximately$6 million in 2012, $7 million in 2011,
$8 and $8 million in 2010, and $11 million in 2009.2010. Property additions for environmental matters in 20122013 are expected to be about $9$8 million.
NS’
Our Consolidated Balance Sheets includedinclude liabilities for environmental exposures in the amount of $42 million at December 31, 2012, and $35 million at December 31, 2011 and $33 million at December 31, 2010 (of which $12 million is classified as a current liability at the end of each period). At December 31, 2011,2012, the liability represents NS’our estimate of the probable cleanup and remediation costs based on available information at 149146 known locations and projects. As of that date, sevennine sites accounted for approximately $13$23 million of the liability, and no individual site was considered to be material. NS anticipatesWe anticipate that much of this liability will be paid out over five years; however, some costs will be paid out over a longer period.
At 2622 locations, one or more NSof our subsidiaries in conjunction with a number of other parties, have been identified as potentially responsible parties under the Comprehensive Environmental Response, Compensation, and Liability Act of 1980, or comparable state statutes that impose joint and several liability for cleanup costs. NS calculates itsWe calculate our estimated liability for these sites based on facts and legal defenses applicable to each site and not solely on the basis of the potential for joint liability.
With respect to known environmental sites (whether identified by NSus or by the EPA or comparable state authorities), estimates of NS’our ultimate potential financial exposure for a given site or in the aggregate for all such sites are necessarily imprecise because of the widely varying costs of currently available cleanup techniques, the likely development of new cleanup technologies, unpredictable contaminant recovery and reduction rates associated with available clean-upcleanup technologies, the likely development of new cleanup technologies, the difficulty of determining in advance the nature and full extent of contamination and each potential participant’s share of any estimated loss (and that participant’s ability to bear it), and evolving statutory and regulatory standards governing liability. NS estimates itsWe estimate our environmental remediation liability on a site-by-site basis, using assumptions and judgments that management deemswe deem appropriate for each site. As a result, it is not practical to quantitatively describe the effects of changes in these many assumptions and judgments. NS hasWe have consistently applied itsour methodology of estimating itsour environmental liabilities.
K32
Based on itsthe assessment of the facts and circumstances now known, management believes that it haswe believe we have recorded the probable and reasonably estimable costs for dealing with those environmental matters of which NS iswe are aware. Further, management believeswe believe that it is unlikely that any known matters, either individually or in the aggregate, will have a material adverse effect on NS’our financial position, results of operations, or liquidity.
Norfolk Southern
We and/or certain subsidiaries are defendants in numerous lawsuits and other claims relating principally to railroad operations. When management concludeswe conclude that it is probable that a liability has been incurred and the amount of the liability can be reasonably estimated, it is accrued through a charge to expenses.earnings. While the ultimate amount of liability incurred in any of these lawsuits and claims is dependent on future developments, in management’sour opinion, any suchthe recorded liability is adequate to cover the future payment of such liability and claims. However, the final outcome of any of these lawsuits and claims cannot be predicted with certainty, and unfavorable or unexpected outcomes could result in additional accruals that could be significant to results of operations in a particular year or quarter. Any adjustments to the recorded liability will be reflected in earnings in the periods in which such adjustments are known.
Income Taxes
NS’
Our net long-term deferred tax liability totaled $7.5$7.8 billion at December 31, 2011 (see Note2012 (Note 3). This liability is estimated based on the expected future tax consequences of items recognized in the financial statements. After application of the federal statutory tax rate to book income, judgment is required with respect to the timing and deductibility of expenses in the corporate income tax returns. For state income and other taxes, judgment is also required with respect to the apportionment among the various jurisdictions. A valuation allowance is recorded if management expectswe expect that it is more likely than not that its deferred tax assets will not be realized. NSWe had a $19 million valuation allowance on $957 million$1.0 billion of deferred tax assets as of December 31, 2011,2012, reflecting the expectation that almost all of these assets will be realized.
In addition, NS haswe have a recorded liability for itsour estimate of uncertain tax positions taken or expected to be taken in a tax return. Judgment is required in evaluating the application of federal and state tax laws and assessing whether it is more likely than not that a tax position will be sustained on examination and, if so, judgment is also required as to the measurement of the amount of tax benefit that will be realized upon settlement with the taxing authority. Management believesWe believe this liability for uncertain tax positions to be adequate. Income tax expense is adjusted in the period in which new information about a tax position becomes available or the final outcome differs from the amounts recorded. For every one half percent change in the 20112012 effective tax rate, net income would have changed by $15$14 million.
OTHER MATTERS
Labor Agreements
More than 80% of NS’our railroad employees are covered by collective bargaining agreements with various labor unions. These agreements remain in effect until changed pursuant to the Railway Labor Act (RLA). NSWe largely bargainsbargain nationally in concert with other major railroads, represented by the National Carriers Conference Committee (NCCC). Moratorium provisions in the labor agreements govern when the railroads and unions may propose changes.
The NCCC’s most recentNCCC has concluded the round of bargaining that began in November 2009.2009 and reached national agreements with all applicable labor unions. Although the currentwe previously concluded separate agreements with each of the Brotherhood of Locomotive Engineers and Trainmen (BLET) and the American Train Dispatchers Association (ATDA) that extend through December 31, 2014, the health and welfare provisions from the national agreements will apply to the BLET and ATDA. Additionally, NS bargainsWe bargain separately with our Ashtabula (Ohio) Docks longshoremen, who are represented by the International Longshoremen’s Association (ILA), at Ashtabula (Ohio) Docks and do not participate in national bargaining. A new nationalWe and the ILA have also reached agreement was reachedwith moratorium provisions consistent with the United Transportation Union (UTU) on September 16, 2011, setting forth terms and working conditions through December 31, 2014. The UTU represents conductors, trainmen, hostlers, and yardmasters.
K33
Generally, after a period of direct negotiations, either party may file for mediation if it believes insufficient progress is being made. The status quo is preserved during mediation while a federal mediator assists the parties in their efforts to reach an agreement and if unsuccessful, either party may seek self-help (strike or lockout) after a 30-day cooling off period. Following failed mediation with two coalitions representing twelve unions, President Obama created Presidential Emergency Board (PEB) No. 243 in October 2011, which delayed any strike for 60 days while the PEB investigated the factsmoratorium provisions of the dispute and made recommendations. Since November 2011, the NCCC has reached tentative national mediated agreements with all twelve unions, largely adopting the recommendations of the PEB. Agreements with eleven of these unions have been ratified by their memberships. The tentative agreement with the Brotherhood of Maintenance of Way Employes Division (BMWED) must still be ratified by its membership.agreements.
Market Risks and Hedging Activities
NS manages its
We manage overall exposure to fluctuations in interest rates by issuing both fixed- and floating-rate debt instruments. At December 31, 2011, NS’2012, debt subject to interest rate fluctuations totaled $200$300 million. A 1%one-percentage point increase in interest rates would increase NS’ total annual interest expense related to all its variable debt by approximately $2$3 million. Management considersWe consider it unlikely that interest rate fluctuations applicable to these instruments will result in a material adverse effect on NS’our financial position, results of operations, or liquidity.
New Accounting Pronouncements
In June 2011, the Financial Accounting Standards Board (FASB) issued Accounting Standards Update (ASU)
No. 2011-05, “Comprehensive Income (Topic 220): Presentation of Comprehensive Income.” This update, effective for interim and annual reporting periods beginning after December 15, 2011, requires that the total of comprehensive income, the components of net income, and the components of other comprehensive income be presented in either a single continuous statement of comprehensive income or in two separate but consecutive statements. This update does not change what items are reported in other comprehensive income or the requirement to report reclassification of items from other comprehensive income to net income. NS will adopt this ASU retrospectively in the first quarter of 2012 however, effective December 2011, the FASB issued ASU No. 2011-12, “Deferral of the Effective Date for Amendments to Presentation Reclassifications of Items Out of Accumulated Other Comprehensive Income in Accounting Standards Update No. 2011-05,” which deferred the requirement to present separate line items on the income statement for reclassification adjustments of items out of accumulated other comprehensive income into net income. This deferral is temporary until the FASB reconsiders the operational concerns and needs of financial statement users. NS expects adoption of the ASU will not have a material effect on its consolidated financial statements.Inflation
In May 2011, the FASB issued ASU No. 2011-04, “Fair Value Measurements (Topic 820): Amendments to Achieve Common Fair Value Measurement and Disclosure Requirements in U.S. GAAP and IFRSs.” The update, effective for interim and annual reporting periods beginning after December 15, 2011, provides clarification about the application of existing fair value measurement and disclosure requirements, and expands certain other disclosures requirements. NS will adopt this ASU in the first quarter of 2012 and expects adoption of the ASU will not have a material effect on its consolidated financial statements.
K34
Inflation
In preparing financial statements, U.S. generally accepted accounting principles requireGAAP requires the use of historical cost that disregards the effects of inflation on the replacement cost of property. NS,As a capital-intensive company, haswe have most of itsour capital invested in such property. The replacement cost of these assets, as well as the related depreciation expense, would be substantially greater than the amounts reported on the basis of historical cost.
FORWARD-LOOKING STATEMENTS
This Management’s Discussion and Analysis of Financial Condition and Results of Operations contains forward-looking statements that may be identified by the use of words like “believe,” “expect,” “anticipate,” “estimate,” “unlikely,“plan,” “consider,” “project,” and “project.”similar references to the future. Forward-looking statements reflect management’sour good-faith evaluation of information currently available.
However, such statements are dependent on and, therefore, can be influenced by, a number of external variables over which management haswe have little or no control, including: transportation of hazardous materials as a common carrier by rail; acts of terrorism or war; general economic conditions;conditions including, but not limited to, fluctuation and competition within the industries of our customers; competition and consolidation within the transportation industry; the operations of carriers with which NS interchanges;we interchange; disruptions to NS’our technology infrastructure, including computer systems; labor difficulties, including strikes and work stoppages; commercial, operating, environmental, and climate change legislative and regulatory developments; results of litigation; natural events such as severe weather, hurricanes, and floods; unavailability of qualified personnel due to unpredictability ofunpredictable demand for rail services; fluctuation in supplies and prices of key materials, in particular diesel fuel; and changes in securities and capital markets. For aadditional discussion of significant risk factors applicable to NS,our business, see Part II, Item 1A “Risk Factors.” Forward-looking statements are not, and should not be relied upon as, a guarantee of future performance or results, nor will they necessarily prove to be accurate indications of the times at or by which any such performance or results will be achieved. As a result, actual outcomes and results may differ materially from those expressed in forward-looking statements. NS undertakesWe undertake no obligation to update or revise forward-looking statements.
Item 7A. Quantitative and Qualitative Disclosures about Market Risk
The information required by this item is included in Part II, Item 7, “Management’s Discussion and Analysis of Financial Condition and Results of Operations” under the heading “Market Risks and Hedging Activities.”
K35
Item 8. Financial Statements and Supplementary Data
INDEX TO FINANCIAL STATEMENTS |
| Page |
| |
Report of Management | K37K39 |
| |
Reports of Independent Registered Public Accounting Firm | K38K40 |
| |
Consolidated Statements of Income
Years ended December 31, 2012, 2011, and 2010 | K42 |
| |
Consolidated Statements of Comprehensive Income
Years ended December 31, 2011, 2010, and 2009 | K40 |
| |
Consolidated Balance Sheets
As of December 31,2012, 2011, and 2010
| K41 |
| K43 |
| |
Consolidated Balance Sheets
At December 31, 2012 and 2011 | K44 |
| |
Consolidated Statements of Cash Flows
Years ended December 31, 2012, 2011, 2010, and 20092010 | K42 |
| K45 |
| |
Consolidated Statements of Changes in Stockholders’ Equity
Years ended December 31, 2012, 2011, 2010, and 20092010 | K43K46 |
| |
Notes to Consolidated Financial Statements | K44K47 |
| |
The Index to Consolidated Financial Statement Schedule in Item 15 | K81K84 |
K36
Report of Management
February 15, 20122013
To the Stockholders
Norfolk Southern Corporation
Management is responsible for establishing and maintaining adequate internal control over financial reporting. In order to ensure that the Corporation’s internal control over financial reporting is effective, management regularly assesses such controls and did so most recently for its financial reporting as of December 31, 2011.2012. This assessment was based on criteria for effective internal control over financial reporting described in Internal Control-Integrated Framework issued by the Committee of Sponsoring Organizations of the Treadway Commission. Based on this assessment, management has concluded that the Corporation maintained effective internal control over financial reporting as of
December 31, 2011.2012.
KPMG LLP, independent registered public accounting firm, has audited the Corporation’s financial statements and issued an attestation report on the Corporation’s internal control over financial reporting as of December 31, 2011.2012.
/s/Charles W. Moorman
Charles W. Moorman
Chairman, President and
Chief Executive Officer | /s/James A. SquiresJohn P. Rathbone
James A. SquiresJohn P. Rathbone
Executive Vice President Finance and
Chief Financial Officer | /s/Clyde H. Allison, Jr.
Clyde H. Allison, Jr.
Vice President and
Controller |
K37
Report of Independent Registered Public Accounting Firm
The Board of Directors and Stockholders
Norfolk Southern Corporation:
We have audited Norfolk Southern Corporation’s internal control over financial reporting as of December 31, 2011,2012, based on criteria established in Internal Control – Integrated Framework issued by the Committee of Sponsoring Organizations of the Treadway Commission (COSO). Norfolk Southern Corporation’s management is responsible for maintaining effective internal control over financial reporting and for its assessment of the effectiveness of internal control over financial reporting, included in the accompanying Report of Management. Our responsibility is to express an opinion on the Company’s internal control over financial reporting based on our audit.
We conducted our audit in accordance with the standards of the Public Company Accounting Oversight Board (United States). Those standards require that we plan and perform the audit to obtain reasonable assurance about whether effective internal control over financial reporting was maintained in all material respects. Our audit included obtaining an understanding of internal control over financial reporting, assessing the risk that a material weakness exists, and testing and evaluating the design and operating effectiveness of internal control based on the assessed risk. Our audit also included performing such other procedures as we considered necessary in the circumstances. We believe that our audit provides a reasonable basis for our opinion.
A company’s internal control over financial reporting is a process designed to provide reasonable assurance regarding the reliability of financial reporting and the preparation of financial statements for external purposes in accordance with generally accepted accounting principles. A company’s internal control over financial reporting includes those policies and procedures that (1) pertain to the maintenance of records that, in reasonable detail, accurately and fairly reflect the transactions and dispositions of the assets of the company; (2) provide reasonable assurance that transactions are recorded as necessary to permit preparation of financial statements in accordance with generally accepted accounting principles, and that receipts and expenditures of the company are being made only in accordance with authorizations of management and directors of the company; and (3) provide reasonable assurance regarding prevention or timely detection of unauthorized acquisition, use, or disposition of the company’s assets that could have a material effect on the financial statements.
Because of its inherent limitations, internal control over financial reporting may not prevent or detect misstatements. Also, projections of any evaluation of effectiveness to future periods are subject to the risk that controls may become inadequate because of changes in conditions, or that the degree of compliance with the policies or procedures may deteriorate.
In our opinion, Norfolk Southern Corporation maintained, in all material respects, effective internal control over financial reporting as of December 31, 2011,2012, based on criteria established in Internal Control – Integrated Framework, issued by the Committee of Sponsoring Organizations of the Treadway Commission.
We also have audited, in accordance with the standards of the Public Company Accounting Oversight Board (United States), the consolidated balance sheets of Norfolk Southern Corporation and subsidiaries as of December 31, 20112012 and 2010,2011, and the related consolidated statements of income, comprehensive income, changes in stockholders’ equity, and cash flows for each of the years in the three-year period ended December 31, 2011,2012, and our report dated February 15, 20122013 expressed an unqualified opinion on those consolidated financial statements.
/s/KPMG LLP
KPMG LLP
Norfolk, Virginia
February 15, 20122013
K38
Report of Independent Registered Public Accounting Firm
The Board of Directors and Stockholders
Norfolk Southern Corporation:
We have audited the accompanying consolidated balance sheets of Norfolk Southern Corporation and subsidiaries as of December 31, 20112012 and 2010,2011, and the related consolidated statements of income, comprehensive income, changes in stockholders’ equity, and cash flows for each of the years in the three-year period ended December 31, 2011.2012. In connection with our audits of the consolidated financial statements, we also have audited the financial statement schedule as listed in Item 15(A)2. These consolidated financial statements and financial statement schedule are the responsibility of the Company’s management. Our responsibility is to express an opinion on these consolidated financial statements and financial statement schedule based on our audits.
We conducted our audits in accordance with the standards of the Public Company Accounting Oversight Board (United States). Those standards require that we plan and perform the audit to obtain reasonable assurance about whether the financial statements are free of material misstatement. An audit includes examining, on a test basis, evidence supporting the amounts and disclosures in the financial statements. An audit also includes assessing the accounting principles used and significant estimates made by management, as well as evaluating the overall financial statement presentation. We believe that our audits provide a reasonable basis for our opinion.
In our opinion, the consolidated financial statements referred to above present fairly, in all material respects, the financial position of Norfolk Southern Corporation and subsidiaries as of December 31, 20112012 and 2010,2011, and the results of their operations and their cash flows for each of the years in the three-year period ended December 31, 2011,2012, in conformity with U.S. generally accepted accounting principles. Also in our opinion, the related financial statement schedule, when considered in relation to the basic consolidated financial statements taken as a whole, presents fairly, in all material respects, the information set forth therein.
We also have audited, in accordance with the standards of the Public Company Accounting Oversight Board (United States), Norfolk Southern Corporation’s internal control over financial reporting as of December 31, 2011,2012, based on criteria established in Internal Control – Integrated Framework, issued by the Committee of Sponsoring Organizations of the Treadway Commission (COSO), and our report dated February 15, 20122013 expressed an unqualified opinion on the effectiveness of the Company’s internal control over financial reporting.
/s/KPMG LLP
KPMG LLP
Norfolk, Virginia
February 15, 20122013
K40
Norfolk Southern Corporation and Subsidiaries |
Consolidated Balance Sheets |
| | | | | | | |
| | | | As of December 31, |
| | | | 2011 | | | 2010 |
| | | | ($ in millions) |
| Assets | | | | | | |
| Current assets: | | | | | | |
| Cash and cash equivalents | | $ | 276 | | $ | 827 |
| Short-term investments | | | 25 | | | 283 |
| Accounts receivable - net | | | 1,022 | | | 807 |
| Materials and supplies | | | 209 | | | 169 |
| Deferred income taxes | | | 143 | | | 145 |
| Other current assets | | | 76 | | | 240 |
| Total current assets | | | 1,751 | | | 2,471 |
| | | | | | | |
| Investments | | | 2,234 | | | 2,193 |
| Properties less accumulated depreciation of $9,464 and $9,262, respectively | | | 24,469 | | | 23,231 |
| Other assets | | | 84 | | | 304 |
| | | | | | | |
| Total assets | | $ | 28,538 | | $ | 28,199 |
| | | | | | | |
| Liabilities and stockholders’ equity | | | | | | |
| Current liabilities: | | | | | | |
| Accounts payable | | $ | 1,092 | | $ | 1,181 |
| Short-term debt | | | 100 | | | 100 |
| Income and other taxes | | | 207 | | | 199 |
| Other current liabilities | | | 252 | | | 244 |
| Current maturities of long-term debt | | | 50 | | | 358 |
| Total current liabilities | | | 1,701 | | | 2,082 |
| | | | | | | |
| Long-term debt | | | 7,390 | | | 6,567 |
| Other liabilities | | | 2,050 | | | 1,793 |
| Deferred income taxes | | | 7,486 | | | 7,088 |
| Total liabilities | | | 18,627 | | | 17,530 |
| | | | | | | |
| Stockholders’ equity: | | | | | | |
| Common stock $1.00 per share par value, 1,350,000,000 shares | | | | | | |
| authorized; outstanding 330,386,089 and 357,362,604 shares, | | | | | | |
| respectively, net of treasury shares | | | 332 | | | 358 |
| Additional paid-in-capital | | | 1,912 | | | 1,892 |
| Accumulated other comprehensive loss | | | (1,026) | | | (805) |
| Retained income | | | 8,693 | | | 9,224 |
| | | | | | | |
| Total stockholders’ equity | | | 9,911 | | | 10,669 |
| | | | | | | |
| Total liabilities and stockholders’ equity | | $ | 28,538 | | $ | 28,199 |
| | | | | | | |
| See accompanying notes to consolidated financial statements. |
K41
Norfolk Southern Corporation and Subsidiaries |
Consolidated Statements of Cash Flows |
| | | | | | | | | | |
| | | | Years ended December 31, |
| | | | 2011 | | | 2010 | | | 2009 |
| | | | ($ in millions) |
| Cash flows from operating activities | | | | | | | | | |
| Net income | | $ | 1,916 | | $ | 1,496 | | $ | 1,034 |
| Reconciliation of net income to net cash | | | | | | | | | |
| provided by operating activities: | | | | | | | | | |
| Depreciation | | | 869 | | | 826 | | | 845 |
| Deferred income taxes | | | 527 | | | 312 | | | 338 |
| Gains and losses on properties and investments | | | (32) | | | (42) | | | (18) |
| Changes in assets and liabilities affecting operations: | | | | | | | | | |
| Accounts receivable | | | (215) | | | (41) | | | 63 |
| Materials and supplies | | | (40) | | | (5) | | | 30 |
| Other current assets | | | 14 | | | (1) | | | 72 |
| Current liabilities other than debt | | | 68 | | | 126 | | | (365) |
| Other - net | | | 120 | | | 43 | | | (139) |
| Net cash provided by operating activities | | | 3,227 | | | 2,714 | | | 1,860 |
| | | | | | | | | | |
| Cash flows from investing activities | | | | | | | | | |
| Property additions | | | (2,160) | | | (1,470) | | | (1,299) |
| Property sales and other transactions | | | 84 | | | 97 | | | 84 |
| Investments, including short-term | | | (135) | | | (504) | | | (266) |
| Investment sales and other transactions | | | 439 | | | 421 | | | 30 |
| Net cash used in investing activities | | | (1,772) | | | (1,456) | | | (1,451) |
| | | | | | | | | | |
| Cash flows from financing activities | | | | | | | | | |
| Dividends | | | (576) | | | (514) | | | (500) |
| Common stock issued - net | | | 120 | | | 89 | | | 66 |
| Purchase and retirement of common stock | | | (2,051) | | | (863) | | | -- |
| Proceeds from borrowings - net | | | 1,101 | | | 350 | | | 1,090 |
| Debt repayments | | | (600) | | | (489) | | | (687) |
| Net cash used in financing activities | | | (2,006) | | | (1,427) | | | (31) |
| | | | | | | | | | |
| Net increase (decrease) in cash and cash equivalents | | | (551) | | | (169) | | | 378 |
| | | | | | | | | | |
| Cash and cash equivalents | | | | | | | | | |
| At beginning of year | | | 827 | | | 996 | | | 618 |
| | | | | | | | | | |
| At end of year | | $ | 276 | | $ | 827 | | $ | 996 |
| | | | | | | | | | |
| Supplemental disclosure of cash flow information | | | | | | | | | |
| Cash paid during the year for: | | | | | | | | | |
| Interest (net of amounts capitalized) | | $ | 435 | | $ | 453 | | $ | 458 |
| Income taxes (net of refunds) | | | 289 | | | 602 | | | 381 |
| | | | | | | | | | |
| See accompanying notes to consolidated financial statements. |
K42
Norfolk Southern Corporation and Subsidiaries |
Consolidated Statements of Changes in Stockholders’ Equity |
| | | | | | | | | | | | | | | | |
| | | | | Additional | Accum. Other | | | | | |
| | | Common | | | Paid-in | Comprehensive | Retained | | | | |
| | | Stock | | | Capital | Loss | Income | | | Total | |
| | | | | ($ in millions, except per share amounts) | | | |
| | | | | | | | | | | | | | | | |
| Balance at December 31, 2008 | $ | 368 | | $ | 1,680 | | $ | (942) | | $ | 8,501 | | $ | 9,607 | |
| | | | | | | | | | | | | | | | |
| Comprehensive income | | | | | | | | | | | | | | | |
| Net income | | | | | | | | | | | 1,034 | | | 1,034 | |
| Other comprehensive income | | | | | | | | 89 | | | | | | 89 | |
| Total comprehensive income | | | | | | | | | | | | | | 1,123 | |
| Dividends on Common Stock, | | | | | | | | | | | | | | | |
| $1.36 per share | | | | | | | | | | | (500) | | | (500) | |
| Stock-based compensation, | | | | | | | | | | | | | | | |
| including tax benefit of $15 | | 2 | | | 123 | | | | | | (8) | | | 117 | |
| Other | | | | | 6 | | | | | | | | | 6 | |
| | | | | | | | | | | | | | | | |
| Balance at December 31, 2009 | | 370 | | | 1,809 | | | (853) | | | 9,027 | | | 10,353 | |
| | | | | | | | | | | | | | | | |
| Comprehensive income | | | | | | | | | | | | | | | |
| Net income | | | | | | | | | | | 1,496 | | | 1,496 | |
| Other comprehensive income | | | | | | | | 48 | | | | | | 48 | |
| Total comprehensive income | | | | | | | | | | | | | | 1,544 | |
| Dividends on Common Stock, | | | | | | | | | | | | | | | |
| $1.40 per share | | | | | | | | | | | (514) | | | (514) | |
| Share repurchases | | (15) | | | (72) | | | | | | (776) | | | (863) | |
| Stock-based compensation, | | | | | | | | | | | | | | | |
| including tax benefit of $33 | | 3 | | | 149 | | | | | | (8) | | | 144 | |
| Other | | | | | 6 | | | | | | (1) | | | 5 | |
| | | | | | | | | | | | | | | | |
| Balance at December 31, 2010 | | 358 | | | 1,892 | | | (805) | | | 9,224 | | | 10,669 | |
| | | | | | | | | | | | | | | | |
| Comprehensive income | | | | | | | | | | | | | | | |
| Net income | | | | | | | | | | | 1,916 | | | 1,916 | |
| Other comprehensive loss | | | | | | | | (221) | | | | | | (221) | |
| Total comprehensive income | | | | | | | | | | | | | | 1,695 | |
| Dividends on Common Stock, | | | | | | | | | | | | | | | |
| $1.66 per share | | | | | | | | | | | (576) | | | (576) | |
| Share repurchases | | (30) | | | (159) | | | | | | (1,862) | | | (2,051) | |
| Stock-based compensation, | | | | | | | | | | | | | | | |
| including tax benefit of $45 | | 4 | | | 179 | | | | | | (9) | | | 174 | |
| | | | | | | | | | | | | | | | |
| Balance at December 31, 2011 | $ | 332 | | $ | 1,912 | | $ | (1,026) | | $ | 8,693 | | $ | 9,911 | |
| | | | | | | | | | | | | | | | |
| See accompanying notes to consolidated financial statements. | | | | | | | | | | |
K43
Norfolk Southern Corporation and Subsidiaries
Consolidated Statements of Income
| Years ended December 31, |
| 2012 | | 2011 | | 2010 |
| ($ in millions, except per share amounts) |
| |
Railway operating revenues | $ | 11,040 | | $ | 11,172 | | $ | 9,516 |
| |
Railway operating expenses: | |
| | |
| | |
|
Compensation and benefits | | 2,960 | | | 2,974 | | | 2,708 |
Purchased services and rents | | 1,604 | | | 1,610 | | | 1,477 |
Fuel | | 1,577 | | | 1,589 | | | 1,079 |
Depreciation | | 916 | | | 862 | | | 819 |
Materials and other | | 859 | | | 924 | | | 757 |
| | | | | | | | |
Total railway operating expenses | | 7,916 | | | 7,959 | | | 6,840 |
| |
| | |
| | |
|
Income from railway operations | | 3,124 | | | 3,213 | | | 2,676 |
| |
| | |
| | |
|
Other income – net | | 129 | | | 160 | | | 153 |
Interest expense on debt | | 495 | | | 455 | | | 462 |
| |
| | |
| | |
|
Income before income taxes | | 2,758 | | | 2,918 | | | 2,367 |
| |
| | |
| | |
|
Provision for income taxes | | 1,009 | | | 1,002 | | | 871 |
| | | | | | | | |
Net income | $ | 1,749 | | $ | 1,916 | | $ | 1,496 |
| |
| | |
| | |
|
Per share amounts: | |
| | |
| | |
|
Net income | |
| | |
| | |
|
Basic | $ | 5.42 | | $ | 5.52 | | $ | 4.06 |
Diluted | | 5.37 | | | 5.45 | | | 4.00 |
See accompanying notes to consolidated financial statements.
Norfolk Southern Corporation and Subsidiaries
Consolidated Statements of Comprehensive Income
| Years ended December 31, |
| 2012 | | 2011 | | 2010 |
| ($ in millions) |
| |
| | |
| | |
|
Net income | $ | 1,749 | | $ | 1,916 | | $ | 1,496 |
Other comprehensive income (loss), before tax: | |
| | |
| | |
|
Pension and other postretirement benefits | | (114) | | | (325) | | | 61 |
Other comprehensive income (loss) of equity investees | | (13) | | | (21) | | | 11 |
Other comprehensive income (loss), before tax | | (127) | | | (346) | | | 72 |
Income tax benefit (expense) related to items of | |
| | |
| | |
|
other comprehensive income (loss) | | 44 | | | 125 | | | (24) |
Other comprehensive income (loss), net of tax | | (83) | | | (221) | | | 48 |
| | | | | | | | |
Total comprehensive income | $ | 1,666 | | $ | 1,695 | | $ | 1,544 |
See accompanying notes to consolidated financial statements.
Norfolk Southern Corporation and Subsidiaries
Consolidated Balance Sheets
| At December 31, |
| 2012 | | 2011 |
| ($ in millions) |
Assets | |
| | |
|
Current assets: | |
| | |
|
Cash and cash equivalents | $ | 653 | | $ | 276 |
Short-term investments | | 15 | | | 25 |
Accounts receivable - net | | 1,109 | | | 1,022 |
Materials and supplies | | 216 | | | 209 |
Deferred income taxes | | 167 | | | 143 |
Other current assets | | 82 | | | 76 |
Total current assets | | 2,242 | | | 1,751 |
| |
| | |
|
Investments | | 2,300 | | | 2,234 |
Properties less accumulated depreciation of $9,922 and | |
| | |
|
$9,464, respectively | | 25,736 | | | 24,469 |
Other assets | | 64 | | | 84 |
| | | | | |
Total assets | $ | 30,342 | | $ | 28,538 |
| |
| | |
|
Liabilities and stockholdersʼ equity | |
| | |
|
Current liabilities: | |
| | |
|
Accounts payable | $ | 1,362 | | $ | 1,092 |
Short-term debt | | 200 | | | 100 |
Income and other taxes | | 206 | | | 207 |
Other current liabilities | | 263 | | | 252 |
Current maturities of long-term debt | | 50 | | | 50 |
Total current liabilities | | 2,081 | | | 1,701 |
| |
| | |
|
Long-term debt | | 8,432 | | | 7,390 |
Other liabilities | | 2,237 | | | 2,050 |
Deferred income taxes | | 7,832 | | | 7,486 |
Total liabilities | | 20,582 | | | 18,627 |
| |
| | |
|
Stockholdersʼ equity: | |
| | |
|
Common Stock $1.00 per share par value, 1,350,000,000 shares | |
| | |
|
authorized; outstanding 314,034,174 and 330,386,089 shares, | |
| | |
|
respectively, net of treasury shares | | 315 | | | 332 |
Additional paid-in capital | | 1,911 | | | 1,912 |
Accumulated other comprehensive loss | | (1,109) | | | (1,026) |
Retained income | | 8,643 | | | 8,693 |
| |
| | |
|
Total stockholdersʼ equity | | 9,760 | | | 9,911 |
| | | | | |
Total liabilities and stockholdersʼ equity | $ | 30,342 | | $ | 28,538 |
| |
| | |
|
See accompanying notes to consolidated financial statements.
Norfolk Southern Corporation and Subsidiaries
Consolidated Statements of Cash Flows
| Years ended December 31, |
| 2012 | | 2011 | | 2010 |
| ($ in millions) |
Cash flows from operating activities: | |
| | |
| | |
|
Net income | $ | 1,749 | | $ | 1,916 | | $ | 1,496 |
Reconciliation of net income to net cash | |
| | |
| | |
|
provided by operating activities: | |
| | |
| | |
|
Depreciation | | 922 | | | 869 | | | 826 |
Deferred income taxes | | 366 | | | 527 | | | 312 |
Gains and losses on properties and investments | | (6) | | | (32) | | | (42) |
Changes in assets and liabilities affecting operations: | |
| | |
| | |
|
Accounts receivable | | (64) | | | (215) | | | (41) |
Materials and supplies | | (7) | | | (40) | | | (5) |
Other current assets | | (6) | | | 14 | | | (1) |
Current liabilities other than debt | | 82 | | | 68 | | | 126 |
Other – net | | 29 | | | 120 | | | 43 |
Net cash provided by operating activities | | 3,065 | | | 3,227 | | | 2,714 |
| |
| | |
| | |
|
Cash flows from investing activities: | |
| | |
| | |
|
Property additions | | (2,241) | | | (2,160) | | | (1,470) |
Property sales and other transactions | | 192 | | | 84 | | | 97 |
Investments, including short-term | | (23) | | | (135) | | | (504) |
Investment sales and other transactions | | 78 | | | 439 | | | 421 |
Net cash used in investing activities | | (1,994) | | | (1,772) | | | (1,456) |
| |
| | |
| | |
|
Cash flows from financing activities: | |
| | |
| | |
|
Dividends | | (624) | | | (576) | | | (514) |
Common Stock issued – net | | 89 | | | 120 | | | 89 |
Purchase and retirement of Common Stock | | (1,288) | | | (2,051) | | | (863) |
Proceeds from borrowings – net | | 1,491 | | | 1,101 | | | 350 |
Debt repayments | | (362) | | | (600) | | | (489) |
Net cash used in financing activities | | (694) | | | (2,006) | | | (1,427) |
| |
| | |
| | |
|
Net increase (decrease) in cash and cash equivalents | | 377 | | | (551) | | | (169) |
| |
| | |
| | |
|
Cash and cash equivalents: | |
| | |
| | |
|
At beginning of year | | 276 | | | 827 | | | 996 |
| | | | | | | | |
At end of year | $ | 653 | | $ | 276 | | $ | 827 |
| |
| | |
| | |
|
Supplemental disclosures of cash flow information: | |
| | |
| | |
|
Cash paid during the year for: | |
| | |
| | |
|
Interest (net of amounts capitalized) | $ | 473 | | $ | 435 | | $ | 453 |
Income taxes (net of refunds) | | 618 | | | 289 | | | 602 |
| |
| | |
| | |
|
See accompanying notes to consolidated financial statements.
Norfolk Southern Corporation and Subsidiaries
Consolidated Statements of Changes in Stockholders’ Equity
| | | Additional | Accum. Other | | | |
| Common | | Paid-in | Comprehensive | Retained | | |
| Stock | | Capital | | Loss | | Income | | Total |
| ($ in millions, except per share amounts) |
| |
| | |
| | |
| | |
| | |
|
Balance at December 31, 2009 | $ | 370 | | $ | 1,809 | | $ | (853) | | $ | 9,027 | | $ | 10,353 |
| |
| | |
| | |
| | |
| | |
|
Comprehensive income: | |
| | |
| | |
| | |
| | |
|
Net income | |
| | |
| | |
| | | 1,496 | | | 1,496 |
Other comprehensive income | |
| | |
| | | 48 | | |
| | | 48 |
Total comprehensive income | |
| | |
| | |
| | |
| | | 1,544 |
Dividends on Common Stock, | |
| | |
| | |
| | |
| | |
|
$1.40 per share | |
| | |
| | |
| | | (514) | | | (514) |
Share repurchases | | (15) | | | (72) | | |
| | | (776) | | | (863) |
Stock-based compensation, | |
| | |
| | |
| | |
| | |
|
including tax benefit of $33 | | 3 | | | 149 | | |
| | | (8) | | | 144 |
Other | |
| | | 6 | | |
| | | (1) | | | 5 |
| | | | | | | | | | | | | | |
Balance at December 31, 2010 | | 358 | | | 1,892 | | | (805) | | | 9,224 | | | 10,669 |
| |
| | |
| | |
| | |
| | |
|
Comprehensive income: | |
| | |
| | |
| | |
| | |
|
Net income | |
| | |
| | |
| | | 1,916 | | | 1,916 |
Other comprehensive loss | |
| | |
| | | (221) | | |
| | | (221) |
Total comprehensive income | |
| | |
| | |
| | |
| | | 1,695 |
Dividends on Common Stock, | |
| | |
| | |
| | |
| | |
|
$1.66 per share | |
| | |
| | |
| | | (576) | | | (576) |
Share repurchases | | (30) | | | (159) | | |
| | | (1,862) | | | (2,051) |
Stock-based compensation, | |
| | |
| | |
| | |
| | |
|
including tax benefit of $45 | | 4 | | | 179 | | |
| | | (9) | | | 174 |
| | | | | | | | | | | | | | |
Balance at December 31, 2011 | | 332 | | | 1,912 | | | (1,026) | | | 8,693 | | | 9,911 |
| |
| | |
| | |
| | |
| | |
|
Comprehensive income: | |
| | |
| | |
| | |
| | |
|
Net income | |
| | |
| | |
| | | 1,749 | | | 1,749 |
Other comprehensive loss | |
| | |
| | | (83) | | |
| | | (83) |
Total comprehensive income | |
| | |
| | |
| | |
| | | 1,666 |
Dividends on Common Stock, | |
| | |
| | |
| | |
| | |
|
$1.94 per share | |
| | |
| | |
| | | (624) | | | (624) |
Share repurchases | | (19) | | | (104) | | |
| | | (1,165) | | | (1,288) |
Stock-based compensation, | |
| | |
| | |
| | |
| | |
|
including tax benefit of $42 | | 2 | | | 103 | | |
| | | (10) | | | 95 |
| | | | | | | | | | | | | | |
Balance at December 31, 2012 | $ | 315 | | $ | 1,911 | | $ | (1,109) | | $ | 8,643 | | $ | 9,760 |
| |
| | |
| | |
| | |
| | |
|
See accompanying notes to consolidated financial statements.
Norfolk Southern Corporation and Subsidiaries
Notes to Consolidated Financial Statements
The following Notes are an integral part of the Consolidated Financial Statements.
1. Summary of Significant Accounting Policies
Description of Business
Norfolk Southern Corporation is a Virginia-based holding company engaged principally in the rail transportation business, operating approximately 20,000 route miles of road primarily in the East and Midwest. These consolidated financial statements include Norfolk Southern Corporation (Norfolk Southern) and its majority-owned and controlled subsidiariessubsidiaries (collectively, NS)NS, we, us, and our). Norfolk Southern’s major subsidiary is Norfolk Southern Railway Company (NSR). All significant intercompany balances and transactions have been eliminated in consolidation.
NSR and its railroad subsidiaries transport raw materials, intermediate products and finished goods classified in the following marketcommodity groups (percent of total railway operating revenues in 2011)2012): coal (31%(26%); intermodal (19%(20%); chemicals (14%); agriculture/consumer products/government (13%); chemicalsmetals/construction (12%); metals/construction (11%); automotive (7%(8%); and, paper/clay/forest products (7%). Although most of NS’our customers are domestic, ultimate points of origination or destination for some of the products transported (particularly coal bound for export and some intermodal containers) may be outside the U.S. More than 80% of NS’our railroad employees are covered by collective bargaining agreements with various labor unions.
Use of Estimates
The preparation of financial statements in accordance with U.S. Generally Accepted Accounting Principles (GAAP)requires managementus to make estimates and assumptions that affect the reported amounts of assets and liabilities, the disclosure of contingent assets and liabilities at the date of the financial statements and the reported amounts of revenues and expenses during the reporting period. ManagementWe periodically reviews itsreview our estimates, including those related to the recoverability and useful lives of assets, as well as liabilities for litigation, environmental remediation, casualty claims, income taxes and pension and other postretirement benefits. Changes in facts and circumstances may result in revised estimates.
Revenue Recognition
Transportation revenue is recognized proportionally as a shipment moves from origin to destination and related expenses are recognized as incurred. Refunds (which are primarily volume-based incentives) are recorded as a reduction to revenues on the basis of management’s best estimate of projected liability, which is based on historical activity, current trafficshipment counts and the expectation of future activity. NSWe regularly monitors itsmonitor our contract refund liability and, historically, the estimates have not differed significantly from the amounts ultimately refunded. Switching, demurrage and other incidental service revenues are recognized when the services are performed.
Cash Equivalents
“Cash equivalents” are highly liquid investments purchased three months or less from maturity.
Allowance for Doubtful Accounts
NS’
Our allowance for doubtful accounts was $3 million at December 31, 2012 and $4 million at December 31, 2011 and $5 million at December 31, 2010.2011. To determine itsour allowance for doubtful accounts, NS evaluateswe evaluate historical loss experience (which has not been significant), the characteristics of current accounts, and general economic conditions and trends.
Materials and Supplies
“Materials and supplies,” consisting mainly of fuel oil and items for maintenance of property and equipment, are stated at the lower of average cost or market. The cost of materials and supplies expected to be used in property additions or improvements is included in “Properties.”
K44
Investments
Debt securities classified as “held-to-maturity” are reported at amortized cost. Marketable equity and debt securities classified as “trading” or “available-for-sale” are recorded at fair value. Unrealized after-tax gains and losses for investments designated as “available-for-sale” are recognized in “Accumulated other comprehensive loss.”
Investments where NS haswe have the ability to exercise significant influence over but doesdo not control the entity are accounted for using the equity method, whereby the investment is carried at the cost of the acquisition plus NS’our equity in undistributed earnings or losses since acquisition.
Properties
“Properties” are stated principally at cost and are depreciated using the group method of depreciation whereby assets with similar characteristics, use, and expected lives are grouped together in asset classes and depreciated using a composite depreciation rate. This methodology treats each asset class as a pool of resources, not as singular items. NS usesWe use more than 60 depreciable asset classes. The primary depreciation method for NS’our asset base is group life. Units of production is the principal method of depreciation for rail in high density corridors and for depletion of natural resources (see Note(Note 2). Remaining properties are depreciated generally using the straight-line method over the lesser of estimated service or lease lives. Depreciation in the Consolidated Statements of Cash Flows includes both depreciation and depletion.
NS’ depreciation
Depreciation expense is based on management’sour assumptions concerning expected service lives of itsour properties as well as the expected net salvage that will be received upon their retirement. In developing these assumptions, NS’ management utilizeswe utilize periodic depreciation studies that are performed by an independent outside firm of consulting engineers and approved by the Surface Transportation Board (STB), the regulatory board that has broad jurisdiction over railroad practices. NS’. Our depreciation studies are conducted about every three years for equipment and every six years for track assets and other roadway property. The frequency of these studies is consistent with guidelines established by the STB. Key factors which are considered in developing average service life and salvage estimates include:
• statistical analysis of historical retirement data and surviving asset records;
• review of historical salvage received and current market rates;
• review of NS’our operations including expected changes in technology, customer demand, maintenance practices and asset management strategies;
• review of accounting policies and assumptions; and
• industry review and analysis.
The units of production depreciation rate for rail in high density corridors is derived based on consideration of annual gross ton miles as compared to the total or ultimate capacity of rail in these corridors. NS’Our experience has shown that traffic density is a leading factor in determination of the expected service life of rail in high density corridors. In developing the respective depreciation rate, consideration is also given to several rail characteristics
including age, weight, condition (new or second hand) and type (curve or straight). As a result, a composite depreciation rate is developed which is applied to the depreciable base.
NS’
Our recent experience with these studies has been that while they do result in changes in the rates used to depreciate itsour properties, these changes have not caused a significant effect to its annual depreciation expense. Changes in rates as a result of depreciation studies are implemented prospectively. The studies may also indicate that the recorded amount of accumulated depreciation is deficient (or in excess) of the amount indicated by the study. Any such deficiency (or excess) is amortized as a component of depreciation expense over the remaining service lives of the affected class of property, as determined by the study. For 2011,2012, roadway depreciation rates ranged from 0.83% to 33.3% and equipment depreciation rates ranged from 1.32% to 37.84%.
K45
NS capitalizesWe capitalize interest on major capital projects during the period of their construction. Expenditures, including those on leased assets, that extend an assets’asset’s useful life or increase its utility, are capitalized. Expenditures capitalized include those that are directly related to a capital project and may include materials, labor and equipment, in addition to an allocable portion of indirect costs that clearly relate to a particular project. Due to the capital intensive nature of the railroad industry, a significant portion of annual capital spending relates to the replacement of self-constructed assets. Because removal activities occur in conjunction with replacement, removal costs are estimated based on an average percentage of time employees replacing assets spend on removal functions. Costs related to repairs and maintenance activities that do not extend an asset’s useful life or increase its utility are expensed when such repairs are performed.
When properties other than land and nonrail assets are sold or retired in the ordinary course of business, the cost of the assets, net of sale proceeds or salvage, is charged to accumulated depreciation, and no gain or loss is recognized in earnings. Actual historical cost values are retired when available, such as with equipment assets. The use of estimates in recording the retirement of certain roadway assets is necessary based on the impracticality of tracking individual asset costs. When retiring rail, ties and ballast, NS useswe use statistical curves that indicate the relative distribution of the age of the assets retired. The historical cost of other roadway assets is estimated using a combination of inflation indices specific to the rail industry and those published by the U.S. Bureau of Labor Statistics. The indices are applied to the replacement value based on the age of the retired assets. These indices are used because they closely correlate with the costs of roadway assets. Gains and losses on disposal of land and nonrail assets are included in “Other income – net”
(see Note (Note 2) since such income is not a product of NS’our railroad operations.
A retirement is considered abnormal if it does not occur in the normal course of business, if it relates to disposition of a large segment of an asset class and if the retirement varies significantly from the retirement profile identified through our depreciation studies, which inherently consider the impact of normal retirements on expected serviceservice lives and depreciation rates. Gains or losses from abnormal retirements are recognized in earnings.
NS reviews
We review the carrying amount of properties whenever events or changes in circumstances indicate that such carrying amount may not be recoverable based on future undiscounted cash flows. Assets that are deemed impaired as a result of such review are recorded at the lower of carrying amount or fair value.
Required Accounting Changes
In September 2011, the FASB issued ASU No. 2011-09, “Disclosures about an Employer’s Participation in a Multiemployer Plan.” This update, effective for annual periods for fiscal years ending after December 15, 2011, requires additional disclosures about employers’ participation in multiemployer pension plans, including information about the plan’s funded status if readily available. This update also requires additional limited disclosures for multiemployer plans that provide postretirement benefits other than pension. NSfirst quarter of 2012, we adopted this ASU in our December 31, 2011 annual financial statements, the adoption of which did not have a material effect on NS’ consolidated financial statements.
In June 2011, the FASB issued ASUAccounting Standards Update (ASU) No. 2011-05, “Comprehensive Income (Topic 220): Presentation of Comprehensive Income.”This update effective for interim and annual reporting periods beginning after December 15, 2011, requires that the total of comprehensive income, the components of net income, and the components of other comprehensive income be presented in either a single continuous statement of comprehensive income or in two separate but consecutive statements. This update does not change what items are reported in other comprehensive income or the requirement to report reclassification of items from other comprehensive income to net income. NS will adopt this ASU retrospectively in
In the first quarter of 2012, however, effective December 2011, the FASB issuedwe adopted ASU No. 2011-12, 2011-04, “Deferral of the Effective Date forFair Value Measurements (Topic 820): Amendments to Presentation Reclassificationsachieve Common Fair Value Measurement and Disclosure Requirements in U.S. GAAP and IFRSs.” This update provides clarification about the application of Items Out of Accumulated Other Comprehensive Income in Accounting Standards Update No. 2011-05,” which deferred the requirement to present separate line items on the income statement for reclassification adjustments of items out of accumulatedexisting fair value measurements and disclosure requirements, and expands certain other comprehensive income into net income. This deferral is temporary until the FASB reconsiders the operational concerns and needs of financial statement users. NS expects adoption of the ASU will not have a material effect on its consolidated financial statements.disclosure requirements.
2. Other Income – Net
| | | | 2011 | | | 2010 | | | 2009 | |
| | | | ($ in millions) | |
| Income from natural resources: | | | | | | | | | | |
| Royalties from coal | | $ | 86 | | $ | 80 | | $ | 67 | |
| Nonoperating depletion and depreciation | | | (7) | | | (7) | | | (8) | |
| Subtotal | | | 79 | | | 73 | | | 59 | |
| | | | | | | | | | | |
| Rental income | | | 51 | | | 47 | | | 47 | |
| Gains and losses from sale of properties | | | 32 | | | 41 | | | 18 | |
| Equity in earnings of Conrail Inc. (Note 5) | | | 31 | | | 26 | | | 32 | |
| Interest income | | | 9 | | | 12 | | | 13 | |
| Corporate-owned life insurance - net | | | 8 | | | 1 | | | 1 | |
| Other interest expense - net | | | (3) | | | (16) | | | (5) | |
| Taxes on nonoperating property | | | (9) | | | (10) | | | (10) | |
| Other | | | (38) | | | (21) | | | (28) | |
| Total | | $ | 160 | | $ | 153 | | $ | 127 | |
| 2012 | | 2011 | | 2010 |
| ($ in millions) |
Income from natural resources: | |
| | |
| | |
|
Royalties from coal | $ | 72 | | $ | 86 | | $ | 80 |
Nonoperating depletion and depreciation | | (6) | | | (7) | | | (7) |
Subtotal | | 66 | | | 79 | | | 73 |
| |
| | |
| | |
|
Rental income | | 54 | | | 51 | | | 47 |
Equity in earnings of Conrail Inc. (Note 5) | | 34 | | | 31 | | | 26 |
Corporate-owned life insurance – net | | 13 | | | 8 | | | 1 |
Interest income | | 8 | | | 9 | | | 12 |
Gains and losses from sale of properties | | 5 | | | 32 | | | 41 |
Other interest expense – net | | (9) | | | (3) | | | (16) |
Taxes on nonoperating property | | (10) | | | (9) | | | (10) |
Other | | (32) | | | (38) | | | (21) |
| | | | | | | | |
Total | $ | 129 | | $ | 160 | | $ | 153 |
“Other income – net” includes income and costs not part of rail operations and the income generated by the activities of NS’our noncarrier subsidiaries as well as the costs incurred by those subsidiaries in their operations.
3. Income Taxes
Provisions for Income Taxes
| | | | 2011 | | | 2010 | | | 2009 | |
| | | | ($ in millions) | |
| Current: | | | | | | | | | | |
| Federal | | $ | 432 | | $ | 492 | | $ | 239 | |
| State | | | 43 | | | 67 | | | 11 | |
| Total current taxes | | | 475 | | | 559 | | | 250 | |
| | | | | | | | | | | |
| Deferred: | | | | | | | | | | |
| Federal | | | 506 | | | 281 | | | 289 | |
| State | | | 21 | | | 31 | | | 49 | |
| Total deferred taxes | | | 527 | | | 312 | | | 338 | |
| | | | | | | | | | | |
| Provision for income taxes | | $ | 1,002 | | $ | 871 | | $ | 588 | |
Other current assets includes prepaid income taxes of zero and $151 million, respectively, as of December 31, 2011 and 2010.
K47
| 2012 | | 2011 | | 2010 |
| ($ in millions) |
Current: | |
| | |
| | |
|
Federal | $ | 569 | | $ | 432 | | $ | 492 |
State | | 74 | | | 43 | | | 67 |
Total current taxes | | 643 | | | 475 | | | 559 |
| |
| | |
| | |
|
Deferred: | |
| | |
| | |
|
Federal | | 339 | | | 506 | | | 281 |
State | | 27 | | | 21 | | | 31 |
Total deferred taxes | | 366 | | | 527 | | | 312 |
| | | | | | | | |
Provision for income taxes | $ | 1,009 | | $ | 1,002 | | $ | 871 |
| |
| | |
| | |
|
Reconciliation of Statutory Rate to Effective Rate
The “Provision for income taxes” in the Consolidated Statements of Income differs from the amounts computed by applying the statutory federal corporate tax rate as follows:
| | | 2011 | | | 2010 | | | 2009 |
| | | Amount | | % | | | Amount | | % | | | Amount | | % |
| | | | | | ($ in millions) | | | |
| | | | | | | | | | | | | | | |
| Federal income tax at statutory rate | $ | 1,021 | | 35 | | $ | 828 | | 35 | | $ | 568 | | 35 |
| State income taxes, net of federal tax effect | | 69 | | 2 | | | 62 | | 3 | | | 39 | | 2 |
| Deferred tax estimate | | -- | | -- | | | (34) | | (1) | | | -- | | -- |
| Medicare Part D | | -- | | -- | | | 27 | | 1 | | | -- | | -- |
| State tax law changes, net of federal tax effect | | (28) | | (1) | | | -- | | -- | | | -- | | -- |
| Internal Revenue Service audit, settlement | | (40) | | (1) | | | -- | | -- | | | 1 | | -- |
| Other, net | | (20) | | (1) | | | (12) | | (1) | | | (20) | | (1) |
| | | | | | | | | | | | | | | |
| Provision for income taxes | $ | 1,002 | | 34 | | $ | 871 | | 37 | | $ | 588 | | 36 |
| 2012 | | 2011 | | 2010 |
| Amount | | % | | Amount | | % | | Amount | | % |
| ($ in millions) |
| |
| |
| | |
| |
| | |
| |
|
Federal income tax at statutory rate | $ | 965 | | 35 | | $ | 1,021 | | 35 | | $ | 828 | | 35 |
State income taxes, net of federal tax effect | | 69 | | 3 | | | 69 | | 2 | | | 62 | | 3 |
Deferred tax estimate | | - | | - | | | - | | - | | | (34) | | (1) |
Medicare Part D | | - | | - | | | - | | - | | | 27 | | 1 |
State tax law changes, net of federal tax effect | | (3) | | - | | | (28) | | (1) | | | - | | - |
Internal Revenue Service audit, settlement | | (6) | | - | | | (40) | | (1) | | | - | | - |
Other, net | | (16) | | (1) | | | (20) | | (1) | | | (12) | | (1) |
| | | | | | | | | | | | | | |
Provision for income taxes | $ | 1,009 | | 37 | | $ | 1,002 | | 34 | | $ | 871 | | 37 |
During 2010, NSwe performed a review and re-evaluation of itsour estimates for deferred tax assets and liabilities, resulting in a reduction of income tax expense of $34 million. In addition, provisions of the health care legislation enacted during 2010 eliminate, after 2012, the tax deduction available for reimbursed prescription drug expenses under the Medicare Part D retiree drug subsidy program. As required by ASCthe Financial Accounting Standards Board (FASB) Accounting Standards Codification (ASC) 740, “Income Taxes,” NS we recorded a $27 million charge to deferred tax expense in 2010.
K48
Deferred Tax Assets and Liabilities
Certain items are reported in different periods for financial reporting and income tax purposes. Deferred tax assets and liabilities are recorded in recognition of these differences. The tax effects of temporary differences that give rise to significant portions of the deferred tax assets and deferred tax liabilities are as follows:
| | | | December 31, |
| | | | 2011 | | | 2010 | |
| | | | ($ in millions) | |
| Deferred tax assets: | | | | | | | |
| Compensation and benefits, including postretirement | | $ | 771 | | $ | 617 | |
| Accruals, including casualty and other claims | | | 145 | | | 156 | |
| Other | | | 41 | | | 50 | |
| Total gross deferred tax assets | | | 957 | | | 823 | |
| Less valuation allowance | | | (19) | | | (21) | |
| Net deferred tax asset | | | 938 | | | 802 | |
| | | | | | | | |
| Deferred tax liabilities: | | | | | | | |
| Property | | | (7,894) | | | (7,453) | |
| Other | | | (387) | | | (292) | |
| Total gross deferred tax liabilities | | | (8,281) | | | (7,745) | |
| | | | | | | | |
| Net deferred tax liability | | | (7,343) | | | (6,943) | |
| Net current deferred tax asset | | | 143 | | | 145 | |
| Net long-term deferred tax liability | | $ | (7,486) | | $ | (7,088) | |
| December 31, |
| 2012 | | 2011 |
| ($ in millions) |
Deferred tax assets: | |
| | |
|
Compensation and benefits, including postretirement | $ | 834 | | $ | 771 |
Accruals, including casualty and other claims | | 139 | | | 145 |
Other | | 41 | | | 41 |
Total gross deferred tax assets | | 1,014 | | | 957 |
Less valuation allowance | | (19) | | | (19) |
| | | | | |
Net deferred tax asset | | 995 | | | 938 |
| |
| | |
|
Deferred tax liabilities: | |
| | |
|
Property | | (8,188) | | | (7,894) |
Other | | (472) | | | (387) |
Total gross deferred tax liabilities | | (8,660) | | | (8,281) |
| |
| | |
|
Net deferred tax liability | | (7,665) | | | (7,343) |
Net current deferred tax asset | | 167 | | | 143 |
| | | | | |
Net long-term deferred tax liability | $ | (7,832) | | $ | (7,486) |
Except for amounts for which a valuation allowance has been provided, management believeswe believe that it is more likely than not that the results of future operations will generate sufficient taxable income to realize the deferred tax assets. The valuation allowance at the end of each year primarily relates to subsidiary state income tax net operating losses that may not be utilized prior to their expiration. The total valuation allowance remained unchanged in 2012 and decreased $2 million in 2011 and increased
$7 million in 2010.2011.
Uncertain Tax Positions
A reconciliation of the beginning and ending amount of unrecognized tax benefits is as follows:
| | | | December 31, |
| | | | 2011 | | | 2010 | |
| | | | ($ in millions) | |
| | | | | | | | |
| Balance at beginning of year | | $ | 152 | | $ | 94 | |
| | | | | | | | |
| Additions based on tax positions related to the current year | | | 40 | | | 51 | |
| Additions for tax positions of prior years | | | 26 | | | 44 | |
| Reductions for tax positions of prior years | | | (78) | | | (19) | |
| Settlements with taxing authorities | | | (22) | | | (2) | |
| Lapse of statutes of limitations | | | (13) | | | (16) | |
| Balance at end of year | | $ | 105 | | $ | 152 | |
K49
| December 31, |
| 2012 | | 2011 |
| ($ in millions) |
| |
| | |
|
Balance at beginning of year | $ | 105 | | $ | 152 |
| |
| | |
|
Additions based on tax positions related to the current year | | 6 | | | 40 |
Additions for tax positions of prior years | | - | | | 26 |
Reductions for tax positions of prior years | | (20) | | | (78) |
Settlements with taxing authorities | | (23) | | | (22) |
Lapse of statutes of limitations | | (5) | | | (13) |
| | | | | |
Balance at end of year | $ | 63 | | $ | 105 |
| |
| | |
|
Included in the balance of unrecognized tax benefits at December 31, 2011,2012, are potential benefits of $42$20 million that would affect the effective tax rate if recognized. Unrecognized tax benefits are adjusted in the period in which new information about a tax position becomes available or the final outcome differs from the amount recorded.
NS expects that
Internal Revenue Service (IRS) examinations have been completed for all years prior to 2011. We expect the total amount of unrecognized tax benefits at December 31,IRS to begin auditing our 2011 will decrease by approximately
$10 million inand 2012 due to tax positions for which there was an uncertainty about the timing of deductibility in earlier years but deductibility may become certain by the the close of 2012. NS’ consolidated federal income tax returns for 2009 and 2010 are being audited by the Internal Revenue Service (IRS). NS anticipates that the IRS will complete its examination of the 2009 and 2010 tax years within the next twelve months.in late 2013. State income tax returns generally are subject to examination for a period of three to four years after filing of the return. In addition, NS iswe are generally obligated to report changes in taxable income arising from federal income tax examinations to the states within a period of up to two years from the date the federal examination is final. NS hasWe have various state income tax returns either under examination, administrative appeals, or litigation. It is reasonably possibleWe expect that the total amount of unrecognized tax benefits at December 31, 2012, will decrease by approximately $12 million in 2012 as a result2013 due to tax positions for which there was an uncertainty about the timing of deductibility in earlier years, but deductibility may become certain by the lapseclose of state statutes of limitations, but the amount is not expected to be significant. NS does2013. We do not expect that any of the aforementioned potential changeschange in unrecognized tax benefits will have a material effect on NS’our financial position, results of operations, or liquidity.
Interest related to unrecognized tax benefits, which is included in “Other income – net,” amounted tototaled $1 million of income in 2012, $10 million of income in 2011, and $1 million of expense in 2010, and $6 million of income in 2009.2010. There were no penalties related to tax matters in 2012, 2011, 2010, and 2009. NS has2010. We have recorded a liability of $3 million at December 31, 2012, and $4 million at December 31, 2011, and $14 million at December 31, 2010, for the payment of interest on unrecognized tax benefits. NS hasWe have no liability recorded at
December 31, 20112012 and 2010,2011, for the payment of penalties on unrecognized tax benefits.
4. Fair Value
Fair Value Measurements
ASC 820-10, “Fair Value Measurements,” established a framework for measuring fair value and a fair value hierarchy that prioritizes the inputs to valuation techniques used to measure fair value into three broad levels, as follows:
Level 1 | Inputs to the valuation methodology are unadjusted quoted prices for identical assets or liabilities in active markets that NS haswe have the ability to access. |
| |
Level 2 | Inputs to the valuation methodology include: |
| • Quoted prices for similar assets or liabilities in active markets; • Quoted prices for identical or similar assets or liabilities in inactive markets; • Inputs other than quoted prices that are observable for the asset or liability; • Inputs that are derived principally from or corroborated by observable market data by correlation or other means. |
| |
| If the asset or liability has a specified (contractual) term, the Level 2 input must be observable for substantially the full term of the asset or liability. |
| |
Level 3 | Inputs to the valuation methodology are unobservable and significant to the fair value measurement. |
The asset’s or liability’s fair value measurement level within the hierarchy is based on the lowest level of any input that is significant to the fair value measurement. At December 31, 2011Other than those assets and 2010, forliabilities described below that approximate fair value, there were no assets or liabilities measured at fair value on a recurring basis there were zero and $175 million, respectively, of available-for-sale securities valued under level 2 of the fair value hierarchy. There were no available-for-sale securities valued under level 1at December 31, 2012 or level 3 valuation techniques.2011.
K50
Fair Values of Financial Instruments
NS has
We have evaluated the fair values of financial instruments and methods used to determine those fair values. The fair values of “Cash and cash equivalents,” “Short-term investments,” “Accounts receivable,” “Accounts payable,” and “Short-term debt” approximate carrying values because of the short maturity of these financial instruments. The carrying value of corporate-owned life insurance is recorded at cash surrender value and, accordingly, approximates fair value. The carrying amounts and estimated fair values for the remaining financial instruments, andexcluding investments accounted for under the equity method, consisted of the following at December 31:
| | | | 2011 | | | | 2010 |
| | Carrying | Fair | | Carrying | Fair |
| | Amount | Value | | Amount | Value |
| | | | | | ($ in millions) | | | |
| | | | | | | | | | | | | | |
| Long-term investments | | $ | 151 | | $ | 186 | | | $ | 192 | | $ | 222 |
| Long-term debt, including current maturities | | | (7,440) | | | (9,469) | | | | (6,925) | | | (7,971) |
| 2012 | | 2011 |
| Carrying | | Fair | | Carrying | | Fair |
| Amount | | Value | | Amount | | Value |
| ($ in millions) |
| |
| | |
| | |
| | |
|
Long-term investments | $ | 139 | | $ | 174 | | $ | 151 | | $ | 186 |
Long-term debt, including current maturities | | (8,482) | | | (10,734) | | | (7,440) | | | (9,469) |
Underlying net assets were used to estimate the fair value of investments with the exception of notes receivable, which are based on future discounted cash flows. The fair values of long-term debt were estimated based on quoted market prices or discounted cash flows using current interest rates for debt with similar terms, company rating, and remaining maturity.
Carrying amounts
The following table sets forth the fair value of available-for-sale securities reflect immaterial unrealized holding losses at December 31, 2010. long-term investment and long-term debt balances disclosed above by valuation technique level, within the fair value hierarchy (there were no level 3 valued assets or liabilities).
| December 31, 2012 |
| Level 1 | | Level 2 | | Total |
| ($ in millions) |
| |
| | |
| | |
|
Long-term investments | $ | 41 | | $ | 133 | | $ | 174 |
Long-term debt, including current maturities | | (10,450) | | | (284) | | | (10,734) |
Sales of available-for-sale securities were zero for the year ended December 31, 2012, $81 million for the year ended December 31, 2011, and $225 million for the year ended December 31, 2010 (which included maturities), and immaterial for the year ended December 31, 2009..
K51
5. Investments
| | | | December 31, |
| | | | 2011 | | | 2010 |
| | | | ($ in millions) |
| Short-term investments with average remaining maturities: | | | | | | |
| Available-for-sale: | | | | | | |
| Certificates of deposit, 5 months | | $ | -- | | $ | 76 |
| Corporate bonds, 4 months | | | -- | | | 64 |
| Commercial paper, 4 months | | | -- | | | 35 |
| Total available-for-sale | | | -- | | | 175 |
| Held-to-maturity: | | | | | | |
| Corporate bonds, 10 months | | | -- | | | 59 |
| Federal government bonds, 1 and 9 months, respectively | | | 25 | | | 49 |
| Total held-to-maturity | | | 25 | | | 108 |
| Total short-term investments | | $ | 25 | | $ | 283 |
| | | | | | | |
| Long-term investments: | | | | | | |
| Equity method investments: | | | | | | |
| Conrail Inc. | | $ | 969 | | $ | 959 |
| TTX Company | | | 376 | | | 363 |
| Meridian Speedway LLC | | | 275 | | | 268 |
| Pan Am Southern LLC | | | 151 | | | 140 |
| Other | | | 82 | | | 69 |
| Total equity method investments | | | 1,853 | | | 1,799 |
| | | | | | | |
| Company-owned life insurance at net cash surrender value | | | 230 | | | 202 |
| Corporate bonds, held to maturity, with average maturities | | | | | | |
| of 17 and 29 months, respectively | | | 15 | | | 15 |
| Federal government notes, held to maturity, with average maturities | | | | | | |
| of 20 months | | | -- | | | 40 |
| Other investments | | | 136 | | | 137 |
| Total long-term investments | | $ | 2,234 | | $ | 2,193 |
| December 31, |
| 2012 | | 2011 |
| ($ in millions) |
Short-term investments: | |
| | |
|
Federal government bonds, held-to-maturity, with average | |
| | |
|
maturities of 5 and 1 months, respectively | $ | 15 | | $ | 25 |
| |
| | |
|
Long-term investments: | |
| | |
|
Equity method investments: | |
| | |
|
Conrail Inc. | $ | 996 | | $ | 969 |
TTX Company | | 383 | | | 376 |
Meridian Speedway LLC | | 281 | | | 275 |
Pan Am Southern LLC | | 155 | | | 151 |
Other | | 82 | | | 82 |
Total equity method investments | | 1,897 | | | 1,853 |
| |
| | |
|
Company-owned life insurance at net cash surrender value | | 264 | | | 230 |
Corporate bonds, held-to-maturity, with average maturities | |
| | |
|
of 17 months | | - | | | 15 |
Other investments | | 139 | | | 136 |
| | | | | |
Total long-term investments | $ | 2,300 | | $ | 2,234 |
| |
| | |
|
Investment in Conrail
Through a limited liability company, Norfolk Southernwe and CSX Corporation (CSX) jointly own Conrail Inc. (Conrail), whose primary subsidiary is Consolidated Rail Corporation (CRC). NS hasWe have a 58% economic and 50% voting interest in the jointly owned entity, and CSX has the remainder of the economic and voting interests. NS isWe are amortizing the excess of the purchase price over Conrail’s net equity using the principles of purchase accounting, based primarily on the estimated useful lives of Conrail’s depreciable property and equipment, including the related deferred tax effect of the differences in book and tax accounting bases for such assets, as all of the purchase price at acquisition was allocable to Conrail’s tangible assets and liabilities.
At December 31, 2012, based on the funded status of Conrail’s pension plans, we decreased our proportional investment in Conrail by $7 million. This resulted in a loss of $6 million recorded to “Other comprehensive loss” and a combined federal and state deferred tax asset of $1 million.
At December 31, 2011, based on the funded status of Conrail’s pension plans, NSwe decreased itsour proportional investment in Conrail by $21 million. This resulted in a loss of $19 million recorded to “Other comprehensive loss” and a combined federal and state deferred tax asset of $2 million.
K52
At December 31, 2010, based on the funded status of Conrail’s pension plans, NS increased its proportional investment in Conrail by $9 million. This resulted in income of $8 million recorded to “Other comprehensive loss” and a combined federal and state deferred tax liability of $1 million.
At December 31, 2011,2012, the difference between NS’our investment in Conrail and itsour share of Conrail’s underlying net equity was $542$540 million. NS’Our equity in the earnings of Conrail, net of amortization, included in “Other income – net” was
$31 $34 million, $31 million, and $26 million in 2012, 2011, and $32 million in 2011, 2010, and 2009, respectively.
CRC owns and operates certain properties (the Shared Assets Areas) for the joint and exclusive benefit of NSR and CSX Transportation, Inc. (CSXT). The costs of operating the Shared Assets Areas are borne by NSR and CSXT based on usage. In addition, NSR and CSXT pay CRC a fee for access to the Shared Assets Areas. “Purchased services and rents” and “Fuel” include expenses for amounts due to CRC for operation of the Shared Assets Areas totaling
$131 $147 million in 2012, $131 million in 2011, and $118 million in 2010, and $123 million in 2009.2010. Future minimum lease payments due to CRC under the Shared Assets Areas agreements are as follows: $33 million in each of 20122013 through 20162017 and $243$217 million thereafter. NS providesWe provide certain general and administrative support functions to Conrail, the fees for which are billed in accordance with several service-provider arrangements and approximate $7 million annually.
“Accounts payable” includes $178 million at December 31, 2012, and $160 million at December 31, 2011, and $128 million at December 31, 2010, due to Conrail for the operation of the Shared Assets Areas. In addition, “Other liabilities” includes $133 million at
both December 31, 20112012 and 2010,2011, for long-term advances from Conrail, maturing 2035, that bear interest at an average rate of 4.4%.
6. Properties
| | | | | | | Accumulated | | | Net Book | | | Depreciation |
| As of December 31, 2011 | | | Cost | | | Depreciation | | | Value | | | Rate(a) |
| | | | | | | ($ in millions) | | | | | |
| | | | | | | | | | | | | | | | | |
| Land | | $ | 2,209 | | | $ | -- | | | $ | 2,209 | | | | -- | |
| | | | | | | | | | | | | | | | | |
| Roadway: | | | | | | | | | | | | | | | | |
| Rail and other track material | | | 5,490 | | | | (1,643) | | | | 3,847 | | | | 2.44% | |
| Ties | | | 4,015 | | | | (973) | | | | 3,042 | | | | 3.33% | |
| Ballast | | | 2,010 | | | | (418) | | | | 1,592 | | | | 2.66% | |
| Construction in process | | | 302 | | | | -- | | | | 302 | | | | -- | |
| Other roadway | | | 10,779 | | | | (2,486) | | | | 8,293 | | | | 2.71% | |
| Total roadway | | | 22,596 | | | | (5,520) | | | | 17,076 | | | | | |
| | | | | | | | | | | | | | | | | |
| Equipment: | | | | | | | | | | | | | | | | |
| Locomotives | | | 4,287 | | | | (1,692) | | | | 2,595 | | | | 3.05% | |
| Freight cars | | | 3,008 | | | | (1,466) | | | | 1,542 | | | | 2.27% | |
| Computers | | | 408 | | | | (277) | | | | 131 | | | | 11.21% | |
| Construction in process | | | 224 | | | | -- | | | | 224 | | | | -- | |
| Other equipment | | | 732 | | | | (252) | | | | 480 | | | | 4.85% | |
| Total equipment | | | 8,659 | | | | (3,687) | | | | 4,972 | | | | | |
| | | | | | | | | | | | | | | | | |
| Other property | | | 469 | | | | (257) | | | | 212 | | | | 1.43% | |
| Total properties | | $ | 33,933 | | | $ | (9,464) | | | $ | 24,469 | | | | | |
K53
| | | Accumulated | | Net Book | | Depreciation | |
At December 31, 2012 | Cost | | Depreciation | | Value | | Rate | (a) |
| ($ in millions) | |
| |
| | |
| | |
| | |
|
|
Land | $ | 2,240 | | $ | - | | $ | 2,240 | | | - |
|
| |
| | |
| | |
| | |
|
|
Roadway: | |
| | |
| | |
| | |
|
|
Rail and other track material | | 5,699 | | | (1,707) | | | 3,992 | | | 2.39% |
|
Ties | | 4,255 | | | (1,027) | | | 3,228 | | | 3.29% |
|
Ballast | | 2,128 | | | (437) | | | 1,691 | | | 2.61% |
|
Construction in process | | 378 | | | - | | | 378 | | | - |
|
Other roadway | | 11,223 | | | (2,636) | | | 8,587 | | | 2.68% |
|
Total roadway | | 23,683 | | | (5,807) | | | 17,876 | | |
|
|
| |
| | |
| | |
| | |
|
|
Equipment: | |
| | |
| | |
| | |
|
|
Locomotives | | 4,576 | | | (1,798) | | | 2,778 | | | 3.05% |
|
Freight cars | | 3,214 | | | (1,502) | | | 1,712 | | | 2.27% |
|
Computers | | 480 | | | (270) | | | 210 | | | 12.27% |
|
Construction in process | | 177 | | | - | | | 177 | | | - |
|
Other equipment | | 817 | | | (282) | | | 535 | | | 5.49% |
|
Total equipment | | 9,264 | | | (3,852) | | | 5,412 | | |
|
|
| |
| | |
| | |
| | |
|
|
Other property | | 471 | | | (263) | | | 208 | | | 1.31% |
|
| | | | | | | | | | | | |
Total properties | $ | 35,658 | | $ | (9,922) | | $ | 25,736 | | |
|
|
| | | Accumulated | | Net Book | | Depreciation | |
At December 31, 2011 | Cost | | Depreciation | | Value | | Rate | (a) |
| ($ in millions) | |
| |
| | |
| | |
| | |
|
|
Land | $ | 2,209 | | $ | - | | $ | 2,209 | | | - |
|
| |
| | |
| | |
| | |
|
|
Roadway: | |
| | |
| | |
| | |
|
|
Rail and other track material | | 5,490 | | | (1,643) | | | 3,847 | | | 2.44% |
|
Ties | | 4,015 | | | (973) | | | 3,042 | | | 3.33% |
|
Ballast | | 2,010 | | | (418) | | | 1,592 | | | 2.66% |
|
Construction in process | | 302 | | | - | | | 302 | | | - |
|
Other roadway | | 10,779 | | | (2,486) | | | 8,293 | | | 2.71% |
|
Total roadway | | 22,596 | | | (5,520) | | | 17,076 | | |
|
|
| |
| | |
| | |
| | |
|
|
Equipment: | |
| | |
| | |
| | |
|
|
Locomotives | | 4,287 | | | (1,692) | | | 2,595 | | | 3.05% |
|
Freight cars | | 3,008 | | | (1,466) | | | 1,542 | | | 2.27% |
|
Computers | | 408 | | | (277) | | | 131 | | | 11.21% |
|
Construction in process | | 224 | | | - | | | 224 | | | - |
|
Other equipment | | 732 | | | (252) | | | 480 | | | 4.85% |
|
Total equipment | | 8,659 | | | (3,687) | | | 4,972 | | |
|
|
| |
| | |
| | |
| | |
|
|
Other property | | 469 | | | (257) | | | 212 | | | 1.43% |
|
| | | | | | | | | | | | |
Total properties | $ | 33,933 | | $ | (9,464) | | $ | 24,469 | | |
|
|
(a) Composite annual depreciation rate for the underlying assets.
Roadway and equipment property includes $9 million at December 31, 2012, and $93 million at December 31, 2011, and $157 million at December 31, 2010, of assets recorded pursuant to capital leases with accumulated amortization of $3 million and $38 million and $60 million at
December 31, 20112012 and 2010,2011, respectively. Other property includes the costs of obtaining rights to natural resources of $336 million at both December 31, 20112012 and 2010,2011, with accumulated depletion of $190$192 million and $187$190 million, respectively.
Capitalized Interest
Total interest cost incurred on debt was $515 million in 2012, $474 million in 2011, and $477 million in 2010, and $484 million in 2009, of which $20 million, $19 million, $15 million, and $17$15 million, respectively, was capitalized.
K54
7. Current Liabilities
| | | | December 31, |
| | | | 2011 | | | 2010 |
| | | | ($ in millions) |
| Accounts payable: | | | | | | |
| Accounts and wages payable | | $ | 499 | | $ | 572 |
| Casualty and other claims (Note 16) | | | 201 | | | 254 |
| Due to Conrail (Note 5) | | | 160 | | | 128 |
| Vacation liability | | | 123 | | | 122 |
| Equipment rents payable - net | | | 79 | | | 80 |
| Other | | | 30 | | | 25 |
| Total | | $ | 1,092 | | $ | 1,181 |
| | | | | | | |
| Other current liabilities: | | | | | | |
| Interest payable | | $ | 106 | | $ | 108 |
| Retiree benefit obligations (Note 11) | | | 68 | | | 67 |
| Liabilities for forwarded traffic | | | 60 | | | 52 |
| Other | | | 18 | | | 17 |
| Total | | $ | 252 | | $ | 244 |
K55
| December 31, |
| 2012 | | 2011 |
| ($ in millions) |
Accounts payable: | |
| | |
|
Accounts and wages payable | $ | 777 | | $ | 499 |
Casualty and other claims (Note 16) | | 183 | | | 201 |
Due to Conrail (Note 5) | | 178 | | | 160 |
Vacation liability | | 129 | | | 123 |
Other | | 95 | | | 109 |
| | | | | |
Total | $ | 1,362 | | $ | 1,092 |
| |
| | |
|
Other current liabilities: | |
| | |
|
Interest payable | $ | 112 | | $ | 106 |
Postretirement and pension benefit obligations (Note 11) | | 70 | | | 68 |
Other | | 81 | | | 78 |
| | | | | |
Total | $ | 263 | | $ | 252 |
8. Debt
Debt with weighted average interest rates and maturities is presented below:
| | | | December 31, |
| | | | 2011 | | | 2010 |
| | | | ($ in millions) |
| Notes and debentures: | | | | | | |
| 5.52%, maturing to 2016 | | $ | 931 | | $ | 1,231 |
| 6.68%, maturing 2017 and 2018 | | | 1,150 | | | 1,150 |
| 6.18%, maturing 2019 to 2021 | | | 1,397 | | | 897 |
| 6.82%, maturing 2025 to 2031 | | | 1,629 | | | 1,657 |
| 6.22%, maturing 2037 to 2043 | | | 1,029 | | | 855 |
| 6.39%, maturing 2097 to 2111 | | | 1,328 | | | 900 |
| Securitization borrowings, 1.35% | | | 200 | | | 200 |
| Other debt, 6.01%, maturing to 2024 | | | 199 | | | 251 |
| Discounts and premiums, net | | | (323) | | | (116) |
| Total debt | | | 7,540 | | | 7,025 |
| Less current maturities and short-term debt | | | (150) | | | (458) |
| Long-term debt excluding current maturities and short-term debt | | $ | 7,390 | | $ | 6,567 |
| | | | | | | |
| Long-term debt maturities subsequent to 2012 are as follows: | | | | | | |
| 2013 | | $ | 46 | | | |
| 2014 | | | 446 | | | |
| 2015 | | | 1 | | | |
| 2016 | | | 500 | | | |
| 2017 and subsequent years | | | 6,397 | | | |
| Total | | $ | 7,390 | | | |
| December 31, |
| 2012 | | 2011 |
| ($ in millions) |
Notes and debentures: | |
| | |
|
6.34% maturing to 2017 | $ | 1,482 | | $ | 1,481 |
5.82% maturing 2018 to 2019 | | 1,100 | | | 1,100 |
5.04% maturing 2020 to 2022 | | 1,497 | | | 897 |
5.90% maturing 2023 to 2031 | | 1,746 | | | 1,629 |
5.22% maturing 2037 to 2043 | | 1,590 | | | 1,029 |
6.39% maturing 2097 to 2111 | | 1,328 | | | 1,328 |
Securitization borrowings, 1.28% | | 300 | | | 200 |
Other debt, 7.05%, maturing to 2024 | | 151 | | | 199 |
Discounts and premiums, net | | (512) | | | (323) |
Total debt | | 8,682 | | | 7,540 |
Less current maturities and short-term debt | | (250) | | | (150) |
| | | | | |
Long-term debt excluding current maturities and short-term debt | $ | 8,432 | | $ | 7,390 |
Long-term debt maturities subsequent to 2013 are as follows: | | |
2014 | $ | 446 |
2015 | | 1 |
2016 | | 500 |
2017 | | 550 |
2018 and subsequent years | | 6,935 |
| | |
Total | $ | 8,432 |
During the third quarter of 2012, we issued $600 million of senior notes at 2.90% due 2023 and paid $115 million of premium in exchange for $521 million of our previously issued notes ($156 million at 7.25% due 2031, $140 million at 5.64% due 2029, $115 million at 5.59% due 2025, $72 million at 7.80% due 2027, and $38 million at 7.05% due 2037). The premium is reflected as a reduction of debt in the 2012 Consolidated Balance Sheet and within “Debt repayments” in the 2012 Statement of Cash Flows and will be amortized as additional interest expense over the term of the new debt. No gain or loss was recognized as a result of the debt exchange. Also during the third quarter of 2012, we issued $600 million of 3.95% senior notes due 2042.
During the first quarter of 2012, we issued $600 million of 3.00% senior notes due 2022.
During the fourth quarter of 2011, NSwe issued $500 million of 3.25% senior notes due 2021 and an additional
$100 $100 million of 6%6.00% senior notes due 2111.
During the third quarter of 2011, NSwe issued $600 million of unsecured notes ($596 million at 4.837%4.84% due 2041 and
$4 $4 million at 6%6.00% due 2111) and paid $146 million of premium in exchange for $526 million of its previously issued unsecured notes ($422 million at 7.05% due 2037, $77 million at 7.90% due 2097, and $27 million at 7.25% due 2031). The premium is reflected as a reduction of debt in the 2011 Consolidated Balance SheetSheets and within “Debt repayments” in the 2011 Statement of Cash Flows and will be amortized as additional interest expense over the terms of the new debt. No gain or loss was recognized as a result of the debt exchange.
During the second quarter of 2011, NSwe issued an additional $400 million of 6%6.00% senior notes due 2111.
During the third quarter of 2010, NS issued an additional $250 million of 6% senior notes due 2105.
NS hasWe have in place a $350 million receivables securitization facility under which NSR sells substantially all of its eligible third-party receivables to a subsidiary, which in turn may transfer beneficial interests in the receivables to various commercial paper vehicles. Amounts received under the facility are accounted for as borrowings. Under this facility, NSwe received $300 million and repaid $100$200 million in 2011.2012.
K56
At December 31, 20112012 and 2010,2011, respectively, the amounts outstanding under the receivables securitization facility were $200$300 million at an average variable interest rate of 1.35%1.28% and $200 million at an average variable interest rate of 1.54%1.35%. NS’Our intent is to refinance $100 million of these borrowings on a long-term basis, which is supported by its
$750our $750 million credit agreement (see below). Accordingly, these amounts outstanding are included in the line item “Long-term debt” and the remaining $100$200 million outstanding at December 31, 2012 and
$100 million outstanding at December 31, 2011, and 2010, respectively, isare included in the line item “Short-term debt” in the Consolidated Balance Sheets. The facility has a 364-day term which was renewed and amended in October 20112012 to run until October 2012.2013. At December 31, 2012 and 2011, and 2010, the amounts of receivables included in “Accounts receivable – net” serving as collateral for these borrowings weretotaled $751 million and $745 million, and $647 million, respectively.
The
Some equipment obligations and the capitalized leaseslease obligations are secured by liens on the underlying equipment. Certain lease obligations requirewhich expired during the first quarter of 2012 required the maintenance of yen-denominated deposits, which arewere pledged to the lessor to satisfy yen-denominated lease payments. These deposits arewere included in “Other assets” in the 2011 Consolidated Balance SheetsSheet and totaled $14 million at December 31, 2011, and $35 million at December 31, 2010.2011.
Issuance of Debt or Equity Securities
NS has
We have authority from itsour Board of Directors to issue an additional $1 billion$600 million of debt or equity securities through public or private sale.
Credit Agreement, Debt Covenants, and Commercial Paper
In December 2011, NS renewed
We have in place and amended itsavailable a $750 million, five-year credit agreement expiring in 2016, which provides for borrowings at prevailing rates and includes covenants. The renewed and amended, five-year agreement, which expires in 2016, reduced the total amount that can be borrowed from $1 billion to $750 million to more closely match NS’ liquidity requirements. NSWe had no amounts outstanding under this facility at December 31, 2012 and 2011, and 2010, and NS iswe are in compliance with all of its covenants.
NS has
We have the ability to issue commercial paper supported by itsthe $750 million credit agreement. At December 31, 2012 and 2011, and 2010, NSwe had no outstanding commercial paper.
9. Lease Commitments
NS is
We are committed under long-term lease agreements, which expire on various dates through 2067, for equipment, lines of road and other property. The following amounts do not include payments to CRC under the Shared Assets Areas agreements (see Note(Note 5). Future minimum lease payments and operating lease expense are as follows:
Future Minimum Lease Payments
| | | | Operating | | | Capital | |
| | | | Leases | | | Leases | |
| | | | ($ in millions) | |
| | | | | | | | |
| 2012 | | $ | 96 | | $ | 19 | |
| 2013 | | | 89 | | | 3 | |
| 2014 | | | 67 | | | 2 | |
| 2015 | | | 41 | | | 1 | |
| 2016 | | | 31 | | | -- | |
| 2017 and subsequent years | | | 261 | | | 2 | |
| Total | | $ | 585 | | | 27 | |
| Less imputed interest on capital leases at an average rate of 5.1% | | | | | | (2) | |
| Present value of minimum lease payments included in debt | | | | | $ | 25 | |
K57
| Operating | | Capital |
| Leases | | Leases |
| ($ in millions) |
| |
| | |
|
2013 | $ | 91 | | $ | 3 |
2014 | | 78 | | | 2 |
2015 | | 63 | | | 1 |
2016 | | 51 | | | - |
2017 | | 44 | | | - |
2018 and subsequent years | | 422 | | | 2 |
| | | | | |
Total | $ | 749 | | | 8 |
Less imputed interest on capital leases at an average rate of 5.30% | |
| | | (1) |
| | | | | |
Present value of minimum lease payments included in debt | |
| | $ | 7 |
Operating Lease Expense
| | | | 2011 | | | 2010 | | | 2009 | |
| | | | | ($ in millions) | | |
| | | | | | | | | | | |
| Minimum rents | | $ | 150 | | $ | 159 | | $ | 163 | |
| Contingent rents | | | 77 | | | 79 | | | 65 | |
| Total | | $ | 227 | | $ | 238 | | $ | 228 | |
| 2012 | | 2011 | | 2010 |
| ($ in millions) |
| |
| | |
| | |
|
Minimum rents | $ | 129 | | $ | 150 | | $ | 159 |
Contingent rents | | 73 | | | 77 | | | 79 |
| | | | | | | | |
Total | $ | 202 | | $ | 227 | | $ | 238 |
Contingent rents are primarily comprised of usage-based rent paid to other railroads for joint facility operations.
10. Other Liabilities
| | | | December 31, |
| | | | 2011 | | | 2010 | |
| | | | ($ in millions) | |
| | | | | | | | |
| Net retiree health and death benefit obligations (Note 11) | | $ | 964 | | $ | 849 | |
| Net pension obligations (Note 11) | | | 346 | | | 185 | |
| Casualty and other claims (Note 16) | | | 275 | | | 261 | |
| Long-term advances from Conrail (Note 5) | | | 133 | | | 133 | |
| Deferred compensation | | | 119 | | | 124 | |
| Federal and state income taxes | | | 67 | | | 82 | |
| Other | | | 146 | | | 159 | |
| Total | | $ | 2,050 | | $ | 1,793 | |
K58
| December 31, |
| 2012 | | 2011 |
| ($ in millions) |
| |
| | |
|
Net postretirement benefit obligations (Note 11) | $ | 1,049 | | $ | 964 |
Net pension benefit obligations (Note 11) | | 482 | | | 346 |
Casualty and other claims (Note 16) | | 258 | | | 275 |
Long-term advances from Conrail (Note 5) | | 133 | | | 133 |
Other | | 315 | | | 332 |
| | | | | |
Total | $ | 2,237 | | $ | 2,050 |
11. Pensions and Other Postretirement Benefits
Norfolk Southern and certain subsidiaries
We have both funded and unfunded defined benefit pension plans covering principally salaried employees. Norfolk Southern and certain subsidiariesWe also provide specified health care and death benefits to eligible retired employees and their dependents. Under the presentdependents; these plans which maycan be amended or terminated at NS’ option,our option. Under our health care plans, a defined percentage of health care expenses is covered, reduced by any deductibles,
co-payments, Medicare payments and, in some cases, coverage provided under other group insurance policies.
Pension and Other Postretirement Benefit Obligations and Plan Assets
| | | | | | | | | | Other Postretirement | |
| | | | Pension Benefits | | | Benefits | |
| | | | 2011 | | | 2010 | | | 2011 | | | 2010 | |
| | | | | | | ($ in millions) | | | | |
| Change in benefit obligations | | | | | | | | | | | | | |
| Benefit obligation at beginning of year | | $ | 1,813 | | $ | 1,696 | | $ | 1,082 | | $ | 1,044 | |
| Service cost | | | 28 | | | 26 | | | 14 | | | 16 | |
| Interest cost | | | 92 | | | 96 | | | 58 | | | 61 | |
| Actuarial losses | | | 209 | | | 108 | | | 101 | | | 10 | |
| Benefits paid | | | (115) | | | (113) | | | (49) | | | (49) | |
| Benefit obligation at end of year | | | 2,027 | | | 1,813 | | | 1,206 | | | 1,082 | |
| | | | | | | | | | | | | | |
| Change in plan assets | | | | | | | | | | | | | |
| Fair value of plan assets at beginning of year | | | 1,756 | | | 1,542 | | | 178 | | | 161 | |
| Actual return on plan assets | | | 18 | | | 216 | | | 8 | | | 17 | |
| Employer contribution | | | 11 | | | 111 | | | 49 | | | 49 | |
| Benefits paid | | | (115) | | | (113) | | | (49) | | | (49) | |
| Fair value of plan assets at end of year | | | 1,670 | | | 1,756 | | | 186 | | | 178 | |
| | | | | | | | | | | | | | |
| Funded status at end of year | | $ | (357) | | $ | (57) | | $ | (1,020) | | $ | (904) | |
| | | | | | | | | | | | | | |
| Amounts recognized in the Consolidated | | | | | | | | | | | | | |
| Balance Sheets consist of: | | | | | | | | | | | | | |
| Noncurrent assets | | $ | 1 | | $ | 140 | | $ | -- | | $ | -- | |
| Current liabilities | | | (12) | | | (12) | | | (56) | | | (55) | |
| Noncurrent liabilities | | | (346) | | | (185) | | | (964) | | | (849) | |
| Net amount recognized | | $ | (357) | | $ | (57) | | $ | (1,020) | | $ | (904) | |
| | | | | | | | | | | | | | |
| Amounts recognized in accumulated other | | | | | | | | | | | | | |
| comprehensive loss (pretax) consist of: | | | | | | | | | | | | | |
| Net loss | | $ | 1,071 | | $ | 807 | | $ | 434 | | $ | 370 | |
| Prior service cost | | | 4 | | | 7 | | | -- | | | -- | |
NS’
| | | Other Postretirement |
| Pension Benefits | | Benefits |
| 2012 | | 2011 | | 2012 | | 2011 |
| ($ in millions) |
Change in benefit obligations: | |
| | |
| | |
| | |
|
Benefit obligation at beginning of year | $ | 2,027 | | $ | 1,813 | | $ | 1,206 | | $ | 1,082 |
Service cost | | 34 | | | 28 | | | 15 | | | 14 |
Interest cost | | 89 | | | 92 | | | 54 | | | 58 |
Actuarial losses | | 253 | | | 209 | | | 82 | | | 101 |
Benefits paid | | (118) | | | (115) | | | (46) | | | (49) |
Benefit obligation at end of year | | 2,285 | | | 2,027 | | | 1,311 | | | 1,206 |
| |
| | |
| | |
| | |
|
Change in plan assets: | |
| | |
| | |
| | |
|
Fair value of plan assets at beginning of year | | 1,670 | | | 1,756 | | | 186 | | | 178 |
Actual return on plan assets | | 227 | | | 18 | | | 19 | | | 8 |
Employer contribution | | 12 | | | 11 | | | 46 | | | 49 |
Benefits paid | | (118) | | | (115) | | | (46) | | | (49) |
Fair value of plan assets at end of year | | 1,791 | | | 1,670 | | | 205 | | | 186 |
| | | | | | | | | | | |
Funded status at end of year | $ | (494) | | $ | (357) | | $ | (1,106) | | $ | (1,020) |
| |
| | |
| | |
| | |
|
Amounts recognized in the Consolidated | |
| | |
| | |
| | |
|
Balance Sheets: | |
| | |
| | |
| | |
|
Noncurrent assets | $ | 1 | | $ | 1 | | $ | - | | $ | - |
Current liabilities | | (13) | | | (12) | | | (57) | | | (56) |
Noncurrent liabilities | | (482) | | | (346) | | | (1,049) | | | (964) |
| | | | | | | | | | | |
Net amount recognized | $ | (494) | | $ | (357) | | $ | (1,106) | | $ | (1,020) |
| |
| | |
| | |
| | |
|
Amounts recognized in accumulated other | |
| | |
| | |
| | |
|
comprehensive loss (pretax): | |
| | |
| | |
| | |
|
Net loss | $ | 1,160 | | $ | 1,071 | | $ | 459 | | $ | 434 |
Prior service cost | | 4 | | | 4 | | | - | | | - |
Our accumulated benefit obligation for itsour defined benefit pension plans is $2.1 billion and $1.9 billion and $1.7 billion at
December 31, 2012 and 2011, and 2010, respectively. NS’Our unfunded pension plans, included above, which in all cases have no assets and therefore have an accumulated benefit obligation in excess of plan assets, had projected benefit obligations of $239 million at December 31, 2012, and $219 million at December 31, 2011, and $197 million at December 31, 2010, and had accumulated benefit obligations of $215 million at December 31, 2012, and $195 million at December 31, 2011, and $177 million at December 31, 2010.2011.
K59
Pension and Other Postretirement Benefit Cost Components
| | | | 2011 | | | 2010 | | | 2009 | |
| | | | | ($ in millions) | | |
| | | | | | | | | | | |
| Pension benefits | | | | | | | | | | |
| Service cost | | $ | 28 | | $ | 26 | | $ | 26 | |
| Interest cost | | | 92 | | | 96 | | | 101 | |
| Expected return on plan assets | | | (140) | | | (142) | | | (154) | |
| Amortization of net losses | | | 67 | | | 48 | | | 25 | |
| Amortization of prior service cost | | | 3 | | | 3 | | | 3 | |
| Net cost | | $ | 50 | | $ | 31 | | $ | 1 | |
| | | | | | | | | | | |
| Other postretirement benefits | | | | | | | | | | |
| Service cost | | $ | 14 | | $ | 16 | | $ | 16 | |
| Interest cost | | | 58 | | | 61 | | | 57 | |
| Expected return on plan assets | | | (15) | | | (15) | | | (15) | |
| Amortization of net losses | | | 44 | | | 52 | | | 35 | |
| Amortization of prior service benefit | | | -- | | | -- | | | (2) | |
| Net cost | | $ | 101 | | $ | 114 | | $ | 91 | |
| 2012 | | 2011 | | 2010 |
| ($ in millions) |
Pension benefits: | |
| | |
| | |
|
Service cost | $ | 34 | | $ | 28 | | $ | 26 |
Interest cost | | 89 | | | 92 | | | 96 |
Expected return on plan assets | | (138) | | | (140) | | | (142) |
Amortization of net losses | | 75 | | | 67 | | | 48 |
Amortization of prior service cost | | - | | | 3 | | | 3 |
| | | | | | | | |
Net cost | $ | 60 | | $ | 50 | | $ | 31 |
| |
| | |
| | |
|
Other postretirement benefits: | |
| | |
| | |
|
Service cost | $ | 15 | | $ | 14 | | $ | 16 |
Interest cost | | 54 | | | 58 | | | 61 |
Expected return on plan assets | | (15) | | | (15) | | | (15) |
Amortization of net losses | | 53 | | | 44 | | | 52 |
| | | | | | | | |
Net cost | $ | 107 | | $ | 101 | | $ | 114 |
Other Changes in Plan Assets and Benefit Obligations Recognized in Other Comprehensive Loss
| | | 2011 | |
| | | | | Other |
| | | Pension | | Postretirement |
| | | Benefits | | Benefits |
| | | ($ in millions) | |
| | | | | | | | |
| Net loss arising during the year | $ | 331 | | | $ | 108 | |
| Amortization of net losses | | (67) | | | | (44) | |
| Amortization of prior service cost | | (3) | | | | -- | |
| Total recognized in other comprehensive loss | $ | 261 | | | $ | 64 | |
Total recognized in net periodic cost
and other comprehensive loss | $ | 311 | | | $ | 165 | |
| | 2012 | |
| | | | Other |
| Pension | | | Postretirement |
| Benefits | | | Benefits |
| ($ in millions) |
| |
| | | |
|
Net loss arising during the year | $ | 164 | | | $ | 78 |
Amortization of net losses | | (75) | | | | (53) |
| | | | | | |
Total recognized in other comprehensive loss | $ | 89 | | | $ | 25 |
Total recognized in net periodic cost | |
| | | |
|
and other comprehensive loss | $ | 149 |
|
| $ | 132 |
The estimated net losslosses and prior service cost for the pension benefit plans that will be amortized from accumulated other comprehensive loss into net periodic cost over the next year are $75$88 million and zero,$1 million, respectively. The estimated net losslosses for the other postretirement benefit plans that will be amortized from accumulated other comprehensive loss into net periodic cost over the next year is $52are $57 million.
Pension and Other Postretirement BenefitBenefits Assumptions
Pension
Costs for pension and other postretirement benefit costsbenefits are determined based on actuarial valuations that reflect appropriate assumptions as of the measurement date, ordinarily the beginning of each year. The funded status of the plans is determined using appropriate assumptions as of each year end. A summary of the major assumptions follows:
| | | 2011 | | 2010 | | 2009 | |
| | | | | | | | |
| Pension funded status: | | | | | | | |
| Discount rate | | 4.5% | | 5.25% | | 5.85% | |
| Future salary increases | | 4.5% | | 4.5% | | 4.5% | |
| Other postretirement benefits funded status: | | | | | | | |
| Discount rate | | 4.55% | | 5.4% | | 5.85% | |
| Pension cost: | | | | | | | |
| Discount rate | | 5.25% | | 5.85% | | 6.25% | |
| Return on assets in plans | | 8.75% | | 8.75% | | 8.75% | |
| Future salary increases | | 4.5% | | 4.5% | | 4.5% | |
| Other postretirement benefits cost: | | | | | | | |
| Discount rate | | 5.4% | | 5.85% | | 6.25% | |
| Return on assets in plans | | 8.5% | | 8.5% | | 8.5% | |
| Health care trend rate | | 8.1% | | 8.5% | | 8.8% | |
| 2012 | | 2011 | | 2010 |
| |
| | |
| | |
|
Pension funded status: | |
| | |
| | |
|
Discount rate | | 3.65% | | | 4.50% | | | 5.25% |
Future salary increases | | 4.50% | | | 4.50% | | | 4.50% |
Other postretirement benefits funded status: | |
| | |
| | |
|
Discount rate | | 3.80% | | | 4.55% | | | 5.40% |
Pension cost: | |
| | |
| | |
|
Discount rate | | 4.50% | | | 5.25% | | | 5.85% |
Return on assets in plans | | 8.25% | | | 8.75% | | | 8.75% |
Future salary increases | | 4.50% | | | 4.50% | | | 4.50% |
Other postretirement benefits cost: | |
| | |
| | |
|
Discount rate | | 4.55% | | | 5.40% | | | 5.85% |
Return on assets in plans | | 8.00% | | | 8.50% | | | 8.50% |
Health care trend rate | | 7.70% | | | 8.10% | | | 8.50% |
| |
| | |
| | |
|
To determine the discount rates, NS utilizedwe utilize analyses in which the projected annual cash flows from the pension and other postretirement benefit plans were matched with yield curves based on an appropriate universe of high-quality corporate bonds. NS usesWe use the results of the yield curve analyses to select the discount rates that match the payment streams of the benefits in these plans.
Health Care Cost Trend Assumptions
For measurement purposes at December 31, 2011,2012, increases in the per capita cost of covered health care benefits were assumed to be 7.7%7.3% for 2012.2013. It is assumed the rate will decrease gradually to an ultimate rate of 5%5.0% for 2019 and remain at that level thereafter.
Assumed health care cost trend rates have a significant effect on the amounts reported in the consolidated financial statements. To illustrate, a one-percentage-pointone-percentage point change in the assumed health care cost trend would have the following effects:
| | | | One percentage point | |
| | | | Increase | | | Decrease | |
| | | | ($ in millions) | |
| Increase (decrease) in: | | | | | | | |
| Total service and interest cost components | | $ | 11 | | $ | (9) | |
| Postretirement benefit obligation | | | 168 | | | (138) | |
K61
| One-percentage point |
| Increase | | Decrease |
| ($ in millions) |
Increase (decrease) in: | |
| | |
|
Total service and interest cost components | $ | 11 | | $ | (9) |
Postretirement benefit obligation | | 190 | | | (156) |
Asset Management
Ten
Nine investment firms manage NS’our defined benefit pension plan’splans’ assets under investment guidelines approved by the Boardour Benefits Investment Committee that is comprised of Directors prior to 2011 and, effective for 2011, approved by a management committee.members of our management. Investments are restricted to domestic fixed incomeand international equity securities, domestic and international fixed income securities, domestic and international equity investments, and unleveraged exchange-traded options and financial futures. Limitations restrict investment concentration and use of certain derivative investments. The target asset allocation for equity is 75% of the pension plan’splans’ assets. The fixed income portfolio is invested in the Barclays Government/Credit Bond Index Fund, except that the Canadian earmarked portion of the Fundportfolio is maintained in U.S. Treasury Bonds. Equity investments must be in liquid securities listed on national exchanges. No investment is permitted in theour securities of Norfolk Southern or its subsidiaries (except through commingled pension trust funds). Investment managers’ returns are expected to meet or exceed selected market indices by prescribed margins.
NS’
Our pension planplans’ weighted-average asset allocations, by asset category, were as follows:
| | | | Percentage of plan | |
| | | | assets at December 31, | |
| | | | 2011 | | | 2010 | |
| | | | | | | | |
| Domestic equity securities | | | 56% | | | 54% | |
| International equity securities | | | 17% | | | 12% | |
| Debt securities | | | 25% | | | 21% | |
| Cash and cash equivalents | | | 2% | | | 13% | |
| Total | | | 100% | | | 100% | |
| Percentage of plan |
| assets at December 31, |
| 2012 | | 2011 |
| |
| | |
|
Domestic equity securities | | 52% | | | 56% |
International equity securities | | 22% | | | 17% |
Debt securities | | 24% | | | 25% |
Cash and cash equivalents | | 2% | | | 2% |
| | | | | |
Total | | 100% | | | 100% |
The other postretirement benefit plan assets consist primarily of trust-owned variable life insurance policies with an asset allocation at December 31, 2011,2012, of 58% in equity securities and 42% in debt securities compared with 56% in equity securities and 44% in debt securities compared with 58% in equity securities and 42% in debt securities at December 31, 2010.2011. The target asset allocation for equity is between 50% and 75% of the plan’s assets.
The plans’ assumed future returns are based principally on the asset allocations and historic returns for the plans’ asset classes determined from both actual plan returns and, over longer time periods, market returns for those asset classes. The expected long-term rate of return on plan assets is applied to a calculated value of plan assets that recognizes changes in fair value over a three-year period. NSWe assumed a rate of return on pension plan assets of 8.25% for 2012 and 8.75% for both 2011 2010, and 2009.2010. A one percentageone-percentage point change to the rate of return assumption would result in a $16$17 million change to the net pension cost and, as a result, an equal change in “Compensation and benefits” expense. For 2012, NS assumes2013, we assume an 8.25% return on pension plan assets.
K62
Fair Value of Plan Assets
Following is a description of the valuation methodologies used for pension plan assets measured at fair value.
Common stock: Shares held by the plan at year end are valued at the official closing price as defined by the exchange or at the most recent trade price of a security at the close of the active market.
Common collective trusts: Valued at the net asset value (NAV) of shares held by the plan at year end, based on the quoted market prices of the underlying assets of the trusts. The investments are valued using NAV as a practical expedient for fair value. The common collective trusts hold equity securities, fixed income securities and cash and cash equivalents.
Corporate bonds and other fixed income instruments: When available, valued at an estimated price at which a dealer would pay for a similar security at year end using observable market inputs. Otherwise, valued at an estimated price at which a dealer would pay for a similar security at year end using unobservable market inputs.
Municipal bonds: Valued at an estimated price at which a dealer would pay for a security at year end using observable market based inputs.
Commingled funds: Valued at the NAV of shares held by the plan at year end, based on the quoted market prices of the underlying assets of the funds. The investments are valued using NAV as a practical expedient for fair value. The commingled funds hold equity securities.
Interest bearing cash: Short-term bills or notes are valued at an estimated price at which a dealer would pay for the security at year end using observable market based inputs; money market funds are valued at the closing price reported on the active market on which the funds are traded.
United States Government and agencies securities: Valued at an estimated price at which a dealer would pay for a security at year end using observable as well as unobservable market based inputs. Inflation adjusted instruments utilize the appropriate index factor.
Preferred stock: Shares held by the plan at year end are valued at the most recent trade price of a security at the close of the active market or at an estimated price at which a dealer would pay for a similar security at year end using primarily observable as well as unobservable market-based inputs.
K63
The following table sets forth the pension planplans’ assets by valuation technique level, within the fair value hierarchy (there were no level 3 valued assets).
| | | | | | | 2011 | | | | |
| | | | Level 1 | | | Level 2 | | | Total | |
| | | | | | ($ in millions) | | | |
| | | | | | | | | | | |
| Common stock | | $ | 1,017 | | $ | -- | | $ | 1,017 | |
| Common collective trusts: | | | | | | | | | | |
| Debt securities | | | -- | | | 416 | | | 416 | |
| International equity securities | | | -- | | | 154 | | | 154 | |
| Commingled funds | | | -- | | | 42 | | | 42 | |
| Interest bearing cash | | | 37 | | | -- | | | 37 | |
| U.S. government and agencies securities | | | -- | | | 3 | | | 3 | |
| Preferred stock | | | -- | | | 1 | | | 1 | |
| Total investments | | $ | 1,054 | | $ | 616 | | $ | 1,670 | |
| | | | | | | 2010 | | | | |
| | | | Level 1 | | | Level 2 | | | Total | |
| | | | | | ($ in millions) | | | |
| | | | | | | | | | | |
| Common stock | | $ | 963 | | $ | -- | | $ | 963 | |
| Common collective trusts: | | | | | | | | | | |
| Debt securities | | | -- | | | 361 | | | 361 | |
| International equity securities | | | -- | | | 160 | | | 160 | |
| Interest bearing cash | | | 220 | | | -- | | | 220 | |
| Commingled funds | | | -- | | | 48 | | | 48 | |
| U.S. government and agencies securities | | | -- | | | 3 | | | 3 | |
| Preferred stock | | | -- | | | 1 | | | 1 | |
| Total investments | | $ | 1,183 | | $ | 573 | | $ | 1,756 | |
| December 31, 2012 |
| Level 1 | | Level 2 | | Total |
| ($ in millions) |
| |
| | |
| | |
|
Common stock | $ | 1,028 | | $ | - | | $ | 1,028 |
Common collective trusts: | |
| | |
| | |
|
Debt securities | | - | | | 433 | | | 433 |
International equity securities | | - | | | 211 | | | 211 |
Commingled funds | | - | | | 84 | | | 84 |
Interest bearing cash | | 31 | | | - | | | 31 |
U.S. government and agencies securities | | - | | | 3 | | | 3 |
Preferred stock | | - | | | 1 | | | 1 |
| | | | | | | | |
Total investments | $ | 1,059 | | $ | 732 | | $ | 1,791 |
| |
| | |
| | |
|
| |
| | |
| | |
|
| December 31, 2011 |
| Level 1 | | Level 2 | | Total |
| ($ in millions) |
| |
| | |
| | |
|
Common stock | $ | 1,017 | | $ | - | | $ | 1,017 |
Common collective trusts: | |
| | |
| | |
|
Debt securities | | - | | | 416 | | | 416 |
International equity securities | | - | | | 154 | | | 154 |
Commingled funds | | - | | | 42 | | | 42 |
Interest bearing cash | | 37 | | | - | | | 37 |
U.S. government and agencies securities | | - | | | 3 | | | 3 |
Preferred stock | | - | | | 1 | | | 1 |
| | | | | | | | |
Total investments | $ | 1,054 | | $ | 616 | | $ | 1,670 |
| |
| | |
| | |
|
Following is a description of the valuation methodologies used for other postretirement benefit plan assets measured at fair value.
Trust-owned life insurance: valuedValued at NS’our share of the net assets of trust-owned life insurance issued by a major insurance company. The underlying investments of that trust consist of a U.S. stock account and a U.S. bond account, valued based upon the aggregate market values of the underlying investments. The loan asset account is valued at cash surrender value at the time of the loan, plus accrued interest.
The other postretirement benefit plan assets consisted of trust-owned life insurance with fair values of $186
$205 million and $178$186 million at December 31, 20112012 and 2010,2011, respectively, and are valued under level 2 of the fair value hierarchy. There were no level 1 or level 3 related assets.
The methods used to value pension and other postretirement benefit plan assets may produce a fair value calculation that may not be indicative of net realizable value or reflective of future fair values. Furthermore, while NS believes itswe believe our valuation methods are appropriate and consistent with other market participants, the use of different methodologies or assumptions to determine the fair value of certain financial instruments could result in a different fair value measurement at the reporting date.
K64
Contributions and Estimated Future Benefit Payments
In 2012, NS expects2013, we expect to contribute approximately $12$13 million to itsour unfunded pension plans for payments to pensioners and approximately $56$57 million to itsour other postretirement benefit plans for retiree health and death benefits. NS doesWe do not expect to contribute to itsour funded pension plan in 2012. In 2010, NS made a voluntary contribution to its funded pension plan of $100 million.2013.
Benefit payments, which reflect expected future service, as appropriate, are expected to be paid as follows:
| | | | | | Other |
| | | | Pension | | Postretirement |
| | | | Benefits | | Benefits |
| | | | ($ in millions) |
| | | | | | | | | | |
| 2012 | | $ | 120 | | | $ | 56 | | |
| 2013 | | | 123 | | | | 58 | | |
| 2014 | | | 125 | | | | 60 | | |
| 2015 | | | 128 | | | | 63 | | |
| 2016 | | | 130 | | | | 65 | | |
| Years 2017 - 2021 | | | 664 | | | | 352 | | |
| | | | Other |
| Pension | | | Postretirement |
| Benefits | | | Benefits |
| ($ in millions) |
| |
| | | |
|
2013 | $ | 123 | | | $ | 57 |
2014 | | 126 | | | | 59 |
2015 | | 128 | | | | 61 |
2016 | | 131 | | | | 63 |
2017 | | 132 | | | | 65 |
Years 2018 – 2022 | | 674 | | | | 348 |
The other postretirement benefits payments include an estimated average annual reduction due to the Medicare Part D subsidy of approximately $7$6 million.
Other Postretirement Coverage
Under collective bargaining agreements, NSNorfolk Southern and certain subsidiaries participate in a multi-employer benefit plan, which provides certain postretirement health care and life insurance benefits to eligible union employees.employees. Premiums under this plan are expensed as incurred and amounted tototaled $47 million in 2012, $48 million in 2011, and $43 million in 2010, and $33 million in 2009.2010.
Section 401(k) Plans
Norfolk Southern and certain subsidiaries provide Section 401(k) savings plans for employees. Under the plans, NS matcheswe match a portion of employee contributions, subject to applicable limitations. NS’Our matching contributions, recorded as an expense, under these plans were $18 million in 2012, $17 million in 2011, and $15 million in 2010, and $16 million in 2009.2010.
12. Stock-Based Compensation
Under the stockholder-approved Long-Term Incentive Plan (LTIP), a committeethe Compensation Committee (Committee), made up of nonemployee directorsmembers of the Board of Directors or the chief executive officerChief Executive Officer (if delegated such authority by the committee)Committee), may grant stock options, stock appreciation rights (SARs), restricted stock units (RSUs), restricted shares, performance share units (PSUs), and performance shares, up to a maximum of 96,125,000 shares of Common Stock.our common Stock (Common Stock). Of these shares, 5,000,000 were approved by the Board for issuance to non-officer participants; as a broad-based issuance, stockholder approval was not required.
In May 2010, the stockholders approved an amended LTIP that eliminated the previous limit on the number of shares of stockCommon Stock that could be granted as RSUs, restricted shares, or performance sharesPSUs and instead adopted a fungible share reserve ratio so that, for awards granted after May 13, 2010, the number of shares remaining for issuance under the amended LTIP will be reduced (i) by 1 for each award granted as a stock option or stock-settled SAR, or (ii) by 1.61 for an award made in the form other than a stock option or stock-settled SAR. Under the Board-approved Thoroughbred Stock Option Plan (TSOP), the committeeCommittee may grant stock options up to a maximum of
6,000,000 shares of Common Stock; as a broad-based stock option plan, stockholder approval of TSOP was not required. NS usesWe use newly issued shares to satisfy any exercises and awards under LTIP and TSOP.
K65
The LTIP also permits the payment – on a current or a deferred basis and in cash or in stock – of dividend equivalents on shares of Common Stock covered by stock options, RSUs, or PSUs in an amount commensurate with regular quarterly dividends paid on Common Stock. With respect to stock options, if employment of the participant is terminated for any reason, including retirement, disability, or death, the Corporation shallwe have no further obligation to make any dividend equivalent payments. Regarding RSUs, if employment of the participant is terminated for any reason other than retirement, disability, or death, the Corporation shallwe have no further obligation to make any dividend equivalent payments. Should an employee terminate employment, they are not required to forfeit dividend equivalent payments already received. Outstanding PSUs do not currently receive dividend equivalent payments.
During the first quarter of 2011, a committee of nonemployee directors of NS’ Board2012, the Committee granted stock options, RSUs and PSUs pursuant to LTIP and granted stock options pursuant to TSOP. Receipt of an award under LTIP was made contingent upon the awardee’s execution of a non-compete agreement, and all awards under LTIP were made subject to forfeiture in the event the awardee “engages in competing employment” for a period of time following retirement.
Accounting Method
NS accounts
We account for itsour grants of stock options, RSUs, PSUs, and dividend equivalents, and tax absorptionequivalent payments in accordance with ASC 718 “Compensation-Stock Compensation.” Accordingly, all awards result in charges to net income while dividend equivalents,equivalent payments, which are all related to equity classified awards, are charged to retained income. Related compensation costs were $45 million in 2012, $61 million in 2011, and $67 million in 2010, and $60 million in 2009.2010. The total tax effects recognized in income in relation to stock-based compensation were benefits of $14 million in 2012, $20 million in 2011, and $21 million in 2010, and $18 million in 2009.2010.
“Common stock issued – net” in the Consolidated Statements of Cash Flows for the years ended December 31, 2012, 2011, 2010, and 20092010 includes tax benefits generated from tax deductions in excess of compensation costs recognized (excess tax benefits) for share-based awards of $42 million, $45 million, $33 million, and $15$33 million, respectively.
Stock Options
Options
Option exercise prices may not be less than the average of the high and low prices at which Common Stock is traded on the grant date and, effective for LTIP options granted for a term not to exceed 10 yearsafter May 13, 2010, will be at least the higher of (i) the average of the high and low prices at which Common Stock is traded on the grant date, or (ii) the closing price of Common Stock on the grant date. All options are subject to a vesting period of at least one year. Option exercise prices are at not less thanyear, and the fair market value of Common Stock on the effective dateterm of the grant and, effective for awards granted after May 13, 2010, mayoption will not be less than the higher of (i) the average fair market value of Common Stock on the date of grant or (ii) the closing price of Common Stock on the date of grant.exceed ten years. In the first quarter of 2011, 627,7002012, 567,300 options were granted under the LTIP and 257,000210,300 options were granted under the TSOP. In each case, the grant price was $62.75.$75.14. The options granted under the LTIP and TSOP in 2012, 2011, and 2010 may not be exercised prior to the fourth and third anniversaries of the date of grant, respectively. respectively, or if the optionee retires or dies before that anniversary date, may not be exercised before the later of one year after the grant date or the date of the optionee’s retirement or death.
In the first quarter of 2011, 627,700 options were granted under LTIP and 257,000 options were granted under TSOP, each with a grant price of $62.75. In the first quarter of 2010, 824,900 options were granted under LTIP and 259,800 options were granted under TSOP, each with a grant price of $47.76.
Holders of the options granted under the LTIP in 20112012 who remain actively employed receive cash dividend equivalent payments for four years in an amount equal to the regular quarterly dividends paid on Common Stock. Dividend equivalent payments are not made on TSOP options.
The fair value of each option awarded in 2012, 2011, 2010, and 20092010 was measured on the date of grant using a lattice-based option valuation model. Expected volatilities are based on implied volatilities from traded options on Common Stock and historical volatility of Common Stock. NS uses historicalHistorical data is used to estimate option exercises and employee terminations within the valuation model. The average expected option life is derived from the output of the valuation model and represents the period of time that options granted are expected to be outstanding. The average risk-free interest rate is based on the U.S. Treasury yield curve in effect at the time of grant. For options granted that include dividend equivalent payments, a dividend yield of zero was used. For 2012, 2011, 2010, and 2009,2010, a dividend yield of 2.55%2.30%, 2.89%2.55%, and 2.4%2.89%, respectively, was used for LTIP options for periods where no dividend equivalent payments are made, as well as for TSOP options, which do not receive dividend equivalents. The assumptions for the 2011, 2010, and 2009 LTIP and TSOP grants for the last three years are shown in the following table:
| | | 2011 | | 2010 | | 2009 |
| | | | | | | |
| Expected volatility range | | 28% - 32% | | 29% - 32% | | 28% - 53% |
| Average expected volatility | | 28% | | 32% | | 43% |
| Average risk-free interest rate | | 3.42% | | 3.63% | | 2.87% |
| Average expected option term LTIP | | 8.5 years | | 8.3 years | | 6.5 years |
| Per-share grant-date fair value LTIP | | $22.26 | | $18.54 | | $18.18 |
| Average expected option term TSOP | | 8.5 years | | 8.3 years | | 9.2 years |
| Per-share grant-date fair value TSOP | | $18.10 | | $14.91 | | $15.41 |
| Options granted (LTIP and TSOP) | | 884,700 | | 1,084,700 | | 1,460,900 |
| 2012 | | 2011 | | 2010 |
| |
| | |
| | |
|
Expected volatility range | | 27% – 29% | | | 28% – 32% | | | 29% – 32% |
Average expected volatility | | 27% | | | 28% | | | 32% |
Average risk-free interest rate | | 1.96% | | | 3.42% | | | 3.63% |
Average expected option term LTIP | | 8.9 years | | | 8.5 years | | | 8.3 years |
Per-share grant-date fair value LTIP | | $23.84 | | | $22.26 | | | $18.54 |
Average expected option term TSOP | | 8.8 years | | | 8.5 years | | | 8.3 years |
Per-share grant-date fair value TSOP | | $19.55 | | | $18.10 | | | $14.91 |
Options granted (LTIP and TSOP) | | 777,600 | | | 884,700 | | | 1,084,700 |
A summary of the status of changes in stock options is presented below:
| | | | Stock | | | Weighted Avg. |
| | | | Options | | | Exercise Price |
| | | | | | | |
| Outstanding at December 31, 2010 | | | 11,735,113 | | $ | 36.55 |
| Granted | | | 884,700 | | | 62.75 |
| Exercised | | | (2,845,677) | | | 27.38 |
| Forfeited | | | (14,700) | | | 48.50 |
| Outstanding at December 31, 2011 | | | 9,759,436 | | | 41.60 |
| Stock | | Weighted Avg. |
| Options | | Exercise Price |
|
| | |
|
Outstanding at December 31, 2011 | 9,759,436 | | $ | 41.60 |
Granted | 777,600 | | | 75.14 |
Exercised | (1,809,770) | | | 26.95 |
Forfeited | (8,700) | | | 57.28 |
| | | | |
Outstanding at December 31, 2012 | 8,718,566 | | | 47.61 |
The aggregate intrinsic value of options outstanding at December 31, 2011,2012, was $305$135 million with a weighted average remaining contractual term of 5.25.1 years. Of these options outstanding, 6,651,9365,299,966 were exercisable and had an aggregate intrinsic value of $229$101 million with a weighted average exercise price of $38.41$42.88 and a weighted average remaining contractual term of 3.83.6 years.
The following table provides information related to options exercised as of December 31 for the respectivelast three years:
| | | 2011 | | 2010 | | 2009 |
| | | ($ in millions) |
| | | | | | | |
| Options exercised | | 2,845,677 | | 2,533,727 | | 2,190,947 |
| Total intrinsic value | $ | 127 | $ | 91 | $ | 48 |
| Cash received upon exercise of options | $ | 75 | $ | 55 | $ | 51 |
| Related excess tax benefits realized | $ | 42 | $ | 32 | $ | 18 |
| 2012 | | 2011 | | 2010 |
| ($ in millions) |
| |
| | |
| | |
|
Options exercised | | 1,809,770 | | | 2,845,677 | | | 2,533,727 |
Total intrinsic value | $ | 80 | | $ | 127 | | $ | 91 |
Cash received upon exercise | | 47 | | | 75 | | | 55 |
Related excess tax benefits realized | | 28 | | | 42 | | | 32 |
At December 31, 2011, there was $11 million of2012, total unrecognized compensation related to options granted under the LTIP and TSOP whichwas $10 million, and is expected to be recognized over a weighted-average period of approximately 2.2 years.
K67
Restricted Stock Units
RSU grants were 177,400 in 2011, with aand grant-date fair value ofvalues were 140,000 and $75.14 in 2012; 177,400 and $62.75 in 2011; and 168,250 and $47.76 in 2010. RSUs granted in 2012, 2011, and 2010 have a five-year restriction period. In 2010, RSU grants were 168,250 with a grant-date fair value of $47.76period and a five-year restriction period. In 2009, RSU grants were 320,550 with a grant-date fair value of $38.72 and a five-year restriction period. RSUs granted in 2011, 2010, and 2009 will be settled through issuance of shares of Common Stock. The RSU grants include cash dividend equivalent payments during the restriction period commensurate with regular quarterly dividends paid on Common Stock. During 2012, 311,900 of the RSUs granted in 2007 vested, with 191,875 shares of Common Stock issued net of withholding taxes. A summary of the status of and changes in RSUs is presented below:
| | | | | | | | Weighted- |
| | | | | | | | Average |
| | | | | | | | Grant-Date |
| | | | RSUs | | | | Fair Value |
| | | | | | | | |
| Nonvested at December 31, 2010 | | | 1,098,000 | | | $ | 40.94 |
| Granted | | | 177,400 | | | | 62.75 |
| Vested | | | -- | | | | -- |
| Forfeited | | | -- | | | | -- |
| Nonvested at December 31, 2011 | | | 1,275,400 | | | | 48.72 |
| | | Weighted- |
| | | Average |
| | | Grant-Date |
| RSUs | | Fair Value |
|
| | |
|
Nonvested at December 31, 2011 | 1,275,400 | | $ | 48.72 |
Granted | 140,000 | | | 75.14 |
Vested | (311,900) | | | 49.85 |
Forfeited | (1,050) | | | 54.24 |
| | | | |
Nonvested at December 31, 2012 | 1,102,450 | | | 51.75 |
At December 31, 2011, there was $7 million of2012, total unrecognized compensation related to RSUs granted under the LTIP whichwas $7 million, and is expected to be recognized over a weighted-average period of approximately 3.13.2 years. The total fair valuesvalue of the RSUs paid in cash during 2012 and restricted shares vested during the twelve months ended December 31, 2011 was zero, and for 2010 and 2009 were zero, $35 million, and $26 million, respectively.was $14 million. The total related excess tax amounts realized were:
a benefitin 2012, 2011, and 2010 were benefits of $3 million, $1 million, in 2011, a benefit ofand $2 million, in 2010, and a liability of $1 million in 2009.respectively.
Performance Share Units
PSUs provide for awards based on achievement of certain predetermined corporate performance goals (total shareholder return, return on average invested capital and operating ratio) at the end of a three-year cycle. PSU grants and average grant-date fair values were 468,850 and $75.14 in 2012; 580,900 and $62.75 in 2011; and 824,900 and $47.76 in 2010; and 1,209,700 and $38.705 in 2009. The2010. PSUs granted in 2012, 2011, 2010, and 20092010 will be paid in the form of shares of Common Stock. During 2012, 782,889 of the PSUs granted in 2009 were earned, with 488,957 shares of Common Stock issued net of withholding taxes. A summary of the status of and changes in PSUs is presented below:
| | | | | | | | Weighted- |
| | | | | | | | Average |
| | | | | | | | Grant-Date |
| | | | PSUs | | | | Fair Value |
| | | | | | | | |
| Balance at December 31, 2010 | | | 3,184,700 | | | $ | 45.31 |
| Granted | | | 580,900 | | | | 62.75 |
| Earned - paid in Common Stock | | | (425,122) | | | | 50.47 |
| Earned - paid in cash | | | (425,473) | | | | 50.47 |
| Unearned | | | (305,105) | | | | 50.47 |
| Forfeited | | | -- | | | | -- |
| Balance at December 31, 2011 | | | 2,609,900 | | | | 46.91 |
K68
| | | Weighted- |
| | | Average |
| | | Grant-Date |
| PSUs | | Fair Value |
|
| | |
|
Balance at December 31, 2011 | 2,609,900 | | $ | 46.91 |
Granted | 468,850 | | | 75.14 |
Earned | (782,889) | | | 38.71 |
Unearned | (423,411) | | | 38.71 |
Forfeited | (2,250) | | | 58.45 |
| | | | |
Balance at December 31, 2012 | 1,870,200 | | | 59.27 |
As of
At December 31, 2011, there was $9 million of2012, total unrecognized compensation related to PSUs granted under the LTIP whichwas $7 million, and is expected to be recognized over a weighted-average period of approximately 1.7 years. The total fair values of PSUs earned and paid in cash during the twelve months ended December 31, 2011 and 2010 and 2009 were
$27 million, $20totaled $27 million and $19$20 million, respectively. The total related excess tax amounts realized were: a benefit of $11 million in 2012, a benefit of $2 million in 2011, and a liabilitycost of less than $1 million in 2010, and a liability of $2 million in 2009.2010.
Shares Available and Issued
Shares of stockCommon Stock available for future grants and issued in connection with all features of the LTIP and TSOP as ofat December 31, were as follows:
| | | 2011 | | 2010 | | 2009 |
| Available for future grants: | | | | | | |
| LTIP | | 8,803,298 | | 10,551,253 | | 4,136,591 |
| TSOP | | 1,640,456 | | 1,891,556 | | 2,145,356 |
| Shares of Common Stock issued: | | | | | | |
| LTIP | | 3,077,739 | | 2,901,786 | | 2,192,764 |
| TSOP | | 193,060 | | 57,800 | | 489,945 |
| 2012 | | 2011 | | 2010 |
Available for future grants: | |
| | |
| | |
|
LTIP | | 7,638,688 | | | 8,803,298 | | | 10,551,253 |
TSOP | | 1,434,356 | | | 1,640,456 | | | 1,891,556 |
Issued: | |
| | |
| | |
|
LTIP | | 2,337,179 | | | 3,077,739 | | | 2,901,786 |
TSOP | | 153,423 | | | 193,060 | | | 57,800 |
13. Stockholders’ Equity
Common Stock
Common stockStock
Common Stock is reported net of shares held by our consolidated subsidiaries (Treasury Shares) of Norfolk Southern.. Treasury Shares at December 31, 20112012 and 2010,2011, amounted to 20,320,777, and 20,336,843 shares, respectively, with a cost of $19 million for both 20112012 and 2010.2011.
Accumulated Other Comprehensive Loss
“Accumulated other comprehensive loss” reported in the Consolidated Statements of Changes in Stockholders’ Equity consisted of the following:
| | | Balance | | Net | | | | | | Balance |
| | | at Beginning | | Gain | Reclassification | at End |
| | | of Year | | (Loss) | Adjustments | of Year |
| | | | | | | ($ in millions) | | | |
| Year ended December 31, 2011 | | | | | | | | | | | | |
| Pensions and other postretirement liabilities | | $ | (726) | | $ | (270) | | $ | 68 | | $ | (928) |
| Other comprehensive loss of equity investees | | | (79) | | | (19) | | | -- | | | (98) |
| Accumulated other comprehensive loss | | $ | (805) | | $ | (289) | | $ | 68 | | $ | (1,026) |
| | | | | | | | | | | | | |
| Year ended December 31, 2010 | | | | | | | | | | | | |
| Pensions and other postretirement liabilities | | $ | (764) | | $ | (26) | | $ | 64 | | $ | (726) |
| Other comprehensive loss of equity investees | | | (89) | | | 10 | | | -- | | | (79) |
| Accumulated other comprehensive loss | | $ | (853) | | $ | (16) | | $ | 64 | | $ | (805) |
K69
| Balance | | | | | Balance |
| at Beginning | | Net | Reclassification | at End |
| of Year | | Loss | | Adjustments | | of Year |
| ($ in millions) |
Year ended December 31, 2012 | |
| | |
| | |
| | |
|
| |
| | |
| | |
| | |
|
Pensions and other postretirement liabilities | $ | (928) | | $ | (149) | | $ | 78 | | $ | (999) |
Other comprehensive loss of equity investees | | (98) | | | (12) | | | - | | | (110) |
| |
| | |
| | |
| | |
|
Accumulated other comprehensive loss | $ | (1,026) | | $ | (161) | | $ | 78 | | $ | (1,109) |
| |
| | |
| | |
| | |
|
Year ended December 31, 2011 | |
| | |
| | |
| | |
|
| |
| | |
| | |
| | |
|
Pensions and other postretirement liabilities | $ | (726) | | $ | (270) | | $ | 68 | | $ | (928) |
Other comprehensive loss of equity investees | | (79) | | | (19) | | | - | | | (98) |
| |
| | |
| | |
| | |
|
Accumulated other comprehensive loss | $ | (805) | | $ | (289) | | $ | 68 | | $ | (1,026) |
Other Comprehensive Income (Loss)
“Other comprehensive income (loss)” reported in the Consolidated Statements of Changes in Stockholders’ Equity consisted of the following:
| | | | | | Tax | | | | |
| | | Pretax | | | (Expense) | | Net-of-Tax |
| | | Amount | | | Benefit | | Amount |
| | | | ($ in millions) | | |
| Year ended December 31, 2011 | | | | | | | | | |
| Net gain (loss) arising during the year: | | | | | | | | | |
| Pensions and other postretirement benefits | $ | (439) | | $ | 169 | | $ | (270) | |
| Reclassification adjustments for costs included in net income | | 114 | | | (46) | | | 68 | |
| Subtotal | | (325) | | | 123 | | | (202) | |
| Other comprehensive loss of equity investees | | (21) | | | 2 | | | (19) | |
| Other comprehensive loss | $ | (346) | | $ | 125 | | $ | (221) | |
| | | | | | | | | | |
| Year ended December 31, 2010 | | | | | | | | | |
| Net gain (loss) arising during the year: | | | | | | | | | |
| Pensions and other postretirement benefits | $ | (42) | | $ | 16 | | $ | (26) | |
| Reclassification adjustments for costs included in net income | | 103 | | | (39) | | | 64 | |
| Subtotal | | 61 | | | (23) | | | 38 | |
| Other comprehensive income of equity investees | | 11 | | | (1) | | | 10 | |
| Other comprehensive income | $ | 72 | | $ | (24) | | $ | 48 | |
| | | | | | | | | | |
| Year ended December 31, 2009 | | | | | | | | | |
| Net gain (loss) arising during the year: | | | | | | | | | |
| Pensions and other postretirement benefits | $ | 47 | | $ | (18) | | $ | 29 | |
| Reclassification adjustments for costs included in net income | | 61 | | | (23) | | | 38 | |
| Subtotal | | 108 | | | (41) | | | 67 | |
| Other comprehensive income of equity investees | | 24 | | | (2) | | | 22 | |
| Other comprehensive income | $ | 132 | | $ | (43) | | $ | 89 | |
| | | Tax | | |
| Pretax | | (Expense) | | Net-of-Tax |
| Amount | | Benefit | | Amount |
| ($ in millions) |
Year ended December 31, 2012 | | | | | | | | |
Net gain (loss) arising during the year: | | | | | | | | |
Pensions and other postretirement benefits | $ | (242) | | $ | 93 | | $ | (149) |
Reclassification adjustments for costs | | | | | | | | |
included in net income | | 128 | | | (50) | | | 78 |
Subtotal | | (114) | | | 43 | | | (71) |
Other comprehensive loss of equity investees | | (13) | | | 1 | | | (12) |
| | | | | | | | |
Other comprehensive loss | $ | (127) | | $ | 44 | | $ | (83) |
| | | | | | | | |
Year ended December 31, 2011 | | | | | | | | |
Net gain (loss) arising during the year: | | | | | | | | |
Pensions and other postretirement benefits | $ | (439) | | $ | 169 | | $ | (270) |
Reclassification adjustments for costs | | | | | | | | |
included in net income | | 114 | | | (46) | | | 68 |
Subtotal | | (325) | | | 123 | | | (202) |
Other comprehensive loss of equity investees | | (21) | | | 2 | | | (19) |
| | | | | | | | |
Other comprehensive loss | $ | (346) | | $ | 125 | | $ | (221) |
| |
| | |
| | |
|
Year ended December 31, 2010 | |
| | |
| | |
|
Net gain (loss) arising during the year: | |
| | |
| | |
|
Pensions and other postretirement benefits | $ | (42) | | $ | 16 | | $ | (26) |
Reclassification adjustments for costs | |
| | |
| | |
|
included in net income | | 103 | | | (39) | | | 64 |
Subtotal | | 61 | | | (23) | | | 38 |
Other comprehensive income of equity investees | | 11 | | | (1) | | | 10 |
| | | | | | | | |
Other comprehensive income | $ | 72 | | $ | (24) | | $ | 48 |
14. Stock Repurchase Program
In November 2010, NS completed the
We repurchased and retired 18.8 million, 30.2 million, and 14.7 million shares under our share repurchase program approved by its Boardin 2012, 2011, and 2010, respectively, at a cost of Directors in November 2005 (as amended in March 2007), pursuant to which NS repurchased a total of 75 million shares of its Common Stock (2005 Program).$1.3 billion, $2.1 billion, and $863 million. On July 27, 2010, NS’August 1, 2012, our Board of Directors authorized the repurchase of up to an additional 50 million shares of Common Stock through December 31, 2014.2017. The timing and volume of purchases is guided by management’sour assessment of market conditions and other pertinent facts.factors. Any near-term share repurchases are expected to be made with internally generated cash, cash on hand, or proceeds from borrowings. NSSince the beginning of 2006, we have repurchased and retired 30.2 million shares, 14.7 million shares, and zero shares of its Common Stock under this program in 2011, 2010, and 2009, respectively, at a cost of $2.1 billion, $863 million, and zero. Since inception of the 2005 Program, NS has repurchased and retired 109.6128.4 million shares of Common Stock at a total cost of $6.2$7.5 billion.
K70
15. Earnings Per Share
The following table sets forth the calculation of basic and diluted earnings per share:
| | | Basic | | | Diluted |
| | | 2011 | | | 2010 | | | 2009 | | | 2011 | | | 2010 | | | 2009 | |
| | | ($ in millions except per share, shares in millions) |
| | | | | | | | | | | | | | | | | | | |
| Net income | $ | 1,916 | | $ | 1,496 | | $ | 1,034 | | $ | 1,916 | | $ | 1,496 | | $ | 1,034 | |
| Dividend equivalent payments | | (9) | | | (8) | | | (8) | | | (2) | | | (8) | | | (8) | |
| Income available to common stockholders | | 1,907 | | | 1,488 | | | 1,026 | | | 1,914 | | | 1,488 | | | 1,026 | |
| | | | | | | | | | | | | | | | | | | |
| Weighted-average shares outstanding | | 345.5 | | | 366.5 | | | 367.1 | | | 345.5 | | | 366.5 | | | 367.1 | |
Dilutive effect of outstanding options
and share-settled awards | | | | | | | | | | | 5.8 | | | 5.3 | | | 5.0 | |
| Adjusted weighted-average shares outstanding | | | | | | | | | | | 351.3 | | | 371.8 | | | 372.1 | |
| Earnings per share | $ | 5.52 | | $ | 4.06 | | $ | 2.79 | | $ | 5.45 | | $ | 4.00 | | $ | 2.76 | |
During 2011, 2010, and 2009,
| Basic | | Diluted |
| 2012 | | 2011 | | 2010 | | 2012 | | 2011 | | 2010 |
| ($ in millions except per share amounts, shares in millions) |
| |
| | |
| | |
| | |
| | |
| | |
|
Net income | $ | 1,749 | | $ | 1,916 | | $ | 1,496 | | $ | 1,749 | | $ | 1,916 | | $ | 1,496 |
Dividend equivalent payments | | (9) | | | (9) | | | (8) | | | (4) | | | (2) | | | (8) |
| | | | | | | | | | | | | | | | | |
Income available to common stockholders | | 1,740 | | | 1,907 | | | 1,488 | | | 1,745 | | | 1,914 | | | 1,488 |
| |
| | |
| | |
| | |
| | |
| | |
|
Weighted-average shares outstanding | | 320.9 | | | 345.5 | | | 366.5 | | | 320.9 | | | 345.5 | | | 366.5 |
Dilutive effect of outstanding options | |
| | |
| | |
| | |
| | |
| | |
|
and share-settled awards | |
| | |
| | |
| | | 4.3 | | | 5.8 | | | 5.3 |
Adjusted weighted-average shares outstanding | |
| | |
| | |
| | | 325.2 | | | 351.3 | | | 371.8 |
| | | | | | | | | | | | | | | | | |
Earnings per share | $ | 5.42 | | $ | 5.52 | | $ | 4.06 | | $ | 5.37 | | $ | 5.45 | | $ | 4.00 |
In each year, dividend equivalent payments were made to holders of stock options and restricted stock units.RSUs. For purposes of computing basic earnings per share, the total amount of dividend equivalent payments made to holders of stock options and restricted stock unitsRSUs were deducted from net income to determine income available to common stockholders. For purposes of computing diluted earnings per share, NS evaluateswe evaluate on a grant-by-grant basis those stock options and restricted stock unitsRSUs receiving dividend equivalent payments under the two-class and treasury stock methods to determine which method is the more dilutive for each grant. For those grants for which the two-class method was more dilutive, net income was reduced by the amount of dividend equivalent payments on these grants to determine income available to common stockholders. The diluted calculations exclude options having exercise prices exceeding the average market price of Common Stock as follows: 2 million in 2012, and none in both 2011 none in 2010 and 1.4 million in 2009.2010.
16. Commitments and Contingencies
Lawsuits
Norfolk SouthernLawsuits
We and/or certain subsidiaries are defendants in numerous lawsuits and other claims relating principally to railroad operations. When management concludeswe conclude that it is probable that a liability has been incurred and the amount of the liability can be reasonably estimated, it is accrued through a charge to earnings. While the ultimate amount of liability incurred in any of these lawsuits and claims is dependent on future developments, in management’sour opinion, the recorded liability is adequate to cover the future payment of such liability and claims. However, the final outcome of any of these lawsuits and claims cannot be predicted with certainty, and unfavorable or unexpected outcomes could result in additional accruals that could be significant to results of operations in a particular year or quarter. Any adjustments to the recorded liability will be reflected in earnings in the periods in which such adjustments are known.
Two
One of NS’our customers, DuPont, and South Mississippi Electric Power Association (SMEPA), filedhas a rate reasonableness complaints atcomplaint pending before the Surface Transportation Board (STB)STB alleging that the NSour tariff rates for transportation of regulated movements are unreasonable. NS disputes these allegations, however, in August 2011, NS agreed to settle the rate reasonableness complaint with SMEPA. Settlement ofWe dispute this claim did not have a material effect on NS’ financial position, results of operations, or liquidity.allegation. Since June 1, 2009, in the case of DuPont, NS haswe have been billing and collecting from DuPont amounts based on the challenged tariff rates. ManagementWe presently expectsexpect resolution of the DuPont case to occur in 20132014 and believesbelieve the estimate of reasonably possible loss will not have a material effect on NS’our financial position, results of operations, or liquidity. With regard to rate cases, management recordswe record adjustments to revenues in the periods, if and when, such adjustments are probable and estimable.
K71
On November 6, 2007, various antitrust class actions filed against NSus and other Class 1I railroads in various Federal district courts regarding fuel surcharges were consolidated in the District of Columbia by the Judicial Panel on
Multidistrict Litigation. NS believesWe believe the allegations in the complaints are without merit and intendsintend to vigorously defend the cases. NS doesWe do not believe that the outcome of these proceedings will have a material effect on itsour financial position, results of operations, or liquidity. A lawsuit containing similar allegations against NS and four other major railroads that was filed on March 25, 2008, in the U.S. District Court for the District of Minnesota containing similar allegations against us and four other major railroads was voluntarily dismissed by the plaintiff subject to a tolling agreement entered into in August 2008.
Casualty Claims
Casualty claims include employee personal injury and occupational claims as well as third-party claims, all exclusive of legal costs. To aid in valuing itsour personal injury liability and determining the amount to accrue with respect to such claims during the year, NS’ management utilizeswe utilize studies prepared by an independent consulting actuarial firm. Job-related accidental injury and occupational claims are subject to the Federal Employers’ Liability Act (FELA), which is applicable only to railroads. FELA’s fault-based system produces results that are unpredictable and inconsistent as compared with a no-fault workers’ compensation system. The variability inherent in this system could result in actual costs being different from the liability recorded. While the ultimate amount of claims incurred is dependent on future developments, in management’sour opinion, the recorded liability is adequate to cover the future payments of claims and is supported by the most recent actuarial study. In all cases, NS recordswe record a liability when the expected loss for the claim is both probable and estimable.
The Consolidated Balance Sheets reflect long-term receivables for estimated recoveries from NS’our insurance carriers for claims associated with the January 6, 2005, derailment in Graniteville, S.C. In the first quarter of 2011, NSwe received an unfavorable ruling for an arbitration claim with an insurance carrier, and waswere denied recovery of the contested portion ($43 million) of the claim. As a result, NSwe recorded a $43 million charge during the first quarter of 2011 for the receivables associated with the contested portion of the claim and a $15 million charge for other receivables affected by the ruling for which recovery is no longer probable. During the first quarter of 2010, NS settled an arbitration claim ($100 million) with another insurance carrier with no adverse effect on NS’ financial position, results of operations, or liquidity.
Employee personal injury claims – The largest component of casualties and other claims expense is employee personal injury costs. The independent actuarial firm engaged by NSus provides quarterly studies to aid in valuing itsour employee personal injury liability and estimating its employee personal injury expense. The actuarial firm studies NS’our historical patterns of reserving for claims and subsequent settlements, taking into account relevant outside influences. The actuaryactuarial firm uses the results of these analyses to estimate the ultimate amount of liability, which includes amounts for incurred but unasserted claims. NS adjusts itsWe adjust the liability quarterly based upon management’sour assessment and the results of the study. Actuarial studies since 2009 have reflected a reduced level of favorable claims development resulting in an increase of the annual cost related to personal injuries from $51 million in 2009, to $75 million in 2010, and $88 million in 2011. TheOur estimate of loss liabilities is subject to inherent limitation given the difficulty of predicting future events such as jury decisions, court interpretations, or legislative changes and as such the actual loss may vary from the estimated liability recorded.
Occupational claims – Occupational claims (including asbestosis and other respiratory diseases, as well as conditions allegedly related to repetitive motion) are often not caused by a specific accident or event but rather allegedly result from a claimed exposure over time. Many such claims are being asserted by former or retired employees, some of whom have not been employed in the rail industry for decades. The independent actuarial firm provides an estimate of the occupational claims liability based upon NS’our history of claim filings, severity, payments, and other pertinent facts. The liability is dependent upon management’s judgments madewe make as to the specific case reserves as well as judgments of the consulting independent actuarial firm in the periodicquarterly studies. The actuarial firm’s estimate of ultimate loss includes a provision for those claims that have been incurred but not reported. This provision is derived by analyzing industry data and projecting NS’our experience into the future as far as can be reasonably determined. NS adjusts itsWe adjust the liability quarterly based upon management’sour assessment and the results of the study. However, it is possible that the recorded liability may not be adequate to cover the future payment of claims. Adjustments to the recorded liability are reflected in operating expenses in the periods in which such adjustments become known.
K72
Third-party claims – NS recordsWe record a liability for third-party claims including those for highway crossing accidents, trespasser and other injuries, automobile liability, property damage, and lading damage. The independent actuarial firm assists us with the calculation of potential liability for third-party claims, except lading damage, based upon NS’our experience including the number and timing of incidents, amount of payments, settlement rates, number of open claims, and legal defenses. The actuarial estimate includes a provision for claims that have been incurred but have not yet been
reported. Each quarter NS adjusts itsWe adjust the liability quarterly based upon management’sour assessment and the results of the study. Given the inherent uncertainty in regard to the ultimate outcome of third-party claims, it is possible that the actual loss may differ from the estimated liability recorded.
Environmental Matters
NS is
We are subject to various jurisdictions’ environmental laws and regulations. It is NS’ policy toWe record a liability where such liability or loss is probable and its amount can be estimated reasonably. Claims, if any, against third parties, for recovery of cleanup costs we have incurred by NS are reflected as receivables (when collection is probable) in the Consolidated Balance Sheets and are not netted against the associated NS liability. Environmental engineers regularly participate in ongoing evaluations of all known sites and in determining any necessary adjustments to liability estimates. NS also hasWe have an Environmental Policy Council, composed of senior managers, to oversee and interpret itsour environmental policy.
NS’
Our Consolidated Balance Sheets include liabilities for environmental exposures in the amount of $42 million at December 31, 2012, and $35 million at December 31, 2011 and $33 million at December 31, 2010 (of which $12 million is classified as a current liability at both December 31, 20112012 and 2010)2011). At December 31, 2011,2012, the liability represents NS’our estimate of the probable cleanup and remediation costs based on available information at 149146 known locations and projects compared with 143149 locations and projects at December 31, 2010. As of2011. At December 31, 2011, seven2012, nine sites accounted for approximately $13$23 million of the liability, and no individual site was considered to be material. NS anticipatesWe anticipate that much of this liability will be paid out over five years; however, some costs will be paid out over a longer period.
At 2622 locations, one or more Norfolk Southernof our subsidiaries in conjunction with a number of other parties have been identified as potentially responsible parties under the Comprehensive Environmental Response, Compensation and Liability Act of 1980 or comparable state statutes that impose joint and several liability for cleanup costs. NS calculates itsWe calculate our estimated liability for these sites based on facts and legal defenses applicable to each site and not solely on the basis of the potential for joint liability.
With respect to known environmental sites (whether identified by NSus or by the EPA or comparable state authorities), estimates of NS’our ultimate potential financial exposure for a given site or in the aggregate for all such sites are necessarily imprecise because of the widely varying costs of currently available cleanup techniques, unpredictable contaminant recovery and reduction rates associated with available clean-upcleanup technologies, the likely development of new cleanup technologies, the difficulty of determining in advance the nature and full extent of contamination and each potential participant’s share of any estimated loss (and that participant’s ability to bear it), and evolving statutory and regulatory standards governing liability.
The risk of incurring environmental liability – for acts and omissions, past, present, and future – is inherent in the railroad business. Some of the commodities in NS’our traffic mix, particularly those classified as hazardous materials, pose special risks that NS and its subsidiarieswe work diligently to minimize. In addition, several NSof our subsidiaries own, or have owned, land used as operating property, or which is leased and operated by others, or held for sale. Because environmental problems that are latent or undisclosed may exist on these properties, that are latent or undisclosed, there can be no assurance that NSwe will not incur environmental liabilities or costs with respect to one or more of them, the amount and materiality of which cannot be estimated reliably at this time. Moreover, lawsuits and claims involving these and potentially other unidentified environmental sites and matters are likely to arise from time to time. The resulting liabilities could have a significant effect on financial position, results of operations, or liquidity in a particular year or quarter.
Based on itsour assessment of the facts and circumstances now known, management believes that it haswe believe we have recorded the probable and reasonably estimable costs for dealing with those environmental matters of which NS iswe are aware. Further, management believeswe believe that it is unlikely that any known matters, either individually or in the aggregate, will have a material adverse effect on NS’our financial position, results of operations, or liquidity.
Insurance
Insurance
Norfolk Southern obtainsWe obtain on behalf of itselfourself and itsour subsidiaries insurance for potential losses for third-party liability and first-party property damages. NS isWe are currently self-insured up to $50 million and above $1 billion per occurrence for bodily injury and property damage to third parties and up to $25 million and above $175 million per occurrence for property owned by NSus or in NS’in our care, custody, or control.
Purchase Commitments
At December 31, 2011, NS2012, we had outstanding purchase commitments totaling approximately $603$560 million for long-term service contracts through 2019 as well as locomotives, track material, RoadRailer® trailers, and freight cars, in connection with itsour capital programs through 2016.
Change-In-Control Arrangements
Norfolk Southern has
We have compensation agreements with certain officers and key employees that become operative only upon a change in control of Norfolk Southern, as defined in those agreements. The agreements provide generally for payments based on compensation at the time of a covered individual’s involuntary or other specified termination and for certain other benefits.
Guarantees
Guarantees
In a number of instances, Norfolk Southern and its subsidiarieswe have agreed to indemnify lenders for additional costs they may bear as a result of certain changes in laws or regulations applicable to their loans. Such changes may include impositions or modifications with respect to taxes, duties, reserves, liquidity, capital adequacy, special deposits, and similar requirements relating to extensions of credit by, deposits with, or the assets or liabilities of such lenders. The nature and timing of changes in laws or regulations applicable to NS’our financings are inherently unpredictable, and therefore NS’our exposure in connection with the foregoing indemnifications cannot be quantified. No liability has been recorded related to these indemnifications. In the case of one type of equipment financing, NSR’s Japanese leverage leases, NSR may terminate the leases and ancillary agreements if such a change-in-law indemnity is triggered. Such a termination would require NSR to make early termination payments that would not be expected to
We have a material effect on NS’ financial position, results of operations, or liquidity.
NS has agreed to indemnify parties in a number of transactions for U.S. income tax withholding imposed as a result of changes in U.S. tax law. In all cases, NS haswe have the right to unwind the related transaction if the withholding cannot be avoided in the future. Because these indemnities would be triggered and are dependent upon a change in the tax law, the maximum exposure is not quantifiable. Management doesWe do not believe that it is likely that itwe will be required to make any payments under these indemnities.
As of
At December 31, 2011,2012, certain Norfolk Southern subsidiaries are contingently liable as guarantors with respect to
$7 $7 million of indebtedness, due in 2019, of an entity in which they have an ownership interest, the Terminal Railroad Association of St. Louis. Four other railroads are also jointly and severally liable as guarantors for this indebtedness. No liability has been recorded related to this guaranty.
NORFOLK SOUTHERN CORPORATION AND SUBSIDIARIES
K74
NORFOLK SOUTHERN CORPORATION AND SUBSIDIARIES
QUARTERLY FINANCIAL DATA
(Unaudited) |
| | | | | | | | | | | | | | | | | |
| | | | | | | | | | | | | | | | | |
| | | | | | | | Three Months Ended | | | | | |
| | | | March 31 | | | June 30 | September 30 | December 31 |
| | | | ($ in millions, except per share amounts) | |
| 2011 | | | | | | | | | | | | | | | | |
| Railway operating revenues | | $ | 2,620 | | | $ | 2,866 | | | $ | 2,889 | | | $ | 2,797 | |
| Income from railway operations | | | 600 | | | | 875 | | | | 938 | | | | 800 | |
| Net income | | | 325 | | | | 557 | | | | 554 | | | | 480 | |
Earnings per share: | | | | | | | | | | | | | | | | |
| Basic | | | 0.91 | | | | 1.58 | | | | 1.61 | | | | 1.44 | |
| Diluted | | | 0.90 | | | | 1.56 | | | | 1.59 | | | | 1.42 | |
| | | | | | | | | | | | | | | | | |
| 2010 | | | | | | | | | | | | | | | | |
| Railway operating revenues | | $ | 2,238 | | | $ | 2,430 | | | $ | 2,456 | | | $ | 2,392 | |
| Income from railway operations | | | 555 | | | | 733 | | | | 746 | | | | 642 | |
| Net income | | | 257 | | | | 392 | | | | 445 | | | | 402 | |
| Earnings per share: | | | | | | | | | | | | | | | | |
| Basic | | | 0.69 | | | | 1.06 | | | | 1.21 | | | | 1.11 | |
| Diluted | | | 0.68 | | | | 1.04 | | | | 1.19 | | | | 1.09 | |
(Unaudited)
| Three Months ended |
| March 31 | | June 30 | | September 30 | | December 31 |
| ($ in millions, except per share amounts) |
2012 | | | | | | | | | | | |
Railway operating revenues | $ | 2,789 | | $ | 2,874 | | $ | 2,693 | | $ | 2,684 |
Income from railway operations | | 745 | | | 934 | | | 731 | | | 714 |
Net income | | 410 | | | 524 | | | 402 | | | 413 |
Earnings per share: | |
| | |
| | |
| | |
|
Basic | | 1.24 | | | 1.62 | | | 1.26 | | | 1.31 |
Diluted | | 1.23 | | | 1.60 | | | 1.24 | | | 1.30 |
| |
| | |
| | |
| | |
|
2011 | | | | | | | | | | | |
Railway operating revenues | $ | 2,620 | | $ | 2,866 | | $ | 2,889 | | $ | 2,797 |
Income from railway operations | | 600 | | | 875 | | | 938 | | | 800 |
Net income | | 325 | | | 557 | | | 554 | | | 480 |
Earnings per share: | |
| | |
| | |
| | |
|
Basic | | 0.91 | | | 1.58 | | | 1.61 | | | 1.44 |
Diluted | | 0.90 | | | 1.56 | | | 1.59 | | | 1.42 |
K75
Item 9. Changes in and Disagreements with Accountants on Accounting and Financial Disclosure
None.
None.
Item 9A. Controls and Procedures
Evaluation of Disclosure Controls and Procedures
Norfolk Southern’s
Our Chief Executive Officer and Chief Financial Officer, with the assistance of management, evaluated the effectiveness of NS’our disclosure controls and procedures (as such term is defined in Rules 13a-15(e) and 15d-15(e) under the Securities Exchange Act of 1934, as amended (Exchange Act)) as ofat December 31, 2011.2012. Based on such evaluation, suchour officers have concluded that, as ofat December 31, 2011, NS’2012, our disclosure controls and procedures were effective to ensure that information required to be disclosed in NS’our reports under the Exchange Act is recorded, processed, summarized, and reported, within the time period specified in the SEC’s rules and forms, and that such information is accumulated and communicated to management, including the Chief Executive Officer and the Chief Financial Officer, as appropriate, to allow timely decisions regarding required disclosure.
Internal Control Over Financial Reporting
The management of Norfolk Southern is
We are responsible for establishing and maintaining adequate internal control over financial reporting. Norfolk Southern’sOur internal control over financial reporting includes those policies and procedures that pertain to itsour ability to record, process, summarize, and report reliable financial data. Management recognizesWe recognize that there are inherent limitations in the effectiveness of any internal control over financial reporting, including the possibility of human error and the circumvention or overriding of internal control. Accordingly, even effective internal control over financial reporting can provide only reasonable assurance with respect to financial statement preparation. Further, because of changes in conditions, the effectiveness of internal control over financial reporting may vary over time.
In order to ensure that Norfolk Southern’sour internal control over financial reporting is effective, managementwe regularly assessesassess such controls and did so most recently for itsour financial reporting as ofat December 31, 2011.2012. This assessment was based on criteria for effective internal control over financial reporting set forth by the Committee of Sponsoring Organizations of the Treadway Commission (COSO) in Internal Control-Integrated Framework. Based on our assessment, management haswe have concluded that Norfolk Southernwe maintained effective internal control over financial reporting as ofat December 31, 2011.2012.
The
Our Board of Directors, acting through its Audit Committee, is responsible for the oversight of Norfolk Southern’sour accounting policies, financial reporting, and internal control. The Audit Committee of theour Board of Directors is comprised entirely of outside directors who are independent of management. The independent registered public accounting firm and theour internal auditors have full and unlimited access to the Audit Committee, with or without management, to discuss the adequacy of internal control over financial reporting, and any other matters which they believe should be brought to the attention of the Audit Committee.
Norfolk Southern’s management has
We have issued a report of itsour assessment of internal control over financial reporting, and Norfolk Southern’sour independent registered public accounting firm has issued an attestation report on Norfolk Southern’sour internal controlscontrol over financial reporting as ofat December 31, 2011.2012. These reports appear in Part II, Item 8 of this report on Form 10-K.
During the fourth quarter of 2011, management has2012, we have not identified any changes in internal controlscontrol over financial reporting that have materially affected, or are reasonably likely to materially effect, NS’our internal control over financial reporting.
Item 9B. Other Information
None.
K76
None.
PART III
NORFOLK SOUTHERN CORPORATION AND SUBSIDIARIES (NS)
Item 10. Directors, Executive Officers, and Corporate Governance
In accordance with General Instruction G(3)G(3), information called for by Part III, Item 10, is incorporated herein by reference from the information appearing under the caption “Election of Directors,” under the caption “Section 16(a) Beneficial Ownership Reporting Compliance,” under the caption “Corporate Governance,” and under the caption “Committees” in Norfolk Southern’sour definitive Proxy Statement for the Annual Meeting of Stockholders to be held on May 10, 2012,9, 2013, which definitive Proxy Statement will be filed electronically with the Securities and Exchange Commission (Commission)SEC pursuant to Regulation 14A. The information regarding executive officers called for by Item 401 of Regulation S-K is included in Part I hereof beginning under “Executive Officers of the Registrant.”
Item 11. Executive CompensationCompensation
In accordance with General Instruction G(3), information called for by Part III, Item 11, is incorporated herein by reference from the information:
• appearing under the subcaption “Compensation” under the caption “Board of Directors” for directors, including the “2011“2012 Non-Employee Director Compensation Table” and the “Narrative to Non-Employee Director Compensation Table;”
• appearing under the caption “Executive Compensation” for executives, including the “Compensation Discussion and Analysis,” the information appearing in the “Summary Compensation Table” and the “2011“2012 Grants of Plan-Based Awards” table, including the narrative to such tables, the “Outstanding Equity Awards at Fiscal Year-End 2011”2012” and “Option Exercises and Stock Vested in 2011”2012” tables, and the tabular and narrative information appearing under the subcaptions “Retirement Benefits,” “Deferred Compensation,” and “Potential Payments Upon a Change in Control or Other Termination of Employment;” and
• appearing under the captions “Compensation Committee Interlocks and Insider Participation”Participation,” “Compensation Policy Risk Assessment,” and “Compensation Committee Report,”
in each case included in Norfolk Southern’sour definitive Proxy Statement for the Annual Meeting of Stockholders to be held on May 10, 2012,9, 2013, which definitive Proxy Statement will be filed electronically with the CommissionSEC pursuant to Regulation 14A.
Item 12. Security Ownership of Certain Beneficial Owners and Management and Related Stockholder Matters
In accordance with General Instruction G(3), information on security ownership of certain beneficial owners and management called for by Item 403 of Regulation S-K, Part III, Item 12, is incorporated herein by reference from the information appearing under the caption “Beneficial Ownership of Stock” in Norfolk Southern’sour definitive Proxy Statement for the Annual Meeting of Stockholders to be held on May 10, 2012,9, 2013, which definitive Proxy Statement will be filed electronically with the CommissionSEC pursuant to Regulation 14A.
K77
Equity Compensation Plan Information (as of(at December 31, 2011)2012)
Plan
Category | Number of
securities
to be issued upon
exercise of
outstanding options,
warrants and rights | | Weighted-
average
exercise price
of outstanding
options, warrants
and rights | Number of securities
remaining available
for future issuance
under equity
compensation plans
(excluding
securities reflected
in column (a)) |
| | | (a) | | | | (b) | | | (c) | |
Equity compensation plans
approved by securities holders(1) | | 12,841,803(3) | | | | $ 40.45(5) | | | 8,803,298 | |
| | | | | | | | | | | |
Equity compensation plans
not approved by securities holders(2) | | 1,185,537(4) | | | | 49.90 | | | 1,661,456(6) | |
| | | | | | | | | | | |
| Total | | 14,027,340 | | | | | | | 10,464,754 | |
1
| The Long-Term Incentive | | | | Number of securities |
| | | | | remaining available |
| Number of | | Weighted- | | for future issuance |
| securities | | average | | under equity |
| to be issued upon | | exercise price | | compensation plans |
| exercise of | | of outstanding | | (excluding |
Plan | outstanding options, | | options, warrants | | securities reflected |
Category | | warrants and rights | | and rights | | in column (a)) |
| (a) | | (b) | | (c) |
Equity compensation plans | |
| | | | |
| | | |
| |
approved by securities holders | (1) | | | 10,860,827 | (3) | | | $ | 46.40 | (4) | | | 7,638,688 | |
| |
| | | | |
| | | |
| |
Equity compensation plans | |
| | | | |
| | | |
| |
not approved by securities holders | (2) | | 1,232,768 | | | | | 55.01 | | | | 1,452,356 | (5) |
| | | | | | | | | | | |
Total | | 12,093,595 | | | | |
| | | | 9,091,044 | |
(1) | LTIP, excluding five million shares for broad-based issuance to non-officers. |
2(2) | The Long-Term Incentive Plan’sLTIP’s five million shares for broad-based issuance to non-officers, the Thoroughbred Stock Option PlanTSOP and the Director’s Restricted Stock Plan. |
3(3) | Includes options, restricted stock unitsRSUs and performance share unitsPSUs granted under the Long-Term Incentive PlanLTIP that may be settled in shares of stock. |
4(4) | Includes options granted under the Long-Term Incentive Plan of 5,446 shares for non-officers and options granted under the Thoroughbred Stock Option Plan. |
5 | Calculated without regard to 4,268,404,3,375,529, outstanding restricted stock unitsRSUs and performance share unitsPSUs at December 31, 2011.2012. |
6(5) | Of the shares remaining available for grant under plans not approved by stockholders, 21,00018,000 are available for grant as restricted stock under the Directors’ Restricted Stock Plan. |
Norfolk Southern Corporation Long-Term Incentive Plan (LTIP)
Established on June 28, 1983, and approved by our stockholders at their Annual Meeting held on May 10, 1984, LTIP was adopted to promote the success of Norfolk Southernour company by providing an opportunity for non-employee directors,Directors, officers, and other key employees to acquire a proprietary interest in the Corporation. On January 23, 2001, theour Board of Directors further amended LTIP and approved the issuance of an additional 5,000,000 shares of authorized but unissued Common Stock under LTIP to participants who are not officers of Norfolk Southern.our company. The issuance of these shares was broadly-based, and stockholder approval of these shares was not required. Accordingly, this portion of LTIP is included in the number of securities available for future issuance for plans not approved by stockholders. Also on
January 23, 2001, theour Board of Directors amended LTIP, which amendment was approved by shareholders on May 10, 2001, that included the reservation for issuance of an additional 30,000,000 shares of authorized but unissued Common Stock.
In May 2010, our shareholders approved an amended LTIP that adopted a fungible share reserve ratio so that, for awards granted after May 13, 2010, the number of shares remaining for issuance under the amended LTIP will be reduced (i) by 1 for each award granted as an option or stock-settled stock appreciation right, or (ii) by 1.61 for an award made in the form other than an option or stock-settled stock appreciation right. Cash payments of restricted units, stock appreciation rights, and performance share unitsPSUs will not be applied against the maximum number of shares issuable under LTIP. Any shares of Common Stock subject to options, performance share units,PSUs, restricted shares, or restricted stock unitsRSUs which are not issued as Common Stock will again be available for award under LTIP after the expiration or forfeiture of an award.
K78
Non-employee directors,Directors, officers, and other key employees residing in the United States or Canada are eligible for selection to receive LTIP awards. Under LTIP, the Compensation Committee (Committee) may grant incentive stock options, nonqualified stock options, stock appreciation rights, restricted stock units,RSUs, restricted shares, performance share units,PSUs, and performance shares. In addition, dividend equivalentsequivalent payments may be awarded for options, restricted stock units,RSUs, and performance share units.PSUs. The Committee may make awards under LTIP subject to forfeiture under certain circumstances and may establish such other terms and conditions for the awards as provided in LTIP.
For options granted after May 13, 2010, the option price will be at least the higher of (i) the average of the high and low prices at which Common Stock is traded on the date of grant, or (ii) the closing price of Common Stock on the date of the grant. All options are subject to a vesting period of at least one year, and the term of the option will not exceed ten years. LTIP specifically prohibits option repricing without stockholder approval, except for capital adjustments.
Performance share units
PSUs entitle a recipient to receive performance-based compensation at the end of a three-year performance cycle based on Norfolk Southern’sour performance during that three-year period. For the 2012 performance share unit2013 PSU awards, corporate performance will be measured using three equally weighted standards established by the Committee: (1) three-year average return on average capital invested, (2) three-year average operating ratio, and (3) three-year total return to stockholders as compared withmeasured at the average total return onend of the publicly traded stocks of North American Class I railroads, using a 20-day average total shareholder return to measure performance. Performance share unitsthree-year period. PSUs may be payable in either shares of Common Stock or cash.
Restricted stock units
RSUs are payable in cash or in shares of Common Stock at the end of a restriction period of not less than 36 months and not more than 60 months. During the restriction period, the holder of the restricted stock unitsRSUs has no beneficial ownership interest in the Common Stock represented by the restricted stock unitsRSUs and has no right to vote the shares represented by the units or to receive dividends (except for dividend equivalent payment rights that may be awarded with respect to the restricted stock units)RSUs). The Committee at its discretion may waive the restriction period, but settlement of any restricted stock unitsRSUs will occur on the same settlement date as would have applied absent a waiver of restrictions, if no performance goals were imposed.
Norfolk Southern Corporation Thoroughbred Stock Option Plan (TSOP)
The
Our Board of Directors adopted the TSOP on January 26, 1999, to promote the success of Norfolk Southernour company by providing an opportunity for nonagreement employees to acquire a proprietary interest in Norfolk Southernour company and thereby to provide an additional incentive to nonagreement employees to devote their maximum efforts and skills to the advancement, betterment, and prosperity of Norfolk Southernour company and itsour stockholders. Under the TSOP there were 6,000,000 shares of authorized but unissued Common Stock reserved for issuance. TSOP has not been and is not required to have been approved by our stockholders.
Active full-time nonagreement employees residing in the United States or Canada are eligible for selection to receive TSOP awards. Under TSOP, the Committee may grant nonqualified stock options subject to such terms and conditions as provided in TSOP.
The option price willmay not be at leastless than the average of the high and low prices at which Common Stock is traded on the date of the grant. All options are subject to a vesting period of at least one year, and the term of the option will not exceed ten years. Options awarded in 2011 are subject to a three-year vesting period. TSOP specifically prohibits repricing without stockholder approval, except for capital adjustments.
K79
Norfolk Southern Corporation Directors’ Restricted Stock Plan (Plan)
The Plan was adopted on January 1, 1994, and is designed to increase ownership of Norfolk Southern Common Stock by itsour non-employee directorsDirectors so as to further align their ownership interest in Norfolk Southernour company with that of our stockholders. The Plan has not been and is not required to have been approved by our stockholders. Currently, a maximum of 66,000 shares of Common Stock may be granted under the Plan. To make grants eligible to directors, Norfolk Southern purchases,Directors, we purchase, through one or more subsidiary companies, the number of shares required in open-market transactions at prevailing market prices, or makesmake such grants from Common Stock already owned by one or more of Norfolk Southern’sour subsidiary companies.
Only non-employee directorsDirectors who are not and never have been employees of Norfolk Southernour company are eligible to participate in the Plan. Upon becoming a director,Director, each eligible directorDirector receives a one-time grant of 3,000 restricted shares of Common Stock. No individual member of the Board exercises discretion concerning the eligibility of any directorDirector or the number of shares granted.
The restriction period applicable to restricted shares granted under the Plan begins on the date of the grant and ends on the earlier of the recipient’s death or six months after the recipient ceases to be a directorDirector by reason of disability or retirement. During the restriction period, shares may not be sold, pledged, or otherwise encumbered. Directors will forfeit the restricted shares if they cease to serve as a directorDirector of Norfolk Southernour company for reasons other than their disability, retirement, or death.
Item 13. Certain Relationships and Related Transactions, and Director Independence
In accordance with General Instruction G(3), information called for by Part III, Item 13, is incorporated herein by reference from the information appearing under the caption “Transactions with Related Persons” and under the caption “Director Independence” in Norfolk Southern’sour definitive Proxy Statement for the Annual Meeting of Stockholders to be held on May 10, 2012,9, 2013, which definitive Proxy Statement will be filed electronically with the CommissionSEC pursuant to Regulation 14A.
Item 14. Principal Accountant Fees and Services
In accordance with General Instruction G(3), information called for by Part III, Item 14, is incorporated herein by reference from the information appearing under the caption “Ratification of Appointment of Independent Registered Public Accounting Firm” in Norfolk Southern’sour definitive Proxy Statement for the Annual Meeting of Stockholders to be held on May 10, 2012,9, 2013, which definitive Proxy Statement will be filed electronically with the CommissionSEC pursuant to Regulation 14A.
PART IV
NORFOLK SOUTHERN CORPORATION AND SUBSIDIARIES (NS)
Item 15. Exhibits and Financial Statement Schedules
| | | | | | Page |
(A) | | | | The following documents are filed as part of this report: | | |
| | | | | | |
| | 1. | | Index to Consolidated Financial Statements | | |
| | | | | | |
| | | | Report of Management | | K37K39 |
| | | | Reports of Independent Registered Public Accounting Firm | | K38K40 |
| | | | Consolidated Statements of Income, Years ended December 31, 2012, 2011, 2010, and 20092010 | | K40K42 |
| | | | Consolidated Statements of Comprehensive Income, Years ended December 31, 2012, 2011, and 2010 | | K43 |
| | | | Consolidated Balance Sheets as ofat December 31, 20112012 and 20102011 | | K41K44 |
| | | | Consolidated Statements of Cash Flows, Years ended December 31, 2012, 2011, 2010, and 20092010 | | K42K45 |
| | | | Consolidated Statements of Changes in Stockholders’ Equity, Years ended
December 31, 2012, 2011, 2010, and 20092010 | | K43K46 |
| | | | Notes to Consolidated Financial Statements | | K44K47 |
| | | | | | |
| | 2. | | Financial Statement Schedule: | | |
| | | | | | |
| | | | The following consolidated financial statement schedule should be read in connection with the consolidated financial statements: | | |
| | | | | | |
| | | | Index to Consolidated Financial Statement Schedule | | |
| | | | | | |
| | | | Schedule II – Valuation and Qualifying Accounts | | K97K101 |
| | | | | | |
| | | | Schedules other than the one listed above are omitted either because they are not required or are inapplicable, or because the information is included in the consolidated financial statements or related notes. | | |
| | | | | | |
| | 3. | | Exhibits | | |
| | | | | | |
Exhibit Number | | | | Description | | |
| | | | | | |
3 | | | | Articles of Incorporation and Bylaws -– | | |
| | | | | | |
3(i) | | | | The Restated Articles of Incorporation of Norfolk Southern Corporation are incorporated by reference to Exhibit 3(i) to Norfolk Southern Corporation’s 10-K filed on March 5, 2001. | | |
| | | | | | |
3(ii) | | | | An amendment to the Articles of Incorporation of Norfolk Southern Corporation is incorporated by reference to Exhibit 3(i) to Norfolk Southern Corporation’s Form 8-K filed on May 18, 2010. | | |
| | | | | | |
3(iii) | | | | The Bylaws of Norfolk Southern Corporation, as amended July 25, 2011,January 22, 2013, is incorporated by reference to Exhibit 3(ii) to Norfolk Southern Corporation’s Form 8-K filed on July 26, 2011.December 21, 2012. | | |
K81
4 | | | | Instruments Defining the Rights of Security Holders, Including Indentures: |
| | | | |
| | (a) | | Indenture, dated as of January 15, 1991, from Norfolk Southern Corporation to First Trust of New York, National Association, as Trustee, is incorporated by reference to Exhibit 4.1 to Norfolk Southern Corporation’s Registration Statement on Form S-3 (No. 33-38595). |
| | | | |
| | (b) | | First Supplemental Indenture, dated May 19, 1997, between Norfolk Southern Corporation and First Trust of New York, National Association, as Trustee, related to the issuance of notes in the principal amount of $4.3 billion, is incorporated herein by reference to Exhibit 1.1(d) to Norfolk Southern Corporation’s
Form 8-K filed on May 21, 1997. |
| | | | |
| | (c) | | Second Supplemental Indenture, dated April 26, 1999, between Norfolk Southern Corporation and U.S. Bank Trust National Association, as Trustee, is incorporated herein by reference to Exhibit 1.1(c) to Norfolk Southern Corporation’s Form 8-K filed on April 30, 1999. |
| | | | |
| | (d) | | Fourth Supplemental Indenture, dated as of February 6, 2001, between Norfolk Southern Corporation and U.S. Bank Trust National Association, as Trustee, related to the issuance of notes in the principal amount of $1 billion, is incorporated herein by reference to Exhibit 4.1 to Norfolk Southern Corporation’s
Form 8-K filed on February 7, 2001. |
| | | | |
| | (e) | | Eighth Supplemental Indenture, dated as of September 17, 2004, between Norfolk Southern Corporation and U.S. Bank Trust National Association, as Trustee, relatingrelated to the issuance of 5.257% Notes due 2014 (Securities) in the aggregate principal amount of $441.5 million in connection with Norfolk Southern Corporation’s offer to exchange the Securities and cash for up to $400 million of its outstanding 7.350% Notes due 2007, is incorporated herein by reference to Exhibit 4.1 to Norfolk Southern Corporation’s Form 8-K filed on September 23, 2004. |
| | | | |
| | (f) | | Indenture, dated August 27, 2004, among PRR Newco, Inc., as Issuer, and Norfolk Southern Railway Company, as Guarantor, and The Bank of New York, as Trustee, is incorporated herein by reference to Exhibit 4(1) to Norfolk Southern Corporation’s Form 10-Q filed on October 28, 2004. |
| | | | |
| | (g) | | First Supplemental Indenture, dated August 27, 2004, among PRR Newco, Inc., as Issuer, and Norfolk Southern Railway Company, as Guarantor, and The Bank of New York, as Trustee, related to the issuance of notes in the principal amount of approximately $451.8 million, is incorporated herein by reference to Exhibit 4(m) to Norfolk Southern Corporation’s Form 10-Q filed on October 28, 2004. |
| | (h) | | |
| | (h) | | Ninth Supplemental Indenture, dated as of March 11, 2005, between Norfolk Southern Corporation and U.S. Bank Trust National Association, as Trustee, relatingrelated to the issuance of notes in the principal amount of $300 million, is incorporated herein by reference to Exhibit 4.1 to Norfolk Southern Corporation’s Form 8-K filed on March 15, 2005. |
| | (i) | | |
| | (i) | | Tenth Supplemental Indenture, dated as of May 17, 2005, between Norfolk Southern Corporation and U.S. Bank Trust National Association, as Trustee, relatingrelated to the issuance of notes in the principal amount of $366.6 million, is incorporated herein by reference to Exhibit 99.1 to Norfolk Southern Corporation’s Form 8-K filed on May 18, 2005. |
| | | | |
| | (j) | | Eleventh Supplemental Indenture, dated as of May 17, 2005, between Norfolk Southern Corporation and U.S. Bank Trust National Association, as Trustee, relatingrelated to the issuance of notes in the principal amount of $350 million, is incorporated herein by reference to Exhibit 99.2 to Norfolk Southern Corporation’s Form 8-K filed on May 18, 2005. |
K82
| | (k) | | Twelfth Supplemental Indenture, dated as of August 26, 2010, between Norfolk Southern Corporation and U.S. Bank Trust National Association, as Trustee, relatingrelated to the issuance of notes in the principal amount of $250 million, is incorporated herein by reference to Exhibit 4.2 to Norfolk Southern Corporation’s Form 8-K filed on August 26, 2010. |
| | | | |
| | (l) | | Indenture, dated as of April 4, 2008, between Norfolk Southern Corporation and U.S. Bank Trust National Association, as Trustee, relatingrelated to the issuance of notes in the principal amount of $600 million, is incorporated herein by reference to Exhibit 4.1 to Norfolk Southern Corporation’s
Form 8-K filed on April 9, 2008. |
| | | | |
| | (m) | | Indenture, dated as of January 15, 2009, between Norfolk Southern Corporation and U.S. Bank Trust National Association, as Trustee, relatingrelated to the issuance of notes in the principal amount of
$500 million, is incorporated herein by reference to Exhibit 4.1 to Norfolk Southern Corporation’s
Form 8-K filed on January 20, 2009. |
| | | | |
| | (n) | | Indenture, dated as of June 1, 2009, between Norfolk Southern Corporation and U.S. Bank Trust National Association, as Trustee, is incorporated herein by reference to Exhibit 4.1 to Norfolk Southern Corporation’s Form 8-K filed on June 1, 2009. |
| | | | |
| | (o) | | First Supplemental Indenture, dated as of June 1, 2009, between Norfolk Southern Corporation and U.S. Bank Trust National Association, as Trustee, related to the issuance of notes in the principal amount of $500 million, is incorporated herein by reference to Exhibit 4.2 to Norfolk Southern Corporation’s
Form 8-K filed on June 1, 2009. |
| | | | |
| | (p) | | Second Supplemental Indenture, dated as of May 23, 2011, between the Registrant and U.S. Bank Trust National Association, as Trustee, related to the issuance of notes in the principal amount of $400 million, is incorporated by reference to Exhibit 4.1 to Norfolk Southern Corporation’s Form 8-K filed on May 23, 2011. |
| | | | |
| | (q) | | Indenture, dated as of September 14, 2011, between the Registrant and U.S. Bank Trust National Association, as Trustee, related to the issuance of notes in the principal amount of $595,504,000, is incorporated by reference to Exhibit 4.1 to Norfolk Southern Corporation’s Form 8-K filed on September 15, 2011. |
| | | | |
| | (r) | | Third Supplemental Indenture, dated as of September 14, 2011, between the Registrant and U.S. Bank Trust National Association, as Trustee, related to the issuance of notes in the principal amount of $4,492,000, is incorporated by reference to Exhibit 4.2 to Norfolk Southern Corporation’s Form 8-K filed on September 15, 2011. |
| | (s) | | |
| | (s) | | Registration Rights Agreement, dated as of September, 2011, among Norfolk Southern Corporation,
J.P. Morgan Securities, LLC, and Merrill Lynch, Pierce, Fenner & Smith Incorporated, is incorporated herein by reference to Exhibit 4.3 to Norfolk Southern Corporation’s Form 8-K filed on
September 15, 2011. |
| | | | |
| | (t) | | Fourth Supplemental Indenture, dated as of November 17, 2011, between the Registrant and U.S. Bank Trust National Association, as Trustee, related to the issuance of two series of notes, one in the principal amount of $500 million and one in the principal amount of $100 million, is incorporated herein by reference to Exhibit 4.1 to Norfolk Southern Corporation’s Form 8-K filed on November 17, 2011. |
| | | | |
| | (t) | | Indenture, dated as of March 15, 2012, between the Registrant and U.S. Bank Trust National Association, as Trustee, is incorporated herein by reference to Exhibit 4.1 to Norfolk Southern Corporation’s Form 8-K filed on November 17, 2011.March 15, 2012. |
| | | | |
| | (u) | | First Supplemental Indenture, dated as of March 15, 2012, between the Registrant and U.S. Bank Trust National Association, as Trustee, is incorporated herein by reference to Exhibit 4.2 to Norfolk Southern Corporation’s Form 8-K filed on March 15, 2012. |
| | | | |
| | (v) | | Indenture, dated as of August 20, 2012, between the Registrant and U.S. Bank Trust National Association, as Trustee, is incorporated herein by reference to Exhibit 4.1 to the Registrant’s Form 8-K filed on August 21, 2012. |
| | | | |
| | (w) | | Registration Rights Agreement, dated as of August 20, 2012, among the Registrant, Merrill Lynch, Pierce, Fenner & Smith Incorporated and Citigroup Global Markets Inc. is incorporated herein by reference to Exhibit 4.2 to Norfolk Southern Corporation’s Form 8-K filed on August 21, 2012. |
| | | | |
| | (x) | | Second Supplemental Indenture, dated as of September 7, 2012, between the Registrant and U.S. Bank Trust National Association, as Trustee, is incorporated herein by reference to Exhibit 4.1 to Norfolk Southern Corporation’s Form 8-K filed on September 7, 2012. |
| | | | |
| | | | In accordance with Item 601(b)(4)(iii) of Regulation S-K, copies of other instruments of Norfolk Southern Corporation and its subsidiaries with respect to the rights of holders of long-term debt are not filed herewith, or incorporated by reference, but will be furnished to the Commission upon request. |
K83
10 | | | | |
10 | | | | Material Contracts - |
| | | | |
| | (a) | | The Transaction Agreement, dated as of June 10, 1997, by and among CSX and CSX Transportation, Inc., Registrant, Norfolk Southern Railway Company, Conrail Inc., Consolidated Rail Corporation, and CRR Holdings LLC, with certain schedules thereto, previously filed, is incorporated herein by reference to Exhibit 10(a) to Norfolk Southern Corporation’s Form 10-K filed on February 24, 2003. |
| | | | |
| | (b) | | Amendment No. 1 dated as of August 22, 1998, to the Transaction Agreement, dated as of June 10, 1997, by and among CSX Corporation, CSX Transportation, Inc., Norfolk Southern Corporation, Norfolk Southern Railway Company, Conrail, Inc., Consolidated Rail Corporation, and CRR Holdings LLC, is incorporated herein by reference from Exhibit 10.1 to Norfolk Southern Corporation’s
Form 10-Q filed on August 11, 1999. |
| | (c) | | |
| | (c) | | Amendment No. 2 dated as of June 1, 1999, to the Transaction Agreement, dated June10, 1997, by and among CSX Corporation, CSX Transportation, Inc., Norfolk Southern Corporation, Norfolk Southern Railway Company, Conrail, Inc., Consolidated Rail Corporation, and CRR Holdings LLC, is incorporated herein by reference from Exhibit 10.2 to Norfolk Southern Corporation’s Form 10-Q filed on August 11, 1999. |
| | | | |
| | (d) | | Amendment No. 3 dated as of June 1, 1999, and executed in April 2004, to the Transaction Agreement, dated June 10, 1997, by and among CSX Corporation, CSX Transportation, Inc., Norfolk Southern Corporation, Norfolk Southern Railway Company, Conrail, Inc., Consolidated Rail Corporation, and CRR Holdings LLC, is incorporated herein by reference from Exhibit 10(dd) to Norfolk Southern Corporation’s Form 10-Q filed on July 30, 2004. |
| | | | |
| | (e) | | Amendment No. 5 to the Transaction Agreement, dated as of August 27, 2004, by and among CSX Corporation, CSX Transportation, Inc., Norfolk Southern Corporation, Norfolk Southern Railway Company, Conrail, Inc., Consolidated Rail Corporation, and CRR Holdings LLC, is incorporated herein by reference to Exhibit 10.1 to Norfolk Southern Corporation’s Form 8-K filed on September 2, 2004. |
| | | | |
| | (f) | | Amendment No. 6 dated as of April 1, 2007, to the Transaction Agreement, dated June 10, 1997, by and among CSX Corporation, CSX Transportation, Inc., Norfolk Southern Railway Company, Conrail, Inc., Consolidated Rail Corporation, and CRR Holdings LLC, is incorporated herein by reference to
Exhibit 10.5 to Norfolk Southern Corporation’s Form 10-Q filed on July 27, 2007. |
| | | | |
| | (g) | | Shared Assets Area Operating Agreement for North Jersey, dated as of June 1, 1999, by and among Consolidated Rail Corporation, CSX Transportation, Inc., and Norfolk Southern Railway Company, with exhibit thereto, is incorporated herein by reference from Exhibit 10.4 to Norfolk Southern Corporation’s Form 10-Q filed on August 11, 1999. |
| | | | |
| | (h) | | Shared Assets Area Operating Agreement for Detroit, dated as of June 1, 1999, by and among Consolidated Rail Corporation, CSX Transportation, Inc., and Norfolk Southern Railway Company, with exhibit thereto, is incorporated herein by reference from Exhibit 10.6 to Norfolk Southern Corporation’s Form 10-Q filed on August 11, 1999. |
| | | | |
| | (i) | | Shared Assets Area Operating Agreement for South Jersey/Philadelphia, dated as of June 1, 1999, by and among Consolidated Rail Corporation, CSX Transportation, Inc., and Norfolk Southern Railway Company, with exhibit thereto, is incorporated herein by reference from Exhibit 10.5 to Norfolk Southern Corporation’s Form 10-Q filed on August 11, 1999. |
K84
| (j) | (j) | Amendment No. 1, dated as of June 1, 2000, to the Shared Assets Area Operating Agreements for North Jersey, South Jersey/Philadelphia, and Detroit, dated as of June 1, 1999, by and among Consolidated Rail Corporation, CSX Transportation, Inc., and Norfolk Southern Railway Company, with exhibits thereto, is incorporated herein by reference to Exhibit 10(h) to Norfolk Southern Corporation’s Form 10-K filed on March 5, 2001. |
| | | |
| (k) | (k) | Amendment No. 2, dated as of January 1, 2001, to the Shared Assets Area Operating Agreements for North Jersey, South Jersey/Philadelphia, and Detroit, dated as of June 1, 1999, by and among Consolidated Rail Corporation, CSX Transportation, Inc., and Norfolk Southern Railway Company, with exhibits thereto, is incorporated herein by reference to Exhibit 10(j) to Norfolk Southern Corporation’s Form 10-K filed on February 21, 2002. |
| | |
(l) | (l) | Amendment No. 3, dated as of June 1, 2001, and executed in May of 2002, to the Shared Assets Area Operating Agreements for North Jersey, South Jersey/Philadelphia, and Detroit, dated as of June 1, 1999, by and among Consolidated Rail Corporation, CSX Transportation, Inc., and Norfolk Southern Railway Company, with exhibits thereto, is incorporated herein by reference to Exhibit 10(k) to Norfolk Southern Corporation’s Form 10-K filed on February 24, 2003. |
| | | |
| (m) | (m) | Amendment No. 4, dated as of June 1, 2005, and executed in late June 2005, to the Shared Assets Area Operating Agreements for North Jersey, South Jersey/Philadelphia, and Detroit, dated as of June 1, 1999, by and among Consolidated Rail Corporation, CSX Transportation, Inc., and Norfolk Southern Railway Company, with exhibits thereto, is incorporated herein by reference to Exhibit 99 to Norfolk Southern Corporation’s Form 8-K filed on July 1, 2005. |
| | | |
| (n) | (n) | Monongahela Usage Agreement, dated as of June 1, 1999, by and among CSX Transportation, Inc., Norfolk Southern Railway Company, Pennsylvania Lines LLC, and New York Central Lines LLC, with exhibit thereto, is incorporated herein by reference from Exhibit-Exhibit 10.7 to Norfolk Southern Corporation’s Form 10-Q filed on August 11, 1999. |
| | | |
| (o) | (o) | The Agreement, entered into as of July 27, 1999, between North Carolina Railroad Company and Norfolk Southern Railway Company, is incorporated herein by reference from Exhibit 10(i) to Norfolk Southern Corporation’s Form 10-K filed on March 6, 2000. |
| | | |
| (p) | (p) | First Amendment, dated March 19, 2007, to the Master Agreement dated July 27, 1999, by and between North Carolina Railroad Company and Norfolk Southern Railway Company, is incorporated herein by reference to Exhibit 10.3 to Norfolk Southern Corporation’s Form 10-Q filed on July 27, 2007. |
| | | |
| (q) | (q) | Second Amendment, dated December 28, 2009, to the Master Agreement dated July 27, 1999, by and between North Carolina Railroad Company and Norfolk Southern Railway Company, is incorporated herein by reference to Exhibit 10(q) to Norfolk Southern Corporation’s Form 10-K filed on
February 17, 2010 (Exhibits, annexes and schedules omitted. The Registrant will furnish supplementary copies of such materials to the SEC upon request). |
| | | |
| (r) | (r) | The Supplementary Agreement, entered into as of January 1, 1987, between the Trustees of the Cincinnati Southern Railway and The Cincinnati, New Orleans and Texas Pacific Railway Company (the latter a wholly owned subsidiary of Norfolk Southern Railway Company) – extending and amending a Lease, dated as of October 11, 1881 – is incorporated by reference to Exhibit 10(k) to Norfolk Southern Corporation’s Form 10-K filed on March 5, 2001. |
K85
| | (s)* | The Norfolk Southern Corporation Executive Management Incentive Plan, effective May 13, 2010, is incorporated by reference herein from Exhibit 10.2 to Norfolk Southern Corporation’s Form 8-K filed on May 18, 2010. |
| | | |
| | (t)* | Norfolk Southern Corporation Executive Management Incentive Plan, as approved by shareholders May 13, 2010 and as amended September 27, 2011 and April 26, 2012, is incorporated herein by reference herein from
to Exhibit 10.2 to Norfolk Southern Corporation’s Form 10-Q filed on October 28, 2011.April 27, 2012. |
| | | |
| | (u)(t)* | The Norfolk Southern Corporation Officers’ Deferred Compensation Plan, as amended effective September 26, 2000, is incorporated herein by reference to Exhibit 10(n) to Norfolk Southern Corporation’s Form 10-K filed on March 5, 2001. |
| | | |
| | (v)(u)* | The Norfolk Southern Corporation Directors’ Restricted Stock Plan, effectiveadopted January 1, 1994, asand amended and restated November 24, 1998, is incorporated herein by reference from Exhibit 10(h) to Norfolk Southern Corporation’s Form 10-K filed on March 24, 1999. |
| | | |
| | (w)* | Form of Severance Agreement, datedeffective as of JuneAugust 1, 1996, between Norfolk Southern Corporation and certain executive officers (including those defined as “named executive officers” and identified in the Corporation’s Proxy Statement for the 1997 through 2001 Annual Meetings of Stockholders)2012, is incorporated herein by reference to Exhibit 10(t)10.1 to Norfolk Southern Corporation’s Form 10-K10-Q filed on February 21, 2002.October 25, 2012. |
| | | |
| | (x)(v)* | Supplemental Benefit Plan of Norfolk Southern Corporation and Participating Subsidiary Companies, as amended effective January 1, 2009, is incorporated herein by reference to Exhibit 10.06 to Norfolk Southern Corporation’s Form 8-K filed on July 24, 2008. |
| | | |
| | (y)(w)* | Amendment to the Supplemental Benefit Plan of Norfolk Southern Corporation and Participating Subsidiary Companies, effective as of January 1, 2009, is incorporated herein by reference to
Exhibit 10(x) to Norfolk Southern Corporation’s Form 10-K filed on February 18, 2009. |
| | | |
| | (z)(x)* | The Norfolk Southern Corporation Directors’ Charitable Award Program, as amended effective July 2007, is incorporated herein by reference to Exhibit 10.6 to Norfolk Southern Corporation’s Form 10-Q filed on July 27, 2007. |
| | | |
| | (aa)*(y) | The Norfolk Southern Corporation Outside Directors’ Deferred Stock Unit Program, as amended effective January 22, 2008, is incorporated herein by reference to Exhibit 10.1 to Norfolk Southern Corporation’s Form 8-K filed on January 25, 2008. |
| | | |
| | (bb)* | Form of Agreement, dated as of October 1, 2001, providing enhanced pension benefits to three officers in exchange for their continued employment with Norfolk Southern Corporation for two years, is incorporated herein by reference to Exhibit 10(w) to Norfolk Southern Corporation’s Form 10-Q filed on November 9, 2001. The agreement was entered into with L. Ike Prillaman, former Vice Chairman and Chief Marketing Officer; Stephen C. Tobias, former Vice Chairman and Chief Operating Officer; and Henry C. Wolf, former Vice Chairman and Chief Financial Officer. |
| | | |
| | (cc) | The Norfolk Southern Corporation Thoroughbred Stock Option Plan, as amended effective
January 28, 2003, is incorporated herein by reference to Exhibit 10(z) to Norfolk Southern Corporation’s Form 10-K filed on February 24, 2003. |
K86
| (dd)(z)* | The Norfolk Southern Corporation Executive Life Insurance Plan, as amended and restated effective November 1, 2009, is incorporated herein by reference to Exhibit 10(cc) to Norfolk Southern Corporation’s Form 10-K filed on February 17, 2010. |
| (aa) | |
| (ee) | Distribution Agreement, dated as of July 26, 2004, by and among CSX Corporation, CSX Transportation, Inc., CSX Rail Holding Corporation, CSX Northeast Holdings Corporation, Norfolk Southern Corporation, Norfolk Southern Railway Company, CRR Holdings LLC, Green Acquisition Corp., Conrail Inc., Consolidated Rail Corporation, New York Central Lines LLC, Pennsylvania Lines LLC, NYC Newco, Inc., and PRR Newco, Inc., is incorporated herein by reference to Exhibit 2.1 to Norfolk Southern Corporation’s Form 8-K filed on September 2, 2004. |
| | |
| (ff)(bb) | Tax Agreement, dated as of August 27, 2004, by and among Green Acquisition Corp., Conrail Inc., Consolidated Rail Corporation, New York Central Lines LLC, and Pennsylvania Lines LLC, is incorporated herein by reference to Exhibit 10.2 to Norfolk Southern Corporation’s Form 8-K filed on September 2, 2004. |
| | |
| (gg)(cc) | Amended and Restated Credit Agreement dated as of June 26, 2007, with respect to the Registrant’s
$1 billion unsecured revolving credit facility, is incorporated herein by reference to Exhibit 99 to Norfolk Southern Corporation’s Form 8-K filed on June 27, 2007. This agreement was terminated as noted in Norfolk Southern Corporation’s Form 8-K filed on December 15, 2011. |
| | |
| (hh)(dd)* | The description of Norfolk Southern Corporation’s executive physical reimbursement for non-employee directors and certain executives is incorporated herein by reference to Norfolk Southern Corporation’s Form 8-K filed on July 28, 2005. |
| | |
| (ii)(ee)* | Form of 2005 Incentive Stock Option and Non-Qualified Stock Option Agreement under the Norfolk Southern Long-Term Incentive Plan, is incorporated herein by reference to Exhibit 99 to Norfolk Southern Corporation’s Form 8-K filed on January 7, 2005. |
| (ff)* | |
| (jj)* | Form of 2006 Incentive Stock Option and Non-Qualified Stock Option Agreement under the Norfolk Southern Long-Term Incentive Plan, is incorporated herein by reference to Exhibit 99 to Norfolk Southern Corporation’s Form 8-K/A filed on December 7, 2005. |
| | |
| (kk)(gg) | The Norfolk Southern Corporation Long-Term Incentive Plan, as amended effective May 13, 2010, is incorporated herein by reference to Exhibit 10.1 to Norfolk Southern Corporation’s Form 8-K filed on May 18, 2010. |
| | |
| (ll)(hh) | The Transaction Agreement, dated as of December 1, 2005, by and among Norfolk Southern Corporation, The Alabama Great Southern Railroad Company, Kansas City Southern, and The Kansas City Southern Railway Company, is incorporated herein by reference to Exhibit 10(II) to Norfolk Southern Corporation’s Form 10-K filed on February 23, 2006 (Exhibits, annexes, and schedules omitted. The Registrant will furnish supplementary copies of such materials to the SEC upon request). |
| | |
| (mm)(ii) | Amendment No. 1, dated as of January 17, 2006, by and among Norfolk Southern Corporation, The Alabama Great Southern Railroad Company, Kansas City Southern, and The Kansas City Southern Railroad , is incorporated herein by reference to Exhibit 10(mm) to Norfolk Southern Corporation’s Form 10-K filed on February 23, 2006. |
K87
| (nn) | |
| (jj) | Amendment No. 2, dated as of May 1, 2006, to the Transaction Agreement, dated as of
December 1, 2005, by and among Norfolk Southern Corporation, The Alabama Great Southern Railroad Company, Kansas City Southern, and The Kansas City Southern Railway Company is incorporated herein by reference to Exhibit 10.1 to Norfolk Southern Corporation’s Form 8-K filed on May 4, 2006. |
| | |
| (oo)(kk)* | The retirement agreement, dated January 27, 2006, between Norfolk Southern Corporation and David R. Goode, is incorporated herein by reference to Exhibit 10.1 to Norfolk Southern Corporation’s
Form 8-K filed on January 27, 2006. |
| | |
| (pp)* | Revised fees for outside directors are incorporated herein by reference to Norfolk Southern Corporation’s Form 8-K filed on January 27, 2006. In addition,Beginning in 2012, directors who serve on a non-standing Special Litigation Committee of the Board of Directors received aas committee chairpersons receive an additional quarterly fee of $3,750 during 2010$5,000 for such service, and starting January 1, 2011 receive athe Lead Director receives an additional quarterly fee of $5,000 per meeting, for such service.$12,500. |
| | |
| (qq)*(ll) | The retirement agreement, dated March 28, 2006, between Norfolk Southern Corporation and L. Ike Prillaman, is incorporated herein by reference to Exhibit 10.1 to Norfolk Southern Corporation’s
Form 8-K filed on March 31, 2006. |
| | |
| (rr) | Limited Liability Agreement of Meridian Speedway, LLC, dated as of May 1, 2006, by and among the Alabama Great Southern Railroad Company and Kansas City Southern, is incorporated herein by reference to Exhibit 10.2 to Norfolk Southern Corporation’s Form 8-K filed on May 4, 2006. |
| | |
| (ss)(mm)* | Form of Norfolk Southern Corporation Long-Term Incentive Plan, 2007 Award Agreement is incorporated herein by reference to Exhibit 10.1 to Norfolk Southern Corporation’s Form 8-K filed on January 11, 2007. |
| | |
| (tt)(nn)* | Retirement Plan of Norfolk Southern Corporation and Participating Subsidiary Companies effective June 1, 1982, amended effective January 1, 2010, is incorporated herein by reference to Exhibit 10(rr) to Norfolk Southern Corporation’s Form 10-K filed on February 17, 2010. |
| | |
| (uu)* | The retirement agreement between Norfolk Southern Corporation and Henry C. Wolf is incorporated herein by reference to Exhibit 10.1 to Norfolk Southern Corporation’s Form 8-K filed on
May 11, 2007.(oo)
|
| | |
| (vv) | Transfer and Administration Agreement dated as of November 8, 2007, with respect to the Registrant’s $500 million receivables securitization facility is incorporated herein by reference to Exhibit 99 to Norfolk Southern Corporation’s Form 8-K filed on November 14, 2007. |
| | |
| (ww)(pp) | Amendment No. 2, dated as of May 19, 2009, to Transfer and Administration Agreement dated as of November 8, 2007, is incorporated herein by reference to Exhibit 10.1 to Norfolk Southern Corporation’s Form 10-Q filed on July 31, 2009. |
| | |
| (qq) | |
| (xx) | Amendment No. 3, dated as of August 21, 2009, to Transfer and Administration Agreement dated as of November 8, 2007, is incorporated herein by reference to Exhibit 10.1 to Norfolk Southern Corporation’s Form 10-Q filed on October 30, 2009. |
| | |
| (yy)(rr) | Amendment No. 4, dated as of October 22, 2009, to Transfer and Administration Agreement dated as of November 8, 2007, is incorporated herein by reference to Exhibit 99 to Norfolk Southern Corporation’s Form 8-K filed on October 22, 2009. |
K88
| (zz)(ss) | Amendment No. 5, dated as of December 23, 2009, to Transfer and Administration Agreement dated as of November 8, 2007, is incorporated herein by reference to Exhibit 10(xx) to Norfolk Southern Corporation’s Form 10-K filed on February 17, 2010. |
| | |
| (aaa)(tt) | Amendment No. 6, dated as of August 30, 2010, to Transfer and Administration Agreement dated as of November 8, 2007, with respect to the Registrant’s receivables securitization facility is incorporated herein by reference to Exhibit 10.1 to Norfolk Southern Corporation’s Form 10-Q filed on October 29, 2010. |
| | |
| (bbb)(uu) | Amendment No. 7, dated as of October 21, 2010, to Transfer and Administration Agreement dated as of November 8, 2007, with respect to the Registrant’s receivables securitization facility is incorporated herein by reference to Exhibit 99 to Norfolk Southern Corporation’s Form 8-K filed on October 22, 2010. |
| (vv) | |
| (ccc) | Amendment No. 8, dated as of October 20, 2011, to Transfer and Administration Agreement dated as of November 8, 2007, with respect to the Registrant’s receivables securitization facility is incorporated herein by reference to Exhibit 99 to Norfolk Southern Corporation’s Form 8-K filed on October 20, 2011. |
| | |
| (ddd)(ww)* | Form of Norfolk Southern Corporation Long-Term Incentive Plan, 2008 Award Agreement is incorporated herein by reference to Exhibit 99 to Norfolk Southern Corporation’s Form 8-K filed on November 20, 2007. |
| | |
| (eee)(xx) | Dealer Agreement dated as of January 23, 2008, between the Registrant and J. P. Morgan Securities Inc. is incorporated herein by reference to Exhibit 10.1 to Norfolk Southern Corporation’s
Form 8-K filed on January 25, 2008. |
| | |
| (fff)(yy) | Dealer Agreement dated as of January 23, 2008, between the Registrant and Goldman, Sachs & Co. is incorporated herein by reference to Exhibit 10.2 to Norfolk Southern Corporation’s Form 8-K filed on January 25, 2008. |
| | |
| (ggg)(zz)* | 2008 Award Agreement between Norfolk Southern Corporation and Gerald L. Baliles, dated January 24, 2008, is incorporated herein by reference to Exhibit 10.2 to Norfolk Southern Corporation’s Form 8-K filed on January 25, 2008. |
| | |
| (hhh)(aaa)* | 2008 Award Agreement between Norfolk Southern Corporation and Daniel A. Carp, dated
January 24, 2008, is incorporated herein by reference to Exhibit 10.3 to Norfolk Southern Corporation’s Form 8-K filed on January 25, 2008. |
| | |
| (iii)(bbb)* | 2008 Award Agreement between Norfolk Southern Corporation and Gene R. Carter, dated
January 24, 2008, is incorporated herein by reference to Exhibit 10.4 to Norfolk Southern Corporation’s Form 8-K filed on January 25, 2008. |
| | |
| (jjj)* | 2008 Award Agreement between Norfolk Southern Corporation and Alston D. Correll, dated January 24, 2008, is incorporated herein by reference to Exhibit 10.5 to Norfolk Southern Corporation’s Form 8-K filed on January 25, 2008. |
| | |
| (kkk)* | 2008 Award Agreement between Norfolk Southern Corporation and Landon Hilliard, dated
January 24, 2008, is incorporated herein by reference to Exhibit 10.6 to Norfolk Southern Corporation’s Form 8-K filed on January 25, 2008. |
| (lll)(ccc)* | 2008 Award Agreement between Norfolk Southern Corporation and Burton M. Joyce, dated January 24, 2008, is incorporated herein by reference to Exhibit 10.7 to Norfolk Southern Corporation’s Form 8-K filed on January 25, 2008. |
| (ddd)* | |
| (mmm)* | 2008 Award Agreement between Norfolk Southern Corporation and Steven F. Leer, dated
January 24, 2008, is incorporated herein by reference to Exhibit 10.8 to Norfolk Southern Corporation’s Form 8-K filed on January 25, 2008. |
| | |
| (nnn)(eee)* | 2008 Award Agreement between Norfolk Southern Corporation and Jane M. O’Brien, dated January 24, 2008, is incorporated herein by reference to Exhibit 10.9 to Norfolk Southern Corporation’s Form 8-K filed on January 25, 2008. |
| | |
| (ooo)* | 2008 Award Agreement between Norfolk Southern Corporation and J. Paul Reason, dated
January 24, 2008, is incorporated herein by reference to Exhibit 10.10 to Norfolk Southern Corporation’s Form 8-K filed on January 25, 2008. |
| | |
| (ppp)(fff) | Omnibus Amendment, dated as of March 18, 2008, to the Transfer and Administration Agreement dated as of November 8, 2007, is incorporated herein by reference to Exhibit 10.1 to Norfolk Southern Corporation’s Form 10-Q filed on April 23, 2008. |
| | |
| (qqq)(ggg) | Transaction Agreement (Pan Am Transaction Agreement), dated May 15, 2008, by and among Norfolk Southern Railway Company, Pan Am Railways, Inc., Boston and Maine Corporation, and Springfield Terminal Railway Company, is incorporated herein by reference to Exhibit 10.1 to Norfolk Southern Corporation’s Form 10-Q filed on July 24, 2008 (Exhibits, annexes and schedules omitted. The Registrant will furnish supplementary copies of such materials to the SEC upon request). |
| | |
| (rrr)(hhh) | Letter Agreement, dated October 21, 2008, by and among Norfolk Southern Railway Company, Pan Am Railways, Inc., Boston and Maine Corporation, and Springfield Terminal Railway Company amending certain terms of the Pan Am Transaction Agreement, is incorporated herein by reference to Exhibit 10(rrr) to Norfolk Southern Corporation’s Form 10-K filed on
February 18, 2009. |
| | |
| (sss)(iii)* | Directors’ Deferred Fee Plan of Norfolk Southern Corporation, as amended effective
January 1, 2009, is incorporated herein by reference to Exhibit 10.01 to Norfolk Southern Corporation’s Form 8-K filed on July 24, 2008. |
| | |
| (ttt)(jjj)** | Norfolk Southern Corporation Executives’ Deferred Compensation Plan, as amended effective January 1, 2009, is incorporated herein by reference to Exhibit 10.02 to Norfolk Southern Corporation’s Form 8-K filed on July 24, 2008.2012. |
| | |
| (uuu)(kkk)** | Norfolk Southern Corporation Executives’ Deferred Compensation Plan, as amended effective December 1, 2011. |
| | |
| (vvv)* | Amendment to Norfolk Southern Corporation Officers’ Deferred Compensation Plan, effective January 1, 2008, is incorporated herein by reference to Exhibit 10.03 to Norfolk Southern Corporation’s Form 8-K filed on July 24, 2008. |
| | |
| (www)(lll)* | Norfolk Southern Corporation Long-Term Incentive Plan, as amended effective January 1, 2009, is incorporated herein by reference to Exhibit 10.04 to Norfolk Southern Corporation’s Form 8-K filed on July 24, 2008. |
K90
| (xxx)(mmm)* | Norfolk Southern Corporation Restricted Stock Unit Plan, as amended effective January 1, 2009, is incorporated herein by reference to Exhibit 10.05 to Norfolk Southern Corporation’s Form 8-K filed on July 24, 2008. |
| (nnn) | |
| (yyy) | Amendment No. 1 to Transfer and Administration Agreement dated as of October 22, 2008, and effective as of October 23, 2008, with respect to the Registrant’s $500 million receivable securitization facility, is incorporated herein by reference to Exhibit 99 to Norfolk Southern Corporation’s Form 8-K filed on October 23, 2006. |
| | |
| (zzz)(ooo)* | Stock Unit Plan of Norfolk Southern Corporation dated as of July 24, 2001, as amended on
August 21, 2008, with an effective date of January 1, 2009, is incorporated herein by reference to Exhibit 10.1 to Norfolk Southern Corporation’s Form 10-Q filed on October 24, 2008. |
| (ppp)* | |
| (aaaa)* | Form of Norfolk Southern Corporation Long-Term Incentive Plan, 2009 Award Agreement is incorporated herein by reference to Exhibit 99 to Norfolk Southern Corporation’s Form 8-K/A filed on December 17, 2008. |
| | |
| (bbbb)(qqq)* | Form of Amended and Restated Change in Control Agreement between Norfolk Southern Corporation and certain executive officers (including those defined as “named executive officers” and identified in the Corporation’s Proxy Statement for the 2008 annual Meetings of Stockholders), is incorporated herein by reference to Exhibit 10(aaaa) to Norfolk Southern Corporation’s Form 10-K filed on February 18, 2009. |
| | |
| (cccc)(rrr)* | 2009 Award Agreement between Norfolk Southern Corporation and Gerald L. Baliles, dated January 29, 2009, is incorporated herein by reference to Exhibit 10.1 to Norfolk Southern Corporation’s Form 8-K filed on January 30, 2009. |
| | |
| (dddd)(sss)* | 2009 Award Agreement between Norfolk Southern Corporation and Daniel A. Carp, dated
January 29, 2009, is incorporated herein by reference to Exhibit 10.2 to Norfolk Southern Corporation’s Form 8-K filed on January 30, 2009. |
| | |
| (eeee)(ttt)* | 2009 Award Agreement between Norfolk Southern Corporation and Gene R. Carter, dated
January 29, 2009, is incorporated herein by reference to Exhibit 10.3 to Norfolk Southern Corporation’s Form 8-K filed on January 30, 2009. |
| | |
| (ffff)* | 2009 Award Agreement between Norfolk Southern Corporation and Alston D. Correll, dated January 29, 2009, is incorporated herein by reference to Exhibit 10.4 to Norfolk Southern Corporation’s Form 8-K filed on January 30, 2009. |
| | |
| (gggg)(uuu)* | 2009 Award Agreement between Norfolk Southern Corporation and Landon Hilliard, dated January 29, 2009, is incorporated herein by reference to Exhibit 10.5 to Norfolk Southern Corporation’s Form 8-K filed on January 30, 2009. |
| | |
| (hhhh)* | 2009 Award Agreement between Norfolk Southern Corporation and Karen N. Horn, dated
January 29, 2009, is incorporated herein by reference to Exhibit 10.6 to Norfolk Southern Corporation’s Form 8-K filed on January 30, 2009. |
| | |
| (iiii)(vvv)* | 2009 Award Agreement between Norfolk Southern Corporation and Burton M. Joyce, dated January 29, 2009, is incorporated herein by reference to Exhibit 10.7 to Norfolk Southern Corporation’s Form 8-K filed on January 30, 2009. |
K91
| (jjjj)(www)* | 2009 Award Agreement between Norfolk Southern Corporation and Steven F. Leer, dated
January 29, 2009, is incorporated herein by reference to Exhibit 10.8 to Norfolk Southern Corporation’s Form 8-K filed on January 30, 2009. |
| | |
| (kkkk)(xxx)* | 2009 Award Agreement between Norfolk Southern Corporation and Michael D. Lockhart, dated January 29, 2009, is incorporated herein by reference to Exhibit 10.9 to Norfolk Southern Corporation’s Form 8-K filed on January 30, 2009. |
| | |
| (llll)(yyy)* | 2009 Award Agreement between Norfolk Southern Corporation and J. Paul Reason, dated
January 29, 2009, is incorporated herein by reference to Exhibit 10.10 to Norfolk Southern Corporation’s Form 8-K filed on January 30, 2009. |
| | |
| (mmmm)(zzz) | Limited Liability Company Agreement of Pan Am Southern LLC, dated as of April 9, 2009, is incorporated herein by reference to Exhibit 10.1 to Norfolk Southern Corporation’s Form 8-K filed on April 9, 2009 (exhibits, annexes, and schedules omitted – the Registrant will furnish supplementary copies of such materials to the SEC upon request). |
| | |
| (nnnn)(aaaa)* | Form of Norfolk Southern Corporation Long-Term Incentive Plan, 2010 Award Agreement for Outside Directors is incorporated herein by reference to Exhibit 99, Item 10.1 to Norfolk Southern Corporation’s Form 8-K/A filed on January 29, 2010. |
| | |
| (oooo)(bbbb)* | Form of Norfolk Southern Corporation Long-Term Incentive Plan, 2010 Award Agreement is incorporated herein by reference to Exhibit 99, Item 10.2 to Norfolk Southern Corporation’s
Form 8-K/A filed on January 29, 2010. |
| | |
| (pppp)(cccc)* | Form of Norfolk Southern Corporation Long-Term Incentive Plan, 2011 Award Agreement for Outside Directors approved by the Compensation Committee on November 22, 2010, is incorporated herein by reference to Exhibit 10nnnn to Norfolk Southern Corporation’s Form 10-K filed on February 16, 2011. |
| | |
| (qqqq)(dddd)* | Form of Norfolk Southern Corporation Long-Term Incentive Plan, 2011 Award Agreement for incentive stock options approved by the Performance-Based Compensation Committee on
January 25, 2011, is incorporated herein by reference to Exhibit 10oooo to Norfolk Southern Corporation’s Form 10-K filed on February 16, 2011. |
| (eeee)* | |
| (rrrr)* | Form of Norfolk Southern Corporation Long-Term Incentive Plan, 2011 Award Agreement for performance share units approved by the Performance-Based Compensation Committee on January 25, 2011, is incorporated herein by reference to Exhibit 10pppp to Norfolk Southern Corporation’s Form 10-K filed on February 16, 2011. |
| | |
| (ssss)(ffff)* | Form of Norfolk Southern Corporation Long-Term Incentive Plan, 2011 Award Agreement for non-qualified stock options approved by the Performance-Based Compensation Committee on January 25, 2011, is incorporated herein by reference to Exhibit 10qqqq to Norfolk Southern Corporation’s Form 10-K filed on February 16, 2011. |
| | |
| (tttt)(gggg)* | Form of Norfolk Southern Corporation Long-Term Incentive Plan, 2011 Award Agreement for restricted stock units approved by the Performance-Based Compensation Committee on
January 25, 2011, is incorporated herein by reference to Exhibit 10rrrr to Norfolk Southern Corporation’s Form 10-K filed on February 16, 2011. |
K92
| (uuuu)* | |
| (hhhh)* | Form of Norfolk Southern Corporation Long-Term Incentive Plan, Non-Compete Agreement Associated with 2011 Award Agreement approved by the Performance-Based Compensation Committee on January 25, 2011, is incorporated herein by reference to Exhibit 10ssss to Norfolk Southern Corporation’s Form 10-K filed on February 16, 2011. |
| | |
| (vvvv)(iiii) | Performance Criteria for bonuses payable in 2012 for the 2011 incentive year. On January 25, 2011, the Performance-Based Compensation Committee of the Norfolk Southern Corporation Board of Directors adopted the following performance criteria for determining bonuses payable in 2012 for the 2011 incentive year under the Norfolk Southern Corporation Executive Management Incentive Plan and the Norfolk Southern Corporation Management Incentive Plan: 37.5% based on pre-tax net income; 37.5% based on operating ratio; and 25% based on a composite of three transportation service measures, consisting of adherence to operating plan, connection performance, and train performance. |
| | |
| (wwww) | Credit Agreement dated as of December 14, 2011, establishing a 5-year, $750 million, unsecured revolving credit facility of the Registrant is incorporated herein by reference to Exhibit 99 to Norfolk Southern Corporation’s Form 8-K filed on December 15, 2011. |
| (jjjj)* | |
| (xxxx)** | Form of Norfolk Southern Corporation Long-Term Incentive Plan, 2012 Award Agreement for Outside Directors approved by the Compensation Committee on November 22, 2011.2011, is incorporated herein by reference to Exhibit 10xxxx to Norfolk Southern Corporation’s Form 10-K filed on February 15, 2012. |
| | |
| (yyyy)(kkkk)** | Form of Norfolk Southern Corporation Long-Term Incentive Plan, 2012 Award Agreement for incentive stock options approved by the Compensation Committee on November 22, 2011.2011, is incorporated herein by reference to Exhibit 10yyyy to Norfolk Southern Corporation’s Form 10-K filed on February 15, 2012. |
| | |
| (zzzz)(llll)** | Form of Norfolk Southern Corporation Long-Term Incentive Plan, 2012 Award Agreement for performance share units approved by the Compensation Committee on November 22, 2011.2011, is incorporated herein by reference to Exhibit 10zzzz to Norfolk Southern Corporation’s Form 10-K filed on February 15, 2012. |
| | |
| (aaaaa)(mmmm)** | Form of Norfolk Southern Corporation Long-Term Incentive Plan, 2012 Award Agreement for
non-qualified stock options approved by the Compensation Committee on November 22, 2011.2011, is incorporated herein by reference to Exhibit 10aaaaa to Norfolk Southern Corporation’s Form 10-K filed on February 15, 2012. |
| | |
| (bbbbb)(nnnn)** | Form of Norfolk Southern Corporation Long-Term Incentive Plan, 2012 Award Agreement for restricted stock units approved by the Compensation Committee on November 22, 2011.2011, is incorporated herein by reference to Exhibit 10bbbbb to Norfolk Southern Corporation’s Form 10-K filed on February 15, 2012. |
| | |
| (ccccc)(oooo)** | Form of Norfolk Southern Corporation Long-Term Incentive Plan, Non-Compete Agreement Associated with 2012 Award Agreement, approved by the Compensation Committee on
November 22, 2011.2011, is incorporated herein by reference to Exhibit 10cccc to Norfolk Southern Corporation’s Form 10-K filed on February 15, 2012. |
| | |
| (ddddd)(pppp)** | Form of Norfolk Southern Corporation Long-Term Incentive Plan, 2013 Award Agreement for Outside Directors approved by the Compensation Committee on November 26, 2012. |
| (qqqq)** | Form of Norfolk Southern Corporation Long-Term Incentive Plan, 2013 Award Agreement for incentive stock options approved by the Compensation Committee on November 26, 2012. |
| | |
| (rrrr)** | Form of Norfolk Southern Corporation Long-Term Incentive Plan, 2013 Award Agreement for performance share units approved by the Compensation Committee on November 26, 2012. |
| | |
| (ssss)** | Form of Norfolk Southern Corporation Long-Term Incentive Plan, 2013 Award Agreement for
non-qualified stock options approved by the Compensation Committee on November 26, 2012. |
| | |
| (tttt)** | Form of Norfolk Southern Corporation Long-Term Incentive Plan, 2013 Award Agreement for restricted stock units approved by the Compensation Committee on November 26, 2012. |
| | |
| (uuuu)** | Form of Norfolk Southern Corporation Long-Term Incentive Plan, Non-Compete Agreement Associated with 2013 Award Agreement, approved by the Compensation Committee on
November 26, 2012. |
| | |
| (vvvv) | Performance Criteria for bonuses payable in 20132014 for the 20122013 incentive year. On January 23, 2012,21, 2013, the Compensation Committee of the Norfolk Southern Corporation Board of Directors adopted the following performance criteria for determining bonuses payable in 20132014 for the 20122013 incentive year under the Norfolk Southern Corporation Executive Management Incentive Plan and the Norfolk Southern Corporation Management Incentive Plan: 50% based on operating income; 35% based on operating ratio; and 15% based on a composite of three transportation service measures, consisting of adherence to operating plan, connection performance, and train performance. |
K93
| | |
| (wwww) | Omnibus Amendment, dated as of January 17, 2011, to Pan Am Transaction Agreement dated as of May 15, 2008, and Limited Liability Company Agreement of Pan Am Southern LLC dated as of April 9, 2009, is incorporated herein by reference to Exhibit 10.1 to Norfolk Southern Corporation’s Form 10-Q filed on April 27, 2012. |
| | |
| (xxxx) | Amendment No. 9, dated as of October 18, 2012, to Transfer and Administration Agreement dated as of November 8, 2007, with respect to the Registrant’s receivables securitization facility, is incorporated herein by reference to Exhibit 99 to Norfolk Southern Corporation’s Form 8-K filed on October 22, 2012. |
| | |
| (yyyy)* | Form of Amendment to Amended and Restated Change in Control Agreements between Norfolk Southern Corporation and the Corporation’s Chairman, President and Chief Executive Officer, and each of the Corporation’s Executive Vice Presidents, to eliminate the excise tax gross-up provision in the Agreements, is incorporated herein by reference to Exhibit 10.1 to Norfolk Southern Corporation’s Form 8-K filed on January 23, 2013. |
| |
12** | Statement re: Computation of Ratio of Earnings to Fixed Charges. |
| |
21** | Subsidiaries of the Registrant. |
| |
23** | Consent of Independent Registered Public Accounting Firm. |
| |
31-A** | Rule 13a-14(a)/15d-014(a) CEO Certifications. |
| |
31-B** | Rule 13a-14(a)/15d-014(a) CFO Certifications. |
| |
32** | Section 1350 Certifications. |
| |
99** | Annual CEO Certification pursuant to NYSE Rule 303A.12(a). |
| |
101** | The following financial information from Norfolk Southern Corporation’s Annual Report on Form 10-K for the year ended December 31, 2011,2012, formatted in Extensible Business Reporting Language (XBRL) includes: (i) the Consolidated Statements of Income of each of the years ended December 31, 2012, 2011, 2010, and 2009;2010; (ii) the Consolidated Statements of Comprehensive Income for each of the years ended December 31, 2012, 2011, and 2010; (iii) the Consolidated Balance Sheets as ofat December 31, 20112012 and 2010; (iii)2011; (iv) the Consolidated Statements of Cash Flows for the years ended December 31, 2012, 2011, 2010, and 2009;2010; (v) the Consolidated Statements of Changes in Stockholders’ Equity for each of the three years ended December 31, 2012, 2011, and (iv)2010; and (vi) the Notes to Consolidated Financial Statements. |
| |
(B) | Exhibits.* Management contract or compensatory arrangement. |
| | ** Filed herewith. |
| |
(B) | Exhibits. |
| | |
| | The Exhibits required by Item 601 of Regulation S-K as listed in Item 15(A)3 are filed herewith or incorporated herein by reference. |
| |
(C) | Financial Statement Schedules. |
| |
| Financial statement schedules and separate financial statements specified by this Item are included in Item 15(A)2 or are otherwise not required or are not applicable. |
| |
| Exhibits 23, 31, 32, and 99 are included in copies assembled for public dissemination. All exhibits are included in the 20112012 Form 10-K posted on our website at www.nscorp.com under “Investors” and “SEC Filings” or you may request copies by writing to: |
| |
| Office of Corporate Secretary
Norfolk Southern Corporation
Three Commercial Place
Norfolk, Virginia 23510-9219 |
POWER OF ATTORNEY
Each person whose signature appears on the next page under SIGNATURES hereby authorizes James A. Hixon and James A. SquiresJohn P. Rathbone or one of them, to execute in the name of each such person, and to file, any amendments to this report and hereby appoints James A. Hixon and James A. SquiresJohn P. Rathbone or any one of them, as attorneys-in-fact to sign on his or her behalf, individually and in each capacity stated below, and to file, any and all amendments to this report.
SIGNATURES
SIGNATURES
Pursuant to the requirements of Section 13 or 15(d) of the Securities Exchange Act of 1934, Norfolk Southern Corporation has duly caused this report to be signed on its behalf by the undersigned, thereunto duly authorized, on this 15th day of February, 2012.2013.
/s/Charles W. Moorman
By: Charles W. Moorman
(Chairman, President and Chief Executive Officer)
K95
Pursuant to the requirements of the Securities Exchange Act of 1934, this report has been signed below on this 15th day of February, 2012,2013, by the following persons on behalf of Norfolk Southern Corporation and in the capacities indicated.
Signature | Title |
| |
/s/Charles W. Moorman
(Charles W. Moorman) | Chairman, President and Chief Executive Officer and Director
(Principal Executive Officer) |
| |
/s/James A. SquiresJohn P. Rathbone
(James A. Squires)John P. Rathbone) | Executive Vice President Finance and Chief Financial Officer
(Principal Financial Officer) |
| |
/s/Clyde H. Allison, Jr.
(Clyde H. Allison, Jr.) | Vice President and Controller
(Principal Accounting Officer) |
| |
/s/Gerald L. Baliles
(Gerald L. Baliles) | Director |
| |
/s/Thomas D. Bell, Jr.
(Thomas D. Bell, Jr.) | Director |
| |
/s/Erskine B. Bowles
(Erskine B. Bowles) | Director |
| |
/s/Robert A. Bradway
(Robert A. Bradway) | Director |
| |
/s/Wesley G. Bush
(Wesley G. Bush) | Director |
| |
/s/Daniel A. Carp
(Daniel A. Carp) | Director |
| |
/s/Alston D. Correll
(Alston D. Correll) | Director |
| |
/s/Karen N. Horn
(Karen N. Horn) | Director |
| |
/s/Burton M. Joyce
(Burton M. Joyce) | Director |
| |
/s/Steven F. Leer
(Steven F. Leer) | Director |
| |
/s/Michael D. Lockhart
(Michael D. Lockhart) | Director |
| |
/s/J. Paul Reason
(J. Paul Reason) | Director |
K96
Schedule II
Norfolk Southern Corporation and Subsidiaries
Valuation and Qualifying Accounts
Years Endedended December 31, 2009, 2010, 2011, and 2011
2012
($ in millions)
| | Additions charged to: |
| | | | | | | | | | | | | | | |
| | | Beginning
Balance | | | Expenses | | | Other
Accounts | | Deductions | | Ending
Balance |
| | | | | | | | | | | | | | | |
Year ended December 31, 2009
Valuation allowance (included net in
deferred tax liability) for deferred
tax assets | $ | 11 | | $ | 3 | | $ | -- | | $ | -- | | $ | 14 |
Casualty and other claims
included in other liabilities | | 320 | | | 58 | | | 42,3 | | | 1172 | | | 265 |
Current portion of casualty and
other claims included in
accounts payable | | 248 | | | 3 | | | 1151 | | | 1333 | | | 233 |
| | | | | | | | | | | | | | | |
Year ended December 31, 2010
Valuation allowance (included net in
deferred tax liability) for deferred
tax assets | $ | 14 | | $ | 7 | | $ | -- | | $ | -- | | $ | 21 |
Casualty and other claims
included in other liabilities | | 265 | | | 87 | | | -- | | | 912 | | | 261 |
Current portion of casualty and
other claims included in
accounts payable | | 233 | | | 13 | | | 1501 | | | 1423 | | | 254 |
| | | | | | | | | | | | | | | |
Year ended December 31, 2011
Valuation allowance (included net in
deferred tax liability) for deferred
tax assets | $ | 21 | | $ | -- | | $ | -- | | $ | 2 | | $ | 19 |
Casualty and other claims
included in other liabilities | | 261 | | | 102 | | | 1 | | | 892 | | | 275 |
Current portion of casualty and
other claims included in
accounts payable | | 254 | | | 16 | | | 1331 | | | 2023 | | | 201 |
¹
| Includes revenue refunds and overcharges provided through deductions from operating revenues and transfers from other accounts. | | Additions charged to: | | | | |
| |
| | |
| | |
| | |
| | |
|
² | Payments and reclassifications to/from accounts payable.Beginning | | | | Other | | | | Ending |
| Balance | | Expenses | | Accounts | | Deductions | | Balance |
³ | Payments |
| | |
| | |
| | |
| | |
|
Year ended December 31, 2010 | |
| | |
| | |
| | |
| | |
|
Valuation allowance (included net in | |
| | |
| | |
| | |
| | |
|
deferred tax liability) for deferred | |
| | |
| | |
| | |
| | |
|
tax assets | $ | 14 | | $ | 7 | | $ | - | | $ | - | | $ | 21 |
Casualty and reclassifications to/from other liabilities.claims | |
| | |
| | |
| | |
| | |
|
included in other liabilities | | 265 | | | 87 | (1) | | - | | | 91 | (3) | | 261 |
Current portion of casualty and | |
| | |
| | |
| | |
| | |
|
other claims included in | |
| | |
| | |
| | |
| | |
|
accounts payable | | 233 | | | 13 | | | 150 | (2) | | 142 | (4) | | 254 |
| |
| | |
| | |
| | |
| | |
|
Year ended December 31, 2011 | |
| | |
| | |
| | |
| | |
|
Valuation allowance (included net in | |
| | |
| | |
| | |
| | |
|
deferred tax liability) for deferred | |
| | |
| | |
| | |
| | |
|
tax assets | $ | 21 | | $ | - | | $ | - | | $ | 2 | | $ | 19 |
Casualty and other claims | |
| | |
| | |
| | |
| | |
|
included in other liabilities | | 261 | | | 102 | (1) | | 1 | | | 89 | (3) | | 275 |
Current portion of casualty and | |
| | |
| | |
| | |
| | |
|
other claims included in | |
| | |
| | |
| | |
| | |
|
accounts payable | | 254 | | | 16 | | | 133 | (2) | | 202 | (4) | | 201 |
| |
| | |
| | |
| | |
| | |
|
Year ended December 31, 2012 | |
| | |
| | |
| | |
| | |
|
Valuation allowance (included net in | |
| | |
| | |
| | |
| | |
|
deferred tax liability) for deferred | |
| | |
| | |
| | |
| | |
|
tax assets | $ | 19 | | $ | - | | $ | - | | $ | - | | $ | 19 |
Casualty and other claims | |
| | |
| | |
| | |
| | |
|
included in other liabilities | | 275 | | | 76 | (1) | | - | | | 93 | (3) | | 258 |
Current portion of casualty and | |
| | |
| | |
| | |
| | |
|
other claims included in | |
| | |
| | |
| | |
| | |
|
accounts payable | | 201 | | | 18 | | | 157 | (2) | | 193 | (4) | | 183 |
K97
(1)Includes adjustments for changes in estimates for prior years’ claims.
(2)Includes revenue refunds and overcharges provided through deductions from operating revenues and transfers
from other accounts.
(3)Payments and reclassifications to/from accounts payable.
(4)Payments and reclassifications to/from other liabilities.