UNITED STATES
SECURITIES AND EXCHANGE COMMISSION
WASHINGTON, DC 20549
FORM 10-K
(Mark One)
☒ ANNUAL REPORT PURSUANT TO SECTION 13 OR 15(d) OF THE SECURITIES EXCHANGE ACT OF 1934
For the fiscal year ended December 31, 20212023
or
☐ TRANSITION REPORT PURSUANT TO SECTION 13 OR 15(d) OF THE SECURITIES EXCHANGE ACT OF 1934
For the transition period from to
Commission file number: 001-35947
Star Equity Holdings, Inc.
(Exact name of registrant as specified in its charter)
| | | | | | | | | | | | | | | | | |
| Delaware | | 33-0145723 |
| (State or Other Jurisdiction of Incorporation or Organization) | | (I.R.S. Employer Identification No.) |
| | | | |
| 53 Forest Ave. Suite 101, | Old Greenwich | CT | | 06870 |
| (Address of Principal Executive Offices) | | (Zip Code) |
(203) 489-9500
(Registrant’s Telephone Number, Including Area Code)
Securities registered pursuant to Section 12(b) of the Act:
| | | | | | | | |
| Title of each class | Trading Symbol(s) | Name of each exchange on which registered |
| Common Stock, par value $0.0001 per share | STRR | NASDAQ Global Market |
| Series A Cumulative Perpetual Preferred Stock, par value $0.0001 per share | STRRP | NASDAQ Global Market |
| Series C Participating Preferred Stock, par value $0.0001 per share Purchase Rights | | |
Securities registered pursuant to Section 12(g) of the Act: None
Indicate by check mark if the registrant is a well-known seasoned issuer, as defined in Rule 405 of the Securities Act. Yes ¨ No ý
Indicate by check mark if the registrant is not required to file reports pursuant to Section 13 or Section 15(d) of the Act. Yes ¨ No ý
Indicate by check mark whether the registrant: (1) has filed all reports required to be filed by Section 13 or 15(d) of the Securities Exchange Act of 1934 during the preceding 12 months (or for such shorter period that the registrant was required to file such reports), and (2) has been subject to such filing requirements for the past 90 days. Yes ý No ¨
Indicate by check mark whether the registrant has submitted electronically every Interactive Data File required to be submitted pursuant to Rule 405 of Regulation S-T (§232.405 of this chapter) during the preceding 12 months (or for such shorter period that the registrant was required to submit such files). Yes ý No ¨
Indicate by check mark whether the registrant is a large accelerated filer, an accelerated filer, a non-accelerated filer, a smaller reporting company, or an emerging growth company. See the definitions of “large accelerated filer,” “accelerated filer,” “smaller reporting company,” and “emerging growth company” in Rule 12b-2 of the Exchange Act.
| | | | | | | | | | | |
| Large accelerated filer | o | Accelerated filer | o |
| | | |
| Non-accelerated filer | x | Smaller reporting company | ☒x |
| | | |
| | Emerging growth company | ☐ |
If an emerging growth company, indicate by check mark if the registrant has elected not to use the extended transition period for complying with any new or revised financial accounting standards provided pursuant to Section 13(a) of the Exchange Act. ☐
Indicate by check mark whether the registrant has filed a report on and attestation to its management’s assessment of the effectiveness of its internal control over financial reporting under Section 404(b) of the Sarbanes-Oxley Act (15 U.S.C. 7262(b)) by the registered public accounting firm that prepared or issued its audit report. ☐
If securities are registered pursuant to Section 12(b) of the Act, indicate by check mark whether the financial statements of the registrant included in the filing reflect the correction of an error to previously issued financial statements. ☐
Indicate by check mark whether any of those error corrections are restatements that required a recovery analysis of incentive-based compensation received by any of the registrant’s executive officers during the relevant recovery period pursuant to §240.10D-1(b). ☐
Indicate by check mark whether the registrant is a shell company (as defined in Rule 12b-2 of the Exchange Act). Yes ☐ No ý
The aggregate market value of the voting common stock held by non-affiliates based on the closing stock price on June 30, 2021,2023, was $17.1$10.4 million. For purposes of this computation only, all executive officers and directors have been deemed affiliates.
The number of outstanding shares of the registrant’s common stock, par value $0.0001 per share, as of March 28, 20227, 2024 was 14,982,507.15,848,202.
DOCUMENTS INCORPORATED BY REFERENCE
Portions of the Registrant’s definitive proxy statement relating to its 2022 annual meeting of shareholders (the “2022 Proxy Statement”) are incorporated by reference into Part III of this Annual Report on Form 10-K where indicated. The 2022 Proxy Statement will be filed with the U.S. Securities and Exchange Commission within 120 days after the end of the fiscal year to which this report relates.
STAR EQUITY HOLDINGS, INC.
FORM 10-K—ANNUAL REPORT
For the Fiscal Year Ended December 31, 20212023
Table of Contents
| | | | | | | | |
| | |
| | Page |
| |
| Item 1 | | |
| Item 1A | | |
| Item 1B | | |
| Item 1C | | |
| Item 2 | | |
| Item 3 | | |
| Item 4 | | |
| |
| |
| Item 5 | | |
| Item 6 | | |
| Item 7 | | |
| Item 7A | | |
| Item 8 | | |
| Item 9 | | |
| Item 9A | | |
| Item 9B | | |
| Item 9C | | |
| |
| |
| Item 10 | | |
| Item 11 | | |
| Item 12 | | |
| Item 13 | | |
| Item 14 | | |
| |
| |
| Item 15 | | |
| Item 16 | | |
| |
| |
PART I
Cautionary Statement Regarding Forward-Looking Statements
Portions of this Annual Report on Form 10-K (including information incorporated by reference) include “forward-looking statements” based on our current beliefs, expectations, and projections regarding our business strategies, market potential, future financial performance, industry, and other matters. This includes, in particular, “Item 7 — Management’s Discussion and Analysis of Financial Condition and Results of Operations” of this Annual Report on Form 10-K, as well as other portions of this Annual Report on Form 10-K. The words “believe,” “expect,” “anticipate,” “project,” “could,” “would,” and similar expressions, among others, generally identify “forward-looking statements,” which speak only as of the date the statements were made. The matters discussed in these forward-looking statements are subject to risks, uncertainties, and other factors that could cause our actual results to differ materially from those projected, anticipated, or implied in the forward-looking statements. The most significant of these risks, uncertainties, and other factors are described in “Item 1A — Risk Factors” of this Annual Report on Form 10-K. Except to the limited extent required by applicable law, we undertake no obligation to update or revise any forward-looking statements, whether as a result of new information, future events, or otherwise.
Corporate Information
Star Equity Holdings, Inc. (“Star Equity” or the “Company”) is a diversified holding company with threetwo divisions: Healthcare, Construction and Investments. Star Equity, which was incorporated in Delaware in 1997, was formerly known as Digirad Corporation until it changed its name to Star Equity Holdings, Inc. effective January 1, 2021. For additional details related to the Company’s reportable segments, see Item 1. Business – Business Segments and Note 15. Segments within the notes to our accompanying consolidated financial statements. Unless the context requires otherwise, in this report the terms “we,” “us,” and, “our” refer to Star Equity and our wholly owned subsidiaries.
ITEM 1. BUSINESS
Overview
Star Equity has operated as a multi-industry holding company since the acquisition of ATRM Holdings, Inc. (“ATRM”) in September 2019. With that merger, we added two construction businesses and one investment business to what historically had been a pure-play healthcare company. Today, Star EquityEquity”, the “Company”, “we”, “our”) is a multi-industry diversified holding company withincorporated as a Delaware corporation in 1997. Currently, we have two divisions which include the operating businesses in two key industry sectors of the economy, Healthcareour Construction division and Construction.
Ouran Investments division. We previously had a Healthcare division which operateswe sold on May 4, 2023, as Digirad Health, Inc., (“Digirad Health”) provides products and servicesfurther described in the area of nuclear medical imaging with a focus on cardiac health. Digirad Health operates across the United States. The Healthcare business comprises two businesses, Diagnostic Services, which offers imaging services to healthcare providers using a fleet of our proprietary solid-state gamma cameras and Diagnostic Imaging, which manufactures, distributes, and maintains our proprietary solid-state gamma cameras.Note 3. Discontinued Operations.
Our Construction division is currently made up of three operating businesses,businesses: KBS Builders, Inc. (“KBS”), EdgeBuilder, Inc. (“EdgeBuilder”), and Glenbrook Building Supply, Inc—Inc. (“Glenbrook”), with the latter two managed together and referred to jointly as “EBGL”. KBS is based in Maine and manufactures modular buildings, for installationtypically in the single and multi-family residential segments, principally inservicing the New England market. EBGL is based in the Minneapolis-Saint Paul area and principally serves the Upper Midwest.Midwest region. Together, the EBGL businesses manufacture and deliver structural wall panels and other engineered wood-based products as well asfor commercial and residential customers. We distribute building materials from two lumberyard locations primarily tofocused on professional builder customers. EBGL expanded its market share of the Greater Minneapolis area through the acquisition of all of the assets of Big Lake Lumber Inc. (“BLL”) in October 2023. See Note 16. Mergers and Acquisitions for further information.
Currently, ourOur Investments division is an internally focused unit directly supervised by Star Equity management. This entity currently holds and manages our corporate-owned real estate, which currently includes our threeincluding two manufacturing facilities in Maine that are leased to KBS as well as anyand one manufacturing facility in Minnesota that is leased to Glenbrook. The Investments division also manages internally-funded, concentrated minority investments we make in a number of public companies, cost method investments in private companies, and private companies.notes receivable.
Strategy
Star Equity
We believe our multi-industry diversified multi-industry holding company structure will allowallows Star Equity management to focus on capital allocation, strategic leadership, mergers and acquisitions, capital markets transactions, and investor relations, andas well as direct management of our Investments division. Our structure frees up our operating company management teams to focus on their respective businesses, look for organic and bolt-on growth opportunities, and improve operations with less distraction and administrative burden associated with running a public company.
We continue to explore strategic alternatives to improve our market position and the profitability of our product offerings, generate additional liquidity, and enhance our valuation. We may pursue our goals through organic growth and through strategic alternatives. Some of these alternatives have included, and could continue to include, selective acquisitions of businesses, divestitures of assets or businesses, equity offerings, debt financings, or a restructuring of our Company.corporate restructuring.
Operating Businesses
We believe that both of our primary divisions, Healthcare and Construction division companies are well positioned for growth in large addressable markets. The key elements of our growth strategy include the following:
•Organic growth from our core businesses. We believe that we operate in markets and geographies that will allow us to continue to grow our core businesses, allowing us to benefit from our scale and strengths. We plan toOur primary focus our effortswill be on markets in which we already have a presence in order to take advantage ofleverage the personnel, infrastructure, and brand recognition we have in these areas.
•Introduction of new services. In the HealthcareWithin our Construction division we plan to continue to focus on healthcare solutions-related businesses that deliver necessary assets, services, and logistics directly to the customer site. We believe that over time we can either purchase or develop new and complementary businesses, and take advantage of our customer loyalty and distribution channels. Additionally, we are exploring new imaging technologies through the recent establishment of a joint venture that is presently conducting research and development in the area of heart imaging. In the Construction division,companies, we will consider opportunities to augment our service offering to better serve our customer base. We have done this in the New England market with our entry into the commercial multi-family segment. Other areas might include logistics, installation on site installation, and manufacturing of sub-components.
•Acquisition of complementary businesses. We plan to continue to look at complementary businesses that meet our internally developed financially disciplined approachfinancial criteria for acquisitions to grow our Company. We believe there are many potential small public and private targets that can be acquired over time and integrated into our platform. We will also look at larger, more transformational mergers and acquisitions if we believe the appropriate mix of value, risk, and return is present for our stockholders. The timing of these potential transactions will always depend on market conditions, available capital, and valuation. In general, we want to be “value” buyers, and will not pursue any transaction unless we believe the post-transaction potential value is high for stockholders.
Business Segments
As of December 31, 2021, our three divisions are organized into the following fourOur reportable segments are based upon our internal organizational structure, the manner in which our operations are managed, the criteria used by our Chief Executive Officer (Chief Operating Decision Maker or "CODM") to evaluate segment performance, the availability of separate financial information, and overall materiality considerations. Prior to May 2023, we had three reportable segments: Healthcare, Construction, and Investments. Effective as it relates to continuing operations,of May 2023 with Diagnostic Servicesthe sale of our Digirad Health business, we have two reportable segments: Construction and Diagnostic Imaging comprisingInvestments. Our corporate structure reflects the manner in which our Healthcare business:
•Diagnostic Services
•Diagnostic Imaging
•Construction
•InvestmentsCODM assesses performance and allocates resources.
See Note 15. Segments, within the notes to our accompanying consolidated financial statements for financial data relating to our segments.statements.
For discussion purposes, we categorized our Diagnostic Imaging and Diagnostic Services reportable segments as “Healthcare.” During the last two fiscal years, Healthcare had the following relative contribution to consolidated revenues:
| | | | | | | | | | | | | | |
| | Year ended December 31, |
| | 2021 | | 2020 |
| Healthcare Revenue: | | | | |
| Diagnostic Services | | 41.1 | % | | 50.3 | % |
| Diagnostic Imaging | | 13.9 | % | | 12.7 | % |
| Total Healthcare Revenue | | 55.0 | % | | 63.0 | % |
Construction revenue is summarized as follows:
| | | | | | | | | | | | | | |
| | Year ended December 31, |
| | 2021 | | 2020 |
| Construction | | 45.0 | % | | 36.9 | % |
| Construction Revenue | | 45.0 | % | | 36.9 | % |
Investments revenue is summarized as follows:
| | | | | | | | | | | | | | | |
| | Year ended December 31, | |
| | 2021 | | 2020 | |
| Investments | | — | % | | 0.1 | % | |
| Investments Revenue | | — | % | | 0.1 | % | |
Detailed Description of Our Operating Segments
Diagnostic Services
Through this segment, we offer a convenient and economically compelling imaging services program as an alternative to purchasing equipment or outsourcing the procedures to another physician or imaging center. For physicians who wish to perform nuclear imaging, echocardiography, vascular, or general ultrasound tests, we provide imaging systems, qualified personnel, radiopharmaceuticals, licensing services, and the logistics required to perform imaging in their own offices, and thereby the ability to bill Medicare, Medicaid, or one of the third-party healthcare insurers directly for those services, which are primarily cardiac in nature. We provide imaging services primarily to cardiologists, internal medicine physicians, and family practice doctors who typically enter into annual contracts for a set number of days ranging from once per month to five times per week.Construction
Our portable nuclear and ultrasound imaging operations utilize a “hub and spoke” model in which centrally located regional hubs anchor multiple van routes in the surrounding metropolitan areas. At these hubs, clinical personnel load the equipment, radiopharmaceuticals, and other supplies onto specially equipped vans for transport to customer locations, where they set up the equipment for the day. After quality assurance testing, a technologist under the physician’s supervision will gather patient information, inject the patient with a radiopharmaceutical, and then acquire images for interpretation by the physician. At the conclusion of the day of service, all equipment and supplies are removed from the customer location and transported back to the central hub location. Our model relies on density and customer concentration to allow for efficiencies and maximum profitability, and therefore we are only located in geographies where there is a high concentration of people, cardiac disease, and opportunity for additional customer locations.
For our nuclear imagingConstruction division services we have obtained Radsite Intersocietal Accreditation Commission (“IAC”) and Intersocietal Commission for Echocardiography Laboratories (“ICAEL”) accreditation for our services. Our licensing infrastructure provides radioactive materials licensing, radiation safety officer services, radiation safety training, monitoring and compliance policies and procedures, and quality assurance functions to ensure adherence to applicable state and federal nuclear regulations.
Diagnostic Imaging
Through this segment, we sell our internally developed solid-state gamma cameras, imaging systems, and camera maintenance contracts. Our imaging systems include nuclear cardiac imaging systems, as well as general purpose nuclear imaging systems. We sell our imaging systems to physician offices and hospitals primarily in the United States, although we have sold a small number of imaging systems internationally. Our imaging systems are sold in both portable and fixed configurations, provide enhanced operability and improved patient comfort, fit easily into floor spaces as small as seven feet by eight feet, and facilitate the delivery of nuclear medicine procedures in a physician’s office, an outpatient hospital setting, or within multiple departments of a hospital (e.g., emergency and operating rooms). Our Diagnostic Imaging segment revenues derive primarily from selling solid-state gamma cameras and post-warranty camera maintenance contracts.
The central component of a nuclear camera is the detector, which ultimately determines the overall clinical quality of images a camera produces. Our nuclear cameras feature detectors with advanced proprietary solid-state technology developed by us. Solid-state systems have a number of benefits over conventional photomultiplier tube-based camera designs typically offered by our competitors. Our solid-state technology systems are typically 2-to-5 times lighter and considerably more compact than most traditional nuclear systems, making them far easier and less costly to build, very reliable, and able to be utilized for mobile applications. We believe we are one of the market leaders in the mobile solid-state nuclear camera segment.
We believe our current imaging systems, with their state-of-the-art technology, will continue to be relevant for the foreseeable future. We will continue to enhance and adjust our existing systems for the changing nuclear imaging market, including software upgrades and smaller enhancements. However, to accomplish any significant changes and enhancements, we will utilize what we believe is a deep available pool of contract engineers on a flexible, as needed basis and do not maintain a fully staffed research and development department.
Construction
Through this segment, by way of our subsidiaries KBS and EBGL, we service residential and commercial construction projects by manufacturingvia our KBS, EdgeBuilder, and Glenbrook brands, through which we manufacture modular housing units, structural wall panels, permanent wood foundation systems, and other engineered wood products, and by supplyingalso supply general contractors and retail customers with building materials.
KBS is a Maine-based modular home manufacturerbuilder that has beenstarted operations in business since 2001. Today, KBS manufactures fully custom modular homes. KBS offers products for both multi-family and single-family residential buildings with a focus on customization to suit specific project requirements and providingleveraging an in-house engineering team and design expertise. Glenbrook isKBS markets its modular homes through a supplierdirect sales organization, which consists of lumber, windows, doors, cabinets, drywall, roofing, deckinginside sales and other building materials to professionaloutside sales teams who work with a network of independent dealers, builders, and is basedcontractors, primarily in the Minneapolis-Saint Paul areaNew England states (Connecticut, Maine, Massachusetts, New Hampshire, Rhode Island, and Vermont). KBS’s outside sales organization focuses on commercial building projects, and works with developers, architects, owners, and general contractors to establish the Hudson, Wisconsin area. scope of work, terms of payment, and general requirements for each project. KBS’s inside sales people focus on a network of independent dealers, builders, and contractors to accurately configure and place orders for mainly single-family residential homes. KBS’s network of independent dealers and contractors do not work with KBS exclusively, although some have KBS model homes on display at their retail centers. KBS’s backlog and pipeline, along with its market initiatives to build more student, workforce, and affordable housing, are expected to position KBS for continued growth, particularly in the multi-family segment.
EdgeBuilder is a manufacturer of structural wall panels, permanent wood foundation systems, and other engineered wood products and conducts its operations out of a factory in Prescott, Wisconsin. EdgeBuilder markets its engineered structural wall panels and permanent wood foundation systems through direct sales people and a network of builders, contractors, and developers in and around the Minneapolis-Saint Paul region. EdgeBuilder’s direct sales organization is responsible for both residential and commercial projects and works with general contractors, developers, and builders to provide bids and quotes for specific projects. Our marketing efforts include participation in industry trade shows, production of product literature, and sales support tools. These efforts are designed to generate sales leads for our independent builders and dealers, and direct salespeople.
Glenbrook (inclusive of BLL acquired in 2023) is a supplier of lumber, windows, doors, cabinets, drywall, roofing, decking, and other building materials to professional builders. Glenbrook conducts its operations in Oakdale, Minnesota and Big Lake, Minnesota with an operational facility in Hudson, Wisconsin. EdgeBuilder and Glenbrook operate as one business with a single management team and we refer to them together as EBGL.
Investments
Through this segment, we currentlyWe hold three real estate assets thatin our portfolio, two of which we lease to our construction subsidiary, KBS, and the third we lease to our construction subsidiary, Glenbrook. These include their principal production facilities in South Paris, Maine and Big Lake, Minnesota, respectively. Also, we continue to expand our investment activities and have acquired, as well some sharesestablished minority positions in the equity securities of a small number of publicpublicly traded companies, cost method investments in private companies, and will potentially manage other investments of Star Equity in the future. In April 2019, the Company funded the initial purchase of three manufacturing facilities in Maine that manufacture modular buildings and leased those three properties back to KBS. The initial funding of the assets acquisition was primarily through the revolver loan under our Sterling National Bank (“Sterling” or “SNB”) Credit Facility. Since that time, we have secured a new facility from Gerber Finance Inc. (“Gerber”) to finance these properties. We also hold minority investments in other companies and may expand this segment over time.notes receivables.
Our Competitive Strengths
Healthcare Services and Products
Our Healthcare division delivers convenient, effective and efficient healthcare solutions on an as needed, when needed, and where needed basis through our mobile products and services. Our Healthcare division’s diverse portfolio of mobile healthcare solutions and diagnostic imaging equipment and services provides hospitals, physician practices, and imaging centers throughout the United States access to technology and services necessary to provide patient care in the rapidly changing healthcare environment.
We believe that our competitive strengths are centered around our streamlined and cost-efficient approach to providing healthcare solutions to our customers at the point of need, while providing an array of industry-leading, technologically enabled healthcare imaging services, as described below:
•Broad Portfolio of Imaging Services. Approximately 41.1% of our consolidated revenues for the twelve months ended December 31, 2021 were derived from our diagnostic services business. We have developed and continue to refine an
industry-leading, customer service-focused approach to our customers. We have found our focus in this area is a key factor in acquiring and retaining our service-based customers. We also recruit and maintain highly trained staff for our clinical and repair services, which allows us to provide superior and more efficient services.
•Unique Dual Sales and Service Offering. For the majority of our business, we offer a service-based model to our customers, allowing them to avoid making costly capital and logistical investments required to offer these services internally. Further, for a smaller portion of our business, we have the ability to sell the underlying capital equipment directly to our customers should their needs change and they desire to provide services on their own with the required capital equipment. This ability to serve our customers in a variety of capacities from selling equipment directly, or providing more flexibility through a service-based model, allows us to serve our customers according to their exact needs as well as the ability to capture both ends of the revenue spectrum.
•Leading Solid-State Technology. Our solid-state gamma cameras utilize proprietary photo detector modules that enable us to build smaller and lighter cameras that are portable with a degree of ruggedness that can withstand the vibration associated with transportation. Our dedicated cardiac imagers require a floor space as little as seven feet by eight feet, can generally be installed without facility renovations, and use standard power. Our portable cameras are ideal for mobile operators or practices desiring to service multiple office locations or imaging facilities.
•Addressable Markets and Revenue Opportunities. Bolstered by advances in medical imaging technology, large and growing global healthcare expenditures, an increasing demand for early disease detection and diagnosis, an aging population, and the anticipated end of the COVID-19 pandemic, we believe the vast size of the addressable market and the multitude of imaging procedures and applications in the diagnostic imaging market position us to grow revenue and market share in the coming years.
Construction Services and Products
Our competitive strengths at KBS include our strategic location withinnear the Greater Boston region and broaderour ability to serve all of New England market.England. We also have the largest manufacturing capacity in the New England region with the ability to provide high quality wood-based volumetric modules for both single and commercial scale multi-family residential buildings. We also provide significant value through our longstanding engineering and design expertise, with a focus on customization to suit specific project requirements. We continue to develop our expertise and specialized knowledge in highly energy-efficient passive homes, which included the delivery of our first zero-energy modular homes for the affordable housing segment during 2020. Additionally, we believe there is a large opportunity in the commercial-scale multi-family modular segment and we have continued to pursue more of these projects since 2020.projects.
At EdgeBuilder, we offer a superior product for commercial scalecommercial-scale multi-family projects, focusing on structural wall panels. Our engineering and design capabilities allow us to create a product that is unique to the specific project’s requirements. We also provide value with our vertically integrated in-house delivery capability, which helps us to be cost-competitive. Our production strategy is to utilize automation and the most efficient manufacturing methods of manufacturing and high-quality materials in all EdgeBuilder projects. Through our building products distribution business, we operate a professional lumber yard and showroom and deliver highly personalized service, knowledgeable salespeople, and attention to detail that the larger, big-box chain home stores do not provide.
We expect the modular and offsite construction industry to achieve revenue growth over the next several years due to thedriven largely by rising housing demand forwhich can be met via modular engineering in several sectors, such as healthcare, education, and multi-family housing, given the comparatively low cost and availability of fully equipped manufactured housing versus site-built construction housing.construction. We believe our Construction division is well positioned to capitalize on the growing popularity of offsite housing construction—both modular and panelized—throughout the United States, including in our two current target markets.
Sales
Healthcare
We maintain separate sales organizations that are aligned with each of our business units, which operate independently but in cooperation with each other. Diagnostic Services concentrates its efforts on twelve regional areas where the majority of its business is concentrated based on concentrations of peoplemarkets and cardiac disease. Diagnostic Imaging sales efforts are conducted throughout the United States and certain foreign countries, and are not concentrated to any particular region or area within the United States as the customer profile for this business can be at any hospital or physician practice. Diagnostic Services and Diagnostic Imaging, though separate sales teams, work collaboratively to help fulfill customer needs through either small practice mobile nuclear cardiac imaging services, or to provide capital equipment sales should the customer decide to own the equipment in house.a whole.
Sales
Construction
KBS markets its modular homes products through both outside and inside salespeople. Our inside sales team works primarily with our network of independent dealers who source end customers for single family homes, largely in northern New England. Our outside sales team prospects for single-family residential andfocuses on commercial scale multi-unit projects through new and established relationships with architects, designers, developers, owners builders, general contractors, consultants, and construction managers throughout New England. Their work involves developing and negotiating the full scope of work for KBS, terms of payment, and general requirements for each project.
EBGL markets its engineered structural wall panels and permanent wood foundation systems through direct sales people to a network of builders, contractors, and developers in the Minneapolis-Saint Paul area and the Upper Midwest states. EBGL’s direct sales organization is responsible for both residential and commercial projects. Our marketing efforts include participation in industry trade shows, production of product literature, and the use of sales support tools. Our showroom and lumber yard processes orders over the phone and services walk-in traffic, mainly focusing on serving professional builders with our highly experienced in-house sales clerks.team.
Competition
Healthcare
The market for diagnostic products and services is highly competitive. Our business, which is focused primarily on the private practice and hospital sectors, continues to face challenges of demand for diagnostic services and imaging equipment, which we believe is due in part to the impact of the Deficit Reduction Act on the reimbursement environment and the 2010 Healthcare Reform laws, as well as general uncertainty in overall healthcare and legislative changes in healthcare, such as the Affordable Care Act. These challenges have impacted, and will likely continue to impact, our operations. We believe that the principal competitive factors in our market include acceptance by hospitals and physicians, relationships that we develop with our customers, budget availability for our capital equipment, and requirements for reimbursement, pricing, ease-of-use, reliability, and mobility.
Diagnostic Services. In providing diagnostic imaging services, we compete against many smaller local and regional nuclear and ultrasound providers that may have lower operating costs. The fixed-installation operators often utilize older, used equipment, and the mobile operators may use older Digirad single-head cameras or newer dual-head cameras. We are the only mobile provider with our own exclusive source of triple-head mobile systems. Some competing operators place new or used cameras into physician offices and then provide the staffing, supplies, and other support as an alternative to a Diagnostic Services service contract. In addition, we compete against imaging centers that install fixed nuclear gamma cameras and make them available to referring physicians in their geographic vicinity. In these cases, the physician sends their patients to the imaging center.
Diagnostic Imaging. In selling our imaging systems, we compete against several large medical device manufacturers who offer a full line of imaging cameras for each diagnostic imaging technology, including x-ray, MRI, CT, ultrasound, nuclear medicine, as well as SPECT/CT and PET/CT hybrid imagers. The existing nuclear imaging systems sold by these competitors have been in use for a longer period of time than our internally developed nuclear gamma cameras, and are more widely recognized and used by physicians and hospitals; however, they are generally not solid-state, light-weight, as flexible, or portable. Additionally, certain medical device companies have developed a version of solid-state gamma cameras that may directly compete with our product offerings. Many of the larger multi-modality competitors enjoy significant competitive advantages over us, including greater brand recognition, greater financial and technical resources, established relationships with healthcare professionals, broader distribution networks, more resources for product development, marketing, and sales, and the ability to bundle products to offer discounts.
Construction
The market for construction, including through offsite manufacturing, is highly competitive.
KBS. KBS is a regional manufacturer of modular housing units with itsa primary target market beingin the New England states. Several modular manufacturing competitors are located in these New England states and in nearby Pennsylvania. Some competitors have manufacturing locations in Canada and ship their products to the United States.
EBGL. EBGL is a regional manufacturer of engineered structural wall panels and permanent wood foundation systems and also has a local professional-builder-focused retail distribution business. EBGL’s market is primarily the Upper Midwest states (Iowa, Minnesota, Missouri, North Dakota, South Dakota, and Wisconsin), though largely concentrated within Minnesota and Wisconsin. Glenbrook Building Supply’sGlenbrook’s professional building material distribution business competesbusinesses (including the newly acquired BLL, as discussed in Note 16. Mergers and Acquisitions) compete on a local level against both small, local lumber yards, regional building supply companies, and to a certain degree, the “big box” stores such as Home Depot, Lowe’s, and Menard’s.
Intellectual Property
We rely on a combination of patent, trademark, copyright, trade secret, and other intellectual property laws, nondisclosure agreements, and other measures to protect our intellectual property. We require our employees, consultants, and advisors to execute confidentiality agreements and to agree to disclose and assign to us all inventions conceived during the workday, using our property, or which relate to our business. Despite any measures taken to protect our intellectual property, unauthorized parties may attempt to copy aspects of our products or to obtain and use information that we regard as proprietary. As discussed herein, Healthcare division intellectualIntellectual property is currently subject tonot a security interest under the credit facility with SNB.
Oursignificant factor in our Construction division’s intellectual property is currently subject to a security interest under the credit facility with Gerber.business.
Patents
We have developed a patent portfolio that covers our products, components, and processes. We have 10 non-expired United States patents. The patents cover, among other things, aspects of solid-state radiation detectors that make it possible for the Company to provide mobile imaging services, and our scan technology that provides for lower patient doses and more specific cardiac images. Our patents expire between 2022 (U.S. Patent 6,734,416) and 2030 (U.S. Patent 8,362,438). While each of our patents applies to nuclear medicine, many also apply to the construction of area detectors for other types of medical and non-medical imagers and imaging methods.
We do not hold any patents within our Construction business.
Trademarks and Copyrights
Our registered trademark portfolio consists of registrations in the United States for Digirad® and CARDIUS®. The Company has produced proprietary software for Diagnostic Imaging systems including: nSPEED™ 3D-OSEM Reconstruction, SEEQUANTA™ acquisition, and STASYS™ motion correction software. We also license certain software products, and their related copyrights, on a nonexclusive basis from Cedars-Sinai Health System. The license includes updates to the software. The license may be terminated at any time by either party upon notice if the other party materially breaches the agreement. Non-payment to licensor is considered a material breach. The license may also be automatically terminated by licensor if (i) an “event of default” occurs under indebtedness for borrowed money of licensee; (ii) licensee ceases business operations; (iii) licensee dissolves; or (iv) licensee commences bankruptcy proceedings. On May 23, 2018, the parties entered into an amendment to the license agreement to, among other things, extend the term of license through July 1, 2023.
Raw Materials
Diagnostic Imaging. We and our contract manufacturers use a wide variety of materials, metals, and mechanical and electrical components for production of our nuclear imaging gamma cameras. These materials are primarily purchased from external suppliers, some of which are single-source suppliers. Materials are purchased from selected suppliers based on quality assurance, cost effectiveness, and constraints resulting from regulatory requirements. We work closely with our suppliers to assure continuity of supply while maintaining high quality and reliability. Inflation and global commodity supply and demand can ultimately affect pricing of certain of these raw materials. Though we believe we have adequate available sources of raw materials, there can be no guarantee that we will be able to access the quantity of raw material needed to sustain operations, as well as at a cost-effective price.
Diagnostic Services. Our Diagnostic Services operations utilize radiopharmaceuticals for our nuclear services. The underlying raw material for creation of the array of doses utilized in nuclear medicine is produced from a total of five main production facilities throughout the world, typically from highly enriched uranium resources. These resources have been and are expected to continue to produce enough raw materials to address the global market, although global conflict in some uranium-rich countries could reduce supply. There continues to be pressure to utilize low or non-enriched uranium resources to produce the underlying nuclear doses.
Construction. Both KBS and EBGL operate in the wood-based construction market. The primary raw materials used in their production processes include dimensional lumber, mainly spruce-pine-fir (SPF), and sheathing/sheet goods (OSB and plywood). The majority of underlying raw material for both KBS and EBGL are sourced by wholesalers and mills in the United States, and wethough from time to time sourceare also sourced from Canada. Both businesses depend on the reliability of the lumber supply chain and are sensitive to varying degrees to wood-based commodity price fluctuations.
Manufacturing
Diagnostic Imaging. We manufacture our nuclear imaging gamma cameras by employing a strategy that combines using internal manufacturing resources for devices requiring specific expertise due to our proprietary design coupled with qualified contract manufacturers. Mechanical and electronic components of our systems are produced by contract manufacturers, whereas the most complex components, final assembly, and final system performance tests are performed at our facility. All of our suppliers of critical materials, components, and subassemblies undergo supplier qualifications and ongoing quality audits in accordance with our supplier quality process.
We and our contract manufacturers are subject to U.S. Food and Drug Administration (“FDA”) Quality System Regulations, state regulations, and standards set by the International Organization for Standardization, or ISO. We are currently certified to the EN ISO 13485:2016 quality standard. We have received FDA 510(k) clearance for our complete nuclear imaging camera product line (Cardius® XPO, Cardius® X-ACT, and Ergo™ gamma cameras). In addition, the X-ACT camera utilizes an x-ray technology to provide attenuation correction information for the SPECT reconstruction. We also have received additional FDA clearance of our Ergo™ large-field-of-view General Purpose Imager for use in intraoperative and molecular breast imaging.
Construction. KBS began manufacturing single family homes in 2001 and commercial modular multi-family housing units in 2008. In subsequent years, KBS expanded its product offerings to include a variety of commercialcommercial-scale multi-family buildings including apartments, condominiums, townhouses, dormitories, hospitals, office buildings, and other structures.dormitories. The structures are built inside our climate-controlled factories and are then transported to the site where they are set, assembled, and secured on the foundation. Electrical, plumbing, and HVAC systems are inspected and tested in the factory, prior to transportation to the site, to ensure the modules meet all local building codes and quality requirements. Modular construction has gained increased acceptance and is a preferred method of building by many architects and general contractors. The advantages of modular construction include: modules are constructed in a climate-controlled environment; weather conditions usually do not interrupt or delay construction; the building is protected from weather, reducing the risk of mold or other materials damage due to materials absorbing moisture from rain or snow; reduced site work; improved safety and security; reduced vandalism and attrition (as the building is immediately secured);attrition; and a significant reduction in overall project time.
EBGL consists of two separate companies (EdgeBuilder and Glenbrook) operating in tandem with a common management team. EdgeBuilder manufactures wall panels and permanent wood foundations (PWF) in a climate-controlled factory, then transports the panels to the construction site via flat-bed trucks. The panels are typically unloaded by crane and erected, or assembled, on site by professional framing contractors. Panelized construction, especially in large-scale, multi-unit projects, is becoming increasingly popular due to the heightened demand for construction labor. Additionally, because the wall panels are constructed in a controlled indoor environment, waste, weather-related delays, and mistakes are minimized. This shaves weeks off large, multi-unit construction schedules, leaving room for more annual builds. Glenbrook, as a retailer of professional building products, is not directly involved in manufacturing but does often sell and ship product in tandem with EdgeBuilder wall panel deliveries. As International Building Code® continues to evolve, KBS and EBGL, along with our professional partners in the industry, meet code changes with innovative products and a dedicated staff for adherent builds.
Healthcare Reimbursement
All of Healthcare customers typically rely primarily on the Medicare and Medicaid programs and private payors for reimbursement. As a result, demand for our products and services are dependent in part on the coverage, reimbursement policies, and ability to pay of these payors. Third party coverage and reimbursement is subject to extensive federal, state, local, and foreign regulation, and private payor rules and policies. In many instances, the applicable regulations, policies, and rules have not been definitively interpreted by regulatory authorities or the courts, are open to a variety of interpretations, and are subject to change without notice.
The scope of coverage and payment policies vary among third-party private payors. For example, some payors will not reimburse a provider unless the provider has a contract with the payor, and in many instances such payors will not enter into such contracts without the approval of a third party “radiology benefit manager” that the payor compensates based on reducing the payor’s imaging expense. Other payors prohibit reimbursement unless physicians own or lease our cameras on a full-time basis, or meet certain accreditation or privileging standards. Such payor requirements and limitations can significantly restrict the types of business models we can successfully utilize.
Medicare reimbursement rules are subject to annual changes that may affect payment for services that our customers provide. In addition, Congress has passed healthcare reform proposals that are intended to expand the availability of healthcare coverage and reduce the growth in healthcare spending in the United States. Many of these laws affect the services that our customers provide, and could change further over time.
Medicare reimbursement rules impose many standards and policies on the payment of services that our customers provide. For instance, physicians billing for the technical component of nuclear imaging tests must be accredited by a government-approved independent accreditation body and many private payors are adopting similar requirements. We offer our customers a service to assist them in obtaining and maintaining the required accreditation. We believe we have structured our contracts in a manner that allows our customers to seek reimbursement from third-party payors in compliance with Medicare reimbursement rules. Our physician customers typically bill for both the technical and professional components of the tests. Assuming they meet certain requirements including, but not limited to, performing and documenting bona fide interpretations and providing the requisite supervision of the non-physician personnel performing the tests, they may bill and be paid by Medicare. If the failure to comply is deemed to be “knowing” or “willful,” the government could seek to impose fines or penalties, and we may be required to restructure our agreements and/or respond to any resultant claims by such customers or the government. Our hospital customers typically seek reimbursement by Medicare for outpatient services under the Medicare Hospital Outpatient Prospective Payment System.
Government Regulation
Healthcare
We and our medical professional customers must comply with an array of federal and state laws and regulations. Violations of such laws and regulations can be punishable by criminal, civil, and/or administrative sanctions, including, in some instances, exclusion from participation in healthcare programs such as Medicare and Medicaid. Accordingly, we maintain a vigorous compliance program and a hotline that permits our personnel to report violations anonymously if they wish.
The following is a summary of some of the laws and regulations applicable to our business:
•Anti-Kickback Laws. The Medicare/Medicaid Patient Protection Act of 1987, as amended, which is commonly referred to as the “Anti-Kickback Statute”, prohibits us from knowingly and willingly offering, paying, soliciting, or receiving any form of remuneration in return for the referral of items or services, or to purchase, lease, order, or arrange for or recommend purchasing, leasing, or ordering any good, facility, service, or item, for which payment may be made under a federal healthcare program. Violation of the federal Anti-Kickback Statute is a felony, punishable by criminal fines and imprisonment, or both, and can result in civil penalties and exclusion from participation in healthcare programs such as Medicare and Medicaid. Many states have adopted similar statutes prohibiting payments intended to induce referrals of products or services paid by Medicaid or other nongovernmental third-party payors.
•Physician Self-Referral Laws. Federal regulations commonly referred to as the “Stark Law” prohibit physician referrals of Medicare or Medicaid patients to an entity for certain designated health services if the physician or an immediate family member has an indirect or direct financial relationship with the entity, unless a statutory exception applies. We believe that referrals made by our physician customers are eligible to qualify for the “in-office ancillary services” exception to the Stark Law, provided that the services are provided or supervised by the physician or a member of his or her “Group Practice,” as that term is defined under the law, the services are performed in the same building in which the physician regularly practices medicine, and the services are billed by or for the supervising physician or Group Practice. Violations of the Stark Law may lead to the imposition of penalties and fines, the exclusion from participation in federal healthcare programs, and liability under the federal False Claims Act and its whistleblower provisions. Many states have adopted similar statutes prohibiting self-referral arrangements that cover all patients and not just Medicare and Medicaid patients.
•HIPAA. The Health Insurance Portability and Accountability Act of 1996, or HIPAA, prohibits schemes to defraud healthcare benefit programs and fraudulent conduct in connection with the delivery of, or payment for, healthcare benefits, items, or services. HIPAA also establishes standards governing electronic healthcare transactions and protecting the security and privacy of individually identifiable health information. Some states have also enacted privacy and security statutes or regulations that, in some cases, are more stringent than those issued under HIPAA.
The American Recovery and Reinvestment Act of 2009, enacted February 17, 2009, made significant changes to HIPAA privacy and security regulations. Effective February 17, 2010, we are regulated directly under all of the HIPAA rules protecting the security of electronic individually identifiable health information and many of the rules governing the privacy of such information.
•Medical Device Regulation. The FDA classifies medical devices, such as our cameras, into one of three classes, depending on the degree of risk associated with the device and the extent of control needed to ensure safety and effectiveness. Devices deemed to pose lower risk are placed in either class I or II, which generally requires the manufacturer to submit to the FDA a pre-market notification requesting permission for commercial distribution. This process is known as 510(k) clearance. Devices deemed to pose the greatest risk, such as life-sustaining, life-supporting, or implantable devices, are placed in Class III, requiring an approved Premarket Approval Application (“PMA”). Our cameras are Class II medical devices that have been cleared for marketing by the FDA. We are also subject to post-market regulatory requirements relating to our manufacturing process, marketing and sales activities, product performance, and medical device reports should there be deaths and serious injuries associated with our products.
•Pharmaceutical Regulation. Federal and state agencies, including the FDA and state pharmacy boards, regulate the radiopharmaceuticals used in our Diagnostic Services business.
•Radioactive Materials Laws. We must maintain licensure under, and comply with, federal and state radioactive materials laws, or RAM laws. RAM laws require, among other things, that radioactive materials are used by, or that their use be supervised by, individuals with specified training, expertise, and credentials and include specific provisions applicable to the medical use of radioactive materials.
•Environmental Matters. The facilities we operate or manage generate hazardous and medical waste subject to federal and state requirements regarding handling and disposal. We believe that the facilities that we operate and manage are currently in compliance in all material respects with applicable federal, state and local statutes and ordinances regulating the handling and disposal of such materials. We do not believe that we will be required to expend any material additional amounts in order to remain in compliance with these laws and regulations or that compliance will materially affect our capital expenditures, earnings or competitive position.
Human Capital Resources
As of December 31, 2021,2023, we had a total of 458171 employees in all our divisions, of which 202103 were employed in clinical health-related positions, 105 in manufacturing, 6320 in operational roles, 6627 in general and administrative functions, and 2221 in marketing and sales. All of our 171 employees are full-time employees. All positions are in the United States. We also utilize varying amounts of temporary workers as necessary to fulfill customer requirements. We have policies to prevent discrimination based on gender, race, disability, ethnicity, nationality, religion, sexual orientation, gender identity, or gender expression. We take affirmative action to ensure that applicants are employed, and that employees are treated during employment, without regard to their race, color, religion, sex, or national origin. We also take affirmative action to employ and advance veterans in employment. We have not experienced any work stoppages and consider our employee relations to be good.
Recent History of our Business Transformation
On October 30, 2020, Star EquityMay 4, 2023, we entered into a Stock Purchase and Contribution Agreement (the “DMS“Digirad Purchase Agreement”) with Knob Creek Acquisition Corp., a Tennessee corporation (“Buyer”), subject toby and among the satisfaction or waiver of certain conditions. Buyer will purchase all of the issued and outstanding common stock of DMSCompany, Digirad Health Technologies Inc. (“DMS Health”), which operated our Mobile Healthcare business segment, from Project Rendezvous Acquisition Corporation, a Delaware corporation and wholly owned subsidiary of the Company (the “DMS Sale Transaction”(“Digirad Health”), TTG Imaging Solutions, LLC, a Pennsylvania limited liability company (“TTG”), and TTG’s parent, Insignia TTG Parent LLC, a Delaware limited liability company (“TTG Parent”). As a resultPursuant to the Digirad Purchase Agreement, (i) TTG purchased 85% of the entry into the DMS Purchase Agreement, asissued and outstanding shares of December 31, 2020, the Mobile Healthcare business met the criteria to be classified as held for sale and is reportedDigirad Health, on the Consolidated Statementsterms and subject to the conditions set forth therein and (ii) the Company contributed to TTG Parent 15% of Operations as discontinued operationsthe issued and onoutstanding shares of stock of Digirad Health (the “Contributed Shares”) in exchange for New Units (as defined in the Consolidated Balance Sheets as Assets and Liabilities held for sale.Digirad Purchase Agreement) of TTG Parent (the “Transaction”). The purchase pricetotal aggregate consideration payable to the Company for the DMS Sale Transaction is $18.75was $40 million, comprised of $19.7 million ($27 million less payoff of debt to Webster Bank (see Note 8. Debt) and transaction costs) in cash. After certain adjustments, includingcash, a working capital adjustment, we received an immaterial amount$7 million promissory note (see Note 5. Supplemental Balance Sheet Information), and $6 million of net escrow settlementNew Units in January, 2022.
On February 1, 2021, theTTG Parent (see Note 5. Supplemental Balance Sheet Information). The Company completed the sale of Digirad Health simultaneously with entering into the Digirad Purchase Agreement. See Note 3. Discontinued Operations for further information.
On October 31, 2023, we purchased certain assets of BLL. Pursuant to this transaction, BLL sold its MD Office Solutions (“MDOS”)lumberyard and showroom facility to 791 Rose Drive LLC, a wholly-owned subsidiary to M.D.O.S.C.A Inc., a California based holding company (“MDOSCA”), in exchange for a secured promissory note in the original principal amount of $1.4 million and entry into multi-year service and support agreements between MDOSCA and Digirad Health.
On March 31, 2021, in connection with completing the sale of DMS Health, the Company, certain subsidiaries of the Company, and SNB entered into a Second Amendmentcertain related assets to Glenbrook, and rebranded the SNB Loan Agreement (as defined below) pursuantlocation and business operations to which, among other things, SNB consented to the sale of DMS Health and its subsidiaries, removed DMS Health and its subsidiaries as borrowersfall under the SNB Loan Agreement,Glenbrook name, for a combined purchase price of $3.3 million (the “BLL Purchase Price”). The BLL Purchase Price is subject to certain post-closing adjustments including an earn-out provision of up to $0.5 million payable over two years and requireda hold back to satisfy certain indemnification obligations of Glenbrook under the principal to be paid down to $7.0 million.
On June 2, 2021, our boardpurchase agreement. As discussed in more detail in Note 16. Mergers and Acquisitions, we recognized a gain upon the acquisition which represents the excess of directors adopted, and we entered into, a Rights Agreement (the “Rights Agreement”) with American Stock Transfer & Trust Company, LLC, as rights agent, designed to preserve the fair value of our significant U.S. net operating loss carryforwards (“NOLs”) and other tax benefits by deterring transfers of our common stock that could result in an “ownership change” under Section 382 ofassets acquired over the Internal Revenue Code of 1986, as amended (“the Code”). In connection with thepurchase price.
Rights Agreement, our board of directors declared a dividend to our stockholders of record as of the close of business on June 14, 2021, for each outstanding share of our common stock, of one right to purchase one one-thousandth of a share of a new series of participating preferred stock of our Company at a specified exercise price.
Pursuant to the Rights Agreement, if any person or group acquires 4.99% or more of the outstanding shares of our common stock without our board of directors’ permission, or if a person or group that already owns 4.99% or more of our common stock acquires additional shares without our board of directors’ permission, then, subject to certain exceptions, there would be a triggering event under the Rights Agreement. The rights would then become exercisable and entitle stockholders (other than the acquiring person or group) to purchase additional shares at a significant discount and result in significant dilution in the economic interest and voting power of the acquiring person or group. In its discretion, our board of directors may exempt certain transactions from the provisions of the Rights Agreement, including if our board of directors determines that the transaction will not jeopardize our tax benefits, or the transaction will otherwise serve our best interests. Any stockholder desiring to own 5% or more of our shares, or increase an existing ownership position that is already at or above 5%, can request an exemption from our board of directors by submitting certain basic information to us and following the other instructions included in the Rights Agreement. The Rights Agreement and the rights issued under the Rights Agreement will expire on June 2, 2024, or on an earlier date if certain events occur, as described more fully in the Rights Agreement.
At our Annual Meeting of Stockholders held on October 21, 2021, our stockholders ratified and approved the Rights Agreement and a protective amendment to our Restated Certificate of Incorporation designed to protect the tax benefits of our NOLs. Additional information regarding the Rights Agreement is contained in our Definitive Proxy Statement filed with the Securities and Exchange Commission (the “SEC”) on September 22, 2021.
No rights were exercisable at December 31, 2021. There is no impact to financial results as a result of the adoption of the Rights Agreement for the year ended December 31, 2021.
On December 10, 2021, we entered into a securities purchase agreement (the “Purchase Agreement”) with Jeffrey E. Eberwein, our Executive Chairman, relating to the issuance and sale of 650,000 shares of our common stock at a purchase price of $3.25 per share pursuant to a private placement. The transaction was approved by a Special Committee of our board of directors made up of independent directors and by the Audit Committee of our board of directors. The gross proceeds to us from the transaction, before deducting transaction fees and other transaction expenses, were $2.1 million.
Pursuant to the Purchase Agreement, we agreed to use commercially reasonable efforts to file a resale registration statement to register under the Securities Act of 1933 the resale by Mr. Eberwein of the shares as soon as practicable following the issuance and filing with the SEC of our audited financial statements for the year ending December 31, 2021, in connection with the filing of our Annual Report on Form 10-K. In connection with the Purchase Agreement, Mr. Eberwein agreed to enter into a lock-up agreement whereby he agreed not to offer, sell, contract to sell, hypothecate, pledge or otherwise dispose of or enter into any transaction which is designed to result in the disposition of the shares, subject to certain exceptions, until the date that is six months following the closing date of the transaction.
Beginning January 1, 2022, we appointed Richard K. Coleman, Jr. as our new Chief Operating Officer. Mr. Coleman’s addition increases the capacity of our senior leadership team. In this role, he oversees our operations, assist our business leaders in achieving their growth and profitability goals and will launch new business initiatives, as well as help analyze and integrate future acquisitions. Mr. Coleman brings more than 30 years of executive leadership experience with extensive expertise in business development, operational excellence, and acquisitions.
On January 24, 2022, we closed an underwritten public offering (the “Offering”) pursuant to an underwriting agreement with Maxim Group LLC, as representative of the underwriters. The Offering was for 9,500,000 shares of common stock (or pre-funded warrants to purchase shares of common stock in lieu thereof) and warrants to purchase up to 9,500,000 shares of common stock (the “common warrants”). Each share of common stock (or pre-funded warrant in lieu thereof) was sold together with one common warrant to purchase one share of common stock at a price of $1.50 per share and common warrant. Gross proceeds, before deducting underwriting discounts and offering expenses and excluding any proceeds we may receive upon exercise of the common warrants, were $14.3 million and net proceeds were $12.8 million.
Available Information
We file electronically with the SEC, our annual reports on Form 10-K, quarterly reports on Form 10-Q, and current reports on Form 8-K pursuant to Section 13(a) or 15(d) of the Securities Exchange Act of 1934 (“Exchange Act”). The SEC maintains a website (www.sec.gov), which contains reports, proxy and information statements, and other information regarding issuers that file electronically with the SEC.
The Company’s annual reports on Form 10-K, quarterly reports on Form 10-Q, current reports on Form 8-K, and all amendments to those reports are available free of charge on our website (www.starequity.com) as soon as reasonably practicable after such material is electronically filed with, or furnished to, the SEC. Such reports will remain available on our website for at least 12 months and are also available free of charge by written request or by contacting theStar Equity at (203) 489-9500 or our third-party Investor Relations Departmentrepresentative at (203) 489-9500.(212) 836-9611.
The contents of our website or any other website are not incorporated by reference into this Annual Report on Form 10-K.
ITEM 1A.RISK FACTORS
Summary of Risk Factors
The summary below provides a non-exhaustive overview of the risks that, if realized, could materially harm our business, prospects, operating results, and financial condition. This summary is qualified by reference to the full set of risk factors set forth in this Item.
•We have a history of annual net losses attributable to common stockholders which may continue and which may negatively impact our ability to achieve our growth initiatives.
•We rely on information technology in our operations, and any material failure, inadequacy, interruption, or security failure of that technology could materially harm our business.
•We may not be able to achieve the anticipated synergies and benefits from business acquisitions.
•We face risks related to health pandemics, wars, inflation, and other widespread outbreaks of contagious disease, including COVID-19 and its variants, or other potential causes of global instability which could significantly disrupt our operations and impact our financial results.
•We are subject to particular risks associated with real estate ownership, which could result in unanticipated losses or expenses.
•Our revenues may decline due to reductions in Medicare and Medicaid reimbursement rates.
•Our Diagnostic Services revenues may decline due to changes in diagnostic imaging regulations and the use of third party benefit managers by states and private payors to drive down diagnostic imaging volumes.
•Operating results may be adversely affected by changes in the costs and availability of supplies and materials.
•Our quarterly and annual financial results are difficult to predict and are likely to fluctuate from period to period.
•We spend considerable time and money complying with federal and state laws, regulations, and other rules which may fluctuate, based on healthcare policy, and if we are unable to fully comply with such laws, regulations, and other rules, we could face substantial penalties.
•We are subject to risks associated with self-insurance related to health benefits.
•A portion of our operations are located in a facility that may be at risk from fire, earthquakes, or other disasters.
•The medical device industry is litigious, which could result in the diversion of our management’s time and efforts, and require us to incur expenses and pay damages that may not be covered by our insurance.
•If we cannot provide quality technical and applications support, we could lose customers and our business and prospects will suffer.
•Our long-term results depend upon our ability to improve existing products and services and develop, introduce, and market new products and services successfully.
•Our ability to protect our intellectual property and proprietary technology through patents and other means is uncertain.
•The measures that we use to protect the security of our intellectual property and other proprietary rights may not be adequate, which could result in the loss of legal protection for, and thereby diminish the value of, such intellectual property and other rights or we may need to enter into costly license agreements in the future.
•If we are sued for infringing intellectual property rights of third parties, it would be costly and time consuming, and an unfavorable outcome in that litigation could have a material adverse effect on our business.
•Our issued patents could be found invalid or unenforceable if challenged in court, at the United States Patent and Trademark Office (“USPTO”) or other administrative agency, or in other lawsuits which could have a material adverse impact on our business.
•We may make financial investments in other businesses that may lose value.
•Our goodwill and other long-lived assets are subject to potential impairment that could negatively impact our earnings.
•If KBS is unable to maintain or establish its relationships with independent dealers and contractors who sell its homes, KBS revenue could decline.
•Due to the nature of our business, many of our expenses are fixed costs and if there are decreases in demand for products, it may adversely affect operating results.
•Due to the nature of the work we and our subsidiaries perform, we may be subject to significant liability claims and disputes.
•OurRising inflation and interest rates could negatively impact our revenues, profitability, and borrowing costs. In addition, if our costs increase and we are not able to correspondingly adjust our commercial relationships to account for this increase, our net income would be adversely affected, and the adverse impact may be material.
•Any indebtedness incurred by the Company could restrict our operations and make us more vulnerable to adverse economic conditions.
•The Company Loan Agreements (as defined herein) governing our indebtedness contain restrictive covenants that restrict our operating flexibility and require that we maintain specified financial ratios. If we cannot comply with these covenants, we may be in default under one or more of the Company Loan Agreements.
•Substantially all of our assets (including the assets of our subsidiaries) have been pledged to lenders as security for our indebtedness under the Company Loan Agreements.
•The inability of our Company, KBS, EdgeBuilder or any of our other subsidiaries to comply with applicable financial covenants under the Company Loan Agreements could have a material adverse effect on our financial condition.
•If we are unable to generate or borrow sufficient cash to make payments on our indebtedness, our financial condition would be materially harmed, our business could fail, and stockholders may lose all of their investment.
•Increases in interest rates could adversely affect our results from operations and financial condition.
•The market price of our common stock may be volatile, and the value of your investment could decline significantly.
•Our common stock has a low trading volume and shares available under our equity compensation plans could affect the trading price of our common stock.
•If we cannot continue to satisfy the Nasdaq Global Market continued listing standards and other Nasdaq rules, our common stock could be delisted, which would harm our business, the trading price of our common stock, our ability to raise additional capital and the liquidity of the market for our common stock.
•A possible “short squeeze” due to a sudden increase in demand of our common stock that largely exceeds supply may lead to price volatility in our common stock.
•Payment of dividends on our common stock is prohibited unless we have declared and paid (or set apart for payment) full accumulated dividends on the Series A Preferred Stock, which also has a significant liquidation value.
•If we fail to pay dividends on our Series A Preferred Stock for six or more consecutive quarters, holders of our Series A Preferred Stock will be entitled to elect two additional directors to our board of directors.
•We may not be able to redeem our Series A Preferred Stock upon a Change of Control Triggering Event (as defined herein).
•As a smaller reporting company, we are subject to scaled disclosure requirements that may make it more challenging for investors to analyze and compare our results of operations and financial prospects.
•If securities or industry analysts do not publish research or reports about our business, or if they issue an adverse or misleading opinion regarding our stock, the price and trading volume of our securities could decline.
•The protective amendment contained in our Restated Certificate of Incorporation, which is intended to help preserve the value of certain income tax assets, primarily NOLs, may have unintended negative effects.
•Our stockholder rights plan, or “poison pill,” includes terms and conditions which could discourage a takeover or other transaction that stockholders may consider favorable.
•Anti-takeover provisions in our organizational documents and Delaware law may prevent or delay removal of current management or a change in control.
•We expect to be limited in our ability to utilize net operating loss carryforwards to reduce our future tax liability as a result of our recent Offering.January 2022 public offering.
•Material weakness in our internal control over financial reporting could have a significant adverse effect on our business and the price of our common stock.
Risks Related to Our Business and Industry
We have a history of annual net losses attributable to common stockholders which may continue and which may negatively impact our ability to achieve our growth initiatives.
Our total stockholders’ equity decreasedincreased to $16.8$65.3 million as of December 31, 2021.2023. For the year ended December 31, 2021,2023, we had revenue of $106.6$45.8 million, compared to revenue of $78.2$57.1 million for the comparable period in 2020.2022. We had a net lossincome attributable to common stockholders of $4.9$23.2 million for the year ended December 31, 2021,2023, compared to a net loss attributable to common stockholders of $8.4$7.2 million for the comparable 20202022 period. There can be no assurance that, even if our revenue increases, our future operations will result in net income attributable to common stockholders. Our failure to increase our revenues or improve our gross margins will harm our business. We may not be able to sustain or increase profitability on a quarterly or annual basis in the future. If our revenues grow more slowly than we anticipate, our gross margins fail to improve or our operating expenses exceed our expectations, our operating results will suffer. The prices we charge for our products and services may decrease, which would reduce our revenues and harm our business. If we are unable to sell our products at acceptable prices relative to our costs, or if we fail to develop and introduce on a timely basis new products from which we can derive additional revenues, our financial results will suffer.
We rely on information technology in our operations, and any material failure, inadequacy, interruption, or security failure of that technology could materially harm our business.
We rely on information technology and systems, including the Internet, commercially available software, and other applications, to process, transmit, store, and safeguard information and to manage or support a variety of our business processes, including financial transactions and maintenance of records, which may include personal identifying information and other valuable or confidential information. If we experience material failures, inadequacies, or interruptions or security failures of our information technology, we could incur material costs and losses. Further, third-party vendors could experience similar events with respect to their information technology and systems that impact the products and services they provide to us or to our customers. We rely on commercially available systems, software, tools, and monitoring, as well as other applications and internal procedures and personnel, to provide security for processing, transmitting, storing, and safeguarding confidential information such as personally identifiable information related to our employees and others, information regarding financial accounts, and information regarding customers and vendors. We take various actions, and we incur significant costs, to maintain and protect the operation and security of our information technology and systems, including the data maintained in those systems. However, it is possible that these measures will not prevent the systems’ improper functioning or a compromise in security, such as in the event of a cyberattack or the improper disclosure of information. Security breaches, computer viruses, attacks by hackers, online fraud schemes, and similar breaches can create significant system disruptions, shutdowns, fraudulent transfer of assets, or unauthorized disclosure of confidential information. For example, in April 2019, we became aware that we had been a victim of criminal fraud commonly referred to as “business email compromise fraud.” The incident involved the impersonation of one of our officers and improper access to his email, wherein the transfer by us of funds to a third-party account almost occurred.
The operation of our healthcare business includes use of complex information technology infrastructures, access to the information technology networks of our customers, as well as the collection of storing of patient information that is subject to HIPAA. In recent years, attacks on corporate information technology infrastructures have become more common and more sophisticated. Any successful attack on our network could severely impact our ability to conduct operations and could result in lost customers. Though we carry customary insurance for notification events in the event of a patient information breach under HIPAA, our coverage may not be sufficient to cover every situation, and any notification could severely impact our customer confidence and operations.
Despite any defensive measures we take to manage threats to our business, our risk and exposure to these matters remain heightened because of, among other things, the evolving nature of such threats in light of advances in computer capabilities, new discoveries in the field of cryptography, new and sophisticated methods used by criminals including phishing, social engineering, or other illicit acts, or other events or developments that we may be unable to anticipate or fail to adequately mitigate. Any failure to maintain the security, proper function and availability of our information technology and systems, or certain third-party vendors’ failure to similarly protect their information technology and systems that are relevant to our operations, or to safeguard our business processes, assets, and information could result in financial losses, interrupt our operations, damage our reputation, cause us to be in default of material contracts, and subject us to liability claims or regulatory penalties, any of which could materially and adversely affect us.
We may not be able to achieve the anticipated synergies and benefits from business acquisitions.
Part of our business strategy is to acquire businesses that we believe can complement or expand our current business activities, both financially and strategically. In September 2019,With these synergistic benefits in mind, we acquired ATRM and its subsidiaries, including KBS, EdgeBuilder and Glenbrook in 2019 and BLL in 2023, and will continue to seek strategic acquisitions in line with these synergistic benefits in mind.our business activities. Acquisitions involve many complexities, including, but
not limited to, risks associated with the acquired business’ past activities, loss of customers, regulatory changes that are not anticipated, difficulties in integrating personnel and human resource programs, integrating ERP systems and other infrastructures, general underperformance of the business under our control versus the prior owners, unanticipated expenses and liabilities, and the impact on its internal controls of compliance with the regulatory requirements under the Sarbanes-Oxley Act of 2002. As a result, the realization of anticipated synergies or benefits from acquisitions may be delayed or substantially reduced, and could potentially result in the impairment of our investment in these businesses.
We face risks related to health pandemics, wars, inflation, and other widespread outbreaks of contagious disease, including COVID-19 and its variants, or other potential causes of global instability which could significantly disrupt our operations and impact our financial results.
Our business has been disrupted and could be further materially adversely affected by the ongoing COVID-19 pandemic, wars, or other causes of global instability. The outbreak and government measures taken in response have also had a significant impact, both direct and indirect, on businesses and commerce in 2021. Global concerns, such as coronavirusCOVID-19 or other health concerns, wars, or global conflicts, could also result in social, economic, and labor instability in the United States or countries in which we or the third parties with whom we engage operate. The future progression of the outbreakCOVID-19 pandemic and its effects on our business and operations are uncertain, as well as the impact of global conflicts on supply chains and inflation. We cannot presently predict the scope and severity of any potential business shutdowns or disruptions, including downturns in global economies and financial markets that could affect our future operating results. Any adverse impact on
Additionally, during 2022 and into early 2023 the global economy experienced high levels of inflation, rising interest rates, significant fluctuations in currency values, and increasing economic uncertainty, particularly in Europe. While inflation in the United States retreated during the latter part of 2023, our results of operations may continue to be negatively impacted by higher costs of raw materials, labor and financial condition couldfreight resulting from inflationary pressures. These factors and global events including the ongoing military conflicts between Russia and Ukraine and Israel and Hamas, a softening economy in Europe, and fluctuating interest rates may also have a negative impact on our ability to comply with certain financial covenants in certain of our loan agreements (as described further below) and on your investment in our common stock.results.
We are subject to particular risks associated with real estate ownership, which could result in unanticipated losses or expenses.
Following our recent acquisition of real estate, ourOur business is subject to many risks that are associated with the ownership of real estate. For example, if our tenants do not renew their leases or default on their leases, we may be unable to re-lease the facilities at favorable rental rates. Other risksRisks that are associated with real estate acquisition and ownership include, without limitation, the following:
•general liability, property and casualty losses, some of which may be uninsured;
•the inability to purchase or sell our assets rapidly due to the illiquid nature of real estate and the real estate market;
•leases which are not renewed or are renewed at lower rental amounts at expiration;
•the default by a tenant or guarantor under any lease;
•costs relating to maintenance and repair of our facilities and the need to make expenditures due to changes in governmental regulations, such as the Americans with Disabilities Act or remediation of unknown environmental hazards; and
•acts of God and acts of terrorism affecting our properties.
Our revenues may decline due to reductions in Medicare and Medicaid reimbursement rates.
The success of our business is largely dependent upon our medical professional customers’ ability to provide diagnostic care to their patients in an economically sustainable manner, either through the purchase of our imaging systems or using our diagnostic services, or both. Our customers are directly impacted by changes (decreases and increases) in governmental and private payor reimbursements for diagnostic services. We are directly and indirectly impacted by changes in reimbursements. In our businesses, where we are indirectly affected by reimbursement changes, we make every effort to act as business partners with our physician customers. For example, in 2010, we proactively adjusted our diagnostic imaging services rates down due to the dramatic reimbursement declines that our customers experienced from the Centers for Medicare & Medicaid Services. Reimbursements remain a source of concern for our customers and downward pressure on reimbursements causes greater pricing pressure on our services and influences the buying decisions of our customers. Although the gap is closing, hospital reimbursements remain higher than in-office reimbursements. Our Diagnostic Imaging segment’s products are targeted to serve the hospital market. A smaller portion of our Diagnostic Services business segment operates in the hospital market.
Reductions in reimbursements could significantly impact the viability of in-office imaging performed by independent physicians. The historical decline in reimbursements in diagnostic imaging has resulted in cancellations of imaging days in our Diagnostic Services business and the delay of purchase and service decisions by our existing and prospective customers in our Diagnostic Imaging business.
Our Diagnostic Services revenues may decline due to changes in diagnostic imaging regulations and the use of third party benefit managers by states and private payors to drive down diagnostic imaging volumes.
Nuclear medicine is a “designated health service” under the federal physician self-referral prohibition law known as the “Stark Law,” which states that a physician may not refer designated health services to an entity with which the physician or an immediate family member has a financial relationship, unless a statutory exception applies. Our business model and service agreements are structured to enable our physician customers to meet the statutory in-office ancillary services (“IOAS”) exception to the Stark Law, allowing them to perform nuclear diagnostic imaging services on their patients in the convenience of their own office. From time-to-time, the Centers for Medicare and Medicaid Services and Congress have proposed to modify the IOAS to further limit or eliminate this exception. Various lobbying organizations, including the Medicare Payment Advisory Commission (“MedPAC”), in the past have pushed for, discussed, and recommended that Congress limit the availability of the IOAS exception in order to reduce federal healthcare costs. Legislation has been introduced in prior Congresses to modify or eliminate the exception, but has not been enacted. The outcome of these efforts is uncertain at this time; however, the limitation or elimination of the IOAS exception could significantly impact our Diagnostic Services business segment as currently structured.
Our customers who perform imaging services in their office also experience the continuing efforts by some private insurance companies to reduce healthcare expenditures by hiring radiology benefit managers to help them manage and limit imaging. The federal government has also set aside monies in the 2009 recession recovery acts to hire radiology benefit managers to provide image management services to Medicare/Medicaid and MedPAC has recommended and the Centers for Medicare & Medicaid Services has, in the past, proposed legislation requiring Medicare physicians who engage in a relatively high volume of medical imaging be required to obtain pre-authorization through a radiology benefit manager. A radiology benefit manager is an unregulated entity that performs various functions for private payors and managed care organizations. Radiology benefit manager activities can include pre-authorization for imaging procedures, setting and enforcing standards, approving which contracted physicians can perform the services, such as requiring even the most experienced and highly qualified cardiologists to obtain additional board certifications, or interfering with the financial decision of the private practitioner by requiring them to own their own imaging system and not allowing them to lease the system. The radiology benefit managers often do not provide written documentation of their decisions or an appeals process, leaving leasing physicians unable to challenge their decisions with the carrier or the state insurance department. Unregulated radiology benefit manager activities have and could continue to adversely affect our physician customers’ ability to receive reimbursement, therefore impacting our customers’ decision to utilize our Diagnostic Services imaging services.
Operating results may be adversely affected by changes in the costs and availability of supplies and materials.
Manufacturing and providing service for our nuclear imaging cameras is highly dependent upon the availability of certain suppliers; thereby making us vulnerable to supply problems and price fluctuations that could harm our business. Our manufacturing process within Diagnostic Imaging, and our warranty and post-warranty camera support business, rely on a limited number of third parties to supply certain key components and manufacture our products. Alternative sources of production and supply may not be readily available or may take several months to scale-up and develop effective production processes. If a disruption in the availability of parts or in the operations of our suppliers were to occur, our ability to have gamma cameras built as well as our ability to provide support could be materially adversely affected. In certain cases, we have developed backup plans and have alternative procedures should we experience a disruption. However, if these plans are unsuccessful or if we have a single source, delays in the production and support of our gamma cameras for an extended period of time could cause a loss of revenue and/or higher production and support costs, which could significantly harm our business and results of operations.
Our Diagnostic Services operations are highly dependent upon the availability of certain radiopharmaceuticals, thereby making us vulnerable to supply problems and price fluctuations that could harm our business. Our Diagnostic Service business involves the use of radiopharmaceuticals. There is a limited number of major nuclear reactors supplying medical radiopharmaceuticals worldwide and there is no guarantee that the reactors will remain in good repair or that our supplier will have continuing access to ample supply of our radiopharmaceutical product. If we are unable to obtain an adequate supply of the necessary radiopharmaceuticals, we may be unable to utilize our personnel and equipment through our in-office service operations, or the volume of our services could decline and our business may be adversely affected. Shortages can also cause price increases that may not be accounted for in third party reimbursement rates, thereby causing us to lose margin or require us to pass increases on to our physician customers.
Our Construction operating results could be adversely affected by changes in the cost and availability of raw materials. Prices and availability of raw materials used to manufacture our products can change significantly due to fluctuations in supply and demand. Additionally, availability of the raw materials used to manufacture our products may be limited at times resulting in higher prices and/or the need to find alternative suppliers. Both KBS’s and EdgeBuilder’s major material components are dimensional lumber and wood sheet products, which include plywood and oriented strand board. Lumber costs are subject to market fluctuations. Furthermore, the cost of raw materials may also be influenced by transportation costs. It is not certain that any price increases can be passed on to our customers without affecting demand or that limited availability of materials will not impact our production capabilities. The state of the financial and housing markets may also impact our suppliers and affect the
availability or pricing of materials. The inability of KBS or EdgeBuilder to raise the price of their products in response to increases in prices of raw materials or to maintain a proper supply of raw materials could have an adverse effect on their revenue and earnings.
Our quarterly and annual financial results are difficult to predict and are likely to fluctuate from period to period.
We have historically experienced seasonality in all of our businesses volatility due to the changing healthcare environment, the variable supply of radiopharmaceuticals, and downturns based on the changing U.S. economy. While
The Construction industry is sensitive to changes in economic conditions and other factors, including, but not limited to, consumer confidence, increases in interest rates, and the cost and availability of financing. Adverse changes in any of these conditions could decrease demand and pricing for new projects in the areas in which we operate or result in customer cancellations of pending contracts, which could result in a decrease in our customers are typically obligated to pay us for imaging days to which they have committed, our contracts permit some flexibilityrevenues in scheduling when services are to be performed. particular periods.
We cannot predict with certainty the degreeoverall trajectory of the Construction industry or the duration of trends due to which seasonal circumstanceschanges in conditions that are beyond our control. These conditions include, but are not limited to:
•rising interest rates;
•economic recession or downturn;
•changes in demographics and population migration that impair the demand for new housing;
•labor issues such as the summer slowdown, winter holiday vacations,shortages and weather conditions may affect the resultsrising costs of our operations. We have also experienced fluctuations in demand of our diagnostic imaging product sales due to economic conditions, capital budget availability,labor; and other financial or business reasons, most recently the abrupt increases of quarantine restrictions and reduced demand due to the COVID-19 pandemic. In addition, due to the way that customers in our target markets acquire our products, a large percentage of our products are booked during the last month of each quarterly accounting period, and often there can be a large amount in the last month of the year. As such, a delivery delay of only a few days may significantly impact quarter-to-quarter comparisons of our results of operations. Moreover, the sales cycle for all of our capital products is typically lengthy, particularly in the hospital market, which may cause us to experience significant revenue fluctuations. We have also experienced fluctuations in demand in our Construction division due to economic conditions and quarantine restrictions.
•tax law changes.
We spend considerable time and money complying with federal and state laws, regulations, and other rules which may fluctuate, based on healthcare policy, and if we are unable to fully comply with such laws, regulations, and other rules, we could face substantial penalties.
Through our Healthcare businesses we are directly, or indirectly through our customers, subject to extensive regulation by both the federal government and the states in which we conduct our business, including: the federal Medicare and Medicaid anti-kickback laws and other Medicare laws, regulations, rules, manual provisions, and policies that prescribe requirements for coverage and payment for services performed by us and our physician customers; the federal False Claims statutes; the federal Health Insurance Portability and Accountability Act of 1996, or HIPAA, as amended in 2009 under the HITECH Act that places direct legal obligations and higher liability on us with respect to the security and handling of personal health information; the Stark Law; the federal Food, Drug and Cosmetic Act; federal and state radioactive materials laws; state food and drug and pharmacy laws and regulations; state laws that prohibit the practice of medicine by non-physicians and fee-splitting arrangements between physicians and non-physicians; state scope-of-practice laws; and federal rules prohibiting the mark-up of diagnostic tests to Medicare under certain circumstances. If our customers are unable or unwilling to comply with these statutes, regulations, rules, and policies, rates of our services and products could decline and our business could be harmed.
Our Construction businesses are subject to various federal, state and local laws and regulations. In recent years, a number of new laws and regulations have been adopted, and there has been expanded enforcement of certain existing laws and regulations by federal, state, and local agencies. These laws and regulations, and related interpretations and enforcement activity, may change as a result of a variety of factors, including political, economic or social events. Changes in, expanded enforcement of, or adoption of new federal, state or local laws and regulations governing minimum wage or living wage requirements; the classification of exempt and non-exempt employees; the distinction between employees and contractors; other wage, labor or workplace regulations; healthcare; data protection and cybersecurity; the sale and pricing of some of our products; transportation; logistics; supply chain transparency; taxes; unclaimed property; energy costs and consumption; or environmental matters could increase our costs of doing business or impact our operations.
We maintain a compliance program to identify and correct any compliance issues and remain in compliance with all applicable laws, to train employees, to audit and monitor our operations, and to achieve other compliance goals. Like most companies with compliance programs, we occasionally discover compliance concerns. In such cases, we take responsive action, including corrective measures when necessary. There can be no assurance that our responsive actions will insulate us from liability associated with any detected compliance concerns.
If our past or present operations are found to be in violation of any of the laws, regulations, rules, or policies described above or the other laws or regulations to which we or our customers are subject, we may be subject to civil and criminal penalties, damages, fines, exclusion from federal or state healthcare programs, or the curtailment or restructuring of our operations. Similarly, if our physician customers are found to be non-compliant with applicable laws, they may be subject to sanctions that could have a negative impact on us. Any penalties, damages, fines, curtailment, or restructuring of our operations could adversely affect our ability to operate our business and our financial results. Any action against us for violation of these laws, even if we successfully defend against it, could cause us to incur significant legal expenses, divert our management’s attention from the operation of our business, and damage our reputation. Although compliance programs can mitigate the risk of investigation and prosecution for violations of these laws, regulations, rules, and policies, the risks cannot be entirely
eliminated. Moreover, achieving and sustaining compliance with applicable federal and state privacy, security, and fraud laws may prove costly.
We are subject to risks associated with self-insurance related to health benefits.
To help control our overall long-term costs associated with employee health benefits, we are self-insured up to certain limits for our health plans. As such, we are subject to risks associated with self-insurance of these health plan benefits. To limit our exposure, we have third party stop-loss insurance coverage for both individual and aggregate claim costs. However, we could still experience unforeseen and potentially significant fluctuations in our healthcare costs based on a higher than expected volume of claims below these stop-loss levels. These fluctuations could have a material adverse effect on our financial position and results of operations.
A portion of our operations are located in a facility that may be at risk from fire, earthquakes, or other disasters.
Final assembly in our manufacturing process and significant portions of our inventory are located in a single facility in Poway, California, near known fire areas and earthquake fault zones. Future natural disasters could cause substantial delays in our operations and cause us to incur additional expenses. Although we have taken precautions to insure our facilities and continuing operations, as well as provide for offsite back-up of our information systems, this may not be adequate to cover our losses in any particular case.
The medical device industry is litigious, which could result in the diversion of our management’s time and efforts, and require us to incur expenses and pay damages that may not be covered by our insurance.11
Our operations entail risks of claims or litigation relating to product liability, radioactive contamination, patent infringement, trade secret disclosure, warranty claims, vendor disputes, product recalls, property damage, misdiagnosis, breach of contract, personal injury, and death. Any litigation or claims against us, or claims we bring against others, may cause us to incur substantial costs, could place a significant strain on our financial resources, divert the attention of our management from our core business, and harm our reputation. We may incur significant liability in the event of any such litigation, regardless of the merit of the action. If we are unable to obtain insurance, or if our insurance is inadequate to cover claims, our cash reserves and other assets could be negatively impacted. Additionally, costs associated with maintaining our insurance could become prohibitively expensive, and our ability to become or remain profitable could be diminished.
If we cannot provide quality technical and applications support, we could lose customers and our business and prospects will suffer.
The placement of our products and the introduction of our technology at new customer sites requires the services of highly trained technical support personnel. Hiring technical support personnel is very competitive in our industry due to the limited number of people available with the necessary scientific and technical backgrounds and ability to understand our technology at a technical level. If we are unable to attract, train or retain the number of highly qualified technical services personnel that our business needs, our business and prospects will suffer.
Our long-term results depend upon our ability to improve existing products and services and develop, introduce, and market new products and services successfully.
Our business is dependent on the continued improvement of our existing products and services and our development of new products and services utilizing our current or other potential future technology. As we introduce new products and services or refine, improve, or upgrade versions of existing products and services, we cannot predict the level of market acceptance or the amount of market share these products and services will achieve, if any. We cannot assure yoube certain that we will not experience material delays in the introduction of new products or services in the future.
We generally sell our products and services in industries that are characterized by rapid technological changes, frequent new product introductions, and changing industry standards. If we do not develop new products and services and product enhancements based on technological innovation on a timely basis, our products and services may become obsolete over time and our revenues, cash flow, profitability, and competitive position may suffer. Even if we successfully innovate and develop new products, services and product enhancements, we may incur substantial costs in doing so, and our profitability may suffer.
We may face risks associated with launching new products and services. If we encounter development or manufacturing challenges or discover errors during our product development cycle, the product launch dates of new products and services may be delayed. The expenses or losses associated with unsuccessful product development or launch activities or lack of market acceptance of our new products and services could adversely affect our business or financial condition.
Our ability to protect our intellectual property and proprietary technology through patents and other means is uncertain.
We rely on patent protection as well as trademark, copyright, trade secret and other intellectual property rights protection and contractual restrictions to protect our proprietary technologies, all of which provide limited protection and may not adequately protect our rights or permit us to gain or keep any competitive advantage. Our success depends, in part, on our
ability to protect our proprietary rights to the technologies used in our products. If we fail to protect and/or maintain our intellectual property, third parties may be able to compete more effectively against us, we may lose our technological or competitive advantage, and/or we may incur substantial litigation costs in our attempts to recover or restrict use of our intellectual property.
We do not have any pending patent applications. We cannot assure investors that we will continue to innovate and file new patent applications, or that if filed any future patent applications will result in granted patents. Further, we cannot predict how long it will take for such patents to issue, if at all. It is possible that, for any of our patents that have issued or that may issue in the future, our competitors may design their products around our patented technologies. Further, we cannot assure investors that other parties will not challenge any patents granted to us, or that courts or regulatory agencies will hold our patents to be valid, enforceable, and/or infringed. We cannot guarantee investors that we will be successful in defending challenges made against our patents and patent applications. Any successful third-party challenge or challenges to our patents could result in the unenforceability or invalidity of such patents, or such patents being interpreted narrowly and/or in a manner adverse to our interests. Our ability to establish or maintain a technological or competitive advantage over our competitors and/or market entrants may be diminished because of these uncertainties. For these and other reasons, our intellectual property may not provide us with any competitive advantage.
To the extent our intellectual property offers inadequate protection, or is found to be invalid or unenforceable, we would be exposed to a greater risk of direct or indirect competition. If our intellectual property does not provide adequate coverage of our competitors’ products, our competitive position could be adversely affected, as could our business.
The measures that we use to protect the security of our intellectual property and other proprietary rights may not be adequate, which could result in the loss of legal protection for, and thereby diminish the value of, such intellectual property and other rights or we may need to enter into costly license agreements in the future.
Other than pursuing patents on our technology, we also rely upon trademarks, trade secrets, copyrights and unfair competition laws, as well as license agreements and other contractual provisions, to protect our intellectual property and other proprietary rights. Despite these measures, any of our intellectual property rights could be challenged, invalidated, circumvented or misappropriated. In addition, we take steps to protect our intellectual property and proprietary technology by entering into confidentiality agreements and intellectual property assignment agreements with our employees, consultants, corporate partners and, when needed, our advisors. Such agreements may not be enforceable or may not provide meaningful protection for our trade secrets and/or other proprietary information in the event of unauthorized use or disclosure or other breaches of the agreements, and we may not be able to prevent such unauthorized disclosure. Moreover, if a party having an agreement with us has an overlapping or conflicting obligation to a third party, our rights in and to certain intellectual property could be undermined. Monitoring unauthorized and inadvertent disclosure is difficult, and we do not know whether the steps we have taken to prevent such disclosure are, or will be, adequate. If we were to enforce a claim that a third party had illegally obtained and was using our trade secrets, it would be expensive and time consuming, the outcome would be unpredictable, and any remedy may be inadequate.
If we are sued for infringing intellectual property rights of third parties, it would be costly and time consuming, and an unfavorable outcome in that litigation could have a material adverse effect on our business.
Our success also depends on our ability to develop, manufacture, market and sell our products and perform our services without infringing the proprietary rights of third parties. Numerous U.S. issued patents and pending patent applications owned by third parties exist in the fields in which we are developing products and services. As part of a business strategy to impede our successful commercialization and entry into new markets, competitors may allege that our products and/or services infringe their intellectual property rights.
We could incur substantial costs and divert the attention of our management and technical personnel in defending ourselves against claims of infringement made by third parties. Any adverse ruling by a court or administrative body, or perception of an adverse ruling, may have a material adverse impact on our ability to conduct our business and our finances. Moreover, third parties making claims against us may be able to obtain injunctive relief against us, which could block our ability to offer one or more products or services and could result in a substantial award of damages against us. Intellectual property litigation can be very expensive, and we may not have the financial means to defend ourselves.
Because patent applications can take many years to issue, there may be pending applications, some of which are unknown to us, that may result in issued patents upon which our products or proprietary technologies may infringe. Moreover, we may fail to identify issued patents of relevance or incorrectly conclude that an issued patent is invalid or not infringed by our technology or any of our products.
Our issued patents could be found invalid or unenforceable if challenged in court, at the USPTO or other administrative agency, or in other lawsuits which could have a material adverse impact on our business.
Any patents we have obtained or do obtain may be challenged by re-examination or otherwise invalidated or eventually found unenforceable. Both the patent application process and the process of managing patent disputes can be time consuming and expensive. If we were to initiate legal proceedings against a third party to enforce a patent related to one of our products or services, the defendant in such litigation could counterclaim that our patent is invalid and/or unenforceable. Third parties may also raise similar claims before the USPTO even outside the context of litigation. The outcome is unpredictable following legal assertions of invalidity and unenforceability. With respect to the validity question, for example, we cannot be certain that no invalidating prior art existed of which we and the patent examiner were unaware during prosecution. These assertions may also be based on information known to us or the USPTO. If a defendant or third party were to prevail on a legal assertion of invalidity and/or unenforceability, we would lose at least part, and perhaps all, of the claims of the challenged patent. Such a loss of patent protection would or could have a material adverse impact on our business.
Competitors may attempt to challenge or invalidate our patents, or may be able to design alternative techniques or devices that avoid infringement of our patents that have issued or that may issue in the future, or develop products with functionalities that are comparable to ours. In the event a competitor infringes upon our patent or other intellectual property rights, litigation to enforce our intellectual property rights or to defend our patents against challenge, even if successful, could be expensive and time consuming and could require significant time and attention from our management. We may not have sufficient resources to enforce our intellectual property rights or to defend our patents against challenges from others.
An adverse result in any such litigation proceedings could put one or more of our patents at risk of being invalidated, being found to be unenforceable, and/or being interpreted narrowly and could impact the validity or enforceability positions of our other patents. Furthermore, because of the substantial amount of discovery required in connection with intellectual property litigation, there is a risk that some of our confidential information could be compromised by disclosure during this type of litigation. In addition, an adverse outcome in such litigation or proceedings may expose us to loss of our proprietary position, expose us to significant liabilities, or require us to seek licenses that may not be available on commercially acceptable terms, if at all.
We may make financial investments in other businesses that may lose value.
As we look for the best ways to deploy our capital and maximize our returns for our businesses and stockholders, we may make financial investments in other businesses or processes for purposes of enhancing our supply chain, creating financial returns, strategic developments, or other purposes. These investments may be speculative in nature, and there is no guarantee that we will experience a financial return and we may lose our entire principal balance if not successful.
Our goodwill and other long-lived assets are subject to potential impairment that could negatively impact our earnings.
A significant portion of our assets consists of goodwill and other long-lived assets, the carrying value of which may be reduced if we determine that those assets are impaired. At December 31, 2021,2023, goodwill and net intangible assets represented $21.1$17.0 million, or 31.0%22.5% of our total assets, and at December 31, 2020,2022, goodwill and net intangible assets represented $26.4$17.8 million, or 29.6%24.3% of our total assets. In addition, net property and equipment assets totaled $8.9$7.8 million and $9.8$5.7 million, or 13.1%10.4% and 10.9%7.7%, respectively, of our total assets at those dates. If actual results differ from the assumptions and estimates used in our goodwill and long-lived asset valuation calculations, we could incur impairment charges, which could negatively impact our earnings.
We review our reporting units for potential goodwill impairment annually or more often if events or circumstances indicate that it is more likely than not that the fair value of a reporting unit is less than its carrying amount. In addition, we test the recoverability of long-lived assets if events or circumstances indicate the carrying values may not be recoverable. Recoverability of long-lived assets is measured by comparison of their carrying amounts to future undiscounted cash flows the assets are expected to generate. We conduct impairment testing based on our current business strategy in light of present industry and economic conditions, as well as future expectations. There are numerous risks that may cause the fair value of a reporting unit to fall below its carrying amount and/or the value of long-lived assets to not be recoverable, which could lead to the measurement and recognition of goodwill and/or long-lived asset impairment. These risks include, but are not limited to, significant negative variances between actual and expected financial results, lowered expectations of future financial results, failure to realize anticipated synergies from acquisitions, adverse changes in the business climate, and the loss of key personnel. If we are not able to achieve projected performance levels, future impairments could be possible, which could negatively impact our earnings.
We recorded anno impairment loss of $3.4 million associated withduring the impairment assessment of the KBS reporting unit as ofyears ended December 31, 20212023 and an impairment loss of $0.4 million associated with the impairment assessment of the EBGL reporting unit as of December 31, 2020.2022. See Note 2. Basis of Presentation and Significant Accounting Policies, and Note 7. Goodwill, within the notes to our accompanying consolidated financial statements for further discussion regarding goodwill and long-lived assets.
If KBS is unable to maintain or establish its relationships with independent dealers and contractors who sell its homes, KBS revenue could decline.
KBS sells residential homes through a network of independent dealers and contractors. As is common in the modular home industry, KBS’s independent dealers may also sell homes produced by competing manufacturers and can cancel their relationships with KBS on short notice. In addition, these dealers may not remain financially solvent, as they are subject to industry, economic, demographic and seasonal trends similar to those faced by KBS. If KBS is not able to maintain good relationships with its dealers and contractors or establish relationships with new solvent dealers or contractors, KBS’s revenue could decline.
Due to the nature of our business, many of our expenses are fixed costs and if there are decreases in demand for products, it may adversely affect operating results.
Many of our expenses, particularly those relating to properties, capital equipment, and certain manufacturing overhead items, are fixed in the short term. Reduced demand for products causes fixed production costs to be allocated across reduced production volumes, which may adversely affect gross margins and profitability.
Due to the nature of the work we and our subsidiaries perform, we may be subject to significant liability claims and disputes.
We and our wholly owned subsidiaries engage in services that can result in substantial injury or damages that may expose us to legal proceedings, investigations and disputes. For example, in the ordinary course of our business, we may be involved in legal disputes regarding personal injury and wrongful death claims, employee or labor disputes, professional liability claims, and general commercial disputes, as well as other claims. Lone Star Value Management, LLC, now a liquidated entity, previously was an exempt reporting advisor and subject to certain regulations which at times may prompt investigations by the SEC or other regulatory bodies into proper compliance therewith. An unfavorable legal ruling against us or our subsidiaries could result in substantial monetary damages. Although we have adopted a range of insurance, risk management, safety, and risk avoidance programs designed to reduce potential liabilities, there can be no assurance that such programs will protect us fully from all risks and liabilities. If we sustain liabilities that exceed our insurance coverage or for which we are not insured, it could have a material adverse impact on our results of operations and financial condition.
Rising inflation and interest rates could negatively impact our revenues, profitability and borrowing costs. In addition, if our costs increase and we are not able to correspondingly adjust our commercial relationships to account for this increase, our net income would be adversely affected, and the adverse impact may be material.
Inflation rates in the U.S. recently increased to a 40-year high before retreating in the latter part of 2023. Increased inflation may result in decreased demand for our products, increased operating costs (including our labor costs), reduced liquidity, and limitations on our ability to access credit or otherwise raise debt and equity capital. In addition, the United States Federal Reserve has raised, and may again raise, interest rates in response to concerns about inflation. Increases in interest rates have had, and could continue to have, a material impact on our borrowing costs. In an inflationary environment, we may be unable to raise the sales prices of our products at or above the rate at which our costs increase, which could reduce our profit margins and have a material adverse effect on our financial results and net income. We also may experience lower than expected sales if there is a decrease in spending on products in our industry in general or a negative reaction to our pricing. A reduction in our revenue would be detrimental to our profitability and financial condition and could also have an adverse impact on our future growth.
Risks Related to our Indebtedness
On March 29, 2019, we and certain ofAny indebtedness incurred by the Healthcare subsidiaries entered into a Loan and Security Agreement with SNB (the “SNB Loan Agreement”). The SNB Loan Agreement is a five-year revolving credit facility (maturing in March 2024), which, as amended, has a maximum credit amount of $20 million (the “SNB Credit Facility”). As of December 31, 2021, our floating rate under this facility was 2.60%. On January 31, 2020, we and certain of our Investments subsidiaries entered into a Loan and Security Agreement with Gerber (as amended, the “Star Loan Agreement”), which provides for a credit facility with borrowing availability of up to $2.5 million, bearing interest at the prime rate plus 3.5% per annum, and matures on January 1, 2025, unless terminated in accordance with the terms therein (the “Star Loan”). On January 31, 2020, we and certain of our Construction subsidiaries entered into a Loan and Security Agreement with Gerber (the “EdgeBuilder Loan Agreement”), which provides for a credit facility with borrowing availability of up to $3.0 million, bearing interest at the prime rate plus 2.75% per annum, and matures on January 1, 2023, subject to annual automatic extensions (the “EdgeBuilder Loan”). The credit facility under the Loan and Security Agreement, dated February 23, 2016, by and among us, KBS, ATRM, and Gerber (as amended, the “KBS Loan Agreement”) provides for a revolving credit facility of up to $4.0 million, bearing interest at the prime rate plus 2.75%, that matures on February 22, 2023, subject to automatic extension for an additional year unless terminated. The SNB Loan Agreement, Star Loan Agreement, EdgeBuilder Loan Agreement and KBS Loan Agreement are collectively referred to as the “Company Loan Agreements.”
Our indebtednessCompany could restrict our operations and make us more vulnerable to adverse economic conditions.
OurAny indebtedness we incur in the future could have important consequences for us and our stockholders. For example, the SNB Loan Agreement requires a balloon payment at the termination of the facility in March 2024, which payment may require us to dedicate a substantial portion of our cash flow from operations to this future payment if we feel we cannot be successful in our ability to refinance in the future, thereby reducing the availability of our cash flow to fund working capital, capital expenditures, and acquisitions, and for other general corporate purposes. In addition, ourOur indebtedness could:
•increase our vulnerability to adverse economic and competitive pressures in our industry;
•place us at a competitive disadvantage compared to our competitors that have less debt;
•limit our flexibility in planning for, or reacting to, changes in our business and our industry; and
•limit our ability to borrow additional funds on terms that are acceptable to us or at all.
The Company Loan Agreements governing our indebtedness contain restrictive covenants that restrict our operating flexibility and require that we maintain specified financial ratios. If we cannot comply with these covenants, we may be in default under one or more of the Company Loan Agreements.
The Company Loan Agreements governing our indebtedness contain restrictions and limitations on our ability to engage in activities that may be in our long-term best interests. The Company Loan Agreements contain affirmative and negative covenants that limit and restrict, among other things, our ability to:
•incur additional debt;
•sell assets;
•incur liens or other encumbrances;
•make certain restricted payments and investments;
•acquire other businesses; and
•merge or consolidate.
The SNB Loan Agreement limits our ability to pay dividends and to redeem our equity securities if such dividend or redemption would result in our non-compliance with the financial covenants in the SNB Loan Agreement, there is insufficient borrowing availability under the SNB Loan Agreement, or if there is a default or event of default under the SNB Loan Agreement that has occurred and is continuing. In addition, the Company Loan Agreements include explicit restrictions on the payment of dividends and distributions to us, which could limit our ability to pay dividends. We may, therefore be required to reduce or eliminate our dividends, if any, including on our preferred stock (if any outstanding), and/or may be unable to redeem shares of our preferred stock (if any outstanding) until compliance with such financial covenants can be met.
The Company Loan Agreements contain various financial covenants that, going forward, we or our subsidiaries may not have the ability to meet. The Company Loan Agreements also contain various other affirmative and negative covenants regarding, among other things, the performance of our business, capital allocation decisions made by us and our subsidiaries, or events beyond our control.
Our failure to comply with our covenants and other obligations under the Company Loan Agreements may result in an event of default thereunder. A default, if not cured or waived, may permit acceleration of our indebtedness. If our indebtedness is accelerated, we cannot be certain that we will have sufficient funds available to pay the accelerated indebtedness (together with accrued interest and fees), or that we will have the ability to refinance the accelerated indebtedness on terms favorable to us or at all. This could have serious consequences to our financial condition, operating results, and business, and could cause us to become insolvent or enter bankruptcy proceedings, and stockholders may lose all or a portion of their investment because of the priority of the claims of our creditors on our assets.
Substantially all of our assets (including the assets of our subsidiaries) have been pledged to lenders as security for our indebtedness under the Company Loan Agreements.
The Company Loan Agreements are secured by a first-priority security interest in substantially all of the assets of us and our subsidiaries and a pledge of all shares and equity interests of our subsidiaries. Upon the occurrence and during the continuation of an event of default under any Company Loan Agreement, the applicable lender may, among other things, declare the loans and all other obligations thereunder immediately due and payable and may, in certain instances, increase the interest rate at which loans and obligations bear interest. The exercise by a lender of remedies provided under the applicable Company Loan Agreement in the event of a default thereunder may have a material adverse effect on the liquidity, financial condition and results of operations of the applicable borrowers and/or us and could cause such borrowers and/or us to become bankrupt or insolvent. Our obligations and the obligations of our various subsidiaries under the Company Loan Agreements are guaranteed by our other subsidiaries and/or us directly. In the event of any bankruptcy, liquidation, dissolution, reorganization, or similar proceeding against us, the assets that are pledged as collateral securing any unpaid amounts under the applicable Company Loan Agreement must first be used to pay such amounts, as well as any other obligation secured by the pledged assets, in full, before making any distributions to our stockholders. In the event of any of the foregoing, our stockholders could lose all or a part of their investment.
The inability of our Company, KBS, EdgeBuilder or any of our other subsidiaries to comply with applicable financial covenants under the Company Loan Agreements could have a material adverse effect on our financial condition.
As of December 31, 2021, our last test date, KBS was not in compliance with the bi-annual financial covenants under the KBS Loan Agreement, which required no net annual post-tax loss and certain minimum leverage ratios as of the test date. We obtained waivers from Gerber, our lender, for these financial covenant violations. While Gerber has historically provided us with timely waivers, there can be no assurance that we will be able to receive waivers for any financial covenant violations in the future, or that we will comply with all financial covenants in the future.
If we or any of our subsidiaries fail to comply with any applicable financial covenants under the Company Loan Agreements to which we are a party, or if there is otherwise an event of default under the Company Loan Agreements by a borrower, the borrowers’ obligations thereunder may (subject to any applicable cure periods) become immediately due and payable and the applicable lender(s) may demand the repayment of the credit facilities amount outstanding and any unpaid interest thereon.
If we are unable to generate or borrow sufficient cash to make payments on our indebtedness, our financial condition would be materially harmed, our business could fail, and stockholders may lose all of their investment.
OurTo the extent we incur indebtedness in the future, our ability to make scheduled payments on or to refinance our obligations will depend on our financial and operating performance, which will be affected by economic, financial, competitive, business, and other factors, some of which are beyond our control. We cannot assure you that our business will generate sufficient cash flow from operations to service our indebtedness or to fund our other liquidity needs. If we are unable to meet our debt obligations or fund our other liquidity needs, we may need to restructure or refinance all or a portion of our indebtedness on or before maturity or sell certain of our assets. We cannot assure you that we will be able to restructure or refinance any of our indebtedness on commercially reasonable terms, if at all, which could cause us to default on our debt obligations and impair our liquidity. Any refinancing of our indebtedness could be at higher interest rates and may require us to comply with more onerous covenants, which could further restrict our business operations.
Increases in interest rates could adversely affect our results from operations and financial condition.
The SNB Loan Agreement and Star Loan Agreement allow for amounts borrowed thereunder to be subject to a floating interest rate which may change with market interest rates. An increase in prevailing interest rates would have an effect on the interest rates charged on our variable rate debt, which rise and fall upon changes in interest rates. If prevailing interest rates or other factors result in higher interest rates, the increased interest expense would adversely affect our cash flow and our ability to service our indebtedness.
Risks Related to our Common Stock and our Company Preferred Stock
The market price of our common stock may be volatile, and the value of your investment could decline significantly.
The market price of our common stock has been, and we expect it to continue to be, volatile. The prices at which our shares of common stock trade depend upon a number of factors, including our historical and anticipated operating results, our financial situation, announcements of new products by us or our competitors, history of timely dividend payments, our ability or inability to raise the additional capital we may need and the terms on which we raise it, and general market and economic conditions. Some of these factors are beyond our control. Broad market fluctuations may lower the market price of our common stock and affect the volume of trading in our stock, regardless of our financial condition, results of operations, business, or prospects. It is impossible to assure you that the market price of our shares of common stock will not fall in the future.
Our common stock has a low trading volume and shares available under our equity compensation plans could affect the trading price of our common stock.
Our common stock historically has had a low trading volume. Any significant sales of our common stock may cause volatility in our stock price. We also have registered shares of common stock that we may issue under our employee benefit plans or from our treasury stock. Accordingly, these shares can be freely sold in the public market upon issuance, subject to restrictions under the securities laws. If any of these stockholders, or other selling stockholders, cause a large number of securities to be sold in the public market without a corresponding demand, the sales could reduce the trading price of our common stock. One or more stockholders holding a significant amount of our common stock might be able to significantly influence matters requiring approval by our stockholders, possibly including the election of directors and the approval of mergers or other business combination transactions.
If we cannot continue to satisfy the Nasdaq Global Market continued listing standards and other Nasdaq rules, our common stock could be delisted, which would harm our business, the trading price of our common stock, our ability to raise additional capital and the liquidity of the market for our common stock.
Our common stock is currently listed on the Nasdaq Global Market. To maintain the listing of our common stock on the Nasdaq Global Market, we are required to meet certain listing requirements, including, among others, either: (i) a minimum closing bid price of $1.00 per share, a market value of publicly held shares (excluding shares held by our executive officers, directors and 10% or more stockholders) of at least $5.0 million and stockholders’ equity of at least $10 million; or (ii) a minimum closing bid price of $1.00 per share, a market value of publicly held shares (excluding shares held by our executive officers, directors and 10% or more stockholders) of at least $15.0 million and total assets of at least $50.0 million and total revenue of at least $50.0 million (in the latest fiscal year or in two of the last three fiscal years).
There is no assurance that we will be able to maintain compliance with the minimum closing price requirement. In the event that we fail to maintain compliance with Nasdaq listing requirements for 30 consecutive trading days, Nasdaq may send us a notice stating we will be provided a period of 180 days to regain compliance with the minimum bid requirement or else Nasdaq may make a determination to delist our common stock or grant a transfer of our listing to the Nasdaq Capital Market, wherein we would be provided another 180 days to regain compliance. On January 19, 2023 we received a letter stating that we had failed to meet the closing bid price for the last 30 consecutive business days. On June 8, 2023, we received a letter from Nasdaq advising we had regained compliance with the minimum bid price requirement. On February 14, 2024, we received an additional letter from Nasdaq stating that we had failed to meet the closing bid requirement for the last 30 consecutive business days. If our common stock were to be delisted from Nasdaq and was not eligible for quotation or listing on another market or exchange, trading of our common stock could be conducted only in the over-the-counter market or on an electronic bulletin board established for unlisted securities such as the Pink Sheets or the OTC Bulletin Board. In such event, it could become more difficult to dispose of, or obtain accurate price quotations for, our common stock, and there would likely also be a reduction in our coverage by securities analysts and the news media, which could cause the price of our common stock to decline.
A possible “short squeeze” due to a sudden increase in demand of our common stock that largely exceeds supply may lead to price volatility in our common stock.
Investors may purchase our common stock to hedge existing exposure in our common stock or to speculate on the price of our common stock. Speculation on the price of our common stock may involve long and short exposures. To the extent aggregate short exposure exceeds the number of shares of our common stock available for purchase in the open market, investors with short exposure may have to pay a premium to repurchase our common stock for delivery to lenders of our common stock. Those repurchases may in turn, dramatically increase the price of our common stock until investors with short exposure are able to purchase additional common shares to cover their short position. This is often referred to as a “short squeeze.” A short squeeze could lead to volatile price movements in our common stock that are not directly correlated to the performance or prospects of our Company and once investors purchase the shares of common stock necessary to cover their short position the price of our common stock may decline.
Payment of dividends on our common stock is prohibited unless we have declared and paid (or set apart for payment) full accumulated dividends on the Series A Preferred Stock, which also has a significant liquidation value.
Unless full cumulative dividends on our preferred stock have been, or contemporaneously are, declared and paid or declared and a sum sufficient for the payment thereof is set apart for payment for all past dividend periods, no dividends (other than a dividend in shares of common stock or other shares of stock ranking junior to the Series A Preferred Stock (as defined herein) as to dividends and upon liquidation) may be declared and paid or declared and set apart for payment on our common stock, nor may any shares of common stock be redeemed, purchased or otherwise acquired for any consideration by us. To the extent dividends are not paid on our preferred stock, cumulative dividends accrue as part of the liquidation value of our preferred stock, which has a liquidation value of $10.00 per share at issuance. Dividends on our preferred stock are payable out of amounts legally available therefor at a rate equal to 10.0% per annum per $10.00 of stated liquidation preference per share, or $1.00 per share of our preferred stock per year. Dividends on our preferred stock are only payable in cash. As of December 31, 2021,2023, there were 1,915,637 shares of our Series A Preferred Stock outstanding.
If we fail to pay dividends on our Series A Preferred Stock for six or more consecutive quarters, holders of our Series A Preferred Stock will be entitled to elect two additional directors to our board of directors.
To the extent dividends are not paid on the Series A Preferred Stock in accordance with their terms, cumulative dividends will accrue as part of the liquidation value of the Series A Preferred Stock. Whenever dividends on any shares of Series A Preferred Stock are in arrears for six or more consecutive quarters, then the holders of those shares together with the holders of all other series of preferred stock equal in rank with the Series A Preferred Stock upon which like voting rights have been conferred and are exercisable, will be entitled to vote separately as a class for the election of a total of two additional directors to our board of directors. Holders of our common stock will not be entitled to vote nofor or against such additional directors.
We may not be able to redeem our Series A Preferred Stock upon a Change of Control Triggering Event.
Upon the occurrence of a Change of Control Triggering Event (as such term is defined in the Certificate of Designations of our Series A Preferred Stock), unless we have exercised our option to redeem our preferred stock after September 10, 2024, each holder of our preferred stock will have the right to require us to redeem all or any part of such holder’s preferred stock at a price equal to the liquidation preference of $10.00 per share, plus an amount equal to any accumulated and unpaid dividends up to but excluding the date of payment, but without interest. If we experience a Change of Control Triggering Event, there can be no assurance that we would have sufficient financial resources available to satisfy our obligations to redeem our preferred stock and any indebtedness that may be required to be repaid or repurchased as a result of such event. In addition, we may be unable to redeem our preferred stock upon a Change of Control Triggering Event if such redemption would result in our non-compliance with the financial covenants in the Company Loan Agreements. Our failure to redeem our preferred stock could have material adverse consequences for us and the holders of our preferred stock.
As a smaller reporting company, we are subject to scaled disclosure requirements that may make it more challenging for investors to analyze and compare our results of operations and financial prospects.
Currently, we are a “smaller reporting company,” as defined by Rule 12b-2 of the Exchange Act. As a “smaller reporting company,” we are able to provide simplified executive compensation disclosures in our filings and have certain other decreased disclosure obligations in our filings with the SEC, including being required to provide only two years of audited financial statements in annual reports. Consequently, it may be more challenging for investors to analyze our results of operations and financial prospects.
Furthermore, we are a non-accelerated filer as defined by Rule 12b-2 of the Exchange Act, and, as such, are not required to provide an auditor attestation of management’s assessment of internal control over financial reporting, which is generally required for SEC reporting companies under Section 404(b) of the Sarbanes-Oxley Act. Because we are not required to, and have not, had our auditor provide an attestation of our management’s assessment of internal control over financial reporting, a material weakness in internal controls may remain undetected for a longer period.
If securities or industry analysts do not publish research or reports about our business, or if they issue an adverse or misleading opinion regarding our stock, the price and trading volume of our securities could decline.
The trading market for our securities will be influenced by the research and reports that industry or securities analysts publish about us or our business. We currently have two securities and industry analysts providing research coverage. In the event ifthat any of the analysts who cover us issue an adverse or misleading opinion regarding us, our business model, our intellectual property or our stock performance, or if our clinical trials and operating results fail to meet the expectations of analysts, the price of our securities would likely decline. If one or more of these analysts cease coverage of us or fail to publish reports on us regularly, we could lose visibility in the financial markets, which in turn could cause the price or trading volume of our securities to decline
The protective amendment contained in our Restated Certificate of Incorporation, which is intended to help preserve the value of certain income tax assets, primarily tax net operating loss carryforwards, may have unintended negative effects.
Pursuant to Sections 382 and 383 of the Code, use of our NOLs may be limited by an “ownership change” as defined under Section 382 of the Code and the Treasury Regulations thereunder. In order to protect our significant NOLs, we filed an amendment to our certificate of incorporation (the “Restated Certificate of Incorporation”) (as amended and extended, the “Protective Amendment”) with the Delaware Secretary of State on May 5, 2015. The Protective Amendment was approved by our stockholders at our 2021 Annual Meeting of Stockholders held on October 21, 2021.
The Protective Amendment is designed to assist us in protecting the long-term value of our accumulated NOLs by limiting certain transfers of our common stock. The Protective Amendment’s transfer restrictions generally restrict any direct or indirect transfers of the common stock if the effect would be to increase the direct or indirect ownership of the common stock by any person from less than 4.99% to 4.99% or more of the common stock, or increase the percentage of the common stock owned directly or indirectly by a person owning or deemed to own 4.99% or more of the common stock. Any direct or indirect transfer attempted in violation of the Protective Amendment will be void as of the date of the prohibited transfer as to the purported transferee.
The Protective Amendment also requires any person attempting to become a holder of 4.99% or more of our common stock to seek the approval of our board of directors. This may have an unintended “anti-takeover” effect because our board of directors may be able to prevent any future takeover. Similarly, any limits on the amount of stock that a stockholder may own could have the effect of making it more difficult for stockholders to replace current management. Additionally, because the Protective Amendment may have the effect of restricting a stockholder’s ability to dispose of or acquire our common stock, the liquidity and market value of our common stock might suffer.
Our stockholder rights plan, or “poison pill,” includes terms and conditions which could discourage a takeover or other transaction that stockholders may consider favorable.
On June 2, 2021, stockholders of record at the close of business on that date received a dividend of one right (a “Right”) for each outstanding share of common stock. Each Right entitles the registered holder to purchase one one-thousandth of a share of our Series C Participating Preferred Stock (the “Series C Preferred Stock”, and together with the Series A Preferred Stock, the “Company Preferred Stock”), at a price of $12.00 per one-thousandth of a share of Series C Preferred Stock, subject to adjustment (the “Exercise Price”). The Rights are not exercisable until the Distribution Date referred to below. The description and terms of the Rights are set forth in the Rights Agreement, which has previously been filed as an exhibit to our public reports.
The Rights Agreement imposes a significant penalty upon any person or group that acquires 4.99% or more (but less than 50%) of our then-outstanding common stock without the prior approval of our board of directors. A person or group that acquires shares of our common stock in excess of the applicable threshold, subject to certain limited exceptions, is called an “Acquiring Person.” Any rights held by an Acquiring Person are void and may not be exercised. The Rights will not be exercisable until the earlier of ten days after a public announcement by us that a person or group has become an Acquiring Person and ten business days (or a later date determined by our board of directors) after a person or group begins a tender or an exchange offer that, if completed, would result in that person or group becoming an acquiring person. On the date (if any) that the Rights become exercisable (the “Distribution Date”), each Right would allow its holder to purchase one one-thousandth of a share of Preferred Stock for a purchase price of $12.00. In addition, if a person or group becomes an Acquiring Person after the Distribution Date or already is an Acquiring Person and acquires more shares after the Distribution Date, all holders of Rights, except the Acquiring Person, may exercise their rights to purchase a number of shares of the common stock (in lieu of preferred stock) with a market value of twice the Exercise Price, upon payment of the purchase price.
The Rights will expire on the earliest of (i) June 2, 2024, or such earlier date as of which our board of directors determines that the Rights Agreement is no longer necessary for the preservation of our tax assets, (ii) the time at which the rights are redeemed, (iii) the time at which the rights are exchanged, (iv) the effective time of the repeal of Section 382 of the Code or any successor statute if our board of directors determines that the Rights Agreement is no longer necessary for the preservation of our tax assets, and (v) the first day of our taxable year in which our board determines that no NOLs or other tax assets may be carried forward.
The Rights have certain anti-takeover effects, including potentially discouraging a takeover that stockholders may consider favorable. The Rights will cause substantial dilution to a person or group that attempts to acquire us on terms not approved by the board of directors.
Anti-takeover provisions in our organizational documents and Delaware law may prevent or delay removal of current management or a change in control.
Our Restated Certificate of Incorporation and Bylaws contain provisions that may delay or prevent a change in control, discourage bids at a premium over the market price of our common stock, and adversely affect the market price of our common
stock and the voting and other rights of the holders of our common stock. In addition, as a Delaware corporation, we are subject to Delaware corporate law, including Section 203 of the Delaware General Corporation Law. In general, Section 203 prohibits a Delaware corporation from engaging in any business combination with any interested stockholder for a period of three years following the date that the stockholder became an interested stockholder unless certain specific requirements are met as set forth in Section 203. These provisions, alone or together, could have the effect of deterring or delaying changes in incumbent management, proxy contests or changes in control.
We expect to be limited in our ability to utilize net operating loss carryforwards to reduce our future tax liability as a result of our recent Offering.January 2022 public offering.
Under Section 382 of the Code, if a corporation undergoes an “ownership change,” generally defined as a greater than 50% change (by value) in its equity ownership over a three-year period, the corporation’s ability to use its pre-change NOLs and other pre-change tax attributes (such as research tax credits) to offset its post-change income may be limited. We expect that our recent Offering,the public offering we closed on January 24, 2022 (the “2022 Public Offering”), alone or in conjunction with other changes in our stock ownership that we cannot control, may result in an “ownership change.” We may also experience ownership changes in the future as a result of strategic transactions or partnerships, equity offerings and other shifts in our stock ownership. As a result, if we earn net taxable income, our ability to use our pre-change NOL carryforwards and other deferred tax assets to offset U.S. federal taxable income may be subject to limitations, which could potentially result in increased future tax liability to us. In addition, similar limitations may apply at the state level and there may be periods during which the use of NOL carryforwards is suspended or otherwise limited, which could accelerate or permanently increase state taxes owed.
Risks Related to Our Material Weakness and Restatements
Material weakness in our internal control over financial reporting could have a significant adverse effect on our business and the price of our common stock.
As a public reporting company, we are subject to the rules and regulations established from time to time by the SEC. These rules and regulations require, among other things, that we have, and periodically evaluate, disclosure controls and procedures that are designed to provide reasonable assurance that information required to be disclosed in our Exchange Act reports is recorded, processed, summarized and reported within the time periods specified in the SEC’s rules, regulations and forms, and that such information is accumulated and communicated to our management, including our Chief Executive Officer and Chief Financial Officer, as appropriate, to allow decisions regarding required disclosure. Reporting obligations as a public company are likely to continue to burden our financial and management systems, processes and controls, as well as our personnel.
In addition, as a public company, we are required to document and test our internal control over financial reporting pursuant to Section 404 of the Sarbanes-Oxley Act so that our management can certify as to the effectiveness of our internal control over financial reporting.
In connection with the preparation of our financial statements for 2021, our management identified a material weakness in our internal control over financial reporting as we do not have a sufficient complement of accounting resources to address complex accounting matters across all operating entities and to allow timely completion of financial reporting and accounting activities, including sufficiently precise management review controls. The material weakness did not result in any material identified misstatements to the financial statements, and there were no material changes to previously released financial results.
ITEM 1B.UNRESOLVED STAFF COMMENTS
Not applicable.
ITEM 1C.CYBERSECURITY
Risk Management and Strategy
We identify and address cybersecurity threats and risks related to our business using an interdisciplinaryapproach that includes assessments primarily by our management, IT team and legal department. To defend against, detect and respond to cybersecurity incidents, we employ a multi-layered approach that has been integrated into our overall risk management systems and processes which includes, among other things: conducting proactive privacy and cybersecurity reviews of systems and applications, auditing applicable data policies, conducting employee training, monitoring emerging laws and regulations related to data protection and information security and continuously improving controls and implementing appropriate changes. The cybersecurity-control principles that form the basis of our cybersecurity program are informed by the National Institute of Standards and Technology Cybersecurity Framework. Our management performs an annual review of third-party service providers’ SOC reports to verify appropriate controls are in place.
In 2023, we did not identify any cybersecurity threats that have materially affected or are reasonably likely to materially affect our business strategy, results of operations, or financial condition. However, despite our ongoing efforts, we cannot eliminate all risks from cybersecurity threats, or provide assurances that we have not experienced undetected cybersecurity incidents. Please refer to the risk factor titled “We rely on information technology in our operations, and any material failure, inadequacy, interruption or security failure of that technology could materially harm our business.” in “Risk Factors” in Part I, Item 1A of this Form 10-K for more information on the risks posed to us by cybersecurity threats.
Cybersecurity Governance
Cybersecurity is an important part of our risk management processes and is an area of focus for our board of directors and management. Our board of directors, as a whole, has oversight responsibility for our strategic and operational risks, and ensures that appropriate risk mitigation strategies are implemented by management. Our audit committee assists the board of directors with this responsibility by periodically reviewing and discussing our risk assessment and risk management practices, including cybersecurity risks, with members of our management team, which is responsible for the assessment and management of cybersecurity risks.
In addition, we have retained an external consultant to serve as our internal audit function and to support our cybersecurity risk management and governance practices. Our consultant has substantial experience in cybersecurity risk management and information technology, including security, compliance, systems and programming and reports to our audit committee and our board of directors on any appropriate items.
ITEM 2.PROPERTIES
Effective January 1, 2021, we moved ourOur principal executive offices from Suwanee, GA toare in Old Greenwich, CT,Connecticut, where we have been leasing 1,344lease 2,006 square feet of office space since 2019.space.
On the healthcare side, we still maintain a lease for 7,500 square feet of office space in Suwanee, GA. We also lease a 21,300 square foot facility in Poway, CA that houses our Diagnostic Imaging operations. Our Diagnostic Services segment leases approximately 24 small hub locations in the various states in which we operate. These hubs primarily house our fleet of mobile imaging cameras and vans.
In April 2019, our Investments division (through Star Real Estate, "SRE”“SRE”) acquired three manufacturing facilities in Maine, which it then leased back to KBS in our constructionConstruction segment. These include KBS’included KBS’s 84,800 square foot main production facility in South Paris, ME, as well asMaine and a 92,200 square foot manufacturing facility in Oxford, ME, and a 61,900 square foot manufacturingMaine. We sold our Waterford, Maine production facility in Waterford, ME.June 2023. SeeNote 5. Supplementary Balance Sheet Information for further details.
We utilize threefour additional facilities in our construction businesses, related specifically to EBGL. In October 2021, we extended two existing leases, a 10,800 square foot office/sales/showroom space in Oakdale, MNMinnesota and a 34,200 square foot production facility in Prescott, WI.Wisconsin. In addition, we entered into a new lease in October 2021 for 22,800 square feet of lumberyard/warehouse space in Hudson, WI.Wisconsin. With the BLL acquisition in late 2023, we acquired a fourth facility, a 22,300 square foot lumberyard/warehouse/showroom space in Big Lake, Minnesota. See Note 16. Mergers and Acquisitions for further information.
We believe that we have adequate space for our anticipated needs and that suitable additional space will be available at commercially reasonable prices as needed.
ITEM 3. LEGAL PROCEEDINGS
See Note 9. Commitments and Contingencies, within the notes to our accompanying consolidated financial statements for a summary of any legal proceedings.
ITEM 4.MINE SAFETY DISCLOSURES
Not applicable.
PART II
ITEM 5.MARKET FOR REGISTRANT’S COMMON EQUITY, RELATED STOCKHOLDER MATTERS AND ISSUER PURCHASES OF EQUITY SECURITIES
Market Information
Our common stock and preferred stock are traded on the NASDAQNasdaq Global Market under the symbols “STRR” and “STRRP”, respectively.
As of March 28, 20227, 2024 there were approximately 159168 holders of record of our common stock. We believe that the number of beneficial owners is substantially greater than the number of record holders because a large portion of our common stock is held of record through brokerage firms in “street name.”
Sales of Unregistered Securities
None.
Issuer Purchases of Equity Securities
| | | | | | | | | | | | | | | | | | | | | | | | | | |
| Period | | Total Number of
Shares Purchased
During the Period | | Average Price
Paid Per Share
for Period
Presented | | Total Cumulative
Number of
Shares Purchased
as Part of Publicly
Announced Plan (1) | | Maximum Number of Shares
that May Yet
Be Purchased
Under the Plan (2) |
October 1, 20212023 – October 31, 20212023 | | — | | | — | | | — | | | 200,000 | |
November 1, 20212023 – November 30, 20212023 | | — | | | — | | | — | | | 200,000 | |
December 1, 20212023 – December 31, 20212023 | | — | | | — | | | — | | | 200,000 | |
| Total | | — | | | — | | | — | | | 200,000 | |
(1)On October 31, 2018, our board of directors approved a stock repurchase program that will enable us to repurchase up to 200,000 shares of our common stock from time to time in market or private transactions (the “2018 Buyback Program”). Under the 2018 Buyback Program, we may purchase shares of our common stock through various means, including open market transactions in compliance with Rule 10b-18 under the Exchange Act, privately negotiated transactions, tender offers or any combination thereof. The number of shares repurchased and the timing of repurchases will depend on a number of factors, including, but not limited to, stock price, trading volume and general market conditions, along with our working capital requirements, general business conditions and other factors. The 2018 Buyback Program has no time limit and may be modified, suspended or terminated at any time by our board of directors. Repurchases under the 2018 Buyback Program will be funded from our existing cash and cash equivalents or future cash flow and equity or debt financings.
(2)As of December 31, 2021,2023, there were 0no cumulative shares purchased as part of the 2018 Buyback Program and 200,000 shares that may yet be purchased under the 2018 Buyback Program.
Securities Authorized for Issuance Under Equity Compensation Plans
See Item 12. “Security Ownership of Certain Beneficial Owners and Management Related Stockholders Matters” for information with respect to our compensation plans under which equity securities are authorized for issuance.
ITEM 6.[RESERVED]
ITEM 7.MANAGEMENT’S DISCUSSION AND ANALYSIS OF FINANCIAL CONDITION AND RESULTS OF OPERATIONS
The following discussion contains forward-looking statements that involve risks and uncertainties. Our actual results could differ materially from those anticipated in these forward-looking statements as a result of various factors, including those set forth previously under the caption “Risk Factors.” This Management’s Discussion and Analysis of Financial Condition and Results of Operations should be read in conjunction with our audited consolidated financial statements and related notes included elsewhere in this report.
Overview
Star Equity has operated asis a multi-industry holding company since the acquisition of ATRM Holdings, Inc. (“ATRM”) in September 2019. With that merger, we added two construction businesses and one investment business to what historically had been a pure-play healthcare company. Today, Star Equity is a diversified holding company with two divisions. Our operating businesses in two key industry sectors of the economy, Healthcare and Construction.
Our Healthcare division which operates as Digirad Health, Inc., (“Digirad Health”) provides products and servicesfocuses in the area of nuclear medical imaging with a focus on cardiac health. Digirad Health operates across the United States. The Healthcare business comprises two businesses, Diagnostic Services, which offers imaging services to healthcare providers using a fleet of our proprietary solid-state gamma cameras and Diagnostic Imaging, which manufactures, distributes, and maintains our proprietary solid-state gamma cameras.Construction industry. In addition, we have an Investments division.
Our Construction division is currently made up of three operating businesses,businesses: KBS, Builders, Inc. (“KBS”), EdgeBuilder, Inc., and Glenbrook, Building Supply, Inc—with the latter two managed together and referred to jointly as “EBGL”. KBS is based in Maine and manufactures modular buildings, for installationtypically in the single and multi-family residential segments, servicing principally in the New England market. EBGL is based in the Minneapolis-Saint Paul area and principally serves the Upper Midwest.Midwest region. Together, the EBGL businesses manufacture and deliver structural wall panels, primarily for multi-family residential buildings, and other engineered wood-based products as well asproducts. We distribute building materials from two lumberyard locations primarily tofocused on professional builder customers.
Currently, ourOur Investments division is an internally focused unit directly supervised by Star Equity management. This entity currently holds and manages our corporate-owned real estate, which currently includes our threeincluding two manufacturing facilities in Maine that are leased to KBS as well as anyand one manufacturing facility in Minnesota that is leased to Glenbrook. The Investments division also manages internally-funded, concentrated minority investments we make in a number of public companies. It also holds and manages a $7 million promissory note and a $6 million private companies.equity stake in TTG Parent LLC, the parent entity of TTG Imaging Solutions, LLC. We acquired these interests in May 2023 as a result of the sale of Digirad Health (see Note 3. Discontinued Operations for further information).
Current Market Conditions
Since the second quarter of 2020, navigating the COVID-19 pandemic has proved to be challenging for the vast majority of businesses across many sectors of the economy. As the vaccine rollout expanded through the second quarter of 2021, we have seen our businesses return substantially to pre-COVID levels. We believe the uncertainty surrounding the pandemic decreased as we are through the fourth quarter of 2021. On the Healthcare side, we see imaging volume increase due to an increase in camera sales, we expect that we will continue to recover from the impact of COVID. In Construction, we expect that continued recovery in employment and a strong housing market will underpin a period of secular growth.
The target market for our Healthcare products and services is comprised of cardiologists, internal medicine physicians, family practice physicians, hospitals, integrated delivery networks, and federal institutions in the United States that perform or could perform a diagnostic imaging procedure or have interest in purchasing diagnostic imaging products. Our diagnostic services businesses currently operate in approximately 25 states. The overriding challenge during 2020 was the drop in imaging volume due to the COVID-19 pandemic. During the twelve months ended December 31, 2021, we have seen a return to a more normal pre-COVID volume of imaging.
The target customers for our Construction division include professional home builders, general contractors, project owners, developers, and design firms. While housingDespite a higher interest rate environment, we are continuing to see significant demand and home improvement activity continues to be very strong, supply chain disruptions caused by the COVID-19 pandemic led to a historic increasefor our products, although there have been some delays in building materials prices during the first half of 2021. While our revenuesexecution as customers finalize project financing. We have benefited from both the robust activity in the housing sector and from price increases that we havehaving implemented our bottom line was negatively impacted in 2021 by this rapid and historic price increase in building materials. While ourboth price increases and changes made tomargin protection language in our contract terms began to have a positive impact to our bottom line in the second half of 2021, we believe they will havecontracts and this had a significantly positive effect on our profitability in 2022.
2023. We noted slower business activity in the second half of 2023 and related lower revenues, but believe this slowdown is temporary. Our sales pipelines continue to indicate strong potential demand for our services, but we can give no assurances as to our ability to compete for these opportunities, or the periods during which successfully negotiated projects will be completed.Trends and Drivers
The market for diagnostic services and products is highly competitive. Our business, which is focused primarily on the private practice and hospital sectors, continues to face uncertainty in the demand for diagnostic services and imaging equipment, which we believe is due in part to the impactModular Building Institute has estimated that permanent modular construction increased as a percentage of the Deficit Reduction Act onconstruction industry from 2.14% in 2015 to 6.03% as of the reimbursement environment and the 2010 Healthcare Reform laws, as well as general uncertaintyend of 2022. In turn, in overall healthcare and legislative changes in healthcare, such as the Affordable Care Act. These challenges have impacted, and will likely continue to impact, our operations. We believe that the principal competitive factors in our market include budget availability for our capital equipment, qualifications for reimbursement, pricing, ease-of-use, reliability, and mobility. We have addressed, and will continue to address, these market pressures by modifying our healthcare business models, and by assisting our Healthcare customers in complying with new regulations and requirements.
In our Construction division, we continue to see a greater adoptionacceptance of offsite or prefab construction in single-family and multi-family residential building projects in our target market. Our modular units and structural wall panels offer builders a number of benefits over traditional onsite or “stick built” construction. These include shorter time to market, higher quality, reduced waste, and potential cost savings, among others. 3D BIMmodeling software modeling and developments in engineered wood products offersoffer greater design flexibility for higher-end applications. The need for more affordable housing solutions also presents a great opportunityopportunities for the continued growth of factory built housing.
Risks arising from global economic instability and conflicts, wars, and health crises could impact our business. In addition the inflation caused by such events may impact demand for our products and services and our cost to provide products and services.
COVID-19 PandemicDiscontinued Operations
As discussed in detail in Note 3. Discontinued Operations, we completed the sale of Digirad Health on May 4, 2023, for total aggregate consideration of $40 million, comprised of $27 million in cash, a $7 million promissory note (“Seller Note”), and $6 million in rollover equity in the parent entity of TTG. We continuedeemed the disposition of Digirad Health, which was our entire Healthcare business unit, to sustain recovery from the economic effectsrepresent a strategic shift that will have a major effect on our operations and financial results. As of the COVID-19 pandemic. During the twelve months ended December 31, 2021, we had a $9.3 million increase in Healthcare division revenue, and a $19.1 million increase in Construction division revenue, as compared to the same perioddate of the prior year. Theaccompanying consolidated financial statements, the results of operations of the Healthcare division continued to rebound to more normal levels versus last yearbusiness unit represent “discontinued operations” in accordance with revenue increasing 18.9% forU.S. Generally Accepted Accounting Practices (“GAAP”) (ASC 205-20-45-1B). Therefore, the twelve months ended 2021. Our Construction division grew revenue by 66.2% due to increased output at both KBS and EBGL coupled with pricing increases associated with higher raw materials costs. Nevertheless, the current COVID-19 pandemic continues to impact worldwide economic activity, and the extent to which the COVID-19 pandemic will impact our business will depend on future developments that are highly uncertain and cannot be predicted at this time.
Discontinued Operations
The DMS Sale Transaction was completed on March 31, 2021, for $18.75 million in cash. After certain adjustments, including a working capital adjustment, we received an immaterial net escrow settlement in January, 2022. Additionally, Mobile Healthcare’s assets and liabilities, as well as the earnings, of December 31, 2020the discontinued operation are presented separately presented as heldin the accompanying consolidated financial statements for sale onall periods presented. Unless otherwise noted, discussion
within the audited Consolidated Balance Sheets.notes to the consolidated financial statements and this Management’s Discussion and Analysis of Financial Condition and Results of Operations relates to continuing operations.
Goodwill and long-lived asset valuationValuation
We review goodwill for impairment on an annual basis during the fourth quarter, and when events or changes in circumstances indicate that a reduction in the carrying value may not be recoverable. We elected to by-pass the qualitative assessment for all reporting units to estimate whether it is more likely than not that the fair value of each reporting unit was less than its carrying amount. We performedrecognize an impairment analysis by quantitatively comparing the fair value of the reporting unit to the carrying value of the reporting unit, including goodwill. An impairment charge for goodwill is recognized for the amount by whichif we determine that the carrying value of the reporting unit exceeds its fair value and such loss should not exceed the total goodwill allocated to the reporting unit. No impairment of goodwill was recorded in 2023.
We also review long-lived assets for impairment when events or changes in circumstances indicate that a reduction in the carrying value may not be recoverable. There are numerousCertain factors that may cause the fair value of a reporting unit to fall below its carrying amount and/or that may cause the value of long-lived assets to not be recoverable, whichrecoverable. This could lead to the measurement and recognition of long-lived asset impairment charges.charges and may cause impairment. These factors include, but are not limited to, significant negative variances between actual and expected financial results, lowered expectations of future financial results, failure to realize anticipated synergies from acquisitions, adverse changes in the business climate, and the loss of key personnel. As of December 31, 2021,2023, we performed qualitative trigger events analysis and concluded that ifanalyses designed to conclude whether we are notwere able to achieve projected performance levels future impairments could be possible, which could negatively impact our earnings. Based on the results of this qualitative assessment, weand determined that it is more likely than not that long-lived assets were not impaired.
See Note 7. Goodwill, within the notes to our accompanying consolidated financial statements for further information.
20212023 Financial Highlights
2023 Revenues were $106.6$45.8 million, for the year ended December 31, 2021.representing a decrease of $11.4 million or 19.9% versus 2022 Revenues of $57.1 million. This decrease was driven by lower revenues at both KBS and EBGL related to slower business activity, which we believe is temporary.
2023 Gross profit was $11.9 million, representing a decrease of $0.4 million or 3.6% versus 2022 Gross profit of $12.4 million. This decrease was related to lower 2023 revenues and was mitigated by our ability to sustain pricing, while benefiting from commodity and input price stability.
2023 Operating expenses were $16.3 million, representing an increase of $28.4$0.4 million or 36.3%, compared to the prior year due to the following:
•2% versus 2022 total Operating expenses of $15.9 million. The increase of $0.4 million was mainly due to $19.1 million revenue generateddriven by the Construction divisionincreased legal and $9.3 million by the Healthcare division.
•Diagnostic Imaging segment revenue increased $4.8 million, or 48.4%, primarily due to an increase in the number of cameras sold, reflecting the continuation of the division’s recovery from the COVID-19 pandemic-related downturn.
•Diagnostic Services segment revenue increased $4.5 million, or 11.5%, primarily due to an increase in scanning service performed, reflecting the continuation of the division’s recovery from the COVID-19 pandemic-related downturn.
Gross profit increased by $1.3 million, or 9.0%, compared to the prior year, mainly due to a $2.3 million increase in the Healthcare division as a result of the continuation of the division’s recovery from the COVID-19 pandemic-related downturn, offset by a $1.0 million decrease in Construction division gross profit due to an adverse impact of a rapid and historic rise in raw materials costs in the first half of the year. For the Construction division, we significantly increased pricing levels during 2021 to offset these higher input costs and expect to continue to see further benefit from these increases on our margins in 2022.
Total operatingoutside services expenses increased $5.6 million, or 26.6%, for the year ended December 31, 2021 compared to the prior year, primarily due to additional $4.0 million sales, marketing and general and administrative expenses. Additionally, there was a $2.9 million increase related to an impairment of goodwill from the Construction division, which was offset by a $0.8 million gain on the sale of MDOS.Digirad Health and our Investments division-related activities.
2023 Loss from continuing operations, net of income taxes, for the year ended December 31, 2021, was $8.9$1.9 million which is an increase of $3.6 millionreflects improved results compared to our loss2022 Loss from continuing operations, net of income taxestax, of $5.3 million during the prior year. This was predominately$5.8 million. The improved results were primarily driven by an additional net lossincreased interest and other income resulting from our strong cash position and gains realized on certain purchases and sales, and the bargain purchase gain we recognized resulting from the October 2023 acquisition of BLL of approximately $1.2 million (see Note 16. Mergers and Acquisitions for further information). These results were partially offset by a decrease in the Construction divisiongross profit of $0.5 million from our operating segments and increased corporatehigher overall Operating expenses primarily related to increases in IT, outside services, and an impairment of goodwill during the year ended December 31, 2021.
For the year ended December 31, 2021, Diagnostic Services operated 81 nuclear gamma cameras and 46 ultrasound imaging systems. We measure efficiency by tracking system utilization, which is based on the percentage of days that our cameras, equipment and imaging systems are used to deliver services to customers out of the total number of days that they are available to deliver such services. System utilization for Diagnostic Services for the year ended December 31, 2021, was 57% compared to 59% of the prior year.$0.4 million.
Use of EBITDA (Non-GAAP measure)
Management believes earnings before taxes, interest, depreciation, and amortization (“EBITDA”) is a meaningful indicator of the Company’s performance that provides useful information to investors regarding the Company’s financial condition and results of operations. EBITDA is also considered by management as an indicator of operating performance and the most comparable measure across the regions in which we operate. Management also uses this measurement to evaluate capital needs and working capital requirements. EBITDA is a non-Generally Accepted Accounting PrincipalsPrinciples (“non-GAAP”) financial measure that is not intended to be considered in isolation from, as substitute for, or as superior to, the corresponding financial measure prepared in accordance with GAAP or as a measure of the Company’s profitability. Because of these and other limitations, EBITDA should be considered along with GAAP based financial performance measures, including operating income or net income prepared in accordance with GAAP. EBITDA is derived from net income (loss) income adjusted for the provision for (benefit from) income taxes, interest expense (income), and depreciation and amortization.
The reconciliation of EBITDA from continuing operations to the most directly comparable GAAP financial measure is provided in the table below:
| | Year Ended December 31, |
| | Year Ended December 31, | | | | Year Ended December 31, |
| $ in thousands | $ in thousands | | 2021 | | 2020 | $ in thousands | | 2023 | | 2022 |
| Net loss | | $ | (2,983) | | | $ | (6,457) | |
| Net income (loss) | |
| Adjustment for income (loss) from discontinued operations, net of income taxes | Adjustment for income (loss) from discontinued operations, net of income taxes | | 5,948 | | | (1,172) | |
| Loss from continuing operations | Loss from continuing operations | | (8,931) | | | (5,285) | |
| Adjustments to loss from continuing operations | Adjustments to loss from continuing operations | |
| Depreciation and amortization | Depreciation and amortization | | 3,472 | | | 3,936 | |
| Depreciation and amortization | |
| Depreciation and amortization | |
| Interest expense, net | Interest expense, net | | 905 | | | 1,292 | |
| Provision for income taxes | Provision for income taxes | | 60 | | | 129 | |
| Total adjustments from loss from continuing operations to EBITDA | | 4,437 | | | 5,357 | |
| Total adjustments from income (loss) from continuing operations to EBITDA | |
| EBITDA from continuing operations | EBITDA from continuing operations | | $ | (4,494) | | | $ | 72 | |
Results of Operations
Comparison of Years Ended December 31, 20212023 and 20202022
The following table sets forth our results from operations for the years ended December 31, 20212023 and 20202022 (in thousands):
| | | | | | | | | | | | | | | | | | | | | | | | | | | | | | | | | | | | | | |
| | Year ended December 31, | | Change from Prior Year |
| | 2021 | | % of
Revenues | | 2020 | | % of
Revenues * | | Dollars | | Percent |
| Total revenues | | $ | 106,559 | | | 100.0 | % | | $ | 78,163 | | | 100.0 | % | | $ | 28,396 | | | 36.3 | % |
| Total cost of revenues | | 91,319 | | | 85.7 | % | | 64,176 | | | 82.1 | % | | 27,143 | | | 42.3 | % |
| Gross profit | | 15,240 | | | 14.3 | % | | 13,987 | | | 17.9 | % | | 1,253 | | | 9.0 | % |
| Operating expenses: | | | | | | | | | | | | |
| Selling, general and administrative | | 22,595 | | | 21.2 | % | | 18,635 | | | 23.8 | % | | 3,960 | | | 21.3 | % |
| Amortization of intangible assets | | 1,728 | | | 1.6 | % | | 2,124 | | | 2.7 | % | | (396) | | | (18.6) | % |
| Goodwill impairment | | 3,359 | | | 3.2 | % | | 436 | | | 0.6 | % | | 2,923 | | | 670.4 | % |
| Gain on sale of MDOS | | (847) | | | (0.8) | % | | — | | | — | % | | (847) | | | N/M |
| Total operating expenses | | 26,835 | | | 25.2 | % | | 21,195 | | | 27.1 | % | | 5,640 | | | 26.6 | % |
| Loss from continuing operations | | (11,595) | | | (10.9) | % | | (7,208) | | | (9.2) | % | | (4,387) | | | 60.9 | % |
| Other (expenses) income | | (550) | | | (0.5) | % | | 874 | | | 1.1 | % | | (1,424) | | | (162.9) | % |
| Interest expense, net | | (905) | | | (0.8) | % | | (1,292) | | | (1.7) | % | | 387 | | | (30.0) | % |
| Gain on forgiveness of PPP loans | | 4,179 | | | 3.9 | % | | 2,470 | | | 3.2 | % | | 1,709 | | | 69.2 | % |
| Total other income | | 2,724 | | | 2.6 | % | | 2,052 | | | 2.6 | % | | 672 | | | 32.7 | % |
| Loss from continuing operations before income taxes | | (8,871) | | | (8.3) | % | | (5,156) | | | (6.6) | % | | (3,715) | | | 72.1 | % |
| Income tax provision | | (60) | | | (0.1) | % | | (129) | | | (0.2) | % | | 69 | | | (53.5) | % |
| Loss from continuing operations, net of income taxes | | (8,931) | | | (8.4) | % | | (5,285) | | | (6.8) | % | | (3,646) | | | 69.0 | % |
| Income (loss) from discontinued operations, net of income taxes | | 5,948 | | | 5.6 | % | | (1,172) | | | (1.5) | % | | 7,120 | | | (607.5) | % |
| Net loss | | $ | (2,983) | | | (2.8) | % | | $ | (6,457) | | | (8.3) | % | | $ | 3,474 | | | (53.8) | % |
N/M - Not meaningful | | | | | | | | | | | | | | | | | | | | | | | | | | | | | | | | | | | | | | |
| | Year ended December 31, | | Change from Prior Year |
| | 2023 | | % of
Revenues | | 2022 | | % of
Revenues * | | Dollars | | Percent |
| Total revenues | | $ | 45,785 | | | 100.0 | % | | $ | 57,149 | | | 100.0 | % | | $ | (11,364) | | | (19.9) | % |
| Total cost of revenues | | 33,859 | | | 74.0 | % | | 44,779 | | | 78.4 | % | | (10,920) | | | (24.4) | % |
| Gross profit | | 11,926 | | | 26.0 | % | | 12,370 | | | 21.6 | % | | (444) | | | (3.6) | % |
| Operating expenses: | | | | | | | | | | | | |
| Selling, general and administrative | | 14,538 | | | 31.8 | % | | 14,195 | | | 24.8 | % | | 343 | | | 2.4 | % |
| Amortization of intangible assets | | 1,734 | | | 3.8 | % | | 1,719 | | | 3.0 | % | | 15 | | | 0.9 | % |
| | | | | | | | | | | | |
| | | | | | | | | | | | |
| Total operating expenses | | 16,272 | | | 35.5 | % | | 15,914 | | | 27.8 | % | | 358 | | | 2.2 | % |
| Net income (loss) from continuing operations | | (4,346) | | | (9.5) | % | | (3,544) | | | (6.2) | % | | (802) | | | 22.6 | % |
| Other (expenses) income | | 852 | | | 1.9 | % | | (1,336) | | | (2.3) | % | | 2,188 | | | (163.8) | % |
| Interest expense, net | | 973 | | | 2.1 | % | | (564) | | | (1.0) | % | | 1,537 | | | (272.5) | % |
| | | | | | | | | | | | |
| Total other income (loss) | | 1,825 | | | 4.0 | % | | (1,900) | | | (3.3) | % | | 3,725 | | | (196.1) | % |
| Income (loss) from continuing operations before income taxes | | (2,521) | | | (5.5) | % | | (5,444) | | | (9.5) | % | | 2,923 | | | (53.7) | % |
| Income tax benefit (provision) | | 614 | | | 1.3 | % | | (383) | | | (0.7) | % | | 997 | | | (260.3) | % |
| Income (loss) from continuing operations, net of income taxes | | (1,907) | | | (4.2) | % | | (5,827) | | | (10.2) | % | | 3,920 | | | (67.3) | % |
| Income (loss) from discontinued operations, net of income taxes | | 27,039 | | | 59.1 | % | | 575 | | | 1.0 | % | | 26,464 | | | 4,602.4 | % |
| Net income (loss) | | $ | 25,132 | | | 54.9 | % | | $ | (5,252) | | | (9.2) | % | | $ | 30,384 | | | (578.5) | % |
*Percentage may not add due to rounding
Revenues
Healthcare
Healthcare revenue by segment is summarized as follows (in thousands):
| | | | | | | | | | | | | | | | | | | | | | | | | | |
| | Year Ended December 31, |
| | 2021 | | 2020 | | $ Change | | % Change |
| Diagnostic Services | | $ | 43,765 | | | $ | 39,267 | | | $ | 4,498 | | | 11.5 | % |
| Diagnostic Imaging | | 14,791 | | | 9,965 | | | 4,826 | | | 48.4 | % |
| Total Healthcare Revenue | | $ | 58,556 | | | $ | 49,232 | | | $ | 9,324 | | | 18.9 | % |
Diagnostic Services revenue increased 11.5% compared to the prior year same period due to an increase in revenue from several large select contracts. Healthcare providers have reopened for onsite visits and more normal operations.
The 48.4% increase in Diagnostic Imaging revenue is due to higher number of cameras sold compared to the prior year same period.
Construction
Construction revenue is summarized as follows (in thousands):
| | | | | | | | | | | | | | | | | | | | | | | | | | |
| | Year Ended December 31, |
| | 2021 | | 2020 | | $ Change | | % Change |
| Construction | | $ | 48,003 | | | $ | 28,879 | | | $ | 19,124 | | | 66.2 | % |
| Total Construction Revenue | | $ | 48,003 | | | $ | 28,879 | | | $ | 19,124 | | | 66.2 | % |
The 66.2% increase in revenue for the Construction division was predominately due to increased pricing and number of contracts sold in both residential and commercial projects at KBS and EBGL businesses.
Investments
Investments revenue is summarized as follows (in thousands):
| | | | | | | | | | | | | | | | | | | | | | | | | | |
| | Year Ended December 31, |
| | 2021 | | 2020 | | $ Change | | % Change |
| Investments | | $ | — | | | $ | 52 | | | $ | (52) | | | (100.0) | % |
| Total Investments | | $ | — | | | $ | 52 | | | $ | (52) | | | (100.0) | % |
The decrease in investments revenue was due to the wind down of investment vehicles from Lone Star Value Management, LLC (“LSVM”).
Gross Profit
Healthcare Gross Profit
Healthcare gross profit is summarized as follows (in thousands):
| | | | | | | | | | | | | | | | | | | | |
| | Year Ended December 31, |
| | 2021 | | 2020 | | % Change |
| Diagnostic Services gross profit | | $ | 7,364 | | | $ | 6,758 | | | 9.0 | % |
| Diagnostic Services gross margin | | 16.8 | % | | 17.2 | % | | |
| | | | | | |
| Diagnostic Imaging gross profit | | 5,095 | | | 3,391 | | | 50.3 | % |
| Diagnostic Imaging gross margin | | 34.4 | % | | 34.0 | % | | |
| | | | | | |
| Total Healthcare gross profit | | $ | 12,459 | | | $ | 10,149 | | | 22.8 | % |
| Total Healthcare gross margin | | 21.3 | % | | 20.6 | % | | |
The slight decrease in Diagnostic Services gross margin percentage was mainly due to an increase in raw materials costs. | | | | | | | | | | | | | | | | | | | | | | | | | | |
| | Year Ended December 31, |
| | 2023 | | 2022 | | $ Change | | % Change |
| Construction Revenue | | $ | 45,785 | | | $ | 57,149 | | | $ | (11,364) | | | (19.9) | % |
The increase in Diagnostic Imaging gross margin percentage was mainlyConstruction revenue decreased 19.9% primarily due to favorable product mixlower revenues at KBS and EBGL on large commercial projects. Slower business activity due to economic headwinds such as higher interest rates was a predominant driver. We believe the effect of newthis on our revenues is temporary as our backlog and used cameras sold throughout the year, compared to the prior year.sales pipeline remain strong despite these economic headwinds.
Construction Gross Profit
Construction gross profit is summarized as follows (in thousands):
| | Year Ended December 31, |
| 2021 | | 2020 | | % Change |
| Construction gross profit | | $ | 3,008 | | | $ | 4,047 | | | (25.7) | % |
| | Year Ended December 31, | | | | Year Ended December 31, |
| | 2023 | | | | 2023 | | 2022 | | % Change |
| Construction gross profit (loss) | | Construction gross profit (loss) | | $ | 12,154 | | | $ | 12,660 | | | (4.0) | % |
| Construction gross margin | Construction gross margin | | 6.3 | % | | 14.0 | % | | |
The decrease in Construction gross profit and gross profit percentage were predominatelywas due to the adverse impact of a rapiddecreases in revenue at KBS and historic rise in raw materials costs. WeEBGL for large commercial projects. However, we have significantly increased prices during 2021 to offset these higher input costs. Our backlogcosts and sales pipeline remain at record levels.have seen an improvement in our gross margin percentage in 2023.
Investments Gross Loss
Investments gross loss is summarized as follows (in thousands):
| | | | | | | | | | | | | | | | | | | | |
| | Year Ended December 31, |
| | 2021 | | 2020 | | % Change |
| Investments gross loss | | $ | (227) | | | $ | (209) | | | 8.6 | % |
| | | | | | |
| | | | | | | | | | | | | | | | | | | | |
| | Year Ended December 31, |
| | 2023 | | 2022 | | % Change |
| Investments gross profit (loss) | | $ | (228) | | | $ | (290) | | | 21.4 | % |
| | | | | | |
The gross loss relates to depreciation expense associated with the three manufacturing facilities owned by the Company. As of December 31, 2023, there was a decrease in total gross loss due to a decrease in depreciation expense. In October 2023, the Company acquired in April 2019.a manufacturing facility as part of the BLL acquisition. In June 2023, we sold one of our manufacturing facilities.
Operating Expenses
Operating expenses are summarized as follows (in thousands):
| | | | | | | | | | | | | | | | | | | | | | | | | | | | | | | | | | | | | | |
| | Year Ended December 31, | | Percent of Revenues |
| | 2021 | | 2020 | | $ Change | | % Change | | 2021 | | 2020 |
| Selling, general and administrative | | $ | 22,595 | | | $ | 18,635 | | | $ | 3,960 | | | 21.3 | % | | 21.2 | % | | 23.8 | % |
| Amortization of intangible assets | | 1,728 | | | 2,124 | | | (396) | | | (18.6) | % | | 1.6 | % | | 2.7 | % |
| Goodwill impairment | | 3,359 | | | 436 | | | 2,923 | | | 670.4 | % | | 3.2 | % | | 0.6 | % |
| Gain on sale of MDOS | | (847) | | | — | | | (847) | | | N/M | | (0.8) | % | | — | % |
| Total operating expenses | | $ | 26,835 | | | $ | 21,195 | | | $ | 5,640 | | | 26.6 | % | | 25.2 | % | | 27.1 | % |
N/M - Not meaningful
| | | | | | | | | | | | | | | | | | | | | | | | | | | | | | | | | | | | | | |
| | Year Ended December 31, | | Percent of Revenues |
| | 2023 | | 2022 | | $ Change | | % Change | | 2023 | | 2022 |
| Selling, general and administrative | | $ | 14,538 | | | $ | 14,195 | | | $ | 343 | | | 2.4 | % | | 31.8 | % | | 24.8 | % |
| Amortization of intangible assets | | 1,734 | | | 1,719 | | | 15 | | | 0.9 | % | | 3.8 | % | | 3.0 | % |
| | | | | | | | | | | | |
| | | | | | | | | | | | |
| Total operating expenses | | $ | 16,272 | | | $ | 15,914 | | | $ | 358 | | | 2.2 | % | | 35.5 | % | | 27.8 | % |
On a consolidated basis, there was a $4.0 million increase in sales,total operating expenses increased by $0.4 million. Sales, general and administrative expenses (“SG&A”). Most of the increaseincreased by $0.3 million. This was primarily associated with a $1.1 million increase in headcount at corporate, a $1.7 million increase indue to increased legal and outside services expenses related to the Construction headcountssale of Digirad Health and commissions, and $1.3 million directly associated with a write-off of capitalized software implementation costs. However, SG&A asour Investments division-related activities. As a percentage of revenue, decreasedSales, general and administrative expenses increased to 21.2% of revenue,31.8%, versus 23.8%24.8% in the prior year period.
Goodwill non-cash impairment charges increased by $2.9 million compared to the prior year, primarily as a result of an impairment recorded during the fourth quarter of 2021 in our KBS reporting unit. See Note 7. Goodwill, within the notes to our accompanying consolidated financial statements for further information.
Other Income (Expense)
Total other income (expense) is summarized as follows (in thousands):
| | | | | | | | | | | | | | |
| | Year Ended December 31, |
| | 2021 | | 2020 |
| Other (expense) income | | $ | (550) | | | $ | 874 | |
| Interest expense, net | | (905) | | | (1,292) | |
| Gain on forgiveness of PPP loans | | 4,179 | | | 2,470 | |
| Total other income | | $ | 2,724 | | | $ | 2,052 | |
| | | | | | | | | | | | | | |
| | Year Ended December 31, |
| | 2023 | | 2022 |
| Other income (expense) | | $ | 852 | | | $ | (1,336) | |
| Interest income (expense), net | | 973 | | | (564) | |
| | | | |
| Total other income (expense) | | $ | 1,825 | | | $ | (1,900) | |
Other income (expense) for the years ended December 31, 2023 and 2022 improved principally due to unrealized gains from available for sale securities recorded in our Investments division, the gain on the sale of our Waterford, Maine facility and a bargain purchase gain of $1.2 million we realized as part of the BLL purchase which is discussed in more detail in Note 16. Mergers and Acquisitions.
Interest income (expense), net, for the year ended December 31, 20212023 improved substantially compared to 2022 due to our cash position and 2020 are predominantly comprisedthe Seller Note acquired as a result of $4.2 million and $2.5 million, respectively,the sale of Digirad Health, as well as lower average debt balances in Paycheck Protection Program (“PPP”) loan forgiveness2023 which resulted in part from the Healthcare and Construction businesses.sale of Digirad Health. See Note 5. Supplementary Balance Sheet Information for further information.
Income Tax (Expense) Benefit
Intraperiod allocation rules require us to allocate our provision for income taxes between continuing operations and other categories or comprehensive income (loss) such as discontinued operations. During the twelve months ended December 31, 2021,2023 and 2020,2022, we recorded a tax provision of $0.1 million$614 thousand and $0.1 million were recorded, in both years$383 thousand, respectively. For the yearyears ended December 31, 2021,2023 and 2022, we recorded a tax expense of $79$693 thousand to discontinued operations. For the year ended December 31, 2020, we recordedand a tax benefit of $22$209 thousand, torespectively, for discontinued operations.
See Note 12. Income Taxes, within the notes to our accompanying consolidated financial statements for further information.
LossNet income (loss) from Discontinued Operations
As described in Note 3. Discontinued Operations, within the notes to our accompanying consolidated financial statements, the results of our Mobile Healthcare reportable segment have been reported as discontinued operations for all periods presented.
Liquidity and Capital Resources
Overview
Cash Flows from Operating Activities
For the year ended December 31, 2021,2023, net cash used inprovided by operating activities, including cash provided by discontinued operations, was $6.5$2.7 million, as compared to $5.0$3.9 million in 2020, resulting in an increase in net cash used in 2022. The improvement in cash flow from operating activities of $1.5 million. The increase in net cash used in operating activities wasis attributable to net loss from operationshigher margins and negative impact on net working capital changes.strong collections at our Construction Division.
Cash Flows from Investing Activities
For the year ended December 31, 2021,2023, net cash provided by investing activities, including cash provided by discontinued operations, was $17.8$16.2 million, as compared to $1.3 million of net cash used byin investing activities of $5.1 million in 2020. The $19.1 million increase in net2022. 2023 cash provided by investing activities was attributable toprincipally consists of cash received from the sale of our Healthcare division after paying down related debt of $19.7 million and proceeds from the sale of discontinued operationsproperty and equipment (primarily our Waterford property) of $18.8$1.2 million. This was partially offset by cash paid for the acquisition of BLL of $2.8 million and cash paid for investments of $1.5 million as we continued to expand our investments portfolio. The 2022 investing activities were primarily attributable to purchases of equity securities as we expanded our investments portfolio and net fixed asset purchases.
Cash Flows from Financing Activities
For the year ended December 31, 2021,2023, net cash used in financing activities, including cash provided by discontinued operations, was $10.0$3.1 million, as compared to net cash generatedprovided by financing activities of $8.9 million in 2022. The 2023 cash flow from financing activities reflected paydowns of $8.1 million in 2020, resulting in a decrease in netall existing debt at the time of the sale of our Healthcare division. The 2022 cash generated fromprovided by financing activities was principally due to net proceeds of $18.0 million. The decrease was attributable to a net reduction in principal on existing debt of $11.7$12.7 million payment of dividends of $4.4 million, partially offset by proceeds received related to the Private Placement of $2.1 million.
raised through our 2022 Public Offering.Summary of Cash Flows
The following table shows cash flow information for the years ended December 31, 20212023 and 20202022 (in thousands):
| | | | | | | | | | | | | | |
| | Year Ended December 31, |
| | 2021 | | 2020 |
| Net cash used in operating activities | | $ | (6,450) | | | $ | (4,953) | |
| Net cash provided by (used in) investing activities | | $ | 17,802 | | | $ | (1,332) | |
| Net cash (used in) provided by financing activities | | $ | (9,975) | | | $ | 8,060 | |
| | | | | | | | | | | | | | |
| | Year Ended December 31, |
| | 2023 | | 2022 |
| Net cash provided by (used in) operating activities | | $ | 2,698 | | | $ | (3,857) | |
| Net cash provided by (used in) investing activities | | $ | 16,182 | | | $ | (5,093) | |
| Net cash provided by (used in) financing activities | | $ | (3,072) | | | $ | 8,941 | |
Sources of Liquidity
Our principal sources of liquidity are our existing cash and cash equivalents and cash generated from operations, availability on our revolving lines of credit from our credit facility with Sterling, our three credit facilities with Gerber, one credit facility with Premier and cash raised from equity financing.operations. As of December 31, 2021,2023, we had $4.5$18.3 million of cash and cash equivalents, as well as approximately $2.5 million in undrawn available capacity on our SNB revolving line of credit. The Gerber facilities directly support our Construction businesses. As of December 31, 2021, we were fully drawn in terms of available capacity at $3.1 million onequivalents. In connection with the KBS revolver and $1.7 million on the EBGL revolver. However, those facilities have loan limits of $4.0 million and $3.0 million, respectively, and we expect to be able to use more of that availability as our borrowing base increases with higher production levels. In January, 2022, we successfully completed the Offering with net proceeds of $12.8 million.
Going Concern
We require capital, principally for capital expenditures, acquisition activity, dividend payments and to finance accounts receivable and inventory. Our working capital requirements vary from period to period depending on inventory requirements, the timing of deliveries, and the payment cyclessale of our customers. Our capital expenditures consistHealthcare business on May 4, 2023, we paid off the credit facility pursuant to the Webster Loan Agreement (as defined below) using some of medical imagingthe proceeds from that sale. We also paid off and diagnostic devices utilized inclosed all credit facilities with eCapital during the provisionsecond quarter of our services, as well as vehicles and information technology hardware and software. In addition, we are putting in place capital expenditure programs in the Construction business in order to improve operations and expand our production output. Generally, this business is not capital intensive, although we had to augment working capital significantly in 2021, especially at KBS, to support higher production levels.
The accompanying consolidated financial statements have been prepared assuming we will continue as a going concern, which contemplates the realization of assets and settlement of obligations in the normal course of business. We incurred losses from continuing operations of approximately $8.9 million and $5.3 million for the years ended December 31, 2021 and 2020, respectively. We have an accumulated deficit of $128.0 million and $125.0 million as of December 31, 2021 and 2020, respectively. Net cash used in operations was $6.5 million for the year ended December 31, 2021 compared to net cash used in operations of $5.0 million for the year ended 2020. The Company will need to secure additional future financing to accomplish its business plan over the next several years and that there can be no assurance on the availability or terms upon which such financing and capital might be available in the future.
At December 31, 2021, we had approximately $12.9 million in outstanding debt, all of which is classified as short-term and is explained in more detail2023. As discussed in Note 8. Debtwithin the notes to, we have approximately $2.0 million in debt at our accompanying consolidated financial statement. The $7.0 million SNB debt primarily supports our HealthcareEBGL business and matures in 2024, but GAAP rules require that the outstanding balance be classified as short-term debt, due to the automatic sweep feature embedded in the traditional lockbox arrangement along with a subjective acceleration clause in the SNB Loan Agreement. As ofat December 31, 2021, we were in compliance with all covenants related to our Healthcare division.
As of December 31, 2021, we had $4.8 million outstanding on our two Construction division revolvers with Gerber. As of that date, we were not in compliance with our bi-annual covenants on these Gerber facilities, but obtained waivers from Gerber for the bi-annual measurement period ended December 31, 2021. While Gerber has historically provided us with waivers, there is no assurance that we will be able to receive waivers for covenant violations in the future, or that we will meet compliance with covenants in the future.
As of December 31, 2021, we also have $1.1 million outstanding on the Star Loan, on which we have been making timely payments and are in compliance with all covenants. Related party notes of $2.3 million that were outstanding as of December 31, 2020 were fully paid off on April 1, 2021, using proceeds from the DMS Sale Transaction. In addition, as of December 31, 2021, we had cash and cash equivalents of $4.5 million.
We are currently forecasting a covenant breach on our SNB Loan Agreement within twelve months after the date these financial statements have been issued. Upon the occurrence and during the continuation of an event of default under the SNB Loan Agreement, SNB may, among other things, declare the loans and all other obligations under the SNB Loan Agreement
immediately due and payable and increase the interest rate at which loans and obligations under the SNB Loan Agreement bear interest. Therefore, management concludes that this forecasted violation raises substantial doubt about our ability to continue as a going concern within twelve months after the date that financial statements are issued if we are not able to restructure those agreements or receive a waiver for non-compliance with our covenants. Our financial statements do not reflect any adjustments that might result from the outcome of this uncertainty. Management is taking a number of steps to avoid these breaches and/or restructure the covenants within these agreements. These steps include improving our operations, considering additional or alternative financing arrangements, and negotiating with current lenders to amend our covenants. While we believe that we maintain strong transparency and relationships with our lenders, there can be no assurance that we will be successful in these efforts.Common Stock Offerings
On January 24, 2022,May 28, 2020, we closed an underwritten public offering (the “Offering”“2020 Public Offering”) pursuant to an underwriting agreement with Maxim Group LLC, as representative of the underwriters. The 2020 Public Offering was for 2,225,000 shares of our common stock, and 2,225,000 warrants (the “Warrants”) to purchase up to 1,112,500 additional shares of our common stock. The 2020 Public Offering price was $2.24 per share of common stock and $0.01 per accompanying Warrant (for a combined offering price of $2.25). Gross proceeds, before deducting underwriting discounts and offering expenses and excluding any proceeds we may receive upon exercise of the common warrants, were $5.0 million and net proceeds were $5.2 million.
On January 24, 2022, we closed the 2022 Public Offering. The 2022 Public Offering was for 9,500,000 shares of common stock (or pre-funded warrants to purchase shares of common stock in lieu thereof) and warrants to purchase up to 9,500,000 shares of common stock (the “common warrants”). Each share of common stock (or pre-funded warrant in lieu thereof) was sold, together with one common warrant to purchase one share of common stock, at a combined price of $1.50 per share and common warrant. Additionally, Company issued to Maxim 237,500 common stock purchase warrants (the “Underwriter’s Warrants”) to purchase up to 237,500 shares of Common Stock at an exercise price of $1.65 per common warrant. Gross proceeds, before deducting underwriting discounts and offering expenses and excluding any proceeds we may receive upon exercise of the common warrants, were $14.3 million and net proceeds were $12.8$12.7 million.
Common Stock Offerings
On May 28, 2020, we closed a public offering (the “2020 Offering”)As of 2,225,000 sharesDecember 31, 2023, of our common stock, and 2,225,000the warrants (the “Warrants”) to purchase up to 1,112,500 additional shares of our common stock. The 2020 Offering price was $2.24 per share of common stock and $0.01 per accompanying Warrant (for a combined 2020 Offering price of $2.25), initially raising $5.0 million in gross proceeds before underwriter discounts and offering-related expenses.
The net proceeds to the Company fromissued through the 2020 Public Offering, 1.0 millionwarrants had been exercised and Warrant exercises in 2020 were approximately $5.21.4 million (inclusive of the exercise of the over-allotment option), after deducting underwriter fees and offering-related expenses estimated at $0.8 million. We used a significant portion of the net proceeds from the 2020 Offering to fund working capital needs at our Construction businesses, particularly related to modular housing projectswarrants remained outstanding, which we produced at KBS Boston-area projects. The remainder of the net proceeds was used for working capital and for other general corporate purposes.
On January 24, 2022, we closed an underwritten public offering (the “Offering”) pursuant to an underwriting agreement with Maxim Group LLC, as representative of the underwriters. The Offering was for 9,500,000represents 0.7 million shares of common stock (or pre-funded warrants to purchase shares of common stock in lieu thereof) and warrants to purchase up to 9,500,000 shares of common stock (the “common warrants”). Each share of common stock (or pre-funded warrant in lieu thereof) was sold together with one common warrant to purchase one share of common stockequivalents, at aan exercise price of $1.50 per share and common warrant. Gross proceeds, before deducting underwriting discounts and offering expenses and excluding any proceeds we may receive upon exercise of the common warrants, were $14.3 million and net proceeds were $12.8 million.
We currently intend to use the net proceeds to pursue growth initiatives and fund potential acquisitions, and for working capital and other general corporate purposes. We will have broad discretion in determining how the proceeds of the Offering will be used, and our discretion is not limited by the aforementioned possible uses.
Credit Facilities
Sterling Credit Facility
On March 29, 2019, the Company entered into a Loan and Security Agreement (the “SNB Loan Agreement”) by and among certain subsidiaries of the Company, as borrowers (collectively, the “SNB Borrowers”); the Company, as guarantor; and Sterling National Bank.
The SNB Loan Agreement is a five-year credit facility maturing in March 2024, with a maximum credit amount of $20.0 million for revolving loans. Under the SNB Credit Facility, the SNB Borrowers can request the issuance of letters of credit in an aggregate amount not to exceed $0.5 million at any one time outstanding. The borrowings under the SNB Loan Agreement were classified as short-term obligations under GAAP as the agreement contained a subjective acceleration clause and required a lockbox arrangement whereby all receipts are swept daily to reduce borrowings outstanding.$2.25. As of December 31, 2021,2023, of the CompanyWarrants issued through the 2022 Public Offering, 0.3 million prefunded warrants had $0.1been exercised and 10.9 million warrants remained outstanding at an exercise price of letters of credit outstanding and had additional borrowing capacity of $2.5 million.
At the SNB Borrowers’ option, the SNB Credit Facility will bear interest at either (i) a Floating LIBOR Rate, as defined in the SNB Loan Agreement, plus a margin of 2.50% per annum; or (ii) a Fixed LIBOR Rate, as defined in the SNB Loan Agreement, plus a margin of 2.25% per annum. Our floating rate on this facility at the end of 2021 was 2.60%.
38
On February 1, 2021, in connection with the closing of the sale of MDOS, we entered into a First Amendment to the SNB Loan Agreement pursuant to which SNB consented to the sale of MDOS and the Company’s name change from Digirad Corporation to Star Equity Holdings, Inc.
On March 31, 2021, in connection with completing the sale of DMS Health, we entered into a Second Amendment to the SNB Loan Agreement pursuant to which SNB consented to the sale of DMS Health and its subsidiaries and required the principal to be paid down to $7.0 million.
At December 31, 2021 and 2020, the Company was in compliance with all covenants.
Construction Loan Agreements
As of December 31, 2021, the Construction division had outstanding revolving lines of credit of approximately $4.8 million. Our Construction debt primarily included (i) $3.1 million principal outstanding on KBS’s $4.0 million revolving credit facility under the KBS Loan Agreement, with Gerber and (ii) $1.7 million principal outstanding on EBGL’s $3.0 million revolving credit facility, which was increased from $3.0 million to $4.0 million on July 30, 2021. As of December 31, 2021, the Construction division was at the maximum borrowing capacity under both revolving lines of credit, based on the inventory and accounts receivable on that day which fluctuates weekly.
KBS Loan Agreement
On February 23, 2016, ATRM, KBS and Main Modular Haulers, Inc. entered into the KBS Loan Agreement with Gerber. The KBS Loan Agreement provides KBS with a revolving line of credit with borrowing availability of up to $4.0 million. Availability under the line of credit is based on a formula tied to KBS’s eligible accounts receivable, inventory and other collateral. The KBS Loan Agreement, which was scheduled to expire on February 22, 2018, has been automatically extended for successive one (1) year periods in accordance with its terms and is now scheduled to expire on February 22, 2023. The KBS Loan Agreement will be automatically extended for another one (1) year period unless a party thereto provides prior written notice of termination. As of December 31, 2021, neither party has provided notice of termination. Upon the final expiration of the term of the KBS Loan Agreement, the outstanding principal balance is payable in full. Borrowings bear interest at the prime rate plus 2.75%, equating to 6.00% at December 31, 2021, with interest payable monthly. The KBS Loan Agreement also provides for certain fees payable to Gerber during its term, including a 1.5% annual facilities fee and a 0.10% monthly collateral monitoring fee. KBS’s obligations under the KBS Loan Agreement are secured by all of its assets and are guaranteed by the Company. Financial covenants required that KBS maintain a post-tax net income (as defined in the KBS Loan Agreement) at least equal to (a) $385 thousand for the trailing 6-month period ending June 30, 2021 and $500 thousand for the trailing fiscal year end December 31, 2021 and a minimum EBITDA (as defined in the KBS Loan Agreement) at (a) June 30, 2021 to be more than $880 thousand or (b) fiscal year end December 31, 2021 to be more than $1.5 million. The borrowings under the KBS Loan Agreement were classified as short-term obligations under GAAP as the agreement contained a subjective acceleration clause and required a lockbox arrangement whereby all receipts are swept daily to reduce borrowings outstanding. At December 31, 2021, approximately $3.1 million was outstanding under the KBS Loan Agreement.
On March 31, 2021, the parties to the KBS Loan Agreement have amended the KBS Loan Agreement to provide for increased availability under the KBS Loan Agreement to KBS under certain circumstances, including for new equipment additions, and certain other changes, as well as a waiver of certain covenants.
As of December 31, 2021 and 2020, KBS was not in compliance with the financial covenants. The occurrence of any unrectifiable event of default under the KBS Loan Agreement may result in KBS’s obligations under the KBS Loan Agreement becoming immediately due and payable. In all prior periods and as of December 31, 2021, we obtained a waiver from Gerber for financial covenant breaches. However, there can be no assurance that we will be able to obtain such waivers in the event of future financial covenant violations.
On March 8, 2022, the borrowers under the KBS Loan Agreement entered into the Nineteenth Amendment to KBS Loan Agreement to amend the financial covenants to require that KBS maintain (a) a net cash income (as defined in the KBS Loan Agreement) of at least equal to no less than $0 for the trailing 6-month period ending June 30, 2022 and no less than $500,000 for the trailing fiscal year ending December 31, 2022 and (b) a minimum EBITDA (as defined in the KBS Loan Agreement) of no less than $0 as of June 30, 2022 and no less than $850,000, as of the fiscal year ending December 31, 2022, as well as a waiver of certain covenants as of December 31, 2021.
EBGL Premier Note
On June 30, 2017,August 16, 2023, EdgeBuilder and Glenbrook (together, EBGL)(the “EBGL Borrowers”) entered into a Revolving Credit Loan Agreement (as amended, the Premier Loan Agreement with Premier Bank (“Premier”) providing the EBGL Borrowers with a working capital line of credit of up to $3.0 million.
$4 million, which agreement was subsequently replaced and increased to $6 million on December 5, 2023 (the “Premier Loan Agreement”). Availability under the Premier Loan Agreement is based on a formula tied to EBGL’sthe EBGL Borrowers’ eligible accounts receivable, inventory and equipment, and borrowingsequipment. Borrowings under the Premier Loan Agreement bear interest at the prime rate plus 1.50%0.75% (and a minimum interest rate of 6.75%), with interest payable monthly and the outstanding principal balance payable upon expiration of the term of the Premier Loan Agreement. The Premier Loan Agreement also provides for certain fees payable to Premier during its term. The initial term of the Premier Loan Agreement was scheduledexpires on December 5, 2024 but may be extended from time to expire on June 30, 2018, but was extended multiple timestime at the request of the EBGL Borrowers, subject to approval by Premier through January 31, 2023. EBGL’sPremier. The EBGL Borrowers’ obligations under the Premier Loan Agreement are guaranteed by the Company and secured by all of their inventory, equipment, accounts and other intangibles, fixtures and all proceedsintangibles. As of the foregoing.
On January 31, 2020, EBGL entered into an Extension and Modification Agreement (the “Modification Agreement”) with Premier that modified the terms of the Revolving Credit Promissory Note (the “Premier Note”). Pursuant to the Modification Agreement, the amount of indebtedness evidenced by the Premier Note was reduced to $1.0 million, and the Premier Note was modified to: (a) extend the Final Maturity Date (as defined in the Premier Note) of the Premier Note to JanuaryDecember 31, 2023, and (b) set the interest that the Premier Note would bear at 5.75% per annum. EBGL’s obligationsavailability under the Premier Loan Agreement were secured by all of its assets.was approximately $3 million.
All obligations underFinancial covenants associated with the Premier Loan Agreement require that the EBGL Borrowers maintain (a) a debt service coverage ratio for any calendar year of less than 1.25; (b) a debt-to-equity ratio at the end of each calendar year in excess of 1.65; (c) a fixed charge coverage ratio at the end of each calendar year of less than 1.10; (d) working capital of at least $2 million; and (e) a current ratio of at least 1.50. As of December 31, 2023, the EBGL Borrowers were repaidnot in fullcompliance with the Premier Loan Agreement covenants. The EBGL Borrowers have obtained a waiver from Premier for the annual covenant breach.
Webster Credit Facility
On March 29, 2019, the Company entered into a Loan and Security Agreement (the “Webster Loan Agreement”) by and among certain subsidiaries of the Company, as borrowers; the Company, as guarantor; and Sterling National Bank (“Sterling”). On February 1, 2022, Sterling became part of Webster Bank, N.A. (“Webster”), and Webster became the successor in interest to the Webster Loan Agreement. The Webster Loan Agreement was also subject to a limited guarantee by Mr. Eberwein, the Executive Chairman of our board of directors.
The Webster Loan Agreement was a five-year credit facility maturing in March 2024, with a maximum credit amount of $20.0 million for revolving loans (the “Webster Credit Facility”). In connection with the sale of our Healthcare business on May 4, 2023, we paid all amounts due and closed the Webster Credit Facility.
eCapital Credit Facilities
The EBGL Borrowers were parties to a Loan and Security Agreement with eCapital Asset Based Lending Corp. (“eCapital”), providing for a $4.0 million credit facility with a maturity date of June 2023 and an auto-renewal of one year thereafter. KBS was a party to a Loan and Security Agreement with eCapital, providing up to $4.0 million in working capital which was scheduled to mature in June 2023 and renew automatically for a period of one year moving forward. During the second quarter of 20212023, we closed these two credit facilities and have no amount remains outstandingremaining debt balance with eCapital.
eCapital Term Loan
We and certain of our Investments subsidiaries were party to a Loan and Security Agreement with eCapital, as of December 31, 2021. In exchange Premier terminated all of its security interestssuccessor in the assets of EBGL.
interest to Gerber Star Loans
On January 31, 2020, SRE, 947 Waterford Road, LLC (“947 Waterford”), 300 Park Street, LLC (“300 Park”), and 56 Mechanic Falls Road, LLC (“56 Mechanic” and together with SRE, 947 Waterford, and 300 Park, (the “Star Borrowers”), each an Investments subsidiary, and the Company, ATRM, KBS, EdgeBuilder, and Glenbrook (collectively,Finance, Inc. (as amended, the “Star Credit Parties”Loan Agreement”), entered into the Star Loan Agreement with Gerber providing the Star Borrowers withwhich provided for a credit facility with borrowing availability of up to $2.5 million, ($2.0 million and $0.5 million to KBS and EBGL, respectively) or the Star Loan. The advance of $2.0 million to KBS is to be repaid in monthly installments of sixty (60) consecutive equal payments. The advance of $0.5 million to EBGL, which has been temporarily increased by $0.3 million due to be repaid on April 30, 2020, was to be repaid in monthly installments of twelve (12) consecutive equal payments. The Star Loan matures on the earlier of (a) January 1, 2025 or (b) the termination, the maturity or repayment of the EBGL Loan. Availability under the Star Loan Agreement was based on a formula tied to the value of real estate owned by the Star Borrowers, and borrowings bearbearing interest at the prime rate plus 3.5% per annum.
On February 20, 2020,annum, and maturing on January 31, 2025, unless terminated in accordance with the Star Borrowers entered into a First Amendmentterms therein. During the second quarter of 2023, we paid in full all amounts related to Loan and Security Agreement (the “First Star Amendment”) with Gerber that amended the Star Loan Agreement in order to (i) temporarily advance $0.3 million to EBGL, which amount is to be repaid to Gerber on or before April 30, 2020; (ii) clarify that Gerber can make multiple advances under the Star Loan Agreement and (iii) to correct the maturity date of the Star Loan. On April 30, 2020, the Star Borrowers entered into a Second Amendment to Loan and Security Agreement (the “Second Star Amendment”)have no remaining debt balance with Gerber that amended the Star Loan Agreement in order to change terms of repayment for the advance of $0.3 million to EBGL provided for under the First Star Amendment. Under the terms of the Second Star Amendment, the advance of $0.3 million to EBGL was to be repaid in three (3) consecutive equal monthly installments on the thirtieth (30th) day in each calendar month, commencing May 30, 2020, and in a final installment on or before July 31, 2020. As of September 30, 2020, EBGL had repaid the $0.3 million in full to Gerber.
The obligations of the Star Borrowers under the Star Loan Agreement are guaranteed by the Star Credit Parties and are secured by substantially all the assets of the Star Borrowers and the Star Credit Parties. Contemporaneously with the execution and delivery of the Star Loan Agreement, Jeffrey E. Eberwein, the Executive Chairman, executed and delivered a Guaranty (the “Gerber Eberwein Guaranty”) to Gerber, pursuant to which he guaranteed the performance of all the Star Borrowers’ obligations to Gerber. Mr. Eberwein’s obligations under the Gerber Eberwein Guaranty are limited in the aggregate to the amount of (a) $2.5 million, plus (b) costs of Gerber incidental to the enforcement of the Gerber Eberwein Guaranty or any guaranteed obligations.
On February 26, 2021, the Star Borrowers entered into a Third Amendment to the Star Loan Agreement (the “Third Star Amendment”) with Gerber that amended the contract rate to prime rate plus 3% and discharged the $2.5 million Gerber Eberwein Guaranty.
The financial covenants under the Star Loan Agreement include maintenance of a Debt Service Coverage Ratio of not less than 1:00 to 1:00, as defined in the Star Loan Agreement, as of December 31, 2021. The occurrence of any event of default under the Star Loan Agreements may result in the obligations of the Star Borrowers becoming immediately due and payable. As of December 31, 2021 and 2020, we were in compliance with the annual financial covenants.
As of December 31, 2021, $1.1 million was outstanding under the Star Loan Agreement. The borrowings under the Star Loan Agreement were classified as short-term obligations under GAAP, because the borrowings under the EBGL Loan Agreement were classified as short-term obligations under GAAP given the EBGL and KBS Loan Agreements contain a subjective acceleration clause and require a lockbox arrangement whereby all receipts are swept daily to reduce borrowings outstanding. Accordingly,if (i) a material adverse effect may be seen to have occurred, (ii) Gerber in its discretion deems a EBGL Loan Agreement default occurred, and (iii) the proceeds swept are insufficient to pay the balance outstanding, Gerber may then demand all obligations under the Star Loan Agreement immediately due and payable due to cross-default provision, occurring within the Star Loan Agreement. Since a material event can occur at any time, all obligations under the Star Loan Agreement, EBGL Loan Agreement and KBS Loan Agreement are classified as short-term obligations.
Gerber EBGL Loans
On January 31, 2020, EdgeBuilder and Glenbrook (the “EBGL Borrowers”), each a Construction Subsidiary, and the Company, 947 Waterford, 300 Park, 56 Mechanic, ATRM, and KBS (collectively, the “EBGL Credit Parties”), entered into a Loan and Security Agreement (the “EBGL Loan Agreement”) with Gerber providing the EBGL Borrowers with a credit facility with borrowing availability of up to $3.0 million (the “EBGL Loan”). On March 5, 2020, the EBGL Borrowers entered into a First Amendment to Loan and Security Agreement (the “First EBGL Amendment”) with Gerber that amended the EBGL Loan Agreement and the KBS Loan Agreement to include a pledge $0.3 million of cash collateral by Lone Star Value Investors (“LSVI”) under the EBGL Loan Agreement which, prior to the First EBGL Amendment, was pledged by LSVI in connection with the KBS Loan Agreement. On July 1, 2020, the EBGL Borrowers entered into a Second Amendment that terminated the pledge of $0.3 million in cash collateral. On February 26, 2021, the EBGL Borrowers entered into a Third Amendment to the EBGL Loan Agreement (the “Third EBGL Amendment”), pursuant to which the Company and Gerber eliminated the minimum leverage ratio covenant, lowered the minimum EBITDA, and required the borrowers to not incur a net operating loss on bi-annual basis. The Third EBGL Amendment also discharged the EBGL Eberwein Guaranty described below. As of December 31, 2021, $1.7 million was outstanding under the EBGL Loan.
Availability under the EBGL Loan Agreement was also based on a formula tied to the EBGL Borrowers’ eligible accounts receivable and inventory, and borrowings bear interest at the prime rate plus 2.75% per annum. The EBGL Loan Agreement also provides for certain fees payable to Gerber during its term, including a 1.5% annual facilities fee and a 0.10% monthly collateral monitoring fee. EBGL’s obligations under the Premier Loan Agreement are secured by all of its assets. The EBGL Loan Agreement also provided for certain fees payable to Gerber during its terms. The EBGL Loan matures on the earlier of (a) January 1, 2023, unless extended, or (b) the termination, the maturity or repayment of the Star Loan. The maturity of the EBGL Loan is automatically extended for successive periods of one (1) year each unless terminated by Gerber or the EBGL Borrowers. The borrowings under the EBGL Loan Agreement were classified as short-term obligations under GAAP as the agreement contained a subjective acceleration clause and required a lockbox arrangement whereby all receipts are swept daily to reduce borrowings outstanding.
The obligations of the EBGL Borrowers under the EBGL Loan Agreement are guaranteed by the EBGL Credit Parties and are secured by substantially all the assets of the EBGL Borrowers and the EBGL Credit Parties. On March 5, 2020, contemporaneously with the execution and delivery of the First EBGL Amendment, Mr. Eberwein, executed and delivered a Guaranty (the “EBGL Eberwein Guaranty”) to Gerber which he guaranteed the performance of all the EBGL Borrowers’ obligations to Gerber under the EBGL Loan Agreement, including the full payment of all indebtedness owing by the EBGL Borrowers to Gerber in connection with the EBGL Loan Agreement and related financing documents. Mr. Eberwein’s obligations under the EBGL Eberwein Guaranty are limited in the aggregate to the amount of (a) $0.5 million, plus (b) costs of Gerber incidental to the enforcement of the EBGL Eberwein Guaranty or any guaranteed obligations.
On July 30, 2021, the EBGL Borrowers entered into a Fourth Amendment to the EBGL Loan Agreement (the “Fourth EBGL Amendment”) with Gerber, which increased the eligible inventory and the maximum borrowing limit from $3.0 million to $4.0 million.
The financial covenants under the EBGL Loan Agreement include maintenance of a minimum EBITDA and no net operating loss, as defined in the EBGL Loan Agreement, for the six months ended June 30, 2021 and for the year ended December 31, 2021. The occurrence of any event of default under the EBGL Loan Agreement and certain events of default under the KBS Loan Agreement may result in the obligations of the EBGL Borrowers becoming immediately due and payable. As of December 31, 2021, no event of default was deemed to have occurred and EBGL was in compliance with the bi-annual financial covenants under the EBGL Loan Agreement.
On October 21, 2021, the EBGL Borrowers entered into the Fifth Amendment to the EBGL Loan Agreement (the “Fifth EBGL Amendment”) with Gerber to amend the definition of “Reserves” to include a minimum amount, subsequent to Glenbrook Building Supply, Inc. entering a new lease for a larger property.
On January 20, 2022, the EBGL Borrowers entered into the Sixth Amendment to the EBGL Loan Agreement (the “Sixth EBGL Amendment”) with Gerber and reduced the minimum average monthly loan amount to 25% of the $4.0 million maximum revolving amount.
On March 8, 2022, the EBGL Borrowers entered into the Seventh Amendment to the EBGL Loan Agreement (the “Seventh EBGL Amendment”) with Gerber to amend and lower the financial covenants to require that EBGL maintain (a) a lower net cash income (as defined in the EBGL Loan Agreement) at least equal to no less than $0 for the trailing 6-month period ending June 30, 2022 and no less than $1,000,000 for the trailing fiscal year end December 31, 2022 and (b) a reduced minimum EBITDA (as defined in the EBGL Loan Agreement) and no less than $0 as of June 30, 2022 or to be no less than $1,000,000 as of the fiscal year ending December 31, 2022.
Paycheck Protection Program
From April 2020 through May 2020, the Company and its subsidiaries received $6.7 million of loans under the Paycheck Protection Program (“PPP”).
On April 30, 2020, each of KBS, EdgeBuilder and Glenbrook executed a separate promissory note evidencing unsecured loans under the Paycheck Protection Program (the “PPP”). The promissory note executed by KBS is for $0.8 million (the “KBS Note”), the promissory note executed by EdgeBuilder is for $0.2 million (the “EdgeBuilder Note”) and the promissory note executed by Glenbrook is for $0.2 million (the “Glenbrook Note”). The KBS Note, the EdgeBuilder Note and the Glenbrook Note, each dated April 30, 2020, are referred to together as the “Construction Notes”.
On May 11, 2020, the Company and each of Digirad Imaging Solutions, Inc. (“DIS”), DMS Imaging, Inc. (“DMS Imaging”) and DMS Health, each a direct or indirect wholly owned subsidiary of the Company, executed a separate promissory note evidencing unsecured loans under the PPP. The promissory note executed by the Company, dated May 7, 2020, is for $0.8 million (the “Company Note”); the promissory note executed by DIS, dated May 5, 2020, is for $3.0 million (the “DIS Note”); the promissory note executed by DMS Imaging, dated May 5, 2020, is for $1.6 million (the “DMS Imaging Note”) and the promissory note executed by DMS Health, dated May 7, 2020, is for $0.1 million (the “DMS Health Note”). The Company Note, the DIS Note, the DMS Imaging Note, and the DMS Health Note are referred to together as the “Healthcare Notes”. The Construction Notes and the Healthcare Notes are referred to collectively as the “PPP Notes” and each promissory note individually as a “PPP Note”.
The PPP was established under the Coronavirus Aid, Relief, and Economic Security Act (the “CARES Act”) and is administered by the U.S. Small Business Administration (“SBA”). The loans evidenced by the Construction Notes were made through Bremer Bank (“Bremer”) as lender, and the loans evidenced by the Healthcare Notes were made through Sterling as lender.
The loans evidenced by the PPP Notes (the “PPP Loans”) have two-year terms and bear interest at a rate of 1.00% per annum. Monthly principal and interest payments under the PPP Loans are deferred until repaid.
Under the terms of the CARES Act, recipients of loans under the PPP could apply for and be granted forgiveness for all or a portion of the loan granted under the PPP. Such forgiveness would be determined, subject to limitations, based on the use of loan proceeds for payment of payroll costs and certain other eligible costs. Even if forgiveness is granted the PPP Loans may remain subject to review and audit for up to six (6) years.
During fiscal year 2020 and 2021, the Company applied for forgiveness on all PPP Loans. As of December 31, 2021, all PPP Loans were forgiven, resulting in a gain of $4.2 million in 2021 and $2.5 million in 2020, thus, the Company has no PPP Loans outstanding.
Eberwein Guarantees
SNB
On March 29, 2019, in connection with the Company’s entry into the SNB Loan Agreement, Mr. Eberwein, the Executive Chairman, entered into the Limited Guaranty Agreement (the “SNB Eberwein Guaranty”) with SNB pursuant to which he guaranteed to SNB the prompt performance of all the SNB Borrowers’ obligations to SNB under the SNB Loan Agreement, including the full payment of all indebtedness owing by Borrowers to SNB. Mr. Eberwein’s obligations under the SNB Eberwein Guaranty are limited in the aggregate to the amount of (a) $1.5 million, plus (b) reasonable costs and expenses of SNB incurred in connection with the SNB Eberwein Guaranty. Mr. Eberwein’s obligations under the SNB Eberwein Guaranty terminated upon the Company and Borrowers achieving certain milestones set forth therein.
Gerber
On March 5, 2020, contemporaneously with the execution and delivery of the First EBGL Amendment, Mr. Eberwein, executed and delivered the EBGL Eberwein Guaranty to Gerber pursuant to which he guaranteed the performance of all the EBGL Borrowers’ obligations to Gerber under the EBGL Loan Agreement, including the full payment of all indebtedness owing by the EBGL Borrowers to Gerber in connection with the EBGL Loan Agreement and related financing documents. Mr. Eberwein’s obligations under the EBGL Eberwein Guaranty were limited in the aggregate to the amount of (a) $0.5 million, plus (b) costs of Gerber incidental to the enforcement of the EBGL Eberwein Guaranty or any guaranteed obligations. On February 26, 2021, the Third EBGL Amendment discharged the EBGL Eberwein Guaranty and removed Mr. Eberwein as an ancillary guarantor from the EBGL Loan Agreement.
Premier
As a condition to the Premier Loan Agreement, Mr. Eberwein entered into a guaranty in favor of Premier, absolutely and unconditionally guaranteeing all of the borrowers’ obligations thereunder. As of May 26, 2021, all obligation under the Premier Loan Agreement have been repaid in full and no amount remains outstanding and Premier discharged Mr. Eberwein’s guaranty.eCapital.
Off-Balance Sheet Arrangements
On September 10, 2019, the parties to the KBS Loan Agreement entered a Consent and Acknowledgment Agreement and Twelfth Amendment to Loan Agreement, by and among Gerber, KBS, ATRM and the Company, pursuant to which the Company agreed to guarantee amounts borrowed by certainAs of ATRM’s subsidiaries from Gerber. The Twelfth Amendment requires us to serve as an additional guarantor with the existing guarantor, ATRM, with respect to the payment, performance and discharge of each and every obligation of payment and performance by the borrowing subsidiaries with respect to the loans made by Gerber to them. On JanuaryDecember 31, 2020, the Company, ATRM, KBS and Gerber entered into a Thirteenth Amendment to Loan and Security Agreement (the “Thirteenth KBS Loan Amendment”) to amend the KBS Loan Agreement, by and among the Company, ATRM, KBS and Gerber, in order to, among other things (a) amend the definitions of “Ancillary Credit Parties,” “Guarantor,” “Obligations,” and “Subordinated Lender” to address the obligations of the Star Borrowers, the EBGL Borrowers, the Star Credit Parties, and the EBGL Credit Parties under the Loan Agreements and the Subordination Agreements to which they are a party and (b) add a new cross default provision.
See Note 8. Debt, within the notes to our consolidated financial statements for further detail.2023, there were no off balance sheet arrangements.
Critical Accounting Policies
Management’s discussion and analysis of our financial condition and results of operations are based upon our accompanying consolidated financial statements, which are prepared in accordance with United States generally accepted accounting principles. The preparation of these financial statements requires us to make estimates and judgments that affect the reported amounts of assets and liabilities, related disclosure of contingent assets and liabilities at the date of the financial statements, and the reported amounts of revenues and expenses during the reporting period. We evaluate our estimates and judgments, the most critical of which are those related to revenue recognition, business combination accounting, goodwill valuation and income taxes. Furthermore, the impact on accounting estimates and judgements on the Company’s financial condition and results of operations due to COVID-19 has introduced additional uncertainties. We base our estimates and judgments on historical experience and other factors that we believe to be reasonable under the circumstances. Materially different results can occur as circumstances change and additional information becomes known.
Revenue Recognition
Pursuant to Accounting Standards Codification (ASC)ASC 606, Revenue from Contracts with Customers, we recognize revenue when a customer obtains control of promised goods or services. We record the amount of revenue that reflects the consideration that it expects to receive in exchange for those goods or services. We apply the following five-step model in order to determine this amount: (i) identification of the promised goods or services in the contract; (ii) determination of whether the promised
goods or services are performance obligations, including whether they are distinct in the context of the contract; (iii) measurement of the transaction price, including the constraint on variable consideration; (iv) allocation of the transaction price to the performance obligations; and (v) recognition of revenue when (or as) the Company satisfies each performance obligation.
Revenue recognition is evaluated on a contract basis. Performance obligations are satisfied over time as work progresses or at a point in time. A performance obligation is satisfied over time ifFrom time-to-time we haveenter into contracts within our construction sector that produce assets with no alternative use and contain an enforceable right to payment, including a reasonable profit margin. Determining if an enforceable right to payment includes a reasonable profit margin requires judgment and is assessed on a contract by contract basis. For contracts requiring over time revenue recognition, the selection of the method to measure progress towards completion requires judgment and is based on the nature of the products or services to be provided. We use a cost-based input measurement of progress because it best depicts the transfer of assets to the customer, which occurs as costs are incurred during the manufacturing process or as services are rendered. Under the cost-based measure of progress, the extent of progress towards completion is measured based on the costs incurred to date. We had no contracts in place as of December 31, 2023 or December 31, 2022 that require recognition over time.
Business Combination Accounting
The Company accounts for business combinations using the acquisition method of accounting, and records the identifiable assets and liabilities of the acquired business at their acquisition date fair values under ASC 805, Business Combinations. The excess of the purchase price over the estimated fair value of the net assets acquired is recorded as goodwill, and, conversely, any excess of the estimated fair values of the net assets acquired over the purchase price is recorded as a bargain purchase gain. Any changes in the estimated acquisition date fair values of the net assets recorded prior to the finalization of a more detailed analysis, but not to exceed one year from the date of acquisition, could change the amount of the purchase price allocated to goodwill or bargain purchase gain. Amounts allocated to goodwill would be recorded in the Consolidated Balance Sheets and bargain purchase gains would be recorded on the Consolidated Statement of Operations. Any subsequent changes to any purchase price allocations that are material to the Company’s Consolidated Financial Statements will be adjusted retrospectively. All acquisition related costs are expensed as incurred.
The results of operations of the acquired companies are recorded in the Consolidated Statements of Operations from the date of acquisition. The application of business combination principles, including the determination of the fair value of the net assets acquired, requires the use of significant estimates and assumptions.
Goodwill Valuation
We review goodwill for impairment on an annual basis during the fourth quarter, as well asand when events or changes in circumstances indicate that thea reporting unit’s carrying value may be impaired. We initially assess qualitative factors to determine whether it is more likely than not be recoverable. Wethat the fair value of the reporting unit is less than its carrying amount. Upon review of the results of such assessment, we may begin the process by performing an impairment analysis by quantitatively comparing the fair value of the reporting unit to the carrying value of the reporting unit, including goodwill. ImpairmentAn impairment charge for goodwill is recognized for the amount by which the carrying value of the reporting unit exceeds its fair value and such loss should not exceed the total goodwill allocated to the reporting unit.
The Company recorded goodwill impairmentThere are numerous factors that may cause the fair value of $3.4 million for the KBSa reporting unit duringto fall below its carrying amount and/or that may cause the year endedvalue of long-lived assets to not be recoverable, which could lead to the measurement and recognition of goodwill and/or long-lived asset impairment charges. These factors include, but are not limited to, significant negative variances between actual and expected financial results, lowered expectations of future financial results, failure to realize anticipated synergies from acquisitions, adverse changes in the business climate, and the loss of key personnel. As of December 31, 2021. The Company recorded goodwill impairment2023, we performed a qualitative assessment and did not identify any triggering events that would lead to the performance of $0.4 million for the EBGL reporting unit during the year ended December 31, 2020.a quantitative analysis. See Note 7. Goodwill, within the notes to our accompanying consolidated financial statements, for further information.
Income Taxes
We provide for income taxes under the asset and liability method. This approach requires the recognition of deferred tax assets and liabilities for the expected future tax consequences of differences between the tax basis of assets or liabilities and their carrying amounts in the financial statements. We provide a valuation allowance for deferred tax assets if it is more likely than not that these items will expire before we are able to realize their benefit. We calculate the valuation allowance in accordance with the authoritative guidance relating to income taxes, which requires an assessment of both positive and negative evidence regarding the realizability of these deferred tax assets when measuring the need for a valuation allowance.assets. Significant judgment is required in determining any valuation allowance against deferred tax assets.
The authoritative guidance for income taxes defines a recognition threshold and measurement attributes for financial statement recognition and measurement of a tax provision taken or expected to be taken in a tax return. The guidance also provides direction on derecognition, classification, interest and penalties, accounting in interim periods, disclosure, and transition. Under the guidance, the impact of an uncertain income tax position on the income tax return must be recognized at the largest amount that is more-likely-than-not to be sustained upon audit by the relevant taxing authority. An uncertain income tax position will not be recognized if it has less than a 50% likelihood of being sustained. We recognize interest and penalties related to uncertain tax positions as a component of the income tax provision.
New Accounting Pronouncements
See Note 2. Basis of Presentation and Significant Accounting Policies, within the notes to our accompanying consolidated financial statements for discussion of our discussion of new accounting pronouncements.
ITEM 7A.QUANTITATIVE AND QUALITATIVE DISCLOSURES ABOUT MARKET RISK
Interest Rate Risk
Debt obligations under all four of our Company Line of Creditthe Premier Loan AgreementsAgreement are subject to variable rates of interest based on LIBOR, the administrative agent’s prime rate or the U.S. federal funds rate.Prime Rate. A 100 basis point increase in the underlying interest rate would result in an additional annual interest expense of approximately $0.1 million,$20 thousand, assuming related line of credit of $11.8$2 million, which is the amount of outstanding borrowings at December 31, 2021.2023.
The Company’s approach to interest rate risk is to balance borrowings between fixed rate and variable rate debt as management deems appropriate. At December 31, 2021, the Company’s borrowings under the Company Loan Agreements are all at variable rates.
ITEM 8.
FINANCIAL STATEMENTS AND SUPPLEMENTARY DATA
STAR EQUITY HOLDINGS, INC.
INDEX TO CONSOLIDATED FINANCIAL STATEMENTS
REPORT OF INDEPENDENT REGISTERED PUBLIC ACCOUNTING FIRM
To the Shareholders and the Board of Directors
of Star Equity Holdings, Inc.
Old Greenwich, Connecticut
Opinion on the Consolidated Financial Statements
We have audited the accompanying consolidated balance sheetsConsolidated Balance Sheets of Star Equity Holdings, Inc. (the “Company”) as of December 31, 20212023 and 2020,2022, the related consolidated statementsConsolidated Statements of operations, consolidated mezzanineOperations, Stockholders’ Equity and stockholders’ equity, and consolidated cash flowsCash Flows, for the years then ended, and the related notes to the Consolidated Financial Statements (collectively, referred to as the “consolidated financial“financial statements”). In our opinion, the consolidated financial statements present fairly, in all material respects, the financial position of the Company atas of December 31, 20212023, and 2020,2022, and the results of its operations and its cash flows for the years then ended in conformity with accounting principles generally accepted in the United States of America.
Going Concern Uncertainty
The accompanying financial statements have been prepared assuming that the Company will continue as a going concern. As discussed in Note 2 to the financial statements, the Company has incurred losses from continuing operations for the years ended December 31, 2021 and 2020 and has an accumulated deficit as of December 31, 2021. The Company is currently forecasting a potential covenant breach for its loan within twelve months after the date the financial statements are issued. These factors raise substantial doubt about the Company’s ability to continue as a going concern. Management’s plans in regard to these matters are also described in Note 2. The financial statements do not include any adjustments that might result from the outcome of this uncertainty.
Basis for Opinion
These consolidated financial statements are the responsibility of the Company’sCompany's management. Our responsibility is to express an opinion on the Company’s consolidatedCompany's financial statements based on our audits. We are a public accounting firm registered with the Public Company Accounting Oversight Board (United States) (“PCAOB”)(PCAOB) and are required to be independent with respect to the Company in accordance with the U.S. federal securities laws and the applicable rules and regulations of the Securities and Exchange Commission and the PCAOB.
We conducted our audits in accordance with the standards of the PCAOB. Those standards require that we plan and perform the audit to obtain reasonable assurance about whether the consolidated financial statements are free of material misstatement, whether due to error or fraud. The Company is not required to have, nor were we engaged to perform, an audit of its internal control over financial reporting. As part of our audits we are required to obtain an understanding of internal control over financial reporting but not for the purpose of expressing an opinion on the effectiveness of the Company’s internal control over financial reporting. Accordingly, we express no such opinion.
Our audits included performing procedures to assess the risks of material misstatement of the consolidated financial statements, whether due to error or fraud, and performing procedures that respond to those risks. Such procedures included examining, on a test basis, evidence regarding the amounts and disclosures in the consolidated financial statements. Our audits also included evaluating the accounting principles used and significant estimates made by management, as well as evaluating the overall presentation of the consolidated financial statements. We believe that our audits provide a reasonable basis for our opinion.
Critical Audit MatterMatters
The critical audit mattermatters communicated below is a matterare matters arising from the current period audit of the consolidated financial statements that waswere communicated or required to be communicated to the audit committee and that: (1) relatesrelate to accounts or disclosures that are material to the consolidated financial statements and (2) involved our especially challenging, subjective or complex judgments. The communication of the critical audit mattermatters does not alter in any way our opinion on the consolidated financial statements, taken as a whole, and we are not, by communicating the critical audit mattermatters below, providing separate opinions on the critical audit mattermatters or on the accounts or disclosures to which it relates.they relate.
Business Combination Accounting
As discussed in Note 16 to the financial statements, the Company completed an acquisition of Big Lake Lumber Inc. during 2023. The Company accounted for this acquisition as a business combination, which resulted in the recognition of a bargain purchase gain.
Auditing the accounting for the acquisition was complex due to the significant estimation uncertainty in determining the fair values of identified assets, including the customer relationship intangible asset of $900 thousand and the fair value of contingent consideration of $169 thousand.
The significant estimation uncertainty was primarily due to the sensitivity of the respective fair values to underlying assumptions about future performance of the acquired business and due to the limited historical data on which to base these assumptions. The significant assumptions used to form the basis of the forecasted results included forecasted revenues and expenditures and customer attrition rates. These significant assumptions were forward-looking and could be affected by future economic and market conditions.
Addressing the matter involved performing procedures and evaluating audit evidence in connection with forming our overall opinion on the financial statements. These procedures included, among others (i) obtaining an understanding of management’s process for accounting for the transaction; (ii) evaluating the qualifications of the third-party expert engaged by management; (iii) testing management’s, and the third-party expert’s, process for developing the valuation models; and (iv) evaluating the significant assumptions used in developing the valuation models. In evaluating management’s assumptions used in the
Valuation of Goodwill
As described in Note 2 and Note 7to the Company’s consolidated financial statements, the Company's consolidated goodwill balance was $6.0 million as of December 31, 2021. The Company performed goodwill impairment testing annually during the fourth quarter, or more frequently if events or changes in circumstances indicate the carrying value may not be recoverable. To estimate the fair value of its reporting units, the Company uses both an income approach and a market approach. The income approach requires management to make significant estimates and judgments regarding future cash flows that are based on a number of factors including actual operating results, forecasted revenue and expenses, discount rate assumptions, and long-term growth rate assumptions. The market approach requires the use of multiples based on financial metrics for both acquisitions or peer group companies. Based on this evaluation, the Company determined that onedevelopment of the reporting units within the construction segment, was impaired and recorded an impairment loss of $3.4 million.
We identified the determination of the fair value of reporting units included in the construction segment as a critical audit matter. The principal considerations for our determination are the subjective and complexvaluation models we considered (i) whether these assumptions related to future revenue and expenses, grow rates, and discount rates under the income approach and market multiples for peer group companies under the market approach used in determining the fair value of reporting units. Auditing these estimates and related assumptions involved especially challenging and subjective auditor judgment due to the nature and extent of audit evidence and effort required to address these matters, including the extent of specialized skill or knowledge needed.
The primary procedures we performed to address this critical audit matter included:
•Evaluating the reasonableness of management’s judgments and assumptions of future revenue, future expenses, and long-term growth rates used in the income approach to forecasts of future cash flows by: (i) comparing the forecasts to internal communications to management and the Board of Directors, (ii) evaluating the impact of alternative assumptions on the valuation and comparing to management’s estimate, and (iii) evaluating whether the forecasts were consistent with evidence obtained in other areas of the audit.
•Evaluatingaudit and (ii) the reasonableness of management’s judgments in determining peer group companies under the market approach.
•Utilizing personnel with specialized knowledge and skill of valuation techniquessensitivity to assist in: (i) testing the underlying source information utilized in the market approach, (ii) assessing the appropriateness and relative weighting of valuation methods, (iii) testing the mathematical accuracychange of the Company’s calculations, (iv) evaluating the reasonableness of the discount rates used in the income approach, (v) evaluating the reasonableness of certain market multiples used in the market approach, and (vi) evaluating the reasonableness of the fair value estimate derived from the market approach using comparable fair value data from comparable peer companies.
We have served as the Company’s auditor since 2015.2022.
Boston, Massachusetts
March 31, 202222, 2024
STAR EQUITY HOLDINGS, INC.
CONSOLIDATED STATEMENTS OF OPERATIONS
(In thousands, except per share amounts)
| | | | | | | | | | | | | | |
| | Year ended December 31, |
| | 2021 | | 2020 |
| Revenues: | | | | |
| Healthcare | | $ | 58,556 | | | $ | 49,232 | |
| Construction | | 48,003 | | | 28,879 | |
| Investments | | — | | | 52 | |
| Total revenues | | 106,559 | | | 78,163 | |
| Cost of revenues: | | | | |
| Healthcare | | 46,097 | | | 39,083 | |
| Construction | | 44,995 | | | 24,832 | |
| Investments | | 227 | | | 261 | |
| Total cost of revenues | | 91,319 | | | 64,176 | |
| Gross profit | | 15,240 | | | 13,987 | |
| | | | |
| Operating expenses: | | | | |
| Selling, general and administrative | | 22,595 | | | 18,635 | |
| Amortization of intangible assets | | 1,728 | | | 2,124 | |
| | | | |
| Goodwill impairment | | 3,359 | | | 436 | |
| Gain on sale of MDOS | | (847) | | | — | |
| Total operating expenses | | 26,835 | | | 21,195 | |
| Loss from continuing operations | | (11,595) | | | (7,208) | |
| Other income (expense): | | | | |
| Other (expense) income | | (550) | | | 874 | |
| Interest expense, net | | (905) | | | (1,292) | |
| Gain on forgiveness of PPP loans | | 4,179 | | | 2,470 | |
| Total other income | | 2,724 | | | 2,052 | |
| Loss from continuing operations before income taxes | | (8,871) | | | (5,156) | |
| Income tax provision | | (60) | | | (129) | |
| Loss from continuing operations, net of income taxes | | (8,931) | | | (5,285) | |
| Income (loss) from discontinued operations, net of income taxes | | 5,948 | | | (1,172) | |
| Net loss | | (2,983) | | | (6,457) | |
| Deemed dividend on Series A Preferred Stock | | (1,906) | | | (1,916) | |
| Net loss attributable to common stockholders | | $ | (4,889) | | | $ | (8,373) | |
| | | | |
| Net loss per common share - basic and diluted* | | | | |
| Net loss per share, continuing operations | | $ | (1.76) | | | $ | (1.44) | |
| Net income (loss) per share, discontinued operations | | $ | 1.17 | | | $ | (0.32) | |
| Net loss per share - basic and diluted | | $ | (0.59) | | | $ | (1.76) | |
| Deemed dividend on Series A Preferred Stock per share | | $ | (0.37) | | | $ | (0.52) | |
| Net loss per share, attributable to common stockholders - basic and diluted | | $ | (0.96) | | | $ | (2.29) | |
| Weighted-average shares outstanding – basic and diluted | | 5,085 | | | 3,659 | |
| | | | |
| Dividends declared per Series A Preferred Stock | | $ | 2.31 | | | $ | — | |
| | | | |
| | | | |
| | | | |
| | | | |
| | | | |
| | | | |
| | | | |
| | | | |
| | | | | | | | | | | | | | |
| | Year ended December 31, |
| | 2023 | | 2022 |
| Revenues: | | | | |
| | | | |
| Construction | | $ | 45,785 | | | $ | 57,149 | |
| Investments | | — | | | — | |
| Total revenues | | 45,785 | | | 57,149 | |
| | | | |
| Cost of revenues: | | | | |
| | | | |
| Construction | | 33,631 | | | 44,489 | |
| Investments | | 228 | | | 290 | |
| Total cost of revenues | | 33,859 | | | 44,779 | |
| | | | |
| Gross profit | | 11,926 | | | 12,370 | |
| | | | |
| Operating expenses: | | | | |
| Selling, general and administrative | | 14,538 | | | 14,195 | |
| Amortization of intangible assets | | 1,734 | | | 1,719 | |
| | | | |
| | | | |
| | | | |
| Total operating expenses | | 16,272 | | | 15,914 | |
| | | | |
| Net income (loss) from continuing operations | | (4,346) | | | (3,544) | |
| | | | |
| Other income (expense): | | | | |
| Other income (expense), net | | 852 | | | (1,336) | |
| Interest income (expense), net | | 973 | | | (564) | |
| | | | |
| Total other income (expense), net | | 1,825 | | | (1,900) | |
| | | | |
| Income (loss) from continuing operations before income taxes | | (2,521) | | | (5,444) | |
| Income tax benefit (provision) | | 614 | | | (383) | |
| Income (loss) from continuing operations, net of tax | | (1,907) | | | (5,827) | |
| Income (loss) from discontinued operations, net of tax | | 27,039 | | | 575 | |
| Net income (loss) | | 25,132 | | | (5,252) | |
| Dividend on Series A perpetual preferred stock | | (1,916) | | | (1,916) | |
| Net income (loss) attributable to common stockholders | | $ | 23,216 | | | $ | (7,168) | |
| | | | |
| Net income (loss) per share | | | | |
| Net income (loss) per share, continuing operations | | | | |
| Basic* | | $ | (0.12) | | | $ | (0.40) | |
| Diluted | | $ | (0.12) | | | $ | (0.39) | |
| Net income (loss) per share, discontinued operations | | | | |
| Basic* | | $ | 1.73 | | | $ | 0.04 | |
| Diluted | | $ | 1.71 | | | $ | 0.04 | |
| Net income (loss) per share | | | | |
| Basic* | | $ | 1.61 | | | $ | (0.36) | |
| Diluted* | | $ | 1.59 | | | $ | (0.35) | |
| | | | |
| | | | |
| | | | |
| Net income (loss) per share, attributable to common shareholders | | | | |
| Basic* | | $ | 1.48 | | | $ | (0.49) | |
| Diluted* | | $ | 1.47 | | | $ | (0.48) | |
| Weighted-average common shares outstanding | | | | |
| Basic* | | 15,638 | | | 14,751 | |
| Diluted* | | 15,775 | | | 14,829 | |
| | | | |
| Dividends declared per share of Series A perpetual preferred stock | | $ | 1.00 | | | $ | 1.00 | |
| | | | |
| | | | |
| | | | |
| | | | |
| | | | |
| | | | |
| | | | |
| | | | |
*Earnings per share may not add due to rounding
See accompanying notes to consolidated financial statements.
STAR EQUITY HOLDINGS, INC.
CONSOLIDATED BALANCE SHEETS
(In thousands, except share amounts and par value) | | December 31, |
| 2021 | | 2020 |
| | December 31, | | | | December 31, |
| | 2023 | | | | 2023 | | 2022 |
| Assets: | Assets: | | | | |
| Current assets: | Current assets: | |
| Current assets: | |
| Current assets: | |
| Cash and cash equivalents | |
| Cash and cash equivalents | |
| Cash and cash equivalents | Cash and cash equivalents | | $ | 4,538 | | | $ | 3,225 | |
| Restricted cash | Restricted cash | | 278 | | | 168 | |
| | Accounts receivable, net | | 15,811 | | | 12,975 | |
| Investments in equity securities | |
| Lumber derivative contracts | |
| Accounts receivable, net of allowances of $191 and $270, respectively | |
| Note receivable, current portion | |
| Inventories, net | Inventories, net | | 8,525 | | | 9,787 | |
| Other current assets | Other current assets | | 2,711 | | | 2,025 | |
| Assets held for sale | | — | | | 20,756 | |
| | Current assets – discontinued operations | |
| Current assets – discontinued operations | |
| Current assets – discontinued operations | |
| Total current assets | Total current assets | | 31,863 | | | 48,936 | |
| Property and equipment, net | Property and equipment, net | | 8,918 | | | 9,762 | |
| Operating lease right-of-use assets, net | Operating lease right-of-use assets, net | | 4,494 | | | 2,935 | |
| Intangible assets, net | Intangible assets, net | | 15,072 | | | 16,900 | |
| Goodwill | Goodwill | | 6,046 | | | 9,542 | |
| | Deferred tax assets | |
| Deferred tax assets | |
| Deferred tax assets | |
| Cost method investment | |
| Notes receivable | |
| Other assets | Other assets | | 1,659 | | | 1,384 | |
| | Non-current assets – discontinued operations | |
| Total assets | Total assets | | $ | 68,052 | | | $ | 89,459 | |
| | Liabilities, Mezzanine Equity and Stockholders’ Equity: | |
| Liabilities and Stockholders’ Equity: | |
| Liabilities and Stockholders’ Equity: | |
| Liabilities and Stockholders’ Equity: | |
| Current liabilities: | |
| Current liabilities: | |
| Current liabilities: | Current liabilities: | |
| Accounts payable | Accounts payable | | $ | 4,277 | | | $ | 4,952 | |
| | Accounts payable | |
| Accounts payable | |
| Accrued liabilities | |
| Accrued compensation | Accrued compensation | | 3,051 | | | 2,825 | |
| Accrued warranty | Accrued warranty | | 569 | | | 214 | |
| Billings in excess of costs and estimated profit | | 312 | | | — | |
| Lumber derivative contracts | |
| | Deferred revenue | Deferred revenue | | 2,457 | | | 2,184 | |
| Short-term debt and current portion of long-term debt | | 12,869 | | | 18,362 | |
| Notes payable to related parties | | — | | | 2,307 | |
| Deferred revenue | |
| Deferred revenue | |
| Short-term debt | |
| | Operating lease liabilities | Operating lease liabilities | | 1,253 | | | 1,278 | |
| Other Current Liabilities | | 3,033 | | | 3,000 | |
| Liabilities held for sale | | — | | | 7,871 | |
| Operating lease liabilities | |
| Operating lease liabilities | |
| Finance lease liabilities | |
| | Current liabilities - discontinued operations | |
| Current liabilities - discontinued operations | |
| Current liabilities - discontinued operations | |
| Total current liabilities | Total current liabilities | | 27,821 | | | 42,993 | |
| Long-term debt, net of current portion | | — | | | 3,700 | |
| | Deferred tax liabilities | Deferred tax liabilities | | 72 | | | 51 | |
| Deferred tax liabilities | |
| Deferred tax liabilities | |
| Operating lease liabilities, net of current portion | Operating lease liabilities, net of current portion | | 3,299 | | | 1,727 | |
| Finance lease liabilities, net of current portion | |
| | Other liabilities | | 1,118 | | | 1,059 | |
| | Non-current liabilities - discontinued operations | |
| | Non-current liabilities - discontinued operations | |
| | Non-current liabilities - discontinued operations | |
| Total liabilities | Total liabilities | | 32,310 | | | 49,530 | |
| | Commitments and contingencies (Note 9) | Commitments and contingencies (Note 9) | | 0 | | 0 |
| | Preferred stock, $0.0001 par value: 10,000,000 shares authorized: Series A Preferred Stock 8,000,000 shares authorized, liquidation preference ($10.00 per share), 1,915,637 shares issued and outstanding at December 31, 2021 and 2020, respectively | | 18,988 | | | 21,500 | |
| Commitments and contingencies (Note 9) | |
| Commitments and contingencies (Note 9) | | | |
| | Stockholders’ equity: | Stockholders’ equity: | |
| Preferred stock, $0.0001 par value: 25,000 shares authorized; Series C Preferred Stock, no shares issued or outstanding | | — | | | — | |
| Common stock, $0.0001 par value: 30,000,000 shares authorized; 5,805,916 and 4,798,367 shares issued and outstanding (net of treasury shares) at December 31, 2021 and 2020, respectively | | — | | | — | |
| Treasury stock, at cost; 258,849 shares at December 31, 2021 and 2020 | | (5,728) | | | (5,728) | |
| Additional paid-in capital | | 150,451 | | | 149,143 | |
| | Accumulated deficit | | (127,969) | | | (124,986) | |
| Total stockholders’ equity | | 16,754 | | | 18,429 | |
| Total liabilities, mezzanine equity and stockholders’ equity | | $ | 68,052 | | | $ | 89,459 | |
| Stockholders’ equity: | |
| Stockholders’ equity: | |
| Preferred stock, $0.0001 par value: 10,000,000 shares authorized: Series A Preferred Stock, 8,000,000 shares authorized, liquidation preference (10.00 per share), 1,915,637 shares issued and outstanding at 2023 and 2022. (Liquidation preference: $18,988,390 as of December 31, 2023 and 2022.) | |
| Preferred stock, $0.0001 par value: 10,000,000 shares authorized: Series A Preferred Stock, 8,000,000 shares authorized, liquidation preference (10.00 per share), 1,915,637 shares issued and outstanding at 2023 and 2022. (Liquidation preference: $18,988,390 as of December 31, 2023 and 2022.) | |
| Preferred stock, $0.0001 par value: 10,000,000 shares authorized: Series A Preferred Stock, 8,000,000 shares authorized, liquidation preference (10.00 per share), 1,915,637 shares issued and outstanding at 2023 and 2022. (Liquidation preference: $18,988,390 as of December 31, 2023 and 2022.) | |
| | | | | | | | | | | | | | |
| Preferred stock, $0.0001 par value: 25,000 shares authorized; Series C Preferred stock, no shares issued or outstanding | | — | | | — | |
| Common stock, $0.0001 par value: 50,000,000 and 50,000,000 shares authorized; 15,826,217 and 15,177,919 shares issued and outstanding (net of treasury shares) at December 31, 2023 and 2022, respectively | | 2 | | | 1 | |
| Treasury stock, at cost; 258,849 shares at December 31, 2023 and 2022, respectively | | (5,728) | | | (5,728) | |
| Additional paid-in capital | | 160,126 | | | 161,715 | |
| | | | |
| Accumulated deficit | | (108,089) | | | (133,221) | |
| Total stockholders’ equity | | 65,299 | | | 41,755 | |
| Total liabilities and stockholders’ equity | | $ | 75,496 | | | $ | 73,302 | |
See accompanying notes to consolidated financial statements.
STAR EQUITY HOLDINGS, INC.
CONSOLIDATED STATEMENTS OF CASH FLOWS
(In thousands)
| | | Year ended December 31, | | | | Year ended December 31, |
| | 2023 | | | | 2023 | | 2022 |
| Operating activities | |
| Net income (loss) | |
| Net income (loss) | |
| Net income (loss) | |
| Adjustments to reconcile net income (loss) to net cash provided (used) by operating activities: | |
| Depreciation of property and equipment | |
| Depreciation of property and equipment | |
| Depreciation of property and equipment | |
| Amortization of intangible assets | |
| Non-cash lease expense | |
| Provision for bad debt, net | |
| Stock-based compensation | |
| Non-cash interest expense | |
| | | Year ended December 31, |
| | 2021 | | 2020 |
| Operating activities | | | | |
| Net loss | | $ | (2,983) | | | $ | (6,457) | |
| Adjustments to reconcile net loss to cash used in operating activities: | |
| Depreciation | | 1,751 | | | 6,330 | |
| Amortization of intangible assets | | 1,728 | | | 3,087 | |
| Non-cash lease expense | | 1,453 | | | 1,561 | |
| Provision for bad debts | | 656 | | | 66 | |
| Stock-based compensation | | 527 | | | 524 | |
| Non-cash interest expense | | 182 | | | 316 | |
| Write-off of borrowing costs | | 130 | | | — | |
| Gain on disposal of discontinued operations | |
| | Gain on sale of discontinued operations | | (5,159) | | | — | |
| Gain on sale of MDOS | | (847) | | | — | |
| (Gain) loss on sale of assets | | (18) | | | 150 | |
| Loss on write-off of software implementation costs | | 1,372 | | | — | |
| Gain on Paycheck Protection Program loan forgiveness | | (4,179) | | | (2,470) | |
| | Goodwill impairment | | 3,359 | | | 436 | |
| Gain on disposal of discontinued operations | |
| | Gain on disposal of discontinued operations | |
| Bargain purchase gain on acquisition | |
| (Gain) Loss on sale of assets | |
| | Deferred income taxes | Deferred income taxes | | 22 | | | 43 | |
| Other, net | | (319) | | | (22) | |
| Deferred income taxes | |
| Deferred income taxes | |
| | Unrealized (gain) loss on equity securities and lumber derivatives | |
| Unrealized (gain) loss on equity securities and lumber derivatives | |
| Unrealized (gain) loss on equity securities and lumber derivatives | |
| Changes in operating assets and liabilities: | Changes in operating assets and liabilities: | |
| Accounts receivable | |
| Accounts receivable | |
| Accounts receivable | Accounts receivable | | (3,701) | | | 1,225 | |
| Inventories | Inventories | | 1,262 | | | (2,572) | |
| Other assets | Other assets | | (637) | | | (1,201) | |
| Accounts payable | Accounts payable | | (1,001) | | | (2,458) | |
| Accrued compensation | Accrued compensation | | 430 | | | (1,109) | |
| Deferred revenue and billings in excess of costs and estimated profit | Deferred revenue and billings in excess of costs and estimated profit | | 499 | | | 478 | |
| Operating lease liabilities | Operating lease liabilities | | (1,422) | | | (1,586) | |
| Other liabilities | Other liabilities | | 445 | | | (1,294) | |
| Net cash used in operating activities | | (6,450) | | | (4,953) | |
| Net cash provided (used) by operating activities | |
| | Investing activities | |
| Investing activities | |
| Investing activities | Investing activities | | | | |
| Purchases of property and equipment | Purchases of property and equipment | | (788) | | | (1,493) | |
| Purchases of property and equipment | |
| Purchases of property and equipment | |
| Proceeds from sale of discontinued operations | |
| Proceeds from sale of property and equipment | |
| Purchases of equity securities | |
| Proceeds from sales of equity securities | |
| Cash paid for business acquisition | |
| | Proceeds from sale of discontinued operations | | 18,750 | | | — | |
| Net cash provided (used) by investing activities | |
| Net cash provided (used) by investing activities | |
| Net cash provided (used) by investing activities | |
| | Proceeds from sale of property and equipment | | 132 | | | 161 | |
| Proceeds from sales of derivatives and equity securities | | 42 | | | — | |
| Purchases of securities available-for-sale | | (34) | | | — | |
| Payments to acquire interest in variable interest entity | | (300) | | | — | |
| Net cash provided by (used in) investing activities | | 17,802 | | | (1,332) | |
| Financing activities | |
| Financing activities | |
| Financing activities | Financing activities | | | | |
| Proceeds from borrowings | Proceeds from borrowings | | 117,601 | | | 120,485 | |
| Proceeds from borrowings | |
| Proceeds from borrowings | |
| Repayment of debt | Repayment of debt | | (125,076) | | | (116,301) | |
| Loan issuance costs and extinguishment costs | | — | | | (317) | |
| Net proceeds from sale and exercise of common stock, over-allotment options and warrants | | 629 | | | 5,193 | |
| Equity proceeds from related party private placement | | 2,113 | | | — | |
| Fees paid on equity issuance costs | | (37) | | | (18) | |
| | Proceeds from exercise of warrants | |
| Proceeds from exercise of warrants | |
| Proceeds from exercise of warrants | |
| Fees paid on issuance of common stock | |
| Proceeds from the sale of common stock, warrants, and exercise of over allotment options | |
| | Taxes paid related to net share settlement of equity awards | |
| Taxes paid related to net share settlement of equity awards | |
| Taxes paid related to net share settlement of equity awards | Taxes paid related to net share settlement of equity awards | | (18) | | | (10) | |
| Repayment of obligations under finance leases | Repayment of obligations under finance leases | | (769) | | | (972) | |
| Preferred stock dividends paid | Preferred stock dividends paid | | (4,418) | | | — | |
| Net cash (used in) provided by financing activities | | (9,975) | | | 8,060 | |
| Net increase in cash and cash equivalents, including cash classified within current assets held for sale | | 1,377 | | | 1,775 | |
| Less: Net (decrease) increase in cash classified within current assets held for sale | | (46) | | | 369 | |
| Net increase in cash, cash equivalents, and restricted cash | | 1,423 | | | 1,406 | |
| Net cash provided (used) by financing activities | |
| Net change in cash, cash equivalents, and restricted cash including cash classified within current assets-discontinued operations | |
| Less: Net (decrease) increase in cash classified within current assets-discontinued operations | |
| Net change in cash, cash equivalents, and restricted cash | |
| Cash, cash equivalents, and restricted cash at beginning of year | Cash, cash equivalents, and restricted cash at beginning of year | | 3,393 | | | 1,987 | |
| Cash, cash equivalents, and restricted cash at end of year | Cash, cash equivalents, and restricted cash at end of year | | $ | 4,816 | | | $ | 3,393 | |
| | Reconciliation of cash, cash equivalents, and restricted cash at end of year | |
| Reconciliation of cash, cash equivalents, and restricted cash at end of year | |
| Reconciliation of cash, cash equivalents, and restricted cash at end of year | |
| | | | | | | | | | | | | | |
| | | | |
| Reconciliation of cash, cash equivalents, and restricted cash at end of year | | | | |
| Cash and cash equivalents | | $ | 4,538 | | | $ | 3,225 | |
| Restricted cash | | 278 | | | 168 | |
| | $ | 4,816 | | | $ | 3,393 | |
| | | | |
| Supplemental Information | | | | |
| Cash paid during the year for interest | | $ | 717 | | | $ | 965 | |
| Cash paid during the year for income taxes | | $ | 344 | | | $ | 30 | |
| | | | |
| Non-Cash Investing Activities | | | | |
| MDOS Promissory Note Receivable | | $ | 1,385 | | | $ | — | |
| Non-Cash Financing Activities | | | | |
| Gain on Paycheck Protection Program Loan Forgiveness | | $ | 4,179 | | | $ | 2,470 | |
| | | | | | | | | | | | | | |
| Cash and cash equivalents | | $ | 18,326 | | | $ | 4,377 | |
| Restricted cash | | 620 | | | 142 | |
| Cash, cash equivalents, and restricted cash at end of period | | $ | 18,946 | | | $ | 4,519 | |
| | | | |
| Supplemental Information | | | | |
| Cash paid during the year for interest | | $ | 261 | | | $ | 689 | |
| Cash paid during the year for income taxes | | $ | 651 | | | $ | 432 | |
| | | | |
| Non-Cash Investing Activities | | | | |
| Noncash note receivable | | 7,000 | | | 487 | |
| Noncash investment in private company | | 6,000 | | | — | |
| | | | |
| Non-Cash Financing Activities | | | | |
| | | | |
| Noncash property, plant, and equipment obtained in exchange for finance lease liabilities | | — | | | 90 | |
| Noncash right-of-use assets obtained in exchange for operating lease liabilities | | — | | | 1,492 | |
See accompanying notes to consolidated financial statements.
STAR EQUITY HOLDINGS, INC.
CONSOLIDATED STATEMENTS OF MEZZANINE AND STOCKHOLDERS’ EQUITY
(In thousands)
| | | | | | | | | | | | | | | | | | | | | | | | | | | | | | | | | | | | | | | | | | | | | | | | | | | | |
| | Perpetual Preferred Stock | | Common stock | | Treasury Stock | | Additional
paid-in
capital | | | | Accumulated
deficit | | Total
stockholders’
equity |
| | Shares | | Amount | | Shares | | Amount | | |
| Balance at December 31, 2019 | | 1,916 | | | $ | 19,602 | | | 2,050 | | | $ | — | | | $ | (5,728) | | | $ | 145,352 | | | | | $ | (118,529) | | | $ | 21,095 | |
| | | | | | | | | | | | | | | | | | |
| Stock-based compensation | | — | | | — | | | — | | | — | | | — | | | 524 | | | | | — | | | 524 | |
| Shares issued under stock incentive plans, net of shares withheld for employee taxes | | — | | | — | | | 55 | | | — | | | — | | | (10) | | | | | — | | | (10) | |
| Accrued dividend on perpetual preferred stock | | — | | | 1,916 | | | — | | | — | | | — | | | (1,916) | | | | | — | | | (1,916) | |
| Net proceeds from sale and exercise of common stock, over allotment options and warrants | | — | | | — | | | 2,693 | | | — | | | — | | | 5,193 | | | | | — | | | 5,193 | |
| Fees paid on issuance of preferred stock | | — | | | (18) | | | — | | | — | | | — | | | — | | | | | — | | | — | |
| Net loss | | — | | | — | | | — | | | — | | | — | | | — | | | | | (6,457) | | | (6,457) | |
| Balance at December 31, 2020 | | 1,916 | | | 21,500 | | | 4,798 | | | — | | | (5,728) | | | 149,143 | | | | | (124,986) | | | 18,429 | |
| | | | | | | | | | | | | | | | | | |
| Stock-based compensation | | — | | | — | | | — | | | — | | | — | | | 527 | | | | | — | | | 527 | |
| Shares issued under stock incentive plans, net of shares withheld for employee taxes | | — | | | — | | | 726 | | | — | | | — | | | (18) | | | | | — | | | (18) | |
| Equity issuance costs | | — | | | — | | | — | | | — | | | — | | | (37) | | | | | — | | | (37) | |
| Equity proceeds from related party private placement | | — | | | — | | | — | | | — | | | — | | | 2,113 | | | | | — | | | 2,113 | |
| Accrued dividend on perpetual preferred stock | | — | | | 1,906 | | | — | | | — | | | — | | | (1,906) | | | | | — | | | (1,906) | |
| Preferred stock dividends paid | | — | | | (4,418) | | | — | | | — | | | — | | | — | | | | | — | | | — | |
| Proceeds received from warrant exercise | | — | | | — | | | 281 | | | — | | | — | | | 629 | | | | | — | | | 629 | |
| | | | | | | | | | | | | | | | | | |
| Net loss | | — | | | — | | | — | | | — | | | — | | | — | | | | | (2,983) | | | (2,983) | |
| Balance at December 31, 2021 | | 1,916 | | | $ | 18,988 | | | 5,805 | | | $ | — | | | $ | (5,728) | | | $ | 150,451 | | | | | $ | (127,969) | | | $ | 16,754 | |
| | | | | | | | | | | | | | | | | | | | | | | | | | | | | | | | | | | | | | | | | | | | | | | | | | | | | | | | | | | | | | | | |
| | Perpetual Redeemable Preferred Stock | | Perpetual Preferred Stock | | Common stock | | Treasury Stock | | Additional
paid-in
capital | | | | Accumulated
deficit | | Total
stockholders’
equity |
| | Shares | | Amount | | Shares | | Amount | | Shares | | Amount | | |
| Balance at December 31, 2021 | | 1,916 | | | $ | 18,988 | | | — | | | $ | — | | 5,805 | | | $ | — | | $ | (5,728) | | | $ | 150,451 | | | | | $ | (127,969) | | | $ | 16,754 | |
| | | | | | | | | | | | | | | | | | | | | | |
| Stock-based compensation | | — | | | — | | | — | | | — | | | — | | | — | | | — | | | 438 | | | | | — | | | 438 | |
| Shares issued under stock incentive plans, net of shares withheld for employee taxes | | — | | | — | | | | | — | | | 198 | | | — | | | — | | | (5) | | | | | — | | | (5) | |
| Equity issuance costs | | — | | | — | | | — | | | — | | | — | | | — | | | — | | | (450) | | | | | — | | | (450) | |
| | | | | | | | | | | | | | | | | | | | | | |
| Dividends to holders of preferred stock ($0.25 per share) | | — | | | 479 | | | — | | | — | | | — | | | — | | | — | | | (1,916) | | | | | — | | | (1,916) | |
| Preferred stock dividends paid | | — | | | (479) | | | — | | | — | | | — | | | — | | | — | | | — | | | | | — | | | — | |
| | | | | | | | | | | | | | | | | | | | | | |
| | | | | | | | | | | | | | | | | | | | | | |
| Proceeds from the sale of common stock, warrants, and exercise of over allotment options | | — | | | — | | | — | | | — | | | 9,175 | | | 1 | | | — | | | 13,197 | | | | | — | | | 13,198 | |
| Reclassification of preferred stock to permanent equity (See Note 2) | | (1,916) | | | (18,988) | | | 1,916 | | | 18,988 | | | — | | | — | | | — | | | — | | | | | — | | | 18,988 | |
| Net income (loss) | | — | | | — | | | — | | | — | | | — | | | — | | | — | | | — | | | | | (5,252) | | | (5,252) | |
| Balance at December 31, 2022 | | — | | | $ | — | | | 1,916 | | | $ | 18,988 | | | 15,178 | | | $ | 1 | | | (5,728) | | | $ | 161,715 | | | | | $ | (133,221) | | | $ | 41,755 | |
| Stock-based compensation | | — | | | — | | | — | | | — | | | — | | | — | | | — | | | 340 | | | | | — | | | 340 | |
| Shares issued under stock incentive plans, net of shares withheld for employee taxes | | — | | | — | | | — | | | — | | | 323 | | | 0.5 | | | — | | | (16) | | | | | — | | | (16) | |
| Dividends to holders of preferred stock ($0.25 per share) | | — | | | — | | | — | | | — | | | — | | | — | | | — | | | (1,916) | | | | | — | | | (1,916) | |
| | | | | | | | | | | | | | | | | | | | | | |
| | | | | | | | | | | | | | | | | | | | | | |
| Proceeds from the sale of common stock, warrants, and exercise of over allotment options | | — | | | — | | | — | | | — | | | 325 | | | 0.5 | | | — | | | 3 | | | | | — | | | 4 | |
| | | | | | | | | | | | | | | | | | | | | | |
| Net income (loss) | | — | | | — | | | — | | | — | | | — | | | — | | | — | | | — | | | | | 25,132 | | | 25,132 | |
| Balance at December 31, 2023 | | — | | | $ | — | | | 1,916 | | | $ | 18,988 | | | 15,826 | | | $ | 2 | | | $ | (5,728) | | | $ | 160,126 | | | | | $ | (108,089) | | | $ | 65,299 | |
| | | | | | | | | | | | | | | | | | | | | | |
See accompanying notes to consolidated financial statements.
STAR EQUITY HOLDINGS, INC.
NOTES TO CONSOLIDATED FINANCIAL STATEMENTS
Note 1. The Company
Star Equity Holdings, Inc. (“Star Equity”, or the “Company”) is a diversified holding company with 3two divisions: Healthcare, Construction and Investments. Star Equity,We previously had a Healthcare division which was incorporatedsold on May 4, 2023, as further described in Delaware in 1997, was formerly known as Digirad Corporation until it changed its name to Star Equity Holdings, Inc. effective January 1, 2021.Note 3. Discontinued Operations. Unless the context requires otherwise, in this report the terms “we,” “us,” and, “our” refer to Star Equity and our wholly owned subsidiaries.
Healthcare
Healthcare designs, manufactures, and distributes diagnostic medical imaging products. Healthcare operates in 2 businesses: Diagnostic Services and Diagnostic Imaging. The Diagnostic Services business offers imaging services to healthcare providers as an alternative to purchasing the equipment or outsourcing the procedure. The Diagnostic Imaging business develops, sells, and maintains solid-state gamma cameras.
Construction
Construction manufactures modular housing units for commercial and residential applications. Construction operates in 2two businesses: (i) modular building manufacturing and (ii) structural wall panel and wood foundation manufacturing, including building supply retail operations. The modular building manufacturing business services the northeast United States and is operated by KBS Builders, Inc. (“KBS”) in Maine. The structural wall panel and wood foundation manufacturing segmentbusiness is operated by EdgeBuilder, Inc. (“EdgeBuilder”), and the retail building supplies are sold through Glenbrook Building Supply, Inc. (“Glenbrook” and together with EdgeBuilder, “EBGL”). EBGL is based in and services the Greater Minneapolis metropolitan area. KBS, EdgeBuilder and Glenbrook are wholly owned subsidiaries of Star Equity and are referred to collectively herein, and together with ATRM Holdings, Inc. (“ATRM”), as the “Construction Subsidiaries.”
EBGL expanded its market share of the Greater Minneapolis area via the acquisition of all of the assets of Big Lake Lumber Inc. (“BLL”) in October 2023. BLL’s operations were integrated into and became part of Glenbrook’s operations. See Note 16. Mergers and Acquisitions for further information.
Investments
Investments generates intercompany revenue from the lease of commercial properties and equipment through Star Real Estate Holdings. Our investmentsInvestments division is an internally-focused unit that is directly supervised by Star Equity management.unit. This entity was established to hold our corporate-owned real estate, which currently includes our three manufacturing facilities in Maine that are leased to KBS and EBGL, as well as any minority investments we make in public and private companies. Star Equity Fund GP, LLC (“Star Equity Fund”), Star Investment Management, LLC (“Star Investment”), Star Equity Investment Holdings Inc. (“SEI”), Star Real Estate Holdings USA, Inc. (“SRE”), and the subsidiaries of SRE that are included in this division are referred to collectively herein as the “Investments Subsidiaries.”
As of December 31, 2021, our business is organized into 4 reportable segments: Diagnostic Services, Diagnostic Imaging, Construction, and Investments in the continuing operations. See Note 15. Segments, within the notes to our accompanying consolidated financial statements for financial data relating to our segments. For discussion purposes, we categorized our Diagnostic Services and Diagnostic Imaging reportable segments as “Healthcare.”
Note 2. Basis of Presentation and Significant Accounting Policies
Basis of Presentation
The consolidated financial statements are prepared in conformity with generally accepted accounting principles (“GAAP”) accepted in the United States of America and include our wholly owned subsidiaries financial statements. All intercompany accounts and transactions have been eliminated. The divestiture of our former Mobile Healthcare division’s assets and liabilities as of December 31, 2021 and 2020 aredivision is separately presented as held for sale ondiscontinued operations in the Consolidated Balance SheetsStatement of Operations for the years ended December 31, 2023 and discontinued operations on the Consolidated Statements of Operations.December 31, 2022. Refer to Note 3. Discontinued Operations for additional information.
Mezzanine Equity
Pursuant to the Certificate of Designations, Rights and Preferences of 10% Series A Cumulative Perpetual Preferred Stock (the “Series A Preferred Stock”) of Star Equity Holdings, Inc. (formerly Digirad Corporation) (the “Certificate of Designations”), upon a Change of Control Triggering Event, as defined in the Certificate of Designations, holders of the CompanySeries A Preferred Stock mayhad the ability to require the Company to redeem the CompanySeries A Preferred Stock at a price of $10.00 per share, plus any accumulated and unpaid dividends (a “Change of Control Redemption”).dividends. As this redemption feature of the shares iswas not solely within the control of the Company, the CompanySeries A Preferred Stock doesdid not qualify as permanent equity and has beenwas classified as mezzanine or temporary equity. Company
On June 2, 2022, the Certificate of Designations was amended to include a “Special Optional Redemption Right” at the Company’s discretion and to extinguish the option of preferred stockholders to redeem preferred shares upon a Change of Control Triggering Event, as defined in the Certificate of Designations, as amended. As the redemption features of the Series A Preferred Stock is not redeemable and it was not probable that ourare now solely within the control of the Company, the Series A Preferred Stock would become redeemablequalifies as of December 31, 2021permanent equity and 2020. Therefore, we are not currently requiredhas been reclassified to accrete the Company Preferred Stock to its redemption value.
permanent equity effective June 2, 2022.In addition to a Change of Control Redemption,the foregoing redemption features, the Certificate of Designations also provides that we may redeem (at our option, in whole or in part) the Series A Preferred Stock following the fifth anniversary of issuance of the CompanySeries A Preferred Stock, at a cash redemption price of $10.00 per share, plus any accumulated and unpaid dividends.
Discontinued Operations
On October 30, 2020, we entered into the DMS Purchase Agreement (as definedRefer to preferred stock dividends discussed in Note 3) to sell all of the issued and outstanding common stock of DMS Health Technologies, Inc. (“DMS Health”), which operated our Mobile Healthcare business. The purchase price for the DMS Sale Transaction (as defined in Note 3.) was $18.75 million in cash, subject to certain adjustments, including a working capital adjustment. The DMS Sale Transaction was completed on March 31, 2021. As of December 31, 2020, the Mobile Healthcare business met the criteria to be classified as held for sale. This segment is reported on the Consolidated Statements of Operations as discontinued operations and on the Consolidated Balance Sheets as Assets and Liabilities held for sale.
We allocated a portion of interest expense to discontinued operations since the proceeds received from the sale were required to be used to pay down outstanding borrowings under our revolving credit facility with Sterling National Bank, a national banking association (“Sterling” or “SNB”), further described in Note 8.17. Debt. The allocation was based on the ratio of assets generated based on the borrowing capacity to total borrowings capacity for the period.
Cash flows used in or provided by DMS Health operations as part of discontinued operations and prior year results are further disclosed in Note 3. Discontinued Operations.
Going Concern
The accompanying consolidated financial statements have been prepared assuming we will continue as a going concern, which contemplates the realization of assets and settlement of obligations in the normal course of business. We incurred losses from continuing operations, net of income taxes of approximately $8.9 million and $5.3 million for the years ended December 31, 2021 and 2020, respectively. We have an accumulated deficit of $128.0 million and $125.0 million as of December 31, 2021 and 2020, respectively. Net cash used in operations was $6.5 million for the year ended December 31, 2021, compared to net cash used in operations of $5.0 million for the year ended 2020. The Company will likely need to secure additional financing in the future to accomplish its business plan over the next several years and there can be no assurance on the availability or terms upon which such financing and capital might be available at that time.
At December 31, 2021, we had approximately $12.9 million in debt outstanding. All of our debt is categorized as short-term on our Consolidated Balance Sheets. For more detail, see Note 8. Debt. The SNB Loan, which has a current balance owed of $7.0 million, supports our Healthcare business. While it matures in 2024, GAAP rules require that the outstanding balance be classified as short-term debt. This is due to both the automatic sweep feature embedded in the traditional lockbox arrangement and the subjective acceleration clause in the SNB Loan and Security Agreement. As of December 31, 2021, we were in compliance with all covenants related to our Healthcare division.
As of December 31, 2021, we had $4.8 million outstanding on our two Construction division revolvers with Gerber Finance, Inc. (“Gerber”). As of that date, we were not in compliance with our bi-annual covenants on either of these Gerber facilities. However, we obtained waivers from Gerber for the bi-annual measurement period ended December 31, 2021. While Gerber has historically provided us with such waivers, when needed, there is no assurance that we will be able to receive waivers for covenant violations in the future.
We also have $1.1 million outstanding on the Star Loan, on which we are and historically have been making timely payments in full compliance with all covenants. Related party notes of $2.3 million that were outstanding as of December 31, 2020 were fully paid off on April 1, 2021 using proceeds from the DMS Sale Transaction. In addition, as of December 31, 2021, we had cash and cash equivalents of $4.5 million.
We are currently forecasting a covenant breach on our SNB Loan Agreement within twelve months after the date these financial statements have been issued. Upon the occurrence and during the continuation of an event of default under the SNB Loan Agreement, SNB may, among other things, declare the loans and all other obligations under the SNB Loan Agreement immediately due and payable and increase the interest rate at which loans and obligations under the SNB Loan Agreement bear interest. Therefore, management concludes that this forecasted violation raises substantial doubt about our ability to continue as a going concern within twelve months after the date that financial statements are issued if we are not able to restructure those agreements or receive a waiver for non-compliance with our covenants. Our financial statements do not reflect any adjustments that might result from the outcome of this uncertainty. Management is taking a number of steps to avoid these breaches and/or restructure the covenants within these agreements. These steps include improving our operations, considering additional or alternative financing arrangements, and negotiating with current lenders to amend our covenants. While we believe that we maintain strong transparency and relationships with our lenders, there can be no assurance that we will be successful in these efforts.
On January 24, 2022, we closed an underwritten public offering (the “Offering”) pursuant to an underwriting agreement with Maxim Group LLC, as representative of the underwriters. The Offering was for 9,500,000 shares of common stock (or pre-funded warrants to purchase shares of common stock in lieu thereof) and warrants to purchase up to 9,500,000 shares of common stock (the “common warrants”). Each share of common stock (or pre-funded warrant in lieu thereof) was sold together with one common warrant to purchase one share of common stock at a price of $1.50 per share and common warrant. Gross proceeds, before deducting underwriting discounts and offering expenses and excluding any proceeds we may receive upon exercise of the common warrants, were $14.3 million and net proceeds were $12.8 million. In the first quarter of 2022, we declared and made a $0.5 million preferred stock dividend payment. Refer to Note 17. Redeemable Preferred Stock for details.
Use of Estimates
The preparation of consolidated financial statements in conformity with GAAPU.S. Generally Accepted Accounting Practices (“GAAP”) requires management to make estimates and assumptions that affect the amounts reported in the consolidated financial statements and disclosures made in the accompanying notes to the consolidated financial statements. Significant estimates and judgments include those related to revenue recognition, goodwill valuation, business combination accounting, and income taxes. Actual results could materially differ from those estimates.
Revenue Recognition
We recognize revenue in accordance with Accounting Standards Codification (“ASC”) Topic 606 and, specific to our discontinued Healthcare Operations, Topic 842, in the year of 2021 and 2020, which areas further explained below.
Pursuant to Accounting Standards Codification (ASC)ASC 606, Revenue from Contracts with Customers, we recognize revenue when a customer obtains control of promised goods or services. We record the amount of revenue that reflects the consideration that it expects to receive in exchange for those goods or services. We apply the following five-step model in order to determine this amount: (i) identification of the promised goods or services in the contract; (ii) determination of whether the promised goods or services are performance obligations, including whether they are distinct in the context of the contract; (iii) measurement of the transaction price, including the constraint on variable consideration; (iv) allocation of the transaction price to the performance obligations; and (v) recognition of revenue when (or as) the Company satisfies each performance obligation.
The Company has elected to use the practical expedient under ASC 606 to exclude disclosures of unsatisfied remaining performance obligations for (i) contracts having an original expected length of one year or less or (ii) contracts for which the practical expedient has been applied to recognize revenue at the amount for which it has a right to invoice.
Revenue is recognizedWe recognize revenue upon transfer of control of promised products or services to customers in an amount that reflects the consideration we expect to receive in exchange for those products or services. Taxes collected from customers, which are subsequently remitted to governmental authorities, are excluded from revenue.
The majority of our contracts have a single performance obligation, asincluding certain instances which we provide a series of distinct goods or services that are substantially the same and are transferred with the same pattern to the customer. For contracts with multiple performance obligations, we allocate the total transaction price to each performance obligation using our best estimate of the standalone selling price of each distinct good or service in the contract. We use an observable price to determine the stand-alone selling price for separate performance obligations or a cost plus margin approach when one is not available. For bill and hold sales, we determine when the customer obtains control of the product on a case-by-case basis to determine the amount of revenue to recognize each period.
Revenue recognition is evaluated on a contract by contract basis. Performance obligations are satisfied over time as work progresses or at a point in time. A performance obligation is satisfied over time ifwhen the company creates an asset with no alternative use and we have an enforceable right to payment, including a reasonable profit margin. Determining if an enforceable right to payment includes a reasonable profit margin requires judgment and is assessed on a contract by contract basis. For contracts requiring over time revenue recognition, the selection of the method to measure progress towards completion requires judgment and is based on the nature of the products or services to be provided. We use a cost-based input measurement of progress because it best depicts the transfer of assets to the customer, which occurs as costs are incurred during the manufacturing process or as services are rendered. Under the cost-based measure of progress, the extent of progress towards completion is measured based on the costs incurred to date.
Our products are generally not sold with a right of return and the Company does not provide significant credits or incentives, which may be variable consideration when estimating the amount of revenue to be recognized.
Healthcare ServicesConstruction Revenue Recognition. We generate service revenue primarily from providing diagnostic imaging services to our customers. Service revenue within our Diagnostic Imaging Services reportable segment is derived from providing our customers with contract diagnostic imaging services, which includes use of our imaging systems, qualified personnel, radiopharmaceuticals, licensing, logistics and related items required to perform testing in their own offices. We bill customers either on a per-scan or fixed-payment methodology, depending upon the contract that is negotiated with the customer. Within our Diagnostic Imaging Service segment, we also rent cameras to healthcare customers for use in their operations. Rental revenues are structured as either a weekly or monthly payment arrangement, and are recognized in the month rental assets are provided. Revenue related to provision of our services is recognized at the time services are performed.
Healthcare Product and Product-Related Revenue Recognition. We generate revenue from product and product-related sales, primarily from the sale of gamma cameras, accessories, and radiopharmaceuticals doses.
Diagnostic Imaging product revenues are generated from the sale of internally developed solid-state gamma camera imaging systems and post-warranty camera maintenance service contracts. Revenue from sales of imaging systems is generally recognized at point in time upon delivery of systems and acceptance by customers. We also provide installation services and training on cameras sold, primarily in the United States. Installation and initial training is generally performed shortly after delivery and the revenue related to the provision of these services is recognized at the time services are performed. Neither installation nor training is essential to the functionality of the product. Finally, we offer camera maintenance service contracts that are sold beyond the term of the initial warranty, generally one year from the date of purchase. Revenue from these service contracts is deferred and recognized ratably over the period of the obligation. We offer time and material services and record revenue when service is performed. Radiopharmaceuticals doses revenue is generally recognized when delivered to the customer.
Construction Revenue Recognition. Within the Construction division, we service residential and commercial construction projects by manufacturing modular housing units and other products and supplysupplying general contractors with building materials. KBS manufactures modular buildings for both single-family residential homes and larger, commercial building projects. EdgeBuilder manufactures structural wall panels, permanent wood foundation systems and other engineered wood products, and Glenbrook is a retail supplier of lumber and other building supplies. Retail sales at Glenbrook are recognized at the point of sale. For bill and hold sales, we determine when the customer obtains control of the product on a case-by-case basis to determine the amount of revenue to recognize each period. Revenue is generally recognized at point in time upon delivery of product or over time by measuring progress towards completion.
Billings in excess of costs and estimated earningsprofit.We recognize billings in excess of costs and estimated profit on uncompleted contracts arewithin current liabilities, whichliabilities. Such amounts relate to fixed-price contracts recognized over time, and represents payments in advance of performing the related contract work. Billings in excess of costs and estimated earningsprofit on uncompleted contracts isare not considered to be a significant financing component because it isthey are generally used to meet working capital demands that can be higher in the early stages of a contract. Contract liabilities are classified in deferred revenue in the Consolidated Balance Sheets. Contract liabilities are reduced when the associated revenue from the contract is recognized, which is generally within one year. There is no liability associated with billings in excess of costs at December 31, 2023 or December 31, 2022.
Healthcare Revenue Recognition. We generated Healthcare service revenue and product and product-related sales revenue primarily from providing diagnostic services to our customers and from the sale of gamma cameras, accessories, and radiopharmaceuticals doses. Service revenues within our former Healthcare reportable segment, which is now recorded as part of discontinued operations, and, in 2023 covers the period through the date of sale of our Healthcare division as discussed in Note 2. Discontinued Operations, was derived from providing our customers with contract diagnostic services, which included use of our imaging systems, qualified personnel, radiopharmaceuticals, licensing, logistics and related items required to perform testing in their own offices. We billed customers either on a per-scan or fixed-payment methodology, depending upon the contract negotiated with the customer. We also rented cameras to customers for use in their healthcare operations. Rental revenues were structured as either a weekly or monthly payment arrangement, and were recognized in the month that rental assets were provided. Revenue related to provision of our services was recognized at the time services were performed. Revenue from product and product-related sales, which is recorded as part of discontinued operations, was derived primarily from the sale of gamma cameras, accessories, and radiopharmaceuticals doses.
Contract Costs.Costs. We recognize an asset for the incremental costs of obtaining a contract with a customer if we expect the benefit of those costs to be longer than one year. The Company applies a practical expedient to expense costs as incurred for costs to obtain a contract when the amortization period would have been one year or less. These costs mainly include the internal sales commissions; under the terms of these programs these are generally earned and the costs are recognized at the time the revenue is recognized. As of December 31, 2023 and 2022, there were no contract costs recognized.
Deferred Revenue. Deferred revenue represents customer deposits and advanced payments for contracts that are subject to point-in-time recognition. We have determined our contracts do not include a significant financing component.
Leases
Lessee Accounting
We determine if an arrangement is a lease at inception. Operating leases are included in operating lease right-of-use (“ROU”) assets, operating lease liabilities, and operating lease liabilities, net of current portion in our Consolidated Balance Sheets. Finance leases are included in property and equipment, other current liabilities, and other long-term liabilities in our Consolidated Balance Sheets.
ROU assets represent our right to use an underlying asset for the lease term and lease liabilities represent our obligation to make lease payments arising from the lease. Operating lease ROU assets and liabilities are recognized at commencement date based on the present value of lease payments over the lease term. We use the implicit discount rate when readily determinable; however, as most of our leases do not provide an implicit discount rate, we use an incremental borrowing rate based on the information available at commencement date in determining the present value of lease payments. The operating lease ROU asset also includes any lease payments made and excludes lease incentives. Our lease valuation may include options to extend or terminate the lease when it is reasonably certain that we will exercise that option. Lease expense for lease payments is recognized on a straight-line basis over the lease term.
We elected to not separate lease and non-lease components of our operating leases in which it is the lessee and lessor.leases. Additionally, the Company elected not to recognize ROU assets and leases liabilities that arise from short-term leases of twelve months or less.
Lessor Accounting
We determine lease classification at the commencement date. Leases not classified as sales-type or direct financing leases are classified as operating leases. The primary accounting criteria used for lease classification are (a) review to determine if the lease transfers ownership of the underlying asset to the lessee by the end of the lease term, (b) review to determine if the lease grants the lessee a purchase option that the lessee is reasonably certain to exercise, (c) determine, using a seventy-five percent or more threshold, if the lease term is for a major part of the remaining economic life of the underlying asset (however, we do not use this classification criterion when the lease commencement date falls within the last 25 percent of the total economic life of the underlying asset) and (d) determine, using a ninety percent or more threshold, if the present value of the sum of the lease payments and any residual value guarantees equal or exceeds substantially all of the fair value of the underlying asset. We do not lease equipment of such a specialized nature that it is expected to have no alternative use to us at the end of the lease term.
We elected the operating lease practical expedient for leases to not separate non-lease components of regular maintenance services from associated lease components.
Property taxes paid by the lessor that are reimbursed by the lessee are considered to be lessor costs of owning the asset and are recorded gross with income included in other non-interest income and expense recorded in operating expenses.
We selected a lessor accounting policy election to exclude from revenue and expenses sales taxes and other similar taxes assessed by a governmental authority on lease revenue-producing transactions and collected by the lessor from a lessee.
Operating lease equipment is carried at cost less accumulated depreciation. Operating lease equipment is depreciated to its estimated residual value using the straight-line method over the lease term or estimated useful life of the asset.
Rental revenue on operating leases is recognized on a straight-line basis over the lease term unless collectability is not probable. In these cases rental revenue is recognized as payments are received.
Concentration of Credit Risk
Financial instruments, which potentially subject us to concentrations of credit risk, consist primarily of cash and cash equivalents and accounts receivable. We limit our exposure to credit loss by generally placing cash in high credit quality financial institutions. Cash balances are maintained primarily at major financial institutions in the United States and a portion of which exceed the regulatory limit of $250,000 insured by the Federal Deposit Insurance Corporation (FDIC)(“FDIC”). We have not experienced any credit losses associated with itsour cash balances. Additionally, we have established guidelines regarding diversification of our investments and their maturities, which are designed to maintain principal and maximize liquidity. As of December 31, 2023, we have $1.0 million of cash in excess of FDIC insured limits.
Fair Value of Financial Instruments
The authoritative guidance for fair value measurements defines fair value for accounting purposes, establishes a framework for measuring fair value, and provides disclosure requirements regarding fair value measurements. The guidance defines fair value as an exit price, which is the price that would be received upon sale of an asset or paid upon transfer of a liability in an orderly transaction between market participants at the measurement date. The degree of judgment utilized in measuring the fair value of assets and liabilities generally correlates to the level of pricing observability. Financial instruments primarily consist of cash equivalents, equity securities, accounts receivable, other current assets, restricted cash, and accounts payable. The carrying amount of short-term and long-term debt and notes payable approximates fair value because of the relative short maturity of these instruments and interest rates we could currently obtain.
The Company occasionally enters into derivative financial instruments to manage certain market risks. These derivative instruments are not designated as hedging instruments and accordingly, are recorded at fair value in the Consolidated Balance Sheets with the changes in fair value recognized in cost of goods soldrevenue in the Consolidated Statements of Operations.
Variable Interest Entities
We determine at the inception of each arrangement whether an entity in which we have made an investment or in which we have other variable interests is considered a variable interest entity (“VIE”). We consolidate VIEs when we are the primary beneficiary. We are the primary beneficiary of a VIE when we have the power to direct activities that most significantly affect the economic performance of the VIE and have the obligation to absorb the significant losses or benefits. If we are not the primary beneficiary in a VIE, we account for the investment or other variable interests in a VIE in accordance with applicable GAAP.
Periodically, we assess whether any changes in our interest or relationship with the entity affect our determination of whether the entity is a VIE and, if so, whether we are the primary beneficiary.
Cash and Cash Equivalents
We consider all investments with a maturity of three months or less when acquired to be cash equivalents.
Equity Securities
As of December 31, 20212023 and 2020,2022, securities consist of investments in equity securities that are publicly traded. Investments that are strategic in nature, with the intent to hold the investment over a several year period, are classified as other assets (non-current). Effective January 1, 2018,These equity securities with certain exceptions, are measured at fair value and changes in fair value are recognized in net income. During the year ended December 31, 2021,2023, we recognized gains related to changes in fair value of $0.3$0.2 million in the Consolidated Statements of Operations. During the year ended December 31, 2020,2022, we recorded gainslosses related to changes in fair value of $22 thousand.$1.7 million.
Cost Method Investment
As a part of the sale of Digirad Health, described further in Note 3. DiscontinuedOperations, we received common equity of TTG Parent. We have elected the measurement alternative under ASC 321. The measurement alternative election allows for equity securities that do not have readily determinable fair values to be recorded at cost, with adjustments for impairment and certain observable price changes reflected in earnings. Such securities are adjusted to fair value when an observable price change occurs or impairment is identified.
Allowance for Doubtful Accounts and Billing Adjustments
Accounts receivable consist principally of trade receivables from customers and third-party healthcare insurance providers,customers. These are recorded at the invoiced amount and are generally unsecured and due within 30 days. Trade receivables do not bear interest. We regularly evaluateadopted ASU No. 2016-13, Financial Instruments – Credit Losses (Topic 326): Measurement of Credit Losses on Financial Instruments (“CECL”), as amended, which replaces the incurred loss methodology with an expected loss methodology . This methodology includes information about past events, current economic conditions and reasonable and supportable forecasts that impact the collectibility of the reported amounts of the receivables over their lifetime. Within the CECL guidelines, we utilize a “probability of default” methodology to determine expected credit losses under the CECL model. Account balances are charged off against the allowance when we believe it is probable the receivable will not be recovered. Our “probability of default” methodology principally entails evaluating the collectability of our trade receivables and provideproviding reserves for doubtful accounts based on our historical experience rate, known collectability issues and disputes, and our bad debt write-off history. The impact of adopting CECL did not have a material impact on our financial statements.
Our estimates of collectability could be impacted by material amounts due to changed circumstances, such as a higher number of defaults or material adverse changes in a payor’s ability to meet its obligations. Expected credit losses related to trade accounts receivable are recorded as an allowance for doubtful accounts within accounts receivable, net in the Consolidated Balance Sheets, and the related provision for doubtful accounts is charged to general and administrative expenses.
Within the Healthcare division, we record a provision for billing adjustments, which are based on our historical experience rate of billing adjustments history. The provision for billing adjustments is charged against Healthcare revenues.
Within the Construction division, accounts receivable are recorded at the invoiced amount and do not bear interest. The allowance for doubtful accounts is our best estimate of losses that may result from uncollectible accounts receivable. We determine the allowance based on an analysis of individual accounts and an evaluation of the collectability of our accounts receivable in the aggregate based on factors such as the aging of receivable amounts, customer concentrations, historical experience, and current economic trends and conditions. Account balances are charged off against the allowance when we believe it is probable the receivable will not be recovered. We do not have any off-balance sheet credit exposure related to our customers.
The following table summarizes the allowance for doubtful accounts billing adjustments, and contractual allowancesfrom continuing operations as of and for the years ended December 31, 2021,2023 and 20202022 (in thousands):
| | | | | | | | | | | | | | | | | | | | | | | | | | | | | | | | |
| | Allowance for Doubtful Accounts(1) | | Reserve for Billing Adjustments (2) | | |
| Balance at December 31, 2019 | | | $ | 635 | | | | | $ | 20 | | | | | | |
| Provision adjustment | | | 68 | | | | | 183 | | | | | | |
| Write-offs and recoveries, net | | | (207) | | | | | (190) | | | | | | |
| Balance at December 31, 2020 | | | 496 | | | | | 13 | | | | | | |
| Provision adjustment | | | 656 | | | | | 293 | | | | | | |
| Write-offs and recoveries, net | | | (309) | | | | | (277) | | | | | | |
| Balance at December 31, 2021 | | | $ | 843 | | | | | $ | 29 | | | | | | |
| | | | | | | | | | | | |
| | Allowance for Doubtful Accounts(1) | | |
| Balance at December 31, 2021 | | $ | (477) | | | | | |
| Provision adjustment | | (432) | | | | | |
| Write-offs and recoveries, net | | 639 | | | | | |
| Balance at December 31, 2022 | | (270) | | | | | |
| Provision adjustment | | (145) | | | | | |
| Write-offs and recoveries, net | | 224 | | | | | |
| Balance at December 31, 2023 | | $ | (191) | | | | | |
(1)The provision was charged against general and administrative expenses.
(2)The provision was charged against Healthcare revenue.
Inventory
Inventories are valued using first-in, first-out or the weighted-average inventory method; stated at the lower of cost (first-in first-out basis) or net realizable value. Finished goods and work-in-process inventory values include the cost of raw materials, labor and manufacturing overhead. Inventory, when written down to net realizable value, establishes a new cost basis and its value is not subsequently increased based upon changes in underlying facts and circumstances. We also make adjustments to reduce the carrying amount of inventories for estimated excess or obsolete inventories. Factors influencing these adjustments include inventories on-hand compared with historical and estimated future sales and usage for existing and new products and assumptions about the likelihood of obsolescence.
The following table summarizes our reserves for excess and obsolete inventory as of and for the years ended December 31, 2021 and 2020 (in thousands):
| | | | | | | | | | | |
| Reserve for Excess and
Obsolete Inventories (1)
|
Balance at December 31, 2019 | | $ | 383 | | |
Provision adjustment | | 137 | | |
Write-offs and scrap | | (121) | | |
Balance at December 31, 2020 | | 399 | | |
Provision adjustment | | 30 | | |
Write-offs and scrap | | (109) | | |
Balance at December 31, 2021 | | $ | 320 | | |
(1)The provision was charged against cost of revenues.
Long-Lived Assets including Finite Lived Purchased Intangible Assets
Long-lived assets consist of property and equipment and finite lived intangible assets. We generally record property and equipment at cost,cost. We record property and recordequipment and intangible assets acquired in business combinations based on their fair values at the date of acquisition. We calculate depreciation on property and equipment using the straight-line method over the estimated useful life of the assets, which range from 5 to 20 years for buildings and improvements, 3 to 13 years for machinery and equipment, 1 to 10 years for computer hardware and software, and the lesser of the estimated useful life or remaining lease term for leasehold improvements. Charges related to amortization of assets recorded under finance leases are included within depreciation expense. We calculate amortization on intangible assets using either the accelerated or the straight-line method over the estimated useful life of the assets, based on when we expect to receive cash inflows generated by the intangible assets. Estimated useful lives for intangibles range from 1 to 15 years.
Impairment losses on long-lived assets used in operations are recorded when indicators of impairment are present and the undiscounted cash flows estimated to be generated by those assets are less than the assets’ carrying amount. No impairment was recorded on long-lived assets to be held and used during the years ended December 31, 20212023 and 2020.2022.
Goodwill Valuation
We review goodwill for impairment on an annual basis during the fourth quarter, as well asand when events or changes in circumstances indicate that a reduction in the carrying value may not be recoverable. We bypassedinitially assess qualitative analysis and performed anfactors to determine whether it is more likely than not that the fair value of the reporting unit is less than its carrying amount. Upon review of the results of such assessment, we may begin performing impairment analysis by quantitatively comparing the fair value of the reporting unit to the carrying value of the reporting unit. Impairmentunit, including goodwill. An impairment charge for goodwill is recognized for the amount by which the carrying value of the reporting unit exceeds its fair value and such loss should not exceed the total goodwill allocated to the reporting unit.
Goodwill has historically been derived from the acquisition of ATRM in 2019, MD Office Solutions (“MDOS”) in 2015, and substantially all of the assets of Ultrascan, Inc. (“Ultrascan”) in 2007.2019. See Note 7. Goodwill, for further information.
Self-Insured Health Insurance BenefitsBusiness Combinations
Healthcare provides healthcare benefitsIn accordance with ASC 805, Business Combinations, the Company allocates the purchase consideration to its employees through a self-insured plan with “stop loss” coverage. The Company records a liability that represents our estimated cost of claims incurredthe identifiable assets acquired and unpaidliabilities assumed in business combinations based on their fair values as of the balance sheetrespective acquisition date. OurThe excess of the purchase consideration over the amounts assigned to the identifiable assets and liabilities is recognized as goodwill, or if the fair value of the net assets acquired exceeds the purchase consideration, a bargain purchase gain is recorded within the Consolidated Statement of Operations. Factors giving rise to goodwill generally include operational synergies that are anticipated as a result of the business combination and growth expected to result in economic benefits from access to new customers and markets. The fair values of identifiable intangible assets acquired in business combinations are generally determined using an income approach, requiring financial forecasts and estimates as well as market participant assumptions.
In connection with the acquisition of BLL during the fiscal year ended December 31, 2023, the Company recorded an initial bargain purchase gain of $1.2 million that was recorded as a component of other income on the Consolidated Statement of Operations. The bargain purchase gain amount represents the excess of the estimated reserve is based on historical experiencefair value of the net assets and trends related to both health insurance claims and payments. intangibles acquired over the estimated fair value of the consideration transferred. In accordance with ASC 805, we have estimated the fair value of the net assets acquired as of the acquisition date.
The ultimate costincremental financial results of healthcare benefits will depend on actual costs incurred to settle the claims and may differBLL acquisition are included in the Company’s consolidated financial results from the amounts reserved by the Company respective acquisition date. See Note 16. Mergers and Acquisitions for those claims. As of December 31, 2021 and 2020, the reserve for estimated claims incurred and unpaid was $0.6 million and $0.5 million, respectively.further information.
Restricted Cash
We maintain certain cash amounts restricted as to withdrawal or use. As of December 31, 20212023 and 2020,2022, restricted cash was $0.3$0.6 million and $0.2$0.1 million for both years respectively, comprised of cash held for letters of credit for our real estate leases and certain minimum balance requirements on our banking arrangements.
Debt Issuance Costs
We incur debt issuance costs in connection with debt financings. Debt issuance costs for line of credit are presented in other assets and are amortized over the term of the revolving debt agreements using the straight-line method. Debt issuance costs for term debt are netted against to the debt and are amortized over the term of the loan using the effective interest method. Amortization of debt issuance costs are included in interest expense. As of December 31, 2021 and 2020,2022, we have $0.3had $0.1 million and $0.6 million, respectively, of unamortized debt issuance costs. As of December 31, 2023 we have no unamortized debt issuance costs.
Shipping and Handling Fees and Costs
We record all shipping and handling costs billed to customers as revenue earned for the goods provided. Shipping and handling costs related to continuing operations are included in cost of revenues and totaled $1.4$1.1 million and $1.0 million for the years ended December 31, 20212023 and 2020, respectively.2022.
Share-Based Compensation
We account for share-based awards exchanged for employee and board services in accordance with the authoritative guidance for share-based compensation. Under this guidance, share-based compensation expense is measured at the grant date, based on the estimated fair value of the award, and is recognized as expense, net of forfeitures, over the requisite service period.
Warranty
In our Healthcare division, we generally provide a 12-month assurance warranty on our gamma cameras. We accrue the estimated cost of this warranty at the time revenue is recorded and charge warranty expense to product and product-related cost
of revenues. Warranty reserves are established based on historical experience with failure rates and repair costs and the number of systems covered by warranty. Warranty reserves are depleted as gamma cameras are repaired. The costs consist principally of materials, personnel, overhead, and transportation. We review warranty reserves quarterly and, if necessary, make adjustments.
Within our Construction division, KBS provides a limited assurance warranty on its residential homes that covers substantial defects in materials or workmanship for a period of 12 months after delivery to the owner. EBGL provides a limited warranty on the sale of its wood foundation products that covers leaks resulting from defects in workmanship for a period of twenty-five years. Estimated warranty costs are accrued in the period that the related revenue is recognized.
The activities related to our warranty reserve See Note 5. Supplementary Balance Sheet Information, for the years ended December 31, 2021 and 2020 are as follows (in thousands):
| | | | | | | | | | | | | | |
| | Year Ended December 31, |
| | 2021 | | 2020 |
| Balance at beginning of year | | $ | 214 | | | $ | 421 | |
| Charges to cost of revenues | | 963 | | | 232 | |
| Applied to liability | | (608) | | | (439) | |
| Balance at end of year | | $ | 569 | | | $ | 214 | |
Advertising Costs
Advertising costs are expensed as incurred. Total advertising costs related to continuing operations for the years ended December 31, 20212023 and 20202022 were $0.3 million$85 thousand and $0.1 million,$38 thousand, respectively.
Basic and Diluted Net Lossincome (loss) Per Share
We present net lossincome (loss) per share attributable to common stockholders in conformity with the two-class method required for participating securities, as the warrants are considered participating securities. We have not allocated net lossincome (loss) attributable to common stockholders to warrants because the holders of our warrants are not contractually obligated to share in our losses.income (loss). In periods for which there is a net loss, diluted loss per common share is equal to basic loss per common share, since the effect of including any common stock equivalents would be antidilutive.
The following weighted-average outstanding common stock equivalents were not included in the calculation of diluted net lossincome (loss) per share because their effect was antidilutive (in thousands):
| | Year Ended December 31, |
| 2021 | | 2020 |
| | Year Ended December 31, | | | | Year Ended December 31, |
| | 2023 | | | | 2023 | | 2022 |
| Stock options | Stock options | | 15 | | | 43 | |
| Stock warrants | Stock warrants | | 768 | | | 1,247 | |
| Restricted stock units | Restricted stock units | | 72 | | | 26 | |
| Total | Total | | 855 | | | 1,316 | |
As of December 31, 2021,2023, there were 1,045,4601,370,460 warrants exercised and 1,404,54012,567,040 warrants outstanding, which represents 702,27011,864,770 shares of common stock equivalents, remained outstanding at an exercise price of $2.25.outstanding. See Note 18. Equity Transactions, for further information about warrants outstanding.
Income Taxes
We account for income taxes under the asset and liability method, which requires the recognition of deferred tax assets and liabilities for the expected future tax consequences of events that have been included in the consolidated financial statements. Under this method, deferred tax assets and liabilities are determined based on the differences between the consolidated financial statements and tax basis of assets and liabilities using enacted tax rates in effect for the year in which the differences are expected to reverse. The effect of a change in tax rates on deferred tax assets and liabilities is recognized in income in the period that includes the enactment date.
We recognize net deferred tax assets to the extent that the Company believeswe believe these assets are more likely than not to be realized. In making such a determination, management considerswe consider all available positive and negative evidence, including future reversals of existing taxable temporary differences, projected future taxable income, tax-planning strategies, and results of recent operations. If management determineswe determine that we would be able to realize deferred tax assets in the future in excess of their net recorded amount, managementwe would make an adjustment to the deferred tax asset valuation allowance, which would reduce the provision for income taxes.
We record uncertain tax positions on the basis of a two-step process whereby (1) management determineswe determine whether it is more likely than not that the tax positions will be sustained on the basis of the technical merits of the position and (2) for those tax positions that meet the more-likely-than-not recognition threshold, management recognizeswe recognize the largest amount of tax benefit that is more than 50% likely to be realized upon ultimate settlement with the related tax authority. We recognize interest and penalties related to unrecognized tax benefits within income tax expense, and any accrued interest and penalties would be included within the related tax liability. No such costs were recorded for the years ended December 31, 20212023 and December 31, 2020.2022.
ReclassificationReclassifications
PPP Loan forgiveness reclassification has been made toCertain items in the prior year financial statements were reclassified to conform towith the current year financial statement presentation of the Consolidated Statements of Operations. This change did not impact previously reported net loss, loss per share, stockholders’ equity, total assets or the Consolidated Statements of Cash Flows.presentation. These reclassifications primarily relate to reporting our Healthcare division as a discontinued operation and inventory.
Revision of Previously Issued Financial Statements for Correction of Immaterial Errors.
The Company identified immaterial errors in its previously issued annual financial statements that were determined to be individually, and in the aggregate, quantitatively and qualitatively immaterial based on its analysis of StaffNew Accounting Bulletin (“SAB”) No. 99, “Materiality,” and SAB No. 108, “Considering the Effects of Prior Year Misstatements when Quantifying Misstatements in Current Year Financial Statements”. These immaterial errors have been corrected in the accompanying Consolidated Balance Sheets, Note 10. Leases, as of December 31, 2020, and Note 4. Revenue, for the year ended December 31, 2020. The nature of these error corrections is as follows:
•The Company identified immaterial errors related to operating lease right-of-use assets and related operating lease liabilities which affected the Consolidated Balance Sheet as of December 31, 2020.
(in thousands)
| | | | | | | | | | | | | | | | | | | | |
| As of December 31, 2020 | | As Previously Reported | | Adjustments | | As Revised |
| Assets and liabilities | | | | | | |
| Operating lease right-of-use assets, net | | $ | 1,769 | | | $ | 1,166 | | | $ | 2,935 | |
| Total assets | | $ | 88,293 | | | $ | 1,166 | | | $ | 89,459 | |
| Operating lease liabilities | | $ | 1,011 | | | $ | 267 | | | $ | 1,278 | |
| Total current liabilities | | $ | 42,726 | | | $ | 267 | | | $ | 42,993 | |
| Operating lease liabilities, net of current portion | | $ | 828 | | | $ | 899 | | | $ | 1,727 | |
| Total liabilities | | $ | 48,364 | | | $ | 1,166 | | | $ | 49,530 | |
Standards Recently Adopted Accounting Pronouncementsand To Be Adopted
No recently issued and adopted accounting standards had a significant impact on our consolidated financial statements.In December 2019,November 2023, the Financial Accounting Standards Board (“FASB”) issued Accounting Standards Update (“ASU”) No 2019-12, “Income TaxesASU 2023-07, Segment Reporting (Topic 740)280): Simplifying the Accounting for Income Taxes”Improvements to Reportable Segment Disclosures (“ASU 2019-12”2023-07”). ASU 2019-12 removes certain exceptions, which requires disclosure of detailed information related to significant expenses of the entity’s reportable segments which is regularly provided to the general principles in Topic 740 in Generally Accepted Accounting Principles.chief operating decision maker. ASU 2019-12 is effective for public entities for fiscal years beginning after December 15, 2020, with early adoption permitted. We adopted the guidance effective the first quarter of 2021. ASU 2019-12 does not have a material effect on our current financial position, results of operations or financial statement disclosures.
New Accounting Standards To Be Adopted
In June 2016, the FASB issued ASU 2016-13, Financial Instruments - Credit Losses: Measurement of Credit Losses on Financial Instruments, which amends the impairment model by requiring entities to use a forward-looking approach based on expected losses to estimate credit losses on certain types of financial instruments, including trade receivables and available-for-sale debt securities. This update2023-07 is effective for annual periods beginning after December 15, 2022,2023, and for interim periods within those periods, and early adoption is permitted. We expect to adopt the standard on its effective date in the first quarter of 2023. We believe the adoption will modify the way we analyze financial instruments, but currently do not expect the adoption to have a material financial impact on our consolidated financial statements.
In March 2020, the FASB issued ASU 2020-04, Reference Rate Reform (Topic 848), to temporarily ease the potential burden in accounting for reference rate reform. The standard provides optional expedients and exceptions for applying GAAP to contracts, hedging relationships and other transactions affected by reference rate reform. The guidance generally can be applied through December 31, 2022. We will monitor our contracts and transactions for potential application of this ASU.
In August 2020, the FASB issued ASU No. 2020-06, Debt - Debt with Conversion and Other Options (Subtopic 470-20) and Derivatives and Hedging - Contracts in Entity’s Own Equity (Subtopic 815-40). ASU 2020-06 eliminates the beneficial conversion and cash conversion accounting models for convertible instruments. It also amends the accounting for certain contracts in an entity’s own equity that are currently accounted for as derivatives because of specific settlement provisions. In addition, ASU 2020-06 modifies how particular convertible instruments and certain contracts that may be settled in cash or shares impact the diluted EPS computation. The amendments in this update are effective for public business entities for fiscal years beginning after December 15, 2021 (or2024. ASU 2023-07 requires retrospective application in the period of initial application. We will apply ASU 2023-07 for annual periods beginning on January 1, 2024, and for interim periods beginning on January 1, 2025. ASU 2023-07 affects financial statement disclosure only, and its adoption will not affect our results of operations or financial position.
In December 2023, the FASB issued ASU 2023-09, Income Taxes (Topic 740): Improvements to Income Tax Disclosures (“ASU 2023-09”), which requires, among other things, greater disaggregation of information in the rate reconciliation, and income taxes paid disaggregated by jurisdiction. ASU 2023-09 is effective for annual periods beginning after December 15, 2023 for companies who meet the SEC definition2024. We will apply ASU 2023-09 on January 1, 2025. ASU 2023-09 affects financial statement disclosure only and its adoption will not affect our results of Smaller Reporting Companies), and interim periods within those fiscal years. The amendment is to be adopted through either a fully retrospectiveoperations or modified retrospective method of transition. Early adoption is permitted. The Company is currently evaluating the impact of this standard on its financial statements and related disclosures.position.
Note 3. Discontinued Operations
On October 30, 2020, Star EquityMay 4, 2023, we entered into a Stock Purchase and Contribution Agreement (the “DMS“Digirad Purchase Agreement”) between, by and among the Company, Digirad Health Inc., a Delaware corporation and wholly owned subsidiary of the Company (“Seller”Digirad Health”), DMS Health,TTG Imaging Solutions, LLC, a Pennsylvania limited liability company (“TTG”), and Knob Creek Acquisition Corp.,TTG’s parent, Insignia TTG Parent LLC, a Tennessee corporationDelaware limited liability company (“Buyer”TTG Parent”), Buyer. Pursuant to the Digirad Purchase Agreement, (i) TTG purchased all85% of the issued and outstanding commonshares of Digirad Health, on the terms and subject to the conditions set forth therein and (ii) the Company contributed to TTG Parent 15% of the issued and outstanding shares of stock of DMSDigirad Health which operated our Mobile Healthcare business unit, from Seller.(the “Contributed Shares”) in exchange for New Units (as defined in the Digirad Purchase Agreement) of TTG Parent (the “Transaction”). The purchase price undertotal aggregate consideration payable to the DMS Purchase AgreementCompany for the Transaction was $18.75$40 million, comprised of $19.7 million ($27 million less payoff of debt to Webster Bank (see Note 8. Debt) and transaction costs) in cash, subject to certain adjustments, including a working capital adjustment. $7 million promissory note (see Note 5. Supplemental Balance Sheet Information), and $6 million of New Units in TTG Parent (see Note 5. Supplemental Balance Sheet Information). The Company completed the sale of Digirad Health simultaneously with entering into the Digirad Purchase Agreement.
We deemed the disposition of the MobileDigirad Health, which operated our Healthcare business unit, to represent a strategic shift that will have a major effect on our operations and financial results. ForAs of the year ended December 31, 2020,date of these financial statements, the Mobileresults of operations of the Healthcare business metunit represent “discontinued operations” in accordance with GAAP (ASC 205-20-45-1B). As such, the criteriaassets and liabilities, as well as the earnings, of the discontinued operation are presented separately in the consolidated financial statements for all periods presented. Unless otherwise noted, discussion within the notes to be classifiedthe consolidated financial statements relates to continuing operations.
Our variable interest entity (“VIE”), for which we are not the primary beneficiary, was disposed of as held for sale. This segment is reported on the Consolidated Statementspart of Operations as discontinued operations and on the Consolidated Balance Sheets as Assets and Liabilities held for sale. In January, 2022, we received an immaterial amount of net escrow settlement. In April 2021, DMS Health contracted Digirad Imaging Solutions for a term of three years to purchase radiopharmaceuticals doses, resulting in $1.1 million of revenues for the year ended December 31, 2021.
We allocated a portion of interest expense to discontinued operations since the proceeds received from the sale were required to be used to pay down outstanding borrowings underof our revolving credit facility with SNB. The allocationHealthcare division. This VIE was based on the ratio of assets generated based on the borrowing capacity to total borrowings capacity for the period. In addition, certain general and administrative costsin a small private company that is primarily involved in research related to corporate and shared service functions previously allocated to the mobile healthcare reportable segment are included in discontinued operations.new heart imaging technologies.
The following table summarizespresents financial results of our Healthcare division for the DMS Healthtwelve months ended December 31, 2023 and 2022 (in thousands). Note that we owned this division through May 4, 2023 and that the results for the yearstwelve months ended December 31, 2021 and 2020 (in thousands):2023 reflect that period only:
| | | | | | | | | | | | | | |
| | Year ended December 31, |
| | 2021 | | 2020 |
| Total revenues | | $ | 9,490 | | | $ | 36,011 | |
| Total cost of revenues | | 6,973 | | | 31,493 | |
| Gross profit | | 2,517 | | | 4,518 | |
| | | | |
| Operating expenses: | | | | |
| Selling, general and administrative | | 1,469 | | | 4,447 | |
| Amortization of intangible assets | | — | | | 965 | |
| | | | |
| | | | |
| Total operating expenses | | 1,469 | | | 5,412 | |
| | | | |
| Operating income (loss) from discontinued operations | | 1,048 | | | (894) | |
| Interest expense, net | | (180) | | | (256) | |
| Gain on sale of discontinued operations | | 5,159 | | | — | |
| Income (loss) from discontinued operations before income taxes | | 6,027 | | | (1,150) | |
| Income tax provision | | (79) | | | (22) | |
| Net Income (loss) from discontinued operations | | $ | 5,948 | | | $ | (1,172) | |
| | | | | | | | | | | | | | |
| | Twelve Months Ended December 31, |
| | 2023 | | 2022 |
| Total revenues | | $ | 17,962 | | | $ | 55,002 | |
| Total cost of revenues | | 12,408 | | | 41,493 | |
| Gross profit | | 5,554 | | | 13,509 | |
| | | | |
| Operating expenses: | | | | |
| Selling, general and administrative | | 3,314 | | | 13,068 | |
| Amortization of intangible assets | | — | | | 1 | |
| (Gain) loss on disposal of discontinued operations | | (26,680) | | | — | |
| Total operating expenses | | (23,366) | | | 13,069 | |
| | | | |
| Income (loss) from discontinued operations | | 28,920 | | | 440 | |
| | | | |
| Other (expense) income, net | | (1,015) | | | 338 | |
| Interest expense, net | | (173) | | | (411) | |
| | | | |
| Income (loss) from discontinued operations before income taxes | | 27,732 | | | 367 | |
| Income tax benefit (provision) | | (693) | | | 208 | |
| Income (loss) from discontinued operations | | $ | 27,039 | | | $ | 575 | |
The carrying amounts of the major classes of assets reported as “Assets held for sale”- discontinued operations” consist of the following as of December 31, 20202022 (in thousands):
| | | | | | | | |
| | December 31, |
| | 2020 2022 |
| Cash and cash equivalents | | $ | 443288 | |
| Accounts receivable, net | | 4,3059,782 | |
| Inventories, net | | 505,949 | |
| Other current assets | | 4591,832 | |
| Property and equipment, net | | 7,7212,683 | |
| Operating lease right-of-use assets, net | | 4,8632,626 | |
Intangible assets, netGoodwill | | 2,9151,608 | |
| | |
| Other assets | | 521 | |
| | $ | 20,75625,289 | |
The carrying amounts of the major classes of liabilities reported as “Liabilities held for sale”- discontinued operations” consist of the following as of December 31, 20202022 (in thousands):
| | | | | | | | |
| | December 31, |
| | 2020 2022 |
| Accounts payable | | $ | 1,5971,983 | |
| Other liabilities | | 1,867 | |
| Accrued compensation | | 645253 | |
| Accrued liabilities | | 2,675 | |
| Deferred revenue | | 961,703 | |
| Short-term debt and current portion of long-term debt | | 8,299 | |
| Operating lease liabilities | | 4,8631,056 | |
OtherFinance lease liabilities, current liabilitiesportion | | 560314 | |
| | |
Deferred taxOperating lease liabilities, net of current portion | | 161,631 | |
| | |
OtherFinance lease liabilities, net of current portion | | 94291 | |
| | |
| Short-term debt and current portion of long-term debt | | $ | 7,87120,072 | |
The following table presents supplemental cash flow information of discontinued operations for the years ended December 31, 2021 and 2020 (in thousands):
| | | | | | | | | | | | | | |
| | Twelve Months Ended December 31, |
| | 2021 | | 2020 |
| Operating activities | | | | |
| | | | |
| Depreciation | | $ | 7 | | | $ | 4,519 | |
| Amortization of intangible assets | | — | | | 965 | |
| Non-cash lease expense | | 256 | | | 360 | |
| Loss on extinguishment of debt | | 130 | | | — | |
| Gain on sale of DMS discontinued operations | | (5,159) | | | — | |
| | | | |
| | | | |
| Provision for bad debt | | — | | | 2 | |
| | | | |
| | | | |
| | | | |
| | | | |
| | | | |
| | | | |
| | | | |
| | | | |
| | | | |
| | | | |
| | | | |
| Investing activities | | | | |
| | | | |
| Proceeds from sale of discontinued operations | | 18,750 | | | — | |
| Proceeds from sale of property and equipment | | 3 | | | 142 | |
| | | | |
| | | | |
| | | | |
| | | | |
| | | | |
| Non-cash investing activities | | | | |
| Fixed asset purchased in accounts payable | | — | | | 75 |
| Lease assets obtained in exchange for new operating lease liabilities | | — | | | 741 |
The following table presents the significant operating, investing and financing activities from discontinued operations for the twelve months ended December 31, 2023 and 2022 (in thousands): | | | | | | | | | | | | | | |
| | Twelve Months Ended December 31, |
| | 2023 | | 2022 |
| Operating activities | | | | |
| Net income (loss) from discontinued operations | | 27,039 | | | 575 | |
| Depreciation | | 332 | | | 1,270 | |
| Amortization of intangible assets | | — | | | 1 | |
| Non-cash lease expense | | 273 | | | 852 | |
| Write-off of borrowing costs | | 16 | | | 40 | |
| (Gain) loss on disposal of discontinued operations | | (26,680) | | | — | |
| Share-based compensation | | 1 | | | 6 | |
| (Gain )Loss on disposal of assets | | 135 | | | (415) | |
| Provision for bad debt | | 17 | | | 124 | |
| Deferred income taxes | | 295 | | | (317) | |
| Accounts receivable | | 1,333 | | | (1,632) | |
| Inventory | | (681) | | | (809) | |
| Other assets | | 654 | | | 448 | |
| Accounts payable | | 994 | | | 882 | |
| Accrued compensation | | (580) | | | (673) | |
| Deferred revenue | | (101) | | | 187 | |
| Operating lease liabilities | | (283) | | | (845) | |
| Other liabilities | | (1,730) | | | (334) | |
| Net cash provided by (used in) operating activities | | 1,034 | | | (640) | |
| | | | |
| | | | |
| | | | |
| | | | |
| | | | |
| Net cash provided by (used in) investing activities | | — | | | (743) | |
| | | | |
| | | | |
| | | | |
| | | | |
| Net cash provided by (used in) financing activities | | 347 | | | 783 | |
| Net increase (decrease) in cash and cash equivalents and restricted cash | | $ | 1,381 | | | $ | (600) | |
| Non-Cash Investing Activities | | | | |
| Lease assets obtained in exchange for new finance lease liabilities | | $ | — | | | $ | 90 | |
| Lease assets obtained in exchange for new operating lease liabilities | | $ | — | | | $ | 1,492 | |
Following is the reconciliation of purchase price to the gain recognized in income from discontinued operations for the twelve months ended December 31, 20212023 (in thousands):, prior to any proposed working capital adjustments:
| | | | | |
| | Twelve Months Ended December 31, 2021
Estimated proceedsProceeds of the disposition, net of transaction costs and indebtedness payoff | $ | 18,75032,682 | |
| Assets of the businesses | (20,920)$ | (24,071) | |
| Liabilities of the businesses | 7,712 | |
Transaction expenses$ | (383)18,069 | |
| Pre-tax gain on the disposition | $ | 5,15926,680 | |
Note 4. Revenue
Disaggregation of Revenue
The following table presents our continuing revenues disaggregated by major source for the years ended December 31, 20212023 and 20202022 (in thousands):
| | | | | | | | | | | | | | | | | | | | | | | | | |
| Year Ended December 31, 2021 |
| Diagnostic Services | | Diagnostic Imaging | | Construction | | | | Total |
| Major Goods/Service Lines | | | | | | | | | |
Mobile Imaging(1) | $ | 43,536 | | | $ | — | | | $ | — | | | | | $ | 43,536 | |
| Camera Sales | — | | | 7,959 | | | — | | | | | 7,959 | |
| Camera Support | — | | | 6,832 | | | — | | | | | 6,832 | |
| Healthcare Revenue from Contracts with Customers | 43,536 | | | 14,791 | | | — | | | | | 58,327 | |
| Lease Income | 229 | | | — | | | 47 | | | | | 276 | |
| Construction Revenue from Contracts with Customers | — | | | — | | | 47,956 | | | | | 47,956 | |
| | | | | | | | | |
Total Revenues | $ | 43,765 | | | $ | 14,791 | | | $ | 48,003 | | | | | $ | 106,559 | |
| | | | | | | | | |
| Timing of Revenue Recognition | | | | | | | | | |
| Services and goods transferred over time | $ | 39,843 | | | $ | 5,614 | | | $ | 3,921 | | | | | $ | 49,378 | |
| Services and goods transferred at a point in time | 3,922 | | | 9,177 | | | 44,082 | | | | | 57,181 | |
Total Revenues | $ | 43,765 | | | $ | 14,791 | | | $ | 48,003 | | | | | $ | 106,559 | |
| | | | | | | | | | | | | | | | | | | | | | | | | | | | | |
| Year Ended December 31, 2020 |
| Diagnostic Services | | Diagnostic Imaging | | Construction | | Investments | | Total |
| Major Goods/Service Lines | | | | | | | | | |
| Mobile Imaging | $ | 38,690 | | | $ | — | | | $ | — | | | $ | — | | | $ | 38,690 | |
| Camera Sales | — | | | 3,450 | | | — | | | — | | | 3,450 | |
| Camera Support | — | | | 6,515 | | | — | | | — | | | 6,515 | |
| Healthcare Revenue from Contracts with Customers | 38,690 | | | 9,965 | | | — | | | — | | | 48,655 | |
| Lease Income | 577 | | | — | | | 260 | | | — | | | 837 | |
| Construction revenue from Contracts with Customers | — | | | — | | | 28,619 | | | — | | | 28,619 | |
| Investments | — | | | — | | | — | | | 52 | | | 52 | |
| Total Revenues | $ | 39,267 | | | $ | 9,965 | | | $ | 28,879 | | | $ | 52 | | | $ | 78,163 | |
| | | | | | | | | |
| Timing of Revenue Recognition | | | | | | | | | |
| Services and goods transferred over time | $ | 37,559 | | | $ | 5,544 | | | $ | 3,255 | | | $ | — | | | $ | 46,358 | |
| Services and goods transferred at a point in time | 1,708 | | | 4,421 | | | 25,624 | | | 52 | | | 31,805 | |
| Total Revenues | $ | 39,267 | | | $ | 9,965 | | | $ | 28,879 | | | $ | 52 | | | $ | 78,163 | |
(1) Revenue generated from MDOS and DMS subsequent to their respective sales resulted in $0.8 million and $1.1 million of total revenues. | | | | | | | | | | | | | | | | |
| December 31, 2023 |
| | Construction | | | | Total |
| Major Goods/Service Lines | | | | | | |
| Construction Revenue from Contracts with Customers | | $ | 45,785 | | | | | $ | 45,785 | |
| | | | | | |
Total Revenues | | $ | 45,785 | | | | | $ | 45,785 | |
| | | | | | |
| Timing of Revenue Recognition | | | | | | |
| | | | | | |
| Services and goods transferred at a point in time | | 45,785 | | | | | 45,785 | |
Total Revenues | | $ | 45,785 | | | | | $ | 45,785 | |
We have corrected an immaterial disclosure error in the previously disclosed disaggregated revenue balances relating to the timing of revenue for the year ended December 31, 2020. For the year ended December 31, 2020, the amount of $2.2 million was revised from over time to point in time related to revenue recognition in the table above. Diagnostic Services for goods transferred over time decreased by $1.7 million, with a corresponding increase to revenue recognized for goods and services transferred at a point in time. The timing of revenue recognition for Diagnostic Imaging for goods transferred over time decreased by $0.5 million, with a corresponding increase to revenue recognized for goods and services transferred at a point in time. The adjustments did not impact the total amount of revenue or the period in which it was recognized, therefore, they had no effect on the Consolidated Balance Sheets, Statements of Operations and Cash Flows for the periods presented. | | | | | | | | | | | | | | | | |
| December 31, 2022 |
| | Construction | | | | Total |
| Major Goods/Service Lines | | | | | | |
| | | | | | |
| | | | | | |
| | | | | | |
| | | | | | |
| | | | | | |
| Construction revenue from Contracts with Customers | | $ | 57,149 | | | | | $ | 57,149 | |
| | | | | | |
| Total Revenues | | $ | 57,149 | | | | | $ | 57,149 | |
| | | | | | |
| Timing of Revenue Recognition | | | | | | |
| Services and goods transferred over time | | $ | 11,625 | | | | | $ | 11,625 | |
| Services and goods transferred at a point in time | | 45,524 | | | | | 45,524 | |
| Total Revenues | | $ | 57,149 | | | | | $ | 57,149 | |
Deferred Revenue
Changes in the deferred revenues for the year ended December 31, 20212023 and 2020,2022, is as follows (in thousands):
| | | | | | | | |
Balance at December 31, 20192021 | | $ | 1,801946 | |
| Revenue recognized that was included in balance at beginning of the year | | (1,494)(822) | |
| Deferred revenue, net, related to contracts entered into during the year | | 2,0451,549 | |
Balance at December 31, 20202022 | | 1,673 | | 2,352 | |
| Revenue recognized that was included in balance at beginning of the year | | (1,975)(1,604) | |
| Deferred revenue, net, related to contracts entered into during the year | | 2,4921,308 | |
Balance at December 31, 20212023 | | $ | 2,8691,377 | |
As of December 31, 2021 and 2020, non-current deferred revenue was $412 thousand and $168 thousand, respectively in other liabilities within our Consolidated Balance Sheets, which is expected to be recognized over a period of 2-4 years. As of December 31, 2021, billings in excess of costs and estimated profit was $0.3 million and no balance as of December 31, 2020, respectively in current liabilities within our Consolidated Balance Sheet.
Note 5. Supplementary Balance Sheet Information
The following tables show the Consolidated Balance Sheet details as of December 31, 20212023 and 20202022 (in thousands):
| | | | | | | | | | | | | | |
| | December 31,
2021 | | December 31,
2020 |
| Inventories: | | | | |
| Raw materials | | $ | 5,870 | | | $ | 5,489 | |
| Work-in-process | | 2,145 | | | 2,821 | |
| Finished goods | | 830 | | | 1,876 | |
| Total inventories | | 8,845 | | | 10,186 | |
| Less reserve for excess and obsolete inventories | | (320) | | | (399) | |
| Total inventories, net | | $ | 8,525 | | | $ | 9,787 | |
| | | | | | | | | | | | | | |
| | December 31,
2021 | | December 31,
2020 |
| Property and equipment, net: | | | | |
| Land | | $ | 805 | | | $ | 805 | |
| Buildings and leasehold improvements | | 4,823 | | | 4,771 | |
| Machinery and equipment | | 24,881 | | | 25,687 | |
| Computer hardware and software | | 2,387 | | | 3,688 | |
| Gross property and equipment | | 32,896 | | | 34,951 | |
| Accumulated depreciation | | (23,978) | | | (25,189) | |
| Total property and equipment, net | | $ | 8,918 | | | $ | 9,762 | |
| | | | | | | | | | | | | | |
| | December 31,
2023 | | December 31,
2022 |
| Inventories: | | | | |
| Raw materials | | $ | 1,394 | | | $ | 1,629 | |
| Work-in-process | | 410 | | | 571 | |
| Finished goods | | 1,616 | | | 2,478 | |
| Total inventories | | 3,420 | | | 4,678 | |
| Less reserve for excess and obsolete inventories | | — | | | — | |
| Total inventories, net | | $ | 3,420 | | | $ | 4,678 | |
On June 9, 2021, we entered into a contract for the sale of commercial real estate agreement with Barnum Holdings, LLC (the "Waterford Sale Agreement"), for the sale of pursuant to 947 Waterford Road real property situated thereon, for the sales price of $1.2 million in cash, which will be paid at the closing. Waterford property was classified as held-for-sale throughout 2021, however, as of December 31, 2021, there were indications of changes to the plan of sale. As such, we reclassified the asset held for sale as an asset held
Property and used. Equipment, net
| | | | | | | | | | | | | | |
| | December 31,
2023 | | December 31,
2022 |
| Property and equipment, net: | | | | |
| Land | | $ | 1,353 | | | $ | 805 | |
| Buildings and leasehold improvements | | 5,123 | | | 4,185 | |
| Machinery and equipment | | 3,511 | | | 2,509 | |
| Gross property and equipment | | 9,987 | | | 7,499 | |
| Accumulated depreciation | | (2,159) | | | (1,834) | |
| Total property and equipment, net | | $ | 7,828 | | | $ | 5,665 | |
As of December 31, 2021 the related assets2023, we held non-operating land and building in Oxford, Maine for investments which had a carrycarrying value of $1.0$0.9 million and was included within property and equipment on the Consolidated Balance Sheets.
As Furthermore, we sold our Waterford, Maine facility on June 30, 2023 for approximately $1.2 million after closing costs and recognized a gain of December 31, 2021, the non-operating land and building, held for investments, had a carry value of $2.1$0.4 million and was included within property and equipment on the Consolidated Balance Sheets.which we recorded in other income/expense.
Depreciation expense for the years ended December 31, 20212023 and 20202022 was $1.7$0.6 million and $1.8 million, respectively.
Warranty Reserves
Within our Construction division, KBS provides a limited assurance warranty on its residential homes that covers substantial defects in materials or workmanship for a period of 12 months after delivery to the owner. EBGL provides a limited warranty on the sale of its wood foundation products that covers leaks resulting from defects in workmanship for a period of twenty-five years. Estimated warranty costs are accrued in the period that the related revenue is recognized. Warranty reserves and related activity were minimal as of and for the periods ended December 31, 2023 and December 31, 2022.
Intangible Assets
| | | | | | | | | | | | | | | | | | | | | | |
| | | | December 31, 2023 |
| | | | Gross Carrying Amount | | Accumulated Amortization | | Intangible Assets, Net |
| Intangible assets with finite useful lives: | | | | | | | | |
| Customer relationships | | | | $ | 14,400 | | | $ | (5,831) | | | $ | 8,569 | |
| Trademarks | | | | 5,540 | | | (1,591) | | | 3,949 | |
| | | | | | | | |
| | | | | | | | |
| | | | | | | | |
| Total intangible assets, net | | | | $ | 19,940 | | | $ | (7,422) | | | $ | 12,518 | |
| | | | | | | | |
| | | | December 31, 2022 |
| | | | Gross Carrying Amount | | Accumulated Amortization | | Intangible Assets, Net |
| Intangible assets with finite useful lives: | | | | | | | | |
| Customer relationships | | | | $ | 13,500 | | | $ | (4,466) | | | $ | 9,034 | |
| Trademarks | | | | 5,540 | | | (1,222) | | | 4,318 | |
| | | | | | | | |
| | | | | | | | |
| | | | | | | | |
| Total intangible assets, net | | | | $ | 19,040 | | | $ | (5,688) | | | $ | 13,352 | |
67
| | | | | | | | | | | | | | | | | | | | | | |
| | | | December 31, 2021 |
| | | | Gross Carrying Amount | | Accumulated Amortization | | Intangible Assets, Net |
| Intangible assets with finite useful lives: | | | | | | | | |
| Customer relationships | | | | $ | 16,440 | | | $ | (6,056) | | | $ | 10,384 | |
| Trademarks | | | | 5,540 | | | (853) | | | 4,687 | |
| Patents | | | | 141 | | | (140) | | | 1 | |
| | | | | | | | |
| | | | | | | | |
| Total intangible assets, net | | | | $ | 22,121 | | | $ | (7,049) | | | $ | 15,072 | |
| | | | | | | | |
| | | | December 31, 2020 |
| | | | Gross Carrying Amount | | Accumulated Amortization | | Intangible Assets, Net |
| Intangible assets with finite useful lives: | | | | | | | | |
| Customer relationships | | | | $ | 17,079 | | | $ | (5,238) | | | $ | 11,841 | |
| Trademarks | | | | 5,727 | | | (670) | | | 5,057 | |
| Patents | | | | 141 | | | (139) | | | 2 | |
| | | | | | | | |
| | | | | | | | |
Total intangible assets, net | | | | $ | 22,947 | | | $ | (6,047) | | | $ | 16,900 | |
Amortization expense for intangible assets, net for the years ended December 31, 20212023 and 20202022 was $1.7 million and $2.1 million, respectively.million.
Estimated amortization expense for intangible assets for 2022each year 2024 through 2028 is $1.7 million, for 2023 is $1.7 million, for 2024 is $1.7 million, for 2025 is $1.7 million, for 2026 is $1.7$1.8 million and thereafter is $6.5$3.5 million.
| | | | | | | | | | | | | | |
| | December 31,
2021 | | December 31,
2020 |
| Other current liabilities: | | | | |
| Professional fees | | $ | 832 | | | $ | 534 | |
| Sales and property taxes payable | | 550 | | | 453 | |
| Radiopharmaceuticals and consumable medical supplies | | 78 | | | 219 | |
| Current portion of finance lease obligation | | 588 | | | 594 | |
| Facilities and related costs | | 169 | | | 70 | |
| Outside services and consulting | | 282 | | | 181 | |
| Other accrued liabilities | | 534 | | | 949 | |
Total other current liabilities | | $ | 3,033 | | | $ | 3,000 | |
Notes receivable consists of the following principal and interest balances as of December 31, 2023 and December 31, 2022 (in thousands):
| | | | | | | | | | | |
| December 31,
2023 | | December 31,
2022 |
| Principal and interest | | Principal and interest |
| TTG Note | $ | 7,459 | | | $ | — | |
| MDOS Note | 1,192 | | | 1,358 | |
| KBS Customer Note | 176 | | | — | |
| $ | 8,827 | | | $ | 1,358 | |
As a part of the sale of Digirad Health, described further in Note 3. DiscontinuedOperations, a $7 million promissory note (the “TTG Note”) was entered into which represents an unsecured note receivable on our balance sheet. The note has a maturity date of May 3, 2029 with payment-in-kind (non-cash) interest on the outstanding principal balance hereof to accrue at the Interest Rate. The Interest Rate is defined as (i) during the period from the date of issuance of the note through the third anniversary of the date of issuance of the note, a per annum rate equal to the sum of (x) 5.0% per annum plus (y) the greater of 5.0% per annum and the weighted-average term SOFR-based interest rate of outstanding loans under the Senior Loan Agreement (as defined in the Digirad Purchase Agreement) during such period, and (ii) during the period following the third anniversary of the date of issuance of the note, a per annum rate equal to the sum of (x) 5.0% per annum plus (y) the greater of 7.0% per annum and the weighted-average term SOFR-based interest rate of outstanding loans under the Senior Loan Agreement during such period.
In 2021, we completed the sale of MD Office Solutions in exchange for a secured promissory note (the “MDOS Note”). The original principal amount of the MDOS Note was $1.4 million and in December 2022 the principal was modified to $1.5 million. The MDOS Note, the principal of which is approximately $1.2 million at December 31, 2023, is included in “Notes receivable, current portion” and “Notes receivable” in our Consolidated Balance Sheets at December 31, 2023 for $0.2 million and $1.0 million, respectively. The MDOS Note requires quarterly installments of $74 thousand and incurs interest at a fixed rate of 5.0% through maturity in 2028.
In 2023, KBS issued a promissory note to a customer, incurring 12% interest per annum (the “KBS Customer Note”). The KBS Customer Note is included in “Notes receivable, current portion” in the Consolidated Balance Sheets at December 31, 2023.
The balance of the Notes Receivable outstanding include any unpaid accrued interest. Interest Income recognized on Notes Receivable for the periods ended December 31, 2023 and December 31, 2022 totaled $0.5 million and $0.2 million, respectively. We have determined that all notes receivable are collectible in full and have established no reserves.
Cost Method Investment
As a part of the sale of Digirad Health, we received $6 million in the common equity of TTG Parent LLC. We have elected the measurement alternative under ASC 321. The measurement alternative election allows for equity securities that do not have readily determinable fair values to be recorded at cost, with adjustments for impairment and certain observable price changes reflected in earnings. Such securities are adjusted to fair value when an observable price change occurs or impairment is identified.
Accrued Liabilities
| | | | | | | | | | | | | | |
| | December 31,
2023 | | December 31,
2022 |
| Accrued liabilities: | | | | |
| Professional fees | | $ | 108 | | | $ | — | |
| Sales and property taxes payable | | — | | | 326 | |
| Outside services and consulting | | 279 | | | 55 | |
| | | | |
| Earn-out Provision | | 169 | | | — | |
| Taxes Payable related to Digirad Sale | | 398 | | | 81 | |
| Other accrued liabilities | | 552 | | | — | |
| Total accrued liabilities | | $ | 1,506 | | | $ | 462 | |
Note 6. Fair Value Measurements
We categorize our assets and liabilities measured at fair value into a three-level hierarchy in accordance with the authoritative guidance for fair value measurements. Assets and liabilities presented at fair value in our Consolidated Balance Sheets are generally categorized as follows:
Level 1:Quoted prices in active markets for identical assets or liabilities.
Level 2:Observable inputs other than Level 1 prices, such as quoted prices for similar assets or liabilities, quoted prices in markets that are not active, or other inputs that are observable or can be corroborated by observable market data for substantially the full term of the assets or liabilities.
Level 3:Unobservable inputs that are supported by little or no market activity and that are significant to the fair value of the assets or liabilities. Such assets and liabilities may have values determined using pricing models, discounted cash flow methodologies, or similar techniques, and include instruments for which the determination of fair value requires significant management judgment or estimation.
Financial assets and liabilities are classified in their entirety based on the lowest level of input that is significant to the fair value measurement. Our assessment of the significance of a particular input to the fair value measurement requires judgment, which may affect the valuation of assets and liabilities and their placement within the fair value hierarchy levels. The following table sets forth by level within the fair value hierarchy our assets and liabilities that were recorded at fair value as of December 31, 20212023 and 20202022 (in thousands):
| | At Fair Value as of December 31, 2021 |
| Level 1 | | Level 2 | | Level 3 | | Total |
| Assets: | | | | | | | | |
| | At Fair Value as of December 31, 2023 | | | | At Fair Value as of December 31, 2023 |
| | Level 1 | | | | Level 1 | | Level 2 | | Level 3 | | Total |
| Assets (liabilities): | |
| Equity securities | |
| Equity securities | |
| Equity securities | Equity securities | | $ | 47 | | | $ | — | | | $ | — | | | $ | 47 | |
| Lumber derivative contracts | Lumber derivative contracts | | 666 | | | — | | | — | | | 666 | |
| Total | Total | | $ | 713 | | | $ | — | | | $ | — | | | $ | 713 | |
|
| | At Fair Value as of December 31, 2020 |
| Level 1 | | Level 2 | | Level 3 | | Total |
| Assets: | | | | | | | | |
| | At Fair Value as of December 31, 2022 | | | | At Fair Value as of December 31, 2022 |
| | Level 1 | | | | Level 1 | | Level 2 | | Level 3 | | Total |
| Assets (liabilities): | |
| Equity securities | Equity securities | | $ | 35 | | | $ | 55 | | | $ | — | | | $ | 90 | |
| | Equity securities | |
| Equity securities | |
| Lumber derivative contracts | |
| Total | Total | | $ | 35 | | | $ | 55 | | | $ | — | | | $ | 90 | |
|
The investment in equity securities consists of common stock of publicly traded companies. The fair value of these securities is based on the closing prices observed on December 31, 20212023 and 2020,2022, respectively. During the yearyears ended December 31, 2021,2023, and 2020,2022, we recorded an unrealized gain of $20$85 thousand and $22loss of $893 thousand, respectively, in the Consolidated Statements of Operations.
We entered into lumber derivative contracts in order to protect our gross profit margins from fluctuations caused by volatility in lumber prices. For the yearyears ended December 31, 2021,2023 and 2022, we recorded a net gainrealized and unrealized loss of $0.4$53 thousand and $1.8 million, in the respectively, within cost of goods sold of therevenues in our Consolidated Statements of Operations. As of December 31, 2021,2023, we had a net long (buying) position of 2,420,000605,000 board feet under NaNtwenty-two lumber derivatives contracts. As of December 31, 2020,2022, we had noa net long (buying) position of 550,000 board feet under five lumber derivativederivatives contracts.
Note 7. Goodwill
Goodwill has historically been derived from the acquisition of ATRM in 2019, MDOS in 2015, and substantially all of the assets of Ultrascan in 2007. Diagnostic Imaging Solutions,2019. KBS and EBGL carry a goodwill balance of $1.6 million, $0.5 million and $4.0 million, respectively.
Changes in theThe carrying amount of goodwill for the years ended December 31, 20212023 and 2020,2022, by reportable segment, arechanged as follows (in thousands):
| | | | | | | | | | | | | | | | | | | | |
| | Healthcare | | Construction | | Total |
| Balance at December 31, 2019 | | $ | 1,745 | | | $ | 8,233 | | | $ | 9,978 | |
Impairment of EBGL (1) | | — | | | (436) | | | (436) | |
| Balance at December 31, 2020 | | 1,745 | | | 7,797 | | | 9,542 | |
De-recognition of MDOS (2) | | (137) | | | — | | | (137) | |
Impairment of KBS (3) | | — | | | (3,359) | | | (3,359) | |
| Balance at December 31, 2021 | | $ | 1,608 | | | $ | 4,438 | | | $ | 6,046 | |
| | | | | | | | | | | | | | |
| | Construction | | Total |
| Balance at December 31, 2022 | | $ | 4,438 | | | $ | 4,438 | |
| | | | |
| Balance at December 31, 2023 | | $ | 4,438 | | | $ | 4,438 | |
(1)The Company assesses qualitative and quantitative factors to determine whether goodwill is impaired. The analysis includes assessing the impact of changes in certain factors including: (1) changes in forecasted operating results and comparing actual results to projections, (2) changes in the industry or our competitive environment since the acquisition date, (3) changes in the overall economy, our market share and market interest rates since the acquisition date, (4) trends in the stock price and related market capitalization and enterprise values, (5) trends in peer companies’ total enterprise value metrics, and (6) additional factors such as management turnover, changes in regulation and changes in litigation matters.
Based on the annual assessment performed as of December 31, 2023, the Company concluded that it was more likely than not that the carrying value of the EBGL reporting unit were in excess of fair value. This conclusion was based on lower than expected operating results during the year ended December 31, 2020, primarily as a result of higher commodity lumber price and COVID-19 impact. As a result, we recorded an impairment loss of $0.4 million associated with the impairment assessment of the EBGL reporting unit as of December 31, 2020 within the Consolidated Statements of Operations.
(2)On February 1, 2021, in connection with the closing of the sale of MDOS, we de-recognized $0.1 million goodwill associated to the Diagnostic Services reporting unit.
(3)We concluded that it was more likely than not that the carrying value of the KBS reporting unit were in excess of fair value. This conclusion was based on lower than expected operating results during the year ended December 31, 2021, primarily as a result of the rise in material costs throughout the year. As a result, we recorded an impairment loss of $3.4 million associated with the impairment assessment of the KBS reporting unit as of December 31, 2021 within the Consolidated Statements of Operations.
During the fourth quarter of 2021, we elected to by-pass the qualitative assessment for all reporting units. We performed a quantitative assessment for all reporting units to estimate whether it is more likely than not that theestimated fair value of each reporting unit was less than its carrying amount. In performing the quantitative assessment, we determined the fair value of theour reporting units using both an income approachexceeded their carrying value, and therefore, determined it was not necessary to perform a market approach. Under the income-based approach, we use a discounted cash flow model in which cash flows anticipated over several future periods, plus a terminal value at the end of that time horizon, are discounted to their present value using an appropriate risk-adjusted rate of return. We use our internal forecasts to estimate future cash flows and include an estimate of long-term growth rates based on our most recent views of the long-term outlook. Actual results may differ materially from those used in our forecasts. The discount rate used in the discounted cash flow analysis reflects the risks inherent in the expected future cash flows. Determining fair value using a market approach considers multiples of financial metrics based on both acquisitions and trading multiples of a selected peer group of companies. From the comparable companies, a representative market multiple was determined which was applied to financial metrics to estimate the fair value.
Estimating the fair value of the reporting units requires the use of estimates and significant judgments regarding future cash flows that are based on a number of factors including actual operating results, forecasted working capital, revenue, and spend targets, discount rate assumptions, and long-term growth rate assumptions. These estimates and judgments could adversely change in future periods and we cannot provide absolute assurance that all of the targets will be achieved, which could lead to futurequantitative goodwill impairment charges.test.
Note 8. Debt
A summary of debt as of December 31, 20212023 and 20202022 is as follows (dollars in thousands):
| | | | | | | | | | | | | | | | | | | | | | | | | | |
| | December 31, 2021 | | December 31, 2020 |
| | Amount | | Weighted-Average Interest Rate | | Amount | | Weighted-Average Interest Rate |
| Revolving Credit Facility - Gerber KBS | | $ | 3,131 | | | 6.00% | | $ | 1,099 | | | 6.00% |
| | | | | | | | |
| Revolving Credit Facility - Gerber EBGL | | 1,652 | | | 6.00% | | 2,016 | | | 6.00% |
| Revolving Credit Facility - SNB | | 7,016 | | | 2.60% | | 12,710 | | | 2.64% |
| Total Short-term Revolving Credit Facility | | $ | 11,799 | | | 3.98% | | $ | 15,825 | | | 3.30% |
| Gerber - Star Term Loan | | $ | 1,070 | | | 6.25% | | $ | 262 | | | 6.75% |
| Premier - Term Loan | | — | | | —% | | 419 | | | 5.75% |
| Short-term debt and current portion of long-term debt | | $ | 1,070 | | | 6.25% | | $ | 681 | | | 6.13% |
| Short-term Paycheck Protection Program Notes | | $ | — | | | —% | | $ | 1,856 | | | 1.00% |
| Total short-term debt and current portion of long-term debt | | $ | 12,869 | | | 4.17% | | $ | 18,362 | | | 3.17% |
| | | | | | | | |
| | | | | | | | |
| | | | | | | | |
| Gerber - Star Term Loan | | $ | — | | | —% | | $ | 1,058 | | | 6.75% |
| Premier - Term Loan | | — | | | —% | | 321 | | | 5.75% |
| Long-term debt, net of current portion | | $ | — | | | —% | | $ | 1,379 | | | 6.52% |
| Long-term Paycheck Protection Program Notes | | $ | — | | | —% | | $ | 2,321 | | | 1.00% |
| Total long-term debt, net of current portion | | $ | — | | | —% | | $ | 3,700 | | | 3.06% |
| | | | | | | | |
| LSV Co-Invest I Promissory Note (“January Note”) | | $ | — | | | —% | | $ | 709 | | | 12.00% |
| LSV Co-Invest I Promissory Note (“June Note”) | | — | | | —% | | 1,220 | | | 12.00% |
| LSVM Note | | — | | | —% | | 378 | | | 12.00% |
Total notes payable to related parties (1) | | $ | — | | | —% | | $ | 2,307 | | | 12.00% |
| | | | | | | | |
| Total debt | | $ | 12,869 | | | 4.17% | | $ | 24,369 | | | 3.99% |
| | | | | | | | | | | | | | | | | | | | | | | | | | |
| | December 31, 2023 | | December 31, 2022 |
| | Amount | | Weighted-Average Interest Rate | | Amount | | Weighted-Average Interest Rate |
| | | | | | | | |
| Revolving Credit Facility - Premier | | $ | 2,019 | | | 9.25% | | $ | — | | | —% |
| Revolving Credit Facility - eCapital EBGL | | — | | | —% | | 2,592 | | | 10.25% |
| | | | | | | | |
| Total Short-term Revolving Credit Facilities | | $ | 2,019 | | | 9.25% | | $ | 2,592 | | | 10.25% |
| eCapital - Star Loan Principal, net | | $ | — | | | —% | | $ | 791 | | | 10.50% |
| Short Term Loan | | $ | — | | | —% | | $ | 791 | | | 10.50% |
| Total Short-term debt | | $ | 2,019 | | | 9.25% | | $ | 3,383 | | | 10.31% |
| | | | | | | | |
(1)See Note 14. Related Party Transactions, for information regarding certain ATRM promissory notes.
Term Loan Facilities
As of December 31, 2021, the short-term debt includes $1.1 million of the Star term loan (as defined below), net of issuance costs.
The following table presents the Star Loan balance net of unamortized debt issuance costs as of December 31, 2021, and 2020, respectively (in thousands):
| | | | | | | | | | | | | | |
| | December 31, 2021 | | December 31, 2020 |
| | Amount | | Amount |
| Gerber - Star Term Loan Principal | | $ | 1,246 | | | $ | 1,633 | |
| Premier - Term Loan | | — | | | 740 | |
| Total Principal | | 1,246 | | | 2,373 | |
| Unamortized debt issuance costs | | (176) | | | (313) | |
| Total | | $ | 1,070 | | | $ | 2,060 | |
Sterling CreditPremier Facility
On March 29, 2019, the Company entered into a Loan and Security Agreement (the “SNB Loan Agreement”) by and among certain subsidiaries of the Company, as borrowers (collectively, the “SNB Borrowers”); the Company, as guarantor; and Sterling National Bank.
The SNB Loan Agreement is a five-year credit facility maturing in March 2024, with a maximum credit amount of $20.0 million for revolving loans. Under the SNB Credit Facility, the SNB Borrowers can request the issuance of letters of credit in an aggregate amount not to exceed $0.5 million at any one time outstanding. The borrowings under the SNB Loan Agreement were classified as short-term obligations under GAAP as the agreement contained a subjective acceleration clause and required a lockbox arrangement whereby all receipts are swept daily to reduce borrowings outstanding. As of December 31, 2021, the Company had $0.1 million of letters of credit outstanding and had additional borrowing capacity of $2.5 million.
At the SNB Borrowers’ option, the SNB Credit Facility will bear interest at either (i) a Floating LIBOR Rate, as defined in the SNB Loan Agreement, plus a margin of 2.50% per annum; or (ii) a Fixed LIBOR Rate, as defined in the SNB Loan Agreement, plus a margin of 2.25% per annum. Our floating rate on this facility at the end of 2021 was 2.60%. The SNB Loan Agreement also provides for certain fees payable to Sterling National Bank during its term including an unused line fee determined on a daily basis, in an amount equal to one-quarter of one percent (0.25%) per annum multiplied by the amount by which the SNB Loan Agreement credit limit exceeded the sum of the average daily outstanding amount and outstanding letters of credit. Given that only the assets of the Digirad Health businesses serve as collateral support for the SNB Credit Facility, distributions from this facility are restricted in their use. They must be used solely to finance these Healthcare businesses, unless there is $4.0 million or greater remaining in undrawn capacity after any distributions made to the parent company or other Star entities.
On February 1, 2021, in connection with the closing of the sale of MDOS, we entered into a First Amendment to the SNB Loan Agreement pursuant to which SNB consented to the sale of MDOS and the Company’s name change from Digirad Corporation to Star Equity Holdings, Inc.
On March 31, 2021, in connection with completing the sale of DMS Health, we entered into a Second Amendment to the SNB Loan Agreement pursuant to which SNB consented to the sale of DMS Health and its subsidiaries and required the principal to be paid down to $7.0 million.
Financial covenants required that the SNB Borrowers maintain (a) a Fixed Charge Coverage Ratio as of the last day of such fiscal quarter to not be less than 1.25 to 1.0 and (b) a Leverage Ratio as of the last day of such fiscal quarter shall not be greater than 3.50 to 1.0. At December 31, 2021 and 2020, the Company was in compliance with all covenants.
Construction Loan Agreements
As of December 31, 2021, the Construction division had outstanding revolving lines of credit of approximately $4.8 million. Our Construction debt primarily included (i) $3.1 million principal outstanding on KBS’s $4.0 million revolving credit facility under the KBS Loan Agreement, with Gerber and (ii) $1.7 million principal outstanding on EBGL’s $3.0 million revolving credit facility, which was increased from $3.0 million to $4.0 million on July 30, 2021. As of December 31, 2021, the Construction division was at the maximum borrowing capacity under both revolving lines of credit, based on the inventory and accounts receivable on that day which fluctuates weekly. The Construction Loan Agreements contain cross default provisions and subjective acceleration clauses which may in the event of a material adverse event, as determined by Gerber, allow Gerber to declare the loans and all other obligations under the Construction Loan Agreements immediately due and payable or increase the interest rate at which loans and obligations under the Construction Loan Agreements bear interest. Each of the two Gerber credit facilities are backed by the assets of their respective borrower (KBS or EBGL), which serve as collateral support. Therefore, distributions from each facility are restricted in their use, as they must be used solely to finance the operations of their respective borrower.
KBS Loan Agreement
On February 23, 2016, ATRM, KBS, and Main Modular Haulers, Inc. entered into the KBS Loan Agreement with Gerber. The KBS Loan Agreement provides KBS with a revolving line of credit with borrowing availability of up to $4.0 million. Availability under the line of credit is based on a formula tied to KBS’s eligible accounts receivable, inventory and other collateral. The KBS Loan Agreement, which was scheduled to expire on February 22, 2018, has been automatically extended for successive one (1) year periods in accordance with its terms and is now scheduled to expire on February 22, 2023. The KBS Loan Agreement will be automatically extended for another one (1) year period unless a party thereto provides prior written notice of termination. As of December 31, 2021, neither party has provided notice of termination. Upon the final expiration of the term of the KBS Loan Agreement, the outstanding principal balance is payable in full. Borrowings bear interest at the prime rate plus 2.75%, equating to 6.00% at December 31, 2021, with interest payable monthly. The KBS Loan Agreement also provides for certain fees payable to Gerber during its term, including a 1.5% annual facilities fee and a 0.10% monthly collateral monitoring fee. KBS’s obligations under the KBS Loan Agreement are secured by all of its assets and are guaranteed by the Company. Financial covenants required that KBS maintain a post-tax net income (as defined in the KBS Loan Agreement) at least equal to (a) $385 thousand for the trailing 6-month period ending June 30, 2021 and $500 thousand for the trailing fiscal year end December 31, 2021 and a minimum EBITDA (as defined in the KBS Loan Agreement) at (a) June 30, 2021 to be more than $880 thousand or (b) fiscal year end December 31, 2021 to be more than $1.5 million. The borrowings under the KBS Loan Agreement were classified as short-term obligations under GAAP as the agreement contained a subjective acceleration clause and required a lockbox arrangement whereby all receipts are swept daily to reduce borrowings outstanding.
At December 31, 2021, approximately $3.1 million was outstanding under the KBS Loan Agreement.
On March 31, 2021, the parties to the KBS Loan Agreement have amended the KBS Loan Agreement to provide for increased availability under the KBS Loan Agreement to KBS under certain circumstances, including for new equipment additions, and certain other changes, as well as a waiver of certain covenants.
As of December 31, 2021 and 2020, KBS was not in compliance with the financial covenants. The occurrence of any unrectifiable event of default under the KBS Loan Agreement may result in KBS’s obligations under the KBS Loan Agreement becoming immediately due and payable. In all prior periods and as of December 31, 2021, we obtained a waiver from Gerber for financial covenant breaches. However, there can be no assurance that we will be able to obtain such waivers in the event of future financial covenant violations.
On March 8, 2022, the borrowers under the KBS Loan Agreement entered into the Nineteenth Amendment to KBS Loan Agreement to amend the financial covenants to require that KBS maintain (a) a net cash income (as defined in the KBS Loan Agreement) of at least equal to no less than $0 for the trailing 6-month period ending June 30, 2022 and be no less than $500,000 for the trailing fiscal year ending December 31, 2022 and (b) a minimum EBITDA (as defined in the KBS Loan Agreement) no less than $0 as of June 30, 2022 and no less than $850,000 as of the fiscal year ending December 31, 2022, as well as a waiver of certain covenants as of December 31, 2021.
EBGL Premier Note
On June 30, 2017,August 16, 2023, EdgeBuilder and Glenbrook (together, EBGL)(the “EBGL Borrowers”) entered into a Revolving Credit Loan Agreement (as amended, the Premier Loan Agreement with Premier Bank (“Premier”) providing the EBGL Borrowers with a working capital line of credit of up to $3.0 million.
$4 million, which agreement was subsequently replaced and increased to $6 million on December 5, 2023 (the “Premier Loan Agreement”). Availability under the Premier Loan Agreement is based on a formula tied to EBGL’sthe EBGL Borrowers’ eligible accounts receivable, inventory and equipment, and borrowingsequipment. Borrowings under the Premier Loan Agreement bear interest at the prime rate plus 1.50%0.75% (and a minimum interest rate of 6.75%), with interest payable monthly and the outstanding principal balance payable upon expiration of the term of the Premier Loan Agreement. The Premier Loan Agreement also provides for certain fees payable to Premier during its term. The initial term of the Premier Loan Agreement was scheduledexpires on December 5, 2024 but may be extended from time to expire on June 30, 2018, but was extended multiple timestime at the request of the EBGL Borrowers, subject to approval by Premier through January 31, 2023. EBGL’sPremier. The EBGL Borrowers’ obligations under the Premier Loan Agreement are guaranteed by the Company and secured by all of their inventory, equipment, accounts and other intangibles, fixtures and all proceedsintangibles. As of the foregoing.
On January 31, 2020, EBGL entered into an Extension and Modification Agreement (the “Modification Agreement”) with Premier that modified the terms of the Revolving Credit Promissory Note (the “Premier Note”). Pursuant to the Modification Agreement, the amount of indebtedness evidenced by the Premier Note was reduced to $1.0 million, and the Premier Note was modified to: (a) extend the Final Maturity Date (as defined in the Premier Note) of the Premier Note to JanuaryDecember 31, 2023, and (b) set the interest that the Premier Note would bear at 5.75% per annum. EBGL’s obligationsavailability under the Premier Loan Agreement were secured by all of its assets.was approximately $3 million.
All obligations underFinancial covenants associated with the Premier Loan Agreement were repaidrequire that the EBGL Borrowers maintain (a) a debt service coverage ratio for any calendar year of less than 1.25; (b) a debt-to-equity ratio at the end of each calendar year in full inexcess of 1.65; (c) a fixed charge coverage ratio at the second quarterend of 2021each calendar year of less than 1.10; (d) working capital of at least $2 million; and no amount remains outstanding as(e) a current ratio of at least 1.50. As of December 31, 2021. In exchange2023, the EBGL Borrowers were not in compliance with the Premier terminated all of its security interests inLoan Agreement covenants. The EBGL Borrowers have obtained a waiver from Premier for the assets of EBGL.annual covenant breach.
Gerber Star LoanWebster Credit Facility
On January 31, 2020, SRE, 947 Waterford Road, LLCMarch 29, 2019, the Company entered into a Loan and Security Agreement (the “Webster Loan Agreement”) by and among certain subsidiaries of the Company, as borrowers; the Company, as guarantor; and Sterling National Bank (“947 Waterford”Sterling”), 300 Park Street, LLC. On February 1, 2022, Sterling became part of Webster Bank, N.A. (“300 Park”Webster”), and 56 Mechanic Falls Road, LLC (“56 Mechanic” and togetherWebster became the successor in interest to the Webster Loan Agreement. In connection with SRE, 947 Waterford, and 300 Park, (the “Star Borrowers”), each an Investments subsidiary, and the Company, ATRM, KBS, EdgeBuilder, and Glenbrook (collectively,sale of our Healthcare business on May 4, 2023, the “Star Credit Parties”), entered intocredit facility pursuant to the StarWebster Loan Agreement with Gerberwas paid in full and terminated.
eCapital Credit Facilities and Term Loan
EBGL
The EBGL Borrowers were formerly parties to a Loan and Security Agreement providing the StarEBGL Borrowers with a credit facility with eCapital Asset Based Lending Corp. formerly known as Gerber Finance, Inc. (“eCapital”) for borrowings up to $4.0 million, subject to certain borrowing base limitations (the “EBGL Loan”). KBS was also party to a revolving credit facility with eCapital which provided for borrowing up to $4.0 million, subject to certain borrowing base limitations.
We and certain of our Investments subsidiaries were party to a Loan and Security Agreement with eCapital, as successor in interest to Gerber Finance, Inc., which provided for a credit facility with borrowing availability of up to $2.5 million, ($2.0 million and $0.5 million to KBS and EBGL, respectively) or the Star Loan. The advance of $2.0 million to KBS is to be repaid in monthly installments of sixty (60) consecutive equal payments. The advance of $0.5 million to EBGL, which has been temporarily increased by $0.3 million due to be repaid on April 30, 2020, was to be repaid in monthly installments of twelve (12) consecutive equal payments. The Star Loan matures on the earlier of (a) January 1, 2025 or (b) the termination, the maturity or repayment of the EBGL Loan. Availability under the Star Loan Agreement was based on a formula tied to the value of real estate owned by the Star Borrowers, and borrowings bearbearing interest at the prime rate plus 3.5% per annum. Theannum, and maturing on January 31, 2025, unless terminated in accordance with the terms therein (the “Star Loan”).
During the second quarter of 2023, we notified eCapital that we would not be renewing any of our outstanding eCapital positions upon expiry at June 30, 2023. Subsequently, we paid in full all amounts then outstanding under the Star Loan also provides for certain fees payableon May 9, 2023. We are no longer party to Gerber during its term, including a 1.5% annual facilities fee and a 0.10% monthly collateral monitoring fee.any credit agreements with eCapital.
On February 20, 2020, the Star Borrowers entered into a First Amendment to Loan and Security Agreement (the “First Star Amendment”) with Gerber that amended the Star Loan Agreement in order to (i) temporarily advance $0.3 million to EBGL, which amount is to be repaid to Gerber on or before April 30, 2020; (ii) clarify that Gerber can make multiple advances under the Star Loan Agreement, and (iii) to correct the maturity date of the Star Loan. On April 30, 2020, the Star Borrowers entered into a Second Amendment to Loan and Security Agreement (the “Second Star Amendment”) with Gerber that amended the Star Loan Agreement in order to change terms of repayment for the advance of $0.3 million to EBGL provided for under the First Star Amendment. Under the terms of the Second Star Amendment, the advance of $0.3 million to EBGL was to be repaid in three (3) consecutive equal monthly installments on the thirtieth (30th) day in each calendar month, commencing May 30, 2020, and in a final installment on or before July 31, 2020. As of September 30, 2020, EBGL had repaid the $0.3 million in full to Gerber.
The obligations of the Star Borrowers under the Star Loan Agreement are guaranteed by the Star Credit Parties and are secured by substantially all the assets of the Star Borrowers and the Star Credit Parties. Contemporaneously with the execution and delivery of the Star Loan Agreement, Jeffrey E. Eberwein, the Executive Chairman, executed and delivered a Guaranty (the “Gerber Eberwein Guaranty”) to Gerber, pursuant to which he guaranteed the performance of all the Star Borrowers’ obligations to Gerber. Mr. Eberwein’s obligations under the Gerber Eberwein Guaranty are limited in the aggregate to the amount of (a) $2.5 million, plus (b) costs of Gerber incidental to the enforcement of the Gerber Eberwein Guaranty or any guaranteed obligations.
On February 26, 2021, the Star Borrowers entered into a Third Amendment to the Star Loan Agreement (the “Third Star Amendment”) with Gerber that amended the contract rate to prime rate plus 3% and discharged the $2.5 million Gerber Eberwein Guaranty.
The financial covenants under the Star Loan Agreement include maintenance of a Debt Service Coverage Ratio of not less than 1:00 to 1:00, as defined in the Star Loan Agreement, as of December 31, 2021. The occurrence of any event of default under the Star Loan Agreements may result in the obligations of the Star Borrowers becoming immediately due and payable. As of December 31, 2021 and 2020, we were in compliance with the annual financial covenants.
As of December 31, 2021, $1.1 million was outstanding under the Star Loan Agreement. The borrowings under the Star Loan Agreement were classified as short-term obligations under GAAP, because the borrowings under the EBGL Loan Agreement were classified as short-term obligations under GAAP given the EBGL and KBS Loan Agreements contain a subjective acceleration clause and require a lockbox arrangement whereby all receipts are swept daily to reduce borrowings outstanding. Accordingly,if (i) a material adverse effect may be seen to have occurred, (ii) Gerber in its discretion deems a EBGL Loan Agreement default occurred, and (iii) the proceeds swept are insufficient to pay the balance outstanding, Gerber may then demand all obligations under the Star Loan Agreement immediately due and payable due to cross-default provision, occurring within the Star Loan Agreement. Since a material event can occur at any time, all obligations under the Star Loan Agreement, EBGL Loan Agreement and KBS Loan Agreement are classified as short-term obligations.
Gerber EBGL Loans
On January 31, 2020, EdgeBuilder and Glenbrook (the “EBGL Borrowers”), each a Construction Subsidiary, and the Company, 947 Waterford, 300 Park, 56 Mechanic, ATRM, and KBS (collectively, the “EBGL Credit Parties”), entered into a Loan and Security Agreement (the “EBGL Loan Agreement”) with Gerber providing the EBGL Borrowers with a credit facility with borrowing availability of up to $3.0 million (the “EBGL Loan”). On March 5, 2020, the EBGL Borrowers entered into a First Amendment to Loan and Security Agreement (the “First EBGL Amendment”) with Gerber that amended the EBGL Loan Agreement and the KBS Loan Agreement to include a pledge $0.3 million of cash collateral by Lone Star Value Investors (“LSVI”) under the EBGL Loan Agreement which, prior to the First EBGL Amendment, was pledged by LSVI in connection with the KBS Loan Agreement. On July 1, 2020, the EBGL Borrowers entered into a Second Amendment that terminated the pledge of $0.3 million in cash collateral. On February 26, 2021, the EBGL Borrowers entered into a Third Amendment to the EBGL Loan Agreement (the “Third EBGL Amendment”), pursuant to which the Company and Gerber eliminated the minimum leverage ratio covenant, lowered the minimum EBITDA, and required the borrowers to not incur a net operating loss on bi-annual basis. The Third EBGL Amendment also discharged the EBGL Eberwein Guaranty described below. As of December 31, 2021, $1.7 million was outstanding under the EBGL Loan.
Availability under the EBGL Loan Agreement was also based on a formula tied to the EBGL Borrowers’ eligible accounts receivable and inventory, and borrowings bear interest at the prime rate plus 2.75% per annum. The EBGL Loan Agreement also provides for certain fees payable to Gerber during its term, including a 1.5% annual facilities fee and a 0.10% monthly collateral monitoring fee. EBGL’s obligations under the Premier Loan Agreement are secured by all of its assets. The EBGL Loan Agreement also provided for certain fees payable to Gerber during its terms. The EBGL Loan matures on the earlier of (a) January 1, 2023, unless extended, or (b) the termination, the maturity or repayment of the Star Loan. The maturity of the EBGL Loan is automatically extended for successive periods of one (1) year each unless terminated by Gerber or the EBGL Borrowers. The borrowings under the EBGL Loan Agreement were classified as short-term obligations under GAAP as the agreement contained a subjective acceleration clause and required a lockbox arrangement whereby all receipts are swept daily to reduce borrowings outstanding.
The obligations of the EBGL Borrowers under the EBGL Loan Agreement are guaranteed by the EBGL Credit Parties and are secured by substantially all the assets of the EBGL Borrowers and the EBGL Credit Parties. On March 5, 2020, contemporaneously with the execution and delivery of the First EBGL Amendment, Mr. Eberwein, executed and delivered a Guaranty (the “EBGL Eberwein Guaranty”) to Gerber which he guaranteed the performance of all the EBGL Borrowers’ obligations to Gerber under the EBGL Loan Agreement, including the full payment of all indebtedness owing by the EBGL Borrowers to Gerber in connection with the EBGL Loan Agreement and related financing documents. Mr. Eberwein’s obligations under the EBGL Eberwein Guaranty are limited in the aggregate to the amount of (a) $0.5 million, plus (b) costs of Gerber incidental to the enforcement of the EBGL Eberwein Guaranty or any guaranteed obligations.
On July 30, 2021, the EBGL Borrowers entered into a Fourth Amendment to the EBGL Loan Agreement (the “Fourth EBGL Amendment”) with Gerber, which increased the eligible inventory and the maximum borrowing limit from $3.0 million to $4.0 million.
The financial covenants under the EBGL Loan Agreement include maintenance of a minimum EBITDA and no net operating loss, as defined in the EBGL Loan Agreement, for the six months ended June 30, 2021 and for the year ended December 31, 2021. The occurrence of any event of default under the EBGL Loan Agreement and certain events of default under the KBS Loan Agreement may result in the obligations of the EBGL Borrowers becoming immediately due and payable. As of December 31, 2021, no event of default was deemed to have occurred and EBGL was in compliance with the bi-annual financial covenants under the EBGL Loan Agreement.
On October 21, 2021, the EBGL Borrowers entered into the Fifth Amendment to the EBGL Loan Agreement (the “Fifth EBGL Amendment”) with Gerber to amend the definition of “Reserves” to include a minimum amount, subsequent to Glenbrook Building Supply, Inc. entering a new lease for a larger property.
On January 20, 2022, the EBGL Borrowers entered into the Sixth Amendment to the EBGL Loan Agreement (the “Sixth EBGL Amendment”) with Gerber and reduced the minimum average monthly loan amount to 25% of the $4.0 million maximum revolving amount.
On March 8, 2022, the EBGL Borrowers entered into the Seventh Amendment to the EBGL Loan Agreement (the “Seventh EBGL Amendment”) with Gerber to amend and lower the financial covenants to require that EBGL maintain (a) a lower net cash income (as defined in the EBGL Loan Agreement) at least equal to no less than $0 for the trailing 6-month period ending June 30, 2022 and no less than $1,000,000 for the trailing fiscal year end December 31, 2022 and (b) a reduced minimum EBITDA (as defined in the EBGL Loan Agreement) to be no less than $0 as of June 30, 2022 and no less than $1,000,000 as of the fiscal year ending December 31, 2022.
Paycheck Protection Program
From April 2020 through May 2020, the Company and its subsidiaries received $6.7 million of loans under the Paycheck Protection Program (“PPP”).
On April 30, 2020, each of KBS, EdgeBuilder and Glenbrook executed a separate promissory note evidencing unsecured loans under the Paycheck Protection Program (the “PPP”). The promissory note executed by KBS is for $0.8 million (the “KBS Note”), the promissory note executed by EdgeBuilder is for $0.2 million (the “EdgeBuilder Note”) and the promissory note executed by Glenbrook is for $0.2 million (the “Glenbrook Note”). The KBS Note, the EdgeBuilder Note and the Glenbrook Note, each dated April 30, 2020, are referred to together as the “Construction Notes”.
On May 11, 2020, the Company and each of Digirad Imaging Solutions, Inc. (“DIS”), DMS Imaging, Inc. (“DMS Imaging”) and DMS Health, each a direct or indirect wholly owned subsidiary of the Company, executed a separate promissory note evidencing unsecured loans under the PPP. The promissory note executed by the Company, dated May 7, 2020, is for $0.8 million (the “Company Note”); the promissory note executed by DIS, dated May 5, 2020, is for $3.0 million (the “DIS Note”); the promissory note executed by DMS Imaging, dated May 5, 2020, is for $1.6 million (the “DMS Imaging Note”) and the promissory note executed by DMS Health, dated May 7, 2020, is for $0.1 million (the “DMS Health Note”). The Company Note, the DIS Note, the DMS Imaging Note, and the DMS Health Note are referred to together as the “Healthcare Notes”. The Construction Notes and the Healthcare Notes are referred to collectively as the “PPP Notes” and each promissory note individually as a “PPP Note”.
The PPP was established under the Coronavirus Aid, Relief, and Economic Security Act (the “CARES Act”) and is administered by the U.S. Small Business Administration (“SBA”). The loans evidenced by the Construction Notes were made through Bremer Bank (“Bremer”) as lender, and the loans evidenced by the Healthcare Notes were made through Sterling as lender.
The loans evidenced by the PPP Notes (the “PPP Loans”) have two-year terms and bear interest at a rate of 1.00% per annum. Monthly principal and interest payments under the PPP Loans are deferred until repaid.
Under the terms of the CARES Act, recipients of loans under the PPP could apply for and be granted forgiveness for all or a portion of the loan granted under the PPP. Such forgiveness would be determined, subject to limitations, based on the use of loan proceeds for payment of payroll costs and certain other eligible costs. Even if forgiveness is granted the PPP Loans may remain subject to review and audit for up to six (6) years.
During fiscal year 2020 and 2021, the Company applied for forgiveness on all PPP Loans. As of December 31, 2021, all PPP Loans were forgiven, resulting in a gain of $4.2 million in 2021 and $2.5 million in 2020, thus, the Company has no PPP Loans outstanding.
Note 9. Commitments and Contingencies
In the normal course of business, we have been and will likely continue to be subject to other litigation or administrative proceedings incidental to our business, such as claims related to compliance with regulatory standards. customer disputes, employment practices, wage and hour disputes, product liability, professional liability, malpractice liability, commercial disputes, licensure restrictions or denials, and warranty or patent infringement. Responding to litigation or administrative proceedings, regardless of whether they have merit, can be expensive and disruptive to normal business operations. We are not able to predict the timing or outcome of these matters and currently do not expect that the resolution of these matters will have a material adverse effect on our financial position or results of operations.
The outcome of litigation and the amount or range of potential loss at particular points in time may be difficult to ascertain. Among other things, uncertainties can include how trial and appellate courts will apply the law and interpret facts, as well as the contractual and statutory obligations of other indemnifying and insuring parties. The estimated range of reasonably possible losses, and their effect on our financial position is based upon currently available information and is subject to significant judgment and a variety of assumptions, as well as known and unknown uncertainties.
On December 27, 2021, the Company reached a settlement in the matter of Kiefer v. Heart of Georgia, et al, GA State Ct. (“Kiefer”), where a judgment for wrongful death and medical expenses in the amount of $4.96 million was entered on October 4, 2021 against a prior employee of Diagnostic Imaging Services, which employee Diagnostic Imaging Services contractually indemnified. The plaintiff’s original complaint was filed April 19, 2018, regarding events occurring on October 12, 2015. A settlement agreement resulted in the payment of $0.1 million by the Company on December 20, 2021. Following such payment, Diagnostic Imaging Services was released from any claims, damages, rights and causes of action..
Note 10. Leases
Lessee
We have operating and finance leases for corporate offices and operating locations, vehicles, and certain equipment. Our leases have remaining lease terms of 1 year to 10 years, some of which include options to extend the leases and some of which include options to terminate the leases within 1 year. Operating leases and finance leases are included separately in the Consolidated Balance Sheets as operating lease right-of-use assets, net and finance lease assets are included in property and equipment with the related liabilities included in other current liabilities and other liabilities in the Consolidated Balance Sheets.
As noted in the Note 2. Basis of Presentation and Significant Accounting Policies,we revised our operating lease right-of-use assets and operating lease liabilities in the accompanying Consolidated Balance Sheets, as of December 31, 2020. As a result of this revision, our disclosure of weighted average remaining lease terms and discount rate were revised. The adjustments had no effect on the Consolidated Statements of Operations and Consolidated Statements of Cash Flows for the periods presented.
The components of lease expense for the years ended December 31, 20212023 and 20202022 are as follows (in thousands):
| | December 31,
2021 | | December 31,
2020 |
| | December 31,
2023 | | | | December 31,
2023 | | December 31,
2022 |
| Operating lease cost | Operating lease cost | | $ | 1,429 | | | $ | 1,303 | |
| | Finance lease cost: | Finance lease cost: | |
| Finance lease cost: | |
| Finance lease cost: | |
| Amortization of finance lease assets | |
| Amortization of finance lease assets | |
| Amortization of finance lease assets | Amortization of finance lease assets | | $ | 476 | | | $ | 463 | |
| Interest on finance lease liabilities | Interest on finance lease liabilities | | 81 | | | 92 | |
| Total finance lease cost | Total finance lease cost | | $ | 557 | | | $ | 555 | |
Supplemental cash flow information related to leases from continuing operations were as follows (in thousands):
| | | | | | | | | | | | | | |
| | December 31,
2021 | | December 31,
2020 |
| Cash paid for amounts included in the measurement of lease liabilities: | | | | |
| Operating cash flows from operating leases | | $ | 1,197 | | | $ | 1,201 | |
| Operating cash flows from finance leases | | $ | 81 | | | $ | 92 | |
| Financing cash flows from finance leases | | $ | 669 | | | $ | 588 | |
| | | | |
| Right-of-use assets obtained in exchange for lease obligations: | | | | |
| Operating leases | | $ | 3,035 | | | $ | 1,762 | |
| Finance leases | | $ | 509 | | | $ | 579 | |
| | | | | | | | | | | | | | |
| | December 31,
2023 | | December 31,
2022 |
| Cash paid for amounts included in the measurement of lease liabilities: | | | | |
| Operating cash flows from operating leases | | $ | 386 | | | $ | 367 | |
| Operating cash flows from finance leases | | $ | 11 | | | $ | 17 | |
| Financing cash flows from finance leases | | $ | 98 | | | $ | 100 | |
| | | | |
| Right-of-use assets obtained in exchange for lease obligations: | | | | |
| Operating leases | | $ | — | | | $ | 666 | |
| Finance leases | | $ | — | | | $ | 90 | |
Supplemental balance sheet information related to leases as of December 31, 20212023 and 20202022 were as follows (in thousands):
| | | | | | | | | | | | | | |
| | December 31,
2021 | | December 31,
2020 |
Operating lease right-of-use assets, net (2) | | $ | 4,494 | | | $ | 2,935 | |
| | | | |
Operating lease liabilities (2) | | $ | 1,253 | | | $ | 1,278 | |
Operating lease liabilities, net of current (2) | | 3,299 | | | 1,727 | |
Total operating lease liabilities | | $ | 4,552 | | | $ | 3,005 | |
| | | | |
| Finance lease assets | | $ | 2,901 | | | $ | 2,765 | |
| Finance lease accumulated amortization | | (1,377) | | | (791) | |
| Total finance lease assets, net | | $ | 1,524 | | | $ | 1,974 | |
| | | | |
Finance lease liabilities (1) | | $ | 588 | | | $ | 594 | |
Finance lease liabilities, net of current (1) | | 706 | | | 937 | |
| Total finance lease liabilities | | $ | 1,294 | | | $ | 1,531 | |
| | | | |
| Weighted-Average Remaining Lease Term (in years) | | | | |
| Operating leases | | 3.9 | | 3.0 |
| Finance leases | | 2.6 | | 2.8 |
| | | | |
| Weighted-Average Discount Rate | | | | |
| Operating leases | | 4.23 | % | | 4.73 | % |
| Finance leases | | 5.05 | % | | 6.44 | % |
| | | | | | | | | | | | | | |
| | December 31,
2023 | | December 31,
2022 |
| | | | |
| | | | |
| | | | |
| | | | |
| | | | |
| | | | |
| | | | |
| | | | |
| | | | |
| | | | |
| | | | |
| | | | |
| | | | |
| | | | |
| Weighted-Average Remaining Lease Term (in years) | | | | |
| Operating leases | | 4.3 | | 4.7 |
| Finance leases | | 2.2 | | 2.4 |
| | | | |
| Weighted-Average Discount Rate | | | | |
| Operating leases | | 5.46 | % | | 5.61 | % |
| Finance leases | | 5.86 | % | | 5.91 | % |
(1) Finance leases are recorded in other current and long-term liabilities as of December 31, 2021 and 2020.
(2)
53
The increase of $1.6 million was primarily related to lease extensions for our EBGL facilities and Diagnostic Services hubs.
We are committed to making future cash payments on non-cancelable operating leases and finance leases (including interest). The future minimum lease payments due under both non-cancelable operating leases and finance leases having initial or remaining lease terms in excess of one year as of December 31, 20212023 were as follows (in thousands):
| | | | | Operating
Leases | | Finance
Leases | | | Operating
Leases | | Finance
Leases |
| 2022 | | $ | 1,417 | | | $ | 635 | |
| 2023 | | 1,252 | | | 406 | |
| 2024 | 2024 | | 1,126 | | | 251 | |
| 2025 | 2025 | | 658 | | | 83 | |
| Thereafter | | 496 | | | — | |
| 2026 | |
| 2027 | |
| 2028 | |
| 2029 and thereafter | |
| Total future minimum lease payments | Total future minimum lease payments | | 4,949 | | | 1,375 | |
| Less amounts representing interest | Less amounts representing interest | | (397) | | | (81) | |
| Present value of lease obligations | Present value of lease obligations | | $ | 4,552 | | | $ | 1,294 | |
Lessor
InPrior to the sale of our Healthcare division, we generategenerated lease income in the Diagnostic ServicesHealthcare segment from equipment rentals to customers. Rental contracts arewere structured as either a weekly or monthly payment arrangement and arewere accounted for as operating leases. Revenues arewere recognized on a straight-line basis over the term of the rental. As ofDuring the twelve months ended December 31, 20212023 and 2020,2022, our lease contracts arewere mainly month to monthmonth-to-month contracts.
Note 11. Share-Based Compensation
At December 31, 2021,2023, we have 2had two active equity incentive plans, the 2011 Inducement Stock Incentive Plan (the “2011 Plan”), and the 2018 Incentive Plan (the “2018 Plan” and together with the 2011 Plan, the “Plans”), under which stock options, restricted stock units, and other stock-based awards may be granted to employees and non-employees, including members of our Boardboard of Directors.directors. The terms of any equity instruments granted under the Plans are approved by the Boardour board of Directors.directors. Stock options typically vest over the requisite service period of one to four years and have a contractual term of seven to ten years. Restricted stock units generally vest over one to three years. Under the Plans, we are authorized to issue an aggregate of 485,0001,450,000 shares of common stock. As of December 31, 2021,2023, the Plans had 109,799500,256 shares available for future issuance. The number of shares reserved for issuance under the 2018 Plan is subject to increase by (i) the number of shares of common stock
that remained available for grant under the 2014 Equity Incentive Award Plan (the “2014 Plan”) as of the effective date of the 2018 Plan, plus (ii) any shares of common stock under the 2014 Plan that are forfeited, expire, or are canceled. As of December 31, 2021,2023, the number of shares provided for issuance under the 2018 Plan due to unissued, forfeited, expired, and canceled shares under the 2014 Plan was 59,62065,658 shares.
Stock Options
The estimated fair value of our stock options is determined using the Black-Scholes model. All stock options were granted with an exercise price equal to the fair value of the common stock on the grant date. There were no employee stock options granted during the years ended December 31, 20212023 and 2020.2022.
A summary of our stock option award activity as of and for the year ended December 31, 20212023 is as follows (in thousands, except per share data):
| | | | | | | | | | | | | | | | | | | | | | | | | | |
| | Number of
Shares | | Weighted-
Average
Exercise
Price per
Share | | Weighted-
Average
Remaining
Contractual
Term (In Years) | | Aggregate Intrinsic Value |
| Options outstanding at December 31, 2020 | | 35 | | | $ | 36.83 | | | | | |
| | | | | | | | |
| | | | | | | | |
| Options expired | | (29) | | | $ | 33.88 | | | | | |
| | | | | | | | |
| Options outstanding at December 31, 2021 | | 6 | | | $ | 51.20 | | | 4.09 | | $ | — | |
| Options exercisable at December 31, 2021 | | 6 | | | $ | 51.20 | | | 4.09 | | $ | — | |
| | | | | | | | | | | | | | | | | | | | | | | | | | |
| | Number of
Shares | | Weighted-Average Exercise Price per Share | | Weighted-Average
Remaining Contractual Term (In Years) | | Aggregate Intrinsic Value |
| Options outstanding at December 31, 2022 | | 2 | | | $ | 51.20 | | | | | |
| Options granted | | — | | | — | | | | | |
| Options forfeited | | — | | | — | | | | | |
| Options expired | | — | | | $ | 51.20 | | | | | |
| Options exercised | | — | | | — | | | | | |
| Options outstanding at December 31, 2023 | | 2 | | | $ | 51.20 | | | 0.01 | | $ | — | |
| Options exercisable at December 31, 2023 | | 2 | | | $ | 51.20 | | | 0.01 | | $ | — | |
At December 31, 2021,2023, there is no unrecognized compensation cost related to unvested stock options.
Upon exercise, we issue new shares of common stock. There were no stock option exercises during the years ended December 31, 20212023 and 2020,2022, respectively.
Under the guidance for share-based payments, the fair value of our restricted stock units is based on the grant date fair value of our common stock. All restricted stock units were granted with no purchase price. Vesting of the restricted stock units is subject to service conditions, as well as the attainment of additional performance objectives for certain of the awards. The weighted-average grant date fair value of the restricted stock units was $2.85$0.93 per share during the year ended December 31, 2021.2023.
A summary of our restricted stock unit activity as of and for the year ended December 31, 20212023 is as follows (in thousands, except per share data):
| | Number of
Shares | | Weighted-Average
Grant Date Fair
Value Per Share |
| Non-vested restricted stock units outstanding at December 31, 2020 | | 34 | | | $ | 12.39 | |
| Adjusted non-vested restricted stock units | | 76 | | | $ | 2.71 | |
| | Number of
Shares | | | | Number of
Shares | | Weighted-Average
Grant Date Fair
Value Per Share |
| Non-vested restricted stock units outstanding at December 31, 2022 | |
| Granted | Granted | | 259 | | | $ | 2.85 | |
| Forfeited | Forfeited | | — | | | $ | 20.50 | |
| Vested | Vested | | (107) | | | $ | 5.28 | |
| Non-vested restricted stock units outstanding at December 31, 2021 | | 262 | | | $ | 3.01 | |
| Non-vested restricted stock units outstanding at December 31, 2023 | |
The following table summarizes information about restricted stock units that vested during the years ended December 31, 20212023 and 20202022 based on service conditions (in thousands):
| | | | | | | | | | | | | | |
| | | Year Ended December 31, |
| | | 2021 | | 2020 |
| Fair value on vesting date of vested restricted stock units | | $ | 313 | | | $ | 159 | |
| | | | | | | | | | | | | | |
| | | Year Ended December 31, |
| | | 2023 | | 2022 |
| Fair value on vesting date of vested restricted stock units | | $ | 295 | | | $ | 182 | |
At December 31, 2021,2023, total unrecognized compensation cost related to non-vested restricted stock units was $0.5$0.3 million, which is expected to be recognized over a weighted-average period of 1.81.9 years.
Allocation of Share-Based Compensation Expense
Total share-based compensation expense related to all of our share-based units for the years ended December 31, 20212023 and 20202022 was allocated as follows (in thousands):
| | | | | | | | | | | | | | |
| | | Year Ended December 31, |
| | 2021 | | 2020 |
| Cost of revenues | | $ | 11 | | | $ | 27 | |
| Selling, general and administrative | | 514 | | | 483 | |
| Total share-based compensation expense | | $ | 525 | | | $ | 510 | |
Share-based compensation expense for the years ended December 31, 2021 and 2020 was $0.5 million and $0.5 million, respectively. | | | | | | | | | | | | | | |
| | | Year Ended December 31, |
| | 2023 | | 2022 |
| Cost of revenues | | $ | — | | | $ | 1 | |
| Selling, general and administrative | | 340 | | | 437 | |
| Total share-based compensation expense | | $ | 340 | | | $ | 438 | |
Note 12. Income Taxes
Significant components of the provision for income taxes from continuing operations for the years ended December 31, 20212023 and 20202022 are as follows (in thousands):
| | Year Ended December 31, |
| 2021 | | 2020 |
| | Year Ended December 31, | | | | Year Ended December 31, |
| | 2023 | | | | 2023 | | 2022 |
| Current provision: | Current provision: | | | | |
| Federal | |
| Federal | |
| Federal | Federal | | $ | 4 | | | $ | — | |
| State | State | | 20 | | | 89 | |
| | Total current provision | Total current provision | | 24 | | | 89 | |
| Total current provision | |
| Total current provision | |
| Deferred provision: | Deferred provision: | |
| Federal | |
| Federal | |
| Federal | Federal | | 6 | | | 21 | |
| State | State | | 30 | | | 19 | |
| | Total deferred provision | | 36 | | | 40 | |
| Total income tax provision | | $ | 60 | | | $ | 129 | |
| Total deferred (benefit) provision | |
| Total deferred (benefit) provision | |
| Total deferred (benefit) provision | |
| Total income tax (benefit) provision | |
Intraperiod allocation rules require us to allocate our provision for income taxes between continuing operations and other categories orof comprehensive income (loss) such as discontinued operations. As described in Note 3. DiscontinuedOperations, the results of our Mobile Healthcare reportable segment have been reported as discontinued operations for the current and prior year.2022. As a result of the intraperiod allocation rules, for the years ended December 31, 20212023 and 2020,2022, the Company recorded a tax expense of $79$693 thousand and a tax benefit of $22$209 thousand, respectively, for discontinued operations.
Differences between the provision for income taxes and income taxes at the statutory federal income tax rate for continuing operations are for the years ended December 31, 20212023 and 20202022 as follows:
| | | | | | | | | | | | | | |
| | | Year Ended December 31, |
| | | 2021 | | 2020 |
| Income tax expense at statutory federal rate | | 21.0 | % | | 21.0 | % |
| State income tax expense, net of federal benefit | | (0.7) | % | | 0.4 | % |
| Permanent differences and other | | 5.6 | % | | (11.7) | % |
| PPP Loan Forgiveness | | 10.5 | % | | 12.8 | % |
| | | | |
| | | | |
| | | | |
| Revaluation of deferred taxes due to change in effective state tax rates | | 2.4 | % | | (1.1) | % |
| Expiration of net operating loss and tax credit carryovers | | (40.6) | % | | (47.4) | % |
| Stock compensation | | (0.9) | % | | (1.3) | % |
| Reserve for uncertain tax positions and other reserves | | 2.6 | % | | 4.0 | % |
| Change in valuation allowance | | (0.6) | % | | 20.1 | % |
| | | | |
| Provision for income taxes | | (0.7) | % | | (3.2) | % |
| | | | | | | | | | | | | | |
| | | Year Ended December 31, |
| | | 2023 | | 2022 |
| Income tax expense at statutory federal rate | | 21.0 | % | | 21.0 | % |
| State income tax expense, net of federal benefit | | 7.3 | % | | 6.5 | % |
| Permanent differences and other | | 0.6 | % | | 0.6 | % |
| | | | |
| | | | |
| | | | |
| Revaluation of deferred taxes due to change in effective state tax rates | | (10.2) | % | | 11.3 | % |
| Expiration of net operating loss and tax credit carryovers | | — | % | | (5.6) | % |
| | | | |
| | | | |
| Change in valuation allowance | | 6.2 | % | | (40.7) | % |
| | | | |
| Provision for income taxes | | 24.9 | % | | (6.9) | % |
Our net deferred tax assets (liabilities) as of December 31, 20212023 and 20202022 consisted of the following (in thousands):
| | | | | December 31, | | | December 31, |
| | | | 2021 | | 2020 | | | 2023 | | 2022 |
| Deferred tax assets: | Deferred tax assets: | | | | |
| Net operating loss carryforwards | |
| Net operating loss carryforwards | |
| Net operating loss carryforwards | Net operating loss carryforwards | | $ | 19,651 | | | $ | 22,614 | |
| Research and development and other credits | Research and development and other credits | | 72 | | | 72 | |
| Reserves | Reserves | | 477 | | | 363 | |
| Operating lease liabilities | Operating lease liabilities | | 2,068 | | | 2,619 | |
| Interest carryover | Interest carryover | | 22 | | | 14 | |
| Other, net | Other, net | | 785 | | | 1,183 | |
| Total deferred tax assets | Total deferred tax assets | | 23,075 | | | 26,865 | |
| Deferred tax liabilities: | Deferred tax liabilities: | |
| Fixed assets and other | Fixed assets and other | | (316) | | | (1,342) | |
| Fixed assets and other | |
| Fixed assets and other | |
| Right of use assets | Right of use assets | | (1,974) | | | (2,534) | |
| Intangibles | Intangibles | | (2,850) | | | (4,128) | |
| Total deferred tax liabilities | Total deferred tax liabilities | | (5,140) | | | (8,004) | |
| Valuation allowance for deferred tax assets | Valuation allowance for deferred tax assets | | (18,007) | | | (18,912) | |
| Net deferred tax liabilities | Net deferred tax liabilities | | $ | (72) | | | $ | (51) | |
The Company recognizes federal and state deferred tax assets or liabilities based on the Company’s estimate of future tax effects attributable to temporary differences and carryovers. The Company records a valuation allowance to reduce any deferred tax assets by the amount of any tax benefits that, based on available evidence and judgment, are not expected to be realized. In assessing the realizability of deferred tax assets, the Company considers whether it is more likely than not that some portion or all of the deferred tax assets will be realized. The ultimate realization of deferred tax assets is dependent upon the generation of future taxable income during periods in which those temporary differences become deductible. The Company considers projected future taxable income and planning strategies in making this assessment. As of December 31, 2021,2023, as a result of a three-year cumulative loss in continuing operations and recent events, we concluded that a full valuation allowance was necessary to offset substantially all of our deferred tax assets. We intend to maintain a valuation allowance until sufficient positive evidence exists to support its reversal. The Company’s valuation allowance balance at December 31, 20212023 is $18.0$8.3 million, offsetting the Company’s deferred tax assets. The valuation allowance decreased by $7.6 million and increased by $2.2 million for the years ended December 31, 2023 and 2022, respectively. The Company will continue to evaluate its deferred tax balances to determine any assets that are more likely than not to be realized.
As of December 31, 2021,2023, we had federal and state income tax net operating loss carryforwards after estimated section 382 limitations of $79.1$43.2 million and $50.4$20.9 million, respectively. Pre-2018Federal and certain state net operating losses of $5.3 million and $1.3 million, respectively, generated after 2017 carry forward without expiration. The remaining federal and state loss carryforwards began towill expire in 20212024 through 2042 unless previously utilized. Federal and state loss carryforwards of approximately $15.6 million and $1.3$1.5 million expired in 2021, and approximately $16.0 million of federal net operating losses and $2.6 million of state net operating losses are set to expire in 2022, unless previously utilized. We also have federal and California research and other credit carryforwards of approximately $0.4 million and $2.1 million, respectively, as of December 31, 2021. The federal credits began to expire in 2021. The California research credits have no expiration.2022. Pursuant to Internal Revenue Code (“Code”) Sections 382 and 383, use of our net operating loss and credit carryforwards may be limited because of a cumulative change in ownership greater than 50%. As of December 31, 2021,The Company experienced an ownership change under Code Section 382 in January 2022 which will restrict the Company has not experienced a change in ownership greater than 50%; however, some of the tax attributes acquired with the DMS Health businesses are subjectCompany’s ability to such limitations due to ownership changes of greater than 50% that may have occurred or which may occur in the future. A valuation allowance has been recognized to offset the deferred tax assets, as realization of such assets has not met the “more likely than not” threshold required under the authoritative guidance of accounting for income taxes.fully utilize its net operating losses. In addition, the net operating losses acquired in the ATRM acquisitionAcquisition (as defined below) are also limited under Internal Revenue Code Section 382.
The Company analyzed these limitations when scheduling the reversal of deferred tax assets and liabilities in arriving at the necessary valuation allowance as of December 31, 2023. Future ownership changes may occur which could further limit our ability to utilize tax attributes.The following table summarizes the activity related to our unrecognized tax benefits for the years ended December 31, 20212023 and 20202022 (in thousands):
| | | | | December 31, | | | December 31, |
| | | | 2021 | | 2020 | | | 2023 | | 2022 |
| Balance at beginning of year | Balance at beginning of year | | $ | 2,778 | | | $ | 2,941 | |
| Expiration of the statute of limitations for the assessment of taxes | Expiration of the statute of limitations for the assessment of taxes | | (217) | | | (163) | |
| Write-off of tax attributes in states in which the Company no longer files | |
| Balance at end of year | Balance at end of year | | $ | 2,561 | | | $ | 2,778 | |
Included in the unrecognized tax benefits of $2.6$0.3 million at December 31, 20212023 was $2.1$0.3 million of tax benefits that, if recognized, would reduce our annual effective tax rate, subject to the valuation allowance. The Company does not expect our unrecognized tax benefits to change significantly over the next 12 months.
We file income tax returns in the U.S. and in various state jurisdictions with varying statutes of limitations. We are no longer subject to income tax examination by tax authorities for years prior to 2017;2019; however, our net operating loss carryforwards and research credit carryforwards arising prior to that year are subject to adjustment. Our policy is to recognize interest expense and penalties related to income tax matters as a component of income tax expense. The accrued interest as of December 31, 20212023 and 2020,2022, and interest and penalties recognized during the years ended December 31, 20212023 and 20202022 were of insignificant amounts.
Note 13. Employee Retirement Plan
Employees have a 401(k) retirement plan under which employees may contribute up to 100% of their annual salary, within IRS limits. Our contributions to the retirement plans totaled $0.2$0.1 million and $0.2$0.1 million for the years ended December 31, 20212023 and 2020,2022, respectively.
Note 14. Related Party Transactions
Eberwein Guarantees
SNB
On March 29, 2019, in connection with the Company’s entry into the SNB Loan Agreement, Mr. Eberwein, the Executive Chairman, entered into the Limited Guaranty Agreement (the “SNB Eberwein Guaranty”) with SNB pursuant to which he guaranteed to SNB the prompt performance of all the SNB Borrowers’ obligations to SNB under the SNB Loan Agreement, including the full payment of all indebtedness owing by Borrowers to SNB. Mr. Eberwein’s obligations under the SNB Eberwein Guaranty are limited in the aggregate to the amount of (a) $1.5 million, plus (b) reasonable costs and expenses of SNB incurred in connection with the SNB Eberwein Guaranty. Mr. Eberwein’s obligations under the SNB Eberwein Guaranty terminate upon the Company and Borrowers achieving certain milestones set forth in the SNB Loan Agreement.
Gerber
On March 5, 2020, contemporaneously with the execution and delivery of the First EBGL Amendment, Mr. Eberwein, executed and delivered the EBGL Eberwein Guaranty to Gerber pursuant to which he guaranteed the performance of all the EBGL Borrowers’ obligations to Gerber under the EBGL Loan Agreement, including the full payment of all indebtedness owing by the EBGL Borrowers to Gerber in connection with the EBGL Loan Agreement and related financing documents. Mr. Eberwein’s obligations under the EBGL Eberwein Guaranty were limited in the aggregate to the amount of (a) $0.5 million, plus (b) costs of Gerber incidental to the enforcement of the EBGL Eberwein Guaranty or any guaranteed obligations. On February 26, 2021, the Third EBGL Amendment discharged the EBGL Eberwein Guaranty and removed Mr. Eberwein as an ancillary guarantor from the EBGL Loan Agreement.
Premier
As a condition to the Premier Loan Agreement, Mr. Eberwein entered into a guaranty in favor of Premier, absolutely and unconditionally guaranteeing all of the borrowers’ obligations thereunder. As of May 26, 2021, all obligation under the Premier Loan Agreement have been repaid in full and no amount remains outstanding and Premier discharged Mr. Eberwein’s guaranty.
Star Equity Holding,Holdings, Inc.
Jeffrey E. Eberwein, the Executive Chairman, was also the Chief Executive Officer of LSVM prior to its dissolution. LSVM was the investment manager of LSVI, now dissolved, and Lone Star Value Co-Invest I, LP (“LSV Co-Invest I”). Mr. Eberwein was also the sole manager of Lone Star Value Investors GP, LLC (“LSV GP”), the general partner of LSVI and LSV Co-Invest I, and the sole owner of LSV Co-Invest I, and over 25% owner of LSVI. LSVM was a wholly owned subsidiary of Star Equity and was dissolved as of December 31, 2021.
As of December 31, 2021, Mr.2023, our Executive Chairman, Jeffrey E. Eberwein, owned approximately 14.6% of the outstanding Star Equity common stock and 1,289,9784,062,485 shares of preferred stock.
On July 10, 2020, Star Equity authorized LSVI to initiate a pro-rata distribution to its partners of an aggregate of 300,000 shares of Company PreferredCommon Stock, at $10 per share, which was finalized by the Company's transfer agent on July 22, 2020 (the "Distribution").
Private Placement
On December 10, 2021, the Company entered into a securities purchase agreement with its Executive Chairman, Jeffery E. Eberwein, relating to the issuance and sale of 650,000 sharesrepresenting approximately 25.67% of our common stock at a purchase price of $3.25 per share pursuant to a private placement.
Put Option Agreement
outstanding Common Stock. In addition, prior to the effective time of the ATRM acquisition, the Company entered into a put option purchase agreement with Mr. Eberwein, pursuant to which the Company has the right to require Mr. Eberwein to acquire up to 100,000 shares of Company Preferred Stock at a price of $10.00 per share for aggregate proceeds of up to $1.0 million at any time, in the Company’s discretion, during the 12 months following the effective time of the ATRM acquisition (the “Issuance Option”). In March 2020, Mr. Eberwein extended the Issuance Option through June 30, 2021. As of December 31, 2021, these put options expired un-exercised.
ATRM Notes Payable
ATRM had the following related party promissory notes (the “ATRM Notes”) outstanding as of December 31, 2020, which were repaid in full during April 2021 using proceeds from the DMS Sale Transaction:
(i) Unsecured promissory note (principal amount2023, Mr. Eberwein owned 1,182,414 shares of $0.7 million payable to LSV Co-Invest I), with interest payable semi-annually at a rate of 10.0% per annum (LSV Co-Invest I may elect to receive interest in-kind at a rate of 12.0% per annum), with any unpaid principal and interest previously due on January 12, 2020 (the “January Note”), subsequently extended to June 30, 2022.
(ii) Unsecured promissory note (principal amount of $1.2 million payable to LSV Co-Invest I), with interest payable semi-annually at a rate of 10.0% per annum (LSV Co-Invest I may elect to receive interest in-kind at a rate of 12.0% per annum), with any unpaid principal and interest previously due on June 1, 2020 (the “June Note”), subsequently extended to June 30, 2022.
(iii) Unsecured promissory note (principal amount of $0.4 million payable to LSVM), with interest payable annually at a rate of 10.0% per annum (LSVM may elect to receive any interest payment entirely in-kind at a rate of 12.0% per annum), with any unpaid principal and interest previously due on November 30, 2020 (the “LSVM Note”), subsequently extended to June 30, 2022.Series A Preferred Stock.
Note 15. Segments
Our three business divisionsreportable segments are based upon our internal organizational structure; the manner in which our operations are managed; the criteria used by our Chief Executive Officer, who is our CODM, to evaluate segment performance; the availability of separate financial information; and overall materiality considerations. Under the prior period Holdco strategy, we organized our reportable segments into the following 4three reportable segments: Healthcare, Construction and Investments. Effective with the sale of our Healthcare business on May 4, 2023, we reorganized our segments into two reportable segments to reflect the manner in which our CODM assesses performance and allocates resources:
1.Diagnostic ServicesConstruction
2.Diagnostic Imaging
3.Construction
4.Investments
Diagnostic Services. Through Diagnostic Services, we offer a convenient and economically efficient imaging services program as an alternative to purchasing equipment or outsourcing the procedures to another physician or imaging center. For physicians who wish to perform nuclear imaging, echocardiography, vascular or general ultrasound tests, we provide imaging systems, qualified personnel, radiopharmaceuticals, licensing services, and the logistics required to perform imaging in their own offices, and thereby the ability to bill Medicare, Medicaid, or one of the third-party healthcare insurers directly for those services, which are primarily cardiac in nature. We provide imaging services primarily to cardiologists, internal medicine
physicians, and family practice doctors who typically enter annual contracts for a set number of days ranging from once per month to five times per week.
Diagnostic Imaging. Through Diagnostic Imaging, we sell our internally developed solid-state gamma cameras, imaging systems and camera maintenance contracts. Our imaging systems include nuclear cardiac imaging systems, as well as general purpose nuclear imaging systems. We sell our imaging systems to physician offices and hospitals primarily in the United States, although we have sold a small number of imaging systems internationally.
Construction. Through KBS, Glenbrook and EdgeBuilder, we service residential and commercial construction projects by manufacturing modular housing units, structural wall panels, permanent wood foundation systems, other engineered wood products, and supply general contractors with building materials. KBS is a Maine-based manufacturer that started business in 2001 as a manufacturer of modular homes. KBS offers products for both commercial and residential buildings with a focus on customization to suit the project requirements and provide engineering and design expertise. Glenbrook is a retail supplier of lumber, windows, doors, cabinets, drywall, roofing, decking and other building materials and conducts its operations in Oakdale, Minnesota. EdgeBuilder is a manufacturer of structural wall panels, permanent wood foundation systems and other engineered wood products and conducts its operations in Prescott, Wisconsin.
Investments. Through this segment, we hold significantOur Investments division is an internally-funded unit. This unit holds our corporate-owned real estate, assetswhich currently includes our two manufacturing facilities in Maine that we acquirelease back to KBS and our manufacturing facility in Minnesota that we lease back to Glenbrook. In addition, it holds several minority equity investments in other small public companies. It also manageholds and manages a $7 million promissory note and a $6 million private equity stake in TTG Parent, the Company’s minority investments.parent entity of TTG. We expectacquired these positions as a result of the Investments segment to assistsale of Digirad Health (discussed in making strategic investments, some of which may produce potential acquisition targets for us.Note 3. DiscontinuedOperations).
Our reporting segments have been determined based on the nature of the products and services offered to customers or the nature of their function in the organization. We evaluate performance based on the gross profit and operating income (loss) excluding goodwill impairment.. Our operating costs included in our shared service functions primarily consist of senior executive officers, finance, human resources, legal, and information technology. Star Equity shared service corporate costs have been separated from the reportable segments and healthcare corporate costs have been allocated within Diagnostic Services and Diagnostic Imaging.segments. Prior period presentation previously disclosed conforms to current year presentation.
Segment information for the years ended December 31, 20212023 and 20202022 is as follows (in thousands):
| | | | | | | | | | | | | | |
| | Year ended December 31, |
| | 2021 | | 2020 |
| Revenue by segment: | | | | |
| Diagnostic Services | | $ | 43,765 | | | $ | 39,267 | |
| Diagnostic Imaging | | 14,791 | | | 9,965 | |
| Construction | | 48,003 | | | 28,879 | |
| Investments | | — | | | 52 | |
| | | | |
| Consolidated revenue | | $ | 106,559 | | | $ | 78,163 | |
| Gross profit (loss) by segment: | | | | |
| Diagnostic Services | | $ | 7,364 | | | $ | 6,758 | |
| Diagnostic Imaging | | 5,095 | | | 3,391 | |
| Construction | | 3,008 | | | 4,047 | |
| Investments | | (227) | | | (209) | |
| | | | |
| Consolidated gross profit | | $ | 15,240 | | | $ | 13,987 | |
| Income (loss) from operations by segment: | | | | |
| Diagnostic Services | | $ | 1,673 | | | $ | (919) | |
| Diagnostic Imaging | | 252 | | | (820) | |
| Construction | | (4,322) | | | (2,981) | |
| Investments | | (255) | | | (363) | |
| | | | |
Star equity corporate and other expenses (2) | | (5,584) | | | (1,689) | |
| Segment loss from operations | | (8,236) | | | (6,772) | |
Goodwill impairment (1) | | (3,359) | | | (436) | |
| | | | |
| | | | |
| Consolidated loss from operations | | $ | (11,595) | | | $ | (7,208) | |
| | | | |
| Depreciation and amortization by segment: | | | | |
| Diagnostic Services | | $ | 1,103 | | | $ | 1,222 | |
| Diagnostic Imaging | | 212 | | | 260 | |
| Construction | | 1,931 | | | 2,172 | |
| Investments | | 226 | | | 282 | |
| Total depreciation and amortization | | $ | 3,472 | | | $ | 3,936 | |
(1) Reflects impairment of goodwill related to the Construction division.
(2) Prior year unallocated corporate expenses and other expenses of $9.5 million were reclassified to reflect the current year allocation methodology. | | | | | | | | | | | | | | |
| | Year ended December 31, |
| | 2023 | | 2022 |
| Revenue by segment: | | | | |
| | | | |
| Construction | | $ | 45,785 | | | $ | 57,149 | |
| Investments | | 564 | | | 633 | |
| Intersegment elimination | | (564) | | | (633) | |
| Consolidated revenue | | $ | 45,785 | | | $ | 57,149 | |
| Gross profit (loss) by segment: | | | | |
| | | | |
| Construction | | 12,154 | | | 12,660 | |
| Investments | | 336 | | | 343 | |
| Intersegment elimination | | (564) | | | (633) | |
| Consolidated gross profit | | $ | 11,926 | | | $ | 12,370 | |
| Income (loss) from operations by segment: | | | | |
| | | | |
| Construction | | 2,095 | | | 3,560 | |
| Investments | | (453) | | | 192 | |
| Corporate, eliminations and other | | (5,988) | | | (7,296) | |
| Segment income (loss) from operations | | (4,346) | | | (3,544) | |
| | | | |
| | | | |
| | | | |
| Consolidated income (loss) from operations | | $ | (4,346) | | | $ | (3,544) | |
| | | | |
| Depreciation and amortization by segment: | | | | |
| | | | |
| Construction | | 2,070 | | | 1,974 | |
| Investments | | 228 | | | 290 | |
| Star equity corporate | | 29 | | | 9 | |
| Total depreciation and amortization | | $ | 2,327 | | | $ | 2,273 | |
Geographic Information. InformationThe Company’s. Our sales to customers located outside the United States for the years ended December 31, 2021 and 2020 was $0.2 million and $0.3 million, respectively. Ourour long-lived assets are attributed to geographic region based on asset location, which are all located within the United States.
Note 16. Variable Interest Entity
VIE in which we are not the Primary Beneficiary
We have an investment in a VIE of $0.3 million, recorded in Other Assets, in which we are not the primary beneficiary. This VIE is a small private company that is primarily involved in research related to new heart imaging technologies.
We have determined that the governance structures of this entity does not allow us to direct the activities that would significantly affect their economic performance. Therefore, we are not the primary beneficiary, and the results of operations and financial position of the VIE are not included in our consolidated financial statements. We account for this investment as non-marketable equity securities which is valued at cost less impairment.
The potential maximum exposure of this unconsolidated VIE is generally based on the current carrying value of the investments and any future funding commitments based on the milestone agreement and board approval. We have determined
thatNote 16. Mergers and Acquisitions
On October 31, 2023, we acquired, through certain wholly owned subsidiaries, the single sourceassets and liabilities of our exposureBLL for consideration consisting of cash of $2.8 million and an earn-out provision of up to the VIE is our capital investment in them. The carrying value, and maximum exposure$0.5 million. As a result of this transaction, EBGL expanded its market share of the unconsolidated VIEGreater Minneapolis area. BLL’s operations were $0.3integrated into and became part of Glenbrook’s operations. The earn-out provision, which is accounted for as a contingent liability, is based on a specific gross profit threshold with a measurement period of two years to begin one year after the closing date of the acquisition and can potentially amount to up to $250,000 for each of the two years, subject to certain limitations. The estimated fair value of the earn-out, which is determined using estimates of forecasted operations and other assumptions, was $0.2 million as of the acquisition date. No change to the fair value of the earn-out was recorded through December 31, 2021.2023.
In accordance with ASC 805, we accounted for this transaction as a business combination and recorded the assets and liabilities of BLL at fair value. The fair value of the net assets acquired amounted to approximately $4.1 million at the date of acquisition, and as a result, we recorded a gain of $1.2 million on our Consolidated Statement of Operations related to the excess of the fair value of the net assets acquired over the acquisition price. This excess is referred to as a “bargain purchase.” This bargain purchase indicates that the fair value of the net assets acquired (which represents the price that the assets would be exchanged between a willing buyer and seller) was in excess of the amount for which we acquired such net assets. As a result of the bargain purchase, we reassessed the recognition and measurement of net identifiable assets acquired and determined the valuation procedures applied and resulting measurements of the net identifiable assets were appropriate. We believe the seller was motivated to complete the sale as part of its overall business strategy of exiting the market segment. The revenue and earnings of BLL from November 1, 2023 through December 31, 2023 totaled $1.4 million and $0.4 million, respectively.
The following table sets forth the purchase price allocation of BLL to the estimated fair value of assets acquired as of the acquisition date (in thousands):
| | | | | | | | |
| | As of Acquisition date |
| Purchase Price | | |
| Cash Paid to Sellers | | $ | 2,770 | |
| Fair Value of Earn-out Provision | | 169 | |
| Total consideration | | 2,939 | |
| | |
| Purchase Price allocation | | |
| Inventories, net | | 438 | |
| Accounts receivable | | 578 | |
| Property and equipment | | 2,654 | |
| Intangible assets, | | 900 | |
| Deferred tax liability | | (461) | |
| Fair value allocated to net assets acquired | | 4,109 | |
| Bargain purchase gain | | $ | (1,170) | |
The following unaudited pro forma combined financial information presents our results as if the BLL acquisition had occurred at the beginning of fiscal 2022 (in thousands):
| | | | | | | | | | | | | | |
| | | December 31, |
| | 2023 | | 2022 |
| | (unaudited) |
| Revenue | | $ | 54,485 | | | $ | 69,149 | |
| Gross Profit | | $ | 13,709 | | | $ | 14,906 | |
| Net income (loss) | | $ | 25,732 | | | $ | (3,926) | |
Note 17. Perpetual Preferred Stock
Holders of shares of Company Preferred Stock are entitled to receive, when, as and if, authorized by the Company’s board of directors (or a duly authorized committee of the Company’s board of directors) and declared by the Company out of funds legally available for the payment of dividends, preferential cumulative cash dividends at the rate of 10.0% per annum of the liquidation preference of $10.00 per share. Dividends are payable quarterly, in arrears, on the last calendar day of March, June, September and December to holders of record at the close of business on the first day of each payment month. Series A Preferred Stock is not convertible and does not have any voting rights, except when dividends are in arrears for six or more consecutive quarters, then the holders of those shares together with holders of all other series of preferred stock equal in rank will be entitled to vote separately as a class for the election of two additional directors to board of directors, until all dividends accumulated on such shares of Series A Preferred Stock for the past dividend periods and the dividend for the current dividend period shall have been fully paid or declared and a sum sufficient for the payment thereof set apart for payment. Under change of control or other conditions, Series A Preferred Stock may be subject to redemption. The Company may redeem the Series A Preferred Stock upon the occurrence of a change of control, subject to certain conditions. The Company may also voluntarily redeem some or all of the Series A Preferred Stock on or after September 10, 2024.
On February 17, 2023, May 26, 202119, 2023, August 17, 2023 and August 16, 2021,November 17, 2023 our board of directors declared a cash dividenddividends to holders of the 10%our Series A Cumulative Perpetual Preferred Stock of $0.25 per share, for an aggregate amount of approximately $0.48 million, respectively.$1.9 million. The record dates for these dividends were March 1, 2023, June 1, 2021 and2023, September 1, 2021,2023 and December 1, 2023, respectively, and the payment dates were March 10, 2023, June 10, 2023, September 11, 20212023 and September 13, 2021,December 11, 2023, respectively. Additionally, on November 22, 2021,As of December 31, 2023, we have no preferred dividends in arrears.
On February 16, 2024, our board of directors declared a cash dividend to holders of the Company’s 10%our Series A Preferred Stock of $1.556 per share, which represents all accumulated and unpaid dividends on the preferred shares for an aggregate amount of $3.5 million. The record date for this dividend was December 1, 2021, and the payment date was December 10, 2021. As of December 31, 2021, we have no preferred dividends in arrears.
On February 25, 2022, our board of directors declared a cash dividend to holders of the Company’s 10% Series A Cumulative Perpetual Preferred Stock of $0.25 per share for an aggregate amount of approximately $0.5 million. The record date for this dividend was March 1, 2022,2024, and the payment date was March 10, 2022.11, 2024.
A roll forward of the balance of Company Preferred Stock for the year ended December 31, 20212023 is as follows (in thousands):
| | | | | |
Balance at December 31, 20202022 | $ | 21,50018,988 | |
Deemed dividendDividend on Series A Preferred Stock | 1,916 | | 1,906 |
| Cash Dividend paid on Preferred Stock | (4,418)(1,916) | |
Balance at December 31, 20212023 | $ | 18,988 | |
Note 18. Equity Transactions
On January 24, 2022, we closed a public offering (the “2022 Public Offering”) pursuant to an underwriting agreement with Maxim Group LLC (“Maxim”), as representative of the underwriters. Through the 2022 Public Offering, we issued and sold (A)(i) 9,175,000 shares of the Company’s Common Stock, (ii) an aggregate of 325,000 pre-funded warrants to purchase up to an aggregate of 325,000 shares of Common Stock, and (iii) an aggregate of 9,500,000 common stock purchase warrants (the “Firm Purchase Warrants”) to purchase up to 9,500,000 shares of Common Stock and (B) at the election of Maxim, (i) up to an additional 1,425,000 shares of Common Stock and/or (ii) up to an additional 1,425,000 shares of common stock purchase warrants (the “Option Purchase Warrants”, and together with the Firm Purchase Warrants, the “Warrants”). Maxim partially exercised its over-allotment option for the purchase of 1,425,000 Warrants for a price of $0.01 per Warrant. Each share of common stock (or pre-funded warrant in lieu thereof) was sold together with one common warrant to purchase one share of common stock at a price of $1.50 per share and common warrant. Gross proceeds, before deducting underwriting discounts and offering expenses and excluding any proceeds we may receive upon exercise of the Warrants, were $14.3 million and net proceeds were $12.7 million.
In addition, as part of the 2022 Public Offering, the Company issued to Maxim 237,500 common stock purchase warrants (the “Underwriter’s Warrants”) to purchase up to 237,500 shares of Common Stock at an exercise price of $1.65 per common warrant. The Underwriter’s Warrants have an initial exercise date beginning July 19, 2022, and no exercises have occurred as of December 31, 2023.
As of December 31, 2023, of the warrants issued through the public offering we closed on May 28, 2020 (the “2020 Public Offering”), 1.0 millionwarrants were exercised and 1.4 million warrants remained outstanding, which represents 0.7 million shares of common stock equivalents, at an exercise price of $2.25. As of December 31, 2023, of the Warrants issued through the 2022 Public Offering, 0.3 million prefunded warrants were exercised and 10.9 million warrants remained outstanding at an exercise price of $1.50. The Underwriter’s Warrants have not been exercised.
Note 18.19. Preferred Stock Rights
On June 2, 2021, ourthe board of directors adopted a tax benefit preservation plan in the form of an Internal Revenue Codea Section 382 Rights Agreement (the “382 Agreement”). The 382 Agreement is intended to diminish the risk that our ability to use our net operating loss carryforwards to reduce future federal income tax obligations may become substantially limited due to an “ownership change,” as defined in Section 382 of the Internal Revenue Code of 1986, as amended (the “Code”). OurCode. The board of directors authorized and declared a dividend distribution of one right for each outstanding share of common stock, par value $0.0001 per share, to stockholders of record as of the close of business on June 14, 2021. Each right entitles the registered holder to purchase from the one one-thousandth of a share of Series C Participating Preferred Stock, par value $0.0001 per share (the “Series C Preferred Stock”), at an exercise price of $12.00 per one one-thousandth of a share of Series C Preferred Share,Stock, subject to adjustment.
The rights will become exercisable following (i) 10 days after a public announcement that a person or group has become an Acquiring Person;Person (as defined in the 382 Agreement); and (ii) 10 business days (or a later date determined by the board of directors) after a person or group begins a tender or an exchange offer that, if completed, would result in that person or group becoming an Acquiring Person.
In addition, upon the occurrence of certain events, the exercise price of the rights would be adjusted and holders of the rights (other than rights owned by an acquiring person or group) would be entitled to purchase common stock at approximately half of market value. Given the potential adjustment of the exercise price of the rights, the rights could cause substantial dilution to a person or group that acquires 4.99% or more of common stock on terms not approved by the board of directors.
No rights were exercisable at December 31, 2021.2023. There is no impact to financial results as a result of the adoption of the 382 Agreement for the year ended December 31, 2021.2023.
Note 19. Subsequent Events
On January 24, 2022, we closed an underwritten public offering (the “Offering”) pursuant to an underwriting agreement with Maxim Group LLC, as representative of the underwriters. The Offering was for 9,500,000 shares of common stock (or pre-funded warrants to purchase shares of common stock in lieu thereof) and warrants to purchase up to 9,500,000 shares of common stock (the “common warrants”). Each share of common stock (or pre-funded warrant in lieu thereof) was sold together with one common warrant to purchase one share of common stock at a price of $1.50 per share and common warrant. Gross proceeds, before deducting underwriting discounts and offering expenses and excluding any proceeds we may receive upon exercise of the common warrants, were $14.3 million and net proceeds were $12.8 million.
ITEM 9.CHANGES IN AND DISAGREEMENTS WITH ACCOUNTANTS ON ACCOUNTING AND FINANCIAL DISCLOSURES
None.
ITEM 9A.CONTROLS AND PROCEDURES
Evaluation of Disclosure Controls and Procedures
We maintainBased on an evaluation under the supervision and with the participation of our management, our chief executive officer and chief financial officer have concluded that our disclosure controls and procedures that are designedas defined in Rules 13a-15(e) and 15d-15(e) under the Exchange Act were effective as of the end of the period covered by this report to ensure that information required to be disclosed by us in ourreports that we file or submit under the Exchange Act reports is (i) recorded, processed, summarized and reported within the time periods specified in the SEC’sSEC rules and forms and that such information is(ii) accumulated and communicated to our management, including our chief executive chairmanofficer and chief financial officer, as appropriate to allow for timely decisions regarding required disclosure. In designing
Management's assessment of and evaluatingconclusion on the disclosureeffectiveness of internal control over financial reporting did not include the internal controls of BLL, which is included in the 2023 consolidated financial statements of the Company and procedures, we recognize that any controlsconstituted 2% of both total and procedures, no matter how well designednet assets, as of December 31, 2023 and operated, can provide only reasonable assurance3% of achievingrevenues and less than 1% of net income, for the desired control objectives, andyear then ended.
Management’s Report on Internal Control over Financial Reporting
The Company's management is required to apply its judgmentresponsible for establishing and maintaining adequate internal control over financial reporting (as defined in evaluatingRules 13a-15(f) and 15d-15(f) of the cost-benefit relationship of possible controls and procedures.
As further discussed below, we carried out an evaluation,Exchange Act). Internal control over financial reporting is a process designed under the supervision and with the participation of our management, including our chief executive chairmanofficer and chief financial officer, to provide reasonable assurance regarding the reliability of financial reporting and the preparation of financial statements for external purposes in accordance with accounting principles generally accepted in the United States of America. Management conducted an assessment of the effectiveness of the design and operation of our disclosure controls and procedures, as defined in Rules 13a-15(e) and 15d-15(e) of the Exchange Act. Based on that evaluation, our executive chairman and chief financial officer concluded that our disclosure controls and procedures were not effective as of December 31, 2021 as a result of the material weakness discussed below.
Our disclosure controls and procedures are designed to provide reasonable assurance of achieving their objectives as specified above. Management does not expect, however, that our disclosure controls and procedures will prevent or detect all errors and fraud. Any internal control system, no matter how well designed and operated, can provide only reasonable, not absolute, assurance that its objectives will be met. Further, no evaluation of controls can provide absolute assurance that misstatements due to error or fraud will not occur or that all control issues and instances of fraud, if any, within the Company have been detected.
Management’s Report on Internal Control over Financial Reporting
Our management is responsible for establishing and maintaining adequate internal control over financial reporting, as such term is defined in Rules 13a-15(f) and 15d-15(f) of the Exchange Act. Under the supervision and with the participation of our management, including our chief executive chairman and chief financial officer, we conducted an evaluation of the effectiveness of ourCompany's internal control over financial reporting based on the framework in Internal Control—Integrated Framework (2013) issuedcriteria set forth by the Committee of Sponsoring Organizations of the Treadway Commission (“COSO”). Because of its inherent limitations, internal control over financial reporting may not prevent or detect all misstatements. Also, projections of any evaluation of effectiveness to future periods are subject to the risk that controls may become inadequate because of changes in conditions, or that the degree of compliance with the policies or procedures may deteriorate. Therefore, even those systems determined to be effective can provide only reasonable assurance with respect to financial statement preparation and presentation.
Based on our evaluation under the framework in Internal Control—Integrated Framework (2013),(2013 Framework). Based on this assessment, our management identified a material weakness inconcluded that, as of December 31, 2023, our internal control over financial reporting as we do not have a sufficient complement of accounting resources to address complex accounting matters across all operating entities and to allow timely completion of financial reporting and accounting activities, including sufficiently precise management review controls. The material weakness did not result in any material identified misstatements to the financial statements, and there were no material changes to previously released financial results.
A “material weakness” is a deficiency, or combination of deficiencies, in internal control over financial reporting, such that there is a reasonable possibility that a material misstatement of the annual or interim financial statements will not be prevented or detectedwas effective based on a timely basis.
In designing and evaluating internal control over financial reporting, management recognizes that any controls and procedures, no matter how well designed and operated, can provide only reasonable assurance of achieving the desired control objectives. In addition, the design of internal controls and procedures must reflect the fact that there are resource constraints and that management is required to apply judgment in evaluating the benefits of possible controls and procedures relative to their costs.
Remediation Plan for Material Weakness
Management intends to increase the skills and experience of our accounting and financial reporting staff over time and to make future investments in the continuing education and public company accounting training of our accounting and financial professionals. We may also retain additional outside financial consultants to conduct technical accounting reviews, when necessary.
Controls will also be added to increase the precision of management review controls, including the review of key inputs used in the preparation and review process. Our management is committed to remediation of the material weakness described above.those criteria.
Changes in Internal Control over Financial Reporting
Except as described above, there were no changes in our internal control over financial reporting identified in connection with the evaluation required by paragraph (d) of Rules 13a-15 or 15d-15 under the Exchange Act that occurred during fourth quarter of 20212023 that have materially affected, or are reasonably likely to materially affect, our internal control over financial reporting.
ITEM 9B. OTHER INFORMATION
None.Security Trading Plans of Directors and Executive Officers
None of the Company's directors or executive officers adopted or terminated a Rule 10b5-1 trading arrangement or a non-Rule 10b5-1 trading arrangement during the Company's fiscal quarter ended December 31, 2023, as such terms are defined under Item 408(a) or Regulation S-K.
ITEM 9C. DISCLOSURE REGARDING FOREIGN JURISDICTIONS THAT PREVENT INSPECTIONS
Not ApplicableApplicable.
PART III
ITEM 10.DIRECTORS, EXECUTIVE OFFICERS AND CORPORATE GOVERNANCE
Pursuant to Paragraph G(3)
Our Board of Directors
The current number of directors on our board of directors is six. Under our bylaws, the number of directors on our board of directors will not be less than five, nor more than nine. The number of directors may be increased or decreased by resolution of the General Instructionsboard of directors.
| | | | | | | | |
| Name | Age | Position |
| Jeffrey E. Eberwein | 53 | Director, Executive Chairman of the Board |
| Richard K. Coleman, Jr. | 67 | Director, Chief Executive Officer |
| Michael A. Cunnion | 53 | Director |
| John W. Sayward | 72 | Director |
| Mitchell I. Quain | 72 | Director |
| John W. Gildea | 80 | Director |
Information about the Company’s Directors
Set forth below are descriptions of the backgrounds of each director and their principal occupations for at least the past five years and their public-company directorships. There are no family relationships among any of our directors or executive officers. All ages are as of March 22, 2024.
In addition to Form 10-K, the information required by Part III (Items 10, 11,12, 13,presented below regarding each director’s specific experience, qualifications, attributes and 14) is being incorporated by referenceskills that led our board of directors to the applicableconclusion that he should serve as a director, we also believe that all of our directors have a reputation for integrity, honesty and adherence to high ethical standards. They each have demonstrated business acumen and an ability to exercise sound judgment, as well as a commitment of service to Star Equity and our board of directors.
| | | | | | | | |
| Jeffrey E. Eberwein | Age 53 | Director since 2012 |
| Chief Executive Officer of Hudson Global Inc. (“Hudson”) and Executive Chairman of Star Equity |
Mr. Eberwein was elected Executive Chairman of the board of directors of the Company on January 1, 2021, after serving as Chairman of the board of directors since February 6, 2013. Mr. Eberwein has served as a director of Hudson since May 2014 and as its Chief Executive Officer since April 1, 2018. He has 25 years of Wall Street experience, and has valuable public company and financial expertise gained through his employment history and directorships. Prior to founding Lone Star Value Management, LLC (“LSVM”), a Connecticut-based investment firm he founded in 2013, Mr. Eberwein was a private investor and served as a portfolio manager at Soros Fund Management from 2009 to 2011 and Viking Global Investors from 2005 to 2008. LSVM was a wholly owned subsidiary of ATRM Holdings, Inc. (“ATRM”) when ATRM, a modular building company, was acquired by the Company on September 10, 2019 (the “ATRM Acquisition”). Previously, Mr. Eberwein served as chairman of the board of Ameri Holdings, Inc. from May 2015 to August 2018. Mr. Eberwein also previously served as a director of Novation Companies, Inc. from April 2015 to March 2018; Crossroads Systems, Inc. from June 2013 to May 2016; NTS, Inc. from December 2012 to June 2014; On Track Innovations Ltd. from 2012 to 2014; and Goldfield Corporation from 2012 to 2013. Mr. Eberwein earned an M.B.A. from The Wharton School, University of Pennsylvania and a B.B.A. with High Honors from The University of Texas at Austin.
We believe Mr. Eberwein’s expertise in finance and experience in the investmentcommunity, along with his extensive experience, qualifications, attributes and skills make him well qualified to serve as a director of our Company.
On February 14, 2017, the SEC issued an order (Securities Exchange Act Release No. 80038) (the “Order”) relating to allegations that certain groups of investors failed to properly disclose ownership information during a series of five campaigns to influence or exert control over microcap companies. The Order alleged violations of Section 13(d)(1) of the Exchange Act and Rule 13d-1 thereunder, Section 13(d)(2) of the Exchange Act and Rule 13d-2(a) thereunder and Section 16(a) of the Exchange Act and Rules 16a-2 and 16a-3 thereunder by Mr. Eberwein and a hedge fund adviser headed by him, LSVM, a mutual fund adviser and another investor. Without admitting or denying the findings, they consented to the Order and agreed to cease and desist from committing any violations of the above-referenced Exchange Act provisions and civil penalties of $90 thousand for Mr. Eberwein, $120 thousand for LSVM, $180 thousand for the mutual fund advisor and $30 thousand for the other investor. On February 24, 2020, the SEC issued an order (Securities Exchange Act Release No. 5448) (the “Advisers Act Order”) relating to allegations, among other things, that LSVM failed to properly disclose certain specific transactions in advance and obtain client consent for these transactions prior to their completion and that LSVM failed to implement certain written policies and procedures. The Advisers Act Order alleged violations of Section 206(3) and 206(4) of the Investment Advisers Act of 1940 (“Advisers Act”) and Rule 206(4)-7 thereunder by Mr. Eberwein and LSVM. Without admitting or denying the findings, they consented to the Advisers Act Order and agreed to cease and desist from committing or causing any violations of the above-referenced Advisers Act provisions, for LSVM to be censured and to pay civil penalties of $25 thousand for Mr. Eberwein and $100 thousand for LSVM.
| | | | | | | | |
| Richard K. Coleman, Jr. | Age 67 | Director since 2022 |
| Chief Executive Officer of Star Equity | | |
Mr. Coleman was appointed as our definitive proxy statement (orChief Executive Officer in April 2022. Prior to being appointed as our Chief Executive Officer, Mr. Coleman served as our Chief Operating Officer from January 2022 to March 2022. Mr. Coleman was formerly the President, Chief Executive Officer and director of Command Center, Inc., a provider of on-demand flexible employment solutions, from April 2018 to July 2019. He was also the Chairman of Hudson Global Inc., a global talent solutions company, from May 2014 to January 2022. He was the Principal Executive Officer of Crossroads Systems, Inc., a global provider of data archive solutions, from August 2017 to March 2018. Mr. Coleman began his career as an amendmentAir Force Telecommunications Officer managing Department of Defense R&D projects. He has also served as an adjunct professor for Regis University’s graduate management program and is a guest lecturer for Denver University’s Pioneer Leadership Program, focusing on leadership and ethics. Coleman holds a master’s degree in Business Administration from Golden Gate University and is a graduate of the United States Air Force Communications Systems Officer School. He holds a Bachelor of Science Degree from the United States Air Force Academy and also has completed leadership, technology, and marketing programs at Kansas University, UCLA, and Harvard Business School.
We believe Mr. Coleman’s extensive business development and operating expertise, his public company board experience, and his broad leadership experience make him well qualified to serve as a director of our Company.
| | | | | | | | |
| Michael A. Cunnion | Age 53 | Director since 2014 |
| Director and Advisor to Growth Companies |
Committees: Audit, Compensation (Chairman), and Corporate Governance
Mr. Cunnion has an extensive history of leadership roles at healthcare media and communication companies. Since October 2022, Mr. Cunnion has served on the board of directors of Remedy Health Media, a privately held health media company. From September 2008 to September 2022, Mr. Cunnion served as Remedy Health Media’s Chief Executive Officer. In addition, prior to that, from January 2004 to December 2007, Mr. Cunnion was the President of privately held HealthTalk, a leading provider of tools and information for chronically ill patients and caregivers. Mr. Cunnion successfully built this company and subsequently sold it to Revolution Health in December 2007. Subsequent to this sale, Mr. Cunnion took on the role of Executive Vice President of Revolution Health, where he oversaw revenue and sales strategy until Revolution Health merged with Everyday Health. Prior to HealthTalk, from December 1998 to December 2003, Mr. Cunnion held the role of Senior Director, Consumer Marketing at WebMD, where he led consumer sales strategy, product development and advertising operations. Mr. Cunnion currently serves on the board of directors of Health-e-Commerce, a healthcare e-commerce platform that simplifies healthcare purchasing for consumers, employers and benefit administrators. This is a post that he has held since 2011. Mr. Cunnion earned a B.A. degree in English from Florida State University.
We believe that Mr. Cunnion’s extensive experience with media companies, coupled with his experience with building up companies and creating ownership value, are of significant strategic importance to us and make him well qualified to serve on our board of directors. His history of creating and leveraging collaborative relationships with the companies he has been part of to maximize value in both the continued organic growth and sale of such companies can be of great benefit to our Annual Reportstockholders.
| | | | | | | | |
| John W. Sayward | Age 72 | Director since 2008 |
| Retired Partner, Nippon Heart Hospital LLC |
Committees: Audit (Chairman) and Compensation
Mr. Sayward is a career healthcare and pharmaceutical executive. Most recently, he served as Chief Executive Officer for Hera Therapeutics Inc., a position he held through June 2015. Prior to this, Mr. Sayward served as the Chief Operating Officer and Chief Financial Officer of Hera Therapeutics Inc. since September 2014. Previously, he was Partner at Nippon Heart Hospital, LLC from September 2005 to January 2007, which was formed to build and manage cardiovascular care hospitals in Japan. From 2002 to 2005, Mr. Sayward was the Executive Vice President and Chief Financial Officer of LMA North America Inc., a medical device business focused on Form 10-K)patient airway management. From 1996 to be filed2001, Mr. Sayward served as the Executive Vice President of Finance, Chief Financial Officer and Treasurer of SICOR Inc., and was elected to its board of directors in 1998. Previous to the above, he served in various management positions with Baxter Healthcare. He received a B.A. in History from Northwestern University in 1973 and a Master of Management from the SECKellogg School of Management at Northwestern University in 1975.
We believe that Mr. Sayward’s extensive business experience in a variety of sectors makes him well qualified to serve on our board of directors. Further, Mr. Sayward’s depth and breadth of positions and experiences also makes him well qualified to serve as a financial expert and audit committee chairman.
| | | | | | | | |
| Mitchell I. Quain | Age 72 | Director since 2019 |
| Industrialist |
Committees: Compensation and Corporate Governance (Chairman)
Mr. Quain joined the board of directors of the Company in January 2019 and became lead independent director on January 1, 2021. He has been a member of the Executive Council at American Securities since 2020, and was a Partner at One Equity Partners, a private equity investment firm, from 2010 to 2011. A Chartered Financial Analyst and “Financial Expert”, he serves on the board of directors of AstroNova, Inc., Kensington Acquisitions V, and Williams Industrial Holdings. Previously, he served on the boards of publicly traded DeCrane Aircraft Holdings, Inc., Handy & Harman Ltd., Hardinge, Inc., HEICO Corporation, Jason Industries, Kensington Acquisitions, MagneTek, Inc., Mechanical Dynamics, Inc., RBC Bearings, Inc., Strategic Distribution, Tecumseh Products Company, Titan International, Xerium, Inc., was Executive Chairman of the Board of Register.com and a Senior Advisor at Carlyle Group.
He is Chairman Emeritus of the Board of Overseers of The University of Pennsylvania’s School of Engineering and Applied Sciences and has served for 10 years on Penn’s Board of Trustees. He has served for 9 years on the Board and Executive Committee of Penn Medicine, a $4 billion enterprise. He is also a member of the Board of Trustees of Curry College, in Milton, Massachusetts. He is on the board of directors of the Palm Beach Zoological Society.
He was born and raised in the New York City area; received his B.S. in electrical engineering from the University of Pennsylvania in 1973 and his MBA with distinction from Harvard Business School in 1975.
He joined the research department of Wertheim & Company in June 1975, and chose machinery as his specialty, having worked for a summer at United Engineers & Contractors, in Philadelphia. He appeared on Institutional Investor magazine’s All American research team for fifteen years, “retiring” from research in 1995 while holding the “number one” ranking. Meanwhile, he became a partner in Wertheim in 1984, and in 1995 joined its operating committee, having assumed responsibility for the equity capital markets department. He left the firm in early 1997, joined Furman Selz as an Executive Vice President and a member of its board of directors. There he built Wall Street’s second industrial manufacturing group (“the Golden Gear”), having begun its first at Wertheim (“In Rust We Trust”). He left the “sellside” in 2001, retiring as Vice Chairman of ABN AMRO.
Mr. Quain brings to the board of directors experience in public company governance and investment experience in small-cap and industrial companies, which gives him a valuable perspective in his role as a director. His qualifications to serve as a director also include his private equity investment experience.
| | | | | | | | |
| John W. Gildea | Age 80 | Director since 2021 |
| Retired Principal, Gildea Management Company |
Committees: Audit and Corporate Governance
Mr. Gildea brings over three decades of experience investing in special situation debt and equity of small to middle market companies. Previously, he was the founding partner of Gildea Management Company from 1984-2003, the general partner of The Network Funds. The fund focused on investing and sponsoring special situation investments in public and private companies, primarily in the United States. His previous experience includes a joint venture of Gildea Management with J.O. Hambro Capital Management Co. to manage accounts targeting high yield debt and small capitalization equities. He was also founder of Latona Europe, a joint venture based in Prague seeking restructuring opportunities in Central Europe. Before forming Gildea Management, Mr. Gildea managed the Corporate Services Group at Donaldson, Lufkin and Jenrette, an investment banking firm.
Throughout his extensive career, Mr. Gildea has served on a range of public and private corporate boards. Previously, he served on the board and board committees of the following companies: America Service Group, Inc.; Amdura Corp.; American Healthcare Management, Inc.; America Opportunities Fund; Country Pure Juice; Gentek, Inc.; General Chemical Group, Inc.; Hain Food Group, Inc.; International Textile Group, Inc.; Konover Property Trust, Inc.; Misonix, Inc.; Shearers Foods; Sothic Capital, Sterling Chemicals, Inc.; Trident North Atlantic Fund; and UNC, Inc. Mr. Gildea received a Bachelor of Arts degree from the University of Pittsburgh.
Mr. Gildea brings to the board of directors experience in public company governance and investment experience in small-cap and industrial companies, which gives him a valuable perspective in his role as a director. His qualifications to serve as a director also include his private equity investment experience.
Executive Officers
The names of our executive officers, their ages, their positions with Star Equity, and other biographical information as of March 22, 2024, are set forth below. There are no family relationships among any of our directors or executive officers.
| | | | | | | | | | | | | | |
| Name | | Age | | Position |
| Jeffrey E. Eberwein | | 53 | | Director, Executive Chairman of the Board of Directors |
| Richard K. Coleman, Jr. | | 67 | | Chief Executive Officer |
| David J. Noble | | 53 | | Chief Financial Officer |
| Thatcher Butcher | | 42 | | President of KBS Builders, Inc. |
Jeffrey E. Eberwein. Mr. Eberwein’s full biographical information is provided above under the heading “Information about the Company’s Directors.”
Richard K. Coleman, Jr. Mr. Coleman’s full biographical information is provided above under the heading “Information about the Company’s Directors.”
David J. Noble was appointed as our Chief Financial Officer in July 2019. Prior to being appointed as our Chief Financial Officer, Mr. Noble served as our Chief Operating Officer from September 2018 to January 2022 and as our Interim Chief Financial Officer from January 2019 to July 2019. Prior to joining the Company, Mr. Noble served as Managing Member of Noble Point LLC, a business and financial advisory firm. From July 2005 through September 2017, Mr. Noble was a senior investment banker at HSBC, serving as Managing Director & Head of Equity Capital Markets for the Americas for more than a decade. Prior to joining HSBC, Mr. Noble held various senior roles within 120 days afterEquity Capital Markets at Lehman Brothers, both in the endU.S. and overseas, from August 1997 to July 2005. In his 20-year Wall Street career, Mr. Noble was involved in hundreds of equity transactions across a wide range of sectors, including healthcare, industrials, financial services, media, technology, and energy, among others. Mr. Noble earned a B.A. degree in Political Science from Yale University in 1992 and an M.B.A. in Finance from MIT’s Sloan School of Management in 1997.
Thatcher Butcher was appointed as President of KBS Builders, Inc. in May 2022. Prior to joining the Company, Mr. Butcher served as the General Manager, Mid Atlantic Division at Anthony & Sylvan Pools from September 2018 to May 2022. Prior to that, Mr. Butcher worked as Truss and Engineered Lumber Division General Manager at TW Perry from December 2009 to September 2018. Prior to joining TW Perry, Mr. Butcher held various other positions with Rocky Top Building products and Best Building Components. Mr. Butcher studied Architectural Design & Building technology at the State University of New York and completed coursework in Architecture at Clemson University. He has also completed General Management and Leadership Development training at George Mason University.
Director Nomination Process
During the fiscal year ended December 31, 20212023, we made no material changes to the procedures by which stockholders may recommend nominees to our board of directors, as described in connectionour most recent proxy statement.
Audit Committee
The audit committee of the board of directors (the “Audit Committee”), established in accordance with Section 3(a)(58)(A) of the Exchange Act, consists of Messrs. Gildea, Cunnion, and Sayward, with Mr. Sayward serving as chairman. All members of the Audit Committee (i) are independent directors (as currently defined in Rule 5605(a)(2) of the Nasdaq listing rules); (ii) meet the criteria for independence set forth in Rule 10A-3(b)(1) under the Exchange Act; (iii) have not participated in the preparation of the financial statements of the Company or any current subsidiary of the Company at any time during the past three years; and (iv) are able to read and understand fundamental financial statements. Mr. Sayward qualifies as an “audit committee financial expert” as defined in the rules and regulations established by the SEC. The Audit Committee is governed by a written charter approved by our Annual Meetingboard of Stockholdersdirectors.
Compensation Committee
The compensation committee of the board of directors (the “Compensation Committee”) consists of Messrs. Cunnion, Sayward, and Gildea with Mr. Cunnion serving as chairman. All members of the Compensation Committee are independent, as determined under the various Nasdaq, SEC and Internal Revenue Service qualification requirements. The Compensation Committee is governed by a written charter approved by our board of directors. The functions of this committee include, among other things reviewing and, as it deems appropriate, recommending to our board of directors, policies, practices, and procedures relating to the compensation of our directors, officers and other managerial employees and the establishment and administration of our employee benefit plans; establishing appropriate incentives for officers, including the chief executive officer, to encourage high performance, promote accountability and adherence to company values and further our long-term strategic plan and long-term value; and exercising authority under our employee benefit plans.
Corporate Governance Committee
The corporate governance committee of the board of directors (the “Corporate Governance Committee”) consists of Messrs. Cunnion, Gildea and Quain with Mr. Quain serving as chairman. The functions of the Corporate Governance Committee include, among other things: reviewing and recommending nominees for election as directors, assessing the performance of our board of directors, developing guidelines for the composition of our board of directors, reviewing and administering our corporate governance guidelines and considering other issues relating to corporate governance; and oversight of the Company compliance officer and compliance with the Ethics Code. The Corporate Governance Committee is governed by a written charter (the “Corporate Governance Committee Charter”) approved by our board of directors. A copy of the Corporate Governance Committee Charter can be heldfound by clicking on the “Corporate Governance” link under the Investors tab on our website at www.starequity.com. All members of the Corporate Governance Committee are independent directors (as defined in 2022.Rule 5605(a)(2) of the Nasdaq listing rules).
Delinquent Section 16(a) Reports
Section 16(a) of the Exchange Act requires Star Equity’s directors, executive officers and holders of more than 10% of its common stock to file with the SEC reports (typically, Forms 3, 4, and/or 5) regarding their ownership and changes in ownership of Star Equity’s securities. Based solely on a review of Forms 3, 4, and 5 and amendments thereto filed with the SEC, we believe that during the fiscal year ended December 31, 2023, Star Equity’s directors, officers and 10% stockholders have complied with all applicable Section 16(a) filing requirements, except for one Form 4 that was inadvertently filed late on behalf of David Noble, the Company’s Chief Financial Officer, reporting one transaction.
Code of Business Ethics and Conduct
We have adopted a Code of Business Ethics and Conduct (“Ethics Code”) that applies to all our officers, directors, employees, and contractors. The Ethics Code contains general guidelines for conducting our business consistent with the highest standards of business ethics and compliance with applicable law, and is intended to qualify as a “code of ethics” within the meaning of Section 406 of the Sarbanes-Oxley Act of 2002 and Item 406 of Regulation S-K. Day-to-day compliance with the Ethics Code is overseen by the Company compliance officer appointed by our board of directors. If we make any substantive amendments to the Ethics Code or grant any waiver from a provision of the Ethics Code to any director or executive officer, we will promptly disclose the nature of the amendment or waiver on our website at www.starequity.com.
ITEM 11.EXECUTIVE COMPENSATION
SeeSummary Compensation Table
The following table provides information regarding the compensation earned during the fiscal years ended December 31, 2023 and 2022 by our principal executive officer and our two other most highly compensated executive officers (the “named executive officers”) who were serving as executive officers as of December 31, 2023.
| | | | | | | | | | | | | | | | | | | | | | | | | | | | | | | | | | | | | | | | | | | | |
| Name and Principal Position | | Year | | Salary ($) (1) | | Bonus ($) (2) | | Stock
Awards
($) (3) | | Nonequity
Incentive Plan
Compensation
($) | | All Other
Compensation
($) (4) | | Total
($) |
| Richard K. Coleman* | | 2023 | | 400,000 | | 185,000 | | 74,000 | | — | | 2,500 | | 661,500 |
| Chief Executive Officer | | 2022 | | 382,773 | | — | | 100,001 | | — | | 2,500 | | 485,274 |
| David J. Noble | | 2023 | | 325,000 | | 125,000 | | 50,000 | | — | | 4,000 | | 504,000 |
| Chief Financial Officer | | 2022 | | 322,503 | | 78,000 | | — | | — | | 3,500 | | 404,003 |
| Thatcher Butcher | | 2023 | | 250,016 | | 106,731 | | 21,347 | | — | | 1,017 | | 379,111 |
| President of KBS Builders, Inc. | | 2022 | | 158,664 | | 500 | | — | | — | | 1,017 | | 160,181 |
__________________
* Effective April 1, 2022, Richard K. Coleman, Jr. was appointed as the Company’s Chief Executive Officer.
(1)The base salary for each executive is initially established through negotiation at the time the executive is hired, and year-to-year adjustments are made, taking into account attributes and factors described below in the Narrative Disclosure to Summary Compensation Table. Based on the factors discussed above, 2022 base salaries were as follows: Mr. Coleman’s 2023 base salary was $400,000, which has not been adjusted since it was initially set in April 2022; the total salary for 2023 was $400,000; Mr. Noble’s 2023 base salary was $325,000, which was initially set at $300,000 from his last adjustment in 2018; the total salary for 2023 was $325,000; Mr. Butcher’s 2023 base salary was initially set at $250,016, the total for 2023 was $250,016. The differences between base and actual salary are due to pay period timing differences at year end.
(2)The executive incentive plan which provides for bonuses at the completion of each fiscal year is described below in the Narrative Disclosure to Summary Compensation Table.
(3)Represents full fair value at grant date of restricted stock units (“RSUs”), including the stock awards with performance conditions (“PSUs”) described below, representing the right to receive, at settlement, common stock of the Company, granted to our named executive officers, computed in accordance with FASB ASC Topic 718, Stock Compensation. The full grant date fair value of an equity award is the maximum value that may be received over the vesting period if all vesting conditions are satisfied, as discussed further below. Thus, there is no assurance that the value, if any, eventually received by our executive officers will correspond to the amount shown. For information regarding assumptions made in connection with this valuation, please see Note 11. Share-Based Compensation within the notes to our consolidated financial statements.
(4)Amounts shown for 2023 and 2022 include up to $2,500 matching contributions to the executives’ 401(k) retirement plans and up to $1,500 seed contribution to the executive’s Health Savings Account plans.
Narrative Disclosure to Summary Compensation Table.
Base Salary. The base salary for each executive is initially established through negotiation at the time the executive is hired, taking into account his or her scope of responsibilities, qualifications, experience, prior salary, and competitive salary information within the industry. Year-to-year adjustments to each executive officer’s base salary are determined by an assessment of his or her sustained performance against individual goals, including leadership skills and the achievement of high ethical standards, the individual’s impact on the Company’s business and financial results, current salary in relation to the salary range designated for the job, experience, demonstrated potential for advancement, and an assessment against base salaries paid to executives for comparable jobs in the marketplace.
When determining the base salary component of executive compensation for 2023, the Compensation Committee considered the achievements of the executives in 2022 based on actual financial performance of the business and achievement of the goals set by the board of directors for the individual executive, the fiscal 2023 budget and financial performance expectations, the totality of all compensation components. After due consideration, the Compensation Committee set compensation as reflected in the Summary Compensation Table above.
Annual Incentive Bonus. Payments under the Company’s executive bonus plan are based on achieving clearly defined, short-term goals. We believe that such bonuses provide incentive to achieve goals that the Company aligns with its stockholders’ interests by measuring the achievement of these goals, whenever possible, in terms of revenue, income or other financial objectives. In setting bonus levels, the Company reviews its annual business plan and financial performance objectives. After estimating the likely financial results of the business plan as submitted by management and approved by the board of directors, the Company sets financial threshold goals based on those estimated results primarily in terms of EBITDA. The Company sets the minimum performance thresholds that must be reached before any bonus is paid at levels that will take significant effort and skill to achieve. An executive officer’s failure to meet some or all of these personal goals can affect his or her bonus amount. The Company believes that offering significant potential income in the form of bonuses allows the Company to attract and retain executives and to align their interests with those of the Company’s stockholders. The Company awards incentive bonuses based on the metrics described above which provided for discretionary bonuses.
Fiscal Year 2023. In July 2023, the Company approved and adopted the fiscal year 2023 Executive Incentive Plan (“2023 Annual Plan”) for executive officers. Due to the changing nature of the Company’s business following the sale of Digirad, the 2023 Annual Plan challenged the Company’s executive team to achieve the company’s financial objectives and develop a platform for future organic growth and acquisitions. Actual cash bonus payments under the plan were based on a combination of corporate, team, and individual performance against pre-defined objectives with final payments determined by the Compensation Committee.
The cash bonus amounts under the 2023 Annual Plan were as follows.
| | | | | | | | | | | | | | |
| Name and Principal Position* | | Percentage of Base Salary | | Bonus Payout |
| Richard K. Coleman, Chief Executive Officer | | 46 | % | | 185,000 | |
| David J. Noble, Chief Financial Officer and Chief Operating Officer | | 38 | % | | 125,000 | |
| Thatcher Butcher, President of KBS Builders, Inc. | | 43 | % | | 106,731 | |
Equity Grants
In connection with the adoption of the 2023 Annual Plan, the Compensation Committee determined, as part of a long-term retention mechanism and to incentivize the executive officers to increase the Company’s stockholder value, to award RSUs effective on March 1, 2023 July 27, 2023 August 16, 2023, November 13, 2023 (the “2023 Grant Dates”) to Messrs. Coleman, Noble and Butcher.
The RSUs granted to each of Messrs. Coleman, Noble and Butcher vest over three years in three equal installments, with each such installment vesting on each anniversary of the 2023 Grant Dates. The RSU grants to Messrs. Coleman, Noble and Butcher were made pursuant to and subject to the terms of the 2023 Annual Plan, the Company’s 2018 Incentive Plan, and the respective award agreement that sets forth the terms of the respective grants.
| | | | | | | | |
| Name and Principal Position | | Cash Value of the Restricted Stock Units Granted |
| Richard K. Coleman, Chief Executive Officer | | 74,000 | |
| David J. Noble, Chief Financial Officer | | 50,000 | |
| Thatcher Butcher, President of KBS Builders, Inc. | | 21,347 | |
Other Compensation
The Company currently maintains benefits for executive officers, that include medical, dental, vision and life insurance coverage and the ability to contribute to a 401(k) retirement plan; however, the Compensation Committee in its discretion may revise, amend or add to the officer's executive benefits if it deems it advisable. The benefits currently available to the executive officers are also available to other employees.
Outstanding Equity Awards at Fiscal Year-End
The following table presents the outstanding equity awards held by each of the named executive officers as of the fiscal year ended December 31, 2023, including the value of the stock awards.
| | | | | | | | | | | | | | | | | | | | | | | | | | | | | | | | |
| Name | | | | Option Awards | | Stock Awards |
| Grant Date | | Number of
Securities
Underlying
Unexercised
Options
(#)
Exercisable | Number of
Securities
Underlying
Unexercised
Options
(#)
Unexercisable | Option
Exercise
Price
($) | Option
Expiration
Date | | Equity
Incentive
Plan Awards:
Number of
Unearned
Shares, Units
or Other
Rights That
Have Not
Vested
(#) | Equity
Incentive
Plan Awards:
Market or
Payout Value
of Unearned
Shares, Units
or Other
Rights That
Have Not
Vested
($) |
| Richard K. Coleman | | 1/1/2022 | (1) | — | | — | | — | | — | | | 25,512 | | 26,788 | |
| | 7/27/2023 | (1) | | | | | | 75,773 | | 79,562 | |
| | | | | | | | | | |
| David J. Noble | | 8/23/2021 | (1) | — | | — | | — | | — | | | 8,333 | | 8,750 | |
| | 7/27/2023 | (1) | — | | — | | — | | — | | | 51,198 | | 53,758 | |
| | | | | | | | | | |
| Thatcher Butcher | | 3/1/2023 | (1) | — | | — | | — | | — | | | 25,719 | | 27,005 | |
____________________
(1)33-1/3% of the units vest annually on the anniversary of the grant date over a three-year period.
(2)100% of the units vest annually on the anniversary of the grant date.
Potential Payments Upon Termination or Change of Control
Richard K. Coleman, Jr.
On December 16, 2021, the Company hired Richard K. Coleman, Jr. to serve as the Company’s Chief Operating Officer, effective January 1, 2022. Effective April 1, 2022, the Company entered into an amended employment agreement with Mr. Coleman (the “Coleman Employment Agreement”), pursuant to which Mr. Coleman serves as Chief Executive Officer of the Company.
Pursuant to the Coleman Employment Agreement, Mr. Coleman can be terminated for “cause,” upon death, upon disability and without “cause.” Under the Coleman Employment Agreement, termination for “cause” generally means the termination of Mr. Coleman’s employment by reason of: (A) the willful failure of Mr. Coleman to perform his duties and obligations in any material respect (other than any failure resulting from his disability), (B) intentional acts of dishonesty or willful misconduct by Mr. Coleman with respect to the Company, (C) arrest or conviction of a felony or violation of any law involving dishonesty, disloyalty, moral turpitude, or fraud, or entry of a plea of guilty or nolo contendere to such charge, (D) Mr. Coleman’s commission at any time of any act of fraud, embezzlement or willful misappropriation of material Company property, (E) repeated refusal to perform the reasonable and legal instructions of the board of directors, (F) willful and material breach of his obligations under any material agreement entered into between Mr. Coleman and the Company or any of its affiliates, or willful and material breach of the Company’s polices or procedures which causes material damage to the Company, its business or reputation, provided that for subsections (A), (E), and (F), if the breach reasonably may be cured, Mr. Coleman has been given at least thirty (30) days after his receipt of written notice of such breach from the Company to cure such breach. Termination without “cause” means termination for any reason other than death, disability, for “cause,” or for no reason at all, upon sixty (60) days’ written notice.
The Coleman Employment Agreement provides for termination of Mr. Coleman’s employment upon his election by voluntary resignation or termination for good reason. Termination by voluntary resignation means Mr. Coleman can terminate his employment with the Company at any time and for any reason whatsoever or for no reason at all in his sole discretion upon giving sixty (60) days’ written notice. A termination for good reason means Mr. Coleman can terminate his employment with the Company pursuant to the occurrence of any of the following events: (i) any material diminution in his authority, duties and responsibilities, (ii) any material reduction of his base salary, aggregate incentive compensation opportunities or aggregate benefits, unless such changes are applied to all members of the Company’s leadership team and amount to less than a 10% reduction in total, or (iii) a material breach by the Company of the Coleman Employment Agreement.In addition, either the Company or Mr. Coleman can deliver to the other party a written notice of non-renewal at least sixty (60) days prior to the applicable renewal date of the Coleman Employment Agreement.
In the event Mr. Coleman voluntarily resigns, is terminated for “cause,” is terminated upon death, or is terminated upon disability, he would be entitled to receive: (i) his then current salary accrued up to and including the date of termination or resignation, (ii) unreimbursed expenses, and (iii) any vested payment or accrued benefits under any equity or Company benefit plan (the “Coleman Accrued Obligations”). All RSU awards under the Coleman Employment Agreement vest one-third on each of the first, second and third anniversaries of the grant date.
In the event Mr. Coleman terminates his employment for good reason, his employment is terminated without “cause,” or his employment is terminated by delivery of a non-renewal notice by the Company, he would be entitled to receive: (i) the Coleman Accrued Obligations (described above), (ii) a target bonus based on the target bonus metrics used to determine actual performance at the end of the fiscal year, but prorated to reflect the number of full months worked during the fiscal year, (iii) immediate vesting of any RSUs awarded under the Coleman Employment Agreement for which the performance period has not been completed as of the date of termination based on the level of achievement of the performance goals at the end of the performance period, but pro-rated based on the number of full months worked during the performance period, and (iv) immediate vesting of any RSUs awarded under the Coleman Employment Agreement which are outstanding as of the date of termination. Notwithstanding the foregoing, if within twelve (12) months following a change of control (as defined in the Coleman Employment Agreement), the Company terminates Mr. Coleman’s employment without “cause,” he resigns from his employment with good reason, or his employment terminates due to Company’s delivery of a non-renewal notice, then the bonus payment under (ii) above shall equal the equivalent of his target bonus without proration and, in addition to (iii) and (iv) above, he shall receive (v) twelve months of his then-current base salary.
David J. Noble
On October 31, 2018, the Company entered into an employment agreement with David J. Noble, which was amended and restated on December 22, 2021 (the “Noble Employment Agreement”). On this same date, Mr. Noble agreed to relinquish the role of Chief Operating Officer, while retaining the position of Chief Financial Officer effective January 1, 2022.
Pursuant to the Noble Employment Agreement, Mr. Noble can be terminated for “cause,” upon death, upon disability and without “cause.” Under the Noble Employment Agreement, termination for “cause” generally means the termination of Mr. Noble’s employment by reason of: (A) the willful failure of Mr. Noble to perform his duties and obligations in any material respect (other than any failure resulting from his disability), (B) intentional acts of dishonesty or willful misconduct by Mr. Noble with respect to the Company, (C) arrest or conviction of a felony or violation of any law involving dishonesty, disloyalty, moral turpitude, or fraud, or entry of a plea of guilty or nolo contendere to such charge, (D) Mr. Noble’s commission at any time of any act of fraud, embezzlement or willful misappropriation of material Company property, (E) repeated refusal to perform the reasonable and legal instructions of the board of directors, (F) willful and material breach of his obligations under any material agreement entered into between Mr. Noble and the Company or any of its affiliates, or willful and material breach of the Company’s polices or procedures which causes material damage to the Company, its business or reputation, provided that for subsections (A), (E), and (F), if the breach reasonably may be cured, Mr. Noble has been given at least thirty (30) days after his receipt of written notice of such breach from the Company to cure such breach. Termination without “cause” means termination for any reason other than death, disability, for “cause,” or for no reason at all, upon sixty (60) days’ written notice.
The Noble Employment Agreement provides for termination of Mr. Noble’s employment upon his election by voluntary resignation or termination for good reason. Termination by voluntary resignation means Mr. Noble can terminate his employment with the Company at any time and for any reason whatsoever or for no reason at all in his sole discretion upon giving sixty (60) days’ written notice. A termination for good reason means Mr. Noble can terminate his employment with the Company pursuant to the occurrence of any of the following events: (i) any material diminution in his authority, duties and responsibilities, (ii) any material reduction of his base salary, aggregate incentive compensation opportunities or aggregate benefits, unless such changes are applied to all members of the Company’s leadership team and amount to less than a 10% reduction in total, or (iii) a material breach by the Company of the Noble Employment Agreement.In addition, either the Company or Mr. Noble can deliver to the other party a written notice of non-renewal at least sixty (60) days prior to the applicable renewal date of the Noble Employment Agreement.
In the event Mr. Noble voluntarily resigns, is terminated for “cause,” is terminated upon death, or is terminated upon disability, he would be entitled to receive: (i) his then current salary accrued up to and including the date of termination or resignation, (ii) unreimbursed expenses, and (iii) any vested payment or accrued benefits under any equity or Company benefit plan (the “Noble Accrued Obligations”). In March 2021, Mr. Noble agreed by letter that all future RSU awards under the Noble Employment Agreement would vest one-third on each of the first, second and third anniversaries of the grant date
In the event Mr. Noble terminates his employment for good reason, his employment is terminated without “cause,” or his employment is terminated by delivery of a non-renewal notice by the Company, he would be entitled to receive: (i) the Noble Accrued Obligations (described above), (ii) a target bonus based on the target bonus metrics used to determine actual performance at the end of the fiscal year, but prorated to reflect the number of full months worked during the fiscal year, (iii) immediate vesting of any RSUs awarded under the Noble Employment Agreement for which the performance period has not been completed as of the date of termination based on the level of achievement of the performance goals at the end of the performance period, but pro-rated based on the number of full months worked during the performance period, and (iv) immediate vesting of any RSUs awarded under the Noble Employment Agreement which are outstanding as of the date of termination. Notwithstanding the foregoing, if within twelve (12) months following a change of control (as defined in the Noble Employment Agreement), the Company terminates Mr. Noble’s employment without “cause,” he resigns from his employment with good reason, or his employment terminates due to Company’s delivery of a non-renewal notice, then the bonus payment under (ii) above shall equal the equivalent of his target bonus without proration and, in addition to (iii) and (iv) above, he shall receive (v) twelve months of his then-current base salary.
If Mr. Noble’s employment was terminated in connection with a change of control as of December 31, 2022, he would have been entitled to receive: (i) a cash payment in the amount of $300,000, (ii) and immediate vesting of certain equity awards.
Thatcher Butcher
On April 19, 2022, the Company entered into an employment agreement with Thatcher Butcher (the “Butcher Employment Agreement”), pursuant to which Mr. Butcher serves as “President - KBS Builders, Inc.” Pursuant to the Butcher Employment Agreement, Mr. Butcher can be terminated for “cause,” upon death, upon disability and without “cause.” Under the Butcher Employment Agreement, termination for “cause” generally means the termination of Mr. Butcher’s employment by reason of: (A) the willful failure of Mr. Butcher to perform his duties and obligations in any material respect (other than any failure resulting from his disability), (B) intentional acts of dishonesty or willful misconduct by Mr. Butcher with respect to the Company, (C) arrest or conviction of a felony or violation of any law involving dishonesty, disloyalty, moral turpitude, or fraud, or entry of a plea of guilty or nolo contendere to such charge, (D) Mr. Butcher’s commission at any time of any act of fraud, embezzlement or willful misappropriation of material Company property, (E) repeated refusal to perform the reasonable and legal instructions of the board of directors, (F) willful and material breach of his obligations under any material agreement entered into between Mr. Butcher and the Company or any of its affiliates, or willful and material breach of the Company’s polices or procedures which causes material damage to the Company, its business or reputation, provided that for subsections (A), (E), and (F), if the breach reasonably may be cured, Mr. Butcher has been given at least thirty (30) days after his receipt of written notice of such breach from the Company to cure such breach. Termination without “cause” means termination for any reason other than death, disability, for “cause,” or for no reason at all, upon sixty (60) days’ written notice.
The Butcher Employment Agreement provides for termination of Mr. Butcher’s employment upon his election by voluntary resignation or termination for good reason. Termination by voluntary resignation means Mr. Butcher can terminate his employment with the Company at any time and for any reason whatsoever or for no reason at all in his sole discretion upon giving sixty (60) days’ written notice. A termination for good reason means Mr. Butcher can terminate his employment with the Company pursuant to the occurrence of any of the following events: (i) any material diminution in his authority, duties and responsibilities, (ii) any material reduction of his base salary, aggregate incentive compensation opportunities or aggregate benefits, unless such changes are applied to all members of the Company’s leadership team and amount to less than a 10% reduction in total, or (iii) a material breach by the Company of the Butcher Employment Agreement. In addition, either the Company or Mr. Butcher can deliver to the other party a written notice of non-renewal at least sixty (60) days prior to the applicable renewal date of the Butcher Employment Agreement.
In the event Mr. Butcher voluntarily resigns, is terminated for “cause,” is terminated upon death, or is terminated upon disability, he would be entitled to receive: (i) his then current salary accrued up to and including the date of termination or resignation, (ii) unreimbursed expenses, and (iii) any vested payment or accrued benefits under any equity or Company benefit plan (the “Butcher Accrued Obligations”).
In the event Mr. Butcher terminates his employment for good reason, his employment is terminated without “cause,” or his employment is terminated by delivery of a non-renewal notice by the Company, he would be entitled to receive: (i) the Butcher Accrued Obligations (described above), (ii) a target bonus based on the target bonus metrics used to determine actual performance at the end of the fiscal year, but prorated to reflect the number of full months worked during the fiscal year, (iii) salary continuation for a period of six months in accordance with the Company’s then established payroll practices, provided that payments of the consideration in (ii) and (iii) are subject to Mr. Butcher’s execution and delivery of a customary general release (that is no longer subject to revocation under applicable law) of the Company, its parents, subsidiaries and affiliates and each of their respective officers, directors, employees, agents, successors and assigns.
Equity Awards
The equity agreements of our named executive officers provide that, in case of a change of control of the Company, all equity instruments then outstanding but neither assumed nor replaced by the successor entity shall vest immediately upon the change of control event. Further, if an executive’s employment is terminated without cause within twelve (12) months of the change of control, all equity instruments then outstanding, either assumed or replaced, shall become fully vested at the time of termination. As of December 31, 2023, the value of the equity instruments of our named executive officers that would accelerate upon (i) termination without cause within twelve (12) months of a change of control in which stock options and restricted stock units are assumed or replaced by the successor entity, or (ii) a change of control in which the outstanding stock options and restricted stock units are neither assumed or replaced by the successor entity, would be as follows based on the difference between the closing price on the last trading day of the year of $1.05 per share and the exercise price of the respective options, and with regard to restricted stock units, based solely on the closing price on the last trading day of the year of $1.05:
| | | | | | | | | | |
| Name | | | | Stock Award Value as of December 31, 2023 |
| Richard K. Coleman | | | | 74,000 | |
| David J. Noble | | | | 50,000 | |
| Thatcher Butcher | | | | 21,347 | |
| | | | |
COMPENSATION OF DIRECTORS
Annual Retainer
Non-employee members of our board of directors are paid an annual retainer for their service, with additional compensation for being the chairperson of the board, serving on a committee of the board of directors and chairing a committee of the board of directors. Payments are made quarterly.
The compensation paid to the members of our board of directors is indicated in the chart below:
| | | | | | | | |
| 2023 Director Compensation |
Director Annual Retainer (all) (1) | $ | 72,000.00 | |
| Additional Annual Retainer to Executive Chairperson | $ | 100,000.00 | |
| Additional Annual Retainer to Audit Committee Chairperson | $ | 25,000.00 | |
| Additional Annual Retainer to Compensation Committee Chairperson | $ | 15,000.00 | |
| Additional Annual Retainer to Corporate Governance Committee Chairperson | $ | 10,000.00 | |
| Additional Annual Retainer to Audit Committee Member | $ | 5,000.00 | |
| Additional Annual Retainer to Compensation Committee Member | $ | 5,000.00 | |
| Additional Annual Retainer to Corporate Governance Committee Member | $ | 5,000.00 | |
(1)Due to the limitation in the RSUs available for issuance, in August 2022, the Compensation Committee of our board of directors elected to suspend all RSU compensation and to provide compensation to all Directors
(2)In August 2023, the Compensation Committee of our board of directors elected to pay compensation to Directors in both cash and RSUs
For the sake of clarity, in fiscal year ended December 31, 2023, each of the Audit Committee, the Compensation Committee, the Corporate Governance Committee, and the Strategic Advisory Committee chairpersons received a chairperson fee in addition to the retainer fee set forth in the table above.
Equity Compensation
Equity compensation awards, and the amount of such awards, to non-employee members of our board of directors are at the discretion of the Compensation Committee of our board of directors. Historically, such awards have been in the form of RSUs and the Compensation Committee generally set the amount of those awards at a fair market value equal to the annual cash retainer received by non-employee members of our board of directors (the “Retainer Awards”). We believe that equity compensation helps to further align the interests of our directors with those of our stockholders because the value of directors’ share ownership will rise and fall with that of our other stockholders. In March 2021, the Compensation Committee elected to end the separate annual equity awards described above and to instead increase the size of the Retainer Awards to quarterly awards of RSUs having a fair market value (as defined in the 2023 Annual Plan) of $18,000 each. Due to the limitation in the RSUs available for issuance, in August 2022, the Compensation Committee elected to temporarily suspend all RSU compensation and to provide compensation to all Directors in cash. Beginning with the second quarter of 2023, the Compensation Committee determined to begin paying equity compensation awards partially in RSUs and partially in cash.
Director Compensation Table
The following table sets forth summary information concerning compensation paid or accrued for services rendered to us in all capacities to the non-employee members of our board of directors for the fiscal year ended December 31, 2023.
| | | | | | | | | | | | | | | | | | | | | | | | | | |
| | Fees Paid
in Cash
($) | | Stock Awards ($) (1) | | All Other
Compensation
($) | | Total
($) |
| Jeffrey E. Eberwein | | $ | 129,800 | | | $ | 17,200 | | | — | | $ | 147,000 | |
| John Gildea | | 78,300 | | | 8,700 | | | — | | 87,000 | |
| Michael A. Cunnion | | 87,300 | | | 9,700 | | | — | | 97,000 | |
| John W. Sayward | | 91,800 | | | 10,200 | | | — | | 102,000 | |
| Mitchell I. Quain | | 73,800 | | | 8,200 | | | — | | 82,000 | |
____________________
(1)Represents full fair value at grant date of restricted stock units granted to our directors, computed in accordance with FASB ASC Topic 718.
PAY VERSUS PERFORMANCE
Pay Versus Performance
As required by Section 953(a) of the Dodd-Frank Wall Street Reform and Consumer Protection Act, and Item 10.402(v) of Regulation S-K, the following table sets forth information concerning the compensation of our principal executive officer, or “PEO,” and, on an average basis, the compensation of our other named executive officers, or “NEOs,” for each of the fiscal years ending December 31, 2023, 2022 and 2021, as such compensation relates to our financial performance for each such fiscal year.
| | | | | | | | | | | | | | | | | | | | | | | | | | | | | | | | |
| Jeffrey E. Eberwein | Richard K. Coleman, Jr. | | | Value of Initial Fixed $100 Investment(4) Based on: | | | |
| Year | Summary Compensation Table Total for PEO | Compensation Actually Paid to PEO(1)(2) | Summary Compensation Table Total for PEO | Compensation Actually Paid to PEO(1)(2) | Average Summary Compensation Table Total for Non-PEO NEO's(3) | Average Compensation Actually Paid to Non-PEO NEO's(1)(3) | Total Shareholder Return | Peer Group Total Shareholder Return | Net Income (in thousands) | Company - Selected Measure |
| 2023 | $147,000 | — | $661,500 | $587,500 | $441,556 | $405,882 | $105 | * | $25,132 | * |
| 2022 | $179,500 | 36,000 | $485,274 | $385,273 | $282,092 | $282,092 | $85 | * | $(5,252) | * |
| 2021 | $78,000 | — | N/A | N/A | $322,924 | $431,887 | $255 | * | $(2,983) | * |
* Not required for smaller reporting companies
(1) Compensation actually paid is defined in Item 402(v)(2)(iii) of Regulation S-K. The following table details the applicable adjustments that were made to determine compensation actually paid”:
(2) During 2021 through March 31, 2022, our PEO was Jeffrey E. Eberwein, and Richard K. Coleman, Jr. was appointed as Chief Executive Officer and PEO effective as of April 1, 2022.
(3) The non-PEO NEOs in the 2023 reporting year were David J. Noble and Thatcher Butcher. The non-PEO NEOs in the 2022 reporting year were David J. Noble and Martin Shirley. The non-PEO NEOs in the 2021 reporting year were David J. Noble and Matthew G. Molchan.
(4) Total Shareholder Return assumes $100 was invested on December 31, 2020.
Analysis of the Information Presented in the Pay Versus Performance Table
As described in more detail in “Executive Compensation” above, the Company’s executive compensation practices reflect a comprehensive assessment of several compensation components, including actual financial performance of the business. While the Company utilizes several performance measures to align executive compensation with Company performance, all of those measures are not presented in the Pay Versus Performance table. Moreover, the Company generally seeks to incentivize long-term performance and, therefore, does not specifically align the Company’s performance measures with compensation that is actually paid (as computed in accordance with SEC rules) for a particular year. In accordance with SEC rules, the Company is providing the following descriptions of the relationships between information presented in the Pay Versus Performance table. The following charts set forth the relationship between compensation actually paid and the Company’s cumulative TSR and between compensation actually paid and the Company’s net income.
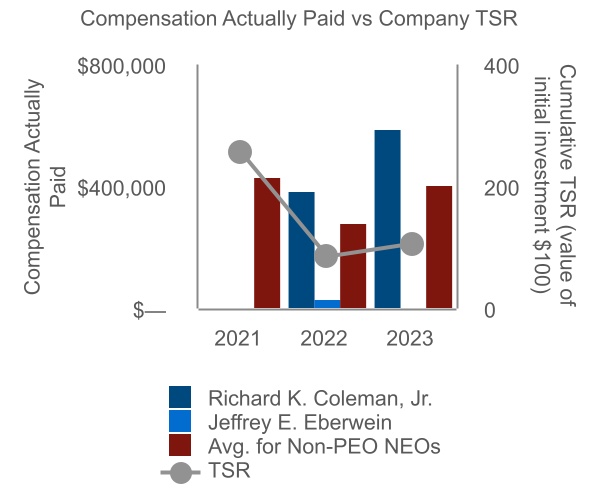
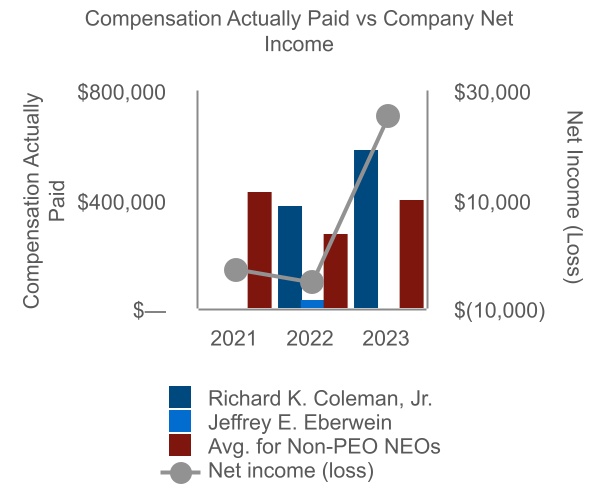
ITEM 12.SECURITY OWNERSHIP OF CERTAIN BENEFICIAL OWNERS AND MANAGEMENT AND RELATED STOCKHOLDER MATTERS
See Item 10.Security Ownership of Certain Beneficial Owners and Management
The following table sets forth information as of March 7, 2024 regarding the beneficial ownership of our common stock by (i) each person we know to be the beneficial owner of 5% or more of our common stock, (ii) each of our current named executive officers, (iii) each of our directors, and (iv) all of our current executive officers and directors as a group. Information with respect to beneficial ownership has been furnished by each director, executive officer or 5% or more stockholder, as the case may be. The address for all executive officers and directors is c/o Star Equity Holdings, Inc., 53 Forest Avenue Suite 101, Old Greenwich, Connecticut 06870.
Percentage of beneficial ownership is calculated based on 15,848,202 shares of common stock outstanding as of March 7, 2024. Beneficial ownership is determined in accordance with the rules of the Securities and Exchange Commission which generally attribute beneficial ownership of securities to persons who possess sole or shared voting power or investment power with respect to those securities and includes shares of our common stock issuable pursuant to the exercise of stock options, warrants or other securities that are immediately exercisable or convertible or exercisable or convertible within 60 days of March 7, 2024. Unless otherwise indicated, the persons or entities identified in this table have sole voting and investment power with respect to all shares shown as beneficially owned by them.
| | | | | | | | | | | | | | |
| Name and Address of Beneficial Owner | | Number of
Shares
Beneficially
Owned | | Percent of
Shares
Beneficially
Owned |
| 5% Stockholders: | | | | |
| None | | | | |
| | | | |
| | | | |
| Named Executive Officers and Directors: | | | | |
Jeffrey E. Eberwein (1) | | 5,137,485 | | 30.40% |
John W. Sayward (2) | | 100,422 | | 0.63% |
Michael A. Cunnion (3) | | 115,120 | | 0.73% |
Mitchell I. Quain (4) | | 272,936 | | 1.72% |
John Gildea (5) | | 177,722 | | 1.12% |
Richard K. Coleman (6) | | 165,400 | | 1.04% |
David J. Noble (7) | | 150,132 | | 0.95% |
Thatcher Butcher (8) | | 6,000 | | 0.04% |
All Executive Officers and Directors as a group (8 persons)(9) | | 6,125,217 | | 35.99% |
____________________
* Indicates beneficial ownership of less than 1% of the outstanding common stock
(1)Includes (a) 4,062,485 shares of common stock held by Mr. Eberwein and (b) 1,075,000 shares of common stock underlying warrants exercisable within 60 days of March 7, 2024.
(2)Includes 100,422 shares of common stock held by Mr. Sayward.
(3)Includes (a) 104,320 shares of common stock held by Mr. Cunnion and (b) 10,800 shares of common stock underlying warrants exercisable within 60 days of March 7, 2024.
(4)Includes 272,936 shares of common stock held by Mr. Quain.
(5)Includes (a) 144,322 shares of common stock held by Mr. Gildea and (b) 33,400 shares underlying warrants exercisable within 60 days of March 7, 2024.
(6)Includes (a) 132,000 shares of common stock held by Mr. Coleman and (b) 33,400 shares underlying warrants exercisable within 60 days of March 7, 2024.
(7)Includes (a) 110,132 shares of common stock held by Mr. Noble and (b) 40,000 shares underlying warrants exercisable within 60 days of March 7, 2024.
(8)Includes 6,000 shares of common stock held by Mr. Butcher.
(9)Includes (a) 6,125,217 shares of common stock held by our 8 executive officers and directors and (b) 1,192,600 shares of common stock underlying the warrants exercisable within 60 days of March 7, 2024.
Securities Authorized for Issuance Under Equity Compensation Plans
| | | | | | | | | | | | | | | | | | | | | | | |
| | Equity Compensation Plan Information |
| | December 31, 2023 |
| | Number of securities to be issued upon exercise of outstanding options, warrants and rights | | Weighted average exercise price of outstanding options, warrants, and rights | | Number of securities remaining available for future issuance under equity compensation plans (excluding shares reflected in column (a)) | |
| Plan Category | | (a) | | (b) (2) | | (c) | |
| Equity compensation plans approved by security holders | | 405,463 | | (1) | $ | 51.20 | | | 690,733 | | (3) |
| Equity compensation plans not approved by security holders | | — | | | — | | | — | | |
| Total | | 405,463 | | | $ | 51.20 | | | 690,733 | | |
____________________
(1)This amount includes the following:
•1,907 shares issuable upon the exercise of outstanding stock options under the Company’s 2004 Stock Incentive 7 Year Plan, the 2004 Stock Incentive Plan, and the 2014 Equity Incentive Award Plan (the “2014 Incentive Plan”), with a weighted-average exercise price of $36.83.
•403,556 RSUs granted under the 2014 Incentive Plan and 2018 Incentive Plan.
(2)The 2014 Incentive Plan and 2018 Incentive Plan RSUs and PSUs have been excluded from the computation of the weighted-average exercise price since these awards have no exercise price.
(3)This amount represents the number of shares available for issuance pursuant to stock options and other awards that could be granted in the future under the 2018 Incentive Plan, as amended July 31, 2020 in order to increase the number of shares authorized for issuance thereunder. The 2018 Incentive Plan allows for issuance of up to the sum of (i) 450,000 shares, plus (ii) the number of shares of common stock of the Company which remain available for grants of options or other awards under the 2014 Incentive Plan as of April 27, 2018, plus (iii) the number of shares that, after April 27, 2018, would again become available for issuance pursuant to the reserved share replenishment provisions of the 2014 Incentive Plan as a result of, stock options issued thereunder expiring or becoming unexercisable for any reason before being exercised in full, or, as a result of restricted stock being forfeited to the Company or repurchased by the Company pursuant to the terms of the agreements governing such shares (the shares described in clauses (ii) and (iii) of this sentence, the “Carryover Shares”). As of December 31, 2023, there were 63,751 Carryover Shares.
ITEM 13.CERTAIN RELATIONSHIPS AND RELATED TRANSACTIONS, AND DIRECTOR INDEPENDENCE
See Item 10.Star Equity Holdings, Inc.
As of December 31, 2023, Jeffrey E. Eberwein, the Company’s Executive Chairman, owned 4,062,485 shares of Common Stock, representing approximately 25.67% of our outstanding Common Stock. In addition, as of December 31, 2023, Mr. Eberwein owned 1,182,414 shares of Series A Preferred Stock.
Director Independence
Our board of directors has determined that each of the directors, except Messrs. Eberwein and Coleman, are independent directors (as currently defined in Rule 5605(a)(2) of the Nasdaq listing rules). In determining the independence of our directors, our board of directors considered all transactions in which the Company and any director had any interest, including those discussed above. The independent directors meet as often as necessary to fulfill their responsibilities, including meeting at least twice annually in executive session without the presence of non-independent directors and management.
The Audit Committee currently consists of Messrs. Gildea, Cunnion, and Sayward, with Mr. Sayward serving as chairman. All members of the Audit Committee are independent directors as defined in Rule 5605(a)(2) of the Nasdaq listing rules and Rule 10A-3 under the Exchange Act, and no member of the Audit Committee participated in the preparation of the financial statements of the Company or any current subsidiary of the Company at any time during the past three years.
The Compensation Committee currently consists of Messrs. Cunnion, Sayward, and Gildea with Mr. Cunnion serving as chairman. All members of the Compensation Committee are independent directors as determined in accordance with the Compensation Committee charter and applicable Nasdaq listing rules (Rule 5605(a)(2) of the Nasdaq listing rules).
The Corporate Governance Committee currently consists of Messrs. Cunnion, Gildea and Quain with Mr. Quain serving as chairman. All members of the Corporate Governance Committee are independent directors (as defined in Rule 5605(a)(2) of the Nasdaq listing rules).
ITEM 14.PRINCIPAL ACCOUNTING FEES AND SERVICES
In connection with the audit of the 20212023 consolidated financial statements, we entered into an engagement agreement with BDO USA, LLPWolf & Company, P.C. (Boston, MA, PCAOB ID #392 (“BDO”Wolf”)) which sets forth the terms by which BDOWolf has performed audit and related professional services for us. The information requiredfollowing tables set forth the aggregate accounting fees paid by this Item 14 is incorporatedus to Wolf for the fiscal years ended December 31, 2023 and 2022.
| | | | | | | | | | | | | | |
| | For the years ended December 31 |
| Type of Fee | | 2023 | | 2022 |
| | (in thousands) |
| Audit Fees | | $ | 548 | | $ | 515 |
| Audit-Related Fees | | — | | 15 |
| | | | |
| | | | |
| Totals | | $ | 548 | | | $ | 530 | |
The below fees were paid to BDO US, LLP (San Diego, CA, PCAOB ID # 243) for the fiscal year ended December 31, 2022.
| | | | | | | | | | | | | | |
| | For the years ended December 31 |
| Type of Fee | | 2023 | | 2022 |
| | (in thousands) |
| Audit Fees | | $ | — | | $ | 315 |
| Audit-Related Fees | | — | | 42 |
| Tax Fees | | — | | 245 |
| | | | |
| Totals | | $ | — | | | $ | 602 | |
No other accounting firm was retained to perform the identified accounting work for us. All non-audit related services in the tables above were pre-approved and/or ratified by reference from the “Audit Matters” section of the 2022 Proxy Statement.Audit Committee.
Audit Committee Pre-Approval of Services by Independent Registered Public Accounting Firm
The Audit Committee is granted the authority and responsibility under its charter to pre-approve all audit and non-audit services provided to the Company by its independent registered public accounting firm, including specific approval of internal control and tax-related services. In exercising this responsibility, the Audit Committee considers whether the provision of each professional accounting service is compatible with maintaining the audit firm’s independence.
Pre-approvals are detailed as to the category or professional service and when appropriate are subject to budgetary limits. Company management and the independent registered public accounting firm periodically report to the Audit Committee regarding the scope and fees for professional services provided under the pre-approval.
With respect to the professional services rendered, the Audit Committee had determined that the rendering of all non-audit services by our independent registered public accounting firm were compatible with maintaining the auditor’s independence and had pre-approved all such services.
PART IV
ITEM 15.EXHIBITS, FINANCIAL STATEMENT SCHEDULES
(a) Documents filed as part of this report:
1.Financial Statements
The financial statements of Star Equity Holdings, Inc. listed below are set forth in Item 8 of this report for the year ended December 31, 2021:2023:
–Report of Independent Registered Public Accounting Firm
–Consolidated Statements of Operations for the Years Ended December 31, 20212023 and 20202022
–Consolidated Balance Sheets at December 31, 20212023 and 20202022
–Consolidated Statements of Cash Flows for the Years Ended December 31, 20212023 and 20202022
–Consolidated Statements of Mezzanine and Stockholders’ Equity for the Years Ended December 31, 20212023 and 20202022
–Notes to Consolidated Financial Statements
2. Financial Statement Schedules
All other schedules are omitted because they are not applicable or the required information is shown in the consolidated financial statements or notes thereto.
3. Exhibits required by Item 601 of Regulation S-K
The information required by this Section (a)(3) of Item 15 is set forth on the exhibit index below.
EXHIBIT INDEX
| | | | | | | | |
Exhibit
Number | | Description |
| | |
| 1.1 | |
| 3.1 | | |
2.1 | | |
| |
2.2 | | |
| | |
2.3 | | |
| | |
2.4 | | |
| | |
2.5 | | |
| | |
2.6 | | |
| | |
3.1 | | |
| | |
| 3.2 | |
|
| | |
| 3.3 | | |
| |
| 3.4 | | |
| | |
| 3.5 | | |
| | |
| 3.6 | | |
| | |
| 3.7 | | |
| | |
| 3.8 | | |
| | |
| 3.9 | | |
| | |
| 3.10 | | |
| | |
| 3.11 | | |
| | |
| 3.12 | | |
| | |
3.63.11 | | |
| | |
3.7 | | |
| | |
3.8 | | |
| | |
| | | | | | | | |
Exhibit
Number | | Description |
3.9 | | |
| | |
3.10 | |
|
| | |
| 4.1 | | |
| | |
| 4.2 | | |
| |
4.3 | | |
| |
4.4 | | |
| | |
4.5 | | |
| | |
4.6 | | |
| | |
4.7 | | |
| | |
4.8 | | |
| | |
4.9 | | |
| | |
4.104.3 | | |
| | Form of Warrant (incorporated by reference to Exhibit 4.2 to the Company’s Current Report on Form 8-K filed with the Commission on May 29, 2020). |
4.114.4 | | |
| | |
4.124.5 | | |
| | |
4.134.6 | | |
| | |
4.144.7 | | |
| | |
4.15 | | |
| | |
| | | | | | | | |
Exhibit
Number | | Description |
4.164.8 | | |
| | |
4.174.9 | | |
| | |
| | | | | | | | |
Exhibit
Number4.10 | | Description |
4.18 | |
|
| | |
| 10.1# | | |
| |
10.2# | | |
| |
10.3# | | |
| |
10.4# | | |
| |
10.5# | | |
| | |
10.6# | | |
| |
10.7# | | |
| | |
10.8# | | |
| | |
10.9# | | |
| | |
10.10# | | |
| | |
10.11# | | |
| | |
10.1210.2# | | |
| | |
| 10.3# | | |
| | |
| 10.4# | | |
| | |
| 10.5# | | |
| | |
| 10.6# | | |
| | |
| 10.7# | | |
| | |
10.1310.8 | | |
| | |
10.1410.9 | | |
| 10.10 | | |
10.15# | | |
| | |
10.16# | | |
| | |
10.17# | | |
| | |
10.18# | | |
| | |
10.19# | | |
| | |
| | | | | | | | |
Exhibit
Number | | Description |
10.20 | | |
| | |
10.21 | | |
| | |
10.22 | | |
| | |
10.23 | | |
| | |
10.24 | | |
| | |
10.2510.11 | | |
| | |
10.2610.12 | | |
| | |
10.2710.13 | | |
| | |
10.2810.14 | | |
| | |
10.29 | | |
| | |
10.30 | | |
| | |
10.31 | | |
| | |
10.32 | | |
| | |
10.33 | | |
| | | | | | | | |
Exhibit
Number | | Description |
| | |
10.34 | | |
| | |
10.3510.15 | | |
| | |
10.36 | | |
| | |
10.37 | | |
| | |
10.38 | | Loan and Security Agreement, dated as of February 23, 2016, by and among Gerber Finance Inc., KBS Builders, Inc., Maine Modular Haulers, Inc., and ATRM Holdings, Inc. (incorporated by reference to Exhibit 10.1 to ATRM Holdings, Inc.’s Quarterly Report on Form 10-Q filed with the Commission on May 16, 2016). |
| | |
10.39 | | |
| | |
| | | | | | | | |
Exhibit
Number | | Description |
10.4010.16 | | |
| | |
10.41 | | |
| | |
10.4210.17 | | |
| | |
10.4310.18 | | |
| | |
10.4410.19 | | |
| | |
10.45 | | |
| | |
10.46 | | |
| | |
10.4710.20 | | |
| | |
10.48 | | |
| | |
10.4910.21 | | |
| | |
| | | | | | | | |
Exhibit
Number10.22 | | Description |
10.50 | | Fifth Agreement of Amendment to Loan and Security Agreement, dated as of April 1, 2019, by and among Gerber Finance Inc., Edgebuilder, Inc., Glenbrook Building Supply Inc., ATRM Holdings, Inc. and KBS Builders, Inc. (incorporated by reference to Exhibit 10.31 to ATRM Holdings, Inc.’s Annual Report on Form 10-K filed with the Commission on April 30, 2019). |
| | |
10.5110.23 | | |
| | |
10.52 | | |
| | |
10.5310.24 | | |
| | |
10.54 | | Loan and Security Agreement, dated January 31, 2020, by and among Star Real Estate Holdings USA, Inc., 300 Park Street, LLC, 947 Waterford Road, LLC, 56 Mechanic Falls Road, LLC, ATRM Holdings, Inc., EdgeBuilder, Inc., Glenbrook Building Supply, Inc., KBS Builders, Inc., Digirad Corporation, and Gerber Finance Inc. (incorporated by reference to Exhibit 10.1 to the Company’s Current Report on Form 8-K filed with the Commission on February 6, 2020). Schedules and exhibits to this Exhibit have been omitted. The Company agrees to furnish a copy of the omitted schedules and exhibits to the Commission on a supplemental basis upon its request. |
| | |
10.5510.25 | | Loan and Security Agreement, dated January 31, 2020, by and among EdgeBuilder, Inc., Glenbrook Building Supply, Inc., Star Real Estate Holdings USA, Inc., 300 Park Street, LLC, 947 Waterford Road, LLC, 56 Mechanic Falls Road, LLC, ATRM Holdings, Inc., KBS Builders, Inc., Digirad Corporation, and Gerber Finance Inc. (incorporated by reference to Exhibit 10.2 to the Company’s Current Report on Form 8-K filed with the Commission on February 6, 2020). Schedules and exhibits to this Exhibit have been omitted. The Company agrees to furnish a copy of the omitted schedules and exhibits to the Commission on a supplemental basis upon its request. |
| | |
10.5610.26 | | |
| | |
10.5710.27 | | |
| | |
10.5810.28 | | First Amendment to Loan and Security Agreement, dated February 20, 2020, by and among Star Real Estate Holdings USA, Inc., 300 Park Street, LLC, 947 Waterford Road, LLC, 56 Mechanic Falls Road, LLC and Gerber Finance Inc (incorporated by reference to Exhibit 10.63 to the Company’s Annual Report on Form 10-K filed with the Commission on March 9, 2020). |
| | |
10.5910.29 | | First Amendment to Loan and Security Agreement Dated January 31, 2020, dated as of March 5, 2020, by and among Gerber Finance Inc., EdgeBuilder, Inc. and Glenbrook Building Supply, Inc.; and Consent and as a Fourteenth Amendment to Loan and Security Agreement Dated February 23, 2016, by and among Gerber Finance Inc., KBS Builders, Inc., ATRM Holdings, Inc. and Digirad Corporation (incorporated by reference to Exhibit 10.64 to the Company’s Annual Report on Form 10-K filed with the Commission on March 9, 2020). |
| | |
10.60 | | |
| | |
10.61 | | |
| | |
10.62 | | |
| | |
10.63 | | |
| | |
| | | | | | | | |
Exhibit
Number | | Description |
10.6410.30 | | Second Amendment to Loan and Security Agreement, dated April 30, 2020, by and among Star Real Estate Holdings USA, Inc., 300 Park Street, LLC, 947 Waterford Road, LLC, 56 Mechanic Falls Road, LLC and Gerber Finance Inc. (incorporated by reference to Exhibit 10.10 to the Company’s Quarterly Report on Form 10-Q filed with the Commission on May 15, 2020). |
| | |
10.6510.31 | | |
| | |
10.6610.32 | | |
| | |
10.67 | | |
| | |
10.68 | | |
| | |
10.69 | | |
| | |
10.70 | | |
| | |
10.7110.33 | | |
| | |
10.72 | | First Amendment to Loan and Security Agreement, Consent and Release, dated February 1, 2021, by and among Digirad Health, Inc., Digirad Imaging Solutions, Inc., MD Office Solutions, DMS Health Technologies, Inc., DMS Imaging, Inc., DMS Health Technologies-Canada, Inc., Project Rendezvous Holding Corporation, Project Rendezvous Acquisition Corporation, Digirad Diagnostic Imaging, Inc., Star Equity Holdings, Inc., and Sterling National Bank, Inc., Star Equity Holdings, Inc., and Sterling National Bank (incorporated by reference to Exhibit 10.72 to the Company’s Annual Report on Form 10-K filed with the Commission on March 29, 2021). |
| | |
10.73 | | Sixteenth Amendment to Loan and Security Agreement, dated January 5, 2021, by and among Gerber Finance Inc., KBS Builders, Inc., ATRM Holdings, Inc., and Star Equity Holdings, Inc. (incorporated(incorporated by reference to Exhibit 10.78 to the Company’s Annual Report on Form 10-K filed with the Commission on March 29, 2021). |
| | |
10.7410.34 | | Seventeenth Amendment to Loan and Security Agreement, dated February 26, 2021, by and among Gerber Finance Inc., KBS Builders, Inc., ATRM Holdings, Inc., and Star Equity Holdings, Inc.(incorporated (incorporated by reference to Exhibit 10.74 to the Company’s Annual Report on Form 10-K filed with the Commission on March 29, 2021). |
| | |
10.7510.35 | | Third Amendment to Loan and Security Agreement, dated January 31, 2020, by and among Gerber Finance Inc., Star Real Estate Holdings USA, Inc., 300 Park Street, LLC, 947 Waterford Road, LLC, and 56 Mechanic Falls Road, LLC. (incorporated (incorporated by reference to Exhibit 10.75 to the Company’s Annual Report on Form 10-K filed with the Commission on March 29, 2021). |
| | |
10.7610.36 | | |
| 10.37 | | |
10.77 | | |
| | |
10.78 | | |
| | |
| | | | | | | | |
Exhibit
Number | | Description |
10.79 | | Second Amendment to Loan and Security Agreement, Consent and Release, dated March 31, 2021, by and among Digirad Health, Inc., Digirad Imaging Solutions, Inc., DMS Health Technologies, Inc., DMS Imaging, Inc., DMS Health Technologies-Canada, Inc., Project Rendezvous Holding Corporation, Project Rendezvous Acquisition Corporation, Digirad Diagnostic Imaging, Inc., Star Equity Holdings, Inc., and Sterling National Bank (incorporated by reference to Exhibit 10.1 to the Company’s Current Report on Form 8-K filed with the Commission on April 1, 2021). |
| | |
10.80 | | |
| | |
10.81 | | Gerber KBS Eighteenth Amendment to Loan and Security Agreement, dated July 30, 2021, by and among Gerber Finance Inc., KBS Builders, Inc., ATRM Holdings, Inc., and Star Equity Holdings, Inc. (incorporated by reference to Exhibit 10.5 to the Company’s Quarterly Report on Form 10-Q filed with the Commission on August 10, 2021). |
| | |
10.8210.38 | | |
| | |
10.83 | | |
| | |
10.84 | | |
| | |
10.8510.39 | | |
| | |
10.8610.40 | | |
| | |
10.8710.41 | | |
| | |
10.88 | | |
| | |
10.89 * | | |
| | |
10.90 *10.42 | | |
| | |
10.91 *10.43 | | |
| | |
| 10.44# | | |
| | |
| 10.45# | | |
| | |
| | | | | | | | |
Exhibit
Number | | Description |
| 10.46 | | |
| | |
| 10.47 | | |
| | |
| 10.48 | | |
| | |
| 10.49 | | |
| | |
| 10.50# | | |
| | |
| 10.51 | | |
| | |
| 10.52 | | |
| | |
| 10.53 | | |
| | |
| 10.54 | | |
| | |
| 10.55 | | Fourth Amendment to Loan and Security Agreement, dated December 31, 2022, by and among Gerber Finance Inc., Star Real Estate Holdings USA, Inc., 300 Park Street, LLC, 947 Waterford Road, LLC, and 56 Mechanic Falls Road, LLC. (incorporated by reference to Exhibit 10.106 to the Company’s Annual Report on Form 10-K filed with the Commission on March 15, 2023). |
| | |
| 10.56 | | |
| | |
| 10.57 | | |
| | |
| 10.58 | | |
| | |
| 10.59* | | |
| | |
| 21.1* | |
|
| |
| 23.1* | | |
| | |
| 24.1* | | |
| |
| 31.1* | | |
| |
| 31.2* | | |
| | |
| 32.1*+ | | |
| | |
| 32.2*+ | | |
| | |
101.INS*97 | | |
| | | | | | | | |
Exhibit
Number | | Description |
| 101.INS* | | Inline XBRL Instance Document |
| 101.SCH* | | Inline XBRL Taxonomy Extension Schema |
| 101.CAL* | | Inline XBRL Taxonomy Extension Calculation Linkbase |
| 101.LAB* | | Inline XBRL Taxonomy Extension Labels Linkbase |
| 101.PRE* | | Inline XBRL Taxonomy Presentation Linkbase |
| 101.DEF* | | Inline XBRL Taxonomy Extension Definition Linkbase |
| 104.1 | | Cover Page Interactive Data File (formatted in Inline XBRL and contained in Exhibit 101). |
| | | | | |
| # | Indicates management contract or compensatory plan. |
| | | | | |
| + | The certifications attached as Exhibits 32.1 and 32.2 that accompany this Annual Report on Form 10-K are not deemed filed with the Securities and Exchange Commission and are not to be incorporated by reference into any filing of Star Equity Holdings, Inc. under the Securities Act of 1933, as amended, or the Securities Exchange Act of 1934, as amended, whether made before or after the date of this Annual Report on Form 10-K, irrespective of any general incorporation language contained in such filings. |
ITEM 16.FORM 10-K SUMMARY
None.
SIGNATURES
Pursuant to the requirements of Section 13 or 15(d) of the Securities Exchange Act of 1934, the registrant has duly caused this report to be signed on its behalf by the undersigned, thereunto duly authorized.
| | | | | | | | | | | | | | |
| | STAR EQUITY HOLDINGS, INC. |
| | |
| Dated: | March 31, 202222, 2024 | By: | | /S/ RICHARD K. COLEMAN, JR. S/ JEFFREY E. EBERWEIN |
| | Name: | | Jeffrey E. EberweinRichard K. Coleman, Jr. |
| | Title: | | Chief Executive Chairman (Principal Executive Officer)
Officer |
Power of Attorney
KNOW ALL PERSONS BY THESE PRESENTS, that each person whose signature appears below constitutes and appoints Jeffrey E. EberweinRichard K. Coleman, Jr. and David J. Noble, and each of them, his true and lawful attorneys-in-fact and agents, with full power of substitution and resubstitution, to sign any and all amendments to this Annual Report on Form 10-K and to file the same, with all exhibits thereto and other documents in connection therewith, with the Securities and Exchange Commission, granting unto each of said attorneys-in-fact and agents, full power and authority to do and perform each and every act and thing requisite and necessary to be done in connection therewith, as fully to all intents and purposes as he or she might or could do in person, hereby ratifying and confirming all that each of said attorneys-in-facts and agents, or his substitute or substitutes, or any of them, shall do or cause to be done by virtue hereof.
Pursuant to the requirements of the Securities Exchange Act of 1934, this report has been signed by the following persons on behalf of the registrant and in the capacities and on the dates indicated:
| | | | | | | | | | | | | | |
| Name | | Title | | Date |
| | | | |
| /S/ JEFFREY E. EBERWEIN | | Executive Chairman of the Board of Directors | | March 31, 202222, 2024 |
| Jeffrey E. Eberwein | | | | |
| /S/ RICHARD K. COLEMAN, JR. | | Chief Executive Officer | | March 22, 2024 |
| Richard K, Coleman, Jr. | | (Principal Executive Officer) | | |
| /S/ DAVID J. NOBLE | | Chief Financial Officer | | March 31, 202222, 2024 |
| David J. Noble | | (Principal Financial and Accounting Officer) | | |
| | | | |
| | | | |
| /S/ MITCHELL I. QUAIN | | Director | | March 31, 202222, 2024 |
| Mitchell I. Quain | | | | |
| /S/ MICHAEL A. CUNNION | | Director | | March 31, 202222, 2024 |
| Michael A. Cunnion | | | | |
| /S/ JOHN W. SAYWARD | | Director | | March 31, 202222, 2024 |
| John W. Sayward | | | | |
| /S/ JOHN W. GILDEA | | Director | | March 31, 202222, 2024 |
| John W. Gildea | | | | |
| | | | |
| | | | |