0000712534 us-gaap:DefinedBenefitPlanEquitySecuritiesCommonStockMember us-gaap:EstimateOfFairValueFairValueDisclosureMember 2018-12-31
UNITED STATES
SECURITIES AND EXCHANGE COMMISSION
Washington, DC 20549
FORM 10-K
[Mark One]
[X]☒ ANNUAL REPORT PURSUANT TO SECTION 13 OR 15(d) OF THE SECURITIES EXCHANGE ACT OF 1934
For the fiscal year ended December 31, 20172019
OR
[ ]☐ TRANSITION REPORT PURSUANT TO SECTION 13 OR 15(d) OF THE SECURITIES EXCHANGE ACT OF 1934
For the transition period from __________to_________
Commission file number 0-17071
FIRST MERCHANTS CORPORATION
(Exact name of registrant as specified in its charter)
|
| |
Indiana | 35-1544218 |
(State or other jurisdiction of
incorporation or organization)
| (I.R.S. Employer Identification No.) |
Indiana35-1544218(State or other jurisdiction of (I.R.S. Employer |
| |
200 East Jackson
Muncie, Indiana
| 47305-2814
|
(Address of principal executive offices) | (Zip Code) |
incorporation or organization) Identification No.)
200 East Jackson Street, Muncie, IN47305-2814
(Address of principal executive offices) (Zip code)
Registrant’s telephone number, including area code: (765)(765)747-1500
Not Applicable
(Former name, former address and former fiscal year,
if changed since last report)
Securities registered pursuant to Section 12(b) of the Act:
|
| | |
| Title of Each Class | Trading Symbol(s) | Name of each exchange on which registered |
| Common Stock, $0.125 stated value per share | The NASDAQ StockFRME | Nasdaq Global Select Market |
Securities registered pursuant to Section 12(g) of the Act:
None
Indicate by check mark if the registrant is a well-known seasoned issuer, as defined in Rule 405 of the Securities Act. Yes [X] ☒ No [ ]☐
Indicate by check mark if the registrant is not required to file reports pursuant to Section 13 or Section 15(d) of the Act. Yes [ ] ☐ No [X] ☒
Indicate by check mark whether the registrant(1) has filed all reports required to be filed by Section 13 or 15(d) of the Securities Exchange Act of 1934 during the preceding 12 months (or for such shorter period that the registrant was required to file such reports), and (2) has been subject to such filing requirements for the past 90 days. Yes [X] ☒ No [ ]☐
Indicate by check mark whether the registrant has submitted electronically and posted on its corporate website, if any, every interactive data file required to be submitted and posted pursuant to Rule 405 of Regulation S-T (§232.405 of this chapter) during the preceding 12 months (or for such shorter period that the registrant was required to submit and post such files) Yes [X] ☒ No [ ]☐
Indicate by check mark if disclosure of delinquent filers pursuant to Item 405 of Regulation S-K is not contained herein, and will not be contained, to the best of registrant’s knowledge, in definitive proxy or information statements incorporated by reference in Part III of this Form 10-K or any amendment to this Form 10-K. [ ]
Indicate by check mark whether the registrant is a large accelerated filer, an accelerated filer, a non-accelerated filer, smaller reporting company, or an emerging growth company. See the definitions of “large accelerated filer,” “accelerated filer,” “smaller reporting company,” and “emerging growth company” in Rule 12b-2 of the Exchange Act.
|
| | | | | |
Large accelerated filer [X]Accelerated Filer | ☒ | Accelerated filer [ ]Filer | Non-accelerated filer [ ] (Do not check if smaller reporting company)
☐ | Non-Accelerated Filer | ☐ |
Smaller reporting company [ ]Reporting Company | ☐ | Emerging growth company [ ]Growth Company | ☐ | | |
If an emerging growth company, indicate by check mark if the registrant has elected not to use the extended transition period for complying with any new or revised financial accounting standards provided pursuant to Section 13(a) of the Exchange Act. [ ]☐
Indicate by check mark whether the registrant is a shell company (as defined in Rule 12b-2 of the Act). Yes [ ] No[X]☐ No☒
The aggregate market value (not necessarily a reliable indication of the price at which more than a limited number of shares would trade) of the voting stock held by non-affiliates of the registrant was $1,732,182,000$1,874,405,000 as of the last business day of the registrant's most recently completed second fiscal quarter (June 30, 2017)2019).
As of February 22, 201821, 2020 there were 49,540,86655,155,733 outstanding common shares, without par value, of the registrant.
DOCUMENTS INCORPORATED BY REFERENCE |
| |
| Documents | Part of Form 10-K into which incorporated |
| Portions of the Registrant’s Definitive | Part III (Items 10 through 14) |
| Proxy Statement for Annual Meeting of | |
Shareholders to be held May 10, 201813, 2020 | |
FIRST MERCHANTS CORPORATION
|
| | | |
| | | | |
| |
| | | | |
| |
| | | | |
| | | |
| | Item 1. | | |
| | Item 1A. | | |
| | Item 1B. | | |
| Item 2. | | |
| | Item 3.2. | | |
| Item 3. | | |
| | Item 4. | | |
| | | | |
| | | | |
| | | |
| | Item 5. | | |
| | Item 6. | | |
| | Item 7. | | |
| | Item 7A. | | |
| Item 8. | | |
| | Item 8. | | |
| Item 9. | | |
| | Item 9A. | | |
| | Item 9B. | | |
| | | | |
| | | |
| | Item 10. | | |
| | Item 11. | | |
| | Item 12. | | |
| | Item 13. | | |
| | Item 14. | | |
| | | | |
| | | |
| | Item 15. | | |
| | Item 16. | | |
| | | | |
GLOSSARY OF DEFINED TERMS
FIRST MERCHANTS CORPORATION
|
| |
| Ameriana | Ameriana Bancorp, Inc., which was acquired by the Corporation on December 31, 2015. |
| Arlington Bank | The Arlington Bank, which was acquired by the Corporation on May 19, 2017 |
| ASC | Accounting Standards Codification |
| AOCI | Accumulated Other Comprehensive Income |
| Bank | First Merchants Bank, a wholly-owned subsidiary of the Corporation |
| BHC Act | Bank Holding Company Act of 1956 |
| CET1 | Common Equity Tier 1 |
| C Financial | C Financial Corporation, which was acquired by the Corporation on April 17, 2015. |
| CFPB | Consumer Financial Protection Bureau |
CFS | CFS Bancorp, Inc., which was acquired by the Corporation on November 12, 2013. |
| CMT | Constant Maturity Treasury |
Community | Community Bancshares, Inc., which was acquired by the Corporation on November 7, 2014. |
| Corporation | First Merchants Corporation |
| Dodd-Frank Act | Dodd-Frank Wall Street Reform and Consumer Protection Act |
| ERISA | Employee Retirement Income Security Act of 1974 |
| ESPP | Employee Stock Purchase Plan |
| FDIC | Federal Deposit Insurance Corporation |
| FDICIA | Federal Deposit Insurance Corporation Improvement Act of 1991 |
| Federal Reserve | Federal Reserve Banking System |
| FHLB | Federal Home Loan Bank |
| FMIG | First Merchants Insurance Services, Inc., an Indiana corporation |
| FTE | Fully taxable equivalent |
| GAAP | Accounting Principles Generally Accepted in the United States of America |
| IAB | Independent Alliance Banks, Inc., which was acquired by the Corporation on July 14, 2017 |
| Indiana DFI | Indiana Department of Financial Institutions |
| MBT | MBT Financial Corp., which was acquired by the Corporation on September 1, 2019 |
| OCC | Office of the Comptroller of the Currency |
| OREO | Other real estate owned |
| OTTI | Other-than-temporary impairment |
| RSA | Restricted Stock Awards |
| Sarbanes-Oxley Act | Sarbanes-Oxley Act of 2002 |
| Savings Plan | The First Merchants Corporation Retirement and Income Savings Plan |
SCB | SCB Bank, of which the Bank assumed substantially all the deposits and certain other liabilities and acquired certain other assets from the FDIC as receiver on February 10, 2012. |
| SEC | Securities and Exchange Commission |
| TCJA | Tax Cuts and Jobs Act, which was enacted by the U.S. Government on December 22, 2017 |
| TEFRA | Tax Equity and Fiscal Responsibility Act. The TEFRA disallowance reduces the amount of interest expense an entity may deduct for the purpose of carrying tax-free investment securities. |
| Treasury | U.S. Department of Treasury |
| USI | USI Insurance Services, LLC |
FORWARD-LOOKING STATEMENTS
The Corporation from time to time includes forward-looking statements in its oral and written communication. The Corporation may include forward-looking statements in filings with the SEC, such as its Annual Reports on Form 10-K and its Quarterly Reports on Form 10-Q, in other written materials and oral statements made by senior management to analysts, investors, representatives of the media and others. The Corporation intends these forward-looking statements to be covered by the safe harbor provisions for forward-looking statements contained in the Private Securities Litigation Reform Act of 1995, and the Corporation is including this statement for purposes of these safe harbor provisions. Forward-looking statements can often be identified by the use of words like “believe”, “continue”, “pattern”, “estimate”, “project”, “intend”, “anticipate”, “expect” and similar expressions or future or conditional verbs such as “will”, “would”, “should”, “could”, “might”, “can”, “may” or similar expressions. These forward-looking statements include:
statements of the Corporation’s goals, intentions and expectations;
statements regarding the Corporation’s business plan and growth strategies;
statements regarding the asset quality of the Corporation’s loan and investment portfolios; and
estimates of the Corporation’s risks and future costs and benefits.
These forward-looking statements are subject to significant risks, assumptions and uncertainties, including, among other things, those discussed in Item 1A, “RISK FACTORS”.
Because of these and other uncertainties, the Corporation’s actual future results may be materially different from the results indicated by these forward-looking statements. In addition, the Corporation’s past results of operations do not necessarily indicate its future results.
PART I
ITEM 1. BUSINESS
GENERAL
The Corporation is a financial holding company headquartered in Muncie, Indiana and was organized in September 1982. The Corporation’s Common Stock is traded on NASDAQ’sthe Nasdaq Global Select Market System under the symbol FRME. The Corporation has one full-service bank charter, First Merchants Bank, which opened for business in Muncie, Indiana, in March 1893. The Bank also operates Lafayette Bank and Trust and First Merchants Private Wealth Advisors (each as a(a division of First Merchants Bank). The Bank includes 119128 banking locations in thirty-onethirty Indiana, two Illinois, two Ohio and two OhioMichigan counties. In addition to its branch network, the Corporation’sCorporation offers comprehensive electronic and mobile delivery channels include ATMs, check cards, remote deposit capture, interactive voice response systems and internet technology.to its customers. The Corporation’s business activities are currently limited to one significant business segment, which is community banking.
Through the Bank, the Corporation offers a broad range of financial services, including accepting time, deposits, savings and demand deposits; making consumer, commercial, agri-business and real estate mortgage loans; renting safe deposit facilities; providing personal and corporate trust services; providingoffering full-service brokerage;brokerage and private wealth management; and providing other corporate services, letters of credit, repurchase agreements and repurchase agreements.other corporate services.
All inter-company transactions are eliminated during the preparation of consolidated financial statements.
As of December 31, 2017,2019, the Corporation had consolidated assets of $9.4$12.5 billion, consolidated deposits of $7.2$9.8 billion and stockholders’ equity of $1.3$1.8 billion. As of December 31, 2017,2019, the Corporation and its subsidiaries had 1,6841,891 full-time equivalent employees.
AVAILABLE INFORMATION
The Corporation makes its Annual Report on Form 10-K, Quarterly Reports on Form 10-Q, Current Reports on Form 8-K and amendments to those reports filed or furnished pursuant to Section 13(a) or 15(d) of the Securities Exchange Act of 1934, as amended, available on its website at https://www.firstmerchants.com without charge, as soon as reasonably practicable, after such reports are electronically filed with, or furnished to, the Securities and Exchange Commission. These documents can also be readThe SEC maintains an internet site that contains reports, proxy and copied atinformation statements, and other information regarding issuers that file electronically with the Securities and Exchange Commission’s Public Reference Room at 100 F Street, NE, Washington, D.C. 20549. Please callSEC, including the Securities and Exchange Commission at 1-800-SEC-0330 for further informationCorporation. Those filings are accessible on the public reference room. SEC filings are also available to the public at the Securities and Exchange Commission’sSEC’s website at http://www.sec.gov. Additionally, the Corporation will also provide without charge, a copy of its Annual Report on Form 10-K to any shareholder by mail. Requests should be sent to Cynthia Holaday, Shareholder Relations, First Merchants Corporation, P.O. Box 792, Muncie, IN 47308-0792.www.sec.gov.
ACQUISITION AND DIVESTITURE POLICY
The Corporation anticipates that it will continue its policy of geographic expansion of its banking business through the acquisition of banks whose operations are consistent with its banking philosophy. Management routinely explores opportunities to acquire financial institutions and other financial services-related businesses and to enter into strategic alliances to expand the scope of its services and its customer base. Future acquisitions and divestitures will be driven by a disciplined financial evaluation process and will be consistent with the Corporation's strategy of community banking, client relationships and consistent quality earnings. As with previous acquisitions, the consideration paid in future acquisitions may be in the form of cash or First Merchants common stock, or a combination thereof. The amount and structure of such consideration is based on reasonable growth, synergies and economies of scale and a thorough analysis of the impact on both long- and short-term financial results.
On September 1, 2019, the Corporation acquired 100 percent of MBT. MBT was headquartered in Monroe, Michigan and had 20 banking centers serving the Monroe market. Pursuant to the merger agreement, each MBT shareholder received 0.275 shares of the Corporation's common stock for each outstanding share of MBT common stock held. The Corporation issued approximately 6.4 million shares of common stock, which was valued at approximately $229.9 million. Details of the MBT acquisition can be found in NOTE 2. ACQUISITION of the Notes to Consolidated Financial Statements included in Item 8 of this Annual Report on Form 10-K.
On November 21, 2016, the Corporation purchased 495,112 shares, or 12.1 percent, of IAB's outstanding common stock from an IAB shareholder for $19.8 million, or $40.00 per share. On July 14, 2017, the Corporation acquired the remaining shares of IAB common stock. IAB was headquartered in Fort Wayne, Indiana and had 16 banking centers serving the Fort Wayne market. Pursuant to the merger agreement, each IAB shareholder received 1.653 shares of the Corporation's common stock for each outstanding share of IAB common stock held. The Corporation issued approximately 6.0 million shares of common stock. The transaction value for the remaining shares of common stock, not owned by the Corporation, was approximately $238.8 million, resulting in a total purchase price of $258.6 million.
On May 19, 2017, the Corporation acquired 100 percent of Arlington Bank. Arlington Bank was headquartered in Columbus, Ohio and had 3 banking centers serving the Columbus, Ohio market. Pursuant to the merger agreement, each Arlington Bank shareholder received 2.7245 shares of the Corporation's common stock for each outstanding share of Arlington Bank common stock held. The Corporation issued approximately 2.1 million shares of common stock, which was valued at approximately $82.6 million.
On December 31, 2015, the Corporation acquired 100 percent of Ameriana. Ameriana was headquartered in New Castle, Indiana and had 13 full service banking centers in east central and central Indiana. Pursuant to the merger agreement, shareholders of Ameriana received .9037 shares of the Corporation's common stock for each share of Ameriana common stock held. The Corporation issued approximately 2.8 million shares of common stock, which was valued at approximately $70.4 million.
On June 12, 2015, the Corporation sold all of its stock in FMIG to USI, a Delaware limited liability company. The sale price was $18.0 million, of which $16.0 million was paid at closing with the remaining $2.0 million paid through a two-year promissory note. The sale of FMIG generated a pre-tax gain on sale of $8.3 million.
On April 17, 2015, the Corporation acquired 100 percent of C Financial. C Financial was headquartered in Columbus, Ohio and had 6 full service banking centers serving the Columbus, Ohio market. Pursuant to the merger agreement, shareholders of C Financial received $6.738 in cash for each share of C Financial stock held, resulting in a total purchase price of $14.5 million.
On November 7, 2014, the Corporation acquired 100 percent of Community. Community was headquartered in Noblesville, Indiana and had 10 full-service banking centers serving central Indiana. Pursuant to the merger agreement, each outstanding share of common stock of Community was converted into the right to receive either (a) 4.0926 shares of the Corporation's common stock, plus cash in lieu of fractional shares; or (b) $85.94 in cash, based upon shareholder elections. The Corporation paid $14.2 million in cash and issued approximately 1.6 million shares of common stock, valued at approximately $35.0 million, for a total purchase price of approximately $49.2 million.
Effective November 12, 2013, the Corporation acquired 100 percent of CFS in an all stock transaction. CFS was headquartered in Munster, Indiana and had 20 banking centers in northwestern Indiana and northeastern Illinois. Pursuant to the merger agreement, the shareholders of CFS received 0.65 percent of a share of the Corporation's common stock for each share of CFS common stock held. The Corporation issued approximately 7.1 million shares of common stock, which was valued at approximately $135.6 million.
Details of the 2017 acquisitions can be found in NOTE 2. ACQUISITIONS of the Notes to Consolidated Financial Statements included in Item 8 of this Annual Report on Form 10-K.
COMPETITION
The Bank is located in Indiana, Ohio, Michigan and Illinois counties where other financial services companies provide similar banking services. In addition to the competition provided by the lending and deposit gathering subsidiaries of national manufacturers, retailers, insurance companies and investment brokers, the Bank competes vigorously with other banks, thrift institutions, credit unions and finance companies located within its service areas.
REGULATION AND SUPERVISION OF FIRST MERCHANTS CORPORATION AND SUBSIDIARIES
Bank Holding Company Regulation
The Corporation is registered as a bank holding company and has elected to be a financial holding company. It is subject to the supervision of, and regulation by the Board of Governors of the Federal Reserve under the BHC Act, as amended. Bank holding companies are required to file periodic reports with and are subject to periodic examination by the Federal Reserve. The Federal Reserve has issued regulations under the BHC Act requiring a bank holding company to serve as a source of financial and managerial strength to the Bank. Thus, it is the policy of the Federal Reserve that a bank holding company should stand ready to use its resources to provide adequate capital funds to the Bank during periods of financial stress or adversity. Additionally, under the FDICIA, a bank holding company is required to guarantee the compliance of any subsidiary bank that may become “undercapitalized” (as defined in the FDICIA section of this Form 10-K) with the terms of any capital restoration plan filed by such subsidiary with its appropriate federal banking agency. Under the BHC Act, the Federal Reserve has the authority to require a bank holding company to terminate any activity or relinquish control of a non-bank subsidiary (other than a non-bank subsidiary of a bank) upon the determination that such activity constitutes a serious risk to the financial stability of any bank subsidiary.
The BHC Act requires the Corporation to obtain the prior approval of the Federal Reserve before:
acquiring direct or indirect control or ownership of any voting shares of any bank or bank holding company if, after such acquisition, the bank holding company will directly or indirectly own or control more than 5 percent of the voting shares of the bank or bank holding company;
merging or consolidating with another bank holding company; or
acquiring substantially all of the assets of any bank.
The BHC Act generally prohibits bank holding companies that have not become financial holding companies from (i) engaging in activities other than banking or managing or controlling banks or other permissible subsidiaries, and (ii) acquiring or retaining direct or indirect control of any company engaged in the activities other than those activities determined by the Federal Reserve to be closely related to banking or managing or controlling banks.
Capital Adequacy Guidelines for Bank Holding Companies
In July 2013, the United States banking regulators adopted new capital rules which modified the risk-based capital and leverage capital requirements applicable to bank holding companies and depository institutions. These rules are commonly known as "Basel III". Basel III was effective for the Corporation on January 1, 2015. Basel III addresses the components of capital and other issues affecting the numerator in banking institutions' regulatory capital ratios. Basel III also implements the requirements of Section 939A of the Dodd-Frank Act to remove references to credit ratings from the federal banking agencies' rules. Certain of the Basel III rules came into effect for the Corporation and the Bank on January 1, 2015, and the balance of the rules arewere subject to a phase-in period which will continuecontinued through January 1, 2019.
Basel III introduced a new capital measure CET1. Basel III specifies that Tier 1 capital consists of CET1 and "Additional Tier 1 Capital" instruments meeting specified requirements. CET1 capital consists of common stock instruments that meet the eligibility criteria, retained earnings, accumulated other comprehensive income and CET1 minority interest. Basel III also defines CET1 narrowly by requiring that most adjustments to regulatory capital measures be made to CET1, and not to the other components of capital.
Basel III requires the Corporation to maintain a minimum ratio of CET1 to risk weighted assets, as defined in the regulation. Under Basel III, in order to avoid limitations on capital distributions, including dividends, the Corporation must hold a capital conservation buffer above the adequately capitalized CET1 to risk-weighted assets ratio. The capital conservation buffer is beingwas phased in from zero percent in 2015 to the fully- implemented 2.50 percent byin 2019.
January 1, 2019, Basel III requires banking organizations to maintain:
a minimum ratio of CET1 to risk-weighted assets of a least 4.5 percent, plus when fully phased-in on January 1, 2019, athe 2.5 percent "capitalcapital conservation buffer" (which is added to the 4.5 percent CET1 as that buffer is phased in, effectively resulting in a minimum ratio of CET1 to risk-weighted assets of at least 7.0 percent upon full implementation);percent;
a minimum ratio of Tier 1 capital to risk-weighted assets of at least 6.0 percent, plus when fully phased-in on January 1, 2019, the 2.5 percent capital conservation buffer (which is added to the 6.0 percent Tier 1 capital ratio as that buffer is phased-in, effectively resulting in a minimum Tier 1 capital ratio of 8.5 percent upon full implementation);percent;
a minimum ratio of total capital (Tier 1 plus Tier 2 capital) to risk-weighted assets of at least 8.0 percent, plus when fully phased-in on January 1, 2019, the 2.5 percent capital conservation buffer (which is added to the 8.0 percent total capital ratio as that buffer is phased-in, effectively resulting in a minimum total capital ratio of 10.5 percent upon full implementation);percent; and
a minimum leverage ratio of 4.0 percent, calculated as the ratio of Tier 1 capital to adjusted average consolidated assets.
Basel III also provides for a “countercyclical capital buffer” that is applicable to only certain covered institutions and is not expected to have any current applicability to the Corporation or the Bank.
The aforementioned capital conservation buffer is designed to absorb losses during periods of economic stress. Banking institutions with a ratio of CET1 to risk-weighted assets above the minimum but below the conservation buffer will face limitations on the payment of dividends, common stock repurchases and discretionary cash payments to executive officers based on the amount of the shortfall.
Basel III provides for a number of deductions from and adjustments to CET1. These include, for example, the requirement that mortgage servicing rights, deferred tax assets dependent upon future taxable income and significant investments in non-consolidated financial entities be deducted from CET1 to the extent that any one such category exceeds 10 percent of CET1 or all such categories in the aggregate exceed 15 percent of CET1. Under Basel III, the Corporation and the Bank were given a one-time election (the “Opt-out Election”) to filter out certain AOCI components. The AOCI Opt-out Election was made on the March 31, 2015 Call Report and FR Y-9C for the Bank and the Corporation, respectively.
Implementation of the deductions and other adjustments to CET1 began on January 1, 2015 and will bewere phased-in over a five-year period (20 percent per year). The implementation of the capital conservation buffer began on January 1, 2016 at the 0.625 percent level and will bewas phased-in over a four-year period (increasing by that amount on each subsequent January 1, until it reachesreached 2.5 percent on January 1, 2019).
Basel III permits banks with less than $15 billion in assets to continue to treat trust preferred securities as Tier 1 capital. This treatment is permanently grandfathered as Tier 1 capital even if the Corporation should ever exceed $15 billion in assets due to organic growth. Should the Corporation exceed $15 billion in assets as the result of a merger or acquisition, then the Tier 1 treatment of its outstanding trust preferred securities will be phased out, but those securities will still be treated as Tier 2 capital. Basel III permits banks with less than $250 billion in assets to choose to continue excluding unrealized gains and losses on certain securities holdings for purposes of calculating regulatory capital. The rules limit a banking organization’s capital distributions and certain discretionary bonus payments if the banking organization does not hold a “capital conservation buffer” consisting of a specified amount of CET1 capital in addition to the amount necessary to meet its minimum risk-based capital requirements.
Historically, the regulation and monitoring of a bank and bank holding company's liquidity has been addressed as a supervisory matter, without minimum required formulaic measures. The Basel III liquidity framework requires banks and bank holding companies to measure their liquidity against specific liquidity tests that, although similar in some respects to liquidity measures historically applied by banks and regulators for management and supervisory purposes, is now required by regulation. One test, referred to as the liquidity coverage ratio, is designed to ensure that the banking entity maintains an adequate level of unencumbered high-quality liquid assets equal to the entity’s expected net cash outflow for a 30-day time horizon (or, if greater, 25% of its expected total cash outflow) under an acute liquidity stress scenario. The other test, referred to as the net stable funding ratio ("NSFR"), is designed to promote more medium- and long-term funding of the assets and activities of banking entities over a one-year time horizon. These requirements are expected to incent banking entities to increase their holdings of U.S. Treasury securities and other sovereign debt as a component of assets and increase the use of long-term debt as a funding source. However, the federal banking agencies have not proposed rules implementing the Basel III liquidity framework and have not determined to what extent they will apply to U.S. banks that are not large, internationally active banks.
The following are the Corporation’s regulatory capital ratios as of December 31, 2017:2019:
| | | | Corporation | | Regulatory Minimum Requirement* | Corporation | | Regulatory Minimum Requirement* |
| Total risk-based capital to risk-weighted assets | 13.69 | % | | 8.00 | % | 14.29 | % | | 8.00 | % |
| Tier 1 capital to risk-weighted assets | 11.86 | % | | 6.00 | % | 12.81 | % | | 6.00 | % |
| Common equity tier 1 capital to risk-weighted assets | 11.00 | % | | 4.50 | % | 12.13 | % | | 4.50 | % |
| Tier 1 capital to average assets | 10.43 | % | | 4.00 | % | 10.54 | % | | 4.00 | % |
*Excludes capital conservation buffer.
Bank Regulation
On April 1, 2016,The Bank is subject to the Board of Directorsprimary regulatory oversight, supervision and examination of the Bank adopted final resolutions approving the conversion of the Bank’s banking charter from a national association to an Indiana state-chartered bank. The initial application to convert was filed withFDIC and the Indiana DFI on February 9, 2016. Between the date of initial application and adoption of the final resolutions by the Bank’s Board, the Indiana DFI and the FDIC conducted a joint exam of the Bank and its banking activities. Final regulatory approval of the application was obtained at the meeting of the Members of the Indiana DFI on April 14, 2016. The Bank filed official conversion documents effective April 15, 2016. As a result of the conversion, the Indiana DFI became the Bank’s primary regulator and the FDIC became the Bank’s primary federal regulator. Upon conversion, the Bank’s official name changed from “First Merchants Bank, National Association” to “First Merchants Bank.” The conversion did not affect the Bank’s operations or customers, and Bank customers continue to receive identical protection on deposits through the FDIC’s deposit insurance program.
The Indiana DFI and FDICDFI. These agencies have the authority to issue cease-and-desist orders if they determine that activities of the Bank regularly represent an unsafe and unsound banking practice or a violation of law. Federal law extensively regulates various aspects of the banking business such as reserve requirements, truth-in-lending and truth-in-savings disclosures, equal credit opportunity, fair credit reporting, trading in securities and other aspects of banking operations. Current federal law also requires banks, among other things, to make deposited funds available within specified time periods.
Requirements for Bank Holding Companies with $10 Billion or More in Assets
VariousThe Consumer Financial Protection Bureau (“CFPB”), an independent federal banking laws and regulations, including rules adopted by the Federal Reserve pursuant to the requirements ofagency created under the Dodd-Frank Act, impose heightened requirements on certain largewas granted broad rulemaking, supervisory and enforcement powers under various federal consumer financial protection laws, primarily with authority over banks and bank holding companies. Mosttheir affiliates with assets of these rules apply primarily to bank holding companies with at least $50 billion in total consolidated assets, but certain rules also apply to banks and bank holding companies with at leastmore than $10 billion in total consolidated assets. Followingbillion. The quarter ended December 31, 2019 is the fourth consecutive quarter (and any applicable phase-in period) where the Corporation’s or the Bank’s total consolidated assets, as applicable, equal or exceed $10 billion, the Corporation orthat the Bank will have reported assets exceeding $10 billion. As a result, effective as applicable,of the beginning of the second quarter of 2020, the Bank and its affiliates will among other requirements:
be requiredbecome subject to perform annual stress tests as described below in “ - Stress Testing;”
calculate our FDIC deposit assessment base using the performance scoreCFPB supervisory and a loss-severity score system described below in “ - Deposit Insurance;”enforcement authority. See “- Dodd-Frank Wall Street Reform and
be examined for compliance with federal consumer protection laws primarily by the Consumer Protection Act” and “- Consumer Financial Protection Bureau as describedProtection” below in “ - Consumer Financial Protection.”for additional information.
While neither the Corporation nor the Bank currently has $10 billion or more in total consolidated assets, we have begun analyzing these rules to ensure we are prepared to comply with the rules when and if they become applicable. In particular, we run periodic and selective stress tests on liquidity, interest rates and the loan portfolio as part
Bank Capital Requirements
Capital adequacy is an important indicator of financial stability and performance. The Corporation and the Bank are subject to various regulatory capital requirements administered by the federal banking agencies and are assigned to a capital category. The assigned capital category is largely determined by four ratios that are calculated according to the regulations: total risk-based capital, tier 1 risk-based capital, common equity tier 1 capital, and tier 1 leverage ratios. The ratios are intended to measure capital relative to assets and credit risk associated with those assets and off-balance sheet exposures of the entity. The capital category assigned to an entity can also be affected by qualitative judgments made by regulatory agencies about the risk inherent in the entity's activities that are not part of the calculated ratios.
There are five capital categories defined in the regulations, ranging from well capitalized to critically undercapitalized. Classification of a bank in any of the undercapitalized categories can result in actions by regulators that could have a material effect on a bank's operations. Quantitative measures established by regulation to ensure capital adequacy require the Bank to maintain minimum amounts and ratios of total and tier 1 capital to risk-weighted assets, and of tier 1 capital to average assets, or leverage ratio, all of which are calculated as defined in the regulations. Banks with lower capital levels are deemed to be undercapitalized, significantly undercapitalized or critically undercapitalized, depending on their actual levels. The appropriate federal regulatory agency may also downgrade a bank to the next lower capital category upon a determination that the bank is in an unsafe or unsound practice. Banks are required to monitor closely their capital levels and to notify their appropriate regulatory agency of any basis for a change in capital category.
Basel III was effective for the Bank on January 1, 2015. Basel III requires the Bank to maintain minimum amounts and ratio of common equity tier 1 capital to risk weighted assets, as defined in the regulation. Under Basel III, the Bank elected to opt-out of including accumulated other comprehensive income in regulatory capital. As of December 31, 2017,2019, the Bank met all capital adequacy requirements to be considered well capitalized.
FDIC Improvement Act of 1991
The FDICIA requires, among other things, federal bank regulatory authorities to take “prompt corrective action” with respect to banks, which do not meet minimum capital requirements. For these purposes, FDICIA establishes five capital tiers: well capitalized, adequately capitalized, undercapitalized, significantly undercapitalized and critically undercapitalized. The FDIC has adopted regulations to implement the prompt corrective action provisions of FDICIA.
Basel III revised the "prompt corrective action" regulations by:
introducing CET1 ratio requirement at each level (other than critically undercapitalized), with the required CET1 ratio being 6.5 percent for well-capitalized status;
increasing the minimum Tier 1 capital ratio requirement for each category, with the minimum Tier 1 risk-based capital ratio for well-capitalized status being 8.0 percent; and
eliminating a provision that provides that a bank with a composite supervisory rating of 1 may have a 3.0 percent leverage ratio and still be well-capitalized.
The FDICIA generally prohibits a depository institution from making any capital distributions (including payment of a dividend) or paying any management fee to its parent holding company if the depository institution would thereafter be “undercapitalized.” “Undercapitalized” banks are subject to growth limitations and are required to submit a capital restoration plan. A bank’s compliance with such plan is required to be guaranteed by the bank’s parent holding company. If an “undercapitalized” bank fails to submit an acceptable plan, it is treated as if it is significantly undercapitalized. “Significantly undercapitalized” banks are subject to various requirements and restrictions, including an order by the FDIC to sell sufficient voting stock to become "adequately capitalized", requirements to reduce total assets and cease receipt of deposits from correspondent banks, and restrictions on compensation of executive officers. “Critically undercapitalized” institutions may not, beginning 60 days after becoming “critically undercapitalized,” make any payment of principal or interest on certain subordinated debt, extend credit for a highly leveraged transaction, or enter into any transaction outside the ordinary course of business. In addition, “critically undercapitalized” institutions are subject to appointment of a receiver or conservator.
As of December 31, 2017,2019, the Bank was “well capitalized” based on the “prompt corrective action” ratios described above. It should be noted that a bank’s capital category is determined solely for the purpose of applying the FDIC’s “prompt corrective action” regulations and that the capital category may not constitute an accurate representation of the bank’s overall financial condition or prospects.
Dodd-Frank Wall Street Reform and Consumer Protection Act
On July 21, 2010, President Obama signed the Dodd-Frank Act was signed into law. The Dodd-Frank Act has had a broad impact on the financial services industry, including significant regulatory and compliance changes. Although most of the required regulations of the Dodd-Frank Act have been promulgated and implemented (or are being implemented over time), there are additional regulations yet to be finalized by the authorized federal agencies. The changes resulting from the Dodd-Frank Act have impacted the profitability of the Corporation’s business activities, required changes to certain business practices, and imposed more stringent capital, liquidity and leverage requirements, and, when fully implemented, may further adversely affect our business. Among other things, the Dodd-Frank Act has resulted, and in the future will likely result, in:
increases to the cost of the Corporation’s operations due to greater regulatory oversight, supervision and examination of banks and bank holding companies, including higher deposit insurance premiums;
limitations on the Corporation’s ability to raise additional capital through the use of trust preferred securities, as new issuances of these securities may no longer be included as Tier 1 capital;
reduced flexibility for the Corporation to generate or originate certain revenue-producing assets based on increased regulatory capital standards; and
limitations on the Corporation’s ability to expand consumer product and service offerings due to stricter consumer protection laws and regulations.
as the Corporation's assets exceed $10 billion, compliance with the Durbin Amendment will result in a material reduction of interchange fee income paid by merchants when debit cards are used as payment.
The Economic Growth, Regulatory Relief, and Consumer Protection Act (the “Economic Growth Act”), which was enacted in May 2018, repealed or modified several provisions of the Dodd-Frank Act. In particular, the asset threshold at which banks are subject to annual company-run stress tests were increased from $10 billion to $250 billion under the Economic Growth Act. As a result, the Corporation and the Bank will not be subject to the Dodd-Frank Act stress testing requirements.
The Corporation’s management continues to take the steps necessary to minimize the adverse impact of the Dodd-Frank Act on its business, financial condition and results of operation.
Volcker Rule
In December 2013, United States banking regulators adopted final rules implementing the Volcker Rule under the Dodd-Frank Act. The Volcker Rule places certain limitations on the trading activity of insured depository institutions and their affiliates subject to certain exceptions. The restricted trading activity includes purchasing or selling certain types of securities or instruments in order to benefit from short-term price movements or to realize short-term profits. Exceptions to the Volcker Rule include trading in certain U.S. Government or other municipal securities and trading conducted (i) in certain capacities as a broker or other agent, or as a fiduciary on behalf of customers, (ii) to satisfy a debt previously contracted, (iii) pursuant to repurchase and securities lending agreements, and (iv) in risk-mitigating hedging activities. The Volcker Rule also prohibits banking institutions from having an ownership interest in a hedge fund or private equity fund.
A banking entity that engages in proprietary trading (which excludes the exceptions discussed above) or covered fund-related activities or investments, and has total consolidated assets of more than $10 billion as reported on December 31 of the previousfor two calendar years, must implement and maintain a compliance program that meets certain minimum requirements and must also maintain certain documentation with respect to covered fund activities, in each case, as described in the Volcker Rule. The implementation ofWhile the Corporation’s total consolidated assets first exceeded $10 billion during the quarter ended March 31, 2019, the Volcker Rule has not had, and is not expected to have, a material impact on the Corporation or the Bank.
Deposit Insurance
The Bank’s deposit accounts are currently insured by the Deposit Insurance Fund of the FDIC. The insurance benefit generally covers up to a maximum of $250,000 per separately insured depositor. As an FDIC-insured bank, our bank subsidiary is subject to deposit insurance premiums and assessments to maintain the Deposit Insurance Fund. The Bank’s deposit insurance premium assessment rate depends on the asset and supervisory categories to which it is assigned. The FDIC has authority to raise or lower assessment rates on insured banks in order to achieve statutorily required reserve ratios in the Deposit Insurance Fund and to impose special additional assessments.
Under the current system, depositDeposit insurance assessments are based on average consolidated total assets minus average tangible equity. The FDIC assignsUnder the FDIC's risk-based assessment system, insured institutions with a banking institution to one of two categories based on asset size. As an institution with underleast $10 billion in assets, such as the Bank, falls into the “Established Small Institution” category. This category has three sub-categories based on supervisory ratings designed to measure risk (the FDIC’s “CAMELS Composite” ratings). The assessment rate, which ranges from 1.5 to 30.0 basis points (such basis points representing a per annum rate) for Established Small Institutions, is determined based upon each applicable institution’s most recent supervisory and capital evaluations.
In addition, each FDIC insured institution is required to pay to the FDIC an assessmentare assessed on the institution’s total assets less tangible capital in orderbasis of a scoring system that combine the institution's regulatory ratings and certain financial measures. The scoring system assesses risk measures to fund interest payments on bonds issued by the Financing Corporation, an agency of the federal government established to recapitalize the predecessor to the Savings Association Insurance Fund. These assessments will continue until the Financing Corporation bonds mature in 2018 and 2019. For the Bank’s December 2017 payment, the bond assessment was equal to a per annum rate of 0.46 basis points.
Following the fourth consecutive quarter (and any applicable phase-in period) where the Bank's total assets equal or exceed $10 billion (thereby being deemed a “Large Institution”), the FDIC will useproduce two scores, a performance score and a loss-severityloss severity score, that will be combined and converted to calculate an initial assessment rate. In calculating these scores, the FDIC uses a bank’s capital level
The performance score measures an institution's financial performance and regulatory supervisory ratings and certain financial measures to assess an institution’sits ability to withstand asset-related stress and funding-related stress. The loss severity score quantifies the relative magnitude of potential losses to the FDIC in the event of an institution's failure. Once the performance and loss severity scores are calculated, these scores will be converted to a total score. An institution with a total score of 30 or less will pay the minimum base assessment rate, and an institution with a total score of 90 or more will pay the maximum initial base assessment rate. For total scores between 30 and 90, initial base assessment rates for Large Institutions range from 1.5 to 40.0 basis points (such basis points representing a per annum rate). Based upon our strategy for expansion through acquisition and our historic organic growth, we expect thatwill rise at an increasing rate as the Bank’s total assets will exceed $10 billion in 2019.score increases.
Stress Testing
As required by the Dodd-Frank Act, the Federal Reserve and the FDIC adopted rules that require bank holding companies and banks with average total consolidated assets greater than $10 billion to conduct an annual company-run stress test of capital, consolidated earnings and losses under one base and at least two stress scenarios provided by the federal bank regulators. Although our assets are currently below this threshold, we have nevertheless commenced a project to ensure that we are able to meet these requirements in a timely fashion. Neither the Corporation nor the Bank is currently subject to the stress testing requirements, but we expect that once we are subject to those requirements, the Federal Reserve, the FDIC and the Indiana DFI will consider our results as an important factor in evaluating the Corporation’s and the Bank’s capital adequacy, in evaluating any proposed acquisitions and in determining whether any proposed dividends or stock repurchases may be an unsafe or unsound practice.
Dividend Limitations
The Corporation's principal source of funds for dividend payments to shareholders is dividends received from the Bank. Banking regulations limit the maximum amount of dividends that a bank may pay without requesting prior approval of regulatory agencies. Under these regulations, the amount of dividends that may be paid in any calendar year is limited to the bank’s retained net income (as defined) for the current year plus those for the previous two years, subject to the capital requirements described above. As of December 31, 2017,2019, the amount available without prior regulatory approval for 20182020 dividends from the Corporation’s subsidiaries (both banking and non-banking) was $154,949,000.$189,371,000.
Brokered Deposits
Under FDIC regulations, no FDIC-insured depository institution can accept brokered deposits unless it (i) is well capitalized, or (ii) is adequately capitalized and received a waiver from the FDIC. In addition, these regulations prohibit any depository institution that is not well capitalized from (a) paying an interest rate on deposits in excess of 75 basis points over certain prevailing market rates or (b) offering “pass through” deposit insurance on certain employee benefit plan accounts unless it provides certain notice to affected depositors.
Consumer Financial Protection
The Bank is subject to a number of federal and state consumer protection laws that govern its relationship with customers. These laws include, but are not limited to:
the Equal Credit Opportunity Act (prohibiting discrimination on the basis of race, religion or other prohibited factors in the extension of credit);
the Fair Credit Reporting Act (governing the provision of consumer information to credit reporting agencies and the use of consumer information);
the Truth-In-Lending Act (governing disclosures of credit terms to consumer borrowers);
the Truth-in-Savings Act (which requires disclosure of deposit terms to consumers);
the Electronic Funds Transfer Act (governing automatic deposits to and withdrawals from deposit accounts and customers’ rights and liabilities arising from the use of automated teller machines and other electronic banking services);
the Fair Debt Collection Act (governing the manner in which consumer debts may be collected by collection agencies);
the Right to Financial Privacy Act (which imposes a duty to maintain the confidentiality of consumer financial records and prescribes procedures for complying with administrative subpoenas of financial records);
the Home Mortgage Disclosure Act and Regulation C, requiring financial institutions to provide certain information about home mortgage and refinanced loans; and
the respective state-law counterparts to the above laws, as applicable, as well as state usury laws and laws regarding unfair and deceptive acts and practices.
Violations of applicable consumer protection laws can result in significant potential liability from litigation brought by customers, including actual damages, restitution and attorneys’ fees. Federal bank regulators, state attorneys general and state and local consumer protection agencies may also seek to enforce consumer protection requirements and obtain these and other remedies, including regulatory sanctions, customer rescission rights, action by the state and local attorneys general in each jurisdiction in which we operate and civil money penalties. Failure to comply with consumer protection requirements may also result in the Corporation’s failure to obtain any required bank regulatory approval for merger or acquisition transactions that it may wish to pursue or prohibition from engaging in such transactions even if approval is not required.
Justice (“DOJ”) to address issues raised relative to the Equal Credit Opportunity Act and the Fair Housing Act within the Indianapolis-Marion County, Indiana market. While the DOJ investigation focused on that market during the period between January 1, 2011 and December 31, 2016, the Bank first physically entered the Indianapolis-Marion County market in February 2016, through a newly-constructed branch. There was no actual finding or adjudication with respect to any matter alleged by the DOJ, and the Bank has not admitted any of the allegations or to any liability. The Order was approved by the United States District Court for the Southern District of Indiana in August 2019.
The Dodd-Frank Act also created the Consumer Financial Protection Bureau (“CFPB”),CFPB, an independent federal agency whichcreated under the Dodd-Frank Act, was granted broad rulemaking, supervisory and enforcement powers under various federal consumer financial protection laws. Although all institutions arelaws, primarily with authority over banks and their affiliates with assets of more than $10 billion. As stated previously, with its assets having recently exceeded $10 billion for four consecutive quarters, the Bank and its affiliates will become subject to rules adopted by the CFPB and examination by the CFPB in conjunction with examinations by the institution’s primary federal regulator, the CFPB has primary examinationsupervisory and enforcement authority over institutions with assets of $10 billion or more. The FDIC has primary responsibility for examinationeffective as of the Bank and enforcement with respect to federal consumer protection laws so long asbeginning of the Bank has total consolidated assetssecond quarter of less than $10 billion.2020.
The consumer protection provisions of the Dodd-Frank Act and the examination, supervision and enforcement of those laws and implementing regulations by the CFPB have created a more complex environment for consumer finance regulation. The CFPB has significant authority to implement and enforce federal consumer finance laws, including the Truth in Lending Act, the Equal Credit Opportunity Act and new requirements for financial services products provided for in the Dodd-Frank Act, as well as the authority to identify and prohibit unfair, deceptive or abusive acts and practices. The review of products and practices to prevent such acts and practices is a continuing focus of the CFPB, and of banking regulators more broadly. The ultimate impact of this heightened scrutiny is uncertain but could result in changes to pricing, practices, products and procedures. It could also result in increased costs related to regulatory oversight, supervision and examination, additional remediation efforts and possible penalties. In addition, the Dodd-Frank Act provides the CFPB with broad supervisory, examination and enforcement authority over various consumer financial products and services, including the ability to require reimbursements and other payments to customers for alleged legal violations and to impose significant penalties, as well as injunctive relief that prohibits lenders from engaging in allegedly unlawful practices. The CFPB also has the authority to obtain cease and desist orders providing for affirmative relief or monetary penalties. The Dodd-Frank Act does not prevent states from adopting stricter consumer protection standards. State regulation of financial products and potential enforcement actions could also adversely affect our business, financial condition or results of operations.
Community Reinvestment Act
The Community Reinvestment Act of 1977 (the “CRA”) requires depository institutions to assist in meeting the credit needs of their market areas consistent with safe and sound banking practice. Under the CRA, each depository institution is required to help meet the credit needs of its market areas by, among other things, providing credit to low- and moderate-income individuals and communities. These factors are also considered in evaluating mergers, acquisitions and applications to open a branch or facility. The applicable federal regulators regularly conduct CRA examinations to assess the performance of financial institutions and assign one of four ratings to the institution’s records of meeting the credit needs of its community. During its last examination, a rating of “satisfactory” was received by the Bank.
Financial Privacy
The federal banking regulators adopted rules that limit the ability of banks and other financial institutions to disclose non-public information about consumers to nonaffiliated third parties. These limitations require disclosure of privacy policies to consumers and, in some circumstances, allow consumers to prevent disclosure of certain personal information to a nonaffiliated third party. These regulations affect how consumer information is transmitted through diversified financial companies and conveyed to outside vendors.
The Bank is also subject to regulatory guidelines establishing standards for safeguarding customer information. These guidelines describe the federal banking agencies’ expectations for the creation, implementation and maintenance of an information security program, which would include administrative, technical and physical safeguards appropriate to the size and complexity of the institution and the nature and scope of its activities. The standards set forth in the guidelines are intended to ensure the security and confidentiality of customer records and information, protect against any anticipated threats or hazards to the security or integrity of such records and protect against unauthorized access to or use of such records or information that could result in substantial harm or inconvenience to any customer.
Anti-Money Laundering and the USA Patriot Act
A major focus of governmental policy on financial institutions in recent years has been aimed at combating money laundering and terrorist financing. The USA Patriot Act of 2001 (the “USA Patriot Act”) substantially broadened the scope of United States anti-money laundering laws and regulations by imposing significant new compliance and due diligence obligations on financial institutions, creating new crimes and penalties and expanding the extra-territorial jurisdiction of the United States.
The Bank Secrecy Act (the “BSA”) requires financial institutions to develop policies, procedures, and practices to prevent and deter money laundering, and mandates that every bank have a written, board-approved program that is reasonably designed to assure and monitor compliance with the BSA. In addition, banks are required to adopt a customer identification program as part of its BSA compliance program, and are required to file Suspicious Activity Reports when they detect certain known or suspected violations of federal law or suspicious transactions related to a money laundering activity or a violation of the BSA. In May 2016, the regulations implementing the BSA were amended to require covered institutions such as theThe Bank is also required to (1) identify and verify, subject to certain exceptions, the identity of the beneficial owners of all legal entity customers at the time a new account is opened, and (2) include, in its anti-money laundering program, risk-based procedures for conducting ongoing customer due diligence, which are to include procedures that: (a) assist in understanding the nature and purpose of customer relationships for the purpose of developing a customer risk profile, and (b) require the covered institutions to conduct ongoing monitoring to identify and report suspicious transactions and, on a risk basis, to maintain and update customer information. The Bank must comply with these amendments and new requirements by May 11, 2018.
Failure of a financial institution to maintain and implement adequate programs to combat money laundering and terrorist financing, or to comply with all of the relevant laws or regulations, could have serious legal and reputational consequences for the institution, including causing applicable bank regulatory authorities not to approve merger or acquisition transactions when regulatory approval is required or to prohibit such transactions even if approval is not required.
Office of Foreign Assets Control Regulation
The United States has imposed economic sanctions that affect transactions with designated foreign countries, nationals and others which are administered by the U.S. Treasury Department Office of Foreign Assets Control. Failure to comply with these sanctions could have serious legal and reputational consequences, including causing applicable bank regulatory authorities not to approve merger or acquisition transactions when regulatory approval is required or to prohibit such transactions even if approval is not required.
The Sarbanes-Oxley Act
The Sarbanes-Oxley Act, which became law on July 30, 2002, added new legal requirements for public companies affecting corporate governance, accounting and corporate reporting. The Sarbanes-Oxley Act provides for, among other things:
a prohibition on personal loans made or arranged by the issuer to its directors and executive officers (except for loans made by a bank subject to Regulation O);
independence requirements for audit committee members;
independence requirements for company auditors;
certification of financial statements on Forms 10-K and 10-Q reports by the chief executive officer and the chief financial officer;
the forfeiture by the chief executive officer and chief financial officer of bonuses or other incentive-based compensation and profits from the sale of an issuer’s securities by such officers in the twelve-month period following initial publication of any financial statements that later require restatement due to corporate misconduct;
disclosure of off-balance sheet transactions;
two-business day filing requirements for insiders filing Form 4s;
disclosure of a code of ethics for financial officers and filing a Form 8-K for a change in or waiver of such code;
the reporting of securities violations “up the ladder” by both in-house and outside attorneys;
restrictions on the use of non-GAAP financial measures in press releases and SEC filings;
the formation of a public accounting oversight board; and
various increased criminal penalties for violations of securities laws.
The SEC was delegated the task of enacting rules to implement various provisions. In addition, each of the national stock exchanges developed new corporate governance rules, including rules strengthening director independence requirements for boards, the adoption of corporate governance codes and charters for the nominating, corporate governance and audit committees.
Additional Matters
The Corporation and the Bank are subject to the Federal Reserve Act, which restricts financial transactions between banks and affiliated companies. The statute limits credit transactions between banks, affiliated companies and its executive officers and its affiliates. The statute prescribes terms and conditions for bank affiliate transactions deemed to be consistent with safe and sound banking practices. It also restricts the types of collateral security permitted in connection with the bank’s extension of credit to an affiliate. Additionally, all transactions with an affiliate must be on terms substantially the same or at least as favorable to the institution as those prevailing at the time for comparable transactions with non-affiliated parties.
The earnings of financial institutions are also affected by general economic conditions and prevailing interest rates, both domestic and foreign, and by the monetary and fiscal policies of the United States Government and its various agencies, particularly the Federal Reserve. The Federal Reserve regulates the supply of credit in order to influence general economic conditions, primarily through open market operations in United States Government obligations, varying the discount rate on financial institution borrowings, varying reserve requirements against financial institution deposits, and restricting certain borrowings by financial institutions and their subsidiaries. The monetary policies of the Federal Reserve have had a significant effect on the operating results of the Bank in the past and are expected to continue to do so in the future.
Additional legislation and administrative actions affecting the banking industry may be considered by the United States Congress, state legislatures and various regulatory agencies, including those referred to above. It cannot be predicted with certainty whether such legislation or administrative action will be enacted or the extent to which the banking industry, the Corporation or the Bank would be affected.
STATISTICAL DATA
The following tables set forth statistical data on the Corporation and its subsidiaries.
DISTRIBUTION OF ASSETS, LIABILITIES AND STOCKHOLDERS’ EQUITY; INTEREST RATES AND INTEREST DIFFERENTIAL
The daily average balance sheet amounts, the related interest income or interest expense, and average rates earned or paid are presented in the following table:
| | | | Average Balance | | Interest
Income /
Expense | | Average
Rate | | Average Balance | | Interest
Income /
Expense | | Average
Rate | | Average Balance | | Interest
Income /
Expense | | Average
Rate | Average Balance | | Interest
Income /
Expense | | Average
Rate | | Average Balance | | Interest
Income /
Expense | | Average
Rate | | Average Balance | | Interest
Income /
Expense | | Average
Rate |
| (Dollars in Thousands) | 2017 | | 2016 | | 2015 | 2019 | | 2018 | | 2017 |
| Assets: | | | | | | | | | | | | | | | | | | | | | | | | | | | | | | | | | | |
| Interest-bearing deposits | $ | 75,417 |
| | $ | 736 |
| | 0.98 | % | | $ | 69,753 |
| | $ | 350 |
| | 0.50 | % | | $ | 61,373 |
| | $ | 160 |
| | 0.26 | % | $ | 211,683 |
| | $ | 4,225 |
| | 2.00 | % | | $ | 110,232 |
| | $ | 2,241 |
| | 2.03 | % | | $ | 75,417 |
| | $ | 736 |
| | 0.98 | % |
| Federal Reserve and Federal Home Loan Bank stock | 20,921 |
| | 894 |
| | 4.27 |
| | 24,268 |
| | 1,098 |
| | 4.52 |
| | 37,495 |
| | 1,967 |
| | 5.25 |
| 25,645 |
| | 1,370 |
| | 5.34 |
| | 24,538 |
| | 1,234 |
| | 5.03 |
| | 20,921 |
| | 894 |
| | 4.27 |
|
Investment Securities: (1) | | | | | | | | | | | | | | | | | | | | | | | | | | | | | | | | | | |
| Taxable | 726,004 |
| | 17,489 |
| | 2.41 |
| | 721,689 |
| | 16,415 |
| | 2.27 |
| | 703,019 |
| | 17,885 |
| | 2.54 |
| 1,101,247 |
| | 27,815 |
| | 2.53 |
| | 841,203 |
| | 21,597 |
| | 2.57 |
| | 726,004 |
| | 17,489 |
| | 2.41 |
|
Tax-exempt (2) | 632,076 |
| | 32,891 |
| | 5.20 |
| | 550,335 |
| | 28,649 |
| | 5.21 |
| | 483,103 |
| | 26,034 |
| | 5.39 |
| 987,006 |
| | 40,070 |
| | 4.06 |
| | 762,623 |
| | 32,290 |
| | 4.23 |
| | 632,076 |
| | 32,891 |
| | 5.20 |
|
| Total investment securities | 1,358,080 |
| | 50,380 |
| | 3.71 |
| | 1,272,024 |
| | 45,064 |
| | 3.54 |
| | 1,186,122 |
| | 43,919 |
| | 3.70 |
| 2,088,253 |
| | 67,885 |
| | 3.25 |
| | 1,603,826 |
| | 53,887 |
| | 3.36 |
| | 1,358,080 |
| | 50,380 |
| | 3.71 |
|
| Loans held for sale | 7,707 |
| | 462 |
| | 5.99 |
| | 4,050 |
| | 372 |
| | 9.19 |
| | 3,725 |
| | 475 |
| | 12.75 |
| 18,402 |
| | 780 |
| | 4.24 |
| | 11,425 |
| | 540 |
| | 4.73 |
| | 7,707 |
| | 462 |
| | 5.99 |
|
Loans: (3) | | | | | | | | | | | | | | | | | | | | | | | | | | | | | | | | | | |
| Commercial | 4,267,651 |
| | 204,771 |
| | 4.80 |
| | 3,541,098 |
| | 162,848 |
| | 4.60 |
| | 3,187,239 |
| | 142,696 |
| | 4.48 |
| 5,631,146 |
| | 306,139 |
| | 5.44 |
| | 5,143,576 |
| | 274,302 |
| | 5.33 |
| | 4,267,651 |
| | 204,771 |
| | 4.80 |
|
| Real estate mortgage | 679,284 |
| | 30,267 |
| | 4.46 |
| | 566,050 |
| | 25,156 |
| | 4.44 |
| | 457,013 |
| | 19,457 |
| | 4.26 |
| 811,188 |
| | 37,782 |
| | 4.66 |
| | 733,709 |
| | 33,549 |
| | 4.57 |
| | 679,284 |
| | 30,267 |
| | 4.46 |
|
| Installment | 573,100 |
| | 28,204 |
| | 4.92 |
| | 485,111 |
| | 21,926 |
| | 4.52 |
| | 406,163 |
| | 18,177 |
| | 4.48 |
| 701,459 |
| | 38,071 |
| | 5.43 |
| | 640,310 |
| | 34,110 |
| | 5.33 |
| | 573,100 |
| | 28,204 |
| | 4.92 |
|
Tax-exempt (2) | 353,542 |
| | 16,452 |
| | 4.65 |
| | 217,696 |
| | 10,039 |
| | 4.61 |
| | 125,699 |
| | 5,322 |
| | 4.23 |
| 527,995 |
| | 22,238 |
| | 4.21 |
| | 468,751 |
| | 18,813 |
| | 4.01 |
| | 353,542 |
| | 16,452 |
| | 4.65 |
|
| Total loans | 5,881,284 |
| | 280,156 |
| | 4.76 |
| | 4,814,005 |
| | 220,341 |
| | 4.58 |
| | 4,179,839 |
| | 186,127 |
| | 4.45 |
| 7,690,190 |
| | 405,010 |
| | 5.27 |
| | 6,997,771 |
| | 361,314 |
| | 5.16 |
| | 5,881,284 |
| | 280,156 |
| | 4.76 |
|
| Total earning assets | 7,335,702 |
| | 332,166 |
| | 4.53 | % | | 6,180,050 |
| | 266,853 |
| | 4.32 | % | | 5,464,829 |
| | 232,173 |
| | 4.25 | % | 10,015,771 |
| | 478,490 |
| | 4.78 | % | | 8,736,367 |
| | 418,676 |
| | 4.79 | % | | 7,335,702 |
| | 332,166 |
| | 4.53 | % |
| Net unrealized gain on securities available for sale | 4,360 |
| | | | | | 9,969 |
| | | | | | 11,800 |
| | | | | |
| Net unrealized gain (loss) on securities available for sale | | 17,676 |
| | | | | | (14,790 | ) | | | | | | 4,360 |
| | | | |
| Allowance for loan losses | (70,380 | ) | | | | | | (62,976 | ) | | | | | | (62,975 | ) | | | | | (81,000 | ) | | | | | | (77,444 | ) | | | | | | (70,380 | ) | | | | |
| Cash and cash equivalents | 142,503 |
| | | | | | 105,443 |
| | | | | | 98,051 |
| | | | | 142,857 |
| | | | | | 131,925 |
| | | | | | 142,503 |
| | | | |
| Premises and equipment | 97,446 |
| | | | | | 96,023 |
| | | | | | 82,710 |
| | | | | 99,343 |
| | | | | | 94,567 |
| | | | | | 97,446 |
| | | | |
| Other assets | 686,598 |
| | | | | | 570,756 |
| | | | | | 491,272 |
| | | | | 896,673 |
| | | | | | 818,432 |
| | | | | | 686,598 |
| | | | |
| Total Assets | $ | 8,196,229 |
| | | | | | $ | 6,899,265 |
| | | | | | $ | 6,085,687 |
| | | | | $ | 11,091,320 |
| | | | | | $ | 9,689,057 |
| | | | | | $ | 8,196,229 |
| | | | |
| Liabilities: | | | | | | | | | | | | | | | | | | | | | | | | | | | | | | | | | | |
| Interest-bearing deposits: | | | | | | | | | | | | | | | | | | | | | | | | | | | | | | | | | | |
| Interest-bearing accounts | $ | 1,730,272 |
| | $ | 5,817 |
| | 0.34 | % | | $ | 1,427,535 |
| | $ | 2,579 |
| | 0.18 | % | | $ | 1,109,829 |
| | $ | 1,374 |
| | 0.12 | % | |
| Interest-bearing deposit accounts | | $ | 3,070,861 |
| | $ | 33,921 |
| | 1.10 | % | | $ | 2,319,081 |
| | $ | 17,577 |
| | 0.76 | % | | $ | 1,730,272 |
| | $ | 5,817 |
| | 0.34 | % |
| Money market deposit accounts | 938,959 |
| | 2,788 |
| | 0.30 |
| | 825,681 |
| | 1,705 |
| | 0.21 |
| | 840,084 |
| | 1,768 |
| | 0.21 |
| 1,300,064 |
| | 14,111 |
| | 1.09 |
| | 1,097,762 |
| | 6,721 |
| | 0.61 |
| | 938,959 |
| | 2,788 |
| | 0.30 |
|
| Savings deposits | 844,825 |
| | 734 |
| | 0.09 |
| | 731,902 |
| | 618 |
| | 0.08 |
| | 614,675 |
| | 672 |
| | 0.11 |
| 1,242,468 |
| | 9,464 |
| | 0.76 |
| | 1,065,031 |
| | 5,230 |
| | 0.49 |
| | 844,825 |
| | 734 |
| | 0.09 |
|
| Certificates and other time deposits | 1,339,866 |
| | 14,467 |
| | 1.08 |
| | 1,151,700 |
| | 11,012 |
| | 0.96 |
| | 1,121,651 |
| | 11,041 |
| | 0.98 |
| 1,673,292 |
| | 34,089 |
| | 2.04 |
| | 1,514,271 |
| | 22,014 |
| | 1.45 |
| | 1,339,866 |
| | 14,467 |
| | 1.08 |
|
| Total interest-bearing deposits | 4,853,922 |
| | 23,806 |
| | 0.49 |
| | 4,136,818 |
| | 15,914 |
| | 0.38 |
| | 3,686,239 |
| | 14,855 |
| | 0.40 |
| 7,286,685 |
| | 91,585 |
| | 1.26 |
| | 5,996,145 |
| | 51,542 |
| | 0.86 |
| | 4,853,922 |
| | 23,806 |
| | 0.49 |
|
| Borrowings | 664,045 |
| | 13,806 |
| | 2.08 |
| | 512,356 |
| | 10,925 |
| | 2.13 |
| | 480,794 |
| | 9,939 |
| | 2.07 |
| 644,729 |
| | 17,160 |
| | 2.66 |
| | 718,061 |
| | 17,545 |
| | 2.44 |
| | 664,045 |
| | 13,806 |
| | 2.08 |
|
| Total interest-bearing liabilities | 5,517,967 |
| | 37,612 |
| | 0.68 |
| | 4,649,174 |
| | 26,839 |
| | 0.58 |
| | 4,167,033 |
| | 24,794 |
| | 0.60 |
| 7,931,414 |
| | 108,745 |
| | 1.37 |
| | 6,714,206 |
| | 69,087 |
| | 1.03 |
| | 5,517,967 |
| | 37,612 |
| | 0.68 |
|
| Noninterest-bearing deposits | 1,514,829 |
| | | | | | 1,301,399 |
| | | | | | 1,120,264 |
| | | | | 1,495,949 |
| | | | | | 1,573,337 |
| | | | | | 1,514,829 |
| | | | |
| Other liabilities | 52,909 |
| | | | | | 64,028 |
| | | | | | 44,666 |
| | | | | 94,342 |
| | | | | | 57,653 |
| | | | | | 52,909 |
| | | | |
| Total Liabilities | 7,085,705 |
| | | | | | 6,014,601 |
| | | | | | 5,331,963 |
| | | | | 9,521,705 |
| | | | | | 8,345,196 |
| | | | | | 7,085,705 |
| | | | |
| Stockholders' Equity | 1,110,524 |
| | | | | | 884,664 |
| | | | | | 753,724 |
| | | | | 1,569,615 |
| | | | | | 1,343,861 |
| | | | | | 1,110,524 |
| | | | |
| Total Liabilities and Stockholders' Equity | $ | 8,196,229 |
| | 37,612 |
| | | | $ | 6,899,265 |
| | 26,839 |
| | | | $ | 6,085,687 |
| | 24,794 |
| | | $ | 11,091,320 |
| | 108,745 |
| | | | $ | 9,689,057 |
| | 69,087 |
| | | | $ | 8,196,229 |
| | 37,612 |
| | |
| Net Interest Income (FTE) | | | $ | 294,554 |
| | | | | | $ | 240,014 |
| | | | | | $ | 207,379 |
| | | | | $ | 369,745 |
| | | | | | $ | 349,589 |
| | | | | | $ | 294,554 |
| | |
Net Interest Spread (FTE) | | | | | 3.85 | % | | | | | | 3.74 | % | | | | | | 3.65 | % | | | | | 3.41 | % | | | | | | 3.76 | % | | | | | | 3.85 | % |
| | | | | | | | | | | | | | | | | | | | | | | | | | | | | | | | | | | |
| Net Interest Margin (FTE): | | | | | | | | | | | | | | | | | | | | | | | | | | | | | | | | | | |
| Interest Income (FTE) / Average Earning Assets | | | | | 4.53 | % | | | | | | 4.32 | % | | | | | | 4.25 | % | | | | | 4.78 | % | | | | | | 4.79 | % | | | | | | 4.53 | % |
| Interest Expense / Average Earning Assets | | | | | 0.51 | % | | | | | | 0.43 | % | | | | | | 0.45 | % | | | | | 1.09 | % | | | | | | 0.79 | % | | | | | | 0.51 | % |
Net Interest Margin (FTE) | | | | | 4.02 | % | | | | | | 3.89 | % | | | | | | 3.80 | % | | | | | 3.69 | % | | | | | | 4.00 | % | | | | | | 4.02 | % |
(1) Average balance of securities is computed based on the average of the historical amortized cost balances without the effects of the fair value adjustment.
(2) Tax-exempt securities and loans are presented on a fully taxable equivalent basis, using a marginal tax rate of 21 percent for both 2019 and 2018, while using 35 percent for 2017, 2016 and 2015.2017. These totals equal $13,085, $10,732 and $17,270, $13,541 and $10,975,respectively.
respectively.
(3) Non-accruing loans have been included in the average balances.
(4) Net Interest Spread (FTE) is interest income expressed as a percentage of average earning assets minus interest expense expressed as a percentage of average interest-bearing liabilities.
(5) Net Interest Margin (FTE) is interest income expressed as a percentage of average earning assets minus interest expense expressed as a percentage of average earning assets.
ANALYSIS OF CHANGES IN NET INTEREST INCOME
The following table presents net interest income components on a tax-equivalent basis and reflects changes between periods attributable to movement in either the average balance or average interest rate for both earning assets and interest-bearing liabilities. The volume differences were computed as the difference in volume between the current and prior year multiplied by the interest rate from the prior year. The interest rate changes were computed as the difference in rate between the current and prior year multiplied by the volume from the prior year. Volume/rate variances have been allocated on the basis of the absolute relationship between volume variances and rate variances.
| | | | 2017 Compared to 2016
Increase (Decrease) Due To |
| 2016 Compared to 2015
Increase (Decrease) Due To |
| 2015 Compared to 2014
Increase (Decrease) Due To | 2019 Compared to 2018
Increase (Decrease) Due To |
| 2018 Compared to 2017
Increase (Decrease) Due To |
| 2017 Compared to 2016
Increase (Decrease) Due To |
| (Dollars in Thousands, Fully Taxable Equivalent Basis) | Volume |
| Rate |
| Total |
| Volume |
| Rate |
| Total |
| Volume |
| Rate |
| Total | Volume |
| Rate |
| Total |
| Volume |
| Rate |
| Total |
| Volume |
| Rate |
| Total |
| Interest Income: | |
| |
| |
| |
| |
| |
| |
| |
| | |
| |
| |
| |
| |
| |
| |
| |
| |
| Interest-bearing deposits | $ | 31 |
|
| $ | 355 |
|
| $ | 386 |
|
| $ | 24 |
|
| $ | 166 |
|
| $ | 190 |
|
| $ | 20 |
|
| $ | 16 |
|
| $ | 36 |
| $ | 2,026 |
|
| $ | (42 | ) |
| $ | 1,984 |
|
| $ | 450 |
|
| $ | 1,055 |
|
| $ | 1,505 |
|
| $ | 31 |
|
| $ | 355 |
|
| $ | 386 |
|
| Federal Reserve and Federal Home Loan Bank stock | (145 | ) |
| (59 | ) |
| (204 | ) |
| (625 | ) |
| (244 | ) |
| (869 | ) |
| (241 | ) |
| 84 |
|
| (157 | ) | 57 |
|
| 79 |
|
| 136 |
|
| 168 |
|
| 172 |
|
| 340 |
|
| (145 | ) |
| (59 | ) |
| (204 | ) |
| Investment securities | 3,133 |
|
| 2,183 |
|
| 5,316 |
|
| 3,095 |
|
| (1,950 | ) |
| 1,145 |
|
| 961 |
|
| 949 |
|
| 1,910 |
| 15,799 |
|
| (1,801 | ) |
| 13,998 |
|
| 8,551 |
|
| (5,044 | ) |
| 3,507 |
|
| 3,133 |
|
| 2,183 |
|
| 5,316 |
|
| Loans held for sale | 252 |
|
| (162 | ) |
| 90 |
|
| 39 |
|
| (142 | ) |
| (103 | ) |
| (274 | ) |
| 264 |
|
| (10 | ) | 301 |
|
| (61 | ) |
| 240 |
|
| 190 |
|
| (112 | ) |
| 78 |
|
| 252 |
|
| (162 | ) |
| 90 |
|
| Loans | 50,333 |
|
| 9,392 |
|
| 59,725 |
|
| 28,858 |
|
| 5,459 |
|
| 34,317 |
|
| 20,315 |
|
| (6,721 | ) |
| 13,594 |
| 35,993 |
|
| 7,463 |
|
| 43,456 |
|
| 56,084 |
|
| 24,996 |
|
| 81,080 |
|
| 50,333 |
|
| 9,392 |
|
| 59,725 |
|
| Totals | 53,604 |
|
| 11,709 |
|
| 65,313 |
|
| 31,391 |
|
| 3,289 |
|
| 34,680 |
|
| 20,781 |
|
| (5,408 | ) |
| 15,373 |
| 54,176 |
|
| 5,638 |
|
| 59,814 |
|
| 65,443 |
|
| 21,067 |
|
| 86,510 |
|
| 53,604 |
|
| 11,709 |
|
| 65,313 |
|
| Interest Expense: | |
| |
| |
| |
| |
| |
| |
| |
| | |
| |
| |
| |
| |
| |
| |
| |
| |
| Interest-bearing NOW accounts | 640 |
|
| 2,598 |
|
| 3,238 |
|
| 463 |
|
| 742 |
|
| 1,205 |
|
| 47 |
|
| 217 |
|
| 264 |
| |
| Interest-bearing deposit accounts | | 6,779 |
|
| 9,565 |
|
| 16,344 |
|
| 2,509 |
|
| 9,251 |
|
| 11,760 |
|
| 640 |
|
| 2,598 |
|
| 3,238 |
|
| Money market deposit accounts | 258 |
|
| 825 |
|
| 1,083 |
|
| (30 | ) |
| (33 | ) |
| (63 | ) |
| 132 |
|
| 64 |
|
| 196 |
| 1,423 |
|
| 5,967 |
|
| 7,390 |
|
| 540 |
|
| 3,393 |
|
| 3,933 |
|
| 258 |
|
| 825 |
|
| 1,083 |
|
| Savings deposits | 98 |
|
| 18 |
|
| 116 |
|
| 115 |
|
| (169 | ) |
| (54 | ) |
| 91 |
|
| (38 | ) |
| 53 |
| 983 |
|
| 3,251 |
|
| 4,234 |
|
| 239 |
|
| 4,257 |
|
| 4,496 |
|
| 98 |
|
| 18 |
|
| 116 |
|
| Certificates and other time deposits | 1,929 |
|
| 1,526 |
|
| 3,455 |
|
| 292 |
|
| (321 | ) |
| (29 | ) |
| 672 |
|
| 1,992 |
|
| 2,664 |
| 2,504 |
|
| 9,571 |
|
| 12,075 |
|
| 2,061 |
|
| 5,486 |
|
| 7,547 |
|
| 1,929 |
|
| 1,526 |
|
| 3,455 |
|
| Borrowings | 3,160 |
|
| (279 | ) |
| 2,881 |
|
| 666 |
|
| 320 |
|
| 986 |
|
| (234 | ) |
| 9 |
|
| (225 | ) | (1,877 | ) |
| 1,492 |
|
| (385 | ) |
| 1,185 |
|
| 2,554 |
|
| 3,739 |
|
| 3,160 |
|
| (279 | ) |
| 2,881 |
|
| Totals | 6,085 |
|
| 4,688 |
|
| 10,773 |
|
| 1,506 |
|
| 539 |
|
| 2,045 |
|
| 708 |
|
| 2,244 |
|
| 2,952 |
| 9,812 |
|
| 29,846 |
|
| 39,658 |
|
| 6,534 |
|
| 24,941 |
|
| 31,475 |
|
| 6,085 |
|
| 4,688 |
|
| 10,773 |
|
| Change in net interest income (fully taxable equivalent basis) | $ | 47,519 |
|
| $ | 7,021 |
|
| 54,540 |
|
| $ | 29,885 |
|
| $ | 2,750 |
|
| 32,635 |
|
| $ | 20,073 |
|
| $ | (7,652 | ) |
| 12,421 |
| $ | 44,364 |
|
| $ | (24,208 | ) |
| 20,156 |
|
| $ | 58,909 |
|
| $ | (3,874 | ) |
| 55,035 |
|
| $ | 47,519 |
|
| $ | 7,021 |
|
| 54,540 |
|
| Tax equivalent adjustment using marginal rate of 35% for 2017, 2016, and 2015 | |
| |
| (3,729 | ) |
| |
| |
| (2,566 | ) |
| |
| |
| (3,054 | ) | |
| Tax equivalent adjustment using marginal rate of 21% for both 2019 and 2018 and 35% for 2017 | | |
| |
| (2,353 | ) |
| |
| |
| 6,538 |
|
| |
| |
| (3,729 | ) |
| Change in net interest income | |
| |
| $ | 50,811 |
|
| |
| |
| $ | 30,069 |
|
| |
| |
| $ | 9,367 |
| |
| |
| $ | 17,803 |
|
| |
| |
| $ | 61,573 |
|
| |
| |
| $ | 50,811 |
|
INVESTMENT SECURITIES
Management evaluates securities for OTTIother-than-temporary-impairment ("OTTI") at least on a quarterly basis, and more frequently when economic or market conditions warrant such an evaluation. The investment securities portfolio is evaluated for OTTI by segregating the portfolio into two general segments and applying the appropriate OTTI model. Investment securities are generally evaluated for OTTI under ASC 320, Investments – Debt and Equity Securities. However, certain purchased beneficial interests, including certain non-agency government-sponsored mortgage-backed securities, asset-backed securities and collateralized debt obligations are evaluated using the model outlined in ASC 325-10, Investments - Other.
In determining OTTI, under ASC 320, management considers many factors, including: (1) the length of time and the extent to which the fair value has been less than cost, (2) the financial condition and near term prospects of the issuer, (3) whether the market decline was affected by macroeconomic conditions, and (4) whether the Corporation has the intent to sell the debt security or more likely than not, will be required to sell the debt security before its anticipated recovery. The assessment of whether an other-than-temporary decline exists involves a high degree of subjectivity and judgment and is based on the information available to management at a point in time.
When OTTI occurs, the amount of OTTI recognized in the income statement depends on whether the Corporation intends to sell the security or it is more likely than not that the Corporation will be required to sell the security before recovery of its amortized cost basis, less any recognized credit loss. If the intent is to sell, or it is more likely than not that the Corporation will be required to sell the security before recovery of its amortized cost basis, less any recognized credit loss, the OTTI shall be recognized in earnings equal to the entire difference between the investment’s amortized cost basis, less any recognized credit loss, and its fair value at the balance sheet date. If the intent is not to sell the security and it is not more likely than not that the Corporation will be required to sell the security before the recovery of its amortized cost basis less any recognized credit loss, the OTTI has been separated into the amount representing the credit loss and the amount related to all other factors. The amount of the total OTTI related to the credit loss is determined based on the present value of cash flows expected to be collected and is recognized in earnings. The amount of the total OTTI related to other factors is recognized in other comprehensive income, net of applicable income taxes. The previous amortized cost basis less the OTTI recognized in earnings becomes the new amortized cost basis of the investment.
The Corporation’s management has evaluated all securities with unrealized losses for OTTI as of December 31, 20172019 and concluded no OTTI existed in 2017. The evaluations are based on the nature of the securities, the extent and duration of the loss and the intent and ability of the Corporation to hold these securities either to maturity or through the expected recovery period.2019.
In determining the fair value of the investment securities portfolio, the Corporation utilizes a third party for portfolio accounting services, including market value input, for those securities classified as Level I and Level II in the fair value hierarchy. The Corporation has obtained an understanding of what inputs are being used by the vendor in pricing the portfolio and how the vendor classified these securities based upon these inputs. From these discussions, the Corporation’s management is comfortable that the classifications are proper. The Corporation has gained trust in the data for two reasons: (a) independent spot testing of the data is conducted by the Corporation through obtaining market quotes from various brokers on a periodic basis; and (b) actual gains or loss resulting from the sale of certain securities has proven the data to be accurate over time. Fair value of securities classified as Level 3 in the valuation hierarchy were determined using a discounted cash flow model that incorporated market estimates of interest rates and volatility in markets that have not been active.
The amortized cost, gross unrealized gains, gross unrealized losses and approximate market value of the investment securities at the dates indicated were:
| | | | Amortized Cost | | Gross Unrealized Gains | | Gross Unrealized Losses | | Fair Value | Amortized Cost | | Gross Unrealized Gains | | Gross Unrealized Losses | | Fair Value |
| Available for sale at December 31, 2017 | | | | | | | | |
| Available for sale at December 31, 2019 | | | | | | | | |
| U.S. Government-sponsored agency securities | | $ | 38,529 |
| | $ | 346 |
| | $ | — |
| | $ | 38,875 |
|
| State and municipal | $ | 510,852 |
| | $ | 16,932 |
| | $ | 1,091 |
| | $ | 526,693 |
| 859,511 |
| | 41,092 |
| | 807 |
| | 899,796 |
|
| U.S. Government-sponsored mortgage-backed securities | 473,325 |
| | 964 |
| | 3,423 |
| | 470,866 |
| 842,349 |
| | 10,378 |
| | 1,404 |
| | 851,323 |
|
| Corporate obligations | 31 |
| |
| |
|
| | 31 |
| 31 |
| | — |
| | — |
| | 31 |
|
| Equity securities | 2,357 |
| |
| |
| | 2,357 |
| |
| Total available for sale | 986,565 |
| | 17,896 |
| | 4,514 |
| | 999,947 |
| 1,740,420 |
| | 51,816 |
| | 2,211 |
| | 1,790,025 |
|
| Held to maturity at December 31, 2017 | | | | | | | | |
| Held to maturity at December 31, 2019 | | | | | | | | |
| U.S. Government-sponsored agency securities | 22,618 |
| |
|
| | 435 |
| | 22,183 |
| 15,619 |
| | 1 |
| | 37 |
| | 15,583 |
|
| State and municipal | 235,594 |
| | 6,295 |
| | 244 |
| | 241,645 |
| 354,115 |
| | 15,151 |
| | 107 |
| | 369,159 |
|
| U.S. Government-sponsored mortgage-backed securities | 301,443 |
| | 3,341 |
| | 1,404 |
| | 303,380 |
| 434,804 |
| | 6,921 |
| | 401 |
| | 441,324 |
|
| Foreign Investment | 1,000 |
| | | | | | 1,000 |
| |
| Foreign investment | | 1,500 |
|
| — |
|
| — |
|
| 1,500 |
|
| Total held to maturity | 560,655 |
| | 9,636 |
| | 2,083 |
| | 568,208 |
| 806,038 |
| | 22,073 |
| | 545 |
| | 827,566 |
|
| Total Investment Securities | $ | 1,547,220 |
| | $ | 27,532 |
| | $ | 6,597 |
| | $ | 1,568,155 |
| $ | 2,546,458 |
| | $ | 73,889 |
| | $ | 2,756 |
| | $ | 2,617,591 |
|
| | | | Amortized Cost | | Gross Unrealized Gains | | Gross Unrealized Losses | | Fair Value | Amortized Cost | | Gross Unrealized Gains | | Gross Unrealized Losses | | Fair Value |
| Available for sale at December 31, 2016 | | | | | | | | |
| Available for sale at December 31, 2018 | | | | | | | | |
| U.S. Government-sponsored agency securities | $ | 100 |
| |
|
| |
| | $ | 100 |
| $ | 13,493 |
|
| $ | 92 |
|
| $ | 3 |
|
| $ | 13,582 |
|
| State and municipal | 360,779 |
| | $ | 8,443 |
| | $ | 5,564 |
| | 363,658 |
| 605,994 |
|
| 5,995 |
|
| 5,854 |
|
| 606,135 |
|
| U.S. Government-sponsored mortgage-backed securities | 313,459 |
| | 1,904 |
| | 3,071 |
| | 312,292 |
| 530,209 |
|
| 634 |
|
| 8,396 |
|
| 522,447 |
|
| Corporate obligations | 31 |
| | | |
|
| | 31 |
| 31 |
|
| — |
|
| — |
|
| 31 |
|
| Equity securities | 21,820 |
| | | | 1,039 |
| | 20,781 |
| |
| Total available for sale | 696,189 |
| | 10,347 |
| | 9,674 |
| | 696,862 |
| 1,149,727 |
|
| 6,721 |
|
| 14,253 |
|
| 1,142,195 |
|
| Held to maturity at December 31, 2016 | | | | | | | | |
| Held to maturity at December 31, 2018 | |
|
|
|
|
|
| |
| U.S. Government-sponsored agency securities | 22,619 |
| | | | 479 |
| | 22,140 |
| 22,618 |
|
| — |
|
| 545 |
|
| 22,073 |
|
| State and municipal | 224,811 |
| | 3,136 |
| | 1,796 |
| | 226,151 |
| 197,909 |
|
| 2,858 |
|
| 872 |
|
| 199,895 |
|
| U.S. Government-sponsored mortgage-backed securities | 360,213 |
| | 4,956 |
| | 1,527 |
| | 363,642 |
| 268,860 |
|
| 713 |
|
| 3,323 |
|
| 266,250 |
|
| Foreign investment | | 1,000 |
|
| — |
|
| 1 |
|
| 999 |
|
| Total held to maturity | 607,643 |
| | 8,092 |
| | 3,802 |
| | 611,933 |
| 490,387 |
|
| 3,571 |
|
| 4,741 |
|
| 489,217 |
|
| Total Investment Securities | $ | 1,303,832 |
| | $ | 18,439 |
| | $ | 13,476 |
| | $ | 1,308,795 |
| $ | 1,640,114 |
|
| $ | 10,292 |
|
| $ | 18,994 |
|
| $ | 1,631,412 |
|
| | | | Amortized Cost | | Gross Unrealized Gains | | Gross Unrealized Losses | | Fair Value | Amortized Cost | | Gross Unrealized Gains | | Gross Unrealized Losses | | Fair Value |
| Available for sale at December 31, 2015 | | | | | | | | |
| U.S. Government-sponsored agency securities | $ | 100 |
| | $ | 4 |
| |
| | $ | 104 |
| |
| Available for sale at December 31, 2017 | | | | | | | | |
| State and municipal | 291,730 |
| | 14,241 |
| | $ | 60 |
| | 305,911 |
| $ | 510,852 |
| | $ | 16,932 |
| | $ | 1,091 |
| | $ | 526,693 |
|
| U.S. Government-sponsored mortgage-backed securities | 342,550 |
| | 4,234 |
| | 518 |
| | 346,266 |
| 473,325 |
| | 964 |
| | 3,423 |
| | 470,866 |
|
| Corporate obligations | 31 |
| | |
| |
|
| | 31 |
| 31 |
| | — |
|
| — |
| | 31 |
|
| Equity securities | 3,912 |
| | | | | | 3,912 |
| 2,357 |
| | — |
|
| — |
| | 2,357 |
|
| Certificates of deposit | 2,176 |
| | | | | | 2,176 |
| |
| Total available for sale | 640,499 |
| | 18,479 |
| | 578 |
| | 658,400 |
| 986,565 |
| | 17,896 |
| | 4,514 |
| | 999,947 |
|
| Held to maturity at December 31, 2015 | | | | | | | | |
| Held to maturity at December 31, 2017 | | | | | | | | |
| U.S. Government-sponsored agency securities | | 22,618 |
|
| — |
|
| 435 |
|
| 22,183 |
|
| State and municipal | 219,767 |
| | 6,982 |
| | 15 |
| | 226,734 |
| 235,594 |
|
| 6,295 |
|
| 244 |
|
| 241,645 |
|
| U.S. Government-sponsored mortgage-backed securities | 398,832 |
| | 7,601 |
| | 787 |
| | 405,646 |
| 301,443 |
|
| 3,341 |
|
| 1,404 |
|
| 303,380 |
|
| Foreign investment | | 1,000 |
| | — |
| | — |
| | 1,000 |
|
| Total held to maturity | 618,599 |
| | 14,583 |
| | 802 |
| | 632,380 |
| 560,655 |
|
| 9,636 |
|
| 2,083 |
|
| 568,208 |
|
| Total Investment Securities | $ | 1,259,098 |
| | $ | 33,062 |
| | $ | 1,380 |
| | $ | 1,290,780 |
| $ | 1,547,220 |
|
| $ | 27,532 |
|
| $ | 6,597 |
|
| $ | 1,568,155 |
|
The cost and yieldsyield for Federal Reserve and Federal Home Loan Bank stock areis included in the table below.
| | | | 2017 | | 2016 | | 2015 | 2019 | | 2018 | | 2017 |
| (Dollars in Thousands) | Cost | | Yield | | Cost | | Yield | | Cost | | Yield | Cost | | Yield | | Cost | | Yield | | Cost | | Yield |
| Federal Reserve and Federal Home Loan Bank stock at December 31: | | | | | | | | | | | | |
| Federal Reserve Bank stock | | | | | | | | | $ | 19,456 |
| | 6.0 | % | |
| Federal Home Loan Bank stock | $ | 23,825 |
| | 3.8 | % | | $ | 17,964 |
| | 4.3 | % | | 18,177 |
| | 5.3 | % | $ | 28,736 |
| | 4.8 | % | | $ | 24,588 |
| | 5.0 | % | | $ | 23,825 |
| | 3.8 | % |
| Total | $ | 23,825 |
| | 3.8 | % | | $ | 17,964 |
| | 4.3 | % | | $ | 37,633 |
| | 5.7 | % | $ | 28,736 |
| | 4.8 | % | | $ | 24,588 |
| | 5.0 | % | | $ | 23,825 |
| | 3.8 | % |
Federal Home Loan Bank stock has been reviewed for impairment and the analysis reflected no impairment. The Corporation’s Federal Home Loan Bank stock is primarily in the Federal Home Loan Bank of Indianapolis and it continued to produce sufficient financial results to pay dividends. In 2016, the Bank redeemed all Federal Reserve Bank stock as a result of the conversion of the Bank's banking charter from a national association to an Indiana state-chartered bank.
There were no issuers included in the investment security portfolio at December 31, 2017, 20162019, 2018 or 20152017 where the aggregate carrying value of any one issuer exceeded 10 percent of the Corporation's stockholders' equity at those dates. The term "issuer" excludes the U.S. Government and its sponsored agencies and corporations.
The maturity distribution and average yields for the securities portfolio at December 31, 20172019 were:
| | | | Within 1 Year | | 1-5 Years | | 5-10 Years | Within 1 Year | | 1-5 Years | | 5-10 Years |
| (Dollars in Thousands) | Amount | | Yield (1) | | Amount | | Yield (1) | | Amount | | Yield (1) | Amount | | Yield (1) | | Amount | | Yield (1) | | Amount | | Yield (1) |
| Securities available for sale December 31, 2017 | | | | | | | | | | | | |
| Securities available for sale December 31, 2019 | | | | | | | | | | | | |
| U.S. Government-sponsored agency securities | | $ | 375 |
|
| 2.3 | % | | $ | 1,147 |
| | 2.6 | % | | $ | 37,353 |
| | 2.7 | % |
| State and municipal | $ | 425 |
| | 6.3 | % | | $ | 5,204 |
| | 6.2 | % | | $ | 78,806 |
| | 5.3 | % | 761 |
| | 5.4 | % | | 3,994 |
| | 4.9 | % | | 39,567 |
| | 4.2 | % |
| $ | 425 |
| | 6.3 | % | | $ | 5,204 |
| | 6.2 | % | | $ | 78,806 |
| | 5.3 | % | $ | 1,136 |
| | 4.4 | % | | $ | 5,141 |
| | 4.4 | % | | $ | 76,920 |
| | 3.5 | % |
| | | | Due After Ten Years | | Equity and U.S. Government-
Sponsored Mortgage - Backed
Securities | | Total | Due After Ten Years | | U.S. Government-
Sponsored Mortgage - Backed
Securities | | Total |
| | Amount | | Yield (1) | | Amount | | Yield (1) | | Amount | | Yield (1) | Amount | | Yield (1) | | Amount | | Yield (1) | | Amount | | Yield (1) |
| U.S. Government-sponsored agency securities | | $ | — |
| | — | % | | $ | — |
| | — | % | | $ | 38,875 |
| | 2.7 | % |
| State and municipal | $ | 442,258 |
| | 5.0 | % | | | | | | $ | 526,693 |
| | 5.0 | % | 855,474 |
| | 3.9 | % | | — |
| | — | % | | 899,796 |
| | 4.0 | % |
| Equity securities |
| |
| | $ | 2,357 |
| | 2.7 | % | | 2,357 |
| | 2.7 | % | |
| U.S. Government-sponsored mortgage-backed securities | | — |
|
| — | % |
| 851,323 |
|
| 2.7 | % |
| 851,323 |
|
| 2.7 | % |
| Corporate obligations | 31 |
| | — | % | |
| |
| | 31 |
| | — | % | 31 |
|
| — | % |
| — |
|
| — | % |
| 31 |
|
| — | % |
| U.S. Government-sponsored mortgage-backed securities | | | | | 470,866 |
| | 2.7 | % | | 470,866 |
| | 2.7 | % | |
| | $ | 442,289 |
| | 5.0 | % | | $ | 473,223 |
| | 2.7 | % | | $ | 999,947 |
| | 3.9 | % | $ | 855,505 |
| | 3.9 | % | | $ | 851,323 |
| | 2.7 | % | | $ | 1,790,025 |
| | 3.3 | % |
| | | | Within 1 Year | | 1-5 Years | | 5-10 Years | Within 1 Year |
| 1-5 Years |
| 5-10 Years |
| | Amount | | Yield (1) | | Amount | | Yield (1) | | Amount | | Yield (1) | |
| Securities held to maturity at December 31, 2017 | | | | | | | | | | | | |
| (Dollars in Thousands) | | Amount |
| Yield (1) |
| Amount |
| Yield (1) |
| Amount |
| Yield (1) |
| Securities held to maturity at December 31, 2019 | | |
| |
| |
| |
| |
| |
| U.S. Government-sponsored agency securities | | | | | $ | 22,618 |
| | 1.8 | % | |
|
| |
|
| $ | — |
|
| — | % |
| $ | 15,619 |
|
| 1.6 | % |
| $ | — |
|
| — | % |
| State and municipal | $ | 12,015 |
| | 6.0 | % | | 52,528 |
| | 6.3 | % | | $ | 54,441 |
| | 5.4 | % | 9,920 |
|
| 4.9 | % |
| 28,078 |
|
| 4.3 | % |
| 84,153 |
|
| 4.2 | % |
| Foreign Investment |
|
|
|
| 1,000 |
|
| 2.2 | % |
|
|
|
| |
| U.S. Government-sponsored mortgage-backed securities | | — |
|
| — | % |
| — |
|
| — | % |
| — |
|
| — | % |
| Foreign investment | | — |
|
| — | % |
| 1,500 |
|
| 2.9 | % |
| — |
|
| — | % |
| | $ | 12,015 |
| | 6.0 | % | | $ | 76,146 |
| | 4.9 | % | | $ | 54,441 |
| | 5.4 | % | $ | 9,920 |
|
| 4.9 | % |
| $ | 45,197 |
|
| 3.3 | % |
| $ | 84,153 |
|
| 4.2 | % |
| | | | Due After Ten Years | | Equity and U.S. Government-
Sponsored Mortgage - Backed
Securities | | Total | Due After Ten Years | | U.S. Government-
Sponsored Mortgage - Backed
Securities | | Total |
| | Amount | | Yield (1) | | Amount | | Yield (1) | | Amount | | Yield (1) | Amount | | Yield (1) | | Amount | | Yield (1) | | Amount | | Yield (1) |
| U.S. Government-sponsored agency securities | | | | | | | | | $ | 22,618 |
| | 1.8 | % | $ | — |
|
| — | % |
| $ | — |
|
| — | % |
| $ | 15,619 |
|
| 1.6 | % |
| State and municipal | $ | 116,610 |
| | 5.1 | % | | | | | | 235,594 |
| | 5.5 | % | 231,964 |
| | 4.0 | % | | — |
| | — | % | | 354,115 |
| | 4.1 | % |
| Foreign Investment |
|
|
|
|
|
|
|
|
|
| 1,000 |
|
| 2.2 | % | |
| U.S. Government-sponsored mortgage-backed securities | | |
| | $ | 301,443 |
| | 2.8 | % | | 301,443 |
| | 2.8 | % | — |
|
| — | % |
| 434,804 |
|
| 2.8 | % |
| 434,804 |
|
| 2.8 | % |
| Foreign investment | | — |
|
| — | % |
| — |
|
| — | % |
| 1,500 |
|
| 2.9 | % |
| | $ | 116,610 |
| | 5.1 | % | | $ | 301,443 |
| | 2.8 | % | | $ | 560,655 |
| | 3.9 | % | $ | 231,964 |
| | 4.0 | % | | $ | 434,804 |
| | 2.8 | % | | $ | 806,038 |
| | 3.3 | % |
_______________________________
(1) Interest yields are presented on a fully taxable equivalent basis using a 3521 percent tax rate.
The following tables show the Corporation’s gross unrealized losses and fair value, aggregated by investment category and length of time that individual securities have been in a continuous unrealized loss position, at December 31, 20172019 and 2016:2018:
| | | | Less than 12 Months | | 12 Months or Longer | | Total | Less than 12 Months | | 12 Months or Longer | | Total |
| | Fair
Value | | Gross
Unrealized
Losses | | Fair
Value | | Gross
Unrealized
Losses | | Fair
Value | | Gross
Unrealized
Losses | Fair
Value | | Gross
Unrealized
Losses | | Fair
Value | | Gross
Unrealized
Losses | | Fair
Value | | Gross
Unrealized
Losses |
Temporarily Impaired Available for Sale Securities at December 31, 2017
| | | | | | | | | | | | |
| Temporarily Impaired Available for Sale Securities at December 31, 2019 | | | | | | | | | | | | |
| State and municipal | $ | 13,296 |
| | $ | 198 |
| | $ | 35,324 |
| | $ | 893 |
| | $ | 48,620 |
| | $ | 1,091 |
| $ | 76,273 |
| | $ | 807 |
| | $ | — |
| | $ | — |
| | $ | 76,273 |
| | $ | 807 |
|
| U.S. Government-sponsored mortgage-backed securities | 182,755 |
| | 1,520 |
| | 68,667 |
| | 1,903 |
| | 251,422 |
| | 3,423 |
| 127,673 |
| | 1,326 |
| | 20,796 |
| | 78 |
| | 148,469 |
| | 1,404 |
|
| Total Temporarily Impaired Available for Sale Securities | 196,051 |
| | 1,718 |
| | 103,991 |
| | 2,796 |
| | 300,042 |
| | 4,514 |
| 203,946 |
| | 2,133 |
| | 20,796 |
| | 78 |
| | 224,742 |
| | 2,211 |
|
| Temporarily Impaired Held to Maturity Securities at December 31, 2017 | | | | | | | | | | | | |
| Temporarily Impaired Held to Maturity Securities at December 31, 2019 | | | | | | | | | | | | |
| U.S. Government-sponsored agency securities | 9,988 |
| | 131 |
| | 12,196 |
| | 304 |
| | 22,184 |
| | 435 |
| 3,016 |
| | 4 |
| | 12,467 |
| | 33 |
| | 15,483 |
| | 37 |
|
| State and municipal | 2,430 |
| | 36 |
| | 15,805 |
| | 208 |
| | 18,235 |
| | 244 |
| 22,947 |
| | 107 |
| | — |
| | — |
| | 22,947 |
| | 107 |
|
| U.S. Government-sponsored mortgage-backed securities | 62,508 |
| | 485 |
| | 43,078 |
| | 919 |
| | 105,586 |
| | 1,404 |
| 124,253 |
| | 364 |
| | 7,991 |
| | 37 |
| | 132,244 |
| | 401 |
|
| Total Temporarily Impaired Held to Maturity Securities | 74,926 |
| | 652 |
| | 71,079 |
| | 1,431 |
| | 146,005 |
| | 2,083 |
| 150,216 |
| | 475 |
| | 20,458 |
| | 70 |
| | 170,674 |
| | 545 |
|
| Total Temporarily Impaired Investment Securities | $ | 270,977 |
| | $ | 2,370 |
| | $ | 175,070 |
| | $ | 4,227 |
| | $ | 446,047 |
| | $ | 6,597 |
| $ | 354,162 |
| | $ | 2,608 |
| | $ | 41,254 |
| | $ | 148 |
| | $ | 395,416 |
| | $ | 2,756 |
|
| | | | Less than 12 Months | | 12 Months or Longer | | Total | Less than 12 Months | | 12 Months or Longer | | Total |
| | Fair
Value | | Gross
Unrealized
Losses | | Fair
Value | | Gross
Unrealized
Losses | | Fair
Value | | Gross
Unrealized
Losses | Fair
Value | | Gross
Unrealized
Losses | | Fair
Value | | Gross
Unrealized
Losses | | Fair
Value | | Gross
Unrealized
Losses |
Temporarily Impaired Available for Sale Securities at December 31, 2016
| | | | | | | | | | | | |
| State and municipal | $ | 126,593 |
| | $ | 5,564 |
| |
| |
| | $ | 126,593 |
| | $ | 5,564 |
| |
| U.S. Government-sponsored mortgage-backed securities | 185,544 |
| | 3,071 |
| |
| |
| | 185,544 |
| | 3,071 |
| |
| Equity securities | 18,765 |
| | 1,039 |
| | | | | | 18,765 |
| | 1,039 |
| |
| Total Temporarily Impaired Available for Sale Securities | 330,902 |
| | 9,674 |
| |
| |
| | 330,902 |
| | 9,674 |
| |
| Temporarily Impaired Held to Maturity Securities at December 31, 2016 | | | | | | | | | | | | |
| Temporarily Impaired Available for Sale Securities at December 31, 2018 | | | | | | | | | | | | |
| U.S. Government-sponsored agency securities | 19,121 |
| | 479 |
| | 19,121 |
| | 479 |
| $ | 1,490 |
|
| $ | 3 |
|
| $ | — |
|
| $ | — |
|
| $ | 1,490 |
|
| $ | 3 |
|
| State and municipal | 50,897 |
| | 1,796 |
| |
| |
| | 50,897 |
| | 1,796 |
| 234,431 |
| | 3,958 |
| | 38,028 |
| | 1,896 |
| | 272,459 |
| | 5,854 |
|
| U.S. Government-sponsored mortgage-backed securities | 109,377 |
| | 1,527 |
| |
| |
| | 109,377 |
| | 1,527 |
| 196,601 |
| | 2,400 |
| | 217,121 |
| | 5,996 |
| | 413,722 |
| | 8,396 |
|
| Total Temporarily Impaired Available for Sale Securities | | 432,522 |
| | 6,361 |
| | 255,149 |
| | 7,892 |
| | 687,671 |
| | 14,253 |
|
| Temporarily Impaired Held to Maturity Securities at December 31, 2018 | | | | | | | | | | | | |
| U.S. Government-sponsored agency securities | | — |
| | — |
| | 22,073 |
|
| 545 |
| | 22,073 |
| | 545 |
|
| State and municipal | | 14,952 |
| | 369 |
| | 16,786 |
| | 503 |
| | 31,738 |
| | 872 |
|
| U.S. Government-sponsored mortgage-backed securities | | 102,828 |
| | 876 |
| | 87,268 |
| | 2,447 |
| | 190,096 |
| | 3,323 |
|
| Foreign investment | | — |
|
| — |
|
| 999 |
|
| 1 |
|
| 999 |
|
| 1 |
|
| Total Temporarily Impaired Held to Maturity Securities | 179,395 |
| | 3,802 |
| |
| |
| | 179,395 |
| | 3,802 |
| 117,780 |
| | 1,245 |
| | 127,126 |
| | 3,496 |
| | 244,906 |
| | 4,741 |
|
| Total Temporarily Impaired Investment Securities | $ | 510,297 |
| | $ | 13,476 |
| |
| |
| | $ | 510,297 |
| | $ | 13,476 |
| $ | 550,302 |
| | $ | 7,606 |
| | $ | 382,275 |
| | $ | 11,388 |
| | $ | 932,577 |
| | $ | 18,994 |
|
LOAN PORTFOLIO
The following table shows the composition of the Corporation’s loan portfolioby collateral classification, including purchased credit impaired loans, for the years indicated:
|
| | | | | | | | | | | | | | | | | | | | | | | | | | | | | | | | | | |
| | 2017 |
| 2016 |
| 2015 |
| 2014 |
| 2013 |
| (Dollars in Thousands) | Amount |
| % |
| Amount |
| % |
| Amount |
| % |
| Amount |
| % |
| Amount |
| % |
| Loans at December 31: | |
| |
| |
| |
| |
| |
| |
| |
| |
| |
| Commercial and industrial loans | $ | 1,493,493 |
|
| 22.1 | % |
| $ | 1,194,646 |
|
| 23.2 | % |
| $ | 1,057,075 |
|
| 22.5 | % |
| $ | 896,688 |
|
| 22.8 | % |
| $ | 761,705 |
|
| 21.0 | % |
Agricultural production financing
and other loans to farmers | 121,757 |
|
| 1.8 |
|
| 79,689 |
|
| 1.6 |
|
| 97,711 |
|
| 2.1 |
|
| 104,927 |
|
| 2.7 |
|
| 114,348 |
|
| 3.1 |
|
| Real estate loans: | |
| |
| |
| |
| |
| |
| |
| |
| |
| |
| Construction | 612,219 |
|
| 9.1 |
|
| 418,703 |
|
| 8.1 |
|
| 366,704 |
|
| 7.8 |
|
| 207,221 |
|
| 5.3 |
|
| 177,082 |
|
| 4.9 |
|
| Commercial and farmland | 2,562,691 |
|
| 38.0 |
|
| 1,953,062 |
|
| 38.1 |
|
| 1,802,921 |
|
| 38.5 |
|
| 1,672,661 |
|
| 42.6 |
|
| 1,611,809 |
|
| 44.4 |
|
| Residential | 962,765 |
|
| 14.3 |
|
| 739,169 |
|
| 14.4 |
|
| 786,105 |
|
| 16.7 |
|
| 647,315 |
|
| 16.5 |
|
| 616,385 |
|
| 17.0 |
|
| Home equity | 514,021 |
|
| 7.6 |
|
| 418,525 |
|
| 8.1 |
|
| 348,613 |
|
| 7.4 |
|
| 286,529 |
|
| 7.3 |
|
| 255,223 |
|
| 7.0 |
|
Individuals' loans for household and
other personal expenditures | 86,935 |
|
| 1.3 |
|
| 77,479 |
|
| 1.5 |
|
| 74,717 |
|
| 1.6 |
|
| 73,400 |
|
| 1.9 |
|
| 69,783 |
|
| 1.9 |
|
| Lease financing receivables, net of unearned income | 2,527 |
|
|
|
|
| 311 |
|
|
|
|
| 588 |
|
|
|
|
| 1,106 |
|
|
|
|
| 1,545 |
|
|
|
|
| Other commercial loans | 394,791 |
|
| 5.8 |
|
| 258,061 |
|
| 5.0 |
|
| 159,388 |
|
| 3.4 |
|
| 35,018 |
|
| 0.9 |
|
| 24,529 |
|
| 0.7 |
|
| Loans | 6,751,199 |
|
| 100.0 | % |
| 5,139,645 |
|
| 100.0 | % |
| 4,693,822 |
|
| 100.0 | % |
| 3,924,865 |
|
| 100.0 | % |
| 3,632,409 |
|
| 100.0 | % |
| Allowance for loan losses | (75,032 | ) |
| |
| (66,037 | ) |
| |
| (62,453 | ) |
| |
| (63,964 | ) |
| |
| (67,870 | ) |
| |
| Net Loans | $ | 6,676,167 |
|
| |
| $ | 5,073,608 |
|
| |
| $ | 4,631,369 |
|
| |
| $ | 3,860,901 |
|
| |
| $ | 3,564,539 |
|
| |
At July 14, 2017, loans of $749.7 million with a fair value discount of $23.7 million were acquired in the IAB acquisition. The May 19, 2017 acquisition of Arlington Bank included loans of $238.9 million with a fair value discount of $6.6 million. At December 31, 2015, loans of $331.0 million with a fair value discount of $14.0 million were acquired in the Ameriana transaction. The April 17, 2015 acquisition of C Financial included loans of $113.2 million with a fair value discount of $2.6 million. The assets acquired in the November 7, 2014 Community transaction included $153.9 million in loans which were acquired at a fair value discount of $8.8 million. The November 12, 2013 CFS acquisition included loans of $639.6 million and a fair value discount of $36.5 million.
The majority of the portfolio is comprised of loans secured by commercial and farmland real estate, commercial and industrial loans and loans secured by residential real estate. Commercial and farmland real estate loans made up 38.0 percent and 38.1 percent of loans at December 31, 2017 and 2016, respectively. Commercial and industrial loans made up 22.1 percent and 23.2 percent of loans and residential real estate loans, including home equity, made up 21.9 percent and 22.5 percent of loans at December 31, 2017 and 2016, respectively. Loans are generated from customers primarily in central northwest and northeastnorthern Indiana, northeast Illinois, and central Ohio, and southeast Michigan and are typically secured by specific items of collateral, including real property, consumer assets, and business assets. The following table shows the composition of the Corporation’s loan portfolioby collateral classification, including purchased credit impaired loans, for the years indicated:
|
| | | | | | | | | | | | | | | | | | | | | | | | | | | | | | | | | | |
| | 2019 |
| 2018 |
| 2017 |
| 2016 |
| 2015 |
| (Dollars in Thousands) | Amount |
| % |
| Amount |
| % |
| Amount |
| % |
| Amount |
| % |
| Amount |
| % |
| Loans at December 31: | |
| |
| |
| |
| |
| |
| |
| |
| |
| |
| Commercial and industrial loans | $ | 2,109,879 |
|
| 24.9 | % |
| $ | 1,726,664 |
|
| 23.9 | % |
| $ | 1,493,493 |
|
| 22.1 | % |
| $ | 1,194,646 |
|
| 23.2 | % |
| $ | 1,057,075 |
|
| 22.5 | % |
Agricultural production financing
and other loans to farmers | 93,861 |
|
| 1.1 |
|
| 92,404 |
|
| 1.3 |
|
| 121,757 |
|
| 1.8 |
|
| 79,689 |
|
| 1.6 |
|
| 97,711 |
|
| 2.1 |
|
| Real estate loans: | |
| |
| |
| |
| |
| |
| |
| |
| |
| |
| Construction | 787,568 |
|
| 9.3 |
|
| 545,729 |
|
| 7.5 |
|
| 612,219 |
|
| 9.1 |
|
| 418,703 |
|
| 8.1 |
|
| 366,704 |
|
| 7.8 |
|
| Commercial and farmland | 3,052,698 |
|
| 36.1 |
|
| 2,832,102 |
|
| 39.2 |
|
| 2,562,691 |
|
| 38.0 |
|
| 1,953,062 |
|
| 38.1 |
|
| 1,802,921 |
|
| 38.5 |
|
| Residential | 1,143,217 |
|
| 13.5 |
|
| 966,421 |
|
| 13.4 |
|
| 962,765 |
|
| 14.3 |
|
| 739,169 |
|
| 14.4 |
|
| 786,105 |
|
| 16.7 |
|
| Home equity | 588,984 |
|
| 7.0 |
|
| 528,157 |
|
| 7.3 |
|
| 514,021 |
|
| 7.6 |
|
| 418,525 |
|
| 8.1 |
|
| 348,613 |
|
| 7.4 |
|
Individuals' loans for household and
other personal expenditures | 135,989 |
|
| 1.6 |
|
| 99,788 |
|
| 1.4 |
|
| 86,935 |
|
| 1.3 |
|
| 77,479 |
|
| 1.5 |
|
| 74,717 |
|
| 1.6 |
|
| Public finance and other commercial loans | 547,114 |
|
| 6.5 |
|
| 433,202 |
|
| 6.0 |
|
| 397,318 |
|
| 5.8 |
|
| 258,372 |
|
| 5.0 |
|
| 159,976 |
|
| 3.4 |
|
| Loans | 8,459,310 |
|
| 100.0 | % |
| 7,224,467 |
|
| 100.0 | % |
| 6,751,199 |
|
| 100.0 | % |
| 5,139,645 |
|
| 100.0 | % |
| 4,693,822 |
|
| 100.0 | % |
| Allowance for loan losses | (80,284 | ) |
| |
| (80,552 | ) |
| |
| (75,032 | ) |
| |
| (66,037 | ) |
| |
| (62,453 | ) |
| |
| Net Loans | $ | 8,379,026 |
|
| |
| $ | 7,143,915 |
|
| |
| $ | 6,676,167 |
|
| |
| $ | 5,073,608 |
|
| |
| $ | 4,631,369 |
|
| |
Public finance and other commercial loans is primarily comprised of loans secured by states and political subdivisions in the United States.
The following table details gross loan balances and the associated fair value discount by acquisition.
|
| | | | | | | | | | |
| (Dollars in Thousands) |
| Acquired Institution |
| Date |
| Gross Loan Balance |
| Fair Value Discount |
| MBT |
| September 1, 2019 |
| $ | 751,353 |
|
| $ | 18,775 |
|
| IAB |
| July 14, 2017 |
| $ | 749,713 |
|
| $ | 23,737 |
|
| Arlington Bank |
| May 19, 2017 |
| $ | 238,867 |
|
| $ | 6,561 |
|
| Ameriana |
| December 31, 2015 |
| $ | 330,918 |
|
| $ | 13,989 |
|
| C Financial |
| April 17, 2015 |
| $ | 113,221 |
|
| $ | 2,596 |
|
At December 31, 2019 and 2018, the remaining fair value discount on acquired loans was $36,622,000 and $30,054,000, respectively.
LOAN MATURITIES
Presented in the table below are the maturities of loans (excluding residential real estate, home equity, individuals’ loans for household and other personal expenditures and lease financing) outstanding as of December 31, 2017,2019, by collateral classification. Also presented are the amounts due after one year, classified according to the sensitivity to changes in interest rates. The tables classify variable rate loans pursuant to the contractual repricing dates of the underlying loans, while fixed rate loans are classified by contractual maturity date.
| | | (Dollars in Thousands) | Maturing
Within 1 Year |
| Maturing
1-5 Years |
| Maturing Over
5 Years |
| Total | Maturing
Within 1 Year |
| Maturing
1-5 Years |
| Maturing Over
5 Years |
| Total |
| Commercial and industrial loans | $ | 1,156,547 |
|
| $ | 205,667 |
|
| $ | 131,279 |
|
| $ | 1,493,493 |
| $ | 1,616,486 |
|
| $ | 312,626 |
|
| $ | 180,767 |
|
| $ | 2,109,879 |
|
| Agriculture production financing and other loans to farmers | 103,608 |
|
| 16,593 |
|
| 1,556 |
|
| 121,757 |
| 79,335 |
|
| 13,418 |
|
| 1,108 |
|
| 93,861 |
|
| Real estate loans: |
|
|
|
|
|
|
|
|
|
|
|
|
|
|
|
|
|
|
|
|
|
|
| Construction | 554,811 |
|
| 24,609 |
|
| 32,799 |
|
| 612,219 |
| 704,976 |
|
| 42,779 |
|
| 39,813 |
|
| 787,568 |
|
| Commercial and farmland | 1,282,712 |
|
| 981,013 |
|
| 298,966 |
|
| 2,562,691 |
| 1,558,375 |
|
| 1,195,764 |
|
| 298,559 |
|
| 3,052,698 |
|
| Other commercial loans | 18,308 |
|
| 60,821 |
|
| 315,662 |
|
| 394,791 |
| |
| Public finance and other commercial loans | | 20,288 |
|
| 57,411 |
|
| 468,644 |
|
| 546,343 |
|
| Total | $ | 3,115,986 |
|
| $ | 1,288,703 |
|
| $ | 780,262 |
|
| $ | 5,184,951 |
| $ | 3,979,460 |
|
| $ | 1,621,998 |
|
| $ | 988,891 |
|
| $ | 6,590,349 |
|
| | | (Dollars in Thousands) | Maturing
1-5 Years |
| Maturing Over
5 Years | Maturing
1-5 Years |
| Maturing Over
5 Years |
| Loans maturing after one year with: |
|
| |
|
| |
| Fixed rate | $ | 828,136 |
|
| $ | 711,327 |
| $ | 1,104,429 |
|
| $ | 895,048 |
|
| Variable rate | 460,567 |
|
| 68,935 |
| 517,569 |
|
| 93,843 |
|
| Total | $ | 1,288,703 |
|
| $ | 780,262 |
| $ | 1,621,998 |
|
| $ | 988,891 |
|
NON-PERFORMING ASSETS
The table below summarizes non-performing assets and loans deemed impaired loansin accordance with ASC 310-10 for the years indicated:
| | | | December 31, |
| December 31, |
| December 31, |
| December 31, |
| December 31, | December 31, |
| December 31, |
| December 31, |
| December 31, |
| December 31, |
| (Dollars in Thousands) | 2017 |
| 2016 |
| 2015 |
| 2014 |
| 2013 | 2019 |
| 2018 |
| 2017 |
| 2016 |
| 2015 |
| Non-performing assets: | |
| |
| |
| |
| | |
| |
| |
| |
| |
| Non-accrual loans | $ | 28,724 |
|
| $ | 29,998 |
|
| $ | 31,389 |
|
| $ | 48,789 |
|
| $ | 56,402 |
| $ | 15,949 |
|
| $ | 26,148 |
|
| $ | 28,724 |
|
| $ | 29,998 |
|
| $ | 31,389 |
|
| Renegotiated loans | 1,013 |
|
| 4,747 |
|
| 1,923 |
|
| 1,992 |
|
| 3,048 |
| 841 |
|
| 1,103 |
|
| 1,013 |
|
| 4,747 |
|
| 1,923 |
|
| Non-performing loans (NPL) | 29,737 |
|
| 34,745 |
|
| 33,312 |
|
| 50,781 |
|
| 59,450 |
| 16,790 |
|
| 27,251 |
|
| 29,737 |
|
| 34,745 |
|
| 33,312 |
|
| Other real estate owned | 10,373 |
|
| 8,966 |
|
| 17,257 |
|
| 19,293 |
|
| 22,246 |
| 7,527 |
|
| 2,179 |
|
| 10,373 |
|
| 8,966 |
|
| 17,257 |
|
| Non-performing assets (NPA) | 40,110 |
|
| 43,711 |
|
| 50,569 |
|
| 70,074 |
|
| 81,696 |
| 24,317 |
|
| 29,430 |
|
| 40,110 |
|
| 43,711 |
|
| 50,569 |
|
| 90+ days delinquent and still accruing | 924 |
|
| 112 |
|
| 907 |
|
| 4,663 |
|
| 1,350 |
| |
| NPAs & 90+ days delinquent | $ | 41,034 |
|
| $ | 43,823 |
|
| $ | 51,476 |
|
| $ | 74,737 |
|
| $ | 83,046 |
| |
| 90 days or more delinquent and still accruing | | 69 |
|
| 1,855 |
|
| 924 |
|
| 112 |
|
| 907 |
|
| NPAs & 90 days or more delinquent | | $ | 24,386 |
|
| $ | 31,285 |
|
| $ | 41,034 |
|
| $ | 43,823 |
|
| $ | 51,476 |
|
| Impaired loans | $ | 52,687 |
|
| $ | 72,050 |
|
| $ | 97,527 |
|
| $ | 116,223 |
|
| $ | 119,755 |
| $ | 11,709 |
|
| $ | 22,025 |
|
| $ | 23,211 |
|
| $ | 26,015 |
|
| $ | 23,355 |
|
Loans are reclassified to a non-accruing status when, in management’s judgment, the collateral value and financial condition of the borrower do not justify accruing interest. Interest previously recorded, but not deemed collectible, is reversed and charged against current income. Payments subsequently received on non-accrual loans are applied to principal.
At December 31, 2017,2019, non-accrual loans totaled $15,949,000, a decrease of $28,724,000 decreased $1,274,000$10,199,000 from December 31, 2016.2018. At December 31, 2019, 2018, 2017, 2016, 2015, 2014, and 2013,2015, non-accrual loans include assets acquired during the respective periods of $3,697,000, $0, $4,822,000, $0, $2,229,000, $5,674,000 and $22,703,000.$2,229,000.
Other real estate owned ("OREO") at December 31, 20172019 increased $1,407,000$5,348,000 from the December 31, 20162018 balance of $8,966,000.$2,179,000. The increase in OREO was primarily driven by $6.3 million in collateral fromthe result of a purchased credit impaired relationship acquired in 2013.single commercial property with a carrying value of $5.9 million. At December 31 2015, 2014, and 2013,2019, OREO included assets acquired from MBT during the respective periodsperiod of $5,719,000, $6,662,000, and $12,899,000.$136,000. At December 31, 2018, 2017 and 2016, OREO did not include any assets acquired during the respective periods. At December 31, 2015, OREO included assets acquired during the period of $5,719,000.
Renegotiated loans are loans for which concessions are granted to the borrower due to deterioration in the financial condition of the borrower, resulting in the inability of the borrower to meet the original contractual terms of the loans. These concessions may include interest rate reductions, principal forgiveness, extensions of maturity date or other actions intended to minimize losses. Certain loans restructured may be excluded from restructured loan disclosures in years subsequent to the restructuring if the loans are in compliance with their modified terms. A non-accrual loan that is restructured may remain non-accrual for a period of approximately six months until the borrower can demonstrate their ability to meet the restructured terms. A borrower's performance prior to the restructuring, as well as after, will be considered in assessing whether the borrower can meet the new terms resulting in the loan being returned to accruing status in a shorter or longer period of time than the standard six months. If the borrower’s performance under the modified terms is not reasonably assured, the loan will remain non-accrual.
For the year ended December 31, 2017,2019, interest income of $768,000$277,000 was recognized on the non-accruing and renegotiated loans listed in the table above, whereas interest income of $2,892,000$749,000 would have been recognized under their original loan terms.
Commercial impairedImpaired loans, at December 31, 2017 totaled $52,687,000 and included loans acquired during the year of $7,175,000. There were no loans acquired during the period ending December 31, 2016. At December 31, 2015, 2014 and 2013, commercial impaired loans included assets acquired during the respective periods of $13,206,000, $17,027,000, and $69,448,000. Commercial impaired loanswhich include non-accrual loans, loans accounted for under ASC 310-30, and loans risk graded as substandard, doubtful and loss that were still accruing but deemed impaired according to the guidance set forth in ASC 310. Also included in impaired loans are accruing loans that are contractually past due 90 days or more and troubled debt restructures.totaled $11,709,000 at December 31, 2019. A loan is deemed impaired under ASC 310 when, based on current information or events, it is probable that all amounts due of principal and interest according to the contractual terms of the loan agreement will not be collected. A specific allowance of $1,233,000,$689,000, on a subset of commercial impaired loans totaling $3,379,000,$4,357,000, was included in the Corporation’s December 31, 20172019 allowance for loan losses. Loss reserves for acquired loans totaled $691,000,$124,000, and were included in the aforementioned specific allowance as a result of subsequent deterioration.
An allowable method for determining impairment is estimating the fair value of collateral on collateral dependent loans. This method requires obtaining a current independent appraisal of the collateral and applying a discount factor to the value. The fair value of real estate is generally based on appraisals by qualified licensed appraisers. The appraisers determine the value of the real estate by utilizing an income or market valuation approach. If an appraisal is not available, the fair value may be determined by using a discounted cash flow analysis. Fair value on other collateral such as business assets is typically ascertained by assessing, either singularly or some combination of, asset appraisals, accounts receivable aging reports, inventory listings andor customer financial statements. Both appraised values and values based on borrower’s financial information are discounted as considered appropriate based on age and quality of the information and current market conditions.
In addition to the impaired loans discussed above, management also identified commercial loans totaling $254,300,000$330,409,000 as of December 31, 20172019 that were deemed to be risk graded criticized, but not impaired. Comparatively, commercial loans risk graded criticized loansbut not deemed impaired at December 31, 2016, 2015, 2014 and 2013 were $233,538,000, $240,848,000, $161,860,000 and $132,400,000; respectively.2018 totaled $259,585,000. These loans are not included in the table above, or the impaired loan table in the footnotes to the consolidated financial statements. A loan risk graded criticized loan is a loan in which there are concerns regarding the borrower’s ability to comply with the repayment terms and would include loans graded special mention or worse.
See additional information regarding loan credit quality in NOTE 5. LOANS AND ALLOWANCE of the Notes to Consolidated Financial Statements included in Item 8 of this Annual Report on Form 10-K.
SUMMARY OF LOAN LOSS EXPERIENCE
The following table summarizes the loan loss experience, by collateral segment, for the years indicated:
| | | (Dollars in Thousands) | 2017 |
| 2016 |
| 2015 |
| 2014 |
| 2013 | 2019 |
| 2018 |
| 2017 |
| 2016 |
| 2015 |
| Allowance for loans losses: | |
| |
| |
| |
| | |
| Allowance for loan losses: | | |
| |
| |
| |
| |
| Balances, January 1 | $ | 66,037 |
|
| $ | 62,453 |
|
| $ | 63,964 |
|
| $ | 67,870 |
|
| $ | 69,366 |
| $ | 80,552 |
|
| $ | 75,032 |
|
| $ | 66,037 |
|
| $ | 62,453 |
|
| $ | 63,964 |
|
| Charge-offs: |
|
|
|
|
|
|
|
|
|
|
|
|
|
|
|
|
|
|
Commercial (1) | 1,383 |
|
| 2,464 |
|
| 2,356 |
|
| 7,246 |
|
| 6,117 |
| 1,732 |
|
| 2,316 |
|
| 1,383 |
|
| 2,464 |
|
| 2,356 |
|
Commercial real estate (2) | 1,737 |
|
| 2,408 |
|
| 1,437 |
|
| 6,608 |
|
| 7,493 |
| 3,675 |
|
| 2,741 |
|
| 1,737 |
|
| 2,408 |
|
| 1,437 |
|
| Consumer | 593 |
|
| 567 |
|
| 620 |
|
| 657 |
|
| 623 |
| 569 |
|
| 749 |
|
| 593 |
|
| 567 |
|
| 620 |
|
| Residential | 1,315 |
|
| 1,990 |
|
| 3,859 |
|
| 2,869 |
|
| 3,886 |
| 645 |
|
| 2,177 |
|
| 1,315 |
|
| 1,990 |
|
| 3,859 |
|
| Finance leases |
|
|
|
|
|
|
|
| 2 |
|
| 15 |
| |
| Total Charge-offs | 5,028 |
|
| 7,429 |
|
| 8,272 |
|
| 17,382 |
|
| 18,134 |
| 6,621 |
|
| 7,983 |
|
| 5,028 |
|
| 7,429 |
|
| 8,272 |
|
| Recoveries: | |
| |
| |
| |
| | |
| |
| |
| |
| |
Commercial (3) | 1,590 |
|
| 1,806 |
|
| 1,911 |
|
| 5,435 |
|
| 4,586 |
| 1,244 |
|
| 2,456 |
|
| 1,590 |
|
| 1,806 |
|
| 1,911 |
|
Commercial real estate (4) | 2,260 |
|
| 2,090 |
|
| 2,545 |
|
| 3,297 |
|
| 3,552 |
| 1,289 |
|
| 2,525 |
|
| 2,260 |
|
| 2,090 |
|
| 2,545 |
|
| Consumer | 324 |
|
| 369 |
|
| 352 |
|
| 377 |
|
| 556 |
| 401 |
|
| 302 |
|
| 324 |
|
| 369 |
|
| 352 |
|
| Residential | 706 |
|
| 1,091 |
|
| 1,536 |
|
| 1,783 |
|
| 1,292 |
| 619 |
|
| 993 |
|
| 706 |
|
| 1,091 |
|
| 1,536 |
|
| Finance leases |
|
|
|
|
|
|
|
| 24 |
|
| 4 |
| |
| Total Recoveries | 4,880 |
|
| 5,356 |
|
| 6,344 |
|
| 10,916 |
|
| 9,990 |
| 3,553 |
|
| 6,276 |
|
| 4,880 |
|
| 5,356 |
|
| 6,344 |
|
| Net Charge-offs | 148 |
|
| 2,073 |
|
| 1,928 |
|
| 6,466 |
|
| 8,144 |
| 3,068 |
|
| 1,707 |
|
| 148 |
|
| 2,073 |
|
| 1,928 |
|
| Provisions for loan losses | 9,143 |
|
| 5,657 |
|
| 417 |
|
| 2,560 |
|
| 6,648 |
| 2,800 |
|
| 7,227 |
|
| 9,143 |
|
| 5,657 |
|
| 417 |
|
| Balance at December 31 | $ | 75,032 |
|
| $ | 66,037 |
|
| $ | 62,453 |
|
| $ | 63,964 |
|
| $ | 67,870 |
| $ | 80,284 |
|
| $ | 80,552 |
|
| $ | 75,032 |
|
| $ | 66,037 |
|
| $ | 62,453 |
|
| Ratio of net charge-offs during the period to average loans outstanding during the period | 0.00 | % |
| 0.04 | % |
| 0.05 | % |
| 0.17 | % |
| 0.27 | % | 0.04 | % |
| 0.02 | % |
| 0.00 | % |
| 0.04 | % |
| 0.05 | % |
The increases in provision expense and the allowance for loan losses was primarily due to the level of organic loan growth in 2017.
Details of the Allowance for Loan Losses and non-performing loans are discussed within the “Loan Quality” and “Provision and Allowance for Loan Losses” sections of Management’s Discussion and Analysis of Financial Condition and Results of Operations included as Item 7 of this Annual Report on Form 10-K.
(1) Category includes the charge-offs for commercial and industrial, agricultural production financing and other loans to farmers and other commercial loans.
(2) Category includes the charge-offs for construction, commercial and farmland.
(3) Category includes the recoveries for commercial and industrial, agricultural production financing and other loans to farmers and other commercial loans.
(4) Category includes the recoveries for construction, commercial and farmland.
ALLOCATION OF THE ALLOWANCE FOR LOAN LOSSES
Presented below is an analysis of the composition of the allowance for loan losses and percent of loans in each category to total loans, by collateral segment, as of December 31, 2017, 2016, 2015, 2014, and 2013.the years indicated.
| | | | 2017 |
| 2016 |
| 2015 |
| 2014 |
| 2013 | 2019 |
| 2018 |
| 2017 |
| 2016 |
| 2015 |
| (Dollars in Thousands) | Amount |
| Percent |
| Amount |
| Percent |
| Amount |
| Percent |
| Amount |
| Percent |
| Amount |
| Percent | Amount |
| Percent |
| Amount |
| Percent |
| Amount |
| Percent |
| Amount |
| Percent |
| Amount |
| Percent |
| Balance at December 31: | |
| |
| |
| |
| |
| |
| |
| |
| |
| | |
| |
| |
| |
| |
| |
| |
| |
| |
| |
| Commercial | $ | 30,418 |
|
| 29.8 | % |
| $ | 27,696 |
|
| 29.8 | % |
| $ | 26,478 |
|
| 28.0 | % |
| $ | 28,824 |
|
| 26.4 | % |
| $ | 27,176 |
|
| 24.8 | % | $ | 32,902 |
|
| 32.5 | % |
| $ | 32,657 |
|
| 31.1 | % |
| $ | 30,420 |
|
| 29.8 | % |
| $ | 27,698 |
|
| 29.8 | % |
| $ | 26,480 |
|
| 28.0 | % |
| Commercial real estate | 27,343 |
|
| 47.0 |
|
| 23,661 |
|
| 46.2 |
|
| 22,145 |
|
| 46.2 |
|
| 19,327 |
|
| 47.9 |
|
| 23,102 |
|
| 49.3 |
| 28,778 |
|
| 45.4 |
|
| 29,609 |
|
| 46.8 |
|
| 27,343 |
|
| 47.0 |
|
| 23,661 |
|
| 46.2 |
|
| 22,145 |
|
| 46.2 |
|
| Consumer | 3,732 |
|
| 1.3 |
|
| 2,923 |
|
| 1.5 |
|
| 2,689 |
|
| 1.6 |
|
| 2,658 |
|
| 1.9 |
|
| 2,515 |
|
| 1.9 |
| 4,035 |
|
| 1.6 |
|
| 3,964 |
|
| 1.4 |
|
| 3,732 |
|
| 1.3 |
|
| 2,923 |
|
| 1.5 |
|
| 2,689 |
|
| 1.6 |
|
| Residential | 13,537 |
|
| 21.9 |
|
| 11,755 |
|
| 22.5 |
|
| 11,139 |
|
| 24.2 |
|
| 13,152 |
|
| 23.8 |
|
| 15,077 |
|
| 24.0 |
| 14,569 |
|
| 20.5 |
|
| 14,322 |
|
| 20.7 |
|
| 13,537 |
|
| 21.9 |
|
| 11,755 |
|
| 22.5 |
|
| 11,139 |
|
| 24.2 |
|
| Finance leases | 2 |
|
|
|
|
| 2 |
|
|
|
|
| 2 |
|
|
|
|
| 3 |
|
|
|
|
|
|
|
|
| |
| Totals | $ | 75,032 |
|
| 100.0 | % |
| $ | 66,037 |
|
| 100.0 | % |
| $ | 62,453 |
|
| 100.0 | % |
| $ | 63,964 |
|
| 100.0 | % |
| $ | 67,870 |
|
| 100.0 | % | $ | 80,284 |
|
| 100.0 | % |
| $ | 80,552 |
|
| 100.0 | % |
| $ | 75,032 |
|
| 100.0 | % |
| $ | 66,037 |
|
| 100.0 | % |
| $ | 62,453 |
|
| 100.0 | % |
Loan concentrations are considered to exist when there are amounts loaned to multiple borrowers engaged in similar activities, which would cause them to be similarly impacted by economic or other conditions. As ofAt December 31, 2017,2019, two concentrations of commercial loans within a single industry (as segregated by North American Industry Classification System “NAICS code”) were in excess of 10 percent of total loans: Lessors of Residential Buildings and Dwellings and Lessors of Nonresidential Buildings.
LOAN LOSS CHARGE-OFF PROCEDURES
The Corporation maintains an allowance to cover probable credit losses in its loan portfolio. The allowance is increased by the provision for loan losses and decreased by charge-offs less recoveries. All charge-offs are approved by the senior loan officers or loan committees, depending on the amount of the charge-off,charge-off. and are reported to the AuditRisk and Credit Policy Committee of the Board of Directors. Loans are charged off when a determination is made that all or a portion of a loan is uncollectible.
PROVISION FOR LOAN LOSSES
In banking, loan losses are a cost of doing business. Although management emphasizes the early detection and charge-off of loan losses, it is inevitable that certain losses, which have not been specifically identified, exist in the portfolio. Accordingly, the provision for loan losses is charged to earnings on an anticipatory basis, and recognized loan losses net of recoveries are deducted from the established allowance. Over time, all net loan losses are charged to earnings. During the year, an estimate of the expected losses for the year serves as a starting point in determining the appropriate level of the provision for loan losses. Based on management’s judgment as to the appropriate level of the allowance for loan losses, the amount provided in any period may be greater or less than net loan losses for the same period. The determination of the provision for loan losses in any period is based on management’s continuing review and evaluation of the loan portfolio, and its judgment as to the impact of current economic conditions on the portfolio. The evaluation by management includes consideration of past loan loss experience, changes in the composition of the loan portfolio, and the current condition and amount of loans outstanding. See additional information in the “Provision and Allowance For Loan Losses” section of Management’s Discussion and Analysis of Financial Condition and Results of Operations included as Item 7 of this Annual Report on Form 10-K.
DEPOSITS
The average balances, interest expense and average rates on deposits for the years ended December 31, 2017, 20162019, 2018 and 20152017 are presented in the Part I. Item I. Business section titled "DISTRIBUTION OF ASSETS, LIABILITIES AND STOCKHOLDERS' EQUITY, INTEREST RATES AND INTEREST DIFFERENTIAL" of this Annual Report on Form 10-K.
As of December 31, 2017,2019, certificates of deposit and other time deposits of $100,000 or more mature as follows:
| |
(Dollars in Thousands) | Maturing 3
Months or Less |
| Maturing 3-6
Months |
| Maturing 6-12
Months |
| Maturing Over
12 Months |
| Total | Maturing 3
Months or Less |
| Maturing 3-6
Months |
| Maturing 6-12
Months |
| Maturing Over
12 Months |
| Total |
| Certificates of deposit and other time deposits | $ | 72,334 |
|
| $ | 47,826 |
|
| $ | 221,651 |
|
| $ | 127,084 |
|
| $ | 468,895 |
| $ | 141,860 |
|
| $ | 171,914 |
|
| $ | 373,685 |
|
| $ | 49,384 |
|
| $ | 736,843 |
|
| Percent | 16 | % |
| 10 | % |
| 47 | % |
| 27 | % |
| 100 | % | 19 | % |
| 23 | % |
| 51 | % |
| 7 | % |
| 100 | % |
RETURN ON EQUITY AND ASSETS
See the information regarding return on equity and assets presented within Part II: Item 6. SELECTED FINANCIAL DATA of this Annual Report on Form 10-K.
SHORT-TERM BORROWINGS
Borrowings maturing in one year or less are included in the following table:
| | | (Dollars in Thousands) | 2017 |
| 2016 |
| 2015 | 2019 |
| 2018 |
| 2017 |
| Balance at December 31: | |
| |
| | |
| |
| |
| Federal funds purchased | $ | 144,038 |
|
| $ | 120,349 |
|
| $ | 49,721 |
| $ | 55,000 |
|
| $ | 104,000 |
|
| $ | 144,038 |
|
| Securities sold under repurchase agreements (short-term portion) | 136,623 |
|
| 146,480 |
|
| 155,325 |
| 187,946 |
|
| 113,512 |
|
| 136,623 |
|
| Federal Home Loan Bank advances (short-term portion) | 171,391 |
|
| 167,068 |
|
| 91,441 |
| 41,370 |
|
| 113,712 |
|
| 171,391 |
|
| Total short-term borrowings | $ | 452,052 |
|
| $ | 433,897 |
|
| $ | 296,487 |
| $ | 284,316 |
|
| $ | 331,224 |
|
| $ | 452,052 |
|
Securities sold under repurchase agreements are categorized as borrowings maturing within one year and are secured by U.S. Government-Sponsored Enterprise obligations, certain municipal securities and mortgage loans.
Pertinent information with respect to borrowings maturing in one year or less is summarized below:
| | | (Dollars in Thousands) | 2017 |
| 2016 |
| 2015 | 2019 |
| 2018 |
| 2017 |
| Weighted Average Interest Rate on Outstanding Balance at December 31: | |
| |
| | |
| |
| |
| Federal funds purchased | 0.9 | % |
| 0.7 | % |
| 0.5 | % | 1.4 | % |
| 1.7 | % |
| 0.9 | % |
| Securities sold under repurchase agreements (short-term portion) | 0.4 | % |
| 0.3 | % |
| 0.3 | % | 0.8 | % |
| 0.9 | % |
| 0.4 | % |
| Federal Home Loan Bank advances (short-term portion) | 1.5 | % |
| 0.9 | % |
| 1.1 | % | 1.8 | % |
| 1.5 | % |
| 1.5 | % |
| Total short-term borrowings | 0.9 | % |
| 0.6 | % |
| 0.6 | % | 1.1 | % |
| 1.4 | % |
| 0.9 | % |
| Weighted Average Interest Rate During the Year: | |
| |
| | |
| |
| |
| Federal funds purchased | 1.2 | % |
| 0.7 | % |
| 0.4 | % | 2.3 | % |
| 1.9 | % |
| 1.2 | % |
| Securities sold under repurchase agreements (short-term portion) | 0.4 | % |
| 0.3 | % |
| 0.3 | % | 1.0 | % |
| 0.6 | % |
| 0.4 | % |
| Federal Home Loan Bank advances (short-term portion) | 1.3 | % |
| 1.5 | % |
| 1.1 | % | 1.8 | % |
| 2.0 | % |
| 1.3 | % |
| Total short-term borrowings | 0.9 | % |
| 0.6 | % |
| 0.5 | % | 1.4 | % |
| 1.4 | % |
| 0.9 | % |
| Highest Amount Outstanding at Any Month End During the Year: | |
| |
| | |
| |
| |
| Federal funds purchased | $ | 144,038 |
|
| $ | 120,349 |
|
| $ | 101,249 |
| $ | 80,000 |
|
| $ | 124,911 |
|
| $ | 144,038 |
|
| Securities sold under repurchase agreements (short-term portion) | 145,883 |
|
| 158,185 |
|
| 163,128 |
| 191,603 |
|
| 143,016 |
|
| 145,883 |
|
| Federal Home Loan Bank advances (short-term portion) | 207,061 |
|
| 167,068 |
|
| 128,557 |
| 163,800 |
|
| 211,800 |
|
| 207,061 |
|
| Total short-term borrowings | $ | 496,982 |
|
| $ | 445,602 |
|
| $ | 392,934 |
| $ | 435,403 |
|
| $ | 479,727 |
|
| $ | 496,982 |
|
| Average Amount Outstanding During the year: | |
| |
| | |
| |
| |
| Federal funds purchased | $ | 47,078 |
|
| $ | 15,387 |
|
| $ | 20,767 |
| $ | 10,810 |
|
| $ | 36,873 |
|
| $ | 47,078 |
|
| Securities sold under repurchase agreements (short-term portion) | 134,401 |
|
| 145,379 |
|
| 143,491 |
| 136,274 |
|
| 124,762 |
|
| 134,401 |
|
| Federal Home Loan Bank advances (short-term portion) | 152,452 |
|
| 65,789 |
|
| 62,471 |
| 89,677 |
|
| 137,499 |
|
| 152,452 |
|
| Total short-term borrowings | $ | 333,931 |
|
| $ | 226,555 |
|
| $ | 226,729 |
| $ | 236,761 |
|
| $ | 299,134 |
|
| $ | 333,931 |
|
PART I: ITEM 1A. AND ITEM 1B.
ITEM 1A. RISK FACTORS
RISK FACTORS
There are a number of factors, including those specified below, that may adversely affect the Corporation’s business, financial results or stock price. Additional risks that the Corporation currently does not know about or currently views as immaterial may also impair the Corporation’s business or adversely impact its financial results or stock price.
INDUSTRY AND CORPORATE RISK FACTORS
The Corporation’s business and financial results are significantly affected by general business and economic conditions.
The Corporation’s business activities and earnings are affected by general business conditions in the United States and abroad. These conditions include short-term and long-term interest rates, inflation, monetary supply, fluctuations in both debt and equity capital markets, and the strength of the United States economy and the state and local economies in which the Corporation operates. The Corporation's offices are primarily located in central and northern Indiana, northeast Illinois, central Ohio and central Ohio.southeast Michigan. Worsening economic conditions in our market areas could negatively impact the financial condition, results of operations and stock price of the Corporation. For example, a prolonged economic downturn, increases in unemployment, or other events that affect household and/or corporate incomes could result in deterioration of credit quality, an increase in the allowance for loan losses, or reduced demand for loan or fee-based products and services. Changes in the financial performance and condition of the Corporation’s borrowers could negatively affect repayment of those borrowers’ loans. In addition, changes in securities market conditions and monetary fluctuations could adversely affect the availability and terms of funding necessary to meet the Corporation’s liquidity needs.
Changes in the domestic interest rate environment could reduceaffect the Corporation’s net interest income as well as the valuation of assets and liabilities.
The operations of financial institutions, such as the Corporation, are dependent to a large degree on net interest income, which is the difference between interest income from loans and investments and interest expense on deposits and borrowings. An institution’s net interest income is significantly affected by market rates of interest, which in turn are affected by prevailing economic conditions, by the fiscal and monetary policies of the federal government and by the policies of various regulatory agencies. In addition to affecting profitability, changes in interest rates can impact the valuation of assets and liabilities. For example, ratechanges in reference rates linked to financial instruments, such as the London Interbank Offered Rate (LIBOR), may adversely affect the value of financial instruments the Corporation holds or issues and related net interest income. Rate changes can also affect the ability of borrowers to meet obligations under variable or adjustable rate loans which in turn affect loss rates on those assets. Also, the demand for interest rate based products and services, including loans and deposit accounts, may decline resulting in the flow of funds away from financial institutions into direct investments. Direct investments, such as U.S. Government and corporate securities and other investment vehicles, including mutual funds, generally pay higher rates of return than financial institutions, because of the absence of federal insurance premiums and reserve requirements.
The replacement of LIBOR with an alternative reference rate could have an adverse impact on the Corporation.
In July 2017, the U.K. Financial Conduct Authority, the authority regulating LIBOR, announced that LIBOR in its current state would be discontinued at the end of 2021. LIBOR is commonly referenced in financial contracts and the Corporation has exposure to the termination of this interest rate index in loans, derivatives, debt agreements, and other instruments. A cross functional project team has been established to determine the level of exposure, identify the appropriate replacement rate(s), and develop migration strategies. Industry groups, regulators and other various oversight bodies will be consulted throughout the transition. Any replacement interest rate(s) may perform differently and we may incur significant costs to transition both our borrowing arrangements and the loan agreements with our customers from LIBOR, which may have an adverse effect on our results of operations. In addition, amending certain contracts indexed to LIBOR may require consent from impacted counterparties which could be difficult to obtain. The financial and operational impact of the transition is unknown at this time.
Changes in the laws, regulations and policies governing banks and financial services companies could alter the Corporation’s business environment and adversely affect operations.
The Board of Governors of the Federal Reserve System regulates the supply of money and credit in the United States. Its fiscal and monetary policies determine in a large part the Corporation’s cost of funds for lending and investing and the return that can be earned on those loans and investments, both of which affect the Corporation’s net interest margin. Federal Reserve Board policies can also materially affect the value of financial instruments that the Corporation holds, such as debt securities. The Corporation and the Bank are heavily regulated at the federal and state levels. This regulation is to protect depositors, federal deposit insurance funds and the banking system as a whole. Congress and state legislatures and federal and state agencies continually review banking laws, regulations and policies for possible changes. After the Great Recession, efforts to promote the safety and soundness of financial institutions, financial market stability, the transparency and liquidity of financial markets, and consumer and investor protection resulted in increased regulation in the financial services industry. Regulatory agencies have intensified their examination practices and enforcement of laws and regulations. Compliance with regulations and other supervisory initiatives could increase the Corporation’s expenses and reduce revenues by limiting the types of financial services and products that the Corporation offers and/or increasing the ability of non-banks to offer competing financial services and products. See a description of recent legislation in the “REGULATION AND SUPERVISION OF FIRST MERCHANTS CORPORATION AND SUBSIDIARIES”SUBSIDIARIES�� section of Item 1: Business of this Annual Report on Form 10-K.
The banking industry, as well as the broader economy, may be subject to new legislation, regulation, and government policy. At this time, we are not able to predict the legislative and regulatory changes that may result from having a the President of the United States and both Houses of Congress and the White House with majority memberships from the same political party. However, both the President and senior members of the House of Representatives have advocated for significant reduction of banking regulation, including possible amendments to the Dodd-Frank Act. Future legislation, regulation, and government policy could affect the banking industry as a whole, including our business and results of operations, in a way that cannot accurately be predicted. In addition, our financial condition and results of operations also could be adversely affected by changes in the way in which existing statutes and regulations are interpreted or applied by courts and government agencies.
PART I: ITEM 1A. AND ITEM 1B.
Certain regulations require the Corporation to maintain certain capital ratios, such as the ratio of Tier 1 capital to risk-based assets. Both the Dodd-Frank Act, which reformed the regulation of financial institutions in a comprehensive manner, and the Basel III regulatory capital reforms, which increase both the amount and quality of capital that financial institutions must hold, impact capital requirements. If the Corporation is unable to satisfy these heightened regulatory capital requirements, due to a decline in the value of the loan portfolio or otherwise, raising additional capital or disposing of assets could be required. Additional capital could be raised by selling additional shares of common stock, or securities convertible into or exchangeable for common stock, which could significantly dilute the ownership percentages of stockholders and cause the market price of our common stock to decline. Events or circumstances in the capital markets generally may increase capital costs and impair the ability to raise capital at any given time. Disposal of assets cannot guarantee disposal at prices appropriate for the disposition, and future operating results could be negatively affected.
PART I: ITEM 1A. AND ITEM 1B.
The Corporation may beis subject to heightened regulatory requirements whenas the Corporation exceedsCorporation's assets have exceeded $10 billion in assets.billion.
Based on the Corporation’s organic growth rates and growth due to potential futurerecent acquisitions, the Corporation’s total consolidated assets may exceedexceeded $10 billion infor four consecutive quarters as of December 31, 2019. Upon crossing that threshold,As a result, the Corporation will likely beis subject to increased regulatory scrutiny and additional expectations imposed by the Dodd-Frank Act. The increased regulatory scrutiny will comecomes from the examination of compliance with federal consumer protection laws by the Consumer Financial Protections Bureau (CFPB).CFPB. The CFPB’s examination practices are evolvingcontinue to evolve and it is uncertain how itthey might impact the Corporation. Currently, our bank is subject to regulations adopted by the CFPB, but the FDIC is primarily responsible for examining our bank’s compliance with consumer protection laws and those CFPB regulations. The Durbin Amendment imposes limits on interchange fees paid by merchants to banks whose assets exceed $10 billion when debit cards are used as payment. These limits are expected to materially reduce the Corporation’s fee income. Enhanced Prudential Standards are also imposed on banks with more than $10 billion in assets. These standards include annual stress testing requirements where the impact of adverse economic scenarios on the Corporation’s financial condition must be assessed. Compliance with the CFPB standards could increase the Corporation’s operational costs. Our other regulators may also consider our preparation for compliance with these regulatory requirements when examining our operations generally or considering any request for regulatory approval we may make.
Our FDIC insurance premiums may increase, and special assessments could be made, which might negatively impact our results of operations.
High levels of insured institution failures, as a result of the last recession, significantly increased losses to the Deposit Insurance Fund of the FDIC. Further, the Dodd-Frank Act mandated the FDIC to increase the level of its reserves for future losses in its Deposit Insurance Fund. Since the Deposit Insurance Fund is funded by premiums and assessments paid by insured banks, our FDIC insurance premium could increase in future years depending upon the FDIC’s actual loss experience, changes in the Bank’s financial condition or capital strength, and future conditions in the banking industry. In addition, once we exceedAs the Corporation's assets have exceeded $10 billion, in assets, the method for calculating the Bank’s FDIC assessment will change and we expect that such assessment will increase as a result. See the “Deposit Insurance” section of “REGULATION AND SUPERVISION OF FIRST MERCHANTS CORPORATION AND SUBSIDIARIES” under this Item 1. Business for additional information.
The banking and financial services industry is highly competitive, and competitive pressures could intensify and adversely affect the Corporation’s financial results.
The Corporation operates in a highly competitive industry that could become even more competitive as a result of legislative, regulatory and technological changes and continued consolidation. The Corporation competes with other banks, savings and loan associations, mutual savings banks, finance companies, mortgage banking companies, credit unions and investment companies. In addition, technology has lowered barriers to entry and made it possible for non-banks to offer products and services traditionally provided by banks. Many of the Corporation’s competitors have fewer regulatory constraints, greater resources and some have lower cost structures allowing them to aggressively price their products. In December 2016,
the OCC announced its intent to make special purpose national bank charters available to financial technology companies. The agency published a paper discussing issues related to chartering special purpose national banks and solicited public comment to help guide its approach to financial innovation. Such pressures make it more difficult for the Corporation to attract and retain customers across its business lines. Also, the demands of adapting to industry changes in technology and systems, on which the Corporation and financial services industry are highly dependent, could present operational issues and require capital spending.
Additionally, our success depends, in large part, on our ability to attract and retain key people. Competition for the best people in many activities for which the Corporation is engaged is intense and we may not be able to hire people and retain them. The unexpected loss of services of key personnel could have a material adverse impact on our business, financial condition and results of operations because of their customer relationships, skills, knowledge of our markets, years of industry experience and the difficulty of promptly finding qualified replacement personnel. In addition, the scope and content of U.S. banking regulators' policies on incentive compensation, as well as changes to these policies, could adversely affect our ability to hire, retain and motivate our key employees.
The Corporation’s allowance for loan losses may not be adequate to cover actual losses.
The Corporation maintains an allowance for loan losses to provide for loan defaults and non-performance. The allowance for loan losses represents management’s estimate of probable losses inherent in the Corporation’s loan portfolio. The Corporation’s allowance consists of three components: probable losses estimated from individual reviews of specific loans, probable losses estimated from historical loss rates, and probable losses resulting from economic, environmental, qualitative or other deterioration above and beyond what is reflected in the first two components of the allowance. The process for determining the adequacy of the allowance for loan losses is critical to the Corporation’s financial results. It requires management to make difficult, subjective and complex judgments, as a result of the need to make estimates about the effect of matters that are uncertain. Therefore, the allowance for loan losses, considering current factors at the time, including economic conditions and ongoing internal and external examination processes, will increase or decrease as deemed necessary to ensure the allowance for loan losses remains adequate. In addition, the allowance as a percentage of charge-offs and nonperforming loans will change at different points in time based on credit performance, loan mix and collateral values.
PART I: ITEM 1A. AND ITEM 1B.
In addition, the adoption of Accounting Standards Update (ASU) No. 2016-13, Financial Instruments - Credit Losses (Topic 326): Measurement of Credit Losses on Financial Instruments as amended, on January 1, 2020 will impact our methodology for estimating the allowance for credit losses and could increase volatility in the Corporation's financial results. See NOTE 1. NATURE OF OPERATIONS AND SUMMARY OF SIGNIFICANT ACCOUNTING POLICIES of the Notes to Consolidated Financial Statements included in Item 8 of this Annual Report on Form 10-K. ASU 2016-13 requires the measurement of all expected credit losses for financial assets held at the reporting date based on historical experience, current conditions, and reasonable and supportable forecasts. The Corporation expects to record a one-time cumulative-effect adjustment to retained earnings, net of income taxes, on its consolidated balance sheet as of the beginning of the first quarter of 2020. The allowance will increase by 55-65 percent because it will cover expected credit losses over the life of the loan portfolio, which approximates four years, and it includes all purchased loans that were previously excluded from the allowance for loan losses calculation. CECL also requires the establishment of a reserve for potential losses from unfunded commitments that is recorded in other liabilities, separate from allowance for credit losses, which is estimated to be approximately $18 million. These estimates and the ongoing impact of adopting this ASU are dependent on various factors, including credit quality, macroeconomic forecasts and conditions, composition of our loans and securities portfolios, and other management judgments. The adjustment to reflect the allowance increase and the reserve for potential losses, which remain subject to further review and analysis by our management team, may fall outside of, or be different than, our estimates as a result of any material changes in these factors.
The Corporation may suffer losses in its loan portfolio despite its underwriting practices.
The Corporation seeks to mitigate the risks inherent in its loan portfolio by adhering to specific underwriting practices. The Corporation’s strategy for credit risk management includes conservative credit policies and underwriting criteria for all loans, as well as an overall credit limit for each customer significantly below legal lending limits. The strategy also emphasizes diversification on a regional geographic, industry and customer level, regular credit quality reviews and management reviews of large credit exposures and loans experiencing deterioration of credit quality. There is a continuous review of the loan portfolio, including an internally administered loan “watch” list and an independent loan review. The evaluation takes into consideration identified credit problems, as well as the possibility of losses inherent in the loan portfolio that are not specifically identified. Although the Corporation believes that its underwriting criteria are appropriate for the various kinds of loans it makes, the Corporation may incur losses on loans due to the factors previously discussed.
PART I: ITEM 1A. AND ITEM 1B.
The Corporation's wholesale funding sources may prove insufficient to replace deposits or support future growth.
As part of the Corporation's liquidity management, a number of funding sources are used, including core deposits and repayments and maturities of loans and investments. Sources also include brokered certificates of deposit, repurchase agreements, federal funds purchased and FHLB advances. Negative operating results or changes in industry conditions could lead to an inability to replace these additional funding sources at maturity. The Corporation's financial flexibility could be constrained if we are unable to maintain access to funding or if adequate financing is not available to accommodate future growth at acceptable interest rates. Finally, if the Corporation is required to rely more heavily on more expensive funding sources to support future growth, revenues may not increase proportionately to cover the costs. In this case the Corporation's results of operations and financial condition would be negatively affected.
The Corporation relies on dividends from its subsidiaries for its liquidity needs.
The Corporation is a separate and distinct legal entity from its bank and non-bank subsidiaries. The Corporation receives substantially all of its cash from dividends paid by its subsidiaries. These dividends are the principal source of funds to pay dividends on the Corporation’s stock and interest and principal on its debt. Various federal and state laws and regulations limit the amount of dividends that the bank subsidiaries may pay to the Corporation.
Acquisitions may not produce revenue enhancements or cost savings at levels or within timeframes originally anticipated and may result in unforeseen integration difficulties.
The Corporation regularly explores opportunities to acquire banks, financial institutions, or other financial services businesses or assets. The Corporation cannot predict the number, size or timing of acquisitions. Difficulty in integrating an acquired business or company may cause the Corporation not to realize expected revenue increases, cost savings, increases in geographic or product presence, and/or other projected benefits from the acquisition. The integration could result in higher than expected deposit attrition (run-off), loss of key employees, disruption of the Corporation’s business or the business of the acquired company, or otherwise adversely affect the Corporation’s ability to maintain relationships with customers and employees or achieve the anticipated benefits of the acquisition. Also, the negative effect of any divestitures required by regulatory authorities in acquisitions or business combinations may be greater than expected. The Corporation may also issue equity securities in connection with acquisitions, which could cause ownership and economic dilution to current stockholders.
The Corporation faces operational risks because the nature of the financial services business involves a high volume of transactions.
The Corporation operates in diverse markets and relies on the ability of its employees and systems to process a high number of transactions. Operational risk is the risk of loss resulting from the Corporation’s operations, including, but not limited to, the risk of fraud by employees or persons outside of the Corporation, the execution of unauthorized transactions by employees, errors relating to transaction processing and technology, breaches of the internal control system and compliance requirements and business continuation and disaster recovery. This risk of loss also includes the potential legal actions that could arise as a result of an operational deficiency or as a result of noncompliance with applicable regulatory standards, adverse business decisions or their implementation, and customer attrition due to potential negative publicity. In the event of a breakdown in the internal control system, improper operation of systems or improper employee actions, the Corporation could suffer financial loss, face regulatory action and suffer damage to its reputation.
PART I: ITEM 1A. AND ITEM 1B.
A disaster, natural or otherwise, acts of terrorism and political or military actions taken by the United States or other governments could adversely affect the Corporation’s business, directly or indirectly.
Disasters (such as tornadoes, floods, and other severe weather conditions, pandemics, fires, and other catastrophic accidents or events) and terrorist activities and the impact of these occurrences cannot be predicted. Such occurences could harm the Corporation’s operations and financial condition directly through interference with communications and through the destruction of facilities and operational, financial and management information systems and/or indirectly by adversely affecting economic and industry conditions. These events could prevent the Corporation from gathering deposits, originating loans and processing and controlling its flow of business by affecting borrowers, depositors, suppliers or other counterparties. The Corporation’s ability to mitigate the adverse impact of these occurrences would depend in part on the Corporation’s business continuity planning, the ability to anticipate any such event occurring, the preparedness of national or regional emergency responders, and continuity planning of parties the Corporation deals with.
Cyber incidents and other security breaches at the Corporation, its service providers or counterparties, or in the business community or markets may negatively impact the Corporation’s business or performance.
In the ordinary course of its business, the Corporation collects, stores, and transmits sensitive, confidential, or proprietary data and other information, including intellectual property, business information, funds-transfer instructions, and the personally identifiable information of its customers and employees. The secure processing, storage, maintenance, and transmission of this information is critical to the Corporation’s operations and reputation, and if any of this information were mishandled, misused, improperly accessed, lost, or stolen or if the Corporation’s operations were disrupted, the Corporation could suffer significant financial, business, reputational, regulatory, or other damage. For example, despite
The Corporation maintains a comprehensive Cyber and Information Security Program and significant resources are devoted to protecting the Corporation’s assets from threats. Despite security measures, the Corporation’s information technology and infrastructure may be breached through cyber-attacks, computer viruses or malware, pretext calls, electronic phishing, or other means. These risks and uncertainties are rapidly evolving and increasing in complexity, and the Corporation’s failure to effectively mitigate them could negatively impact its business and operations.
Service providers and counterparties also present a source of risk to the Corporation if their own security measures or other systems or infrastructure were to be breached or otherwise fail. Likewise, a cyber-attack or other security breach affecting the business community, the markets, or parts of them may cycle or cascade through the financial system and adversely affect the Corporation or its service providers or counterparties. Many of these risks and uncertainties are beyond the Corporation’s control.
PART I: ITEM 1A. AND ITEM 1B.
Even when an attempted cyber incident or other security breach is successfully avoided or thwarted, the Corporation may need to expend substantial resources in doing so, may be required to take actions that could adversely affect customer satisfaction or behavior, and may be exposed to reputational damage. If a breach were to occur, moreover, the Corporation could be exposed to contractual claims, regulatory actions, and litigation by private plaintiffs, and would additionally suffer reputational harm. Despite the Corporation’s efforts to safeguard the integrity of systems and controls and to manage third-party risk, the Corporation may not be able to anticipate or implement effective measures to prevent all security breaches or all risks to the sensitive, confidential, or proprietary information that it or its service providers or counterparties collect, store, or transmit. In addition, the Corporation may not have adequate insurance coverage to compensate for losses from a cyber incident or other security breach.
The Corporation continually encounters technological change.
The financial services industry is continually undergoing rapid technological change with frequent introductions of new technology-driven products and services. The effective use of technology increases efficiency and enables the financial institutions to better serve customers to reduce costs. The Corporation's future success depends, in part, upon its ability to address customer needs by using technology to provide products and services that will satisfy customer demands, as well as to create additional efficiencies in the Corporation's operations. The Corporation may not be able to effectively implement new technology-driven products and services or be successful in marketing these products and services to its customers. Failure to successfully keep pace with technological changes affecting the financial services industry could negatively affect the Corporation's growth, revenue and profit. In addition, the Corporation relies upon the expertise and support of third-party service providers to help implement, maintain and/or service certain of its core technology solutions. If the Corporation cannot effectively manage these service providers, the service parties fail to materially perform, or the Corporation was to falter in any of the other noted areas, its business or performance could be negatively impacted.
The Corporation’s controls and procedures may fail or be circumvented.
Management regularly reviews and updates the Corporation’s internal controls, disclosure controls and procedures, and corporate governance policies and procedures. Any system of controls, however well designed and operated, is based in part on certain assumptions and can provide only reasonable, not absolute, assurances that the objectives of the system are met. Any failure or circumvention of the Corporation’s controls and procedures or failure to comply with regulations related to controls and procedures could have a material adverse effect on our results of operations and financial condition.
The Corporation’s methods of reducing risk exposure may not be effective.
The Corporation maintains a comprehensive risk management program designed to identify, quantify, manage, mitigate, monitor, aggregate, and report risks. However, instruments, systems and strategies used to hedge or otherwise manage exposure to various types of credit, market, liquidity, operational, compliance, financial reporting and strategic risks could be less effective than anticipated. As a result, the Corporation may not be able to effectively mitigate its risk exposures in particular market environments or against particular types of risk, which could have a material adverse effect on our results of operations and financial condition.
PART I: ITEM 1A. AND ITEM 1B.
The Corporation’s reported financial results depend on management’s selection of accounting methods and certain assumptions and estimates.
The Corporation’s accounting policies and methods are fundamental to how it records and reports its financial condition and results of operations. The Corporation’s management must exercise judgment in selecting and applying many of these accounting policies and methods, so they comply with GAAP and reflect management’s judgment of the most appropriate manner to report the Corporation’s financial condition and results. In some cases, management must select the accounting policy or method to apply from two or more alternatives, any of which might be reasonable under the circumstances yet might result in the Corporation reporting materially different results than would have been reported under a different alternative. Certain accounting policies are critical to presenting the Corporation’s financial condition and results, and require management to make difficult, subjective or complex judgments about matters that are uncertain. Materially different amounts could be reported under different conditions or using different assumptions or estimates. These critical accounting policies include: the allowance for loan losses; the valuation of investment securities; the valuation of goodwill and intangible assets; pension accounting; and pension accounting.the accounting related to acquisitions. Because of the uncertainty of estimates involved in these matters, the Corporation may be required to do one or more of the following: significantly increase the allowance for loan losses and/or sustain loan losses that are significantly higher than the reserve provided; recognize significant provision for impairment of its investment securities; recognize significant impairment on its goodwill and intangible assets; or significantly increase its pension liability.liability; or modify the purchase price allocation of an acquisition. As part of its function of assisting the Corporation’s Board of Directors in discharging its responsibility of ensuring all types of risk to the organization are properly being managed, mitigated and monitored by management, the Audit Committee of the Board of Directors oversees management’s accounting policies and methods. For more information, refer to NOTE 1. NATURE OF OPERATIONS AND SUMMARY OF SIGNIFICANT ACCOUNTING POLICIES of the Notes to Consolidated Financial Statements included in Item 8 of this Annual Report on Form 10-K.
A write-down of all or part of the Corporation’s goodwill could materially reduce its net income and net worth.
At December 31, 2017,2019, the Corporation had goodwill of $445,355,000$543,918,000 recorded on its consolidated balance sheet. Under ASC 350, Intangibles – Goodwill and Other, the Corporation is required to evaluate goodwill for impairment on an annual basis, as well as on an interim basis, if events or changes indicate that the asset may be impaired. An impairment loss must be recognized for any excess of carrying value over the fair value of goodwill. The fair value is determined based on internal valuations using management’s assumptions of future growth rates, future attrition, discount rates, multiples of earnings or other relevant factors. The resulting estimated fair value could result in material write-downs of goodwill and recording of impairment losses. Such a write-down could materially reduce the Corporation’s net income and overall net worth. The Corporation also cannot predict the occurrence of certain future events that might adversely affect the fair value of goodwill. Such events include, but are not limited to, strategic decisions made in response to economic and competitive conditions, the effect of the economic environment on the Corporation’s customer base, or a material negative change in its relationship with significant customers.
Changes in accounting standards could materially impact the Corporation’s financial statements.
From time to time, the Financial Accounting Standards Board changes the financial accounting and reporting standards that govern the preparation of the Corporation’s financial statements. These changes can be hard to predict and can materially impact how the Corporation records and reports its financial condition and results of operations. In some cases, the Corporation could be required to apply a new or revised standard retroactively; resulting in the restatingrestatement of prior period financial statements.
PART I: ITEM 1A. AND ITEM 1B.
Changes in tax legislation could materially impact the Corporation’s business and financial results.
From time to time, the U.S government or State governments where the corporationCorporation has tax nexus can enact tax legislation that may have a material effect on the Corporation's business and financial results. On December 22, 2017, the U.S. government enacted tax reform legislation commonly referred to as the Tax Cuts and Jobs Act ("TCJA") which made significant changes to the Internal Revenue Code of 1986, as amended. The new legislation, among other things, makesmade significant changes to the rules applicable to the taxation of corporations, such as changing the corporate tax rate to 21 percent, modifying the rules regarding limitations on certain deductions for executive compensation, introducing a capital investment deduction in certain circumstances, placing certain limitations on the interest deduction, and modifying the rules regarding the usability of net operating losses, and puts into effect the migration to a territorial system of taxation.losses. ASC 740, Income Taxes, requires the impact of tax legislation to be recognized in the accounting period the legislation is signed into law. As such, the $5.1 million impact of revaluing the Corporation's deferred tax assets and liabilities has been recorded in income tax expense as of December 31, 2017.
While our earnings have been positively impacted by the direct impact torate reduction and the Corporation's financial statements has been addressed, the impact ofresulting increase in economic activity, the TCJA also enacted limitations on certain deductions that have had a negative impact on borrowers and the market for single-family residential real estate, and, as a result, on the overall economy,banking industry. These limitations include (1) a lower limit on the Corporation's customer base,deductibility of mortgage interest on single-family residential mortgage loans, (2) the elimination of interest deductions for certain home equity loans, (3) a limitation on the deductibility of business interest expense, and shareholders remains uncertain.
(4) a limitation on the deductibility of property taxes and state and local income taxes. Given the current economic and political environment and ongoing budgetary pressures, the enactment of further new federal or state tax legislation may occur. The enactment of such legislation, or changes in the interpretation of existing law, including provisions impacting tax rates, apportionment, consolidation or combination, income, expenses, credits and exemptions may have a material adverse effect on our business, financial condition and results of operations.
Significant legal actions could subject the Corporation to substantial uninsured liabilities.
The Corporation is from time to time subject to claims related to its operations. These claims and legal actions, including supervisory actions by the Corporation’s regulators, could involve large monetary claims and significant defense costs. To protect itself from the cost of these claims, the Corporation maintains insurance coverage in amounts and with deductibles that it believes are appropriate for its operations. However, the Corporation’s insurance coverage may not cover all claims against the Corporation or continue to be available to the Corporation at a reasonable cost. As a result, the Corporation may be exposed to substantial uninsured liabilities, which could adversely affect the Corporation’s results of operations and financial condition.
PART I: ITEM 1A. AND ITEM 1B.
Negative publicity could damage the Corporation’s reputation and adversely impact its business and financial results.
Reputation risk, or the risk to the Corporation’s earnings and capital from negative publicity, is inherent in the Corporation’s business. Negative publicity can result from the Corporation’s actual or alleged conduct in any number of activities, including lending practices, corporate governance and acquisitions, and actions taken by government regulators and community organizations in response to those activities. Negative publicity can adversely affect the Corporation’s ability to keep and attract customers and can expose the Corporation to litigation and regulatory action. Although the Corporation takes steps to minimize reputation risk in dealing with customers and other constituencies, the Corporation is inherently exposed to this risk.
The Corporation may not be able to pay dividends in the future in accordance with past practice.
The Corporation has traditionally paid a quarterly dividend to common stockholders. The payment of dividends is subject to legal and regulatory restrictions. Any payment of dividends in the future will depend, in large part, on the Corporation’s earnings, capital requirements, financial condition and other factors considered relevant by the Corporation’s Board of Directors.
The Corporation’s stock price can be volatile.
The Corporation’s stock price can fluctuate widely in response to a variety of factors, including: actual or anticipated variations in the Corporation’s quarterly operating results; recommendations by securities analysts; significant acquisitions or business combinations; strategic partnerships, joint ventures or capital commitments; operating and stock price performance of other companies that investors deem comparable to the Corporation; new technology used or services offered by the Corporation’s competitors; news reports relating to trends, concerns and other issues in the banking and financial services industry, and changes in government regulations. General market fluctuations, industry factors and general economic and political conditions and events, including terrorist attacks, economic slowdowns or recessions, interest rate changes, credit loss trends or currency fluctuations, could also cause the Corporation’s stock price to decrease, regardless of the Corporation’s operating results.
The Bank is operating under a Settlement Agreement and Agreed Order ("Settlement Agreement") with the United States Department of Justice ("DOJ"), and its failure to comply with the Agreement could materially and adversely affect our business.
The Bank is operating under a Settlement Agreement and Agreed Order with the DOJ, and its failure to comply with the Settlement Agreement could materially and adversely affect our business. Our Board of Directors and executive management team have been working diligently to comply with the Settlement Agreement and believe that they have allocated sufficient resources to address the corrective actions required by the DOJ. Compliance with and resolution of the Settlement Agreement will ultimately be determined by the DOJ. The Bank’s failure to comply with the Settlement Agreement and to successfully implement its requirements or the general perception of the Settlement Agreement by other regulators with jurisdiction over the Corporation or the Bank could have a material and adverse effect on our business, results of operation, financial condition, plans for and timing of future acquisitions and expansion, cash flows and stock price.
ITEM 1B. UNRESOLVED STAFF COMMENTS.
None.
PART I: ITEM 2., ITEM 3. AND ITEM 4.
ITEM 2. PROPERTIES.
The headquarters of the Corporation and the Bank isare located at 200 East Jackson Street, Muncie, Indiana. The building is owned by the Bank.
The Bank conducts business through numerous facilities owned and leased. Of the 119128 banking offices operated by the Bank, 99110 are owned and 2018 are leased from non-affiliated third parties.
None of the properties owned by the Corporation are subject to any major encumbrances. The net investment of the Corporation and subsidiaries in real estate and equipment at December 31, 20172019 was $95,852,000.$113,055,000.
ITEM 3. LEGAL PROCEEDINGS.
There are no pending legal proceedings, other than litigation incidental to the ordinary course of business of the Corporation and its subsidiaries, of a material nature to which the Corporation or its subsidiaries is a party, or of which any of their properties are subject. Further, there are no material legal proceedings in which any director, officer, principal shareholder, or affiliate of the Corporation, or any associate of any such director, officer or principal shareholder, is a party, or has a material interest, adverse to the Corporation or any of its subsidiaries.
None of the routine legal proceedings, individually or in the aggregate, in which the Corporation or its affiliates are involved are expected to have a material adverse impact on the financial position or the results of operations of the Corporation.
ITEM 4. MINE SAFETY DISCLOSURES.
Not applicable.
SUPPLEMENTAL INFORMATION - INFORMATION ABOUT OUR EXECUTIVE OFFICERS OF THE REGISTRANT
The names, ages, and positions with the Corporation and the Bank of all executive officers of the Corporation and all persons chosen to become executive officers are listed below. The officers are elected by the Board of Directors of the Corporation for a term of one year or until the election of their successors. There are no arrangements between any officer and any other person pursuant to which he or she was selected as an officer.
Michael C. Rechin, 59,61, President and Chief Executive Officer, Corporation
President and Chief Executive Officer of the Corporation since April 2007; Chief Operating Officer of the Corporation from November 2005 to April 2007; Executive Vice President, Corporate Banking National City Bank from 1995 to November 2005.
Mark K. Hardwick, 47,49, Executive Vice President and Chief Financial Officer and Chief Operating Officer, Corporation
Executive Vice President and Chief Financial Officer and Chief Operating Officer of the Corporation since May 2016; Executive Vice President and Chief Financial Officer of the Corporation since December 2005; Senior Vice President and Chief Financial Officer of the Corporation from April 2002 to December 2005; Corporate Controller of the Corporation from November 1997 to April 2002.
Michael J. Stewart, 52,54, Executive Vice President and Chief Banking Officer, Corporation
Executive Vice President and Chief Banking Officer of the Corporation since February 2008; Executive Vice President from December 2006 to February 2008 of National City Corp; Executive Vice President and Chief Credit Officer of National City Bank of Indiana from December 2002 to December 2006.
John J. Martin, 51,53, Executive Vice President and Chief Credit Officer, Corporation
Executive Vice President and Chief Credit Officer of the Corporation since March 2013; Senior Vice President and Chief Credit Officer of the Corporation from June 2009 to March 2013; First Vice President and Deputy Chief Credit Officer of the Corporation from July 2008 to June 2009; First Vice President and Senior Manager of Lending Process of the Corporation from January 2008 to July 2008; Senior Vice President and Regional Senior Credit Officer of National City Bank from May 2000 to December 2007.
Stephan H. Fluhler, 49,51, Senior Vice President, Chief Information Officer, Corporation
Senior Vice President and Chief Information Officer of the Corporation since May 2014; Chief Technology Officer of the Corporation from 2004 to May 2014; Director of Technology Services and Change Management of the Corporation from December 2003 to 2004.
Jeffrey B. Lorentson, 54,56, Senior Vice President and Chief Risk Officer, Corporation
Senior Vice President and Chief Risk Officer of the Corporation since June 2007; Corporate Controller of First Indiana Bank from June 2006 to June 2007; First Vice President and Corporate Controller of the Corporation from 2003 to 2006; Vice President and Corporate Controller of the Corporation from 2002 to 2003.
Michele M. Kawiecki, 45,47, Senior Vice President and Director of Finance, Corporation
Senior Vice President and Director of Finance of the Corporation since March 2015; Senior Vice President of Capital Management and Assistant Treasurer of UMB Financial Corporation from May 2011 to March 2015; Director of Corporate Development and Enterprise Project Management at UMB Financial Corporation from May 2008 to May 2011; Chief Risk Officer at UMB Financial Corporation from February 2004 to May 2008.
PART II: ITEM 5. AND ITEM 6.
PART II
ITEM 5. MARKET FOR THE REGISTRANT’S COMMON EQUITY, RELATED STOCKHOLDER MATTERS AND ISSUER PURCHASES OF EQUITY SECURITIES.
PERFORMANCE GRAPH
The following graph compares the cumulative 5-year total return to shareholders on First Merchants Corporation’s common stock relative to the cumulative total returns of the Russell 2000 index the SNL Bank $1B - $5B index, and the SNL Bank $5B - $10B index.KBW Nasdaq Regional Banking Index. The graph assumes that the value of the investment in the Corporation’s common stock and in each of the indexes (including reinvestment of dividends) was $100 on December 31, 20122014 and tracks it through December 31, 20172019.
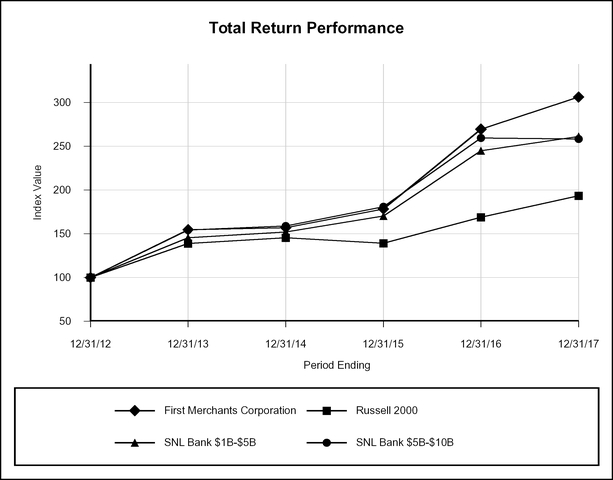
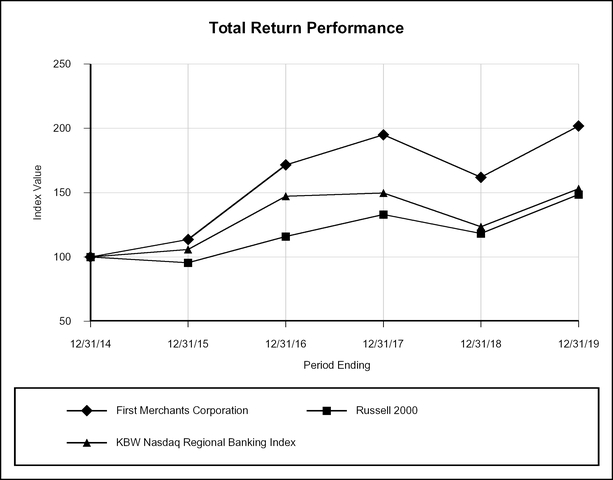
| | | | | | | Period Ending |
| | | | | Period Ending |
| |
| Index | | 12/31/2012 |
| | 12/31/2013 |
| | 12/31/2014 |
| | 12/31/2015 |
| | 12/31/2016 |
| | 12/31/2017 |
| | 12/31/2014 |
| | 12/31/2015 |
| | 12/31/2016 |
| | 12/31/2017 |
| | 12/31/2018 |
| | 12/31/2019 |
|
| First Merchants Corporation | | $ | 100.00 |
| | $ | 154.69 |
| | $ | 157.05 |
| | $ | 178.39 |
| | $ | 269.47 |
| | $ | 306.16 |
| | $ | 100.00 |
| | $ | 113.59 |
| | $ | 171.58 |
| | $ | 194.94 |
| | $ | 161.94 |
| | $ | 201.79 |
|
| Russell 2000 | | 100.00 |
| | 138.82 |
| | 145.62 |
| | 139.19 |
| | 168.85 |
| | 193.58 |
| | 100.00 |
| | 95.59 |
| | 115.95 |
| | 132.94 |
| | 118.30 |
| | 148.49 |
|
| SNL Bank $1B-$5B | | 100.00 |
| | 145.41 |
| | 152.04 |
| | 170.20 |
| | 244.85 |
| | 261.04 |
| |
| SNL Bank $5B-$10B | | 100.00 |
| | 154.28 |
| | 158.92 |
| | 181.04 |
| | 259.37 |
| | 258.40 |
| |
| KBW Nasdaq Regional Banking Index | | | 100.00 |
| | 105.91 |
| | 147.24 |
| | 149.82 |
| | 123.60 |
| | 153.03 |
|
The stock price performance included in this graph is not necessarily indicative of future stock price performance.
COMMON STOCK LISTING
First Merchants Corporation common stock is traded on the Nasdaq Global Select Market under the symbol FRME. At the close of business on February 21, 2020, the number of shares outstanding was 55,155,733. There were 4,479 stockholders of record on that date.
PART II: ITEM 5. AND ITEM 6.
STOCK INFORMATION
|
| | | | | | | | | | | | | | | | | | | | | | | | |
| | | Price Per Share | | | | |
| | | HIGH | | LOW | | Dividends Declared (1) |
| Quarter | | 2017 | | 2016 | | 2017 | | 2016 | | 2017 | | 2016 |
| First quarter | | $ | 42.17 |
| | $ | 25.27 |
| | $ | 35.26 |
| | $ | 21.10 |
| | $ | 0.15 |
| | $ | 0.11 |
|
| Second quarter | | 43.48 |
| | 26.55 |
| | 37.03 |
| | 22.63 |
| | 0.18 |
| | 0.14 |
|
| Third quarter | | 43.33 |
| | 27.42 |
| | 37.09 |
| | 23.89 |
| | 0.18 |
| | 0.14 |
|
| Fourth quarter | | 45.42 |
| | 38.02 |
| | 37.60 |
| | 25.84 |
| | 0.18 |
| | 0.15 |
|
Numbers rounded to nearest cent when applicable.
The table above lists per share prices and dividend payments during 2017 and 2016. Prices are as reported by the National Association of Securities Dealers Automated Quotation – Global Select Market System.
COMMON STOCK LISTING
First Merchants Corporation common stock is traded over-the-counter on the NASDAQ Global Select Market System. Quotations are carried in many daily papers. The NASDAQ symbol is FRME (Cusip #320817-10-9). At the close of business on February 22, 2018, the number of shares outstanding was 49,540,866. There were 4,056 stockholders of record on that date.
PURCHASES OF EQUITY SECURITIES BY THE ISSUER AND AFFILIATED PURCHASES
The following table presents information relating to our purchases of equity securities during the three months ended December 31, 2017,2019, as follows:
|
| | | | | | | | | | |
| Period | | Total Number
of Shares
Purchased | | Average
Price Paid
per Share | | Total Number of Shares
Purchased as part of Publicly announced Plans or Programs | | Maximum Number of Shares
that may yet be Purchased
Under the Plans or Programs |
| October, 2017 | | 358 |
| | $43.19 | | | | |
| November, 2017 | | 222 |
| 0.03253 |
| $43.89 | | | | |
| December, 2017 | | | | | | | | |
|
| | | | | | | | | | | | | |
| Period | | Total Number
of Shares
Purchased (1) | | Average
Price Paid
per Share | | Total Number of Shares
Purchased as part of Publicly announced Plans or Programs | | Maximum Number of Shares
that may yet be Purchased
Under the Plans or Programs (2) |
| October, 2019 |
| — |
|
| $ | — |
|
| — |
|
| 2,483,984 |
|
| November, 2019 |
| — |
|
| $ | — |
|
| — |
|
| 2,483,984 |
|
| December, 2019 |
| 116 |
|
| $ | 41.11 |
|
| — |
|
| 2,483,984 |
|
The
(1) Includes shares were purchasedrepurchased pursuant to net settlement by employees in connection with the exercisesatisfaction of certain outstanding stock options andincome tax withholding obligations incurred through the vesting of certainthe Corporation's restricted stock awards.
(2)On February 9, 2016,September 3, 2019, the Board of Directors of the Corporation approved a stock repurchase program of up to $153 million of the outstanding shares of the Corporation’sCorporation's outstanding common stock. As of December 31, 2017,stock; provided however, that the total aggregate investment in shares repurchased under the program may not exceed $75,000,000. The program does not have an expiration date. However it may be discontinued by the Board at any time. Since commencing the program, the Corporation has not made any purchases under the program. The program, which does not haverepurchased a stated expiration date, may be discontinued at any time.
total of 516,016 shares of common stock for a total investment of $19.0 million.
EQUITY COMPENSATION PLAN INFORMATION
The following table provides information about the Corporation’s common stock that may be issued under equity compensation plans as of December 31, 2017.2019.
| | | Plan Category | | Number of securities to be
issued upon exercise of
outstanding options,
warrants and rights | | Weighted-average
exercised price of
outstanding options,
warrants and rights | | Number of securities remaining
available for future issuance
under equity compensations
plans (excluding securities
reflected in first column) | | Number of securities to be
issued upon exercise of
outstanding options,
warrants and rights | | Weighted-average
exercised price of
outstanding options,
warrants and rights | | Number of securities remaining
available for future issuance
under equity compensations
plans (excluding securities
reflected in first column) |
| Equity compensation plans approved by stockholders | | 152,652 |
| | $ | 16.70 |
| | 419,173 |
| | 59,350 |
| | $ | 13.51 |
| | 1,625,354 |
|
| Total | | 152,652 |
| | $ | 16.70 |
| | 419,173 |
| | 59,350 |
| | $ | 13.51 |
| | 1,625,354 |
|
(1) The“Dividend Limitations” section of “BUSINESS - REGULATION AND SUPERVISION OF FIRST MERCHANTS CORPORATION AND SUBSIDIARIES” included in Item 1 of this Annual Report on Form 10-K, the “CAPITAL” and “LIQUIDITY” sections of “Management's Discussion & Analysis of Financial Condition and Results of Operations” included as Item 7 of this Annual Report on Form 10-K and NOTE 17. REGULATORY CAPITAL AND DIVIDENDS of the Notes to Consolidated Financial Statements included in Item 8 of this Annual Report on Form 10-K include discussions regarding dividend restrictions.
PART II: ITEM 5. AND ITEM 6.
ITEM 6. SELECTED FINANCIAL DATA.
| | | (Dollars in Thousands, Except Share Data) | 2017 | | 2016 | | 2015 | | 2014 | | 2013 | 2019 | | 2018 | | 2017 | | 2016 | | 2015 |
Operations (1) (2) (3) (4) (5) (6) | | | | | | | | | | |
Operations (1) (2) (3) (4) (5) | | | | | | | | | | |
| Net interest income fully taxable equivalent (FTE) basis | $ | 294,554 |
| | $ | 240,014 |
| | $ | 207,379 |
| | $ | 194,958 |
| | $ | 160,308 |
| $ | 369,745 |
| | $ | 349,589 |
| | $ | 294,554 |
| | $ | 240,014 |
| | $ | 207,379 |
|
| Less tax equivalent adjustment | 17,270 |
| | 13,541 |
| | 10,975 |
| | 7,921 |
| | 6,043 |
| 13,085 |
| | 10,732 |
| | 17,270 |
| | 13,541 |
| | 10,975 |
|
| Net interest income | 277,284 |
| | 226,473 |
| | 196,404 |
| | 187,037 |
| | 154,265 |
| 356,660 |
| | 338,857 |
| | 277,284 |
| | 226,473 |
| | 196,404 |
|
| Provision for loan losses | 9,143 |
| | 5,657 |
| | 417 |
| | 2,560 |
| | 6,648 |
| 2,800 |
| | 7,227 |
| | 9,143 |
| | 5,657 |
| | 417 |
|
| Net interest income after provision for loan losses | 268,141 |
| | 220,816 |
| | 195,987 |
| | 184,477 |
| | 147,617 |
| 353,860 |
| | 331,630 |
| | 268,141 |
| | 220,816 |
| | 195,987 |
|
| Total other income | 71,009 |
| | 65,203 |
| | 69,868 |
| | 61,816 |
| | 51,831 |
| 86,688 |
| | 76,459 |
| | 71,009 |
| | 65,203 |
| | 69,868 |
|
| Total other expenses | 205,556 |
| | 177,359 |
| | 174,806 |
| | 164,008 |
| | 139,034 |
| 246,763 |
| | 219,951 |
| | 205,556 |
| | 177,359 |
| | 174,806 |
|
| Income before income tax expense | 133,594 |
| | 108,660 |
| | 91,049 |
| | 82,285 |
| | 60,414 |
| 193,785 |
| | 188,138 |
| | 133,594 |
| | 108,660 |
| | 91,049 |
|
| Income tax expense | 37,524 |
| | 27,609 |
| | 25,665 |
| | 22,123 |
| | 15,884 |
| 29,325 |
| | 28,999 |
| | 37,524 |
| | 27,609 |
| | 25,665 |
|
| Net income | 96,070 |
| | 81,051 |
| | 65,384 |
| | 60,162 |
| | 44,530 |
| |
| Preferred stock dividends and discount accretion | | | | |
|
| |
|
| | (2,380 | ) | |
| Net income available to common stockholders | $ | 96,070 |
| | $ | 81,051 |
| | $ | 65,384 |
| | $ | 60,162 |
| | $ | 42,150 |
| $ | 164,460 |
| | $ | 159,139 |
| | $ | 96,070 |
| | $ | 81,051 |
| | $ | 65,384 |
|
| | | | | | | | | | | | | | | | | | | |
| Per Share Data | | | | | | | | | | | | | | | | | | |
| Basic net income available to common stockholders | $ | 2.13 |
| | $ | 1.99 |
| | $ | 1.73 |
| | $ | 1.66 |
| | $ | 1.42 |
| $ | 3.20 |
| | $ | 3.23 |
| | $ | 2.13 |
| | $ | 1.99 |
| | $ | 1.73 |
|
| Diluted net income available to common stockholders | 2.12 |
| | 1.98 |
| | 1.72 |
| | 1.65 |
| | 1.41 |
| 3.19 |
| | 3.22 |
| | 2.12 |
| | 1.98 |
| | 1.72 |
|
| Cash dividends paid - common | 0.69 |
| | 0.54 |
| | 0.41 |
| | 0.29 |
| | 0.18 |
| 1.00 |
| | 0.84 |
| | 0.69 |
| | 0.54 |
| | 0.41 |
|
| December 31 book value - common | 26.51 |
| | 22.04 |
| | 20.91 |
| | 19.29 |
| | 17.67 |
| 32.26 |
| | 28.53 |
| | 26.51 |
| | 22.04 |
| | 20.91 |
|
December 31 tangible book value - common (7) | 16.96 |
| | 15.85 |
| | 14.68 |
| | 13.65 |
| | 12.17 |
| |
December 31 tangible book value - common (6) | | 21.94 |
| | 19.12 |
| | 16.96 |
| | 15.85 |
| | 14.68 |
|
| December 31 market value (bid price) - common | 42.06 |
| | 37.65 |
| | 25.42 |
| | 22.75 |
| | 22.72 |
| 41.59 |
| | 34.27 |
| | 42.06 |
| | 37.65 |
| | 25.42 |
|
| | | | | | | | | | | | | | | | | | | |
Average Balances (1) (2) (3) (4) (5) (6) | | | | | | | | | | |
Average Balances (1) (2) (3) (4) (5) | | | | | | | | | | |
| Total assets | $ | 8,196,229 |
| | $ | 6,899,265 |
| | $ | 6,085,687 |
| | $ | 5,571,354 |
| | $ | 4,455,411 |
| $ | 11,091,320 |
| | $ | 9,689,057 |
| | $ | 8,196,229 |
| | $ | 6,899,265 |
| | $ | 6,085,687 |
|
Total loans (8) | 5,881,284 |
| | 4,814,005 |
| | 4,179,839 |
| | 3,730,080 |
| | 3,008,555 |
| |
Total loans (7) | | 7,690,190 |
| | 6,997,771 |
| | 5,881,284 |
| | 4,814,005 |
| | 4,179,839 |
|
| Earning assets | 7,335,702 |
| | 6,180,050 |
| | 5,464,829 |
| | 4,985,338 |
| | 4,017,247 |
| 10,015,771 |
| | 8,736,367 |
| | 7,335,702 |
| | 6,180,050 |
| | 5,464,829 |
|
| Total deposits | 6,368,751 |
| | 5,438,217 |
| | 4,806,503 |
| | 4,363,955 |
| | 3,465,640 |
| 8,782,634 |
| | 7,569,482 |
| | 6,368,751 |
| | 5,438,217 |
| | 4,806,503 |
|
| Total stockholders' equity | 1,110,524 |
| | 884,664 |
| | 753,724 |
| | 675,295 |
| | 540,255 |
| 1,569,615 |
| | 1,343,861 |
| | 1,110,524 |
| | 884,664 |
| | 753,724 |
|
| | | | | | | | | | | | | | | | | | | |
Year-End Balances (1) (2) (3) (4) (5) (6) | | | | | | | | | | |
Year-End Balances (1) (2) (3) (4) (5) | | | | | | | | | | |
| Total assets | $ | 9,367,478 |
| | $ | 7,211,611 |
| | $ | 6,761,003 |
| | $ | 5,824,127 |
| | $ | 5,437,262 |
| $ | 12,457,254 |
| | $ | 9,884,716 |
| | $ | 9,367,478 |
| | $ | 7,211,611 |
| | $ | 6,761,003 |
|
Total loans (8) | 6,758,415 |
| | 5,142,574 |
| | 4,703,716 |
| | 3,932,100 |
| | 3,637,740 |
| |
Total loans (7) | | 8,468,347 |
| | 7,229,245 |
| | 6,758,415 |
| | 5,142,574 |
| | 4,703,716 |
|
| Allowance for loan losses | 75,032 |
| | 66,037 |
| | 62,453 |
| | 63,964 |
| | 67,870 |
| 80,284 |
| | 80,552 |
| | 75,032 |
| | 66,037 |
| | 62,453 |
|
| Total deposits | 7,172,530 |
| | 5,556,498 |
| | 5,289,647 |
| | 4,640,694 |
| | 4,231,468 |
| 9,839,956 |
| | 7,754,593 |
| | 7,172,530 |
| | 5,556,498 |
| | 5,289,647 |
|
| Total stockholders' equity | 1,303,463 |
| | 901,657 |
| | 850,509 |
| | 726,827 |
| | 634,923 |
| 1,786,437 |
| | 1,408,260 |
| | 1,303,463 |
| | 901,657 |
| | 850,509 |
|
| | | | | | | | | | | | | | | | | | | |
Financial Ratios (1) (2) (3) (4) (5) (6) | | | | | | | | | | |
Financial Ratios (1) (2) (3) (4) (5) | | | | | | | | | | |
| Return on average assets | 1.17 | % | | 1.17 | % | | 1.07 | % | | 1.08 | % | | 0.95 | % | 1.48 | % | | 1.64 | % | | 1.17 | % | | 1.17 | % | | 1.07 | % |
| Return on average stockholders' equity | 8.65 |
| | 9.16 |
| | 8.67 |
| | 8.91 |
| | 7.80 |
| 10.48 |
| | 11.84 |
| | 8.65 |
| | 9.16 |
| | 8.67 |
|
| Average earning assets to average assets | 89.50 |
| | 89.58 |
| | 89.80 |
| | 89.48 |
| | 90.17 |
| 90.30 |
| | 90.17 |
| | 89.50 |
| | 89.58 |
| | 89.80 |
|
| Allowance for loan losses as % of total loans | 1.11 |
| | 1.28 |
| | 1.33 |
| | 1.63 |
| | 1.87 |
| 0.95 |
| | 1.11 |
| | 1.11 |
| | 1.28 |
| | 1.33 |
|
| Dividend payout ratio | 32.55 |
| | 27.27 |
| | 23.84 |
| | 17.58 |
| | 12.77 |
| 31.35 |
| | 26.09 |
| | 32.55 |
| | 27.27 |
| | 23.84 |
|
| Average stockholders' equity to average assets | 13.55 |
| | 12.82 |
| | 12.39 |
| | 12.12 |
| | 12.13 |
| 14.15 |
| | 13.87 |
| | 13.55 |
| | 12.82 |
| | 12.39 |
|
| Tax equivalent yield on earning assets | 4.53 |
| | 4.32 |
| | 4.25 |
| | 4.35 |
| | 4.40 |
| 4.78 |
| | 4.79 |
| | 4.53 |
| | 4.32 |
| | 4.25 |
|
| Cost of supporting liabilities | 0.51 |
| | 0.43 |
| | 0.45 |
| | 0.44 |
| | 0.41 |
| 1.09 |
| | 0.79 |
| | 0.51 |
| | 0.43 |
| | 0.45 |
|
| Net interest margin on earning assets | 4.02 |
| | 3.89 |
| | 3.80 |
| | 3.91 |
| | 3.99 |
| 3.69 |
| | 4.00 |
| | 4.02 |
| | 3.89 |
| | 3.80 |
|
(1) Effective November 12, 2013, the Corporation acquired 100 percent of CFS in an all stock transaction. CFS was headquartered in Munster, Indiana and had 20 banking centers in northwestern Indiana and northeastern Illinois. Pursuant to the merger agreement, the shareholders of CFS received 0.65 percent of a share of the Corporation's common stock for each share of CFS common stock held. The Corporation issued approximately 7.1 million shares of common stock, which was valued at approximately $135.6 million.
(2) Effective November 7, 2014, the Corporation acquired 100 percent of Community. Community was headquartered in Noblesville, Indiana and had 10 banking centers serving central Indiana. Pursuant to the merger agreement, each outstanding share of common stock of Community was converted into the right to receive either (a) 4.0926 shares of First Merchants' common stock, plus cash in lieu of fractional shares; or (b) $85.94 in cash, based upon shareholder elections. The Corporation paid $14.2 million in cash and issued approximately 1.6 million shares of common stock, valued at $35.0 million, for a total purchase price of approximately $49.2 million.
(3) Effective April 17, 2015, the Corporation acquired 100 percent of C Financial. C Financial was headquartered in Columbus, Ohio and had 6 full service banking centers serving the Columbus, Ohio market. Pursuant to the merger agreement, shareholders of C Financial received $6.738 in cash for each share of C Financial stock held, resulting in a total purchase price of $14.5 million.
(4)(2) Effective December 31, 2015, the Corporation acquired 100 percent of Ameriana. Ameriana was headquartered in New Castle, Indiana and had 13 full service banking centers in east central and central Indiana. Pursuant to the merger agreement, shareholders of Ameriana received .9037 shares of the Corporation's common stock for each share of Ameriana Bancorp common stock held. The Corporation issued approximately 2.8 million shares of common stock, which was valued at approximately $70.4 million.
(5)(3) Effective May 19, 2017, the Corporation acquired 100 percent of Arlington Bank. Arlington Bank was headquartered in Columbus, Ohio and had 3 full service banking centers serving the Columbus, Ohio market. Pursuant to the merger agreement, each Arlington Bank shareholder received 2.7245 shares of the Corporation's common stock for each outstanding share of Arlington Bank common stock held. The Corporation issued approximately 2.1 million shares of common stock, which was valued at approximately $82.6 million. The details of the acquisition can be found in NOTE 2. ACQUISITIONS of the Notes to Consolidated Financial Statements included in Item 8 of this Annual Report on Form 10-K.
(6)(4) On November 21, 2016, the Corporation purchased 495,112 shares, or 12.1 percent, of IAB's outstanding common stock from an IAB shareholder for $19.8 million. Effective July 14, 2017, the Corporation acquired the remaining shares of IAB common stock. IAB was headquartered in Fort Wayne, Indiana and had 16 full service banking centers serving the Fort Wayne, Indiana market. Pursuant to the merger agreement, each IAB shareholder received 1.653 shares of the Corporation's common stock for each outstanding share of IAB common stock held. The Corporation issued approximately 6.0 million shares of common stock. The transaction value for the remaining shares of common stock, not owned by the Corporation, was approximately $238.8 million, resulting in a total purchase price of $258.6 million.
(5) On September 1, 2019, the Corporation acquired 100 percent of MBT. MBT was headquartered in Monroe, Michigan and had 20 banking centers serving the Monroe market. Pursuant to the merger agreement, each MBT shareholder received 0.275 shares of the Corporation's common stock for each outstanding share of MBT common stock held. The Corporation issued approximately 6.4 million shares of common stock, which was valued at approximately $229.9 million. The details of the acquisition can be found in NOTE 2. ACQUISITIONSACQUISITION of the Notes to Consolidated Financial Statements included in Item 8 of this Annual Report on Form 10-K.
(7)(6) Non-GAAP reconciliation can be found in the “Capital” section of Management’s Discussion and Analysis of Financial Condition and Results of Operations included as Item 7 of this Annual Report on Form 10-K.
(8)(7) Includes loans held for sale.
PART II: ITEM 7. AND ITEM 7A. MANAGEMENT'S DISCUSSION AND ANALYSIS OF FINANCIAL CONDITION AND RESULTS OF OPERATIONS
ITEM 7. MANAGEMENT’S DISCUSSION AND ANALYSIS OF FINANCIAL CONDITION AND RESULTS OF OPERATIONS.
CRITICAL ACCOUNTING POLICIES
Generally accepted accounting principles require management to apply significant judgment to certain accounting, reporting and disclosure matters. Management must use assumptions and estimates to apply those principles where actual measurement is not possible or practical. The judgments and assumptions made are based upon historical experience or other factors that management believes to be reasonable under the circumstances. Because of the nature of the judgments and assumptions, actual results could differ from estimates, which could have a material effect on our financial condition and results of operations. For a complete discussion of the Corporation’s significant accounting policies, see NOTE 1. NATURE OF OPERATIONS AND SUMMARY OF SIGNIFICANT ACCOUNTING POLICIES of the Notes to Consolidated Financial Statements included in Item 8 of this Annual Report on Form 10-K.
The following policies materially affect our reported earnings and financial condition and require significant judgments and estimates. Management has reviewed these critical accounting estimates
Business Combinations
Business combinations are accounted for under the acquisition method of accounting. Under the acquisition method, assets and related disclosuresliabilities of the business acquired are recorded at their estimated fair values as of the date of acquisition with our Audit Committee.any excess of the cost of the acquisition over the fair value of the net tangible and intangible assets acquired recorded as goodwill. Results of operations of the acquired business are included in the income statement from the date of acquisition.
Investment Securities
Available for sale securities are recorded at fair value on a recurring basis with the unrealized gains and losses, net of applicable income taxes, recorded in other comprehensive income. Realized gains and losses are recorded in earnings and the prior fair value adjustments are reclassified within stockholders' equity. Gains and losses on sales of securities are determined on the specific-identification method. Amortization of premiums and accretion of discounts are recorded as interest income from securities.
Available for sale and held to maturity securities are evaluated for OTTI at least on a quarterly basis, and more frequently when economic or market conditions warrant such an evaluation. The investment securities portfolio is evaluated for OTTI by segregating the portfolio into two general segments and applying the appropriate OTTI model. Investment securities are generally evaluated for OTTI under ASC 320, Investments - Debt and Equity Securities. However, certain purchased beneficial interest, including certain non-agency government-sponsored mortgage-backed securities, asset-backed securities and collateralized debt obligations are evaluated using the model outlined in ASC 325-10, Investments - Other.
In determining OTTI, under ASC 320, management considers many factors, including: (1) the length of time and the extent to which the fair value has been less than cost, (2) the financial condition and near term prospects of the issuer, (3) whether the market decline was affected by macroeconomic conditions, and (4) whether the Corporation has the intent to sell the debt security or more likely than not, will be required to sell the debt security before its anticipated recovery. The assessment of whether an other-than-temporary decline exists involves a high degree of subjectivity and judgment and is based on the information available to management at a point in time.
When OTTI occurs, the amount of OTTI recognized in the income statement depends on whether the Corporation intends to sell the security or it is more likely than not that the Corporation will be required to sell the security before recovery of its amortized cost basis, less any recognized credit loss. If the intent is to sell, or it is more likely than not that the Corporation will be required to sell the security before recovery of its amortized cost basis, less any recognized credit loss, the OTTI shall be recognized in earnings equal to the entire difference between the investment’s amortized cost basis, less any recognized credit loss, and its fair value at the balance sheet date. If the intent is not to sell the security and it is not more likely than not that the Corporation will be required to sell the security before the recovery of its amortized cost basis less any recognized credit loss, the OTTI has been separated into the amount representing the credit loss and the amount related to all other factors. The amount of the total OTTI related to the credit loss is determined based on the present value of cash flows expected to be collected and is recognized in earnings. The amount of the total OTTI related to other factors is recognized in other comprehensive income, net of applicable income taxes. The previous amortized cost basis less the OTTI recognized in earnings becomes the new amortized cost basis of the investment.
Held to maturity securities are classified as held to maturity when the Corporation has the positive intent and ability to hold the securities to maturity. Securities held to maturity are carried at amortized cost. For held to maturity debt securities, the amount of an OTTI recorded in other comprehensive income for the noncredit portion of a previous other-than-temporary impairment is amortized prospectively over the remaining life of the security on the basis of the timing of future estimated cash flows of the security.
Loans
The Corporation’s loan portfolio is carried at the principal amount outstanding, net of unearned income.income and principal charge-offs. Certain non-accrual, substantially delinquent and renegotiated loans classified as troubled debt restructures may be considered to be impaired in accordance with ASC 310, Receivables. Under ASC 310,310-10, a loan is impaired when, based on current information or events, it is probable all amounts due (principal and interest) according to the contractual terms of the loan agreement are uncollectible. Renegotiated consumer loans classified as troubled debt restructures are considered to be impaired. In applying the provisions of ASC 310,310-10, the Corporation considers all other investments in one-to-four family residential loans and consumer installment loans to be homogeneous and therefore excluded from separate identification for evaluation of impairment. Interest income is accrued on the principal balances of loans. The accrual of interest is discontinued on a loan when, in management’s opinion, the borrower may be unable to meet payments as they become due. When the interest accrual is discontinued, all unpaid accrued interest is reversed against earnings when considered uncollectible. Interest income accrued in the prior year, if any, is charged to the allowance for loan losses. Interest income is subsequently recognized only to the extent cash payments are received and the loan is returned to accruing status. Certain loan fees and direct costs are being deferred and amortized as an adjustment of yield on the loans.
Impaired loans are carried at the fair value of collateral if the loan is collateral dependent, or the present value of estimated future cash flows using the loan’s existing rate. A portion of the allowance for loan losses is allocated to impaired loans if the value of such loans is deemed to be less than the unpaid balance. If these allocations cause the allowance for loan losses to increase, such increase is reported as a component of the provision for loan losses. Loan losses are charged against the allowance when management believes the uncollectability of the loan is confirmed. The valuation would be considered Level 3, consisting of appraisals of underlying collateral and discounted cash flow analysis.
Interest income is accrued on the principal balances of loans. The accrual of interest is discontinued on a loan when, in management’s opinion, the borrower may be unable to meet payments as they become due. When the interest accrual is discontinued, all unpaid accrued interest is reversed against earnings when considered uncollectible. Interest income accrued in the prior year, if any, is charged to the allowance for loan losses. Interest income is subsequently recognized only to the extent cash payments are received and the loan is returned to accruing status. Certain loan fees and direct costs are being deferred and amortized as an adjustment of yield on the loans.
PART II: ITEM 7. AND ITEM 7A. MANAGEMENT'S DISCUSSION AND ANALYSIS OF FINANCIAL CONDITION AND RESULTS OF OPERATIONS
Loan commitments and letters-of-credit generally have short-term, variable-rate features and contain clauses which limit the exposure to changes in customer credit quality. Accordingly, their carrying values, which are immaterial at the respective balance sheet dates, are reasonable estimates of fair value.
Loans Acquired in Business Combinations
Loans acquired in a business combination with evidence of credit deterioration since origination and for which it is probable that all contractually required payments will not be collected are considered to be purchased credit impaired. Evidence of credit quality deterioration as of purchase dates may include information such as past-due and nonaccrual status, borrower credit scoresrisk grade and recent loan to value percentages. AcquiredPurchased credit-impaired loans are accounted for under the accounting guidance for loans and debt securities acquired with deteriorated credit quality (ASC 310-30). These loans are initially measured at fair value based upon expected cash flows without anticipation of prepayments and includes estimated future credit losses expected to be incurred over the life of the loans. As a result, related discounts are recognized subsequently through accretion based on the expected cash flows of the acquired loans. For purposes of applying ASC 310-30, loans acquired in business combinations are individually evaluated for the initial fair value measurement. Accordingly, allowances for credit losses related to these loans are not carried over and recorded at the acquisition date.
The difference between contractually required payments and the cash flows expected to be collected at acquisition is referred to as the nonaccretable portion of the fair value discount or premium. The accretable portion of the fair value discount or premium is the difference between the expected cash flows and the net present value of expected cash flows, with such difference accreted into earnings over the term of the loans. Acquired loans not accounted for under ASC 310-30 are accounted for under ASC 310-20, which allows the fair value adjustment to be accreted into income over the remaining life of the loans.
Allowance for Loan Losses
The allowance for loan losses is maintained to absorb losses inherent in the loan portfolio and is based on ongoing, quarterly assessments of the probable losses inherent in the loan portfolio. The allowance is increased by the provision for loan losses, which is charged against current operating results. Loan losses are charged against the allowance when management believes the uncollectability of a loan balance is confirmed. Subsequent recoveries, if any, are credited to the allowance. The Corporation’s strategy for credit risk management includes credit policies and underwriting criteria for all loans, as well as an overall credit limit for each customer significantly below legal lending limits. The strategy also emphasizes diversification on regional geographic and industry levels, regular credit quality reviews and management reviews of large credit exposures and loans experiencing deterioration of credit quality.
The Corporation’s methodology for assessing the appropriateness of the allowance consists of three key elements – the determination of the appropriate reserves for impaired loans accounted for under ASC 310,310-10, probable losses estimated from historical loss rates, and probable losses resulting from economic, environmental, qualitative or other deterioration above and beyond what is reflected in the first two components of the allowance.
Commercial relationships greater than $500,000 that exhibit probable or observed credit weaknesses are subject to individual review. Where appropriate, reserves are allocated to individual loans based on management’s estimate of the borrower’s ability to repay the loan given the availability of collateral, other sources of cash flow and legal options available to the Corporation. Included in the review of individual loansLoans individually evaluated for impairment are those deemed impaired in accordance with ASC 310-10, including commercial relationships greater than $500,000 that are impaired as provided in ASC 310.exhibit well defined credit weaknesses. Any allowances for impaired loans are measured based on the fair value of the underlying collateral, if collateral dependent, or the present value of expected future cash flows discounted at the loan’s effective interest rate. The Corporation evaluates the collectability of principal when assessing the need for a loss accrual. Historical loss rates are applied to other commercial loans not subject to specific reserve allocations.
The historical allocation for commercial loans graded pass are established by loan segments using loss rates based on the Corporation’s migration analysis. This migration analysis shows the loss rates for each segment of loans based on the loan grades at the beginning of the twelve month period. This loss rate is then applied to the current portfolio of loans in each respective loan segment.
Homogenous loans, such as consumer installment and residential mortgage loans, are not individually risk graded. Reserves are established for each segment of loans using loss rates based on charge-offs for the same period as the migration analysis used for commercial loans.
Historical loss allocations for commercial and consumer loans may be adjusted for significant factors that, in management’s judgment, reflect the impact of any current conditions on loss recognition. Factors which management considers in the analysis include the effects of the national and local economies, trends in loan growth and charge-off rates, changes in mix, concentration of loans in specific industries, asset quality trends (delinquencies, charge-offs and non-accrual loans), risk management and loan administration, changes in the internal lending policies and credit standards, examination results from bank regulatory agencies and the Corporation’s internal loan review.
Goodwill and Intangibles
For acquisitions, assets acquired, including identified intangible assets, and the liabilities assumed are required to be recorded at their fair value. These often involve estimates based on third party valuations, such as appraisals, or internal valuations based on discounted cash flow analysis or other valuation techniques that may include estimates of attrition, inflation, asset growth rates, or other relevant factors. In addition, the determination of the useful lives over which the intangible asset will be amortized is subjective. Intangible Assets that are subject to amortization, including core deposit intangibles, are being amortized on both the straight-line and accelerated basis over two to twentyten years. Intangible assets are periodically evaluated as to the recoverability of their carrying value.
Under ASC 350, Intangibles – Goodwill and Other, goodwill recorded must be reviewed for impairment on an annual basis, as well as on an interim basis if events or changes indicate that the asset might be impaired. An impairment loss must be recognized for any excess of carrying value over fair value of the goodwill. The Corporation completed its most recent annual goodwill impairment test on October 1, 20172019 and concluded, based on current events and circumstances, goodwill is not impaired.
PART II: ITEM 7. AND ITEM 7A. MANAGEMENT'S DISCUSSION AND ANALYSIS OF FINANCIAL CONDITION AND RESULTS OF OPERATIONS
Derivative Instruments
Derivative instruments are carried at the fair value of the derivatives and reflects the estimated amounts that would have been received to terminate these contracts at the reporting date based upon pricing or valuation models applied to current market information.
As part of the asset/liability management program, the Corporation will utilize, from time to time, interest rate floors, caps or swaps to reduce its sensitivity to interest rate fluctuations. These are derivative instruments, which are recorded as assets or liabilities in the consolidated balance sheets at fair value. Changes in the fair values of derivatives are reported in the consolidated statements of operations or AOCI depending on the use of the derivative and whether the instrument qualifies for hedge accounting. The key criterion for the hedge accounting is that the hedged relationship must be highly effective in achieving offsetting changes in those cash flows that are attributable to the hedged risk, both at inception of the hedge and on an ongoing basis.
Derivatives that qualify for the hedge accounting treatment are designated as either: (1) a hedge of the fair value of the recognized asset or liability, or of an unrecognized firm commitment (a fair value hedge); or (2) a hedge of a forecasted transaction or the variability of cash flows to be received or paid related to a recognized asset or liability (a cash flow hedge). To date, the Corporation has only entered into a cash flow hedge. For cash flow hedges, changes in the fair values of the derivative instruments are reported in AOCI to the extent the hedge is effective. The gains and losses on derivative instruments that are reported in AOCI are reflected in the consolidated statements of income in the periods in which the results of operations are impacted by the variability of the cash flows of the hedged item. Generally, net interest income is increased or decreased by amounts receivable or payable with respect to the derivatives, which qualify for hedge accounting. At inception of the hedge, the Corporation establishes the method it uses for assessing the effectiveness of the hedging derivative and the measurement approach for determining the ineffective aspect of the hedge. The ineffective portion of the hedge, if any, is recognized in the consolidated statements of income. The Corporation excludes the time value expiration of the hedge when measuring ineffectiveness.
The Corporation offers interest rate derivative products (e.g. interest rate swaps) to certain of its high-quality commercial borrowers. This product allows customers to enter into an agreement with the Corporation to swap their variable rate loan to a fixed rate. These derivative products are designed to reduce, eliminate or modify the risk of changes in the borrower’s interest rate or market price risk. The extension of credit incurred through the execution of these derivative products is subject to the same approvals and rigorous underwriting standards as the related traditional credit product. The Corporation limits its risk exposure to these products by entering into a mirror-image, offsetting swap agreement with a separate, well-capitalized and rated counterparty previously approved by the Credit and Asset Liability Committee. By using these interest rate swap arrangements, the Corporation is also better insulated from the interest rate risk associated with underwriting fixed-rate loans. These derivative contracts are not designated against specific assets or liabilities under ASC 815, Derivatives and Hedging, and, therefore, do not qualify for hedge accounting. The derivatives are recorded on the balance sheet at fair value and changes in fair value of both the customer and the offsetting swap agreements are recorded (and essentially offset) in non-interest income. The fair value of the derivative instruments incorporates a consideration of credit risk (in accordance with ASC 820, Fair Value Measurements and Disclosures), resulting in some volatility in earnings each period.
Income Taxes
Income tax in the consolidated statements of income includes deferred income tax provisions or benefits for all significant temporary differences in recognizing income and expenses for financial reporting and income tax purposes. The Corporation files consolidated income tax returns with its subsidiaries. The Corporation is generally no longer subject to U.S. federal, state and local income tax examinations by tax authorities for tax years before 2014.2016.
The Corporation adopted the provisions of the ASC 740, Income Taxes, which prescribes a recognition threshold and measurement attribute for the financial statement recognition and measurement of a tax position taken or expected to be taken in a tax return. ASC 740 also provides guidance on derecognition, classification, interest and penalties, accounting in interim periods, disclosure and transition. As a result of the implementation of ASC 740, the Corporation did not identify any uncertain tax positions that it believes should be recognized in the financial statements. The Corporation reviews income tax expense and the carrying value of deferred tax assets and liabilities quarterly; as new information becomes available, the balances are adjusted if applicable. The Corporation's policy is to recognize interest and penalties related to unrecognized tax benefits, if any, as a component of income tax expense.
RESULTS OF OPERATIONS – 20172019
Net income available to stockholders for the year ended December 31, 2019 was $96.1 million, an increase of $15.0$164.5 million compared to $81.1$159.1 million during the same period in 2016.2018. Earnings per fully diluted common share for 20172019 totaled $2.12, an increase of $0.14 per share, or 7.1 percent, over $1.98$3.19 compared to $3.22 during the same period in 2016.
2018. Included in the 20172019 results were $12.2$13.7 million, or $0.18$0.21 per share, of acquisition-related expenses associated with the acquisition merger and system conversion expenses related to the acquisitions of Arlington Bank and IAB.MBT. Details of the acquisitionsMBT acquisition, which occurred on September 1, 2019, are included inwithin NOTE 2. ACQUISITIONS of the Notes to Consolidated Financial Statements included in Item 8 of this Annual Report on Form 10-K. Additionally, the revaluation of the Corporation's deferred tax assets and liabilities as a result of the enactment of the Tax Cuts and Jobs Act ("TCJA") resulted in the recognition of additional income tax expense of $5.1 million, or $0.11 per share. Details of the impact of the TCJA are included in NOTE 21. INCOME TAXACQUISITION of the Notes to Consolidated Financial Statements included in Item 8 of this Annual Report on Form 10-K.
As of December 31, 2017,2019, total assets equaled $9.4$12.5 billion compared to $7.2$9.9 billion as of year end 2016,2018, an increase of 29.9$2.6 billion, or 26.0 percent. On May 19, 2017, the Corporation acquired Arlington Bank, which resulted $338.7 million of additional assets and on July 14, 2017, the Corporation acquired IAB, whichThe MBT acquisition resulted in $1.2$1.5 billion of additional assets. Excluding the growthasset increase in total assets from the acquisitions, organic asset growth totaled $604.7 million, or 8.4 percent, in 2017.
PART II: ITEM 7. AND ITEM 7A. MANAGEMENT'S DISCUSSION AND ANALYSIS OF FINANCIAL CONDITION AND RESULTS OF OPERATIONS
2019. The Corporation's total loan portfolio equaled $6.8$8.5 billion as of December 31, 2017,2019, an increase of $1.6$1.2 billion, or 17.1 percent from December 31, 2016. The Arlington Bank and IAB acquisitions contributed $232.32018. Excluding the MBT loans acquired of $732.6 million, and $726.0 millionthe Corporation's loan portfolio grew organically in total loans, respectively. Organic total loan growth equaled $657.62019 by $506.5 million, or 12.8 percent, in 2017. Additional details of the changes in the Corporation's loans are discussed within NOTE 5. LOANS AND ALLOWANCE of the Notes to Consolidated Financial Statements included in Item 8 of this Annual Report on Form 10-K.7 percent.
The Corporation’s allowance for loan losses totaled $75.0$80.3 million as of December 31, 2017,2019, a slight decrease compared to $66.0$80.6 million as of December 31, 2016. The2018, due to declines in delinquent, impaired and non-accrual loans during 2019. Non-accrual loans decreased $10.2 million, or 39 percent during 2019 and the allowance provides 261.2503.4 percent coverage of all non-accrual loans and 1.110.95 percent of total loans. The Corporation's provision expense for the year endedloans at December 31, 2017 was $9.1 million compared to $5.7 million during the same period in 2016. The increase in provision expense was primarily due to the level of organic loan growth in 2017.2019. Details of the Allowance for Loan Losses and non-performing loans are discussed within the “Loan Quality” and “Provision and Allowance for Loan Losses” sections of this Management’s Discussion and Analysis of Financial Condition and Results of Operations.
PART II: ITEM 7. AND ITEM 7A. MANAGEMENT'S DISCUSSION AND ANALYSIS OF FINANCIAL CONDITION AND RESULTS OF OPERATIONS
The Corporation's investment securities portfolio increased $256.1$963.5 million from December 31, 2016,2018, and totaled $1.6$2.6 billion as of December 31, 2017.2019. The MBT acquisition accounted for $212.2 million of the increase and excess liquidity from deposit growth was deployed in the investment portfolio, which also contributed to the increase from December 31, 2018. Details of the composition of the Corporation's investment securities portfolio are included within NOTE 4. INVESTMENT SECURITIES of the Notes to Consolidated Financial Statements included in Item 8 of this Annual Report on Form 10-K.
The Corporation's other assets increased $52.4 million from December 31, 2018 due in part to implementation of new lease accounting guidance in ASU 2016-02, Leases (Topic 842), associated with the Corporation's leased banking center locations. As of December 31, 2017, total deposits equaled $7.2 billion, an increase2019, the Corporation's right of $1.6 billionuse asset (recorded in other assets) was $20.7 million and the lease liability (recorded in other liabilities) was $21.4 million. The new lease accounting guidance and lease disclosures are discussed within NOTE 1. NATURE OF OPERATIONS AND SUMMARY OF SIGNIFICANT ACCOUNTING POLICIES and NOTE 10. LEASES of the Notes to Consolidated Financial Statements included in Item 8 of this Annual Report on Form 10-K.
Additionally, the Corporation's derivative hedge asset (recorded in other assets) and derivative hedge liability (recorded in other liabilities), related to the Corporation's interest rate swaps with commercial banking customers, which are simultaneously hedged by offsetting interest rate swaps with a third party, increased $15.8 million and $16.7 million, respectively from December 31, 2016.2018. The Arlington Bankincreases were primarily due to a $214.5 million increase in outstanding notional balance and IAB acquisitionsyield curve rates used for valuation purposes were lower at each term point as of December 31, 2019 compared to December 31, 2018. Details of the Corporation's derivative activity is detailed in NOTE 14. DERIVATIVE INSTRUMENTS AND HEDGING ACTIVITY of the Notes to Consolidated Financial Statements included in Item 8 of this Annual Report on Form 10-K.
Total deposits of $9.8 billion increased $2.1 billion, or 26.9 percent, from December 31, 2018. The MBT acquisition on September 1, 2019 resulted in $252.8 million and $862.3 million$1.1 billion of additional deposits, respectively.acquired deposits. Organic deposit growth equaled $501.0of $979.4 million, or 9.012.6 percent, also contributed to the increase in 2017. The2019. Excluding deposits from the MBT acquisition, the largest increases were in demand, savings and savingstime deposits.
Total borrowings increased $140.2 million as of December 31, 2017, compared to2019 increased $61.7 million from December 31, 2016. Federal2018. FHLB advances increased $36.1 million, which included $10.9 million in FHLB advances from the MBT acquisition, while federal funds purchased and Federal Home Loan Bank advances,decreased $49.0 million. Securities sold under repurchase agreements increased $74.4 million from December 31, 2018, as a result of the MBT acquisition, which increased $23.7accounted for a $94.8 million and $115.5 million, respectively, when coupled with the increase in deposits, were used as liquidity sources to support the increase in the loan and investment portfolios.increase. Additional details related to the changes in deposits and borrowings are discusseddetailed within NOTE 11. DEPOSITS and NOTE 13. BORROWINGS of the Notes to Consolidated Financial Statements included in Item 8 of this Annual Report on Form 10-K and the “Deposits and Borrowings” section of this Management’s Discussion and Analysis of Financial Condition and Results of Operations.
The Corporation continued to maintain all regulatory capital ratios in excess of the regulatory definition of “well-capitalized” as discussed in the “CAPITAL” section of this Management’s Discussion and Analysis of Financial Condition and Results of Operations.
RESULTS OF OPERATIONS – 20162018
Net income available to stockholders was $81.1$159.1 million, an increase of $15.7$63.0 million, compared to $65.4$96.1 million during the same period in 2015.2017. Earnings per fully diluted common share for 20162018 totaled $1.98,$3.22, an increase of $0.26$1.10 per share, or 15.151.9 percent, over $1.72$2.12 in 2015.2017.
Included in the 2015 results were $9.8 million, or $0.17 per share, of acquisition, merger and system conversion expenses related to the 2014 and 2015 acquisitions and 2015 on-line banking system conversion. Details of the December 31, 2015 Ameriana acquisition, the April 17, 2015 C Financial acquisition and the November 7, 2014 Community acquisition are included in NOTE 2. ACQUISITIONS of the Notes to Consolidated Financial Statements included in Item 8 of this Annual Report on Form 10-K.
As of December 31, 2016,2018, total assets equaled $7.2$9.9 billion compared to $6.8$9.4 billion as of year end 2015, resulting from organic growth2017, an increase of $450.6 million. Total loans5.5 percent. The Corporation's total loan portfolio equaled $5.1$7.2 billion as of December 31, 2016, reflecting organic growth2018, an increase of $445.8$470.8 million or 9.5%, from the same period in 2015.
December 31, 2017. The Corporation’s allowance for loan losses totaled $66.0$80.6 million as of December 31, 2016,2018, compared to $62.5$75.0 million as of December 31, 2015.2017. The allowance provides 220.1308.1 percent coverage of all non-accrual loans and 1.281.11 percent of total loans.loans at December 31, 2018. The Corporation's provision expense for the year ended December 31, 2018 was $7.2 million compared to $9.1 million during the same period in 2017. The provision expense in 2018 was primarily due to organic loan growth. Details of the Allowance for Loan Losses and non-performing loans are discussed within the “Loan Quality” and “Provision and Allowance for Loan Losses” sections of this Management’s Discussion and Analysis of Financial Condition and Results of Operations.
The Corporation's investment securities portfolio increased $27.5$72.0 million from December 31, 2015,2017, and totaled $1.3$1.6 billion as of December 31, 2016.2018. Details of the composition of the Corporation's investment securities portfolio are included within NOTE 4. INVESTMENT SECURITIES of the Notes to Consolidated Financial Statements included in Item 8 of this Annual Report on Form 10-K.
As discussedof December 31, 2018, total deposits equaled $7.8 billion, an increase of $582.1 million, or 8.1 percent, from December 31, 2017. The largest increases were in savings and demand deposits. Total borrowings decreased $163.4 million as of December 31, 2018, compared to December 31, 2017. Liquidity generated from organic deposit growth was used to fund loan and investment portfolio growth. Additionally, the excess liquidity was used to pay down Federal Home Loan Bank advances and Federal funds purchased, which decreased $99.4 million and $40.0 million, respectively. Additional details related to the changes in deposits and borrowings are detailed within NOTE 1. NATURE OF OPERATIONS AND SUMMARY OF SIGNIFICANT ACCOUNTING POLICIES11. DEPOSITS and NOTE 13. BORROWINGS of the Notes to Consolidated Financial Statements included in Item 8 of this Annual Report on Form 10-K the Bank’s banking charter was converted from a national association to an Indiana state-chartered bank in April 2016. As part of the conversion, the Bank redeemed at cost all of its Federal Reserve Bank stock held, which resulted in a decrease in Federal Reserve and Federal Home Loan Bank stock of $19.7 million from the same period in 2015.
At December 31, 2016, other real estate owned totaled $9.0 million, a decrease of $8.3 million, or 48.0 percent, from the December 31, 2015 balance of $17.3 million. Included in the December 31, 2015 balance was $5.7 million of other real estate owned acquired in the Ameriana acquisition.
Taxes, both current and deferred, decreased in 2016 by $7.6 million. Details related to the change in taxes are discussed within the “Income Taxes” section of the this Management’s Discussion and Analysis of Financial Condition and Results of Operations and in NOTE 21. INCOME TAX of the Notes to Consolidated Financial Statements included in Item 8 of this Annual Report on Form 10-K.
PART II: ITEM 7. AND ITEM 7A. MANAGEMENT'S DISCUSSION AND ANALYSIS OF FINANCIAL CONDITION AND RESULTS OF OPERATIONS
Deposits increased $266.9 million from December 31, 2015. Demand deposits, brokered certificates of deposit and savings deposits increased $290.6 million, $66.9 million and $42.0 million, respectively, from the same period in 2015. Offsetting these increases were decreases in certificates of deposit of $85.2 million and certificates of deposit greater than $100,000 of $47.4 million.
Federal Funds purchased and Federal Home Loan Bank advances, which increased $70.6 million and $63.3 million, respectively, when coupled with the increase in deposits, were used as liquidity sources to support the increase in the loan portfolio. Additional details related to the changes are discussed within the “Deposits and Borrowings” section of this Management’s Discussion and Analysis of Financial Condition and Results of Operations.
The Corporation was ablecontinued to maintain all regulatory capital ratios in excess of the regulatory definition of “well-capitalized” as discussed in the “CAPITAL” section of this Management’s Discussion and Analysis of Financial Condition and Results of Operations.
PART II: ITEM 7. AND ITEM 7A. MANAGEMENT'S DISCUSSION AND ANALYSIS OF FINANCIAL CONDITION AND RESULTS OF OPERATIONS
NET INTEREST INCOME
Net interest income is the most significant component of the Corporation's earnings, comprising 80 percent of revenues for the year ended December 31, 2017.2019. Net interest income and margin are influenced by many factors, primarily the volume and mix of earningsearning assets, funding sources, and interest rate fluctuations. Other factors include the level of accretion income on purchased loans, prepayment risk on mortgage and investment-related assets, and the composition and maturity of earning assets and interest-bearing liabilities. Loans typically generate more interest income than investment securities with similar maturities. Funding from customer deposits generally costs less than wholesale funding sources. Factors such as general economic activity, Federal Reserve Board monetary policy, and price volatility of competing alternative investments, can also exert significant influence on our ability to optimize the mix of assets and funding and the net interest income and margin.
Net interest income is the excess of interest received from earning assets over interest paid on interest-bearing liabilities. For analytical purposes, net interest income is also presented on an FTE basis in the table that follows to reflect what our tax-exempt assets would need to yield in order to achieve the same after-tax yield as a taxable asset. The federal statutory rate in effect of 21 percent was used for both 2019 and 2018, while 35 percent was used for all periods,2017, adjusted for the TEFRA interest disallowance applicable to certain tax-exempt obligations. ThisThe lower effective income tax rate during the twelve months ended December 31, 2019 and 2018 when compared to the same periods in 2017 were primarily the result of the Tax Cuts and Jobs Act (TCJA) enacted on December 22, 2017. The FTE analysis portrays the income tax benefits associated inwith tax-exempt assets and helps to facilitate a comparison between taxable and tax-exempt assets. Management believes that it is a standard practice in the banking industry to present net interest margin and net interest income on a fully taxable equivalent basis. Therefore, management believes these measures provide useful information for both management and investors by allowing them to make peer comparisons.
For the periods presented,In 2019, the increases in net interest income and average earning assets were primarily driven byattributable to the September 2019 MBT acquisition, in addition to, core organic loan and deposit growth and an increase in earning assets attributable to acquisitions of Arlington Bank in May 2017 and IAB in July 2017. In addition, in April 2015, the Corporation acquired C Financial and, in December 2015, the Corporation acquired Ameriana.
In 2017, assetinvestment securities portfolio. Asset yields increased 21decreased 1 basis pointspoint FTE and interest costs increased 1034 basis points, resulting in an 1135 basis point FTE increasedecrease in net interest spread as compared to 2016. Primarily2018. Asset yields decreased in 2019 primarily as a result of the Federal Reserve's discount rate decrease of 25 basis points at each of the Board's August, September and October 2019 meetings. Average earning assets increased $1.3 billion in 2019 compared to 2018 primarily as a result of organic loan growth and acquisitions, earning assets increased $1,155,652,000 in 2017 compared to 2016.the MBT acquisition. In 2019, organic loan growth was $506.5 million, or 7 percent. The Corporation recognized fair value accretion income on purchased loans, which is included in interest income, of $13,864,000$12.0 million and $12,397,000,$14.1 million, respectively, for the twelve months ended December 31, 20172019 and 2016.2018. Net interest margin, on a tax equivalent basis, increaseddecreased to 4.023.69 percent for 20172019 compared to 3.894.00 percent in 2016. Asset yields increased primarily as a result of the Federal Reserve's discount rate increases of 25 basis points at their March, June and December 2017 meetings.2018.
In 2016, asset yields increased 7 basis points FTE and interest costs decreased 2 basis points, resulting in a 9 basis point FTE increase in net interest spread as compared to 2015. Primarily as a result of organic loan growth, earning assets increased $715,221,000 in 2016 compared to 2015. The Corporation recognized fair value accretion income on purchased loans, which is included in interest income, of $12,397,000 and $8,217,000, respectively, for the twelve months ended December 31, 2016 and 2015. Net interest margin, on a tax equivalent basis, increased to 3.89 percent for 2016 compared to 3.80 percent in 2015.
Additional details of the Corporation's acquisitions, remaining loan fair value discount, accretable and nonaccretable yield can be found in NOTE 2. ACQUISITIONS andACQUISITION, NOTE 6. ACCOUNTING FOR CERTAIN LOANS ACQUIRED IN A PURCHASE, and NOTE 22. INCOME TAX of the Notes to Consolidated Financial Statements included in Item 8 of this Annual Report on Form 10-K.
In 2018, asset yields increased 26 basis points FTE and interest costs increased 35 basis points, resulting in an 9 basis point FTE decrease in net
interest spread as compared to 2017. Asset yields increased in 2018 primarily as a result of the Federal Reserve's discount rate increases of 25 basis points at each of the Board's March, June, September and December 2018 meetings. Interest costs also increased as both core deposits and wholesale funding rates increased year-over-year. Average earning assets increased $1.4 billion in 2018 compared to 2017 primarily as a result of organic loan growth and a full year of acquisition related earning assets. The Corporation recognized fair value accretion income on purchased loans, which is included in interest income, of $14.1 million and $13.9 million, respectively, for the twelve months ended December 31, 2018 and 2017. Net interest margin, on a tax equivalent basis, decreased to 4.00 percent for 2018 compared to 4.02 percent in 2017.
PART II: ITEM 7. AND ITEM 7A. MANAGEMENT'S DISCUSSION AND ANALYSIS OF FINANCIAL CONDITION AND RESULTS OF OPERATIONS
Net interest margin is a function of net interest income and the level of average earning assets. The following tabletables presents the Corporation’s interest income, interest expense, and net interest income as a percent of average earning assets for the three-year period ending in 2017.2019.
| | | | Average Balance | | Interest
Income /
Expense | | Average
Rate | | Average Balance | | Interest
Income /
Expense | | Average
Rate | | Average Balance | | Interest
Income /
Expense | | Average
Rate | Average Balance | | Interest
Income /
Expense | | Average
Rate | | Average Balance | | Interest
Income /
Expense | | Average
Rate | | Average Balance | | Interest
Income /
Expense | | Average
Rate |
| (Dollars in Thousands) | 2017 | | 2016 | | 2015 | 2019 | | 2018 | | 2017 |
| Assets: | | | | | | | | | | | | | | | | | | | | | | | | | | | | | | | | | | |
| Interest-bearing deposits | $ | 75,417 |
| | $ | 736 |
| | 0.98 | % | | $ | 69,753 |
| | $ | 350 |
| | 0.50 | % | | $ | 61,373 |
| | $ | 160 |
| | 0.26 | % | $ | 211,683 |
| | $ | 4,225 |
| | 2.00 | % | | $ | 110,232 |
| | $ | 2,241 |
| | 2.03 | % | | $ | 75,417 |
| | $ | 736 |
| | 0.98 | % |
| Federal Reserve and Federal Home Loan Bank stock | 20,921 |
| | 894 |
| | 4.27 |
| | 24,268 |
| | 1,098 |
| | 4.52 |
| | 37,495 |
| | 1,967 |
| | 5.25 |
| 25,645 |
| | 1,370 |
| | 5.34 |
| | 24,538 |
| | 1,234 |
| | 5.03 |
| | 20,921 |
| | 894 |
| | 4.27 |
|
Investment Securities: (1) | | | | | | | | | | | | | | | | | | | | | | | | | | | | | | | | | | |
| Taxable | 726,004 |
| | 17,489 |
| | 2.41 |
| | 721,689 |
| | 16,415 |
| | 2.27 |
| | 703,019 |
| | 17,885 |
| | 2.54 |
| 1,101,247 |
| | 27,815 |
| | 2.53 |
| | 841,203 |
| | 21,597 |
| | 2.57 |
| | 726,004 |
| | 17,489 |
| | 2.41 |
|
Tax-exempt (2) | 632,076 |
| | 32,891 |
| | 5.20 |
| | 550,335 |
| | 28,649 |
| | 5.21 |
| | 483,103 |
| | 26,034 |
| | 5.39 |
| 987,006 |
| | 40,070 |
| | 4.06 |
| | 762,623 |
| | 32,290 |
| | 4.23 |
| | 632,076 |
| | 32,891 |
| | 5.20 |
|
| Total investment securities | 1,358,080 |
| | 50,380 |
| | 3.71 |
| | 1,272,024 |
| | 45,064 |
| | 3.54 |
| | 1,186,122 |
| | 43,919 |
| | 3.70 |
| 2,088,253 |
| | 67,885 |
| | 3.25 |
| | 1,603,826 |
| | 53,887 |
| | 3.36 |
| | 1,358,080 |
| | 50,380 |
| | 3.71 |
|
| Loans held for sale | 7,707 |
| | 462 |
| | 5.99 |
| | 4,050 |
| | 372 |
| | 9.19 |
| | 3,725 |
| | 475 |
| | 12.75 |
| 18,402 |
| | 780 |
| | 4.24 |
| | 11,425 |
| | 540 |
| | 4.73 |
| | 7,707 |
| | 462 |
| | 5.99 |
|
Loans: (3) | | | | | | | | | | | | | | | | | | | | | | | | | | | | | | | | | | |
| Commercial | 4,267,651 |
| | 204,771 |
| | 4.80 |
| | 3,541,098 |
| | 162,848 |
| | 4.60 |
| | 3,187,239 |
| | 142,696 |
| | 4.48 |
| 5,631,146 |
| | 306,139 |
| | 5.44 |
| | 5,143,576 |
| | 274,302 |
| | 5.33 |
| | 4,267,651 |
| | 204,771 |
| | 4.80 |
|
| Real estate mortgage | 679,284 |
| | 30,267 |
| | 4.46 |
| | 566,050 |
| | 25,156 |
| | 4.44 |
| | 457,013 |
| | 19,457 |
| | 4.26 |
| 811,188 |
| | 37,782 |
| | 4.66 |
| | 733,709 |
| | 33,549 |
| | 4.57 |
| | 679,284 |
| | 30,267 |
| | 4.46 |
|
| Installment | 573,100 |
| | 28,204 |
| | 4.92 |
| | 485,111 |
| | 21,926 |
| | 4.52 |
| | 406,163 |
| | 18,177 |
| | 4.48 |
| 701,459 |
| | 38,071 |
| | 5.43 |
| | 640,310 |
| | 34,110 |
| | 5.33 |
| | 573,100 |
| | 28,204 |
| | 4.92 |
|
Tax-exempt (2) | 353,542 |
| | 16,452 |
| | 4.65 |
| | 217,696 |
| | 10,039 |
| | 4.61 |
| | 125,699 |
| | 5,322 |
| | 4.23 |
| 527,995 |
| | 22,238 |
| | 4.21 |
| | 468,751 |
| | 18,813 |
| | 4.01 |
| | 353,542 |
| | 16,452 |
| | 4.65 |
|
| Total loans | 5,881,284 |
| | 280,156 |
| | 4.76 |
| | 4,814,005 |
| | 220,341 |
| | 4.58 |
| | 4,179,839 |
| | 186,127 |
| | 4.45 |
| 7,690,190 |
| | 405,010 |
| | 5.27 |
| | 6,997,771 |
| | 361,314 |
| | 5.16 |
| | 5,881,284 |
| | 280,156 |
| | 4.76 |
|
| Total earning assets | 7,335,702 |
| | 332,166 |
| | 4.53 | % | | 6,180,050 |
| | 266,853 |
| | 4.32 | % | | 5,464,829 |
| | 232,173 |
| | 4.25 | % | 10,015,771 |
| | 478,490 |
| | 4.78 | % | | 8,736,367 |
| | 418,676 |
| | 4.79 | % | | 7,335,702 |
| | 332,166 |
| | 4.53 | % |
| Net unrealized gain on securities available for sale | 4,360 |
| | | | | | 9,969 |
| | | | | | 11,800 |
| | | | | |
| Net unrealized gain (loss) on securities available for sale | | 17,676 |
| | | | | | (14,790 | ) | | | | | | 4,360 |
| | | | |
| Allowance for loan losses | (70,380 | ) | | | | | | (62,976 | ) | | | | | | (62,975 | ) | | | | | (81,000 | ) | | | | | | (77,444 | ) | | | | | | (70,380 | ) | | | | |
| Cash and cash equivalents | 142,503 |
| | | | | | 105,443 |
| | | | | | 98,051 |
| | | | | 142,857 |
| | | | | | 131,925 |
| | | | | | 142,503 |
| | | | |
| Premises and equipment | 97,446 |
| | | | | | 96,023 |
| | | | | | 82,710 |
| | | | | 99,343 |
| | | | | | 94,567 |
| | | | | | 97,446 |
| | | | |
| Other assets | 686,598 |
| | | | | | 570,756 |
| | | | | | 491,272 |
| | | | | 896,673 |
| | | | | | 818,432 |
| | | | | | 686,598 |
| | | | |
| Total Assets | $ | 8,196,229 |
| | | | | | $ | 6,899,265 |
| | | | | | $ | 6,085,687 |
| | | | | $ | 11,091,320 |
| | | | | | $ | 9,689,057 |
| | | | | | $ | 8,196,229 |
| | | | |
| Liabilities: | | | | | | | | | | | | | | | | | | | | | | | | | | | | | | | | | | |
| Interest-bearing deposits: | | | | | | | | | | | | | | | | | | | | | | | | | | | | | | | | | | |
| Interest-bearing accounts | $ | 1,730,272 |
| | $ | 5,817 |
| | 0.34 | % | | $ | 1,427,535 |
| | $ | 2,579 |
| | 0.18 | % | | $ | 1,109,829 |
| | $ | 1,374 |
| | 0.12 | % | |
| Interest-bearing deposit accounts | | $ | 3,070,861 |
| | $ | 33,921 |
| | 1.10 | % | | $ | 2,319,081 |
| | $ | 17,577 |
| | 0.76 | % | | $ | 1,730,272 |
| | $ | 5,817 |
| | 0.34 | % |
| Money market deposit accounts | 938,959 |
| | 2,788 |
| | 0.30 |
| | 825,681 |
| | 1,705 |
| | 0.21 |
| | 840,084 |
| | 1,768 |
| | 0.21 |
| 1,300,064 |
| | 14,111 |
| | 1.09 |
| | 1,097,762 |
| | 6,721 |
| | 0.61 |
| | 938,959 |
| | 2,788 |
| | 0.30 |
|
| Savings deposits | 844,825 |
| | 734 |
| | 0.09 |
| | 731,902 |
| | 618 |
| | 0.08 |
| | 614,675 |
| | 672 |
| | 0.11 |
| 1,242,468 |
| | 9,464 |
| | 0.76 |
| | 1,065,031 |
| | 5,230 |
| | 0.49 |
| | 844,825 |
| | 734 |
| | 0.09 |
|
| Certificates and other time deposits | 1,339,866 |
| | 14,467 |
| | 1.08 |
| | 1,151,700 |
| | 11,012 |
| | 0.96 |
| | 1,121,651 |
| | 11,041 |
| | 0.98 |
| 1,673,292 |
| | 34,089 |
| | 2.04 |
| | 1,514,271 |
| | 22,014 |
| | 1.45 |
| | 1,339,866 |
| | 14,467 |
| | 1.08 |
|
| Total interest-bearing deposits | 4,853,922 |
| | 23,806 |
| | 0.49 |
| | 4,136,818 |
| | 15,914 |
| | 0.38 |
| | 3,686,239 |
| | 14,855 |
| | 0.40 |
| 7,286,685 |
| | 91,585 |
| | 1.26 |
| | 5,996,145 |
| | 51,542 |
| | 0.86 |
| | 4,853,922 |
| | 23,806 |
| | 0.49 |
|
| Borrowings | 664,045 |
| | 13,806 |
| | 2.08 |
| | 512,356 |
| | 10,925 |
| | 2.13 |
| | 480,794 |
| | 9,939 |
| | 2.07 |
| 644,729 |
| | 17,160 |
| | 2.66 |
| | 718,061 |
| | 17,545 |
| | 2.44 |
| | 664,045 |
| | 13,806 |
| | 2.08 |
|
| Total interest-bearing liabilities | 5,517,967 |
| | 37,612 |
| | 0.68 |
| | 4,649,174 |
| | 26,839 |
| | 0.58 |
| | 4,167,033 |
| | 24,794 |
| | 0.60 |
| 7,931,414 |
| | 108,745 |
| | 1.37 |
| | 6,714,206 |
| | 69,087 |
| | 1.03 |
| | 5,517,967 |
| | 37,612 |
| | 0.68 |
|
| Noninterest-bearing deposits | 1,514,829 |
| | | | | | 1,301,399 |
| | | | | | 1,120,264 |
| | | | | 1,495,949 |
| | | | | | 1,573,337 |
| | | | | | 1,514,829 |
| | | | |
| Other liabilities | 52,909 |
| | | | | | 64,028 |
| | | | | | 44,666 |
| | | | | 94,342 |
| | | | | | 57,653 |
| | | | | | 52,909 |
| | | | |
| Total Liabilities | 7,085,705 |
| | | | | | 6,014,601 |
| | | | | | 5,331,963 |
| | | | | 9,521,705 |
| | | | | | 8,345,196 |
| | | | | | 7,085,705 |
| | | | |
| Stockholders' Equity | 1,110,524 |
| | | | | | 884,664 |
| | | | | | 753,724 |
| | | | | 1,569,615 |
| | | | | | 1,343,861 |
| | | | | | 1,110,524 |
| | | | |
| Total Liabilities and Stockholders' Equity | $ | 8,196,229 |
| | 37,612 |
| | | | $ | 6,899,265 |
| | 26,839 |
| | | | $ | 6,085,687 |
| | 24,794 |
| | | $ | 11,091,320 |
| | 108,745 |
| | | | $ | 9,689,057 |
| | 69,087 |
| | | | $ | 8,196,229 |
| | 37,612 |
| | |
| Net Interest Income (FTE) | | | $ | 294,554 |
| | | | | | $ | 240,014 |
| | | | | | $ | 207,379 |
| | | | | $ | 369,745 |
| | | | | | $ | 349,589 |
| | | | | | $ | 294,554 |
| | |
Net Interest Spread (FTE) | | | | | 3.85 | % | | | | | | 3.74 | % | | | | | | 3.65 | % | | | | | 3.41 | % | | | | | | 3.76 | % | | | | | | 3.85 | % |
| | | | | | | | | | | | | | | | | | | | | | | | | | | | | | | | | | | |
| Net Interest Margin (FTE): | | | | | | | | | | | | | | | | | | | | | | | | | | | | | | | | | | |
| Interest Income (FTE) / Average Earning Assets | | | | | 4.53 | % | | | | | | 4.32 | % | | | | | | 4.25 | % | | | | | 4.78 | % | | | | | | 4.79 | % | | | | | | 4.53 | % |
| Interest Expense / Average Earning Assets | | | | | 0.51 | % | | | | | | 0.43 | % | | | | | | 0.45 | % | | | | | 1.09 | % | | | | | | 0.79 | % | | | | | | 0.51 | % |
Net Interest Margin (FTE) | | | | | 4.02 | % | | | | | | 3.89 | % | | | | | | 3.80 | % | | | | | 3.69 | % | | | | | | 4.00 | % | | | | | | 4.02 | % |
(1) Average balance of securities is computed based on the average of the historical amortized cost balances without the effects of the fair value adjustment.
(2) Tax-exempt securities and loans are presented on a fully taxable equivalent basis, using a marginal tax rate of 21 percent for both 2019 and 2018, while using 35 percent for 2017, 2016 and 2015.2017. These totals equal $13,085, $10,732 and $17,270, $13,541 and $10,975,respectively.
respectively.
(3) Non-accruing loans have been included in the average balances.
(4) Net Interest Spread (FTE) is interest income expressed as a percentage of average earning assets minus interest expense expressed as a percentage of average interest-bearing liabilities.
(5) Net Interest Margin (FTE) is interest income expressed as a percentage of average earning assets minus interest expense expressed as a percentage of average earning assets.
PART II: ITEM 7. AND ITEM 7A. MANAGEMENT'S DISCUSSION AND ANALYSIS OF FINANCIAL CONDITION AND RESULTS OF OPERATIONS
NON-INTEREST INCOME
Non-interest income increased $5.8$10.2 million, or 8.913.4 percent, in 20172019 compared to 2016. The larger customer base resulting from2018. On September 1, 2019, the Arlington Bank and IAB acquisitions, as well as organic growth,Corporation acquired MBT, which contributed $4.1 million to anthe 2019 increase in service charges on deposit accounts, fiduciary activities and other customer fees of $4.4 million in 2017 when compared to 2016. Additional detailsnon-interest income. Details of the 2017 acquisitionsacquisition can be found in NOTE 2. ACQUISITIONSACQUISITION of the Notes to Consolidated Financial Statements included in Item 8 of this Annual Report on Form 10-K. The increased customer base from the acquisition, in addition to organic growth, resulted in an increase in customer related line items of $10.4 million. The largest increases were recognized in derivative hedge fees, fiduciary and wealth management fees, card payment fees and service charges on deposit accounts which accounted for $9.7 million of the customer related line items increase.
Non-interest income increased $5.5 million, or 7.7 percent, in 2018 compared to 2017. Organic growth in 2018 coupled with a full year of the larger customer base from the 2017 acquisitions of Arlington Bank and IAB resulted in an increase in customer related line items of $4.5 million. The largest increases were recognized in service charges on deposit accounts, card payment fees and derivative hedge fees which accounted for $4.7 million of increase when compared to 2017.
PART II: ITEM 7. AND ITEM 7A. MANAGEMENT'S DISCUSSION AND ANALYSIS OF FINANCIAL CONDITION AND RESULTS OF OPERATIONS
Additionally, 20172018 contained an increase in other income and gains on sales of $2.3available for sale securities of $3.3 million. The increases noted above were offset by a decrease of $2.5 million in earnings on cash surrender value of life insurance and gains on life insurance benefits when compared to 2016. The increase was primarily due to gains on life insurance benefits which were $2.7 million in 2017 compared to $643,000 in 2016, as well as earnings on a larger portfolio resulting from the IAB acquisition, which included a $27.0 million Bank Owned Life Insurance portfolio.2017.
Finally, the increases noted above were partially offset by decreases in net realized gains on sales of available for sale securities and other income of $758,000 and $624,000, respectively.
In 2016, non-interest income decreased $4.7 million, or 6.7 percent, compared to 2015. The sale of FMIG in June 2015 resulted in a gain of $8.3 million, and also accounted for a $4.1 million decline in insurance commission income compared to 2015. Meanwhile, the larger customer base resulting from the C Financial and Ameriana acquisitions, as well as organic growth, contributed to increases in other customer fees, service charges and derivative hedge income of $2.4 million, $1.6 million and $1.2 million, respectively.
Additionally, 2016 contained an increase of $711,000 in earnings on cash surrender value of life insurance when compared to 2015. The increase was primarily due to earnings on a larger portfolio resulting from the Ameriana acquisition, which included a $28.2 million Bank Owned Life Insurance portfolio. Also, there were $643,000 in gains on life insurance benefits in 2016 compared to none in 2015.
Finally, offsetting the increases noted above, 2015 included a gain from the Corporation's cancellation of $5.0 million of subordinated debentures, which resulted in a decline in non-interest income of $1.3 million, in 2016.
NON-INTEREST EXPENSES
Non-interest expensesexpense increased $28.2$26.8 million, or 15.912.2 percent, in 20172019 compared to 2016.2018. The acquisitionsmost significant factor contributing to the increase was the acquisition of Arlington Bank and IAB were the largest contributing factor for the increase. In 2017,MBT, as the Corporation recorded $12.2$13.7 million of acquisition-related expenses, for both Arlington Bank and IAB, primarily consisting of $4.5$5.3 million of contract termination and core system conversion expenses, $2.2$5.2 million of employee severance and retention expenses and $1.6 million of professional and other outside services expense. In addition to the acquisition-related expenses, MBT operations, after the acquisition, resulted in non-interest expense of $6.2 million, of which $3.3 million was in salaries and professionalemployee benefits. Additionally, increases totaling $6.1 million were noted in equipment and software, outside data processing fees, and other real estate owned and foreclosure expense. Lastly, marketing expense increased $2.0 million, compared to 2018, primarily due to fair lending settlement expenses. Additionally, the larger franchise and growth
These increases were partially offset by a decrease in our customer baseFDIC expense of $2.2 million in 2019 compared to 2018. The decrease was due to assessment credits being issued as a result of the FDIC insurance fund reaching the FDIC's target minimum reserve ratio.
Non-interest expenses increased $14.4 million, or 7.0 percent, in 2018 compared to 2017. With the Arlington Bank and IAB acquisitions resultedoccurring in May and July 2017, respectively, 2018 reflected the first full year of non-interest expenses from IABassociated with the significantly larger franchise and Arlington Bank operations of $8.5 million and $3.1 million, respectively, in 2017, compared to 2016.customer base. The largest non-interest expenses impacted wereincrease was in salaries and employee benefits of $11.9 million, or 9.9 percent, over 2017 primarily due to the addition of Arlington Bank and IAB personnel. Other categories experiencing increases in 2018 compared to 2017 were net occupancy, equipment, marketing, outside data processing fees, and other expenses.expenses, which increased by $5.9 million. Additionally, intangible asset amortization increased $1.7$1.1 million primarily due to amortization recorded in 2017 related to the Arlington Bank and IAB intangibles.
In 2017,Partially offsetting the Corporation's continued focus on asset quality resultedincreases was a $4.6 million decrease in professional and other outside services primarily due to Arlington Bank and IAB contract termination, system conversion and professional expenses of $6.3 million recognized in 2017. The Corporation also realized a declinedecrease in other real estate owned and foreclosure expenses of $974,000, compared to 2016. FDIC expense for 2017 decreased $472,000 from 2016 as a result of the 2016 FDIC assessment calculatioin change for banks under $10 billion in total assets. Additionally, in 2016, the Bank converted its banking charter from a national association, regulated by the Office of the Comptroller of the Currency, to an Indiana state-chartered bank, regulated by the Indiana DFI and the FDIC, resulting in a $517,000 reduction in examination fees compared to 2016.
In 2016, non-interest expenses increased $2.6 million, or 1.5 percent, compared to 2015. Overall, the sale of FMIG resulted in the elimination of $3.2 million of non-interest expenses in 2016 compared to 2015.
Salaries and employee benefit expenses of $102.6 million increased $644,000 in 2016 compared to 2015.
The sale of FMIG resulted in the elimination of $2.5 million of salaries and employee benefit expenses in 2016.
The C Financial and Ameriana acquisitions resulted in one-time severance expenses of $2.0 million in 2015.
The Corporation elected to terminate a post retirement benefit plan in 2016 which resulted in a $2.2 million curtailment gain recorded as a reduction of salaries and employee benefits expense in 2016.
The additional personnel from the C Financial and Ameriana acquisitions, along with annual and merit increases, resulted in additional salaries and employee benefit expenses in 2016 of $7.3 million$433,000 when compared to the same period in 2015.
Furthermore, as a result of the larger franchise size from the 2015 acquisitions, the Corporation experienced increases in net occupancy, outside data processing and equipment expenses of $2.3 million, $2.0 million and $1.7 million, respectively. Offsetting these increases was a $3.3 million decrease, from 2016 to 2015, in professional and other outside services due primarily to the prior year containing acquisition and divestiture expenses not repeated in the current year.2017.
INCOME TAX EXPENSE
Income tax expense in 20172019 was $37,524,000$29.3 million on pre-tax income of $133,594,000,$193.8 million, or 28.115.1 percent. For 2016,2018, income tax expense was $27,609,000$29.0 million on pre-tax income of $108,660,000,$188.1 million, or 25.415.4 percent. The increase in the effective tax rate in 2017 when compared to 2016 was primarily a result of the revaluation of net deferred tax assets due to the Tax Cuts and Jobs Act enacted by the U.S. government on December 22, 2017. As required by ASC 740, net deferred tax assets were revalued to the newly enacted 21 percent tax rate and the resulting adjustment was an increase to federal income tax expense of $5,120,000.
Additional income tax expense details are discussed within the “INCOME TAXES” section of this Management’s Discussion and Analysis of Financial Condition and Results of Operations and in NOTE 21.22. INCOME TAX of the Notes to Consolidated Financial Statements included in Item 8 of this Annual Report on Form 10-K.
CAPITAL
Stockholders' Equity
On September 1, 2019, the Corporation acquired 100 percent of MBT. Pursuant to the merger agreement, each MBT shareholder received 0.275 shares of the Corporation's common stock for each outstanding share of MBT common stock held. The Corporation issued approximately 6.4 million shares of common stock, which was valued at approximately $229.9 million. Details regarding the MBT acquisition are discussed in NOTE 2. ACQUISITION of the Notes to Consolidated Financial Statements included in Item 8 of this Annual Report on Form 10-K.
Stock Repurchase Program
On September 3, 2019, the Board of Directors of the Corporation approved a stock repurchase program of up to 3 million shares of the Corporation's outstanding common stock; provided, however, that the total aggregate investment in shares repurchased under the program may not exceed $75 million. On a share basis, the amount of common stock subject to the repurchase program represents approximately 5 percent of the Corporation's outstanding shares. The actual timing, number and share price of shares purchased under the repurchase program will be determined at the Corporation's discretion and will depend upon such factors as the market price of the stock, general market and economic conditions and applicable legal requirements. During 2019, the Corporation repurchased 516,016 shares of common stock for a total amount of $19.0 million at an average price of $36.90. All shares repurchased under the stock repurchase program were retired upon settlement.
PART II: ITEM 7. AND ITEM 7A. MANAGEMENT'S DISCUSSION AND ANALYSIS OF FINANCIAL CONDITION AND RESULTS OF OPERATIONS
CAPITALRegulatory Capital
Capital adequacy is an important indicator of financial stability and performance. The Corporation and the Bank are subject to various regulatory capital requirements administered by the federal banking agencies and are assigned to a capital category. The assigned capital category is largely determined by four ratios that are calculated according to the regulations: total risk-based capital, tier 1 risk-based capital, CET1, and tier 1 leverage ratios. The ratios are intended to measure capital relative to assets and credit risk associated with those assets and off-balance sheet exposures of the entity. The capital category assigned to an entity can also be affected by qualitative judgments made by regulatory agencies about the risk inherent in the entity's activities that are not part of the calculated ratios.
There are five capital categories defined in the regulations, ranging from well capitalized to critically undercapitalized. Classification of a bank in any of the undercapitalized categories can result in actions by regulators that could have a material effect on a bank's operations. Quantitative measures established by regulation to ensure capital adequacy require the Bank to maintain minimum amounts and ratios of total and tier 1 capital to risk-weighted assets, and of tier 1 capital to average assets, or leverage ratio, all of which are calculated as defined in the
regulations. Banks with lower capital levels are deemed to be undercapitalized, significantly undercapitalized or critically undercapitalized, depending on their actual levels. The appropriate federal regulatory agency may also downgrade a bank to the next lower capital category upon a determination that the bank is in an unsafe or unsound practice. Banks are required to monitor closely their capital levels and to notify their appropriate regulatory agency of any basis for a change in capital category.
Basel III was effective for the Corporation on January 1, 2015. Basel III requires the Corporation and the Bank to maintain a minimum ratio of CET1 capital to risk weighted assets, as defined in the regulation. Under the new Basel III rules, in order to avoid limitations on capital distributions, including dividends, the Corporation must hold a capital conservation buffer above the adequately capitalized CET1 capital to risk-weighted assets ratio. The capital conservation buffer is beingwas phased in from zero percent in 2015 to the fully-implemented 2.50 percent by 2019. As of January 1, 2017, the Corporation was required to hold a capital conservation buffer of 1.25 percent, which amount increases by 0.625 percent in each successive year until 2019. Under Basel III, the Corporation and Bank elected to opt-out of including accumulated other comprehensive income in regulatory capital.
As of December 31, 2017,2019, the Bank met all capital adequacy requirements to be considered well capitalized. There is no threshold for well capitalized status for bank holding companies. The Corporation's and Bank's actual and required capital ratios as of December 31, 20172019 and December 31, 20162018 were as follows:
| |
|
|
|
|
| Prompt Corrective Action Thresholds |
|
|
|
| Prompt Corrective Action Thresholds |
| Actual |
| Adequately Capitalized |
| Well Capitalized | Actual |
| Adequately Capitalized |
| Well Capitalized |
| December 31, 2017 | Amount |
| Ratio |
| Amount |
| Ratio |
| Amount |
| Ratio | |
| December 31, 2019 | | Amount |
| Ratio |
| Amount |
| Ratio |
| Amount |
| Ratio |
| Total risk-based capital to risk-weighted assets |
|
|
|
|
|
|
|
|
|
|
|
|
|
|
|
|
|
|
|
|
|
|
| First Merchants Corporation | $ | 1,048,757 |
|
| 13.69 | % |
| $ | 612,848 |
|
| 8.00 | % |
| N/A |
|
| N/A |
| $ | 1,400,617 |
|
| 14.29 | % |
| $ | 783,946 |
|
| 8.00 | % |
| N/A |
|
| N/A |
|
| First Merchants Bank | 1,016,355 |
|
| 13.17 |
|
| 614,477 |
|
| 8.00 |
|
| $ | 771,847 |
|
| 10.00 | % | 1,267,649 |
|
| 12.87 |
|
| 787,753 |
|
| 8.00 |
|
| $ | 984,691 |
|
| 10.00 | % |
| Tier 1 capital to risk-weighted assets |
|
|
|
|
|
|
|
|
|
|
|
|
|
|
|
|
|
|
|
|
|
|
| First Merchants Corporation | $ | 908,725 |
|
| 11.86 | % |
| $ | 459,636 |
|
| 6.00 | % |
| N/A |
|
| N/A |
| $ | 1,255,333 |
|
| 12.81 | % |
| $ | 587,960 |
|
| 6.00 | % |
| N/A |
|
| N/A |
|
| First Merchants Bank | 941,323 |
|
| 12.20 |
|
| 463,108 |
|
| 6.00 |
|
| $ | 617,477 |
|
| 8.00 | % | 1,187,365 |
|
| 12.06 |
|
| 590,815 |
|
| 6.00 |
|
| $ | 787,753 |
|
| 8.00 | % |
| Common equity tier 1 capital to risk-weighted assets |
|
|
|
|
|
|
|
|
|
|
|
|
|
|
|
|
|
|
|
|
|
|
| First Merchants Corporation | $ | 842,806 |
|
| 11.00 | % |
| $ | 344,727 |
|
| 4.50 | % |
| N/A |
|
| N/A |
| $ | 1,188,970 |
|
| 12.13 | % |
| $ | 440,970 |
|
| 4.50 | % |
| N/A |
|
| N/A |
|
| First Merchants Bank | 941,323 |
|
| 12.20 |
|
| 347,331 |
|
| 4.50 |
|
| $ | 501,700 |
|
| 6.50 | % | 1,187,365 |
|
| 12.06 |
|
| 443,111 |
|
| 4.50 |
|
| $ | 640,049 |
|
| 6.50 | % |
| Tier 1 capital to average assets |
|
|
|
|
|
|
|
|
|
|
|
|
|
|
|
|
|
|
|
|
|
|
| First Merchants Corporation | $ | 908,725 |
|
| 10.43 | % |
| $ | 348,407 |
|
| 4.00 | % |
| N/A |
|
| N/A |
| $ | 1,255,333 |
|
| 10.54 | % |
| $ | 476,383 |
|
| 4.00 | % |
| N/A |
|
| N/A |
|
| First Merchants Bank | 941,323 |
|
| 10.83 |
|
| 347,794 |
|
| 4.00 |
|
| $ | 434,742 |
|
| 5.00 | % | 1,187,365 |
|
| 9.99 |
|
| 475,564 |
|
| 4.00 |
|
| $ | 594,455 |
|
| 5.00 | % |
| |
|
|
|
|
| Prompt Corrective Action Thresholds |
|
|
|
| Prompt Corrective Action Thresholds |
| | Actual |
| Adequately Capitalized |
| Well Capitalized | Actual |
| Adequately Capitalized |
| Well Capitalized |
| December 31, 2016 | Amount |
| Ratio |
| Amount |
| Ratio |
| Amount |
| Ratio | |
| December 31, 2018 | | Amount |
| Ratio |
| Amount |
| Ratio |
| Amount |
| Ratio |
| Total risk-based capital to risk-weighted assets |
|
|
|
|
|
|
|
|
|
|
|
|
|
|
|
|
|
|
|
|
|
|
| First Merchants Corporation | $ | 851,521 |
|
| 14.21 | % |
| $ | 479,470 |
|
| 8.00 | % |
| N/A |
|
| N/A |
| $ | 1,177,725 |
|
| 14.61 | % |
| $ | 644,871 |
|
| 8.00 | % |
| N/A |
|
| N/A |
|
| First Merchants Bank | 800,598 |
|
| 13.30 |
|
| 481,490 |
|
| 8.00 |
|
| $ | 601,862 |
|
| 10.00 | % | 1,092,602 |
|
| 13.46 |
|
| 649,531 |
|
| 8.00 |
|
| $ | 811,914 |
|
| 10.00 | % |
| Tier 1 capital to risk-weighted assets |
|
|
|
|
|
|
|
|
|
|
|
|
|
|
|
|
|
|
|
|
|
|
| First Merchants Corporation | $ | 720,484 |
|
| 12.02 | % |
| $ | 359,603 |
|
| 6.00 | % |
| N/A |
|
| N/A |
| $ | 1,032,173 |
|
| 12.80 | % |
| $ | 483,653 |
|
| 6.00 | % |
| N/A |
|
| N/A |
|
| First Merchants Bank | 734,561 |
|
| 12.20 |
|
| 361,117 |
|
| 6.00 |
|
| $ | 481,490 |
|
| 8.00 | % | 1,012,050 |
|
| 12.47 |
|
| 487,148 |
|
| 6.00 |
|
| $ | 649,531 |
|
| 8.00 | % |
| Common equity tier 1 capital to risk-weighted assets |
|
|
|
|
|
|
|
|
|
|
|
|
|
|
|
|
|
|
|
|
|
|
| First Merchants Corporation | $ | 665,445 |
|
| 11.10 | % |
| $ | 269,702 |
|
| 4.50 | % |
| N/A |
|
| N/A |
| $ | 966,032 |
|
| 11.98 | % |
| $ | 362,740 |
|
| 4.50 | % |
| N/A |
|
| N/A |
|
| First Merchants Bank | 734,561 |
|
| 12.20 |
|
| 270,838 |
|
| 4.50 |
|
| $ | 391,210 |
|
| 6.50 | % | 1,012,050 |
|
| 12.47 |
|
| 365,361 |
|
| 4.50 |
|
| $ | 527,744 |
|
| 6.50 | % |
| Tier 1 capital to average assets |
|
|
|
|
|
|
|
|
|
|
|
|
|
|
|
|
|
|
|
|
|
|
| First Merchants Corporation | $ | 720,484 |
|
| 10.54 | % |
| $ | 273,456 |
|
| 4.00 | % |
| N/A |
|
| N/A |
| $ | 1,032,173 |
|
| 10.91 | % |
| $ | 378,379 |
|
| 4.00 | % |
| N/A |
|
| N/A |
|
| First Merchants Bank | 734,561 |
|
| 10.78 |
|
| 272,461 |
|
| 4.00 |
|
| $ | 340,576 |
|
| 5.00 | % | 1,012,050 |
|
| 10.70 |
|
| 379,397 |
|
| 4.00 |
|
| $ | 472,996 |
|
| 5.00 | % |
PART II: ITEM 7. AND ITEM 7A. MANAGEMENT'S DISCUSSION AND ANALYSIS OF FINANCIAL CONDITION AND RESULTS OF OPERATIONS
Management believes that all of the above capital ratios are meaningful measurements for evaluating the safety and soundness of the Corporation. Traditionally, the banking regulators have assessed bank and bank holding company capital adequacy based on both the amount and the composition of capital, the calculation of which is prescribed in federal banking regulations. The Federal Reserve focuses its assessment of capital adequacy on a component of Tier 1 capital known as CET1. Because the Federal Reserve has long indicated that voting common shareholders' equity (essentially Tier 1 risk-based capital less preferred stock and non-controlling interest in subsidiaries) generally should be the dominant element in Tier 1 risk-based capital, this focus on CET1 is consistent with existing capital adequacy categories. Tier I regulatory capital consists primarily of total stockholders’ equity and subordinated debentures issued to business trusts categorized as qualifying borrowings, less non-qualifying intangible assets and unrealized net securities gains or losses.
| |
| December 31, 2017 |
| December 31, 2016 | December 31, 2019 |
| December 31, 2018 |
| First Merchants Corporation |
| First Merchants Bank |
| First Merchants Corporation |
| First Merchants Bank | First Merchants Corporation |
| First Merchants Bank |
| First Merchants Corporation |
| First Merchants Bank |
| Total Risk-Based Capital |
|
|
|
|
|
|
|
|
|
|
|
|
|
|
| Total Stockholders' Equity (GAAP) | $ | 1,303,463 |
|
| $ | 1,404,303 |
|
| $ | 901,657 |
|
| $ | 973,641 |
| $ | 1,786,437 |
|
| $ | 1,787,006 |
|
| $ | 1,408,260 |
|
| $ | 1,456,220 |
|
Adjust for Accumulated Other Comprehensive (Income) Loss (1) | 3,534 |
|
| 763 |
|
| 13,581 |
|
| 9,701 |
| (27,874 | ) |
| (30,495 | ) |
| 21,422 |
|
| 19,031 |
|
| Less: Preferred Stock | (125 | ) |
| (125 | ) |
| (125 | ) |
| (125 | ) | (125 | ) |
| (125 | ) |
| (125 | ) |
| (125 | ) |
| Add: Qualifying Capital Securities | 65,919 |
|
|
|
| 55,415 |
|
|
| 66,363 |
|
| — |
|
| 66,141 |
|
| — |
|
| Less: Tier 1 Capital Deductions |
|
|
|
| (376 | ) |
|
| |
| Less: Disallowed Goodwill and Intangible Assets | (464,066 | ) |
| (463,618 | ) |
| (249,104 | ) |
| (248,656 | ) | (569,468 | ) |
| (569,021 | ) |
| (463,525 | ) |
| (463,076 | ) |
| Less: Disallowed Servicing Assets |
|
|
|
|
|
|
| |
| Less: Disallowed Deferred Tax Assets |
|
|
|
| (564 | ) |
|
| |
| Total Tier 1 Capital (Regulatory) | 908,725 |
|
| 941,323 |
|
| 720,484 |
|
| 734,561 |
| 1,255,333 |
|
| 1,187,365 |
|
| 1,032,173 |
|
| 1,012,050 |
|
| Qualifying Subordinated Debentures | 65,000 |
|
|
|
| 65,000 |
|
|
| 65,000 |
|
| — |
|
| 65,000 |
|
| — |
|
| Allowance for Loan Losses Includible in Tier 2 Capital | 75,032 |
|
| 75,032 |
|
| 66,037 |
|
| 66,037 |
| 80,284 |
|
| 80,284 |
|
| 80,552 |
|
| 80,552 |
|
| Total Risk-Based Capital (Regulatory) | $ | 1,048,757 |
|
| $ | 1,016,355 |
|
| $ | 851,521 |
|
| $ | 800,598 |
| $ | 1,400,617 |
|
| $ | 1,267,649 |
|
| $ | 1,177,725 |
|
| $ | 1,092,602 |
|
|
|
|
|
|
|
|
|
|
|
|
|
|
|
|
| Net Risk-Weighted Assets (Regulatory) | $ | 7,660,604 |
|
| $ | 7,718,467 |
|
| $ | 5,993,381 |
|
| $ | 6,018,623 |
| $ | 9,799,329 |
|
| $ | 9,846,913 |
|
| $ | 8,060,882 |
|
| $ | 8,119,141 |
|
| Average Assets | $ | 8,710,171 |
|
| $ | 8,694,838 |
|
| $ | 6,836,412 |
|
| $ | 6,811,519 |
| $ | 11,909,571 |
|
| $ | 11,889,092 |
|
| $ | 9,459,477 |
|
| $ | 9,459,925 |
|
|
|
|
|
|
|
|
|
|
|
|
|
|
|
|
| Total Risk-Based Capital Ratio (Regulatory) | 13.69 | % |
| 13.17 | % |
| 14.21 | % |
| 13.30 | % | 14.29 | % |
| 12.87 | % |
| 14.61 | % |
| 13.46 | % |
| Tier 1 Capital to Risk-Weighted Assets | 11.86 | % |
| 12.20 | % |
| 12.02 | % |
| 12.20 | % | 12.81 | % |
| 12.06 | % |
| 12.80 | % |
| 12.47 | % |
| Tier 1 Capital to Average Assets | 10.43 | % |
| 10.83 | % |
| 10.54 | % |
| 10.78 | % | 10.54 | % |
| 9.99 | % |
| 10.91 | % |
| 10.70 | % |
|
|
|
|
|
|
|
|
|
|
|
|
|
|
|
| Common Equity Tier 1 Capital Ratio |
|
|
|
|
|
|
|
|
|
|
|
|
|
|
| Total Tier 1 Capital (Regulatory) | $ | 908,725 |
|
| $ | 941,323 |
|
| $ | 720,484 |
|
| $ | 734,561 |
| $ | 1,255,333 |
|
| $ | 1,187,365 |
|
| $ | 1,032,173 |
|
| $ | 1,012,050 |
|
| Less: Qualified Capital Securities | (65,919 | ) |
|
|
| (55,415 | ) |
|
| (66,363 | ) |
| — |
|
| (66,141 | ) |
| — |
|
| Add: Additional Tier 1 Capital Deductions |
|
|
|
| 376 |
|
|
| |
| Less: Preferred Stock |
|
|
|
|
|
|
| |
| Common Equity Tier 1 Capital (Regulatory) | $ | 842,806 |
|
| $ | 941,323 |
|
| $ | 665,445 |
|
| $ | 734,561 |
| $ | 1,188,970 |
|
| $ | 1,187,365 |
|
| $ | 966,032 |
|
| $ | 1,012,050 |
|
|
|
|
|
|
|
|
|
|
|
|
|
|
|
|
| Net Risk-Weighted Assets (Regulatory) | $ | 7,660,604 |
|
| $ | 7,718,467 |
|
| $ | 5,993,381 |
|
| $ | 6,018,623 |
| $ | 9,799,329 |
|
| $ | 9,849,913 |
|
| $ | 8,060,882 |
|
| $ | 8,119,141 |
|
| Common Equity Tier 1 Capital Ratio (Regulatory) | 11.00 | % |
| 12.20 | % |
| 11.10 | % |
| 12.20 | % | 12.13 | % |
| 12.06 | % |
| 11.98 | % |
| 12.47 | % |
(1) Includes net unrealized gains or losses on available for sale securities, net gains or losses on cash flow hedges, and amounts resulting from the application of the applicable accounting guidance for defined benefit and other postretirement plans.
PART II: ITEM 7. AND ITEM 7A. MANAGEMENT'S DISCUSSION AND ANALYSIS OF FINANCIAL CONDITION AND RESULTS OF OPERATIONS
Additionally, management believes the following tables are also meaningful when considering performance measures of the Corporation. Non-GAAP financial measures such as tangible common equity to tangible assets, return on average tangible capital and return on average tangible assets are important measures of the strength of the Corporation's capital and ability to generate earnings on tangible common equity invested by our shareholders. These non-GAAP measures provide useful supplemental information and may assist investors in analyzing the
Corporation’s financial position without regard to the effects of intangible assets and preferred stock. Disclosure of these measures also allows analysts and banking regulators to assess our capital adequacy on these same bases.
Because these measures are not defined in GAAP or federal banking regulations, they are considered non-GAAP financial measures. Non-GAAP financial measures have inherent limitations, are not required to be uniformly applied, and are not audited. Although these non-GAAP financial measures are frequently used by investors to evaluate a company, they have limitations as analytical tools, and should not be considered in isolation, or as a substitute for analyses of results as reported under GAAP.
PART II: ITEM 7. AND ITEM 7A. MANAGEMENT'S DISCUSSION AND ANALYSIS OF FINANCIAL CONDITION AND RESULTS OF OPERATIONS
The Corporation had a strong capital position as evidenced by the tangible common equity to tangible assets ratio of 9.3010.16 percent at December 31, 2017,2019, and 9.249.97 percent at December 31, 2016.2018.
| |
| Tangible Common Equity to Tangible Assets (non-GAAP) | Tangible Common Equity to Tangible Assets (non-GAAP) |
| (Shares and Dollars in Thousands, Except Per Share Amounts) | December 31, 2017 |
| December 31, 2016 | December 31, 2019 |
| December 31, 2018 |
| Total Stockholders' Equity (GAAP) | $ | 1,303,463 |
|
| $ | 901,657 |
| $ | 1,786,437 |
|
| $ | 1,408,260 |
|
| Less: Cumulative preferred stock (GAAP) | (125 | ) |
| (125 | ) | (125 | ) |
| (125 | ) |
| Less: Intangible assets (GAAP) | (476,503 | ) |
| (258,866 | ) | (578,881 | ) |
| (469,784 | ) |
| Tangible common equity (non-GAAP) | $ | 826,835 |
|
| $ | 642,666 |
| $ | 1,207,431 |
|
| $ | 938,351 |
|
| Total assets (GAAP) | $ | 9,367,478 |
|
| $ | 7,211,611 |
| $ | 12,457,254 |
|
| $ | 9,884,716 |
|
| Less: Intangible assets (GAAP) | (476,503 | ) |
| (258,866 | ) | (578,881 | ) |
| (469,784 | ) |
| Tangible assets (non-GAAP) | $ | 8,890,975 |
|
| $ | 6,952,745 |
| $ | 11,878,373 |
|
| $ | 9,414,932 |
|
| Tangible common equity to tangible assets (non-GAAP) | 9.30 | % |
| 9.24 | % | 10.16 | % |
| 9.97 | % |
| | | | | | | |
| Tangible common equity (non-GAAP) | $ | 826,835 |
| | $ | 642,666 |
| $ | 1,207,431 |
| | $ | 938,351 |
|
| Plus: Tax Benefit of intangibles (non-GAAP) | 6,789 |
| | 5,930 |
| 7,257 |
| | 5,017 |
|
| Tangible common equity, net of tax (non-GAAP) | $ | 833,624 |
| | $ | 648,596 |
| $ | 1,214,688 |
| | $ | 943,368 |
|
| Common Stock outstanding at December 31, 2017 | 49,158 |
| | $ | 40,913 |
| |
| Common Stock outstanding | | 55,368 |
| | $ | 49,350 |
|
| December 31 - tangible book value - common (non-GAAP) | $ | 16.96 |
| | $ | 15.85 |
| $ | 21.94 |
| | $ | 19.12 |
|
The following table details and reconciles tangible earnings per share, return on tangible capital and tangible assets to traditional GAAP measures for the periods ended December 31, 20172019 and 2016.2018.
| | | (Dollars in Thousands, Except Per Share Amounts) | December 31, 2017 |
| December 31, 2016 | December 31, 2019 |
| December 31, 2018 |
| Average goodwill (GAAP) | $ | 345,491 |
|
| $ | 244,000 |
| $ | 478,143 |
|
| $ | 445,354 |
|
| Average core deposit intangible (GAAP) | 23,564 |
|
| 16,800 |
| 27,067 |
|
| 27,770 |
|
| Average deferred tax on CDI (GAAP) | (9,050 | ) |
| (6,468 | ) | (5,588 | ) |
| (5,703 | ) |
| Intangible adjustment (non-GAAP) | $ | 360,005 |
|
| $ | 254,332 |
| $ | 499,622 |
|
| $ | 467,421 |
|
| Average stockholders' equity (GAAP) | $ | 1,110,524 |
|
| $ | 884,664 |
| $ | 1,569,615 |
|
| $ | 1,343,861 |
|
| Average cumulative preferred stock (GAAP) | (125 | ) |
| (125 | ) | (125 | ) |
| (125 | ) |
| Intangible adjustment (non-GAAP) | (360,005 | ) |
| (254,332 | ) | (499,622 | ) |
| (467,421 | ) |
| Average tangible capital (non-GAAP) | $ | 750,394 |
|
| $ | 630,207 |
| $ | 1,069,868 |
|
| $ | 876,315 |
|
| Average assets (GAAP) | $ | 8,196,229 |
|
| $ | 6,899,265 |
| $ | 11,091,320 |
|
| $ | 9,689,057 |
|
| Intangible adjustment (non-GAAP) | (360,005 | ) |
| (254,332 | ) | (499,622 | ) |
| (467,421 | ) |
| Average tangible assets (non-GAAP) | $ | 7,836,224 |
|
| $ | 6,644,933 |
| $ | 10,591,698 |
|
| $ | 9,221,636 |
|
| Net income available to common stockholders (GAAP) | $ | 96,070 |
|
| $ | 81,051 |
| $ | 164,460 |
|
| $ | 159,139 |
|
| CDI amortization, net of tax (GAAP) | 3,670 |
|
| 2,542 |
| 4,736 |
|
| 5,307 |
|
| Tangible net income available to common stockholders (non-GAAP) | $ | 99,740 |
|
| $ | 83,593 |
| $ | 169,196 |
|
| $ | 164,446 |
|
| Per Share Data: | |
| | |
| |
| Diluted net income available to common stockholders (GAAP) | $ | 2.12 |
|
| $ | 1.98 |
| $ | 3.19 |
|
| $ | 3.22 |
|
| Diluted tangible net income available to common stockholders (non-GAAP) | $ | 2.20 |
|
| $ | 2.04 |
| $ | 3.28 |
|
| $ | 3.32 |
|
| Ratios: |
|
|
|
|
|
|
| Return on average GAAP capital (ROE) | 8.65 | % |
| 9.16 | % | 10.48 | % |
| 11.84 | % |
| Return on average tangible capital | 13.30 | % |
| 13.26 | % | 15.81 | % |
| 18.77 | % |
| Return on average assets (ROA) | 1.17 | % |
| 1.17 | % | 1.48 | % |
| 1.64 | % |
| Return on average tangible assets | 1.27 | % |
| 1.26 | % | 1.60 | % |
| 1.78 | % |
Return on average tangible capital is tangible net income available to common stockholders (annualized) expressed as a percentage of average tangible capital. Return on average tangible assets is tangible net income available to common stockholders (annualized) expressed as a percentage of average tangible assets.
PART II: ITEM 7. AND ITEM 7A. MANAGEMENT'S DISCUSSION AND ANALYSIS OF FINANCIAL CONDITION AND RESULTS OF OPERATIONS
LOAN QUALITY/PROVISION AND ALLOWANCE FOR LOAN LOSSES
The Corporation's primary lending focus is small business and middle market commercial, commercial real estate and residential real estate, which results in portfolio diversification. Commercial loans are individually underwritten and judgmentally risk rated. They are periodically monitored and prompt corrective actions are taken on deteriorating loans. RetailConsumer loans are typically underwritten with statistical decision-making tools and are managed throughout their life cycle on a portfolio basis.
PART II: ITEM 7. AND ITEM 7A. MANAGEMENT'S DISCUSSION AND ANALYSIS OF FINANCIAL CONDITION AND RESULTS OF OPERATIONS
Loan Quality
The quality of the loan portfolio and amount of non-performing loans may increase or decrease as a result of acquisitions, organic portfolio growth, problem loan recognition and resolution through collections, sales or charge-offs. The performance of any loan can be affected by external factors such as economic conditions, or internal factors specific to a particular borrower, such as the actions of a customer's internal management.
At December 31, 2017,2019, non-performing loans totaled $29,737,000,$16.8 million, a decrease of $5,008,000$10.5 million from December 31, 2016. Troubled debt restructured loans of $1,013,000 decreased $3,734,000 from December 31, 2016. The decrease in troubled debt restructures was primarily in the loans secured by commercial real estate category, which decreased $3,096,000 year over year.2018. Loans not accruing interest income totaled $28,724,000$15.9 million at December 31, 2017,2019, a decrease of $1,274,000$10.2 million from the December 31, 20162018 balance of $29,998,000.$26.1 million. The Corporation's coverage ratio of allowance for loan losses to non-accrual loans increased from 220.1308.1 percent at December 31, 20162018 to 261.2503.4 percent at December 31, 2017.2019. See additional information in the “Provision and Allowance for Loan Losses” section of this Management’s Discussion and Analysis of Financial Condition and Results of Operations.
Other real estate owned totaling $10,373,000$7.5 million increased $1,407,000$5.3 million during the twelve month period ending December 31, 2017.2019. The increase in other real estate owned was primarily driven by $6.3 million in collateral fromthe transfer of a purchased credit impaired relationship.single commercial property with a carrying value of $5.9 million. For other real estate owned, current appraisals are obtained to determine fair value as management continues to aggressively market these real estate assets.
Accruing loans 90-days or more delinquent 90+ days of $924,000totaled $69,000 at December 31, 2017 increased $812,0002019, a decrease of $1.8 million from the December 31, 20162018 balance of $112,000. Loans secured by commercial$1.9 million. The decrease was primarily in real estate and revolving home equity line of credit loans 90+ days delinquent and accruing increased $603,000 and $172,000, respectively, from December 31, 2016.construction loans.
Commercial impairedImpaired loans include all non-accrual loans loans accounted for under ASC 310-30 as well as substandard, doubtful and loss grade loans that were still accruing but deemed impaired according to the guidance set forth in ASC 310. Also included in impaired310-10. Commercial loans are accruingunder $500,000 and consumer loans, contractually past due 90 days or more andwith the exception of troubled debt restructured loans.
restructures, are not individually evaluated for impairment. A loan is deemed impaired when, based on current information or events, it is probable that all amounts due of principal and interest according to the contractual terms of the loan agreement will not be collected substantially within the contractual terms of the note. At December 31, 2017, commercial2019, impaired loans totaled $52,687,000,$11.7 million, a decrease of $19,636,000$10.3 million from the December 31, 2016.2018 balance of $22.0 million. At December 31, 2017,2019, a specific allowance for losses was not deemed necessary for commercial impaired loans totaling $49,308,000$7.4 million as there was no identified loss on these credits. An allowance of $1,233,000$689,000 was recorded for the remaining balance of these impaired loans totaling $3,379,000$4.4 million, and is included in the Corporation’s allowance for loan losses.
At December 31, 2017,The Corporation's non-performing assets which includes non-accrual loans, renegotiated loans, and other real estate owned, plus accruing loans 90-days or more delinquent totaled $41,034,000, a decrease of $2,789,000 from December 31, 2016 asand impaired loans are presented in the table below.
| | | | December 31, |
| December 31, | December 31, |
| December 31, |
| (Dollars in Thousands) | 2017 |
| 2016 | 2019 |
| 2018 |
| Non-performing assets: | |
| | |
| |
| Non-accrual loans | $ | 28,724 |
|
| $ | 29,998 |
| $ | 15,949 |
|
| $ | 26,148 |
|
| Renegotiated loans | 1,013 |
|
| 4,747 |
| 841 |
|
| 1,103 |
|
| Non-performing loans (NPL) | 29,737 |
|
| 34,745 |
| 16,790 |
|
| 27,251 |
|
| Other real estate owned | 10,373 |
|
| 8,966 |
| 7,527 |
|
| 2,179 |
|
| Non-performing assets (NPA) | 40,110 |
|
| 43,711 |
| 24,317 |
|
| 29,430 |
|
| 90+ days delinquent and still accruing | 924 |
|
| 112 |
| |
| NPAs & 90+ days delinquent | $ | 41,034 |
|
| $ | 43,823 |
| |
| Impaired loans (includes substandard, doubtful and loss) | $ | 52,687 |
|
| $ | 72,050 |
| |
| Loans 90-days or more delinquent and still accruing | | 69 |
|
| 1,855 |
|
| NPAs and loans 90-days or more delinquent | | $ | 24,386 |
|
| $ | 31,285 |
|
| Impaired loans | | $ | 11,709 |
|
| $ | 22,025 |
|
The non-accrual balances in the above table above include troubled debt restructures totaling $3,630,000$709,000 and $4,478,000$705,000 as of December 31, 20172019 and December 31, 2016,2018, respectively.
The composition of non-performing assets and accruing loans 90 days or more delinquent, by collateral classification, is reflected in the following table.
|
| | | | | | | |
| | December 31, |
| December 31, |
| (Dollars in Thousands) | 2017 |
| 2016 |
| Non-performing assets and 90+ days delinquent: | |
| |
| Commercial and industrial loans | $ | 3,278 |
|
| $ | 2,138 |
|
| Agricultural production financing and other loans to farmers | 1,027 |
|
| 1,341 |
|
| Real estate loans | |
| |
| Construction | 2,980 |
|
| 5,312 |
|
| Commercial and farmland | 20,382 |
|
| 22,362 |
|
| Residential | 11,051 |
|
| 10,943 |
|
| Home equity | 2,239 |
|
| 1,688 |
|
| Individual's loans for household and other personal expenditures | 77 |
|
| 39 |
|
| Non-performing assets plus 90+ days delinquent | $ | 41,034 |
|
| $ | 43,823 |
|
PART II: ITEM 7. AND ITEM 7A. MANAGEMENT'S DISCUSSION AND ANALYSIS OF FINANCIAL CONDITION AND RESULTS OF OPERATIONS
The composition of non-performing assets plus accruing loans 90-days or more delinquent is reflected in the following table.
|
| | | | | | | |
| | December 31, |
| December 31, |
| (Dollars in Thousands) | 2019 |
| 2018 |
| Non-performing assets and loans 90-days or more delinquent: | |
| |
| Commercial and industrial loans | $ | 1,259 |
|
| $ | 2,052 |
|
| Agricultural production financing and other loans to farmers | 183 |
|
| 679 |
|
| Real estate loans | |
| |
| Construction | 7,191 |
|
| 11,606 |
|
| Commercial and farmland | 7,103 |
|
| 8,682 |
|
| Residential | 6,810 |
|
| 5,987 |
|
| Home equity | 1,795 |
|
| 1,815 |
|
| Individual's loans for household and other personal expenditures | 45 |
|
| 110 |
|
| Public finance and other commercial loans | — |
|
| 354 |
|
| Non-performing assets and loans 90-days or more delinquent | $ | 24,386 |
|
| $ | 31,285 |
|
Although the Corporation believes its underwriting and loan review procedures are appropriate for the various kinds of loans it makes, its results of operations and financial condition could be adversely affected in the event the quality of its loan portfolio declines. Deterioration in the economic environment including residential and commercial real estate values may result in increased levels of loan delinquencies and credit losses.
Concentrations of credit in the portfolio, including commercial construction and land development loans, are closely monitored by management. Commercial construction and land development loans represented 9.1 percent of loans at December 31, 2017, a slight increase from 8.1 percent at December 31, 2016.
In 2017,2019, net charge-offs totaled $148,000, a decrease$3.1 million, an increase of $1,925,000$1.4 million and $1,780,000$2.9 million from 20162018 and 2015,2017, respectively. In 2017,2019, the Corporationcorporation incurred charge-offs exceeding $500,000 on two commercial relationships, with said charge-offs totaling $3.6 million. One recovery above $500,000, in the amount of $738,000, was recognized on one commercial relationship with said charge-offduring 2019. In 2018, the corporation incurred charge-offs exceeding $500,000 on two commercial relationships totaling $624,000. Two recoveries over$1.3 million. Recoveries above $500,000, totaling $1,752,000,$809,000, were recognized on one commercial relationship during the year.twelve month period ending December 31, 2018.
The CorporationsCorporation's loan loss experience is presented in the table below for the years indicated.
| | | (Dollars in Thousands) | 2017 |
| 2016 |
| 2015 | 2019 |
| 2018 |
| 2017 |
| Allowance for loan losses: | |
| |
| | |
| |
| |
| Balance at December 31, 2016 | $ | 66,037 |
|
| $ | 62,453 |
|
| $ | 63,964 |
| |
| Beginning balance | | $ | 80,552 |
|
| $ | 75,032 |
|
| $ | 66,037 |
|
|
|
|
|
|
|
|
|
|
|
|
|
|
|
|
|
|
| Charge-offs | 5,028 |
|
| 7,429 |
|
| 8,272 |
| 6,621 |
|
| 7,983 |
|
| 5,028 |
|
| Recoveries | 4,880 |
|
| 5,356 |
|
| 6,344 |
| 3,553 |
|
| 6,276 |
|
| 4,880 |
|
| Net charge-offs | 148 |
|
| 2,073 |
|
| 1,928 |
| 3,068 |
|
| 1,707 |
|
| 148 |
|
| Provision for loan losses | 9,143 |
|
| 5,657 |
|
| 417 |
| 2,800 |
|
| 7,227 |
|
| 9,143 |
|
| Balance at December 31 | $ | 75,032 |
|
| $ | 66,037 |
|
| $ | 62,453 |
| |
| Ending balance | | $ | 80,284 |
|
| $ | 80,552 |
|
| $ | 75,032 |
|
| Ratio of net charge-offs during the period to average loans outstanding during the period | 0.00 | % |
| 0.04 | % |
| 0.05 | % | 0.04 | % |
| 0.02 | % |
| 0.00 | % |
| Ratio of allowance to non-accrual loans | 261.20 | % |
| 220.10 | % |
| 199.00 | % | 503.4 | % |
| 308.1 | % |
| 261.2 | % |
The distribution of the net charge-offs by collateral classification is provided in the following table for the years indicated.
| | | (Dollars in Thousands) | December 31, 2017 |
| December 31, 2016 |
| December 31, 2015 | December 31, 2019 |
| December 31, 2018 |
| December 31, 2017 |
| Net charge-offs: | |
| |
| | |
| |
| |
| Commercial and industrial loans | $ | (141 | ) |
| $ | 600 |
|
| $ | (302 | ) | $ | 239 |
|
| $ | (257 | ) |
| $ | (141 | ) |
| Agricultural production financing and other farm loans | (66 | ) |
| 59 |
|
| 757 |
| 10 |
|
| 37 |
|
| (66 | ) |
| Real estate loans |
|
|
|
|
|
|
|
|
|
|
| Construction | (31 | ) |
| (11 | ) |
| 101 |
| 1,226 |
|
| 734 |
|
| (31 | ) |
| Commercial and farmland | (492 | ) |
| 329 |
|
| (1,209 | ) | 1,160 |
|
| (518 | ) |
| (492 | ) |
| Residential | 162 |
|
| 511 |
|
| 1,298 |
| 95 |
|
| 586 |
|
| 162 |
|
| Home equity | 447 |
|
| 388 |
|
| 1,025 |
| (69 | ) |
| 598 |
|
| 447 |
|
| Individuals loans for household and other personal expenditures | 269 |
|
| 198 |
|
| 268 |
| 168 |
|
| 447 |
|
| 269 |
|
| Lease financing receivables, net of unearned income |
|
|
|
|
|
|
|
| |
| Other commercial loans |
|
|
| (1 | ) |
| (10 | ) | |
| Public finance and other commercial loans | | 239 |
|
| 80 |
|
|
|
| Total net charge-offs | $ | 148 |
|
| $ | 2,073 |
|
| $ | 1,928 |
| $ | 3,068 |
|
| $ | 1,707 |
|
| $ | 148 |
|
PART II: ITEM 7. AND ITEM 7A. MANAGEMENT'S DISCUSSION AND ANALYSIS OF FINANCIAL CONDITION AND RESULTS OF OPERATIONS
Provision and Allowance for Loan Losses
The allowance for loan losses is maintained through the provision for loan losses, which is a charge against earnings. The provision for loan losses in 2017, 2016, and 2015 were $9,143,000, $5,657,000, and $417,000, respectively.
Based on management’s judgment as to the appropriate level of the allowance for loan losses, the amount provided in any period may be greater or less than net loan losses for the same period. The determination of the provision amount and the adequacy of the allowance in any period is based on management’s continuing review and evaluation of the loan portfolio, including an internally administered loan "watch" list and an independent review.loan reviews. The evaluation also takes into consideration identified credit problems, portfolio growth, management's judgment as to the impact of current economic conditions on the portfolio and the possibility of losses inherent in the loan portfolio that are not specifically identified. Additional details are discussed in NOTE 1. NATURE OF OPERATIONS AND SUMMARY OF SIGNIFICANT ACCOUNTING POLICIES of the Notes to Consolidated Financial Statements included in Item 8 of this Annual Report on Form 10-K.
Management believes that the allowance for loan losses is adequate to cover incurred losses inherent in the loan portfolio at December 31, 2017.2019. The process for determining the adequacy of the allowance for loan losses is critical to the Corporation’s financial results. It requires management to make difficult, subjective and complex judgments to estimate the effect of uncertain matters. The allowance for loan losses considers current factors, economic conditions and ongoing internal and external examination processes and will increase or decrease as deemed necessary to ensure the allowance remains adequate. In addition, the allowance as a percentage of charge-offs and nonperforming loans will change at different points in time based on credit performance, portfolio mix and collateral values. Management continually evaluates the commercial loan portfolio by including consideration of specific borrower cash flow analysis and estimated collateral values, types and amounts on non-performing loans, past and anticipated loan loss experience, changes in the composition of the loan portfolio, and the current condition and amount of loans outstanding.
PART II: ITEM 7. AND ITEM 7A. MANAGEMENT'S DISCUSSION AND ANALYSIS OF FINANCIAL CONDITION AND RESULTS OF OPERATIONS
In conformance with ASC 805 and ASC 820, purchased loans purchased are recorded at the acquisition date fair value. Such loans are included in the allowance to the extent a specific impairment is identified that exceeds the fair value adjustment on an impaired loan. An allowance may also be necessary if the historical loss and environmental factor analysis indicates losses inherent in a purchased portfolio exceed the fair value adjustment on the portion of the purchased portfolio not deemed impaired.
At December 31, 2017,2019, the allowance for loan losses was $75,032,000, an increase$80.3 million, a decrease of $8,995,000$268,000 from December 31, 2016. The increases in provision expense and2018. During the allowancetwelve month period ending December 31, 2019, specific reserves on impaired loans decreased $1.2 million, while the loss reserve for loan losses was primarily due to the level of organic loan growth in 2017.loans not deemed impaired increased $915,000. As a percent of total loans, the allowance decreasedwas 0.95 percent at December 31, 2019, compared to 1.11 percent at December 31, 2017 from 1.28 percent at December 31, 2016.2018. The decreasedecline in the ratioallowance as a percent of allowance to total loans was primarily due to a declinean improvement in loss rates resulting fromcredit metrics and the strengthened economy and an increaseacquisition of MBT, which resulted in the percentage$732.6 million of acquired loans to loans. During 2017, the specific reserves against impaired loans increased by $749,000, and the allowance for loans not deemed impaired increased by $8,246,000. Not included inthat are excluded from the allowance for loan losses is the remaining fair value discount on acquired loans of $46,304,000 and $34,936,000 as of December 31, 2017 and 2016, respectively. calculation.
Loans are generally secured by specific items of collateral, including real property and business assets. Allowable methods for determining the amount of impairment include estimating fair value using the fair value of the collateral for collateral dependent loans. If the impaired loan is identified as collateral dependent, then the fair value method of measuring the amount of impairment is utilized. This method requires obtaining a current independent appraisal of the collateral and applying a discount factor to the value. The fair value of real estate is determined based on appraisals by qualified licensed appraisers. The appraisers determine the value of the real estate by utilizing an income or market valuation approach. Updated “as is” or “liquidation value” appraisals are obtained as individual circumstances and/or market conditions warrant. Partially charged off loans measured for impairment based on their collateral value are generally not returned to performing status subsequent to receiving updated appraisals or restructure of the loan. If an appraisal is not available, the fair value may be determined by using a discounted cash flow analysis. Fair value on other collateral such as business assets is typically ascertained by assessing, either singularly or some combination of, asset appraisals, accounts receivable aging reports, inventory listings and/or customer financial statements. Both appraised values and values based on borrower’s financial information are discounted as considered appropriate based on age and quality of the information and current market conditions.
Loans deemed impaired according to guidance set forth in ASC 310 are evaluated during problem loan meetings held within each reporting period by a special assets management team. Loan collateral and customer financial information are reviewed and the level of impairment is assessed to determine appropriate reserve and/or charge-off amounts. Loans or portions of loans are charged off when they are considered uncollectible. It is the Corporation’s policy to recognize losses promptly to prevent overstatement of assets, earnings and capital.
The following table summarizes loan loss reserves by collateral segment for the periods ended December 31, 20172019 and 2016.2018.
| | | | December 31, 2017 | December 31, 2019 |
| (Dollars in Thousands) | Commercial |
| Commercial
Real Estate |
| Consumer |
| Residential |
| Finance
Leases |
| Total | Commercial |
| Commercial
Real Estate |
| Consumer |
| Residential |
| Total |
| Allowance balances: | |
| |
| |
| |
| |
| | |
| |
| |
| |
| |
| Individually evaluated for impairment | $ | 666 |
|
| $ | 567 |
|
|
|
| $ | 404 |
|
|
|
| $ | 1,637 |
| $ | — |
|
| $ | 231 |
|
| $ | — |
|
| $ | 458 |
|
| $ | 689 |
|
| Collectively evaluated for impairment | 29,752 |
|
| 26,776 |
|
| $ | 3,732 |
|
| 13,133 |
|
| $ | 2 |
|
| 73,395 |
| 32,902 |
|
| 28,547 |
|
| 4,035 |
|
| 14,111 |
|
| 79,595 |
|
| Total allowance for loan losses | $ | 30,418 |
|
| $ | 27,343 |
|
| $ | 3,732 |
|
| $ | 13,537 |
|
| $ | 2 |
|
| $ | 75,032 |
| $ | 32,902 |
|
| $ | 28,778 |
|
| $ | 4,035 |
|
| $ | 14,569 |
|
| $ | 80,284 |
|
| | | | December 31, 2016 | December 31, 2018 |
| (Dollars in Thousands) | Commercial |
| Commercial
Real Estate |
| Consumer |
| Residential |
| Finance
Leases |
| Total | Commercial |
| Commercial
Real Estate |
| Consumer |
| Residential |
| Total |
| Allowance balances: | |
| |
| |
| |
| |
| | |
| |
| |
| |
| |
| Individually evaluated for impairment | $ | 37 |
|
| $ | 553 |
|
|
|
| $ | 298 |
|
|
|
| $ | 888 |
| $ | — |
|
| $ | 1,435 |
|
| $ | 1 |
|
| $ | 436 |
|
| $ | 1,872 |
|
| Collectively evaluated for impairment | 27,659 |
|
| 23,108 |
|
| $ | 2,923 |
|
| 11,457 |
|
| $ | 2 |
|
| 65,149 |
| 32,657 |
|
| 28,174 |
|
| 3,963 |
|
| 13,886 |
|
| 78,680 |
|
| Total allowance for loan losses | $ | 27,696 |
|
| $ | 23,661 |
|
| $ | 2,923 |
|
| $ | 11,755 |
|
| $ | 2 |
|
| $ | 66,037 |
| $ | 32,657 |
|
| $ | 29,609 |
|
| $ | 3,964 |
|
| $ | 14,322 |
|
| $ | 80,552 |
|
PART II: ITEM 7. AND ITEM 7A. MANAGEMENT'S DISCUSSION AND ANALYSIS OF FINANCIAL CONDITION AND RESULTS OF OPERATIONS
The historical loss allocation for loans not deemed impaired according to ASC 450 is the product of the volume of loans within the non-impaired criticized and non-criticized risk grade classifications, each segmented by call code, and the historical loss factor for each respective classification and call code segment. The historical loss factors are based upon actual loss experience within each risk and call code classification. The historical look back period for non-criticized loans is the most recent rolling-four-quarter average and aligns with the look back period for non-impaired criticized loans. This look back period includes all charge-offs from the most recent seven quarters and is reflective of current conditions.quarters. The loss factor computation for this allocation includes a segmented historical loss migration analysis of loans, by risk grade, to charge-off. The decrease in the allowance as a percent of originated loans reflected the impact of the stabilizing economic environment on the Corporation’s loan portfolio, resulting in improved credit quality.
PART II: ITEM 7. AND ITEM 7A. MANAGEMENT'S DISCUSSION AND ANALYSIS OF FINANCIAL CONDITION AND RESULTS OF OPERATIONS
In addition to the specific reserves and historical loss components of the allowance, consideration is given to various environmental factors to help ensure that losses inherent in the portfolio are reflected in the allowance for loan losses. The environmental component adjusts the historical loss allocations for commercial and consumer loans to reflect relevant current conditions that have an impact on loss recognition. Environmental factors that management reviews in the analysis include: National and local economic trends and conditions; trends in growth in the loan portfolio and growth in higher risk areas; levels of, and trends in, delinquencies and non-accruals; experience and depth of lending management and staff; adequacy of, and adherence to, lending policies and procedures including those for underwriting; industry concentrations of credit; and adequacy of risk identification systems and controls through the internal loan review and internal audit processes. Each environmental factor receives an individual qualitative allocation that reflects losses inherent in the portfolio that are not reflected in the historical loss components of the allowance. As the economic environment has seen improvement during recent years, management believes losses inherent in the portfolio may not be immediately apparent for specific identification.
The Corporation’s primary market areas for lending are central Indiana, northwestern Indiana, northeasternand northern Indiana, northeastern Illinois, central Ohio, and central Ohio.southeast Michigan. When evaluating the adequacy of the allowance, consideration is given to this regional geographic concentration and the closely associated effect changing economic conditions have on the Corporation’s customers. The allowance for loan losses at December 31, 20172019 is reflective of both the banking environment within the Corporation’s footprint and the Corporation’s recent loan and loss trends.
Management continually evaluates the commercial loan portfolio by including consideration of specific borrower cash flow analysis and estimated collateral values, types and amounts on non-performing loans, past and anticipated loan loss experience, changes in the composition of the loan portfolio and the current condition and amount of loans outstanding. The determination of the provision for loan losses in any period is based on management's continuing review and evaluation of the loan portfolio, and its judgment as to the impact of current economic conditions on the portfolio.
Beginning with the first quarter of 2020, the Corporation will adopt Accounting Standards Update (ASU) No. 2016-13, Financial Instruments - Credit Losses (Topic 326): Measurement of Credit Losses on Financial Instruments. This new guidance was issued to address concerns that current generally accepted accounting principles (GAAP) restricts the ability to record credit losses that are expected, but do not yet meet the “probable” threshold by replacing the current “incurred loss” model for recognizing credit losses with an “expected life of loan loss” model referred to as the Current Expected Credit Loss (CECL) model.
Under the CECL model, certain financial assets carried at amortized cost, such as loans held for investment and held-to-maturity debt securities, are required to be presented at the net amount expected to be collected. The measurement of expected credit losses is to be based on information about past events, including historical experience, current conditions, and reasonable and supportable forecasts that affect the collectability of the reported amount. This measurement will take place at the time the financial asset is first added to the balance sheet and periodically thereafter. This differs significantly from the “incurred loss” model required under current GAAP, which delays recognition until it is probable a loss has been incurred. The change could materially affect how the allowance for loan losses is determined and cause a charge to earnings through the provision for loan losses. Such charge would adversely affect the financial condition of the Corporation.
The Corporation has developed models that satisfy the requirements of the new standard which will be governed by a system of internal controls and a cross-functional working group consisting of accounting, finance, and credit administration personnel. The loan portfolio was pooled into ten loan segments with similar risk characteristics for which the probability of default/loss given default methodology will be applied. The Corporation intends to utilize a one-year economic forecast period then revert to historical macroeconomic levels for the remaining life of the portfolio. A baseline macroeconomic scenario, along with three other scenarios, will be used to develop a range of estimated credit losses for which to determine the best estimate within.
The Corporation will record a one-time cumulative-effect adjustment to retained earnings, net of income taxes, on the consolidated balance sheet as of the beginning of the first quarter of 2020. The allowance will increase by 55-65 percent because it will cover expected credit losses over the life of the loan portfolio, which approximates four years, and it includes all purchased loans that were previously excluded from the allowance for loan losses calculation. CECL also requires the establishment of a reserve for potential losses from unfunded commitments that is recorded in other liabilities, separate from allowance for credit losses, which is estimated to be approximately $18 million.
GOODWILL
Goodwill is reviewed at least annually for impairment. The Corporation completed its most recent annual goodwill impairment test on October 1, 20172019 and concluded, based on current events and circumstances, goodwill is not impaired. The IABMBT acquisition on July, 14, 2017September, 1, 2019 resulted in $153,636,000 of goodwill. The Arlington Bank acquisition on May 19, 2017 resulted in $47,719,000$98.6 million of goodwill, which includes a reductionan addition of $469,000. This reduction was$719,000 recorded in the thirdfourth quarter of 20172019 as a measurement period adjustment. The Ameriana acquisition onThere were no changes in goodwill for the year ending December 31, 2015 resulted in $38,624,000 of goodwill, of which, $871,000 was recorded during the first quarter of 2016 as a measurement period adjustment.2018. Details regarding the acquisitionsMBT acquisition are discussed in NOTE 2. ACQUISITIONSACQUISITION of the Notes to Consolidated Financial Statements included in Item 8 of this Annual Report on Form 10-K.
PART II: ITEM 7. AND ITEM 7A. MANAGEMENT'S DISCUSSION AND ANALYSIS OF FINANCIAL CONDITION AND RESULTS OF OPERATIONS
LIQUIDITY
Liquidity management is the process by which the Corporation ensures that adequate liquid funds are available for the holding company and its subsidiaries. These funds are necessary in order to meet financial commitments on a timely basis. These commitments include withdrawals by depositors, funding credit obligations to borrowers, paying dividends to stockholders, paying operating expenses, funding capital expenditures, and maintaining deposit reserve requirements. Liquidity is monitored and closely managed by the asset/liability committee.
The Corporation’s liquidity is dependent upon the receipt of dividends from the Bank, which is subject to certain regulatory limitations and access to other funding sources. Liquidity of the Bank is derived primarily from core deposit growth, principal payments received on loans, the sale and maturity of investment securities, net cash provided by operating activities, and access to other funding sources.
The principal source of asset-funded liquidity is investment securities classified as available for sale, the market values of which totaled$999,947,000totaled $1.8 billion at December 31, 2017,2019, an increase of $303,085,000,$647.8 million, or 43.556.7 percent, from December 31, 2016.2018. Securities classified as held to maturity that are maturing within a short period of time can also be a source of liquidity. Securities classified as held to maturity and that are maturing in one year or less totaled $12,015,000$9.9 million at December 31, 2017.2019. In addition, other types of assets such as cash and interest-bearing deposits with other banks, federal funds sold and loans maturing within one year are sources of liquidity.
The most stable source of liability-funded liquidity for both the long-term and short-term is deposit growth and retention in the core deposit base. Federal funds purchased and securities sold under agreements to repurchase are also considered a source of liquidity. In addition, FHLB advances are utilized as a funding source. At December 31, 2017,2019, total borrowings from the FHLB were $414,377,000.$351.1 million. The Bank has pledged certain mortgage loans and investments to the FHLB. The total available remaining borrowing capacity from the FHLB at December 31, 20172019 was $664,177,000.$638.7 million.
The required payments related to operating leases and borrowings at December 31, 2019 are as follows:
|
| | | | | | | | | | | | | | | | | | | | | | | | | | | | | | | |
| (Dollars in Thousands) | 2020 |
| 2021 |
| 2022 |
| 2023 |
| 2024 |
| 2025 and
after |
| ASC 805 fair value adjustments at acquisition |
| Total |
| Operating leases | $ | 3,434 |
| | $ | 3,157 |
| | $ | 3,033 |
| | $ | 2,654 |
| | $ | 2,585 |
| | $ | 10,198 |
| | $ | — |
| | $ | 25,061 |
|
| Federal funds purchased | 55,000 |
|
| — |
|
| — |
|
| — |
|
| — |
|
| — |
|
| — |
|
| 55,000 |
|
| Securities sold under repurchase agreements | 187,946 |
|
| — |
|
| — |
|
| — |
|
| — |
|
| — |
|
| — |
|
| 187,946 |
|
| Federal Home Loan Bank advances | 41,370 |
|
| 55,097 |
|
| 95,097 |
|
| 115,097 |
|
| 97 |
|
| 44,314 |
|
| — |
|
| 351,072 |
|
| Subordinated debentures and term loans | — |
|
| — |
|
| — |
|
| — |
|
| — |
|
| 142,322 |
|
| (3,637 | ) |
| 138,685 |
|
| Total | $ | 287,750 |
|
| $ | 58,254 |
|
| $ | 98,130 |
|
| $ | 117,751 |
|
| $ | 2,682 |
|
| $ | 196,834 |
|
| $ | (3,637 | ) |
| $ | 757,764 |
|
For further details related to the Corporation's borrowings, see NOTE 12.13. BORROWINGS of the Notes to Consolidated Financial Statements included in Item 8 of this Annual Report on Form 10-K.
InAdditionally, the Corporation has entered into a number of long-term leasing arrangements to support ongoing activities. Details related to the Corporation's lease obligations are discussed within NOTE 10. LEASES of the Notes to Consolidated Financial Statements included in Item 8 of this Annual Report of Form 10-K.
Also, in the normal course of business, the Bank is a party to a number of other off-balance sheet activities that contain credit, market and operational risk that are not reflected in whole or in part in the consolidated financial statements. SuchThese activities include:primarily consist of traditional off-balance sheet credit-related financial instruments commitments under operating leases and long-term debt.
The Bank provides customers with off-balance sheet credit support throughsuch as loan commitments and standby letters of credit.
Summarized credit-related financial instruments at December 31, 20172019 are as follows:
| | | | December 31, | | | |
| (Dollars in Thousands) | 2017 | December 31, 2019 |
| Amounts of Commitments: | | |
| Loan commitments to extend credit | $ | 2,482,641 |
| $ | 3,005,064 |
|
| Standby letters of credit | 43,526 |
| 30,200 |
|
| | $ | 2,526,167 |
| $ | 3,035,264 |
|
PART II: ITEM 7. AND ITEM 7A. MANAGEMENT'S DISCUSSION AND ANALYSIS OF FINANCIAL CONDITION AND RESULTS OF OPERATIONS
Since many of the commitments are expected to expire unused or be only partially used, the total amount of unused commitments in the preceding table does not necessarily represent future cash requirements.
In addition to owned banking facilities, the Corporation has entered into a number of long-term leasing arrangements to support ongoing activities. The required payments under such commitments and borrowings at December 31, 2017 are as follows:
|
| | | | | | | | | | | | | | | | | | | | | | | | | | | | | | | |
| (Dollars in Thousands) | 2018 |
| 2019 |
| 2020 |
| 2021 |
| 2022 |
| 2023 and
after |
| ASC 805 fair value adjustments at acquisition |
| Total |
| Operating leases | $ | 3,161 |
|
| $ | 3,611 |
|
| $ | 3,484 |
|
| $ | 3,137 |
|
| $ | 3,090 |
|
| $ | 15,180 |
|
|
|
|
| $ | 31,663 |
|
| Federal funds purchased | 144,038 |
|
|
|
|
|
|
|
|
|
|
|
|
|
|
| 144,038 |
|
| Securities sold under repurchase agreements | 136,623 |
|
|
|
|
|
|
|
|
|
|
|
|
|
|
|
| 136,623 |
|
| Federal Home Loan Bank advances | 171,391 |
|
| 121,713 |
|
| 41,273 |
|
| 25,000 |
|
| 20,000 |
|
| 35,000 |
|
|
|
|
| 414,377 |
|
| Subordinated debentures and term loans |
|
|
|
|
|
|
|
|
|
|
|
|
|
| 143,430 |
|
| $ | (4,081 | ) |
| 139,349 |
|
| Total | $ | 455,213 |
|
| $ | 125,324 |
|
| $ | 44,757 |
|
| $ | 28,137 |
|
| $ | 23,090 |
|
| $ | 193,610 |
|
| $ | (4,081 | ) |
| $ | 866,050 |
|
INTEREST SENSITIVITY AND DISCLOSURES ABOUT MARKET RISK
Asset/Liability management has been an important factor in the Corporation's ability to record consistent earnings growth through periods of interest rate volatility and product deregulation. Management and the Board of Directors monitor the Corporation's liquidity and interest sensitivity positions at regular meetings to review how changes in interest rates may affect earnings. Decisions regarding investment and the pricing of loan and deposit products are made after analysis of reports designed to measure liquidity, rate sensitivity, the Corporation’s exposure to changes in net interest income given various rate scenarios and the economic and competitive environments.
PART II: ITEM 7. AND ITEM 7A. MANAGEMENT'S DISCUSSION AND ANALYSIS OF FINANCIAL CONDITION AND RESULTS OF OPERATIONS
It is the objective of the Corporation to monitor and manage risk exposure to net interest income caused by changes in interest rates. It is the goal of the Corporation’s Asset/Liability management function to provide optimum and stable net interest income. To accomplish this, management uses two asset liability tools. GAP/Interest Rate Sensitivity Reports and Net Interest Income Simulation Modeling are constructed, presented and monitored quarterly. Management believes that the Corporation's liquidity and interest sensitivity position at December 31, 2017,2019 remained adequate to meet the Corporation’s primary goal of achieving optimum interest margins while avoiding undue interest rate risk.
The following table presents the Corporation’s interest rate sensitivity analysis as of December 31, 20172019. | | | | December 31, 2017 | December 31, 2019 |
| (Dollars in Thousands) | 1-180 Days |
| 181-365 Days |
| 1-5 Years |
| Beyond 5 Years |
| Total | 1-180 Days |
| 181-365 Days |
| 1-5 Years |
| Beyond 5 Years |
| Total |
| Rate-Sensitive Assets: | |
| |
| |
| |
| | |
| |
|
| |
|
| |
| |
| Interest-bearing deposits | $ | 35,027 |
|
|
|
|
|
|
|
| $ | 35,027 |
| $ | 118,263 |
|
| $ | — |
|
| $ | — |
|
| $ | — |
|
| $ | 118,263 |
|
| Investment securities | 71,310 |
|
| $ | 62,434 |
|
| $ | 369,851 |
|
| $ | 1,057,007 |
|
| 1,560,602 |
| 148,834 |
|
| 112,748 |
|
| 555,860 |
|
| 1,778,621 |
|
| 2,596,063 |
|
| Loans | 3,757,877 |
|
| 359,647 |
|
| 1,475,182 |
|
| 1,090,677 |
|
| 6,683,383 |
| 4,809,785 |
|
| 538,928 |
|
| 1,894,883 |
|
| 1,224,751 |
|
| 8,468,347 |
|
| Federal Home Loan Bank stock | |
| |
| 23,825 |
|
| |
| 23,825 |
| — |
|
| — |
|
| 28,736 |
|
| — |
|
| 28,736 |
|
| Total rate-sensitive assets | $ | 3,864,214 |
|
| $ | 422,081 |
|
| $ | 1,868,858 |
|
| $ | 2,147,684 |
|
| $ | 8,302,837 |
| $ | 5,076,882 |
|
| $ | 651,676 |
|
| $ | 2,479,479 |
|
| $ | 3,003,372 |
|
| $ | 11,211,409 |
|
| Rate-Sensitive Liabilities: | |
| |
| |
| |
| | |
| |
| |
| |
| |
| Interest-bearing deposits | $ | 4,316,231 |
|
| $ | 538,598 |
|
| $ | 513,150 |
|
| $ | 42,998 |
|
| $ | 5,410,977 |
| $ | 7,087,907 |
|
| $ | 811,653 |
|
| $ | 191,739 |
|
| $ | 12,261 |
|
| $ | 8,103,560 |
|
| Federal funds purchased | 144,038 |
|
|
|
|
|
|
|
|
| 144,038 |
| 55,000 |
|
| — |
|
| — |
|
| — |
|
| 55,000 |
|
| Securities sold under repurchase agreements | 136,623 |
|
|
|
|
|
|
|
|
| 136,623 |
| 187,946 |
|
| — |
|
| — |
|
| — |
|
| 187,946 |
|
| Federal Home Loan Bank advances | 202,087 |
|
| 14,442 |
|
| 178,100 |
|
| 19,748 |
|
| 414,377 |
| 20,100 |
|
| 21,200 |
|
| 275,000 |
|
| 34,772 |
|
| 351,072 |
|
| Subordinated debentures and term loans | 72,322 |
|
|
|
|
|
|
| 67,027 |
|
| 139,349 |
| 68,685 |
|
| — |
|
| 70,000 |
|
| — |
|
| 138,685 |
|
| Total rate-sensitive liabilities | $ | 4,871,301 |
|
| $ | 553,040 |
|
| $ | 691,250 |
|
| $ | 129,773 |
|
| $ | 6,245,364 |
| $ | 7,419,638 |
|
| $ | 832,853 |
|
| $ | 536,739 |
|
| $ | 47,033 |
|
| $ | 8,836,263 |
|
| Interest rate sensitivity gap by period | $ | (1,007,087 | ) |
| $ | (130,959 | ) |
| $ | 1,177,608 |
|
| $ | 2,017,911 |
|
|
|
| $ | (2,342,756 | ) |
| $ | (181,177 | ) |
| $ | 1,942,740 |
|
| $ | 2,956,339 |
|
|
|
|
| Cumulative rate sensitivity gap | $ | (1,007,087 | ) |
| $ | (1,138,046 | ) |
| $ | 39,562 |
|
| $ | 2,057,473 |
|
| | $ | (2,342,756 | ) |
| $ | (2,523,933 | ) |
| $ | (581,193 | ) |
| $ | 2,375,146 |
|
| |
| Cumulative rate sensitivity gap ratio | |
| |
| |
| |
| | |
| |
| |
| |
| |
| at December 31, 2017 | 79.3 | % |
| 79.0 | % |
| 100.6 | % |
| 132.9 | % |
| | |
| at December 31, 2016 | 76.1 | % |
| 79.4 | % |
| 101.5 | % |
| 131.0 | % |
| | |
| at December 31, 2019 | | 68.4 | % |
| 69.4 | % |
| 93.4 | % |
| 126.9 | % |
| |
| at December 31, 2018 | | 74.8 | % |
| 72.4 | % |
| 91.1 | % |
| 126.7 | % |
| |
The Corporation had a cumulative negative gap of $1,138,046,000$2.5 billion in the one-year horizon at December 31, 20172019, or 12.1520.3 percent of total assets.
Net interest income simulation modeling, or earnings-at-risk, measures the sensitivity of net interest income to various interest rate movements. The Corporation's asset liability process monitors simulated net interest income under three separate interest rate scenarios; base, rising and falling. Estimated net interest income for each scenario is calculated over a twelve-month horizon. The immediate and parallel changes to the base case scenario used in the model are presented below. The interest rate scenarios are used for analytical purposes and do not necessarily represent management's view of future market movements. Rather, these are intended to provide a measure of the degree of volatility interest rate movements may introduce into the earnings of the Corporation.
PART II: ITEM 7. AND ITEM 7A. MANAGEMENT'S DISCUSSION AND ANALYSIS OF FINANCIAL CONDITION AND RESULTS OF OPERATIONS
The base scenario is highly dependent on numerous assumptions embedded in the model, including assumptions related to future interest rates. While the base sensitivity analysis incorporates management's best estimate of interest rate and balance sheet dynamics under various market rate movements, the actual behavior and resulting earnings impact will likely differ from that projected. For certain assets, the base simulation model captures the expected prepayment behavior under changing interest rate environments. Assumptions and methodologies regarding the interest rate or balance behavior of indeterminate maturity products, such as savings, money market, interest-bearing and demand deposits, reflect management's best estimate of expected future behavior. Historical retention rate assumptions are applied to non-maturity deposits for modeling purposes.
The comparative rising 200 basis points and falling 100 basis points scenarios below, as of December 31, 20172019, assume further interest rate changes in addition to the base simulation discussed above. These changes are immediate and parallel changes to the base case scenario. In the current rate environment, many driver rates are at or near historical lows, thus totalTotal rate movements (beginning point minus ending point) to each of the various driver rates utilized by management have the following results:
| | | |
| At December 31, 2017 |
| At December 31, 2019 |
| |
| RISING |
| FALLING |
| RISING |
| FALLING |
| Driver Rates |
| (200 Basis Points) |
| (100 Basis Points) |
| (200 Basis Points) |
| (100 Basis Points) |
| Prime |
| 200 |
| (100) |
| 200 |
| (100) |
| Federal Funds |
| 200 |
| (100) |
| 200 |
| (100) |
| One-Year CMT |
| 200 |
| (100) |
| 200 |
| (100) |
| Three-Year CMT |
| 200 |
| (100) |
| 200 |
| (100) |
| Five-Year CMT |
| 200 |
| (100) |
| 200 |
| (100) |
| CD's |
| 200 |
| (24) |
| 200 |
| (24) |
| FHLB |
| 200 |
| (100) |
| 200 |
| (89) |
PART II: ITEM 7. AND ITEM 7A. MANAGEMENT'S DISCUSSION AND ANALYSIS OF FINANCIAL CONDITION AND RESULTS OF OPERATIONS
Results for the base, rising 200 basis points and falling 100 basis points interest rate scenarios are listed below based upon the Corporation’s rate sensitive assets and liabilities at December 31, 20172019. The net interest income shown represents cumulative net interest income over a twelve-month time horizon. Balance sheet assumptions used for the base scenario are the same for the rising and falling simulations.
| | | | At December 31, 2017 | At December 31, 2019 |
| | |
| RISING |
| FALLING | |
| RISING |
| FALLING |
| (Dollars in Thousands) | Base |
| (200 Basis Points) |
| (100 Basis Points) | Base |
| (200 Basis Points) |
| (100 Basis Points) |
| Net Interest Income | $ | 311,466 |
|
| $ | 336,970 |
|
| $ | 286,477 |
| $ | 368,024 |
|
| $ | 389,367 |
|
| $ | 355,191 |
|
| Variance from Base |
|
| $ | 25,504 |
|
| $ | (24,989 | ) |
|
| $ | 21,343 |
|
| $ | (12,833 | ) |
| Percent of Change from Base |
|
|
| 8.19 | % |
| (8.02 | )% |
|
|
| 5.8 | % |
| (3.5 | )% |
The comparative rising 200 basis points and falling 100 basis points scenarios below, as of December 31, 20162018, assume further interest rate changes in addition to the base simulation discussed above. These changes are immediate and parallel changes to the base case scenario. In addition, total rate movements (beginning point minus ending point) to each of the various driver rates utilized by management in the base simulation are as follows:
| | | | | At December 31, 2016 | | At December 31, 2018 |
| |
| RISING |
| FALLING |
| RISING |
| FALLING |
| Driver Rates |
| (200 Basis Points) |
| (100 Basis Points) |
| (200 Basis Points) |
| (100 Basis Points) |
| Prime |
| 200 |
| (50) |
| 200 |
| (100) |
| Federal Funds |
| 200 |
| (50) |
| 200 |
| (100) |
| One-Year CMT |
| 200 |
| (77) |
| 200 |
| (100) |
| Three-Year CMT |
| 200 |
| (100) |
| 200 |
| (100) |
| Five-Year CMT |
| 200 |
| (100) |
| 200 |
| (100) |
| CD's |
| 200 |
| (16) |
| 200 |
| (25) |
| FHLB |
| 200 |
| (92) |
| 200 |
| (100) |
Results for the base, rising 200 basis points and falling 100 basis points interest rate scenarios are listed below based upon the Corporation’s rate sensitive assets and liabilities at December 31, 2016.2018. The net interest income shown represents cumulative net interest income over a twelve-month time horizon. Balance sheet assumptions used for the base scenario are the same for the rising and falling simulations.
| | | | At December 31, 2016 | At December 31, 2018 |
| | |
| RISING |
| FALLING | |
| RISING |
| FALLING |
| (Dollars in Thousands) | Base |
| (200 Basis Points) |
| (100 Basis Points) | Base |
| (200 Basis Points) |
| (100 Basis Points) |
| Net Interest Income | $ | 231,074 |
|
| $ | 247,920 |
|
| $ | 214,302 |
| $ | 344,064 |
|
| $ | 371,221 |
|
| $ | 330,990 |
|
| Variance from Base | |
| $ | 16,846 |
|
| $ | (16,772 | ) | |
| $ | 27,157 |
|
| $ | (13,074 | ) |
| Percent of Change from Base |
|
|
| 7.29 | % |
| (7.26 | )% |
|
|
| 7.9 | % |
| (3.8 | )% |
PART II: ITEM 7. AND ITEM 7A. MANAGEMENT'S DISCUSSION AND ANALYSIS OF FINANCIAL CONDITION AND RESULTS OF OPERATIONS
EARNING ASSETS
The following table presentsEarning assets increased by $2.3 billion during the earning asset mix as of twelve months ended December 31, 2017 and 2016. Earnings assets at December 31, 2017 increased by $1,888,367,000 compared to December 31, 2016.2019. The 2017 acquisitionsSeptember 1, 2019 acquisition of Arlington Bank and IABMBT contributed to increases in several categories. Additional details regardingof the acquisitions are discussed withinMBT acquisition can be found in NOTE 2. ACQUISITIONSACQUISITION of the Notes to Consolidated Financial Statements included in Item 8 of this Annual Report on Form 10-K.
Interest-bearing time deposits and investmentinvestments securities increased $10,568,000$81.3 million and $256,097,000,$963.5 million, respectively, since December 31, 2016. The July 14, 2017of which the MBT acquisition of IAB accounted for an$281.2 million and $212.2 million of the increase in interest-bearing time deposits of $248,212,000.and investment securities, respectively. During 2019, the third quarter of 2017, a significant portion of the acquired interest-bearing time deposits were used to investCorporation deployed excess liquidity in the Corporation's investment securities portfolio and reduce Federal Home Loan Bank advances.portfolio.
Loans and loans held for sale increased by $1,615,841,000 from December 2016,$1.2 billion, as the Arlington Bank and IAB acquisitionsMBT acquisition contributed $232,306,000 and $725,976,000, respectively.$732.6 million to the loan growth. In 2019, organic loan growth was $506.5 million, or 7 percent. The largest loan segments that experienced increases were commercial and farmland,industrial, construction real estate and commercial and industrial, residential, construction and other commercial.farmland real estate loans. No loan segments experienced decreases. Additional details regardingof the changes in the Corporation's loansloan porfolio are discussed within NOTE 5. LOANS AND ALLOWANCE of the Notes to Consolidated Financial Statements included in Item 8 of this Annual Report on Form 10-K.
Federal Home Loan Bank stock increased $5,861,000 primarily$4.1 million, all of which was due to the acquisitionsacquisition of Arlington BankMBT.
The following table presents the earning asset mix as of December 31, 2019 and IAB.2018.
| | | | December 31, |
| December 31, | December 31, |
| December 31, |
| (Dollars in Thousands) | 2017 | | 2016 | 2019 | | 2018 |
| Interest-bearing time deposits | $ | 35,027 |
|
| $ | 24,459 |
| $ | 118,263 |
|
| $ | 36,963 |
|
| Investment securities available for sale | 999,947 |
|
| 696,862 |
| 1,790,025 |
|
| 1,142,195 |
|
| Investment securities held to maturity | 560,655 |
|
| 607,643 |
| 806,038 |
|
| 490,387 |
|
| Loans held for sale | 7,216 |
|
| 2,929 |
| 9,037 |
|
| 4,778 |
|
| Loans | 6,751,199 |
|
| 5,139,645 |
| 8,459,310 |
|
| 7,224,467 |
|
| Federal Home Loan Bank stock | 23,825 |
|
| 17,964 |
| 28,736 |
|
| 24,588 |
|
| | $ | 8,377,869 |
|
| $ | 6,489,502 |
| $ | 11,211,409 |
|
| $ | 8,923,378 |
|
DEPOSITS AND BORROWINGS
The table below reflects the level of deposits and borrowed funds (federal funds purchased, repurchase agreements, FHLB advances, subordinated debentures and term loans) at December 31, 20172019 and 2016.2018.
| | | | December 31, |
| December 31, | December 31, |
| December 31, |
| (Dollars in Thousands) | 2017 |
| 2016 | 2019 |
| 2018 |
| Deposits | $ | 7,172,530 |
|
| $ | 5,556,498 |
| $ | 9,839,956 |
|
| $ | 7,754,593 |
|
| Federal funds purchased | 144,038 |
|
| 120,349 |
| 55,000 |
|
| 104,000 |
|
| Securities sold under repurchase agreements | 136,623 |
|
| 146,480 |
| 187,946 |
|
| 113,512 |
|
| Federal Home Loan Bank advances | 414,377 |
|
| 298,923 |
| 351,072 |
|
| 314,986 |
|
| Subordinated debentures and term loans | 139,349 |
|
| 128,445 |
| 138,685 |
|
| 138,463 |
|
| | $ | 8,006,917 |
|
| $ | 6,250,695 |
| $ | 10,572,659 |
|
| $ | 8,425,554 |
|
Deposits increased $1.6$2.1 billion from December 31, 2016.2018. The IABMBT acquisition on July 14, 2017 and the Arlington Bank acquisition on May 19, 2017September 1, 2019 resulted in deposits$1.1 billion of $862,271,000 and $252,783,000, respectively.acquired deposits. Additional details regarding the acquisitionsacquisition are discussed inwithin NOTE 2. ACQUISITIONSACQUISITION of the Notes to Consolidated Financial Statements included in Item 8 of this Annual Report on Form 10-K.
The increase in deposits,Deposit increases, excluding deposits acquired, from December 31, 2016, was primarily due to an increase of $580,726,000the MBT acquisition, were noted in demand, savings and time deposits of $667.3 million, $216.2 million and $75,887,000$127.7 million, respectively, as compared to the same period in time deposits.2018. Offsetting these increases was a decrease in savingsbrokered certificates of deposits of $154,984,000.$31.8 million.
Federal Home Loan Bank Advances and Federal FundsFHLB advances increased $36.1 million, which included $10.9 million in FHLB advances from the MBT acquisition, while federal funds purchased increased $115,454,000, in 2017, and included $47,575,000 in advances acquired in the IAB acquisition. Federal Funds Purchased increased $23,689,000, and when coupled with thedecreased $49.0 million. Liquidity generated from an increase in deposits and Federal Home Loan Bank Advances, the increased liquidityFHLB advances was used as a source ofto fund organic loan growth and investment securities purchases, and also to pay down wholesale funding to support the increase in the loan portfolio during 2017.sources.
Subordinated debentures increased $10,904,000 from December 31, 2016. The increase was primarily a result of the $10,583,000 in acquired balances from the IAB acquisition. Securities sold under repurchase agreements decreased $9,857,000increased $74.4 million from December 31, 2016. Offsetting these decreases was an increase from2018, as a result of the IABMBT acquisition, of $17,915,000.which accounted for a $94.8 million increase.
The Corporation has leveraged its capital position with FHLB advances, as well as repurchase agreements, which are pledged against acquired investment securities as collateral for the borrowings. Further discussion regarding FHLB advances is included in Management’s Discussion and Analysis of Financial Condition and Results of Operations under the heading “LIQUIDITY”. Additionally, the interest rate risk is included as part of the Corporation’s interest simulation discussed in this Management’s Discussion and Analysis of Financial Condition and Results of Operations under the heading “INTEREST SENSITIVITY AND DISCLOSURES ABOUT MARKET RISK”.
PART II: ITEM 7. AND ITEM 7A. MANAGEMENT'S DISCUSSION AND ANALYSIS OF FINANCIAL CONDITION AND RESULTS OF OPERATIONS
INCOME TAXES
Income tax expense totaled $37,524,000$29.3 million for 20172019 compared to $27,609,000$29.0 million for 2016.2018. The Corporation’s federal statutory income tax rate for 20172019 is 3521 percent and its state tax rate varies from 0 to 9.5 percent depending on the state in which the subsidiary company is domiciled. The Corporation’s effective tax rate is lower than the blended effective statutory federal and state rates primarily due to the Corporation’s income on tax-exempt securities and loans, income generated by the subsidiaries domiciled in a state with no state or local income tax, income tax credits generated from investments in affordable housing projects, tax-exempt earnings from bank-owned life insurance contracts and reduced state taxes, resulting from the effect of state income apportionment. Also impacting the Corporation's effective tax rate for 2017 is the remeasurement of net deferred tax assets as a result of the Tax Cuts and Jobs Act discussed in more detail below. The reconciliation of federal statutory to actual tax expense is shown in NOTE 21.22. INCOME TAX of the Notes to Consolidated Financial Statements included in Item 8 of this Annual Report on Form 10-K.
On December 22, 2017, the U.S. government enacted comprehensive tax legislation referred to as the Tax Cuts and Jobs Act (the "TCJA"). The TCJA makes widespread changes to U.S. tax law, including but not limited to: (1) permanently reducing the federal corporate tax rate from 35 percent to 21 percent, (2) bonus depreciation that will allow for full expensing of qualified property, and (3) eliminating the corporate alternative minimum tax (AMT) and changing how existing AMT credits can be realized. Under ASC 740, the Corporation must recognize the effects of the new tax legislation upon enactment. At December 31, 2017, the Corporation adjusted its net deferred tax asset to the enacted rate of 21 percent resulting in a decrease to net deferred tax assets of $5,120,000.
The Corporation’s tax asset, deferred and receivable decreased from $39,384,000$23.7 million at December 31, 20162018 to $23,983,000$12.2 million at December 31, 2017.2019. The largest component is the Corporation’s net deferred tax asset, which decreased from $37,755,000$21.4 million at December 31, 20162018 to $19,818,000$8.3 million at December 31, 2017.2019. The $17,937,000$13.1 million decrease in the Corporation’s net deferred tax asset was primarily due to a combination of a decrease in deferred tax assets and an increase in deferred tax liabilities. The largest deferred tax asset decreaseliability increase was associated with the impacttax effect of the TCJA. Other decreases not related to the TCJA were associated with federalchange in unrealized gains and state net operating loss carryforwards and other employee benefits of $2,323,000 and $2,080,000, respectively. Increases in deferred tax liabilities associated with the accounting for acquisitions and accounting for unrealized gainslosses on available for sale securities further decreasedof $12.0 million. Additionally, the net change in deferred taxes associated with accounting for loans increased the net deferred tax assetliability by $4,106,000 and $4,273,000, respectively.
The Corporation has recorded a valuation allowance of $6,966,000 related$1.9 million. Offsetting the increases to deferred state taxes as it does not anticipate having future state taxable income sufficient to fully utilize thetax liabilities was a deferred state tax asset. This is primarily due to the Corporation’s current tax structure as noted above.asset increase associated with deferred compensation of $2.3 million.
INFLATION
Changing prices of goods, services and capital affect the financial position of every business enterprise. The level of market interest rates and the price of funds loaned or borrowed fluctuate due to changes in the rate of inflation and various other factors, including government monetary policy.
Fluctuating interest rates affect the Corporation’s net interest income and loan volume. As the inflation rate increases, the purchasing power of the dollar decreases. Those holding fixed-rate monetary assets incur a loss, while those holding fixed-rate monetary liabilities enjoy a gain. The nature of a financial holding company’s operations is such that there will generally be an excess of monetary assets over monetary liabilities, and, thus, a financial holding company will tend to suffer from an increase in the rate of inflation and benefit from a decrease.
OTHER
The Securities and Exchange Commission maintains a website that contains reports, proxy and information statements and other information regarding registrants that file electronically with the Commission, including the Corporation, and that address is www.sec.gov.
PART II: ITEM 7. AND ITEM 7A. MANAGEMENT'S DISCUSSION AND ANALYSIS OF FINANCIAL CONDITION AND RESULTS OF OPERATIONS
ITEM 7A. QUANTITATIVE AND QUALITATIVE DISCLOSURES ABOUT MARKET RISK.
The quantitative and qualitative disclosures about market risk information are presented in the “INTEREST SENSITIVITY AND DISCLOSURES ABOUT MARKET RISK” section of Management’s Discussion and Analysis of Financial Condition and Results of Operations included as Item 7 of this Annual Report on Form 10-K.
PART II: ITEM 8. FINANCIAL STATEMENTS AND SUPPLEMENTARY DATA REPORT OF INDEPENDENT REGISTERED PUBLIC ACCOUNTING FIRM
ITEM 8. FINANCIAL STATEMENTS AND SUPPLEMENTARY DATA.
Report of Independent Registered Public Accounting Firm
To the Shareholders,Stockholders, Board of Directors and Audit Committee
First Merchants Corporation
Muncie, Indiana
Opinion on the Financial Statements
We have audited the accompanying consolidated balance sheets of First Merchants Corporation (Corporation) as of December 31, 20172019 and 2016,2018, the related consolidated statements of income, comprehensive income, stockholders’ equity and cash flows for each of the years in the three-year period ended December 31, 2017,2019, and the related notes (collectively referred to as the “financial statements”). In our opinion, the consolidated financial statements referred to above present fairly, in all material respects, the financial position of the Corporation as of December 31, 20172019 and 2016,2018, and the results of its operations and its cash flows for each of the years in the three-year period ended December 31, 2017,2019, in conformity with accounting principles generally accepted in the United States of America.
We also have audited, in accordance with the standards of the Public Company Accounting Oversight Board (United States) (PCAOB)(“PCAOB”), the Corporation’s internal control over financial reporting as of December 31, 2017,2019, based on criteria established in Internal Control-IntegratedControl - Integrated Framework (2013) issued by the Committee of Sponsoring Organizations of the Treadway Commission (2013 Framework) (COSO) and our report dated March 1, 2018,February 28, 2020, expressed as an unqualified opinion thereon.
Basis for Opinion
These consolidated financial statements are the responsibility of the Corporation’s management. Our responsibility is to express an opinion on the Corporation’s consolidated financial statements based on our audits.
We are a public accounting firm registered with the PCAOBPublic Company Accounting Oversight Board (United States) (“PCAOB”) and are required to be independent with respect to the Corporation in accordance with the U.S. federal securities laws and the applicable rules and regulations of the Securities and Exchange Commission and the PCAOB.
We conducted our audits in accordance with the standards of the PCAOB. Those standards require that we plan and perform the auditsaudit to obtain reasonable assurance about whether the consolidated financial statements are free of material misstatement, whether due to error or fraud. Our auditsaudit included performing procedures to assess the risks of material misstatement of the consolidated financial statements, whether due to error or fraud, and performing procedures that respond to those risks. Such procedures include examining, on a test basis, evidence regarding the amounts and disclosures in the consolidated financial statements. Our auditsaudit also included evaluating the accounting principles used and significant estimates made by management, as well as evaluating the overall presentation of the consolidated financial statements. We believe that our audits provideaudit provides a reasonable basis for our opinion.opinion
Critical Audit Matters
The critical audit matters communicated below are matters arising from the current period audit of the financial statements that were communicated or required to be communicated to the audit committee and that: (1) relates to accounts or disclosures that are material to the financial statements and (2) involved our especially challenging, subjective or complex judgments. The communication of the critical audit matters does not alter in any way our opinion on the consolidated financial statements, taken as a whole, and we are not, by communicating the critical audit matters below, providing a separate opinion on the critical audit matters or on the account or disclosures to which they relate.
Allowance for Loan Losses
As described in Note 5 to the consolidated financial statements, the Corporation’s consolidated allowance for loan and lease losses (ALLL) was $80.3 million at December 31, 2019. The ALLL is an estimate of probable credit losses related to specifically identified loans and for losses inherent in the portfolio that have been incurred as of the balance sheet date. The determination of the ALLL requires management to exercise significant judgment and consider numerous subjective factors, including determining qualitative factors utilized to adjust historical loss rates, risk grading loans, identifying loan impairments, among others. As disclosed by management, different assumptions and conditions could result in a materially different amount for the ALLL.
We identified the valuation of the ALLL as a critical audit matter. Auditing the allowance for loan losses involves a high degree of subjectivity in evaluating management’s estimates, such as evaluating management’s assessment of economic conditions and other environmental factors used to adjust historical loss rates, evaluating the adequacy of specific allowances associated with impaired loans and assessing the appropriateness of loan grades.
PART II: ITEM 8. FINANCIAL STATEMENTS AND SUPPLEMENTARY DATA REPORT OF INDEPENDENT REGISTERED PUBLIC ACCOUNTING FIRM
How We Addressed the Matter in Our Audit
The primary procedures we performed to address this critical audit matter included:
Testing the design and operating effectiveness of controls, including those related to technology, over the Corporation’s ALLL including data completeness and accuracy, classifications of loans by loan segment, historical loss data, the calculation of a loss rate, the establishment of qualitative adjustments, grading and risk classification of loans and establishment of specific reserves on impaired loans including purchased loans that have experienced further credit deterioration and management’s review controls over the ALLL balance as a whole including attending internal Corporation credit quality discussions and analysis;
Testing of completeness and accuracy of the information utilized in the ALLL;
Testing the model’s computational accuracy;
Evaluating the qualitative adjustment to the historical loss rates, including assessing the basis for the adjustments and the reasonableness of the significant assumptions;
Testing the internal loan review functions and evaluating the accuracy of loan grades;
Evaluating the appropriateness of loan grades and assessing the reasonableness of specific reserves on impaired loans;
Evaluating the overall reasonableness of assumptions used by considering the past performance of the Corporation and evaluating to trends identified within peer groups.
Reviewing subsequent events and considering whether they support or contradict the Corporation’s assessment.
Acquisition
As described in Note 2 to the consolidated financial statements, the Corporation completed the acquisition of MBT and its wholly owned subsidiary Monroe Bank & Trust during the year ended December 31, 2019 with an acquisition price of $229.9 million, including the recognition of $98.6 million of Goodwill. As part of the acquisition, management determined that the acquisition qualified as a business and accordingly all identifiable assets and liabilities acquired were valuated at fair value as part of the purchase price allocation as of the acquisition date. The identification and valuation of such acquired assets and assumed liabilities required management to exercise significant judgment and consider the use of outside vendors to estimate the fair value allocations.
We identified the acquisition and the valuation of acquired assets and assumed liabilities a critical audit matter. Auditing the acquisition transaction involved a high degree of subjectivity in evaluating management’s operational assumptions, fair value estimates, purchase price allocations and assessing the appropriateness of outside vendor valuation models.
How We Addressed the Matter in Our Audit
The primary procedures we performed to address this critical audit matter included:
Obtaining and reviewing executed Plan and Agreement of Merger documents to gain an understanding of the underlying terms of the consummated acquisition;
Obtaining and reviewing management’s reconciliation procedures of significant accounts and testing of completion procedures performed and asset/liability identification considerations made;
Testing management’s computation of purchase price and determination of goodwill recognized focusing on the completeness and accuracy of the balance sheet acquired and related fair value purchase price allocations made to identified assets acquired and liabilities assumed;
Obtaining and reviewing significant outside vendor valuation estimates and challenging management’s review of the appropriateness of the valuations assessed/allocated to assets acquired and liabilities assumed; including but not limited to, testing all critical inputs, including assumptions applied and valuation models utilized by the outside vendors;
Utilization of our Forensics & Valuation Services group to assist with testing and challenging the related fair value purchase price allocations made to identified assets acquired and liabilities assumed;
Reviewing and evaluating the adequacy of the disclosures made in the footnotes of the Corporation’s SEC filings.
BKD, LLP
We have served as the Corporation’s auditor since at least 1982; however, an earlier year cannot be reliably determined.
Indianapolis, Indiana
March 1, 2018February 28, 2020
PART II: ITEM 8. FINANCIAL STATEMENTS AND SUPPLEMENTARY DATA
CONSOLIDATED FINANCIAL STATEMENTS
CONSOLIDATED BALANCE SHEETS
| | | | December 31, | | December 31, | December 31, | | December 31, |
| (Dollars in Thousands, Except Share Data) | 2017 | | 2016 | 2019 | | 2018 |
| ASSETS | | | | | | |
| Cash and cash equivalents | $ | 154,905 |
| | $ | 127,927 |
| $ | 177,201 |
| | $ | 139,247 |
|
| Interest-bearing time deposits | 35,027 |
| | 24,459 |
| 118,263 |
| | 36,963 |
|
| Investment securities available for sale | 999,947 |
| | 696,862 |
| 1,790,025 |
| | 1,142,195 |
|
| Investment securities held to maturity (fair value of $568,208 and $611,933) | 560,655 |
| | 607,643 |
| |
| Investment securities held to maturity (fair value of $827,566 and $489,217) | | 806,038 |
| | 490,387 |
|
| Loans held for sale | 7,216 |
| | 2,929 |
| 9,037 |
| | 4,778 |
|
| Loans | 6,751,199 |
| | 5,139,645 |
| 8,459,310 |
| | 7,224,467 |
|
| Less: Allowance for loan losses | (75,032 | ) | | (66,037 | ) | (80,284 | ) | | (80,552 | ) |
| Net loans | 6,676,167 |
| | 5,073,608 |
| 8,379,026 |
| | 7,143,915 |
|
| Premises and equipment | 95,852 |
| | 94,432 |
| 113,055 |
| | 93,420 |
|
| Federal Home Loan Bank stock | 23,825 |
| | 17,964 |
| 28,736 |
| | 24,588 |
|
| Interest receivable | 37,130 |
| | 26,194 |
| 48,901 |
| | 40,881 |
|
| Other intangibles | 31,148 |
| | 14,866 |
| 34,962 |
| | 24,429 |
|
| Goodwill | 445,355 |
| | 244,000 |
| 543,918 |
| | 445,355 |
|
| Cash surrender value of life insurance | 223,557 |
| | 201,671 |
| 288,206 |
| | 224,939 |
|
| Other real estate owned | 10,373 |
| | 8,966 |
| 7,527 |
| | 2,179 |
|
| Tax asset, deferred and receivable | 23,983 |
| | 39,384 |
| 12,165 |
| | 23,668 |
|
| Other assets | 42,338 |
| | 30,706 |
| 100,194 |
| | 47,772 |
|
| TOTAL ASSETS | $ | 9,367,478 |
| | $ | 7,211,611 |
| $ | 12,457,254 |
| | $ | 9,884,716 |
|
| LIABILITIES | | | | | | |
| Deposits: | | | | | | |
| Noninterest-bearing | $ | 1,761,553 |
| | $ | 1,348,267 |
| $ | 1,736,396 |
| | $ | 1,447,907 |
|
| Interest-bearing | 5,410,977 |
| | 4,208,231 |
| 8,103,560 |
| | 6,306,686 |
|
| Total Deposits | 7,172,530 |
| | 5,556,498 |
| 9,839,956 |
| | 7,754,593 |
|
| Borrowings: | | | | | | |
| Federal funds purchased | 144,038 |
| | 120,349 |
| 55,000 |
| | 104,000 |
|
| Securities sold under repurchase agreements | 136,623 |
| | 146,480 |
| 187,946 |
| | 113,512 |
|
| Federal Home Loan Bank advances | 414,377 |
| | 298,923 |
| 351,072 |
| | 314,986 |
|
| Subordinated debentures and term loans | 139,349 |
| | 128,445 |
| 138,685 |
| | 138,463 |
|
| Total Borrowings | 834,387 |
| | 694,197 |
| 732,703 |
| | 670,961 |
|
| Interest payable | 4,390 |
| | 3,110 |
| 6,754 |
| | 5,607 |
|
| Other liabilities | 52,708 |
| | 56,149 |
| 91,404 |
| | 45,295 |
|
| Total Liabilities | 8,064,015 |
| | 6,309,954 |
| 10,670,817 |
| | 8,476,456 |
|
| COMMITMENTS AND CONTINGENT LIABILITIES |
| |
|
| |
|
| STOCKHOLDERS' EQUITY | | | | | | |
| Cumulative Preferred Stock, $1,000 par value, $1,000 liquidation value: | | | | | | |
| Authorized - 600 shares | | | | | | |
| Issued and outstanding - 125 shares | 125 |
| | 125 |
| 125 |
| | 125 |
|
| Common Stock, $.125 stated value: | | | | |
Authorized - 100,000,000 and 50,000,000 shares (1) | | | | |
| Issued and outstanding - 49,158,238 and 40,912,697 shares | 6,145 |
| | 5,114 |
| |
| Common Stock, $0.125 stated value: | | | | |
| Authorized - 100,000,000 shares | | | | |
| Issued and outstanding - 55,368,482 and 49,349,800 shares | | 6,921 |
| | 6,169 |
|
| Additional paid-in capital | 834,870 |
| | 509,018 |
| 1,054,997 |
| | 840,052 |
|
| Retained earnings | 465,231 |
| | 400,981 |
| 696,520 |
| | 583,336 |
|
| Accumulated other comprehensive loss | (2,908 | ) | | (13,581 | ) | |
| Accumulated other comprehensive income (loss) | | 27,874 |
| | (21,422 | ) |
| Total Stockholders' Equity | 1,303,463 |
| | 901,657 |
| 1,786,437 |
| | 1,408,260 |
|
| TOTAL LIABILITIES AND STOCKHOLDERS' EQUITY | $ | 9,367,478 |
| | $ | 7,211,611 |
| $ | 12,457,254 |
| | $ | 9,884,716 |
|
| | | | | | | |
(1) On May 1, 2017, the shareholders of First Merchants Corporation approved an amendment to the Articles of Incorporation to increase the number of shares of common stock authorized to issue from 50,000,000 to 100,000,000 shares. | |
See notes to consolidated financial statements.
PART II: ITEM 8. FINANCIAL STATEMENTS AND SUPPLEMENTARY DATA
CONSOLIDATED FINANCIAL STATEMENTS
CONSOLIDATED STATEMENTS OF INCOME
| | | (Dollars in Thousands, Except Share Data) | | December 31,
2017 | | December 31,
2016 | | December 31,
2015 | | December 31,
2019 | | December 31,
2018 | | December 31,
2017 |
| INTEREST INCOME | | | | | | | | | | | | |
| Loans receivable: | | | | | | | | | | | | |
| Taxable | | $ | 263,704 |
| | $ | 210,302 |
| | $ | 180,805 |
| | $ | 382,772 |
| | $ | 342,501 |
| | $ | 263,704 |
|
| Tax exempt | | 10,694 |
| | 6,525 |
| | 3,459 |
| | 17,568 |
| | 14,862 |
| | 10,694 |
|
| Investment securities: | | | | | | | | | | | | |
| Taxable | | 17,489 |
| | 16,415 |
| | 17,885 |
| | 27,815 |
| | 21,597 |
| | 17,489 |
|
| Tax exempt | | 21,379 |
| | 18,622 |
| | 16,922 |
| | 31,655 |
| | 25,509 |
| | 21,379 |
|
| Deposits with financial institutions | | 736 |
| | 350 |
| | 160 |
| | 4,225 |
| | 2,241 |
| | 736 |
|
| Federal Reserve and Federal Home Loan Bank stock | | 894 |
| | 1,098 |
| | 1,967 |
| |
| Federal Home Loan Bank stock | | | 1,370 |
| | 1,234 |
| | 894 |
|
| Total Interest Income | | 314,896 |
| | 253,312 |
| | 221,198 |
| | 465,405 |
| | 407,944 |
| | 314,896 |
|
| INTEREST EXPENSE | | | | | | | | | | | | |
| Deposits | | 23,806 |
| | 15,914 |
| | 14,855 |
| | 91,585 |
| | 51,542 |
| | 23,806 |
|
| Federal funds purchased | | 561 |
| | 102 |
| | 74 |
| | 251 |
| | 718 |
| | 561 |
|
| Securities sold under repurchase agreements | | 477 |
| | 374 |
| | 368 |
| | 1,424 |
| | 762 |
| | 477 |
|
| Federal Home Loan Bank advances | | 5,196 |
| | 3,264 |
| | 2,836 |
| | 7,176 |
| | 7,832 |
| | 5,196 |
|
| Subordinated debentures and term loans | | 7,572 |
| | 7,185 |
| | 6,661 |
| | 8,309 |
| | 8,233 |
| | 7,572 |
|
| Total Interest Expense | | 37,612 |
| | 26,839 |
| | 24,794 |
| | 108,745 |
| | 69,087 |
| | 37,612 |
|
| NET INTEREST INCOME | | 277,284 |
| | 226,473 |
| | 196,404 |
| | 356,660 |
| | 338,857 |
| | 277,284 |
|
| Provision for loan losses | | 9,143 |
| | 5,657 |
| | 417 |
| | 2,800 |
| | 7,227 |
| | 9,143 |
|
| NET INTEREST INCOME AFTER PROVISION FOR LOAN LOSSES | | 268,141 |
| | 220,816 |
| | 195,987 |
| | 353,860 |
| | 331,630 |
| | 268,141 |
|
| OTHER INCOME | | | | | | | | | | | | |
| Service charges on deposit accounts | | 18,722 |
| | 17,762 |
| | 16,201 |
| | 22,951 |
| | 20,950 |
| | 18,722 |
|
| Fiduciary activities | | 11,589 |
| | 9,818 |
| | 9,196 |
| |
| Fiduciary and wealth management fees | | | 17,562 |
| | 14,906 |
| | 14,682 |
|
| Card payment fees | | | 20,243 |
| | 18,035 |
| | 16,120 |
|
| Net gains and fees on sales of loans | | | 7,891 |
| | 7,029 |
| | 7,564 |
|
| Derivative hedge fees | | | 5,357 |
| | 2,493 |
| | 1,978 |
|
| Other customer fees | | 20,956 |
| | 19,315 |
| | 16,959 |
| | 1,664 |
| | 1,860 |
| | 1,743 |
|
| Commission income | | | | | | 4,147 |
| |
| Increase in cash surrender value of life insurance | | 3,906 |
| | 3,630 |
| | 2,919 |
| | 4,518 |
| | 4,020 |
| | 3,906 |
|
| Gains on life insurance benefits | | 2,671 |
| | 643 |
| | | | 19 |
| | 198 |
| | 2,671 |
|
| Net gains and fees on sales of loans | | 7,564 |
| | 7,052 |
| | 6,483 |
| |
| Net realized gains on sales of available for sale securities | | 2,631 |
| | 3,389 |
| | 2,670 |
| | 4,415 |
| | 4,269 |
| | 2,631 |
|
| Gain on sale of insurance subsidiary | | | | | | 8,265 |
| |
| Gain on cancellation of subordinated debentures | | | | | | 1,250 |
| |
| Other income | | 2,970 |
| | 3,594 |
| | 1,778 |
| | 2,068 |
| | 2,699 |
| | 992 |
|
| Total Other Income | | 71,009 |
| | 65,203 |
| | 69,868 |
| | 86,688 |
| | 76,459 |
| | 71,009 |
|
| OTHER EXPENSES | | | | | | | | | | | | |
| Salaries and employee benefits | | 119,812 |
| | 102,552 |
| | 101,908 |
| | 144,037 |
| | 131,704 |
| | 119,812 |
|
| Net occupancy | | 16,976 |
| | 16,997 |
| | 14,668 |
| | 19,584 |
| | 18,341 |
| | 16,976 |
|
| Equipment | | 13,090 |
| | 12,497 |
| | 10,787 |
| | 16,218 |
| | 14,334 |
| | 13,090 |
|
| Marketing | | 3,739 |
| | 3,008 |
| | 3,493 |
| | 6,650 |
| | 4,681 |
| | 3,739 |
|
| Outside data processing fees | | 12,242 |
| | 9,148 |
| | 7,109 |
| | 16,476 |
| | 13,215 |
| | 12,242 |
|
| Printing and office supplies | | 1,283 |
| | 1,348 |
| | 1,353 |
| | 1,445 |
| | 1,425 |
| | 1,283 |
|
| Intangible asset amortization | | 5,647 |
| | 3,910 |
| | 2,835 |
| | 5,994 |
| | 6,719 |
| | 5,647 |
|
| FDIC assessments | | 2,564 |
| | 3,036 |
| | 3,655 |
| | 717 |
| | 2,920 |
| | 2,564 |
|
| Other real estate owned and foreclosure expenses | | 1,903 |
| | 2,877 |
| | 3,956 |
| | 2,428 |
| | 1,470 |
| | 1,903 |
|
| Professional and other outside services | | 12,757 |
| | 6,516 |
| | 9,855 |
| | 15,410 |
| | 8,176 |
| | 12,757 |
|
| Other expenses | | 15,543 |
| | 15,470 |
| | 15,187 |
| | 17,804 |
| | 16,966 |
| | 15,543 |
|
| Total Other Expenses | | 205,556 |
| | 177,359 |
| | 174,806 |
| | 246,763 |
| | 219,951 |
| | 205,556 |
|
| INCOME BEFORE INCOME TAX | | 133,594 |
| | 108,660 |
| | 91,049 |
| | 193,785 |
| | 188,138 |
| | 133,594 |
|
| Income tax expense | | 37,524 |
| | 27,609 |
| | 25,665 |
| | 29,325 |
| | 28,999 |
| | 37,524 |
|
| NET INCOME AVAILABLE TO COMMON STOCKHOLDERS | | $ | 96,070 |
| | $ | 81,051 |
| | 65,384 |
| | $ | 164,460 |
| | $ | 159,139 |
| | 96,070 |
|
| | | | | | | | | | | | | |
| NET INCOME AVAILABLE TO COMMON STOCKHOLDERS PER SHARE DATA: | | | | | | | | | | | | |
| Basic | | $ | 2.13 |
| | $ | 1.99 |
| | $ | 1.73 |
| | $ | 3.20 |
| | $ | 3.23 |
| | $ | 2.13 |
|
| Diluted | | $ | 2.12 |
| | $ | 1.98 |
| | $ | 1.72 |
| | $ | 3.19 |
| | $ | 3.22 |
| | $ | 2.12 |
|
See notes to consolidated financial statements.
PART II: ITEM 8. FINANCIAL STATEMENTS AND SUPPLEMENTARY DATA
CONSOLIDATED FINANCIAL STATEMENTS
CONSOLIDATED STATEMENTS OF COMPREHENSIVE INCOME
| | | (Dollars in Thousands) | December 31, 2017 | | December 31, 2016 | | December 31, 2015 | December 31, 2019 | | December 31, 2018 | | December 31, 2017 |
| Net income | $ | 96,070 |
|
| $ | 81,051 |
|
| $ | 65,384 |
| $ | 164,460 |
|
| $ | 159,139 |
|
| $ | 96,070 |
|
| Other comprehensive income (loss) net of tax: | |
| |
|
| |
| |
| |
Unrealized holding gain (loss) on securities available for sale arising during the period,
net of tax of $5,193, $4,893, and $20 | 9,645 |
|
| (9,087 | ) |
| (37 | ) | |
| Unrealized gain (loss) on cash flow hedges arising during the period, net of tax of $4, $128, and $588 | 9 |
|
| (240 | ) |
| (1,093 | ) | |
| Reclassification adjustment for net gains included in net income net of tax of $576, $749, and $435 | (1,070 | ) |
| (1,390 | ) |
| (808 | ) | |
| Defined benefit pension plans, net of tax of $1,125, $809, and $1,187 |
|
|
|
|
|
|
|
| |
Unrealized holding gain (loss) on securities available for sale arising during the period,
net of tax of $12,946, $3,174, and $5,193 | | 48,703 |
|
| (13,872 | ) |
| 9,645 |
|
| Unrealized gain (loss) on cash flow hedges arising during the period, net of tax of $226, $52, and $4 | | (846 | ) |
| 437 |
|
| 9 |
|
| Reclassification adjustment for net gains included in net income, net of tax of $857, $797, and $576 | | (3,224 | ) |
| (3,002 | ) |
| (1,070 | ) |
| Defined benefit pension plans, net of tax of $1,239, $1,001, and $1,125 | |
|
|
|
|
|
|
|
|
| Net gain (loss) arising during period | 2,686 |
|
| (470 | ) |
| 2,404 |
| 4,579 |
|
| (1,435 | ) |
| 2,686 |
|
| Amortization of prior service cost | (597 | ) |
| (1,032 | ) |
| (198 | ) | 84 |
|
| (16 | ) |
| (597 | ) |
| | 10,673 |
|
| (12,219 | ) |
| 268 |
| 49,296 |
|
| (17,888 | ) |
| 10,673 |
|
| Comprehensive income | $ | 106,743 |
|
| $ | 68,832 |
|
| $ | 65,652 |
| $ | 213,756 |
|
| $ | 141,251 |
|
| $ | 106,743 |
|
See notes to consolidated financial statements.
PART II: ITEM 8. FINANCIAL STATEMENTS AND SUPPLEMENTARY DATA
CONSOLIDATED FINANCIAL STATEMENTS
CONSOLIDATED STATEMENT OF STOCKHOLDERS' EQUITY | | | | Preferred | | Common Stock | | | | | | | | | Preferred | | Common Stock | | | | | | | | |
| (Dollars in Thousands, Except Share Data) | Shares | | Amount | | Shares | | Amount | | Additional Paid in Capital | | Retained Earnings | | Accumulated Other Comprehensive Income (Loss) | | Total | Shares | | Amount | | Shares | | Amount | | Additional Paid in Capital | | Retained Earnings | | Accumulated Other Comprehensive Income (Loss) | | Total |
| Balances, December 31, 2014 | 125 |
| | $ | 125 |
| | 37,669,948 |
| | $ | 4,709 |
| | $ | 431,220 |
| | $ | 292,403 |
| | $ | (1,630 | ) | | $ | 726,827 |
| |
| Comprehensive income | | | | | | | | | | | | | | | | |
| Net income | | | | | | | | | | | 65,384 |
| | | | 65,384 |
| |
| Other comprehensive income (loss), net of tax | | | | | | | | | | | | | 268 |
| | 268 |
| |
| Cash dividends on common stock ($.41 per share) | | | | | | | | | | | (15,654 | ) | | | | (15,654 | ) | |
| Issuance of common stock related to acquisition | | | | | 2,769,568 |
| | 346 |
| | 70,056 |
| | | | | | 70,402 |
| |
| Share-based compensation | | | | | 149,577 |
| | 19 |
| | 2,251 |
| | | | | | 2,270 |
| |
| Stock issued under employee benefit plans | | | | | 22,074 |
| | 3 |
| | 457 |
| | | | | | 460 |
| |
| Stock issued under dividend reinvestment and stock purchase plan | | | | | 26,375 |
| | 3 |
| | 658 |
| | | | | | 661 |
| |
| Stock options exercised | | | | | 96,066 |
| | 12 |
| | 1,519 |
| | | | | | 1,531 |
| |
| Stock redeemed | | | | | (69,349 | ) | | (9 | ) | | (1,631 | ) | | | | | | (1,640 | ) | |
| Balances, December 31, 2015 | 125 |
| | 125 |
| | 40,664,259 |
| | 5,083 |
| | 504,530 |
| | 342,133 |
| | (1,362 | ) | | 850,509 |
| |
| Comprehensive income | | | | | | | | | | | | | | | | |
| Net income | | | | | | | | | | | 81,051 |
| | | | 81,051 |
| |
| Other comprehensive income (loss), net of tax | | | | | | | | | | | | | (12,219 | ) | | (12,219 | ) | |
| Cash dividends on common stock ($.54 per share) | | | | | | | | | | | (22,203 | ) | | | | (22,203 | ) | |
| Share-based compensation | | | | | 141,126 |
| | 17 |
| | 2,583 |
| | | | | | 2,600 |
| |
| Stock issued under employee benefit plans | | | | | 20,545 |
| | 3 |
| | 459 |
| | | | | | 462 |
| |
| Stock issued under dividend reinvestment and stock purchase plan | | | | | 30,297 |
| | 4 |
| | 831 |
| | | | | | 835 |
| |
| Stock options exercised | | | | | 128,848 |
| | 16 |
| | 2,586 |
| | | | | | 2,602 |
| |
| Stock redeemed | | | | | (72,378 | ) | | (9 | ) | | (1,971 | ) | | | | | | (1,980 | ) | |
| Balances, December 31, 2016 | 125 |
| | 125 |
| | 40,912,697 |
| | 5,114 |
| | 509,018 |
| | 400,981 |
| | (13,581 | ) | | 901,657 |
| 125 |
| | $ | 125 |
| | 40,912,697 |
| | $ | 5,114 |
| | $ | 509,018 |
| | $ | 400,981 |
| | $ | (13,581 | ) | | $ | 901,657 |
|
| Comprehensive income | | | | | | | | | | | | | | | | | | | | | | | | | | | | | | |
| Net income | | | | | | | | | | | 96,070 |
| | | | 96,070 |
| — |
| | — |
| | — |
| | — |
| | — |
| | 96,070 |
| | — |
| | 96,070 |
|
| Other comprehensive income (loss), net of tax | | | | | | | | | | | | | 10,673 |
| | 10,673 |
| — |
| | — |
| | — |
| | — |
| | — |
| | — |
| | 10,673 |
| | 10,673 |
|
| Cash dividends on common stock ($.69 per share) | | | | | | | | | | | (31,820 | ) | | | | (31,820 | ) | — |
| | — |
| | — |
| | — |
| | — |
| | (31,820 | ) | | — |
| | (31,820 | ) |
| Issuance of common stock related to acquisition | | | | | 8,044,446 |
| | 1,006 |
| | 320,425 |
| | | | | | 321,431 |
| |
| Issuance of common stock related to acquisitions | | — |
| | — |
| | 8,044,446 |
| | 1,006 |
| | 320,425 |
| | — |
| | — |
| | 321,431 |
|
| Share-based compensation | | | | | 89,362 |
| | 11 |
| | 2,816 |
| | | | | | 2,827 |
| — |
| | — |
| | 89,362 |
| | 11 |
| | 2,816 |
| | — |
| | — |
| | 2,827 |
|
| Stock issued under employee benefit plans | | | | | 14,948 |
| | 2 |
| | 517 |
| | | | | | 519 |
| — |
| | — |
| | 14,948 |
| | 2 |
| | 517 |
| | — |
| | — |
| | 519 |
|
| Stock issued under dividend reinvestment and stock purchase plan | | | | | 24,058 |
| | 3 |
| | 988 |
| | | | | | 991 |
| — |
| | — |
| | 24,058 |
| | 3 |
| | 988 |
| | — |
| | — |
| | 991 |
|
| Stock options exercised | | | | | 104,748 |
| | 13 |
| | 2,385 |
| | | | | | 2,398 |
| — |
| | — |
| | 104,748 |
| | 13 |
| | 2,385 |
| | — |
| | — |
| | 2,398 |
|
| Stock redeemed | | | | | (32,021 | ) | | (4 | ) | | (1,279 | ) | | | | | | (1,283 | ) | |
| Restricted shares withheld for taxes | | — |
| | — |
| | (32,021 | ) | | (4 | ) | | (1,279 | ) | | — |
| | — |
| | (1,283 | ) |
| Balances, December 31, 2017 | 125 |
| | $ | 125 |
| | 49,158,238 |
| | $ | 6,145 |
| | $ | 834,870 |
| | $ | 465,231 |
| | $ | (2,908 | ) | | $ | 1,303,463 |
| 125 |
| | $ | 125 |
| | 49,158,238 |
| | $ | 6,145 |
| | $ | 834,870 |
| | $ | 465,231 |
| | $ | (2,908 | ) | | $ | 1,303,463 |
|
| | | | | | | | | | | | | | | | | |
| | | | | | | | | | | | | | | | | |
| Comprehensive income | | | | | | | | | | | | | | | | |
| Net income | | — |
| | — |
| | — |
| | — |
| | — |
| | 159,139 |
| | — |
| | 159,139 |
|
| Other comprehensive income (loss), net of tax | | — |
| | — |
| | — |
| | — |
| | — |
| | — |
| | (17,888 | ) | | (17,888 | ) |
| Cash dividends on common stock ($.84 per share) | | — |
| | — |
| | — |
| | — |
| | — |
| | (41,660 | ) | | — |
| | (41,660 | ) |
| Reclassification adjustment under ASU 2018-02 | | — |
| | — |
| | — |
| | — |
| | — |
| | 626 |
| | (626 | ) | | — |
|
| Share-based compensation | | — |
| | — |
| | 112,569 |
| | 14 |
| | 3,578 |
| | — |
| | — |
| | 3,592 |
|
| Stock issued under employee benefit plans | | — |
| | — |
| | 19,001 |
| | 2 |
| | 705 |
| | — |
| | — |
| | 707 |
|
| Stock issued under dividend reinvestment and stock purchase plan | | — |
| | — |
| | 28,156 |
| | 4 |
| | 1,207 |
| | — |
| | — |
| | 1,211 |
|
| Stock options exercised | | — |
| | — |
| | 76,152 |
| | 10 |
| | 1,588 |
| | — |
| | — |
| | 1,598 |
|
| Restricted shares withheld for taxes | | — |
| | — |
| | (44,316 | ) | | (6 | ) | | (1,896 | ) | | — |
| | — |
| | (1,902 | ) |
| Balances, December 31, 2018 | | 125 |
| | $ | 125 |
| | 49,349,800 |
| | $ | 6,169 |
| | $ | 840,052 |
| | $ | 583,336 |
| | $ | (21,422 | ) | | $ | 1,408,260 |
|
| Comprehensive income | | | | | | | | | | | | | | | |
|
| Net income | | — |
| | — |
| | — |
| | — |
| | — |
| | 164,460 |
| | — |
| | 164,460 |
|
| Other comprehensive income (loss), net of tax | | — |
| | — |
| | — |
| | — |
| | — |
| | — |
| | 49,296 |
| | 49,296 |
|
| Cash dividends on common stock ($1.00 per share) | | — |
| | — |
| | — |
| | — |
| | — |
| | (51,276 | ) | | — |
| | (51,276 | ) |
| Issuance of common stock related to acquisitions | | — |
| | — |
| | 6,383,806 |
| | 798 |
|
| 229,128 |
| | — |
| | — |
| | 229,926 |
|
| Repurchases of common stock | | — |
| | — |
| | (516,016 | ) | | (65 | ) | | (18,976 | ) | | — |
| | — |
| | (19,041 | ) |
| Share-based compensation | | — |
| | — |
| | 116,572 |
| | 15 |
| | 4,100 |
| | — |
| | — |
| | 4,115 |
|
| Stock issued under employee benefit plans | | — |
| | — |
| | 21,521 |
| | 3 |
| | 699 |
| | — |
| | — |
| | 702 |
|
| Stock issued under dividend reinvestment and stock purchase plan | | — |
| | — |
| | 38,942 |
| | 5 |
| | 1,526 |
| | — |
| | — |
| | 1,531 |
|
| Stock options exercised | | — |
| | — |
| | 16,950 |
| | 2 |
| | 142 |
| | — |
| | — |
| | 144 |
|
| Restricted shares withheld for taxes | | — |
| | — |
| | (43,093 | ) | | (6 | ) | | (1,674 | ) | | — |
| | — |
| | (1,680 | ) |
| Balances, December 31, 2019 | | 125 |
| | $ | 125 |
| | 55,368,482 |
| | $ | 6,921 |
| | $ | 1,054,997 |
| | $ | 696,520 |
| | $ | 27,874 |
| | $ | 1,786,437 |
|
See notes to consolidated financial statements.
PART II: ITEM 8. FINANCIAL STATEMENTS AND SUPPLEMENTARY DATA
CONSOLIDATED FINANCIAL STATEMENTS
CONSOLIDATED STATEMENTS OF CASH FLOWS
| | | | December 31, | | December 31, | | December 31, | December 31, | | December 31, | | December 31, |
| (Dollars in Thousands) | 2017 | | 2016 | | 2015 | 2019 | | 2018 | | 2017 |
| Cash Flow From Operating Activities: | | | | | | | | | | |
| Net income | $ | 96,070 |
| | $ | 81,051 |
| | $ | 65,384 |
| $ | 164,460 |
| | $ | 159,139 |
| | $ | 96,070 |
|
| Adjustments to reconcile net income to net cash provided by operating activities: | | | | | | | | | | |
| Provision for loan losses | 9,143 |
| | 5,657 |
| | 417 |
| 2,800 |
| | 7,227 |
| | 9,143 |
|
| Depreciation and amortization | 7,967 |
| | 7,161 |
| | 6,262 |
| 9,383 |
| | 8,842 |
| | 7,967 |
|
| Change in deferred taxes | 15,523 |
| | 8,611 |
| | 4,444 |
| 4,965 |
| | 3,524 |
| | 15,523 |
|
| Share-based compensation | 2,827 |
| | 2,600 |
| | 2,270 |
| 4,115 |
| | 3,592 |
| | 2,827 |
|
| Loans originated for sale | (377,252 | ) | | (354,265 | ) | | (364,411 | ) | (511,407 | ) | | (372,791 | ) | | (377,252 | ) |
| Proceeds from sales of loans held for sale | 387,095 |
| | 367,148 |
| | 367,377 |
| 513,357 |
| | 380,254 |
| | 387,095 |
|
| Gains on sales of loans held for sale | (5,910 | ) |
| (5,918 | ) |
| (5,625 | ) | (6,209 | ) |
| (5,025 | ) |
| (5,910 | ) |
| Gain on sale of insurance subsidiary |
|
| |
|
| | (8,265 | ) | |
| Gain on cancellation of subordinated debentures |
|
| |
|
| | (1,250 | ) | |
| Gains on sales of securities available for sale | (2,631 | ) | | (3,389 | ) | | (2,670 | ) | (4,415 | ) | | (4,269 | ) | | (2,631 | ) |
| Increase in cash surrender of life insurance | (3,906 | ) | | (3,630 | ) | | (2,927 | ) | (4,518 | ) | | (4,020 | ) | | (3,906 | ) |
| Gains on life insurance benefits | (2,671 | ) | | (643 | ) | |
|
| (19 | ) | | (198 | ) | | (2,671 | ) |
| Change in interest receivable | (6,838 | ) | | (1,779 | ) | | (2,833 | ) | (4,659 | ) | | (3,751 | ) | | (6,838 | ) |
| Change in interest payable | 31 |
| | 18 |
| | (162 | ) | 1,090 |
| | 1,217 |
| | 31 |
|
| Other adjustments | 7,054 |
| | 1,097 |
| | (1,351 | ) | 9,464 |
| | 6,494 |
| | 7,054 |
|
| Net cash provided by operating activities | 126,502 |
| | 103,719 |
| | 56,660 |
| 178,407 |
| | 180,235 |
| | 126,502 |
|
| Cash Flows from Investing Activities: | | | | | | | | | | |
| Net change in interest-bearing deposits | 237,936 |
| | 7,856 |
| | 24,917 |
| 199,928 |
| | (1,936 | ) | | 237,936 |
|
| Purchases of: | | | | | | | | | | |
| Securities available for sale | (479,045 | ) | | (281,470 | ) | | (200,154 | ) | (676,791 | ) | | (370,284 | ) | | (479,045 | ) |
| Securities held to maturity | (30,220 | ) | | (110,797 | ) | | (87,282 | ) | (423,385 | ) | | (30,465 | ) | | (30,220 | ) |
| Proceeds from sales of securities available for sale | 94,165 |
| | 167,186 |
| | 83,647 |
| 132,837 |
| | 154,519 |
| | 94,165 |
|
| Proceeds from maturities of: | | | | | | | | | | |
| Securities available for sale | 70,846 |
| | 73,956 |
| | 63,124 |
| 138,356 |
| | 77,881 |
| | 70,846 |
|
| Securities held to maturity | 72,220 |
| | 119,052 |
| | 98,581 |
| 130,502 |
| | 66,129 |
| | 72,220 |
|
| Redemption (Purchase) of Federal Reserve and Federal Home Loan Bank stock | 40 |
| | 19,669 |
| | 7,268 |
| — |
| | (763 | ) | | 40 |
|
| Net change in loans | (670,000 | ) | | (452,781 | ) | | (350,287 | ) | (512,364 | ) | | (483,418 | ) | | (670,000 | ) |
| Net cash and cash equivalents received (paid) in acquisition | 54,536 |
| |
|
| | (7,936 | ) | |
| Net cash received from sale of insurance subsidiary |
|
| |
|
| | 15,155 |
| |
| Net cash and cash equivalents received in acquisition | | 10,207 |
| | — |
| | 54,536 |
|
| Proceeds from the sale of other real estate owned | 6,584 |
| | 9,974 |
| | 12,567 |
| 2,060 |
| | 9,121 |
| | 6,584 |
|
| Proceeds from life insurance benefits | 11,655 |
| | 3,141 |
| |
|
| 815 |
| | 2,836 |
| | 11,655 |
|
| Other investing activities | (4,047 | ) | | (4,490 | ) | | 9 |
| (8,564 | ) | | 804 |
| | (4,047 | ) |
| Net cash used in investing activities | (635,330 | ) | | (448,704 | ) | | (340,391 | ) | (1,006,399 | ) | | (575,576 | ) | | (635,330 | ) |
| Cash Flows from Financing Activities: | | | | | | | | | | |
| Net change in : | | | | | | | | | | |
| Demand and savings deposits | 425,742 |
| | 332,600 |
| | 240,736 |
| 883,524 |
| | 526,859 |
| | 425,742 |
|
| Certificates of deposit and other time deposits | 75,236 |
| | (66,920 | ) | | (79,656 | ) | 95,913 |
| | 55,204 |
| | 75,236 |
|
| Borrowings | 1,088,189 |
| | 1,107,795 |
| | 491,660 |
| 599,298 |
| | 1,515,526 |
| | 1,088,189 |
|
| Repayment of borrowings | (1,024,166 | ) | | (982,449 | ) | | (370,813 | ) | (643,169 | ) | | (1,677,860 | ) | | (1,024,166 | ) |
| Cash dividends on common stock | (31,820 | ) | | (22,203 | ) | | (15,654 | ) | (51,276 | ) | | (41,660 | ) | | (31,820 | ) |
| Stock issued under employee benefit plans | 519 |
| | 462 |
| | 460 |
| 702 |
| | 707 |
| | 519 |
|
| Stock issued under dividend reinvestment and stock purchase plans | 991 |
| | 835 |
| | 661 |
| 1,531 |
| | 1,211 |
| | 991 |
|
| Stock options exercised | 2,398 |
| | 2,602 |
| | 1,531 |
| 144 |
| | 1,598 |
| | 2,398 |
|
| Stock redeemed | (1,283 | ) | | (1,980 | ) | | (1,640 | ) | |
| Restricted shares withheld for taxes | | (1,680 | ) | | (1,902 | ) | | (1,283 | ) |
| Repurchase of common stock | | (19,041 | ) | | — |
| | — |
|
| Net cash provided by financing activities | 535,806 |
| | 370,742 |
| | 267,285 |
| 865,946 |
| | 379,683 |
| | 535,806 |
|
| Net Change in Cash and Cash Equivalents | 26,978 |
| | 25,757 |
| | (16,446 | ) | 37,954 |
| | (15,658 | ) | | 26,978 |
|
| Cash and Cash Equivalents, January 1 | 127,927 |
| | 102,170 |
| | 118,616 |
| 139,247 |
| | 154,905 |
| | 127,927 |
|
| Cash and Cash Equivalents, December 31 | $ | 154,905 |
| | $ | 127,927 |
| | $ | 102,170 |
| $ | 177,201 |
| | $ | 139,247 |
| | $ | 154,905 |
|
| Additional cash flow information: | | | | | | | | | | |
| Interest paid | $ | 36,332 |
|
| $ | 26,821 |
|
| $ | 24,903 |
| $ | 107,598 |
|
| $ | 67,870 |
|
| $ | 36,332 |
|
| Income tax paid | 22,421 |
|
| 11,999 |
|
| 21,200 |
| 23,588 |
|
| 23,289 |
|
| 22,421 |
|
| Loans transferred to other real estate owned | 8,360 |
|
| 1,684 |
|
| 3,644 |
| 7,031 |
|
| 855 |
|
| 8,360 |
|
| Fixed assets transferred to other assets | 6,753 |
|
| 360 |
|
| 1,600 |
| 1,210 |
|
| 374 |
|
| 6,753 |
|
| Non-cash investing activities using trade date accounting | 9,401 |
|
| 14,179 |
|
| 1,559 |
| — |
|
| 6,551 |
|
| 9,401 |
|
| Investments transferred from held to maturity to available for sale in accordance with ASU 2017-12 | | — |
|
| 30,794 |
|
| — |
|
| ROU assets obtained in exchange for new operating lease liabilities | | 23,529 |
| | — |
| | — |
|
CONSOLIDATED STATEMENTS OF CASH FLOWS - CONTINUED
In conjunction with the acquisitions, liabilities were assumed as follows:
| | | | December 31,
2017 | | December 31,
2016 | | December 31,
2015 | December 31,
2019 | | December 31,
2018 | | December 31,
2017 |
| Fair value of assets acquired | $ | 1,531,397 |
|
| $ | — |
| | $ | 635,047 |
| $ | 1,451,287 |
|
| $ | — |
| | $ | 1,531,397 |
|
| Cash received (paid) in acquisition | (12 | ) |
|
| | (14,500 | ) | (15 | ) |
| — |
| | (12 | ) |
| Less: Common stock issued | 321,431 |
|
|
| | 70,402 |
| 229,926 |
|
| — |
| | 321,431 |
|
| Liabilities assumed | $ | 1,209,954 |
|
| $ | — |
| | $ | 550,145 |
| $ | 1,221,346 |
|
| $ | — |
| | $ | 1,209,954 |
|
See notes to consolidated financial statements.
PART II: ITEM 8. FINANCIAL STATEMENTS AND SUPPLEMENTARY DATA
NOTES TO CONSOLIDATED FINANCIAL STATEMENTS
(table dollar amounts in thousands, except share data)
NOTE 1
NATURE OF OPERATIONS AND SUMMARY OF SIGNIFICANT ACCOUNTING POLICIES
Financial Statement Preparation
The accounting and reporting policies of the Corporation and the Bank, conform to accounting principles generally accepted in the United States of America and reporting practices followed by the banking industry.
The preparation of financial statements in conformity with accounting principles generally accepted in the United States of America requires management to make estimates and assumptions that affect the reported amounts of assets and liabilities and disclosure of contingent assets and liabilities at the date of the financial statements and the reported amounts of revenues and expenses during the reporting period. Actual results could differ from those estimates.
The Corporation is a financial holding company whose principal activity is the ownership and management of the Bank and operates in a single significant business segment. The Bank provides full banking services under an Indiana state-charter. On April 1, 2016, the Board of Directors ofAdditionally, the Bank adopted final resolutions approving the conversion of the Bank’s banking charter from a national association to an Indiana state-chartered bank. The initial application to convert was filed with the Indiana DFI on February 9, 2016. Between the date of initial application and adoption of the final resolutions by the Bank’s Board, the Indiana DFI and the FDIC conducted a joint exam of the Bank and its banking activities. Final regulatory approval of the application was obtained at the meeting of the Members of the Indiana DFI on April 14, 2016. The Bank filed official conversion documents effective April 15, 2016. As a result of the conversion, the Indiana DFI became the Bank’s primary regulator and the FDIC became the Bank’s primary federal regulator. Upon conversion, the Bank’s official name changed from “First Merchants Bank, National Association” to “First Merchants Bank.” The Bank continues operating under the following trade names in certain geographic markets: Lafayette Bank and Trust andoperates as First Merchants Private Wealth Advisors (each as a(a division of First Merchants Bank). The conversion did not affect the Bank’s operations or customers in any way, and Bank customers continued to receive identical protection on deposits through the FDIC’s deposit insurance program.
The Bank generates commercial, mortgage, and consumer loans and receives deposits from customers located primarily in central and northern Indiana, northeast Illinois, and central Ohio and southeast Michigan counties. The Bank’s loans are generally secured by specific items of collateral, including real property, consumer assets and business assets.
A brief description of current accounting practices and current valuation methodologies are presented below.
CONSOLIDATION of the Corporation's financial statements include the accounts of the Corporation and all its subsidiaries, after elimination of all material intercompany transactions.
BUSINESS COMBINATIONS are accounted for under the acquisition method of accounting. Under the acquisition method, assets and liabilities of the business acquired are recorded at their estimated fair values as of the date of acquisition with any excess of the cost of the acquisition over the fair value of the net tangible and intangible assets acquired recorded as goodwill. Results of operations of the acquired business are included in the income statement from the date of acquisition.
AVAILABLE FOR SALE SECURITIES are recorded at fair value on a recurring basis with the unrealized gains and losses, net of applicable income taxes, recorded in other comprehensive income. Realized gains and losses are recorded in earnings and the prior fair value adjustments are reclassified within stockholders' equity. Gains and losses on sales of securities are determined on the specific-identification method. Amortization of premiums and accretion of discounts are recorded as interest income from securities.
Available for sale and held to maturity securities are evaluated for OTTI at least on a quarterly basis, and more frequently when economic or market conditions warrant such an evaluation. The investment securities portfolio is evaluated for OTTI by segregating the portfolio into two general segments and applying the appropriate OTTI model. Investment securities are generally evaluated for OTTI under ASC 320, Investments - Debt and Equity Securities. However, certain purchased beneficial interest, including certain non-agency government-sponsored mortgage-backed securities, asset-backed securities and collateralized debt obligations are evaluated using the model outlined in ASC 325-10, Investments - Other.
In determining OTTI, under ASC 320, management considers many factors, including: (1) the length of time and the extent to which the fair value has been less than cost, (2) the financial condition and near term prospects of the issuer, (3) whether the market decline was affected by macroeconomic conditions, and (4) whether the Corporation has the intent to sell the debt security or more likely than not, will be required to sell the debt security before its anticipated recovery. The assessment of whether an other-than-temporary decline exists involves a high degree of subjectivity and judgment and is based on the information available to management at a point in time.
When OTTI occurs, the amount of OTTI recognized in the income statement depends on whether the Corporation intends to sell the security or it is more likely than not that the Corporation will be required to sell the security before recovery of its amortized cost basis, less any recognized credit loss. If the intent is to sell, or it is more likely than not that the Corporation will be required to sell the security before recovery of its amortized cost basis, less any recognized credit loss, the OTTI shall be recognized in earnings equal to the entire difference between the investment’s amortized cost basis, less any recognized credit loss, and its fair value at the balance sheet date. If the intent is not to sell the security and it is not more likely than not that the Corporation will be required to sell the security before the recovery of its amortized cost basis less any recognized credit loss, the OTTI has been separated into the amount representing the credit loss and the amount related to all other factors. The amount of the total OTTI related to the credit loss is determined based on the present value of cash flows expected to be collected and is recognized in earnings. The amount of the total OTTI related to other factors is recognized in other comprehensive income, net of applicable income taxes. The previous amortized cost basis less the OTTI recognized in earnings becomes the new amortized cost basis of the investment.
PART II: ITEM 8. FINANCIAL STATEMENTS AND SUPPLEMENTARY DATA
NOTES TO CONSOLIDATED FINANCIAL STATEMENTS
(table dollar amounts in thousands, except share data)
HELD TO MATURITY SECURITIES are classified as held to maturity when the Corporation has the positive intent and ability to hold the securities to maturity. Securities held to maturity are carried at amortized cost. For held to maturity debt securities, the amount of an OTTI recorded in other comprehensive income for the noncredit portion of a previous other-than-temporary impairment is amortized prospectively over the remaining life of the security on the basis of the timing of future estimated cash flows of the security.
LOANS HELD FOR SALE are carried at the principal amount outstanding. The carrying amount approximates fair value due to the short duration between origination and the date of sale.
PART II: ITEM 8. FINANCIAL STATEMENTS AND SUPPLEMENTARY DATA
NOTES TO CONSOLIDATED FINANCIAL STATEMENTS
(table dollar amounts in thousands, except share data)
LOANS held in the Corporation’s loan portfolio are carried at the principal amount outstanding, net of unearned income.income and principal charge-offs. Certain non-accrual, substantially delinquent and renegotiated loans classified as troubled debt restructures may be considered to be impaired in accordance with ASC 310, Receivables. Under ASC 310,310-10, a loan is impaired when, based on current information or events, it is probable that the Bank will be unable to collect all amounts due (principal and interest) according to the contractual terms of the loan agreement.agreement are uncollectible. Renegotiated consumer loans classified as troubled debt restructures are considered to be impaired. In applying the provisions of ASC 310,310-10, the Corporation considers all other investments in one-to-four family residential loans and consumer installment loans to be homogeneous and therefore excluded from separate identification for evaluation of impairment. Interest income is accrued on the principal balances of loans. The accrual of interest is discontinued on a loan when, in management’s opinion, the borrower may be unable to meet payments as they become due. When the interest accrual is discontinued, all unpaid accrued interest is reversed against earnings when considered uncollectible. Interest income accrued in the prior year, if any, is charged to the allowance for loan losses. Interest income is subsequently recognized only to the extent cash payments are received and the loan is returned to accruing status. Certain loan fees and direct costs are being deferred and amortized as an adjustment of yield on the loans.
Impaired loans are carried at the fair value of collateral if the loan is collateral dependent, or the present value of estimated future cash flows using the loan’s existing rate. A portion of the allowance for loan losses is allocated to impaired loans if the value of such loans is deemed to be less than the unpaid balance. If these allocations cause the allowance for loan losses to increase, such increase is reported as a component of the provision for loan losses. Loan losses are charged against the allowance when management believes the uncollectability of the loan is confirmed. The valuation would be considered Level 3, consisting of appraisals of underlying collateral and discounted cash flow analysis.
Interest income is accrued on the principal balances of loans. The accrual of interest is discontinued on a loan when, in management’s opinion, the borrower may be unable to meet payments as they become due. When the interest accrual is discontinued, all unpaid accrued interest is reversed against earnings when considered uncollectible. Interest income accrued in the prior year, if any, is charged to the allowance for loan losses. Interest income is subsequently recognized only to the extent cash payments are received and the loan is returned to accruing status. Certain loan fees and direct costs are being deferred and amortized as an adjustment of yield on the loans.
Loan commitments and letters-of-credit generally have short-term, variable-rate features and contain clauses which limit the Bank’s exposure to changes in customer credit quality. Accordingly, their carrying values, which are immaterial at the respective balance sheet dates, are reasonable estimates of fair value.
LOANS ACQUIRED IN BUSINESS COMBINATIONS with evidence of credit deterioration since origination and for which it is probable that all contractually required payments will not be collected are considered to be purchased credit impaired. Evidence of credit quality deterioration as of purchase dates may include information such as past-due and nonaccrual status, borrower credit scoresrisk grade and recent loan to value percentages. AcquiredPurchased credit-impaired loans are accounted for under the accounting guidance for loans and debt securities acquired with deteriorated credit quality (ASC 310-30). These loans are initially measured at fair value based upon expected cash flows without anticipation of prepayments and includes estimated future credit losses expected to be incurred over the life of the loans. As a result, related discounts are recognized subsequently through accretion based on the expected cash flows of the acquired loans. For purposes of applying ASC 310-30, loans acquired in business combinations are individually evaluated for the initial fair value measurement. Accordingly, allowances for credit losses related to these loans are not carried over and recorded at the acquisition date.
The difference between contractually required payments and the cash flows expected to be collected at acquisition is referred to as the nonaccretable portion of the fair value discount or premium. The accretable portion of the fair value discount or premium is the difference between the expected cash flows and the net present value of expected cash flows, with such difference accreted into earnings over the term of the loans. Acquired loans not accounted for under ASC 310-30 are accounted for under ASC 310-20, which allows the fair value adjustment to be accreted into income over the remaining life of the loans.
ALLOWANCE FOR LOAN LOSSES is maintained to absorb losses inherent in the loan portfolio and is based on ongoing, quarterly assessments of the probable losses inherent in the loan portfolio. The allowance is increased by the provision for loan losses, which is charged against current operating results. Loan losses are charged against the allowance when management believes the uncollectability of a loan balance is confirmed. Subsequent recoveries, if any, are credited to the allowance. The Corporation’s strategy for credit risk management includes credit policies and underwriting criteria for all loans, as well as an overall credit limit for each customer significantly below legal lending limits. The strategy also emphasizes diversification on regional geographic and industry levels, regular credit quality reviews and management reviews of large credit exposures and loans experiencing deterioration of credit quality.
The Corporation’s methodology for assessing the appropriateness of the allowance consists of three3 key elements – the determination of the appropriate reserves for impaired loans accounted for under ASC 310,310-10, probable losses estimated from historical loss rates, and probable losses resulting from economic, environmental, qualitative or other deterioration above and beyond what is reflected in the first two components of the allowance.
Commercial relationships greater than $500,000 that exhibit probable or observed credit weaknesses are subject to individual review. Where appropriate, reserves are allocated to individual loans based on management’s estimate of the borrower’s ability to repay the loan given the availability of collateral, other sources of cash flow and legal options available to the Corporation. Included in the review of individual loansLoans individually evaluated for impairment are those deemed impaired in accordance with ASC 310-10, including commercial relationships greater than $500,000 that are impaired as provided in ASC 310.exhibit well defined credit weaknesses. Any allowances for impaired loans are measured based on the fair value of the underlying collateral, if collateral dependent, or the present value of expected future cash flows discounted at the loan’s effective interest rate. The Corporation evaluates the collectability of principal when assessing the need for a loss accrual. Historical loss rates are applied to other commercial loans not subject to specific reserve allocations.
PART II: ITEM 8. FINANCIAL STATEMENTS AND SUPPLEMENTARY DATA
NOTES TO CONSOLIDATED FINANCIAL STATEMENTS
(table dollar amounts in thousands, except share data)
The historical allocation for commercial loans graded pass are established by loan segments using loss rates based on the Corporation’s migration analysis. This migration analysis shows the loss rates for each segment of loans based on the loan grades at the beginning of the twelve month period. This loss rate is then applied to the current portfolio of loans in each respective loan segment.
PART II: ITEM 8. FINANCIAL STATEMENTS AND SUPPLEMENTARY DATA
NOTES TO CONSOLIDATED FINANCIAL STATEMENTS
(table dollar amounts in thousands, except share data)
Homogenous loans, such as consumer installment and residential mortgage loans, are not individually risk graded. Reserves are established for each segment of loans using loss rates based on charge-offs for the same period as the migration analysis used for commercial loans.
Historical loss allocations for commercial and consumer loans may be adjusted for significant factors that, in management’s judgment, reflect the impact of any current conditions on loss recognition. Factors which management considers in the analysis include the effects of the national and local economies, trends in loan growth and charge-off rates, changes in mix, concentration of loans in specific industries, asset quality trends (delinquencies, charge-offs and non-accrual loans), risk management and loan administration, changes in the internal lending policies and credit standards, examination results from bank regulatory agencies and the Corporation’s internal loan review.
PENSION benefits are provided to the Corporation’s employees. Its accounting policies related to pensions and other post retirement benefits reflect the guidance in ASC 715, Compensation – Retirement Benefits. The Corporation does not consolidate the assets and liabilities associated with the pension plan. Instead, the Corporation recognizes the funded status of the plan in the consolidated balance sheets. The measurement of the funded status and the annual pension expense involves actuarial and economic assumptions. Various statistical and other factors, which attempt to anticipate future events, are used in calculating the expense and liabilities related to the plans. Key factors include assumptions on the expected rates of return on plan assets, discount rates, expected rates of salary increases and health care costs and trends. The Corporation considers market conditions, including changes in investment returns and interest rates in making these assumptions. The primary assumptions used in determining the Corporation’s pension and post retirement benefit obligations and related expenses are presented in NOTE 20.21. PENSION AND OTHER POST RETIREMENT BENEFIT PLANS of these Notes to Consolidated Financial Statements.
PREMISES AND EQUIPMENT is carried at cost net of accumulated depreciation. Depreciation is computed using the straight-line and declining balance methods based on the estimated useful lives of the assets ranging from three to forty years. Maintenance and repairs are expensed as incurred, while major additions and improvements, which extend the useful life, are capitalized. Gains and losses on dispositions are included in current operations.
FEDERAL HOME LOAN BANK STOCK is a required investment for institutions that are members of the FHLB. The Bank is a member of the FHLB of Indianapolis. Members are required to own a certain amount of stock based on the level of borrowings and other factors, and may invest in additional amounts. FHLB stock is carried at cost, classified as a restricted security, and periodically evaluated for impairment based on ultimate recovery of par value. Both cash and stock dividends are reported as income.
INTANGIBLE ASSETS that are subject to amortization, including core deposit intangibles, are being amortized on both the straight-line and accelerated basis over two to twenty years.ten years. Intangible assets are periodically evaluated as to the recoverability of their carrying value.
GOODWILL is maintained by applying the provisions of ASC 350, Intangibles – Goodwill and Other. For purchase acquisitions, the Corporation is required to record the assets acquired, including identified intangible assets, and the liabilities assumed at their fair value, which in many instances involves estimates based on third party valuations, such as appraisals, or internal valuations based on discounted cash flow analysis or other valuation techniques that may include estimates of attrition, inflation, asset growth rates or other relevant factors. In addition, the determination of the useful lives for which an intangible asset will be amortized is subjective.
Under ASC 350, the Corporation is required to evaluate goodwill for impairment on an annual basis, as well as on an interim basis, if events or changes indicate that the asset may be impaired, indicating that the carrying value may not be recoverable. The Corporation has historically elected to test for goodwill impairment as of October 1 of each year and has determined that no impairment exists.
BANK OWNED LIFE INSURANCE has been purchased on certain employees and directors of the Corporation.Corporation to offset a portion of the employee benefit costs. The Corporation records the life insurance at the amount that can be realized under the insurance contract at the balance sheet date, which is the cash surrender value adjusted for other charges or amounts due that are probable at settlement. Changes in cash surrender values and death benefits received in excess of cash surrender values are reported in non-interest income. A corporate policy is in place with defined thresholds that limit the amount of credit, interest rate and liquidity risk inherent in a BOLI portfolio. The Corporation actively monitors the overall portfolio performance along with the credit quality of the insurance carriers and the credit quality and yield of the underlying investments.
OTHER REAL ESTATE OWNED consists of assets acquired through, or in lieu of, loan foreclosure and are held for sale. They are initially recorded at fair value less cost to sell at the date of foreclosure, establishing a new cost basis. Subsequent to foreclosure, valuations are periodically performed by management and the assets are carried at the lower of carrying amount or fair value less cost to sell. Revenue and expenses from operations and changes in the valuation are included in other real estate owned and foreclosure expenses. Other real estate owned also includes bank premises formerly, but no longer used for banking. Bank premises are transferred at the lower of carrying value or fair value less cost to sell.
DERIVATIVE INSTRUMENTS are carried at the fair value of the derivatives and reflects the estimated amounts that would have been received to terminate these contracts at the reporting date based upon pricing or valuation models applied to current market information.
As part of the asset/liability management program, the Corporation will utilize, from time to time, interest rate floors, caps or swaps to reduce its sensitivity to interest rate fluctuations. These are derivative instruments, which are recorded as assets or liabilities in the consolidated balance sheets at fair value. Changes in the fair values of derivatives are reported in the consolidated statements of operations or AOCI depending on the use of the derivative and whether the instrument qualifies for hedge accounting. The key criterion for the hedge accounting is that the hedged relationship must be highly effective in achieving offsetting changes in those cash flows that are attributable to the hedged risk, both at inception of the hedge and on an ongoing basis.
PART II: ITEM 8. FINANCIAL STATEMENTS AND SUPPLEMENTARY DATA
NOTES TO CONSOLIDATED FINANCIAL STATEMENTS
(table dollar amounts in thousands, except share data)
Derivatives that qualify for the hedge accounting treatment are designated as either: (1) a hedge of the fair value of the recognized asset or liability, or of an unrecognized firm commitment (a fair value hedge); or (2) a hedge of a forecasted transaction or the variability of cash flows to be received or paid related to a recognized asset or liability (a cash flow hedge). To date, the Corporation has only entered into a cash flow hedge. For cash flow hedges, changes in the fair values of the derivative instruments are reported in AOCI to the extent the hedge is effective. The gains and losses on derivative instruments that are reported in AOCI are reflected in the consolidated statements of income in the periods in which the results of operations are impacted by the variability of the cash flows of the hedged item. Generally, net interest income is increased or decreased by amounts receivable or payable with respect to the derivatives, which qualify for hedge accounting. At inception of the hedge, the Corporation establishes the method it uses for assessing the effectiveness of the hedging derivative and the measurement approach for determining the ineffective aspect of the hedge. The ineffective portion of the hedge, if any, is recognized in the consolidated statements of income. The Corporation excludes the time value expiration of the hedge when measuring ineffectiveness.
The Corporation offers interest rate derivative products (e.g. interest rate swaps) to certain of its high-quality commercial borrowers. This product allows customers to enter into an agreement with the Corporation to swap their variable rate loan to a fixed rate. These derivative products are designed to reduce, eliminate or modify the risk of changes in the borrower’s interest rate or market price risk. The extension of credit incurred through the execution of these derivative products is subject to the same approvals and rigorous underwriting standards as the related traditional credit product. The Corporation limits its risk exposure to these products by entering into a mirror-image, offsetting swap agreement with a separate, well-capitalized and rated counterparty previously approved by the Credit and Asset Liability Committee. By using these interest rate swap arrangements, the Corporation is also better insulated from the interest rate risk associated with underwriting fixed-rate loans. These derivative contracts are not designated against specific assets or liabilities under ASC 815, Derivatives and Hedging, and, therefore, do not qualify for hedge accounting. The derivatives are recorded on the balance sheet at fair value and changes in fair value of both the customer and the offsetting swap agreements are recorded (and essentially offset) in non-interest income. The fair value of the derivative instruments incorporates a consideration of credit risk (in accordance with ASC 820, Fair Value Measurements and Disclosures), resulting in some volatility in earnings each period.
INCOME TAXSECURITIES SOLD UNDER REPURCHASE AGREEMENTS represent securities the Corporation routinely sells to certain treasury management customers and then repurchases these securities the next day. Securities sold under repurchase agreements are reflected as secured borrowings in the consolidated statementsbalance sheets at the amount of income includes deferred income tax provisionscash received in connection with each transaction.
REVENUE RECOGNITION guidance was adopted by the Corporation on January 1, 2018. ASU 2014-09 establishes principles for reporting information about the nature, amount, timing and uncertainty of revenue and cash flows arising from the entity's contracts to provide goods or benefitsservices to customers. The core principle requires an entity to recognize revenue to depict the transfer of goods or services to customers in an amount that reflects the consideration that it expects to be entitled to receive in exchange for all significant temporary differences in recognizing incomethose goods or services recognized as performance obligations are satisfied.
The majority of the Corporation's revenue-generating transactions are not subject to ASU 2014-09, including revenue generated from financial instruments, such as loans, letters of credit, derivatives and expenses for financial reporting and income tax purposes.investment securities, as well as revenue related to mortgage servicing activities, as these activities are subject to other GAAP discussed elsewhere within the disclosures. The Corporation files consolidatedhas evaluated the nature of its contracts with customers and determined that further disaggregation of revenue from contracts with customers into more granular categories beyond what is presented in the Consolidated Statements of Income was not necessary. Descriptions of revenue-generating activities that are within the scope of ASU 2014-09, which are presented in our income tax returns with its subsidiaries.statements are as follows:
Service charges on deposit accounts: The Corporation earns fees from its deposit customers for transaction-based, account maintenance and overdraft services. Transaction-based fees, which include services such as ATM use fees, stop payment charges, statement rendering and ACH fees, are recognized at the time the transaction is generally no longer subject to U.S. federal, state and local income tax examinations by tax authorities for tax years before 2014.
The Corporation adoptedexecuted, which is the provisions of the ASC 740, Income Taxes, which prescribes a recognition threshold and measurement attribute for the financial statement recognition and measurement of a tax position taken or expected to be takenpoint in a tax return. ASC 740 also provides guidance on derecognition, classification, interest and penalties, accounting in interim periods, disclosure and transition. As a result of the implementation of ASC 740,time the Corporation did not identify any uncertain tax positions that it believes should be recognized infulfills the financial statements. The Corporation's policy iscustomer's request. Account maintenance fees, which relate primarily to recognize interest and penalties related to unrecognized tax benefits, if any, as a component of income tax expense.
STOCK OPTION AND RESTRICTED STOCK AWARD PLANSmonthly maintenance, are maintained byearned monthly, representing the Corporation. The compensation costsperiod which the Corporation satisfies the performance obligation. Overdraft fees are recognized at the point in time that the overdraft occurs. Service charges on deposits are withdrawn from the customer's account balance.
Fiduciary activities: This represents monthly fees due from wealth management customers as consideration for stock optionsmanaging the customers' assets. Wealth management and restricted stock awards issued to employeestrust services include custody of assets, investment management, fees for trust services and directorssimilar fiduciary activities. These fees are primarily earned over time as the Corporation provides the contracted monthly or quarterly services and are generally assessed based on the fairmarket value of these awardsassets under management at month-end. Fees that are transaction-based are recognized at the date of grant. A Black-Scholes modelpoint in time that the transaction is utilizedexecuted.
Investment Brokerage Fees: The Corporation earns fees from investment brokerage services provided to estimateits customers by a third-party service provider. The Corporation receives commissions from the fair value of stock options.third-party provider on a monthly basis based upon customer activity for the month. The market pricefees are paid to us by the third party on a monthly basis and are recognized when received.
Interchange income: The Corporation earns interchange fees from debit and credit cardholder transactions conducted through the Visa and MasterCard payment networks. Interchange fees from cardholder transactions represent a percentage of the Corporation’s common stockunderlying transaction value and are recognized concurrent with the transaction processing services provided to the cardholder.
Gains (Losses) on Sales of OREO: The Corporation records a gain or loss from the sale of OREO when control of the property transfers to the buyer, which generally occurs at the datetime of grantan executed deed. When the Corporation finances the sale of OREO to the buyer, the Corporation assesses whether the buyer is used for restricted stock awards. Compensation expensecommitted to perform their obligations under the contract and whether collectability of the transaction price is recognized overprobable. Once these criteria are met, the appropriate service period, whichOREO asset is generally twoderecognized and the gain or three years.loss on sale is recorded upon the transfer of control of the property to the buyer. In determining the gain or loss on the sale, the Corporation adjusts the transaction price and related gain (loss) on sale if a significant financing component is present.
PART II: ITEM 8. FINANCIAL STATEMENTS AND SUPPLEMENTARY DATA
NOTES TO CONSOLIDATED FINANCIAL STATEMENTS
(table dollar amounts in thousands, except share data)
TRANSFERS OF FINANCIAL ASSETS are accounted for as sales, when control over the assets has been surrendered. Control over transferred assets is deemed to be surrendered when (1) the assets have been isolated from the Corporation and put presumptively beyond the reach of the transferor and its creditors, even in bankruptcy or other receivership, (2) the transferee obtains the right (free of conditions that constrain it from taking advantage of that right) to pledge or exchange the transferred assets and (3) the Corporation does not maintain effective control over the transferred assets through an agreement to repurchase them before their maturity or the ability to unilaterally cause the holder to return specific assets.
STOCK OPTION AND RESTRICTED STOCK AWARD PLANS are maintained by the Corporation. The compensation costs are recognized for stock options and restricted stock awards issued to employees and directors based on the fair value of these awards at the date of grant. A Black-Scholes model is utilized to estimate the fair value of stock options. The market price of the Corporation’s common stock at the date of grant is used for restricted stock awards. Compensation expense is recognized over the appropriate service period, which is generally two or three years.
INCOME TAX in the consolidated statements of income includes deferred income tax provisions or benefits for all significant temporary differences in recognizing income and expenses for financial reporting and income tax purposes. The Corporation files consolidated income tax returns with its subsidiaries. The Corporation is generally no longer subject to U.S. federal, state and local income tax examinations by tax authorities for tax years before 2016.
The Corporation adopted the provisions of the ASC 740, Income Taxes, which prescribes a recognition threshold and measurement attribute for the financial statement recognition and measurement of a tax position taken or expected to be taken in a tax return. ASC 740 also provides guidance on derecognition, classification, interest and penalties, accounting in interim periods, disclosure and transition. As a result of the implementation of ASC 740, the Corporation did not identify any uncertain tax positions that it believes should be recognized in the financial statements. The Corporation's policy is to recognize interest and penalties related to unrecognized tax benefits, if any, as a component of income tax expense.
NET INCOME PER SHARE is computed by dividing net income available to common shareholders by the weighted-average number of shares of common stock outstanding. Diluted net income per share is computed by dividing net income available to common shareholders by the weighted-average number of shares of common stock outstanding, plus the dilutive effect of outstanding stock options and nonvested restricted stock.
RECLASSIFICATIONS have been made to prior financial statements to conform to the current financial statement presentation. These reclassifications had no effect on net income.
RECENT ACCOUNTING CHANGES ADOPTED IN 2019
FASB Accounting Standards Update No. 2018-11 - Leases (Topic 842): Targeted Improvements - The FASB issued Accounting Standards Update (ASU) No. 2018-11, Leases (Topic 842): Targeted Improvements. This ASU was intended to reduce costs and ease implementation of the leases standard for financial statement preparers. ASU 2018-11 provided a new transition method and a practical expedient for separating components of a contract. ASU 2018-11 provided entities with an additional (and optional) transition method to adopt the new leases standard. Under this new transition method, an entity initially applied the new leases standard at the adoption date and recognized a cumulative-effect adjustment to the opening balance of retained earnings in the period of adoption. Consequently, the Corporation's reporting for the comparative periods presented in the financial statements in the period of adoption is in accordance with GAAP in Topic 840, Leases. The Corporation must provide the required Topic 840 disclosures for all periods that continue to be in accordance with Topic 840. The amendments did not change the existing disclosure requirements in Topic 840 (for example, they did not create interim disclosure requirements that the Corporation previously was not required to provide). The Corporation adopted this new transition method on January 1, 2019, but did not recognize a cumulative-effect adjustment to the opening balance of retained earnings at adoption. Lease disclosures are included in NOTE 10. LEASES of these Notes to Consolidated Financial Statements.
The amendments in ASU 2018-11 provided lessors with a practical expedient, by class of underlying asset, to not separate non-lease components from the associated lease component and, instead, to account for those components as a single component if the non-lease components otherwise would be accounted for under the new revenue guidance (Topic 606) and both of the following are met:
The timing and pattern of transfer of the non-lease component(s) and associated lease component are the same.
The lease component, if accounted for separately, would be classified as an operating lease.
An entity electing this practical expedient (including an entity that accounts for the combined component entirely in Topic 606) is required to disclose certain information, by class of underlying asset, as specified in the ASU. The Corporation elected the practical expedient to not separate non-lease components from the associated lease component at adoption, which was January 1, 2019.
PART II: ITEM 8. FINANCIAL STATEMENTS AND SUPPLEMENTARY DATA
NOTES TO CONSOLIDATED FINANCIAL STATEMENTS
(table dollar amounts in thousands, except share data)
FASB Accounting Standards Update No. 2018-07 - Compensation - Stock Compensation (Topic 718): Improvements to Nonemployee Share-Based Payment Accounting- The FASB issued an Accounting Standards Update (ASU) intended to reduce cost and complexity and to improve financial reporting for non-employee share-based payments. The ASU expanded the scope of Topic 718, Compensation-Stock Compensation (which currently only includes share-based payments to employees) to include share-based payments issued to non-employees for goods or services. Consequently, the accounting for share-based payments to non-employees and employees is substantially aligned. The ASU supersedes Subtopic 505-50, Equity-Equity-Based Payments to Non-Employees. The Corporation adopted the standard in the first quarter of 2019 and adoption of the standard did not have a significant effect on the Corporation’s consolidated financial statements.
FASB Accounting Standards Update No. 2017-08 - Receivables - Nonrefundable Fees and Other Costs (Subtopic 310-20): Premium Amortization on Purchased Callable Debt Securities- The FASB issued Accounting Standards Update (ASU) No. 2017-08, Receivables-Nonrefundable Fees and Other Costs (Subtopic 310-20): Premium Amortization on Purchased Callable Debt Securities. The ASU shortened the amortization period for certain callable debt securities held at a premium to the earliest call date. Under previous GAAP, entities normally amortized the premium as an adjustment of yield over the contractual life of the instrument. Stakeholders expressed concerns with the approach on the basis that GAAP excluded certain callable debt securities from consideration of early repayment of principal even if the holder was certain the call would be exercised. As a result, upon the exercise of a call on a callable debt security held at a premium, the unamortized premium was recorded as a loss in earnings. Further, there was diversity in practice (1) in the amortization period for premiums of callable debt securities, and (2) in how the potential for exercise of a call was factored into current impairment assessments. Another issue was that the practice in the United States was to quote, price, and trade callable debt securities using a model that incorporated consideration of calls (also referred to as “yield-to-worst” pricing). The ASU shortened the amortization period for certain callable debt securities held at a premium and required the premium to be amortized to the earliest call date. However, the amendments did not require an accounting change for securities held at a discount; the discount continues to be amortized to maturity.
The Corporation was required to apply the amendments on a modified retrospective basis through a cumulative-effect adjustment directly to retained earnings at adoption. The Corporation adopted ASU 2017-08 on January 1, 2019 and adoption of the standard did not have a significant effect on the Corporation’s consolidated financial statements.
FASB Accounting Standards Update No. 2016-02 - Leases (Topic 842) - The FASB issued new lease accounting guidance in Accounting Standards Update (ASU) No. 2016-02, Leases (Topic 842). Under the new guidance, lessees recognize the following for all leases (with the exception of short-term leases) at the commencement date:
A lease liability, which is a lessee‘s obligation to make lease payments arising from a lease, measured on a discounted basis; and
A right-of-use ("ROU") asset, which is an asset that represents the lessee’s right to use, or control the use of, a specified asset for the lease term.
Under the new guidance, lessor accounting is largely unchanged. Certain targeted improvements were made to align, where necessary, lessor accounting with the lessee accounting model and Topic 606, Revenue from Contracts with Customers. The new lease guidance simplified the accounting for sale and leaseback transactions primarily because lessees must recognize lease assets and lease liabilities. Lessees are no longer provided with a source of off-balance sheet financing.
The Corporation elected the package of practical expedients permitted under the transition guidance within the new standard, which among other things, allowed the Corporation to carry forward the historical lease classification. The Corporation elected to not apply ASC 842 to short-term leases (leases with a term of 12 months or less). Leases with an initial term of 12 months or less are not recorded on the balance sheet as the Corporation expenses the lease on a straight-line basis over the lease term. The Corporation also elected the practical expedient to not separate nonlease components from lease components. Variable payments are not included as part of the consideration of a lease contract and all of the Corporation's nonlease components contain variable payments; therefore, this election will not have any impact on the ROU asset or lease liability.
The Corporation adopted this ASU on January 1, 2019 and recorded a ROU asset of $23.3 million and a lease liability of $23.8 million at adoption. Lease disclosures are included in NOTE 10. LEASES of these Notes to Consolidated Financial Statements.
NEW ACCOUNTING PRONOUNCEMENTS TO BE ADOPTED AFTER 2019
The Corporation continually monitors potential accounting changes and pronouncements. The following pronouncements have been deemed to have the most applicability to the Corporation's financial statements:
FASB Accounting Standards Update No. 2019-11 - Codification Improvements to Topic 326, Financial Instruments - Credit Losses
Summary - The FASB issued an Accounting Standards Update (ASU) that addressed issues raised by stakeholders during the implementation of ASU No. 2016-13, Financial Instruments-Credit Losses (Topic 326): Measurement of Credit Losses of Financial Instruments.
Among other narrow-scope improvements, the new ASU clarifies guidance around how to report expected recoveries. “Expected recoveries” describes a situation in which an organization recognizes a full or partial write-off of the amortized cost basis of a financial asset, but then later determines that the amount written off, or a portion of that amount, will in fact be recovered. While applying the credit losses standard, stakeholders questioned whether expected recoveries were permitted on assets that had already shown credit deterioration at the time of purchase (also known as PCD assets).
PART II: ITEM 8. FINANCIAL STATEMENTS AND SUPPLEMENTARY DATA
NOTES TO CONSOLIDATED FINANCIAL STATEMENTS
(table dollar amounts in thousands, except share data)
In response to this question, the ASU permits organizations to record expected recoveries on PCD assets. In addition to other narrow technical improvements, the ASU also reinforces existing guidance that prohibits organizations from recording negative allowances for available-for-sale debt securities.
The ASU includes effective dates and transition requirements that vary depending on whether or not an entity has already adopted ASU 2016-13. The Corporation adopted the standard on January 1, 2020, but adoption of the standard did not have a significant impact on the Corporation’s consolidated financial statements.
FASB Accounting Standards Update No. 2018-15 - Intangibles - Goodwill and Other - Internal-Use Software (Subtopic 350-40): Customer's Accounting for Implementation Costs Incurred in a Cloud Computing Arrangement That Is a Service Contract
Summary - The FASB has issued Accounting Standards Update (ASU) No. 2018-15, Intangibles-Goodwill and Other-Internal-Use Software (Subtopic 350-40): Customer’s Accounting for Implementation Costs Incurred in a Cloud Computing Arrangement That Is a Service Contract, which reduces complexity for the accounting for costs of implementing a cloud computing service arrangement. This standard aligns the accounting for implementation costs of hosting arrangements, regardless of whether they convey a license to the hosted software.
The ASU aligns the following requirements for capitalizing implementation costs:
Those incurred in a hosting arrangement that is a service contract, and
Those incurred to develop or obtain internal-use software (and hosting arrangements that include an internal-use software license).
For calendar-year public companies, the changes will be effective for fiscal years ending after December 15, 2019. For all other calendar-year companies and organizations, the changes will be effective for fiscal years ending after December 15, 2020. The Corporation adopted the standard on January 1, 2020, but adoption of the standard did not have a significant impact on the Corporation’s consolidated financial statements.
FASB Accounting Standards Update No. 2018-14 - Compensation - Retirement Benefits - Defined Benefit Plans - General (Subtopic 715-20): Disclosure Framework - Changes to the Disclosure Requirements for Defined Benefit Plans
Summary - The FASB has issued ASU No. 2018-14, Compensation - Retirement Benefits - Defined Benefit Plans - General (Subtopic 715-20): Disclosure Framework - Changes to the Disclosure Requirements for Defined Benefit Plans, that applies to all employers that sponsor defined benefit pension or other postretirement plans. The amendments modify the disclosure requirements for employers that sponsor defined benefit pension or other postretirement plans.
Disclosure Requirements Deleted
The amounts in accumulated other comprehensive income expected to be recognized as components of net periodic benefit cost over the next fiscal year.
The amount and timing of plan assets expected to be returned to the employer.
Related party disclosures about the amount of future annual benefits covered by insurance and annuity contracts and significant transactions between the employer or related parties and the plan.
For public entities, the effects of a one-percentage-point change in assumed health care cost trend rates on the (a) aggregate of the service and interest cost components of net periodic benefit costs and (b) benefit obligation for postretirement health care benefits.
Disclosure Requirements Added
An explanation of the reasons for significant gains and losses related to changes in the benefit obligation for the period.
The amendments also clarify the disclosure requirements in paragraph 715-20-50-3, which state that the following information for defined benefit pension plans should be disclosed:
The projected benefit obligation (PBO) and fair value of plan assets for plans with PBOs in excess of plan assets.
The accumulated benefit obligation (ABO) and fair value of plan assets for plans with ABOs in excess of plan assets.
ASU No. 2018-14 is effective for fiscal years ending after December 15, 2020, for public business entities and for fiscal years ending after December 15, 2021, for all other entities. Early adoption is permitted for all entities. The Corporation adopted the standard January 1, 2020, but adoption of the standard did not have a significant impact on the Corporation’s disclosures.
FASB Accounting Standards Update No. 2018-13 - Fair Value Measurement (Topic 820): Disclosure Framework - Changes to the Disclosure Requirements for Fair Value Measurement
Summary - The FASB has issued ASU No. 2018-13, Fair Value Measurement (Topic 820): Disclosure Framework - Changes to the Disclosure Requirements for Fair Value Measurement. ASU No. 2018-13 modifies the disclosure requirements on fair value measurements in Topic 820. Certain disclosure requirements related to transfers between Level 1 and Level 2 of the fair value hierarchy and Level 3 valuation process were removed from Topic 820. Disclosures were also added to Topic 820 for changes in unrealized gains and losses for the period included in other comprehensive income for recurring Level 3 fair value measurements held at the end of the reporting period and the range and weighted average of significant unobservable inputs used to develop Level 3 fair value measurements.
PART II: ITEM 8. FINANCIAL STATEMENTS AND SUPPLEMENTARY DATA
NOTES TO CONSOLIDATED FINANCIAL STATEMENTS
(table dollar amounts in thousands, except share data)
In addition, the amendments eliminate at a minimum from the phrase “an entity shall disclose at a minimum” to promote the appropriate exercise of discretion by entities when considering fair value measurement disclosures and to clarify that materiality is an appropriate consideration of entities and their auditors when evaluating disclosure requirements.
The amendments in ASU No. 2018-13 are effective for all entities for fiscal years, and interim periods within those fiscal years, beginning after December 15, 2019. The amendments on changes in unrealized gains and losses, the range and weighted average of significant unobservable inputs used to develop Level 3 fair value measurements, and the narrative description of measurement uncertainty should be applied prospectively for only the most recent interim or annual period presented in the initial fiscal year of adoption. All other amendments should be applied retrospectively to all periods presented upon their effective date. Early adoption is permitted. An entity is permitted to early adopt any removed or modified disclosures upon issuance of ASU No. 2018-13 and delay adoption of the additional disclosures until their effective date. The Corporation adopted the standard January 1, 2020, but adoption of the standard did not have a significant impact on the Corporation’s disclosures.
FASB Accounting Standards Update No. 2016-13, Financial Instruments - Credit Losses (Topic 326): Measurement of Credit Losses on Financial Instruments
Summary - The FASB has issued Accounting Standards Update (ASU) No. 2016-13, Financial Instruments - Credit Losses (Topic 326): Measurement of Credit Losses on Financial Instruments. This new guidance was issued to address concerns that current generally accepted accounting principles (GAAP) restricts the ability to record credit losses that are expected, but do not yet meet the “probable” threshold by replacing the current “incurred loss” model for recognizing credit losses with an “expected life of loan loss” model referred to as the Current Expected Credit Loss (CECL) model.
Under the CECL model, certain financial assets carried at amortized cost, such as loans held for investment and held-to-maturity debt securities, are required to be presented at the net amount expected to be collected. The measurement of expected credit losses is to be based on information about past events, including historical experience, current conditions, and reasonable and supportable forecasts that affect the collectability of the reported amount. This measurement will take place at the time the financial asset is first added to the balance sheet and periodically thereafter. This differs significantly from the “incurred loss” model required under current GAAP, which delays recognition until it is probable a loss has been incurred. The change could materially affect how the allowance for loan losses is determined and cause a charge to earnings through the provision for loan losses. Such charge would adversely affect the financial condition of the Corporation.
The ASU is effective for SEC filers for fiscal years, and interim periods within those fiscal years, beginning after December 15, 2019 (i.e., January 1, 2020, for calendar year entities). The Corporation adopted this ASU January 1, 2020.
The Corporation has developed models that satisfy the requirements of the new standard which will be governed by a system of internal controls and a cross-functional working group consisting of accounting, finance, and credit administration personnel. The loan portfolio was pooled into ten loan segments with similar risk characteristics for which the probability of default/loss given default methodology will be applied. The Corporation intends to utilize a one-year economic forecast period then revert to historical macroeconomic levels for the remaining life of the portfolio. A baseline macroeconomic scenario, along with three other scenarios, will be used to develop a range of estimated credit losses for which to determine the best estimate within.
The Corporation will record a one-time cumulative-effect adjustment to retained earnings, net of income taxes, on the consolidated balance sheet as of the beginning of the first quarter of 2020. The allowance will increase by 55-65 percent because it will cover expected credit losses over the life of the loan portfolio, which approximates four years, and it includes all purchased loans that were previously excluded from the allowance for loan losses calculation. CECL also requires the establishment of a reserve for potential losses from unfunded commitments that is recorded in other liabilities, separate from allowance for credit losses, which is estimated to be approximately $18 million.
NOTE 2
ACQUISITIONSACQUISITION
Independent Alliance Banks, Inc.MBT Financial Corp.
On November 21, 2016, the Corporation purchased 495,112 shares, or 12.1 percent, of IAB's outstanding common stock from an IAB shareholder for $19.8 million, or $40.00 per share. On July 14, 2017,September 1, 2019, the Corporation acquired the remaining shares100 percent of IAB common stock. IAB, an Indiana Corporation,MBT. MBT, a Michigan corporation, merged with and into the Corporation, whereupon the separate corporate existence of IABMBT ceased and the Corporation survived. Immediately following the merger, IAB'sMBT's wholly-owned subsidiary, iAB FinancialMonroe Bank & Trust, merged with and into the Bank, with the Bank continuing as the surviving bank.
IABMBT was headquartered in Fort Wayne, IndianaMonroe, Michigan and had 1620 banking centers serving the Fort WayneMonroe market. Pursuant to the merger agreement, each IABMBT shareholder received 1.6530.275 shares of the Corporation's common stock for each outstanding share of IABMBT common stock held. The Corporation issued approximately 6.06.4 million shares of common stock. The transaction value for the remaining shares of common stock, not owned by the Corporation,which was valued at approximately $238.8 million, resulting in a total purchase price of $258.6$229.9 million. The Corporation engaged in this transaction with the expectation that it would be accretive to income and add a new market area within Michigan that has a demographic profile consistent with many of the current Indiana and Ohio markets served by the Bank. Goodwill resulted from this transaction due to the expected synergies and economies of scale.
In the third quarter
PART II: ITEM 8. FINANCIAL STATEMENTS AND SUPPLEMENTARY DATA
NOTES TO CONSOLIDATED FINANCIAL STATEMENTS
(table dollar amounts in IAB's common stock and recognize the resulting gain or loss, if any, in earnings. The remeasurement was based upon the closing price of IAB's common stock immediately prior to the acquisition announcement, and prior to the Corporation obtaining control of IAB. The trading price of IAB's common stock subsequent to the acquisition announcement included a control or acquisition premium and was not indicative of the fair value of the Corporation's pre-existing equity interest immediately prior to the acquisition announcement. The fair value of the equity interest in IAB's common stock after the remeasurement was $19.8 million. The Corporation recorded a $50,000 loss in 2017 as a result of the remeasurement and the loss is reflected in the Corporation's Consolidated Statements of Income in the line titled "Net realized gains on sales of available for sale securities."thousands, except share data)
Under the acquisition method of accounting, the total purchase price is allocated to net tangible and intangible assets based on their current estimated fair values on the date of the acquisition. Based on preliminary valuations of the fair value of tangible and intangible assets acquired and liabilities assumed, which are based on assumptions that are subject to change based on the timing of the transaction, the purchase price for the IABMBT acquisition is detailed in the following table. If, prior to the end of the one-year measurement period for finalizing the purchase price allocation, information becomes available about facts and circumstances that existed as of the acquisition date, which would indicate adjustments are required to the purchase price allocation, such adjustments will be included in the purchase price allocation retrospectively.
|
| | | | |
|
| Fair Value |
| Cash and cash equivalents |
| $ | 10,222 |
|
| Interest-bearing time deposits |
| 281,228 |
|
| Investment securities |
| 212,235 |
|
| Loans |
| 732,578 |
|
| Premises and equipment |
| 21,664 |
|
| Federal Home Loan Bank stock |
| 4,148 |
|
| Interest receivable |
| 3,361 |
|
| Cash surrender value of life insurance |
| 59,545 |
|
| Tax asset, deferred and receivable |
| 5,205 |
|
| Other assets |
| 6,011 |
|
| Deposits |
| (1,105,926 | ) |
| Securities sold under repurchase agreements |
| (94,760 | ) |
| Federal Home Loan Bank advances |
| (10,853 | ) |
| Other liabilities |
| (9,807 | ) |
| Net tangible assets acquired |
| 114,851 |
|
| Core deposit intangible |
| 16,527 |
|
| Goodwill |
| 98,563 |
|
| Purchase price |
| $ | 229,941 |
|
|
| | | | |
| | | Fair Value |
| Cash and cash equivalents | | $ | 6,016 |
|
| Interest-bearing time deposits | | 248,212 |
|
| Investment securities | | 4,078 |
|
| Loans held for sale | | 594 |
|
| Loans | | 725,382 |
|
| Premises and equipment | | 10,107 |
|
| Federal Home Loan Bank stock | | 4,810 |
|
| Interest receivable | | 3,445 |
|
| Cash surrender value of life insurance | | 26,964 |
|
| Other assets | | 11,780 |
|
| Deposits | | (862,271 | ) |
| Securities sold under repurchase agreements | | (17,915 | ) |
| Federal Home Loan Bank Advances | | (47,575 | ) |
| Subordinated debentures | | (10,583 | ) |
| Interest payable | | (1,005 | ) |
| Other liabilities | | (14,472 | ) |
| Net tangible assets acquired | | 87,567 |
|
| Other Intangible assets | | 17,403 |
|
| Goodwill | | 153,636 |
|
| Purchase price | | $ | 258,606 |
|
Of the total purchase price, $17,403,000 has been allocated to other intangible assets. Approximately $13.6 million$16,527,000 was allocated to a core deposit intangible, which will be amortized over its estimated life of 10 years. Approximately $3.8 million was allocated to a non-compete intangible, which will be amortized over its estimated life of 2 years. The remaining purchase price has beenwas allocated to goodwill, which is not deductible for tax purposes.
PART II: ITEM 8. FINANCIAL STATEMENTS AND SUPPLEMENTARY DATA
NOTES TO CONSOLIDATED FINANCIAL STATEMENTS
(table dollar amounts in thousands, except share data)
Acquired loan data for IAB can be foundMBT is included in the table below:following table:
|
| | | | | | | | | | | |
| | Fair Value of Acquired Loans at Acquisition Date | | Gross Contractual Amounts Receivable at Acquisition Date | | Best Estimate at Acquisition Date of Contractual Cash Flows Not Expected to be Collected |
| Acquired receivables subject to ASC 310-30 | $ | 3,531 |
| | $ | 6,840 |
| | $ | 2,733 |
|
| Acquired receivables not subject to ASC 310-30 | $ | 729,047 |
| | $ | 907,210 |
| | $ | 14,722 |
|
|
| | | | | | | | | | | |
| | Fair Value of Acquired Loans at Acquisition Date | | Gross Contractual Amounts Receivable at Acquisition Date | | Best Estimate at Acquisition Date of Contractual Cash Flows Not Expected to be Collected |
| Acquired receivables subject to ASC 310-30 | $ | 4,838 |
| | $ | 14,131 |
| | $ | 8,352 |
|
| Acquired receivables not subject to ASC 310-30 | $ | 720,544 |
| | $ | 864,613 |
| | $ | 9,786 |
|
The Arlington Bank
On May 19, 2017, the Corporation acquired 100 percentPurchased loans with evidence of Arlington Bank. Arlington Bank, an Ohio savings bank, merged withcredit deterioration since origination and into the Bank, with the Bank continuing as the surviving bank. Arlington Bank was headquartered in Columbus, Ohio and had 3 banking centers serving the Columbus, Ohio market. Pursuant to the merger agreement, each Arlington Bank shareholder received 2.7245 shares of the Corporation's common stock for each outstanding share of Arlington Bank common stock held. The Corporation issued approximately 2.1 million shares of common stock, which was valuedit is probable at approximately $82.6 million. The Corporation engaged in this transaction with the expectation that it would be accretive to income and expand the existing footprint in Columbus, Ohio. Goodwill resulted from this transaction due to the expected synergies and economies of scale.
Under the acquisition method of accounting, the total purchase price is allocated to net tangible and intangible assets based on their current estimated fair values on the date of acquisition that the acquisition. Based on preliminary valuationsacquirer will not collect all contractually required principal and interest payments are accounted for under ASC 310-30, Loans Acquired with Deteriorated Credit Quality. The difference between contractually required payments and the cash flows expected to be collected at acquisition is referred to as the nonaccretable difference. The accretable portion of the fair value discount or premium is the difference between the expected cash flows and the net present value of tangible and intangible assets acquired and liabilities assumed, which are based on assumptions that are subject to change,expected cash flows, with such difference accreted into earnings over the purchase price for the Arlington Bank acquisition is detailed in the following table. If prior to the endterm of the one-year measurement period for finalizing the purchase price allocation, information becomes available which would indicate adjustments are required to the purchase price allocation, such adjustments will be included in the purchase price allocation retrospectively.loans.
|
| | | | |
| | | Fair Value |
| Cash and cash equivalents | | $ | 48,532 |
|
| Interest-bearing time deposits | | 292 |
|
| Loans held for sale | | 7,626 |
|
| Loans | | 224,680 |
|
| Premises and equipment | | 1,986 |
|
| Federal Home Loan Bank stock | | 1,091 |
|
| Interest receivable | | 653 |
|
| Other assets | | 1,620 |
|
| Deposits | | (252,783 | ) |
| Interest payable | | (244 | ) |
| Other liabilities | | (3,106 | ) |
| Net tangible assets acquired | | 30,347 |
|
| Core deposit intangible | | 4,526 |
|
| Goodwill | | 47,719 |
|
| Purchase price | | $ | 82,592 |
|
Of the total purchase price, $4,526,000 has been allocated to a core deposit intangible that will be amortized over its estimated life of 10 years. The remaining purchase price has been allocated to goodwill, which is not deductible for tax purposes.
Acquired loan data for Arlington Bank can be found in the table below:
|
| | | | | | | | | | | |
| | Fair Value of Acquired Loans at Acquisition Date | | Gross Contractual Amounts Receivable at Acquisition Date | | Best Estimate at Acquisition Date of Contractual Cash Flows Not Expected to be Collected |
| Acquired receivables subject to ASC 310-30 | $ | 2,625 |
| | $ | 6,183 |
| | $ | 2,891 |
|
| Acquired receivables not subject to ASC 310-30 | $ | 222,055 |
| | $ | 308,857 |
| | $ | 2,741 |
|
PART II: ITEM 8. FINANCIAL STATEMENTS AND SUPPLEMENTARY DATA
NOTES TO CONSOLIDATED FINANCIAL STATEMENTS
(table dollar amounts in thousands, except share data)
Pro Forma Financial Information
The results of operations of Arlington Bank and IABMBT have been included in the Corporation's consolidated financial statements since the acquisition dates.date. The following schedule includes pro forma results for the year ended December 31, 20172019 and 2016,2018, as if the Arlington Bank and IAB acquisitionsMBT acquisition occurred as of the beginning of the periods presented.
|
| | | | | | | | |
|
| Year Ended
December 31, 2019 |
| Year Ended
December 31, 2018 |
| Total revenue (net interest income plus other income) |
| $ | 474,891 |
|
| $ | 476,878 |
|
| Net income available to common shareholders |
| $ | 161,228 |
|
| $ | 177,906 |
|
| Earnings per share: |
|
|
|
|
| Basic |
| $ | 2.89 |
|
| $ | 3.19 |
|
| Diluted |
| $ | 2.88 |
|
| $ | 3.18 |
|
|
| | | | | | | |
| | 2017 | | 2016 |
| Total revenue (net interest income plus other income) | $ | 380,324 |
| | $ | 353,732 |
|
| Net income | $ | 95,009 |
| | $ | 95,288 |
|
| Net income available to common shareholders |
| |
|
| Earnings per share: | | | |
| Basic | $ | 1.94 |
| | $ | 1.95 |
|
| Diluted | $ | 1.93 |
| | $ | 1.94 |
|
The pro forma information includes adjustments for interest income on loans and investments, interest expense on deposits and borrowings, premises expense for the banking centers acquired and amortization of intangibles arising from the transaction and the related income tax effects. The pro forma information for the year ended December 31, 20172019 includes operating revenue from MBT of $9.0$19.7 million and $21.4 million from Arlington Bank and IAB acquisitions since the date of acquisition, respectively.acquisition. Additionally, $15.4$19.7 million, net of tax, of non-recurring expenses directly attributable to the Arlington Bank and IAB acquisitionsMBT acquisition were included in the year ended December 31, 20172019 pro forma information.
PART II: ITEM 8. FINANCIAL STATEMENTS AND SUPPLEMENTARY DATA
NOTES TO CONSOLIDATED FINANCIAL STATEMENTS
(table dollar amounts in thousands, except share data)
The pro forma information for the year ended December 31, 20162018 includes operating results from Arlington Bank and IABMBT as if the acquisitionsacquisition occurred at the beginning of the year. Additionally, $877,000, net of tax, of non-recurring expenses directly attributable to the MBT acquisition were included in the year ended December 31, 2018 pro forma information.
The pro forma information is presented for informationinformational purposes only and is not indicative of the results of operations that actually would have been achieved had the acquisitionsacquisition been consummated as of that time, nor is itor intended to be a projection of future results.
NOTE 3
RESTRICTION ON CASH AND DUE FROM BANKSCASH EQUIVALENTS
The Corporation considers all liquid investments with original maturities of three months or less to be cash equivalents. As of December 31, 20172019, cash and cash equivalents is defined to include cash on hand, deposits in other institutions and federal funds sold.
At December 31, 2017,2019, the Corporation’s interest-bearing cash accounts and noninterest-bearing transaction deposits held at other institutions exceeded the $250,000 federally insured limits by approximately $128,127,000190,378,000. Each correspondent bank’s financial performance and market rating are reviewed on a quarterly basis to ensure the Corporation has deposits only at institutions providing minimal risk for those exceeding the federally insured limits.
Additionally, the Corporation had approximately $5,826,00039,844,000 at the Federal Home Loan Bank and Federal Reserve Bank, which are government-sponsored entities not insured by the FDIC.
The Corporation is required to maintain reserve funds in cash and/or on deposit with the Federal Reserve Bank. The reserve required at December 31, 20172019, was $14,522,00078,934,000.
NOTE 4
INVESTMENT SECURITIES
The amortized cost, gross unrealized gains, gross unrealized losses and approximate market value of the Corporation's investment securities at the dates indicated were:
64 |
| | | | | | | | | | | | | | | |
| | Amortized Cost | | Gross Unrealized Gains | | Gross Unrealized Losses | | Fair Value |
| Available for sale at December 31, 2019 | | | | | | | |
| U.S. Government-sponsored agency securities | $ | 38,529 |
| | $ | 346 |
| | $ | — |
| | $ | 38,875 |
|
| State and municipal | 859,511 |
| | 41,092 |
| | 807 |
| | 899,796 |
|
| U.S. Government-sponsored mortgage-backed securities | 842,349 |
| | 10,378 |
| | 1,404 |
| | 851,323 |
|
| Corporate obligations | 31 |
| | — |
| | — |
| | 31 |
|
| Total available for sale | 1,740,420 |
| | 51,816 |
| | 2,211 |
| | 1,790,025 |
|
| Held to maturity at December 31, 2019 | | | | | | | |
| U.S. Government-sponsored agency securities | 15,619 |
| | 1 |
| | 37 |
| | 15,583 |
|
| State and municipal | 354,115 |
| | 15,151 |
| | 107 |
| | 369,159 |
|
| U.S. Government-sponsored mortgage-backed securities | 434,804 |
| | 6,921 |
| | 401 |
| | 441,324 |
|
| Foreign investment | 1,500 |
| | — |
|
| — |
| | 1,500 |
|
| Total held to maturity | 806,038 |
| | 22,073 |
| | 545 |
| | 827,566 |
|
| Total Investment Securities | $ | 2,546,458 |
| | $ | 73,889 |
| | $ | 2,756 |
| | $ | 2,617,591 |
|
| | | | | | | | |
| Available for sale at December 31, 2018 | | | | | | | |
| U.S. Government-sponsored agency securities | $ | 13,493 |
| | $ | 92 |
| | $ | 3 |
| | $ | 13,582 |
|
| State and municipal | 605,994 |
| | 5,995 |
| | 5,854 |
| | 606,135 |
|
| U.S. Government-sponsored mortgage-backed securities | 530,209 |
| | 634 |
| | 8,396 |
| | 522,447 |
|
| Corporate obligations | 31 |
| | — |
|
| — |
| | 31 |
|
| Total available for sale | 1,149,727 |
| | 6,721 |
| | 14,253 |
| | 1,142,195 |
|
| Held to maturity at December 31, 2018 | | | | | | | |
| U.S. Government-sponsored agency securities | 22,618 |
|
| — |
|
| 545 |
|
| 22,073 |
|
| State and municipal | 197,909 |
|
| 2,858 |
|
| 872 |
|
| 199,895 |
|
| U.S. Government-sponsored mortgage-backed securities | 268,860 |
|
| 713 |
|
| 3,323 |
|
| 266,250 |
|
| Foreign investment | 1,000 |
|
| — |
|
| 1 |
|
| 999 |
|
| Total held to maturity | 490,387 |
|
| 3,571 |
|
| 4,741 |
|
| 489,217 |
|
| Total Investment Securities | $ | 1,640,114 |
|
| $ | 10,292 |
|
| $ | 18,994 |
|
| $ | 1,631,412 |
|
The change in unrealized gains/losses from December 31, 2018 to December 31, 2019 is primarily due to the changes in interest rates. The
longer term points on the yield curve have declined since year-end which increases the fair value of securities held in the portfolio.
PART II: ITEM 8. FINANCIAL STATEMENTS AND SUPPLEMENTARY DATA
NOTES TO CONSOLIDATED FINANCIAL STATEMENTS
(table dollar amounts in thousands, except share data)
NOTE 4
INVESTMENT SECURITIES
The amortized cost, gross unrealized gains,following table shows the Corporation’s gross unrealized losses and approximate marketfair value, aggregated by investment category and length of time the Corporation's investmentindividual securities have been in a continuous unrealized loss position at the dates indicated were:December 31, 2019 and 2018:
|
| | | | | | | | | | | | | | | |
| | Amortized Cost | | Gross Unrealized Gains | | Gross Unrealized Losses | | Fair Value |
| Available for sale at December 31, 2017 | | | | | | | |
| State and municipal | $ | 510,852 |
| | $ | 16,932 |
| | $ | 1,091 |
| | $ | 526,693 |
|
| U.S. Government-sponsored mortgage-backed securities | 473,325 |
| | 964 |
| | 3,423 |
| | 470,866 |
|
| Corporate obligations | 31 |
| |
| |
|
| | 31 |
|
| Equity securities | 2,357 |
| |
| |
| | 2,357 |
|
| Total available for sale | 986,565 |
| | 17,896 |
| | 4,514 |
| | 999,947 |
|
| Held to maturity at December 31, 2017 | | | | | | | |
| U.S. Government-sponsored agency securities | 22,618 |
| | | | 435 |
| | 22,183 |
|
| State and municipal | 235,594 |
| | 6,295 |
| | 244 |
| | 241,645 |
|
| U.S. Government-sponsored mortgage-backed securities | 301,443 |
| | 3,341 |
| | 1,404 |
| | 303,380 |
|
| Foreign Investment | 1,000 |
| | | | | | 1,000 |
|
| Total held to maturity | 560,655 |
| | 9,636 |
| | 2,083 |
| | 568,208 |
|
| Total Investment Securities | $ | 1,547,220 |
| | $ | 27,532 |
| | $ | 6,597 |
| | $ | 1,568,155 |
|
| | | | | | | | |
| Available for sale at December 31, 2016 | | | | | | | |
| U.S. Government-sponsored agency securities | $ | 100 |
| |
|
| |
| | $ | 100 |
|
| State and municipal | 360,779 |
| | $ | 8,443 |
| | $ | 5,564 |
| | 363,658 |
|
| U.S. Government-sponsored mortgage-backed securities | 313,459 |
| | 1,904 |
| | 3,071 |
| | 312,292 |
|
| Corporate obligations | 31 |
| |
|
|
|
| | 31 |
|
| Equity securities | 21,820 |
| |
|
| 1,039 |
| | 20,781 |
|
| Total available for sale | 696,189 |
| | 10,347 |
| | 9,674 |
| | 696,862 |
|
| Held to maturity at December 31, 2016 | | | | | | | |
| U.S. Government-sponsored agency securities | 22,619 |
| | | | 479 |
| | 22,140 |
|
| State and municipal | 224,811 |
| | 3,136 |
| | 1,796 |
| | 226,151 |
|
| U.S. Government-sponsored mortgage-backed securities | 360,213 |
| | 4,956 |
| | 1,527 |
| | 363,642 |
|
| Total held to maturity | 607,643 |
| | 8,092 |
| | 3,802 |
| | 611,933 |
|
| Total Investment Securities | $ | 1,303,832 |
| | $ | 18,439 |
| | $ | 13,476 |
| | $ | 1,308,795 |
|
|
| | | | | | | | | | | | | | | | | | | | | | | |
| | Less than 12 Months |
| 12 Months or Longer |
| Total |
| | Fair
Value |
| Gross
Unrealized
Losses |
| Fair
Value |
| Gross
Unrealized
Losses |
| Fair
Value |
| Gross
Unrealized
Losses |
| Temporarily Impaired Available for Sale Securities at December 31, 2019 | |
| |
| |
| |
| |
| |
| State and municipal | $ | 76,273 |
|
| $ | 807 |
|
| $ | — |
|
| $ | — |
|
| $ | 76,273 |
|
| $ | 807 |
|
| U.S. Government-sponsored mortgage-backed securities | 127,673 |
|
| 1,326 |
|
| 20,796 |
|
| 78 |
|
| 148,469 |
|
| 1,404 |
|
| Total Temporarily Impaired Available for Sale Securities | 203,946 |
|
| 2,133 |
|
| 20,796 |
|
| 78 |
|
| 224,742 |
|
| 2,211 |
|
| Temporarily Impaired Held to Maturity Securities at December 31, 2019 | |
| |
| |
| |
| |
| |
| U.S. Government-sponsored agency securities | 3,016 |
|
| 4 |
|
| 12,467 |
|
| 33 |
|
| 15,483 |
|
| 37 |
|
| State and municipal | 22,947 |
|
| 107 |
|
| — |
|
| — |
|
| 22,947 |
|
| 107 |
|
| U.S. Government-sponsored mortgage-backed securities | 124,253 |
|
| 364 |
|
| 7,991 |
|
| 37 |
|
| 132,244 |
|
| 401 |
|
| Total Temporarily Impaired Held to Maturity Securities | 150,216 |
|
| 475 |
|
| 20,458 |
|
| 70 |
|
| $ | 170,674 |
|
| 545 |
|
| Total Temporarily Impaired Investment Securities | $ | 354,162 |
|
| $ | 2,608 |
|
| $ | 41,254 |
|
| $ | 148 |
|
| $ | 395,416 |
|
| $ | 2,756 |
|
| |
|
|
|
|
|
|
|
|
|
|
|
| | | | | | | | | | | | |
| | Less than 12 Months |
| 12 Months or Longer |
| Total |
| | Fair
Value |
| Gross
Unrealized
Losses |
| Fair
Value |
| Gross
Unrealized
Losses |
| Fair
Value |
| Gross
Unrealized
Losses |
| Temporarily Impaired Available for Sale Securities at December 31, 2018 | |
| |
| |
| |
| |
| |
| U.S. Government-sponsored agency securities | $ | 1,490 |
|
| $ | 3 |
|
| $ | — |
|
| $ | — |
|
| $ | 1,490 |
|
| $ | 3 |
|
| State and municipal | 234,431 |
|
| 3,958 |
|
| 38,028 |
|
| 1,896 |
|
| 272,459 |
|
| 5,854 |
|
| U.S. Government-sponsored mortgage-backed securities | 196,601 |
|
| 2,400 |
|
| 217,121 |
|
| 5,996 |
|
| 413,722 |
|
| 8,396 |
|
| Total Temporarily Impaired Available for Sale Securities | 432,522 |
|
| 6,361 |
|
| 255,149 |
|
| 7,892 |
|
| 687,671 |
|
| 14,253 |
|
| Temporarily Impaired Held to Maturity Securities at December 31, 2018 | |
| |
| |
| |
| |
| |
| U.S. Government-sponsored agency securities | — |
|
| — |
|
| 22,073 |
|
| 545 |
|
| 22,073 |
|
| 545 |
|
| State and municipal | 14,952 |
|
| 369 |
|
| 16,786 |
|
| 503 |
|
| 31,738 |
|
| 872 |
|
| U.S. Government-sponsored mortgage-backed securities | 102,828 |
|
| 876 |
|
| 87,268 |
|
| 2,447 |
|
| 190,096 |
|
| 3,323 |
|
| Foreign investment | — |
|
| — |
|
| 999 |
|
| 1 |
|
| 999 |
|
| 1 |
|
| Total Temporarily Impaired Held to Maturity Securities | 117,780 |
|
| 1,245 |
|
| 127,126 |
|
| 3,496 |
|
| 244,906 |
|
| 4,741 |
|
| Total Temporarily Impaired Investment Securities | $ | 550,302 |
|
| $ | 7,606 |
|
| $ | 382,275 |
|
| $ | 11,388 |
|
| $ | 932,577 |
|
| $ | 18,994 |
|
Certain investments in debt securities are reported in the financial statements at amounts less than their historical cost. The historical cost of these investments totaled $452,644,000$398,172,000 and $523,773,000$951,571,000 at December 31, 20172019 and 2016,2018, respectively. Total fair value of these investments was $446,047,000$395,416,000 and $510,297,000,$932,577,000, which was approximately 28.615.2 and 39.157.1 percent of the Corporation's available for sale and held to maturity investment portfolio at December 31, 20172019 and 2016,2018, respectively.
Except as discussed below,The Corporation's management believes the decline in fair value for these securities was temporary. Should the impairment of any of these securities become other-than-temporary, the cost basis of the investment will be reduced and the resulting loss recognized in net income during the period the OTTI is identified.
The Corporation’s management has evaluated all securities with unrealized losses for OTTI as ofand concluded no OTTI existed at December 31, 2017. The evaluations are based on the nature of the securities, the extent and duration of the loss and the intent and ability of the Corporation to hold these securities either to maturity or through the expected recovery period.2019.
In determining the fair value of the investment securities portfolio, the Corporation utilizes a third party for portfolio accounting services, including market value input, for those securities classified as Level I and Level II in the fair value hierarchy. The Corporation has obtained an understanding of what inputs are being used by the vendor in pricing the portfolio and how the vendor classified these securities based upon these inputs. From these discussions, the Corporation’s management is comfortable that the classifications are proper. The Corporation has gained trust in the data for two reasons: (a) independent spot testing of the data is conducted by the Corporation through obtaining market quotes from various brokers on a periodic basis; and (b) actual gains or loss resulting from the sale of certain securities has proven the data to be accurate over time. Fair value of securities classified as Level 3 in the valuation hierarchy was determined using a discounted cash flow model that incorporated market estimates of interest rates and volatility in markets that have not been active.
PART II: ITEM 8. FINANCIAL STATEMENTS AND SUPPLEMENTARY DATA
NOTES TO CONSOLIDATED FINANCIAL STATEMENTS
(table dollar amounts in thousands, except share data)
U.S. Government-Sponsored Mortgage-Backed Securities
The unrealized losses on the Corporation's investment in mortgage-backed securities were a result of interest rate changes. The Corporation expects to recover the amortized cost basis over the term of the securities. Because the decline in market value is attributable to changes in interest rates and not credit quality, and because the Corporation does not intend to sell the investments and it is not more likely than not that the Corporation will be required to sell the investments before recovery of their amortized cost basis, which may be maturity, the Corporation does not consider those investments to be other-than-temporarily impaired at December 31, 2017.2019. As noted in the table above, the mortgage-backed securities portfolio contains unrealized losses of $3,423,000$1,404,000 on sixty-threeNaN securities and $1,404,000$401,000 on thirty-six15 securities in the available for sale and held to maturity portfolios, respectively. All these securities are issued by a government-sponsored entity.
PART II: ITEM 8. FINANCIAL STATEMENTS AND SUPPLEMENTARY DATA
NOTES TO CONSOLIDATED FINANCIAL STATEMENTS
(table dollar amounts in thousands, except share data)
State and Municipal Securities and U.S. Government-Sponsored Agency Securities
The unrealized losses on the Corporation's investments in securities of state and political subdivisions and U.S. Government-Sponsored Agency securities were caused by interest rate increases. The contractual terms of those investments do not permit the issuer to settle the securities at a price less than the amortized cost basis of the investments. Because the Corporation does not intend to sell the investments and it is not more likely than not that the Corporation will be required to sell the investments before recovery of their amortized cost basis, which may be maturity, the Corporation does not consider those investments to be other-than-temporarily impaired at December 31, 2017.2019. As noted in the table above, the state and political subdivisionmunicipal securities portfolio contains unrealized losses of $1,091,000$807,000 on forty-twoNaN securities and $244,000$107,000 on twenty-eight18 securities in the available for sale and held to maturity portfolios, respectively. The U.S. Government-Sponsored Agency securities portfolio contains no0 unrealized lossesloses in the available for sale portfolio, and $435,000$37,000 on five3 securities in the held to maturity portfolio.
The following table shows the Corporation’s gross unrealized losses and fair value, aggregated by investment category and length of time the individual securities have been in a continuous unrealized loss position at December 31, 2017 and 2016:
|
| | | | | | | | | | | | | | | | | | | | | | | |
| | Less than 12 Months | | 12 Months or Longer | | Total |
| | Fair
Value | | Gross
Unrealized
Losses | | Fair
Value | | Gross
Unrealized
Losses | | Fair
Value | | Gross
Unrealized
Losses |
Temporarily Impaired Available for Sale Securities at December 31, 2017
| | | | | | | | | | | |
| State and municipal | $ | 13,296 |
| | $ | 198 |
| | $ | 35,324 |
| | $ | 893 |
| | $ | 48,620 |
| | $ | 1,091 |
|
| U.S. Government-sponsored mortgage-backed securities | 182,755 |
| | 1,520 |
| | 68,667 |
| | 1,903 |
| | 251,422 |
| | 3,423 |
|
| Total Temporarily Impaired Available for Sale Securities | 196,051 |
| | 1,718 |
| | 103,991 |
| | 2,796 |
| | 300,042 |
| | 4,514 |
|
| Temporarily Impaired Held to Maturity Securities at December 31, 2017 | | | | | | | | | | | |
| U.S. Government-sponsored agency securities | 9,988 |
| | 131 |
| | 12,196 |
| | 304 |
| | 22,184 |
| | 435 |
|
| State and municipal | 2,430 |
| | 36 |
| | 15,805 |
| | 208 |
| | 18,235 |
| | 244 |
|
| U.S. Government-sponsored mortgage-backed securities | 62,508 |
| | 485 |
| | 43,078 |
| | 919 |
| | 105,586 |
| | 1,404 |
|
| Total Temporarily Impaired Held to Maturity Securities | 74,926 |
| | 652 |
| | 71,079 |
| | 1,431 |
| | 146,005 |
| | 2,083 |
|
| Total Temporarily Impaired Investment Securities | $ | 270,977 |
| | $ | 2,370 |
| | $ | 175,070 |
| | $ | 4,227 |
| | $ | 446,047 |
| | $ | 6,597 |
|
| | | | | | | | | | | | |
| | | | | | | | | | | | |
| | Less than 12 Months | | 12 Months or Longer | | Total |
| | Fair
Value | | Gross
Unrealized
Losses | | Fair
Value | | Gross
Unrealized
Losses | | Fair
Value | | Gross
Unrealized
Losses |
Temporarily Impaired Available for Sale Securities at December 31, 2016
| | | | | | | | | | | |
| State and municipal | $ | 126,593 |
| | $ | 5,564 |
| |
| |
| | $ | 126,593 |
| | $ | 5,564 |
|
| U.S. Government-sponsored mortgage-backed securities | 185,544 |
| | 3,071 |
| |
| |
| | 185,544 |
| | 3,071 |
|
| Equity securities | 18,765 |
| | 1,039 |
| | | | | | 18,765 |
| | 1,039 |
|
| Total Temporarily Impaired Available for Sale Securities | 330,902 |
| | 9,674 |
| |
| |
| | 330,902 |
| | 9,674 |
|
| Temporarily Impaired Held to Maturity Securities at December 31, 2016 | | | | | | | | | | | |
| U.S. Government-sponsored agency securities | 19,121 |
| | 479 |
| | | | | | 19,121 |
| | 479 |
|
| State and municipal | 50,897 |
| | 1,796 |
| |
| |
| | 50,897 |
| | 1,796 |
|
| U.S. Government-sponsored mortgage-backed securities | 109,377 |
| | 1,527 |
| |
| |
| | 109,377 |
| | 1,527 |
|
| Total Temporarily Impaired Held to Maturity Securities | 179,395 |
| | 3,802 |
| |
| |
| | 179,395 |
| | 3,802 |
|
| Total Temporarily Impaired Investment Securities | $ | 510,297 |
| | $ | 13,476 |
| |
|
| |
|
| | $ | 510,297 |
| | $ | 13,476 |
|
PART II: ITEM 8. FINANCIAL STATEMENTS AND SUPPLEMENTARY DATA
NOTES TO CONSOLIDATED FINANCIAL STATEMENTS
(table dollar amounts in thousands, except share data)
The amortized cost and fair value of securities available for sale and held to maturity at December 31, 20172019 by contractual maturity are shown below. Expected maturities will differ from contractual maturities because issuers may have the right to call or prepay obligations with or without call or prepayment penalties.
|
| | | | | | | | | | | | | | | |
| | Available for Sale | | Held to Maturity |
| | Amortized Cost | | Fair Value | | Amortized Cost | | Fair Value |
| Maturity Distribution at December 31, 2019 | | | | | | | |
| Due in one year or less | $ | 1,134 |
| | $ | 1,136 |
| | $ | 9,920 |
| | $ | 10,105 |
|
| Due after one through five years | 5,031 |
| | 5,141 |
| | 45,197 |
| | 45,654 |
|
| Due after five through ten years | 74,745 |
| | 76,920 |
| | 84,153 |
| | 88,844 |
|
| Due after ten years | 817,161 |
| | 855,505 |
| | 231,964 |
| | 241,639 |
|
| | 898,071 |
| | 938,702 |
| | 371,234 |
| | 386,242 |
|
| U.S. Government-sponsored mortgage-backed securities | 842,349 |
| | 851,323 |
| | 434,804 |
| | 441,324 |
|
| Total Investment Securities | $ | 1,740,420 |
| | $ | 1,790,025 |
| | $ | 806,038 |
| | $ | 827,566 |
|
|
| | | | | | | | | | | | | | | |
| | Available for Sale | | Held to Maturity |
| | Amortized Cost | | Fair Value | | Amortized Cost | | Fair Value |
| Maturity Distribution at December 31, 2017 | | | | | | | |
| Due in one year or less | $ | 425 |
| | $ | 425 |
| | $ | 12,015 |
| | $ | 12,158 |
|
| Due after one through five years | 5,040 |
| | 5,204 |
| | 76,146 |
| | 76,334 |
|
| Due after five through ten years | 74,921 |
| | 78,806 |
| | 54,441 |
| | 55,679 |
|
| Due after ten years | 430,497 |
| | 442,289 |
| | 116,610 |
| | 120,657 |
|
| | 510,883 |
| | 526,724 |
| | 259,212 |
| | 264,828 |
|
| U.S. Government-sponsored mortgage-backed securities | 473,325 |
| | 470,866 |
| | 301,443 |
| | 303,380 |
|
| Equity securities | 2,357 |
| | 2,357 |
| |
| |
|
| Total Investment Securities | $ | 986,565 |
| | $ | 999,947 |
| | $ | 560,655 |
| | $ | 568,208 |
|
Securities with a carrying value of approximately $475,999,000, $572,896,000$503,427,000, $416,155,000 and $637,358,000$475,999,000 were pledged at December 31, 2017, 20162019, 2018 and 2015,2017, respectively, to secure certain deposits and securities sold under repurchase agreements, and for other purposes as permitted or required by law.
The book value of securities sold under agreements to repurchase amounted to $136,639,000$182,856,000 at December 31, 2017,2019, and $145,936,000$116,691,000 at
December 31, 2016.2018.
Gross gains of $2,681,000, $3,389,000 and $2,770,000 were realizedlosses on sales of investment securities in 2017, 2016 and 2015, respectively. Gross losses of $50,000 and $100,000 were realized on sales of investment securities in 2017 and 2015, respectively. There were no losses from the sales and redemptions of investmentavailable for sale securities in 2016.for the for the years indicated are shown below.
|
| | | | | | | | | | | |
| 2019 |
| 2018 |
| 2017 |
| Sales and Redemptions of Available for Sale Securities: | |
| |
|
|
| Gross gains | $ | 4,415 |
|
| $ | 4,269 |
|
| $ | 2,681 |
|
| Gross losses | — |
|
| — |
|
| 50 |
|
NOTE 5
LOANS AND ALLOWANCE
The Corporation's primary lending focus is small business and middle market commercial, commercial real estate and residential real estate, which results in portfolio diversification. The following tables show the composition of the loan portfolio, the allowance for loan losses and credit quality characteristics by collateral classification, excluding loans held for sale. Loans held for sale at December 31, 20172019 and 2016,2018, were $7,216,000$9,037,000 and $2,929,000,$4,778,000, respectively.
PART II: ITEM 8. FINANCIAL STATEMENTS AND SUPPLEMENTARY DATA
NOTES TO CONSOLIDATED FINANCIAL STATEMENTS
(table dollar amounts in thousands, except share data)
The following table illustrates the composition of the Corporation’s loan portfolio by loan class for the years indicated:
|
| | | | | | | |
| December 31, 2019 |
| December 31, 2018 |
| |
| |
| Commercial and industrial loans | $ | 2,109,879 |
|
| $ | 1,726,664 |
|
| Agricultural production financing and other loans to farmers | 93,861 |
|
| 92,404 |
|
| Real estate loans: |
|
|
|
| Construction | 787,568 |
|
| 545,729 |
|
| Commercial and farmland | 3,052,698 |
|
| 2,832,102 |
|
| Residential | 1,143,217 |
|
| 966,421 |
|
| Home equity | 588,984 |
|
| 528,157 |
|
| Individuals' loans for household and other personal expenditures | 135,989 |
|
| 99,788 |
|
| Public finance and other commercial loans | 547,114 |
|
| 433,202 |
|
| Loans | 8,459,310 |
|
| 7,224,467 |
|
| Allowance for loan losses | (80,284 | ) |
| (80,552 | ) |
| Net Loans | $ | 8,379,026 |
|
| $ | 7,143,915 |
|
|
| | | | | | | |
| December 31, 2017 |
| December 31, 2016 |
| |
| |
| Commercial and industrial loans | $ | 1,493,493 |
|
| $ | 1,194,646 |
|
| Agricultural production financing and other loans to farmers | 121,757 |
|
| 79,689 |
|
| Real estate loans: |
|
|
|
| Construction | 612,219 |
|
| 418,703 |
|
| Commercial and farmland | 2,562,691 |
|
| 1,953,062 |
|
| Residential | 962,765 |
|
| 739,169 |
|
| Home equity | 514,021 |
|
| 418,525 |
|
| Individuals' loans for household and other personal expenditures | 86,935 |
|
| 77,479 |
|
| Lease financing receivables, net of unearned income | 2,527 |
|
| 311 |
|
| Other commercial loans | 394,791 |
|
| 258,061 |
|
| Loans | 6,751,199 |
|
| 5,139,645 |
|
| Allowance for loan losses | (75,032 | ) |
| (66,037 | ) |
| Net Loans | $ | 6,676,167 |
|
| $ | 5,073,608 |
|
Allowance, Credit Quality and Loan Portfolio
The Corporation maintains an allowance for loan losses to cover probable credit losses identified during its loan review process. Management believes that the allowance for loan losses is adequate to cover probable losses inherent in the loan portfolio at December 31, 2017.2019. The process for determining the adequacy of the allowance for loan losses is critical to the Corporation’s financial results. It requires management to make difficult, subjective and complex judgments to estimate the effect of uncertain matters. The allowance for loan losses considers current factors, including economic conditions and ongoing internal and external examinations, and will increase or decrease as deemed necessary to ensure it remains adequate. In addition, the allowance as a percentage of charge-offs and nonperforming loans will change at different points in time based on credit performance, portfolio mix and collateral values.
PART II: ITEM 8. FINANCIAL STATEMENTS AND SUPPLEMENTARY DATA
NOTES TO CONSOLIDATED FINANCIAL STATEMENTS
(table dollar amounts in thousands, except share data)
The allowance for loan losses is maintained through the provision for loan losses, which is a charge against earnings. The allowance is increased by provision expense and decreased by charge-offs less recoveries. All charge-offs are approved by the Bank's senior credit officers and in accordance with established policies. The Bank charges off a loan when a determination is made that all or a portion of the loan is uncollectible. The amount provided for loan losses in a given period may be greater than or less than net loan losses experienced during the period, and is based on management’s judgment as to the appropriate level of the allowance for loan losses. The determination of the provision amount is based on management’s ongoing review and evaluation of the loan portfolio, including an internally administered loan "watch" list and independent loan reviews. The evaluation takes into consideration identified credit problems, the possibility of losses inherent in the loan portfolio that are not specifically identified and management’s judgment as to the impact of the current environment and economic conditions on the portfolio.
The allowance consists of specific impairment reserves as required by ASC 310-10-35, a component for historical losses in accordance with ASC 450 and the consideration of current environmental factors in accordance with ASC 450. A loan is deemed impaired when, based on current information or events, it is probable that all amounts due of principal and interest according to the contractual terms of the loan agreement will not be collected.
The historical loss allocation for loans not deemed impaired according to ASC 450 is the product of the volume of loans within the non-impaired criticized and non-criticized risk grade classifications, each segmented by call code, and the historical loss factor for each respective classification and call code segment. The historical loss factors are based upon actual loss experience within each risk and call code classification. The historical look back period for non-criticized loans looks to the most recent rolling-four-quarter average and aligns with the look back period for non-impaired criticized loans. Each of the rolling four quarter periods used to obtain the average, include all charge-offs for the previous twelve-month period, therefore the historical look back period includes seven quarters. The resulting allocation is reflective of current conditions. Criticized loans are grouped based on the risk grade assigned to the loan. Loans with a special mention grade are assigned a loss factor, and loans with a classified grade but not impaired are assigned a separate loss factor. The loss factor computation for this allocation includes a segmented historical loss migration analysis of risk grades to charge-off.
In addition to the specific reserves and historical loss components of the allowance, consideration is given to various environmental factors to ensure that losses inherent in the portfolio are reflected in the allowance for loan losses. The environmental component adjusts the historical loss allocations for non-impaired loans to reflect relevant current conditions that, in management's opinion, have an impact on loss recognition. Environmental factors that management reviews in the analysis include: national and local economic trends and conditions; trends in growth in the loan portfolio and growth in higher risk areas; levels of, and trends in, delinquencies and non-accruals; experience and depth of lending management and staff; adequacy of, and adherence to, lending policies and procedures including those for underwriting; industry concentrations of credit; and adequacy of risk identification systems and controls through the internal loan review and internal audit processes.
In conformance with ASC 805 and ASC 820, loans purchased after December 31, 2008 are recorded at the acquisition date fair value. Such loans are included in the allowance to the extent a specific impairment is identified that exceeds the fair value adjustment on an impaired loan or the historical loss and environmental factor analysis indicates losses inherent in a purchased portfolio exceeds the fair value adjustment on the portion of the purchased portfolio not deemed impaired.
PART II: ITEM 8. FINANCIAL STATEMENTS AND SUPPLEMENTARY DATA
NOTES TO CONSOLIDATED FINANCIAL STATEMENTS
(table dollar amounts in thousands, except share data)
At December 31, 2017,2019, the allowance for loan losses was $75,032,000, an increase$80,284,000, a decrease of $8,995,000$268,000 from the December 31, 20162018 balance of $66,037,000.$80,552,000. Net charge-offs for the twelve months ended December 31, 2017,2019, were $148,000, a decrease$3,068,000, an increase of $1,925,000$1,361,000 from the same period in 2016.2018. The provision for loan losses for the twelve months ended December 31, 20172019 was $9,143,000, an increase$2,800,000, a decrease of $3,486,000$4,427,000 from the same period in 2016.2018. The determination of the provision for loan losses in any period is based on management’s continuing review and evaluation of the loan portfolio, and its judgment as to the impact of current economic conditions on the portfolio.
The following tables summarize changes in the allowance for loan losses by loan segment for the twelve months ended December 31, 2017, 2016,2019, 2018, and 2015:2017: | | | | Twelve Months Ended December 31, 2017 | Twelve Months Ended December 31, 2019 |
| | Commercial |
| Commercial Real Estate |
| Consumer |
| Residential |
| Finance
Leases |
| Total | Commercial |
| Commercial Real Estate |
| Consumer |
| Residential |
| Total |
| Allowance for loan losses: | |
| |
| |
| |
| |
| | |
| |
| |
| |
| |
| Balances, December 31, 2016 | $ | 27,696 |
|
| $ | 23,661 |
|
| $ | 2,923 |
|
| $ | 11,755 |
|
| $ | 2 |
|
| $ | 66,037 |
| |
| Balances, December 31, 2018 | | $ | 32,657 |
|
| $ | 29,609 |
|
| $ | 3,964 |
|
| $ | 14,322 |
|
| $ | 80,552 |
|
| Provision for losses | 2,515 |
|
| 3,159 |
|
| 1,078 |
|
| 2,391 |
|
|
|
|
| 9,143 |
| 733 |
|
| 1,555 |
|
| 239 |
|
| 273 |
|
| 2,800 |
|
| Recoveries on loans | 1,590 |
|
| 2,260 |
|
| 324 |
|
| 706 |
|
|
|
|
| 4,880 |
| 1,244 |
|
| 1,289 |
|
| 401 |
|
| 619 |
|
| 3,553 |
|
| Loans charged off | (1,383 | ) |
| (1,737 | ) |
| (593 | ) |
| (1,315 | ) |
|
|
|
| (5,028 | ) | (1,732 | ) |
| (3,675 | ) |
| (569 | ) |
| (645 | ) |
| (6,621 | ) |
| Balances, December 31, 2017 | $ | 30,418 |
|
| $ | 27,343 |
|
| $ | 3,732 |
|
| $ | 13,537 |
|
| $ | 2 |
|
| $ | 75,032 |
| |
| Balances, December 31, 2019 | | $ | 32,902 |
|
| $ | 28,778 |
|
| $ | 4,035 |
|
| $ | 14,569 |
|
| $ | 80,284 |
|
| | | | Twelve Months Ended December 31, 2016 | Twelve Months Ended December 31, 2018 |
| | Commercial |
| Commercial Real Estate |
| Consumer |
| Residential |
| Finance
Leases |
| Total | Commercial |
| Commercial Real Estate |
| Consumer |
| Residential |
| Total |
| Allowance for loan losses: | |
| |
| |
| |
| |
| | |
| |
| |
| |
| |
| Balances, December 31, 2015 | $ | 26,478 |
|
| $ | 22,145 |
|
| $ | 2,689 |
|
| $ | 11,139 |
|
| $ | 2 |
|
| $ | 62,453 |
| |
| Balances, December 31, 2017 | | $ | 30,420 |
|
| $ | 27,343 |
|
| $ | 3,732 |
|
| $ | 13,537 |
|
| $ | 75,032 |
|
| Provision for losses | 1,876 |
|
| 1,834 |
|
| 432 |
|
| 1,515 |
|
|
|
|
| 5,657 |
| 2,097 |
|
| 2,482 |
|
| 679 |
|
| 1,969 |
|
| 7,227 |
|
| Recoveries on loans | 1,806 |
|
| 2,090 |
|
| 369 |
|
| 1,091 |
|
|
|
|
| 5,356 |
| 2,456 |
|
| 2,525 |
|
| 302 |
|
| 993 |
|
| 6,276 |
|
| Loans charged off | (2,464 | ) |
| (2,408 | ) |
| (567 | ) |
| (1,990 | ) |
|
|
|
| (7,429 | ) | (2,316 | ) |
| (2,741 | ) |
| (749 | ) |
| (2,177 | ) |
| (7,983 | ) |
| Balances, December 31, 2016 | $ | 27,696 |
|
| $ | 23,661 |
|
| $ | 2,923 |
|
| $ | 11,755 |
|
| $ | 2 |
|
| $ | 66,037 |
| |
| Balances, December 31, 2018 | | $ | 32,657 |
|
| $ | 29,609 |
|
| $ | 3,964 |
|
| $ | 14,322 |
|
| $ | 80,552 |
|
|
| | | | | | | | | | | | | | | | | | | |
| | Twelve Months Ended December 31, 2017 |
| | Commercial |
| Commercial Real Estate |
| Consumer |
| Residential |
| Total |
| Allowance for loan losses: | |
| |
| |
| |
| |
| Balances, December 31, 2016 | $ | 27,698 |
|
| $ | 23,661 |
|
| $ | 2,923 |
|
| $ | 11,755 |
|
| $ | 66,037 |
|
| Provision for losses | 2,515 |
|
| 3,159 |
|
| 1,078 |
|
| 2,391 |
|
| 9,143 |
|
| Recoveries on loans | 1,590 |
|
| 2,260 |
|
| 324 |
|
| 706 |
|
| 4,880 |
|
| Loans charged off | (1,383 | ) |
| (1,737 | ) |
| (593 | ) |
| (1,315 | ) |
| (5,028 | ) |
| Balances, December 31, 2017 | $ | 30,420 |
|
| $ | 27,343 |
|
| $ | 3,732 |
|
| $ | 13,537 |
|
| $ | 75,032 |
|
PART II: ITEM 8. FINANCIAL STATEMENTS AND SUPPLEMENTARY DATA
NOTES TO CONSOLIDATED FINANCIAL STATEMENTS
(table dollar amounts in thousands, except share data)
|
| | | | | | | | | | | | | | | | | | | | | | | |
| | Twelve Months Ended December 31, 2015 |
| | Commercial |
| Commercial Real Estate |
| Consumer |
| Residential |
| Finance
Leases |
| Total |
| Allowance for loan losses: | |
| |
| |
| |
| |
| |
| Balances, December 31, 2014 | $ | 28,824 |
|
| $ | 19,327 |
|
| $ | 2,658 |
|
| $ | 13,152 |
|
| $ | 3 |
|
| $ | 63,964 |
|
| Provision for losses | (1,901 | ) |
| 1,710 |
|
| 299 |
|
| 310 |
|
| $ | (1 | ) |
| 417 |
|
| Recoveries on loans | 1,911 |
|
| 2,545 |
|
| 352 |
|
| 1,536 |
|
|
|
|
| 6,344 |
|
| Loans charged off | (2,356 | ) |
| (1,437 | ) |
| (620 | ) |
| (3,859 | ) |
|
|
|
| (8,272 | ) |
| Balances, December 31, 2015 | $ | 26,478 |
|
| $ | 22,145 |
|
| $ | 2,689 |
|
| $ | 11,139 |
|
| $ | 2 |
|
| $ | 62,453 |
|
The following tables below show the Corporation’s allowance for loan losses and loan portfolio by loan segment for the years indicated:indicated.
| |
| December 31, 2017 | December 31, 2019 |
| | Commercial |
| Commercial
Real Estate |
| Consumer |
| Residential |
| Finance
Leases |
| Total | Commercial |
| Commercial
Real Estate |
| Consumer |
| Residential |
| Total |
| Allowance balances: | |
| |
| |
| |
| |
| | |
| |
| |
| |
| |
| Individually evaluated for impairment | $ | 666 |
|
| $ | 567 |
|
|
|
|
| $ | 404 |
|
|
|
| $ | 1,637 |
| $ | — |
|
| $ | 231 |
|
| $ | — |
|
| $ | 458 |
|
| $ | 689 |
|
| Collectively evaluated for impairment | 29,752 |
|
| 26,776 |
|
| $ | 3,732 |
|
| 13,133 |
|
| $ | 2 |
|
| 73,395 |
| 32,902 |
|
| 28,547 |
|
| 4,035 |
|
| 14,111 |
|
| 79,595 |
|
| Total Allowance for Loan Losses | $ | 30,418 |
|
| $ | 27,343 |
|
| $ | 3,732 |
|
| $ | 13,537 |
|
| $ | 2 |
|
| $ | 75,032 |
| |
| Total allowance for loan losses | | $ | 32,902 |
|
| $ | 28,778 |
|
| $ | 4,035 |
|
| $ | 14,569 |
|
| $ | 80,284 |
|
| Loan balances: | |
| |
| |
| |
| |
| | |
| |
| |
| |
| |
| Individually evaluated for impairment | $ | 4,776 |
|
| $ | 21,009 |
|
| $ | 5 |
|
| $ | 3,941 |
|
|
|
| $ | 29,731 |
| $ | 457 |
|
| $ | 8,728 |
|
| $ | 4 |
|
| $ | 2,520 |
|
| $ | 11,709 |
|
| Collectively evaluated for impairment | 2,003,844 |
|
| 3,131,589 |
|
| 86,930 |
|
| 1,471,309 |
|
| $ | 2,527 |
|
| 6,696,199 |
| 2,748,681 |
|
| 3,821,660 |
|
| 135,985 |
|
| 1,727,966 |
|
| 8,434,292 |
|
| Loans acquired with deteriorated credit quality | 1,421 |
|
| 22,312 |
|
|
|
|
| 1,536 |
|
|
|
|
| 25,269 |
| 1,716 |
|
| 9,878 |
|
| — |
|
| 1,715 |
|
| 13,309 |
|
| Loans | $ | 2,010,041 |
|
| $ | 3,174,910 |
|
| $ | 86,935 |
|
| $ | 1,476,786 |
|
| $ | 2,527 |
|
| $ | 6,751,199 |
| $ | 2,750,854 |
|
| $ | 3,840,266 |
|
| $ | 135,989 |
|
| $ | 1,732,201 |
|
| $ | 8,459,310 |
|
|
| | | | | | | | | | | | | | | | | | | |
| December 31, 2018 |
| Commercial |
| Commercial
Real Estate |
| Consumer |
| Residential |
| Total |
| Allowance balances: | |
| |
| |
| |
| |
| Individually evaluated for impairment | $ | — |
|
| $ | 1,435 |
|
| $ | 1 |
|
| $ | 436 |
|
| $ | 1,872 |
|
| Collectively evaluated for impairment | 32,657 |
|
| 28,174 |
|
| 3,963 |
|
| 13,886 |
|
| 78,680 |
|
| Total allowance for loan losses | $ | 32,657 |
|
| $ | 29,609 |
|
| $ | 3,964 |
|
| $ | 14,322 |
|
| $ | 80,552 |
|
| Loan balances: | |
| |
| |
| |
| |
| Individually evaluated for impairment | $ | 1,838 |
|
| $ | 17,756 |
|
| $ | 18 |
|
| $ | 2,413 |
|
| $ | 22,025 |
|
| Collectively evaluated for impairment | 2,248,330 |
|
| 3,347,686 |
|
| 99,770 |
|
| 1,490,872 |
|
| 7,186,658 |
|
| Loans acquired with deteriorated credit quality | 2,102 |
|
| 12,389 |
|
| — |
|
| 1,293 |
|
| 15,784 |
|
| Loans | $ | 2,252,270 |
|
| $ | 3,377,831 |
|
| $ | 99,788 |
|
| $ | 1,494,578 |
|
| $ | 7,224,467 |
|
|
| | | | | | | | | | | | | | | | | | | | | | | |
| December 31, 2016 |
| Commercial |
| Commercial
Real Estate |
| Consumer |
| Residential |
| Finance
Leases |
| Total |
| Allowance balances: | |
| |
| |
| |
| |
| |
| Individually evaluated for impairment | $ | 37 |
|
| $ | 553 |
|
|
|
|
| $ | 298 |
|
|
|
| $ | 888 |
|
| Collectively evaluated for impairment | 27,659 |
|
| 23,108 |
|
| $ | 2,923 |
|
| 11,457 |
|
| $ | 2 |
|
| 65,149 |
|
| Total Allowance for Loan Losses | $ | 27,696 |
|
| $ | 23,661 |
|
| $ | 2,923 |
|
| $ | 11,755 |
|
| $ | 2 |
|
| $ | 66,037 |
|
| Loan balances: | |
| |
| |
| |
| |
| |
| Individually evaluated for impairment | $ | 4,762 |
|
| $ | 21,358 |
|
| $ | 9 |
|
| $ | 4,450 |
|
|
|
| $ | 30,579 |
|
| Collectively evaluated for impairment | 1,520,981 |
|
| 2,315,686 |
|
| 77,470 |
|
| 1,151,396 |
|
| $ | 311 |
|
| 5,065,844 |
|
| Loans acquired with deteriorated credit quality | 6,653 |
|
| 34,721 |
|
|
|
|
| 1,848 |
|
|
|
|
| 43,222 |
|
| Loans | $ | 1,532,396 |
|
| $ | 2,371,765 |
|
| $ | 77,479 |
|
| $ | 1,157,694 |
|
| $ | 311 |
|
| $ | 5,139,645 |
|
Loans individually evaluated for impairment are comprised of commercial and consumer loans deemed impaired in accordance with ASC 310-10. This includes loans acquired with subsequent deterioration of credit quality totaling $2,819,000 with $124,000 of related allowance for loan losses at December 31, 2019 and $1,541,000 with 0 related allowance for loan losses at December 31, 2018.
The risk characteristics of the Corporation’s material portfolio segments are as follows:
Commercial
Commercial lending is primarily based on the identified cash flows of the borrower and secondarily on the underlying collateral provided by the borrower. The cash flows of borrowers, however, may not be as expected and the collateral securing these loans may fluctuate in value. Most commercial loans are secured by the tangible assets being financed such as equipment or real estate or other business assets such as accounts receivable or inventory and may incorporate a personal guarantee. Other loans may be unsecured, secured but under-collateralized or otherwise made on the basis of the enterprise value of an organization. In the case of loans secured by accounts receivable, the availability of funds for the repayment of these loans may be substantially dependent on the ability of the borrower to collect amounts due from its customers.
Commercial real estate
These loans are viewed primarily as cash flow loans and secondarily as loans secured by real estate. Commercial real estate lending typically involves higher loan principal amounts and the repayment of these loans is generally dependent on the successful operation of the property securing the loan or the business conducted on the property securing the loan. Commercial real estate loans may be more adversely affected by conditions in the real estate markets or in the general economy. Management monitors and evaluates commercial real estate loans based on collateral and risk grade criteria. In addition, management tracks the level of owner-occupied commercial real estate loans versus non-owner occupied loans.
PART II: ITEM 8. FINANCIAL STATEMENTS AND SUPPLEMENTARY DATA
NOTES TO CONSOLIDATED FINANCIAL STATEMENTS
(table dollar amounts in thousands, except share data)
Consumer and Residential
With respect to residential loans that are secured by 1-4 family residences, andwhich are typically owner occupied, the Corporation generally establishes a maximum loan-to-value ratio and requires private mortgage insurance if that ratio is exceeded. Home equity loans are secured by a subordinate interest in 1-4 family residences, and consumer loans are secured by consumer assets such as automobiles or recreational vehicles. Some consumer loans, are unsecured such as small installment loans and certain lines of credit.credit, are unsecured. Repayment of these loans is primarily dependent on the personal income and credit rating of the borrowers, which can be impacted by economic conditions in their market areas such as unemployment levels. Repayment on loans secured by 1-4 family residences can be impacted by changes in property values. Risk is mitigated by the fact that the loans are of smaller individual amounts and spread over a large number of borrowers.
Loans are reclassified to a non-accruing status when, in management’s judgment, the collateral value and financial condition of the borrower do not justify accruing interest. When the interest accrual is discontinued, all unpaid accrued interest is reversed against earnings when considered uncollectible. Payments subsequently received on non-accrual loans are applied to principal. A loan is returned to accrual status when principal and interest are no longer past due and collectability is probable, typically after a minimum of six consecutive months of performance. Payments received on impaired accruing or delinquent loans are applied to interest income as accrued.
The following table summarizes the Corporation’s non-accrual loans by loan class for the years indicated:
|
| | | | | | | |
| December 31, 2019 |
| December 31, 2018 |
| Commercial and industrial loans | $ | 1,255 |
|
| $ | 1,803 |
|
| Agriculture production financing and other loans to farmers | 183 |
| | 679 |
|
| Real estate loans: |
|
|
| |
| Construction | 977 |
|
| 8,667 |
|
| Commercial and farmland | 7,007 |
|
| 8,156 |
|
| Residential | 5,062 |
|
| 4,966 |
|
| Home equity | 1,421 |
|
| 1,481 |
|
| Individuals' loans for household and other personal expenditures | 44 |
|
| 42 |
|
| Public Finance and other commercial loans | — |
|
| 354 |
|
| Total | $ | 15,949 |
|
| $ | 26,148 |
|
|
| | | | | | | |
| December 31, 2017 |
| December 31, 2016 |
| Commercial and industrial loans | $ | 3,275 |
|
| $ | 1,839 |
|
| Agriculture production financing and other loans to farmers | 1,027 |
| | 1,329 |
|
| Real estate loans: |
|
|
| |
| Construction | 65 |
|
| 73 |
|
| Commercial and farmland | 12,951 |
|
| 15,754 |
|
| Residential | 9,444 |
|
| 9,523 |
|
| Home equity | 1,928 |
|
| 1,457 |
|
| Individuals' loans for household and other personal expenditures | 34 |
|
| 23 |
|
| Total | $ | 28,724 |
|
| $ | 29,998 |
|
Commercial impairedImpaired loans include non-accrual loans loans accounted for under ASC 310-30, and loans risk graded as substandard, doubtful and loss that were still accruing but deemed impaired according to the guidance set forth in ASC 310. Also included in impaired310-10. Commercial loans are accruingunder $500,000 and
consumer loans, that are contractually past due 90 days or more andwith the exception of troubled debt restructures.restructures, are not individually evaluated for impairment.
Allowable methods for determining the amount of impairment include estimating fair value using the fair value of the collateral for collateral dependent loans. If the impaired loan is identified as collateral dependent, then the fair value method for measuring the amount of impairment is utilized. This method requires obtaining a current independent appraisal of the collateral and applying a discount factor, which includes selling costs if applicable, to the value. The fair value of real estate is generally based on appraisals by qualified licensed appraisers. The appraisers typically determine the value of the real estate by utilizing an income or market valuation approach. If an appraisal is not available, the fair value may be determined by using a cash flow analysis. Fair value on other collateral such as business assets is typically ascertained by assessing, either singularly or some combination of, asset appraisals, accounts receivable aging reports, inventory listings andor customer financial statements. Both appraised values and values based on borrower’s financial information are discounted as considered appropriate based on age and quality of the information and current market conditions.
The following tables show the composition of the Corporation’s commercial impaired loans, related allowance and interest income recognized while impaired by loan class for the years indicated:
|
| | | | | | | | | | | | | | | | | | | |
| | December 31, 2017 |
| | Unpaid Principal
Balance |
| Recorded
Investment |
| Related
Allowance |
| Average Recorded Investment |
| Interest Income Recognized |
| Impaired loans with no related allowance: | |
| |
| |
| |
| |
| Commercial and industrial loans | $ | 14,110 |
|
| $ | 3,850 |
|
| |
| $ | 7,653 |
|
| $ | 186 |
|
| Agriculture production financing and other loans to farmers | 1,595 |
|
| 1,238 |
|
| |
| 1,304 |
|
| 20 |
|
| Real estate loans: | |
| |
| |
| |
| |
| Construction | 2,530 |
|
| 1,396 |
|
| |
| 1,420 |
|
| 64 |
|
| Commercial and farmland | 51,829 |
|
| 39,651 |
|
| |
| 43,445 |
|
| 1,734 |
|
| Residential | 5,403 |
|
| 3,133 |
|
| |
| 3,558 |
|
| 122 |
|
| Home equity | 80 |
|
| 40 |
|
| |
| 48 |
|
|
|
|
| Total | $ | 75,547 |
|
| $ | 49,308 |
|
| |
|
| $ | 57,428 |
|
| $ | 2,126 |
|
| Impaired loans with related allowance: | |
| |
| |
| |
| |
| Commercial and industrial loans | $ | 812 |
|
| $ | 782 |
|
| $ | 552 |
|
| $ | 1,517 |
|
|
|
|
| Agriculture production financing and other loans to farmers | 357 |
|
| 327 |
|
| 114 |
|
| 327 |
|
|
|
|
| Real estate loans: | |
| |
| |
| |
| |
| Commercial and farmland | 2,989 |
|
| 2,270 |
|
| 567 |
|
| 2,383 |
|
| $ | 4 |
|
| Total | $ | 4,158 |
|
| $ | 3,379 |
|
| $ | 1,233 |
|
| $ | 4,227 |
|
| $ | 4 |
|
| Total Impaired Loans | $ | 79,705 |
|
| $ | 52,687 |
|
| $ | 1,233 |
|
| $ | 61,655 |
|
| $ | 2,130 |
|
PART II: ITEM 8. FINANCIAL STATEMENTS AND SUPPLEMENTARY DATA
NOTES TO CONSOLIDATED FINANCIAL STATEMENTS
(table dollar amounts in thousands, except share data)
The following tables show the composition of the Corporation’s impaired loans, related allowance and interest income recognized while impaired by loan class for the years indicated:
| | | | December 31, 2016 | December 31, 2019 |
| | Unpaid Principal
Balance | | Recorded
Investment | | Related
Allowance | | Average Recorded Investment | | Interest Income Recognized | Unpaid Principal
Balance |
| Recorded
Investment |
| Related
Allowance |
| Average Recorded Investment |
| Interest Income Recognized |
| Impaired loans with no related allowance: | |
| |
| |
| |
| | |
| |
| |
| |
| |
| Commercial and industrial loans | $ | 17,645 |
|
| $ | 10,074 |
|
| |
|
| $ | 13,393 |
|
| $ | 499 |
| $ | 320 |
|
| $ | 320 |
|
| $ | — |
|
| $ | 320 |
|
| $ | — |
|
| Agriculture production financing and other loans to farmers | 757 |
|
| 680 |
|
| |
|
| 750 |
|
| 3 |
| 299 |
|
| 137 |
|
| — |
|
| 298 |
|
| — |
|
| Real estate loans: | | | | | | | | | |
|
|
|
|
|
|
|
|
|
| Construction | 5,946 |
|
| 3,178 |
|
| |
| 3,255 |
|
| 258 |
| 1,206 |
|
| 970 |
|
| — |
|
| 1,229 |
|
| — |
|
| Commercial and farmland | 67,936 |
|
| 49,731 |
|
| |
| 51,740 |
|
| 2,978 |
| 8,037 |
|
| 5,849 |
|
| — |
|
| 6,000 |
|
| 156 |
|
| Residential | 8,039 |
|
| 4,664 |
|
| |
| 5,410 |
|
| 167 |
| 93 |
|
| 76 |
|
| — |
|
| 77 |
|
| 3 |
|
| Home equity | 82 |
|
| 44 |
|
| |
| 44 |
|
|
|
| |
| Other commercial loans | 11 |
|
|
|
|
| |
|
|
|
|
| |
| Total | $ | 100,416 |
|
| $ | 68,371 |
|
|
|
| $ | 74,592 |
|
| $ | 3,905 |
| $ | 9,955 |
|
| $ | 7,352 |
|
| $ | — |
|
| $ | 7,924 |
|
| $ | 159 |
|
| Impaired loans with related allowance: | |
| |
| |
| |
| | |
| |
| |
| |
| |
| Agriculture production financing and other loans to farmers | $ | 660 |
| | $ | 660 |
| | $ | 36 |
| | $ | 691 |
| |
|
| |
| Real estate loans: | |
| |
| |
| |
| |
|
|
|
|
|
|
|
|
|
| Commercial and farmland | 4,238 |
|
| 2,985 |
|
| 553 |
|
| 2,989 |
|
|
|
| $ | 2,648 |
|
| $ | 1,909 |
|
| $ | 231 |
|
| $ | 1,909 |
|
| $ | — |
|
| Residential | 65 |
|
| 34 |
|
| 23 |
|
| 38 |
|
|
|
| 2,070 |
|
| 2,044 |
|
| 383 |
|
| 2,083 |
|
| 63 |
|
| Home equity | | 417 |
|
| 400 |
|
| 75 |
|
| 409 |
|
| 12 |
|
| Individuals' loans for household and other personal expenditures | | 4 |
|
| 4 |
|
| — |
|
| 4 |
|
| $ | — |
|
| Total | $ | 4,963 |
|
| $ | 3,679 |
|
| $ | 612 |
|
| $ | 3,718 |
|
|
|
| $ | 5,139 |
|
| $ | 4,357 |
|
| $ | 689 |
|
| $ | 4,405 |
|
| $ | 75 |
|
| Total Impaired Loans | $ | 105,379 |
|
| $ | 72,050 |
|
| $ | 612 |
|
| $ | 78,310 |
|
| $ | 3,905 |
| $ | 15,094 |
|
| $ | 11,709 |
|
| $ | 689 |
|
| $ | 12,329 |
|
| $ | 234 |
|
| | | | December 31, 2015 | December 31, 2018 |
| | Unpaid Principal
Balance |
| Recorded
Investment |
| Related
Allowance |
| Average Recorded Investment |
| Interest Income Recognized | Unpaid Principal
Balance | | Recorded
Investment | | Related
Allowance | | Average Recorded Investment | | Interest Income Recognized |
| Impaired loans with no related allowance: | |
| |
| |
| |
| | |
| |
| |
| |
| |
| Commercial and industrial loans | $ | 22,151 |
|
| $ | 11,669 |
|
| |
| $ | 12,578 |
|
| $ | 488 |
| $ | 828 |
|
| $ | 806 |
|
| $ | — |
|
| $ | 833 |
|
| $ | — |
|
| Agriculture production financing and other loans to farmers | 370 |
|
| 361 |
|
| |
| 439 |
|
| | 679 |
|
| 679 |
|
| — |
|
| 679 |
|
| — |
|
| Real estate loans: |
|
|
|
|
|
|
|
|
| | | | | | | | | |
| Construction | 4,551 |
|
| 2,336 |
|
| |
| 3,662 |
|
| 157 |
| 1,352 |
|
| 614 |
|
| — |
|
| 835 |
|
| — |
|
| Commercial and farmland | 95,930 |
|
| 69,024 |
|
| |
| 71,569 |
|
| 3,328 |
| 11,176 |
|
| 8,994 |
|
| — |
|
| 12,975 |
|
| 165 |
|
| Residential | 11,262 |
|
| 7,338 |
|
| |
| 7,926 |
|
| 244 |
| 118 |
|
| 100 |
|
| — |
|
| 101 |
|
| 3 |
|
| Home equity | 297 |
|
| 247 |
|
| |
| 249 |
|
|
|
| 49 |
|
| 48 |
|
| — |
|
| 48 |
|
| — |
|
| Other commercial loans | 20 |
|
|
|
|
| |
|
|
|
|
| |
| Public finance and other commercial loans | | 353 |
|
| 353 |
|
| — |
|
| 353 |
|
| — |
|
| Total | $ | 134,581 |
|
| $ | 90,975 |
|
| |
| $ | 96,423 |
|
| $ | 4,217 |
| $ | 14,555 |
|
| $ | 11,594 |
|
| $ | — |
|
| $ | 15,824 |
|
| $ | 168 |
|
| Impaired loans with related allowance: | |
| |
| |
| |
| |
|
|
|
|
|
|
|
|
|
| Commercial and industrial loans | $ | 3,043 |
|
| $ | 2,690 |
|
| $ | 1,247 |
|
| $ | 2,752 |
|
| $ | 38 |
| |
| Agriculture production financing and other loans to farmers | 466 |
| 466 |
| 30 |
| 538 |
|
| |
| Real estate loans: | |
| |
| |
| |
| |
|
|
|
|
|
|
|
|
|
| Construction | | $ | 7,978 |
|
| $ | 7,977 |
|
| $ | 1,429 |
|
| $ | 7,977 |
|
| $ | — |
|
| Commercial and farmland | 2,144 |
|
| 1,933 |
|
| 392 |
|
| 1,868 |
|
|
|
| 171 |
|
| 171 |
|
| 6 |
|
| 171 |
|
| — |
|
| Residential | 2,300 |
|
| 1,463 |
|
| 173 |
|
| 1,787 |
|
|
|
| 1,958 |
|
| 1,907 |
|
| 362 |
|
| 1,915 |
|
| 57 |
|
| Home equity | | 376 |
|
| 358 |
|
| 74 |
|
| 365 |
|
| 10 |
|
| Individuals' loans for household and other personal expenditures | | 18 |
|
| 18 |
|
| 1 |
|
| 20 |
|
| 1 |
|
| Total | $ | 7,953 |
|
| $ | 6,552 |
|
| $ | 1,842 |
|
| $ | 6,945 |
|
| $ | 38 |
| $ | 10,501 |
|
| $ | 10,431 |
|
| $ | 1,872 |
|
| $ | 10,448 |
|
| $ | 68 |
|
| Total Impaired Loans | $ | 142,534 |
|
| $ | 97,527 |
|
| $ | 1,842 |
|
| $ | 103,368 |
|
| $ | 4,255 |
| $ | 25,056 |
|
| $ | 22,025 |
|
| $ | 1,872 |
|
| $ | 26,272 |
|
| $ | 236 |
|
PART II: ITEM 8. FINANCIAL STATEMENTS AND SUPPLEMENTARY DATA
NOTES TO CONSOLIDATED FINANCIAL STATEMENTS
(table dollar amounts in thousands, except share data)
|
| | | | | | | | | | | | | | | | | | | |
| | December 31, 2017 |
| | Unpaid Principal
Balance |
| Recorded
Investment |
| Related
Allowance |
| Average Recorded Investment |
| Interest Income Recognized |
| Impaired loans with no related allowance: | |
| |
| |
| |
| |
| Commercial and industrial loans | $ | 7,611 |
|
| $ | 1,536 |
|
| $ | — |
|
| $ | 3,839 |
|
| $ | — |
|
| Agriculture production financing and other loans to farmers | 732 |
|
| 700 |
|
| — |
|
| 762 |
|
| — |
|
| Real estate loans: |
|
|
|
|
|
|
|
|
|
| Commercial and farmland | 16,758 |
|
| 15,163 |
|
| — |
|
| 17,495 |
|
| 360 |
|
| Residential | 833 |
|
| 519 |
|
| — |
|
| 635 |
|
| — |
|
| Home equity | 40 |
|
| 8 |
|
| — |
|
| 14 |
|
| — |
|
| Individuals' loans for household and other personal expenditures | 5 |
|
| 5 |
|
| — |
|
| 7 |
|
| — |
|
| Total | $ | 25,979 |
|
| $ | 17,931 |
|
| $ | — |
|
| $ | 22,752 |
|
| $ | 360 |
|
| Impaired loans with related allowance: | |
| |
| |
| |
| |
| Commercial and industrial loans | 812 |
|
| 782 |
|
| 552 |
|
| 1,517 |
|
| — |
|
| Agriculture production financing and other loans to farmers | 357 |
|
| 327 |
|
| 114 |
|
| 327 |
|
| — |
|
| Real estate loans: |
|
|
|
|
|
|
|
|
|
| Commercial and farmland | 2,988 |
|
| 2,269 |
|
| 567 |
|
| 2,379 |
|
| — |
|
| Residential | 1,616 |
|
| 1,572 |
|
| 327 |
|
| 1,580 |
|
| 28 |
|
| Home equity | 350 |
|
| 330 |
|
| 77 |
|
| 332 |
|
| 11 |
|
| Total | $ | 6,123 |
|
| $ | 5,280 |
|
| $ | 1,637 |
|
| $ | 6,135 |
|
| $ | 39 |
|
| Total Impaired Loans | $ | 32,102 |
|
| $ | 23,211 |
|
| $ | 1,637 |
|
| $ | 28,887 |
|
| $ | 399 |
|
Impaired loans in the above tables do not include loans accounted for under ASC 310-30, or any other loan, unless deemed impaired in
accordance with ASC 310-10.
As part of the ongoing monitoring of the credit quality of the Corporation's loan portfolio, management tracks certain credit quality indicators including trends related to: (i) the level of criticized commercial loans, (ii) net charge-offs, (iii) non-performing loans, (iv) covenant failures and (v) the general national and local economic conditions.
PART II: ITEM 8. FINANCIAL STATEMENTS AND SUPPLEMENTARY DATA
NOTES TO CONSOLIDATED FINANCIAL STATEMENTS
(table dollar amounts in thousands, except share data)
The Corporation utilizes a risk grading of pass, special mention, substandard, doubtful and loss to assess the overall credit quality of large commercial loans. All large commercial credit grades are reviewed at a minimum of once a year for pass grade loans. Loans with grades below pass are reviewed more frequently depending on the grade. A description of the general characteristics of these grades is as follows:
Pass - Loans that are considered to be of acceptable credit quality.
Special Mention - Loans which possess some credit deficiency or potential weakness, which deserves close attention. If left uncorrected, these potential weaknesses may result in deterioration of the repayment prospects for the asset or in the Corporation's credit position at some future date. Special mention assets are not adversely classified and do not expose the Corporation to sufficient risk to warrant adverse classification. The key distinctions of this category's classification are that it is indicative of an unwarranted level of risk; and weaknesses are considered “potential”, not “defined”, impairments to the primary source of repayment. Examples include businesses that may be suffering from inadequate management, loss of key personnel or significant customer or litigation.
Substandard - A substandard loan is inadequately protected by the current net worth and paying capacity of the obligor or of the collateral pledged, if any. Assets so classified have a well-defined weakness that jeopardizes the liquidation of the debt. They are characterized by the distinct possibility that the Corporation will sustain some loss if the deficiencies are not corrected. Other characteristics may include:
|
| | |
| | o | the likelihood that a loan will be paid from the primary source of repayment is uncertain or financial deterioration is underway and very close attention is warranted to ensure that the loan is collected without loss, |
|
| | |
| | o | the primary source of repayment is gone, and the Corporation is forced to rely on a secondary source of repayment, such as collateral liquidation or guarantees, |
|
| | |
| | o | loans have a distinct possibility that the Corporation will sustain some loss if deficiencies are not corrected, |
|
| | |
| | o | unusual courses of action are needed to maintain a high probability of repayment, |
|
| | |
| | o | the borrower is not generating enough cash flow to repay loan principal; however, it continues to make interest payments, |
|
| | |
| | o | the Corporation is forced into a subordinated or unsecured position due to flaws in documentation, |
PART II: ITEM 8. FINANCIAL STATEMENTS AND SUPPLEMENTARY DATA
NOTES TO CONSOLIDATED FINANCIAL STATEMENTS
(table dollar amounts in thousands, except share data)
|
| | |
| | o | loans have been restructured so that payment schedules, terms and collateral represent concessions to the borrower when compared to the normal loan terms, |
|
| | |
| | o | the Corporation is seriously contemplating foreclosure or legal action due to the apparent deterioration of the loan, and |
|
| | |
| | o | there is significant deterioration in market conditions to which the borrower is highly vulnerable. |
Doubtful - Loans that have all of the weaknesses of those classified as Substandard. However, based on currently existing facts, conditions and values, these weaknesses make full collection of principal highly questionable and improbable. Other credit characteristics may include the primary source of repayment is gone or there is considerable doubt as to the quality of the secondary sources of repayment. The possibility of loss is high, but because of certain important pending factors that may strengthen the loan, loss classification is deferred until the exact status of repayment is known.
Loss – Loans that are considered uncollectible and of such little value that continuing to carry them as an asset is not warranted. Loans will be classified as Loss when it is neither practical or desirable to defer writing off or reserving all or a portion of a basically worthless asset, even though partial recovery may be possible at some time in the future.
PART II: ITEM 8. FINANCIAL STATEMENTS AND SUPPLEMENTARY DATA
NOTES TO CONSOLIDATED FINANCIAL STATEMENTS
(table dollar amounts in thousands, except share data)
The following tables summarize the credit quality of the Corporation’s loan portfolio, by loan class for the years indicated. Consumer non-performing loans include accruing consumer loans 90 plus days90-days or more delinquent and consumer non-accrual loans. The entire balance of a loan is considered delinquent if the minimum payment contractually required to be made is not received by the specified date. Loans that evidenced deterioration of credit quality since origination and it was probable,the probability, at acquisition, that all contractually required payments would not be collected are included in the applicable categories below.
| | | | December 31, 2017 | December 31, 2019 |
| | Commercial Pass |
| Commercial Special Mention |
| Commercial Substandard |
| Commercial Doubtful |
| Commercial Loss |
| Consumer Performing |
| Consumer
Non Performing |
| Total | Commercial Pass |
| Commercial Special Mention |
| Commercial Substandard |
| Commercial Doubtful |
| Commercial Loss |
| Consumer Performing |
| Consumer
Non Performing |
| Total |
| Commercial and industrial loans | $ | 1,418,401 |
|
| $ | 51,336 |
|
| $ | 23,386 |
|
| $ | 370 |
|
| |
| |
| |
| $ | 1,493,493 |
| $ | 1,956,985 |
|
| $ | 81,179 |
|
| $ | 71,715 |
|
| $ | — |
|
| $ | — |
|
| $ | — |
|
| $ | — |
|
| $ | 2,109,879 |
|
| Agriculture production financing and other loans to farmers | 73,800 |
|
| 27,502 |
|
| 20,018 |
|
| 387 |
|
| $ | 50 |
|
| |
| |
| 121,757 |
| 78,558 |
|
| 5,626 |
|
| 9,677 |
|
| — |
|
| — |
|
| — |
|
| — |
|
| 93,861 |
|
| Real estate loans: |
|
| |
|
|
| |
| |
| |
| |
|
|
|
|
|
|
|
|
|
|
|
|
|
| |
|
|
| Construction | 587,906 |
|
| 828 |
|
| 981 |
|
|
|
| |
| $ | 22,374 |
|
| $ | 130 |
|
| 612,219 |
| 749,249 |
|
| 1,613 |
|
| 1,634 |
|
| — |
|
| — |
|
| 35,072 |
|
| — |
|
| 787,568 |
|
| Commercial and farmland | 2,408,329 |
|
| 70,074 |
|
| 79,769 |
|
| 1,536 |
|
| |
| 2,980 |
|
| 3 |
|
| 2,562,691 |
| 2,894,366 |
|
| 57,776 |
|
| 98,575 |
|
| — |
|
| — |
|
| 1,981 |
|
| — |
|
| 3,052,698 |
|
| Residential | 185,725 |
|
| 4,376 |
|
| 4,209 |
|
| 114 |
|
| |
| 759,900 |
|
| 8,441 |
|
| 962,765 |
| 196,710 |
|
| 877 |
|
| 8,075 |
|
| — |
|
| — |
|
| 932,743 |
|
| 4,812 |
|
| 1,143,217 |
|
| Home equity | 28,554 |
|
| 457 |
|
| 286 |
|
|
|
| |
| 482,661 |
|
| 2,063 |
|
| 514,021 |
| 24,211 |
|
| 257 |
|
| 682 |
|
| — |
|
| — |
|
| 562,507 |
|
| 1,327 |
|
| 588,984 |
|
| Individuals' loans for household and other personal expenditures | |
| |
| |
| |
| |
| 86,875 |
|
| 60 |
|
| 86,935 |
| — |
|
| — |
|
| — |
|
| — |
|
| — |
|
| 135,944 |
|
| 45 |
|
| 135,989 |
|
| Lease financing receivables, net of unearned income | 2,527 |
|
|
|
|
|
|
|
| |
|
|
|
|
|
| 2,527 |
| |
| Other commercial loans | 394,222 |
|
|
|
|
| 569 |
|
|
|
|
| |
|
|
|
|
| 394,791 |
| |
| Public finance and other commercial loans | | 547,114 |
|
| — |
|
| — |
|
| — |
|
| — |
|
| — |
|
| — |
|
| 547,114 |
|
| Loans | $ | 5,099,464 |
|
| $ | 154,573 |
|
| $ | 129,218 |
|
| $ | 2,407 |
|
| $ | 50 |
|
| $ | 1,354,790 |
|
| $ | 10,697 |
|
| $ | 6,751,199 |
| $ | 6,447,193 |
|
| $ | 147,328 |
|
| $ | 190,358 |
|
| $ | — |
|
| $ | — |
|
| $ | 1,668,247 |
|
| $ | 6,184 |
|
| $ | 8,459,310 |
|
|
| | | | | | | | | | | | | | | | | | | | | | | | | | | | | | | |
| | December 31, 2018 |
| | Commercial Pass |
| Commercial Special Mention |
| Commercial Substandard |
| Commercial Doubtful |
| Commercial Loss |
| Consumer Performing |
| Consumer
Non Performing |
| Total |
| Commercial and industrial loans | $ | 1,660,879 |
|
| $ | 23,246 |
|
| $ | 42,539 |
|
| $ | — |
|
| — |
|
| $ | — |
|
| $ | — |
|
| $ | 1,726,664 |
|
| Agriculture production financing and other loans to farmers | 78,446 |
|
| 5,966 |
|
| 7,992 |
|
| — |
|
| — |
|
| — |
|
| — |
|
| 92,404 |
|
| Real estate loans: |
|
| |
|
|
|
|
|
|
| |
| |
|
|
| Construction | 492,358 |
|
| 2,185 |
|
| 24,224 |
|
| — |
|
| — |
|
| 25,419 |
|
| 1,543 |
|
| 545,729 |
|
| Commercial and farmland | 2,669,491 |
|
| 76,037 |
|
| 84,288 |
|
| — |
|
| — |
|
| 2,285 |
|
| 1 |
|
| 2,832,102 |
|
| Residential | 170,075 |
|
| 7,373 |
|
| 2,076 |
|
| — |
|
| — |
|
| 782,080 |
|
| 4,817 |
|
| 966,421 |
|
| Home equity | 24,653 |
|
| 535 |
|
| 457 |
|
| — |
|
| — |
|
| 500,996 |
|
| 1,516 |
|
| 528,157 |
|
| Individuals' loans for household and other personal expenditures | — |
|
| — |
|
| — |
|
| — |
|
| — |
|
| 99,741 |
|
| 47 |
|
| 99,788 |
|
| Public finance and other commercial loans | 432,849 |
|
| — |
|
| 353 |
|
| — |
|
| — |
|
| — |
|
| — |
|
| 433,202 |
|
| Loans | $ | 5,528,751 |
|
| $ | 115,342 |
|
| $ | 161,929 |
|
| $ | — |
|
| $ | — |
|
| $ | 1,410,521 |
|
| $ | 7,924 |
|
| $ | 7,224,467 |
|
|
| | | | | | | | | | | | | | | | | | | | | | | | | | | |
| | December 31, 2016 |
| | Commercial Pass |
| Commercial Special Mention |
| Commercial Substandard |
| Commercial Doubtful |
| Commercial Loss |
| Consumer Performing |
| Consumer
Non Performing |
| Total |
| Commercial and industrial loans | $ | 1,117,545 |
|
| $ | 30,919 |
|
| $ | 46,182 |
|
|
|
| |
| |
| |
| $ | 1,194,646 |
|
| Agriculture production financing and other loans to farmers | 30,712 |
|
| 25,273 |
|
| 23,704 |
|
|
|
| |
| |
| |
| 79,689 |
|
| Real estate loans: |
|
| |
|
|
| |
| |
| |
| |
|
|
| Construction | 398,646 |
|
| 3,490 |
|
| 1,858 |
|
|
|
| |
| $ | 14,636 |
|
| $ | 73 |
|
| 418,703 |
|
| Commercial and farmland | 1,811,367 |
|
| 60,028 |
|
| 80,626 |
|
|
|
| |
| 1,034 |
|
| 7 |
|
| 1,953,062 |
|
| Residential | 146,251 |
|
| 5,106 |
|
| 6,046 |
|
|
|
| |
| 574,054 |
|
| 7,712 |
|
| 739,169 |
|
| Home equity | 7,310 |
|
| 47 |
|
| 516 |
|
|
|
| |
| 409,237 |
|
| 1,415 |
|
| 418,525 |
|
| Individuals' loans for household and other personal expenditures | |
| |
| |
| |
| |
| 77,456 |
|
| 23 |
|
| 77,479 |
|
| Lease financing receivables, net of unearned income | 228 |
|
|
|
| 83 |
|
|
|
| |
|
|
|
|
|
|
| 311 |
|
| Other commercial loans | 257,861 |
|
|
|
|
| 200 |
|
|
|
| |
|
|
|
|
| 258,061 |
|
| Loans | $ | 3,769,920 |
|
| $ | 124,863 |
|
| $ | 159,215 |
|
|
|
| |
| $ | 1,076,417 |
|
| $ | 9,230 |
|
| $ | 5,139,645 |
|
PART II: ITEM 8. FINANCIAL STATEMENTS AND SUPPLEMENTARY DATA
NOTES TO CONSOLIDATED FINANCIAL STATEMENTS
(table dollar amounts in thousands, except share data)
The tables below show a past due aging of the Corporation’s loan portfolio, by loan class, for the years indicated:
| |
| December 31, 2017 | December 31, 2019 |
| | Current |
| 30-59 Days
Past Due |
| 60-89 Days
Past Due |
| Loans > 90 Days
And Accruing |
| Non-Accrual |
| Total Past Due
& Non-Accrual |
| Total | Current |
| 30-59 Days
Past Due |
| 60-89 Days
Past Due |
| Loans 90 Days or More Past Due
And Accruing |
| Non-Accrual |
| Total Past Due
& Non-Accrual |
| Total |
| Commercial and industrial loans | $ | 1,487,221 |
|
| $ | 2,967 |
|
| $ | 30 |
|
|
|
|
| $ | 3,275 |
|
| $ | 6,272 |
|
| $ | 1,493,493 |
| $ | 2,105,445 |
|
| $ | 3,039 |
|
| $ | 136 |
|
| $ | 4 |
|
| $ | 1,255 |
|
| $ | 4,434 |
|
| $ | 2,109,879 |
|
| Agriculture production financing and other loans to farmers | 120,720 |
|
| 10 |
|
|
|
|
|
|
|
| 1,027 |
|
| 1,037 |
|
| 121,757 |
| 93,678 |
|
| — |
|
| — |
|
| — |
|
| 183 |
|
| 183 |
|
| 93,861 |
|
| Real estate loans: | |
| |
| |
| |
| |
|
|
| |
|
|
|
|
|
|
|
|
|
|
|
|
|
| Construction | 610,896 |
|
| 1,193 |
|
|
|
| $ | 65 |
|
| 65 |
|
| 1,323 |
|
| 612,219 |
| 784,961 |
|
| 1,630 |
|
| — |
|
| — |
|
| 977 |
|
| 2,607 |
|
| 787,568 |
|
| Commercial and farmland | 2,542,048 |
|
| 6,923 |
|
| 166 |
|
| 603 |
|
| 12,951 |
|
| 20,643 |
|
| 2,562,691 |
| 3,043,318 |
|
| 2,324 |
|
| 49 |
|
| — |
|
| 7,007 |
|
| 9,380 |
|
| 3,052,698 |
|
| Residential | 948,947 |
|
| 4,010 |
|
| 308 |
|
| 56 |
|
| 9,444 |
|
| 13,818 |
|
| 962,765 |
| 1,133,476 |
|
| 4,290 |
|
| 367 |
|
| 22 |
|
| 5,062 |
|
| 9,741 |
|
| 1,143,217 |
|
| Home equity | 510,362 |
|
| 1,372 |
|
| 184 |
|
| 175 |
|
| 1,928 |
|
| 3,659 |
|
| 514,021 |
| 584,023 |
|
| 2,960 |
|
| 538 |
|
| 42 |
|
| 1,421 |
|
| 4,961 |
|
| 588,984 |
|
| Individuals' loans for household and other personal expenditures | 85,744 |
|
| 298 |
|
| 834 |
|
| 25 |
|
| 34 |
|
| 1,191 |
|
| 86,935 |
| 135,399 |
|
| 440 |
|
| 105 |
|
| 1 |
|
| 44 |
|
| 590 |
|
| 135,989 |
|
| Lease financing receivables, net of unearned income | 2,527 |
|
|
|
|
|
| |
|
|
|
|
|
|
| 2,527 |
| |
| Other commercial loans | 394,791 |
|
|
|
|
|
|
|
|
|
|
|
|
|
| 394,791 |
| |
| Public finance and other commercial loans | | 547,114 |
|
| — |
|
| — |
|
| — |
|
| — |
|
| — |
|
| 547,114 |
|
| Loans | $ | 6,703,256 |
|
| $ | 16,773 |
|
| $ | 1,522 |
|
| $ | 924 |
|
| $ | 28,724 |
|
| $ | 47,943 |
|
| $ | 6,751,199 |
| $ | 8,427,414 |
|
| $ | 14,683 |
|
| $ | 1,195 |
|
| $ | 69 |
|
| $ | 15,949 |
|
| $ | 31,896 |
|
| $ | 8,459,310 |
|
|
| | | | | | | | | | | | | | | | | | | | | | | | | | | |
| December 31, 2018 |
| | Current |
| 30-59 Days
Past Due |
| 60-89 Days
Past Due |
| Loans 90 Days or More Past Due
And Accruing |
| Non-Accrual |
| Total Past Due
& Non-Accrual |
| Total |
| Commercial and industrial loans | $ | 1,723,337 |
|
| $ | 1,093 |
|
| $ | 182 |
|
| $ | 249 |
|
| $ | 1,803 |
|
| $ | 3,327 |
|
| $ | 1,726,664 |
|
| Agriculture production financing and other loans to farmers | 89,440 |
|
| 2,285 |
|
| — |
|
| — |
|
| 679 |
|
| 2,964 |
|
| 92,404 |
|
| Real estate loans: |
|
|
|
|
|
|
|
|
|
|
|
|
|
| Construction | 535,520 |
|
| 64 |
|
| — |
|
| 1,478 |
|
| 8,667 |
|
| 10,209 |
|
| 545,729 |
|
| Commercial and farmland | 2,822,515 |
|
| 1,253 |
|
| 178 |
|
| — |
|
| 8,156 |
|
| 9,587 |
|
| 2,832,102 |
|
| Residential | 959,252 |
|
| 1,756 |
|
| 430 |
|
| 17 |
|
| 4,966 |
|
| 7,169 |
|
| 966,421 |
|
| Home equity | 524,198 |
|
| 2,164 |
|
| 207 |
|
| 107 |
|
| 1,481 |
|
| 3,959 |
|
| 528,157 |
|
| Individuals' loans for household and other personal expenditures | 99,499 |
|
| 179 |
|
| 64 |
|
| 4 |
|
| 42 |
|
| 289 |
|
| 99,788 |
|
| Public finance and other commercial loans | 432,848 |
|
| — |
|
| — |
|
| — |
|
| 354 |
|
| 354 |
|
| 433,202 |
|
| Loans | $ | 7,186,609 |
|
| $ | 8,794 |
|
| $ | 1,061 |
|
| $ | 1,855 |
|
| $ | 26,148 |
|
| $ | 37,858 |
|
| $ | 7,224,467 |
|
|
| | | | | | | | | | | | | | | | | | | | | | | | | | | |
| December 31, 2016 |
| | Current |
| 30-59 Days
Past Due |
| 60-89 Days
Past Due |
| Loans > 90 Days
And Accruing |
| Non-Accrual |
| Total Past Due
& Non-Accrual |
| Total |
| Commercial and industrial loans | $ | 1,192,079 |
|
| $ | 466 |
|
| $ | 162 |
|
| $ | 100 |
|
| $ | 1,839 |
|
| $ | 2,567 |
|
| $ | 1,194,646 |
|
| Agriculture production financing and other loans to farmers | 78,360 |
|
|
|
|
|
|
|
|
|
|
| 1,329 |
|
| 1,329 |
|
| 79,689 |
|
| Real estate loans: | |
| |
| |
| |
| |
| |
| |
| Construction | 415,975 |
|
| 2,655 |
|
|
|
|
|
| 73 |
|
| 2,728 |
|
| 418,703 |
|
| Commercial and farmland | 1,932,896 |
|
| 1,385 |
|
| 3,027 |
|
|
|
|
| 15,754 |
|
| 20,166 |
|
| 1,953,062 |
|
| Residential | 725,338 |
|
| 3,664 |
|
| 635 |
|
| 9 |
|
| 9,523 |
|
| 13,831 |
|
| 739,169 |
|
| Home equity | 415,969 |
|
| 850 |
|
| 246 |
|
| 3 |
|
| 1,457 |
|
| 2,556 |
|
| 418,525 |
|
| Individuals' loans for household and other personal expenditures | 76,929 |
|
| 470 |
|
| 57 |
|
|
|
| 23 |
|
| 550 |
|
| 77,479 |
|
| Lease financing receivables, net of unearned income | 311 |
|
| |
| |
| |
|
|
|
|
|
|
| 311 |
|
| Other commercial loans | 258,061 |
|
|
|
|
|
|
|
|
|
|
|
|
|
| 258,061 |
|
| Loans | $ | 5,095,918 |
|
| $ | 9,490 |
|
| $ | 4,127 |
|
| $ | 112 |
|
| $ | 29,998 |
|
| $ | 43,727 |
|
| $ | 5,139,645 |
|
On occasion, borrowers experience declines in income and cash flow. As a result, these borrowers seek to reduce contractual cash outlays including debt payments. Concurrently, in an effort to preserve and protect its earning assets, specifically troubled loans, the Corporation works to maintain its relationship with certain customers who are experiencing financial difficulty by contractually modifying the borrower's debt agreement with the Corporation. In certain loan restructuring situations, the Corporation may grant a concession to a debtor experiencing financial difficulty, resulting in a trouble debt restructuring. A concession is deemed to be granted when, as a result of the restructuring, the Corporation does not expect to collect all original amounts due, including interest accrued at the original contract rate. If the payment of principal at original maturity is primarily dependent on the value of collateral, the current value of the collateral is considered in determining whether the principal will be paid.
The following tables summarize troubled debt restructures in the Corporation's loan portfolio that occurred during the periods ended December 31, 20172019 and 2016:2018: | | | | December 31, 2017 | December 31, 2019 |
| Pre-Modification
Recorded Balance |
| Post-Modification
Recorded Balance |
| Number
of Loans | Pre-Modification
Recorded Balance |
| Post-Modification
Recorded Balance |
| Number
of Loans |
| Commercial and industrial loans | $ | 599 |
| | $ | 376 |
| | 3 |
| |
| Agriculture production financing and other loans to farmers | 387 |
| | 387 |
| | 3 |
| |
| Real estate loans: | | | | | | | | | | |
| Commercial and farmland | 1,022 |
| | 1,156 |
| | 8 |
| |
| Residential | 788 |
| | 862 |
| | 15 |
| $ | 636 |
| | $ | 629 |
| | 11 |
|
| Home equity | 195 |
| | 107 |
| | 4 |
| 56 |
| | 61 |
| | 2 |
|
| Individuals' loans for household and other personal expenditures | 13 |
| | 14 |
| | 1 |
| |
| Total | $ | 3,004 |
| | $ | 2,902 |
| | 34 |
| $ | 692 |
| | $ | 690 |
| | 13 |
|
74 |
| | | | | | | | | | |
| | December 31, 2018 |
| Pre-Modification
Recorded Balance |
| Post-Modification
Recorded Balance |
| Number
of Loans |
| Real estate loans: |
|
| |
| |
| Commercial and farmland | $ | 85 |
|
| $ | 85 |
|
| 1 |
|
| Residential | 490 |
|
| 487 |
|
| 11 |
|
| Home equity | 81 |
| | 81 |
| | 3 |
|
| Individuals' loans for household and other personal expenditures | 65 |
|
| 66 |
|
| 3 |
|
| Total | $ | 721 |
|
| $ | 719 |
|
| 18 |
|
PART II: ITEM 8. FINANCIAL STATEMENTS AND SUPPLEMENTARY DATA
NOTES TO CONSOLIDATED FINANCIAL STATEMENTS
(table dollar amounts in thousands, except share data)
|
| | | | | | | | | | |
| | December 31, 2016 |
| Pre-Modification
Recorded Balance |
| Post-Modification
Recorded Balance |
| Number
of Loans |
| Commercial and industrial loans | $ | 410 |
|
| $ | 410 |
|
| 4 |
|
| Agriculture production financing and other loans to farmers | 1,368 |
| | 1,234 |
| | 4 |
|
| Real estate loans: |
|
| |
| |
| Commercial and farmland | 3,978 |
|
| 3,954 |
|
| 7 |
|
| Residential | 1,126 |
|
| 1,183 |
|
| 17 |
|
| Home equity | 266 |
| | 244 |
| | 4 |
|
| Individuals' loans for household and other personal expenditures | 17 |
|
| 10 |
|
| 1 |
|
| Total | $ | 7,165 |
|
| $ | 7,035 |
|
| 37 |
|
The following tables summarize the recorded investment of troubled debt restructures as of December 31, 20172019 and 2016,2018, by modification type, that occurred during the years indicated:
| | | | December 31, 2017 | December 31, 2019 |
| Term
Modification |
| Rate
Modification |
| Combination |
| Total
Modification | Term
Modification |
| Rate
Modification |
| Combination |
| Total
Modification |
| Commercial and industrial loans | $ | 203 |
| | | | $ | 166 |
| | $ | 369 |
| |
| Agriculture production financing and other farm loans | 387 |
| |
|
| | | | 387 |
| |
| Real estate loans: | |
| | |
| | |
| | |
| |
| | |
| | |
| | |
|
| Commercial and farmland | 705 |
| | $ | 59 |
| | 232 |
| | 996 |
| |
| Residential |
|
| | 761 |
| | 85 |
| | 846 |
| $ | 95 |
| | $ | 87 |
| | $ | 432 |
| | $ | 614 |
|
| Home equity | | | 105 |
| | | | 105 |
| — |
| | — |
| | 61 |
| | 61 |
|
| Individuals' loans for household and other personal expenditures | | | 14 |
| | | | 14 |
| |
| Total | $ | 1,295 |
| | $ | 939 |
| | $ | 483 |
| | $ | 2,717 |
| $ | 95 |
| | $ | 87 |
| | $ | 493 |
| | $ | 675 |
|
|
| | | | | | | | | | | | | | | |
| | December 31, 2018 |
| Term
Modification |
| Rate
Modification |
| Combination |
| Total
Modification |
| Real estate loans: | |
| |
| |
| |
| Commercial and farmland | $ | 85 |
|
| — |
|
| — |
|
| $ | 85 |
|
| Residential | — |
|
| $ | 209 |
|
| $ | 239 |
|
| 448 |
|
| Home equity | 106 |
|
| 74 |
|
| — |
|
| 180 |
|
| Individuals' loans for household and other personal expenditures | 58 |
|
| 6 |
|
| — |
|
| 64 |
|
| Total | $ | 249 |
|
| $ | 289 |
|
| $ | 239 |
|
| $ | 777 |
|
|
| | | | | | | | | | | | | | | |
| | December 31, 2016 |
| Term
Modification |
| Rate
Modification |
| Combination |
| Total
Modification |
| Commercial and industrial loans |
|
|
|
|
| $ | 397 |
|
| $ | 397 |
|
| Agriculture production financing and other loans to farmers | $ | 660 |
| | $ | 12 |
| | | | 672 |
|
| Real estate loans: | |
| |
| |
| |
| Commercial and farmland | 297 |
|
|
|
|
| 3,456 |
|
| 3,753 |
|
| Residential | 238 |
|
| 928 |
|
|
|
|
| 1,166 |
|
| Home equity |
|
|
| 266 |
|
|
|
|
| 266 |
|
| Individuals' loans for household and other personal expenditures |
|
|
| 9 |
|
|
|
| 9 |
|
| Total | $ | 1,195 |
|
| $ | 1,215 |
|
| $ | 3,853 |
|
| $ | 6,263 |
|
Loans secured by commercial and farmland1- 4 family residential real estate made up 40100 percent of the post-modification balances of the troubled debt restructured loans that occurred during the twelve months ending December 31, 2017.2019. The same classification made up 79 percent of the post-modification balance of the troubled debt restructured loans for the twelve months ending December 31, 2018.
The following tables summarize troubled debt restructures that occurred during the twelve months ended December 31, 20172019 and 2016,2018, that subsequently defaulted during the period indicated and remained in default at period end. For purposes of this schedule, a loan is considered in default if it is 3030-days or more days past due.
| |
| Twelve Months Ended December 31, 2017 | Twelve Months Ended December 31, 2019 |
| | Number of Loans |
| Recorded Balance | Number of Loans |
| Recorded Balance |
| Real estate loans: | | | | | | |
| Commercial and farmland | 1 |
| | $ | 14 |
| |
| Residential | 4 |
| | 323 |
| 1 |
| | $ | 37 |
|
| Total | 5 |
|
| $ | 337 |
| 1 |
|
| $ | 37 |
|
|
| | | | | | |
| Twelve Months Ended December 31, 2018 |
| | Number of Loans |
| Recorded Balance |
| Real estate loans: |
|
|
|
| Residential | 2 |
|
| $ | 75 |
|
| Total | 2 |
|
| $ | 75 |
|
|
| | | | | | |
| Twelve Months Ended December 31, 2016 |
| | Number of Loans |
| Recorded Balance |
| Commercial and industrial loans | 3 |
|
| $ | 197 |
|
| Agriculture production financing and other loans to farmers | 1 |
| | 661 |
|
| Real estate loans: |
|
|
|
| Commercial and farmland | 1 |
|
| 343 |
|
| Residential | 1 |
|
| $ | 64 |
|
| Total | 6 |
|
| $ | 1,265 |
|
PART II: ITEM 8. FINANCIAL STATEMENTS AND SUPPLEMENTARY DATA
NOTES TO CONSOLIDATED FINANCIAL STATEMENTS
(table dollar amounts in thousands, except share data)
For potential consumer loan restructures, impairment evaluation occurs prior to modification. Any subsequent impairment is typically addressed through the charge-off process or may be addressed through a specific reserve. Consumer troubled debt restructures are generally included in the general historical allowance for loan loss at the post modification balance. Consumer non-accrual and delinquent troubled debt restructures are also considered in the calculation of the non-accrual and delinquency trend environmental allowance allocation. Consumer mortgage loans secured by residential real estate properties for which formal foreclosure proceedings are in process totaled $2,302,000$1,033,000 and $1,530,000$800,000 at December 31, 20172019 and 2016,2018, respectively.
Commercial troubled debt restructured loans risk graded special mention, substandard, doubtful and loss are individually evaluated for impairment under ASC 310. Any resulting specific reserves are included in the allowance for loan losses. Commercial 30 - 89 day delinquent troubled debt restructures are included in the calculation of the delinquency trend environmental allowance allocation. With the exception of the acquired loans excluded from the allowance for loan losses, all commercial non-impaired loans, including non-accrual and 90+ day90-days or more delinquents, are included in the ASC 450 loss estimate.
PART II: ITEM 8. FINANCIAL STATEMENTS AND SUPPLEMENTARY DATA
NOTES TO CONSOLIDATED FINANCIAL STATEMENTS
(table dollar amounts in thousands, except share data)
NOTE 6
ACCOUNTING FOR CERTAIN LOANS ACQUIRED IN A PURCHASE
The acquired loans detailed in the tables belowPurchase Credit Impaired Loans are included in NOTE 5. LOANS AND ALLOWANCE of these Notes to Consolidated Financial Statements. As described in NOTE 5, loans purchased after December 31, 2008loans are recorded at the acquisition date fair value, which could result in a fair value discount or premium. Purchased loans with evidence of credit deterioration since origination and for which it is probable at the date of acquisition that the acquirer will not collect all contractually required principal and interest payments are accounted for under ASC 310-30, Loans Acquired with Deteriorated Credit Quality. The difference between contractually required payments and the cash flows expected to be collected at acquisition is referred to as the nonaccretable difference. The accretable portion of the fair value discount or premium is the difference between the expected cash flows and the net present value of expected cash flows, with such difference accreted into earnings over the term of the loans. All other loans not accounted for under ASC 310-30 are accounted for under ASC 310-20, which allows the fair value adjustment to be accreted into income over the remaining life of the loans.
The Corporation's most recent acquisitions, Arlington Bank and IAB, are detailed in NOTE 2. ACQUISITIONS of these Notes to Consolidated Financial Statements. All of the Corporation's acquisitions since December 31, 2008 are as indicated below.
The following tables include the outstanding balance and carrying amount of all acquired loans which were included in the Corporation's balance sheet at December 31, 2017 and December 31, 2016.
|
| | | | | | | | | | | | | | | | | | | | | | | | | | | | | | | |
| December 31, 2017 |
| IAB | | Arlington Bank | | Ameriana | | C Financial | | Community | | CFS | | SCB | | Total |
| Outstanding Balance: |
|
|
|
|
| | | | | | | | | | | | |
| Commercial and industrial loans | $ | 83,630 |
|
| $ | 3,152 |
| | $ | 4,150 |
| | $ | 64 |
| | $ | 235 |
| | $ | 10,539 |
| | $ | 1,760 |
| | $ | 103,530 |
|
| Agricultural production financing and other loans to farmers | 33,537 |
|
|
| | | | | | 76 |
| | 50 |
| | 1,317 |
| | 34,980 |
|
| Real estate loans: |
|
|
|
|
| | | | | | | | | | | | |
| Construction | 23,571 |
|
| 14,716 |
| | 2,451 |
| | 830 |
| | 1,499 |
| | 65 |
| | | | 43,132 |
|
| Commercial and farmland | 346,155 |
|
| 76,375 |
| | 79,739 |
| | 15,791 |
| | 27,910 |
| | 65,578 |
| | 6,733 |
| | 618,281 |
|
| Residential | 100,569 |
|
| 69,011 |
| | 86,098 |
| | 32,854 |
| | 6,354 |
| | 79,674 |
| | 2,899 |
| | 377,459 |
|
| Home equity | 36,349 |
|
| 22,581 |
| | 8,800 |
| | 5,733 |
| | 4,392 |
| | 19,972 |
| | 9,636 |
| | 107,463 |
|
| Individuals' loans for household and other personal expenditures | 3,552 |
|
| 174 |
| | 356 |
| |
|
| | 82 |
| | 22 |
| | 21 |
| | 4,207 |
|
| Other commercial loans | 11,189 |
|
| 90 |
| | 1,745 |
| | | | | | 58 |
| | | | 13,082 |
|
| Total | 638,552 |
|
| 186,099 |
| | 183,339 |
| | 55,272 |
| | 40,548 |
| | 175,958 |
| | 22,366 |
| | 1,302,134 |
|
| Remaining fair value discount | (20,090 | ) | | (5,242 | ) | | (6,689 | ) | | (1,266 | ) | | (2,482 | ) | | (5,859 | ) | | (2,120 | ) | | (43,748 | ) |
| Carrying amount | 618,462 |
| | 180,857 |
| | 176,650 |
| | 54,006 |
| | 38,066 |
| | 170,099 |
| | 20,246 |
| | 1,258,386 |
|
| Allowance | 290 |
| | | | 411 |
| | | | 52 |
| | 16 |
| | | | 769 |
|
| Carrying amount net of allowance | $ | 618,172 |
| | $ | 180,857 |
| | $ | 176,239 |
| | $ | 54,006 |
| | $ | 38,014 |
| | $ | 170,083 |
| | $ | 20,246 |
| | $ | 1,257,617 |
|
PART II: ITEM 8. FINANCIAL STATEMENTS AND SUPPLEMENTARY DATA
NOTES TO CONSOLIDATED FINANCIAL STATEMENTS
(table dollar amounts in thousands, except share data)
|
| | | | | | | | | | | | | | | | | | | | | | | |
| | December 31, 2016 |
| | Ameriana | | C Financial | | Community | | CFS | | SCB | | Total |
| Outstanding Balance: | | | | | | | | | | | |
| Commercial and industrial loans | $ | 8,003 |
| | $ | 85 |
| | $ | 2,269 |
| | $ | 23,327 |
| | $ | 3,552 |
| | $ | 37,236 |
|
| Agricultural production financing and other loans to farmers | | | | | 1,030 |
| | 50 |
| | 1,630 |
| | 2,710 |
|
| Real estate loans: | | | | | | | | | | | |
| Construction | 22,017 |
| | 2,835 |
| | 4,026 |
| | 420 |
| | | | 29,298 |
|
| Commercial and farmland | 103,075 |
| | 22,130 |
| | 36,947 |
| | 131,895 |
| | 9,315 |
| | 303,362 |
|
| Residential | 103,414 |
| | 44,101 |
| | 9,363 |
| | 96,627 |
| | 4,135 |
| | 257,640 |
|
| Home Equity | 11,728 |
| | 7,947 |
| | 6,326 |
| | 26,894 |
| | 11,924 |
| | 64,819 |
|
| Individuals' loans for household and other personal expenditures | 762 |
| | 2 |
| | 147 |
| | 201 |
| | 30 |
| | 1,142 |
|
| Other commercial loans | 1,825 |
| | | | | | 65 |
| | | | 1,890 |
|
| Total | 250,824 |
| | 77,100 |
| | 60,108 |
| | 279,479 |
| | 30,586 |
| | 698,097 |
|
| Remaining fair value discount | (10,771 | ) | | (1,906 | ) | | (4,101 | ) | | (12,634 | ) | | (3,268 | ) | | (32,680 | ) |
| Carrying Amount | 240,053 |
| | 75,194 |
| | 56,007 |
| | 266,845 |
| | 27,318 |
| | 665,417 |
|
| Allowance | 265 |
| | | | 23 |
| | 92 |
| | | | 380 |
|
| Carrying Amount Net of Allowance | $ | 239,788 |
| | $ | 75,194 |
| | $ | 55,984 |
| | $ | 266,753 |
| | $ | 27,318 |
| | $ | 665,037 |
|
The outstanding balance and related carrying amount of purchased credit impaired loans acquired and accounted for under ASC 310-30 as of December 31, 2017 were $38.92019 was $25.3 million which had a carrying amount of $16.1 million and $25.3$124,000 of related allowance for loan losses. As of December 31, 2018, the outstanding balance of purchased credit impaired loans was $26.3 million respectively; with noa carrying amount of $17.3 million with 0 required allowance for loan losses. Comparatively, the outstanding balance and related carrying amount as of December 31, 2016 were $60.5 million and $43.2 million, respectively; with no required allowance for loan losses. During the twelve months ended December 31, 2017, one loan with a December 31, 2016 outstanding balance of $12.1 million and a carrying amount of $7.6 million, was transferred to other real estate owned.
As customer cash flow expectations improve, on loans accounted for under ASC310-30, nonaccretable yield can be reclassified to accretable yield. The accretable portion,amount, or income expected to be collected, and reclassifications from nonaccretable, are identified in the tables below for the years indicated.table below.
|
| | | | | | | | | | | |
| | Twelve Months Ended December 31, 2019 |
| Twelve Months Ended December 31, 2018 |
| Twelve Months Ended December 31, 2017 |
| Beginning balance | $ | 2,143 |
|
| $ | 2,890 |
|
| $ | 3,950 |
|
| Additions | 576 |
|
| — |
|
| 1,608 |
|
| Accretion | (2,387 | ) |
| (4,118 | ) |
| (6,749 | ) |
| Reclassification from nonaccretable | 1,965 |
|
| 3,387 |
|
| 4,748 |
|
| Disposals | (165 | ) |
| (16 | ) |
| (667 | ) |
| Ending balance | $ | 2,132 |
|
| $ | 2,143 |
|
| $ | 2,890 |
|
|
| | | | | | | | | | | | | | | | | | | | | | | | | | | | | | | |
| | Twelve Months Ended December 31, 2017 |
| | IAB | | Arlington Bank | | Ameriana | | C Financial | | Community | | CFS | | SCB | | Total |
| Beginning balance | | | | | $ | 1,629 |
| | $ | 73 |
| | $ | 1,233 |
| | $ | 736 |
| | $ | 279 |
| | $ | 3,950 |
|
| Additions | $ | 941 |
| | $ | 667 |
| | | | | | | | | | | | 1,608 |
|
| Accretion | (1,009 | ) | | (314 | ) | | (2,983 | ) | | (260 | ) | | (454 | ) | | (1,172 | ) | | (557 | ) | | (6,749 | ) |
| Reclassification from nonaccretable | 834 |
| | 164 |
| | 1,805 |
| | 187 |
| | 212 |
| | 1,075 |
| | 471 |
| | 4,748 |
|
| Disposals | | | | |
|
| | | | (122 | ) | | (545 | ) | | | | (667 | ) |
| Ending balance | $ | 766 |
| | $ | 517 |
| | $ | 451 |
| |
|
| | $ | 869 |
| | $ | 94 |
| | $ | 193 |
| | $ | 2,890 |
|
|
| | | | | | | | | | | | | | | | | | | | | | | |
| | Twelve Months Ended December 31, 2016 |
| | Ameriana | | C Financial | | Community | | CFS | | SCB | | Total |
| Beginning balance | $ | 2,160 |
| | $ | 114 |
| | $ | 1,508 |
| | $ | 1,188 |
| | $ | 642 |
| | $ | 5,612 |
|
| Additions | | | | | | | | | | | |
| Accretion | (311 | ) | | (123 | ) | | (1,119 | ) | | (4,268 | ) | | (756 | ) | | (6,577 | ) |
| Reclassification from nonaccretable | 12 |
| | 82 |
| | 858 |
| | 3,827 |
| | 393 |
| | 5,172 |
|
| Disposals | (232 | ) | | | | (14 | ) | | (11 | ) | | | | (257 | ) |
| Ending balance | $ | 1,629 |
| | $ | 73 |
| | $ | 1,233 |
| | $ | 736 |
| | $ | 279 |
| | $ | 3,950 |
|
|
| | | | | | | | | | | | | | | | | | | | | | | |
| | Twelve Months Ended December 31, 2015 |
| | Ameriana | | C Financial | | Community | | CFS | | SCB | | Total |
| Beginning balance | | | | | $ | 2,122 |
| | $ | 2,400 |
| | $ | 868 |
| | $ | 5,390 |
|
| Additions | $ | 2,160 |
| | $ | 145 |
| | | | | | | | 2,305 |
|
| Accretion | | | (31 | ) | | (723 | ) | | (4,050 | ) | | (1,046 | ) | | (5,850 | ) |
| Reclassification from nonaccretable | | | | | 249 |
| | 2,854 |
| | 822 |
| | 3,925 |
|
| Disposals | | | | | (140 | ) | | (16 | ) | | (2 | ) | | (158 | ) |
| Ending balance | $ | 2,160 |
| | $ | 114 |
| | $ | 1,508 |
| | $ | 1,188 |
| | $ | 642 |
| | $ | 5,612 |
|
PART II: ITEM 8. FINANCIAL STATEMENTS AND SUPPLEMENTARY DATA
NOTES TO CONSOLIDATED FINANCIAL STATEMENTS
(table dollar amounts in thousands, except share data)
The following table presents loans acquired during the period ending December 31, 2017,2019, for which it was probable at acquisition that all contractually required payments would not be collected. There were no loans acquired during the period ending December 31, 2016.2018.
|
| | | |
| 2019 |
| MBT |
| Contractually required payments receivable at acquisition date | $ | 6,840 |
|
| Nonaccretable difference | 2,733 |
|
| Expected cash flows at acquisition date | 4,107 |
|
| Accretable difference | 576 |
|
| Basis in loans at acquisition date | $ | 3,531 |
|
|
| | | | | | | | | | | |
| 2017 |
| IAB |
| Arlington Bank |
| Total |
| Contractually required payments receivable at acquisition date | $ | 14,131 |
|
| $ | 6,183 |
|
| $ | 20,314 |
|
| Nonaccretable difference | 8,352 |
|
| 2,891 |
|
| 11,243 |
|
| Expected cash flows at acquisition date | 5,779 |
|
| 3,292 |
|
| 9,071 |
|
| Accretable difference | 941 |
|
| 667 |
|
| 1,608 |
|
| Basis in loans at acquisition date | $ | 4,838 |
|
| $ | 2,625 |
|
| $ | 7,463 |
|
NOTE 7
PREMISES AND EQUIPMENT
The following table summarizes the Corporation's premises and equipment as of December 31, 20172019 and 2016:2018:
|
| | | | | | | |
| | 2019 | | 2018 |
| Cost at December 31: | | | |
| Land | $ | 25,227 |
| | $ | 21,762 |
|
| Buildings and Leasehold Improvements | 162,391 |
| | 125,366 |
|
| Equipment | 124,327 |
| | 86,498 |
|
| Total Cost | 311,945 |
| | 233,626 |
|
| Accumulated Depreciation and Amortization | (198,890 | ) | | (140,206 | ) |
| Net | $ | 113,055 |
| | $ | 93,420 |
|
|
| | | | | | | |
| | 2017 | | 2016 |
| Cost at December 31: | | | |
| Land | $ | 22,042 |
| | $ | 25,035 |
|
| Buildings and Leasehold Improvements | 124,441 |
| | 114,444 |
|
| Equipment | 82,344 |
| | 65,547 |
|
| Total Cost | 228,827 |
| | 205,026 |
|
| Accumulated Depreciation and Amortization | (132,975 | ) | | (110,594 | ) |
| Net | $ | 95,852 |
| | $ | 94,432 |
|
The IABMBT acquisition on July 14, 2017 and the Arlington Bank acquisition on May 19, 2017September 1, 2019 resulted in additions to premises and equipment of $10,107,000 and $1,986,000, respectively.$21,664,000. Details regarding the acquisitionsacquisition are discussed in NOTE 2. ACQUISITIONSACQUISITION of these Notes to Consolidated Financial Statements.
The Corporation is committed under various non-cancelable lease contracts for certain subsidiary office facilities and equipment. TotalDetails regarding the lease expense for 2017, 2016 and 2015 was $4,072,000, $4,586,000 and $3,456,000, respectively. The future minimum rental commitments required under the operating leases, which expire at various dates through the year 2035,contracts are as follows for the years ending December 31:discussed in NOTE 10. LEASES of these Notes to Consolidated Financial Statements.
|
| | | |
| | Future Minimum Rental Commitments |
| 2018 | $ | 3,161 |
|
| 2019 | 3,611 |
|
| 2020 | 3,484 |
|
| 2021 | 3,137 |
|
| 2022 | 3,090 |
|
| After 2022 | 15,180 |
|
| Total Future Minimum Obligations | $ | 31,663 |
|
PART II: ITEM 8. FINANCIAL STATEMENTS AND SUPPLEMENTARY DATA
NOTES TO CONSOLIDATED FINANCIAL STATEMENTS
(table dollar amounts in thousands, except share data)
NOTE 8
GOODWILL
Goodwill is recorded on the acquisition date of an entity. During the one-year measurement period, the Corporation may record subsequent adjustments to goodwill for provisional amounts recorded at the acquisition date. The IABMBT acquisition on July, 14, 2017September, 1, 2019 resulted in $153,636,000 of goodwill. The Arlington Bank acquisition on May 19, 2017 resulted in $47,719,000
$98,563,000 of goodwill, which includes a reductionan addition of $469,000.$719,000. This reductionaddition was recorded in the thirdfourth quarter of 2017 as a measurement period adjustment. The Ameriana acquisition on December 31, 2015 resulted in $38,624,000 of goodwill, of which, $871,000 was recorded during the first quarter of 20162019 as a measurement period adjustment. Details regarding the IAB and Arlington Bank acquisitions areMBT acquisition is discussed in NOTE 2. ACQUISITIONSACQUISITION of these Notes to Consolidated Financial Statements.
NoNaN impairment loss was recorded in 20172019 or 2016.2018. The Corporation tested goodwill for impairment during 20172019 and 2016.2018. In both valuations, the fair value exceeded the Corporation’s carrying value; therefore, it was concluded goodwill is not impaired. For additional details related to impairment testing, see the “GOODWILL” section of Management’s Discussion and Analysis of Financial Condition and Results of Operations included as Item 7 of this Annual Report on Form 10-K. |
| | | | | | | |
| 2019 |
| 2018 |
| Balance, January 1 | $ | 445,355 |
|
| $ | 445,355 |
|
| Goodwill acquired | 97,844 |
|
| — |
|
| Measurement period adjustment | 719 |
|
| $ | — |
|
| Balance, December 31 | $ | 543,918 |
|
| $ | 445,355 |
|
NOTE 9
OTHER INTANGIBLES
Core deposit intangibles and other intangibles are recorded on the acquisition date of an entity. During the one-year measurement period, the Corporation may record subsequent adjustments to these intangibles for provisional amounts recorded at the acquisition date. The MBT acquisition on September 1, 2019 resulted in a core deposit intangible of $16,527,000. Details regarding the MBT acquisition are discussed in NOTE 2. ACQUISITION of these Notes to Consolidated Financial Statements.
The carrying basis and accumulated amortization of recognized core deposit and other intangibles are noted below.
78 |
| | | | | | | |
| | 2019 |
| 2018 |
| Gross carrying amount | $ | 85,869 |
|
| $ | 85,869 |
|
| Core deposit intangible acquired | 16,527 |
|
| — |
|
| Accumulated amortization | (67,434 | ) |
| (61,440 | ) |
| Core Deposit and Other Intangibles | $ | 34,962 |
|
| $ | 24,429 |
|
The core deposit intangibles and other intangibles are being amortized primarily on an accelerated basis over their estimated useful lives, generally over a period of two to ten years. Amortization expense for the years ended December 31, 2019, 2018 and 2017, was $5,994,000, $6,719,000 and $5,647,000, respectively.
Estimated future amortization expense is summarized as follows:
|
| | | |
| | Amortization Expense |
| 2020 | $ | 5,987 |
|
| 2021 | 5,429 |
|
| 2022 | 5,027 |
|
| 2023 | 4,827 |
|
| 2024 | 4,241 |
|
| After 2024 | 9,451 |
|
| | $ | 34,962 |
|
PART II: ITEM 8. FINANCIAL STATEMENTS AND SUPPLEMENTARY DATA
NOTES TO CONSOLIDATED FINANCIAL STATEMENTS
(table dollar amounts in thousands, except share data)
|
| | | | | | | |
| 2017 |
| 2016 |
| Balance, January 1 | $ | 244,000 |
|
| $ | 243,129 |
|
| Goodwill acquired | 201,824 |
|
|
|
| Measurement period adjustment | (469 | ) |
| $ | 871 |
|
| Balance, December 31 | $ | 445,355 |
|
| $ | 244,000 |
|
NOTE 9
OTHER INTANGIBLES
Core deposit intangibles and other intangibles are recorded on the acquisition date of an entity. During the measurement period, the Corporation may record subsequent adjustments to these intangibles for provisional amounts recorded at the acquisition date. The IAB acquisition on July 14, 2017 resulted in a core deposit intangible of $13,638,000 and other intangibles, consisting of non-compete intangibles, of $3,765,000. The Arlington Bank acquisition on May 19, 2017 resulted in a core deposit intangible of $4,526,000. The Ameriana acquisition on December 31, 2015 resulted in a core deposit intangible of $5,342,000, of which, $2,142,000 was recorded as a measurement period adjustment in the first quarter of 2016. Details regarding the IAB and Arlington Bank acquisitions are discussed in NOTE 2. ACQUISITIONS of these in the Notes to Consolidated Financial Statements.
The carrying basis and accumulated amortization of recognized core deposit and other intangibles are noted below.
|
| | | | | | | |
| | 2017 |
| 2016 |
| Gross carrying amount | $ | 63,940 |
|
| $ | 61,798 |
|
| Core deposit intangible acquired | 18,164 |
|
|
|
|
| Other intangibles acquired | 3,765 |
| | |
| Measurement period adjustment |
|
|
| 2,142 |
|
| Accumulated amortization | (54,721 | ) |
| (49,074 | ) |
| Core deposit intangible and other intangibles reduction |
|
|
|
|
|
| Core Deposit and Other Intangibles | $ | 31,148 |
|
| $ | 14,866 |
|
Amortization expense for the years ended December 31, 2017, 2016 and 2015, was $5,647,000, $3,910,000 and $2,835,000, respectively.
Estimated future amortization expense is summarized as follows:
|
| | | |
| | Amortization Expense |
| 2018 | $ | 6,719 |
|
| 2019 | 5,169 |
|
| 2020 | 3,632 |
|
| 2021 | 3,427 |
|
| 2022 | 3,325 |
|
| After 2022 | 8,876 |
|
| | $ | 31,148 |
|
NOTE 10
DEPOSITSLEASES
The compositionCorporation adopted ASU No. 2016-02 - Leases (Topic 842), as amended, as of January 1, 2019 for certain retail branches, office space, land and equipment. The Corporation elected the package of practical expedients permitted under the transition guidance within the new standard, which among other things, allowed the Corporation to carry forward the historical lease classification. Operating leases are included in the operating lease right-of use ("ROU") asset, which is included in other assets and the lease liability is included in other liabilities in our condensed balance sheets. The Corporation does not have any finance leases.
ROU assets represent the Corporation's right to use an underlying asset for the lease term and lease liabilities represent the Corporation's obligation to make lease payments arising from the lease. Operating lease ROU assets and liabilities are recognized at commencement date based on the present value of lease payments over the lease term. As most of the deposit portfolioCorporation's leases do not provide an implicit rate, the Corporation typically uses its incremental borrowing rate based on information available at commencement date in determining the present value of lease payments. Lease terms may include options to extend or terminate the lease. The exercise of such lease renewal options is at the Corporation's sole discretion and is not included in the present value of lease obligations unless it is reasonably certain that the option will be exercised. The depreciable life of assets and leasehold improvements are limited by the expected lease term, unless there is a transfer of title or purchase option reasonably certain of exercise. Certain of the Corporation's lease agreements include rental payments adjusted periodically for inflation. The Corporation's lease agreements do not contain any material residual value guarantees or material restrictive covenants. The Corporation does not have any material sublease agreements.
Supplemental balance sheet information related to leases is presented in the table below as of December 31, 2019.
|
| | | |
| December 31, 2019 |
| Operating lease assets | $ | 20,747 |
|
| Total lease assets | $ | 20,747 |
|
|
|
|
| Operating lease liabilities | $ | 21,421 |
|
| Total Lease liabilities | $ | 21,421 |
|
|
|
| Weighted average remaining lease term (years) |
| Operating leases | 8.9 |
|
| Weighted average discount rate |
|
| Operating leases | 3.4 | % |
The table below presents the components of lease expense for the years indicated:period indicated.
|
| | | |
| Twelve Months Ended December 31, 2019 |
| Lease Cost: |
|
| Operating lease cost | $ | 3,617 |
|
| Short-term lease cost | 204 |
|
| Variable lease cost | 948 |
|
| Sublease income | $ | (13 | ) |
| Total lease cost | $ | 4,756 |
|
|
| | | | | | | |
| December 31, 2017 | | December 31, 2016 |
| Demand deposits | $ | 3,746,654 |
|
| $ | 2,866,853 |
|
| Savings deposits | 1,994,366 |
|
| 1,560,752 |
|
| Certificates and other time deposits of $100,000 or more | 468,895 |
|
| 276,274 |
|
| Other certificates and time deposits | 581,894 |
|
| 471,247 |
|
| Brokered deposits | 380,721 |
|
| 381,372 |
|
| Total deposits | $ | 7,172,530 |
|
| $ | 5,556,498 |
|
At December 31, 2017 and 2016, deposits exceedingSupplemental cash flow information related to leases is presented in the FDIC's Standard Maximum Deposit Insurance Amount of $250,000 were $3.2 billion and $2.2 billion, respectively.
tables below.
79 |
| | | |
| Maturity of lease liabilities | Operating Leases |
| 2020 | $ | 3,434 |
|
| 2021 | 3,157 |
|
| 2022 | 3,033 |
|
| 2023 | 2,654 |
|
| 2024 | 2,585 |
|
| 2025 and after | 10,198 |
|
| Total lease payments | $ | 25,061 |
|
| Less: Present value discount | 3,640 |
|
| Present value of lease liabilities | $ | 21,421 |
|
|
|
| Other Information | Twelve Months Ended December 31, 2019 |
| Cash paid for amounts included in the measurement of lease liabilities |
|
| Operating cash flows from operating leases | $ | 3,422 |
|
| ROU assets obtained in exchange for new operating lease liabilities | $ | 23,529 |
|
PART II: ITEM 8. FINANCIAL STATEMENTS AND SUPPLEMENTARY DATA
NOTES TO CONSOLIDATED FINANCIAL STATEMENTS
(table dollar amounts in thousands, except share data)
NOTE 11
DEPOSITS
The composition of the deposit portfolio is included in the table below for the years indicated:
|
| | | | | | | |
| December 31, 2019 | | December 31, 2018 |
| Demand deposits | $ | 5,250,568 |
|
| $ | 3,985,178 |
|
| Savings deposits | 2,896,177 |
|
| 2,282,701 |
|
| Certificates and other time deposits of $100,000 or more | 736,843 |
|
| 593,592 |
|
| Other certificates and time deposits | 741,759 |
|
| 646,682 |
|
| Brokered deposits | 214,609 |
|
| 246,440 |
|
| Total deposits | $ | 9,839,956 |
|
| $ | 7,754,593 |
|
At December 31, 2017,2019 and 2018, deposits exceeding the FDIC's Standard Maximum Deposit Insurance Amount of $250,000 were $5.1 billion and $3.8 billion, respectively.
At December 31, 2019, the contractual maturities of time deposits are summarized as follows:
|
| | | |
| Certificates and Other Time Deposits |
| 2020 | $ | 1,489,274 |
|
| 2021 | 118,919 |
|
| 2022 | 47,731 |
|
| 2023 | 24,636 |
|
| 2024 | 11,934 |
|
| After 2024 | 717 |
|
| | $ | 1,693,211 |
|
|
| | | |
| Certificates and Other Time Deposits |
| 2018 | $ | 876,126 |
|
| 2019 | 330,892 |
|
| 2020 | 119,066 |
|
| 2021 | 63,005 |
|
| 2022 | 27,518 |
|
| After 2022 | 14,903 |
|
| | $ | 1,431,510 |
|
NOTE 1112
TRANSFERS ACCOUNTED FOR AS SECURED BORROWINGS
The collateral pledged for all repurchase agreements that are accounted for as secured borrowings as of December 31, 20172019 and 20162018 were:
|
| | | | | | | | | | | | | | | | | |
| December 31, 2017 |
| Remaining Contractual Maturity of the Agreements |
| Overnight and Continuous |
| Up to 30 Days |
| 30-90 Days |
| Greater Than 90 Days |
| Total |
| U.S. Government-sponsored mortgage-backed securities | $ | 126,187 |
|
| 1,340 |
|
| 1,500 |
|
| $ | 7,596 |
|
| $ | 136,623 |
|
|
| | | | | | | | | | | | | | | | | | | |
| December 31, 2019 |
| Remaining Contractual Maturity of the Agreements |
| Overnight and Continuous |
| Up to 30 Days |
| 30-90 Days |
| Greater Than 90 Days |
| Total |
| U.S. Government-sponsored mortgage-backed securities | $ | 178,732 |
|
| $ | — |
|
| $ | 7,672 |
|
| $ | 1,542 |
|
| $ | 187,946 |
|
|
| | | | | | | | | | | | | | | | | | | |
| December 31, 2018 |
| Remaining Contractual Maturity of the Agreements |
| Overnight and Continuous |
| Up to 30 Days |
| 30-90 Days |
| Greater Than 90 Days |
| Total |
| U.S. Government-sponsored mortgage-backed securities | $ | 104,883 |
|
| $ | 1,014 |
|
| $ | 7,615 |
|
| $ | — |
|
| $ | 113,512 |
|
|
| | | | | | | | | | | | | | | | | |
| December 31, 2016 |
| Remaining Contractual Maturity of the Agreements |
| Overnight and Continuous |
| Up to 30 Days |
| 30-90 Days |
| Greater Than 90 Days |
| Total |
| U.S. Government-sponsored mortgage-backed securities | $ | 129,617 |
|
| 1,337 |
|
| 10,253 |
|
| $ | 5,273 |
|
| $ | 146,480 |
|
PART II: ITEM 8. FINANCIAL STATEMENTS AND SUPPLEMENTARY DATA
NOTES TO CONSOLIDATED FINANCIAL STATEMENTS
(table dollar amounts in thousands, except share data)
NOTE 1213
BORROWINGS
The following table summarizes the Corporation's borrowings as of December 31, 20172019 and 2016:2018:
|
| | | | | | | |
| December 31, 2019 |
| December 31, 2018 |
| Federal funds purchased | $ | 55,000 |
|
| $ | 104,000 |
|
| Securities sold under repurchase agreements | 187,946 |
|
| 113,512 |
|
| Federal Home Loan Bank advances | 351,072 |
|
| 314,986 |
|
| Subordinated debentures and term loans | 138,685 |
|
| 138,463 |
|
| Total Borrowings | $ | 732,703 |
|
| $ | 670,961 |
|
|
| | | | | | | |
| December 31, 2017 |
| December 31, 2016 |
| Federal funds purchased | $ | 144,038 |
|
| $ | 120,349 |
|
| Securities sold under repurchase agreements | 136,623 |
|
| 146,480 |
|
| Federal Home Loan Bank advances | 414,377 |
|
| 298,923 |
|
| Subordinated debentures and term loans | 139,349 |
|
| 128,445 |
|
| Total Borrowings | $ | 834,387 |
|
| $ | 694,197 |
|
Securities sold under repurchase agreements consist of obligations of the Bank to other parties and are secured by U.S. Government-Sponsored Enterprise obligations. The maximum amount of outstanding agreements at any month-end during 20172019 and 20162018 totaled $145,883,000191,603,000 and $158,185,000143,016,000, respectively, and the average of such agreements totaled $134,401,000136,274,000 and $145,379,000124,762,000 during 20172019 and 20162018, respectively.
Contractual maturities of borrowings as of December 31, 20172019, are as follows:
|
| | | | | | | | | | | | | | | |
| Maturities in Years Ending December 31: | Federal Funds Purchased |
| Securities Sold
Under Repurchase Agreements |
| Federal Home
Loan Bank
Advances |
| Subordinated
Debentures and
Term Loans |
| 2020 | $ | 55,000 |
|
| $ | 187,946 |
|
| $ | 41,370 |
|
| $ | — |
|
| 2021 | — |
|
| — |
|
| 55,097 |
|
| — |
|
| 2022 | — |
|
| — |
|
| 95,097 |
|
| — |
|
| 2023 | — |
|
| — |
|
| 115,097 |
|
| — |
|
| 2024 | — |
|
| — |
|
| 97 |
|
| — |
|
| After 2024 | — |
|
| — |
|
| 44,314 |
|
| 142,322 |
|
| ASC 805 fair value adjustments at acquisition | — |
|
| — |
|
| — |
|
| (3,637 | ) |
| | $ | 55,000 |
|
| $ | 187,946 |
|
| $ | 351,072 |
|
| $ | 138,685 |
|
|
| | | | | | | | | | | | | | | |
| Maturities in Years Ending December 31: | Federal Funds Purchased | | Securities Sold
Under Repurchase Agreements | | Federal Home
Loan Bank
Advances | | Subordinated
Debentures and
Term Loans |
| 2018 | $ | 144,038 |
| | $ | 136,623 |
| | $ | 171,391 |
| |
|
|
| 2019 | | | | | 121,713 |
| | |
| 2020 | | | | | 41,273 |
| | |
| 2021 | | | | | 25,000 |
| | |
| 2022 | | | | | 20,000 |
| | |
| After 2022 | | | | | 35,000 |
| | $ | 143,430 |
|
| ASC 805 fair value adjustments at acquisition | | | | | | | (4,081 | ) |
| | $ | 144,038 |
| | $ | 136,623 |
| | $ | 414,377 |
| | $ | 139,349 |
|
PART II: ITEM 8. FINANCIAL STATEMENTS AND SUPPLEMENTARY DATA
NOTES TO CONSOLIDATED FINANCIAL STATEMENTS
(table dollar amounts in thousands, except share data)
The terms of a security agreement with the FHLB require the Corporation to pledge, as collateral for advances, qualifying first mortgage loans, investment securities and multi-family loans in an amount equal to at least 142145 percent of these advances depending on the type of collateral pledged. Advances, withAt December 31, 2019, the outstanding FHLB advances had interest rates from 0.881.07 to 5.865.09 percent and are subject to restrictions or penalties in the event of prepayment. The total available remaining borrowing capacity from the FHLB at December 31, 20172019, was $664,177,000.$638,668,000. As of December 31, 2017,2019, the Corporation had $45,000,000$55,000,000 of putable advances with the FHLB.
Subordinated Debentures and Term Loans. As of December 31, 20172019 and 2016,2018, subordinated debentures and term loans totaled $139,349,000138,685,000 and $128,445,000,$138,463,000, respectively.
| |
| • | First Merchants Capital Trust II. The subordinated debenture was entered into on July 2, 2007 for $56,702,000. On August 10, 2015, the Corporation completed the cancellation of $5 million of subordinated debentures at a gain of $1,250,000. As of December 31, 2019, $51,702,000 of subordinated debentures remain outstanding with a maturity date of September 15, 2037. The Corporation could not redeem the debenture prior to September 15, 2012, and redemption is subject to the prior approval of the Board of Governors of the Federal Reserve System, as required by law or regulation. Interest was fixed at 6.495 percent for the period from the date of issuance through September 15, 2012; interest is now an annual floating rate equal to the three-month LIBOR plus 1.56 percent, reset quarterly. Interest is payable in March, June, September and December of each year. The interest rate at December 31, 2019 and 2018 was 3.45 percent and 4.35 percent, respectively. The Corporation holds all of the outstanding common securities of First Merchants Capital Trust II. |
| |
| • | Ameriana Capital Trust I. On December 31, 2015 the Corporation acquired Ameriana Capital Trust I in conjunction with its acquisition of Ameriana Bancorp, Inc. The subordinated debentures of Ameriana Capital Trust I were entered into in March 2006 for $10,310,000 and have a maturity of March 2036. Ameriana could not redeem the debenture prior to March 2011, and redemption is subject to the prior approval of the Board of Governors of the Federal Reserve System, as required by law or regulation. The interest rate is equal to the three-month LIBOR plus 1.50 percent, reset quarterly. Interest is payable in March, June, September and December of each year. The interest rate at December 31, 2019 and 2018 was 3.39 percent and 4.29 percent, respectively. The Corporation holds all of the outstanding common securities of Ameriana Capital Trust I. |
First Merchants Capital Trust II. The subordinated debenture was entered into on July 2, 2007 for $56,702,000. On August 10, 2015, the Corporation completed the cancellation85
Table of $5 million of subordinated debentures at a gain of $1,250,000. As of December 31, 2017, $51,702,000 of subordinated debentures remain outstanding with a maturity date of September 15, 2037. The Corporation could not redeem the debenture prior to September 15, 2012, and redemption is subject to the prior approval of the Board of Governors of the Federal Reserve System, as required by law or regulation. Interest was fixed at 6.495 percent for the period from the date of issuance through September 15, 2012; interest is now an annual floating rate equal to the three-month LIBOR plus 1.56 percent, reset quarterly. Interest is payableContents PART II: ITEM 8. FINANCIAL STATEMENTS AND SUPPLEMENTARY DATA
NOTES TO CONSOLIDATED FINANCIAL STATEMENTS
(table dollar amounts in March, June, September and December of each year. The interest rate at December 31, 2017 and 2016 was 3.15 percent and 2.52 percent, respectively. The Corporation holds all of the outstanding common securities of First Merchants Capital Trust II.thousands, except share data)
Ameriana Capital Trust I. On December 31, 2015 the Corporation acquired Ameriana Capital Trust I in conjunction with its acquisition of Ameriana Bancorp, Inc. The subordinated debentures of Ameriana Capital Trust I were entered into in March 2007 for $10,310,000 and have a maturity of March 2036. Ameriana could not redeem the debenture prior to March 2011, and redemption is subject to the prior approval of the Board of Governors of the Federal Reserve System, as required by law or regulation. The interest rate is equal to the three-month LIBOR plus 1.50 percent, reset quarterly. Interest is payable in March, June, September and December of each year. The interest rate at December 31, 2017 and 2016 was 3.09 percent and 2.46 percent, respectively. The Corporation holds all of the outstanding common securities of Ameriana Capital Trust I.
| |
| • | Grabill Capital Trust I. On July 14, 2017 the Corporation acquired Grabill Capital Trust I in conjunction with its acquisition of Independent Alliance Banks, Inc. The subordinated debentures of Grabill Capital Trust I were entered into in June 2004 for $10,310,000 and have a maturity of July 23, 2034. IAB could not redeem the debenture prior to July 2009, and redemption is subject to the prior approval of the Board of Governors of the Federal Reserve System, as required by law or regulation. The interest rate is equal to the three-month LIBOR plus 2.60 percent, reset quarterly. Interest is payable in January, April, July and October of each year. The interest rate at December 31, 2019 and 2018 was 4.53 percent and 5.08 percent, respectively. The Corporation holds all of the outstanding common securities of Grabill Capital Trust I. |
Grabill Capital Trust I. On July 14, 2017 the Corporation acquired Grabill Capital Trust I in conjunction with its acquisition of Independent Alliance Banks, Inc. The subordinated debentures of Grabill Capital Trust I were entered into in June 2004 for $10,310,000 and have a maturity of July 23, 2034. IAB could not redeem the debenture prior to July 2009, and redemption is subject to the prior approval of the Board of Governors of the Federal Reserve System, as required by law or regulation. The interest rate is equal to the three-month LIBOR plus 2.60 percent, reset quarterly. Interest is payable in January, April, July and October of each year. The interest rate at December 31, 2017 was 3.96 percent. The Corporation holds all of the outstanding common securities of Grabill Capital Trust I.
On November 1, 2013, the Corporation completed the private issuance and sale to four4 institutional investors of an aggregate of $70 million of debt comprised of (a) 5.00 percent Fixed-to-Floating Rate Senior Notes due 2028 in the aggregate principal amount of $5 million (the "Senior Debt") and (b) 6.75 percent Fixed-to -FloatingFixed-to-Floating Rate Subordinated Notes due 2028 in the aggregate principal amount of $65 million (the "Subordinated Debt"). The interest rate on the Senior Debt and Subordinated Debt remains fixed for the first ten (10) years and will become floating thereafter. Once the rates convert to floating on October 30, 2023, the Senior Debt will have an annual floating rate equal to the three-month LIBOR plus 2.345 percent and the Subordinated Debt will have an annual floating rate equal to the three-month LIBOR plus 4.095 percent. The Corporation has an option to redeem the Subordinated Debt in whole or in part at a redemption price equal to 100 percent of the principal amount of the redeemed Subordinated Notes, plus accrued and unpaid interest to the date of the redemption. The option of redemption is subject to the approval of the Federal Reserve Board. The Corporation has an option to redeem the Senior Debt in whole or in part at a redemption price equal to 100 percent of the principal amount of the redeemed Senior Notes, plus accrued and unpaid interest to the date of the redemption; provided, however, that no Subordinated Notes (as defined in the Issuing and Paying Agency Agreement) may remain outstanding subsequent to any early redemption of Senior Notes. The Subordinated Debt and the Senior Debt options to redeem begin with the interest payment date on October 30, 2023, or on any scheduled interest payment date thereafter. The Senior Debt agreement contains certain customary representations and warranties and financial and negative covenants. As of December 31, 20172019 and 20162018 the Corporation was in compliance with these covenants.
PART II: ITEM 8. FINANCIAL STATEMENTS AND SUPPLEMENTARY DATA
NOTES TO CONSOLIDATED FINANCIAL STATEMENTS
(table dollar amounts in thousands, except share data)
NOTE 1314
DERIVATIVE INSTRUMENTS AND HEDGING ACTIVITIES
Risk Management Objective of Using Derivatives
The Corporation is exposed to certain risks arising from both its business operations and economic conditions. The Corporation principally manages its exposures to a wide variety of business and operational risks through management of its core business activities. The Corporation manages economic risks, including interest rate, liquidity, and credit risk, primarily by managing the amount, sources, and duration of its assets and liabilities and through the use of derivative financial instruments. Specifically, the Corporation enters into derivative financial instruments to manage exposures that arise from business activities that result in the receipt or payment of future known and uncertain cash amounts, the value of which are determined by interest rates. The Corporation’s derivative financial instruments are used to manage differences in the amount, timing, and duration of the Corporation’s known or expected cash payments principally related to certain variable-rate liabilities. The Corporation also has derivatives that are a result of a service the Corporation provides to certain qualifying customers, and, therefore, are not used to manage interest rate risk in the Corporation’s assets or liabilities. The Corporation manages a matched book with respect to its derivative instruments offered as a part of this service to its customers in order to minimize its net risk exposure resulting from such transactions.
Cash Flow Hedges of Interest Rate Risk
The Corporation’s objectives in using interest rate derivatives are to add stability to interest expense and to manage its exposure to interest rate movements. To accomplish this objective, the Corporation primarily uses interest rate swaps and interest rate caps as part of its interest rate risk management strategy. Interest rate swaps designated as cash flow hedges involve the payment of fixed amounts to a counterparty in exchange for the Corporation receiving variable payments over the life of the agreements without exchange of the underlying notional amount. Interest rate caps designated as cash flow hedges involve the receipt of variable amounts from a counterparty if interest rates rise above the strike rate on the contract in exchange for an up-front premium. As of December 31, 2017 and 2016,2019, the Corporation had five4 interest rate swaps with a notional amount of $56.0$46.0 million. As of December 31, 2018, the Corporation had 4 interest rate swaps with a notional amount of $46.0 million and one1 interest rate cap with a notional amount of $13.0 million.
The effective portion of changes in the fair value of derivatives designated and that qualify as cash flow hedges is recorded in accumulated other comprehensive income and is subsequently reclassified into earnings in the period that the hedged forecasted transaction affects earnings. During 2017,2019, $26.0 million of the interest rate swaps and the $13.0 million interest rate cap were used to hedge the variable cash outflows (LIBOR-based) associated with existing trust preferred securities when the outflows converted from a fixed rate to variable rate in September 2012. In addition, the remaining $30.0$20.0 million of interest rate swaps were used to hedge the variable cash outflows (LIBOR-based) associated with threetwo Federal Home Loan Bank advances. The ineffective portion of the change in fair value of the derivatives is recognized directly in earnings. During the years ended December 31, 20172019 and 2016,2018, the Corporation did not recognize any ineffectiveness.
Amounts reported in accumulated other comprehensive income related to derivatives will be reclassified to interest expense as interest payments are made on the Corporation’s variable-rate liabilities. During the next twelve months, the Corporation expects to reclassify $640,000$490,000 from accumulated other comprehensive income to interest expense.
PART II: ITEM 8. FINANCIAL STATEMENTS AND SUPPLEMENTARY DATA
NOTES TO CONSOLIDATED FINANCIAL STATEMENTS
(table dollar amounts in thousands, except share data)
Non-designated Hedges
The Corporation does not use derivatives for trading or speculative purposes. Derivatives not designated as hedges are not speculative and result from a service the Corporation provides to certain customers. The Corporation executes interest rate swaps with commercial banking customers to facilitate their respective risk management strategies. Those interest rate swaps are simultaneously hedged by offsetting interest rate swaps that the Corporation executes with a third party, such that the Corporation minimizes its net risk exposure resulting from such transactions. As the interest rate swaps associated with this program do not meet the strict hedge accounting requirements, changes in the fair value of both the customer swaps and the offsetting swaps are recognized directly in earnings. As of December 31, 2017,2019, the notional amount of customer-facing swaps was approximately $396,206,000.$692,287,000. This amount is offset with third party counterparties, as described above.
Fair Values of Derivative Instruments on the Balance Sheet
The table below presents the fair value of the Corporation’s derivative financial instruments as well as their classification on the Balance Sheet as of December 31, 20172019 and December 31, 20162018.
|
| | | | | | | | | | | | | | | | | | | | | | | |
| | Asset Derivatives |
| Liability Derivatives |
| | December 31, 2019 |
| December 31, 2018 |
| December 31, 2019 |
| December 31, 2018 |
| | Balance Sheet Location |
| Fair
Value |
| Balance Sheet Location |
| Fair
Value |
| Balance Sheet Location |
| Fair
Value |
| Balance Sheet Location |
| Fair
Value |
| Derivatives designated as hedging instruments: | |
| |
| |
| |
| |
| |
| |
| |
| Interest rate contracts | Other Assets |
| $ | — |
|
| Other Assets |
| $ | 135 |
|
| Other Liabilities |
| $ | 1,444 |
|
| Other Liabilities |
| $ | 688 |
|
| Derivatives not designated as hedging instruments: | |
| |
| |
| |
| |
| |
| |
| |
| Interest rate contracts | Other Assets |
| $ | 27,855 |
|
| Other Assets |
| $ | 11,948 |
|
| Other Liabilities |
| $ | 27,855 |
|
| Other Liabilities |
| $ | 11,948 |
|
|
| | | | | | | | | | | | | | | | | | | | | | | |
| | Asset Derivatives |
| Liability Derivatives |
| | December 31, 2017 |
| December 31, 2016 |
| December 31, 2017 |
| December 31, 2016 |
| | Balance Sheet Location |
| Fair
Value |
| Balance Sheet Location |
| Fair
Value |
| Balance Sheet Location |
| Fair
Value |
| Balance Sheet Location |
| Fair
Value |
| Derivatives designated as hedging instruments: | |
| |
| |
| |
| |
| |
| |
| |
| Interest rate contracts | Other Assets |
| $ | 18 |
|
| Other Assets |
| $ | 15 |
|
| Other Liabilities |
| $ | 1,383 |
|
| Other Liabilities |
| $ | 2,182 |
|
| Derivatives not designated as hedging instruments: | |
| |
| |
| |
| |
| |
| |
| |
| Interest rate contracts | Other Assets |
| $ | 7,305 |
|
| Other Assets |
| $ | 6,295 |
|
| Other Liabilities |
| $ | 7,305 |
|
| Other Liabilities |
| $ | 6,295 |
|
PART II: ITEM 8. FINANCIAL STATEMENTS AND SUPPLEMENTARY DATA
NOTES TO CONSOLIDATED FINANCIAL STATEMENTS
(table dollar amounts in thousands, except share data)
The amount of gain (loss) recognized in other comprehensive income is included in the table below for the periods indicated.
|
| | | | | | | |
| Derivatives in Cash Flow Hedging Relationships | Amount of Gain (Loss) Recognized in Other Comprehensive Income on Derivative
(Effective Portion)
For the Year Ended December 31, |
| 2019 |
| 2018 |
| Interest rate products | $ | (1,072 | ) |
| $ | 247 |
|
|
| | | | | | | |
| Derivatives in Cash Flow Hedging Relationships | Amount of Gain (Loss) Recognized in Other Comprehensive Income on Derivative
(Effective Portion)
For the Year Ended |
| 2017 |
| 2016 |
| Interest rate products | $ | 13 |
|
| $ | (368 | ) |
Effect of Derivative Instruments on the Income Statement
The tables below present the effect of the Corporation’s derivative financial instruments on the Income Statement for the years ended December 31, 20172019, 20162018 and 2015.2017.
|
| | | | | | | | | | | | |
Derivatives Not
Designated as Hedging
Instruments under
FASB ASC 815-10 | Location of Gain
(Loss) Recognized in
Income on Derivative | Amount of Gain (Loss) Recognized in Income on Derivative |
| 2017 |
| 2016 |
| 2015 |
| Interest rate contracts | Other income | $ | — |
|
| $ | 211 |
|
| $ | (53 | ) |
|
| | | | | | | | | | | | |
Derivatives Designated as Hedging
Instruments under
FASB ASC 815-10 | Location of Loss Reclassified from Accumulated Other Comprehensive Income (Effective Portion) | Amount of Loss Reclassified from Other Comprehensive Income into Income (Effective Portion) |
| 2019 |
| 2018 |
| 2017 |
| Interest rate contracts | Interest expense | $ | (334 | ) |
| $ | (470 | ) |
| $ | (985 | ) |
|
| | | | | | | | | | | | |
Derivatives Designated as Hedging
Instruments under
FASB ASC 815-10 | Location of Loss Reclassified from Accumulated Other Comprehensive Income (Effective Portion) | Amount of Loss Reclassified from Other Comprehensive Income into Income (Effective Portion) |
| 2017 |
| 2016 |
| 2015 |
| Interest rate contracts | Interest expense | $ | (985 | ) |
| $ | (1,250 | ) |
| $ | (1,427 | ) |
The Corporation’s exposure to credit risk occurs because of nonperformance by its counterparties. The counterparties approved by the Corporation are usually financial institutions, which are well capitalized and have credit ratings through Moody’s and/or Standard & Poor’s, at or above investment grade. The Corporation’s control of such risk is through quarterly financial reviews, comparing mark-to-market values with policy limitations, credit ratings and collateral pledging.
Credit-Risk-Related Contingent Features
The Corporation has agreements with certain of its derivative counterparties that contain a provision where if the Corporation fails to maintain its status as a well/adequately capitalized institution, then the Corporation could be required to terminate or fully collateralize all outstanding derivative contracts. Additionally, the Corporation has agreements with certain of its derivative counterparties that contain a provision where if the Corporation defaults on any of its indebtedness, including default where repayment repayment��of the indebtedness has not been accelerated by the lender, then the Corporation could also be declared in default on its derivative obligations. As of December 31, 20172019, the termination value of derivatives in a net liability position related to these agreements was $2,579,00028,734,000. As of December 31, 20172019, the Corporation has minimum collateral posting thresholds with certain of its derivative counterparties and has posted collateral of $11,866,00042,255,000. If the Corporation had breached any of these provisions at December 31, 20172019, it could have been required to settle its obligations under the agreements at their termination value.
PART II: ITEM 8. FINANCIAL STATEMENTS AND SUPPLEMENTARY DATA
NOTES TO CONSOLIDATED FINANCIAL STATEMENTS
(table dollar amounts in thousands, except share data)
NOTE 1415
FAIR VALUES OF FINANCIAL INSTRUMENTS
The Corporation used fair value measurements to record fair value adjustments to certain assets and liabilities and to determine fair value disclosures. The accounting guidance defines fair value, establishes a framework for measuring fair value and expands disclosures about fair value measurements. ASC 820 applies only when other guidance requires or permits assets or liabilities to be measured at fair value; it does not expand the use of fair value in any new circumstances.
As defined in ASC 820, fair value is the price to sell an asset or transfer a liability in an orderly transaction between market participants. It represents an exit price at the measurement date. Market participants are buyers and sellers, who are independent, knowledgeable, and willing and able to transact in the principal (or most advantageous) market for the asset or liability being measured. Current market conditions, including imbalances between supply and demand, are considered in determining fair value. The Corporation values its assets and liabilities in the principal market where it sells the particular asset or transfers the liability with the greatest volume and level of activity. In the absence of a principal market, the valuation is based on the most advantageous market for the asset or liability (i.e., the market where the asset could be sold or the liability transferred at a price that maximizes the amount to be received for the asset or minimizes the amount to be paid to transfer the liability).
PART II: ITEM 8. FINANCIAL STATEMENTS AND SUPPLEMENTARY DATA
NOTES TO CONSOLIDATED FINANCIAL STATEMENTS
(table dollar amounts in thousands, except share data)
Valuation inputs refer to the assumptions market participants would use in pricing a given asset or liability. Inputs can be observable or unobservable. Observable inputs are those assumptions which market participants would use in pricing the particular asset or liability. These inputs are based on market data and are obtained from a source independent of the Corporation. Unobservable inputs are assumptions based on the Corporation’s own information or estimate of assumptions used by market participants in pricing the asset or liability. Unobservable inputs are based on the best and most current information available on the measurement date. All inputs, whether observable or unobservable, are ranked in accordance with a prescribed fair value hierarchy which gives the highest ranking to quoted prices (unadjusted) in active markets for identical assets or liabilities (Level 1) and the lowest ranking to unobservable inputs for which there is little or no market activity (Level 3). Fair values for assets or liabilities classified as Level 2 are based on one or a combination of the following factors: (i) quoted prices for similar assets; (ii) observable inputs for the asset or liability, such as interest rates or yield curves; or (iii) inputs derived principally from or corroborated by observable market data. The level in the fair value hierarchy within which the fair value measurement in its entirety falls is determined based on the lowest level input that is significant to the fair value measurement in its entirety. The Corporation considers an input to be significant if it drives 10 percent or more of the total fair value of a particular asset or liability.
RECURRING MEASUREMENTS
Assets and liabilities are considered to be measured at fair value on a recurring basis if fair value is measured regularly (i.e., daily, weekly, monthly or quarterly). Recurring valuation occurs at a minimum on the measurement date. Assets and liabilities are considered to be measured at fair value on a non-recurringnonrecurring basis if the fair value measurement of the instrument does not necessarily result in a change in the amount recorded on the balance sheet. Generally, nonrecurring valuation is the result of the application of other accounting pronouncements which require assets or liabilities to be assessed for impairment or recorded at the lower of cost or fair value. The fair value of assets or liabilities transferred in or out of Level 3 is measured on the transfer date, with any additional changes in fair value subsequent to the transfer considered to be realized or unrealized gains or losses.
Following is a description of the valuation methodologies used for instruments measured at fair value on a recurring basis and recognized in the
accompanying balance sheets, as well as the general classification of such instruments pursuant to the valuation hierarchy.
Investment Securities
Where quoted prices are available in an active market, securities are classified within Level 1 of the valuation hierarchy. At December 31, 2017, there wereThe Corporation currently has no securities classified within Level 1 securities. At December 31, 2016,of the hierarchy. Where significant observable inputs, other than Level 1 securities included equity securities. If quoted market prices, are not available, then fair valuessecurities are estimated by using pricing models, quoted pricesclassified within Level 2 of securities with similar characteristics or discounted cash flows.the valuation hierarchy. Level 2 securities included agencies,include government-sponsored mortgage backs,agency and mortgage-backed securities and state and municipal and equity securities. In certain cases where Level 1 or Level 2 inputs are not available, securities are classified within Level 3 of the hierarchy. Level 3 securities includedhierarchy and include state and municipal, government-sponsored mortgage-backed securities and corporate obligations and equity securities. Level 3 fair value for state and municipal, corporate obligations and equity securities was determined using a discounted cash flow model that incorporated market estimates of interest rates and volatility in markets that have not been active.
Third party vendors compile prices from various sources and may apply such techniques as matrix pricing to determine the value of identical or similar investment securities (Level 2). Matrix pricing is a mathematical technique widely used in the banking industry to value investment securities without relying exclusively on quoted prices for specific investment securities but rather relying on the investment securities’ relationship to other benchmark quoted investment securities. Any investment security not valued based upon the methods above are considered Level 3.
PART II: ITEM 8. FINANCIAL STATEMENTS AND SUPPLEMENTARY DATA
NOTES TO CONSOLIDATED FINANCIAL STATEMENTS
(table dollar amounts in thousands, except share data)
Interest Rate Derivative Agreements
See information regarding the Corporation’s interest rate derivative products in NOTE 13.14. DERIVATIVE INSTRUMENTS AND HEDGING ACTIVITIES of these Notes to Consolidated Financial Statements. The following table presents the fair value measurements of assets and liabilities recognized in the accompanying balance sheets measured at fair value on a recurring basis and the level within the ASC 820-10 fair value hierarchy in which the fair value measurements fall at December 31, 20172019 and 2016.2018.
| | | | | | | Fair Value Measurements Using: | | | | Fair Value Measurements Using: |
| | | | | Quoted Prices in Active
Markets for Identical Assets | | Significant Other Observable Inputs | | Significant
Unobservable Inputs | | | | Quoted Prices in Active
Markets for Identical Assets | | Significant Other Observable Inputs | | Significant
Unobservable Inputs |
| December 31, 2017 | | Fair Value | | (Level 1) | | (Level 2) | | (Level 3) | |
| December 31, 2019 | | | Fair Value | | (Level 1) | | (Level 2) | | (Level 3) |
| Available for sale securities: | | | | | | | | | | | | | | |
| U.S. Government-sponsored agency securities | |
| $ | 38,875 |
|
| $ | — |
|
| $ | 38,875 |
|
| $ | — |
|
| State and municipal | | $ | 526,693 |
| | $ | 522,750 |
| | $ | 3,943 |
|
| 899,796 |
|
| — |
|
| 896,938 |
|
| 2,858 |
|
| U.S. Government-sponsored mortgage-backed securities | | 470,866 |
| | 470,866 |
| | |
| 851,323 |
|
| — |
|
| 851,319 |
|
| 4 |
|
| Corporate obligations | | 31 |
| | | | 31 |
|
| 31 |
|
| — |
|
| — |
|
| 31 |
|
| Equity securities | | 2,357 |
| |
| | 2,353 |
| | 4 |
| |
| Interest rate swap asset | | 7,305 |
| | 7,305 |
| | |
| 27,855 |
|
| — |
|
| 27,855 |
|
| — |
|
| Interest rate cap | | 18 |
| | 18 |
| | | |
| Interest rate swap liability | | 8,688 |
| | 8,688 |
| | |
| 29,299 |
|
| — |
|
| 29,299 |
|
| — |
|
84 |
| | | | | | | | | | | | | | | | |
| | | | | Fair Value Measurements Using: |
| | | | | Quoted Prices in Active
Markets for Identical Assets | | Significant Other Observable Inputs | | Significant
Unobservable Inputs |
| December 31, 2018 | | Fair Value | | (Level 1) | | (Level 2) | | (Level 3) |
| Available for sale securities: | | | | | | | | |
| U.S. Government-sponsored agency securities |
| $ | 13,582 |
|
| $ | — |
|
| $ | 13,582 |
|
| $ | — |
|
| State and municipal |
| 606,135 |
|
| — |
|
| 602,842 |
|
| 3,293 |
|
| U.S. Government-sponsored mortgage-backed securities |
| 522,447 |
|
| — |
|
| 522,443 |
|
| 4 |
|
| Corporate obligations |
| 31 |
|
| — |
|
| — |
|
| 31 |
|
| Interest rate swap asset |
| 11,948 |
|
| — |
|
| 11,948 |
|
| — |
|
| Interest rate cap |
| 135 |
|
| — |
|
| 135 |
|
| — |
|
| Interest rate swap liability |
| 12,636 |
|
| — |
|
| 12,636 |
|
| — |
|
PART II: ITEM 8. FINANCIAL STATEMENTS AND SUPPLEMENTARY DATA
NOTES TO CONSOLIDATED FINANCIAL STATEMENTS
(table dollar amounts in thousands, except share data)
|
| | | | | | | | | | | | | | | | |
| | | | | Fair Value Measurements Using: |
| | | | | Quoted Prices in Active
Markets for Identical Assets | | Significant Other Observable Inputs | | Significant
Unobservable Inputs |
| December 31, 2016 | | Fair Value | | (Level 1) | | (Level 2) | | (Level 3) |
| Available for sale securities: | | | | | | | | |
| U.S. Government-sponsored agency securities | | $ | 100 |
| | | | $ | 100 |
| | |
| State and municipal | | 363,658 |
| | | | 358,524 |
| | $ | 5,134 |
|
| U.S. Government-sponsored mortgage-backed securities | | 312,292 |
| | | | 312,292 |
| | |
| Corporate obligations | | 31 |
| | | | | | 31 |
|
| Equity securities | | 20,781 |
| | $ | 18,765 |
| | 2,012 |
| | 4 |
|
| Interest rate swap asset | | 6,295 |
| | | | 6,295 |
| | |
| Interest rate cap | | 15 |
| | | | 15 |
| | |
| Interest rate swap liability | | 8,477 |
| | | | 8,477 |
| | |
LEVEL 3 RECONCILIATION
The following is a reconciliation of the beginning and ending balances of recurring fair value measurements recognized in the accompanying balance sheets using significant unobservable Level 3 inputs for year ended December 31, 20172019 and 2016.2018.
| | | | Available for Sale Securities | Available for Sale Securities |
| | For The Year Ended | For The Year Ended |
| | December 31, 2017 | | December 31, 2016 | December 31, 2019 | | December 31, 2018 |
| Beginning Balance | $ | 5,169 |
| | $ | 5,932 |
| $ | 3,328 |
| | $ | 3,978 |
|
| Included in other comprehensive income | 26 |
| | (223 | ) | 80 |
| | (49 | ) |
| Principal payments | (1,217 | ) | | (540 | ) | (515 | ) | | (601 | ) |
| Ending balance | $ | 3,978 |
| | $ | 5,169 |
| $ | 2,893 |
| | $ | 3,328 |
|
There were no gains or losses included in earnings that were attributable to the changes in unrealized gains or losses related to assets or liabilities held at December 31, 20172019 or 2016.2018.
TRANSFERS BETWEEN LEVELS
There were no0 transfers in or out of Level 3 during 20172019 or 2016.2018.
PART II: ITEM 8. FINANCIAL STATEMENTS AND SUPPLEMENTARY DATA
NOTES TO CONSOLIDATED FINANCIAL STATEMENTS
(table dollar amounts in thousands, except share data)
NONRECURRING MEASUREMENTS
Following is a description of valuation methodologies used for instruments measured at fair value on a non-recurring basis and recognized in the accompanying balance sheets, as well as the general classification of such instruments pursuant to the valuation hierarchy for year ended December 31, 20172019 and 2016.2018.
| | | |
| |
| Fair Value Measurements Using |
| |
| Fair Value Measurements Using |
| |
| |
| Quoted Prices in Active
Markets for Identical Assets |
| Significant Other Observable Inputs |
| Significant
Unobservable Inputs |
| |
| Quoted Prices in Active
Markets for Identical Assets |
| Significant Other Observable Inputs |
| Significant
Unobservable Inputs |
| December 31, 2017 |
| Fair Value |
| (Level 1) |
| (Level 2) |
| (Level 3) | |
| December 31, 2019 | |
| Fair Value |
| (Level 1) |
| (Level 2) |
| (Level 3) |
| Impaired Loans (collateral dependent) |
| $ | 9,576 |
|
|
| $ | 9,576 |
|
| $ | 5,653 |
|
| — |
|
| — |
|
| $ | 5,653 |
|
| Other real estate owned |
| $ | 859 |
|
|
| $ | 859 |
|
| $ | 194 |
|
| — |
|
| — |
|
| $ | 194 |
|
|
| | | | | | | | | | | | | | |
| |
| |
| Fair Value Measurements Using |
| |
| |
| Quoted Prices in Active
Markets for Identical Assets |
| Significant Other Observable Inputs |
| Significant
Unobservable Inputs |
| December 31, 2018 |
| Fair Value |
| (Level 1) |
| (Level 2) |
| (Level 3) |
| Impaired Loans (collateral dependent) |
| $ | 11,866 |
|
| — |
|
| — |
|
| $ | 11,866 |
|
| Other real estate owned |
| $ | 657 |
|
| — |
|
| — |
|
| $ | 657 |
|
|
| | | | | | | | | | | | |
| |
| |
| Fair Value Measurements Using |
| |
| |
| Quoted Prices in Active
Markets for Identical Assets |
| Significant Other Observable Inputs |
| Significant
Unobservable Inputs |
| December 31, 2016 |
| Fair Value |
| (Level 1) |
| (Level 2) |
| (Level 3) |
| Impaired Loans (collateral dependent) |
| $ | 15,318 |
|
| |
| |
| $ | 15,318 |
|
| Other real estate owned |
| $ | 1,612 |
|
| |
| |
| $ | 1,612 |
|
PART II: ITEM 8. FINANCIAL STATEMENTS AND SUPPLEMENTARY DATA
NOTES TO CONSOLIDATED FINANCIAL STATEMENTS
(table dollar amounts in thousands, except share data)
Impaired Loans (collateral dependent)
Loans for which it is probable that the Corporation will not collect all principal and interest due according to contractual terms are measured for impairment. Allowable methods for determining the amount of impairment include estimating fair value of the collateral for collateral dependent loans. If the impaired loan is identified as collateral dependent, then the fair value method of measuring the amount of impairment is utilized. This method requires obtaining a current independent appraisal of the collateral and applying a discount factor to the value. A portion of the allowance for loan losses is allocated to impaired loans if the value of such loans is deemed to be less than the unpaid balance. If these allocations cause the allowance for loan losses to increase, such increase is reported as a component of the provision for loan losses. Loan losses are charged against the allowance when management believes the uncollectability of the loan is confirmed. During 2017,2018 and 2019, certain impaired loans were partially charged off or re-evaluated. Impaired loans that are collateral dependent are classified within Level 3 of the fair value hierarchy when impairment is determined using the fair value method.
Other Real Estate Owned
The fair value for impaired loans and other real estate owned is measured based on the value of the collateral securing those loans or real estate and is determined using several methods. The fair value of real estate is generally determined based on appraisals by qualified licensed appraisers. The appraisers typically determine the value of the real estate by utilizing an income or market valuation approach. If an appraisal is not available, the fair value may be determined by using a discounted cash flow analysis. Fair value on other collateral such as business assets is typically ascertained by assessing, either singularly or some combination of, asset appraisals, accounts receivable aging reports, inventory listings andor customer financial statements. Both appraised values and values based on borrower’s financial information are discounted as considered appropriate based on age and quality of the information and current market conditions.
PART II: ITEM 8. FINANCIAL STATEMENTS AND SUPPLEMENTARY DATA
NOTES TO CONSOLIDATED FINANCIAL STATEMENTS
(table dollar amounts in thousands, except share data)
UNOBSERVABLE (LEVEL 3) INPUTS
The following table presents quantitative information about unobservable inputs used in recurring and nonrecurring Level 3 fair value measurements, other than goodwill, at December 31, 20172019 and 2016.2018.
|
| | | | | | | | | |
| December 31, 2019 | Fair Value | | Valuation Technique | | Unobservable Inputs | | Range (Weighted-Average) |
| State and municipal securities | $ | 2,858 |
| | Discounted cash flow | | Maturity Call Date
US Muni BQ curve
Discount rate | | 1 month to 15 years
A- to BBB-
2% - 5% |
| | | | | | | | |
| Corporate obligations and U.S. Government-sponsored mortgage backed securities | $ | 35 |
| | Discounted cash flow | | Risk free rate
plus Premium for illiquidity | | 3 month LIBOR
plus 200 bps |
| | | | | | | | |
| Impaired loans (collateral dependent) | $ | 5,653 |
| | Collateral based measurements | | Discount to reflect current market conditions and ultimate collectability | | 0% - 10% (1%) |
| | | | | | | | |
| Other real estate owned | $ | 194 |
| | Appraisals | | Discount to reflect current market conditions | | 0% - 37% (37%) |
|
| | | | | | | | | |
| December 31, 2017 | Fair Value | | Valuation Technique | | Unobservable Inputs | | Range (Weighted-Average) |
| State and municipal securities | $ | 3,943 |
| | Discounted cash flow | | Maturity Call Date
US Muni BQ curve
Discount rate | | 1 month to 20 years
A- to BBB-
.69% - 5% |
| | | | | | | | |
| Corporate obligations and Equity securities | $ | 35 |
| | Discounted cash flow | | Risk free rate
plus Premium for illiquidity | | 3 month LIBOR
plus 200 bps |
| | | | | | | | |
| Impaired loans (collateral dependent) | $ | 9,576 |
| | Collateral based measurements | | Discount to reflect current market conditions and ultimate collectability | | 0% - 10% (1%) |
| | | | | | | | |
| Other real estate owned | $ | 859 |
| | Appraisals | | Discount to reflect current market conditions | | 0% - 10% (2%) |
|
| | | | | | | | | |
| December 31, 2018 | Fair Value | | Valuation Technique | | Unobservable Inputs | | Range (Weighted-Average) |
| State and municipal securities | $ | 3,293 |
| | Discounted cash flow | | Maturity Call Date
US Muni BQ curve
Discount rate | | 1 month to 20 years
A- to BBB-
.69% - 5% |
| | | | | | | | |
| Corporate obligations and U.S. Government-sponsored mortgage backed securities | $ | 35 |
| | Discounted cash flow | | Risk free rate
plus Premium for illiquidity | | 3 month LIBOR
plus 200 bps |
| | | | | | | | |
| Impaired loans (collateral dependent) | $ | 11,866 |
| | Collateral based measurements | | Discount to reflect current market conditions and ultimate collectability | | 0% - 10% (6%) |
| | | | | | | | |
| Other real estate owned | $ | 657 |
| | Appraisals | | Discount to reflect current market conditions | | 0% - 10% (4%) |
|
| | | | | | | | | |
| December 31, 2016 | Fair Value | | Valuation Technique | | Unobservable Inputs | | Range (Weighted-Average) |
| State and municipal securities | $ | 5,134 |
| | Discounted cash flow | | Maturity Call Date
US Muni BQ curve
Discount rate | | 1 month to 20 years
A- to BBB-
.69% - 5% |
| | | | | | | | |
| Corporate obligations and Equity securities | $ | 35 |
| | Discounted cash flow | | Risk free rate
plus Premium for illiquidity | | 3 month LIBOR
plus 200 bps |
| | | | | | | | |
| Impaired loans (collateral dependent) | $ | 15,318 |
| | Collateral based measurements | | Discount to reflect current market conditions and ultimate collectability | | 0% - 10% (1%) |
| | | | | | | | |
| Other real estate owned | $ | 1,612 |
| | Appraisals | | Discount to reflect current market conditions | | 0% - 10% (9%) |
The following is a discussion of the sensitivity of significant unobservable inputs, the interrelationships between those inputs and other unobservable inputs used in recurring fair value measurement and how those inputs might magnify or mitigate the effect of changes in the unobservable inputs on the fair value measurement.
State and Municipal Securities, Corporate Obligations, and EquityU.S. Government-sponsored Mortgage Backed Securities
The significant unobservable inputs used in the fair value measurement of the Corporation's state and municipal securities, corporate obligations
and equityU.S. Government-sponsored mortgage backed securities are premiums for unrated securities and marketability discounts. Significant
increases or decreases in either of those inputs in isolation would result in a significantly lower or higher fair value measurement. Generally,
changes in on inputeither of those inputs will not affect the other input.
PART II: ITEM 8. FINANCIAL STATEMENTS AND SUPPLEMENTARY DATA
NOTES TO CONSOLIDATED FINANCIAL STATEMENTS
(table dollar amounts in thousands, except share data)
FAIR VALUE OF FINANCIAL INSTRUMENTS
The following table presents estimated fair values of the Corporation's financial instruments and the level within the fair value hierarchy in which the fair value measurements fall at December 31, 20172019 and 2016.2018.
| | | | 2017 | 2019 |
| | Carrying
Amount |
| Quoted Prices in Active Markets for Identical Assets
(Level 1) |
| Significant Other Observable Inputs
(Level 2) |
| Significant Unobservable Inputs
(Level 3) | Carrying
Amount |
| Quoted Prices in Active Markets for Identical Assets
(Level 1) |
| Significant Other Observable Inputs
(Level 2) |
| Significant Unobservable Inputs
(Level 3) |
| Assets at December 31: | |
|
|
| |
| | |
|
|
| |
| |
| Cash and cash equivalents | $ | 154,905 |
|
| $ | 154,905 |
|
|
|
|
|
|
| $ | 177,201 |
|
| $ | 177,201 |
|
| $ | — |
|
| $ | — |
|
| Interest-bearing time deposits | 35,027 |
|
| 35,027 |
|
|
|
|
|
|
| 118,263 |
|
| 118,263 |
|
| — |
|
| — |
|
| Investment securities available for sale | 999,947 |
|
|
|
|
| $ | 995,969 |
|
| $ | 3,978 |
| 1,790,025 |
|
| — |
|
| 1,787,132 |
|
| 2,893 |
|
| Investment securities held to maturity | 560,655 |
|
|
|
|
| 556,305 |
|
| 11,903 |
| 806,038 |
|
| — |
|
| 799,884 |
|
| 27,682 |
|
| Loans held for sale | 7,216 |
|
|
|
|
| 7,216 |
|
|
|
| 9,037 |
|
| — |
|
| 9,037 |
|
| — |
|
| Loans | 6,676,167 |
|
|
|
|
|
|
|
| 6,534,877 |
| 8,379,026 |
|
| — |
|
| — |
|
| 8,335,340 |
|
| Federal Home Loan Bank stock | 23,825 |
|
|
|
|
| 23,825 |
|
|
|
| 28,736 |
|
| — |
|
| 28,736 |
|
| — |
|
| Interest rate swap asset | 7,323 |
|
|
|
|
| 7,323 |
|
|
|
| 27,855 |
|
| — |
|
| 27,855 |
|
| — |
|
| Interest receivable | 37,130 |
|
|
|
|
| 37,130 |
|
|
|
| 48,901 |
|
| — |
|
| 48,901 |
|
| — |
|
| Liabilities at December 31: |
|
|
|
|
|
|
|
|
|
|
|
|
|
|
| Deposits | $ | 7,172,530 |
|
| $ | 5,741,019 |
|
| $ | 1,406,526 |
|
|
|
| $ | 9,839,956 |
|
| $ | 8,146,745 |
|
| $ | 1,675,202 |
|
| $ | — |
|
| Borrowings: |
|
|
|
|
|
|
|
|
|
|
|
|
|
|
| Federal funds purchased | 144,038 |
|
|
|
|
| 144,038 |
|
|
|
| 55,000 |
|
| — |
|
| 55,000 |
|
| — |
|
| Securities sold under repurchase agreements | 136,623 |
|
|
|
|
| 136,562 |
|
|
|
| 187,946 |
|
| — |
|
| 187,801 |
|
| — |
|
| Federal Home Loan Bank advances | 414,377 |
|
|
|
|
| 361,085 |
|
|
|
| 351,072 |
|
| — |
|
| 352,581 |
|
| — |
|
| Subordinated debentures and term loans | 139,349 |
|
|
|
|
| 120,085 |
|
|
|
| 138,685 |
|
| — |
|
| 123,571 |
|
| — |
|
| Interest rate swap liability | 8,688 |
|
|
|
|
| 8,688 |
|
|
|
| 29,299 |
|
| — |
|
| 29,299 |
|
| — |
|
| Interest payable | 4,390 |
|
|
|
|
| 4,390 |
|
|
|
| 6,754 |
|
| — |
|
| 6,754 |
|
| — |
|
|
| | | | | | | | | | | | | | | |
| | 2018 |
| | Carrying
Amount |
| Quoted Prices in Active Markets for Identical Assets
(Level 1) |
| Significant Other Observable Inputs
(Level 2) |
| Significant Unobservable Inputs
(Level 3) |
| Assets at December 31: | |
|
|
| |
| |
| Cash and cash equivalents | $ | 139,247 |
|
| $ | 139,247 |
|
| $ | — |
|
| $ | — |
|
| Interest-bearing time deposits | 36,963 |
|
| 36,963 |
|
| — |
|
| — |
|
| Investment securities available for sale | 1,142,195 |
|
| — |
|
| 1,138,867 |
|
| 3,328 |
|
| Investment securities held to maturity | 490,387 |
|
| — |
|
| 481,377 |
|
| 7,840 |
|
| Loans held for sale | 4,778 |
|
| — |
|
| 4,778 |
|
| — |
|
| Loans | 7,143,915 |
|
| — |
|
| — |
|
| 7,004,193 |
|
| Federal Home Loan Bank stock | 24,588 |
|
| — |
|
| 24,588 |
|
| — |
|
| Interest rate swap asset | 12,083 |
|
| — |
|
| 12,083 |
|
| — |
|
| Interest receivable | 40,881 |
|
| — |
|
| 40,881 |
|
| — |
|
| Liabilities at December 31: |
|
|
|
|
|
|
|
| Deposits | $ | 7,754,593 |
|
| $ | 6,267,879 |
|
| $ | 1,464,129 |
|
| $ | — |
|
| Borrowings: |
|
|
|
|
|
|
|
| Federal funds purchased | 104,000 |
|
| — |
|
| 104,000 |
|
| — |
|
| Securities sold under repurchase agreements | 113,512 |
|
| — |
|
| 113,437 |
|
| — |
|
| Federal Home Loan Bank advances | 314,986 |
|
| — |
|
| 318,728 |
|
| — |
|
| Subordinated debentures and term loans | 138,463 |
|
| — |
|
| 127,298 |
|
| — |
|
| Interest rate swap liability | 12,636 |
|
| — |
|
| 12,636 |
|
| — |
|
| Interest payable | 5,607 |
|
| — |
|
| 5,607 |
|
| — |
|
|
| | | | | | | | | | | | | | | |
| | 2016 |
| | Carrying
Amount |
| Quoted Prices in Active Markets for Identical Assets
(Level 1) |
| Significant Other Observable Inputs
(Level 2) |
| Significant Unobservable Inputs
(Level 3) |
| Assets at December 31: | |
|
|
| |
| |
| Cash and cash equivalents | $ | 127,927 |
|
| $ | 127,927 |
|
|
|
|
|
|
|
| Interest-bearing time deposits | 24,459 |
|
| 24,459 |
|
|
|
|
|
|
|
| Investment securities available for sale | 696,862 |
|
| 18,765 |
|
| $ | 672,928 |
|
| $ | 5,169 |
|
| Investment securities held to maturity | 607,643 |
|
|
|
|
| 597,246 |
|
| 14,687 |
|
| Loans held for sale | 2,929 |
|
|
|
|
| 2,929 |
|
|
|
|
| Loans | 5,073,608 |
|
|
|
|
|
|
|
| 4,933,552 |
|
| Federal Home Loan Bank stock | 17,964 |
|
|
|
|
| 17,964 |
|
|
|
|
| Interest rate swap asset | 6,310 |
|
|
|
|
| 6,310 |
|
|
|
|
| Interest receivable | 26,194 |
|
|
|
|
| 26,194 |
|
|
|
|
| Liabilities at December 31: |
|
|
|
|
|
|
|
| Deposits | $ | 5,556,498 |
|
| $ | 4,427,605 |
|
| $ | 1,111,491 |
|
|
|
|
| Borrowings: |
|
|
|
|
|
|
|
| Federal funds purchased | 120,349 |
|
|
|
|
| 120,349 |
|
|
|
|
| Securities sold under repurchase agreements | 146,480 |
|
|
|
|
| 146,449 |
|
|
|
|
| Federal Home Loan Bank advances | 298,923 |
|
|
|
|
| 297,465 |
|
|
|
|
| Subordinated debentures and term loans | 128,445 |
|
|
|
|
| 105,930 |
|
|
|
|
| Interest rate swap liability | 8,477 |
|
|
|
|
| 8,477 |
|
|
|
|
| Interest payable | 3,110 |
|
|
|
| 3,110 |
|
|
|
PART II: ITEM 8. FINANCIAL STATEMENTS AND SUPPLEMENTARY DATA
NOTES TO CONSOLIDATED FINANCIAL STATEMENTS
(table dollar amounts in thousands, except share data)
The following methods were used to estimate the fair value of all other financial instruments recognized in the Consolidated Balance Sheets at amounts other than fair value.
Cash and cash equivalents: The fair value of cash and cash equivalents approximates carrying value.
Interest-bearing time deposits: The fair value of interest-bearing time deposits approximates carrying value.
Investment securities: Fair value is based on quoted market prices, if available. If a quoted market price is not available, fair value is estimated using quoted market prices for similar securities. The fair value of certain Level III securities is estimated using discounted cash flow analysis, using interest rates currently being offered on investments with similar maturities and investment quality.
Loans held for sale: The carrying amount approximates fair value due to the short duration between origination and date of sale.
Loans: The fair value for loans is estimated using discounted cash flow analysis, using interest rates currently being offered for loans with similar terms to borrowers of similar credit quality. See Impaired Loans above.
Federal Home Loan Bank stock: The fair value of Federal Home Loan Bank stock is based on the price which it may be resold to the Federal Home Loan Bank.
Derivative instruments: The fair value of interest rate swaps reflect the estimated amounts that would have been received to terminate these contracts at the reporting date based upon pricing or valuation models applied to current market information. Interest rate caps are valued using the market standard methodology of discounting the future expected cash receipts that would occur if variable interest rates rose above the strike rate of the caps. The projected cash receipts on the caps are based on an expectation of future interest rates derived from observed market interest rate curves and volatilities.
Interest receivable and Interest payable: The fair value of interest receivable/payable approximates carrying value.
Deposits: The fair values of noninterest-bearing and interest-bearing demand accounts and savings deposits are equal to the amount payable on demand at the balance sheet date. The carrying amounts for variable rate, fixed-term certificates of deposit approximate their fair values at the balance sheet date. Fair values for fixed-rate certificates of deposit and other time deposits are estimated using a discounted cash flow calculation that applies interest rates currently being offered to a schedule of aggregated expected monthly maturities on such time deposits.
Borrowings: The fair value of Federal Funds purchased approximates the carrying amount. The fair value of all other borrowings is estimated using a discounted cash flow calculation, based on current rates for similar debt.
NOTE 1516
COMMITMENTS AND CONTINGENT LIABILITIES
In the normal course of business there are outstanding commitments and contingent liabilities, such as commitments to extend credit and standby letters of credit, which are not included in the accompanying financial statements. The Corporation's exposure to credit loss in the event of nonperformance by the other party to the financial instruments for commitments to extend credit and standby letters of credit is represented by the contractual or notional amount of those instruments. The Bank uses the same credit policies in making such commitments as they do for instruments that are included in the consolidated balance sheets.
Financial instruments, whose contract amount represents credit risk as of December 31, were as follows:
|
| | | | | | | |
| | 2019 |
| 2018 |
| Amounts of commitments: | |
| |
| Loan commitments to extend credit | $ | 3,005,064 |
|
| $ | 2,684,806 |
|
| Standby letters of credit | $ | 30,200 |
|
| $ | 32,862 |
|
|
| | | | | | | |
| | 2017 |
| 2016 |
| Amounts of commitments: | |
| |
| Loan commitments to extend credit | $ | 2,482,641 |
|
| $ | 2,057,878 |
|
| Standby letters of credit | $ | 43,526 |
|
| $ | 46,010 |
|
Commitments to extend credit are agreements to lend to a customer, as long as there is no violation of any condition established in the contract. Commitments generally have fixed expiration dates or other termination clauses and may require payment of a fee. Since many of the commitments are expected to expire without being drawn upon, the total commitment amounts do not necessarily represent future cash requirements. The Bank evaluates each customer’s creditworthiness on a case-by-case basis. The amount of collateral obtained, if deemed necessary by the Bank upon extension of credit, is based on management's credit evaluation. Collateral held varies, but may include accounts receivable, inventory, property and equipment, and income-producing commercial properties.
Standby letters of credit are conditional commitments issued by the Bank to guarantee the performance of a customer to a third party.
The Corporation and subsidiaries are also subject to claims and lawsuits, which arise primarily in the ordinary course of business. It is the opinion of management that the disposition or ultimate resolution of such claims and lawsuits will not have a material adverse effect on the consolidated financial position of the Corporation.
PART II: ITEM 8. FINANCIAL STATEMENTS AND SUPPLEMENTARY DATA
NOTES TO CONSOLIDATED FINANCIAL STATEMENTS
(table dollar amounts in thousands, except share data)
NOTE 1617
ACCUMULATED OTHER COMPREHENSIVE INCOME (LOSS)
The following table summarizes the changes in the balances of each component of accumulated other comprehensive income (loss), net of tax, as of December 31, 20172019 and 2016:2018:
|
| | | | | | | | | | | | | | | |
| Accumulated Other Comprehensive Income (Loss) |
| Unrealized Gains (Losses) on Securities Available for Sale |
| Unrealized Gains (Losses) on Cash Flow Hedges |
| Unrealized Gains (Losses) on Defined Benefit Plans |
| Total |
| Balance at December 31, 2018 | $ | (6,343 | ) |
| $ | (559 | ) |
| $ | (14,520 | ) |
| $ | (21,422 | ) |
| Other comprehensive income before reclassifications | 48,703 |
|
| (846 | ) |
| 4,579 |
|
| 52,436 |
|
| Amounts reclassified from accumulated other comprehensive income | (3,488 | ) |
| 264 |
|
| 84 |
|
| (3,140 | ) |
| Period change | 45,215 |
|
| (582 | ) |
| 4,663 |
|
| 49,296 |
|
| Balance at December 31, 2019 | $ | 38,872 |
|
| $ | (1,141 | ) |
| $ | (9,857 | ) |
| $ | 27,874 |
|
|
|
|
|
|
|
|
|
|
|
|
|
|
|
|
|
| Balance at December 31, 2017 | $ | 8,970 |
|
| $ | (1,125 | ) |
| $ | (10,753 | ) |
| $ | (2,908 | ) |
| Other comprehensive income before reclassifications | (13,872 | ) |
| 437 |
|
| (1,435 | ) |
| (14,870 | ) |
| Amounts reclassified from accumulated other comprehensive income | (3,373 | ) |
| 371 |
|
| (16 | ) |
| (3,018 | ) |
| Period change | (17,245 | ) |
| 808 |
|
| (1,451 | ) |
| (17,888 | ) |
| Reclassification adjustment under ASU 2018-02 | 1,932 |
|
| (242 | ) |
| (2,316 | ) |
| (626 | ) |
| Balance at December 31, 2018 | $ | (6,343 | ) |
| $ | (559 | ) |
| $ | (14,520 | ) |
| $ | (21,422 | ) |
PART II: ITEM 8. FINANCIAL STATEMENTS AND SUPPLEMENTARY DATA
NOTES TO CONSOLIDATED FINANCIAL STATEMENTS
(table dollar amounts in thousands, except share data)
|
| | | | | | | | | | | | | | | |
| Accumulated Other Comprehensive Income (Loss) |
| Unrealized Gains (Losses) on Securities Available for Sale |
| Unrealized Gains (Losses) on Cash Flow Hedges |
| Unrealized Gains (Losses) on Defined Benefit Plans |
| Total |
| Balance at December 31, 2016 | $ | 1,035 |
|
| $ | (1,774 | ) |
| $ | (12,842 | ) |
| $ | (13,581 | ) |
| Other comprehensive income before reclassifications | 9,645 |
|
| 9 |
|
| 2,686 |
|
| 12,340 |
|
| Amounts reclassified from accumulated other comprehensive income | (1,710 | ) |
| 640 |
|
| (597 | ) |
| (1,667 | ) |
| Period change | 7,935 |
|
| 649 |
|
| 2,089 |
|
| 10,673 |
|
| Balance at December 31, 2017 | $ | 8,970 |
|
| $ | (1,125 | ) |
| $ | (10,753 | ) |
| $ | (2,908 | ) |
|
|
|
|
|
|
|
|
|
|
|
|
|
|
|
|
| Balance at December 31, 2015 | $ | 12,325 |
|
| $ | (2,347 | ) |
| $ | (11,340 | ) |
| $ | (1,362 | ) |
| Other comprehensive income before reclassifications | (9,087 | ) |
| (240 | ) |
| (470 | ) |
| (9,797 | ) |
| Amounts reclassified from accumulated other comprehensive income | (2,203 | ) |
| 813 |
|
| (1,032 | ) |
| (2,422 | ) |
| Period change | (11,290 | ) |
| 573 |
|
| (1,502 | ) |
| (12,219 | ) |
| Balance at December 31, 2016 | $ | 1,035 |
|
| $ | (1,774 | ) |
| $ | (12,842 | ) |
| $ | (13,581 | ) |
The following table presents the reclassification adjustments out of accumulated other comprehensive income (loss) that were included in net income in the Consolidated Condensed Statements of Income for the years ended December 31, 2017, 20162019, 2018 and 2015:2017:
| |
| Amount Reclassified from Accumulated Other Comprehensive Income (Loss) For the Year Ended December 31, |
| Amount Reclassified from Accumulated Other Comprehensive Income (Loss) For the Year Ended December 31, |
|
| Details about Accumulated Other Comprehensive Income (Loss) Components | 2017 |
| 2016 |
| 2015 |
| Affected Line Item in the Statements of Income | 2019 |
| 2018 |
| 2017 |
| Affected Line Item in the Statements of Income |
Unrealized gains (losses) on available for sale securities (1) |
|
|
|
|
|
|
|
|
|
|
|
|
| Realized securities gains reclassified into income | $ | 2,631 |
|
| $ | 3,389 |
|
| $ | 2,670 |
|
| Other income - net realized gains on sales of available for sale securities | $ | 4,415 |
|
| $ | 4,269 |
|
| $ | 2,631 |
|
| Other income - net realized gains on sales of available for sale securities |
| Related income tax expense | (921 | ) |
| (1,186 | ) |
| (934 | ) |
| Income tax expense | (927 | ) |
| (896 | ) |
| (921 | ) |
| Income tax expense |
| $ | 1,710 |
|
| $ | 2,203 |
|
| $ | 1,736 |
|
| $ | 3,488 |
|
| $ | 3,373 |
|
| $ | 1,710 |
|
|
|
|
|
|
|
|
|
|
|
|
|
|
|
Unrealized gains (losses) on cash flow hedges (2) |
|
|
|
|
|
|
|
|
|
|
|
|
| Interest rate contracts | $ | (985 | ) |
| $ | (1,250 | ) |
| $ | (1,427 | ) |
| Interest expense - subordinated debentures and term loans | $ | (334 | ) |
| $ | (470 | ) |
| $ | (985 | ) |
| Interest expense - subordinated debentures and term loans |
| Related income tax benefit | 345 |
|
| 437 |
|
| 499 |
|
| Income tax expense | 70 |
|
| 99 |
|
| 345 |
|
| Income tax expense |
| $ | (640 | ) |
| $ | (813 | ) |
| $ | (928 | ) |
| $ | (264 | ) |
| $ | (371 | ) |
| $ | (640 | ) |
|
|
|
|
|
|
|
|
|
|
|
|
|
|
| Unrealized gains (losses) on defined benefit plans |
|
|
|
|
|
|
|
|
|
|
|
|
| Amortization of net loss and prior service costs | $ | 806 |
|
| $ | 1,588 |
|
| $ | 305 |
|
| Other expenses - salaries and employee benefits | $ | (106 | ) |
| $ | 20 |
|
| $ | 806 |
|
| Other expenses - salaries and employee benefits |
| Related income tax benefit (expense) | (209 | ) |
| (556 | ) |
| (107 | ) |
| Income tax expense | 22 |
|
| (4 | ) |
| (209 | ) |
| Income tax expense |
| $ | 597 |
|
| $ | 1,032 |
|
| $ | 198 |
|
| $ | (84 | ) |
| $ | 16 |
|
| $ | 597 |
|
|
|
|
|
|
|
|
|
|
|
|
|
|
|
| Total reclassifications for the period, net of tax | $ | 1,667 |
|
| $ | 2,422 |
|
| 1,006 |
|
| $ | 3,140 |
|
| $ | 3,018 |
|
| 1,667 |
|
|
(1) For additional detail related to unrealized gains (losses) on available for sale securities and related amounts reclassified from accumulated other comprehensive income see NOTE 4. INVESTMENT SECURITIES.
(2) For additional detail related to unrealized gains (losses) on cash flow hedges and related amounts reclassified from accumulated other comprehensive income see NOTE 13.14. DERIVATIVE INSTRUMENTS AND HEDGING ACTIVITIES.
PART II: ITEM 8. FINANCIAL STATEMENTS AND SUPPLEMENTARY DATA
NOTES TO CONSOLIDATED FINANCIAL STATEMENTS
(table dollar amounts in thousands, except share data)
NOTE 1718
REGULATORY CAPITAL AND DIVIDENDS
Regulatory Capital
Capital adequacy is an important indicator of financial stability and performance. The Corporation and the Bank are subject to various regulatory capital requirements administered by the federal banking agencies and are assigned to a capital category. The assigned capital category is largely determined by four ratios that are calculated according to the regulations: total risk-based capital, tier 1 risk-based capital, common equity tier 1 capital,CET1, and tier 1 leverage ratios. The ratios are intended to measure capital relative to assets and credit risk associated with those assets and off-balance sheet exposures of the entity. The capital category assigned to an entity can also be affected by qualitative judgments made by regulatory agencies about the risk inherent in the entity's activities that are not part of the calculated ratios.
There are five capital categories defined in the regulations, ranging from well capitalized to critically undercapitalized. Classification of a bank in any of the undercapitalized categories can result in actions by regulators that could have a material effect on a bank's operations. Quantitative measures established by regulation to ensure capital adequacy require the Bank to maintain minimum amounts and ratios of total and tier 1 capital to risk-weighted assets, and of tier 1 capital to average assets, or leverage ratio, all of which are calculated as defined in the
regulations. Banks with lower capital levels are deemed to be undercapitalized, significantly undercapitalized or critically undercapitalized, depending on their actual levels. The appropriate federal regulatory agency may also downgrade a bank to the next lower capital category upon a determination that the bank is in an unsafe or unsound practice. Banks are required to monitor closely their capital levels and to notify their appropriate regulatory agency of any basis for a change in capital category.
Basel III was effective for the Corporation on January 1, 2015. Basel III requires the Corporation and the Bank to maintain a minimum ratio of CET1 capital to risk weighted assets, as defined in the regulation. Under the new Basel III rules, in order to avoid limitations on capital distributions, including dividends, the Corporation must hold a capital conservation buffer above the adequately capitalized CET1 capital to risk-weighted assets ratio. The capital conservation buffer is beingwas phased in from zero percent in 2015 to the fully-implemented 2.50 percent by 2019. As of January 1, 2017, the Corporation was required to hold a capital conservation buffer of 1.25 percent, which amount increases by 0.625 percent in each successive year until 2019. Under Basel III, the Corporation and Bank elected to opt-out of including AOCIaccumulated other comprehensive income in regulatory capital.
PART II: ITEM 8. FINANCIAL STATEMENTS AND SUPPLEMENTARY DATA
NOTES TO CONSOLIDATED FINANCIAL STATEMENTS
(table dollar amounts in thousands, except share data)
As of December 31, 2017,2019, the Bank met all capital adequacy requirements to be considered well capitalized. There is no threshold for well capitalized status for bank holding companies. The Corporation's and Bank's actual and required capital ratios as of December 31, 20172019 and December 31, 20162018 were as follows:
|
| | | | | | | | | | | | | | | | | | | | |
| | | | | | Prompt Corrective Action Thresholds |
| | Actual | | Adequately Capitalized | | Well Capitalized |
| December 31, 2019 | Amount | | Ratio | | Amount | | Ratio | | Amount | | Ratio |
| Total risk-based capital to risk-weighted assets | | | | | | | | | | | |
| First Merchants Corporation | $ | 1,400,617 |
| | 14.29 | % | | $ | 783,946 |
| | 8.00 | % | | N/A |
| | N/A |
|
| First Merchants Bank | 1,267,649 |
| | 12.87 |
| | 787,753 |
| | 8.00 |
| | $ | 984,691 |
| | 10.00 | % |
| Tier 1 capital to risk-weighted assets | | | | | | | | | | | |
| First Merchants Corporation | $ | 1,255,333 |
| | 12.81 | % | | $ | 587,960 |
| | 6.00 | % | | N/A |
| | N/A |
|
| First Merchants Bank | 1,187,365 |
| | 12.06 |
| | 590,815 |
| | 6.00 |
| | $ | 787,753 |
| | 8.00 | % |
| Common equity tier 1 capital to risk-weighted assets | | | | | | | | | | | |
| First Merchants Corporation | $ | 1,188,970 |
| | 12.13 | % | | $ | 440,970 |
| | 4.50 | % | | N/A |
| | N/A |
|
| First Merchants Bank | 1,187,365 |
| | 12.06 |
| | 443,111 |
| | 4.50 |
| | $ | 640,049 |
| | 6.50 | % |
| Tier 1 capital to average assets | | | | | | | | | | | |
| First Merchants Corporation | $ | 1,255,333 |
| | 10.54 | % | | $ | 476,383 |
| | 4.00 | % | | N/A |
| | N/A |
|
| First Merchants Bank | 1,187,365 |
| | 9.99 |
| | 475,564 |
| | 4.00 |
| | $ | 594,455 |
| | 5.00 | % |
| | | | | | | | | | | | |
| | | | | |
|
|
|
|
| Prompt Corrective Action Thresholds |
| | Actual |
| Adequately Capitalized |
| Well Capitalized |
| December 31, 2018 | Amount |
| Ratio |
| Amount |
| Ratio |
| Amount |
| Ratio |
| Total risk-based capital to risk-weighted assets |
|
|
|
|
|
|
|
|
|
|
|
| First Merchants Corporation | $ | 1,177,725 |
|
| 14.61 | % |
| $ | 644,871 |
|
| 8.00 | % |
| N/A |
|
| N/A |
|
| First Merchants Bank | 1,092,602 |
|
| 13.46 |
|
| 649,531 |
|
| 8.00 |
|
| $ | 811,914 |
|
| 10.00 | % |
| Tier 1 capital to risk-weighted assets |
|
|
|
|
|
|
|
|
|
|
|
| First Merchants Corporation | $ | 1,032,173 |
|
| 12.80 | % |
| $ | 483,653 |
|
| 6.00 | % |
| N/A |
|
| N/A |
|
| First Merchants Bank | 1,012,050 |
|
| 12.47 |
|
| 487,148 |
|
| 6.00 |
|
| $ | 649,531 |
|
| 8.00 | % |
| Common equity tier 1 capital to risk-weighted assets |
|
|
|
|
|
|
|
|
|
|
|
| First Merchants Corporation | $ | 966,032 |
|
| 11.98 | % |
| $ | 362,740 |
|
| 4.50 | % |
| N/A |
|
| N/A |
|
| First Merchants Bank | 1,012,050 |
|
| 12.47 |
|
| 365,361 |
|
| 4.50 |
|
| $ | 527,744 |
|
| 6.50 | % |
| Tier 1 capital to average assets |
|
|
|
|
|
|
|
|
|
|
|
| First Merchants Corporation | $ | 1,032,173 |
|
| 10.91 | % |
| $ | 378,379 |
|
| 4.00 | % |
| N/A |
|
| N/A |
|
| First Merchants Bank | 1,012,050 |
|
| 10.70 |
|
| 379,397 |
|
| 4.00 |
|
| $ | 472,996 |
|
| 5.00 | % |
|
| | | | | | | | | | | | | | | | | | | | |
| | | | | | Prompt Corrective Action Thresholds |
| | Actual | | Adequately Capitalized | | Well Capitalized |
| December 31, 2017 | Amount | | Ratio | | Amount | | Ratio | | Amount | | Ratio |
| Total risk-based capital to risk-weighted assets | | | | | | | | | | | |
| First Merchants Corporation | $ | 1,048,757 |
| | 13.69 | % | | $ | 612,848 |
| | 8.00 | % | | N/A |
| | N/A |
|
| First Merchants Bank | 1,016,355 |
| | 13.17 |
| | 617,477 |
| | 8.00 |
| | $ | 771,847 |
| | 10.00 | % |
| Tier 1 capital to risk-weighted assets | | | | | | | | | | | |
| First Merchants Corporation | $ | 908,725 |
| | 11.86 | % | | $ | 459,636 |
| | 6.00 | % | | N/A |
| | N/A |
|
| First Merchants Bank | 941,323 |
| | 12.20 |
| | 463,108 |
| | 6.00 |
| | $ | 617,477 |
| | 8.00 | % |
| Common equity tier 1 capital to risk-weighted assets | | | | | | | | | | | |
| First Merchants Corporation | $ | 842,806 |
| | 11.00 | % | | $ | 344,727 |
| | 4.50 | % | | N/A |
| | N/A |
|
| First Merchants Bank | 941,323 |
| | 12.20 |
| | 347,331 |
| | 4.50 |
| | $ | 501,700 |
| | 6.50 | % |
| Tier 1 capital to average assets | | | | | | | | | | | |
| First Merchants Corporation | $ | 908,725 |
| | 10.43 | % | | $ | 348,407 |
| | 4.00 | % | | N/A |
| | N/A |
|
| First Merchants Bank | 941,323 |
| | 10.83 |
| | 347,794 |
| | 4.00 |
| | $ | 434,742 |
| | 5.00 | % |
| | | | | | | | | | | | |
| | | | | |
|
|
|
|
| Prompt Corrective Action Thresholds |
| | Actual |
| Adequately Capitalized |
| Well Capitalized |
| December 31, 2016 | Amount |
| Ratio |
| Amount |
| Ratio |
| Amount |
| Ratio |
| Total risk-based capital to risk-weighted assets |
|
|
|
|
|
|
|
|
|
|
|
| First Merchants Corporation | $ | 851,521 |
|
| 14.21 | % |
| $ | 479,470 |
|
| 8.00 | % |
| N/A |
|
| N/A |
|
| First Merchants Bank | 800,598 |
|
| 13.30 |
|
| 481,490 |
|
| 8.00 |
|
| $ | 601,862 |
|
| 10.00 | % |
| Tier 1 capital to risk-weighted assets |
|
|
|
|
|
|
|
|
|
|
|
| First Merchants Corporation | $ | 720,484 |
|
| 12.02 | % |
| $ | 359,603 |
|
| 6.00 | % |
| N/A |
|
| N/A |
|
| First Merchants Bank | 734,561 |
|
| 12.20 |
|
| 361,117 |
|
| 6.00 |
|
| $ | 481,490 |
|
| 8.00 | % |
| Common equity tier 1 capital to risk-weighted assets |
|
|
|
|
|
|
|
|
|
|
|
| First Merchants Corporation | $ | 665,445 |
|
| 11.10 | % |
| $ | 269,702 |
|
| 4.50 | % |
| N/A |
|
| N/A |
|
| First Merchants Bank | 734,561 |
|
| 12.20 |
|
| 270,838 |
|
| 4.50 |
|
| $ | 391,210 |
|
| 6.50 | % |
| Tier 1 capital to average assets |
|
|
|
|
|
|
|
|
|
|
|
| First Merchants Corporation | $ | 720,484 |
|
| 10.54 | % |
| $ | 273,456 |
|
| 4.00 | % |
| N/A |
|
| N/A |
|
| First Merchants Bank | 734,561 |
|
| 10.78 |
|
| 272,461 |
|
| 4.00 |
|
| $ | 340,576 |
|
| 5.00 | % |
PART II: ITEM 8. FINANCIAL STATEMENTS AND SUPPLEMENTARY DATA
NOTES TO CONSOLIDATED FINANCIAL STATEMENTS
(table dollar amounts in thousands, except share data)
Management believes that all of the above capital ratios are meaningful measurements for evaluating the safety and soundness of the Corporation. Traditionally, the banking regulators have assessed bank and bank holding company capital adequacy based on both the amount and the composition of capital, the calculation of which is prescribed in federal banking regulations. The Federal Reserve focuses its assessment of capital adequacy on a component of Tier 1 capital known as CET1. Because the Federal Reserve has long indicated that voting common shareholders' equity (essentially Tier 1 risk-based capital less preferred stock and non-controlling interest in subsidiaries) generally should be the dominant element in Tier 1 risk-based capital, this focus on CET1 is consistent with existing capital adequacy categories. Tier I regulatory capital consists primarily of total stockholders’ equity and subordinated debentures issued to business trusts categorized as qualifying borrowings, less non-qualifying intangible assets and unrealized net securities gains or losses.
Because these measures are not defined in GAAP, they are considered non-GAAP financial measures. Non-GAAP financial measures have inherent limitations, are not required to be uniformly applied, and are not audited. Although these non-GAAP financial measures are frequently used by investors to evaluate a company, they have limitations as analytical tools, and should not be considered in isolation, or as a substitute for analyses of results as reported under GAAP. For a reconciliation of GAAP measures to regulatory measures (non-GAAP), see additional details within the “Capital” section of Management’s Discussion and Analysis of Financial Condition and Results of Operations included as Item 7 of this Annual Report on Form 10-K.
Dividends
The Corporation's principal source of funds for dividend payments to shareholders is dividends received from the Bank. Banking regulations limit the maximum amount of dividends that a bank may pay without requesting prior approval of regulatory agencies. Under these regulations, the amount of dividends that may be paid in any calendar year is limited to the bank’s retained net income (as defined) for the current year plus those for the previous two years, subject to the capital requirements described above. As of December 31, 2017,2019, the amount available without prior regulatory approval for 20182020 dividends from the Corporation’s subsidiaries (both banking and non-banking) was $154,949,000.$189,371,000.
Additionally, the Corporation has a Dividend Reinvestment and Stock Purchase Plan, enabling stockholders to elect to have their cash dividends on all shares automatically reinvested in additional shares of the Corporation’s common stock. In addition, stockholders may elect to make optional cash payments up to an aggregate of $2,500$5,000 per quarter for the purchase of additional shares of common stock. The stock is credited to participant accounts at fair market value. Dividends are reinvested on a quarterly basis.
PART II: ITEM 8. FINANCIAL STATEMENTS AND SUPPLEMENTARY DATA
NOTES TO CONSOLIDATED FINANCIAL STATEMENTS
(table dollar amounts in thousands, except share data)
Stockholders' Equity
On September 1, 2019, the Corporation acquired 100 percent of MBT. Pursuant to the merger agreement, each MBT shareholder received 0.275 shares of the Corporation's common stock for each outstanding share of MBT common stock held. The Corporation issued approximately 6.4 million shares of common stock, which was valued at approximately $229.9 million. Details regarding the MBT acquisition are discussed in NOTE 2. ACQUISITION of these Notes to Consolidated Financial Statements.
Stock Repurchase Program
On February 9, 2016,September 3, 2019, the Board of Directors of the Corporation approved a stock repurchase program of up to $153 million of the outstanding shares of the Corporation's outstanding common stock. Thestock; provided, however, that the total aggregate investment in shares may be purchased from time to time in open market transactions at prevailing market prices in accordance with federal securities laws. The Corporation is not obligated to purchase any sharesrepurchased under the program andmay not exceed $75 million. On a share basis, the amount of common stock subject to the repurchase program may be discontinued at any time.represents approximately 5 percent of the Corporation's outstanding shares. The actual timing, number and share price of shares purchased under the repurchase program will be determined byat the Corporation at itsCorporation's discretion and will depend upon such factors as the market price of the stock, general market and economic conditions and applicable legal requirements. During 2019, the Corporation repurchased 516,016 shares of common stock for a total amount of $19.0 million at an average price of $36.90. All shares repurchased under the stock repurchase program were retired upon settlement.
NOTE 1819
LOAN SERVICING
Mortgage loans serviced for others are not included in the accompanying consolidated balance sheets. The loans are serviced primarily for the Federal Home Loan Mortgage Corporation, Fannie Mae, Federal Home Loan Bank of Cincinnati and Federal Home Loan Bank of Indianapolis, and the unpaid balances totaled $514,294,000, $533,386,000 and $549,618,000, $369,592,000 and $312,204,000 at December 31, 20172019, 20162018 and 20152017, respectively. The amount of capitalized servicing assets is considered immaterial.
NOTE 1920
SHARE-BASED COMPENSATION
Stock options and RSAs have been issued to directors, officers and other management employees under the Corporation's 19992009 Long-term Equity Incentive Plan, the 2019 Long-term Equity Incentive Plan and the 2009 Long-term Equity Incentive Plan.Compensation Plan for Non-Employee Directors. The stock options, which have a ten-year life, become 100 percent vested based on time ranging from six monthsone year to two years and are fully exercisable when vested. Option exercise prices equal the Corporation's common stock closing price on NASDAQ on the date of grant. The RSAs issued to employees and non-employee directors provide for the issuance of shares of the Corporation's common stock at no cost to the holder and generally vest after three years. The RSAs vest only if the employee is actively employed by the Corporation on the vesting date and, therefore, any unvested shares are forfeited. For non-employee directors, the RSA's vest only if the non-employee director remains as an active board member on the vesting date and, therefore, any unvested shares are forfeited. The RSAs for employees and non-employee directors retired from the Corporation are either immediately vested at retirement, disability or death, or continue to vest after retirement, disability or death, depending on the plan under which the shares were granted. Deferred Stock Units ("DSUs") can be credited to non-employee directors who elect to defer payment of compensation under the Corporation's 2008 Equity Compensation Plan for Non-employee Directors. DSUs credited are equal to the restricted shares that the non-employee director would have received under the plan. As of December 31, 2017, the Corporation did not have any outstanding DSUs.
PART II: ITEM 8. FINANCIAL STATEMENTS AND SUPPLEMENTARY DATA
NOTES TO CONSOLIDATED FINANCIAL STATEMENTS
(table dollar amounts in thousands, except share data)
The Corporation’s 20092019 ESPP provides eligible employees of the Corporation and its subsidiaries an opportunity to purchase shares of common stock of the Corporation through quarterly offerings financed by payroll deductions. The price of the stock to be paid by the employees shall be equal to 85 percent of the average of the closing price of the Corporation’s common stock on each trading day during the offering period. However, in no event shall such purchase price be less than the lesser of an amount equal to 85 percent of the market price of the Corporation’s stock on the offering date or an amount equal to 85 percent of the market value on the date of purchase. Common stock purchases are made quarterly and are paid through advance payroll deductions up to a calendar year maximum of $25,000. The Corporation's 2009 ESPP, which was substantially similar to the 2019 ESPP, expired on June 30, 2019.
Compensation expense related to unvested share-based awards is recorded by recognizing the unamortized grant date fair value of these awards over the remaining service periods of those awards, with no change in historical reported fair values and earnings. Awards are valued at fair value in accordance with provisions of share-based compensation guidance and are recognized on a straight-line basis over the service periods of each award. To complete the exercise of vested stock options, RSA’s and ESPP options, the Corporation generally issues new shares from its authorized but unissued share pool. Share-based compensation for the years ended December 31, 2019, 2018, and 2017 2016,was $4,115,000, $3,592,000, and 2015 was $2,827,000, $2,600,000, and $2,270,000, respectively, and has been recognized as a component of salaries and benefits expense in the accompanying CONSOLIDATED STATEMENTS OF INCOME.
Share-based compensation expense recognized in the CONSOLIDATED STATEMENTS OF INCOME is based on awards ultimately expected to vest and is reduced for estimated forfeitures. Share-based compensation guidance requires forfeitures to be estimated at the time of grant and revised, if necessary, in subsequent periods, if actual forfeitures differ from those estimates. Pre-vesting forfeitures were estimated to be approximately 2.81.7 percent for the year ended December 31, 2017,2019, based on historical experience.
PART II: ITEM 8. FINANCIAL STATEMENTS AND SUPPLEMENTARY DATA
NOTES TO CONSOLIDATED FINANCIAL STATEMENTS
(table dollar amounts in thousands, except share data)
The following table summarizes the components of the Corporation's share-based compensation awards recorded as an expense and the income tax benefit of such awards. The income tax benefit increasedecrease for the year ended December 31, 2017 is2018 was due to the reduction of the corporate federal income tax rate from 35 percent to 21 percent as a result of the Tax Cuts and Jobs Act, which was effective January 1, 2018. On January 1, 2017, the implementation of ASU 2016-09, Compensation - Stock Compensation (Topic 718): Improvements to Employee Share-Based Payment Accounting. This ASU requires all required the income tax effects of awards to be recognized as income tax expense or benefit in the income statement when the awards vest or are settled. Implementation of the ASU was effective January 1, 2017 and resulted in approximately $433,000, $644,000 and $935,000 of income tax benefit for the yearyears ended December 31, 2017.2019, 2018 and 2017, respectively.
|
| | | | | | | | | | | |
| | Years Ended December 31, |
| | 2019 | | 2018 | | 2017 |
| Stock and ESPP Options | | | | | |
| Pre-tax compensation expense | $ | 101 |
| | $ | 109 |
| | $ | 121 |
|
| Income tax expense (benefit) | (70 | ) | | (97 | ) | | (322 | ) |
| Stock and ESPP option expense, net of income taxes | $ | 31 |
| | $ | 12 |
| | $ | (201 | ) |
| Restricted Stock Awards | | | | | |
| Pre-tax compensation expense | $ | 4,014 |
| | $ | 3,483 |
| | $ | 2,706 |
|
| Income tax benefit | (1,206 | ) | | (1,179 | ) | | (1,561 | ) |
| Restricted stock awards expense, net of income taxes | $ | 2,808 |
| | $ | 2,304 |
| | $ | 1,145 |
|
| Total Share-Based Compensation: | | | | | |
| Pre-tax compensation expense | $ | 4,115 |
| | $ | 3,592 |
| | $ | 2,827 |
|
| Income tax benefit | (1,276 | ) | | (1,276 | ) | | (1,883 | ) |
| Total share-based compensation expense, net of income taxes | $ | 2,839 |
| | $ | 2,316 |
| | $ | 944 |
|
|
| | | | | | | | | | | |
| | Years Ended December 31, |
| | 2017 | | 2016 | | 2015 |
| Stock and ESPP Options | | | | | |
| Pre-tax compensation expense | $ | 121 |
| | $ | 76 |
| | $ | 101 |
|
| Income tax expense (benefit) | (322 | ) | | 18 |
| | 4 |
|
| Stock and ESPP option expense, net of income taxes | $ | (201 | ) | | $ | 94 |
| | $ | 105 |
|
| Restricted Stock Awards | | | | | |
| Pre-tax compensation expense | $ | 2,706 |
| | $ | 2,524 |
| | $ | 2,169 |
|
| Income tax benefit | (1,561 | ) | | (883 | ) | | (749 | ) |
| Restricted stock awards expense, net of income taxes | $ | 1,145 |
| | $ | 1,641 |
| | $ | 1,420 |
|
| Total Share-Based Compensation: | | | | | |
| Pre-tax compensation expense | $ | 2,827 |
| | $ | 2,600 |
| | $ | 2,270 |
|
| Income tax benefit | (1,883 | ) | | (865 | ) | | (745 | ) |
| Total share-based compensation expense, net of income taxes | $ | 944 |
| | $ | 1,735 |
| | $ | 1,525 |
|
As of December 31, 2017,2019, unrecognized compensation expense related to RSAs was $6,090,000$7,422,000 and is expected to be recognized over weighted-average period of 1.451.60 years. The Corporation did not0t have any unrecognized compensation expense related to stock options as of December 31, 2017.2019.
Stock option activity under the Corporation's stock option plans, as of December 31, 2017,2019, and changes during the year ended December 31, 2017,2019, were as follows:
|
| | | | | | | | | | | | | |
| | Number of
Shares | | Weighted-Average
Exercise Price | | Weighted Average
Remaining Contractual
Term (in Years) | | Aggregate
Intrinsic Value |
| Outstanding at January 1, 2019 | 76,300 |
| | $ | 12.40 |
| | — |
| | $ | — |
|
| Exercised | (16,950 | ) | | $ | 8.51 |
| | — |
| | $ | — |
|
| Outstanding December 31, 2019 | 59,350 |
| | $ | 13.51 |
| | 2.45 |
| | $ | 1,666,694 |
|
| Vested and Expected to Vest at December 31, 2019 | 59,350 |
| | $ | 13.51 |
| | 2.45 |
| | $ | 1,666,694 |
|
| Exercisable at December 31, 2019 | 59,350 |
| | $ | 13.51 |
| | 2.45 |
| | $ | 1,666,694 |
|
|
| | | | | | | | | | | | |
| | Number of
Shares | | Weighted-Average
Exercise Price | | Weighted Average
Remaining Contractual
Term (in Years) | | Aggregate
Intrinsic Value |
| Outstanding at January 1, 2017 | 260,211 |
| | $ | 19.26 |
| | | | |
| Exercised | (104,748 | ) | | $ | 22.90 |
| |
| |
|
| Canceled | (2,811 | ) | | $ | 22.21 |
| | | | |
| Outstanding December 31, 2017 | 152,652 |
| | $ | 16.71 |
| | 2.36 | | $ | 3,870,499 |
|
| Vested and Expected to Vest at December 31, 2017 | 152,652 |
| | $ | 16.71 |
| | 2.36 | | $ | 3,870,499 |
|
| Exercisable at December 31, 2017 | 152,652 |
| | $ | 16.71 |
| | 2.36 | | $ | 3,870,499 |
|
PART II: ITEM 8. FINANCIAL STATEMENTS AND SUPPLEMENTARY DATA
NOTES TO CONSOLIDATED FINANCIAL STATEMENTS
(table dollar amounts in thousands, except share data)
The aggregate intrinsic value in the table above represents the total pre-tax intrinsic value (the difference between the Corporation's closing stock price on the last trading day of 20172019 and the exercise price, multiplied by the number of in-the-money options) that would have been received by the option holders had all option holders exercised their stock options on December 31, 2017.2019. The amount of aggregate intrinsic value will change based on the fair market value of the Corporation's common stock.
The aggregate intrinsic value of stock options exercised during the years ended December 31, 20172019 and 20162018 was $1,728,000$495,000 and $1,641,000,$1,685,000, respectively. Cash receipts of stock options exercised during 20172019 and 20162018 were $2,398,000$144,000 and $2,602,000,$1,598,000, respectively.
The following table summarizes information on unvested RSAs outstanding as of December 31, 2017:2019:
|
| | | | | | |
| | Number of
Shares | | Weighted-Average
Grant Date Fair Value |
| Unvested RSAs at January 1, 2019 | 344,362 |
| | $ | 36.80 |
|
| Granted | 125,846 |
| | $ | 35.84 |
|
| Forfeited | (2,588 | ) | | $ | 40.53 |
|
| Vested | (116,572 | ) | | $ | 24.03 |
|
| Unvested RSAs at December 31, 2019 | 351,048 |
| | $ | 40.67 |
|
|
| | | | | | |
| | Number of
Shares | | Weighted-Average
Grant Date Fair Value |
| Unvested RSAs at January 1, 2017 | 328,347 |
| | $ | 22.87 |
|
| Granted | 132,710 |
| | $ | 40.47 |
|
| Forfeited | (4,702 | ) | | $ | 23.63 |
|
| Vested | (89,362 | ) | | $ | 20.53 |
|
| Unvested RSAs at December 31, 2017 | 366,993 |
| | $ | 29.79 |
|
The grant date fair value of ESPP options was estimated at the beginning of the October 1, 2017,2019, quarterly offering period of approximately $28,000.$29,000. The ESPP options vested during the three months ending December 31, 2017,2019, leaving no0 unrecognized compensation expense related to unvested ESPP options at December 31, 2017.
2019.
PART II: ITEM 8. FINANCIAL STATEMENTS AND SUPPLEMENTARY DATA
NOTES TO CONSOLIDATED FINANCIAL STATEMENTS
(table dollar amounts in thousands, except share data)
NOTE 2021
PENSION AND OTHER POST RETIREMENT BENEFIT PLANS
The Corporation’s defined-benefit pension plans, including non-qualified plans for certain employees, former employees and former non-employee directors, cover approximately 1510 percent of the Corporation’s employees. In 2005, the Board of Directors of the Corporation approved the curtailment of the accumulation of defined benefits for future services provided by certain participants in the First Merchants Corporation Retirement Plan. No additional pension benefits have been earned by any employees who had not attained both the age of 55 and accrued at least 10 years of vesting service as of March 1, 2005. The benefits are based primarily on years of service and employees’ pay near retirement. Contributions are intended to provide not only for benefits attributed to service-to-date, but also for those expected to be earned in the future. The Corporation also maintained a post retirement benefit plan that provided health insurance benefits to retirees. The plan allowed retirees to be carried under the Corporation’s health insurance plan, generally from ages 55 to 65. The retirees paid 100 percent of the premiums due for their coverage. In 2016, the Corporation elected to terminate this plan effective December 31, 2017.
The table below sets forth the plans’ funded status and amounts recognized in the consolidated balance sheets at December 31, using measurement dates of December 31, 20172019 and 20162018. |
| | | | | | | |
| | 2017 | | 2016 |
| Change in Benefit Obligation: | | | |
| Benefit obligation at beginning of year | $ | 84,090 |
| | $ | 71,747 |
|
| Service cost | 10 |
| | 9 |
|
| Interest cost | 3,353 |
| | 3,273 |
|
| Actuarial loss | 3,686 |
| | 2,679 |
|
| Benefits paid | (5,179 | ) | | (5,263 | ) |
| Plan settlements | (3,803 | ) | | |
| Net transfers in from Ameriana acquisition |
|
| | 11,645 |
|
| Benefit obligation at end of year | $ | 82,157 |
| | $ | 84,090 |
|
| | | | |
| Change in Plan Assets: | | | |
| Fair value of plan assets at beginning of year | $ | 83,557 |
| | $ | 71,396 |
|
| Actual return on plan assets | 9,968 |
| | 6,959 |
|
| Employer contributions | 670 |
| | 739 |
|
| Benefits paid | (5,179 | ) | | (5,263 | ) |
| Plan settlements | (3,803 | ) | | |
| Ameriana acquisition |
|
| | 9,726 |
|
| End of year | 85,213 |
| | 83,557 |
|
| Funded status at end of year | $ | 3,056 |
| | $ | (533 | ) |
| | | | |
| Assets and Liabilities Recognized in the Balance Sheets: | | | |
| Deferred tax asset | $ | 3,474 |
| | $ | 7,041 |
|
| Assets | $ | 7,660 |
| | $ | 5,028 |
|
| Liabilities | $ | 4,604 |
| | $ | 5,561 |
|
| | | | |
| Amounts Recognized in Accumulated Other Comprehensive Income Not Yet Recognized as Components of Net Periodic Cost, net of tax, consist of: | | | |
| Accumulated loss | $ | (10,360 | ) | | $ | (12,624 | ) |
| Prior service cost | (393 | ) | | (451 | ) |
| | $ | (10,753 | ) | | $ | (13,075 | ) |
|
| | | | | | | |
| | 2019 | | 2018 |
| Change in Benefit Obligation: | | | |
| Benefit obligation at beginning of year | $ | 73,193 |
| | $ | 82,157 |
|
| Service cost | 39 |
| | 8 |
|
| Interest cost | 2,975 |
| | 2,816 |
|
| Actuarial (gain) loss | 4,007 |
| | (6,129 | ) |
| Benefits paid | (5,145 | ) | | (5,659 | ) |
| Net transfer in from MBT acquisition | 1,701 |
| | — |
|
| Benefit obligation at end of year | $ | 76,770 |
| | $ | 73,193 |
|
| | | | |
| Change in Plan Assets: | | | |
| Fair value of plan assets at beginning of year | $ | 76,736 |
| | $ | 85,213 |
|
| Actual return on plan assets | 12,972 |
| | (3,427 | ) |
| Employer contributions | 558 |
| | 609 |
|
| Benefits paid | (5,145 | ) | | (5,659 | ) |
| End of year | 85,121 |
| | 76,736 |
|
| Funded status at end of year | $ | 8,351 |
| | $ | 3,543 |
|
| | | | |
| Assets and Liabilities Recognized in the Balance Sheets: | | | |
| Deferred tax asset | $ | 3,278 |
| | $ | 3,855 |
|
| Assets | $ | 13,291 |
| | $ | 7,024 |
|
| Liabilities | $ | 4,940 |
| | $ | 3,481 |
|
| | | | |
| Amounts Recognized in Accumulated Other Comprehensive Income Not Yet Recognized as Components of Net Periodic Cost, net of tax, consist of: | | | |
| Accumulated loss | $ | (9,712 | ) | | $ | (14,111 | ) |
| Prior service cost | (325 | ) | | (409 | ) |
| | $ | (10,037 | ) | | $ | (14,520 | ) |
In 2017, the Corporation offered certain terminated vested pension plan participants the opportunity to elect
The actuarial (gain) loss recognized in 2019 and 2018 was primarily a lump sum payment during a specific distribution window. The lump sums paid, or plan settlements, released $4.6 millionresult of benefit obligation, while lump sum payments were $3.8 million. The total amount of lump sum payment elections and lump sums paid under regular operation of the plan, triggered pension plan settlement accounting, resulting in a $761,000 settlement charge, which is reflected in the Corporation's CONSOLIDATED STATEMENTS OF INCOME in the line titled "Salaries and employee benefits."discount rate assumption fluctuations.
Ameriana participated in the Pentegra Defined Benefit Plan for Financial Institutions (the "Pentegra Plan”), an industry-wide, tax-qualified defined-benefit pension plan. The Pentegra Plan operated as a multi-employer plan for accounting purposes and as a multiple employer plan under ERISA and the Internal Revenue Code. On November 20, 2015, Ameriana provided Pentegra a 60-day written notice of withdrawal as a Participating Employer in the Pentegra Plan. Upon completion of the withdrawal from the Pentegra Plan, the assets and liabilities were merged into the First Merchants Corporation Retirement Plan in 2016.
The accumulated benefit obligation for all defined benefit plans was $82,157,000$76,770,000 and $84,090,000$73,193,000 at December 31, 20172019 and 2016,2018, respectively.
Information for pension plans with an accumulated benefit obligation in excess of plan assets consists solely of the non-qualified plans for certain employees, former employees and former non-employee directors, and is included in the table below.
94 |
| | | | | | | |
| | December 31, 2019 | | December 31, 2018 |
| Projected benefit obligation | $ | 4,940 |
| | $ | 3,481 |
|
| Accumulated benefit obligation | $ | 4,940 |
| | $ | 3,481 |
|
| Fair value of plan assets | $ | — |
| | $ | — |
|
The Corporation recognized expense under these non-qualified plans of $192,000, $161,000 and $213,000 for 2019, 2018 and 2017, respectively.
PART II: ITEM 8. FINANCIAL STATEMENTS AND SUPPLEMENTARY DATA
NOTES TO CONSOLIDATED FINANCIAL STATEMENTS
(table dollar amounts in thousands, except share data)
Information for pension plans with an accumulated benefit obligation in excess of plan assets is included in the table below.
|
| | | | | | | |
| | December 31, 2017 | | December 31, 2016 |
| Projected benefit obligation | $ | 4,604 |
| | $ | 5,561 |
|
| Accumulated benefit obligation | $ | 4,604 |
| | $ | 5,561 |
|
| Fair value of plan assets | $ | — |
| | $ | — |
|
The following table shows the components of net periodic pension costs:benefit cost:
|
| | | | | | | | | | | |
| | December 31, 2019 | | December 31, 2018 | | December 31, 2017 |
| Service cost | $ | 39 |
| | $ | 8 |
| | $ | 10 |
|
| Interest cost | 2,975 |
| | 2,816 |
| | 3,353 |
|
| Expected return on plan assets | (4,414 | ) | | (4,891 | ) | | (4,778 | ) |
| Amortization of prior service cost | 87 |
| | 87 |
| | 90 |
|
| Amortization of net loss | 404 |
| | 287 |
| | 1,218 |
|
| Settlement loss recognized | — |
| | — |
| | 761 |
|
| Net periodic pension benefit cost | $ | (909 | ) | | $ | (1,693 | ) | | $ | 654 |
|
|
| | | | | | | | | | | |
| | December 31, 2017 | | December 31, 2016 | | December 31, 2015 |
| Service cost | $ | 10 |
| | $ | 9 |
| | $ | 55 |
|
| Interest cost | 3,353 |
| | 3,273 |
| | 3,087 |
|
| Expected return on plan assets | (4,778 | ) | | (4,508 | ) | | (4,471 | ) |
| Amortization of prior service costs | 90 |
| | 79 |
| | 64 |
|
| Amortization of net loss | 1,218 |
| | 1,656 |
| | 1,722 |
|
| Settlement loss recognized | 761 |
| | | | |
| Net periodic pension cost | $ | 654 |
| | $ | 509 |
| | $ | 457 |
|
Other changes in plan assets and benefit obligations recognized in other comprehensive income:
|
| | | | | | | | | | | |
| | December 31, 2019 | | December 31, 2018 | | December 31, 2017 |
| Net periodic pension benefit cost | $ | (909 | ) | | $ | (1,693 | ) | | $ | 654 |
|
| Net gain (loss) | 4,552 |
| | (2,189 | ) | | 1,504 |
|
| Amortization of net loss | 404 |
| | 287 |
| | 1,979 |
|
| Amortization of prior service cost | 87 |
| | 87 |
| | 90 |
|
| Total recognized in other comprehensive income (loss) | 5,043 |
| | (1,815 | ) | | 3,573 |
|
| Total recognized in net periodic pension benefit cost and other comprehensive income (loss) | $ | 5,952 |
| | $ | (122 | ) | | $ | 2,919 |
|
|
| | | | | | | | | | | |
| | December 31, 2017 | | December 31, 2016 | | December 31, 2015 |
| Net periodic pension cost | $ | 654 |
| | $ | 509 |
| | $ | 457 |
|
| Net gain (loss) | 1,504 |
| | (228 | ) | | 1,299 |
|
| Amortization of loss | 1,979 |
| | 1,656 |
| | 1,722 |
|
| Amortization of prior service cost | 90 |
| | 79 |
| | 64 |
|
| Total recognized in other comprehensive income | 3,573 |
| | 1,507 |
| | 3,085 |
|
| Total recognized in net periodic pension cost and other comprehensive income | $ | 2,919 |
| | $ | 998 |
| | $ | 2,628 |
|
The estimated net loss and transition obligation for the defined benefit pension plansamounts that will be amortized from accumulated other comprehensive income into net periodic pension benefit cost over the next fiscal year are:
|
| | | | | | | | | | | |
| | December 31, 2019 | | December 31, 2018 | | December 31, 2017 |
|
| Amortization of net loss | $ | (208 | ) | | $ | (432 | ) | | $ | (830 | ) |
| Amortization of prior service cost | (87 | ) | | (87 | ) | | (87 | ) |
| Total | $ | (295 | ) | | $ | (519 | ) | | $ | (917 | ) |
|
| | | | | | | | | | | |
| December 31, 2017 |
| December 31, 2016 | | December 31, 2015 |
| Amortization of net loss | $ | (830 | ) |
| $ | (1,208 | ) | | $ | (1,505 | ) |
| Amortization of prior service cost | (87 | ) |
| (90 | ) | | (61 | ) |
| Total | $ | (917 | ) |
| $ | (1,298 | ) | | $ | (1,566 | ) |
Significant assumptions include:
| | | | December 31, 2017 | | December 31, 2016 | | December 31, 2015 | December 31, 2019 | | December 31, 2018 | | December 31, 2017 |
| Weighted-average Assumptions Used to Determine Benefit Obligation: | | | | | | | | | | |
| Discount rate | 3.60 | % | | 4.20 | % | | 4.50 | % | 3.20 | % | | 4.30 | % | | 3.60 | % |
| Rate of compensation increase for accruing active participants | n/a |
| | 3.00 | % | | 3.00 | % | n/a |
| | n/a |
| | n/a |
|
| Weighted-average Assumptions Used to Determine Cost: |
| | | | |
| | | | |
| Discount rate | 4.20 | % | | 4.50 | % | | 4.00 | % | 4.30 | % | | 3.60 | % | | 4.20 | % |
| Expected return on plan assets | 6.00 | % | | 6.00 | % | | 6.00 | % | 6.00 | % | | 6.00 | % | | 6.00 | % |
| Rate of compensation increase for accruing active participants | n/a |
| | 3.00 | % | | 3.00 | % | n/a |
| | n/a |
| | n/a |
|
At December 31, 20172019 and 20162018, the Corporation based its estimate of the expected long-term rate of return on analysis of the historical returns of the plans and current market information available. The plans’ investment strategies are to provide for preservation of capital with an emphasis on long-term growth without undue exposure to risk. The assets of the plans’ are invested in accordance with the plans’ Investment Policy Statement, subject to strict compliance with ERISA and any other applicable statutes.
The plans’ risk management practices include semi-annual evaluations of investment managers, including reviews of compliance with investment manager guidelines and restrictions; ability to exceed performance objectives; adherence to the investment philosophy and style; and ability to exceed the performance of other investment managers. The evaluations are reviewed by management with appropriate follow-up and actions taken, as deemed necessary. The Investment Policy Statement generally allows investments in cash and cash equivalents, real estate, fixed income debt securities and equity securities, and specifically prohibits investments in derivatives, options, futures, private placements, short selling, non-marketable securities and purchases of individual non-investment grade bonds.
At December 31, 2019, the maturities of the plans’ debt securities ranged from 15 days to 7.67 years, with a weighted average maturity of 4.00 years. At December 31, 2018, the maturities of the plans’ debt securities ranged from 15 days to 8.24 years, with a weighted average maturity of 4.29 years.
PART II: ITEM 8. FINANCIAL STATEMENTS AND SUPPLEMENTARY DATA
NOTES TO CONSOLIDATED FINANCIAL STATEMENTS
(table dollar amounts in thousands, except share data)
At December 31, 2017, the maturities of the plans’ debt securities ranged from 15 days to 8.83 years, with a weighted average maturity of 4.53 years. At December 31, 2016, the maturities of the plans’ debt securities ranged from 15 days to 8.03 years, with a weighted average maturity of 3.97 years.
The following benefit payments, which reflect expected future service, as appropriate, are expected to be paid as of December 31, 20172019. The minimum contribution required in 20182020 will likely be zero,0, but the Corporation may decide to make a discretionary contribution during the year.
|
| | | |
| 2020 | $ | 5,662 |
|
| 2021 | 5,549 |
|
| 2022 | 5,547 |
|
| 2023 | 5,418 |
|
| 2024 | 5,241 |
|
| After 2024 | 24,435 |
|
| | $ | 51,852 |
|
|
| | | |
| 2018 | $ | 5,586 |
|
| 2019 | 5,641 |
|
| 2020 | 5,609 |
|
| 2021 | 5,476 |
|
| 2022 | 5,377 |
|
| After 2022 | 25,652 |
|
| | $ | 53,341 |
|
Plan assets are re-balanced quarterly. At December 31, 20172019 and 2016,2018, plan assets by category are as follows:
|
| | | | | | | | | | | |
| | December 31, 2019 |
| December 31, 2018 |
| | Actual |
| Target |
| Actual |
| Target |
| Cash and cash equivalents | 3.0 | % |
| 3.0 | % |
| 3.9 | % |
| 3.0 | % |
| Equity securities | 52.3 |
|
| 50.0 |
|
| 48.4 |
|
| 50.0 |
|
| Debt securities | 42.3 |
|
| 45.0 |
|
| 45.6 |
|
| 45.0 |
|
| Alternative investments | 2.4 |
|
| 2.0 |
|
| 2.1 |
|
| 2.0 |
|
| | 100.0 | % |
| 100.0 | % |
| 100.0 | % |
| 100.0 | % |
|
| | | | | | | | | | | |
| | December 31, 2017 |
| December 31, 2016 |
| | Actual |
| Target |
| Actual |
| Target |
| Cash and cash equivalents | 6.0 | % |
| 3.0 | % |
| 4.5 | % |
| 3.0 | % |
| Equity securities | 52.4 |
|
| 55.0 |
|
| 55.8 |
|
| 55.0 |
|
| Debt securities | 39.6 |
|
| 40.0 |
|
| 37.7 |
|
| 40.0 |
|
| Alternative investments | 2.0 |
|
| 2.0 |
|
| 2.0 |
|
| 2.0 |
|
| | 100.0 | % |
| 100.0 | % |
| 100.0 | % |
| 100.0 | % |
The Savings Plan, a Section 401(k) qualified defined contribution plan, was amended on March 1, 2005 to provide enhanced retirement benefits, including employer and matching contributions, for eligible employees of the Corporation and its subsidiaries. The Corporation matches employees’ contributions at the rate of 100 percent for the first 3 percent of base salary contributed by participants and 50 percent of the next 3 percent of base salary contributed by participants.
Beginning in 2005, employees who have completed 1000 hours of service and are an active employee on the last day of the year receive an additional retirement contribution after year-end. Employees hired after January 1, 2010 do not participate in the additional retirement contribution. Effective January 1, 2013, the additional retirement contribution was fixed at 2 percent. Full vesting occurs after five years of service. The Corporation’s expense for the Savings Plan, including the additional retirement contribution, was $4,560,000, $5,114,000 and $3,691,000 $3,441,000for 2019, 2018 and $3,526,000 for 2017, 2016 and 2015, respectively.
The Corporation maintainedalso maintains a post retirement benefit plan that providedprovides health insurance benefits for a closed group of participants that came to retirees.the Corporation through the 2019 MBT acquisition. To be eligible for the post retirement plan, the participants must (1) have been hired by MBT prior to January 1, 2007, (2) be a full-time employee of the Corporation and employed by MBT prior to the acquisition, and (3) be at least 55 of age with 5 years of full-time service with MBT. The plan allowed retirees to be carried under the Corporation’s health insurance plan, generally from ages 55 to 65.65. The retirees paid 100 percentretirees' premiums are determined based on their retiree class (per historical MBT guidelines) and also determined by the plan type for which the retiree is enrolled. As of the premiums due for their coverage. In 2016, the Corporation elected to terminate this plan effective December 31, 2017. As a result of2019, the termination, in 2016, the Corporation recognized a curtailment gain of $2,157,000 as a component of "Salaries and benefits expense" in the accompanying CONSOLIDATED STATEMENTS OF INCOME. The obligation payable under the post retirement plan totaled $54,000 at December 31, 2016.was $4.0 million. Post retirement plan expense totaled $(301,000), $(2,437,000) and $(127,000)$43,000 for the years ending year ended December 31, 2017, 2016 and 2015, respectively.2019.
PART II: ITEM 8. FINANCIAL STATEMENTS AND SUPPLEMENTARY DATA
NOTES TO CONSOLIDATED FINANCIAL STATEMENTS
(table dollar amounts in thousands, except share data)
Pension Plan Assets
Following is a description of the valuation methodologies used for pension plan assets measured at fair value on a recurring basis, as well as the general classification of pension plan assets pursuant to the valuation hierarchy.
Where quoted market prices are available in an active market, plan assets are classified within Level 1 of the valuation hierarchy. Level 1 plan assets total $78,280,000$80,689,000 and $64,064,000$71,277,000 as of December 31, 20172019 and 2016,2018, respectively, and include cash and cash equivalents, common stocks, mutual funds and corporate bonds and notes. If quoted market prices are not available, then fair values are estimated by using pricing models, quoted prices of plan assets with similar characteristics or discounted cash flows. Level 2 plan assets total $6,933,000$4,432,000 and $19,493,000$5,459,000 as of December 31, 20172019 and 2016,2018, respectively, and include governmental agencies, taxable municipal bonds common collective trust investments (which are classified below as Party-in-Interest Investments - common bond fund and common equity fund)notes, and certificates of deposit. In certain cases where Level 1 or Level 2 inputs are not available, plan assets are classified within Level 3 of the hierarchy. There are no assets classified within Level 3 of the hierarchy at December 31, 20172019 and 2016.2018.
|
| | | | | | | | | | | | | | | |
| | |
| Fair Value Measurements Using |
| | | | Quoted Prices in Active Markets for Identical Assets | | Significant Other Observable Inputs | | Significant Unobservable Inputs |
| December 31, 2019 | Fair Value |
| (Level 1) |
| (Level 2) |
| (Level 3) |
| Cash & Cash Equivalents | $ | 2,578 |
|
| $ | 2,578 |
|
| $ | — |
|
| $ | — |
|
| Corporate Bonds and Notes | 17,629 |
|
| 17,629 |
|
| — |
|
| — |
|
| Government Agency and Municipal Bonds and Notes | 3,660 |
|
| — |
|
| 3,660 |
|
| — |
|
| Certificates of Deposit | 772 |
|
| — |
|
| 772 |
|
| — |
|
| Party-in-Interest Investments |
|
|
|
|
|
|
|
| Common Stock | 2,516 |
|
| 2,516 |
|
| — |
|
| — |
|
| Mutual Funds |
|
|
|
|
|
|
|
| Taxable Bond | 13,938 |
|
| 13,938 |
|
| — |
|
| — |
|
| Large Cap Equity | 21,958 |
|
| 21,958 |
|
| — |
|
| — |
|
| Mid Cap Equity | 10,407 |
|
| 10,407 |
|
| — |
|
| — |
|
| Small Cap Equity | 5,753 |
|
| 5,753 |
|
| — |
|
| — |
|
| International Equity | 3,898 |
|
| 3,898 |
|
| — |
|
| — |
|
| Specialty Alternative Equity | 2,012 |
|
| 2,012 |
|
| �� |
|
| — |
|
| | $ | 85,121 |
| | $ | 80,689 |
| | $ | 4,432 |
| | $ | — |
|
|
| | | | | | | | | | | | | |
| | |
| Fair Value Measurements Using |
| | | | Quoted Prices in Active Markets for Identical Assets | | Significant Other Observable Inputs | | Significant Unobservable Inputs |
| December 31, 2017 | Fair Value |
| (Level 1) |
| (Level 2) |
| (Level 3) |
| Cash & Cash Equivalents | $ | 5,123 |
|
| $ | 5,123 |
|
|
|
|
|
| Corporate Bonds and Notes | 14,598 |
|
| 14,598 |
|
|
|
|
|
| Government Agency and Municipal Bonds and Notes | 5,679 |
|
|
|
| $ | 5,679 |
|
|
|
| Certificates of Deposit | 1,254 |
|
|
|
| 1,254 |
|
|
|
| Party-in-Interest Investments |
|
|
|
|
|
|
|
| Common Stock | 2,545 |
|
| 2,545 |
|
|
|
|
|
| Mutual Funds |
|
|
|
|
|
|
|
| Taxable Bond | 12,198 |
|
| 12,198 |
|
|
|
|
|
|
| Large Cap Equity | 22,137 |
|
| 22,137 |
|
|
|
|
|
| Mid Cap Equity | 10,676 |
|
| 10,676 |
|
|
|
|
|
| Small Cap Equity | 5,264 |
|
| 5,264 |
|
|
|
|
|
| International Equity | 4,030 |
|
| 4,030 |
|
|
|
|
|
| Specialty Alternative Equity | 1,709 |
|
| 1,709 |
|
|
|
|
|
| | $ | 85,213 |
| | $ | 78,280 |
| | $ | 6,933 |
| |
|
|
| | | | | | | | | | | | | | | |
| | | | Fair Value Measurements Using |
| | | | Quoted Prices in
Active Markets for
Identical Assets | | Significant Other Observable Inputs | | Significant
Unobservable
Inputs |
| December 31, 2018 | Fair Value | | (Level 1) | | (Level 2) | | (Level 3) |
| Cash & Cash Equivalents | $ | 3,026 |
|
| $ | 3,026 |
|
| $ | — |
|
| $ | — |
|
| Corporate Bonds and Notes | 16,691 |
|
| 16,691 |
|
| — |
|
| — |
|
| Government Agency and Municipal Bonds and Notes | 4,479 |
|
| — |
|
| 4,479 |
|
| — |
|
| Certificates of Deposit | 980 |
|
| — |
|
| 980 |
|
| — |
|
| Party-in-Interest Investments |
|
|
|
|
|
|
|
| Common Stock | 2,073 |
|
| 2,073 |
|
| — |
|
| — |
|
| Mutual Funds |
|
|
|
|
|
|
|
| Taxable Bond | 12,817 |
|
| 12,817 |
|
| — |
|
| — |
|
| Large Cap Equity | 18,269 |
|
| 18,269 |
|
| — |
|
| — |
|
| Mid Cap Equity | 8,735 |
|
| 8,735 |
|
| — |
|
| — |
|
| Small Cap Equity | 4,713 |
|
| 4,713 |
|
| — |
|
| — |
|
| International Equity | 3,336 |
|
| 3,336 |
|
| — |
|
| — |
|
| Specialty Alternative Equity | 1,617 |
|
| 1,617 |
|
| — |
|
| — |
|
| | $ | 76,736 |
|
| $ | 71,277 |
|
| $ | 5,459 |
|
| $ | — |
|
|
| | | | | | | | | | | | | |
| | | | Fair Value Measurements Using |
| | | | Quoted Prices in
Active Markets for
Identical Assets | | Significant Other Observable Inputs | | Significant
Unobservable
Inputs |
| December 31, 2016 | Fair Value | | (Level 1) | | (Level 2) | | (Level 3) |
| Cash & Cash Equivalents | $ | 3,778 |
| | $ | 3,778 |
| | | | |
| Corporate Bonds and Notes | 10,646 |
| | 10,646 |
| | | | |
| Government Agency and Municipal Bonds and Notes | 6,855 |
| | | | $ | 6,855 |
| | |
| Certificates of Deposit | 1,268 |
| | | | 1,268 |
| | |
| Party-in-Interest Investments | | | | | | | |
| Common Stock | 2,278 |
| | 2,278 |
| | | | |
| Common Bond Fund | 4,744 |
| | | | 4,744 |
| | |
| Common Equity Fund | 6,626 |
| | | | 6,626 |
| | |
| Mutual Funds | | | | | | | |
| Taxable Bond | 7,974 |
| | 7,974 |
| | | | |
| Large Cap Equity | 19,611 |
| | 19,611 |
| | | | |
| Mid Cap Equity | 10,304 |
| | 10,304 |
| | | | |
| Small Cap Equity | 4,680 |
| | 4,680 |
| | | | |
| International Equity | 3,093 |
| | 3,093 |
| | | | |
| Specialty Alternative Equity | 1,700 |
| | 1,700 |
| | | | |
| | $ | 83,557 |
| | $ | 64,064 |
| | $ | 19,493 |
| |
|
PART II: ITEM 8. FINANCIAL STATEMENTS AND SUPPLEMENTARY DATA
NOTES TO CONSOLIDATED FINANCIAL STATEMENTS
(table dollar amounts in thousands, except share data)
NOTE 2122
INCOME TAX
The reconciliation between income tax expense expected at the U.S. federal statutory tax rate and the reported income tax expense is summarized in the following table for years ended December 31, 2017, 2016, 2015:2019, 2018 and 2017:
|
| | | | | | | | | | | |
| 2019 |
| 2018 |
| 2017 |
| Reconciliation of Federal Statutory to Actual Tax Expense: | |
| |
| |
| Federal Statutory Income Tax at 21% for 2019 and 2018 and 35% for 2017 | $ | 40,695 |
|
| $ | 39,509 |
|
| $ | 46,758 |
|
| Tax-exempt Interest Income | (10,124 | ) |
| (8,347 | ) |
| (11,127 | ) |
| Stock Compensation | (459 | ) |
| (622 | ) |
| (893 | ) |
| Earnings on Life Insurance | (953 | ) |
| (868 | ) |
| (2,302 | ) |
| Tax Credits | (263 | ) |
| (615 | ) |
| (811 | ) |
| Tax Cuts and Jobs Act - Rate Reform Impact | — |
|
| — |
|
| 5,120 |
|
| Other | 429 |
|
| (58 | ) |
| 779 |
|
| Income Tax Expense | $ | 29,325 |
|
| $ | 28,999 |
|
| $ | 37,524 |
|
| | | | | | |
| Effective Tax Rate | 15.1 | % | | 15.4 | % | | 28.1 | % |
|
| | | | | | | | | | | |
| 2017 |
| 2016 |
| 2015 |
| Reconciliation of Federal Statutory to Actual Tax Expense: | |
| |
| |
| Federal Statutory Income Tax at 35% | $ | 46,758 |
|
| $ | 38,031 |
|
| $ | 31,867 |
|
| Tax-exempt Interest Income | (11,127 | ) |
| (8,749 | ) |
| (7,083 | ) |
| Basis Difference on Sale of Insurance Subsidiary |
|
|
|
| 2,252 |
|
| Stock Compensation | (893 | ) |
| (61 | ) |
| (31 | ) |
| Earnings on Life Insurance | (2,302 | ) |
| (1,486 | ) |
| (1,012 | ) |
| Tax Credits | (811 | ) |
| (564 | ) |
| (583 | ) |
| Tax Cuts and Jobs Act - Rate Reform Impact | 5,120 |
|
|
|
|
|
| Other | 779 |
|
| 438 |
|
| 255 |
|
| Income Tax Expense | $ | 37,524 |
|
| $ | 27,609 |
|
| $ | 25,665 |
|
Income tax expense consists of the following components for the years ended December 31, 2017, 2016, 2015:2019, 2018, 2017:
|
| | | | | | | | | | | |
| | 2019 |
| 2018 |
| 2017 |
| Income Tax Expense for the Year Ended December 31: |
|
| |
| |
| Currently Payable: |
|
| |
| |
| Federal | $ | 23,938 |
|
| $ | 23,633 |
|
| $ | 22,001 |
|
| State | 422 |
|
| 1,842 |
|
| — |
|
| Deferred: |
|
|
|
|
|
| Federal | 4,726 |
|
| 6,723 |
|
| 9,969 |
|
| Tax Cuts and Jobs Act - Rate Reform Impact | — |
|
| — |
|
| 5,120 |
|
| State | 239 |
|
| (3,199 | ) |
| 434 |
|
| Income Tax Expense | $ | 29,325 |
|
| $ | 28,999 |
|
| $ | 37,524 |
|
|
| | | | | | | | | | | |
| | 2017 |
| 2016 |
| 2015 |
| Income Tax Expense for the Year Ended December 31: |
|
| |
| |
| Currently Payable: |
|
| |
| |
| Federal | $ | 22,001 |
|
| $ | 18,998 |
|
| $ | 21,221 |
|
| State |
|
|
|
|
|
|
| Deferred: |
|
|
|
|
|
| Federal | 9,969 |
|
| 8,233 |
|
| 3,952 |
|
| Tax Cuts and Jobs Act - Rate Reform Impact | 5,120 |
|
|
|
|
|
| State | 434 |
|
| 378 |
|
| 492 |
|
| Income Tax Expense | $ | 37,524 |
|
| $ | 27,609 |
|
| $ | 25,665 |
|
Significant components of the net deferred tax assets (liabilities) resulting from temporary differences were as follows at December 31, 20172019 and 2016:2018:
|
| | | | | | | |
| | 2019 |
| 2018 |
| Deferred Tax Asset at December 31: | |
| |
| Assets: | |
| |
| Differences in Accounting for Loan Losses | $ | 19,717 |
|
| $ | 19,785 |
|
| Differences in Accounting for Loan Fees | 442 |
|
| 749 |
|
| Differences in Accounting for Loans and Securities | — |
|
| 710 |
|
| Deferred Compensation | 4,436 |
|
| 2,101 |
|
| Federal & State Income Tax Loss Carryforward and Credits | 6,205 |
|
| 6,954 |
|
| Net Unrealized Loss on Securities Available for Sale | — |
|
| 1,686 |
|
| Other | 3,499 |
|
| 2,028 |
|
| Total Assets | 34,299 |
|
| 34,013 |
|
| Liabilities: | |
| |
| Differences in Depreciation Methods | 5,240 |
|
| 6,496 |
|
| Differences in Accounting for Loans and Securities | 1,192 |
|
| — |
|
| Difference in Accounting for Pensions and Other Employee Benefits | 1,556 |
|
| 566 |
|
| State Income Tax | 778 |
|
| 791 |
|
| Net Unrealized Gain on Securities Available for Sale | 10,333 |
|
| — |
|
| Gain on FDIC Modified Whole Bank Transaction | 413 |
|
| 487 |
|
| Other | 6,506 |
|
| 4,271 |
|
| Total Liabilities | 26,018 |
|
| 12,611 |
|
| Net Deferred Tax Asset Before Valuation Allowance | 8,281 |
|
| 21,402 |
|
| Valuation allowance: |
|
|
|
| Beginning Balance | — |
|
| (6,966 | ) |
| Decrease/(Increase) During the Year | — |
|
| 6,966 |
|
| Ending Balance | — |
|
| — |
|
| Net Deferred Tax Asset | $ | 8,281 |
|
| $ | 21,402 |
|
|
| | | | | | | |
| | 2017 |
| 2016 |
| Deferred Tax Asset at December 31: | |
| |
| Assets: | |
| |
| Differences in Accounting for Loan Losses | $ | 19,526 |
|
| $ | 26,315 |
|
| Differences in Accounting for Loan Fees | 1,458 |
|
| 1,918 |
|
| Differences in Accounting for Loans and Securities | 3,681 |
|
| 5,689 |
|
| Deferred Compensation | 4,448 |
|
| 3,471 |
|
| Difference in Accounting for Pensions and Other Employee Benefits |
|
|
| 83 |
|
| Federal & State Income Tax Loss Carryforward and Credits | 10,829 |
|
| 16,643 |
|
| Other | 365 |
|
| 4,210 |
|
| Total Assets | 40,307 |
|
| 58,329 |
|
| Liabilities: | |
| |
| Differences in Depreciation Methods | 5,245 |
|
| 8,216 |
|
| Difference in Accounting for Pensions and Other Employee Benefits | 823 |
|
|
|
|
| State Income Tax | 58 |
|
| 237 |
|
| Net Unrealized Gain on Securities Available for Sale | 2,898 |
|
| 557 |
|
| Gain on FDIC Modified Whole Bank Transaction | 602 |
|
| 1,126 |
|
| Other | 3,897 |
|
| 623 |
|
| Total Liabilities | 13,523 |
|
| 10,759 |
|
| Net Deferred Tax Asset Before Valuation Allowance | 26,784 |
|
| 47,570 |
|
| Valuation allowance: |
|
| |
| Beginning Balance | (9,815 | ) |
| (15,736 | ) |
| Decrease/(Increase) During the Year | 2,849 |
|
| 5,921 |
|
| Ending Balance | (6,966 | ) |
| (9,815 | ) |
| Net Deferred Tax Asset | $ | 19,818 |
|
| $ | 37,755 |
|
PART II: ITEM 8. FINANCIAL STATEMENTS AND SUPPLEMENTARY DATA
NOTES TO CONSOLIDATED FINANCIAL STATEMENTS
(table dollar amounts in thousands, except share data)
The $17,937,000$13,121,000 decrease in the Corporation’s net deferred tax asset was primarily due a combination of a decrease in deferred tax assets andto an increase in deferred tax liabilities. The largest deferred tax asset decreaseliability increase was associated with the impacttax effect of the Tax Cutschange in unrealized gains and Jobs Act ("TCJA"). Signed into law on December 22, 2017, the TCJA makes permanent a reduction in the federal corporate income tax rate from 35 percent to 21 percent. Under ASC 740, the Corporation is required to adjust its net deferred tax asset at December 31, 2017 to the enacted tax rate of 21 percent. As of December 31, 2017, the Corporation has substantially completed its accounting for the tax effects of enactment of the TCJA. Tax adjustments resulted in a decrease to the net deferred tax asset of $5,120,000. The Corporation continues to analyze certain aspects of the TCJA and further refinements are possible, which could potentially affect the measurement of these balances or potentially give rise to new deferred tax amounts. However, the Corporation does not expect these adjustments to materially impact our financial statements.
Other decreases not related to the TCJA were associated with federal and state net operating loss carryforwards and other employee benefits of $2,323,000 and $2,080,000, respectively. Increases in deferred tax liabilities associated with the accounting for acquisitions and accounting for unrealized gainslosses on available for sale securities further decreasedof $12,019,000. Additionally, the net change in deferred taxes associated with accounting for loans increased the net deferred tax liability by $1,902,000. Offsetting the increases to deferred tax liabilities was a deferred tax asset by $4,106,000 and $4,273,000, respectively.increase associated with deferred compensation of $2,336,000.
As of December 31, 2017,2019, the Corporation has approximately $45,196,000$28,354,000 of state NOL carryforwards available to offset future state taxable income, which will expire beginning in 2020.2022. These NOL carryforwards along with normal timing differences between book and tax result in total state deferred tax assets of $7,400,000.$3,719,000. Management believes it is more likely than not that the benefit from certain of these state NOL carryforwards and certain other state deferred tax assets will not be fully realized. In recognition of this risk, the Corporation has recorded a valuation allowance of $6,966,000 against its state deferred tax assets.
The Corporation has additional paid-in capital that is considered restricted resulting from the acquisitions of CFS and Ameriana of approximately $13,393,000 and $11,883,000, respectively. CFS and Ameriana qualified as banks under provisions of the Internal Revenue Code which permitted them to deduct from taxable income an allowance for bad debts which differed from the provision for losses charged to income. No provision for income taxes had been provided. If in the future this portion of additional paid-in capital is distributed, or the Corporation no longer qualifies as a bank for income tax purposes, income taxes may be imposed at the then applicable tax rates. The unrecorded deferred tax liability at December 31, 2017,2019, would have been approximately $5,308,000.
The Corporation or one of its subsidiaries files income tax returns in the U.S. federal jurisdiction and various state jurisdictions. The Corporation is generally no longer subject to U.S. federal, state and local income tax examinations by tax authorities for tax years before 2014.2016.
NOTE 2223
NET INCOME PER SHARE
Basic net income per share is computed by dividing net income by the weighted-average shares outstanding during the reporting period. Diluted net income per share is computed by dividing net income by the combination of all dilutive common share equivalents, comprised of shares issuable under the Corporation’s share-based compensation plans, and the weighted-average shares outstanding during the reporting period.
Dilutiveperiod and all potentially dilutive common shares. Potentially dilutive common shares include stock options and RSAs issued under the Corporation's share-based compensation plans. Potentially dilutive common shares are excluded from the computation of diluted earnings per share equivalents includein the dilutiveperiods where the effect of in-the-money share-based awards, which are calculated based on the average share price for each period using the treasury stock method. Under the treasury stock method, the exercise price of share-based awards, the amount of compensation expense, if any, for future service that the Corporation has not yet recognized, and the amount of estimated tax benefits that would be recorded in additional paid-in capital when share-based awards are exercised, are assumed to be used to repurchase common stock in the current period.antidilutive.
The following table reconciles basic and diluted net income per share for the years indicated:
|
| | | | | | | | | | | | | | | | | | | | | | | | | | | | | | | | |
| | 2019 | | 2018 | | 2017 |
| | | | Weighted-Average Shares | | | | | | Weighted-Average Shares | | | | | | Weighted-Average Shares | | |
| Basic net income per share: | | | | | | | | | | | | | | | | | |
| Net income available to common stockholders | $ | 164,460 |
| | 51,412,133 |
| | $ | 3.20 |
| | $ | 159,139 |
| | 49,262,015 |
| | $ | 3.23 |
| | $ | 96,070 |
| | 45,181,221 |
| | $ | 2.13 |
|
| Effect of dilutive stock options and restricted stock awards | | | 149,105 |
| | | | | | 208,908 |
| | | | | | 221,757 |
| | |
| Diluted net income per share: | | | | | | | | | | | | | | | | | |
| Net income available to common stockholders | $ | 164,460 |
| | 51,561,238 |
| | $ | 3.19 |
| | $ | 159,139 |
| | 49,470,923 |
| | $ | 3.22 |
| | $ | 96,070 |
| | 45,402,978 |
| | $ | 2.12 |
|
|
| | | | | | | | | | | | | | | | | | | | | | | | | | | | | | | | |
| | 2017 | | 2016 | | 2015 |
| | | | Weighted-Average Shares | | | | | | Weighted-Average Shares | | | | | | Weighted-Average Shares | | |
| Basic net income per share: | | | | | | | | | | | | | | | | | |
| Net income available to common stockholders | $ | 96,070 |
| | 45,181,221 |
| | $ | 2.13 |
| | $ | 81,051 |
| | 40,767,343 |
| | $ | 1.99 |
| | $ | 65,384 |
| | 37,816,399 |
| | $ | 1.73 |
|
| Effect of dilutive stock options and restricted stock awards | | | 221,757 |
| | | | | | 245,790 |
| | | | | | 271,834 |
| | |
| Diluted net income per share: | | | | | | | | | | | | | | | | | |
| Net income available to common stockholders | $ | 96,070 |
| | 45,402,978 |
| | $ | 2.12 |
| | $ | 81,051 |
| | 41,013,133 |
| | $ | 1.98 |
| | $ | 65,384 |
| | 38,088,233 |
| | $ | 1.72 |
|
As of December 31, 2019, 2018 and 2017, there were no0 stock options with an option price greater than the average market price of the common shares.
Options to purchase 51,949 and 286,119 shares of common stock, with weighted average exercise prices of $19.26 and $19.99 at December 31, 2016 and 2015, respectively, were excluded from the computation of diluted net income per share because the options exercise price was greater than the average market price of the common stock.
PART II: ITEM 8. FINANCIAL STATEMENTS AND SUPPLEMENTARY DATA
NOTES TO CONSOLIDATED FINANCIAL STATEMENTS
(table dollar amounts in thousands, except share data)
NOTE 2324
QUARTERLY RESULTS OF OPERATIONS (UNAUDITED)
The following table sets forth certain quarterly results for the years ended December 31, 20172019 and 2016:2018:
|
| | | | | | | | | | | | | | | | | | | | | | | | | | | | | | | |
| | 2019 | | 2018 |
| | First | | Second | | Third | | Fourth | | First | | Second | | Third | | Fourth |
| Interest income | $ | 108,813 |
| | $ | 112,639 |
| | $ | 118,132 |
| | $ | 125,821 |
| | $ | 93,620 |
| | $ | 100,871 |
| | $ | 104,800 |
| | $ | 108,653 |
|
| Interest expense | 23,947 |
| | 27,361 |
| | 29,200 |
| | 28,237 |
| | 13,704 |
| | 16,300 |
| | 18,314 |
| | 20,769 |
|
| Net interest income | 84,866 |
| | 85,278 |
| | 88,932 |
| | 97,584 |
| | 79,916 |
| | 84,571 |
| | 86,486 |
| | 87,884 |
|
| Provision for loan losses | 1,200 |
| | 500 |
| | 600 |
| | 500 |
| | 2,500 |
| | 1,663 |
| | 1,400 |
| | 1,664 |
|
| Net interest income after provision for loan losses | 83,666 |
| | 84,778 |
| | 88,332 |
| | 97,084 |
| | 77,416 |
| | 82,908 |
| | 85,086 |
| | 86,220 |
|
| Non-interest income | 18,713 |
| | 21,614 |
| | 22,116 |
| | 24,245 |
| | 19,561 |
| | 18,191 |
| | 19,527 |
| | 19,180 |
|
| Non-interest expense | 56,621 |
| | 57,587 |
| | 67,354 |
| | 65,201 |
| | 53,687 |
| | 53,504 |
| | 55,022 |
| | 57,738 |
|
| Income before income tax expense | 45,758 |
| | 48,805 |
| | 43,094 |
| | 56,128 |
| | 43,290 |
| | 47,595 |
| | 49,591 |
| | 47,662 |
|
| Income tax expense | 6,941 |
| | 7,749 |
| | 6,337 |
| | 8,298 |
| | 6,611 |
| | 7,961 |
| | 8,478 |
| | 5,949 |
|
| Net income available to common stockholders | $ | 38,817 |
| | $ | 41,056 |
| | $ | 36,757 |
| | $ | 47,830 |
| | $ | 36,679 |
| | $ | 39,634 |
| | $ | 41,113 |
| | $ | 41,713 |
|
| | | | | | | | | | | | | | | | |
| Basic EPS | $ | 0.79 |
| | $ | 0.83 |
| | $ | 0.71 |
| | $ | 0.87 |
| | $ | 0.75 |
| | $ | 0.80 |
| | $ | 0.83 |
| | $ | 0.85 |
|
| Diluted EPS | $ | 0.78 |
| | $ | 0.83 |
| | $ | 0.71 |
| | $ | 0.87 |
| | $ | 0.74 |
| | $ | 0.80 |
| | $ | 0.83 |
| | $ | 0.85 |
|
| Average Shares Outstanding: | | | | | | | | | | | | | | | |
| Basic | 49,369,024 |
| | 49,432,167 |
| | 51,433,227 |
| | 55,348,176 |
| | 49,192,647 |
| | 49,252,580 |
| | 49,286,945 |
| | 49,314,276 |
|
| Diluted | 49,540,844 |
| | 49,549,887 |
| | 51,569,557 |
| | 55,519,953 |
| | 49,427,972 |
| | 49,451,406 |
| | 49,492,019 |
| | 49,511,233 |
|
|
| | | | | | | | | | | | | | | | | | | | | | | | | | | | | | | |
| | 2017 | | 2016 |
| | First | | Second | | Third | | Fourth | | First | | Second | | Third | | Fourth |
| Interest income | $ | 68,234 |
| | $ | 71,467 |
| | $ | 84,847 |
| | $ | 90,348 |
| | $ | 61,227 |
| | $ | 62,704 |
| | $ | 64,376 |
| | $ | 65,005 |
|
| Interest expense | 7,235 |
| | 8,367 |
| | 10,427 |
| | 11,583 |
| | 6,772 |
| | 6,742 |
| | 6,694 |
| | 6,631 |
|
| Net interest income | 60,999 |
| | 63,100 |
| | 74,420 |
| | 78,765 |
| | 54,455 |
| | 55,962 |
| | 57,682 |
| | 58,374 |
|
| Provision for loan losses | 2,385 |
| | 2,875 |
| | 2,083 |
| | 1,800 |
| | 550 |
| | 790 |
| | 1,900 |
| | 2,417 |
|
| Net interest income after provision for loan losses | 58,614 |
| | 60,225 |
| | 72,337 |
| | 76,965 |
| | 53,905 |
| | 55,172 |
| | 55,782 |
| | 55,957 |
|
| Non-interest income | 14,846 |
| | 18,434 |
| | 18,668 |
| | 19,061 |
| | 15,837 |
| | 16,385 |
| | 16,861 |
| | 16,120 |
|
| Non-interest expense | 43,099 |
| | 47,316 |
| | 58,708 |
| | 56,433 |
| | 46,475 |
| | 44,835 |
| | 44,115 |
| | 41,934 |
|
| Income before income tax expense | 30,361 |
| | 31,343 |
| | 32,297 |
| | 39,593 |
| | 23,267 |
| | 26,722 |
| | 28,528 |
| | 30,143 |
|
| Income tax expense | 7,168 |
| | 7,207 |
| | 7,939 |
| | 15,210 |
| | 5,574 |
| | 6,716 |
| | 7,469 |
| | 7,850 |
|
| Net income available to common stockholders | $ | 23,193 |
| | $ | 24,136 |
| | $ | 24,358 |
| | $ | 24,383 |
| | $ | 17,693 |
| | $ | 20,006 |
| | $ | 21,059 |
| | $ | 22,293 |
|
| | | | | | | | | | | | | | | | |
| Basic EPS | $ | 0.57 |
| | $ | 0.57 |
| | $ | 0.50 |
| | $ | 0.49 |
| | $ | 0.43 |
| | $ | 0.50 |
| | $ | 0.51 |
| | $ | 0.55 |
|
| Diluted EPS | $ | 0.56 |
| | $ | 0.57 |
| | $ | 0.50 |
| | $ | 0.49 |
| | $ | 0.43 |
| | $ | 0.49 |
| | $ | 0.51 |
| | $ | 0.55 |
|
| Average Shares Outstanding: | | | | | | | | | | | | | | | |
| Basic | 40,984,481 |
| | 42,038,824 |
| | 48,431,880 |
| | 49,144,310 |
| | 40,690,573 |
| | 40,751,720 |
| | 40,779,423 |
| | 40,846,650 |
|
| Diluted | 41,220,586 |
| | 42,243,539 |
| | 48,643,774 |
| | 49,379,303 |
| | 40,916,972 |
| | 40,969,111 |
| | 41,025,784 |
| | 41,124,179 |
|
NOTE 2425
CONDENSED FINANCIAL INFORMATION (parent company only)
Presented below is condensed financial information as to financial position, results of operations, and cash flows of the Corporation.
Condensed Balance Sheets
|
| | | | | | | |
| December 31, 2019 |
| December 31, 2018 |
| Assets | |
| |
| Cash | $ | 127,723 |
|
| $ | 87,435 |
|
| Investment in subsidiaries | 1,791,070 |
|
| 1,459,036 |
|
| Premises and equipment | 153 |
|
| 1,158 |
|
| Interest receivable | 6 |
|
| 6 |
|
| Goodwill | 448 |
|
| 448 |
|
| Cash surrender value of life insurance | 837 |
|
| 810 |
|
| Other assets | 16,803 |
|
| 5,240 |
|
| Total assets | $ | 1,937,040 |
|
| $ | 1,554,133 |
|
| Liabilities | |
| |
| Subordinated debentures and term loans | $ | 138,685 |
|
| $ | 138,463 |
|
| Interest payable | 977 |
|
| 994 |
|
| Other liabilities | 10,941 |
|
| 6,416 |
|
| Total liabilities | 150,603 |
|
| 145,873 |
|
| Stockholders' equity | 1,786,437 |
|
| 1,408,260 |
|
| Total liabilities and stockholders' equity | $ | 1,937,040 |
|
| $ | 1,554,133 |
|
|
| | | | | | | |
| December 31, 2017 |
| December 31, 2016 |
| Assets | |
| |
| Cash | $ | 31,527 |
|
| $ | 31,944 |
|
| Investment in subsidiaries | 1,411,360 |
|
| 978,291 |
|
| Investment securities | 31 |
|
| 18,765 |
|
| Premises and equipment | 1,252 |
|
| 1,260 |
|
| Interest receivable | 5 |
|
| 47 |
|
| Goodwill | 448 |
|
| 448 |
|
| Cash surrender value of life insurance | 787 |
|
| 1,082 |
|
| Tax asset, deferred and receivable |
|
|
| 521 |
|
| Other assets | 3,480 |
|
| 5,274 |
|
| Total assets | $ | 1,448,890 |
|
| $ | 1,037,632 |
|
| Liabilities | |
| |
| Subordinated debentures and term loans | $ | 138,241 |
|
| $ | 127,427 |
|
| Interest payable | 968 |
|
| 880 |
|
| Other liabilities | 6,218 |
|
| 7,668 |
|
| Total liabilities | 145,427 |
|
| 135,975 |
|
| Stockholders' equity | 1,303,463 |
|
| 901,657 |
|
| Total liabilities and stockholders' equity | $ | 1,448,890 |
|
| $ | 1,037,632 |
|
PART II: ITEM 8. FINANCIAL STATEMENTS AND SUPPLEMENTARY DATA
NOTES TO CONSOLIDATED FINANCIAL STATEMENTS
(table dollar amounts in thousands, except share data)
Condensed Statements of Income and Comprehensive Income
|
| | | | | | | | | | | |
| | December 31, 2019 | | December 31, 2018 | | December 31, 2017 |
| Income | | | | | |
| Dividends from subsidiaries | $ | 125,775 |
| | $ | 100,954 |
| | $ | 33,014 |
|
| Loss on sale of available for sale securities | — |
| | — |
| | (50 | ) |
| Other income | 172 |
| | 572 |
| | 350 |
|
| Total income | 125,947 |
| | 101,526 |
| | 33,314 |
|
| Expenses | | | | | |
| Interest expense | 8,309 |
| | 8,233 |
| | 7,572 |
|
| Salaries and employee benefits | 3,540 |
| | 3,729 |
| | 4,118 |
|
| Net occupancy and equipment expenses | 802 |
| | 851 |
| | 797 |
|
| Other outside services | 1,889 |
| | 489 |
| | 1,810 |
|
| Professional services | 303 |
| | 270 |
| | 442 |
|
| Other expenses | 1,587 |
| | 442 |
| | (385 | ) |
| Total expenses | 16,430 |
| | 14,014 |
| | 14,354 |
|
| Income before income tax benefit and equity in undistributed income of subsidiaries | 109,517 |
| | 87,512 |
| | 18,960 |
|
| Income tax benefit | 3,575 |
| | 3,298 |
| | 5,946 |
|
| Income before equity in undistributed income of subsidiaries | 113,092 |
| | 90,810 |
| | 24,906 |
|
| Equity in undistributed income of subsidiaries | 51,368 |
| | 68,329 |
| | 71,164 |
|
| Net income available to common stockholders | $ | 164,460 |
| | $ | 159,139 |
| | $ | 96,070 |
|
| | | | | | |
| Net income | $ | 164,460 |
| | $ | 159,139 |
| | $ | 96,070 |
|
| Other comprehensive income (loss) | 49,296 |
| | (17,888 | ) | | 10,673 |
|
| Comprehensive income | $ | 213,756 |
| | $ | 141,251 |
| | $ | 106,743 |
|
|
| | | | | | | | | | | |
| | December 31, 2017 | | December 31, 2016 | | December 31, 2015 |
| Income | | | | | |
| Dividends from subsidiaries | $ | 33,014 |
| | $ | 33,546 |
| | $ | 39,032 |
|
| Gain on the sale of insurance subsidiary |
|
| |
|
| | 8,265 |
|
| Gain on cancellation of subordinated debentures |
|
| |
|
| | 1,250 |
|
| Loss on sale of available for sale securities | (50 | ) | | | | |
| Other income | 350 |
| | 143 |
| | 197 |
|
| Total income | 33,314 |
| | 33,689 |
| | 48,744 |
|
| Expenses | | | | | |
| Interest expense | 7,572 |
| | 7,185 |
| | 6,661 |
|
| Salaries and employee benefits | 4,118 |
| | 639 |
| | 3,023 |
|
| Net occupancy and equipment expenses | 797 |
| | 832 |
| | 464 |
|
| Other outside services | 1,810 |
| | 967 |
| | 1,455 |
|
| Professional services | 442 |
| | 279 |
| | 636 |
|
| Other expenses | (385 | ) | | (470 | ) | | 1,234 |
|
| Total expenses | 14,354 |
| | 9,432 |
| | 13,473 |
|
| Income before income tax benefit (expense) and equity in undistributed income of subsidiaries | 18,960 |
| | 24,257 |
| | 35,271 |
|
| Income tax benefit (expense) | 5,946 |
| | 3,243 |
| | (974 | ) |
| Income before equity in undistributed income of subsidiaries | 24,906 |
| | 27,500 |
| | 34,297 |
|
| Equity in undistributed income of subsidiaries | 71,164 |
| | 53,551 |
| | 31,087 |
|
| Net income available to common stockholders | $ | 96,070 |
| | $ | 81,051 |
| | $ | 65,384 |
|
| | | | | | |
| Net income | $ | 96,070 |
| | $ | 81,051 |
| | $ | 65,384 |
|
| Other comprehensive income (loss) | 10,673 |
| | (12,219 | ) | | 268 |
|
| Comprehensive income | $ | 106,743 |
| | $ | 68,832 |
| | $ | 65,652 |
|
Condensed StatementStatements of Cash Flows
|
| | | | | | | | | | | |
| | December 31, 2019 | | December 31, 2018 | | December 31, 2017 |
| Cash Flow From Operating Activities: | |
| |
| |
| Net income | $ | 164,460 |
|
| $ | 159,139 |
|
| $ | 96,070 |
|
| Adjustments to Reconcile Net Income to Net Cash: | |
| |
| |
| Share-based compensation | 1,339 |
|
| 1,256 |
|
| 1,215 |
|
| Distributions in excess of (equity in undistributed) income of subsidiaries | (51,368 | ) |
| (68,329 | ) |
| (71,164 | ) |
| Loss on sale of available for sale securities | — |
|
| — |
|
| 50 |
|
| Net Change in: | |
| |
| |
| Other assets | (8,944 | ) |
| 584 |
|
| 3,358 |
|
| Other liabilities | 4,611 |
|
| 274 |
|
| (1,900 | ) |
| Investment in subsidiaries - operating activities | (268 | ) |
| 841 |
|
| 1,112 |
|
| Net cash provided by operating activities | 109,830 |
|
| 93,765 |
|
| 28,741 |
|
| Cash Flow From Investing Activities: |
|
|
|
|
|
|
| Net cash received in acquisition | 78 |
|
| — |
|
| 37 |
|
| Other | — |
|
| 2,189 |
|
| — |
|
| Net cash provided by investing activities | 78 |
|
| 2,189 |
|
| 37 |
|
| Cash Flow From Financing Activities: | |
| |
| |
| Cash dividends | (51,276 | ) |
| (41,660 | ) |
| (31,820 | ) |
| Stock issued under employee benefit plans | 702 |
|
| 707 |
|
| 519 |
|
| Stock issued under dividend reinvestment and stock purchase plan | 1,531 |
|
| 1,211 |
|
| 991 |
|
| Stock options exercised | 144 |
|
| 1,598 |
|
| 2,398 |
|
| Restricted shares withheld for taxes | (1,680 | ) |
| (1,902 | ) |
| (1,283 | ) |
| Repurchases of common stock | (19,041 | ) |
| — |
|
| — |
|
| Net cash used by financing activities | (69,620 | ) |
| (40,046 | ) |
| (29,195 | ) |
| Net change in cash | 40,288 |
|
| 55,908 |
|
| (417 | ) |
| Cash, beginning of the year | 87,435 |
|
| 31,527 |
|
| 31,944 |
|
| Cash, end of year | $ | 127,723 |
|
| $ | 87,435 |
|
| $ | 31,527 |
|
|
| | | | | | | | | | | |
| | Year Ended December 31, |
| | 2017 | | 2016 | | 2015 |
| Cash Flow From Operating Activities: | | | | | |
| Net income | $ | 96,070 |
| | $ | 81,051 |
| | $ | 65,384 |
|
| Adjustments to Reconcile Net Income to Net Cash: | | | | | |
| Share-based compensation | 1,215 |
| | 1,166 |
| | 843 |
|
| Distributions in excess of (equity in undistributed) income of subsidiaries | (71,164 | ) | | (53,551 | ) | | (31,087 | ) |
| Gain on sale of insurance subsidiary |
| |
| | (8,265 | ) |
| Gain on cancellation of subordinated debentures |
| |
| | (1,250 | ) |
| Loss on sale of available for sale securities | 50 |
| | | | |
| Net Change in: | | | | | |
| Other assets | 3,358 |
| | 833 |
| | (441 | ) |
| Other liabilities | (1,900 | ) | | 849 |
| | (1,486 | ) |
| Investment in subsidiaries - operating activities | 1,112 |
| | (1,938 | ) | | 197 |
|
| Net cash provided by operating activities | 28,741 |
| | 28,410 |
| | 23,895 |
|
| Cash Flow From Investing Activities: | | | | | |
| Purchase of securities available for sale |
|
| | (19,804 | ) | | |
| Net cash received (paid) in acquisition | 37 |
| |
|
| | (14,500 | ) |
| Proceeds from business divestitures | | |
|
| | 16,000 |
|
| Other |
|
| |
|
| | 575 |
|
| Net cash provided (used) in investing activities | 37 |
| | (19,804 | ) | | 2,075 |
|
| Cash Flow From Financing Activities: | | | | | |
| Cash dividends | (31,820 | ) | | (22,203 | ) | | (15,654 | ) |
| Repayment of borrowings |
|
| |
|
| | (3,750 | ) |
| Stock issued under employee benefit plans | 519 |
| | 462 |
| | 460 |
|
| Stock issued under dividend reinvestment and stock purchase plan | 991 |
| | 835 |
| | 661 |
|
| Stock options exercised | 2,398 |
| | 2,602 |
| | 1,531 |
|
| Stock redeemed | (1,283 | ) | | (1,980 | ) | | (1,640 | ) |
| Net cash used by financing activities | (29,195 | ) | | (20,284 | ) | | (18,392 | ) |
| Cash, beginning of the year | 31,944 |
| | 43,622 |
| | 36,044 |
|
| Cash, end of year | $ | 31,527 |
| | $ | 31,944 |
| | $ | 43,622 |
|
PART II: ITEM 8. FINANCIAL STATEMENTS AND SUPPLEMENTARY DATA
NOTES TO CONSOLIDATED FINANCIAL STATEMENTS
(table dollar amounts in thousands, except share data)
NOTE 25
ACCOUNTING MATTERS
The Corporation continually monitors potential accounting changes and pronouncements. The following pronouncements have been deemed to have the most applicability to the Corporation's financial statements:
FASB Accounting Standards Updates No. 2018-02 - Income Statement - Reporting Comprehensive Income (Topic 220)-Reclassification of Certain Tax Effects from Accumulated Other Comprehensive Income
Summary - The FASB issued an Accounting Standards Update (ASU) that helps organizations address certain stranded income tax effects in accumulated other comprehensive income (AOCI) resulting from the Tax Cuts and Jobs Act.
ASU No. 2018-02, Income Statement-Reporting Comprehensive Income (Topic 220): Reclassification of Certain Tax Effects from Accumulated Other Comprehensive Income, provides financial statement preparers with an option to reclassify stranded tax effects within AOCI to retained earnings in each period in which the effect of the change in the U.S. federal corporate income tax rate in the Tax Cuts and Jobs Act (or portion thereof) is recorded.
The ASU requires financial statement preparers to disclose:
•A description of the accounting policy for releasing income tax effects from AOCI;
•Whether they elect to reclassify the stranded income tax effects from the Tax Cuts and Jobs Act; and
•Information about the other income tax effects that are reclassified.
The amendments affect any organization that is required to apply the provisions of Topic 220, Income Statement-Reporting Comprehensive Income, and has items of other comprehensive income for which the related tax effects are presented in other comprehensive income as required by GAAP.
The amendments are effective for all organizations for fiscal years beginning after December 15, 2018, and interim periods within those fiscal years. Early adoption is permitted. Organizations should apply the proposed amendments either in the period of adoption or retrospectively to each period (or periods) in which the effect of the change in the U.S. federal corporate income tax rate in the Tax Cuts and Jobs Act is recognized. The Corporation adopted this ASU in the first quarter of 2018. Adoption of this ASU did not have a significant effect on the Corporation’s consolidated financial statements.
FASB Accounting Standards Update No. 2017-12 - Derivatives and Hedging (Topic 815): Targeted Improvements to Accounting for Hedging Activities
Summary - The FASB has issued an Accounting Standards Update (ASU) No. 2017-12, Derivatives and Hedging (Topic 815): Targeted Improvements to Accounting for Hedging Activities. The new standard is intended to improve and simplify accounting rules around hedge accounting. The ASU is effective for public companies in 2019 and private companies in 2020. Early adoption is permitted.
The new standard refines and expands hedge accounting for both financial (e.g., interest rate) and commodity risks. Its provisions create more transparency around how economic results are presented, both on the face of the financial statements and in the footnotes, for investors and analysts.
The new standard takes effect for fiscal years, and interim periods within those fiscal years, beginning after December 15, 2018, for public companies and for fiscal years beginning after December 15, 2019 (and interim periods for fiscal years beginning after December 15, 2020), for private companies. Early adoption is permitted in any interim period or fiscal years before the effective date of the standard. The Corporation plans to adopt ASU 2017-12 in the first quarter of 2019.
ASU 2017-12 requires a modified retrospective transition method in which the Corporation will recognize the cumulative effect of the change on the opening balance of each affected component of equity in the statement of financial position as of the date of adoption. While the Corporation continues to assess all potential impacts of the standard, adoption of the standard is not expected to have a significant effect on the Corporation’s consolidated financial statements.
PART II: ITEM 8. FINANCIAL STATEMENTS AND SUPPLEMENTARY DATA
NOTES TO CONSOLIDATED FINANCIAL STATEMENTS
(table dollar amounts in thousands, except share data)
FASB Accounting Standards Update No. 2017-08 - Receivables - Nonrefundable Fees and Other Costs (Subtopic 310-20): Premium Amortization on Purchased Callable Debt Securities
Summary - The FASB has issued Accounting Standards Update (ASU) No. 2017-08, Receivables-Nonrefundable Fees and Other Costs (Subtopic 310-20), Premium Amortization on Purchased Callable Debt Securities. The ASU shortens the amortization period for certain callable debt securities held at a premium to the earliest call date.
Under current GAAP, entities normally amortize the premium as an adjustment of yield over the contractual life of the instrument. Stakeholders have expressed concerns with the current approach on the basis that current GAAP excludes certain callable debt securities from consideration of early repayment of principal even if the holder is certain that the call will be exercised. As a result, upon the exercise of a call on a callable debt security held at a premium, the unamortized premium is recorded as a loss in earnings. Further, there is diversity in practice (1) in the amortization period for premiums of callable debt securities, and (2) in how the potential for exercise of a call is factored into current impairment assessments. Another issue is that the practice in the United States is to quote, price, and trade callable debt securities assuming a model that incorporates consideration of calls (also referred to as “yield-to-worst” pricing).
The ASU shortens the amortization period for certain callable debt securities held at a premium and requires the premium to be amortized to the earliest call date. However, the amendments do not require an accounting change for securities held at a discount; the discount continues to be amortized to maturity.
The amendments are effective for public business entities for annual periods beginning after December 15, 2018, including interim periods within those annual periods. For other entities, the amendments are effective for annual periods beginning after December 15, 2019, and interim periods within annual periods beginning after December 15, 2020. Early adoption is permitted.
Entities are required to apply the amendments on a modified retrospective basis through a cumulative-effect adjustment directly to retained earnings as of the beginning of the period of adoption. The entity is required to provide disclosures about a change in accounting principle in the period of adoption. The Corporation plans to adopt ASU 2017-08 in the first quarter of 2019. Adoption of this ASU is not expected to have a significant effect on the Corporation’s consolidated financial statements.
FASB Accounting Standards Update No. 2017-07 - Compensation - Retirement Benefits (Topic 715): Improving the Presentation of Net Periodic Pension Cost and Net Periodic Postretirement Benefit Cost
Summary - The FASB has issued Accounting Standards Update (ASU) No. 2017-07, Compensation - Retirement Benefits (Topic 715): Improving the Presentation of Net Periodic Pension Cost and Net Periodic Postretirement Benefit Cost. The amendments apply to all employers, including not-for-profit entities, that offer to their employees defined benefit pension plans, other postretirement benefit plans, or other types of benefits accounted for under Topic 715, Compensation - Retirement Benefits.
The amendments require that an employer report the service cost component in the same line item or items as other compensation costs arising from services rendered by the pertinent employees during the period. The other components of net benefit cost are required to be presented in the income statement separately from the service cost component and outside a subtotal of income from operations, if one is presented. If a separate line item or items are used to present the other components of net benefit cost, that line item or items must be appropriately described. If a separate line item or items are not used, the line item or items used in the income statement to present the other components of net benefit cost must be disclosed.
The amendments also allow only the service cost component to be eligible for capitalization when applicable (e.g., as a cost of internally manufactured inventory or a self-constructed asset).
The amendments are effective for public business entities for annual periods beginning after December 15, 2017, including interim periods within those annual periods. For other entities, the amendments are effective for annual periods beginning after December 15, 2018, and interim periods within annual periods beginning after December 15, 2019. Early adoption is permitted as of the beginning of an annual period for which financial statements (interim or annual) have not been issued or made available for issuance. The Corporation adopted this ASU in the first quarter of 2018. Adoption of this ASU did not have a significant effect on the Corporation’s consolidated financial statements.
FASB Accounting Standards Update No. 2016-13, Financial Instruments - Credit Losses (Topic 326): Measurement of Credit Losses on Financial Instruments
Summary - The FASB has issued Accounting Standards Update (ASU) No. 2016-13, Financial Instruments - Credit Losses (Topic 326): Measurement of Credit Losses on Financial Instruments. This new guidance was issued to address concerns that current generally accepted accounting principles (GAAP) restricts the ability to record credit losses that are expected, but do not yet meet the “probable” threshold by replacing the current “incurred loss” model for recognizing credit losses with an “expected life of loan loss” model referred to as the Current Expected Credit Loss (CECL) model.
PART II: ITEM 8. FINANCIAL STATEMENTS AND SUPPLEMENTARY DATA
NOTES TO CONSOLIDATED FINANCIAL STATEMENTS
(table dollar amounts in thousands, except share data)
Under the CECL model, certain financial assets carried at amortized cost, such as loans held for investment and held-to-maturity debt securities, are required to be presented at the net amount expected to be collected. The measurement of expected credit losses is to be based on information about past events, including historical experience, current conditions, and reasonable and supportable forecasts that affect the collectability of the reported amount. This measurement will take place at the time the financial asset is first added to the balance sheet and periodically thereafter. This differs significantly from the “incurred loss” model required under current GAAP, which delays recognition until it is probable a loss has been incurred. The change could materially affect how the allowance for loan losses is determined and cause a charge to earnings through the provision for loan losses. Such would adversely affect the financial condition of the Corporation.
The ASU is effective for SEC filers for fiscal years, and interim periods within those fiscal years, beginning after December 15, 2019 (i.e., January 1, 2020, for calendar year entities). Early application will be permitted for all organizations for fiscal years, and interim periods within those fiscal years, beginning after December 15, 2018. The Corporation plans to adopt this ASU in the first quarter of 2020.
The impact of CECL adoption continues to be evaluated, but it’s expected a one-time cumulative-effect adjustment to the allowance for loan losses will be recognized in retained earnings on the consolidated balance sheet as of the beginning of the first reporting period in which the new standard is effective, as is consistent with regulatory expectations set forth in interagency guidance issued at the end of 2016. The magnitude of any such adjustment or the overall impact of the new standard on financial condition or results of operations cannot yet be determined.
FASB Accounting Standards Update No. 2016-02 - Leases (Topic 842)
Summary - The FASB has issued its new lease accounting guidance in Accounting Standards Update (ASU) No. 2016-02, Leases (Topic 842). Under the new guidance, lessees will be required to recognize the following for all leases (with the exception of short-term leases) at the commencement date:
A lease liability, which is a lessee‘s obligation to make lease payments arising from a lease, measured on a discounted basis; and
A right-of-use asset, which is an asset that represents the lessee’s right to use, or control the use of, a specified asset for the lease term.
Under the new guidance, lessor accounting is largely unchanged. Certain targeted improvements were made to align, where necessary, lessor accounting with the lessee accounting model and Topic 606, Revenue from Contracts with Customers. The new lease guidance simplified the accounting for sale and leaseback transactions primarily because lessees must recognize lease assets and lease liabilities. Lessees will no longer be provided with a source of off-balance sheet financing.
Public business entities should apply the amendments in ASU 2016-02 for fiscal years beginning after December 15, 2018, including interim periods within those fiscal years (i.e., January 1, 2019, for a calendar year entity). Nonpublic business entities should apply the amendments for fiscal years beginning after December 15, 2019 (i.e., January 1, 2020, for a calendar year entity), and interim periods within fiscal years beginning after December 15, 2020. Early application is permitted for all public business entities and all nonpublic business entities upon issuance.
Lessees (for capital and operating leases) and lessors (for sales-type, direct financing, and operating leases) must apply a modified retrospective transition approach for leases existing at, or entered into after, the beginning of the earliest comparative period presented in the financial statements. The modified retrospective approach would not require any transition accounting for leases that expired before the earliest comparative period presented. Lessees and lessors may not apply a full retrospective transition approach. The Corporation plans to adopt this ASU in the first quarter of 2019. The impact of this ASU continues to be evaluated, but it’s expected a one-time adjustment to the Corporation’s other assets and other liabilities on the consolidated balance sheet will occur as of the beginning of the first reporting period in which the new standard is effective. The magnitude of any such adjustment or the overall impact of the new standard on financial condition, results of operations and regulatory capital is being evaluated.
PART II: ITEM 8. FINANCIAL STATEMENTS AND SUPPLEMENTARY DATA
NOTES TO CONSOLIDATED FINANCIAL STATEMENTS
(table dollar amounts in thousands, except share data)
FASB Accounting Standards Updates No. 2016-01, Financial Instruments - Overall (Subtopic 825-10): Recognition and Measurement of Financial Assets and Financial Liabilities
Summary - The FASB has issued Accounting Standards Update (ASU) No. 2016-01, Financial Instruments - Overall (Subtopic 825-10): Recognition and Measurement of Financial Assets and Financial Liabilities. The new guidance is intended to improve the recognition and measurement of financial instruments. The ASU affects public and private companies, not-for-profit organizations, and employee benefit plans that hold financial assets or owe financial liabilities.
The new guidance makes targeted improvements to existing U.S. GAAP by:
Requiring equity investments (except those accounted for under the equity method of accounting, or those that result in consolidation of the investee) to be measured at fair value with changes in fair value recognized in net income;
Requiring public business entities to use the exit price notion when measuring the fair value of financial instruments for disclosure purposes;
Requiring separate presentation of financial assets and financial liabilities by measurement category and form of financial asset (i.e., securities or loans and receivables) on the balance sheet or the accompanying notes to the financial statements;
Eliminating the requirement to disclose the fair value of financial instruments measured at amortized cost for organizations that are not public business entities;
Eliminating the requirement for public business entities to disclose the method(s) and significant assumptions used to estimate the fair value that is required to be disclosed for financial instruments measured at amortized cost on the balance sheet; and
Requiring a reporting organization to present separately in other comprehensive income the portion of the total change in the fair value of a liability resulting from a change in the instrument-specific credit risk (also referred to as “own credit”) when the organization has elected to measure the liability at fair value in accordance with the fair value option for financial instruments.
The new guidance is effective for public companies for fiscal years beginning after December 15, 2017, including interim periods within those fiscal years. For private companies, not-for-profit organizations, and employee benefit plans, the new guidance becomes effective for fiscal years beginning after December 15, 2018, and for interim periods within fiscal years beginning after December 15, 2019. The new guidance permits early adoption of the own credit provision. In addition, the new guidance permits early adoption of the provision that exempts private companies and not-for-profit organizations from having to disclose fair value information about financial instruments measured at amortized cost. The Corporation adopted this ASU in the first quarter of 2018. Adoption of this ASU did not have a significant effect on the Corporation’s consolidated financial statements.
FASB Accounting Standards Updates No. 2014-09, Revenue from Contracts with Customers (Topic 606):
Summary - The FASB has issued Accounting Standards Update (ASU) No. 2014-09, Revenue from Contracts with Customers (Topic 606). The amendments in this update supersede virtually all existing GAAP revenue recognition guidance, including most industry-specific revenue recognition guidance. ASU 2014-09 creates a single, principle-based revenue recognition framework and will require entities to apply significantly more judgment and expanded disclosures surrounding revenue recognition. The core principle requires an entity to recognize revenue in a manner that depicts the transfer of goods or services to customers at an amount that reflects the consideration to which the entity expects to be entitled in exchange for those good or services. ASU 2014-09 applies to contracts with customers to provide goods and services, with certain exclusion such as lease contracts, financing arrangements and financial instruments. The amendments in ASU 2014-09 are effective for annual reporting periods beginning after December 15, 2017. Early adoption is permitted for annual reporting periods beginning after December 15, 2016.
The Corporation’s revenue is comprised of net interest income on financial assets and financial liabilities, which is explicitly excluded from the scope of ASU 2014-09, and non-interest income. The revenue line items within the scope of this new guidance have been identified and the Corporation's accounting policies will not materially change since the principles of revenue recognition from the ASU are largely consistent with existing guidance and the Corporation's current practices. The Corporation has elected to implement using the modified retrospective application, with the cumulative effect recorded as an adjustment to opening retained earnings at January 1, 2018. Qualitative disclosures of performance obligations related to revenue recognition and disaggregation for significant categories of revenue will be presented according to the scope of the guidance.
NOTE 26
GENERAL LITIGATION
The Corporation is subject to claims and lawsuits that arise primarily in the ordinary course of business. It is the opinion of management that the disposition or ultimate resolution of such claims and lawsuits will not have a material adverse effect on the consolidated financial position, results of operations and cash flow of the Corporation.
PART II: ITEM 9., ITEM 9A. AND ITEM 9B.
ITEM 9. CHANGES IN AND DISAGREEMENTS WITH ACCOUNTANTS ON ACCOUNTING AND FINANCIAL DISCLOSURE.
In connection with its audits for the two most recent fiscal years ended December 31, 20172019, there have been no disagreements with the Corporation’s independent registered public accounting firm on any matter of accounting principles or practices, financial statement disclosure or audit scope or procedure, nor have there been any changes in accountants.
ITEM 9A. CONTROLS AND PROCEDURES
At the end of the period covered by this report (the “Evaluation Date”), the Corporation carried out an evaluation, under the supervision and with the participation of the Corporation’s management, including the Corporation’s Chief Executive Officer and Chief Financial Officer, of the effectiveness of the design and operation of its disclosure controls and procedures pursuant to Rule 13a-15(e) and 15d-15(e) of the Securities Exchange Act of 1934 (“Exchange Act”). In 2017,2019, the Corporation completed the acquisitionsacquisition of The Arlington Bank and Independent Alliance Banks, Inc.MBT Financial Corp., and as a result, the Corporation extended oversight and monitoring processes that support the Corporation's internal controlcontrols over financial reporting during the second throughthird and fourth quarters of 2017,2019, to include the operations of The Arlington Bank and Independent Alliance Banks.MBT Financial Corp. Based upon that evaluation, the Corporation’s Chief Executive Officer and Chief Financial Officer concluded that, as of the Evaluation Date, the Corporation’s disclosure controls and procedures are effective. Disclosure controls and procedures are controls and procedures that are designed to ensure that information required to be disclosed in the Corporation's reports filed or submitted under the Exchange Act are recorded, processed, summarized and reported within the time periods specified in the Securities and Exchange Commission’s rules and forms.
MANAGEMENT’S REPORT ON INTERNAL CONTROL OVER FINANCIAL REPORTING
Management of First Merchants Corporation (the “Corporation”) is responsible for establishing and maintaining effective internal control over financial reporting as defined in Rule 13a-15(f) under the Securities Exchange Act of 1934. The Corporation’s internal control over financial reporting is designed to provide reasonable assurance to the Corporation’s management and Board of Directors regarding the preparation and fair presentation of published financial statements. As part of its function of assisting the Corporation’s Board of Directors in discharging its responsibility of ensuring financial reporting and regulatory risks to the organization are properly being managed, mitigated and monitored by Management, the Audit Committee of the Board of Directors oversees management’s internal controls over financial reporting.
Because of its inherent limitations, internal control over financial reporting may not prevent or detect misstatements. Accordingly, even those systems determined to be effective can provide only reasonable assurance with respect to financial statement preparation and presentation.
Management assessed the effectiveness of the Corporation’s internal control over financial reporting as of December 31, 2017.2019. In making this assessment, management used the criteria set forth in “Internal Control - Integrated Framework (2013)” issued by the Committee of Sponsoring Organizations (COSO) of the Treadway Commission. As permitted by SEC guidance, management excluded from its assessment the operations of the Independent Alliance Banks, Inc. and The Arlington Bank acquisitionsMBT Financial Corp. acquisition made during 2017,2019, which areis described in NOTE 2 ACQUISITIONS, included within2. ACQUISITION of the Notes to Consolidated Financial Statements included as Item 8 of this Annual Report on Form 10-K. The total assets of the entities acquired in these acquisitionsMBT Financial Corp. represented 17approximately 11 percent of the Corporation's consolidated assets as of December 31, 2017.2019. Based on this assessment, management has determined that the Corporation’s internal control over financial reporting as of December 31, 20172019 is effective based on the specified criteria.
There have been no changes in the Corporation’s internal controls over financial reporting identified in connection with the evaluation referenced above that occurred during the Corporation’s last fiscal quarter that have materially affected, or are reasonably likely to materially affect, the Corporation’s internal control over financial reporting.
BKD, LLP, the independent registered public accounting firm that audited the financial statements included in Item 8 of this Annual Report on Form 10-K, has issued an attestation report on the Corporation’s internal control over financial reporting as of December 31, 2017,2019, which appears as follows.
PART II: ITEM 9., ITEM 9A. AND ITEM 9B.
Report of Independent Registered Public Accounting Firm
To the Shareholders,Stockholders, Board of Directors and Audit Committee
First Merchants Corporation
Muncie, Indiana
Opinion on the Internal Control Over Financial Reporting
We have audited First Merchants Corporation’sCorporation's (Corporation) internal control over financial reporting as of December 31, 2017,2019, based on criteria established in InternalControl - Integrated Framework: Framework: (2013) issued by the Committee of Sponsoring Organizations of the Treadway Commission (COSO).
In our opinion, the CorporationCompany maintained, in all material respects, effective internal control over financial reporting as of December 31, 2017,2019, based on criteria established in Internal Control - Integrated Framework: Framework: (2013) issued by COSO.
We also have audited, in accordance with the standards of the Public Company Accounting Oversight Board (United States) (PCAOB)(“PCAOB”), the consolidated balance sheets of the Corporation as of December 31, 20172019 and 20162018 and the related consolidated statements of income, comprehensive income, stockholders’ equity and the cash flows of the Corporation and our report dated March 1, 2018February 28, 2020, expressed an unqualified opinion thereon.opinion.
Basis for Opinion
The Corporation’s management is responsible for maintaining effective internal control over financial reporting and for its assessment of the effectiveness of internal control over financial reporting, included in the accompanying Management Report on Internal Control Over Financial Reporting. Our responsibility is to express an opinion on the Corporation’s internal control over financial reporting based on our audit.
We are a public accounting firm registered with the PCAOB and are required to be independent with respect to the Corporation in accordance with the U.S. federal securities laws and the applicable rules and regulations of the Securities and Exchange Commission and the PCAOB.
We conducted our audit in accordance with the standards of the PCAOB. Those standards require that we plan and perform the audit to obtain reasonable assurance about whether effective internal control over financial reporting was maintained in all material respects.
Our audit included obtaining an understanding of internal control over financial reporting, assessing the risk that a material weakness exists and testing and evaluating the design and operating effectiveness of internal control based on the assessed risk. Our audit also included performing such other procedures as we considered necessary in the circumstances. We believe that our audit provides a reasonable basis for our opinion.
Definitions and Limitations of Internal Control Over Financial Reporting
A company’scompany's internal control over financial reporting is a process designed to provide reasonable assurance regarding the reliability of financial reporting and the preparation of financial statements for external purposes in accordance with generally accepted accounting principles. A company’s internal control over financial reporting includes those policies and procedures that (1) pertain to the maintenance of records that, in reasonable detail, accurately and fairly reflect the transactions and dispositions of the assets of the company; (2) provide reasonable assurance that transactions are recorded as necessary to permit preparation of financial statements in accordance with generally accepted accounting principles, and that receipts and expenditures of the company are being made only in accordance with authorizations of management and directors of the company; and (3) provide reasonable assurance regarding prevention or timely detection of unauthorized acquisition, use or disposition of the company’scompany's assets that could have a material effect on the financial statements.
Because of its inherent limitations, internal control over financial reporting may not prevent or detect misstatements. Also, projections of any evaluation of effectiveness to future periods are subject to the risk that controls may become inadequate because of changes in conditions or that the degree of compliance with the policies or procedures may deteriorate.
As permitted, the Corporation excluded the operations of the acquisition of The Arlington Bank and Independent Alliance Banks, Inc. acquired during 2017, which is described in Note 2 of the consolidated financial statements, from the scope of management’s report on internal control over financial report. As such, The Arlington Bank and Independent Alliance Banks, Inc. has also been excluded from the scope of our audit of internal control over financial reporting.
BKD, LLP
Indianapolis, Indiana
March 1, 2018February 28, 2020
PART II: ITEM 9., ITEM 9A. AND ITEM 9B.
ITEM 9B. OTHER INFORMATION
None
PART III: ITEM 10., ITEM 11., ITEM 12., ITEM 13. AND ITEM 14.
PART III
ITEM 10. DIRECTORS, EXECUTIVE OFFICERS AND CORPORATE GOVERNANCE
The information required under this Item 10 relating to executive officers is set forth in Part I, “Supplemental Information - Information about our Executive Officers of the Registrant”Officers” of this Annual Report on Form 10-K.
The Corporation has adopted a Code of Ethics that applies to its Chief Executive Officer, Chief Financial Officer, Chief Banking Officer, Senior Vice President of Finance, Corporate Controller and Corporate Treasurer. It is part of the Corporation’s Code of Business Conduct, which applies to all employees and directors of the Corporation and its affiliates. A copy of the Code of Business Conduct may be obtained, free of charge, by writing to First Merchants Corporation at 200 East Jackson Street, Muncie, IN 47305. In addition, the Code of Ethics is maintained on the Corporation’s website, which can be accessed at https://www.firstmerchants.com.
The Corporation will provide information that is responsive to the remainder of this Item 10 in its definitive proxy statement furnished to stockholders in connection with the 20182020 annual meeting (“20182020 Proxy Statement”) or in an amendment to this Annual Report not later than 120 days after the end of the fiscal year covered hereby. That information is incorporated in this Item 10 by reference.
ITEM 11. EXECUTIVE COMPENSATION
The Corporation will provide information that is responsive to this Item 11 in its 20182020 Proxy Statement or in an amendment to this Annual Report on Form 10-K not later than 120 days after the end of the fiscal year covered hereby. That information is incorporated in this Item 11 by reference.
ITEM 12. SECURITY OWNERSHIP OF CERTAIN BENEFICIAL OWNERS AND MANAGEMENT AND RELATED STOCKHOLDER MATTERS
The information required under this Item 12 relating to equity compensation plans is set forth in Part II, Item 5 under the table entitled “Equity Compensation Plan Information” of this Annual Report on Form 10-K. The Corporation will provide additional information that is responsive to this Item 12 in its 20182020 Proxy Statement or in an amendment to this Annual Report not later than 120 days after the end of the fiscal year covered hereby. That information is incorporated in this Item 12 by reference.
ITEM 13. CERTAIN RELATIONSHIPS AND RELATED TRANSACTIONS, AND DIRECTOR INDEPENDENCE
The Corporation will provide information that is responsive to this Item 13 in its 20182020 Proxy Statement or in an amendment to this Annual Report on Form 10-K not later than 120 days after the end of the fiscal year covered hereby. That information is incorporated in this Item 13 by reference.
ITEM 14. PRINCIPAL ACCOUNTANT FEES AND SERVICES
The Corporation will provide information that is responsive to this Item 14 in its 20182020 Proxy Statement or in an amendment to this Annual Report on Form 10-K not later than 120 days after the end of the fiscal year covered hereby. That information is incorporated in this Item 14 by reference.
PART IV: ITEM 15. AND ITEM 16.
PART IV
ITEM 15. EXHIBITS AND FINANCIAL STATEMENT SCHEDULES
FINANCIAL INFORMATION
(a) 1. The following financial statements are filed as part of this document under Item 8 hereof:
Independent accountants' report
Consolidated balance sheets at December 31, 20172019 and 20162018
Consolidated statements of income, years ended December 31, 2017, 20162019, 2018 and 20152017
Consolidated statements of comprehensive income, years ended December 31, 2017, 20162019, 2018 and 20152017
Consolidated statements of stockholders' equity, years ended December 31, 2017, 20162019, 2018 and 20152017
Consolidated statements of cash flows, years ended December 31, 2017, 20162019, 2018 and 20152017
Notes to consolidated financial statements
(a) 2. Financial statement schedules:
All schedules are omitted because they are not applicable or not required, or because the required information is included in the consolidated financial statements or related notes.
(a) 3. Exhibits:
|
| |
Exhibit No: | Description of Exhibits: |
|
| |
2.1 | |
2.2 | |
| 3.1 | |
| 3.2 | |
3.3 | |
| 4.1 | |
| 4.2 | |
| 4.3 | |
| 4.4 | |
| 4.5 | |
| 4.6 | |
| 4.7 | |
| 4.8 | |
| 10.1 | |
| 10.2 | |
| 10.3 | |
| 10.4 | |
| 10.5 | |
| 10.6 | |
| 10.7 | |
| 10.8 | |
PART IV: ITEM 15. AND ITEM 16.
PART IV: ITEM 15. AND ITEM 16.
|
| |
| 10.14 | |
10.15 | |
| 10.15 | |
| 10.16 | |
| 10.17 | |
| 21 | |
| 23 | |
| 24 | |
| 31.1 | |
| 31.2 | |
| 32 | |
99.1 | |
| 101.INS | Inline XBRL Instance Document (3)- the instance document does not appear in the Interactive Data File because its XBRL tags are embedded within the Inline XBRL document (2) |
| 101.SCH | Inline XBRL Taxonomy Extension Schema Document (3)(2) |
| 101.CAL | Inline XBRL Taxonomy Extension Calculation Linkbase Document (3)(2) |
| 101.DEF | Inline XBRL Taxonomy Extension Definition Linkbase Document (3)(2) |
| 101.LAB | Inline XBRL Taxonomy Extension Label Linkbase Document (3)(2) |
| 101.PRE | Inline XBRL Taxonomy Extension Presentation Linkbase Document (3)(2) |
| 104 | Cover Page Interactive Data File (formatted as Inline XBRL and included in Exhibit 101) |
| | |
| | |
| | |
| | (1) Management contract or compensatory plan |
| | (2) Filed herewith. |
| | (3) Furnished herewith. |
PART IV: ITEM 15. AND ITEM 16.
ITEM 16. FORM 10-K SUMMARY
Not applicable.
SIGNATURES
Pursuant to the requirements of Section 13 or 15 (d) of the Securities Exchange Act of 1934, the registrant has duly caused this report to be signed on its behalf by the undersigned, thereunto duly authorized, on this 1st28th day of March, 2018.February, 2020.
|
| | | |
| | FIRST MERCHANTS CORPORATION | |
| | | |
| | | | |
| | By: | /s/ Michael C. Rechin | |
| | Michael C. Rechin, | |
| | President and Chief Executive Officer | |
| | | | |
Pursuant to the requirements of the Securities Exchange Act of 1934, this report on Form 10-K has been signed by the following persons on behalf of the registrant and in the capacities indicated, on this 1st28th day of March, 2018.February, 2020.
|
| |
| /s/ Michael C. Rechin | /s/ Mark K. Hardwick |
| Michael C. Rechin, President and | Mark K. Hardwick, Executive Vice President, |
| Chief Executive Officer | Chief Financial Officer and Chief Operating Officer |
| (Principal Executive Officer) | (Principal Financial and Accounting Officer) |
| | |
| /s/ Michael R. Becher* | /s/ Michael C. Marhenke*Rechin |
| Michael R. Becher, Director | Michael C. Rechin, Director |
| |
| /s/ Harold D. Chaffin* | /s/ Michael C. Marhenke* |
| Harold D. Chaffin, Director | Michael C. Marhenke, Director |
| | |
| /s/ Michael J. Fisher* | /s/ Charles E. Schalliol* |
| Michael J. Fisher, Director | Charles E. Schalliol, Director |
| | |
| /s/ F. Howard Halderman* | /s/ Patrick A. Sherman* |
| F. Howard Halderman, Director | Patrick A. Sherman, Director |
| | |
| /s/ William L. Hoy* | /s/ Terry L. Walker* |
| William L. Hoy, Director | Terry L. Walker, Director |
| | |
/s/ Gary J. Lehman*Clark C. Kellogg* | /s/ Jean L. Wojtowicz* |
Gary J. Lehman,Clark C. Kellogg, Director | Jean L. Wojtowicz, Director |
| | |
/s/ Michael C. RechinGary J. Lehman* | |
Michael C. Rechin,Gary J. Lehman, Director | |
| |
|
| |
| * | By Mark K. Hardwick as Attorney-in Fact pursuant to a Limited Power of Attorney executed by the directors listed above, which Power of Attorney is being filed with the Securities and Exchange Commission as an exhibit hereto. |
|
| | |
| | /s/ Mark K. Hardwick | |
| | Mark K. Hardwick | |
| | As Attorney-in-Fact March 1, 2018February 28, 2020
| |