UNITED STATES SECURITIES AND EXCHANGE COMMISSION
WASHINGTON, D.C. 20549
FORM 10-K
ANNUAL REPORT PURSUANT TO SECTION 13 OR 15(d) OF THE SECURITIES EXCHANGE ACT OF 1934
For the fiscal year ended December 31, 20212023
Commission File Number 001-15877
| | | | | | | | |
| GERMAN AMERICAN BANCORP, INC. | |
| (Exact name of registrant as specified in its charter) | |
| | | | | | | | |
| Indiana | | 35-1547518 |
| (State or other jurisdiction of incorporation or organization) | | (I.R.S. Employer Identification No.) |
| | | | | | | | | | | | | | | | | |
| 711 Main Street, | Box 810, | Jasper, | Indiana | | 47546 |
| (Address of Principal Executive Offices) | | (Zip Code) |
Registrant’s telephone number, including area code: (812) 482-1314
Securities registered pursuant to Section 12(b) of the Act
| | | | | | | | |
| Title of Each Class | Trading Symbol(s) | Name of each exchange on which registered |
| Common Shares, no par value | GABC | Nasdaq Global Select Market |
Securities registered pursuant to Section 12(g) of the Act: None
| | | | | | | | | | | | | | | | | |
| Indicate by check mark if the registrant is a well-known seasoned issuer, as defined in Rule 405 of the Securities Act. | | þ | Yes | o | No |
| | | | | | |
| Indicate by check mark if the registrant is not required to file reports pursuant to Section 13 or Section 15(d) of the Act. | | o | Yes | þ | No |
| | | | | | |
| Indicate by check mark whether the registrant (1) has filed all reports required to be filed by Section 13 or 15(d) of the Securities Exchange Act of 1934 during the preceding 12 months (or for such shorter period that the registrant was required to file such reports), and (2) has been subject to such filing requirements for the past 90 days. | | þ | Yes | o | No |
| | | | | | |
| Indicate by check mark whether the registrant has submitted electronically every Interactive Data File required to be submitted pursuant to Rule 405 of Regulation S-T (§232.405 of this chapter) during the preceding 12 months (or for such shorter period that the registrant was required to submit such files). | | þ | Yes | o | No |
| | | | | | | | | | | | | | | | | |
| Indicate by check mark whether the registrant is a large accelerated filer, an accelerated filer, a non-accelerated filer, a smaller reporting company, or an emerging growth company. See the definitions of “large accelerated filer,” “accelerated filer,” “smaller reporting company,” and “emerging growth company” in Rule 12b-2 of the Exchange Act. | |
| |
| Large accelerated filer | þ | | | Accelerated filer | o |
| | | | | |
| Non-accelerated filer | o | | | Smaller reporting company | ☐o
|
| | | | Emerging growth company | ☐o
|
| | | | | |
If an emerging growth company, indicate by check mark if the registrant has elected not to use the extended transition period for complying with any new or revised financial accounting standards provided pursuant to Section 13(a) of the Exchange Act. o |
| | | | | |
Indicate by check mark whether the registrant has filed a report on and attestation to its management’s assessment of the effectiveness of its internal control over financial reporting under Section 404(b) of the Sarbanes-Oxley Act (15 U.S.C. 7262(b)) by the registered public accounting firm that prepared or issued its audit report. | ☑ |
| | | | | |
| If securities are registered pursuant to Section 12(b) of the Act, indicate by check mark whether the financial statements of the registrant included in the filing reflect the correction of an error to previously issued financial statements. | o |
| | |
| Indicate by check mark whether any of those error corrections are restatements that required a recovery analysis of incentive-based compensation received by any of the registrant’s executive officers during the relevant recovery period pursuant to §240.10D-1(b). ☐ |
| | | | | | | | | | | |
| Indicate by check mark whether the registrant is a shell company (as defined in Rule 12b-2 of the Act). | ☐ | Yes | þ No |
The aggregate market value of the registrant’s common shares held by non-affiliates as of June 30, 20212023 was approximately $936,743,191.$777,294,304. This calculation does not reflect a determination that persons are (or are not) affiliates for any other purpose.
As of February 23, 2022,20, 2024, there were outstanding 29,423,84129,584,709 common shares, no par value, of the registrant.
DOCUMENTS INCORPORATED BY REFERENCE
Portions of the Proxy Statement of German American Bancorp, Inc., for the Annual Meeting of its Shareholders to be held May 19, 2022,April 29, 2024, to the extent stated herein, are incorporated by reference into Part III (Items 10 through 14).
GERMAN AMERICAN BANCORP, INC.
ANNUAL REPORT ON FORM 10-K
For Fiscal Year Ended December 31, 20212023
Table of Contents
| | | | | | | | |
| Glossary of Terms and Acronyms | |
| | |
| PART I | | |
| | | |
| Item 1. | Business | |
| | | |
| Item 1A. | Risk Factors | |
| | | |
| Item 1B. | Unresolved Staff Comments | |
| | | |
| Item 1C. | Cybersecurity | |
| | |
| Item 2. | Properties | |
| | | |
| Item 3. | Legal Proceedings | |
| | | |
| Item 4. | Mine Safety Disclosures | |
| | | |
| PART II | | |
| | | |
| Item 5. | Market for Registrant’s Common Equity, Related Stockholder Matters and Issuer Purchases of Equity Securities | |
| | | |
| Item 6. | [Reserved] | |
| | | |
| Item 7. | Management’s Discussion and Analysis of Financial Condition and Results of Operations | |
| | | |
| Item 7A. | Quantitative and Qualitative Disclosures About Market Risk | |
| | | |
| Item 8. | Financial Statements and Supplementary Data | |
| | | |
| Item 9. | Changes in and Disagreements with Accountants on Accounting and Financial Disclosure | |
| | | |
| Item 9A. | Controls and Procedures | |
| | | |
| Item 9B. | Other Information | |
| | |
| Item 9C. | Disclosure Regarding Foreign Jurisdictions that Prevent Inspections | |
| | | |
| PART III | | |
| | | |
| Item 10. | Directors, Executive Officers and Corporate Governance | |
| | | |
| Item 11. | Executive Compensation | |
| | | |
| Item 12. | Security Ownership of Certain Beneficial Owners and Management and Related Stockholder Matters | |
| | | |
| Item 13. | Certain Relationships and Related Transactions, and Director Independence | |
| | | |
| Item 14. | Principal Accounting Fees and Services | |
| | | |
| PART IV | | |
| | | |
| Item 15. | Exhibits, Financial Statement Schedules | |
| | |
| Item 16. | Form 10-K Summary | |
| | |
| SIGNATURES | |
GLOSSARY OF TERMS AND ACRONYMS
As used in this Report, references to “Company,” “we,” “our,” “us,” and similar terms refer to German American Bancorp, Inc. and its consolidated subsidiaries as a whole. Occasionally, we will refer to the term “parent company” or “holding company” when we mean to refer to only German American Bancorp, Inc. and the term “Bank” when we mean to refer only to German American Bank, the Company’s bank subsidiary.
The terms and acronyms identified below are used throughout this Report, including the Notes to Consolidated Financial Statements. You may find it helpful to refer to this Glossary as you read this Report.
2009 ESPP: German American Bancorp, Inc. 2009 Employee Stock Purchase Plan
2019 ESPP: German American Bancorp, Inc. 2019 Employee Stock Purchase Plan
2019 LTI Plan: German American Bancorp, Inc. 2019 Long-Term Equity Incentive Plan
AOCI: Accumulated other comprehensive income (loss)
ASU: Accounting Standards Update
Basel III Rules: Regulatory capital rules agreed to by the Basel Committee on Banking Supervision, as issued by the FRB and OCC and published in the Federal Register on October 11, 2013
BHC Act: Bank Holding Company Act of 1956, as amended
BSA: Bank Secrecy Act (Financial Recordkeeping and Reporting of Currency and Foreign Transactions Act of 1970)
CAA: 2021 Consolidated Appropriations Act enacted on December 27, 2020, which included a $900 billion COVID-19 relief package
CARES Act: Coronavirus Aid, Relief and Economic Security Act
CBLR: Community bank leverage ratio, which is the subject of rules adopted by federal banking regulators on October 29,2019 (the “CBLR framework”)
CECL: Current expected credit losses, which are the subject of an accounting standard under GAAP
CET1: Common Equity Tier 1 Capital
CFPB: Consumer Financial Protection Bureau
Citizens First: Citizens First Corporation, which was acquiredCME Term SOFR: A forward-looking term Secured Overnight Financing Rate, as administered by the Company on July 1, 2019CME Group Benchmark Administration Limited
CMO: Collateralized mortgage obligations
COVID-19: Novel coronavirus disease 2019 declared, in March 2020, by the World Health Organization as a global pandemic and by the President of the United States as a national emergency
CRA: Community Reinvestment Act of 1977
CRE: Commercial Real Estate
CUB: Citizens Union Bancorp of Shelbyville, Inc., which was acquired by the company on January 1, 2022
DFI: Indiana Department of Financial Institutions
DIF: Deposit Insurance Fund of the FDIC
Dodd-Frank Act: Dodd-Frank Wall Street Reform and Consumer Protection Act
Economic Growth Act: Economic Growth, Relief and Consumer Protection Act of 2018
ERISA: Employee Retirement Income and Security Act of 1974
FASB: Financial Accounting Standards Board
FDIC: Federal Deposit Insurance Corporation
FDICIA: Federal Deposit Insurance Corporation Improvements Act
federal banking
regulators: The FRB, the OCC, and the FDIC, collectively
FHLB: Federal Home Loan Bank
First Security: First Security, Inc., which was acquired by the Company on October 15, 2018
FRB: Board of Governors of the Federal Reserve System
GAAP: Generally Accepted Accounting Principles in the United States of America
GLB Act: Gramm-Leach-Bliley Financial Modernization Act of 1999
LIBOR: London Interbank Offered Rate
LIBOR Act: Adjustable Interest Rate (LIBOR) Act enacted on March 15, 2022
MBS: Mortgage-backed securities
Notes: The Company’s 4.50% Fixed-to-Floating Rate Subordinated Notes due 2029, issued and sold on June 25, 2019, in an aggregate principal amount of $40.0 million
NPV: Net portfolio value
OCC: Office of the Comptroller of the Currency
OFAC: U.S. Treasury Department Office of Foreign Assets Control
PCAOB: Public Company Accounting Oversight Board (United States)
PCD: Purchased with credit deterioration
PCI:Purchased credit impaired
PPP: Paycheck Protection Program established under the CARES Act
PTO: Paid time off
SBA: Small Business Administration
SEC: Securities and Exchange Commission
SOFR: Secured Overnight Funding Rate recommended by the Alternative Reference Rate Committee as an alternative to LIBOR
TDR:Troubled Debt Restructurings
USA Patriot Act: Uniting and Strengthening America by Providing Appropriate Tools Required to Intercept and Obstruct Terrorism Act of 2001
Information included in or incorporated by reference in this Annual Report on Form 10-K, our other filings with the Securities and Exchange Commission and our press releases or other public statements, contain or may contain “forward-looking statements” within the meaning of the Private Securities Litigation Reform Act of 1995. Please refer to a discussion of our forward- looking statements and associated risks in Item 1, “Business - Forward-Looking Statements and Associated Risks” and our discussion of risk factors in Item 1A, “Risk Factors” in this Annual Report on Form 10-K.
PART I
Item 1. Business.
General
German American Bancorp, Inc. is a Nasdaq-traded (symbol: GABC) financial holding company based in Jasper, Indiana. German American, through its banking subsidiary German American Bank, operates 7775 banking offices in 1920 contiguous southern Indiana counties and 14 counties in Kentucky. The Company also owns an investment brokerage subsidiary (German American Investment Services, Inc.) and a full line property and casualty insurance agency (German American Insurance, Inc.).
The Company was formed in 1982 as a bank holding company under the Bank Holding Company Act of 1956, as amended. Effective September 24, 2019, the Company elected to be a “financial holding company” as permitted under the Gramm-Leach-Bliley Act of 1999, as amended. As a financial holding company, the Company is generally permitted to engage in certain otherwise prohibited nonbanking activities and certain other broader securities, insurance, merchant banking and other activities that the Board of Governors of the Federal Reserve System (the “FRB”) has determined to be “financial in nature,” or are incidental or complementary to activities that are financial in nature, without prior approval from the FRB (subject to certain exceptions). Upon becoming a financial holding company, we began operating GABC Risk Management, Inc., a wholly-owned subsidiary, as a pooled captive insurance company subsidiary to provide additional insurance coverage for the Company and its subsidiaries related to the operations of the Company for which insurance may not be economically feasible.
Throughout this Report, when we use the term “Company”, we will usually be referring to the business and affairs (financial and otherwise) of German American Bancorp, Inc. and its consolidated subsidiaries as a whole. Occasionally, we will refer to the term “parent company” or “holding company” when we mean to refer to only German American Bancorp, Inc. and the term “Bank” when we mean to refer only to the Company’s bank subsidiary.
The Company’s lines of business include retail and commercial banking, comprehensive financial planning, full servicewealth management services, and insurance operations. Our retail and commercial banking business involves attracting deposits from the general public and using those funds to originate consumer, commercial and agricultural, commercial and agricultural real estate, and residential mortgage loans, primarily in the Company’s local markets. These core banking activities also include the sale of residential mortgage loans in the secondary market. Our wealth management services involve providing trust, investment advisory, brokerage and trust administration, andretirement planning services to customers. In our insurance operations, we offer a full range of personal and corporate property and casualty insurance products.products, primarily in the Company’s banking subsidiary’s local markets. Financial and other information by segment is included in Note 16 (Segment Information) of the Notes to the Consolidated Financial Statements included in Item 8 of this Report and is incorporated into this Item 1 by reference. Substantially all of the Company’s revenues are derived from customers located in, and substantially all of its assets are located in, the United States.
Subsidiaries
The Company’s principal operating subsidiaries are described in the following table:
| | | | | | | | |
| Name | Type of Business | Principal Office Location |
| German American Bank | Commercial Bank | Jasper, IN |
| German American Insurance, Inc. | Multi-Line Insurance Agency | Jasper, IN |
| German American Investment Services, Inc. | Retail Brokerage | Jasper, IN |
Business Developments
On January 1, 2022, the Company completed the acquisition of Citizens Union Bancorp of Shelbyville, Inc. (“CUB”) through the merger of CUB with and into the Company. Immediately following completion of the CUB holding company merger, CUB’s subsidiary bank, Citizen Union Bank of Shelbyville, Inc., was merged with and into the Company’s subsidiary bank, German American Bank. CUB, headquartered in Shelbyville, Kentucky, operated 15 retail banking offices located in Shelby, Jefferson, Spencer, Bullitt, Oldham, Owen, Gallatin and Hardin counties in Kentucky through Citizens Union Bank of Shelbyville, Inc. in Kentucky. As of the closing of the transaction, CUB had total assets of approximately $1.109 billion, total loans of approximately $683.8 million, and total deposits of approximately $930.5 million. The Company issued approximately 2.9 million shares of its common stock, and paid approximately $50.8 million in cash, in exchange for all of the issued and outstanding shares of common stock of CUB.
For further information regarding this merger and acquisition transaction, see Note 20 (Subsequent Events) in the Notes to the Consolidated Financial Statements included in Item 8 of this Report, which Note 20 is incorporated into this Item 1 by reference.
During 2021, the Company commenced an operating optimization plan, pursuant to which its banking subsidiary, German American Bank, would consolidate seven branch offices and implement various staff reductions during 2021. In making its decision to consolidate these branches, which were generally integrated with other nearby bank branches, the Company considered, among other factors, the operating costs of the branches, certain physical limitations impacting the bank facilities, and their proximity to other branch locations. In addition, the Company’s evaluation of the branch consolidations and the reductions in staff also took into consideration the numbers and types of transactions being conducted by its customers and the increased usage of online and mobile banking. Also as part of the operating optimization plan, in September 2021, German American Bank sold its two branches located in Lexington, Kentucky to The Home Savings and Loan Company of Kenton, Ohio (“HSLC”). HSLC assumed approximately $17.6 million in total deposits and purchased approximately $17.8 million in total loans as part of the sale.
On July 1, 2019, the Company completed the acquisition of Citizens First Corporation (“Citizens First”) through the merger of Citizens First with and into the Company. Immediately following completion of the Citizens First holding company merger, Citizens First's subsidiary bank, Citizen First Bank, Inc., was merged with and into the Company’s subsidiary bank, German American Bank. Citizens First, headquartered in Bowling Green, Kentucky operated eight retail banking offices through Citizens First Bank, Inc. in Barren, Hart, Simpson and Warren Counties in Kentucky. As of the closing of the transaction, Citizens First had total assets of approximately $456.0 million, total loans of approximately $364.6 million, and total deposits of approximately $370.8 million. The Company issued approximately 1.7 million shares of its common stock, and paid approximately $15.5 million in cash, in exchange for all of the issued and outstanding shares of common stock of Citizens First.
For further information regarding this merger and acquisition transaction, see Note 18 (Business Combinations)Combinations, Goodwill and Intangible Assets) in the Notes to the Consolidated Financial Statements included in Item 8 of this Report, which Note 18 is incorporated into this Item 1 by reference.
The Company expects to continue to evaluate opportunities to expand its business through opening of new banking, insurance or trust, brokerage and financial planning offices, and through acquisitions of other banks, bank branches, portfolios of loans or other assets, and other financial-service-related businesses and assets in the future.
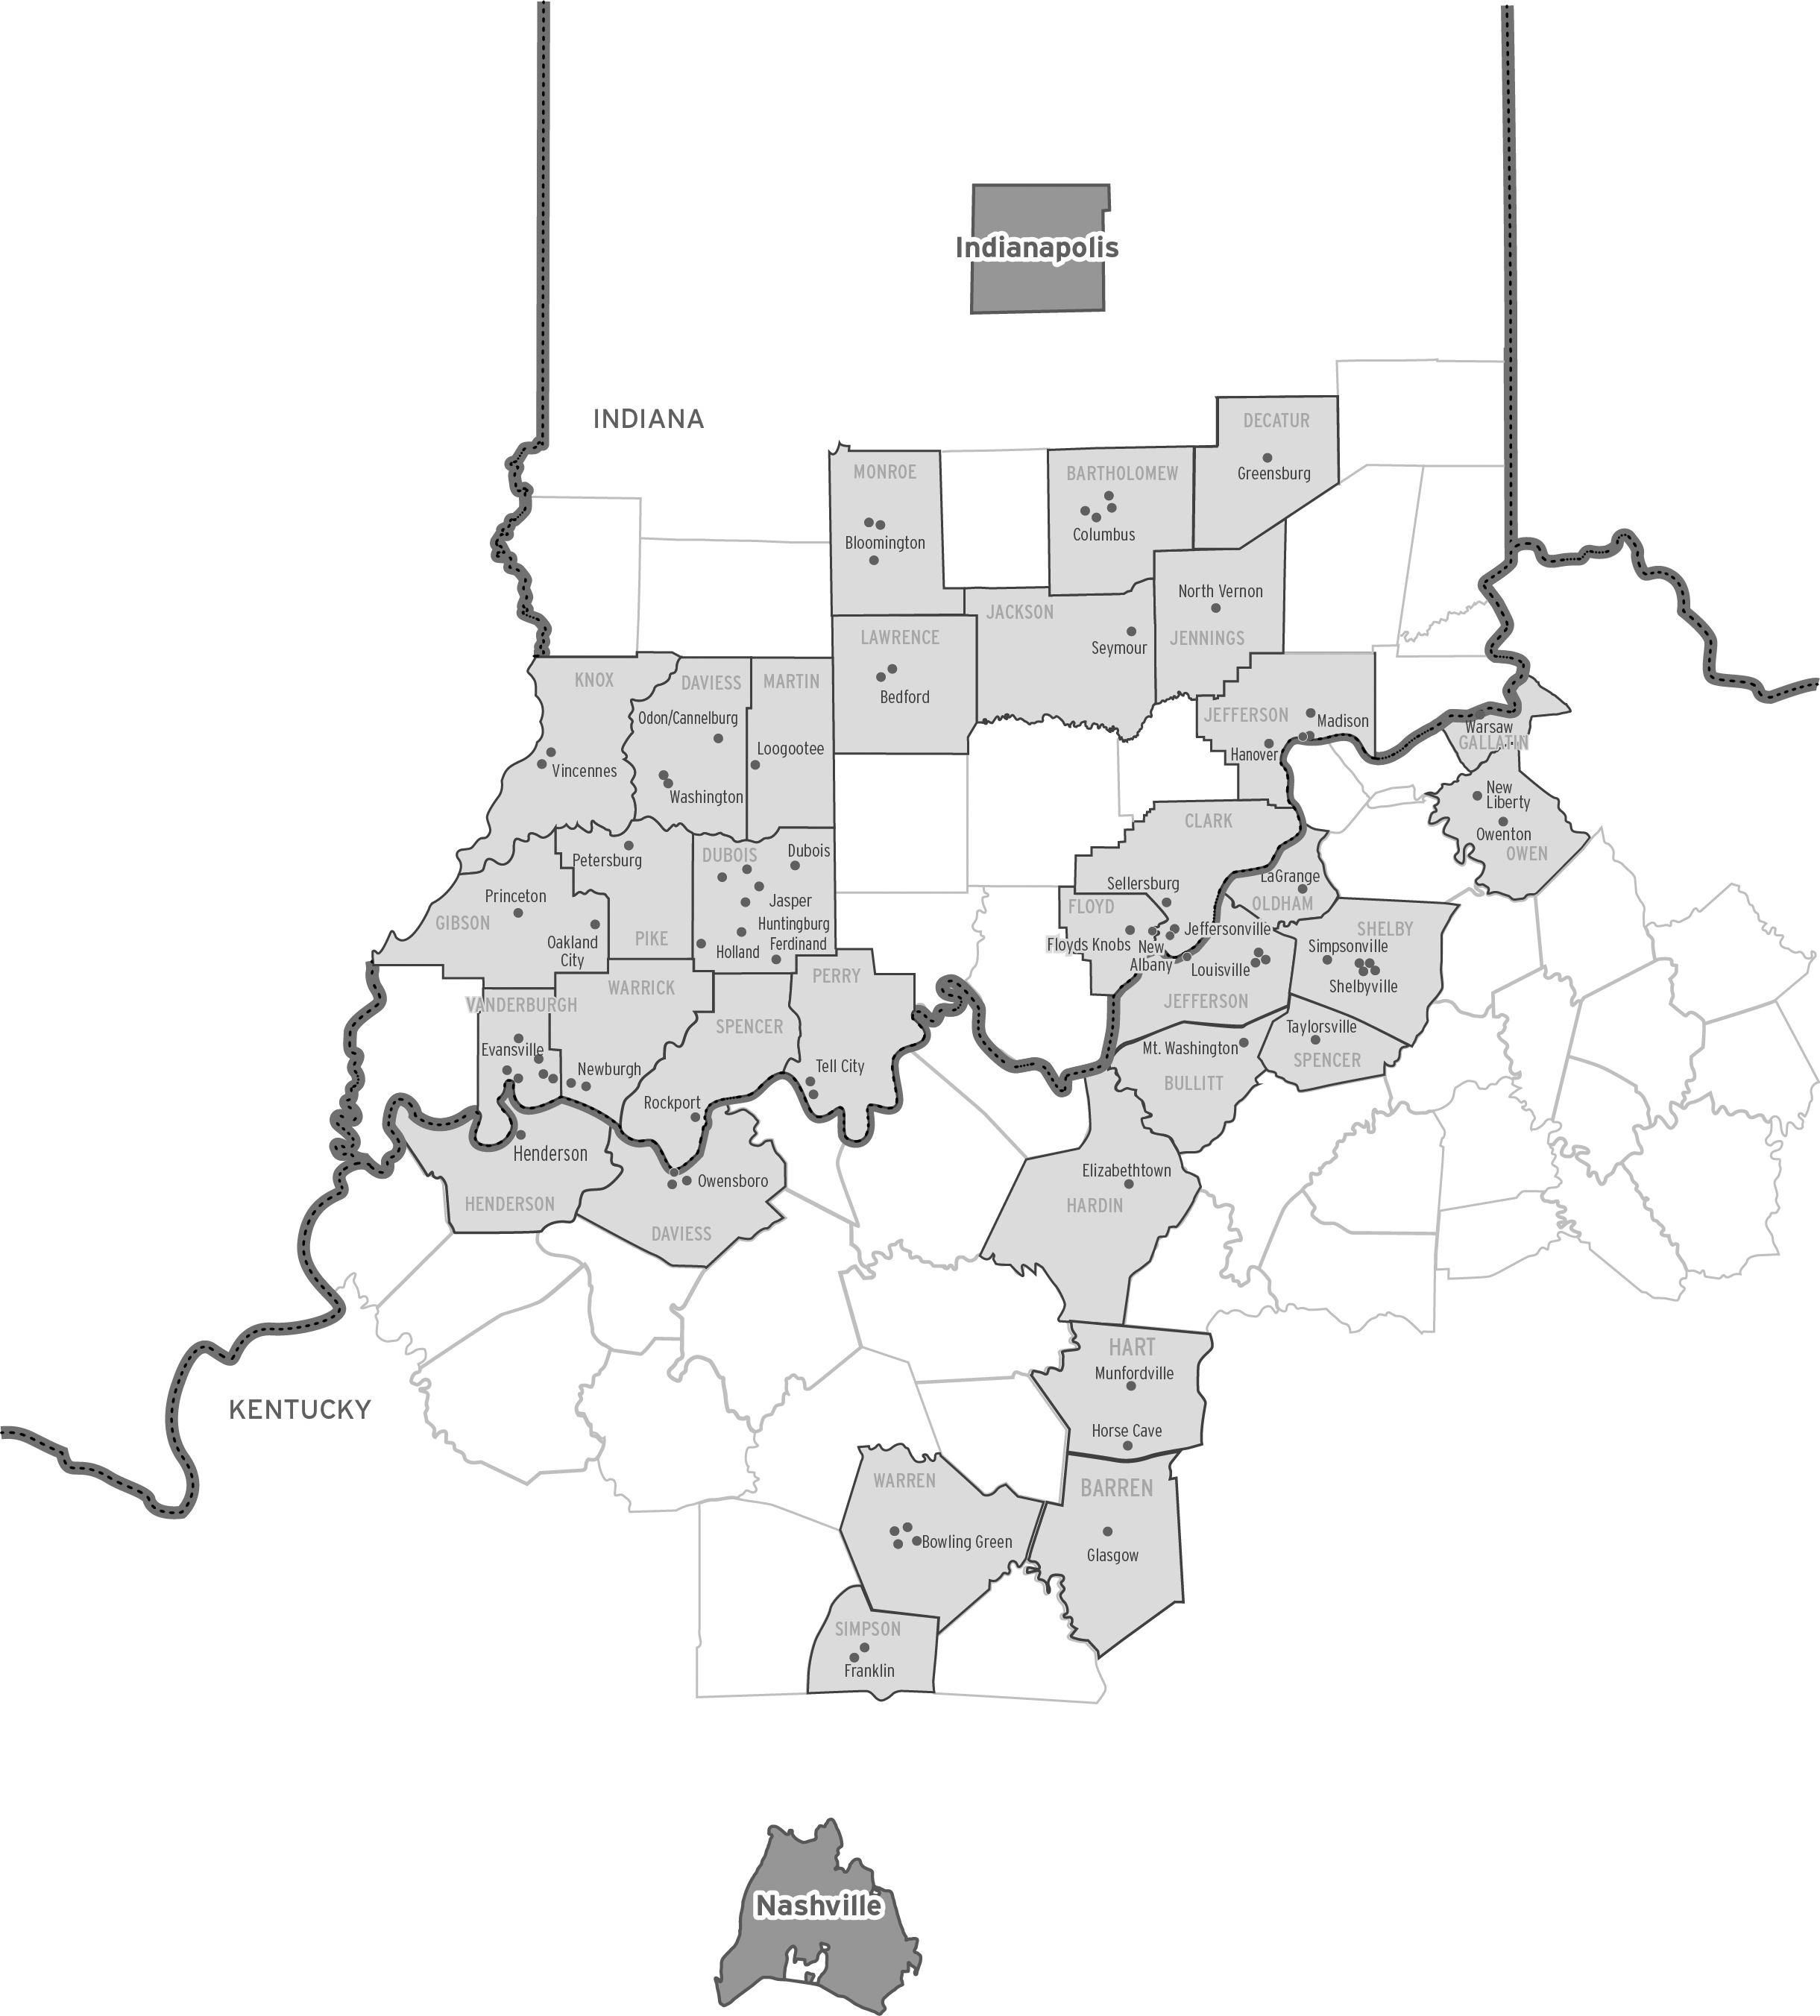
Office Locations
The map below illustrates the locations of the Company’s 7876 retail and commercial banking, insurance and investment offices.
Competition
The industries in which the Company operates are highly competitive. The Bank competes for commercial and retail banking business within its core banking segment not only with financial institutions that have offices in the same counties but also with financial institutions that compete from other locations in Southern Indiana, Kentucky and elsewhere. Further, the Bank competes for loans and deposits not only with commercial banks but also with savings and loan associations, savings banks, credit unions, production credit associations, federal land banks, finance companies, credit card companies, personal loan companies, investment brokerage firms, insurance agencies, insurance companies, lease finance companies, money market funds, mortgage companies, and other non-depository financial intermediaries. There are numerous alternative providers (including national providers that advertise extensively and provide their services via e-mail, direct mail, telephone and the Internet) for the insurance products and services offered by German American Insurance, Inc., trust and financial planning services offered by the Bank and the brokerage products and financial planning services offered by German American Investment Services, Inc. In addition, financial technology, or “FinTech,” companies continue to emerge intheir rapid growth into key areas of banking. Many of these competitors have substantially greater resources than the Company.
Human Capital
At February 23, 2022,20, 2024, the Company and its subsidiaries employed approximately 894840 full-time equivalent employees. There are no collective bargaining agreements, and we consider employee relations to be good.
People come first at German American. It is through our employees, and their ties to the local community, that we are able to proudly support the communities we serve. We are deeply rooted in these communities. Engrained in our culture is a commitment to give back to the individuals, families, and businesses in our communities. We have a long history of community involvement, from both a contributory standpoint and a dedication to hands-on volunteer efforts. We believe that service to our communities, customers and each other is fun, rewarding and powerful.
German American strives to attract, develop, and retain talented individuals in every community we serve. We understand that, in order to deliver the best financial products and services to our clients, we need to invest in our team’s personal and professional success, which includes helping to create a work/life balance and providing further growth opportunities. As a result, our employees have demonstrated a desire and determination to succeed. Our culture encourages them to take initiative, accept challenges, and be collaborative to achieve goals. Their vast knowledge baseperformance and expertise enables them to work efficiently while providing customer serviceoperating excellence to support strong performance.for our customers, shareholders, and communities. German American’s reputation relies on integrity. Our team trusts each other in words and actions, which enables our customers to trust our brand. We value honesty, open communication,transparency, and diverse perspectives andwith high ethical principles.standards in all we do.
We have long been committed to comprehensive and competitive compensation and benefits programs as we recognize that we operate in an intensely competitive environment for employees. Retention of skilled and highly trained employees is critical to our strategy of being a trusted resource to our communities and customers. To help ensure we remain competitive in our compensation programs, we participate annually in market and banking compensation studies and model compensation with an external vendor for comparison. Furthering our philosophy to attract and retain talented and motivated employees who will continue to advance our purpose and contribute to our overall success, our compensation and benefits programs include: referral incentive programs, quarterly performance incentives, medical (including a digital clinic for joint and muscle care, telemedicine and behavioral health care services), dental and vision plans; a 401(k) deferred compensation plan, with matching contribution, which covers substantially all employees; flexible spending and health savings accounts,accounts; competitive paid time off (PTO)“PTO” programs, including the opportunity to purchase additional PTO; and life insurance and a robust employee assistance program that covers an array of work-life benefits that supports employee well-being.well-being through personal and work-life issues. In addition, we offer supplemental benefits such as accident, critical illness and hospital indemnity policies, quarterly performance incentives, discounted bank services and an Employee Stock Purchase Plan.
We also invest in our employees’ future by sponsoring and prioritizing continued education throughout the Company’s employee ranks.ranks, including support of many bank-related certification programs and any required continuing education to support those certifications. Full-time and part-time employees are eligible for our education assistance program which covers tuition and textbooks for work-related courses taken through a community college or university. Employees are also able to participate in on-the-job learning, classroom learning, mentoring and other internal and external career development programs.programs
in order to advance or diversify their career paths throughout the organization. These programs focus on enhancing current skills, as well as developingengaging and empowering our next generationteam members in their own career development and building our pipeline of leaders, bankers, commercial lenders and other financial professional roles.
We are committed to employee care and helping our employees improve their quality of life and place. As a result, we remain focused on continuous improvement throughout all departments in order to create positive outcomes and experiences for all. To support our focus on employee care, we have a paid family bonding leave program, a PTO donation program, flexible work guidelines, and career opportunities promoted throughout our footprint.
In order to develop and engage a workforce that aligns with our corporate values,purpose, we regularly sponsor local community events. We believe that the well-being of our employees and their personal and professional development is furthered by our outreach to the communities we serve. Our employees’ desire for active community involvement enables us to sponsor many local community events and initiatives, including leading financial literacy classes in community schools and volunteering to enhance the arts, education, economic development, and overall community enrichment in our footprint.
The health and well-being of our employees and customers will always be our top priority.This, of course, came to the forefront as COVID-19 began to spread exponentially in early 2020 and continued throughout 2021. In response, we have continued to adapt and adjust our Pandemic Response Plans within the Company to protect the health of our employees, customers and communities. Those plans included business continuity remote work options, support of vaccination through different vaccination incentive programs, paid leave, and more.
Regulation and Supervision
Overview
The Company is subject to regulation and supervision by the Board of Governors of the Federal Reserve System (“FRB”) under the Bank Holding Company Act of 1956, as amended (“BHC Act”), and is required to file with the FRB annual reports and such additional information as the FRB may require. The FRB may also make examinations or inspections of the Company. The Bank is under the supervision of and subject to examination by the Indiana Department of Financial Institutions (“DFI”), and the Federal Deposit Insurance Corporation (“FDIC”). Regulation and examination by banking regulatory agencies are primarily for the benefit of depositors rather than shareholders.
Under FRB policy and the Dodd-Frank Wall Street Reform and Consumer Protection Act, a complex and wide-ranging statute (the “Dodd-Frank Act”), the Company is required to act as a source of financial and managerial strength to the Bank, and to commit resources to support the Bank, even in circumstances where the Company might not do so absent such a requirement. Under current federal law, the FRB may require a bank holding company to make capital injections into a troubled subsidiary bank. It may charge the bank holding company with engaging in unsafe and unsound practices if the bank holding company fails to commit resources to such a subsidiary bank or if it undertakes actions that the FRB believes might jeopardize the bank holding company’s ability to commit resources to such subsidiary bank.
With certain exceptions, the BHC Act prohibits a bank holding company from engaging in (or acquiring direct or indirect control of more than 5 percent of the voting shares of any company engaged in) nonbanking activities. One of the principal exceptions to this prohibition is for activities deemed by the FRB to be “closely related to banking.” Under current regulations, bank holding companies and their subsidiaries are permitted to engage in such banking-related business ventures as consumer finance; equipment leasing; credit life insurance; computer service bureau and software operations; mortgage banking; and securities brokerage.
In September 2019, we elected to becomeWe are also a “financial holding company.” As a financial holding company, we are permittedcompany” under the BHC Act, which permits us to engage in a broader range of activities that are “financial in nature” and in activities that are determined to be incidental or complementary to activities that are financial in nature. These activities include underwriting and dealing in and making a market in securities (subject to certain limits and compliance procedures required by the so-called Volcker Rule provisions added by the Dodd-Frank Act, described below under “Other Aspects of the Dodd-Frank Act”), insurance underwriting, and merchant banking. Banks may also engage through financial subsidiaries in certain of the activities permitted for financial holding companies, subject to certain conditions. Upon becomingIn order to continue as a financial holding company, we began operatingmust continue to be well-capitalized, well-managed and maintain compliance with the Community Reinvestment Act.
As a financial holding company, we operated GABC Risk Management, Inc., a wholly-owned subsidiary (the “Captive”), as a pooled captive insurance company subsidiary to provide additional insurance coverage for the Company and its subsidiaries related to the operations of the Company for which insurance may not be economically feasible. In orderOn April 10, 2023, the Internal Revenue Service issued a proposed regulation impacting taxes on insurance companies under Section 831(b) of the Internal Revenue Code, both prospectively and retroactively, for a period of three years. As a result of the proposed regulation, the Company elected to continuedecommission the Captive as an insurance company in December 2023 and subsequently dissolved the Captive as a financial holding company, we must continue to be well-capitalized, well-managed and maintain compliance withcorporation in the Community Reinvestment Act.State of Nevada.
The Bank and the subsidiaries of the Bank may generally engage in activities that are permissible activities for state chartered banks under Indiana banking law, without regard to the limitations that might apply to such activities under the BHC Act if the Company were to engage directly in such activities at the parent company level or through parent company subsidiaries that were not also bank subsidiaries.
Indiana law and the BHC Act restrict certain types of expansion by the Company and its bank subsidiary. The Company and its subsidiaries may be required to apply for prior approval from (or give prior notice and an opportunity for review to) the FRB, the DFI, the FDIC, and/or other bank regulatory or other regulatory agencies, as a condition to the acquisition or establishment of new offices, or the acquisition (by merger or consolidation, purchase or otherwise) of the stock, business or properties of other banks or other companies.
The earnings of commercial banks and their holding companies are affected not only by general economic conditions but also by the policies of various governmental regulatory authorities. In particular, the FRB regulates money and credit conditions and interest rates in order to influence general economic conditions, primarily through open-market operations in U.S. Government securities, varying the discount rate on bank borrowings, and setting reserve requirements against bank deposits. These policies have a significant influence on overall growth and distribution of bank loans, investments and deposits, and affect interest rates charged on loans and earned on investments or paid for time and savings deposits. FRB monetary policies have had a significant effect on the operating results of commercial banks in the past and this is expected to continue in the future. The general effect, if any, of such policies upon the future business and earnings of the Company cannot accurately be predicted.
Capital Requirements
We are subject to various regulatory capital requirements both at the parent company and at the Bank level administered by the FRB and by the FDIC and DFI, respectively. Failure to meet minimum capital requirements could result in certain mandatory and possible additional discretionary actions by regulators that, if undertaken, could have an adverse material effect on our financial statements. Under capital adequacy guidelines and the regulatory framework for “Prompt Corrective Action” (described below), we must meet specific capital guidelines that involve quantitative measures of our assets, liabilities, and certain off-balance sheet items as calculated under regulatory accounting policies. Our capital amounts and classification are also subject to judgments by the regulators regarding qualitative components, risk weightings, and other factors. We have consistently maintained regulatory capital ratios at or above the well-capitalized standards.
Generally, for purposes of satisfying these capital requirements, we must maintain capital sufficient to meet both risk-based asset ratio tests and a leverage ratio test on a consolidated basis. The risk-based ratios are determined by allocating assets and specified off-balance sheet commitments into various weighted categories, with higher weighting assigned to categories perceived as representing greater risk. A risk-based ratio represents the applicable measure of capital divided by total risk-weighted assets. The leverage ratio is a measure of our core capital divided by our total assets adjusted as specified in the guidelines.
The current risk-based capital rules, as adopted by federal banking regulators, are based upon guidelines developed by the Basel Committee on Banking Supervision and reflect various requirements of the Dodd-Frank Act (the “Basel III Rules”). The Basel III Rules require banking organizations to, among other things, maintain:
•a minimum ratio of “Common Equity Tier 1 Capital” to risk-weighted assets of 4.5%, plus a 2.5% “conservation buffer” (bringing the Common Equity Tier 1 Capital to risk-weighted assets ratio to a total of at least 7.0%);
•a minimum ratio of Tier 1 Capital to risk-weighted assets of 6% plus the conservation buffer (which results in a minimum required total Tier 1 Capital to risk-weighted assets ratio of 8.5%);
•a minimum ratio of Total Capital (that is, Tier 1 Capital plus instruments includable in a tier called Tier 2 Capital) to risk-weighted assets of at least 8.0% plus the conservation buffer (which results in a minimum Total Capital to risk-weighted assets ratio of 10.5%); and
•a minimum leverage ratio of 4% (calculated as the ratio of Tier 1 Capital to adjusted average consolidated assets).
“Common Equity Tier 1” (“CET1”) Capital consists of common stock instruments that meet the eligibility criteria in the new rules, retained earnings, accumulated other comprehensive income (“AOCI”) and common equity Tier 1 minority interest.
Tier 1 Capital under the new rules consists of CET1 (subject to certain adjustments) and “additional Tier 1 capital” instruments meeting specified requirements, plus, in the case of smaller holding companies like ours, trust preferred securities in accordance with prior requirements for their inclusion in Tier I Capital.
Under the Basel III Rules, we and our bank subsidiary elected to opt-out of the requirement to include AOCI in our CET1. As a result, most AOCI items will be treated, for regulatory capital purposes, in the same manner in which they were prior to Basel III.
Although banking institutions with a ratio of CET1 to risk-weighted assets above the minimum but below the conservation buffer will technically comply with minimum capital requirements under the new rules, such institutions will face limitations on
the payment of dividends, common stock repurchases and discretionary cash payments to executive officers based on the amount of the shortfall.
In December 2018, federal banking agencies issued a joint final rule to revise their regulatory capital rules to, among other things: (i) address implementation of the “current expected credit losses” (“CECL”) accounting standard under GAAP; and (ii) provide an optional three-year phase-in period for the day-one adverse regulatory capital effects of adopting CECL. As discussed in Note 1 (Summary of Significant Accounting Policies) of the Notes to the Consolidated Financial Statements included in Item 8 of this Report, the FASB issued the CECL accounting standard in 2016 to address concerns relating to the ability to record credit losses that are expected, but do not yet meet the “probable” threshold by replacing the current “incurred loss” model for recognizing credit losses with an “expected life of loan loss” model referred to as the CECL model. The Company adopted the CECL“current expected credit losses” (“CECL”) accounting standard onunder GAAP effective January 1, 2020.
The regulatory capital rules applicable to the Company provided an optional three-year phase-in period for the day-one adverse regulatory capital effects of adopting CECL. In an action related to addition, as a result of the Coronavirus Aid, Relief and Economic Security Act (the “CARES Act”), in September 2020, federal banking regulators adopted a final rule that allowed banking organizations were further permitted to mitigate the estimated cumulative regulatory capital effects of CECL for up to an additional two years. This two-year delay is in addition to the three-year phase-in period discussed above. By adopting this option, the Company was able to largely delay the effects of CECL on its regulatory capital through
December 31, 2021. Beginning on January 1, 2022, the Company began the required three-year phase-in by reflecting 25% of the previously deferred estimated capital impact of CECL in its regulatory capital. An additional 25% is towas phased in on each of January 1, 2023 and January 1, 2024, and another 25% will be phased in aton January 1, 2025 (at which time the beginningadverse cumulative effects of each subsequent year untiladopting CECL will have been fully phased in by January 1, 2025.into our regulatory capital). Under this 2020 rule,these rules, the amount of adjustments to regulatory capital that could be deferred until the phase-in period included both the initial impact of our adoption of CECL at January 1, 2020 and 25% of subsequent changes in our allowance for credit losses during each quarter of the two-year period ended December 31, 2021. For information about the one-time cumulative adjustment to our allowance for credit losses and changes in the allowance during 2020, please see Note 1 (Summary of Significant Accounting Policies) of the Notes to the Consolidated Financial Statements included in Item 8 of this Report.
In April 2020, federal banking regulators modified the Basel III regulatory capital rules applicable to banking organizations to allow those organizations participating in the Paycheck Protection Program (“PPP”) established under the CARES Act to neutralize the regulatory capital effects of participating in the program by allowing PPP loans to receive a zero percent risk weight for purposes of determining risk-weighted assets and the CET1, Tier 1 and Total Risk-Based capital ratios. At December 31, 2021, risk-weighted assets included $19.5 million of PPP loans (net of deferred fees) at a zero risk weight. See “- COVID-19 and Related Legislative and Regulatory Actions” below for additional information on the PPP.
Prompt Corrective Action Classifications
The Federal Deposit Insurance Corporation Improvements Act (enacted in 1991) (FDICIA) requires federal banking regulatory authorities to take regulatory enforcement actions known as Prompt Corrective Action with respect to depository institutions that do not meet minimum capital requirements. For these purposes, FDICIA establishes five capital tiers: well-capitalized, adequately-capitalized, under-capitalized, significantly under-capitalized, and critically under-capitalized.
Under FDICIA, a depository institution that is not well-capitalized is generally prohibited from accepting brokered deposits and offering interest rates on deposits higher than the prevailing rate in its market. Since the Bank was well-capitalized throughout 2021,2023, the FDICIA brokered deposit rule did not adversely affect its ability to accept brokered deposits. The Bank had no brokered deposits at December 31, 2021.2023. Further, a depository institution or its holding company that is not well-capitalized will generally not be successful in seeking regulatory approvals that may be necessary in connection with any plan or agreement to expand its business, such as through the acquisition (by merger or consolidation, purchase or otherwise) of the stock, business or properties of other banks or other companies.
Under the Prompt Corrective Action regulations, the applicable agency can treat an institution as if it were in the next lower category if the agency determines (after notice and an opportunity for hearing) that the institution is in an unsafe or unsound condition or is engaging in an unsafe or unsound practice. The degree of regulatory scrutiny of a financial institution will increase, and the permissible activities of the institution will decrease, as it moves downward through the capital categories. Institutions that fall into one of the three “undercapitalized” categories (as such term is used in the FDICIA) may be required to (i) submit a capital restoration plan; (ii) raise additional capital; (iii) restrict their growth, deposit interest rates, and other activities; (iv) improve their management; (v) eliminate management fees and dividends; or (vi) divest themselves of all or a part of their operations. Bank holding companies can be called upon to boost the capital of the financial institutions that they control, and to partially guarantee the institutions’ performance under their capital restoration plans. Critically under-capitalized institutions are subject to appointment of a receiver or conservator within 90 days of becoming so classified.
The minimum ratios defined by the Prompt Corrective Action regulations from time to time are merely guidelines and the bank regulators possess the discretionary authority to require higher capital ratios. Further, the risk-based capital standards of the FRB and the FDIC specify that evaluations by the banking agencies of a bank’s capital adequacy will include an assessment of the exposure to declines in the economic value of a bank’s capital due to changes in interest rates. These banking agencies issued a joint policy statement on interest rate risk describing prudent methods for monitoring such risk that rely principally on internal measures of exposure and active oversight of risk management activities by senior management.
To qualify as a “well-capitalized” institution, a depository institution under the Prompt Corrective Action requirements must have a leverage ratio of no less than 5%, a Tier I Capital ratio of no less than 8%, a CET1 ratio of no less than 6.5%, and a total risk-based capital ratio of no less than 10%, and the bank must not have been under any order or directive from the appropriate regulatory agency to meet and maintain a specific capital level. As of December 31, 2021,2023, the Bank exceeded the requirements contained in the applicable regulations, policies and directives pertaining to capital adequacy to be classified as “well-capitalized”, and is unaware of any material violation or alleged violation of these regulations, policies or directives.directives. For a tabular presentation of our regulatory capital ratios and those of the Bank as of December 31, 2021,2023, see Note 8 (Shareholders’ Equity) of the Notes to the Consolidated Financial Statements included in Item 8 of this Report, which Note 8 is incorporated herein by reference.
In October 2019, the FRB, the FDIC and the Office of the Comptroller of the Currency (the “OCC”) adopted a final rule to simplify the regulatory capital requirements for eligible community banks and holding companies that opt-in to the community bank leverage ratio framework (“CBLR framework”), as required by Section 201 of the Economic Growth, Relief and Consumer Protection Act of 2018 (the “Economic Growth Act”). Under simplified the final rule, which became effective as of January 1, 2020,regulatory capital requirements for eligible community banks and holding companies (which would include the Bank and the Company) that satisfy certain qualifying criteria, including having less than $10 billion in average total consolidated assets and a leverage ratio (referred to as the “community bank leverage ratio”) of greater than 9%, would be eligibleby permitting those entities to opt-in to the CBLR framework.community bank leverage ratio framework (the “CBLR framework”). The community bank leverage ratio is the ratio of a banking organization’s Tier 1 Capital to its average total consolidated assets, both as reported on the banking organization’s applicable regulatory filings. If this election is made, the Company and the Bank would satisfy their regulatory capital standards by calculating and reporting the community bank leverage ratio instead of the risk-weighted capital ratios and minimum leverage ratio currently required and would be deemed “well-capitalized” under the FRB’s and FDIC’s Prompt Corrective Action rules so long as they continue to satisfy the qualifying criteria of the CBLR framework. Despite this option, the Company intends to continue with its use of the existing layered ratio structure. Under either framework, the Company and the Bank would be considered well-capitalized under the applicable guidelines.
Future rulemaking and regulatory changes on capital requirements may impact the Company as it continues to grow and evaluate potential mergers and acquisitions.
Restrictions on Bank Dividends or Loans to, or other Transactions with, the Parent Company, and on Parent Company Dividends
German American Bancorp, Inc., which is the publicly-held parent of the Bank (German American Bank), is a corporation that is separate and distinct from the Bank and its other subsidiaries. Most of the parent company’s revenues historically have been comprised of dividends, fees, and interest paid to it by the Bank, and this is expected to continue in the future. There are, however, statutory limits under Indiana law on the amount of dividends that the Bank can pay to its parent company without regulatory approval. The Bank may not, without the approval of the DFI, pay a dividend in an amount greater than its undivided profits. In addition, the prior approval of the DFI is required for the payment of a dividend by an Indiana state-chartered bank if the total of all dividends declared in a calendar year would exceed the total of its net income for the year combined with its retained net income for the two preceding years, unless such a payment qualifies under certain exemptive criteria that exempt certain dividend payments by certain qualified banks from the prior approval requirement. At December 31, 2021,2023, the Bank was eligible for payment of dividends under the exemptive criteria established by DFI policy for this purpose, and could have declared and paid to the holding company $75approximately $175 million of its undividedundivided profits without approval by the DFI in accordance with such criteria. See Note 8 (Shareholders’ Equity) of the Notes to Consolidated Financial Statements included in Item 8 of this Report for further discussion.
Insured depository institutions such as the Bank are also prohibited under the FDICIA from making capital distributions, including the payment of dividends, if, after making such distribution, the institution would become undercapitalized.
In addition, the FRB and other bank regulatory agencies have issued policy statements or advisories that provide that insured banks and bank holding companies should generally only pay dividends out of current operating earnings.
In addition to these statutory restrictions, if, in the opinion of the applicable regulatory authority, a bank under its jurisdiction is engaged in, or is about to engage in, an unsafe or unsound practice, such authority may require, after notice and hearing, that such bank cease and desist from such practice. Accordingly, if the Bank were to experience financial difficulties, it is possible that the applicable regulatory authority could determine that the Bank would be engaged in an unsafe or unsound practice if the Bank were to pay dividends and could prohibit the Bank from doing so, even if availability existed for dividends under the statutory formula.
Further, the Bank is subject to affiliate transaction restrictions under federal laws, which limit certain transactions generally involving the transfer of funds by a subsidiary bank or its subsidiaries to its parent corporation or any nonbank subsidiary of its parent corporation, whether in the form of loans, extensions of credit, investments, or asset purchases, or otherwise undertaking certain obligations on behalf of such affiliates. Furthermore, covered transactions that are loans and extensions of credit must be secured within specified amounts. In addition, all covered transactions and other affiliate transactions must be conducted on terms and under circumstances that are substantially the same as such transactions with unaffiliated entities.
Other Aspects of the Dodd-Frank Act
The Dodd-Frank Act (in addition to the regulatory changes discussed elsewhere in this “Regulation and Supervision” discussion and below under “Federal Deposit Insurance Premiums and Assessments”) made a variety of changes that affect the business and affairs of the Company and the Bank in other ways. For instance, the Dodd-Frank Act (or agency regulations adopted and
implemented (or to be adopted and implemented) under the Dodd-Frank Act) altered the authority and duties of the federal banking and securities regulatory agencies, implemented certain corporate governance requirements for all public companies
including financial institutions with regard to executive compensation, proxy access by shareholders, and certain whistleblower provisions; restricted certain proprietary trading and hedge fund and private equity activities of banks and their affiliates; eliminated the former statutory prohibition against the payment of interest on business checking accounts; limited interchange fees on debit card transactions by certain large processors; and established the Consumer Financial Protection Bureau (“CFPB”).
The CFPB was granted broad rulemaking, supervisory and enforcement powers under various federal consumer financial protection laws, including the Equal Credit Opportunity Act, Truth in Lending Act, Real Estate Settlement Procedures Act, Fair Credit Reporting Act, Fair Debt Collection Act, the Consumer Financial Privacy provisions of the Gramm-Leach-Bliley Act and certain other statutes. The CFPB has examination and primary enforcement authority with respect to depository institutions with $10 billion or more in assets. Smaller institutions are subject to rules promulgated by the CFPB but continue to be examined and supervised by federal banking regulators for consumer compliance purposes.
The CFPB has authority to prevent unfair, deceptive or abusive practices in connection with the offering of consumer financial products. The Dodd-Frank Act authorized the CFPB to establish certain minimum standards for the origination of residential mortgages including a determination of the borrower’s ability to repay. In addition, Dodd-Frank allows borrowers to raise certain defenses to foreclosure if they receive any loan other than a “qualified mortgage” as defined by the CFPB. Under the CFPB’s rule, a “qualified mortgage” loan must not contain certain specified features, and the borrower’s total monthly debt-to-income ratio may not exceed a specified percentage. Lenders must also verify and document the income and financial resources relied upon to qualify the borrower for the loan and underwrite the loan based on a fully amortizing payment schedule and maximum interest rate during the first five years, taking into account all applicable taxes, insurance and assessments.
The Dodd-Frank Act permits states to adopt consumer protection laws and standards that are more stringent than those adopted at the federal level and, in certain circumstances, permits state attorneys general to enforce compliance with both the state and federal laws and regulations.
The so-called Volcker Rule, which was adopted under the Dodd-Frank Act, prohibits banking entities from, among other things, (1) engaging in short-term proprietary trading for their own accounts, and (2) having certain ownership interests in and relationships with hedge funds or private equity funds (“covered funds”). Community banks like the Bank have been afforded some relief under these final rules from onerous compliance obligations created by the rules; if banks are engaged only in exempted proprietary trading, such as trading in U.S. government, agency, state and municipal obligations, they are exempt entirely from compliance program requirements. Moreover, even if a community bank engages in proprietary trading or covered fund activities under the rule, they need only incorporate references to the Volcker Rule into their existing policies and procedures. The Economic Growth Act also served to raise the threshold of banks subject to the Volcker Rule to only those with more than $10 billion in assets. Although we do not yet meet that threshold, even if we were subject to it, we do not expect that the Volcker Rule would have any material financial implications on us or our investments or activities.
In October 2023, the CFPB proposed a new rule that would require a provider of payment accounts or products, such as a bank, to make data available to consumers upon request regarding the products or services they obtain from the provider. Any such data provider would also have to make the data available to third parties, with the consumer’s express authorization, and through an interface that satisfies formatting, performance and security standards, for the purpose of the third parties providing the consumer with financial products or services requested by the consumer. Data that would be required to be made available under the rule would include transaction information, account balance, account and routing numbers, terms and conditions, upcoming bill information, and certain account verification data. The proposed rule is intended to give consumers control over their financial data, including with whom it is shared, and encourage competition in the provision of consumer financial products or services. For banks that hold at least $850 million but less than $50 billion in total assets (which includes the Bank), compliance would be required approximately two and a half years after adoption of the final rule.
Certain Other Laws and Regulations
The Community Reinvestment Act of 1977 (the “CRA”) requires depository institutions to assist in meeting the credit needs of their market areas consistent with safe and sound banking practice. Under the CRA, each depository institution is required to help meet the credit needs of its market areas by, among other things, providing credit to low- and moderate-income individuals and communities. These factors are also considered in evaluating mergers, acquisitions and applications to open a branch or facility. The applicable federal regulators regularly conduct CRA examinations to assess the performance of financial institutions and assign one of four ratings to the institution’s records of meeting the credit needs of its community. During its last examination, a rating of “satisfactory” was received by the Bank.
In October 2023, the federal banking regulators issued a joint final rule to modernize the CRA regulatory framework. The final rule is intended, among other things, to adapt to changes in the banking industry, including the expanded role of mobile and
online banking, and to tailor performance standards to account for differences in bank size and business models. The final rule introduces new tests under which the performance of banks with over $2 billion in assets will be assessed. The new rule also includes data collection and reporting requirements, some of which are applicable to banks with less than $10 billion in assets, such as the Bank. Most provisions of the final rule will become effective on January 1, 2026, and the data reporting requirements will become effective on January 1, 2027.
In accordance with the Gramm-Leach-Bliley Financial Modernization Act of 1999 (the “GLB Act”), federal banking regulators adopted rules that limit the ability of banks and other financial institutions to disclose non-public information about consumers to nonaffiliated third parties. These limitations require disclosure of privacy policies to consumers and, in some circumstances, allow consumers to prevent disclosure of certain personal information to a nonaffiliated third party. The privacy provisions of the GLB Act affect how consumer information is transmitted through diversified financial companies and conveyed to outside vendors.
A major focus of governmental policy on financial institutions is combating money laundering and terrorist financing. The Bank Secrecy Act (the “BSA”) requires financial institutions to develop policies, procedures, and practices to prevent and deter money laundering, and mandates that every bank have a written, board-approved program that is reasonably designed to assure and monitor compliance with the BSA. In addition, banks are required to adopt a customer identification program as part of its
BSA compliance program, and are required to file Suspicious Activity Reports when they detect certain known or suspected violations of federal law or suspicious transactions related to a money laundering activity or a violation of the BSA. The Bank is also required to (1) identify and verify, subject to certain exceptions, the identity of the beneficial owners of all legal entity customers at the time a new account is opened, and (2) include, in its anti-money laundering program, risk-based procedures for conducting ongoing customer due diligence, which must include procedures that: (a) assist in understanding the nature and purpose of customer relationships for the purpose of developing a customer risk profile, and (b) require ongoing monitoring to identify and report suspicious transactions and, on a risk basis, to maintain and update customer information.
The USA PATRIOT Act of 2001, or the USA Patriot Act, substantially broadened the scope of United States anti-money laundering laws and regulations by imposing significant new compliance and due diligence obligations, creating new crimes and penalties and expanding the extra-territorial jurisdiction of the United States. The U.S. Treasury Department has issued a number of regulations that apply various requirements of the USA Patriot Act to financial institutions such as the Bank. These regulations impose obligations on financial institutions to maintain appropriate policies, procedures and controls to detect, prevent and report money laundering and terrorist financing and to verify the identity of their customers. Failure of a financial institution to maintain and implement adequate programs to combat money laundering and terrorist financing, or to comply with all of the relevant laws or regulations, could have serious legal and reputational consequences for the institution.
The United States has imposed economic sanctions that affect transactions with designated foreign countries, nationals and others. These are typically known as the “OFAC” rules based on their administration by the U.S. Treasury Department Office of Foreign Assets Control (“OFAC”). The OFAC-administered sanctions targeting countries take many different forms. Generally, however, they contain one or more of the following elements: (i) restrictions on trade with or investment in a sanctioned country, including prohibitions against direct or indirect imports from and exports to a sanctioned country and prohibitions on “U.S. persons” engaging in financial transactions relating to making investments in, or providing investment-related advice or assistance to, a sanctioned country; and (ii) a blocking of assets in which the government or specially designated nationals of the sanctioned country have an interest, by prohibiting transfers of property subject to U.S. jurisdiction (including property in the possession or control of U.S. persons). Blocked assets (e.g., property and bank deposits) cannot be paid out, withdrawn, set off or transferred in any manner without a license from OFAC. Failure to comply with these sanctions could have serious legal and reputational consequences.
The Bank is subject to a wide variety of other laws with respect to the operation of its businesses, and regulations adopted under those laws, including but not limited to the Truth in Lending Act, Truth in Savings Act, Equal Credit Opportunity Act, Electronic Funds Transfer Act, Fair Housing Act, Home Mortgage Disclosure Act, Fair Debt Collection Practices Act, Fair Credit Reporting Act, Expedited Funds Availability (Regulation CC), Reserve Requirements (Regulation D), Insider Transactions (Regulation O), Privacy of Consumer Information (Regulation P), Margin Stock Loans (Regulation U), Right To Financial Privacy Act, Flood Disaster Protection Act, Homeowners Protection Act, Servicemembers Civil Relief Act, Real Estate Settlement Procedures Act, TILA-RESPA Integrated Disclosure Rule, Telephone Consumer Protection Act, CAN-SPAM Act, Children’s Online Privacy Protection Act, the Secure and Fair Enforcement for Mortgage Licensing Act of 2008 (SAFE Act) and the John Warner National Defense Authorization Act. The laws and regulations to which we are subject are constantly under review by the U.S. Congress, the federal regulatory agencies, and the state authorities.
Federal Deposit Insurance Premiums and Assessments
The Bank’s deposit accounts are currently insured by the Deposit Insurance Fund (the “DIF”) of the FDIC. The insurance benefit generally covers up to a maximum of $250,000 per separately insured depositor. As an FDIC-insured bank, our bank subsidiary is subject to deposit insurance premiums and assessments to maintain the DIF. The Bank’s deposit insurance premium assessment rate depends on the asset and supervisory categories to which it is assigned. The FDIC has authority to raise or lower assessment rates on insured banks in order to achieve statutorily required reserve ratios in the DIF and to impose special additional assessments.
Under the current system, deposit insurance assessments are based on average total assets minus average tangible equity. The FDIC assigns a banking institution to one of two categories based on asset size. As an institution with under $10 billion in assets, the Bank falls into the “Established Small Institution” category. This category has three sub-categories based on supervisory ratings designed to measure risk (the FDIC’s “CAMELS Composite” ratings). The assessment rate, which ranges from 1.5 to 30.0 basis points (such basis points representing a per annum rate) for Established Small Institutions, is determined based upon each applicable institution’s most recent supervisory and capital evaluations.
In addition, eachOctober 2022, the FDIC insured institution has beenadopted a final rule that increased the initial base deposit insurance assessment rate schedules uniformly by 2 basis points beginning with the first quarterly assessment period of 2023. The increased assessment was expected to improve the likelihood that the DIF reserve ratio would reach the statutory minimum of 1.35% by the statutory deadline prescribed under the FDIC’s amended restoration plan.
Cybersecurity
The federal banking regulators regularly issue new guidance and standards, and update existing guidance and standards, regarding cybersecurity intended to enhance cyber risk management among financial institutions. Financial institutions are expected to comply with such guidance and standards and to accordingly develop appropriate security controls and risk management processes. If we fail to observe such regulatory guidance or standards, we could be subject to various regulatory sanctions, including financial penalties. In 2023, the SEC issued a final rule that requires disclosure of material cybersecurity incidents, as well as cybersecurity risk management, strategy and governance. Under this rule, banking organizations that are SEC registrants must generally disclose information about a material cybersecurity incident within four business days of determining it is material with periodic updates as to the status of the incident in subsequent filings as necessary.
Under a final rule adopted by federal banking regulators in 2021, banking organizations are required to paynotify their primary banking regulator within 36 hours of determining that a “computer-security incident” has materially disrupted or degraded, or is reasonably likely to materially disrupt or degrade, the FDIC an assessmentbanking organization’s (i) ability to carry out banking operations or deliver banking products and services to a material portion of its customer base, (ii) businesses and operations that would result in material loss, or (iii) operations that would impact the financial stability of the United States.
State regulators have also been increasingly active in implementing privacy and cybersecurity standards and regulations. Recently, several states have adopted regulations requiring certain financial institutions to implement cybersecurity programs and many states, including Indiana, have also recently implemented or modified their data breach notification, information security and data privacy requirements. We expect this trend of state-level activity in those areas to continue and are continually monitoring developments in the states in which our customers are located.
See Item 1A. Risk Factors for a further discussion of risks related to cybersecurity and Item 1C. Cybersecurity for a further discussion of risk management strategies and governance processes related to cybersecurity.
Climate-Related and Other ESG Developments
In recent years, federal, state and international lawmakers and regulators have increased their focus on a company’s risk oversight, disclosures and practices in connection with climate change and other environmental, social and governance (“ESG”) matters. For example, in March 2022, the SEC issued a proposed rule on the institution’s total assets less tangibleenhancement and standardization of climate-related disclosures by public companies. The proposed rule would require public issuers, including us, to significantly expand the scope of climate-related disclosures in their SEC filings. The SEC has also announced plans to propose rules to require enhanced disclosure regarding human capital in ordermanagement and board diversity for public issuers.
Future Legislation and Regulation
The U.S. Congress may enact legislation from time to fund interest payments on bonds issued bytime that affects the Financing Corporation, an agencyregulation of the federal government establishedfinancial services industry, and state legislatures may enact legislation from time to recapitalizetime affecting the predecessor to the Savings Association Insurance Fund. With the Financingregulation of financial institutions chartered by or operating in
Corporation having madethose states. Federal and state regulatory agencies also periodically propose and adopt changes to their regulations or change the manner in which existing regulations are applied. The substance or impact of pending or future legislation or regulation, or the application thereof, cannot be predicted, although any change could impact the regulatory structure under which we or our competitors operate and may significantly increase costs, impede the efficiency of internal business processes, require an increase in regulatory capital, require modifications to our business strategy, and limit our ability to pursue business opportunities in an efficient manner. It could also affect our competitors differently than us, including in a manner that would make them more competitive. A change in statutes, regulations or regulatory policies applicable to the Company or any of its final bond payment in September 2019, the Bank made its last assessment payment, which was equal tosubsidiaries could have a per annum ratematerial, adverse effect on our business, financial condition and results of 0.12 basis points, in March 2019.operations.
COVID-19 and Related Legislative and Regulatory Actions
On January 30, 2020, the World Health Organization (“WHO”) announced that the outbreak of the novel coronavirus disease 2019 (COVID-19) constituted a public health emergency of international concern. On March 11, 2020, WHO declared COVID-19 to be a global pandemic and, on March 13, 2020, the President of the United States declared the COVID-19 outbreak a national emergency. In the two years since then, the pandemic has dramatically impacted global health and the economy, including millions of confirmed cases and deaths, business slowdowns or shutdowns, labor shortfalls, supply chain challenges, regulatory challenges, and market volatility. In response, the U.S. Congress, through the enactment of the CARES Act in March 2020, and the federal banking agencies, though rulemaking, interpretive guidance and modifications to agency policies and procedures, have taken a series of actions to provide emergency economic relief measures including, among others, the following:
Paycheck Protection Program. The CARES Act established the PPP, which is administered by the Small Business Administration (“SBA”), to fund payroll and operational costs of eligible businesses, organizations and self-employed persons during the pandemic. The Company actively participated in assisting its customers with PPP funding during all phases of the program. The vast majority of the Company’s PPP loans made in 2020 have two-year maturities, while the loans made in 2021 have five-year maturities. Loans under the program earn interest at a fixed rate of 1 percent. As of December 31, 2021, the Company had $19.5 million of PPP loans outstanding compared to the December 31, 2020 balance of $182.0 million. The Company will continue to monitor legislative, regulatory, and supervisory developments related to the PPP. However, it anticipates that the majority of the Company's remaining PPP loans will be forgiven by the SBA in accordance with the terms of the program.
Loan Modifications and Troubled Debt Restructures. The CARES Act, as amended by the 2021 Consolidated Appropriations Act, which was signed into law on December 27, 2020 (the “CAA”), allowed banks to suspend requirements under GAAP, through January 1, 2022, for certain loan modifications related to the COVID-19 pandemic. The federal banking agencies also issued guidance to encourage banks to make loan modifications for borrowers affected by COVID-19 or offer other borrower friendly options. In accordance with such guidance, the Company made various short-term modifications to borrowers who were current and otherwise not past due. These included short-term, 180 days or less, modifications in the form of payment deferrals.
Regulatory Capital. The CARES Act, the CAA, and certain actions by federal banking regulators resulted in modifications to, or delays in implementation of, various regulatory capital rules applicable to banking organizations. See “Capital Requirements” above for additional information.
Internet Address; Internet Availability of SEC Reports
The Company’s Internet address is www.germanamerican.com.
The Company makes available, free of charge through the Investor Relations - Financial Information section of its Internet website, the Company’s annual report on Form 10-K, its quarterly reports on Form 10-Q, its current reports on Form 8-K and any amendments to those reports filed or furnished pursuant to Section 13(a) of the Securities Exchange Act of 1934, as amended, as soon as reasonably practicable after those reports are filed with or furnished to the SEC.
Forward-Looking Statements and Associated Risks
The Company from time to time in its oral and written communications makes statements relating to its expectations regarding the future. These types of statements are considered “forward-looking statements” within the meaning of the Private Securities Litigation Reform Act of 1995. Such forward-looking statements can include statements about the Company’s net interest income or net interest margin; the impact of the COVID-19 pandemic; adequacy of the Company’s capital under regulatory requirements and of its allowance for loan losses, and the quality of the Company’s loans, investment securities and other assets; simulations of changes in interest rates; litigation results; dividend policy; acquisitions or mergers; estimated cost savings, plans and objectives for future operations; and expectations about the Company’s financial and business performance and other business matters as well as economic and market conditions and trends. All statements other than statements of historical fact included in this Report, including statements regarding our financial position, business strategy and the plans and objectives of our management for future operations, are forward-looking statements. When used in this Report, words such as “anticipate”, “believe”, “estimate”, “expect”, “plan”, “intend”, “should”, “would”, “could”, “can”, “may”, “will”, “might” and similar expressions, as they relate to us or our management, identify forward-looking statements.
Such forward-looking statements are based on the beliefs of our management, as well as assumptions made by and information currently available to our management, and are subject to risks, uncertainties, and other factors.
Actual results may differ materially and adversely from the expectations of the Company that are expressed or implied by any forward-looking statement. The discussions in Item 1A, “Risk Factors,” and in Item 7 of this Form 10-K, “Management’s Discussion and Analysis of Financial Condition and Results of Operations,” list some of the factors that could cause the Company’s actual results to vary materially from those expressed or implied by any forward-looking statements. OtherThose risks, and other risks, uncertainties, and factors that could cause the Company’s actual results to vary materially from those expressed or implied by any forward-looking statement, include but are not limited to:
•the unknown future direction ofchanges in interest rates and the timing and magnitude of any such changes;
•unfavorable economic conditions, including a prolonged period of inflation, and the resulting adverse impact on, among other things, credit quality;
•the soundness of other financial institutions and general investor sentiment regarding the stability of financial institutions;
•changes in interest rates;our liquidity position;
•the impacts of epidemics, pandemics or other infectious disease outbreaks;
•changes in competitive conditions;
•the introduction, withdrawal, success and timing of asset/liability management strategies or of mergers and acquisitions and other business initiatives and strategies;
•changes in customer borrowing, repayment, investment and deposit practices;
•changes in fiscal, monetary and tax policies;
•changes in financial and capital markets;
•potential deterioration in general economic conditions, either nationally or locally, resulting in, among other things, credit quality deterioration;
•the severity and duration of the COVID-19 pandemic and its impact on general economic and financial market conditions and our business, results of operations and financial condition;
•capital management activities, including possible future sales of new securities, or possible repurchases or redemptions by the Company of outstanding debt or equity securities;
•risks of expansion through acquisitions and mergers, such as unexpected credit quality problems of the acquired loans or other assets, unexpected attrition of the customer base or employee base of the acquired institution or branches, and difficulties in integration of the acquired operations;
•factors driving impairment charges on investments;
•the impact, extent and timing of technological changes;
•potential cyber-attacks, information security breaches and other criminal activities;
•litigation liabilities, including related costs, expenses, settlements and judgments, or the outcome of matters before regulatory agencies, whether pending or commencing in the future;
•actions of the FRB;
•the possible effectspotential for increases to, and volatility in, the balance of the replacement of the London Interbank Offering Rate (LIBOR);
•the impact ofour allowance for credit losses and related provision expense due to the current expected credit loss (CECL) standard;
•changes in accounting principles and interpretations,interpretations;
•potential increases of federal deposit insurance premium expense, and possible future special assessments of FDIC premiums, either industry wide or specific to the Company’s banking subsidiary;
•actions of the regulatory authorities under the Dodd-Frank Act and the Federal Deposit Insurance Act and other possible legislative and regulatory actions and reforms;
•impacts resulting from possible amendments or revisions to the Dodd-Frank Act and the regulations promulgated thereunder, or to CFPB rules and regulations; and
•the continued availability of earnings and excess capital sufficient for the lawful and prudent declaration and payment of cash dividends; and
•with respect to the merger with CUB, the possibility that the anticipated benefits of the transaction, including anticipated cost savings and strategic gains, are not realized when expected or at all, including as a result of the impact of, or problems arising from, the integration of the two companies, unexpected credit quality problems of the acquired loans or other assets, or unexpected attrition of the customer base of the acquired institution or branches.dividends.
Such statements reflect our views with respect to future events and are subject to these and other risks, uncertainties and assumptions relating to the operations, results of operations, growth strategy and liquidity of the Company. Readers are cautioned not to place undue reliance on these forward-looking statements. It is intended that these forward-looking statements speak only as of the date they are made. We do not undertake any obligation to release publicly any revisions to these forward-looking statements to reflect future events or circumstances or to reflect the occurrence of unanticipated events.
Item 1A. Risk Factors.
The following describes some of the principal risks and uncertainties to which our industry in general, and our securities, assets and businesses specifically, are subject; other risks are briefly identified in our cautionary statement that is included under the heading “Forward-Looking Statements and Associated Risks” in Part I, Item 1, “Business.” Although we seek ways
to manage these risks and uncertainties and to develop programs to control those that we can, we ultimately cannot predict the future. Future results may differ materially from past results, and from our expectations and plans.
Risks Related to the COVID-19 Pandemic
The ongoing COVID-19 pandemic and measures intended to prevent its spread have adversely impacted the Company’s business and financial results, and the continued impact will depend on future developments, which are highly uncertain and cannot be predicted, including the severity and duration of the pandemic and further actions taken by governmental authorities and other third parties to contain and treat the virus.
COVID-19, which has been identified as a pandemic by the World Health Organization and declared a national emergency in the United States, continues to cause disruptions in the global economy (including the states and local economies in which we operate) and instability in financial markets. The outbreak resulted in authorities implementing numerous measures to try to contain the virus, such as travel bans and restrictions, quarantines, shelter in place or total lock-down orders and business limitations and shutdowns. Such measures, which could be implemented again in the future, significantly contributed to rising unemployment and negatively impacted consumer and business spending. As a result, the demand for the Company’s products and services has been, and may continue to be, adversely impacted. Furthermore, the pandemic has caused, and could continue to influence, the recognition of credit losses in the Company’s loan portfolio as customers are negatively impacted by economic conditions. The Company’s allowance for credit losses is also subject to further change as customers are impacted by economic fluctuations resulting from the pandemic. In addition, governmental actions taken in response to COVID-19 have resulted in decreased interest rates and yields, which have adversely impacted the Company's interest margins and which may lead to decreases in the Company’s net interest income.
As our banking regulators encouraged us to work prudently with borrowers who are unable to meet their contractual payment obligations due to the effects of COVID-19, the Bank provided certain hardship relief primarily in the form of payment deferrals. As a result, the Bank has made short-term loan modifications for borrowers who are current and otherwise not past due. As provided under the CARES Act and extended by the 2021 Consolidated Appropriations Act, these qualified loan modifications were exempt by law from classification as troubled debt restructures, as defined by GAAP, through January 1, 2022. The potential adverse impact resulting from the inability of these borrowers to repay loans on a timely basis cannot be determined at this time. However, the extent of such impact, as reflected in the Company’s financial statements, may have been muted by these loan modifications, which could have the effect of having delayed loss recognition until after the deferral period.
The spread of COVID-19 caused the Company to modify its business practices (including developing work from home and social distancing plans for our employees), and we may take further actions as may be required by government authorities or as we determine are in the best interests of our employees, customers and business partners. There is no certainty that such measures will be sufficient to mitigate the risks posed by the virus or will otherwise be satisfactory to government authorities. Furthermore, the Company’s business operations have been, and may again in the future be, disrupted due to vendors and third-party service providers being unable to work or provide services effectively, including because of illness, quarantines, government actions, or other restrictions in connection with the pandemic.
The extent to which COVID-19 continues to impact the Company’s business, results of operations and financial condition, as well as its regulatory capital and liquidity ratios, will depend on future developments, which are highly uncertain and are difficult to predict, including, but not limited to, the duration and severity of the pandemic, the potential for seasonal or other resurgences, actions taken by governmental authorities and other third parties to contain and treat the virus, and how quickly and to what extent normal economic and operating conditions can resume. Moreover, the effects of the COVID-19 pandemic may heighten many of the other risks described in this “Risk Factors” section. While we do not yet know the full extent of its impact, the pandemic could cause us to experience higher credit losses in our lending portfolio, impairment of our goodwill and other financial assets, reduced demand for our products and services, and other negative impacts on the Company’s business, results of operations and financial condition, which could be material.
As a participating lender in the SBA Paycheck Protection Program (“PPP”), the Company and the Bank are subject to additional risks of litigation from the Bank’s clients or other parties in connection with the Bank’s processing of loans for the PPP and risks that the SBA may not fund some or all PPP loan guaranties.
On March 27, 2020, the CARES Act established the PPP, which is administered by the SBA, to fund payroll and operational costs of eligible businesses, organizations and self-employed persons during the pandemic. The Bank actively participated in assisting its customers with PPP funding during all phases of the program. Because of the short timeframe between the passing of the CARES Act and the April 3, 2020 opening of the PPP, there was some ambiguity in the laws, rules and guidance regarding the operation of the program, which exposes the Company to risks relating to noncompliance with the PPP.
Since the opening of the PPP, several larger banks have been subject to litigation relating to the policies and procedures that they used in processing applications for the PPP. The Company and the Bank may be exposed to the risk of litigation, from both customers and non-customers that have approached the Bank in connection with PPP loans and its policies and procedures used in processing applications for the PPP. If any such litigation is filed against the Company or the Bank and is not resolved in a manner favorable to the Company or the Bank, it may result in significant financial liability or adversely affect the Company’s reputation. In addition, litigation can be costly, regardless of outcome. Any financial liability, litigation costs or reputational damage caused by PPP-related litigation could have a material adverse impact on our business, financial condition and results of operations.
The Bank also has credit risk on PPP loans if a determination is made by the SBA that there is a deficiency in the manner in which the loan was originated, funded, or serviced by the Bank, such as an issue with the eligibility of a borrower to receive a PPP loan, which may or may not be related to the ambiguity in the laws, rules and guidance regarding the operation of the PPP. In the event of a loss resulting from a default on a PPP loan and a determination by the SBA that there was a deficiency in the manner in which the PPP loan was originated, funded, or serviced by the Company, the SBA may deny its liability under the guaranty, reduce the amount of the guaranty, or, if it has already paid under the guaranty, seek recovery of any loss related to the deficiency from the Bank.
The ongoing COVID-19 pandemic has increased cyber-security risks.
The ongoing COVID-19 pandemic has introduced additional risk to our information systems and security procedures, controls and policies as a result of employees, contractors and other corporate partners working remotely. As a result of an increased remote workforce, we have increasingly relied on information technology systems that are outside our direct control, and these systems are also vulnerable to cyber-based attacks and security breaches. In addition, since the beginning of pandemic, there has been an increase attacks by cyber criminals on businesses and individuals, utilizing interest in pandemic-related information and the fear and uncertainty caused by the pandemic to increase phishing, malware, and other cybersecurity attacks designed to trick victims into transferring sensitive data or funds, steal credentials or deploy malware that compromises information systems. If one of our employees were to fall victim to one of these attacks, or our information technology systems are compromised, our operations could be disrupted, or we may suffer financial loss, reputational loss, loss of customer business or other critical assets, or become exposed to regulatory fines and intervention or civil litigation.
Risks Related to the Financial Services Industry
We operate in a highly regulated environment and changes in laws and regulations to which we are subject may adversely affect our results of operations.
The banking industry in which we operate is subject to extensive regulation and supervision under federal and state laws and regulations. The restrictions imposed by such laws and regulations limit the manner in which we conduct our business, undertake new investments and activities and obtain financing. These regulations are designed primarily for the protection of the deposit insurance funds and consumers and not to benefit our shareholders.
Since its passage in 2010, the Dodd-Frank Act (discussed in “Business - Regulation and Supervision” of Item 1 above) has resulted in sweeping changes in the regulation of financial institutions. The Dodd-Frank Act contains numerous provisions that affect all banks and bank holding companies. While many of these provisions have been implemented, others are still being drafted. As a result, the impact of the future regulatory requirements continues to be uncertain. However, we expect the way we conduct business to continue to be affected by these regulatory requirements, including through limitations on our ability to pursue certain lines of business, enhanced reporting obligations, increased costs (which adversely affect our profitability) and increased risk that we might not comply in all respects with the new requirements.
In addition, significant new laws or changes in, or repeals of, existing laws (including changes in federal or state laws affecting corporate taxpayers generally or financial institutions specifically) could have a material adverse effect on our business, financial condition, results of operations or liquidity. Further, federal monetary policy, particularly as implemented through the Federal Reserve System, significantly affects credit conditions, and any unfavorable change in these conditions could have a material adverse effect on our business, financial condition, results of operations or liquidity.
We are required to maintain certain minimum amounts and types of capital and may be subject to more stringent capital requirements in the future. A failure to meet applicable capital requirements could have an adverse effect on us.
We are subject to regulatory requirements specifying minimum amounts and types of capital that we must maintain. From time to time, banking regulators change these capital adequacy guidelines. For example, as a result of the Basel III Rules required by
the Dodd-Frank Act, we are now required to satisfy additional, more stringent, capital adequacy standards than we had in the past. See “Business - Regulation and Supervision, Capital Requirements” of Item 1 above for additional information. We currently satisfy the well-capitalized and capital conservation standards set forth in Basel III, and based on our current capital composition and levels, we anticipate that our capital ratios, on a Basel III basis, will continue to exceed the well-capitalized minimum capital requirements and capital conservation buffer standards. However, a failure to meet minimum capital requirements could result in certain mandatory and possible additional discretionary actions by regulators that, if undertaken, could have a negative impact on our ability to lend, grow deposit balances, make acquisitions or make capital distributions in the form of dividends. Higher capital levels could also lower our return on equity.
Our FDIC insurance premiums may increase, and special assessments could be made, which might negatively impact our results of operations.
High levels of insured institution failures, as a result of the recent recession, significantly increased losses to the Deposit Insurance Fund of the FDIC. Further, the Dodd-Frank Act mandated the FDIC to increase the level of its reserves for future losses in its Deposit Insurance Fund. Since the Deposit Insurance Fund is funded by premiums and assessments paid by insured banks, our FDIC insurance premium could increase in future years depending upon the FDIC’s actual loss experience, changes in our Bank’s financial condition or capital strength, and future conditions in the banking industry.
Risks Related to Our Business and Financial Strategies
Economic weakness in our geographic markets could negatively affect us.
We conduct business from offices that are located in 1920 contiguous southern Indiana counties and 14 counties in Kentucky, from which substantially all of our customer base is drawn. Because of the geographic concentration of our operations and customer base, our results depend largely upon economic conditions in this area. Any material deteriorationA favorable business environment is generally characterized by, among other factors, economic growth, low inflation, low unemployment, high business and investor confidence, strong business earnings, and efficient capital markets.Unfavorable or uncertain economic and market conditions can be caused by a decline in economic growth in the markets where we operate and in the United States as a whole; declines in business activity or investor or business confidence; limitations on the availability of or increases in the cost of credit and capital; increases in inflation or interest rates; high unemployment; commodity price volatility; natural disasters; or a combination of these or other factors.
Current economic conditions in these marketsare being heavily impacted by elevated levels of inflation and rising interest rates. A prolonged period of inflation may impact our profitability by negatively impacting our fixed costs and expenses. Economic and inflationary pressure on consumers and uncertainty regarding economic improvement could have direct or indirect material adverse impacts on us, or on our customers or on the financial institutions with whom we deal as counterparties to financial transactions.Such deteriorationpressures could negatively impact customers’ ability to obtain new loans or to repay existing loans, diminish the values of any collateral securing such loans and could cause increases in the number of the Company’s customers experiencing financial distress and in the levels of the Company’s delinquencies, non-performing loans and other problem assets, charge-offs and provision for credit losses, all of which could materially adversely affect our financial condition and results of operations. The underwriting and credit monitoring policies and procedures that we have adopted cannot eliminate the risk that we might incur losses on account of factors relating to the economy like those identified above, and those losses could have a material adverse effect on our business, financial condition, results of operations and cash flows.
If our actual loan losses exceed our estimates, our earnings and financial condition will be impacted.
A significant source of risk for any bank or other enterprise that lends money arises from the possibility that losses will be sustained because borrowers, guarantors and related parties may fail (because of financial difficulties or other reasons) to perform in accordance with the terms of their loan agreements. In our case, we originate many loans that are secured, but some loans are unsecured depending on the nature of the loan. With respect to secured loans, the collateral securing the repayment of these loans includes a wide variety of real and personal property that may be insufficient to cover the obligations owed under such loans, due to adverse changes in collateral values caused by changes in prevailing economic, environmental and other conditions, including declines in the value of real estate and other external events.
We have adopted new accounting guidance, specifically the current expected credit loss (“CECL”) standard, to account for our credit losses that may be more volatile and may adversely impact our financial statements when forecasted market conditions change.
Effective January 1, 2020, the Company adopted the Financial Accounting Standards Board (FASB) issued Accounting Standards Update (ASU) No. 2016-13, “Financial Instruments-Credit Losses (Topic 326): Measurement of Credit Losses on Financial Instruments,” which replaces the incurred loss model with an expected loss model, which is referred to as the current expected credit loss (“CECL”) model. The CECL model is applicable to the measurement of credit losses on financial assets measured at amortized cost, including loan receivables, held-to-maturity debt securities, and reinsurance receivables. It also applies to off-balance sheet credit exposures not accounted for as insurance (loan commitments, standby letters of credit, financial guarantees, and other similar instruments) and net investments in leases recognized by a lessor. The measurement of expected credit losses is to be based on information about past events, including historical experience, current conditions, and reasonable and supportable forecasts that affect the collectability of the reported amount. This measurement will take place at the time the financial asset is first added to the balance sheet and periodically thereafter. This differs significantly from the incurred loss model, which delays recognition until it is probable a loss has been incurred. As a result, the CECL model may create more volatility in our earnings and the level of our allowance for credit losses.
Our allowance for credit losses may not be adequate to cover actual losses.
We maintain an allowance for credit losses for the expected credit losses over the contractual life of the loan portfolio as well as unfunded loan commitments. The Company estimates the allowance balance using relevant available information, from internal and external sources, relating to past events, current conditions, and reasonable and supportable forecasts. Historical loss experience provides the basis for the estimation of expected credit losses. Adjustments to historical loss information are made for changes in underwriting standards, portfolio mix, delinquency level,levels, changes in environmental conditions, unemployment rates, risk classifications and collateral values. We have also included assumptions about the severity and duration of thecontinued effects of the COVID-19 pandemicadvancing stress on our borrowers, their industry,the economy as a result of inflationary pressures, rising interest rates and onfinancial market volatility, and economic conditions in general, all of which are highly uncertain and for which we have nolimited recent historical experience to draw upon. If our assumptions and judgments used to determine the allowance for credit losses prove to be incorrect, the allowance may not be adequate. We could sustain actual loan losses that are significantly higher than the amount of our allowance for credit losses.
We could be adversely affected by changes in interest rates.
Our earnings and cash flows are largely dependent upon our net interest income. Net interest income is the difference between interest income earned on interest-earning assets such as loans and securities and interest expense paid on interest-bearing liabilities such as deposits and borrowed funds. Interest rates are highly sensitive to many factors that are beyond our control, including general economic conditions, inflationary trends, demand for loans, securities and deposits, and policies of various governmental and regulatory agencies and, in particular, the monetary policies of the FRB. Changes in monetary policy, including changes in interest rates, could influence not only the interest we receive on loans and securities and the amount of interest we pay on deposits and borrowings, but such changes could also affect (i) our ability to originate loans and obtain deposits, (ii) the fair value of our financial assets and liabilities, and (iii) the average duration of our securities portfolio. If the interest rates paid on deposits and other borrowings increase at a faster rate than the interest rates received on loans and other investments, our net interest income, and therefore earnings, could be adversely affected. Earnings could also be adversely affected if the interest rates received on loans and other investments fall more quickly than the interest rates paid on deposits and other borrowings. We maintain an investment portfolio consisting of various high quality liquid fixed-income securities. The nature of fixed-income securities is such that increases in prevailing market interest rates negatively impact the value of these securities, while decreases in prevailing market interest rates positively impact the value of these securities. Any substantial, unexpected, or prolonged change in market interest rates could have a material adverse effect on our financial condition, results of operations, and cash flows.
The replacementCompany’s business, results of the LIBOR benchmark interest rate may have an impact on the our business,operations and financial condition may be adversely affected by epidemics, pandemics or results of operations.other infectious disease outbreaks.
Certain loans made by us and financing extendedThe Company may face risks related to us are made at variable ratesepidemics, pandemics or other infectious disease outbreaks, which could result in a widespread health crisis that use LIBOR as a benchmark for establishingadversely affects general commercial activity, the interest rate. In addition, we also have interest rate derivatives that reference LIBOR. After first announcing its intention to do so in July 2017, the United Kingdom’s Financial Conduct Authority, the authority regulating LIBOR, announced in March 2021 that, among other things: (i) a majority of the current LIBOR rate settings would cease to exist immediately after December 31, 2021global economy (including the 1-weekstates and 2-month U.S. dollar LIBOR settings);local economies in which we operate) and (ii)financial markets. Epidemics, pandemics or other infectious disease outbreaks may result in the 1-month, 3-month, 6-monthCompany closing certain offices and 12-month U.S. dollar LIBOR settings would ceasemay require us to exist after June 30, 2023.limit how customers conduct business through our branch network. If our employees are required to work remotely, the Company will be exposed to increased cybersecurity risks such as phishing, malware, and other cybersecurity attacks, all of which could expose us to liability and could seriously disrupt our business operations. Furthermore, the Company’s business operations may be disrupted due to vendors and third-party service providers being unable to work or provide services effectively during such a health crisis, including because of illness, quarantines or other government actions.
To identifyIn addition, epidemics, pandemics or other infectious disease outbreaks could significantly impact households and businesses, or cause limitations on commercial activity, increased unemployment and general economic and financial instability. An economic slow-down, or the reversal of an economic recovery, in the regions in which we conduct our business could result in declines in loan demand and collateral values. Furthermore, negative impacts on our customers caused by such a successor rate for U.S. dollar LIBOR,health crisis could result in increased risk of delinquencies, defaults, foreclosures and losses on our loans. Moreover, governmental and regulatory actions taken in response to epidemics, pandemics or other infectious disease outbreaks may include decreased
interest rates, which could adversely impact the Alternative Reference Rates Committee (the “ARRC”), a U.S.-based group convened byCompany’s interest margins and may lead to decreases in the Federal Reserve Board and the Federal Reserve Bank of New York, was formed. On July 29, 2021, the ARRC formally identified the Secured Overnight Financing Rate (“SOFR”) as its preferred alternative rate for LIBOR. SOFR is a measure of the cost of borrowing cash overnight, collateralized by U.S. Treasury securities, and is based on directly observable U.S. Treasury-backed repurchase transactions. As such, it is different from LIBOR in that it is a backward looking secured rate rather than a forward looking unsecured rate.Company’s net interest income.
At this time, it is not possibleThe extent to which a widespread health crisis may impact the Company’s business, results of operations and financial condition, as well as its regulatory capital and liquidity ratios, will depend on future developments, which are highly uncertain and are difficult to predict, including, but not limited to, the effectduration and severity of any such changes, any establishment of alternative reference ratesthe crisis, the potential for seasonal or other reformsresurgences, actions taken by governmental authorities and other third parties to LIBOR thatcontain and treat such epidemics, pandemics or other infectious disease outbreaks, and how quickly and to what extent normal economic and operating conditions can resume. Moreover, the effects of a widespread health crisis may be enactedheighten many of the other risks described in this “Risk Factors” section. As a result, the United States,negative effects on the United Kingdom or elsewhere or, whether the COVID-19 outbreak will have further effect on LIBOR transition plans. Any replacement interest rate(s) may perform differently and we may incur significant costs to transition both our borrowing arrangements and the loan agreements with our customers from LIBOR, which may have an adverse effect on ourCompany’s business, results of operations. In addition, amending certain contracts indexed to LIBOR may require consentoperations and financial condition from impacted counterparties whichepidemics, a pandemics or other infectious disease outbreaks could be difficult to obtain. The financial and operational impact of the transition is unknown at this time. As federal banking regulators required banks to stop originating new products using LIBOR by December 31, 2021, the Bank began using alternative indices, including SOFR, in originating new loans or other products following such date.material.
The banking and financial services business in our markets is highly competitive.
We compete with much larger regional, national, and international competitors, including competitors that have no (or only a limited number of) offices physically located within our markets, many of which compete with us via Internet and other electronic product and service offerings. In addition, banking and other financial services competitors (including newly organized companies) that are not currently represented by physical locations within our geographic markets could establish office facilities within our markets, including through their acquisition of existing competitors. Financial technology, or
“FinTech, “FinTech,” companies continue to emerge in key areas of banking. Our competitors may have substantially greater resources and lending limits than we have and may offer services that we do not or cannot provide. Many of our nonfinancial institution competitors have fewer regulatory constraints, broader geographic service areas, and, in some cases, lower cost structures. Increased competition in our market may also result in a decrease in the amounts of our loans and deposits, reduced spreads between loan rates and deposit rates or loan terms that are more favorable to the borrower. Any of these results could have a material adverse effect on our business, financial condition, results of operations or liquidity. See also “Business - Competition” and “Business - Regulation and Supervision” under Item 1 of Part I of this Report.
The manner in which we report our financial condition and results of operations may be affected by accounting changes.
Our financial condition and results of operations that are presented in our consolidated financial statements, accompanying notes to the consolidated financial statements, and selected financial data appearing in this Report, are, to a large degree, dependent upon our accounting policies. The selection of and application of these policies involve estimates, judgments and uncertainties that are subject to change, and the effect of any change in estimates or judgments that might be caused by future developments or resolution of uncertainties could be materially adverse to our reported financial condition and results of operations. In addition, authorities that prescribe accounting principles and standards for public companies from time to time change those principles or standards or adopt formal or informal interpretations of existing principles or standards. Such changes or interpretations (to the extent applicable to us) could result in changes that would be materially adverse to our reported financial condition and results of operations.
We may be adversely affected by changes in tax laws.
Any change in federal or state tax laws or regulations, including any increase in the federal corporate income tax rate from the current level of 21%, could negatively affect our business, financial condition and results of operations.
Liquidity risk could impair our ability to fund operations and jeopardize our financial condition.
Liquidity is essential to our business. An inability to raise funds through deposits, borrowings, the sale of securities or loans and other sources could have a substantial negative effect on our liquidity. Our access to funding sources in amounts adequate to finance our activities or the terms of which are acceptable to us could be impaired by factors that affect us specifically or the financial services industry or economy in general. Although we have historically been able to replace maturing deposits and borrowings as necessary, we might not be able to replace such funds in the future if, among other things, our results of operations or financial condition or the results of operations or financial condition of our lenders or market conditions were to change.change.
Additionally, negative news about us or the banking industry in general could negatively impact market and/or customer perceptions of the Bank, which could lead to a loss of depositor confidence and an increase in deposit withdrawals, particularly among those with uninsured deposits. Furthermore, as we and other banks experienced in 2023, the failure of other financial institutions may cause deposit outflows as customers (i) spread deposits among several different banks so as to maximize their amount of FDIC insurance, (ii) move deposits to larger banks (who may be considered “too big to fail”), or (iii) remove deposits from the banking system entirely. As of December 31, 2023, approximately 21% of our deposits were uninsured and
uncollateralized. A failure to maintain adequate liquidity could have a material adverse effect on our business, financial condition and results of operations.
The value of securities in our investment securities portfolio may be negatively affected by market interest rates or disruptions in securities markets.markets, and could affect our liquidity.
PricesAs market interest rates have increased, we have experienced significant unrealized losses on our available-for-sale securities portfolio. Unrealized losses related to available-for-sale securities are reflected in accumulated other comprehensive income in our consolidated balance sheets and reduce the level of our book capital and tangible common equity. However, such unrealized losses do not affect our regulatory capital ratios. We actively monitor our available-for-securities portfolio and we do not currently anticipate the need to realize material losses from the sale of securities for liquidity purposes. Furthermore, we believe it is unlikely that we would be required to sell any such securities before recovery of their amortized cost bases, which may be at maturity. Nonetheless, significant unrealized losses could negatively impact market and/or customer perceptions of the Bank, which could lead to a loss of depositor confidence and an increase in deposit withdrawals, particularly among those with uninsured deposits.
In addition, prices and volumes of transactions in the nation’s securities markets can be affected suddenly by economic crises, or by other national or international crises, such as national disasters, acts of war or terrorism, changes in commodities markets, or instability in foreign governments. Disruptions in securities markets may detrimentally affect the value of securities that we hold in our investment portfolio, such as through reduced valuations due to the perception of heightened credit and liquidity risks. There can be no assurance that declines in market value associated with these disruptions will not result in other than temporary impairments of these assets, which would lead to accounting charges that could have a material adverse effect on our net income and capital levels.
The soundness of other financial institutions could adversely affect us.
Our ability to engage in routine funding transactions could be adversely affected by the actions and commercial soundness of other financial institutions. Financial services companies are interrelated as a result of trading, clearing, counterparty, or other relationships. We have exposure to many different industries and counterparties, and we routinely execute transactions with counterparties in the financial services industry, including brokers and dealers, commercial banks, investment banks, mutual and hedge funds, and other institutional clients. As a result, defaults by, or even rumors or questions about, one or more financial services companies, or the financial services industry generally, have led to market-wide liquidity problems and could lead to losses or defaults by us or by other institutions. Many of these transactions expose us to credit risk in the event of default of our counterparty or client. In addition, our credit risk may be exacerbated when the collateral held by us cannot be realized or is liquidated at prices not sufficient to recover the full amount due us.
The bank failures that occurred in 2023 highlighted the potential results of an insured depository institution unexpectedly having to obtain needed liquidity to satisfy deposit withdrawal requests, including how quickly such requests can accelerate once uninsured depositors lose confidence in an institution’s ability to satisfy its obligations to depositors. Uncertainty related to the stability and liquidity of banks has impacted the competitive landscape for deposits in the banking industry and may continue to impact competition for deposits in the future in an unpredictable manner. These possible impacts could adversely affect our future operating results, including net income, and negatively impact capital.
We are dependent on key personnel and the loss of one or more of those key personnel could harm our business.
Competition for qualified employees and personnel in the financial services industry (including banking personnel, trust and investments personnel, and insurance personnel) is intense and there are a limited number of qualified persons with knowledge of and experience in our local markets. Our success depends to a significant degree upon our ability to attract and retain
qualified loan origination executives, sales executives for our trust and investment products and services, and sales executives for our insurance products and services. We also depend upon the continued contributions of our management personnel, and in particular upon the abilities of our senior executive management, and the loss of the services of one or more of them could harm our business.
Our controls and procedures may fail or be circumvented.
Management regularly reviews and updates our internal controls, disclosure controls and procedures, and corporate governance policies and procedures. Any system of controls, however well designed and operated, is based in part on certain assumptions and can provide only reasonable, not absolute, assurances that the objectives of the system are met. Any failure or circumvention of our controls and procedures or failure to comply with regulations related to controls and procedures could have a material adverse effect on our business, results of operations, cash flows and financial condition.
Our methods of reducing risk exposure may not be effective.
The Company maintains a comprehensive risk management program designed to identify, quantify, manage, mitigate, monitor, aggregate, and report risks. However, instruments, systems and strategies used to hedge or otherwise manage exposure to various types of credit, market, liquidity, operational, compliance, financial reporting and strategic risks could be less effective than anticipated. As a result, the Company may not be able to effectively mitigate its risk exposures in particular market environments or against particular types of risk, which could have a material adverse effect on our business, results of operations, cash flows and financial condition. For more information regarding risk management, please see “RISK MANAGEMENT” under Item 7 of this Report (“Management’s Discussion and Analysis of Financial Condition and Results of Operations”).
We are exposed to risk of environmental liabilities with respect to properties to which we take title.
In the course of our business, we may own or foreclose and take title to real estate, and could be subject to environmental liabilities with respect to these properties (including liabilities for property damage, personal injury, investigation and clean-up costs incurred by these parties in connection with environmental contamination), or may be required to investigate or clean up hazardous or toxic substances, or chemical releases at a property.
Climate change and related legislative and regulatory initiatives may materially affect the Company’s business and results of operations.
The global business community has increased its political and social awareness surrounding the state of the global environment and the issue climate change. Further, the U.S. Congress, state legislatures and federal and state regulatory agencies continue to propose numerous initiatives related to climate change. Similar and even more expansive initiatives are expected under the current administration, including potentially increasing supervisory expectations with respect to banks’ risk management practices, accounting for the effects of climate change in stress testing scenarios and systemic risk assessments, revising expectations for credit portfolio concentrations based on climate-related factors and encouraging investment by banks in climate-related initiatives and lending to communities disproportionately impacted by the effects of climate change. The lack of empirical data surrounding the credit and other financial risks posed by climate change make it impossible to predict how specifically climate change may impact our financial condition and results of operations. To the extent our customers experience unpredictable and more frequent weather disasters attributable to climate change, the value of real property securing the loans in our portfolios may be negatively impacted. Additionally, if insurance obtained by our borrowers is insufficient to cover any disaster-related losses sustained to the collateral, or if insurance coverage is otherwise unavailable to our borrowers, the collateral securing our loans may be negatively impacted, which could impact our financial condition and results of operations. Further, the effects of weather disasters attributed to climate change may negatively impact regional and local economic activity, which could lead to an adverse effect on our customers and impact the communities in which we operate. Overall, climate change, its effects and the resulting, unknown impact could have a material adverse effect on our financial condition and results of operations.
Increasing scrutiny and evolving expectations from customers, regulators, investors, and other stakeholders with respect to the Company’s environmental, social and governance practices may impose additional costs on the Company or expose it to new or additional risks.
Companies are facing increasing scrutiny from customers, regulators, investors, and other stakeholders related to their environmental, social and governance (“ESG”)ESG practices and disclosure. Investor advocacy groups, investment funds and influential investors are also increasingly focused on these practices, especially as they relate to the environment, health and safety, diversity, labor conditions and human rights. Increased ESG-related compliance costs for the Company as well as among our suppliers, vendors and various other parties within our supply chain could result in increases to our overall operational costs. Failure to adapt to or comply with regulatory requirements or investor or stakeholder expectations and standards could
negatively impact our reputation, ability to do business with certain partners, access to capital, and our stock price. New government regulations could also result in new or more stringent forms of ESG oversight and expanding mandatory and voluntary reporting, diligence, and disclosure.
Risks Related to the Financial Services Industry
We operate in a highly regulated environment and changes in laws and regulations to which we are subject may adversely affect our results of operations.
The banking industry in which we operate is subject to extensive federal and state regulation and supervision, which vests a significant amount of discretion in the various regulatory authorities. Banking regulations are primarily intended to protect the funds of depositors, federal deposit insurance funds and the banking system as a whole, not shareholders. These regulations and supervisory guidance affect our lending practices, capital structure, investment practices, dividend policy and growth, among other things. The U.S. Congress and federal regulatory agencies continually review banking laws, regulations and policies for
possible changes. Changes to statutes, regulations or regulatory policies or supervisory guidance, including changes in interpretation or implementation of statutes, regulations, policies or supervisory guidance, could affect us in substantial and unpredictable ways. Such changes could subject us to additional costs, limit the types of financial services and products we may offer, limit our ability to return capital to shareholders or conduct certain activities, and/or increase the ability of non-banks to offer competing financial services and products, among other things. Failure to comply with laws, regulations, policies or supervisory guidance could result in enforcement and other legal actions by federal or state authorities, including criminal and civil penalties, the loss of FDIC insurance, the revocation of a banking charter, enforcement actions or sanctions by regulatory agencies, significant fines and civil money penalties and/or reputational damage. In this regard, government authorities, including the bank regulatory agencies, are pursuing aggressive enforcement actions with respect to compliance and other legal matters involving financial activities, which heightens the risks associated with actual and perceived compliance failures. Directives issued to enforce such actions may be confidential and thus, in some instances, we are not permitted to publicly disclose these actions. Any of the foregoing could have a material adverse effect on our business, financial condition and results of operations.
In addition, we anticipate increased regulatory scrutiny, in the course of routine examinations and otherwise, and new regulations in response to negative developments in the banking industry over the course of 2023, which may increase our cost of doing business and reduce our profitability. Among other things, there may be increased focus by both regulators and investors on deposit composition, the level of uninsured deposits, brokered deposits, unrealized losses in securities portfolios, liquidity, commercial real estate loan composition and concentrations, and capital as well as general oversight and control of the foregoing. We could face increased scrutiny or be viewed as higher risk by regulators and/or the investor community, which could have a material adverse effect on our business, financial condition and results of operations.
See “Business - Regulation and Supervision” of Item 1 above for additional information.
We are required to maintain certain minimum amounts and types of capital and may be subject to more stringent capital requirements in the future. A failure to meet applicable capital requirements could have an adverse effect on us.
We are subject to regulatory requirements specifying minimum amounts and types of capital that we must maintain. From time to time, banking regulators change these capital adequacy guidelines. For example, as a result of the Basel III Rules required by the Dodd-Frank Act, we are now required to satisfy additional, more stringent, capital adequacy standards than we had in the past. See “Business - Regulation and Supervision, Capital Requirements” of Item 1 above for additional information. We currently satisfy the well-capitalized and capital conservation standards set forth in Basel III, and based on our current capital composition and levels, we anticipate that our capital ratios, on a Basel III basis, will continue to exceed the well-capitalized minimum capital requirements and capital conservation buffer standards. However, a failure to meet minimum capital requirements could result in certain mandatory and possible additional discretionary actions by regulators that, if undertaken, could have a negative impact on our ability to lend, grow deposit balances, make acquisitions or make capital distributions in the form of dividends. Higher capital levels could also lower our return on equity.
Our FDIC insurance premiums may increase, and special assessments could be made, which might negatively impact our results of operations.
High levels of insured institution failures, as a result of the recent recession, significantly increased losses to the Deposit Insurance Fund of the FDIC. Further, the Dodd-Frank Act mandated the FDIC to increase the level of its reserves for future losses in its Deposit Insurance Fund. Since the Deposit Insurance Fund is funded by premiums and assessments paid by insured banks, our FDIC insurance premium could increase in future years depending upon the FDIC’s actual loss experience, changes in our Bank’s financial condition or capital strength, and future conditions in the banking industry.
Risks Related to Our Operations
We face significant operational risks due to the high volume and the high dollar value nature of transactions we process.
We operate in many different businesses in diverse markets and rely on the ability of our employees and systems to process transactions. Operational risk is the risk of loss resulting from our operations, including but not limited to, the risk of fraud by employees or persons outside our company, the execution of unauthorized transactions, errors relating to transaction processing and technology, breaches of our internal control systems or failures of those of our suppliers or counterparties, compliance failures, cyber-attacks or unforeseen problems encountered while implementing new computer systems or upgrades to existing systems, business continuation and disaster recovery issues, and other external events. Insurance coverage may not be available for such losses, or where available, such losses may exceed insurance limits. This risk of loss also includes the potential legal actions that could arise as a result of an operational deficiency or as a result of noncompliance with applicable regulatory standards, adverse business decisions or their implementation, and customer attrition due to potential negative publicity. The
occurrence of any of these events could cause us to suffer financial loss, face regulatory action and suffer damage to our reputation.
Unauthorized disclosure of sensitive or confidential client or customer information, whether through a cyber-attack, other breach of our computer systems or otherwise, could harm our business.
In the normal course of our business, we collect, process and retain sensitive and confidential client and customer information on our behalf and on behalf of other third parties. Despite the security measures we have in place, our facilities and systems may be vulnerable to cyber-attacks, security breaches, acts of vandalism, computer viruses, misplaced or lost data, programming and / or human errors, or other similar events.
Information security risks for financial institutions like us have increased recently in part because of new technologies, the use of the Internet and telecommunications technologies (including mobile devices) to conduct financial and other business transactions and the increased sophistication and activities of organized crime, perpetrators of fraud, hackers, terrorists and others. In addition to cyber-attacks or other security breaches involving the theft of sensitive and confidential information, hackers recently have engaged in attacks against large financial institutions, particularly denial of service attacks, designed to disrupt key business services such as customer-facing web sites. We may not be able to anticipate or implement effective preventive measures against all security breaches of these types. Although we employ detection and response mechanisms designed to contain and mitigate security incidents, early detection may be thwarted by sophisticated attacks and malware designed to avoid detection.
We also face risks related to cyber-attacks and other security breaches in connection with credit card transactions that typically involve the transmission of sensitive information regarding our customers through various third parties. Some of these parties have in the past been the target of security breaches and cyber-attacks, and because the transactions involve third parties and environments that we do not control or secure, future security breaches or cyber-attacks affecting any of these third parties could impact us through no fault of our own, and in some cases we may have exposure and suffer losses for breaches or attacks relating to them. We also rely on numerous other third party service providers to conduct other aspects of our business operations and face similar risks relating to them. We cannot be sure that their information security protocols are sufficient to withstand a cyber-attack or other security breach.
Any cyber-attack or other security breach involving the misappropriation, loss or other unauthorized disclosure of confidential customer information could severely damage our reputation, erode confidence in the security of our systems, products and services, expose us to the risk of litigation and liability, disrupt our operations and have a material adverse effect on our business.
Our information systems may experience an interruption or breach in security.
We rely heavily on communications and information systems to conduct our business. Any failure, interruption, or breach in security or operational integrity of these systems could result in failures or disruptions in our customer relationship management, general ledger, deposit, loan, and other systems. While we have policies and procedures designed to prevent or limit the effect of the failure, interruption, or security breach of our information systems, we cannot completely ensure that any such failures, interruptions, or security breaches will not occur or, if they do occur, that they will be adequately addressed. The occurrence of any failures, interruptions, or security breaches of our information systems could damage our reputation, result in
a loss of customer business, subject us to additional regulatory scrutiny, or expose us to civil litigation and possible financial liability, any of which could have a material adverse effect on our financial condition and results of operations.
We are dependent upon third parties for certain information system, data management and processing services and to provide key components of our business infrastructure.
We outsource certain information system and data management and processing functions to third party providers. These third party service providers are sources of operational and informational security risk to us, including risks associated with operational errors, information system interruptions or breaches, and unauthorized disclosures of sensitive or confidential client or customer information. If third party service providers encounter any of these issues, or if we have difficulty communicating with them, we could be exposed to disruption of operations, loss of service or connectivity to customers, reputational damage, and litigation risk that could have a material adverse effect on our results of operations or our business.
Third party vendors provide key components of our business infrastructure such as internet connections, network access and core application processing.
While we have selected these third party vendors carefully, we do not control their actions. Any problems caused by these third parties, including as a result of their not providing us their services for any reason or their performing their services poorly,
could adversely affect our ability to deliver products and services to our customers and otherwise to conduct our business. Replacing these third party vendors could also entail significant delay and expense.
Risks Relating to Expansion of Our Businesses by Acquisition
Any acquisitions of banks, bank branches, or loans or other financial service assets pose risks to us.
We may acquire other banks, bank branches and other financial-service-related businesses and assets in the future. Acquiring other banks, businesses, or branches involves various risks commonly associated with acquisitions, including, among other things:
•potential exposure to unknown or contingent liabilities of the acquired assets, operations or company;
•exposure to potential asset quality issues of the acquired assets, operations or company;
•environmental liability with acquired real estate collateral or other real estate;
•difficulty and expense of integrating the operations, systems and personnel of the acquired assets, operations or company;
•potential disruption to our ongoing business, including diversion of our management’s time and attention;
•the possible loss of key employees and customers of the acquired operations or company;
•difficulty in estimating the value of the acquired assets, operations or company; and
•potential changes in banking or tax laws or regulations that may affect the acquired assets, operations or company.
We may not be successful in overcoming these risks or any other problems encountered in connection with mergers or acquisitions.
Acquisitions typically involve the payment of a premium over book and market values, and, therefore, some dilution of the Company’s tangible book value per common share or net income per common share (or both) may occur in connection with any future transaction.
We may incur substantial costs to expand by acquisition, and such acquisitions may not result in the levels of profits we seek.
Integration efforts for any future acquisitions may not be successful and following any future acquisition, after giving it effect, we may not achieve financial results comparable to or better than our historical experience.
Risks Related to Our Common Stock
Our common stock price may fluctuate significantly, and this may make it difficult for you to resell our common stock at times or at prices acceptable to you.
Our common stock price constantly changes in response to a variety of factors (some of which are beyond our control), and we expect that our stock price will continue to fluctuate in the future. Factors impacting the price of our common stock include, among others:
•actual or anticipated variations in our quarterly results of operations;
•recommendations or research reports about us or the financial services industry in general published by securities analysts;
•the failure of securities analysts to cover, or continue to cover, us;
•operating and stock price performance of other companies that investors believe are comparable to us;
•news reports relating to trends, concerns and other issues in the financial services industry;
•perceptions in the marketplace regarding us, or our reputation, competitors or other financial institutions;
•actual or anticipated sales of our equity or equity-related securities;
•our past and future dividend practice;
•departure of our management team or other key personnel;
•new technology used, or services offered, by competitors;
•significant acquisitions or business combinations, strategic partnerships, joint ventures or capital commitments by or involving us or our competitors;
•failure to integrate acquisitions or realize anticipated benefits from acquisitions;
•existing or increased regulatory and compliance requirements, changes or proposed changes in laws or regulations, or differing interpretations thereof affecting our business, or enforcement of these laws and regulations; and
•litigation and governmental investigations.
General market fluctuations, industry factors and general economic and political conditions and events (including the effects of the COVID-19 pandemic, otherelevated inflation, interest rate changes, credit loss trends, or economic slowdowns or recessions, interest rate changes or credit loss trends)recessions) could also cause our stock price to decrease regardless of operating results.
Item 1B. Unresolved Staff Comments.
None.
Item 1C. Cybersecurity.
Risk Management and Strategy
Our enterprise risk management program is designed to identify, assess, and mitigate risks across various aspects of our company, including financial, operational, regulatory, reputational, and legal. Cybersecurity is a critical component of this program, given the increasing reliance on technology and potential of cyber threats. Our processes and policies related to cybersecurity are focused on: (i) developing organizational understanding to manage cybersecurity risks, (ii) applying safeguards to protect our systems, (iii) detecting the occurrence of a cybersecurity incident, (iv) responding to a cybersecurity incident, and (v) recovering from a cybersecurity incident. Where appropriate, these processes and policies are integrated into our overall enterprise risk management systems and processes. For example, all of our employees with network access are required to complete information security and privacy training on an annual basis. We are continuously working to improve our information technology systems and provide employee awareness training around phishing, malware, and other cyber risks to enhance our levels of protection.
Other aspects of our cyber and information security risk management program include:
•Monitoring external and internal threats and events, managing access, facilitating use of appropriate authentication options, validating controls and programs by internal teams and independent third parties and testing various compromise scenarios that are overseen by our information security team;
•Investing in threat intelligence platforms and participating in financial services industry and government forums which track and report on cyber and other information security threats;
•Identifying those third-party relationships that have the greatest potential to expose the Company to cybersecurity threats and, upon identification, conducting additional due diligence as a part of establishing those relationships;
•Routinely performing vulnerability tests;
•Engaging independent consultants and other third-parties to assist the Company in establishing and improving its policies; and
•Conducting “tabletop” exercises with outside consultants at least annually to test the Company’s processes and policies and using feedback from those exercises to further improve our processes.
The Company also maintains insurance coverage for cybersecurity incidents as part of its overall insurance portfolio.
In the event of a cybersecurity incident, the Company maintains incident response plans to investigate, classify, respond to, and manage cybersecurity incidents that may compromise the availability or integrity of our information systems, network resources, or data. In accordance with the incident response plans, cross-functional management teams assess and assign a threat level to each cybersecurity incident. A cybersecurity incident (or incidents, if aggregated together) assigned a critical threat level is escalated to a committee consisting of the Company’s executive and certain other officers (for such purpose, the “Critical Threat Committee”) for review.
The Company has not experienced any cybersecurity threats, including as a result of any previous cybersecurity incidents, that have materially affected the Company, including its business strategy, results of operations, or financial condition. However, cybersecurity attacks and other threats to the systems, networks, products and services of the Company, its customers and vendors, and other third parties could materially affect the Company in the future. See Item 1A. Risk Factors – Unauthorized disclosure of sensitive or confidential client or customer information, whether through a cyber-attack, other breach of our computer systems or otherwise, could harm our business.
Governance
In exercising oversight over the Company’s information technology risks, including its cyber and information security program, our Board of Directors has established a Technology Committee that is led by the Company’s Chief Digital and Information Officer (“CDIO”) and is comprised of directors with technology industry backgrounds, all of the Company’s executive officers, the Company’s Information Security Officer (“ISO”) and the Company’s Chief Risk Officer. The Technology Committee
receives materials on a quarterly basis to address the identification and status of information technology cybersecurity risks. Each year, the full Board of Directors also receives a comprehensive update on the Company’s cyber and information security program.
Our CDIO leads the Company’s digital optimization and information technology initiatives. He is also responsible for driving the strategy, execution and integration of all banking and nonbanking technology, information and digital initiatives in alignment with the Company’s corporate business strategy. Our CDIO assumed his current role in January, 2022. Prior to that, he served as the Company’s Senior Vice President of Technology and Operations, where he lead the Company’s core processing and operations functions, and the development of technology-driven products and services. Our CDIO has over 20 years of technology and operations experience in the banking industry.
Our ISO oversees a team of employees dedicated to the prevention, detection, mitigation, and remediation of cybersecurity incidents. He joined the Company in September, 2022 with more than 20 years of technology and information security experience in banking and as a consultant, and holds a Certified Information Security Manager certification.
The Company’s Critical Threat Committee is responsible for evaluating the materiality of a cybersecurity incident based on criteria that has been reviewed with the Board of Directors, and for determining whether there are disclosure obligations under applicable securities laws. In the event that the Critical Threat Committee determines that a critical cybersecurity incident (or incidents, if aggregated together) is deemed to be material, the Critical Threat Committee will brief the Board of Directors and oversee the disclosure process. For all critical cybersecurity incidents that are not deemed to be material, the Critical Threat Committee will notify the Company’s Chairman and Chief Executive Officer to determine whether the Board of Directors will be notified of the critical incident during the next regularly-scheduled cybersecurity update to the Audit Committee, or sooner as circumstances warrant.
Item 2. Properties.
The Company’s executive offices are located in the main office building of the Bank at 711 Main Street, Jasper, Indiana. The main office building, which is owned by the Bank and also serves as the main office of the Company’s other subsidiaries, contains approximately 23,600 square feet of office space. The Bank and the Company’s other subsidiaries also conduct their operations from 50 other locations in Southern Indiana and 2927 in Kentucky. Of the 8077 total locations, 6259 are owned by the Company and 18 are leased from third parties.
Item 3. Legal Proceedings.
In July 2020, the Company was named in a putative class action lawsuit filed in Marion County, Indiana Superior Court challenging the Company’s checking account practices associated with its assessment of overdraft fees for certain debit card transactions. The relief sought by the plaintiff includes restitution, other monetary damages, and injunctive and declaratory relief. The plaintiff also seeks to have the case certified by the Court as a class action on behalf all citizens of Indiana who are checking account holders at German American Bank and who were assessed overdraft fees on certain debit card transactions. The Company believes the plaintiff’s claims are unfounded and has vehemently defended against them, including by filing a motion to dismiss the plaintiff’s amended complaint. On August 25, 2021, while the Company’s motion to dismiss remained pending, the parties participated in a mediation conference. The mediation conference resulted in a settlement in principle, subject to execution of a definitive settlement agreement which would be subject to the Court’s approval. On October 21, 2021, the Company executed a Settlement Agreement and Release, pursuant to which the Company would pay the amount of $3,050,000 in full and complete settlement of plaintiff’s putative class action. The Settlement Agreement and Release has not yet been submitted to and remains subject to the Court’s approval.
There are no other pending legal proceedings, other than routine litigation incidental to the business of the Company’s subsidiaries, to which the Company or any of its subsidiaries is a party or of which any of their property is the subject.
Item 4. Mine Safety Disclosures.
Not applicable.
PART II
Item 5. Market for Registrant’s Common Equity, Related Stockholder Matters and Issuer Purchases of Equity Securities.
Market for Common Stock
German American Bancorp, Inc.’s stock is traded on the Nasdaq Global Select Market under the symbol GABC.
The Common Stock was held of record by approximately 3,2083,058 shareholders at February 23, 2022.20, 2024.
| | | | | | | | | | | | | | |
| Transfer Agent: | Computershare
Priority Processing
462 South 4th Street150 Royall St., Suite 101
Louisville, KY 40202-3467
Contact: Shareholder RelationsCanton, MA 02021
(800) 884-4225 | | Shareholder
Information and
Corporate Office: | Terri A. Eckerle
German American Bancorp, Inc.
P.O. Box 810
Jasper, Indiana 47547-0810
(812) 482-1314
(800) 482-1314 |
Stock Performance Graph
The following graph compares the Company’s five-year cumulative total returns with those of the Russell 2000 Stock Index, Russell Microcap Stock Index, and the Indiana Bank Peer Group. The Indiana Bank Peer Group (which is a custom peer group identified by Company management) includes all Indiana-based commercial bank holding companies (excluding companies owning thrift institutions that are not regulated as bank holding companies) that have been in existence as commercial bank holding companies throughout the five-year period ended December 31, 2021,2023, the stocks of which have been traded on an established securities market (NYSE, NYSE American or Nasdaq) throughout that five-year period. The companies comprising the Indiana Bank Peer Group for purposes of the December 20212023 comparison were: 1st Source Corp., First Financial Corp., First Merchants Corp., Lakeland Financial Corp., Old National Bancorp, Horizon Bancorp, First Internet Bancorp, and First Savings Financial Corp., and First Capital, Inc. The returns of each company in the Indiana Bank Peer Group have been weighted to reflect the company’s market capitalization. The Russell 2000 Stock Index, which is designed to measure the performance of the small-cap segment of the U.S. equity universe, is a subset of the Russell 3000 Index (which measures the performance of the largest 3,000 U.S. companies) that includes approximately 2,000 of the smallest securities in that index based on a combination of their market cap and current index membership, and is annually reconstituted at the end of each June. The Russell Microcap Stock Index is an index representing the smallest 1,000 securities in the small-cap Russell 2000 Index plus the next 1,000 securities, which is also annually reconstituted at the end of each June. The Company’s stock is currently included in the Russell 2000 Index and Russell Microcap Index.
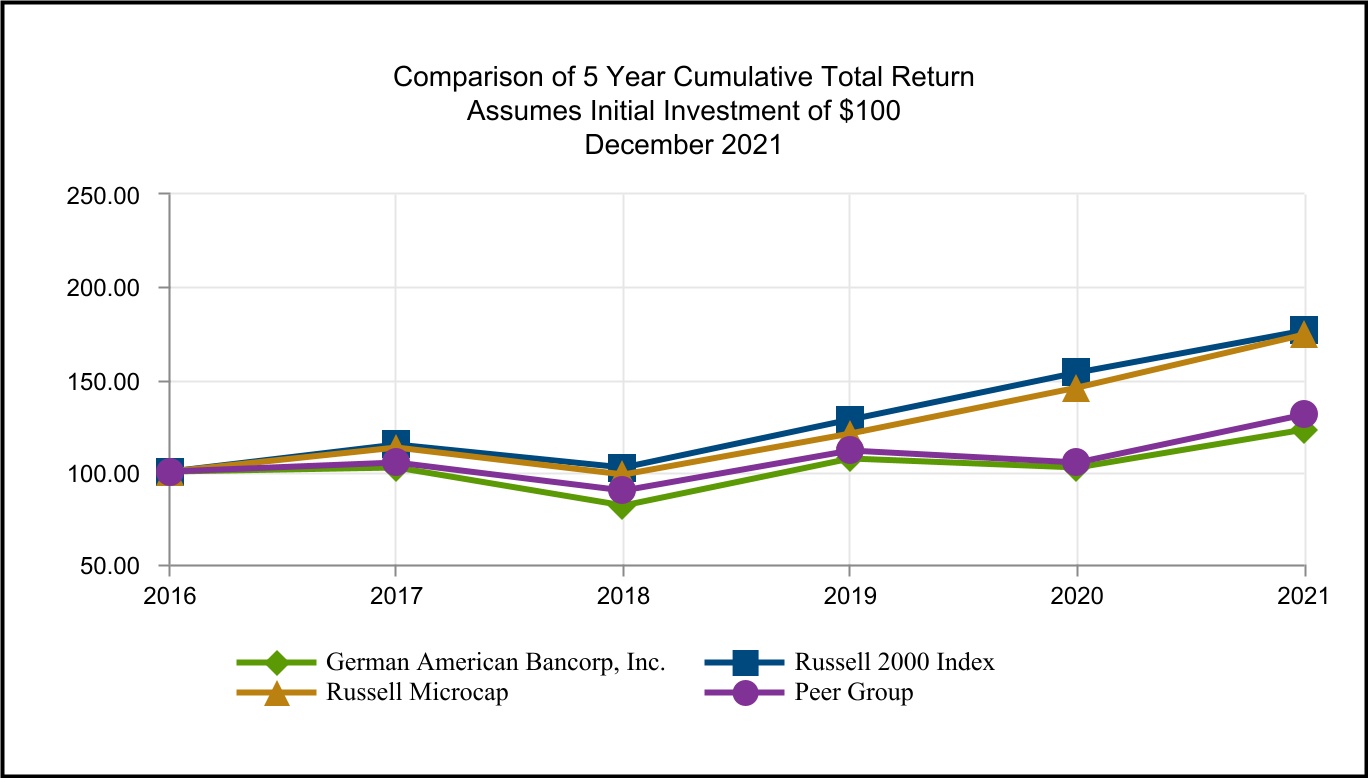

Stock Repurchase Program Information
The following table sets forth information regarding the Company’s purchases of its common shares during each of the three months ended December 31, 2021.2023.
| | | | | | | | | | | | | | | | | | | | | | | | | | |
| Period | | Total Number of Shares
(or Units) Purchased | | Average Price Paid Per Share (or Unit) | | Total Number of Shares (or Units) Purchased as Part of Publicly Announced Plans or Programs (1) | | Maximum Number (or Approximate Dollar Value) of Shares (or Units) that May Yet Be Purchased Under the Plans or Programs (1) |
October 20212023 | | — | | | $ | — | | | — | | | 1,000,000 | |
November 20212023 | | — | | | — | | | — | | | 1,000,000 | |
December 20212023 | | — | | | — | | | — | | | 1,000,000 | |
| Totals | | — | | | $ | — | | | — | | | |
(1) On January 25, 2021, the Company's Board of Directors approved a stock repurchase program for up to 1.0 million of its outstanding common shares. The Company did not repurchase any shares of common stock under the repurchase plan during the quarter ended December 31, 2021.
On January 31, 2022, the Company’s Board of Directors terminated the 2021 repurchase program and approved a new plan to repurchase up to 1.0 million shares of the Company’s outstanding common stock. On a share basis, the amount of common stock subject to the new repurchase plan represented approximately 3% of the Company’s outstanding shares on the date it was approved, which was inclusive of the approximately 2.9 million shares issued in conjunction with the CUB acquisition.approved. The Company is not obligated to purchase any shares under the plan, and the plan may be discontinued at any time. The actual timing, number and share price of shares purchased under the repurchase plan will be determined by the Company at its discretion and will depend upon such factors as the market price of the stock, general market and economic conditions and applicable legal requirements. The Company has not repurchased any shares of common stock under the 2022this repurchase plan.
Equity Compensation Plan Information
The Company maintains three equity incentive plans under which it hasSee Item 12 of Part III of this Report for information regarding securities authorized the issuance of its Common Shares to employees and non-employee directors as compensation: its 2009 Long-Term Equity Incentive Plan (under which no new grants may be made), its 2019 Long-Term Equity Incentive Plan (the “2019 LTI Plan”) and its 2019 Employee Stock Purchase Plan (the “2019 ESPP”). Each of these plans was approved by the requisite vote of the Company’s common shareholders in the year of adoption by the Board of Directors. The Company is not a party to any individual compensation arrangement involving the authorization for issuance of itsunder equity securities to any single person, other than option agreements and restricted stock award agreements that have been granted under the terms of one of the three plans identified above. The following table sets forth information regarding these plans as of December 31, 2021:
| | | | | | | | | | | | | | | | | | | | | | | |
Plan Category | | Number of Securities
to be Issued upon Exercise
of Outstanding Options, Warrants or Rights | | Weighted Average
Exercise Price of
Outstanding Options, Warrants and Rights | | Number of Securities
Remaining Available for
Future Issuance under
Equity Compensation
Plans (Excluding
Securities Reflected in First Column) | |
| | | | | | | |
Equity compensation plans approved by security holders | | — | | (a) | $ | — | | (a) | 1,630,772 | | (b) |
Equity compensation plans not approved by security holders | | — | | | — | | | — | | |
Total | | — | | | $ | — | | | 1,630,772 | | |
(a)On December 31, 2021, participants under the 2019 ESPP exercised options to purchase 5,615 Common Shares at the purchase price of $40.46 per share. The Company settled the option exercises in January 2022 with shares purchased on the open market.
(b)Represents 750,000 shares at December 31, 2021 that the Company may in the future issue to employees under the 2019 ESPP (although the Company typically purchases the shares needed for sale to participating employees on the open market rather than issuing new issue shares to such employees) and 880,772 shares that were available for grant or issuance at December 31, 2021 under the 2019 LTI Plan. As stated in note (a) above, the Company settled certain option exercises in January 2022 with shares purchased on the open market. The issuance of such reacquired shares will result in a 5,615 share reduction in the amount remaining available for future issuance.
For additional information regarding the Company’s equity incentive plans and employee stock purchase plan, see Note 8 (Shareholders’ Equity) of the Notes to the Consolidated Financial Statements included in Item 8 of this Report.compensation plans.
Item 6. [Reserved]
Item 7. Management’s Discussion and Analysis of Financial Condition and Results of Operations.
INTRODUCTION
German American Bancorp, Inc. is a Nasdaq-traded (symbol: GABC) financial holding company based in Jasper, Indiana. German American, through its banking subsidiary German American Bank, operates 7776 banking offices in 1920 contiguous southern Indiana counties and 14 counties in Kentucky. The Company also owns an investment brokerage subsidiary (German American Investment Services, Inc.) and a full line property and casualty insurance agency (German American Insurance, Inc.).
Throughout this Management’s Discussion and Analysis, as elsewhere in this Report, when we use the term “Company”, we will usually be referring to the business and affairs (financial and otherwise) of the Company and its subsidiaries and affiliates as a whole. Occasionally, we will refer to the term “parent company” or “holding company” when we mean to refer to only German American Bancorp, Inc., and the term “Bank” when we mean to refer to only the Company’s bank subsidiary.
This Management’s Discussion and Analysis includes an analysis of the major components of the Company’s operations for the years 20192021 through 20212023 and its financial condition as of December 31, 20202022 and 2021.2023. This information should be read in conjunction with the accompanying consolidated financial statements and footnotes contained elsewhere in this Report and with the description of business included in Item 1 of this Report (including the cautionary disclosure regarding “Forward Looking Statements and Associated Risks”). Financial and other information by segment is included in Note 16 (Segment Information) of the Notes to the Consolidated Financial Statements included in Item 8 of this Report and is incorporated into this Item 7 by reference.
The statements of management’s expectations and goals concerning the Company’s future operations and performance that are set forth in the following Management Overview and in other sections of this Item 7 are forward-looking statements, and readers are cautioned that these forward-looking statements are based on assumptions and are subject to risks, uncertainties, and other factors. Actual results may differ materially from the expectations of the Company that is expressed or implied by any forward-looking statement. This Item 7, as well as the discussions in Item 1 (“Business”) entitled “Forward-Looking Statements and Associated Risks” and in Item 1A (“Risk Factors”) (which discussions are incorporated in this Item 7 by reference) list some of the factors that could cause the Company’s actual results to vary materially from those expressed or implied by any such forward-looking statements.
Any statements of management’s expectations and goals concerning the Company’s future operations and performance, and future financial condition, liquidity and capital resources that are set forth in the following Management Overview and in other sections of this Item 7 are forward-looking statements, and readers are cautioned that these forward-looking statements are based on assumptions and are subject to risks, uncertainties, and other factors. Actual results may differ materially from the expectations of the Company that is expressed or implied by any forward-looking statement. This Item 7, as well as the discussions in Item 1 (“Business”) entitled “Forward-Looking Statements and Associated Risks” and in Item 1A (“Risk Factors”) (which discussions are incorporated in this Item 7 by reference) list some of the factors that could cause the Company’s actual results to vary materially from those expressed or implied by any such forward-looking statements.
MANAGEMENT OVERVIEW
Net income for the year ended December 31, 2021 totaled $84,137,000, or $3.17 per share, an increase of $21,927,000, or approximately 35% on a per share basis, from the year ended December 31, 2020 net income of $62,210,000, or $2.34 per share. The net income growth during 2021 compared with 2020 was driven by a number of factors including improved net interest income, lower provision for credit losses and increased non-interest revenue which was partially offset by a modestly higher level of non-interest expense. Net income for the year ended December 31, 2020 totaled $62,210,000, or $2.34 per share, an increase of $2,988,000, or approximately 2% on a per share basis, from the year ended December 31, 2019 net income of $59,222,000, or $2.29 per share.
As previously disclosed, in March 2021, the Company commenced an operating optimization plan, pursuant to which its banking subsidiary, German American Bank, would consolidate seven branch offices and implement various staff reductions during 2021. In making its decision to consolidate these branches, which were generally integrated with other nearby bank branches, the Company considered, among other factors, the operating costs of the branches, certain physical limitations impacting the bank facilities, and their proximity to other branch locations. In addition, the Company’s evaluation of the branch
consolidations and the reductions in staff also took into consideration the numbers and types of transactions being conducted by its customers and the increased usage of online and mobile banking. Also as part of the operating optimization plan, in September 2021, German American Bank sold its two branches located in Lexington, Kentucky to The Home Savings and Loan Company of Kenton, Ohio (“HSLC”). HSLC assumed approximately $17.6 million in total deposits and purchased approximately $17.8 million in total loans as part of the sale.
On January 1, 2022, the Company completed the acquisition of Citizens Union Bancorp of Shelbyville, Inc. (“CUB”) through the merger of CUB with and into the Company. Immediately following completion of the CUB holding company merger, CUB'sCUB’s subsidiary bank, Citizen Union Bank of Shelbyville, Inc., was merged with and into the Company’s subsidiary bank, German American Bank. CUB, headquartered in Shelbyville, Kentucky, operated 15 retail banking offices located in Shelby, Jefferson, Spencer, Bullitt, Oldham, Owen, Gallatin and Hardin counties in Kentucky through Citizens Union Bank of Shelbyville, Inc. in Kentucky. As of the closing of the transaction, CUB had total assets of approximately $1.109 billion, total loans of approximately $683.8 million, and total deposits of approximately $930.5 million. The Company issued approximately 2.9 million shares of its common stock, and paid approximately $50.8 million in cash, in exchange for all of the issued and outstanding shares of common stock of CUB.
For further information regarding this merger and acquisition transaction, see Note 20 (Subsequent Events)18 (Business Combinations, Goodwill and Intangible Assets) in the Notes to the Consolidated Financial Statements included in Item 8 of this Report.
On July 1, 2019, the Company completed the acquisition of Citizens First Corporation (“Citizens First”) through the merger of Citizens First with and into the Company. Immediately following completion of the Citizens First holding company merger, Citizens First's subsidiary bank, Citizen First Bank, Inc., was merged with and into the Company’s subsidiary bank, German American Bank. Citizens First, headquartered in Bowling Green, Kentucky operated eight retail banking offices through Citizens First Bank, Inc. in Barren, Hart, Simpson and Warren Counties in Kentucky. As of the closing of the transaction, Citizens First had total assets of approximately $456.0 million, total loans of approximately $364.6 million, and total deposits of approximately $370.8 million. The Company issued approximately 1.7 million shares of its common stock, and paid approximately $15.5 million in cash, in exchange for all of the issued and outstanding shares of common stock of Citizens First.
For further information regarding this merger and acquisition transaction, see Note 18 (Business Combinations) in the Notes to the Consolidated Financial Statements included in Item 8 of this Report.
COVID-19 PANDEMIC BUSINESS UPDATE
The novel coronavirus disease 2019 (COVID-19) pandemic continued to impact our operations during 2021. While uncertainty remains as to the future effects of the pandemic, an improving business climate, supported by unprecedented fiscal stimulus, an accommodative Federal Reserve, and modest increases in COVID-19 vaccination rates, has helped to mitigate the negative impacts of the pandemic on our financial condition and results of operations, despite the challenges presented by very low interest rates, muted loan growth, and excess liquidity.
CARES Act and the Paycheck Protection Program
As previously disclosed, the Coronavirus Aid, Relief and Economic Security Act (the “CARES Act”) was signed into law in March 2020, providing an approximately $2 trillion stimulus package that included direct payments to individual taxpayers, economic stimulus to significantly impacted industry sectors, emergency funding for hospitals and providers, small business loans, increased unemployment benefits, and a variety of tax incentives. For small businesses, eligible nonprofits and certain others, the CARES Act established a Paycheck Protection Program (“PPP”), a lending program administered by the Small Business Administration (“SBA”) that is intended to incentivize participants to retain their employees by providing them with loans that are fully guaranteed by the U.S. government and subject to forgiveness if program guidelines are met. The PPP was later extended and modified by the Paycheck Protection Program and Health Care Enhancement Act in April 2020 and the Paycheck Protection Program Flexibility Act in June 2020, with PPP funding under this initial round expiring on August 8, 2020.
In December 2020, the Economic Aid to Hard-Hit Small Businesses, Nonprofits, and Venues Act was signed into law as part of the Consolidated Appropriations Act, 2021 (the “CAA”). In addition to direct stimulus payments and other aid, this Act provided for a second round of PPP loans through March 31, 2021. Under the American Rescue Plan Act of 2021 and the PPP Extension Act of 2021, which were both enacted during March 2021, additional funds were provided for the program and the deadline for applying for PPP loans was extended through May 31, 2021 (with the SBA having been given until June 30, 2021 to process loan applications).
The Company actively participated in both rounds ofFinancial Overview
Net income for the PPP, lending funds primarily to its existing loan and/or deposit customers. The PPP loans carry an interest rate of 1.00% and included a processing fee that varied depending on the balance of the loan at origination (which fee is recognized over the life of the loan). The vast majority of the Company’s PPP loans made during 2020 had two-year maturities, while PPP loans made during 2021 have five-year maturities.
Under the first round of the PPP (i.e., the 2020 round), the Company originated loans totaling approximately $351.3 million in principal amount, with approximately $12.0 million of related net processing fees on 3,070 PPP loan relationships. As ofyear ended December 31, 2021, $349.2 million2023 totaled $85,888,000, or $2.91 per share, an increase of those first round PPP loans had been forgiven by$4,063,000, or approximately 5% on a per share basis, from the SBA and repaid to the Company pursuant to the termsyear ended December 31, 2022 net income of the program$81,825,000, or repaid by customers, with approximately $12.0 million$2.78 per share. The increase in net processing fees having been recognizedincome during 2023, compared with 2022, was primarily attributable to increased non-interest income, a decline in non-interest expenses (which was driven by the Company.
Under the second round of the PPP (i.e., the 2021 round), the Company originated loans totaling approximately $157.0 millionhigher expenses in principal amount, with approximately $9.0 million of related net processing fees, on 2,601 PPP loan relationships. As of December 31, 2021, $138.8 million of second round PPP loans had been forgiven by the SBA and repaid to the Company, with $8.1 million in net processing fees having been recognized by the Company. As2022 as a result of the forgivenessJanuary 1, 2022 acquisition of CUB), and a lower provision for credit losses. The positive impact of those items was partially offset by a decline in net interest income resulting primarily from a reduced level of earning assets, which was somewhat mitigated by an improved net interest margin.
Net income for the first and second round PPP loans, $20.3 millionyear ended December 31, 2022 totaled $81,825,000, or $2.78 per share, a decline of total PPP loans remain outstanding as of$2,312,000, or approximately 12% on a per share basis, from the year ended December 31, 2021 net income of $84,137,000, or $3.17 per share. The change in net income during 2022, compared with 2021, was largely impacted by acquisition-related expenses for the CUB transaction that closed on January 1, 2022. The 2022 results of operations included acquisition-related expenses of $12,323,000 ($9,372,000 or $0.32 per share, on an after tax basis) and also included Day 1 provision for credit losses under the CECL model of $6,300,000 ($4,725,000 or $1.16 per share, on an after tax basis). The decline in per share net income for the year ended December 31, 2022, as compared to 2021, was also impacted by the Company’s January 1, 2022 issuance of approximately $0.92.9 million shares of net fees remaining deferred on that date.common stock as part of the merger consideration in the CUB transaction.
CRITICAL ACCOUNTING POLICIES AND ESTIMATES
The financial condition and results of operations for the Company presented in the Consolidated Financial Statements, accompanying Notes to the Consolidated Financial Statements, and selected financial data appearing elsewhere within this Report, are, to a large degree, dependent upon the Company’s accounting policies. The selection of and application of these policies involve estimates, judgments, and uncertainties that are subject to change. The critical accounting policies and estimates that the Company has determined to be the most susceptible to change in the near term relate to the determination of the allowance for credit losses, the valuation of securities available for sale, income tax expense, and the valuation of goodwill and other intangible assets.
Allowance for Credit LossesALLOWANCE FOR CREDIT LOSSES
The Company maintains an allowance for credit losses to cover the estimated expected credit losses over the expected contractual life of the loan portfolio. Loan losses are charged against the allowance when management believes the uncollectibility of a loan balance is confirmed. Subsequent recoveries, if any, are credited to the allowance. Allocations of the allowance may be made for specific loans, but the entire allowance is available for any loan that, in management’s judgment, should be charged-off. A provision for credit losses is charged to operations based on management’s periodic evaluation of the necessary allowance balance. Evaluations are conducted at least quarterly and more often if deemed necessary. The ultimate recovery of all loans is susceptible to future market factors beyond the Company’s control.
The Company has an established process to determine the adequacy of the allowance for credit losses. The determination of the allowance is inherently subjective, as it requires significant estimates, including the amounts and timing of expected future cash flows on individually analyzed loans, estimated losses on other classified loans and pools of homogeneous loans, and consideration of past loan loss experience, the nature and volume of the portfolio, information about specific borrower situations and estimated collateral values, economic conditions, reasonable and supportable forecasts and other factors, all of which may be susceptible to significant change. The allowance consists of two components of allocations, specific and general. These two components represent the total allowance for credit losses deemed adequate to cover expected credit losses over the expected life of the loan portfolio.
Commercial and agricultural loans are subject to a standardized grading process administered by an internal loan review function. The need for specific reserves is considered for credits when: (a) the customer’s cash flow or net worth appears insufficient to repay the loan; (b) the loan has been criticized in a regulatory examination; (c) the loan is on non-accrual; or (d) other reasons where the ultimate collectability of the loan is in question, or the loan characteristics require special monitoring.
Specific reserves on individually analyzed loans are determined by comparing the loan balance to the present value of expected cash flows or expected collateral proceeds. Allocations are also applied to categories of loans not individually analyzed but for which the rate of loss is expected to be greater than other similar type loans, including non-performing consumer or residential real estate loans. Such allocations are based on past loss experience, reasonable and supportable forecasts and information about specific borrower situations and estimated collateral values.
General allocations are made for commercial and agricultural loans that are graded as substandard and special mention, but are not individually analyzed for specific reserves as well as other pools of loans, including non-classified loans, homogeneous portfolios of consumer and residential real estate loans, and loans within certain industry categories believed to present unique risk of loss. General allocations of the allowance are primarily made based on historical averages for loan losses for these portfolios along with reasonable and supportable forecasts, judgmentally adjusted for economic, external and internal quantitative and qualitative factors and portfolio trends. Economic factors include evaluating changes in international, national, regional and local economic and business conditions that affect the collectability of the loan portfolio. Internal factors include evaluating changes in lending policies and procedures; changes in the nature and volume of the loan portfolio; and changes in experience, ability and depth of lending management and staff.
The allowance for credit losses for loans represents management’s estimate of all expected credit losses over the expected contractual life of the loan portfolio. Determining the appropriateness and adequacy of the allowance is complex and requires judgment by management about the effect of matters that are inherently uncertain. Subsequent evaluations of the loan portfolio may result in significant changes in the allowance for credit losses in future periods.
Securities ValuationThe Company uses a number of economic variables in its scenarios to estimate the allowance for credit losses, with the most significant drivers being unemployment rate forecast, gross domestic product and agricultural producer price index as well as qualitative adjustments. Historical loss rates from periods where the average unemployment rate, gross domestic product and agricultural producer pricing index matches the forecast range are considered when calculating the forecast period loss rate. The impact of the changes in the unemployment and gross domestic product forecast range between December 31, 2023, and December 31, 2022, resulted in a decrease in the allowance for credit losses of approximately $400,000.
Based on sensitivity analysis of all portfolios, a 0.050% change (slight improvement or decline on the Company’s scale) in all ten qualitative risk factors would have a $1,900,000 impact on the reserve allocation. The sensitivity and related range of impact is a hypothetical analysis and is not intended to represent management’s judgements or assumptions of qualitative loss factors that were utilized at December 31, 2023 in estimation of the allowance for credit losses on loans recognized on the Consolidated Balance Sheets.
SECURITIES VALUATION
Available-for-sale debt securities in unrealized loss positions are evaluated for impairment related to credit losses at least quarterly. For available-for-sale debt securities in an unrealized loss position, the Company assesses whether we intend to sell, or it is more likely than not that we will be required to sell the security before recovery of its amortized cost basis. If either of the criteria regarding intent or requirement to sell is met, the security’s amortized cost basis is written down to fair value through income. For available-for sale debt securities that do not meet the criteria, the Company evaluates whether the decline in fair value has resulted from credit losses or other factors. In making this assessment, management considers the extent to which fair value is less than amortized cost, any changes to the rating of the security by a rating agency, and adverse conditions specifically related to the security and the issuer, among other factors. If this assessment indicates that a credit loss exists, the Company compares the present value of cash flows expected to be collected from the security with the amortized cost basis of the security. If the present value of cash flows expected to be collected is less than the amortized cost basis for the security, a credit loss exists and an allowance for credit losses is recorded, limited to the amount that the fair value of the security is less than its amortized cost basis. Any impairment that has not been recorded through an allowance for credit losses is recognized in other comprehensive income, net of applicable taxes. No allowance for credit losses for available-for-sale debt securities was needed at December 31, 2021.2023. Accrued interest receivable on available-for-sale debt securities is excluded from the estimate of credit losses. As of December 31, 2021,2023, gross unrealized gains on the securities available-for-sale portfolio totaled approximately $36,068,000$1,337,000 and gross unrealized losses totaled approximately $15,649,000$275,765,000. The net amount of these two items, net of applicable taxes, is included in other comprehensive income.income (loss).
Equity securities that do not have readily determinable fair values are carried at cost, less impairment with observable price changes being recognized in earnings.
Income Tax ExpenseINCOME TAX EXPENSE
Income tax expense involves estimates related to the valuation allowance on deferred tax assets and loss contingencies related to exposure from tax examinations presumed to occur.
A valuation allowance reduces deferred tax assets to the amount management believes is more likely than not to be realized. In evaluating the realization of deferred tax assets, management considers the likelihood that sufficient taxable income of appropriate character will be generated within carry-back and carry-forward periods, including consideration of available tax
planning strategies. Tax-related loss contingencies, including assessments arising from tax examinations and tax strategies, are recorded as liabilities when the likelihood of loss is probable and an amount or range of loss can be reasonably estimated. In considering the likelihood of loss, management considers the nature of the contingency, the progress of any examination or related protest or appeal, the views of legal counsel and other advisors, experience of the Company or other enterprises in similar matters, if any, and management’s intended response to any assessment.
Goodwill and Other Intangible AssetsGOODWILL AND OTHER INTANGIBLE ASSETS
Goodwill resulting from business combinations represents the excess of the purchase price over the fair value of the net assets of businesses acquired. Goodwill resulting from business combinations is generally determined as the excess of the fair value of the consideration transferred, plus the fair value of any noncontrolling interests in the acquiree, over the fair value of the net assets acquired and liabilities assumed as of the acquisition date. Goodwill and intangible assets acquired in a purchase business combination and determined to have an indefinite useful life are not amortized, but tested for impairment at least annually. The
Company has selected December 31 as the date to perform the annual impairment test. Goodwill is the only intangible asset with an indefinite life on the Company’s balance sheet. No impairment to Goodwill was indicated based on year-end testing.
Intangible assets with definite useful lives are amortized over their estimated useful lives to their estimated residual values. Other intangible assets consist of core deposit and acquired customer relationship intangible assets. They are initially measured at fair value and then are amortized over their estimated useful lives, which range from 6 to 10 years.
RESULTS OF OPERATIONS
NET INCOME
Net income for the year ended December 31, 20212023 totaled $84,137,000,$85,888,000, or $3.17$2.91 per share, an increase of $21,927,000,$4,063,000, or approximately 35%5% on a per share basis, from the year ended December 31, 20202022 net income of $62,210,000,$81,825,000, or $2.34$2.78 per share. The increase in net income during 2023, compared with 2022, was primarily attributable to increased non-interest income, a decline in non-interest expenses (which was driven by higher expenses in 2022 as a result of the January 1, 2022 acquisition of CUB), and a lower provision for credit losses. The positive impact of those items was partially offset by a decline in net interest income resulting primarily from a reduced level of earning assets, which was somewhat mitigated by an improved net interest margin.
Net income for the year ended December 31, 20202022 totaled $62,210,000,$81,825,000, or $2.34$2.78 per share, an increasea decline of $2,988,000,$2,312,000, or approximately 2%12% on a per share basis, from the year ended December 31, 20192021 net income of $59,222,000,$84,137,000, or $2.29$3.17 per share. The change in net income during 2022, compared with 2021, was largely impacted by acquisition-related expenses for the CUB transaction that closed on January 1, 2022. The 2022 results of operations included acquisition-related expenses of $12,323,000 ($9,372,000 or $0.32 per share, on an after tax basis) and also included Day 1 provision for credit losses under the CECL model of $6,300,000 ($4,725,000 or $1.16 per share, on an after tax basis). The decline in per share net income for the year ended December 31, 2022, as compared to 2021, was also impacted by the Company’s January 1, 2022 issuance of approximately 2.9 million shares of common stock as part of the merger consideration in the CUB transaction.
NET INTEREST INCOME
Net interest income is the Company’s single largest source of earnings, and represents the difference between interest and fees realized on earning assets, less interest paid on deposits and borrowed funds. Several factors contribute to the determination of net interest income and net interest margin, including the volume and mix of earning assets, interest rates, and income taxes. Many factors affecting net interest income are subject to control by management policies and actions. Factors beyond the control of management include the general level of credit and deposit demand, Federal Reserve Board monetary policy, and changes in tax laws.
During the year ended December 31, 2021,2023, net interest income, on a non tax-equivalent basis, totaled $160,830,000, representing an increase$190,433,000, a decline of $5,587,000,$10,151,000, or 4%5%, fromcompared to the year ended December 31, 20202022 net interest income of $155,243,000.$200,584,000. The increasedecline in net interest income during 20212023 compared with 20202022 was largelyprimarily attributable to an increasea decline in average earning assets, driven by a higherreduced level of fees recognized related to PPP loansdeposits which were partiallywas somewhat offset by a lower level of accretion of loan discounts on acquired loans, and a decreased level ofan improved net interest expense on interest bearing liabilities related to lowermargin resulting from the rise in market interest rates.
During the year ended December 31, 2020,2022, net interest income totaled $155,243,000,$200,584,000, representing an increase of $10,018,000,$39,754,000, or 7%25%, from the year ended December 31, 20192021 net interest income of $145,225,000.$160,830,000. The increased level ofincrease in net interest income
during 20202022 compared with 20192021 was largelyprimarily attributable to a higher level of average earning assets, resulting fromdriven in large part by the CUB acquisition, and an expansion of Citizens First on July 1, 2019, significant deposit growth during 2020 and participationthe Company’s net interest margin. The increase in the PPP. In addition, the recognition of fees related to PPP loans also contributed to higher levels of net interest income but was partially mitigatedoffset by a lower level of accretion of discounts on acquired loans.Paycheck Protection Program (“PPP”) loan fee recognition.
The net interest margin represents tax-equivalent net interest income expressed as a percentage of average earning assets. The net interest margin for the year ended December 31, 20212023 was 3.31%3.58% compared to 3.63%3.45% in 20202022 and 3.92%3.31% in 2019. Historically low market interest rates impacted2021. The improvement in the Company'sCompany’s net interest margin during 2023 compared to 2022 of 13 basis points was primarily the result of a shift in both 2021 and 2020. Lowerthe earning assets from the securities portfolio to higher yielding loans, which was somewhat reduced by the increasing cost of deposits as a result of the higher market interest rates.
The improvement in the Company’s net interest margin during 2022 compared to 2021 was largely attributable to improved yields on earning assets driven by increased market rates, have negatively impacted earning asset yields during 2021 and 2020, with these declines beingwhich were partially mitigated by a loweran increase in the overall cost of funds. Also contributing tofunds of the lower net interest margin has been excess liquidity the Company has carried on the balance sheet that resulted from significant deposit growth during 2021 and 2020, PPP loan forgiveness and somewhat muted loan growth.Company.
The Company’s net interest margin infor all periods presented was impacted by the accretion of discounts on acquired loans. In 2022 and 2021, and 2020 has beenthe Company’s net interest margin was also impacted by fees recognized as a part of the PPP and impacted in all periods presented by the accretion of discounts on acquired loans.PPP. Fees recognized on PPP loans through net interest income totaled $873,000 during 2022 and $12,196,000 during 2021 and $7,978,000 during 2020.2021. The fees recognized related to the PPP contributed approximately 1 basis point to the net interest margin in 2022 and 24 basis points to the net interest margin in 2021 and 18 basis points in 2020.2021. Accretion of discounts on acquired loans contributed approximately 75 basis points to the net interest margin during 2021, 13in 2023 and 7 basis points during 2020both 2022 and 23 basis points in 2019.2021. Accretion of discounts on acquired loans totaled $2,814,000 during 2023, $4,341,000 during 2022, and $3,476,000 during 2021, $5,769,000 during 2020 and $8,559,000 during 2019.2021.
The following table summarizes net interest income (on a tax-equivalent basis) for each of the past three years. For tax-equivalent adjustments, an effective tax rate of 21% was used for all periods presented (1).
Average Balance Sheet
(Tax-equivalent basis, dollars in thousands)
| | Twelve Months Ended
December 31, 2021 | | Twelve Months Ended
December 31, 2020 | | Twelve Months Ended
December 31, 2019 |
| Principal
Balance | | Income /
Expense | | Yield /
Rate | | Principal
Balance | | Income /
Expense | | Yield /
Rate | | Principal
Balance | | Income /
Expense | | Yield /
Rate |
| | Twelve Months Ended
December 31, 2023 | | | | Twelve Months Ended
December 31, 2023 | | Twelve Months Ended
December 31, 2022 | | Twelve Months Ended
December 31, 2021 |
| | Principal
Balance | | | | Principal
Balance | | Income /
Expense | | Yield /
Rate | | Principal
Balance | | Income /
Expense | | Yield /
Rate | | Principal
Balance | | Income /
Expense | | Yield /
Rate |
| ASSETS | ASSETS | | | | | | | | | | | | | | | | | | |
| Federal Funds Sold and Other Short-term Investments | |
| Federal Funds Sold and Other Short-term Investments | |
| Federal Funds Sold and Other Short-term Investments | Federal Funds Sold and Other Short-term Investments | | $ | 390,362 | | | $ | 488 | | | 0.12 | % | | $ | 209,012 | | | $ | 382 | | | 0.18 | % | | $ | 27,166 | | | $ | 522 | | | 1.92 | % | | $ | 39,452 | | | $ | | $ | 1,677 | | | 4.25 | | 4.25 | % | | $ | 458,230 | | | $ | | $ | 5,765 | | | 1.26 | | 1.26 | % | | $ | 390,362 | | | $ | | $ | 488 | | | 0.12 | | 0.12 | % |
| | Securities: | Securities: | |
| Securities: | |
| Securities: | |
| Taxable | |
| Taxable | |
| Taxable | Taxable | | 824,204 | | | 12,962 | | | 1.57 | % | | 555,961 | | | 10,447 | | | 1.88 | % | | 546,191 | | | 13,910 | | | 2.55 | % | | 890,841 | | | 20,614 | | 20,614 | | | 2.31 | | 2.31 | % | | 1,015,958 | | | 20,453 | | 20,453 | | | 2.01 | | 2.01 | % | | 824,204 | | | 12,962 | | 12,962 | | | 1.57 | | 1.57 | % |
| Non-taxable | Non-taxable | | 728,765 | | | 22,504 | | | 3.09 | % | | 420,294 | | | 15,040 | | | 3.58 | % | | 305,266 | | | 12,096 | | | 3.96 | % | Non-taxable | | 738,769 | | | 27,656 | | 27,656 | | | 3.74 | | 3.74 | % | | 844,772 | | | 29,810 | | 29,810 | | | 3.53 | | 3.53 | % | | 728,765 | | | 22,504 | | 22,504 | | | 3.09 | | 3.09 | % |
| Total Loans and Leases ⁽²⁾ | Total Loans and Leases ⁽²⁾ | | 3,072,302 | | | 139,378 | | | 4.54 | % | | 3,185,542 | | | 151,946 | | | 4.77 | % | | 2,899,939 | | | 152,836 | | | 5.27 | % | Total Loans and Leases ⁽²⁾ | | 3,835,157 | | | 213,195 | | 213,195 | | | 5.56 | | 5.56 | % | | 3,680,708 | | | 169,593 | | 169,593 | | | 4.61 | | 4.61 | % | | 3,072,302 | | | 139,378 | | 139,378 | | | 4.54 | | 4.54 | % |
| | TOTAL INTEREST EARNING ASSETS | TOTAL INTEREST EARNING ASSETS | | 5,015,633 | | | 175,332 | | | 3.50 | % | | 4,370,809 | | | 177,815 | | | 4.07 | % | | 3,778,562 | | | 179,364 | | | 4.75 | % |
| TOTAL INTEREST EARNING ASSETS | |
| TOTAL INTEREST EARNING ASSETS | | | 5,504,219 | | | 263,142 | | | 4.78 | % | | 5,999,668 | | | 225,621 | | | 3.76 | % | | 5,015,633 | | | 175,332 | | | 3.50 | % |
| | Other Assets | Other Assets | | 397,147 | | | | | | | 398,102 | | | | | | | 366,171 | | | | | |
| Other Assets | |
| Other Assets | |
| Less: Allowance for Credit Losses | |
| Less: Allowance for Credit Losses | |
| Less: Allowance for Credit Losses | Less: Allowance for Credit Losses | | (43,073) | | | | | | | (39,905) | | | | | | | (16,198) | | | | | |
| | TOTAL ASSETS | TOTAL ASSETS | | $ | 5,369,707 | | | | | | | $ | 4,729,006 | | | | | | | $ | 4,128,535 | | | | | |
| | TOTAL ASSETS | |
| | TOTAL ASSETS | |
| | LIABILITIES AND SHAREHOLDERS’ EQUITY | LIABILITIES AND SHAREHOLDERS’ EQUITY | | | | | | | | | | | | | | | | | | |
| | LIABILITIES AND SHAREHOLDERS’ EQUITY | |
| | LIABILITIES AND SHAREHOLDERS’ EQUITY | |
| Interest-bearing Demand Deposits | |
| Interest-bearing Demand Deposits | |
| Interest-bearing Demand Deposits | Interest-bearing Demand Deposits | | $ | 1,595,579 | | | $ | 1,789 | | | 0.11 | % | | $ | 1,309,998 | | | $ | 4,089 | | | 0.31 | % | | $ | 1,128,457 | | | $ | 8,643 | | | 0.77 | % | | $ | 1,826,232 | | | $ | | $ | 28,378 | | | 1.55 | | 1.55 | % | | $ | 2,013,969 | | | $ | | $ | 8,583 | | | 0.43 | | 0.43 | % | | $ | 1,595,579 | | | $ | | $ | 1,789 | | | 0.11 | | 0.11 | % |
| Savings Deposits and Money Market Accounts | Savings Deposits and Money Market Accounts | | 1,106,692 | | | 885 | | | 0.08 | % | | 912,183 | | | 1,885 | | | 0.21 | % | | 733,160 | | | 3,406 | | | 0.46 | % | Savings Deposits and Money Market Accounts | | 1,229,019 | | | 12,106 | | 12,106 | | | 0.99 | | 0.99 | % | | 1,473,772 | | | 2,879 | | 2,879 | | | 0.20 | | 0.20 | % | | 1,106,692 | | | 885 | | 885 | | | 0.08 | | 0.08 | % |
| Time Deposits | Time Deposits | | 412,935 | | | 2,281 | | | 0.55 | % | | 567,932 | | | 7,722 | | | 1.36 | % | | 670,802 | | | 11,756 | | | 1.75 | % | Time Deposits | | 588,142 | | | 16,432 | | 16,432 | | | 2.79 | | 2.79 | % | | 474,409 | | | 2,052 | | 2,052 | | | 0.43 | | 0.43 | % | | 412,935 | | | 2,281 | | 2,281 | | | 0.55 | | 0.55 | % |
| FHLB Advances and Other Borrowings | FHLB Advances and Other Borrowings | | 186,750 | | | 4,594 | | | 2.46 | % | | 221,832 | | | 5,430 | | | 2.45 | % | | 279,675 | | | 7,444 | | | 2.66 | % | FHLB Advances and Other Borrowings | | 210,837 | | | 9,307 | | 9,307 | | | 4.41 | | 4.41 | % | | 159,029 | | | 4,828 | | 4,828 | | | 3.04 | | 3.04 | % | | 186,750 | | | 4,594 | | 4,594 | | | 2.46 | | 2.46 | % |
| | TOTAL INTEREST-BEARING LIABILITIES | TOTAL INTEREST-BEARING LIABILITIES | | 3,301,956 | | | 9,549 | | | 0.29 | % | | 3,011,945 | | | 19,126 | | | 0.63 | % | | 2,812,094 | | | 31,249 | | | 1.11 | % |
| TOTAL INTEREST-BEARING LIABILITIES | |
| TOTAL INTEREST-BEARING LIABILITIES | | | 3,854,230 | | | 66,223 | | | 1.72 | % | | 4,121,179 | | | 18,342 | | | 0.45 | % | | 3,301,956 | | | 9,549 | | | 0.29 | % |
| | Demand Deposit Accounts | Demand Deposit Accounts | | 1,378,647 | | | | | | | 1,070,284 | | | 761,515 | | | | | |
| Demand Deposit Accounts | |
| Demand Deposit Accounts | |
| Other Liabilities | |
| Other Liabilities | |
| Other Liabilities | Other Liabilities | | 46,170 | | | | | | | 51,996 | | | 35,916 | | | | | |
| TOTAL LIABILITIES | TOTAL LIABILITIES | | 4,726,773 | | | | | | | 4,134,225 | | | | | | | 3,609,525 | | | | | |
| TOTAL LIABILITIES | |
| TOTAL LIABILITIES | |
| | Shareholders’ Equity | |
| | Shareholders’ Equity | |
| | Shareholders’ Equity | Shareholders’ Equity | | 642,934 | | | | | | | 594,781 | | | | | | | 519,010 | | | | | |
| | TOTAL LIABILITIES AND SHAREHOLDERS’ EQUITY | TOTAL LIABILITIES AND SHAREHOLDERS’ EQUITY | | $ | 5,369,707 | | | | | | | $ | 4,729,006 | | | | | | | $ | 4,128,535 | | | | | |
| | TOTAL LIABILITIES AND SHAREHOLDERS’ EQUITY | |
| | TOTAL LIABILITIES AND SHAREHOLDERS’ EQUITY | |
| | COST OF FUNDS | |
| | COST OF FUNDS | |
| | COST OF FUNDS | COST OF FUNDS | | | | | | 0.19 | % | | 0.44 | % | | 0.83 | % | | | | 1.20 | % | | | | | | 0.31 | % | | | | | | 0.19 | % |
| | NET INTEREST INCOME | NET INTEREST INCOME | | | | $ | 165,783 | | | | | | | $ | 158,689 | | | | | | | $ | 148,115 | | | |
| NET INTEREST INCOME | |
| NET INTEREST INCOME | |
| | NET INTEREST MARGIN | NET INTEREST MARGIN | | | | | | 3.31 | % | | | | | | 3.63 | % | | | | | | 3.92 | % |
| | NET INTEREST MARGIN | |
| | NET INTEREST MARGIN | | | | | 3.58 | % | | | | | | 3.45 | % | | | | | | 3.31 | % |
(1)Effective tax rates were determined as though interest earned on the Company'sCompany’s investments in municipal bonds and loans was fully taxable.
(2)Loans held-for-sale and non-accruing loans have been included in average loans. Interest income on loans includes loan fees of $4,316, $6,972, and $15,761 $15,003,for 2023, 2022 and $8,397 for 2021, 2020 and 2019, respectively.
The following table sets forth for the periods indicated a summary of the changes in interest income and interest expense resulting from changes in volume and changes in rates:
Net Interest Income – Rate / Volume Analysis
(Tax-Equivalent basis, dollars in thousands)
| | 2021 compared to 2020
Increase / (Decrease) Due to ⁽¹⁾ | | 2020 compared to 2019
Increase / (Decrease) Due to ⁽¹⁾ |
| | 2023 compared to 2022
Increase / (Decrease) Due to ⁽¹⁾ | | | | 2023 compared to 2022
Increase / (Decrease) Due to ⁽¹⁾ | | 2022 compared to 2021
Increase / (Decrease) Due to ⁽¹⁾ |
| | | | Volume | | Rate | | Net | | Volume | | Rate | | Net | | | Volume | | Rate | | Net | | Volume | | Rate | | Net |
| Interest Income: | Interest Income: | | | | | | | | | | | | | Interest Income: | | | | | | | | |
| Federal Funds Sold and Other | Federal Funds Sold and Other | | | | | | | | | | | | | Federal Funds Sold and Other | | |
| Short-term Investments | Short-term Investments | | $ | 254 | | | $ | (148) | | | $ | 106 | | | $ | 708 | | | $ | (848) | | | $ | (140) | |
| Taxable Securities | Taxable Securities | | 4,426 | | | (1,911) | | | 2,515 | | | 244 | | | (3,707) | | | (3,463) | |
| Non-taxable Securities | Non-taxable Securities | | 9,764 | | | (2,300) | | | 7,464 | | | 4,208 | | | (1,264) | | | 2,944 | |
| Loans and Leases | Loans and Leases | | (5,290) | | | (7,278) | | | (12,568) | | | 14,325 | | | (15,215) | | | (890) | |
| Total Interest Income | Total Interest Income | | 9,154 | | | (11,637) | | | (2,483) | | | 19,485 | | | (21,034) | | | (1,549) | |
| | Interest Expense: | Interest Expense: | | | | | | | |
| Interest Expense: | |
| Interest Expense: | |
| Savings and Interest-bearing Demand | |
| Savings and Interest-bearing Demand | |
| Savings and Interest-bearing Demand | Savings and Interest-bearing Demand | | 1,083 | | | (4,383) | | | (3,300) | | | 1,994 | | | (8,069) | | | (6,075) | |
| Time Deposits | Time Deposits | | (1,714) | | | (3,727) | | | (5,441) | | | (1,639) | | | (2,395) | | | (4,034) | |
| FHLB Advances and Other Borrowings | FHLB Advances and Other Borrowings | | (863) | | | 27 | | | (836) | | | (1,451) | | | (563) | | | (2,014) | |
| Total Interest Expense | Total Interest Expense | | (1,494) | | | (8,083) | | | (9,577) | | | (1,096) | | | (11,027) | | | (12,123) | |
| | Net Interest Income | Net Interest Income | | $ | 10,648 | | | $ | (3,554) | | | $ | 7,094 | | | $ | 20,581 | | | $ | (10,007) | | | $ | 10,574 | |
| Net Interest Income | |
| Net Interest Income | |
(1) The change in interest due to both rate and volume has been allocated to volume and rate changes in proportion to the relationship of the absolute dollar amounts of the change in each.
See the Company’s Average Balance Sheet above and the discussions under the headings “USES OF FUNDS,” “SOURCES OF FUNDS,” and “RISK MANAGEMENT – Liquidity and Interest Rate Risk Management” for further information on the Company’s net interest income, net interest margin, and interest rate sensitivity position.
PROVISION FOR CREDIT LOSSES
The Company provides for credit losses through regular provisions to the allowance for credit losses. The provision is affected by net charge-offs on loans and changes in specific and general allocations of the allowance. During 2021,2023, the Company recorded a provision for credit losses of $2,550,000 compared with $6,350,000 during 2022 and a negative provision for credit losses of $6,500,000 compared with aduring 2021.
During 2023, the provision for credit losses represented approximately 7 basis points of $17,550,000average loans. The lower provision recorded during 2020 and2023, as compared to 2022, was largely related to the resolution during the fourth quarter of 2023 of a $5,325,000single commercial borrowing relationship with minimal loss recognition for which the Company had established a significant reserve in previous periods. The Company realized net charge-offs of $2,953,000 or 8 basis points of average loans during 2023.
During 2022, the provision for loancredit losses represented approximately 17 basis points of average loans. The provision for credit losses in 2022 included $6,300,000 for the Day 1 CECL addition to the allocation for credit loss related to the CUB acquisition for the non-purchased with credit deterioration (“PCD”) loans. The Company realized net charge-offs of $2,316,000 or 6 basis points of average loans during 2019 under the incurred loss model.2022.
During 2021, the negative provision for credit losses represented approximately 21 basis points of average loans. The negative provision for credit losses in 2021 was largely due to declines in certain adversely criticized assets and improvement in certain pandemic-related stressed sectors for which the Company had provided significant levels of allowance for credit losses during 2020. The Company realized net charge-offs of $3,342,000 or 11 basis points of average loans during 2021.
During 2020, the provision for credit losses represented approximately 55 basis points of average loans. The increased level of provision during 2020 compared with 2019 was primarily due to the developments related to the COVID-19 pandemic and the resulting impact on the economic assumptions used in the Company's CECL model. The Company realized net charge-offs of $2,622,000 or 8 basis points of average loans outstanding during 2020.
The provision for credit losses made during 20212023 was made at a level deemed necessary by management to absorb expected losses in the loan portfolio. A detailed evaluation of the adequacy of the allowance for credit losses is completed quarterly by management, the results of which are used to determine provision for credit losses. Management estimates the allowance balance required using past loan loss experience, the nature and volume of the portfolio, information about specific borrower situations and estimated collateral values, economic conditions and reasonable and supportable forecasts along with other
qualitative and quantitative factors. Refer also to the sections entitled “CRITICAL ACCOUNTING POLICIES AND ESTIMATES” and “RISK MANAGEMENT - Lending and Loan Administration” for further discussion of the provision and allowance for credit losses.
NON-INTEREST INCOME
During the year ended December 31, 2021,2023, non-interest income increased $4,988,000,$1,128,000 or 9%2% from the year ended December 31, 2022. During the year ended December 31, 2022, non-interest income declined $329,000, or 1%, from the year ended December 31, 2020. During the year ended December 31, 2020, non-interest income increased $8,973,000, or 20%, from the year ended December 31, 2019.2021.
| Non-interest Income
(dollars in thousands) | Non-interest Income
(dollars in thousands) | | Years Ended December 31, | | % Change From
Prior Year | Non-interest Income
(dollars in thousands) | | Years Ended December 31, | | % Change From
Prior Year |
| 2021 | | 2020 | | 2019 | | 2020 | | 2019 |
| Trust and Investment Product Fees | | $ | 10,321 | | | $ | 8,005 | | | $ | 7,278 | | | 29 | % | | 10 | % |
| | 2023 | | | | 2023 | | 2022 | | 2021 | | 2022 | | 2021 |
| Wealth Management Fees | | Wealth Management Fees | | $ | 11,711 | | | $ | 10,076 | | | $ | 10,321 | | | 16 | % | | (2) | % |
| Service Charges on Deposit Accounts | Service Charges on Deposit Accounts | | 7,723 | | | 7,334 | | | 8,718 | | | 5 | | | (16) | |
| Insurance Revenues | Insurance Revenues | | 9,268 | | | 8,922 | | | 8,940 | | | 4 | | | — | |
| Company Owned Life Insurance | Company Owned Life Insurance | | 1,529 | | | 2,307 | | | 2,005 | | | (34) | | | 15 | |
| Interchange Fee Income | Interchange Fee Income | | 13,116 | | | 10,529 | | | 9,450 | | | 25 | | | 11 | |
| Other Operating Income | Other Operating Income | | 6,991 | | | 3,388 | | | 3,229 | | | 106 | | | 5 | |
| Subtotal | Subtotal | | 48,948 | | | 40,485 | | | 39,620 | | | 21 | | | 2 | |
| Net Gains on Sales of Loans | Net Gains on Sales of Loans | | 8,267 | | | 9,908 | | | 4,633 | | | (17) | | | 114 | |
| Net Gains on Securities | Net Gains on Securities | | 2,247 | | | 4,081 | | | 1,248 | | | (45) | | | 227 | |
| TOTAL NON-INTEREST INCOME | TOTAL NON-INTEREST INCOME | | $ | 59,462 | | | $ | 54,474 | | | $ | 45,501 | | | 9 | | | 20 | |
Trust and investment productWealth management fees increased $2,316,000,$1,635,000, or 29%16%, during 20212023 compared with 2020. Trust and investment product fees increased $727,000, or 10%, during 2020 compared with 2019.2022. The increase in both yearsduring 2023 was largely attributable to increased assets under management inwithin the Company'sCompany’s wealth management group.group as compared with 2022. Wealth management fees declined $245,000, or 2%, during 2022 compared with 2021.
Service charges on deposit accounts increased $389,000,$81,000, or 5%1%, during 20212023 compared with 2020.to 2022. Service charges on deposit accounts declined $1,384,000,increased $3,734,000, or 16%48%, during 20202022 compared to 2021. The increase during 2022 compared with 2019. The decline2021 was the result of the CUB acquisition as well as increased deposit customer activity.
Insurance revenues declined $424,000, or 4%, during 20202023 compared with 20192022, which was largely relatedprimarily attributable to decreased contingency revenue. Contingency revenue during 2023 totaled $955,000 compared with $1,641,000 during 2022. Contingency revenue is reflective of claims and loss experience with insurance carriers that the economic impactsCompany represents through its property and casualty insurance agency. Insurance revenues increased $752,000, or 8%, during 2022 compared with 2021, which was the result of the COVID-19 pandemic and resulting change in deposit customer activity, partially mitigated by the acquisitionincreased contingency revenue as well as increases across multiple lines of Citizens First.business.
Company owned life insurance revenue declined $778,000,decreased $533,000, or 34%24%, during 20212023 compared with 2020.2022. The decline in 2023 was primarily the result of a decrease in the death benefit claims received compared with 2022. Company owned life insurance revenue increased $302,000,$735,000, or 15%48%, during 20202022 compared with 2019.2021. The variance in both periodsincrease during 2022 compared with 2021 was largely related to death benefits received from life insurance policies during 2020.2022 and to the CUB acquisition.
Interchange feesfee income increased $2,587,000,$1,632,000, or 25%10%, during 2021the year ended December 31, 2023 compared to 2020.with 2022. The increasedincrease in the level of fees during 20212023 compared with 20202022 was due to increased economic activity and increased card utilization by customers. Interchange fees increased $1,079,000,$2,704,000, or 11%21%, during 2020 compared to 2019. The increase during 20202022 compared with 20192021. The increased level of fees during 2022 compared with 2021 was largely attributablerelated to the CUB acquisition of Citizens First andas well as increased card utilization by customers.
Other operating income increased $3,603,000,by $714,000, or 106%14%, during 20212023 compared with 2020.2022. The increase during 20212023 was largely attributable to the gain on sale of real estate related to the consolidation of various branch office facilities. Other operating income declined $1,875,000, or 27%, during 2022 compared with 2021. This decline was primarily attributable to the net gain of approximately $1.4 million related to the sale of the two branch office locations in Lexington, Kentuckyduring the third quarter of 2021 and approximately $863,000to a lower level of fair value adjustments and higher transaction fees associated with interest rate swap transactionstransaction fees with loan customers. Also contributing to the increase in 2021, was the donation of a building and accompanying real estate to a local municipality in one of the Company’s market areas. The estimated fair value of the property was approximately $575,000 greater than the book value which increased other operating income. A corresponding contribution expense of $800,000 was recognized in advertising and promotion expense of the Company’s income statement related to the donation of the building and real estate.
Net gains on sales of loans declined $1,641,000,$1,455,000, or 17%38%, during 2021the year ended December 31, 2023 compared with 2022. The decline during 2023 compared with 2022 was related to both a lower volume of loans sold and lower pricing levels. Net gains on sales of loans declined $4,449,000, or 54%, during the 2020.year ended December 31, 2022 compared with 2021. The decline in 20212022 compared with 20202021 was generally attributable to a lower level of fair value adjustments on commitments to sell loans and a modestly lower levelvolume of loans sold which were partially offset by higherand lower pricing levels on loans sold. Net gains on sales of loans increased $5,275,000, or 114%, during 2020 compared with 2019. The increase in the net gains on sales of loans during 2020 compared with 2019 was generally attributable to a higher sales volume and higher pricing levels on loans sold.levels. Loan sales totaled $109.0 million during 2023, $168.1 million during 2022, and $266.0 million during 2021, $316.4 million during 2020 and $185.4 million during 2019.2021.
The Company realized $2,247,000$40,000 in gains on sales of securities during 20212023 compared with $4,081,000$562,000 during 20202022 and $1,248,000$2,247,000 during 2019.2021. The net gains on sales of securities in all periods presented were donecompleted as part of shiftsadjustments in the allocations within the normal course of business of securities portfolio.
NON-INTEREST EXPENSE
During 2021,the year ended December 31, 2023, non-interest expense totaled $124,007,000, an increase$144,497,000, a decrease of $6,884,000,$9,694,000, or 6%, compared with 2020. Thethe year ended December 31, 20212022. During the year ended December 31, 2022, non-interest expense totaled $154,191,000, an increase of $30,184,000, or 24%, compared with the year ended December 31, 2021. The 2022 non-interest expenses included approximately $12,323,000 of non-recurring expenses totaling $4,100,000 related to the Company’s previously discussed operating optimization plan, $3,050,000 related to a previously disclosed litigation reserve, and $735,000 of transaction-relatedacquisition-related expenses for the acquisition of Citizens Union Bancorp of Shelbyville, Inc., which was completed on January 1, 2022. During 2020, non-interest expense totaled $117,123,000, an increase of $2,961,000, or 3%, compared with 2019.CUB.
| Non-interest Expense
(dollars in thousands) | Non-interest Expense
(dollars in thousands) | | Years Ended December 31, | | % Change From
Prior Year | Non-interest Expense
(dollars in thousands) | | Years Ended December 31, | | % Change From
Prior Year |
| 2021 | | 2020 | | 2019 | | 2020 | | 2019 |
| | 2023 | | | | 2023 | | 2022 | | 2021 | | 2022 | | 2021 |
| Salaries and Employee Benefits | Salaries and Employee Benefits | | $ | 68,570 | | | $ | 68,112 | | | $ | 63,885 | | | 1 | % | | 7 | % | Salaries and Employee Benefits | | $ | 83,244 | | | $ | | $ | 84,145 | | | $ | | $ | 68,570 | | | (1) | | (1) | % | | 23 | % |
| Occupancy, Furniture and Equipment Expense | Occupancy, Furniture and Equipment Expense | | 14,831 | | | 14,024 | | | 13,776 | | | 6 | | | 2 | |
| FDIC Premiums | FDIC Premiums | | 1,419 | | | 740 | | | 533 | | | 92 | | | 39 | |
| Data Processing Fees | Data Processing Fees | | 7,611 | | | 6,889 | | | 7,927 | | | 10 | | | (13) | |
| Professional Fees | Professional Fees | | 5,009 | | | 3,998 | | | 4,674 | | | 25 | | | (14) | |
| Advertising and Promotion | Advertising and Promotion | | 4,197 | | | 3,589 | | | 4,230 | | | 17 | | | (15) | |
| Intangible Amortization | Intangible Amortization | | 2,731 | | | 3,539 | | | 3,721 | | | (23) | | | (5) | |
| Other Operating Expenses | Other Operating Expenses | | 19,639 | | | 16,232 | | | 15,416 | | | 21 | | | 5 | |
| TOTAL NON-INTEREST EXPENSE | TOTAL NON-INTEREST EXPENSE | | $ | 124,007 | | | $ | 117,123 | | | $ | 114,162 | | | 6 | | | 3 | |
Salaries and benefits were relatively stabledeclined $901,000, or 1%, during 2021the year ended December 31, 2023 compared with 2020 increasing by $458,000, or less than 1%.2022. The decline in salaries and benefits during 2023 compared with 2022 was largely related to approximately $1,480,000 of acquisition-related salary and benefit costs of a non-recurring nature in 2022 related to the CUB acquisition. Salaries and benefits increased $4,227,000,$15,575,000, or 7%23%, during 20202022 compared with 2019.2021. The increase in salaries and benefits during 20202022 compared with 20192021 was largely attributable to an increased numberthe CUB acquisition, including the aforementioned acquisition-related salary and benefit costs of full-time equivalent employees during 2020.
Occupancy, furniture and equipment expense increased $807,000, or 6%, during 2021 compared with 2020. The increase during 2021 was due to lease termination costs associateda non-recurring nature, with the Company’s operating optimization plan that totaled approximately $1,411,000 during 2021. Occupancy, furnitureremainder of the increase due primarily to the salaries and equipment expense increased $248,000, or 2%, during 2020 compared with 2019.benefits costs for the CUB employee base.
FDIC premiums increased $679,000,$969,000, or 92%52%, during 2021the year ended December 31, 2023 compared with 2020 and increased $207,000, or 39%, during 2020 compared with 2019.2022. The increase during 20212023 compared with 20202022 was primarily related to credits receivedan industry-wide 2 basis point increase in the base FDIC premium assessment effective January 1, 2023. FDIC premiums increased $441,000, or 31%, during 2022 compared with 2021. This increase is primarily attributable to an increase in total assessable assets from the FDIC during 2020. There were no credits received during 2021 and a lower levelacquisition of credits in 2020 compared with 2019. The credits received in 2020 and prior years were due to the reserve ratio of the deposit insurance fund exceeding the FDIC targeted levels.CUB as well as organic growth.
Data processing fees increased $722,000,declined $4,294,000, or 10%28%, during 2021the year ended December 31, 2023 compared with 2020.the year ended December 31, 2022. The increasedecline during 2023 compared with 2022 was related to various softwarelargely driven by acquisition-related costs including expenses related toassociated with the PPP loan program as well as increased data processing fees for the branch salesCUB transaction, which totaled approximately $4,982,000 during 2021.2022. Data processing fees declined $1,038,000,increased $7,795,000, or 13%102%, during 2020the year ended December 31, 2022 compared with 2019.2021. The decline in data processing feesincrease during 20202022 compared with 20192021 was largely duedriven by the aforementioned acquisition-related costs along with the CUB operating costs and costs related to acquisition related costs during 2019.continued data system enhancements.
Professional fees increased $1,011,000,declined $720,000, or 25%11%, during 2021the year ended December 31, 2023 compared with 2020.the year ended December 31, 2022. The decline during 2023 compared with 2022 was primarily due to merger-related professional fees associated with the CUB acquisition that totaled approximately $1,802,000 in 2022, which were partially mitigated by increased legal and other professional fees during 2023. Professional fees increased $1,286,000, or 26%, during 2022 compared with 2021. The increase during 2021 compared with 20202022 was largely attributableprimarily due to professional fees associated with the acquisition of CUB acquisition. Merger and an increase in legalacquisition-related professional fees related to non-acquisition related legal matters. Professional fees declined $676,000, or 14%,totaled approximately $1,802,000 during 20202022 compared with 2019. The decline in professional fees$678,000 during 2020 compared with 2019 was largely related to higher levels of merger and acquisition related professional fees in 2019.
Advertising and promotion expense increased $608,000, or 17%, during 2021 compared with 2020. The increase during 2021 was attributable to the donation of a building and accompanying real estate to a local municipality in one of the Company’s market areas. The estimated fair value of the property was approximately $800,000 which resulted in the increase in the contribution expense during 2021. Advertising and promotion expense declined $641,000, or 15%, during 2020 compared with 2019. The decline during 2020 was largely attributable to lesser marketing and sponsorship expenditures impacted by the COVID-19 pandemic.
Other operating expenses increased $3,407,000,declined $3,864,000, or 21%16%, during 2021the year ended December 31, 2023 compared to the year ended December 31, 2022. The decline during 2023 compared with 2020 and2022 was attributable to acquisition-related costs that totaled approximately $3,862,000 in 2022. The acquisition-related costs were primarily vendor contract termination costs. Other operating expenses increased $816,000,$3,798,000, or 5%19%, during 2020the year ended December 31, 2022 compared with 2019.2021. The increase duringin 2022 compared to 2021 was primarily attributable to the establishment of a settlement reserve for a lawsuit challenging the Company’s checking account practicesaforementioned acquisition-related costs and operating costs associated with its assessment of overdraft fees forCUB.
certain debit card transactions. Like many other financial institutions, the Company has been the subject of an overdraft fee related putative class action lawsuit since the third quarter of 2020. This type of litigation is often time consuming and expensive to defend. In order to avoid further costs associated with this type of litigation, the Company determined it was in its best interest to pursue a settlement of this lawsuit during the third quarter of 2021 and therefore accrued a $3,050,000 settlement reserve. On October 21, 2021, the Company executed a settlement agreement for payment of that amount in connection with this lawsuit which remains subject to court approval. In addition, the Company recognized $1,276,000 of charges related to various fixed asset write-downs as a part of the Company’s operating optimization plans announced in March 2021.
PROVISION FOR INCOME TAXES
The Company records a provision for current income taxes payable, along with a provision for deferred taxes payable in the future. Deferred taxes arise from temporary differences, which are items recorded for financial statement purposes in a different period than for income tax returns. The Company’s effective tax rate was 18.1%17.1%, 17.1%17.5%, and 16.9%18.1%, respectively, in 2021, 2020,2023, 2022, and 2019.2021. The effective tax rate in all periods is lower than the blended statutory rate. The lower effective rate in all periods primarily resulted from the Company’s tax-exempt investment income on securities, loans, and company owned life insurance, income tax credits generated by investments in affordable housing projects, and income generated by subsidiaries domiciled in a state with no state or local income tax.
See Note 10 to the Company’s consolidated financial statements included in Item 8 of this Report for additional details relative to the Company’s income tax provision.
CAPITAL RESOURCES
As of December 31, 2021,2023, shareholders’ equity increased by $43.8$105.2 million to $668.5$663.6 million compared with $624.7$558.4 million at year-end 2020.2022. The increase in shareholders'shareholders’ equity was partially attributable to increasedthe increase in retained earnings of $61.9$56.5 million due to net income of $84.1$85.9 million during 20212023, which was partially offset by the payment of $22.2$29.4 million in shareholder dividends. Partially mitigating theThe increase in retained earningsshareholders’ equity was a declinealso attributable to an increase in accumulated other comprehensive income (“AOCI”) of $19.9$46.4 million related to the decreasean increase in value of the Company'sCompany’s available-for-sale securities portfolio.
Shareholders’ equity represented 11.9%10.8% of total assets at December 31, 20212023 and 12.6%9.1% of total assets at December 31, 2020.2022. Shareholders’ equity included $127.6$186.7 million of goodwill and other intangible assets at December 31, 20212023 compared to $130.9$189.8 million of goodwill and other intangible assets at December 31, 2020.2022.
OnIn January 25, 2021, the Company's Board of Directors approved a stock repurchase program for up to 1.0 million of its outstanding common shares. The Company did not repurchase any shares of common stock under the repurchase plan during 2021.
On January 31, 2022, the Company’s Board of Directors terminated the 2021 repurchase program and approved a new plan to repurchase up to 1.0 million shares of the Company’s outstanding common stock. On a share basis, the amount of common stock subject to the new repurchase plan represented approximately 3% of the Company’s outstanding shares on the date it was approved, which was inclusive of the approximately 2.9 million shares issued in conjunction with the CUB acquisition.approved. The Company is not obligated to purchase any shares under the plan, and the plan may be discontinued at any time. The actual timing, number and share price of shares purchased under the repurchase plan will be determined by the Company at its discretion and will depend upon such factors as the market price of the stock, general market and economic conditions and applicable legal requirements. The Company has not repurchased any shares of common stock under the 2022 repurchase plan.
In August 2022, the Inflation Reduction Act of 2022 (the “IRA”) was enacted. Among other things, the IRA imposes a new 1% excise tax on the fair market value of stock repurchased after December 31, 2022 by publicly traded U.S. corporations, like the Company. With certain exceptions, the value of stock repurchased is determined net of stock issued in the year, including shares issued pursuant to compensatory arrangements.
Federal banking regulations provide guidelines for determining the capital adequacy of bank holding companies and banks. These guidelines provide for a more narrow definition of core capital and assign a measure of risk to the various categories of assets. The Company is required to maintain minimum levels of capital in proportion to total risk-weighted assets and off-balance sheet exposures.
The current risk-based capital rules, as adopted by federal banking regulators, are based upon guidelines developed by the Basel Committee on Banking Supervision and reflect various requirements of the Dodd-Frank Act (the “Basel III Rules”). The Basel III Rules require banking organizations to, among other things, maintain a minimum ratio of Total Capital to risk-weighted assets, a minimum ratio of Tier 1 Capital to risk-weighted assets, a minimum ratio of “Common Equity Tier 1 Capital” to risk-weighted assets, and a minimum leverage ratio (calculated as the ratio of Tier 1 Capital to adjusted average consolidated assets). In addition, under the Basel III Rules, in order to avoid limitations on capital distributions, including dividend payments, the Company is required to maintain a 2.5% capital conservation buffer above the adequately capitalized regulatory capital ratios.
At December 31, 2021,2023, the capital levels for the Company and its subsidiary bank remained well in excess of the minimum amounts needed for capital adequacy purposes and the Bank’s capital levels met the necessary requirements to be considered well-capitalized.
The table below presents the Company’s consolidated and the subsidiary bank'sbank’s capital ratios under regulatory guidelines:
| | | | | 12/31/2021
Ratio | | 12/31/2020
Ratio | | Minimum for Capital Adequacy Purposes ⁽¹⁾ | | Well-Capitalized Guidelines | | | 12/31/2023
Ratio | | 12/31/2022
Ratio | | Minimum for Capital Adequacy Purposes ⁽¹⁾ | | Well-Capitalized Guidelines |
| Total Capital (to Risk Weighted Assets) | Total Capital (to Risk Weighted Assets) | | | | | | | | |
| Consolidated | Consolidated | | 16.20 | % | | 15.86 | % | | 8.00 | % | | N/A |
| Consolidated | |
| Consolidated | | | 16.50 | % | | 15.45 | % | | 8.00 | % | | N/A |
| Bank | Bank | | 13.36 | | | 14.00 | | | 8.00 | | | 10.00 | % | Bank | | 14.76 | | | 14.07 | | 14.07 | | | 8.00 | | 8.00 | | | 10.00 | | 10.00 | % |
| Tier 1 (Core) Capital (to Risk Weighted Assets) | Tier 1 (Core) Capital (to Risk Weighted Assets) | |
| Consolidated | |
| Consolidated | |
| Consolidated | Consolidated | | 14.61 | % | | 13.93 | % | | 6.00 | % | | N/A | | 14.97 | % | | 13.97 | % | | 6.00 | % | | N/A |
| Bank | Bank | | 12.83 | | | 13.21 | | | 6.00 | | | 8.00 | % | Bank | | 14.04 | | | 13.42 | | 13.42 | | | 6.00 | | 6.00 | | | 8.00 | | 8.00 | % |
| Common Tier 1 (CET 1) Capital Ratio (to Risk Weighted Assets) | Common Tier 1 (CET 1) Capital Ratio (to Risk Weighted Assets) | |
| Consolidated | Consolidated | | 14.18 | % | | 13.48 | % | | 4.50 | % | | N/A |
| Consolidated | |
| Consolidated | | | 14.26 | % | | 13.26 | % | | 4.50 | % | | N/A |
| Bank | Bank | | 12.83 | | | 13.21 | | | 4.50 | | | 6.50 | % | Bank | | 14.04 | | | 13.42 | | 13.42 | | | 4.50 | | 4.50 | | | 6.50 | | 6.50 | % |
| Tier 1 Capital (to Average Assets) | Tier 1 Capital (to Average Assets) | |
| Consolidated | Consolidated | | 10.10 | % | | 10.07 | % | | 4.00 | % | | N/A |
| Consolidated | |
| Consolidated | | | 11.75 | % | | 10.50 | % | | 4.00 | % | | N/A |
| Bank | Bank | | 8.88 | | | 9.56 | | | 4.00 | | | 5.00 | % | Bank | | 11.03 | | | 10.09 | | 10.09 | | | 4.00 | | 4.00 | | | 5.00 | | 5.00 | % |
(1) Excludes capital conservation buffer.
In December 2018,As discussed in Note 1 (Summary of Significant Accounting Policies) of the federal banking regulators approved a final ruleNotes to address changes to credit lossthe Consolidated Financial Statements included in Item 8 of this Report, the Company adopted the CECL accounting standard under GAAP including banking organizations’ implementation of CECL.effective January 1, 2020. The final rule provides banking organizationsregulatory capital rules applicable to the option to phase in over aCompany provided an optional three-year phase-in period for the day-one adverse effects on regulatory capital that may result from the adoptioneffects of adopting CECL. In addition, as part of the new accounting standard. On March 27, 2020, in an action relatedCoronavirus Aid, Relief, and Economic Security Act (the “CARES Act”), banking organizations were further permitted to the CARES Act, the federal banking regulators announced an interim final rule to delaymitigate the estimated impact oncumulative regulatory capital stemming fromeffects of CECL for up to an additional two years. As a result, on January 1, 2022, the implementation of CECL. The interim final rule, which was finalized effective September 30, 2020, maintains the three-year transition option in the previous rule and provides banks the option to delay for two years an estimate of CECL’s effect on regulatory capital, relative to the incurred loss methodology’s effect on regulatory capital, followed by a three-year transition period (five-year transition option). The Company elected to adopt the five-year transition option and, as a result, began the required three-year phase-in by reflecting 25% of the previously deferred estimated capital impact of CECL in its regulatory capital effective January 1, 2022.capital. An additional 25% is towas phased in on each of January 1, 2023 and January 1, 2024, and another 25% will be phased in aton January 1, 2025 (at which time the beginningcumulative effects of each subsequent year untiladopting CECL will have been fully phased in by January 1, 2025.into our regulatory capital). Under the five-year transition option, the amount of adjustments to regulatory capital that could be deferred until the phase-in period began included both the initial impact of our adoption of CECL at January 1, 2020 and 25% of subsequent changes in our allowance for credit losses during each quarter of the two-year period ended December 31, 2021.
On April 9, 2020, federal banking regulators issued an interim final rule to modify the Basel III regulatory capital rules applicable to banking organizations to allow those organizations participating in the PPP to neutralize the regulatory capital effects of participating in the program. Specifically, the agencies have clarified that banking organizations, including the Company and the Bank, are permitted to assign a zero percent risk weight to PPP loans for purposes of determining risk-weighted assets and risk-based capital ratios.
USES OF FUNDS
LOANS
December 31, 20212023 total loans declined $84.1increased $189.3 million, or 3%5%, compared with December 31, 2020.2022. The declineincrease in total loans at December 31, 2021 compared to year-end 2020 was primarily due to a decrease in PPP loans. PPP loans, net of deferred fees, totaled $19.5 million ($20.3 million principal balance and $0.8 million of remaining net deferred fees) at December 31, 2021 compared with $182.0 million at December 31, 2020.
Excluding PPP loans, total loans increased $86.8 million, or 3%, at December 31, 20212023 compared with year-end 2020.2022 was broad-based across most segments of the portfolio. Commercial and industrial loans increased approximately $18.5 million, or 4%, during 2021 compared with year-end 2020, commercial real estate loans increased $69.5$155.0 million, or 5%8%, and agricultural loans declined $17.9grew $6.4 million, or 5% (excluding PPP loans). At December 31, 2021, as compared with year-end 2020,2%, and retail loans increased $16.7$42.9 million, or 3%6%.
Partially offsetting these increases was a modest decline in commercial and industrial loans of $15.0 million, or 2%, as line of credit utilization remains muted.
December 31, 20202022 total loans increased $10.0$780.7 million, or less than 1%26%, compared with December 31, 2019.2021. The increase in loans during 2020 compared with year-end 2019 was primarily the result in the Company’s participation in the PPP. Excluding the $182.0 million in PPPtotal loans at December 31, 2020, total loans declined by $172.0 million, or 6%, during 20202022 compared with year-end 2019. The decline in total loans, excluding the PPP loans,2021 was impacted by elevated pay-offs within the commercial real estate loan portfolio, reduced line utilization within the commercial loan portfolio partially attributablelargely due to the acquisition of CUB and organic loan growth from throughout the Company’s existing market areas, partially offset by a decrease in PPP loan originations during 2020, and continued pay-downs in the Company's residential and home equity loan portfolios related to a low interest rate environment.loans.
The Bank has certain lending policies and procedures in place that are designed to maximize loan income within an acceptable level of risk. Management reviews and approves these policies and procedures on a regular basis. A reporting system supplements the review process by providing management with frequent reports related to loan production, loan quality, concentration of credit, loan delinquencies and non-performing and potential problem loans. Diversification in the loan portfolio is a means of managing risk associated with fluctuations in economic conditions. As reflected in the table below, over the past several years (including 2023), the composition of the loan portfolio has remained relatively stable and diversified over the past several years, including 2021. diversified.
The portfolio is most heavily concentrated in commercial real estate loans at 51%53% of the portfolio andin 2023, followed by commercial and industrial loans at 18%17% of the portfolio, and agricultural loans at 12%11% of the portfolio. The Company’s commercial lending is extended to various industries, including multi-family housing and lodging, agribusiness and manufacturing, as well as health care, wholesale, and retail services.
| | Loan Portfolio | Loan Portfolio | | December 31, | Loan Portfolio | | December 31, |
| (dollars in thousands) | (dollars in thousands) | | 2021 | | 2020 | | 2019 | | 2018 | | 2017 | (dollars in thousands) | | 2023 | | 2022 | | 2021 | | 2020 | | 2019 |
| Commercial and Industrial Loans and Leases | Commercial and Industrial Loans and Leases | | $ | 548,350 | | | $ | 694,437 | | | $ | 589,758 | | | $ | 543,761 | | | $ | 486,668 | |
| Commercial Real Estate Loans | Commercial Real Estate Loans | | 1,530,677 | | | 1,467,397 | | | 1,495,862 | | | 1,208,646 | | | 926,729 | |
| Agricultural Loans | Agricultural Loans | | 358,150 | | | 376,186 | | | 384,526 | | | 365,208 | | | 333,227 | |
| Home Equity and Consumer Loans | Home Equity and Consumer Loans | | 307,184 | | | 297,702 | | | 306,972 | | | 285,534 | | | 219,662 | |
| Residential Mortgage Loans | Residential Mortgage Loans | | 263,565 | | | 256,276 | | | 304,855 | | | 328,592 | | | 178,733 | |
| Total Loans | Total Loans | | 3,007,926 | | | 3,091,998 | | | 3,081,973 | | | 2,731,741 | | | 2,145,019 | |
| Less: Unearned Income | Less: Unearned Income | | (3,662) | | | (3,926) | | | (4,882) | | | (3,682) | | | (3,381) | |
| Subtotal | Subtotal | | 3,004,264 | | | 3,088,072 | | | 3,077,091 | | | 2,728,059 | | | 2,141,638 | |
| Less: Allowance for Loan Losses | | (37,017) | | | (46,859) | | | (16,278) | | | (15,823) | | | (15,694) | |
| Less: Allowance for Credit Losses | |
| Loans, Net | Loans, Net | | $ | 2,967,247 | | | $ | 3,041,213 | | | $ | 3,060,813 | | | $ | 2,712,236 | | | $ | 2,125,944 | |
| Net PPP Loans (Included in Commercial and Industrial Loans above) | |
| | Ratio of Loans to Total Loans | Ratio of Loans to Total Loans | | | | | | | | | | |
| Ratio of Loans to Total Loans | |
| Ratio of Loans to Total Loans | |
| Commercial and Industrial Loans and Leases | |
| Commercial and Industrial Loans and Leases | |
| Commercial and Industrial Loans and Leases | Commercial and Industrial Loans and Leases | | 18 | % | | 23 | % | | 19 | % | | 20 | % | | 23 | % | | 17 | % | | 18 | % | | 18 | % | | 23 | % | | 19 | % |
| Commercial Real Estate Loans | Commercial Real Estate Loans | | 51 | % | | 47 | % | | 49 | % | | 44 | % | | 43 | % | Commercial Real Estate Loans | | 53 | % | | 52 | % | | 51 | % | | 47 | % | | 49 | % |
| Agricultural Loans | Agricultural Loans | | 12 | % | | 12 | % | | 12 | % | | 13 | % | | 16 | % | Agricultural Loans | | 11 | % | | 11 | % | | 12 | % | | 12 | % | | 12 | % |
| Home Equity and Consumer Loans | Home Equity and Consumer Loans | | 10 | % | | 10 | % | | 10 | % | | 11 | % | | 10 | % | Home Equity and Consumer Loans | | 10 | % | | 10 | % | | 10 | % | | 10 | % | | 10 | % |
| Residential Mortgage Loans | Residential Mortgage Loans | | 9 | % | | 8 | % | | 10 | % | | 12 | % | | 8 | % | Residential Mortgage Loans | | 9 | % | | 9 | % | | 9 | % | | 8 | % | | 10 | % |
| Total Loans | Total Loans | | 100 | % | | 100 | % | | 100 | % | | 100 | % | | 100 | % | Total Loans | | 100 | % | | 100 | % | | 100 | % | | 100 | % | | 100 | % |
The Company’s policy is generally to extend credit to consumer and commercial borrowers in its primary geographic market area in southern Indiana and central and western Kentucky. Commercial extensions of credit outside this market area are generally concentrated in real estate loans within a reasonable proximity of the Company’s primary market and are granted on a selective basis.
PPP loans, which were originated in 2020 and early 2021, were made to fund payroll and operational costs of eligible businesses, organizations and self-employed persons during the COVID-19 pandemic. Loans covered by the PPP, which was administered by the Small Business Administration (“SBA”) under the provisions of the CARES Act, were eligible for loan forgiveness if program guidelines were met. The Company actively participated in assisting its customers with PPP funding during the program. PPP loans are reflected in Commercial and Industrial Loans and Leases in the table above.
While commercial real estate (“CRE”) is the largest component of the Company’s loan portfolio, it is well-diversified over numerous property types. Specifically, the commercial real estate loan portfolio, as a percentage of the CRE portfolio and total loans at December 31, 2023, included the following property types: multi-family dwellings (21% of CRE portfolio and 11% of total loans); single family investment properties (12% of CRE portfolio and 7% of total loans); retail space (14% of CRE portfolio and 7% of total loans); office real estate (8% of CRE portfolio and 4% of total loans); lodging (6% of CRE portfolio and 3% of total loans); healthcare facilities (7% of CRE portfolio and 4% of total loans); and land development and construction (6% of CRE portfolio and 3% of total loans). The Company’s commercial real estate loan portfolio is further diversified by occupancy type, with approximately 77% of the CRE portfolio being non-owner occupied at December 31, 2023 (which is 41% of the Company’s overall loan portfolio), and 23% of the CRE portfolio being owner occupied (which is 12% of the Company’s total loan portfolio).
The commercial real estate loan portfolio, as a percentage of the CRE portfolio and total loans at December 31, 2022, included the following property types: multi-family dwellings (20% of CRE portfolio and 11% of total loans); single family investment properties (14% of CRE portfolio and 7% of total loans); retail space (13% of CRE portfolio and 7% of total loans); office real estate (7% of CRE portfolio and 4% of total loans); lodging (6% of CRE portfolio and 3% of total loans); healthcare facilities (6% of CRE portfolio and 3% of total loans); and land development and construction (5% of CRE portfolio and 3% of total loans). The Company’s commercial real estate loan portfolio is further diversified by occupancy type, with approximately 78% of the CRE portfolio being non-owner occupied at December 31, 2022 (which is 40% of the Company’s overall loan portfolio), and 22% of the CRE portfolio being owner occupied (which is 12% of the Company’s total loan portfolio).
Commercial real estate loans are underwritten after evaluating and understanding the borrower’s ability to operate profitably and prudently expand its business. Like much of the Bank’s lending activities, the underwriting standards for commercial real estate are designed to promote relationship banking rather than transactional banking. Once it is determined that the borrower’s management possesses sound ethics and solid business acumen, our management examines market conditions and current and projected cash flows to determine the ability of the borrower to repay their obligations as agreed. Commercial real estate loans are viewed primarily as cash flow loans and secondarily as loans secured by real estate. As discussed above, the properties securing our commercial real estate portfolio are diverse in terms of property type, occupancy type, and geographic location. This diversity helps reduce the Bank’s exposure to adverse economic events that affect any single market or industry. Management will continue to monitor and evaluate commercial real estate loans based on collateral, geography and risk grade criteria.
The following table indicates the amounts of loans (excluding residential mortgages on 1-4 family residences and consumer loans) outstanding as of December 31, 2021,2023, which, based on remaining scheduled repayments of principal, are due in the periods indicated (dollars in thousands).
| | | | | | | | | | | | | | | | | | | | | | | | | | |
| | Within
One Year | | One to Five
Years | | After
Five Years | | Total |
| Commercial and Agricultural | | $ | 860,098 | | | $ | 1,243,604 | | | $ | 315,567 | | | $ | 2,419,269 | |
| | | | | | | | | | | | | | |
| | Interest Sensitivity |
| | Fixed Rate | | Variable Rate |
| Loans Maturing After One Year | | $ | 412,426 | | | $ | 1,146,745 | |
| | | | | | | | | | | | | | | | | | | | | | | | | | |
| | Within
One Year | | One to Five
Years | | After
Five Years | | Total |
| Commercial and Agricultural | | $ | 845,677 | | | $ | 1,601,441 | | | $ | 771,576 | | | $ | 3,218,694 | |
| | | | | | | | | | | | | | |
| | Interest Sensitivity |
| | Fixed Rate | | Variable Rate |
| Loans Maturing After One Year | | $ | 824,511 | | | $ | 1,548,506 | |
INVESTMENTS
The investment portfolio is a principal source for funding the Company’s loan growth and other liquidity needs of its subsidiaries. The Company’s securities portfolio primarily consists of money market securities, collateralized and uncollateralized federal agency securities, municipal obligations of state and political subdivisions, and mortgage-backed securities and collateralized mortgage obligations (MBS/CMO - Residential) issued by U.S. government agencies. Money market securities include federal funds sold, interest-bearing balances with banks, and other short-term investments. The composition of the year-end balances in the investment portfolio is presented in Note 2 (Securities) of the Notes to the Consolidated Financial Statements included in Item 8 of this Report and in the table below:
| | Investment Portfolio, at Amortized Cost | Investment Portfolio, at Amortized Cost | | December 31, | Investment Portfolio, at Amortized Cost | | December 31, |
| (dollars in thousands) | (dollars in thousands) | | 2021 | | % | | 2020 | | % | | 2019 | | % | (dollars in thousands) | | 2023 | | % | | 2022 | | % | | 2021 | | % |
| | Federal Funds Sold and Other Short-term Investments | Federal Funds Sold and Other Short-term Investments | | $ | 349,717 | | | 16 | % | | $ | 287,776 | | | 20 | % | | $ | 43,913 | | | 5 | % |
| Federal Funds Sold and Other Short-term Investments | |
| Federal Funds Sold and Other Short-term Investments | | | $ | 36,525 | | | 2 | % | | $ | 41,905 | | | 2 | % | | $ | 349,717 | | | 16 | % |
| U.S. Treasury | |
| Obligations of State and Political Subdivisions | Obligations of State and Political Subdivisions | | 896,048 | | | 40 | | | 548,273 | | | 37 | | | 307,943 | | | 35 | |
| MBS/CMO - Residential | | 797,693 | | | 36 | | | 535,526 | | | 37 | | | 526,907 | | | 60 | |
| US Gov't Sponsored Entities & Agencies | | 175,457 | | | 8 | | | 88,376 | | | 6 | | | — | | | n/m ⁽¹⁾ |
| MBS/CMO | |
| US Gov’t Sponsored Entities & Agencies | |
| Equity Securities | Equity Securities | | 353 | | | n/m ⁽¹⁾ | | 353 | | | n/m ⁽¹⁾ | | 353 | | | n/m ⁽¹⁾ | Equity Securities | | 353 | | | n/m ⁽¹⁾ | | n/m ⁽¹⁾ | | 353 | | | n/m ⁽¹⁾ | | n/m ⁽¹⁾ | | 353 | | | n/m ⁽¹⁾ | | n/m ⁽¹⁾ |
| Total Securities Portfolio | Total Securities Portfolio | | $ | 2,219,268 | | | 100 | % | | $ | 1,460,304 | | | 100 | % | | $ | 879,116 | | | 100 | % | Total Securities Portfolio | | $ | 1,908,138 | | | 100 | | 100 | % | | $ | 2,137,084 | | | 100 | | 100 | % | | $ | 2,219,268 | | | 100 | | 100 | % |
(1)n/m = not meaningful
The amortized cost of investment securities, including federal funds sold and short-term investments, increased $759.0decreased $229.0 million, or 52%11%, at year-end 20212023 compared to year-end 2022 and decreased $82.2 million, or 4%, at year-end 2022 compared to year-end 2021. The decline in the available for sale portfolio during 2023 compared with 2022 was primarily the result of the Company’s utilization of cash flows of approximately $171 million from the securities portfolio to fund loan growth and overall modest deposit declines. The decline in 2023 was broad-based across all areas of the investment portfolio. Mortgage related securities declined $85.5 million, or 10%, obligations of state and political subdivisions declined $49.3 million, or 5%, and US treasuries declined $64 million, or 100%, as compared to 2022. The decline from year-end 2022 compared with year-end 2020 and increased $581.2 million, or 66%, at year-end 2020 compared with year-end 2019. The increase over the past two years2021 was largelyprimarily attributable to increased levelsthe decrease in federal funds sold which is partially offset by the increase in amortized cost of deposits during both 2021obligations of state and 2020 in addition to PPP loan forgivenesspolitical subdivisions, agency issued mortgage related securities and repayment activity over those same periods.collateralized and uncollateralized federal agency securities.
The investment portfolio continues to be relatively balanced with agency issued mortgage related securities and collateralized and uncollateralized federal agency securities totaling $973.2$981.3 million, or 44%51% of the total securities portfolio at December 31, 2021.2023. The Company’s level of obligations of state and political subdivisions increased to $896.0$889.9 million, or 40%47% of the portfolio at December 31, 2021.2023.
| | | | | | | | | | | | | | | | | | | | |
| Investment Securities, at Carrying Value | | | | | | |
| (dollars in thousands) | | |
| | December 31, |
| Securities Available-for-Sale | | 2023 | | 2022 | | 2021 |
| U.S. Treasury | | $ | — | | | $ | 64,119 | | | $ | — | |
| Obligations of State and Political Subdivisions | | 768,875 | | | 777,852 | | | 925,706 | |
| MBS/CMO | | 645,040 | | | 714,681 | | | 791,950 | |
| US Gov’t Sponsored Entities & Agencies | | 182,917 | | | 205,017 | | | 171,961 | |
| Total Securities | | $ | 1,596,832 | | | $ | 1,761,669 | | | $ | 1,889,617 | |
| | | | | | | | | | | | | | | | | | | | |
| Investment Securities, at Carrying Value | | | | | | |
| (dollars in thousands) | | |
| | December 31, |
| Securities Available-for-Sale | | 2021 | | 2020 | | 2019 |
| Obligations of State and Political Subdivisions | | $ | 925,706 | | | $ | 581,247 | | | $ | 324,300 | |
| MBS/CMO - Residential | | 791,950 | | | 548,307 | | | 530,525 | |
| US Gov't Sponsored Entities & Agencies | | 171,961 | | | 88,298 | | | — | |
| Total Securities | | $ | 1,889,617 | | | $ | 1,217,852 | | | $ | 854,825 | |
As discussed above, the Company utilized cash flows from the available for sale portfolio to fund loan growth and an overall modest decline in deposits. This cash flow utilization drove the decline in carrying value in the available for sale portfolio from 2023 to 2022, which was slightly offset by the fair value adjustments in the portfolio due to the change in interest rates. The decline in the available for sale portfolio during 2022 compared with 2021 was largely attributable to fair value adjustments in the portfolio caused by the rise in market interest rates. The Company’s $1.890$1.597 billion available-for-sale investment portfolio provides an additional funding source for the liquidity needs of the Company’s subsidiaries and for asset/liability management requirements. Although management has the ability to sell these securities if the need arises, their designation as available-for-sale should not necessarily be interpreted as an indication that management anticipates such sales.
The amortized cost of available-for-sale debt securities at December 31, 20212023 is shown in the following table by contractual maturity. MBS/CMO - Residential securities are based on estimated average lives. Expected maturities will differ from contractual maturities because issuers may have the right to call or prepay obligations.
Maturities and Average Yields of Securities at December 31, 20212023
(dollars in thousands)
| | | Within
One Year | | | | Within
One Year | | After One But
Within Five Years | | After Five But
Within Ten Years | | After Ten
Years |
| | Within
One Year | | After One But
Within Five Years | | After Five But
Within Ten Years | | After Ten
Years | | | Amount | | Yield | | Amount | | Yield | | Amount | | Yield | | Amount | | Yield |
| | | Amount | | Yield | | Amount | | Yield | | Amount | | Yield | | Amount | | Yield |
| U.S. Treasury | | U.S. Treasury | | $ | — | | | — | % | | $ | — | | | — | % | | $ | — | | | — | % | | $ | — | | | — | % |
| Obligations of State and Political Subdivisions | Obligations of State and Political Subdivisions | | $ | 2,806 | | | 4.32 | % | | $ | 18,670 | | | 4.19 | % | | $ | 70,964 | | | 3.86 | % | | $ | 803,608 | | | 2.97 | % | Obligations of State and Political Subdivisions | | 1,768 | | | 3.72 | | 3.72 | % | | 17,548 | | | 4.28 | | 4.28 | % | | 65,213 | | | 3.26 | | 3.26 | % | | 805,411 | | | 3.01 | | 3.01 | % |
| MBS/CMO - Residential | | — | | | — | | | 785 | | | 3.00 | % | | 25,587 | | | 2.05 | % | | 771,321 | | | 1.59 | % |
| US Gov't Sponsored Entities & Agencies | | — | | | — | | | — | | | — | % | | 7,496 | | | 1.01 | % | | 167,961 | | | 1.49 | % |
| | MBS/CMO | | MBS/CMO | | — | | | — | % | | 35,091 | | | 2.72 | % | | 31,116 | | | 2.22 | % | | 694,818 | | | 1.77 | % |
| US Gov’t Sponsored Entities & Agencies | | US Gov’t Sponsored Entities & Agencies | | 333 | | | 2.48 | % | | 8,675 | | | 1.14 | % | | 12,094 | | | 2.94 | % | | 199,193 | | | 1.82 | % |
| Total Securities | Total Securities | | $ | 2,806 | | | 4.32 | % | | $ | 19,455 | | | 4.14 | % | | $ | 104,047 | | | 3.21 | % | | $ | 1,742,890 | | | 2.22 | % | Total Securities | | $ | 2,101 | | | 3.52 | | 3.52 | % | | $ | 61,314 | | | 2.94 | | 2.94 | % | | $ | 108,423 | | | 2.93 | | 2.93 | % | | $ | 1,699,422 | | | 2.36 | | 2.36 | % |
A tax-equivalent adjustment using a tax rate of 21 percent was used in the above table.
CONTRACTUAL OBLIGATIONS
In addition to the other uses of funds discussed previously, the Company has certain contractual obligations to make cash payments. These contractual obligations primarily consist of borrowings from the Federal Home Loan Bank (“FHLB”), junior subordinated debentures, deposits, repurchase agreements, and lease commitments for certain office facilities. A summary of these payment obligations is set forth below.
| | Contractual and Other Obligations | Contractual and Other Obligations | | Payments Due In | Contractual and Other Obligations | | Payments Due In |
| (dollars in thousands) | (dollars in thousands) | | One Year or Less | | Over One Year | | Total | (dollars in thousands) | | One Year or Less | | Over One Year | | Total |
| Deposits without Stated Maturities | Deposits without Stated Maturities | | $ | 4,397,217 | | | $ | — | | | $ | 4,397,217 | |
| Time Deposits | Time Deposits | | 347,099 | | | — | | | 347,099 | |
| Federal Home Loan Bank Advances | Federal Home Loan Bank Advances | | — | | | 25,000 | | | 25,000 | |
| Other Borrowings (Subordinated Notes and Debentures) | Other Borrowings (Subordinated Notes and Debentures) | | — | | | 55,804 | | | 55,804 | |
| Federal Funds Purchased | |
| Securities Sold under Repurchase Agreements | Securities Sold under Repurchase Agreements | | 68,328 | | | — | | | 68,328 | |
| Lease Obligations | Lease Obligations | | 1,735 | | | 10,314 | | | 12,049 | |
| Total Contractual and Other Obligations | Total Contractual and Other Obligations | | $ | 4,814,379 | | | $ | 91,118 | | | $ | 4,905,497 | |
In the normal course of business, the Company makes commitments to extend credit and commitments to sell loans, which are not reflected in its consolidated financial statements. For further information about such commitments, see Note 14 (Commitments and Off-balance Sheet Items) in Notes to the Consolidated Financial Statements included in Item 8 of this Report.
SOURCES OF FUNDS
The Company’s primary source of funding is its base of core customer deposits. Core deposits consist of demand deposits, savings, interest-bearing checking, money market accounts, and certificates of deposit of less than $100,000. Other deposit sources of funds areinclude certificates of deposit of $100,000 or more, brokeredmore. The deposit base remains diverse with stable and manageable exposure to uninsured and uncollateralized deposits of approximately 21% of total deposits.
Other funding sources include overnight borrowings from other financial institutions and securities sold under agreement to repurchase. The membership of the Company’s affiliate bank in the Federal Home Loan Bank System provides a significant additional source for both long and short-term collateralized borrowings. In addition, the Company, as a separate and distinct corporation from its bank and other subsidiaries, also has the ability to borrow funds from other financial institutions and to raise debt or equity capital from the capital markets and other sources. The following pages contain a discussion of changes in these areas.funding sources.
The table below illustrates changes between years in the average balances of all funding sources:
| Funding Sources - Average Balances
(dollars in thousands) | Funding Sources - Average Balances
(dollars in thousands) | | December 31, | | % Change From
Prior Year | Funding Sources - Average Balances
(dollars in thousands) | | December 31, | | % Change From
Prior Year |
| 2021 | | 2020 | | 2019 | | 2021 | | 2020 |
| | 2023 | | | | 2023 | | 2022 | | 2021 | | 2023 | | 2022 |
| Demand Deposits | Demand Deposits | | | | | | | | | | | Demand Deposits | | |
| Non-interest-bearing | Non-interest-bearing | | $ | 1,378,647 | | | $ | 1,070,284 | | | $ | 761,515 | | | 29 | % | | 41 | % | Non-interest-bearing | | $ | 1,553,082 | | | $ | | $ | 1,738,349 | | | $ | | $ | 1,378,647 | | | (11) | | (11) | % | | 26 | % |
| Interest-bearing | Interest-bearing | | 1,595,579 | | | 1,309,998 | | | 1,128,457 | | | 22 | | | 16 | |
| Savings Deposits | Savings Deposits | | 460,945 | | | 358,389 | | | 293,044 | | | 29 | | | 22 | |
| Money Market Accounts | Money Market Accounts | | 645,747 | | | 553,794 | | | 440,116 | | | 17 | | | 26 | |
| Other Time Deposits | Other Time Deposits | | 226,419 | | | 288,762 | | | 285,208 | | | (22) | | | 1 | |
| Total Core Deposits | Total Core Deposits | | 4,307,337 | | | 3,581,227 | | | 2,908,340 | | | 20 | | | 23 | |
| Certificates of Deposits of $100,000 or more and Brokered Deposits | | 186,516 | | | 279,170 | | | 385,594 | | | (33) | | | (28) | |
| Certificates of Deposits of $100,000 or more | |
| FHLB Advances and Other Borrowings | FHLB Advances and Other Borrowings | | 186,750 | | | 221,832 | | | 279,675 | | | (16) | | | (21) | |
| Total Funding Sources | Total Funding Sources | | $ | 4,680,603 | | | $ | 4,082,229 | | | $ | 3,573,609 | | | 15 | | | 14 | |
Maturities of certificates of deposit of $100,000 or more and brokered deposits are summarized as follows:
(dollars in thousands)
| | | | | | | | | | | | | | | | | | | | | | | | | | | | | | | | |
| | 3 Months
Or Less | | 3 - 6
Months | | 6 - 12 Months | | Over
12 Months | | Total |
| December 31, 2021 | | $ | 47,577 | | | $ | 34,927 | | | $ | 39,941 | | | $ | 22,971 | | | $ | 145,416 | |
| | | | | | | | | | | | | | | | | | | | | | | | | | | | | | | | |
| | 3 Months
Or Less | | 3 - 6
Months | | 6 - 12 Months | | Over
12 Months | | Total |
| December 31, 2023 | | $ | 119,055 | | | $ | 117,165 | | | $ | 222,396 | | | $ | 19,349 | | | $ | 477,965 | |
CORE DEPOSITS
The Company’s overall level of average core deposits increaseddeclined approximately $726.1$622.8 million, or 20%11%, during 20212023 compared with 2020. During 2021, average demand deposits (non-interest bearing and interest bearing) increased $593.9 million, average savings deposits increased $102.6 million, average money market demand deposits increased $92.0 million and average time deposits under $100,000 declined $62.3 million.2022. The Company’s overall level of averageperiod-end core deposits increaseddeclined approximately $672.9$381.8 million, or 23%7%, during 20202023 compared with 2019. The increase2022. Competitive deposit pricing in the marketplace as well as customers actively looking for yield opportunities within and outside the banking industry are contributing factors to the decline in total average core deposits over the course of the past year. A meaningful level of the outflow of deposits experienced during 2021 following the increase in 2020past year was largely impacted by general inflows of customers deposits generally related tocaptured within the COVID-19 pandemic, participation in the PPP, stimulus payments provided by the federal government, and an increase in public funds.Company’s wealth management group.
The Company’s ability to attract core deposits continues to be influenced by competition and the interest rate environment, as well as the availability of alternative investment products. The Company has continued to see customer movement from both interest bearing and non-interest bearing transactional accounts to time deposits due primarily to a higher interest rate environment. Core deposits continue to represent a significant funding source for the Company’s operations and represented 92%90% of average total funding sources during 20212023 compared with 88%94% during 20202022 and 81%92% during 2019.2021.
The Company’s overall level of average core deposits increased approximately $1.2 billion, or 27%, during 2022 compared with 2021, largely as a result of the CUB acquisition. During 2022, average demand deposits (non-interest bearing and interest bearing) increased $778.1 million, average savings deposits increased $179.7 million, average money market demand deposits increased $187.4 million and average time deposits under $100,000 increased $36.3 million.
Demand, savings, and money market deposits have provided a growing source of funding for the Company in each of the periods reported. Average demand, savings, and money market deposits increased 24%declined 12% during 20212023 following 26%28% growth during 2020.2022. Average demand, savings, and money market deposits totaled $4.608 billion or 95% of core deposits (85% of total funding sources) in 2023 compared with $5.226 billion or 95% of core deposits (89% of total funding sources) in 2022 and $4.080 billion or 95% of core deposits (87% of total funding sources) in 2021 compared with $3.292 billion or 92% of core deposits (81% of total funding sources) in 2020 and $2.623 billion or 90% of core deposits (73% of total funding sources) in 2019.2021.
Other time deposits consist of certificates of deposits in denominations of less than $100,000. These average deposits declined by 22%2% during 20212023 following an increase of 1%16% during 2020.2022. Other time deposits comprised 5% of core deposits in 2021, 8% in 2020 and 10% in 2019.all periods presented.
OTHER FUNDING SOURCES
Certificates of deposits in denominations of $100,000 or more and brokered deposits are an additional source of other funding for the Company’s bank subsidiary. Large denomination certificatessubsidiary and brokered deposits declined $92.7 million, or 33%, during 2021 following a decline of $106.4 million, or 28% during 2020. Large certificates and brokered deposits comprised approximately 4% of average total funding sources in 2021 compared with 7% in 2020 and 11% in 2019. This type of funding isare used as both long-term and short-term funding sources. On an average basis, large denomination certificates increased $118.8 million, or 56%, during 2023. This follows an increase of $25.1 million, or 13% during 2022. Large certificate deposits comprised approximately 6% of average total funding sources in 2023 compared with 4% in 2022 and 4% in 2021. On an end of period basis, certificates of deposits in denominations of $100,000 or more increased $284.7 million, or 147%, during 2023 compared to an increase of $47.8 million, or 33%, during 2022. As previously discussed, customers seeking higher yield opportunities were a contributing factor to growth in this category of the Company’s funding sources.
Federal Home Loan BankThe Company had no brokered deposits as of December 31, 2023 and 2022. The Company participates in a reciprocal deposit program. Reciprocal Deposits totaled $77.9 million at December 31, 2023 and $42.6 million at December 31, 2022.
FHLB advances and other borrowings represent an important source of other funding for the Company. Average borrowed funds declined $35.1increased $51.8 million, or 16%33%, during 2021 following2023 compared to a decline of $57.8$27.8 million, or 21%15%, during
2020. 2022. Borrowings comprised approximately 4% of average total funding sources during 20212023 compared with 5%3% in 20202022 and 8%4% in 2019.2021.
The bank subsidiary of the Company also utilizes short-term funding sources from time to time. These sources consist of overnight federal funds purchased from other financial institutions, secured repurchase agreements that generally mature within one day of the transaction date, and secured overnight variable rate borrowings from the FHLB. These borrowings represent an important source of short-term liquidity for the Company’s bank subsidiary.
The Company’s bank subsidiary is authorized by its Board to borrow up to $500 million at the FHLB, but availability at December 31, 2023 was limited to approximately $226 million based on the then pledged collateral and outstanding borrowings. In addition, the Company had a borrowing capacity of approximately $200 million at the Federal Reserve Bank as of December 31, 2023, based on the then pledged collateral. The capacity for borrowings from the FHLB and the Federal Reserve Bank could be increased, in each case, by the Company pledging additional available collateral. The Company’s Asset/Liability Committee closely monitors the availability of these sources as part of its overall oversight and management of the bank subsidiary’s liquidity.
Long-term debt at the Company’s bank subsidiary is in the form of FHLB advances, which are secured by the pledge of certain investment securities, residential and housing-related mortgage loans, and certain other commercial real estate loans. See Note 7 (FHLB Advances and Other Borrowings) of the Notes to the Consolidated Financial Statements included in Item 8 of this Report for further information regarding borrowed funds.
PARENT COMPANY FUNDING SOURCES
The parent company is a corporation separate and distinct from its bank and other subsidiaries. For information regarding the financial condition, result of operations, and cash flows of the Company, presented on a parent-company-only basis, see Note 17 (Parent Company Financial Statements) of the Notes to the Consolidated Financial Statements included in Item 8 of this Report.
The Company uses funds at the parent company level to pay dividends to its shareholders, to acquire or make other investments in other businesses or their securities or assets, to repurchase its stock from time to time, and for other general corporate purposes. The parent company does not have access to the deposits and certain other sources of funds that are available to its bank subsidiary to support its operations. Instead, the parent company has historically derived most of its revenues from dividends paid to the parent company by its bank subsidiary. The Company’s banking subsidiary is subject to statutory restrictions on its ability to pay dividends to the parent company. See Note 8 (Shareholders’ Equity) of the Notes to the Consolidated Financial Statements included in Item 8 of this Report, which is incorporated herein by reference. The parent
company has, in recent yearsfrom time-to-time, supplemented the dividends received from its subsidiaries with borrowings. For details related to borrowings, which are discussed in detail below.
On June 25, 2019, the Company soldsee Note 7 (FHLB Advances and issued $40.0 million in aggregate principal amount of its 4.50% Fixed-to-Floating Rate Subordinated Notes due 2029 (the “Notes”). The Company used the proceeds from the offering to pay $15.0 millionOther Borrowings) of the approximately $15.5 million of cash consideration upon closing of the Citizens First Corporation merger and the remaining balance to repay the Company’s $25.0 million term loan from U.S. Bank National Association dated October 11, 2018.
The Notes have a ten-year term, from and including the date of issuance to but excluding June 30, 2024, and will bear interest at a fixed annual rate of 4.50%, payable semi-annually in arrears. From and including June 30, 2024 to but excluding the maturity date or early redemption date, the interest rate shall reset quarterly to an interest rate per annum equal to the then-current three-month LIBOR (provided, however, thatConsolidated Financial Statements included in the event three-month LIBOR is less than zero, three-month LIBOR shall be deemed to be zero) plus 268 basis points, payable quarterly in arrears. The Notes are redeemable, in whole or in part, on June 30, 2024, on any scheduled interest payment date thereafter and at any time upon the occurrenceItem 8 of certain events. The Purchase Agreement contains certain customary representations, warranties and covenants made by the Company, on the one hand, and the Purchasers, severally and not jointly, on the other hand.
The Notes were issued under an Indenture, dated June 25, 2019, by and between the Company and U.S. Bank National Association, as trustee. The Notes are not subject to any sinking fund and are not convertible into or exchangeable for any other securities or assets of the Company or any of its subsidiaries. The Notes are not subject to redemption at the option of the holder. The Notes are unsecured, subordinated obligations of the Company only and are not obligations of, and are not guaranteed by, any subsidiary of the Company. The Notes rank junior in right to payment to the Company’s current and future senior indebtedness. The Notes are intended to qualify as Tier 2 capital for regulatory capital purposes for the Company.this Report.
At year-end 2021,2023, the Company had available to it a $15 million revolving line of credit facility that will mature on September 26, 2022.25, 2024. Borrowings are available for general working capital purposes. Interest is payable quarterly at a floating rate based upon one-month LIBORterm SOFR rate plus a margin payable in respect of any principal amounts advanced under the revolving line of credit. There was no outstanding balance as of December 31, 2021.
Effective January 1, 2011, and as a result of the acquisition of American Community Bancorp, Inc., the Company assumed long-term debt obligations of American Community in the form of two junior subordinated debentures issued by American Community in the aggregate unpaid principal amount of approximately $8.3 million. Effective March 1, 2016, and as a result of the acquisition of River Valley Bancorp, the Company assumed long-term debt obligations of River Valley in the form of a junior subordinated debenture issued by River Valley in the aggregate unpaid principal amount of approximately $7.2 million.
Effective July 1, 2019, and as a result of the acquisition of Citizens First Bancorp, the Company assumed long-term debt obligations of Citizens First in the form of a junior subordinated debenture issued by Citizens First in the aggregate unpaid principal amount of approximately $5.2 million.
The junior subordinated debentures were issued to certain statutory trusts established by River Valley, American Community, and Citizens First (in support of related issuances of trust preferred securities issued by those trusts) and mature in installments of principal payable in 2033, 2035 and 2037, respectively, and bear interest payable on a quarterly basis at a floating rate, adjustable quarterly based on the three-month LIBOR plus a specified percentage. These debentures are of a type that are eligible (under current regulatory capital requirements) to qualify as Tier 1 capital (with certain limitations) for regulatory purposes and as of December 31, 2021 approximately $16.1 million of the junior subordinated debentures were treated as Tier 1 capital for regulatory capital purposes.
See Note 17 (Parent Company Financial Statements) of the Notes to the Consolidated Financial Statements included in Item 8 of this Report for further information regarding the parent company borrowed funds and other indebtedness.2023.
RISK MANAGEMENT
The Company is exposed to various types of business risk on an on-going basis. These risks include credit risk, liquidity risk and interest rate risk. Various procedures are employed at the Company’s subsidiary bank to monitor and mitigate risk in the loan and investment portfolios, as well as risks associated with changes in interest rates. Following is a discussion of the Company’s philosophies and procedures to address these risks.
LENDING AND LOAN ADMINISTRATION
Primary responsibility and accountability for day-to-day lending activities rests with the Company’s subsidiary bank. Loan personnel at the subsidiary bank have the authority to extend credit under guidelines approved by the Bank’s board of directors. The executive loan committee serves as a vehicle for communication and for the pooling of knowledge, judgment and experience of its members. The committee provides valuable input to lending personnel, acts as an approval body, and monitors the overall quality of the Bank’s loan portfolio. The Corporate Credit Risk Management Committee comprised of members of the Company’s and its subsidiary Bank’s executive officers and board of directors, strives to ensure a consistent application of the Company’s lending policies. The Company also maintains a comprehensive risk-grading and loan review program, which includes quarterly reviews of problem loans, delinquencies and charge-offs. The purpose of this program is to evaluate loan administration, credit quality, loan documentation and the adequacy of the allowance for credit losses.
In response to requests from borrowers who had experienced pandemic-related business or personal cash flow interruptions, and in accordance with regulatory guidance, the Company began making short-term loan modifications involving both partial and full payment deferrals in April 2020. As of December 31, 2021, the Company has just one commercial real estate loan, in the principal amount of $3.5 million, with a payment modification that is still in effect, with such credit relationship making full interest payments.
The Company tracks lending exposure by industry classification to determine potential risk associated with industry concentrations, if any, that could lead to additional credit loss exposure. As a result of the COVID-19 pandemic, the Company identified certain loan segments that represented higher levels of credit risk, as many of the customers in these segments were expected to incur significant negative impacts to their businesses as a result of governmental stay-at-home orders and travel restrictions, limited attendance, social distancing and face mask requirements, and work-from-home and hybrid work models being used by employers. At December 31, 2021, the Company had the following exposure to these COVID-19-impacted loan segments:
| | | | | | | | | | | | | | | | | | | | | | | | | | |
Industry Segment
(dollars in thousands) | | Number of Loans | | Outstanding Balance | | % of Total Loans (excludes PPP Loans) | | % of Industry Segment Under Deferral |
| | | | | | | | |
| Lodging / Hotels | | 32 | | $ | 113,381 | | | 3.8 | % | | 3.1 | % |
| Retail Shopping / Strip Centers | | 58 | | 89,002 | | | 3.0 | % | | — | % |
| Restaurants | | 161 | | 62,163 | | | 2.1 | % | | — | % |
The Company maintains an allowance for credit losses to cover management'smanagement’s estimate of all expected credit losses over the expected contractual life of the loan portfolio. Management estimates the required level of allowance for credit losses using past loan loss experience, information about specific borrower situations and estimated collateral values, along with reasonable
and supportable forecasts, judgmentally adjusted for economic, external and internal quantitative and qualitative factors and portfolio trends. Economic factors include evaluating changes in international, national, regional and local economic and business conditions that affect the collectability of the loan portfolio. Internal factors include evaluating changes in lending policies and procedures; changes in the nature and volume of the loan portfolio; and changes in experience, ability and depth of lending management and staff. Allocations of the allowance may be made for specific loans, but the entire allowance is available for any loan that, in management’s judgment, should be charged-off. Loan losses are charged against the allowance when management believes the uncollectibility of a loan balance is confirmed.
The allowance for credit losses is comprised of: (a) specific reserves on individual credits; and (b) general reserves for certain loan categories and industries, and overall historical loss experience; and (c) unallocated reserves based on performance trends in the loan portfolios, current economic conditions, and other factors that influence the level of estimated credit losses. The need for specific reserves are considered for credits when: (a) the customer’s cash flow or net worth appears insufficient to repay the loan; (b) the loan has been criticized in a regulatory examination; (c) the loan is on non-accrual; or, (d) other reasons where the ultimate collectability of the loan is in question, or the loan characteristics require special monitoring.
| | | | | | | | | | | | | | | | | | | | | | | | | | | | | | | | |
Allowance for Credit Losses
(dollars in thousands) | | Years Ended December 31, |
| | 2021 | | 2020 | | 2019 | | 2018 | | 2017 |
| | | | | | | | | | |
| Balance of Allowance for Possible Losses at Beginning of Period | | $ | 46,859 | | | $ | 16,278 | | | $ | 15,823 | | | $ | 15,694 | | | $ | 14,808 | |
| Impact of adopting ASC 326 | | — | | | 8,767 | | | — | | | — | | | — | |
| Impact of adopting ASC 326 - PCD loans | | — | | | 6,886 | | | — | | | — | | | — | |
| Loans Charged-off: | | | | | | | | | | |
| Commercial and Industrial Loans and Leases | | 2,777 | | | 2,119 | | | 3,810 | | | 1,500 | | | 151 | |
| Commercial Real Estate Loans | | 10 | | | 36 | | | 320 | | | 49 | | | 220 | |
| Agricultural Loans | | — | | | — | | | — | | | — | | | 49 | |
| Home Equity and Consumer Loans | | 1,003 | | | 942 | | | 1,155 | | | 922 | | | 765 | |
| Residential Mortgage Loans | | 45 | | | 39 | | | 117 | | | 75 | | | 93 | |
| Total Loans Charged-off | | 3,835 | | | 3,136 | | | 5,402 | | | 2,546 | | | 1,278 | |
| | | | | | | | | | |
| Recoveries of Previously Charged-off Loans: | | | | | | | | | | |
| Commercial and Industrial Loans and Leases | | 61 | | | 23 | | | 56 | | | 141 | | | 14 | |
| Commercial Real Estate Loans | | 40 | | | 129 | | | 29 | | | 20 | | | 48 | |
| Agricultural Loans | | — | | | — | | | — | | | 20 | | | 9 | |
| Home Equity and Consumer Loans | | 359 | | | 358 | | | 440 | | | 387 | | | 280 | |
| Residential Mortgage Loans | | 33 | | | 4 | | | 7 | | | 37 | | | 63 | |
| Total Recoveries | | 493 | | | 514 | | | 532 | | | 605 | | | 414 | |
| | | | | | | | | | |
| Net Loans Recovered (Charged-off) | | (3,342) | | | (2,622) | | | (4,870) | | | (1,941) | | | (864) | |
| Additions to Allowance Charged to Expense | | (6,500) | | | 17,550 | | | 5,325 | | | 2,070 | | | 1,750 | |
| Balance at End of Period | | $ | 37,017 | | | $ | 46,859 | | | $ | 16,278 | | | $ | 15,823 | | | $ | 15,694 | |
| | | | | | | | | | |
| Net Charge-offs (Recoveries) to Average Loans Outstanding | | 0.11 | % | | 0.08 | % | | 0.17 | % | | 0.08 | % | | 0.04 | % |
| Provision for Credit Losses to Average Loans Outstanding | | (0.21) | % | | 0.55 | % | | 0.18 | % | | 0.09 | % | | 0.09 | % |
| Allowance for Credit Losses to Total Loans at Year-end | | 1.23 | % | | 1.52 | % | | 0.53 | % | | 0.58 | % | | 0.73 | % |
| | | | | | | | | | | | | | | | | | | | | | | | | | | | | | | | |
Allowance for Credit Losses
(dollars in thousands) | | Years Ended December 31, |
| | 2023 | | 2022 | | 2021 | | 2020 | | 2019 |
| | | | | | | | | | |
| Balance of Allowance for Expected Credit Losses at Beginning of Period | | $ | 44,168 | | | $ | 37,017 | | | $ | 46,859 | | | $ | 16,278 | | | $ | 15,823 | |
| Impact of adopting ASC 326 | | — | | | — | | | — | | | 8,767 | | | — | |
| Impact of adopting ASC 326 - PCD loans | | — | | | — | | | — | | | 6,886 | | | — | |
| Loans Charged-off: | | | | | | | | | | |
| Commercial and Industrial Loans and Leases | | 1,792 | | | 1,149 | | | 2,777 | | | 2,119 | | | 3,810 | |
| Commercial Real Estate Loans | | 56 | | | 79 | | | 10 | | | 36 | | | 320 | |
| Agricultural Loans | | 27 | | | — | | | — | | | — | | | — | |
| Home Equity and Consumer Loans | | 1,858 | | | 1,598 | | | 1,003 | | | 942 | | | 1,155 | |
| Residential Mortgage Loans | | 58 | | | 24 | | | 45 | | | 39 | | | 117 | |
| Total Loans Charged-off | | 3,791 | | | 2,850 | | | 3,835 | | | 3,136 | | | 5,402 | |
| | | | | | | | | | |
| Recoveries of Previously Charged-off Loans: | | | | | | | | | | |
| Commercial and Industrial Loans and Leases | | 154 | | | 26 | | | 61 | | | 23 | | | 56 | |
| Commercial Real Estate Loans | | 76 | | | 24 | | | 40 | | | 129 | | | 29 | |
| Agricultural Loans | | — | | | — | | | — | | | — | | | — | |
| Home Equity and Consumer Loans | | 605 | | | 479 | | | 359 | | | 358 | | | 440 | |
| Residential Mortgage Loans | | 3 | | | 5 | | | 33 | | | 4 | | | 7 | |
| Total Recoveries | | 838 | | | 534 | | | 493 | | | 514 | | | 532 | |
| | | | | | | | | | |
| Net Loans Recovered (Charged-off) | | (2,953) | | | (2,316) | | | (3,342) | | | (2,622) | | | (4,870) | |
| Acquisition of Citizens Union Bank of Shelbyville, KY - PCD Loans | | — | | | 3,117 | | | — | | | — | | | — | |
| Additions to Allowance Charged to Expense | | 2,550 | | | 6,350 | | | (6,500) | | | 17,550 | | | 5,325 | |
| Balance at End of Period | | $ | 43,765 | | | $ | 44,168 | | | $ | 37,017 | | | $ | 46,859 | | | $ | 16,278 | |
| | | | | | | | | | |
| Net Charge-offs (Recoveries) to Average Loans Outstanding | | 0.08 | % | | 0.06 | % | | 0.11 | % | | 0.08 | % | | 0.17 | % |
| Provision for Credit Losses to Average Loans Outstanding | | 0.07 | % | | 0.17 | % | | (0.21) | % | | 0.55 | % | | 0.18 | % |
| Allowance for Credit Losses to Total Loans at Year-end | | 1.10 | % | | 1.17 | % | | 1.23 | % | | 1.52 | % | | 0.53 | % |
The following table indicates the breakdown of the allowance for credit losses for the periods indicated (dollars in thousands): | | | | | | | | | | | | | | | | | | | | | | | | | | | | | | | | |
| | Years Ended December 31, |
| | 2021 | | 2020 | | 2019 | | 2018 | | 2017 |
| Commercial and Industrial Loans and Leases | | $ | 9,754 | | | $ | 6,645 | | | $ | 4,799 | | | $ | 2,953 | | | $ | 4,735 | |
| Commercial Real Estate Loans | | 19,245 | | | 29,878 | | | 4,692 | | | 5,291 | | | 4,591 | |
| Agricultural Loans | | 4,505 | | | 6,756 | | | 5,315 | | | 5,776 | | | 4,894 | |
| Home Equity and Consumer Loans | | 1,808 | | | 1,636 | | | 634 | | | 649 | | | 628 | |
| Residential Mortgage Loans | | 1,705 | | | 1,944 | | | 333 | | | 472 | | | 343 | |
| Unallocated | | — | | | — | | | 505 | | | 682 | | | 503 | |
| | | | | | | | | | |
| Total Allowance for Credit Losses | | $ | 37,017 | | | $ | 46,859 | | | $ | 16,278 | | | $ | 15,823 | | | $ | 15,694 | |
47 | | | | | | | | | | | | | | | | | | | | | | | | | | | | | | | | |
| | Years Ended December 31, |
| | 2023 | | 2022 | | 2021 | | 2020 | | 2019 |
| Commercial and Industrial Loans and Leases | | $ | 8,267 | | | $ | 13,958 | | | $ | 9,754 | | | $ | 6,645 | | | $ | 4,799 | |
| Commercial Real Estate Loans | | 25,923 | | | 21,598 | | | 19,245 | | | 29,878 | | | 4,692 | |
| Agricultural Loans | | 3,837 | | | 4,188 | | | 4,505 | | | 6,756 | | | 5,315 | |
| Home Equity and Consumer Loans | | 2,976 | | | 2,196 | | | 1,808 | | | 1,636 | | | 634 | |
| Residential Mortgage Loans | | 2,762 | | | 2,228 | | | 1,705 | | | 1,944 | | | 333 | |
| Unallocated | | — | | | — | | | — | | | — | | | 505 | |
| | | | | | | | | | |
| Total Allowance for Credit Losses | | $ | 43,765 | | | $ | 44,168 | | | $ | 37,017 | | | $ | 46,859 | | | $ | 16,278 | |
The Company’s allowance for credit losses totaled $37.0$43.8 million at December 31, 20212023 compared to $46.9$44.2 million at December 31, 2020.2022. The allowance for credit losses represented 1.23%1.10% of period-end loans at December 31, 20212023 compared with 1.52%1.17% of period-end loans at year-end 2020.
Under the CECL model, which was adopted by the Company on January 1, 2020, certain acquired loans continue to carry a fair value discount as well as an allowance for credit losses. As of December 31, 2021, the Company held net discounts on acquired loans of $4.9 million.2022.
The allowance for credit losses declined during 2021 as a result of the Company recording a negative $6.5adopted ASU No. 2016-13, Financial instruments - Credit Losses (Topic 326) on January 1, 2020. The Company added $9.4 million provision for credit losses while recording modest net charge-offs. During 2020,to the allowance for credit losses increasedin conjunction with the closing of the CUB acquisition on January 1, 2022 related to the CUB loan portfolio. Of the increase in allowance for credit losses for the CUB portfolio, $6.3 million was recorded through elevatedthe provision for credit losses primarily due toon “Day 1” under the developments during 2020 related toCECL model for non-PCD loans. The Company also acquired $29.9 million in PCD loans (at time of acquisition) for which the COVID-19 pandemic and the resulting impact on the economic assumptions usedcompany recorded a credit adjustment of $3.1 million which was included in the CECL model.allowance for credit losses.
The Company realized net charge-offs of $2,953,000, or 0.08% of average loans outstanding, during 2023 compared with $2,316,000, or 0.06% of average loans outstanding, during 2022 and $3,342,000, or 0.11% of average loans outstanding, during 2021 compared with net charge-offs of $2,622,000, or 0.08% of average loans outstanding during 2020 and $4,870,000, or 0.17% of average loans during 2019.2021.
Please see “RESULTS OF OPERATIONS - Provision for Credit Losses” and “CRITICAL ACCOUNTING POLICIES AND ESTIMATES - Allowance for Credit Losses” for additional information regarding the allowance.
NON-PERFORMING ASSETS
Non-performing assets consist of: (a) non-accrual loans; (b) loans which have been renegotiated to provide for a reduction or deferral of interest or principal because of deterioration in the financial condition of the borrower; (c) loans past due 90 days or more as to principal or interest; and, (d) other real estate owned. Loans are placed on non-accrual status when scheduled principal or interest payments are past due for 90 days or more or when the borrower’s ability to repay becomes doubtful. Uncollected accrued interest is reversed against income at the time a loan is placed on non-accrual. Loans are typically charged-off at 180 days past due, or earlier if deemed uncollectible. Exceptions to the non-accrual and charge-off policies are made when the loan is well secured and in the process of collection. The following table presents an analysis of the Company’s non-performing assets.
| | Non-performing Assets | Non-performing Assets | | December 31, | Non-performing Assets | | December 31, |
| (dollars in thousands) | (dollars in thousands) | | 2021 | | 2020 | | 2019 | | 2018 | | 2017 | (dollars in thousands) | | 2023 | | 2022 | | 2021 | | 2020 | | 2019 |
| | Non-accrual Loans | |
| Non-accrual Loans | |
| Non-accrual Loans | Non-accrual Loans | | $ | 14,602 | | | $ | 21,507 | | | $ | 13,802 | | | $ | 12,579 | | | $ | 11,091 | |
| Past Due Loans (90 days or more and accruing) | Past Due Loans (90 days or more and accruing) | | 156 | | | — | | | 190 | | | 633 | | | 719 | |
| Total Non-performing Loans | Total Non-performing Loans | | 14,758 | | | 21,507 | | | 13,992 | | | 13,212 | | | 11,810 | |
| Other Real Estate | Other Real Estate | | — | | | 325 | | | 425 | | | 286 | | | 54 | |
| Total Non-performing Assets | Total Non-performing Assets | | $ | 14,758 | | | $ | 21,832 | | | $ | 14,417 | | | $ | 13,498 | | | $ | 11,864 | |
| | Restructured Loans | Restructured Loans | | $ | 104 | | | $ | 111 | | | $ | 116 | | | $ | 121 | | | $ | 149 | |
| Restructured Loans | |
| Restructured Loans | |
| Non-performing Loans to Total Loans | Non-performing Loans to Total Loans | | 0.49 | % | | 0.70 | % | | 0.45 | % | | 0.48 | % | | 0.55 | % | Non-performing Loans to Total Loans | | 0.23 | % | | 0.38 | % | | 0.49 | % | | 0.70 | % | | 0.45 | % |
| Allowance for Credit Losses to Non-performing Loans | Allowance for Credit Losses to Non-performing Loans | | 250.83 | % | | 217.88 | % | | 116.34 | % | | 119.76 | % | | 132.89 | % | Allowance for Credit Losses to Non-performing Loans | | 476.17 | % | | 308.54 | % | | 250.83 | % | | 217.88 | % | | 116.34 | % |
Non-performing assets totaled $14.8 million, or 0.26% of total assets at December 31, 2021 compared to $21.8 million, or 0.44% of total assets at December 31, 2020 and compared to $14.4 million, or 0.33% of total assets at December 31, 2019. Non-performing loans totaled $14.8 million, or 0.49% of total loans at December 31, 2021 compared with $21.5 million, or 0.70% of total loans at December 31, 2020 and $14.0 million, or 0.45% of total loans at December 31, 2019. The decline in the level of commercial real estate non-performing loans during 2021 was largely attributable to the payoff of a commercial real estate credit in the lodging industry that was placed in non-accrual status during the third quarter of 2020.
The increase in the level of non-performing assets and non-performing loans at December 31, 2020 compared with year-end 2019 was largely attributable to the gross-up of purchased credit deteriorated loans upon the adoption of the CECL standard during 2020 and a commercial real estate credit in the lodging industry that was moved to non-performing status in the third quarter of 2020.
The following tables present an analysis of the Company’s non-accrual loans and loans past due 90 days or more and still accruing.
| | Non-Accrual Loans | Non-Accrual Loans | | December 31, | Non-Accrual Loans | | December 31, |
| (dollars in thousands) | (dollars in thousands) | | 2021 | | 2020 | | 2019 | | 2018 | | 2017 | (dollars in thousands) | | 2023 | | 2022 | | 2021 | | 2020 | | 2019 |
| | Commercial and Industrial Loans and Leases | |
| Commercial and Industrial Loans and Leases | |
| Commercial and Industrial Loans and Leases | Commercial and Industrial Loans and Leases | | $ | 10,530 | | | $ | 8,133 | | | $ | 4,940 | | | $ | 2,430 | | | $ | 4,753 | |
| Commercial Real Estate Loans | Commercial Real Estate Loans | | 2,243 | | | 10,188 | | | 3,433 | | | 6,833 | | | 4,618 | |
| Agricultural Loans | Agricultural Loans | | 1,136 | | | 1,915 | | | 2,739 | | | 1,449 | | | 748 | |
| Home Equity Loans | Home Equity Loans | | 24 | | | 271 | | | 79 | | | 88 | | | 199 | |
| Consumer Loans | Consumer Loans | | 82 | | | 170 | | | 115 | | | 162 | | | 286 | |
| Residential Mortgage Loans | Residential Mortgage Loans | | 587 | | | 830 | | | 2,496 | | | 1,617 | | | 487 | |
| Total | Total | | $ | 14,602 | | | $ | 21,507 | | | $ | 13,802 | | | $ | 12,579 | | | $ | 11,091 | |
| | | | | | | | | | | | | | | | | | | | | | | | | | | | | | | | |
| Loans Past Due 90 Days or More & Still Accruing | | December 31, |
| (dollars in thousands) | | 2021 | | 2020 | | 2019 | | 2018 | | 2017 |
| | | | | | | | | | |
| Commercial and Industrial Loans and Leases | | $ | — | | | $ | — | | | $ | 190 | | | $ | — | | | $ | — | |
| Commercial Real Estate Loans | | 156 | | | — | | | — | | | 364 | | | 471 | |
| Agricultural Loans | | — | | | — | | | — | | | 269 | | | 248 | |
| Home Equity Loans | | — | | | — | | | — | | | — | | | — | |
| Consumer Loans | | — | | | — | | | — | | | — | | | — | |
| Residential Mortgage Loans | | — | | | — | | | — | | | — | | | — | |
| Total | | $ | 156 | | | $ | — | | | $ | 190 | | | $ | 633 | | | $ | 719 | |
| | | | | | | | | | | | | | | | | | | | | | | | | | | | | | | | |
| Loans Past Due 90 Days or More & Still Accruing | | December 31, |
| (dollars in thousands) | | 2023 | | 2022 | | 2021 | | 2020 | | 2019 |
| | | | | | | | | | |
| Commercial and Industrial Loans and Leases | | $ | — | | | $ | 1,427 | | | $ | — | | | $ | — | | | $ | 190 | |
| Commercial Real Estate Loans | | 55 | | | — | | | 156 | | | — | | | — | |
| Agricultural Loans | | — | | | — | | | — | | | — | | | — | |
| Home Equity Loans | | — | | | — | | | — | | | — | | | — | |
| Consumer Loans | | — | | | — | | | — | | | — | | | — | |
| Residential Mortgage Loans | | — | | | — | | | — | | | — | | | — | |
| Total | | $ | 55 | | | $ | 1,427 | | | $ | 156 | | | $ | — | | | $ | 190 | |
Non-performing assets totaled $9.2 million, or 0.15% of total assets, at December 31, 2023 compared to $14.3 million, or 0.23% of total assets, at December 31, 2022 and compared to $14.8 million, or 0.26% of total assets, at December 31, 2021. Non-performing loans totaled $9.2 million, or 0.23% of total loans, at December 31, 2023 compared with $14.3 million, or 0.38% of total loans, at December 31, 2022 and compared with $14.8 million, or 0.49% of total loans, at December 31, 2021.
The decline in the level of non-performing commercial and industrial loans and leases during 2023 was primarily attributable to the resolution of a single commercial borrowing relationship with minimal loss recognition for which the Company had established a significant reserve in previous periods. The decline in the level of non-performing commercial and industrial loans and leases during 2022 was primarily attributable to certain credits that were either charged-off or paid off, which were in non-accrual status.
For additional detail on individually analyzed loans, see Note 4 in(Loans) of the Notes to the Consolidated Financial Statements included in Item 8 of this Report.
Interest income recognized on non-performing loans for 20212023 was $630,000.$231,000. The gross interest income that would have been recognized in 20212023 on non-performing loans if the loans had been current in accordance with their original terms was $891,000.$1,313,000. Loans are typically placed on non-accrual status when scheduled principal or interest payments are past due for 90 days or more, unless the loan is well secured and in the process of collection.
LIQUIDITY AND INTEREST RATE RISK MANAGEMENT
Liquidity is a measure of the ability of the Company’s subsidiary bank to fund new loan demand, existing loan commitments and deposit withdrawals. The purpose of liquidity management is to match sources of funds with anticipated customer borrowings and withdrawals and other obligations to ensure a dependable funding base, without unduly penalizing earnings. Failure to properly manage liquidity requirements can result in the need to satisfy customer withdrawals and other obligations on less than desirable terms. The liquidity of the parent company is dependent upon the receipt of dividends from its bank subsidiary, which are subject to certain regulatory limitations explained in Note 8 (Shareholders’ Equity) of the Notes to the Consolidated Financial Statements included in Item 8 of this Report. The subsidiary bank’s source of funding is predominately core deposits, time deposits in excess of $100,000 and brokered certificates of deposit, maturities of securities, repayments of loan principal and interest, federal funds purchased, securities sold under agreements to repurchase and borrowings from the Federal Home Loan Bank and Federal Reserve Bank.
Interest rate risk is the exposure of the Company’s financial condition to adverse changes in market interest rates. In an effort to estimate the impact of sustained interest rate movements to the Company’s earnings, the Company monitors interest rate risk through computer-assisted simulation modeling of its net interest income. The Company’s simulation modeling monitors the potential impact to net interest income under various interest rate scenarios. The Company’s objective is to actively manage its asset/liability position within a one-year interval and to limit the risk in any of the interest rate scenarios to a reasonable level of tax-equivalent net interest income within that interval. The Company’s Asset/Liability Committee monitors compliance within established guidelines of the Funds Management Policy. See Item 7A. Quantitative and Qualitative Disclosures About Market Risk section for further discussion regarding interest rate risk.
Item 7A. Quantitative and Qualitative Disclosures About Market Risk.
The Company’s exposure to market risk is reviewed on a regular basis by the Asset/Liability Committee and Boards of Directors of the parent company and its subsidiary bank. Primary market risks which impact the Company’s operations are liquidity risk and interest rate risk.
The liquidity of the parent company is dependent upon the receipt of dividends from its subsidiary bank, which is subject to certain regulatory limitations. The Bank’s source of funding is predominately core deposits, maturities of securities, repayments of loan principal and interest, federal funds purchased, securities sold under agreements to repurchase and borrowings from the Federal Home Loan Bank.
The Company monitors interest rate risk by the use of computer simulation modeling to estimate the potential impact on its net interest income under various interest rate scenarios, and by estimating its static interest rate sensitivity position. Another method by which the Company’s interest rate risk position can be estimated is by computing estimated changes in its net portfolio value (“NPV”). This method estimates interest rate risk exposure from movements in interest rates by using interest rate sensitivity analysis to determine the change in the NPV of discounted cash flows from assets and liabilities. NPV represents the market value of portfolio equity and is equal to the estimated market value of assets minus the estimated market value of liabilities.
Computations for measuring both net interest income and NPV are based on a number of assumptions, including the relative levels of market interest rates and prepayments in mortgage loans and certain types of investments. These computations do not contemplate any actions management may undertake in response to changes in interest rates, and should not be relied upon as indicative of actual results. In addition, certain shortcomings are inherent in the method of computing both net interest income and NPV. Should interest rates remain or decrease below current levels, the proportion of adjustable rate loans could decrease in future periods due to refinancing activity. In the event of an interest rate change, prepayment levels would likely be different from those assumed in the modeling. Lastly, the ability of many borrowers to repay their adjustable rate debt may decline during a rising interest rate environment.
The Company from time to time utilizes derivatives to manage interest rate risk. Management continuously evaluates the merits of such interest rate risk products but does not anticipate the use of such products to become a major part of the Company’s risk management strategy.
The table below provides an assessment of the risk to net interest income over the next 12 months in the event of a sudden and sustained 1% and 2% increase and decrease in prevailing interest rates (dollars in thousands).
Interest Rate Sensitivity as of December 31, 20212023 - Net Interest Income
| | | Net Interest Income | |
| | | Net Interest Income | |
| | | | | |
| Changes in Rates | Changes in Rates | | Amount | | % Change | |
| Changes in Rates | |
| Changes in Rates | |
| +2% | |
| +2% | |
| +2% | +2% | | $ | 147,827 | | | (1.87) | % | |
| +1% | +1% | | 148,436 | | | (1.46) | | |
| +1% | |
| +1% | |
| Base | |
| Base | |
| Base | Base | | 150,639 | | | — | | |
| -1% | -1% | | 146,159 | | | (2.97) | | |
| -1% | |
| -1% | |
| -2% | -2% | | 142,821 | | | (5.19) | | |
| -2% | |
| -2% | |
The above table is a measurement of the Company’s net interest income at risk, assuming a static balance sheet as of December 31, 20212023 and instantaneous parallel changes in interest rates. The Company also monitors interest rate risk under other scenarios including a more gradual movement in market interest rates. This type of scenario can at times produce different modeling results in measuring interest rate risk sensitivity.
The table below provides an assessment of the risk to NPV in the event of a sudden and sustained 1% and 2% increase and decrease in prevailing interest rates (dollars in thousands).
Interest Rate Sensitivity as of December 31, 20212023 - Net Portfolio Value
| | Net Portfolio Value | | Net Portfolio Value as a % of Present Value of Assets |
| | Net Portfolio Value | | | | Net Portfolio Value | | Net Portfolio Value as a % of Present Value of Assets |
| Changes in Rates | Changes in Rates | | Amount | | % Change | | NPV Ratio | | Change | Changes in Rates | | Amount | | % Change | | NPV Ratio | | Change |
| | +2% | |
| +2% | |
| +2% | +2% | | $ | 616,194 | | | (10.00) | % | | 11.94 | % | | (54) b.p. | | $ | 575,830 | | | (17.25) | | (17.25) | % | | 10.72 | % | | (140) b.p. |
| +1% | +1% | | 654,725 | | | (4.37) | | | 12.30 | | | (18) b.p. | +1% | | 637,347 | | | (8.41) | | (8.41) | | | 11.48 | | 11.48 | | | (64) b.p. | | (64) b.p. |
| Base | Base | | 684,667 | | | — | | | 12.48 | | | — | |
| -1% | -1% | | 685,436 | | | 0.11 | | | 12.07 | | | (41) b.p. | -1% | | 743,599 | | | 6.86 | | 6.86 | | | 12.54 | | 12.54 | | | 42 b.p. | | 42 b.p. |
| -2% | -2% | | 546,441 | | | (20.19) | | | 9.60 | | | (288) b.p. | -2% | | 770,311 | | | 10.69 | | 10.69 | | | 12.60 | | 12.60 | | | 48 b.p. | | 48 b.p. |
The above discussion, and the portions of MANAGEMENT’S DISCUSSION AND ANALYSIS in Item 7 of this Report that are referenced in the above discussion contain statements relating to future results of the Company that are considered “forward-looking statements” within the meaning of the Private Securities Litigation Reform Act of 1995. These statements relate to, among other things, simulation of the impact on net interest income from changes in interest rates. Actual results may differ materially from those expressed or implied therein as a result of certain risks and uncertainties, including those risks and uncertainties expressed above, those that are described in MANAGEMENT’S DISCUSSION AND ANALYSIS in Item 7 of this Report, and those that are described in Item 1 of this Report, “Business,” under the caption “Forward-Looking Statements and Associated Risks,” which discussions are incorporated herein by reference.
Item 8. Financial Statements and Supplementary Data.
| | |
Report of Independent Registered Public Accounting Firm
|
Shareholders and the Board of Directors of German American Bancorp, Inc.
Jasper, Indiana
Opinions on the Financial Statements and Internal Control over Financial Reporting
We have audited the accompanying consolidated balance sheets of German American Bancorp, Inc. (the “Company”) as of December 31, 20212023 and 2020,2022, the related consolidated statements of income, comprehensive income (loss), changes in shareholders’ equity, and cash flows for each of the years in the three-year period ended December 31, 2021,2023, and the related notes (collectively referred to as the “financial statements”). We also have audited the Company’s internal control over financial reporting as of December 31, 2021,2023, based on criteria established in Internal Control – Integrated Framework: (2013) issued by the Committee of Sponsoring Organizations of the Treadway Commission (COSO).
In our opinion, the financial statements referred to above present fairly, in all material respects, the financial position of the Company as of December 31, 20212023 and 2020,2022, and the results of its operations and its cash flows for each of the years in the three-year period ended December 31, 20212023 in conformity with accounting principles generally accepted in the United States of America. Also in our opinion, the Company maintained, in all material respects, effective internal control over financial reporting as of December 31, 2021,2023, based on criteria established in Internal Control – Integrated Framework: (2013) issued by COSO.
Change in Accounting Principle
As discussed in Note 1 to the financial statements, the Company has changed its method of accounting for credit losses effective January 1, 2020 due to the adoption of Financial Accounting Standards Board (FASB) Accounting Standards Codification No. 326, Financial Instruments – Credit Losses (ASC 326). The Company adopted the new credit loss standard using the modified retrospective method such that prior period amounts are not adjusted and continue to be reported in accordance with previously applicable generally accepted accounting principles.
Basis for Opinions
The Company’s management is responsible for these financial statements, for maintaining effective internal control over financial reporting, and for its assessment of the effectiveness of internal control over financial reporting, included in the accompanying Management’s Report on Internal Control Over Financial Reporting. Our responsibility is to express an opinion on the Company’s financial statements and an opinion on the Company’s internal control over financial reporting based on our audits. We are a public accounting firm registered with the Public Company Accounting Oversight Board (United States) (“PCAOB”) and are required to be independent with respect to the Company in accordance with the U.S. federal securities laws and the applicable rules and regulations of the Securities and Exchange Commission and the PCAOB.
We conducted our audits in accordance with the standards of the PCAOB. Those standards require that we plan and perform the audits to obtain reasonable assurance about whether the financial statements are free of material misstatement, whether due to error or fraud, and whether effective internal control over financial reporting was maintained in all material respects.
Our audits of the financial statements included performing procedures to assess the risks of material misstatement of the financial statements, whether due to error or fraud, and performing procedures that respond to those risks. Such procedures included examining, on a test basis, evidence regarding the amounts and disclosures in the financial statements. Our audits also included evaluating the accounting principles used and significant estimates made by management, as well as evaluating the overall presentation of the financial statements. Our audit of internal control over financial reporting included obtaining an understanding of internal control over financial reporting, assessing the risk that a material weakness exists, and testing and evaluating the design and operating effectiveness of internal control based on the assessed risk. Our audits also included performing such other procedures as we considered necessary in the circumstances. We believe that our audits provide a reasonable basis for our opinions.
| | | | | | | | | | | | | | |
Report of Independent Registered Public Accounting Firm
|
Definition and Limitations of Internal Control Over Financial Reporting
A company’s internal control over financial reporting is a process designed to provide reasonable assurance regarding the reliability of financial reporting and the preparation of financial statements for external purposes in accordance with generally accepted accounting principles. A company’s internal control over financial reporting includes those policies and procedures that (1) pertain to the maintenance of records that, in reasonable detail, accurately and fairly reflect the transactions and dispositions of the assets of the company; (2) provide reasonable assurance that transactions are recorded as necessary to permit preparation of financial statements in accordance with generally accepted accounting principles, and that receipts and expenditures of the company are being made only in accordance with authorizations of management and directors of the company; and (3) provide reasonable assurance regarding prevention or timely detection of unauthorized acquisition, use, or disposition of the company’s assets that could have a material effect on the financial statements.
Because of its inherent limitations, internal control over financial reporting may not prevent or detect misstatements. Also, projections of any evaluation of effectiveness to future periods are subject to the risk that controls may become inadequate because of changes in conditions, or that the degree of compliance with the policies or procedures may deteriorate.
Critical Audit Matters
The critical audit matter communicated below is a matter arising from the current period audit of the consolidated financial statements that was communicated or required to be communicated to the audit committee and that: (i) relates to accounts or disclosures that are material to the consolidated financial statements and (ii) involved our especially challenging, subjective, or complex judgments. The communication of the critical audit matter does not alter in any way our opinion on the consolidated financial statements, taken as a whole, and we are not, by communicating the critical audit matter below, providing a separate opinion on the critical audit matter or on the accounts or disclosures to which it relates.
Allowance for Credit Losses on Loans
As discussed in Notes 1 and 4, the allowance for credit losses (the “ACL”) is an accounting estimate of expected credit losses over the estimated life of financial assets carried at amortized cost and off-balance-sheet credit exposures in accordance with Accounting Standards Update (the “ASU”) 2016-13, Financial Instruments —Credit Losses (Topic 326): Measurement of Credit Losses on Financial Instruments. The standard requires the Company'sCompany’s loan portfolio, measured at amortized cost, to be presented at the net amount expected to be collected. Estimates of expected credit losses for loans are based on historical experience, current conditions and reasonable and supportable forecasts over the estimated life of the loans. In order to estimate the expected credit losses, the Company utilizes a loss estimation model. The Company utilizes the static pool methodology for determining the allowance for credit losses. The static pool methodology tracks loan pool by segment over a period of time to calculate a loss rate. Loss rates are then qualitatively adjusted for current conditions and reasonable and supportable forecast. Commercial and agricultural loans graded special mention and substandard are also adjusted based on a migration analysis technique.
Auditing the Allowance for Credit Losses for Loans was identified by us as a critical audit matter because of the extent of auditor judgment applied and significant audit effort to evaluate the significant subjective and complex judgments made by management. The principal considerations resulting in our determination included the following:
•Significant auditor judgment and effort were used in evaluating the qualitative factors used in the calculation.
•Significant audit effort to test the completeness and accuracy of data used in the migration analysis calculation, including accuracy of loan risk rating, and its application to the commercial and agricultural loan segments.
The primary procedures performed to address this critical audit matter included:
•Testing the effectiveness of controls over the Company’s preparation and review of the allowance for credit loss calculation, including relevance and reliability of data used as the basis for adjustments related to the qualitative factors, management’s judgments and significant assumptions in the development and reasonableness of qualitative factors, and mathematical accuracy and appropriateness of the application of qualitative factors;
| | | | | | | | | | | | | | |
Report of Independent Registered Public Accounting Firm
|
•Substantively testing management’s process for developing the qualitative factors and assessing relevance and reliability of data used to develop factors, including evaluating their judgments and significant assumptions for reasonableness, and mathematical accuracy and appropriateness of the application of qualitative factors;
•Testing the effectiveness of controls over the Company’s loan risk rating;
•Substantively testing the accuracy of both the loan risk ratings as well as testing the accuracy of the transition matrix.
We have served as the Company'sCompany’s auditor since 1977.
Louisville, Kentucky
March 1, 2022February 27, 2024
| | |
| Consolidated Balance Sheets |
| Dollars in thousands, except share and per share data |
| | | December 31, | | | | December 31, |
| | | December 31, |
| | | | | 2021 | | 2020 | | 2023 | | 2022 |
| ASSETS | ASSETS | | | | | ASSETS | | |
| Cash and Due from Banks | Cash and Due from Banks | | $ | 47,173 | | | $ | 57,972 | |
| Federal Funds Sold and Other Short-term Investments | Federal Funds Sold and Other Short-term Investments | | 349,717 | | | 287,776 | |
| Cash and Cash Equivalents | Cash and Cash Equivalents | | 396,890 | | | 345,748 | |
| | Interest-bearing Time Deposits with Banks | Interest-bearing Time Deposits with Banks | | 745 | | | 1,241 | |
| Securities Available-for-Sale, at Fair Value (Amortized Cost $1,869,198 for December 31, 2021; Amortized Cost $1,172,175 for December 31, 2020; No Allowance for Credit Losses) | | 1,889,617 | | | 1,217,852 | |
| Interest-bearing Time Deposits with Banks | |
| Interest-bearing Time Deposits with Banks | |
| Securities Available-for-Sale, at Fair Value (Amortized Cost $1,871,260 for December 31, 2023; Amortized Cost $2,094,826 for December 31, 2022; No Allowance for Credit Losses) | |
| Other Investments | Other Investments | | 353 | | | 353 | |
| | Loans Held-for-Sale, at Fair Value | Loans Held-for-Sale, at Fair Value | | 10,585 | | | 16,904 | |
| Loans Held-for-Sale, at Fair Value | |
| Loans Held-for-Sale, at Fair Value | |
| | Loans | |
| Loans | |
| Loans | Loans | | 3,007,926 | | | 3,091,998 | |
| Less: Unearned Income | Less: Unearned Income | | (3,662) | | | (3,926) | |
| Allowance for Credit Losses | Allowance for Credit Losses | | (37,017) | | | (46,859) | |
| Loans, Net | Loans, Net | | 2,967,247 | | | 3,041,213 | |
| | Stock in FHLB of Indianapolis and Other Restricted Stock, at Cost | |
| Stock in FHLB of Indianapolis and Other Restricted Stock, at Cost | |
| Stock in FHLB of Indianapolis and Other Restricted Stock, at Cost | Stock in FHLB of Indianapolis and Other Restricted Stock, at Cost | | 13,048 | | | 13,168 | |
| Premises, Furniture and Equipment, Net | Premises, Furniture and Equipment, Net | | 88,863 | | | 96,593 | |
| Other Real Estate | Other Real Estate | | — | | | 325 | |
| Goodwill | Goodwill | | 121,761 | | | 121,956 | |
| Intangible Assets | Intangible Assets | | 5,845 | | | 8,984 | |
| Company Owned Life Insurance | Company Owned Life Insurance | | 70,070 | | | 69,250 | |
| Accrued Interest Receivable and Other Assets | Accrued Interest Receivable and Other Assets | | 43,515 | | | 43,990 | |
| | TOTAL ASSETS | TOTAL ASSETS | | $ | 5,608,539 | | | $ | 4,977,577 | |
| TOTAL ASSETS | |
| TOTAL ASSETS | |
| | LIABILITIES | |
| LIABILITIES | |
| LIABILITIES | LIABILITIES | | | | | | |
| Non-interest-bearing Demand Deposits | Non-interest-bearing Demand Deposits | | $ | 1,529,223 | | | $ | 1,183,442 | |
| Interest-bearing Demand, Savings, and Money Market Accounts | Interest-bearing Demand, Savings, and Money Market Accounts | | 2,867,994 | | | 2,428,636 | |
| Time Deposits | Time Deposits | | 347,099 | | | 494,452 | |
| | Total Deposits | Total Deposits | | 4,744,316 | | | 4,106,530 | |
| Total Deposits | |
| Total Deposits | |
| | FHLB Advances and Other Borrowings | |
| FHLB Advances and Other Borrowings | |
| FHLB Advances and Other Borrowings | FHLB Advances and Other Borrowings | | 152,183 | | | 194,529 | |
| Accrued Interest Payable and Other Liabilities | Accrued Interest Payable and Other Liabilities | | 43,581 | | | 51,809 | |
| | TOTAL LIABILITIES | TOTAL LIABILITIES | | 4,940,080 | | | 4,352,868 | |
| TOTAL LIABILITIES | |
| TOTAL LIABILITIES | |
| | Commitments and Contingencies (See Note 14) | Commitments and Contingencies (See Note 14) | | 0 | | 0 |
| Commitments and Contingencies (See Note 14) | |
| Commitments and Contingencies (See Note 14) | | | |
| | SHAREHOLDERS’ EQUITY | |
| SHAREHOLDERS’ EQUITY | |
| SHAREHOLDERS’ EQUITY | SHAREHOLDERS’ EQUITY | | | | | | |
| Common Stock, no par value, $1 stated value; 45,000,000 shares authorized | Common Stock, no par value, $1 stated value; 45,000,000 shares authorized | | 26,554 | | | 26,502 | |
| Additional Paid-in Capital | Additional Paid-in Capital | | 276,057 | | | 274,385 | |
| Retained Earnings | Retained Earnings | | 350,364 | | | 288,447 | |
| Accumulated Other Comprehensive Income | | 15,484 | | | 35,375 | |
| Accumulated Other Comprehensive Income (Loss) | |
| | TOTAL SHAREHOLDERS’ EQUITY | |
| TOTAL SHAREHOLDERS’ EQUITY | |
| TOTAL SHAREHOLDERS’ EQUITY | TOTAL SHAREHOLDERS’ EQUITY | | 668,459 | | | 624,709 | |
| | TOTAL LIABILITIES AND SHAREHOLDERS’ EQUITY | TOTAL LIABILITIES AND SHAREHOLDERS’ EQUITY | | $ | 5,608,539 | | | $ | 4,977,577 | |
| TOTAL LIABILITIES AND SHAREHOLDERS’ EQUITY | |
| TOTAL LIABILITIES AND SHAREHOLDERS’ EQUITY | |
| | End of period shares issued and outstanding | End of period shares issued and outstanding | | 26,553,508 | | | 26,502,157 | |
| End of period shares issued and outstanding | |
| End of period shares issued and outstanding | |
|
See accompanying notes to the consolidated financial statements.
| | |
| Consolidated Statements of Income |
| Dollars in thousands, except per share data |
| | | Years Ended December 31, | | | | Years Ended December 31, |
| | | Years Ended December 31, |
| | | | | 2021 | | 2020 | | 2019 | | 2023 | | 2022 | | 2021 |
| INTEREST INCOME | INTEREST INCOME | | | | | | | INTEREST INCOME | | |
| | Interest and Fees on Loans | Interest and Fees on Loans | | $ | 139,151 | | | $ | 151,658 | | | $ | 152,481 | |
| Interest and Fees on Loans | |
| Interest and Fees on Loans | |
| Interest on Federal Funds Sold and Other Short-term Investments | Interest on Federal Funds Sold and Other Short-term Investments | | 488 | | | 382 | | | 522 | |
| Interest and Dividends on Securities: | Interest and Dividends on Securities: | | | | | | | Interest and Dividends on Securities: | | |
| Taxable | Taxable | | 12,962 | | | 10,447 | | | 13,910 | |
| Non-taxable | Non-taxable | | 17,778 | | | 11,882 | | | 9,561 | |
| | TOTAL INTEREST INCOME | TOTAL INTEREST INCOME | | 170,379 | | | 174,369 | | | 176,474 | |
| TOTAL INTEREST INCOME | |
| TOTAL INTEREST INCOME | |
| | INTEREST EXPENSE | INTEREST EXPENSE | | | | | | |
| INTEREST EXPENSE | |
| INTEREST EXPENSE | | | |
| | Interest on Deposits | |
| Interest on Deposits | |
| Interest on Deposits | Interest on Deposits | | 4,955 | | | 13,696 | | | 23,805 | |
| Interest on FHLB Advances and Other Borrowings | Interest on FHLB Advances and Other Borrowings | | 4,594 | | | 5,430 | | | 7,444 | |
| | TOTAL INTEREST EXPENSE | TOTAL INTEREST EXPENSE | | 9,549 | | | 19,126 | | | 31,249 | |
| TOTAL INTEREST EXPENSE | |
| TOTAL INTEREST EXPENSE | |
| | NET INTEREST INCOME | |
| NET INTEREST INCOME | |
| NET INTEREST INCOME | NET INTEREST INCOME | | 160,830 | | | 155,243 | | | 145,225 | |
| | Provision for Credit Losses | Provision for Credit Losses | | (6,500) | | | 17,550 | | | 5,325 | |
| Provision for Credit Losses | |
| Provision for Credit Losses | |
| | NET INTEREST INCOME AFTER PROVISION FOR CREDIT LOSSES | |
| NET INTEREST INCOME AFTER PROVISION FOR CREDIT LOSSES | |
| NET INTEREST INCOME AFTER PROVISION FOR CREDIT LOSSES | NET INTEREST INCOME AFTER PROVISION FOR CREDIT LOSSES | | 167,330 | | | 137,693 | | | 139,900 | |
| | NON-INTEREST INCOME | NON-INTEREST INCOME | | | | | | |
| NON-INTEREST INCOME | |
| NON-INTEREST INCOME | | | |
| | Wealth Management and Investment Services Income | | 10,321 | | | 8,005 | | | 7,278 | |
| Wealth Management Fees | |
| Wealth Management Fees | |
| Wealth Management Fees | |
| Service Charges on Deposit Accounts | Service Charges on Deposit Accounts | | 7,723 | | | 7,334 | | | 8,718 | |
| Insurance Revenues | Insurance Revenues | | 9,268 | | | 8,922 | | | 8,940 | |
| Company Owned Life Insurance | Company Owned Life Insurance | | 1,529 | | | 2,307 | | | 2,005 | |
| Interchange Fee Income | Interchange Fee Income | | 13,116 | | | 10,529 | | | 9,450 | |
| Other Operating Income | Other Operating Income | | 6,991 | | | 3,388 | | | 3,229 | |
| Net Gains on Sales of Loans | Net Gains on Sales of Loans | | 8,267 | | | 9,908 | | | 4,633 | |
| Net Gains on Securities | Net Gains on Securities | | 2,247 | | | 4,081 | | | 1,248 | |
| | TOTAL NON-INTEREST INCOME | TOTAL NON-INTEREST INCOME | | 59,462 | | | 54,474 | | | 45,501 | |
| TOTAL NON-INTEREST INCOME | |
| TOTAL NON-INTEREST INCOME | |
| | NON-INTEREST EXPENSE | NON-INTEREST EXPENSE | | | | | | |
| NON-INTEREST EXPENSE | |
| NON-INTEREST EXPENSE | | | |
| | Salaries and Employee Benefits | |
| Salaries and Employee Benefits | |
| Salaries and Employee Benefits | Salaries and Employee Benefits | | 68,570 | | | 68,112 | | | 63,885 | |
| Occupancy Expense | Occupancy Expense | | 11,081 | | | 10,033 | | | 9,988 | |
| Furniture and Equipment Expense | Furniture and Equipment Expense | | 3,750 | | | 3,991 | | | 3,788 | |
| FDIC Premiums | FDIC Premiums | | 1,419 | | | 740 | | | 533 | |
| Data Processing Fees | Data Processing Fees | | 7,611 | | | 6,889 | | | 7,927 | |
| Professional Fees | Professional Fees | | 5,009 | | | 3,998 | | | 4,674 | |
| Advertising and Promotion | Advertising and Promotion | | 4,197 | | | 3,589 | | | 4,230 | |
| Intangible Amortization | Intangible Amortization | | 2,731 | | | 3,539 | | | 3,721 | |
| Other Operating Expenses | Other Operating Expenses | | 19,639 | | | 16,232 | | | 15,416 | |
| | TOTAL NON-INTEREST EXPENSE | TOTAL NON-INTEREST EXPENSE | | 124,007 | | | 117,123 | | | 114,162 | |
| TOTAL NON-INTEREST EXPENSE | |
| TOTAL NON-INTEREST EXPENSE | |
| | Income before Income Taxes | |
| Income before Income Taxes | |
| Income before Income Taxes | Income before Income Taxes | | 102,785 | | | 75,044 | | | 71,239 | |
| Income Tax Expense | Income Tax Expense | | 18,648 | | | 12,834 | | | 12,017 | |
| | NET INCOME | NET INCOME | | $ | 84,137 | | | $ | 62,210 | | | $ | 59,222 | |
| NET INCOME | |
| NET INCOME | |
| | Basic Earnings per Share | Basic Earnings per Share | | $ | 3.17 | | | $ | 2.34 | | | $ | 2.29 | |
| Basic Earnings per Share | |
| Basic Earnings per Share | |
| Diluted Earnings per Share | Diluted Earnings per Share | | $ | 3.17 | | | $ | 2.34 | | | $ | 2.29 | |
See accompanying notes to the consolidated financial statements.
| | |
| Consolidated Statements of Comprehensive Income (Loss) |
| Dollars in thousands |
| | Years Ended December 31, |
| | Years Ended December 31, | | | | Years Ended December 31, |
| | | | 2021 | | 2020 | | 2019 | | | 2023 | | 2022 | | 2021 |
| | NET INCOME | NET INCOME | | $ | 84,137 | | | $ | 62,210 | | | $ | 59,222 | |
| NET INCOME | |
| NET INCOME | |
| | Other Comprehensive Income (Loss): | |
| Other Comprehensive Income (Loss): | |
| Other Comprehensive Income (Loss): | Other Comprehensive Income (Loss): | | | | | | | | |
| Unrealized Gains (Losses) on Securities: | Unrealized Gains (Losses) on Securities: | | | | | | | Unrealized Gains (Losses) on Securities: | | |
| Unrealized Holding Gain (Loss) Arising During the Period | Unrealized Holding Gain (Loss) Arising During the Period | | (23,011) | | | 29,783 | | | 29,866 | |
| Reclassification Adjustment for Gains Included in Net Income | Reclassification Adjustment for Gains Included in Net Income | | (2,247) | | | (4,081) | | | (1,248) | |
| Tax Effect | Tax Effect | | 5,367 | | | (5,432) | | | (6,186) | |
| Net of Tax | Net of Tax | | (19,891) | | | 20,270 | | | 22,432 | |
| Postretirement Benefit Obligation: | Postretirement Benefit Obligation: | | | | | | | Postretirement Benefit Obligation: | | |
| Net (Loss) Arising During the Period | Net (Loss) Arising During the Period | | — | | | — | | | (310) | |
| Reclassification Adjustment for Amortization of Prior Service Cost and Net | Reclassification Adjustment for Amortization of Prior Service Cost and Net | | — | | | — | | | 37 | |
| Tax Effect | Tax Effect | | — | | | — | | | 44 | |
| Net of Tax | Net of Tax | | — | | | — | | | (229) | |
| | Total Other Comprehensive Income (Loss) | Total Other Comprehensive Income (Loss) | | (19,891) | | | 20,270 | | | 22,203 | |
| Total Other Comprehensive Income (Loss) | |
| Total Other Comprehensive Income (Loss) | |
| | COMPREHENSIVE INCOME | | $ | 64,246 | | | $ | 82,480 | | | $ | 81,425 | |
| COMPREHENSIVE INCOME (LOSS) | |
| COMPREHENSIVE INCOME (LOSS) | |
| COMPREHENSIVE INCOME (LOSS) | |
See accompanying notes to the consolidated financial statements.
| | |
| Consolidated Statements of Changes in Shareholders’ Equity |
| Dollars in thousands, except share and per share data |
| | | Common Stock | |
| | | Common Stock | |
| | | Shares | | Amount | | Additional Paid-in Capital | | Retained Earnings | | Accumulated Other Comprehensive Income (Loss) | | Total Shareholders' Equity |
| Balances, January 1, 2019 | | 24,967,458 | | | $ | 24,967 | | | $ | 229,347 | | | $ | 211,424 | | | $ | (7,098) | | | $ | 458,640 | |
| Net Income | | | | | | | | 59,222 | | | | | 59,222 | |
| Other Comprehensive Income (Loss) | | | | | | | | | | 22,203 | | | 22,203 | |
| Cash Dividends ($0.68 per share) | | | | | | | | (17,556) | | | | | (17,556) | |
| Issuance of Common Stock for: | | | | | | | | | | | |
| Acquisition of Citizens First Corporation | | 1,663,954 | | | 1,664 | | | 48,360 | | | | | | | 50,024 | |
| Restricted Share Grants | | 39,956 | | | 40 | | | 1,247 | | | | | 1,287 | |
| | Balances, December 31, 2019 | | 26,671,368 | | | 26,671 | | | 278,954 | | | 253,090 | | | 15,105 | | | 573,820 | |
| Cumulative Effect of Change in Accounting Principles | | (6,717) | | | (6,717) | |
| Balances, January 1, 2020 | | 26,671,368 | | | 26,671 | | | 278,954 | | | 246,373 | | | 15,105 | | | 567,103 | |
| Net Income | | | | | | | | 62,210 | | | | | 62,210 | |
| Other Comprehensive Income (Loss) | | | | | | | | | | 20,270 | | | 20,270 | |
| Cash Dividends ($0.76 per share) | | | | | | | | (20,136) | | | | | (20,136) | |
| Issuance of Common Stock for: | | | | | | | | | | | | |
| Restricted Share Grants | | 52,701 | | | 53 | | | 998 | | | | | | | 1,051 | |
| Stock Repurchase | | (221,912) | | | (222) | | | (5,567) | | | | | | | (5,789) | |
| | | | | | | | | | | | | | Shares | | Amount | | Additional Paid-in Capital | | Retained Earnings | | Accumulated Other Comprehensive Income (Loss) | | Total Shareholders’ Equity |
| Balances, December 31, 2020 | Balances, December 31, 2020 | | 26,502,157 | | | 26,502 | | | 274,385 | | | 288,447 | | | 35,375 | | | 624,709 | |
| Net Income | Net Income | | | | | | | | 84,137 | | | | | 84,137 | |
| Other Comprehensive Income (Loss) | Other Comprehensive Income (Loss) | | | | | | | | | | (19,891) | | | (19,891) | |
| Cash Dividends ($0.84 per share) | Cash Dividends ($0.84 per share) | | | | | | | | (22,220) | | | | | (22,220) | |
| Issuance of Common Stock for: | Issuance of Common Stock for: | | | | | | | | | | | | |
| Restricted Share Grants | Restricted Share Grants | | 51,351 | | | 52 | | | 1,672 | | | | | | | 1,724 | |
| Restricted Share Grants | |
| Restricted Share Grants | |
| | Balances, December 31, 2021 | Balances, December 31, 2021 | | 26,553,508 | | | $ | 26,554 | | | $ | 276,057 | | | $ | 350,364 | | | $ | 15,484 | | | $ | 668,459 | |
| | Balances, December 31, 2021 | |
| | Balances, December 31, 2021 | |
| Net Income | |
| Other Comprehensive Income (Loss) | |
| Cash Dividends ($0.92 per share) | |
| Issuance of Common Stock for: | | Issuance of Common Stock for: | | |
| Acquisition of Citizens Union Bancorp | |
| Restricted Share Grants | |
| | Balances, December 31, 2022 | |
| | Balances, December 31, 2022 | |
| | Balances, December 31, 2022 | |
| Net Income | |
| Other Comprehensive Income (Loss) | |
| Cash Dividends ($1.00 per share) | |
| Issuance of Common Stock for: | | Issuance of Common Stock for: | | |
| Restricted Share Grants | |
| Balances, December 31, 2023 | |
See accompanying notes to the consolidated financial statements.
| | |
| Consolidated Statements of Cash Flows |
| Dollars in thousands |
| | Years Ended December 31, |
| | Years Ended December 31, | | | | Years Ended December 31, |
| CASH FLOWS FROM OPERATING ACTIVITIES | CASH FLOWS FROM OPERATING ACTIVITIES | | 2021 | | 2020 | | 2019 | CASH FLOWS FROM OPERATING ACTIVITIES | | 2023 | | 2022 | | 2021 |
| Net Income | Net Income | | $ | 84,137 | | | $ | 62,210 | | | $ | 59,222 | |
| Adjustments to Reconcile Net Income to Net Cash from Operating Activities: | Adjustments to Reconcile Net Income to Net Cash from Operating Activities: | | | | | | | Adjustments to Reconcile Net Income to Net Cash from Operating Activities: | | |
| Net Amortization on Securities | Net Amortization on Securities | | 6,638 | | | 5,671 | | | 3,862 | |
| Depreciation and Amortization | Depreciation and Amortization | | 8,770 | | | 9,429 | | | 8,630 | |
| Loans Originated for Sale | Loans Originated for Sale | | (261,529) | | | (317,032) | | | (198,326) | |
| Proceeds from Sales of Loans Held-for-Sale | Proceeds from Sales of Loans Held-for-Sale | | 276,417 | | | 327,172 | | | 189,875 | |
| Provision for Credit Losses | Provision for Credit Losses | | (6,500) | | | 17,550 | | | 5,325 | |
| Gain on Sale of Loans, net | Gain on Sale of Loans, net | | (8,267) | | | (9,908) | | | (4,633) | |
| Gain on Securities, net | Gain on Securities, net | | (2,247) | | | (4,081) | | | (1,248) | |
| Loss (Gain) on Sales of Other Real Estate and Repossessed Assets | Loss (Gain) on Sales of Other Real Estate and Repossessed Assets | | (101) | | | 28 | | | 200 | |
| Loss (Gain) on Disposition and Donation of Premises and Equipment | Loss (Gain) on Disposition and Donation of Premises and Equipment | | 1,640 | | | 223 | | | 111 | |
| Loss (Gain) on Disposition of Land | Loss (Gain) on Disposition of Land | | — | | | 43 | | | (352) | |
| Post Retirement Medical Benefit | Post Retirement Medical Benefit | | — | | | — | | | (228) | |
| Increase in Cash Surrender Value of Company Owned Life Insurance | Increase in Cash Surrender Value of Company Owned Life Insurance | | (1,369) | | | (1,449) | | | (1,407) | |
| Equity Based Compensation | Equity Based Compensation | | 1,724 | | | 1,051 | | | 1,287 | |
| Excess Tax Benefit from Restricted Share Grant | | — | | | 3 | | | 25 | |
| | Change in Assets and Liabilities: | |
| Change in Assets and Liabilities: | |
| Change in Assets and Liabilities: | Change in Assets and Liabilities: | | | | | | | | |
| Interest Receivable and Other Assets | Interest Receivable and Other Assets | | 2,716 | | | (2,925) | | | (1,602) | |
| Interest Payable and Other Liabilities | Interest Payable and Other Liabilities | | (1,185) | | | 4,433 | | | 4,488 | |
| Net Cash from Operating Activities | Net Cash from Operating Activities | | 100,844 | | | 92,418 | | | 65,229 | |
| | CASH FLOWS FROM INVESTING ACTIVITIES | |
| CASH FLOWS FROM INVESTING ACTIVITIES | |
| CASH FLOWS FROM INVESTING ACTIVITIES | CASH FLOWS FROM INVESTING ACTIVITIES | | | | | | | | |
| Proceeds from Maturity of Other Short-term Investments | Proceeds from Maturity of Other Short-term Investments | | 496 | | | 744 | | | 496 | |
| Proceeds from Maturities of Securities Available-for-Sale | Proceeds from Maturities of Securities Available-for-Sale | | 208,156 | | | 200,968 | | | 114,669 | |
| Proceeds from Sales of Securities Available-for-Sale | Proceeds from Sales of Securities Available-for-Sale | | 111,124 | | | 125,106 | | | 82,601 | |
| Purchase of Securities Available-for-Sale | Purchase of Securities Available-for-Sale | | (1,020,695) | | | (664,989) | | | (169,640) | |
| Proceeds from Redemption of Federal Home Loan Bank Stock | Proceeds from Redemption of Federal Home Loan Bank Stock | | 120 | | | 800 | | | 1,145 | |
| Purchase of Loans | Purchase of Loans | | — | | | — | | | (2,051) | |
| Proceeds from Sales of Loans Held for Investment | Proceeds from Sales of Loans Held for Investment | | — | | | 3,128 | | | — | |
| Loans Made to Customers, net of Payments Received | Loans Made to Customers, net of Payments Received | | 59,557 | | | (10,114) | | | 3,925 | |
| Proceeds from Sales of Other Real Estate | Proceeds from Sales of Other Real Estate | | 1,423 | | | 340 | | | 369 | |
| Property and Equipment Expenditures | Property and Equipment Expenditures | | (4,686) | | | (7,071) | | | (9,374) | |
| | Proceeds from Sale of Land and Building | Proceeds from Sale of Land and Building | | 1,963 | | | 3,928 | | | 1,761 | |
| Proceeds from Sale of Land and Building | |
| Proceeds from Sale of Land and Building | |
| Proceeds from Life Insurance | Proceeds from Life Insurance | | 549 | | | 1,082 | | | 1,216 | |
| Sale of Bank Branches | Sale of Bank Branches | | 1,694 | | | — | | | — | |
| | Acquisition of Citizens First Corporation | | — | | | — | | | 5,545 | |
| Acquisition of Citizens Union Bancorp of Shelbyville, Inc. | |
| Acquisition of Citizens Union Bancorp of Shelbyville, Inc. | |
| Acquisition of Citizens Union Bancorp of Shelbyville, Inc. | |
| Net Cash from Investing Activities | Net Cash from Investing Activities | | (640,299) | | | (346,078) | | | 30,662 | |
| | CASH FLOWS FROM FINANCING ACTIVITIES | |
| CASH FLOWS FROM FINANCING ACTIVITIES | |
| CASH FLOWS FROM FINANCING ACTIVITIES | CASH FLOWS FROM FINANCING ACTIVITIES | | | | | | | | |
| Change in Deposits | Change in Deposits | | 655,485 | | | 676,906 | | | (13,007) | |
| Change in Short-term Borrowings | Change in Short-term Borrowings | | 15,423 | | | (114,832) | | | (82,037) | |
| Advances in Long-term Debt | Advances in Long-term Debt | | — | | | — | | | 89,214 | |
| Repayments of Long-term Debt | Repayments of Long-term Debt | | (58,091) | | | (40,625) | | | (65,171) | |
| Issuance (Retirement) of Common Stock | Issuance (Retirement) of Common Stock | | — | | | (5,789) | | | — | |
| Dividends Paid | Dividends Paid | | (22,220) | | | (20,136) | | | (17,556) | |
| Net Cash from Financing Activities | Net Cash from Financing Activities | | 590,597 | | | 495,524 | | | (88,557) | |
| | Net Change in Cash and Cash Equivalents | Net Change in Cash and Cash Equivalents | | 51,142 | | | 241,864 | | | 7,334 | |
| Net Change in Cash and Cash Equivalents | |
| Net Change in Cash and Cash Equivalents | |
| Cash and Cash Equivalents at Beginning of Year | Cash and Cash Equivalents at Beginning of Year | | 345,748 | | | 103,884 | | | 96,550 | |
| Cash and Cash Equivalents at End of Year | Cash and Cash Equivalents at End of Year | | $ | 396,890 | | | $ | 345,748 | | | $ | 103,884 | |
| | Cash Paid During the Year for | Cash Paid During the Year for | | | | | | |
| Cash Paid During the Year for | |
| Cash Paid During the Year for | | | |
| Interest | Interest | | $ | 10,020 | | | $ | 20,484 | | | $ | 30,765 | |
| Income Taxes | Income Taxes | | 14,434 | | | 11,505 | | | 7,977 | |
| | Supplemental Non Cash Disclosures (See Note 18 for Business Combinations) | | | | | | |
| Supplemental Non Cash Disclosures | |
| Supplemental Non Cash Disclosures | |
| Supplemental Non Cash Disclosures | | | | | |
| Loans Transferred to Other Real Estate | Loans Transferred to Other Real Estate | | $ | — | | | $ | — | | | $ | 708 | |
| Reclassification of Land and Buildings to Other Assets | | — | | | — | | | 5,712 | |
| Right of Use Asset Obtained in Exchange for Lease Liabilities | | — | | | — | | | 9,034 | |
| Reclass of Land & Buildings to Other Assets | |
| Interest Rate Swap Fair Value Activity | |
| | See Note 18 (Business Combinations, Goodwill and Intangible Assets) regarding non-cash transactions included in the acquisition. | |
| See Note 18 (Business Combinations, Goodwill and Intangible Assets) regarding non-cash transactions included in the acquisition. | |
| See Note 18 (Business Combinations, Goodwill and Intangible Assets) regarding non-cash transactions included in the acquisition. | |
See accompanying notes to the consolidated financial statements.
| | |
| Notes to the Consolidated Financial Statements |
| Dollars in thousands, except per share data |
NOTE 1 – Summary of Significant Accounting Policies
Impact of COVID-19
The novel coronavirus disease 2019 (COVID-19) pandemic continued to impact our operations during 2021. While uncertainty remains as to the future effects of the pandemic, an improving business climate, supported by unprecedented fiscal stimulus, an accommodative Federal Reserve, and the demonstrated ability of states and local governments to respond to COVID-19 and its variants, has helped to mitigate the negative impacts of the pandemic on our financial condition and results of operations, despite the challenges presented by very low interest rates, muted loan growth, excess liquidity and rising inflation.
Description of Business and Basis of Presentation
The operations of German American Bancorp, Inc. (the “Company”) are primarily comprised of 3three business segments: core banking, trust and investment advisory services, and insurance operations. The accounting and reporting policies of the Company and its subsidiaries conform to U.S. generally accepted accounting principles. The more significant policies are described below. The consolidated financial statements include the accounts of the Company and its subsidiaries after elimination of all material intercompany accounts and transactions. Certain prior year amounts have been reclassified to conform with current classifications. Reclassifications had no impact on shareholders'shareholders’ equity or net income. To prepare financial statements in conformity with accounting principles generally accepted in the United States of America, management makes estimates and assumptions based on available information. These estimates and assumptions affect the amounts reported in the financial statements and the disclosures provided, and actual results could differ.
Securities
Debt securities classified as available-for-sale are securities that the Company intends to hold for an indefinite period of time, but not necessarily until maturity. TheseHeld-to-maturity securities, when present, are carried at amortized cost. As of December 31, 2023, and 2022, the Company held no securities classified as held-to-maturity. Debt securities classified as available-for-sale include securities that management may use as part of its asset/liability strategy, or that may be sold in response to changes in interest rates, changes in prepayment risk, or similar reasons. Securities classified as available-for-sale are reported at fair value with unrealized gains or losses included as a separate component of equity (other comprehensive income), net of tax.
Interest income includes amortization of purchase premium or discount. Premiums and discounts on securities are amortized on the level-yield method without anticipating prepayments, except for mortgage backed securities where prepayments are anticipated. Gains and losses on sales are recorded on trade date and determined using the specific identification method.
Investments with readily determinable values (except those accounted for under equity method of accounting or those that result in consolidation of the investee) are measured at fair value with changes in fair value recognized in net income. Equity securities that do not have readily determinable fair values are carried at historical cost and evaluated for impairment on a periodic basis.
Loans Held for Sale
Mortgage loans originated and intended for sale in the secondary market are carried at fair value. Fair value is determined based on collateral value and prevailing market prices for loans with similar characteristics. Net unrealized gains or losses are recorded through earnings.
Mortgage loans held for sale are generally sold on a servicing released basis. Gains and losses on sales of mortgage loans are based on the difference between the selling price and the carrying value of the related loan sold.
Loans
Loans that management has the intent and ability to hold for the foreseeable future or until maturity or payoff are reported at amortized cost. Amortized cost is the principal balance outstanding, net of purchase premiums and discounts, deferred loan fees and costs. Accrued interest receivable totaled $11,016$20,580 at December 31, 20212023 and was reported in Accrued Interest Receivable and Other Assets on the Consolidated Balance Sheets. Interest income is accrued on the unpaid principal balance. Loan origination fees and costs are deferred and recognized in interest income using the level-yield method without anticipating prepayments.
Purchase Credit Deteriorated (PCD) Loans
The Company has purchased loans, some of which have experienced more than insignificant credit deterioration since origination. PCD loans are recorded at the amount paid. An allowance for credit losses on loans is determined using the same methodology as other loans held for investment. The initial allowance for credit losses on loans determined on a collective basis
| | |
Notes to the Consolidated Financial Statements |
Dollars in thousands, except per share data |
NOTE 1 – Summary of Significant Accounting Policies (continued)
is allocated to individual loans. The sum of the loan’s purchase price and allowance for credit losses on loans becomes its initial amortized cost basis. The difference between the initial amortized cost basis and the par value of the loan is a noncredit discount or premium, which is amortized into interest income over the life of the loan. Subsequent changes to the allowance for credit losses on loans are recorded through provision expense.
Allowance for Credit Losses - Loans
The allowance for credit losses is a valuation account that is deducted from the loans’ amortized cost basis to present the net amount expected to be collected on the loans. Loans are charged off against the allowance when management believes the
| | |
| Notes to the Consolidated Financial Statements |
| Dollars in thousands, except per share data |
NOTE 1 – Summary of Significant Accounting Policies (continued)
uncollectibility of a loan balance is confirmed. Expected recoveries do not exceed the aggregate of amounts previously charged-off and expected to be charged-off.
The Company utilizes the static pool methodology in determining expected future credit losses. Static pool analysis includes segmenting and tracking loans over a period of time based on similar risk characteristics such as loan structure, collateral type, industry of borrower and concentrations, contractual terms and credit risk indicators. Static pool calculates a loss rate on a closed pool of loans that existed on a specified start date based upon the remaining life of each segment. The Company’s expected loss estimate is anchored in historical credit loss experience, with an emphasis on all available portfolio data. The Company’s historical look-back period includes January 2014 through the current period, on a monthly basis.
The Company estimates the allowance balance using relevant available information, from internal and external sources, relating to past events, current conditions, and reasonable and supportable forecasts. Historical loss experience provides the basis for the estimation of expected credit losses. Adjustments to historical loss information are made for changes in underwriting standards, portfolio mix, delinquency level, changes in environmental conditions, unemployment rates, risk classifications and collateral values. The Company separately assigns allocations for substandard and special mention commercial and agricultural credits as well as other categories of loans based on migration analysis techniques. The migration analysis factors are calculated using a transition matrix to determine the likelihood of a customer’s asset quality rating migrating from its current rating to any other rating.
The allowance for credit losses is measured on a collective (pooled) basis when similar risk characteristics exist. The Company has identified the following portfolio segments and measuresidentified the allowance for credit losses using the following methods:risk characteristics of each portfolio listed below:
Commercial and Industrial Loans - The principal risk of commercial and industrial loans is that these loans are primarily based on the identified cash flow of the borrower and secondarily on the collateral underlying the loans. Most commercial loans are secured by accounts receivable, inventory and equipment. If cash flow from business operations is reduced, the borrower’s ability to repay the loan may diminish, and over time, it may also be difficult to substantiate current value of inventory and equipment. Repayment of these loans are more sensitive than other types of loans to adverse conditions in the general economy.
Commercial Real Estate Loans - Commercial real estate lending is generally dependent on the successful operation of the property securing the loan or the business conducted on the property securing the loan. Commercial real estate loans may be adversely affected by conditions in the real estate markets or in the general economy. Commercial real estate loans are collateralized by the borrower’s underlying real estate. Therefore, diminished cash flows not only affects the ability to repay the loan, it may also reduce the underlying collateral value.
Agricultural Loans - This portfolio is diversified between real estate financing, equipment financing and lines of credit in various segments including grain production, poultry production and livestock production. Mitigating any concentration of risk that may exist in the Company’s agricultural loan portfolio is the use of federal government guarantee programs.
Leases - Leases are primarily for equipment leased to varying types of businesses. If the cash flows from the business operations is reduced, the business’s ability to repay the lease is diminished as well.
Home Equity Loans - Home equity loans are generally secured by 1-4 family residences that are owner-occupied. Repayment of these loans is primarily dependent on the personal income of the borrowers, which can be impacted by unemployment levels in the market area due to economic conditions.
Consumer Loans - Consumer loan repayment is typically dependent on the borrower remaining employed through the life of the loan as well as the borrower maintaining the underlying collateral adequately.
Credit Cards - Credit card loans are unsecured and repayment is primarily dependent on the personal income of the borrower.
Residential Mortgage Loans - Residential mortgage loans are typically secured by 1-4 family residences that are owner-occupied. Repayment of these loans is primarily dependent on the personal income of the borrowers, which can be impacted by unemployment levels in the market area due to economic conditions. Repayment may also be impacted by changes in residential property values.
| | |
| Notes to the Consolidated Financial Statements |
| Dollars in thousands, except per share data |
NOTE 1 – Summary of Significant Accounting Policies (continued)
Loans that do not share risk characteristics are evaluated on an individual basis. Loans evaluated individually are also not included in the collective evaluation. When the borrower is experiencing financial difficulty at the reporting date and repayment is expected to be provided substantially through the operation or sale of the collateral, expected credit losses are based on the fair value of the collateral at the reporting date adjusted for selling costs.
Troubled Debt Restructurings (“TDR”)Modifications to Borrowers Experiencing Financial Difficulty
AFrom time to time, the Company may modify certain loans to borrowers who are experiencing financial difficulty. The Company’s loan modifications for which the terms have been modified resulting in a concession, and for which the borrower isborrowers experiencing financial difficulties is considered to bewill typically include one or a TDR. The allowances for credit losses on loans on a TDR is measured using the same method as all other loans held for investment.
Loan Modifications and Troubled Debt Restructurings due to COVID-19
On April 7, 2020, the Board of Governorscombination of the Federal Reserve System (the “FRB”), the Officefollowing: a reduction of the Comptrollerstated interest rate of the Currency (the “OCC”), and the Federal Deposit Insurance Corporation (the “FDIC” and, together with the FRB and OCC, the “federal banking regulators”) issued a revised Interagency Statement on Loan Modifications and Reporting for Financial Institutions, which, among other things, encouraged financial institutions to work prudently with borrowers who are or may be unable to meet their contractual payment obligations becauseloan; an extension of the effectsmaturity date at a stated rate of COVID-19, and stated that institutions generally do not need to categorize COVID-19-related modifications as troubledinterest lower than the current market rate for new debt restructurings and thatwith similar risk; or a permanent reduction of the agencies will not direct supervised institutions to automatically categorize all COVID-19 related loan modifications as troubled debt restructurings. Similarly, underrecorded investment in the CARES Act, provisions were included that allow for loan modifications to not be classified as TDRs if certain criteria are met. This TDR exemption, which was set to expire on December 31, 2020, was extended under the 2021 Consolidated Appropriations Act adopted on December 27, 2020, to the earlier of (i) 60 days after the national emergency concerning the COVID-19 outbreak terminates, and (ii) January 1, 2022.loan.
Allowance for Credit Losses on Available-For-Sale Securities
For available-for-sale debt securities in an unrealized loss position, the Company first assesses whether it intends to sell, or it is more likely than not that it will be required to sell, the security before recovery of its amortized cost basis. If either of the criteria regarding intent or requirement to sell is met, the security’s amortized cost basis is written down to fair value through income. For debt securities available for sale that do not meet the aforementioned criteria, the Company evaluates whether the decline in fair value has resulted from credit losses or other factors. In making this assessment, management considers the extent to which fair value is less than amortized cost, any changes to the rating of the security by a rating agency, and adverse conditions specifically related to the security, among other factors. If this assessment indicates that a credit loss exists, the present value of cash flows expected to be collected from the security are compared to the amortized cost basis of the security. If the present value of cash flows expected to be collected is less than the amortized cost basis, a credit loss exists and an allowance for credit losses is recorded for the credit loss, limited by the amount that the fair value is less than the amortized cost basis. Any impairment that has not been recorded through an allowance for credit losses is recorded in other comprehensive income.
Changes in the allowance for credit losses are recorded as provision for, or reversal of, credit loss expense. Losses are charged against the allowance when management believes the uncollectibility of an available-for-sale security is confirmed or when either of the criteria regarding intent or requirement to sell is met.
Allowance for Credit Losses on Off-Balance Sheet Credit Exposures
The Company estimates expected credit losses over the contractual period in which the Company is exposed to credit risk via a contractual obligation to extend credit, unless that obligation is unconditionally cancellable by the Company. The allowance for credit losses on off-balance sheet credit exposures is adjusted as a provision for credit loss expense included in other expense on the consolidated income statement. The estimate includes consideration of the likelihood that funding will occur and an estimate of expected credit losses on commitments expected to be funded over its estimated life. Expected utilization rates are compared to the current funded portion of the total commitment amount as a practical expedient for funded exposure at default.
Federal Home Loan Bank (FHLB) Stock
The Bank is a member of the FHLB of Indianapolis.Indianapolis and FHLB of Cincinnati. Members are required to own a certain amount of stock based on the level of borrowings and other factors, and may invest in additional amounts. FHLB stock is carried at cost, classified as a restricted security, and periodically evaluated for impairment based on ultimate recovery of par value. Both cash and stock dividends are reported as income.
| | |
Notes to the Consolidated Financial Statements |
Dollars in thousands, except per share data |
NOTE 1 – Summary of Significant Accounting Policies (continued)
Premises, Furniture and Equipment
Land is carried at cost. Premises, furniture, and equipment are stated at cost less accumulated depreciation. Buildings and related components are depreciated using the straight-line method with useful lives ranging generally from 10 to 40 years. Furniture, fixtures, and equipment are depreciated using the straight-line method with useful lives ranging generally from 3 to 10 years.
Other Real Estate
Assets acquired through or instead of loan foreclosure are initially recorded at fair value less costs to sell when acquired, establishing a new cost basis. Physical possession of commercial/residential real estate property collateralizing a commercial/consumer mortgage loan occurs when legal title is obtained upon completion of foreclosure or when the borrower conveys all interest in the property to satisfy the loan through the completion of a deed in lieu of foreclosure or through a similar legal
| | |
| Notes to the Consolidated Financial Statements |
| Dollars in thousands, except per share data |
NOTE 1 – Summary of Significant Accounting Policies (continued)
agreement. If fair value declines subsequent to foreclosure, a valuation allowance is recorded through expense. Operating costs after acquisition are expensed.
Goodwill and Other Intangible Assets
Goodwill arises from business combinations and is generally determined as the excess of the fair value of the consideration transferred, plus the fair value of any noncontrolling interests in the acquiree, over the fair value of the net assets acquired and liabilities assumed as of the acquisition date. Goodwill and intangible assets acquired in a purchase business combination and determined to have an indefinite useful life are not amortized, but tested for impairment at least annually. The Company has selected December 31 as the date to perform the annual impairment test. Intangible assets with definite useful lives are amortized over their estimated useful lives to their estimated residual values. Goodwill is the only intangible asset with an indefinite life on the Company’s balance sheet.
Other intangible assets consist of core deposit and acquired customer relationship intangible assets. They are initially measured at fair value and then are amortized over their estimated useful lives, which range from 6 to 10 years.
Company Owned Life Insurance
The Company has purchased life insurance policies on certain directors and executives. This life insurance is recorded at its cash surrender value or the amount that can be realized, which considers any adjustments or changes that are probable at settlement.
Loss Contingencies
Loss contingencies, including claims and legal actions arising in the ordinary course of business, are recorded as liabilities when the likelihood of loss is probable and an amount or range of loss can be reasonably estimated. Management does not believe currently that there are any such matters that will have a material impact on the financial statements.
Loan Commitments and Related Financial Instruments
Financial instruments include off-balance sheet credit instruments, such as commitments to make loans and commercial letters of credit issued to meet customer financing needs. The face amount for these items represents the exposure to loss, before considering customer collateral or ability to repay. Such financial instruments are recorded when they are funded.
Restrictions on Cash
At December 31, 20212023 and 2020,2022, the Company was not required to have balance on deposits with the Federal Reserve, or as cash on hand.
Long-term Assets
Premises and equipment, core deposit and other intangible assets, and other long-term assets are reviewed for impairment when events indicate their carrying amount may not be recoverable from future undiscounted cash flows. If impaired, the assets are recorded at fair value.
Stock Based Compensation
Compensation cost is recognized for stock options and restricted stock awards issued to employees and directors, based on the fair value of these awards at the date of grant. A Black-Scholes model is utilized to estimate the fair value of stock options, while the marketMarket price of the Corporation’sCompany’s common stock at the date of grant is used for restricted stock awards. Compensation cost is recognized over the required service period, generally defined as the vesting period.
| | |
Notes to the Consolidated Financial Statements |
Dollars in thousands, except per share data |
NOTE 1 – Summary of Significant Accounting Policies (continued)
Comprehensive Income (Loss)
Comprehensive income (loss) consists of net income and other comprehensive income (loss). Other comprehensive income (loss) includes unrealized gains and losses on securities available for sale and changes in unrecognized amounts in pension and other postretirement benefits, which are also recognized as a separate component of equity.
Income Taxes
Income tax expense is the total of the current year income tax due or refundable and the change in deferred tax assets and liabilities. Deferred tax assets and liabilities are the expected future tax amounts for the temporary differences between carrying amounts and tax bases of assets and liabilities, computed using enacted tax rates. A valuation allowance, if needed, reduces deferred tax assets to the amount expected to be realized.
A tax position is recognized as a benefit only if it is “more likely than not” that the tax position would be sustained in a tax examination, with a tax examination being presumed to occur. The amount recognized is the largest amount of tax benefit that
| | |
| Notes to the Consolidated Financial Statements |
| Dollars in thousands, except per share data |
NOTE 1 – Summary of Significant Accounting Policies (continued)
is greater than 50% likely of being realized on examination. For tax positions not meeting the “more likely than not” test, no tax benefit is recorded.
The Company recognizes interest and/or penalties related to income tax matters in other operating expense.
Retirement Plans
Pension expense under the suspended defined benefit plan is the net of interest cost, return on plan assets and amortization of gains and losses not immediately recognized. Employee 401(k) and profit sharing plan expense is the amount of matching contributions. Deferred compensation and supplemental retirement plan expense allocates the benefits over years of service.
Earnings Per Share
Earnings per share are based on net income divided by the weighted average number of shares outstanding during the period. Diluted earnings per share show the potential dilutive effect of additional common shares issuable under the Company’s stock based compensation plans. Earnings per share are retroactively restated for stock splits and stock dividends.
Cash Flow Reporting
The Company reports net cash flows for customer loan transactions, deposit transactions, deposits made with other financial institutions and short-term borrowings. Cash and cash equivalents are defined to include cash on hand, demand deposits in other institutions and Federal Funds Sold.
Fair Values of Financial Instruments
Fair values of financial instruments are estimated using relevant market information and other assumptions, as more fully disclosed in Note 15. Fair value estimates involve uncertainties and matters of significant judgment regarding interest rates, credit risk, prepayments, and other factors, especially in the absence of broad markets for particular items. Changes in assumptions or in market conditions could significantly affect the estimates.
Recently Adopted Accounting Guidance
In June 2016,March 2020, the Financial Accounting Standards Board (“FASB”(“FASB”) issued ASU 2016-13, Financial Instruments - Credit Losses (Topic 326): Measurement of Credit Losses on Financial Instruments, which replaces the incurred loss methodology with an expected loss methodology that is referred to as the current expected credit loss (CECL) methodology. The measurement of expected credit losses under the CECL methodology is applicable to financial assets measured at amortized cost, including loan receivables and held-to-maturity debt securities. It also applies to off-balance sheet credit exposures not accounted for as insurance (loan commitments, standby letters of credit, financial guarantees, and other similar instruments). The new CECL model requires an estimate of expected credit losses, measured over the contractual life of an instrument, which considers reasonable and supportable forecasts of future economic conditions in addition to information about past events and current conditions. The standard provides significant flexibility and requires a high degree of judgement with regards to pooling financial assets with similar risk characteristics and adjusting the relevant historical loss information in order to develop an estimate of expected lifetime losses.
The Company adopted ASC 326 on January 1, 2020 using the modified retrospective approach. Results for reporting periods after January 1, 2020 are presented under ASC 326 while prior period amounts continue to be reported in accordance with previously applicable GAAP. The Company recorded a net reduction of retained earnings of $6,717 upon adoption.
| | |
Notes to the Consolidated Financial Statements |
Dollars in thousands, except per share data |
NOTE 1 – Summary of Significant Accounting Policies (continued)
The Company adopted ASC 326 using the prospective transition approach for financial assets purchased with credit deterioration (PCD) that were previously classified as purchased credit impaired (PCI) and accounted for under ASC 310-30. In accordance with the standard, management did not reassess whether PCI assets met the criteria of PCD assets as of the date of adoption. On January 1, 2020, the amortized cost basis of the PCD assets were adjusted to reflect the addition of $6,886 of the allowance for credit losses. The remaining noncredit discount (based on the adjusted amortized cost basis) will be accreted into interest income at the effective interest rate as of January 1, 2020.
The Company expanded the loan portfolio segments used to determine the allowance for credit losses for loans into 8 loan segments as opposed to 6 loan segments under the incurred loss methodology. The following table illustrates the impact of the segment expansion as of January 1, 2020.
| | | | | | | | | | | | | | | | | | | | | | | |
| (dollars in thousands) | | December 31, 2019 Statement Balance | | Segment Portfolio Reclassifications | | December 31, 2019 After Reclassification |
| Loans: | | | | | | |
| Commercial and Industrial Loans | | $ | 589,758 | | | $ | (57,257) | | | $ | 532,501 | |
| Commercial Real Estate Loans | | 1,495,862 | | | N/A | | 1,495,862 | |
| Agricultural Loans | | 384,526 | | | N/A | | 384,526 | |
| Leases | | N/A | | 57,257 | | | 57,257 | |
| Home Equity Loans | | 225,755 | | | N/A | | 225,755 | |
| Consumer Loans | | 81,217 | | | (11,953) | | | 69,264 | |
| Credit Cards | | N/A | | 11,953 | | | 11,953 | |
| Residential Mortgage Loans | | 304,855 | | | N/A | | 304,855 | |
| Total Loans | | $ | 3,081,973 | | | $ | — | | | $ | 3,081,973 | |
The following table illustrates the impact of ASC 326: | | | | | | | | | | | | | | | | | | | | |
| (dollars in thousands) | | December 31, 2019 After Reclassification | | Impact of ASC 326 Adoption | | January 1, 2020 Post-ASC 326 Adoption |
| Assets: | | | | | | |
| Loans: | | | | | | |
| Commercial and Industrial Loans | | $ | 532,501 | | | $ | 2,191 | | | $ | 534,692 | |
| Commercial Real Estate Loans | | 1,495,862 | | | 4,385 | | | 1,500,247 | |
| Agricultural Loans | | 384,526 | | | 128 | | | 384,654 | |
| Leases | | 57,257 | | | — | | | 57,257 | |
| Home Equity Loans | | 225,755 | | | 35 | | | 225,790 | |
| Consumer Loans | | 69,264 | | | — | | | 69,264 | |
| Credit Cards | | 11,953 | | | — | | | 11,953 | |
| Residential Mortgage Loans | | 304,855 | | | 147 | | | 305,002 | |
| Allowance for Credit Losses on Loans | | (16,278) | | | (15,653) | | | (31,931) | |
| | | | | | |
| Liabilities: | | | | | | |
| Allowance for Credit Losses on Unfunded Loan Commitments | | $ | — | | | $ | (173) | | | $ | (173) | |
In December 2018, federal banking regulators approved a final rule to address changes to credit loss accounting under GAAP, including banking organizations’ implementation of CECL. The final rule provides banking organizations the option to phase in over a three-year period the day-one adverse effects on regulatory capital that may result from the adoption of the new accounting standard. On March 27, 2020, in an action related to the CARES Act, the federal banking regulators announced an interim final rule to delay the estimated impact on regulatory capital stemming from the implementation of CECL. The interim final rule, which was finalized effective September 30, 2020, maintains the three-year transition option in the previous rule and provides banks the option to delay for two years an estimate of CECL’s effect on regulatory capital, relative to the incurred loss methodology’s effect on regulatory capital, followed by a three-year transition period (five-year transition option). The
| | |
Notes to the Consolidated Financial Statements |
Dollars in thousands, except per share data |
NOTE 1 – Summary of Significant Accounting Policies (continued)
Company has taken advantage of the capital transition relief over the permissible five-year period and will begin the three-year phase-in of the regulatory impact effective January 1, 2022.
In January 2017, the FASB issued ASU No. 2017-04, Intangibles - Goodwill and Other: Simplifying the Test for Goodwill Impairment. To simplify the subsequent measurement of goodwill, the amendments eliminate Step 2 from the goodwill impairment test. The annual, or interim, goodwill impairment test is performed by comparing the fair value of a reporting unit with its carrying amount. An impairment charge should be recognized for the amount by which the carrying amount exceeds the reporting unit’s fair value; however, the loss recognized should not exceed the total amount of goodwill allocated to that reporting unit. In addition, the income tax effects of tax deductible goodwill on the carrying amount of the reporting unit should be considered when measuring the goodwill impairment loss, if applicable. The amendments also eliminate the requirements for any reporting unit with a zero or negative carrying amount to perform Step 2 of the goodwill impairment test. An entity still has the option to perform the qualitative assessment for a reporting unit to determine if the quantitative impairment test is necessary. The amendments should be applied on a prospective basis. The nature of and reason for the change in accounting principle should be disclosed upon transition. The amendments in this update became effective for annual or any interim goodwill impairment tests in fiscal years beginning after December 15, 2019 and did not have a material impact on the Company’s financial statements.
In August 2018, the FASB issued ASU No. 2018-13, Fair Value Measurement (Topic 820): Disclosure Framework – Changes to the Disclosure Requirements for Fair Value Measurement. The amendment removes certain disclosures required by Topic 820 related to transfers between Level 1 and Level 2 of the fair value hierarchy; the policy for timing of transfers between levels; and the valuation processes for Level 3 fair value measurements. The update also adds certain disclosure requirements related to changes in unrealized gains and losses for the period included in other comprehensive income for recurring Level 3 fair value measurements held at the end of the reporting period and the range and weighted average of significant unobservable inputs used to develop Level 3 fair value measurements. The amendments in this update became effective for fiscal years and interim periods within those fiscal years beginning after December 15, 2019 and did not have a material impact on the Company’s financial statements.
In March 2020, the FASB issued ASUStandards Update (“ASU”) No. 2020-04, Reference“Reference Rate Reform (Topic 848): Facilitation of the Effects of Reference Rate Reform on Financial Reporting.Reporting”. These amendments provide temporary optional guidance to ease the potential burden in accounting for reference rate reform. The ASU provides optional expedients and exceptions for applying generally accepted accounting principles to contract modifications and hedging relationships, subject to meeting certain criteria, that reference LIBOR or another reference rate expected to be discontinued. It is intended to help stakeholders during the global market-wide reference rate transition period. In January 2021, the FASB issued ASU 2021-01 which clarifies that certain optional expedients and exceptions in Topic 848 for contract modifications and hedge accounting apply to derivatives that are affected by the discounting transition. The guidance is effective for all entities as of March 12, 2020 through December 31, 2022.2024. The Company has discontinued originating LIBOR based loans and has a plan in place to transition LIBOR indexed loans primarily to term SOFR or other indices.
On March 31, 2022, the FASB issued ASU 2022-02, “Financial Instruments - Credit Losses (Topic 326): Troubled Debt Restructurings and Vintage Disclosures” which eliminates the troubled debt restructuring recognition and measurement guidance and instead requires an entity to evaluate whether the modification represents a new loan or a continuation of an existing loan. The amendments also enhance existing disclosures and include new disclosure requirements related to certain modifications of receivables made to borrowers experiencing financial difficulty. To improve consistency for vintage disclosures, the ASU requires that public business entities disclose current-period gross write-offs by year of origination for financing receivables and net investments in leases within the scope of Subtopic 326-20. For entities that have adopted ASU 2016-13, the amendments are effective for fiscal years beginning after December 15, 2022, including interim periods within those fiscal years. For entities that have not adopted ASU 2016-13, the effective dates for the amendments are the same as the effective dates in ASU 2016-13. Early adoption is permitted if ASU 2016-13 has been adopted, including adoption in an interim period. If an entity elects to adopt the amendments in an interim period, the guidance should be applied as of the beginning of the fiscal year that includes the interim period. The Company adopted the new guidance prospectively with no material impact to the consolidated financial statements.
The SEC released Staff Accounting Bulletin No. 121 (“SAB 121”), which provides interpretive guidance regarding the accounting for obligations to safeguard crypto-assets an entity holds for its customers, either directly through an agent or another third party acting on its behalf. SAB 121 requires an entity to recognize a liability on its balance sheet to reflect the obligation to safeguard the crypto-assets of others, along with a corresponding safeguarding asset, both of which are measured
| | |
| Notes to the Consolidated Financial Statements |
| Dollars in thousands, except per share data |
NOTE 1 – Summary of Significant Accounting Policies (continued)
at fair value. The Company has completed an evaluation and concluded that it does not have a safeguarding obligation under SAB 121 and therefore the disclosures do not apply.
Newly Issued But Not Yet Effective Accounting Standards
On March 29, 2023, the FASB issued ASU 2023-02, “Investments - Equity Method and Joint Ventures (Topic 323): Accounting for Investments in Tax Credit Structures Using the Proportional Amortization Method” to expand use of the proportional amortization method of accounting to equity investments in tax credit programs beyond those in low-income-housing tax credit (LIHTC) programs. The amendments in this update permit reporting entities to account for certain tax equity investments, regardless of the tax credit program from which the income tax credits are received, using the proportional amortization method if certain conditions are met. This guidance provides clarifications to address interpretive issues and prescribes specific information that reporting entities must disclose about tax credit investments each period.
This ASU is effective for reporting periods beginning after December 15, 2023, for public business entities. For all other entities, the ASU is effective for fiscal years beginning after December 15, 2024. Early adoption is permitted, including early adoption in any interim period as of the beginning of the fiscal year that includes that interim period. Entities have the option of applying the forthcoming revisions using either a modified retrospective or retrospective adoption approach. The Company is continuing to evaluatecurrently evaluating the impact of adopting this new guidance, however, adoption of the standard over the effective period, and doesis not expect itexpected to have a material impact.impact on the Company’s financial statements or disclosures.
NOTE 2 – Securities
The amortized cost, unrealized gross gains and losses recognized in accumulated other comprehensive income (loss), and fair value of Securities Available-for-Sale were as follows:
| | Securities Available-for-Sale: | Securities Available-for-Sale: | | Amortized Cost | | Gross Unrealized Gains | | Gross Unrealized Losses | | Fair Value | Securities Available-for-Sale: | | Amortized Cost | | Gross Unrealized Gains | | Gross Unrealized Losses | | Fair Value |
| 2021 | | | | | | | | |
| 2023 | | 2023 | | | | |
| U.S. Treasury | |
| Obligations of State and Political Subdivisions | Obligations of State and Political Subdivisions | | $ | 896,048 | | | $ | 31,138 | | | $ | (1,480) | | | $ | 925,706 | |
| MBS/CMO | MBS/CMO | | 797,693 | | | 4,738 | | | (10,481) | | | 791,950 | |
| US Gov’t Sponsored Entities & Agencies | US Gov’t Sponsored Entities & Agencies | | 175,457 | | | 192 | | | (3,688) | | | 171,961 | |
| Total | Total | | $ | 1,869,198 | | | $ | 36,068 | | | $ | (15,649) | | | $ | 1,889,617 | |
| | 2020 | | | | | | | | |
| 2022 | |
| 2022 | |
| 2022 | | | |
| U.S. Treasury | |
| Obligations of State and Political Subdivisions | Obligations of State and Political Subdivisions | | $ | 548,273 | | | $ | 33,077 | | | $ | (103) | | | $ | 581,247 | |
| MBS/CMO | MBS/CMO | | 535,526 | | | 12,806 | | | (25) | | | 548,307 | |
| US Gov’t Sponsored Entities & Agencies | US Gov’t Sponsored Entities & Agencies | | 88,376 | | | 120 | | | (198) | | | 88,298 | |
| Total | Total | | $ | 1,172,175 | | | $ | 46,003 | | | $ | (326) | | | $ | 1,217,852 | |
| | |
Notes to the Consolidated Financial Statements |
Dollars in thousands, except per share data |
NOTE 2 – Securities (continued)
All mortgage-backed securities in the above table (identified above and throughout this Note 2 as “MBS/CMO”) are residential and multi-family mortgage-backed securities and guaranteed by government sponsored entities. The US Gov’t Sponsored Entities & Agencies in the above table have underlying collateral of equipment, machinery and commercial real estate.
| | |
| Notes to the Consolidated Financial Statements |
| Dollars in thousands, except per share data |
NOTE 2 – Securities (continued)
The amortized cost and fair value of securities at December 31, 20212023 by contractual maturity are shown below. Expected maturities may differ from contractual maturities because some issuers have the right to call or prepay certain obligations with or without call or prepayment penalties. Mortgage-backed securities are not due at a single maturity date and are shown separately.
| | Amortized
Cost | | Fair
Value |
| | Amortized
Cost | | | | Amortized
Cost | | Fair
Value |
| Securities Available-for-Sale: | Securities Available-for-Sale: | | | | | Securities Available-for-Sale: | | |
| Due in one year or less | Due in one year or less | | $ | 2,806 | | | $ | 2,844 | |
| Due after one year through five years | Due after one year through five years | | 18,670 | | | 19,395 | |
| Due after five years through ten years | Due after five years through ten years | | 70,964 | | | 75,685 | |
| Due after ten years | Due after ten years | | 803,608 | | | 827,782 | |
| MBS/CMO | MBS/CMO | | 797,693 | | | 791,950 | |
| US Gov’t Sponsored Entities & Agencies | US Gov’t Sponsored Entities & Agencies | | 175,457 | | | 171,961 | |
| Total | Total | | $ | 1,869,198 | | | $ | 1,889,617 | |
| | 2021 | | 2020 | | 2019 |
| | 2023 | | | | 2023 | | 2022 | | 2021 |
| Proceeds from the Sales of Securities are summarized below: | Proceeds from the Sales of Securities are summarized below: | | Available-
for-Sale | | Available-
for-Sale | | Available-
for-Sale | Proceeds from the Sales of Securities are summarized below: | | Available-
for-Sale |
| | Proceeds from Sales | Proceeds from Sales | | $ | 111,124 | | | $ | 125,106 | | | $ | 82,601 | |
| Proceeds from Sales | |
| Proceeds from Sales | |
| Gross Gains on Sales | Gross Gains on Sales | | 2,247 | | | 4,081 | | | 1,248 | |
| Gross Losses on Sales | | Gross Losses on Sales | | 306 | | 188 | | 152 |
| | Income Taxes on Gross Gains | | 472 | | | 857 | | | 262 | |
| Income Taxes on Net Gains | |
| Income Taxes on Net Gains | |
| Income Taxes on Net Gains | |
The carrying value of securities pledged to secure repurchase agreements, public and trust deposits, and for other purposes as required by law was $222,896$366,576 and $237,506$354,123 as of December 31, 20212023 and 2020,2022, respectively.
Below is a summary of securities with unrealized losses as of year-end 2021December 31, 2023 and 2020,2022, presented by length of time the securities have been in a continuous unrealized loss position:
| | | | | Less than 12 Months | | 12 Months or More | | Total | | | Less than 12 Months | | 12 Months or More | | Total |
| | Fair
Value | | | | Fair
Value | | Unrealized
Loss | | Fair
Value | | Unrealized
Loss | | Fair
Value | | Unrealized
Loss |
| December 31, 2023 | | December 31, 2023 | | |
| | Fair
Value | | Unrealized
Loss | | Fair
Value | | Unrealized
Loss | | Fair
Value | | Unrealized
Loss |
| December 31, 2021 | | | | | | | | | | | | |
| Obligations of State and Political Subdivisions | |
| Obligations of State and Political Subdivisions | |
| Obligations of State and Political Subdivisions | Obligations of State and Political Subdivisions | | $ | 165,210 | | | $ | (1,386) | | | $ | 1,500 | | | $ | (94) | | | $ | 166,710 | | | $ | (1,480) | |
| MBS/CMO | MBS/CMO | | 467,888 | | | (9,100) | | | 36,827 | | | (1,381) | | | 504,715 | | | (10,481) | |
| US Gov’t Sponsored Entities & Agencies | US Gov’t Sponsored Entities & Agencies | | 126,103 | | | (3,480) | | | 7,288 | | | (208) | | | 133,391 | | | (3,688) | |
| Total | Total | | $ | 759,201 | | | $ | (13,966) | | | $ | 45,615 | | | $ | (1,683) | | | $ | 804,816 | | | $ | (15,649) | |
| | | | | Less than 12 Months | | 12 Months or More | | Total | | | Less than 12 Months | | 12 Months or More | | Total |
| Fair
Value | | Unrealized
Loss | | Fair
Value | | Unrealized
Loss | | Fair
Value | | Unrealized
Loss |
| December 31, 2020 | | | | | | | | | | | | |
| | Fair
Value | | | | Fair
Value | | Unrealized
Loss | | Fair
Value | | Unrealized
Loss | | Fair
Value | | Unrealized
Loss |
| December 31, 2022 | |
| Obligations of State and Political Subdivisions | |
| Obligations of State and Political Subdivisions | |
| Obligations of State and Political Subdivisions | Obligations of State and Political Subdivisions | | $ | 10,652 | | | $ | (103) | | | $ | — | | | $ | — | | | $ | 10,652 | | | $ | (103) | |
| MBS/CMO | MBS/CMO | | 19,631 | | | (25) | | | — | | | — | | | 19,631 | | | (25) | |
| US Gov’t Sponsored Entities & Agencies | US Gov’t Sponsored Entities & Agencies | | 59,054 | | | (198) | | | — | | | — | | | 59,054 | | | (198) | |
| Total | Total | | $ | 89,337 | | | $ | (326) | | | $ | — | | | $ | — | | | $ | 89,337 | | | $ | (326) | |
Available-for-sale debt securities in unrealized loss positions are evaluated for impairment related to credit losses at least quarterly. For available-for-sale debt securities in an unrealized loss position, the Company assesses whether we intend to sell,
| | |
Notes to the Consolidated Financial Statements |
Dollars in thousands, except per share data |
NOTE 2 – Securities (continued)
or it is more likely than not that we will be required to sell the security before recovery of its amortized cost basis. If either of the criteria regarding intent or requirement to sell is met, the security’s amortized cost basis is written downreduced to fair value through
| | |
| Notes to the Consolidated Financial Statements |
| Dollars in thousands, except per share data |
NOTE 2 – Securities (continued)
income. For available-for sale debt securities that do not meet the criteria, the Company evaluates whether the decline in fair value has resulted from credit losses or other factors. In making this assessment, management considers the extent to which fair value is less than amortized cost, any changes to the rating of the security by a rating agency, and adverse conditions specifically related to the security and the issuer, among other factors. If this assessment indicates that a credit loss exists, we compare the present value of cash flows expected to be collected from the security with the amortized cost basis of the security. If the present value of cash flows expected to be collected is less than the amortized cost basis for the security, a credit loss exists and an allowance for credit losses is recorded, limited to the amount that the fair value of the security is less than its amortized cost basis. Any impairment that has not been recorded through an allowance for credit losses is recognized in other comprehensive income, net of applicable taxes. The decrease in unrealized losses from December 31, 2022 to December 31, 2023 was primarily the result of fair value adjustments caused by the change in market interest rates. No allowance for credit losses for available-for-sale debt securities was needed at December 31, 20212023 or 2020. 2022.
Although management has the ability to sell these securities if the need arises, their designation as available-for-sale should not necessarily be interpreted as an indication that management anticipates such sales.
Accrued interest receivable on available-for-sale debt securities totaled $8,990$9,620 at December 31, 20212023 and $10,637 at December 31, 2022. Accrued interest receivable is excluded from the estimate of credit losses. The unrealized losses attributable to our state and political subdivisions, mortgage-backed securities and US government sponsored entities and agencies are the result of fluctuations in interest rates.
The Company’s equity securities are listed as Other Investments on the Consolidated Balance Sheets and consist of 1one non-controlling investment in a single banking organization at December 31, 20212023 and 2020.2022. The original investment totaled $1,350 and other-than-temporary impairment was previously recorded totaling $997. The Company’s equity securities are considered not to have readily determinable fair value and are carried at cost and evaluated for impairment. There was no additional impairment recognized through earnings during 20212023 or 2020.2022.
NOTE 3 - Derivatives
The Company executes interest rate swaps with commercial banking customers to facilitate their respective risk management strategies. The notional amounts of these interest rate swaps and the offsetting counterparty derivative instruments were $143.6 million and $117.6 million$139,751 at December 31, 20212023 and 2020, respectively.$134,684 at December 31, 2022. These interest rate swaps are simultaneously hedged by offsetting interest rate swaps that the Company executes with a third party, such that the Company minimizes its net risk exposure resulting from such transactions with approved, reputable, independent counterparties with substantially matching terms. The agreements are considered stand alonestand-alone derivatives and changes in the fair value of derivatives are reported in earnings as non-interest income. While the derivatives represent economic hedges, they do not qualify as hedges for accounting purposes.
Credit risk arises from the possible inability of counterparties to meet the terms of their contracts. The Company’s exposure is limited to the replacement value of the contracts rather than the notional, principal or contract amounts. There are provisions in the agreements with the counterparties that allow for certain unsecured credit exposure up to an agreed threshold. Exposures in excess of the agreed thresholds are collateralized. In addition, the Company minimizes credit risk through credit approvals, limits, and monitoring procedures.
The following table reflects the fair value hedgesof derivative instruments included in the Consolidated Balance Sheets as of:
| | | | | December 31, 2021 | | December 31, 2020 | | | December 31, 2023 | | December 31, 2022 |
| Notional
Amount | | Fair Value | | Notional
Amount | | Fair Value |
| | Notional
Amount | | | | Notional
Amount | | Fair Value | | Notional
Amount | | Fair Value |
| Included in Other Assets: | Included in Other Assets: | | | | | | | | | Included in Other Assets: | | | | | | | | |
| Interest Rate Swaps | Interest Rate Swaps | | $ | 143,593 | | | $ | 4,519 | | | $ | 117,621 | | | $ | 8,806 | |
| Included in Other Liabilities: | Included in Other Liabilities: | |
| Interest Rate Swaps | Interest Rate Swaps | | $ | 143,593 | | | $ | 4,762 | | | $ | 117,621 | | | $ | 9,353 | |
| Interest Rate Swaps | |
| Interest Rate Swaps | |
| | |
| Notes to the Consolidated Financial Statements |
| Dollars in thousands, except per share data |
NOTE 3 – Derivatives (continued)
The following table presents the effect of derivative instruments on the Consolidated Statements of Income for the years ended December 31, 2021, 20202023, 2022 and 20192021 is as follows:
| | | | | 2021 | | 2020 | | 2019 | | | 2023 | | 2022 | | 2021 |
| Interest Rate Swaps: | Interest Rate Swaps: | | | | | | | Interest Rate Swaps: | | |
| Included in Other Income | Included in Other Income | | $ | 1,131 | | | $ | 268 | | | $ | 429 | |
| | |
Notes to the Consolidated Financial Statements |
Dollars in thousands, except per share data |
NOTE 4 –- Loans
Loans were comprised of the following classifications at December 31:
| | | | | | | | | | | | | | |
| | | 2021 | | 2020 |
| Commercial: | | | | |
| Commercial and Industrial Loans | | $ | 493,005 | | | $ | 638,773 | |
| Commercial Real Estate Loans | | 1,530,677 | | | 1,467,397 | |
| Agricultural Loans | | 358,150 | | | 376,186 | |
| Leases | | 55,345 | | | 55,664 | |
| Retail: | | | | |
| Home Equity Loans | | 222,525 | | | 219,348 | |
| Consumer Loans | | 70,302 | | | 66,717 | |
| Credit Cards | | 14,357 | | | 11,637 | |
| Residential Mortgage Loans | | 263,565 | | | 256,276 | |
| Subtotal | | 3,007,926 | | | 3,091,998 | |
| Less: Unearned Income | | (3,662) | | | (3,926) | |
| Allowance for Credit Losses | | (37,017) | | | (46,859) | |
| Loans, net | | $ | 2,967,247 | | | $ | 3,041,213 | |
As previously disclosed, the Coronavirus Aid, Relief and Economic Security Act (the “CARES Act”) was signed into law in March 2020, providing an approximately $2 trillion stimulus package that included direct payments to individual taxpayers, economic stimulus to significantly impacted industry sectors, emergency funding for hospitals and providers, small business loans, increased unemployment benefits, and a variety of tax incentives. For small businesses, eligible nonprofits and certain others, the CARES Act established a Paycheck Protection Program (“PPP”), a lending program administered by the Small Business Administration (“SBA”) that is intended to incentivize participants to retain their employees by providing them with loans that are fully guaranteed by the U.S. government and subject to forgiveness if program guidelines are met. The PPP was later extended and modified by the Paycheck Protection Program and Health Care Enhancement Act in April 2020 and the Paycheck Protection Program Flexibility Act in June 2020, with PPP funding under this initial round expiring on August 8, 2020.
In December 2020, the Economic Aid to Hard-Hit Small Businesses, Nonprofits, and Venues Act was signed into law as part of the Consolidated Appropriations Act, 2021 (the “CAA”). In addition to direct stimulus payments and other aid, this Act provided for a second round of PPP loans through March 31, 2021. Under the American Rescue Plan Act of 2021 and the PPP Extension Act of 2021, which were both enacted during March 2021, additional funds were provided for the program and the deadline for applying for PPP loans was extended through May 31, 2021 (with the SBA having been given until June 30, 2021 to process loan applications). | | | | | | | | | | | | | | |
| | | 2023 | | 2022 |
| Commercial: | | | | |
| Commercial and Industrial Loans | | $ | 589,541 | | | $ | 620,106 | |
| Commercial Real Estate Loans | | 2,121,835 | | | 1,966,884 | |
| Agricultural Loans | | 423,803 | | | 417,413 | |
| Leases | | 71,988 | | | 56,396 | |
| Retail: | | | | |
| Home Equity Loans | | 299,685 | | | 279,748 | |
| Consumer Loans | | 87,853 | | | 79,904 | |
| Credit Cards | | 20,351 | | | 17,512 | |
| Residential Mortgage Loans | | 362,844 | | | 350,682 | |
| Subtotal | | 3,977,900 | | | 3,788,645 | |
| Less: Unearned Income | | (6,818) | | | (3,711) | |
| Allowance for Credit Losses | | (43,765) | | | (44,168) | |
| Loans, net | | $ | 3,927,317 | | | $ | 3,740,766 | |
The Company actively participated in both roundstable above includes $13,237 and $21,149 of the PPP, lending funds primarily to its existing loan and/or deposit customers. The PPPpurchase credit deteriorated loans carry an interest rate of 1.00% and included a processing fee that varied depending on the balance of the loan at origination (which fee is recognized over the life of the loan). The vast majority of the Company’s PPP loans made during 2020 had two-year maturities, while PPP loans made during 2021 have five-year maturities.
Under the first round of the PPP (i.e., the 2020 round), the Company originated loans totaling approximately $351,260 in principal amount, with approximately $12,024 of related net processing fees on 3,070 PPP loan relationships. As of December 31, 2021, $349,152 of those first round PPP loans had been forgiven by the SBA and repaid to the Company pursuant to the terms of the program or repaid by customers, with $12,012 in net processing fees having been recognized by the Company.
Under the second round of the PPP (i.e., the 2021 round), the Company originated loans totaling approximately $157,042 in principal amount, with approximately $9,022 of related net processing fees, on 2,601 PPP loan relationships. As of December 31, 2021, $138,828 of second round PPP loans had been forgiven by the SBA and repaid to the Company, with $8,160 in net processing fees having been recognized by the Company. As a result of the forgiveness of the first and second round PPP loans, $20,322 of total PPP loans remain outstanding as of December 31, 2021, with approximately $872 of net fees remaining deferred on that date.2023 and 2022, respectively.
Allowance for Credit Losses for Loans:
The following tables present the activity in the allowance for credit losses by portfolio segment for the years ended December 31, 2023, 2022 and 2021:
| | | | | | | | | | | | | | | | | | | | | | | | | | | | | | | | | | | | | | | | | | | | | | | | | | | | | | | | |
| December 31, 2023 | | Commercial
and
Industrial
Loans | | Commercial
Real Estate
Loans | | Agricultural
Loans | | Leases | | Consumer
Loans | | Home Equity Loans | | Credit Cards | | Residential
Mortgage
Loans | | Total |
| Allowance for Credit Losses: | | | | | | | | | | | | | | | | | | |
| Beginning Balance | | $ | 13,749 | | | $ | 21,598 | | | $ | 4,188 | | | $ | 209 | | | $ | 595 | | | $ | 1,344 | | | $ | 257 | | | $ | 2,228 | | | $ | 44,168 | |
| Provision (Benefit) for Credit Losses | | (4,190) | | | 4,305 | | | (324) | | | 137 | | | 919 | | | 551 | | | 563 | | | 589 | | | 2,550 | |
| Loans Charged-off | | (1,792) | | | (56) | | | (27) | | | — | | | (1,309) | | | (94) | | | (455) | | | (58) | | | (3,791) | |
| Recoveries Collected | | 154 | | | 76 | | | — | | | — | | | 554 | | | 33 | | | 18 | | | 3 | | | 838 | |
| Total Ending Allowance Balance | | $ | 7,921 | | | $ | 25,923 | | | $ | 3,837 | | | $ | 346 | | | $ | 759 | | | $ | 1,834 | | | $ | 383 | | | $ | 2,762 | | | $ | 43,765 | |
| | |
| Notes to the Consolidated Financial Statements |
| Dollars in thousands, except per share data |
NOTE 4 – Loans (continued)
Allowance for Credit Losses for Loans | | | | | | | | | | | | | | | | | | | | | | | | | | | | | | | | | | | | | | | | | | | | | | | | | | | | | | | | |
| December 31, 2022 | | Commercial
and
Industrial
Loans | | Commercial
Real Estate
Loans | | Agricultural
Loans | | Leases | | Consumer
Loans | | Home Equity Loans | | Credit Cards | | Residential
Mortgage
Loans | | Total |
| Allowance for Credit Losses: | | | | | | | | | | | | | | | | | | |
| Beginning Balance | | $ | 9,554 | | | $ | 19,245 | | | $ | 4,505 | | | $ | 200 | | | $ | 507 | | | $ | 1,061 | | | $ | 240 | | | $ | 1,705 | | | $ | 37,017 | |
| Acquisition of Citizens Union Bank of Shelbyville, KY - PCD Loans | | 376 | | | 1,945 | | | 689 | | | — | | | 2 | | | — | | | — | | | 105 | | | 3,117 | |
| Provision (Benefit) for Credit Losses | | 4,942 | | | 463 | | | (1,006) | | | 9 | | | 991 | | | 351 | | | 163 | | | 437 | | | 6,350 | |
| Loans Charged-off | | (1,149) | | | (79) | | | — | | | — | | | (1,364) | | | (69) | | | (165) | | | (24) | | | (2,850) | |
| Recoveries Collected | | 26 | | | 24 | | | — | | | — | | | 459 | | | 1 | | | 19 | | | 5 | | | 534 | |
| Total Ending Allowance Balance | | $ | 13,749 | | | $ | 21,598 | | | $ | 4,188 | | | $ | 209 | | | $ | 595 | | | $ | 1,344 | | | $ | 257 | | | $ | 2,228 | | | $ | 44,168 | |
The following tables present the activity in the allowance for credit losses by portfolio segment for the years ended December 31, 2021 and 2020:
| | | | | | | | | | | | | | | | | | | | | | | | | | | | | | | | | | | | | | | | | | | | | | | | | | | | | | | | | | | | | | |
| December 31, 2021 | | Commercial
and
Industrial
Loans | | Commercial
Real Estate
Loans | | Agricultural
Loans | | Leases | | Consumer
Loans | | Home Equity Loans | | Credit Cards | | Residential
Mortgage
Loans | | Unallocated | | Total |
| Allowance for Credit Losses: | | | | | | | | | | | | | | | | | | | | |
| Beginning Balance | | $ | 6,445 | | | $ | 29,878 | | | $ | 6,756 | | | $ | 200 | | | $ | 490 | | | $ | 996 | | | $ | 150 | | | $ | 1,944 | | | $ | — | | | $ | 46,859 | |
| Provision (Benefit) for Credit Losses | | 5,825 | | | (10,663) | | | (2,251) | | | — | | | 385 | | | 44 | | | 387 | | | (227) | | | — | | | (6,500) | |
| Loans Charged-off | | (2,777) | | | (10) | | | — | | | — | | | (675) | | | (15) | | | (313) | | | (45) | | | — | | | (3,835) | |
| Recoveries Collected | | 61 | | | 40 | | | — | | | — | | | 307 | | | 36 | | | 16 | | | 33 | | | — | | | 493 | |
| Total Ending Allowance Balance | | $ | 9,554 | | | $ | 19,245 | | | $ | 4,505 | | | $ | 200 | | | $ | 507 | | | $ | 1,061 | | | $ | 240 | | | $ | 1,705 | | | $ | — | | | $ | 37,017 | |
| | December 31, 2020 | | Commercial
and
Industrial
Loans | | Commercial
Real Estate
Loans | | Agricultural
Loans | | Leases | | Consumer
Loans | | Home Equity Loans | | Credit Cards | | Residential
Mortgage
Loans | | Unallocated | | Total |
| December 31, 2021 | | December 31, 2021 | | Commercial
and
Industrial
Loans | | Commercial
Real Estate
Loans | | Agricultural
Loans | | Leases | | Consumer
Loans | | Home Equity Loans | | Credit Cards | | Residential
Mortgage
Loans | | Total |
| Allowance for Credit Losses: | Allowance for Credit Losses: | | | | | | | | | | | | | | | | |
| Beginning Balance Prior to Adoption of ASC 326 | | $ | 4,799 | | | $ | 4,692 | | | $ | 5,315 | | | $ | — | | | $ | 434 | | | $ | 200 | | | $ | — | | | $ | 333 | | | $ | 505 | | | $ | 16,278 | |
| Impact of Adopting ASC 326 | | 2,245 | | | 3,063 | | | 1,438 | | | 105 | | | (59) | | | 762 | | | 124 | | | 1,594 | | | (505) | | | 8,767 | |
| Impact of Adopting ASC 326 - PCD Loans | | 2,191 | | | 4,385 | | | 128 | | | — | | | — | | | 35 | | | — | | | 147 | | | — | | | 6,886 | |
| Beginning Balance | |
| Beginning Balance | |
| Beginning Balance | |
| Provision (Benefit) for Credit Losses | Provision (Benefit) for Credit Losses | | (694) | | | 17,645 | | | (125) | | | 95 | | | 527 | | | 66 | | | 131 | | | (95) | | | — | | | 17,550 | |
| Initial Allowance on Loans Purchased with Credit Deterioration | | — | | | — | | | — | | | — | | | — | | | — | | | — | | | — | | | — | | | — | |
| Loans Charged-off | Loans Charged-off | | (2,119) | | | (36) | | | — | | | — | | | (766) | | | (67) | | | (109) | | | (39) | | | — | | | (3,136) | |
| Recoveries Collected | Recoveries Collected | | 23 | | | 129 | | | — | | | — | | | 354 | | | — | | | 4 | | | 4 | | | — | | | 514 | |
| Total Ending Allowance Balance | Total Ending Allowance Balance | | $ | 6,445 | | | $ | 29,878 | | | $ | 6,756 | | | $ | 200 | | | $ | 490 | | | $ | 996 | | | $ | 150 | | | $ | 1,944 | | | $ | — | | | $ | 46,859 | |
The Company utilizes the Static Pool methodology in determining expected future credit losses. Static pool analysis means segmenting and tracking loans over a period of time based on similar risk characteristics such as loan structure, collateral type, industry of borrower and concentrations, contractual terms and credit risk indicators. Static pool calculates a loss rate on a closed pool of loans that existed on a specified start date based upon the remaining life of each segment.
The Company’s expected loss estimate is anchored in historical credit loss experience, with an emphasis on all available portfolio data. The Company’s historical look-back period includes January 2014 through the current period, on a monthly basis.
Qualitative reserves reflect management’s overall estimate of the extent to which current expected credit losses on collectively evaluated loans will differ from historical loss experience. The analysis takes into consideration industry and collateral concentrations, acquired loan portfolio characteristics and other credit-related analytics as deemed appropriate. Management attempts to quantify qualitative reserves wheneverby anchoring to specific data points when possible.
The Company estimates the allowance balance using relevant available information, from internal and external sources, relating to past events, current conditions, and reasonable and supportable forecasts. Historical loss experience provides the basis for the estimation of expected credit losses. Adjustments to historical loss information are made for changes in underwriting standards, portfolio mix, delinquency level, changes in environmental conditions, unemployment rates, risk classifications and collateral values. The allowance for credit losses is measured on a collective (pooled) basis when similar risk characteristics exist. Based on the potential increased losses related to the economic impactadvancing stress on the economy as a result of inflationary pressures, rising interest rates and financial market volatility, the COVID-19 pandemic, the BankCompany has considered
| | |
Notes to the Consolidated Financial Statements |
Dollars in thousands, except per share data |
NOTE 4 – Loans (continued)
the potential for losses to this loss experience may align with loss experience from the recessionary period from 2008-2011 and qualitative adjustments werehave been made accordingly.
Loans that do not share risk characteristics are evaluated on an individual basis. Loans evaluated individually are not included in the collective evaluation. When the borrower is experiencing financial difficulty at the reporting date and repayment is expected to be provided substantially through the operation or sale of the collateral, expected credit losses are based on the fair value of the collateral at the reporting date adjusted for selling costs.
| | |
| Notes to the Consolidated Financial Statements |
| Dollars in thousands, except per share data |
NOTE 4 – Loans (continued)
For the year ended December 31, 2021,2023, the decline in allowance for credit losses decreased primarily due to a decline in individually analyzed loans as well as a decline in the reserve attributable to pandemic-related stressed sectors. While there continues to be great uncertaintywas largely related to COVID-19 on our borrowers and communities, we have recognized improvementsthe resolution, during the fourth quarter of 2023, of a single commercial borrowing relationship with minimal loss recognition for which the Company had established a significant reserve in employmentprevious periods which was slightly offset by additional reserve for loan portfolio growth. Key indicators utilized in forecasting for the allowance calculations include unemployment rates and gross domestic product which are key indicators utilized in our forecasting for our allowance calculations. The impact of fiscal stimulus, including direct payments to individuals, ongoing increased unemployment benefits, as well as commodity prices for the various government-sponsored loan programs, was alsoagricultural segment of the portfolio. There has been some improvement in these factors over previous periods; however, rising interest rates and the expanded inflationary impact on consumer discretionary spending were considered in ourthe qualitative adjustments. Since PPP loans are guaranteed by the Small Business Administration (SBA), they have minimal impact onfactors to determine the allowance for credit losses.
All classes of loans, including loans acquired with deteriorated credit quality, are generally placed on non-accrual status when scheduled principal or interest payments are past due for 90 days or more or when the borrower’s ability to repay becomes doubtful. For purchased loans, the determination is made at the time of acquisition as well as over the life of the loan. Uncollected accrued interest for each class of loans is reversed against income at the time a loan is placed on non-accrual. Interest received on such loans is accounted for on the cash-basis or cost-recovery method, until qualifying for return to accrual. All classes of loans are returned to accrual status when all the principal and interest amounts contractually due are brought current and future payments are reasonably assured. Loans are typically charged-off at 180 days past due, or earlier if deemed uncollectible. Exceptions to the non-accrual and charge-off policies are made when the loan is well secured and in the process of collection.
The following tables present the amortized cost basis of loans on non-accrual status and loans past due over 89 days still accruing as of December 31, 20212023 and 2020:2022:
| | December 31, 2021 | | Non-Accrual With No Allowance for Credit Loss ⁽¹⁾ | | Non-Accrual | | Loans Past Due Over 89 Days Still Accruing |
| December 31, 2023 | | December 31, 2023 | | Non-Accrual With No Allowance for Credit Loss ⁽¹⁾ | | Non-Accrual | | Loans Past Due Over 89 Days Still Accruing |
| | Commercial and Industrial Loans | |
| Commercial and Industrial Loans | |
| Commercial and Industrial Loans | Commercial and Industrial Loans | | $ | 1,989 | | | $ | 10,530 | | | $ | — | |
| Commercial Real Estate Loans | Commercial Real Estate Loans | | 145 | | | 2,243 | | | 156 | |
| Agricultural Loans | Agricultural Loans | | 1,041 | | | 1,136 | | | — | |
| Leases | Leases | | — | | | — | | | — | |
| Home Equity Loans | Home Equity Loans | | 1 | | | 24 | | | — | |
| Consumer Loans | Consumer Loans | | 16 | | | 18 | | | — | |
| Credit Cards | Credit Cards | | 64 | | | 64 | | | — | |
| Residential Mortgage Loans | Residential Mortgage Loans | | 587 | | | 587 | | | — | |
| Total | Total | | $ | 3,843 | | | $ | 14,602 | | | $ | 156 | |
(1) Includes non-accrual loans with no allowance for credit loss and are also included in Non-Accrual loans totaling $14,602.$9,136.
| | |
Notes to the Consolidated Financial Statements |
Dollars in thousands, except per share data |
NOTE 4 – Loans (continued)
| | December 31, 2020 | | Non-Accrual With No Allowance for Credit Loss ⁽¹⁾ | | Non-Accrual | | Loans Past Due Over 89 Days Still Accruing |
| December 31, 2022 | | December 31, 2022 | | Non-Accrual With No Allowance for Credit Loss ⁽¹⁾ | | Non-Accrual | | Loans Past Due Over 89 Days Still Accruing |
| | Commercial and Industrial Loans | |
| Commercial and Industrial Loans | |
| Commercial and Industrial Loans | Commercial and Industrial Loans | | $ | 4,571 | | | $ | 8,133 | | | $ | — | |
| Commercial Real Estate Loans | Commercial Real Estate Loans | | 3,152 | | | 10,188 | | | — | |
| Agricultural Loans | Agricultural Loans | | 1,291 | | | 1,915 | | | — | |
| Leases | Leases | | — | | | — | | | — | |
| Home Equity Loans | Home Equity Loans | | 271 | | | 271 | | | — | |
| Consumer Loans | Consumer Loans | | 77 | | | 84 | | | — | |
| Credit Cards | Credit Cards | | 86 | | | 86 | | | —�� | |
| Residential Mortgage Loans | Residential Mortgage Loans | | 671 | | | 830 | | | — | |
| Total | Total | | $ | 10,119 | | | $ | 21,507 | | | $ | — | |
(1) Includes non-accrual loans with no allowance for credit loss and are also included in Non-Accrual loans totaling $21,507.$12,888.
Interest income on non-accrual loans recognized during the years ended December 31, 20212023 and 20202022 totaled $80$106 and $28.
The following tables present the amortized cost basis of collateral-dependent loans by class of loans as of December 31, 2021 and 2020:
| | | | | | | | | | | | | | | | | | | | | | | | | | | | | | | | |
| December 31, 2021 | | Real Estate | | Equipment | | Accounts Receivable | | Other | | Total |
| | | | | | | | | | |
| Commercial and Industrial Loans | | $ | 1,716 | | | $ | 2,444 | | | $ | 549 | | | $ | 5,822 | | | $ | 10,531 | |
| Commercial Real Estate Loans | | 4,610 | | | — | | | — | | | — | | | 4,610 | |
| Agricultural Loans | | 1,522 | | | — | | | — | | | — | | | 1,522 | |
| Leases | | — | | | — | | | — | | | — | | | — | |
| Home Equity Loans | | 441 | | | — | | | — | | | — | | | 441 | |
| Consumer Loans | | 6 | | | — | | | — | | | 2 | | | 8 | |
| Credit Cards | | — | | | — | | | — | | | — | | | — | |
| Residential Mortgage Loans | | 652 | | | — | | | — | | | — | | | 652 | |
| Total | | $ | 8,947 | | | $ | 2,444 | | | $ | 549 | | | $ | 5,824 | | | $ | 17,764 | |
| | | | | | | | | | | | | | | | | | | | | | | | | | | | | | | | |
| December 31, 2020 | | Real Estate | | Equipment | | Accounts Receivable | | Other | | Total |
| | | | | | | | | | |
| Commercial and Industrial Loans | | $ | 4,943 | | | $ | 3,014 | | | $ | 669 | | | $ | 154 | | | $ | 8,780 | |
| Commercial Real Estate Loans | | 11,877 | | | — | | | — | | | 1,530 | | | 13,407 | |
| Agricultural Loans | | 3,064 | | | — | | | — | | | — | | | 3,064 | |
| Leases | | — | | | — | | | — | | | — | | | — | |
| Home Equity Loans | | 416 | | | — | | | — | | | — | | | 416 | |
| Consumer Loans | | 4 | | | 4 | | | — | | | 3 | | | 11 | |
| Credit Cards | | — | | | — | | | — | | | — | | | — | |
| Residential Mortgage Loans | | 817 | | | — | | | — | | | — | | | 817 | |
| Total | | $ | 21,121 | | | $ | 3,018 | | | $ | 669 | | | $ | 1,687 | | | $ | 26,495 | |
| | |
| Notes to the Consolidated Financial Statements |
| Dollars in thousands, except per share data |
NOTE 4 – Loans (continued)
The following tables present the amortized cost basis of collateral-dependent loans by class of loans as of December 31, 2023 and 2022:
| | | | | | | | | | | | | | | | | | | | | | | | | | | | | | | | |
| December 31, 2023 | | Real Estate | | Equipment | | Accounts Receivable | | Other | | Total |
| | | | | | | | | | |
| Commercial and Industrial Loans | | $ | 3,668 | | | $ | 49 | | | $ | — | | | $ | 1,888 | | | $ | 5,605 | |
| Commercial Real Estate Loans | | 8,553 | | | — | | | — | | | — | | | 8,553 | |
| Agricultural Loans | | 3,338 | | | 1,055 | | | — | | | — | | | 4,393 | |
| Leases | | — | | | — | | | — | | | — | | | — | |
| Home Equity Loans | | 420 | | | — | | | — | | | — | | | 420 | |
| Consumer Loans | | 9 | | | — | | | — | | | — | | | 9 | |
| Credit Cards | | — | | | — | | | — | | | — | | | — | |
| Residential Mortgage Loans | | 753 | | | — | | | — | | | — | | | 753 | |
| Total | | $ | 16,741 | | | $ | 1,104 | | | $ | — | | | $ | 1,888 | | | $ | 19,733 | |
| | | | | | | | | | | | | | | | | | | | | | | | | | | | | | | | |
| December 31, 2022 | | Real Estate | | Equipment | | Accounts Receivable | | Other | | Total |
| | | | | | | | | | |
| Commercial and Industrial Loans | | $ | 2,078 | | | $ | 1,219 | | | $ | 272 | | | $ | 5,851 | | | $ | 9,420 | |
| Commercial Real Estate Loans | | 12,192 | | | 36 | | | — | | | — | | | 12,228 | |
| Agricultural Loans | | 4,944 | | | 318 | | | — | | | — | | | 5,262 | |
| Leases | | — | | | — | | | — | | | — | | | — | |
| Home Equity Loans | | 467 | | | — | | | — | | | — | | | 467 | |
| Consumer Loans | | 8 | | | 2 | | | — | | | 12 | | | 22 | |
| Credit Cards | | — | | | — | | | — | | | — | | | — | |
| Residential Mortgage Loans | | 1,060 | | | — | | | — | | | — | | | 1,060 | |
| Total | | $ | 20,749 | | | $ | 1,575 | | | $ | 272 | | | $ | 5,863 | | | $ | 28,459 | |
The following tables present the aging of the amortized cost basis in past due loans by class of loans as of December 31, 20212023 and 2020:2022:
| | | | | | | | | | | | | | | | | | | | | | | | | | | | | | | | | | | | | | |
| December 31, 2021 | | 30-59 Days
Past Due | | 60-89 Days
Past Due | | Greater Than 89 Days Past Due | | Total
Past Due | | Loans Not
Past Due | | Total |
| | | | | | | | | | | | |
| Commercial and Industrial Loans | | $ | 12 | | | $ | — | | | $ | 6,147 | | | $ | 6,159 | | | $ | 486,846 | | | $ | 493,005 | |
| Commercial Real Estate Loans | | — | | | 5 | | | 891 | | | 896 | | | 1,529,781 | | | 1,530,677 | |
| Agricultural Loans | | — | | | — | | | — | | | — | | | 358,150 | | | 358,150 | |
| Leases | | — | | | — | | | — | | | — | | | 55,345 | | | 55,345 | |
| Home Equity Loans | | 225 | | | 229 | | | 25 | | | 479 | | | 222,046 | | | 222,525 | |
| Consumer Loans | | 158 | | | 58 | | | 4 | | | 220 | | | 70,082 | | | 70,302 | |
| Credit Cards | | 61 | | | 9 | | | 64 | | | 134 | | | 14,223 | | | 14,357 | |
| Residential Mortgage Loans | | 2,726 | | | 507 | | | 369 | | | 3,602 | | | 259,963 | | | 263,565 | |
| Total | | $ | 3,182 | | | $ | 808 | | | $ | 7,500 | | | $ | 11,490 | | | $ | 2,996,436 | | | $ | 3,007,926 | |
| | | | | | | | | | | | | | | | | | | | | | | | | | | | | | | | | | | | | | |
| December 31, 2020 | | 30-59 Days
Past Due | | 60-89 Days
Past Due | | Greater Than 89 Days Past Due | | Total
Past Due | | Loans Not
Past Due | | Total |
| | | | | | | | | | | | |
| Commercial and Industrial Loans | | $ | 477 | | | $ | 909 | | | $ | 2,441 | | | $ | 3,827 | | | $ | 634,946 | | | $ | 638,773 | |
| Commercial Real Estate Loans | | 5 | | | 4,877 | | | 3,682 | | | 8,564 | | | 1,458,833 | | | 1,467,397 | |
| Agricultural Loans | | — | | | — | | | 651 | | | 651 | | | 375,535 | | | 376,186 | |
| Leases | | — | | | — | | | — | | | — | | | 55,664 | | | 55,664 | |
| Home Equity Loans | | 672 | | | 5 | | | 271 | | | 948 | | | 218,400 | | | 219,348 | |
| Consumer Loans | | 233 | | | 84 | | | 65 | | | 382 | | | 66,335 | | | 66,717 | |
| Credit Cards | | 95 | | | 80 | | | 86 | | | 261 | | | 11,376 | | | 11,637 | |
| Residential Mortgage Loans | | 3,737 | | | 1,590 | | | 529 | | | 5,856 | | | 250,420 | | | 256,276 | |
| Total | | $ | 5,219 | | | $ | 7,545 | | | $ | 7,725 | | | $ | 20,489 | | | $ | 3,071,509 | | | $ | 3,091,998 | |
Troubled Debt Restructurings:
In certain instances, the Company may choose to restructure the contractual terms of loans. A troubled debt restructuring occurs when the Bank grants a concession to the borrower that it would not otherwise consider due to a borrower’s financial difficulty. In order to determine whether a borrower is experiencing financial difficulty, an evaluation is performed of the probability that the borrower will be in payment default on any of its debt in the foreseeable future without modification. This evaluation is performed under the Company’s internal underwriting policy. The Company uses the same methodology for loans acquired with deteriorated credit quality as for all other loans when determining whether the loan is a troubled debt restructuring.
As of December 31, 2021 and 2020, the Company had trouble debt restructurings totaling $104 and $111, respectively. The Company had no specific allocation of allowance for these loans at December 31, 2021.
The Company had not committed to lending any additional amounts during 2021 or 2020 to customers with outstanding loans that are classified as trouble debt restructurings.
During the years ended December 31, 2021 and 2020, the Company had no loans modified as troubled debt restructurings. Additionally, there were no loans modified as trouble debt restructurings for which there was a payment default within twelve months following the modification during the years ended December 31, 2021 and 2020.
A loan is considered to be in payment default once it is 30 days contractually past due under the modified terms.
| | | | | | | | | | | | | | | | | | | | | | | | | | | | | | | | | | | | | | |
| December 31, 2023 | | 30-59 Days
Past Due | | 60-89 Days
Past Due | | Greater Than 89 Days Past Due | | Total
Past Due | | Loans Not
Past Due | | Total |
| | | | | | | | | | | | |
| Commercial and Industrial Loans | | $ | 832 | | | $ | 257 | | | $ | 3,299 | | | $ | 4,388 | | | $ | 585,153 | | | $ | 589,541 | |
| Commercial Real Estate Loans | | 1,215 | | | 484 | | | 938 | | | 2,637 | | | 2,119,198 | | | 2,121,835 | |
| Agricultural Loans | | 5 | | | 248 | | | 497 | | | 750 | | | 423,053 | | | 423,803 | |
| Leases | | — | | | — | | | — | | | — | | | 71,988 | | | 71,988 | |
| Home Equity Loans | | 1,016 | | | 571 | | | 1,033 | | | 2,620 | | | 297,065 | | | 299,685 | |
| Consumer Loans | | 658 | | | 84 | | | 110 | | | 852 | | | 87,001 | | | 87,853 | |
| Credit Cards | | 165 | | | 87 | | | 142 | | | 394 | | | 19,957 | | | 20,351 | |
| Residential Mortgage Loans | | 7,362 | | | 1,647 | | | 1,215 | | | 10,224 | | | 352,620 | | | 362,844 | |
| Total | | $ | 11,253 | | | $ | 3,378 | | | $ | 7,234 | | | $ | 21,865 | | | $ | 3,956,035 | | | $ | 3,977,900 | |
| | |
| Notes to the Consolidated Financial Statements |
| Dollars in thousands, except per share data |
NOTE 4 – Loans (continued)
Loan Modifications and Troubled Debt Restructurings due to COVID-19
| | | | | | | | | | | | | | | | | | | | | | | | | | | | | | | | | | | | | | |
| December 31, 2022 | | 30-59 Days
Past Due | | 60-89 Days
Past Due | | Greater Than 89 Days Past Due | | Total
Past Due | | Loans Not
Past Due | | Total |
| | | | | | | | | | | | |
| Commercial and Industrial Loans | | $ | 268 | | | $ | 681 | | | $ | 8,285 | | | $ | 9,234 | | | $ | 610,872 | | | $ | 620,106 | |
| Commercial Real Estate Loans | | 1,617 | | | 14 | | | 616 | | | 2,247 | | | 1,964,637 | | | 1,966,884 | |
| Agricultural Loans | | 343 | | | — | | | 123 | | | 466 | | | 416,947 | | | 417,413 | |
| Leases | | — | | | — | | | — | | | — | | | 56,396 | | | 56,396 | |
| Home Equity Loans | | 1,770 | | | 140 | | | 310 | | | 2,220 | | | 277,528 | | | 279,748 | |
| Consumer Loans | | 219 | | | 64 | | | 252 | | | 535 | | | 79,369 | | | 79,904 | |
| Credit Cards | | 86 | | | 24 | | | 146 | | | 256 | | | 17,256 | | | 17,512 | |
| Residential Mortgage Loans | | 6,330 | | | 2,783 | | | 1,051 | | | 10,164 | | | 340,518 | | | 350,682 | |
| Total | | $ | 10,633 | | | $ | 3,706 | | | $ | 10,783 | | | $ | 25,122 | | | $ | 3,763,523 | | | $ | 3,788,645 | |
On April 7, 2020, the federal banking regulators issued a revised Interagency Statement on Loan Modifications and ReportingMade to Borrowers Experiencing Financial Difficulty
Effective January 1, 2023, the Company prospectively adopted ASU 2022-02, which eliminated the accounting for Financial Institutions, which, among other things, encouraged financial institutions to work prudently with borrowers who are or may be unable to meet their contractual payment obligations because of the effects of COVID-19, and stated that institutions generally do not need to categorize COVID-19-related modifications as troubled debt restructurings and thatwhile establishing a new standard for the agenciestreatment of modifications made to borrowers experiencing financial difficulties. As such, effective with the adoption of the new standard, the Company will not direct supervised institutions to automatically categorize all COVID-19 related loannow include, prospectively, financial difficulty modifications asin its presentation of nonperforming loans, nonperforming assets or classified assets. Prior period data, which included troubled debt restructurings. Similarly, under the CARES Act, provisions were included that allow for loan modifications torestructurings, has not be classified as TDRs if certain criteria are met. This TDR exemption, which was set to expire on December 31, 2020, was extended under the CAA to, effectively, January 1, 2022.been adjusted.
In response to requests fromThe Company’s loan modifications for borrowers who had experienced pandemic-related businessexperiencing financial difficulties will typically include one or personal cash flow interruptions, anda combination of the following: a reduction of the stated interest rate of the loan; an extension of the maturity date at a stated rate of interest lower than the current market rate for new debt with similar risk; or a permanent reduction of the recorded investment in accordance with regulatory guidance,the loan. No modifications in 2023 resulted in the permanent reduction of the recorded investment in the loan.
At December 31, 2023, the Company began making short-term loan modifications involving both partial and fullhad no modified loans made to borrowers experiencing financial difficulty. There were no modified loans that had a payment deferrals in April 2020. As ofdefault during the year ended December 31, 2021, the Company has just 1 commercial real estate loan,2023 and were modified in the principal amount of $3.5 million, withtwelve months prior to that default to borrowers experiencing financial difficulty. The Company considers a loan to be in payment modification thatdefault once it is still in effect, with such credit relationship making full interest payments.30 days contractually past due under the modified terms.
Credit Quality Indicators:
The Company categorizes loans into risk categories based on relevant information about the ability of borrowers to service their debt such as: current financial information, historical payment experience, credit documentation, public information, and current economic trends, among other factors. The Company classifies loans as to credit risk by individually analyzing loans. This analysis includes commercial and industrial loans, commercial real estate loans, and agricultural loans with an outstanding balance greater than $250. This analysis is typically performed on at least an annual basis. The Company uses the following definitions for risk ratings:
Special Mention. Loans classified as special mention have a potential weakness that deserves management’s close attention. If left uncorrected, these potential weaknesses may result in deterioration of the repayment prospects for the loan or of the institution’s credit position at some future date.
Substandard. Loans classified as substandard are inadequately protected by the current net worth and paying capacity of the obligor or of the collateral pledged, if any. Loans so classified have a well-defined weakness or weaknesses that jeopardize the liquidation of the debt. They are characterized by the distinct possibility that the institution will sustain some loss if the deficiencies are not corrected.
Doubtful. Loans classified as doubtful have all the weaknesses inherent in those classified as substandard, with the added characteristic that the weaknesses make collection or liquidation in full, on the basis of currently existing facts, conditions, and values, highly questionable and improbable.
Loans not meeting the criteria above that are analyzed individually as part of the above described process are considered to be pass rated loans.
| | |
| Notes to the Consolidated Financial Statements |
| Dollars in thousands, except per share data |
NOTE 4 – Loans (continued)
The following table presents the risk category of loans and current period gross charge-offs as of December 31, 2023 by loan class and vintage year:
| | | | | | | | | | | | | | | | | | | | | | | | | | | | | | | | | | | | | | | | | | | | | | | | | | |
| | Term Loans Amortized Cost Basis by Origination Year | | | | |
| As of December 31, 2023 | | 2023 | | 2022 | | 2021 | | 2020 | | 2019 | | Prior | | Revolving Loans Amortized Cost Basis | | Total |
| Commercial and Industrial: | | | | | | | | | | | | | | | | |
| Risk Rating | | | | | | | | | | | | | | | | |
| Pass | | $ | 112,626 | | | $ | 134,590 | | | $ | 80,738 | | | $ | 28,492 | | | $ | 32,585 | | | $ | 45,764 | | | $ | 134,936 | | | $ | 569,731 | |
| Special Mention | | 47 | | | 453 | | | 128 | | | 829 | | | — | | | 1,948 | | | 3,048 | | | 6,453 | |
| Substandard | | — | | | 294 | | | 5,689 | | | 780 | | | 1,696 | | | 1,471 | | | 3,427 | | | 13,357 | |
| Doubtful | | — | | | — | | | — | | | — | | | — | | | — | | | — | | | — | |
| Total Commercial and Industrial Loans | | $ | 112,673 | | | $ | 135,337 | | | $ | 86,555 | | | $ | 30,101 | | | $ | 34,281 | | | $ | 49,183 | | | $ | 141,411 | | | $ | 589,541 | |
| | | | | | | | | | | | | | | | |
| Current Period Gross Charge-Offs | | $ | — | | | $ | 911 | | | $ | 32 | | | $ | 493 | | | $ | 7 | | | $ | 88 | | | $ | 261 | | | $ | 1,792 | |
| | | | | | | | | | | | | | | | |
| Commercial Real Estate: | | | | | | | | | | | | | | | | |
| Risk Rating | | | | | | | | | | | | | | | | |
| Pass | | $ | 300,569 | | | $ | 416,874 | | | $ | 470,917 | | | $ | 225,668 | | | $ | 147,431 | | | $ | 458,821 | | | $ | 41,102 | | | $ | 2,061,382 | |
| Special Mention | | 13,906 | | | 2,401 | | | 11,155 | | | 1,651 | | | 259 | | | 19,532 | | | 638 | | | 49,542 | |
| Substandard | | — | | | 617 | | | 5,510 | | | 1,142 | | | 729 | | | 2,737 | | | 176 | | | 10,911 | |
| Doubtful | | — | | | — | | | — | | | — | | | — | | | — | | | — | | | — | |
| Total Commercial Real Estate Loans | | $ | 314,475 | | | $ | 419,892 | | | $ | 487,582 | | | $ | 228,461 | | | $ | 148,419 | | | $ | 481,090 | | | $ | 41,916 | | | $ | 2,121,835 | |
| | | | | | | | | | | | | | | | |
| Current Period Gross Charge-Offs | | $ | — | | | $ | — | | | $ | 56 | | | $ | — | | | $ | — | | | $ | — | | | $ | — | | | $ | 56 | |
| | | | | | | | | | | | | | | | |
| Agricultural: | | | | | | | | | | | | | | | | |
| Risk Rating | | | | | | | | | | | | | | | | |
| Pass | | $ | 44,948 | | | $ | 56,291 | | | $ | 39,852 | | | $ | 42,279 | | | $ | 23,217 | | | $ | 100,391 | | | $ | 89,455 | | | $ | 396,433 | |
| Special Mention | | 1,495 | | | 164 | | | 903 | | | 5,047 | | | 2,338 | | | 9,894 | | | 2,259 | | | 22,100 | |
| Substandard | | — | | | — | | | 199 | | | 188 | | | 200 | | | 4,683 | | | — | | | 5,270 | |
| Doubtful | | — | | | — | | | — | | | — | | | — | | | — | | | — | | | — | |
| Total Agricultural Loans | | $ | 46,443 | | | $ | 56,455 | | | $ | 40,954 | | | $ | 47,514 | | | $ | 25,755 | | | $ | 114,968 | | | $ | 91,714 | | | $ | 423,803 | |
| | | | | | | | | | | | | | | | |
| Current Period Gross Charge-Offs | | $ | — | | | $ | — | | | $ | — | | | $ | 2 | | | $ | — | | | $ | — | | | $ | 25 | | | $ | 27 | |
| | | | | | | | | | | | | | | | |
| Leases: | | | | | | | | | | | | | | | | |
| Risk Rating | | | | | | | | | | | | | | | | |
| Pass | | $ | 36,848 | | | $ | 12,281 | | | $ | 10,634 | | | $ | 6,086 | | | $ | 4,788 | | | $ | 1,351 | | | $ | — | | | $ | 71,988 | |
| Special Mention | | — | | | — | | | — | | | — | | | — | | | — | | | — | | | — | |
| Substandard | | — | | | — | | | — | | | — | | | — | | | — | | | — | | | — | |
| Doubtful | | — | | | — | | | — | | | — | | | — | | | — | | | — | | | — | |
| Total Leases | | $ | 36,848 | | | $ | 12,281 | | | $ | 10,634 | | | $ | 6,086 | | | $ | 4,788 | | | $ | 1,351 | | | $ | — | | | $ | 71,988 | |
| | | | | | | | | | | | | | | | |
| Current Period Gross Charge-Offs | | $ | — | | | $ | — | | | $ | — | | | $ | — | | | $ | — | | | $ | — | | | $ | — | | | $ | — | |
| | |
| Notes to the Consolidated Financial Statements |
| Dollars in thousands, except per share data |
NOTE 4 – Loans (continued)
As of December 31, 2022, the risk category of loans by class of loans is as follows:
| | | | | | | | | | | | | | | | | | | | | | | | | | | | | | | | | | | | | | | | | | | | | | | | | | |
| | Term Loans Amortized Cost Basis by Origination Year | | | | |
| As of December 31, 2022 | | 2022 | | 2021 | | 2020 | | 2019 | | 2018 | | Prior | | Revolving Loans Amortized Cost Basis | | Total |
| Commercial and Industrial: | | | | | | | | | | | | | | | | |
| Risk Rating | | | | | | | | | | | | | | | | |
| Pass | | $ | 156,318 | | | $ | 117,648 | | | $ | 39,949 | | | $ | 46,505 | | | $ | 18,423 | | | $ | 51,482 | | | $ | 154,203 | | | $ | 584,528 | |
| Special Mention | | 56 | | | 148 | | | 577 | | | 78 | | | 551 | | | 2,346 | | | 1,672 | | | 5,428 | |
| Substandard | | 1,714 | | | 5,629 | | | 849 | | | 1,304 | | | 1,028 | | | 2,237 | | | 17,389 | | | 30,150 | |
| Doubtful | | — | | | — | | | — | | | — | | | — | | | — | | | — | | | — | |
| Total Commercial and Industrial Loans | | $ | 158,088 | | | $ | 123,425 | | | $ | 41,375 | | | $ | 47,887 | | | $ | 20,002 | | | $ | 56,065 | | | $ | 173,264 | | | $ | 620,106 | |
| | | | | | | | | | | | | | | | |
| Commercial Real Estate: | | | | | | | | | | | | | | | | |
| Risk Rating | | | | | | | | | | | | | | | | |
| Pass | | $ | 398,631 | | | $ | 490,747 | | | $ | 261,462 | | | $ | 162,701 | | | $ | 129,151 | | | $ | 427,433 | | | $ | 35,163 | | | $ | 1,905,288 | |
| Special Mention | | 3,982 | | | 1,568 | | | 4,612 | | | 135 | | | 13,689 | | | 25,371 | | | — | | | 49,357 | |
| Substandard | | — | | | 4,628 | | | 489 | | | 1,415 | | | 979 | | | 4,728 | | | — | | | 12,239 | |
| Doubtful | | — | | | — | | | — | | | — | | | — | | | — | | | — | | | — | |
| Total Commercial Real Estate Loans | | $ | 402,613 | | | $ | 496,943 | | | $ | 266,563 | | | $ | 164,251 | | | $ | 143,819 | | | $ | 457,532 | | | $ | 35,163 | | | $ | 1,966,884 | |
| | | | | | | | | | | | | | | | |
| Agricultural: | | | | | | | | | | | | | | | | |
| Risk Rating | | | | | | | | | | | | | | | | |
| Pass | | $ | 62,673 | | | $ | 47,682 | | | $ | 47,355 | | | $ | 25,431 | | | $ | 21,728 | | | $ | 92,344 | | | $ | 83,862 | | | $ | 381,075 | |
| Special Mention | | 634 | | | 842 | | | 6,066 | | | 4,149 | | | 2,355 | | | 11,440 | | | 4,310 | | | 29,796 | |
| Substandard | | — | | | 210 | | | 628 | | | 429 | | | 85 | | | 5,190 | | | — | | | 6,542 | |
| Doubtful | | — | | | — | | | — | | | — | | | — | | | — | | | — | | | — | |
| Total Agricultural Loans | | $ | 63,307 | | | $ | 48,734 | | | $ | 54,049 | | | $ | 30,009 | | | $ | 24,168 | | | $ | 108,974 | | | $ | 88,172 | | | $ | 417,413 | |
| | | | | | | | | | | | | | | | |
| Leases: | | | | | | | | | | | | | | | | |
| Risk Rating | | | | | | | | | | | | | | | | |
| Pass | | $ | 20,057 | | | $ | 14,461 | | | $ | 9,648 | | | $ | 8,901 | | | $ | 1,851 | | | $ | 1,478 | | | $ | — | | | $ | 56,396 | |
| Special Mention | | — | | | — | | | — | | | — | | | — | | | — | | | — | | | — | |
| Substandard | | — | | | — | | | — | | | — | | | — | | | — | | | — | | | — | |
| Doubtful | | — | | | — | | | — | | | — | | | — | | | — | | | — | | | — | |
| Total Leases | | $ | 20,057 | | | $ | 14,461 | | | $ | 9,648 | | | $ | 8,901 | | | $ | 1,851 | | | $ | 1,478 | | | $ | — | | | $ | 56,396 | |
| | |
Notes to the Consolidated Financial Statements |
Dollars in thousands, except per share data |
NOTE 4 – Loans (continued)
Based on the most recent analysis performed, the risk category of loans by class of loans is as follows:
| | | | | | | | | | | | | | | | | | | | | | | | | | | | | | | | | | | | | | | | | | | | | | | | | | |
| | Term Loans Amortized Cost Basis by Origination Year | | | | |
| As of December 31, 2021 | | 2021 | | 2020 | | 2019 | | 2018 | | 2017 | | Prior | | Revolving Loans Amortized Cost Basis | | Total |
| Commercial and Industrial: | | | | | | | | | | | | | | | | |
| Risk Rating | | | | | | | | | | | | | | | | |
| Pass | | $ | 141,133 | | | $ | 57,477 | | | $ | 60,883 | | | $ | 29,005 | | | $ | 15,936 | | | $ | 48,559 | | | $ | 122,377 | | | $ | 475,370 | |
| Special Mention | | 115 | | | 128 | | | 227 | | | 649 | | | 7 | | | 918 | | | 1,510 | | | 3,554 | |
| Substandard | | 100 | | | 1,221 | | | — | | | 1,062 | | | 1,378 | | | 2,457 | | | 7,863 | | | 14,081 | |
| Doubtful | | — | | | — | | | — | | | — | | | — | | | — | | | — | | | — | |
| Total Commercial and Industrial Loans | | $ | 141,348 | | | $ | 58,826 | | | $ | 61,110 | | | $ | 30,716 | | | $ | 17,321 | | | $ | 51,934 | | | $ | 131,750 | | | $ | 493,005 | |
| | | | | | | | | | | | | | | | |
| Commercial Real Estate: | | | | | | | | | | | | | | | | |
| Risk Rating | | | | | | | | | | | | | | | | |
| Pass | | $ | 404,175 | | | $ | 264,011 | | | $ | 164,204 | | | $ | 131,746 | | | $ | 139,788 | | | $ | 336,066 | | | $ | 26,697 | | | $ | 1,466,687 | |
| Special Mention | | 2,279 | | | — | | | 710 | | | 14,426 | | | 17,356 | | | 13,916 | | | — | | | 48,687 | |
| Substandard | | 74 | | | — | | | 7,687 | | | 1,528 | | | — | | | 6,014 | | | — | | | 15,303 | |
| Doubtful | | — | | | — | | | — | | | — | | | — | | | — | | | — | | | — | |
| Total Commercial Real Estate Loans | | $ | 406,528 | | | $ | 264,011 | | | $ | 172,601 | | | $ | 147,700 | | | $ | 157,144 | | | $ | 355,996 | | | $ | 26,697 | | | $ | 1,530,677 | |
| | | | | | | | | | | | | | | | |
| Agricultural: | | | | | | | | | | | | | | | | |
| Risk Rating | | | | | | | | | | | | | | | | |
| Pass | | $ | 44,510 | | | $ | 45,101 | | | $ | 22,482 | | | $ | 24,187 | | | $ | 24,325 | | | $ | 71,268 | | | $ | 81,011 | | | $ | 312,884 | |
| Special Mention | | 1,714 | | | 5,346 | | | 5,503 | | | 3,025 | | | 6,438 | | | 6,624 | | | 8,271 | | | 36,921 | |
| Substandard | | — | | | — | | | 63 | | | 385 | | | 1,048 | | | 6,849 | | | — | | | 8,345 | |
| Doubtful | | — | | | — | | | — | | | — | | | — | | | — | | | — | | | — | |
| Total Agricultural Loans | | $ | 46,224 | | | $ | 50,447 | | | $ | 28,048 | | | $ | 27,597 | | | $ | 31,811 | | | $ | 84,741 | | | $ | 89,282 | | | $ | 358,150 | |
| | | | | | | | | | | | | | | | |
| Leases: | | | | | | | | | | | | | | | | |
| Risk Rating | | | | | | | | | | | | | | | | |
| Pass | | $ | 19,689 | | | $ | 12,706 | | | $ | 12,990 | | | $ | 5,599 | | | $ | 2,473 | | | $ | 1,888 | | | $ | — | | | $ | 55,345 | |
| Special Mention | | — | | | — | | | — | | | — | | | — | | | — | | | — | | | — | |
| Substandard | | — | | | — | | | — | | | — | | | — | | | — | | | — | | | — | |
| Doubtful | | — | | | — | | | — | | | — | | | — | | | — | | | — | | | — | |
| Total Leases | | $ | 19,689 | | | $ | 12,706 | | | $ | 12,990 | | | $ | 5,599 | | | $ | 2,473 | | | $ | 1,888 | | | $ | — | | | $ | 55,345 | |
| | |
Notes to the Consolidated Financial Statements |
Dollars in thousands, except per share data |
NOTE 4 – Loans (continued)
| | | | | | | | | | | | | | | | | | | | | | | | | | | | | | | | | | | | | | | | | | | | | | | | | | |
| | Term Loans Amortized Cost Basis by Origination Year | | | | |
| As of December 31, 2020 | | 2020 | | 2019 | | 2018 | | 2017 | | 2016 | | Prior | | Revolving Loans Amortized Cost Basis | | Total |
| Commercial and Industrial: | | | | | | | | | | | | | | | | |
| Risk Rating | | | | | | | | | | | | | | | | |
| Pass | | $ | 260,027 | | | $ | 88,273 | | | $ | 46,681 | | | $ | 31,612 | | | $ | 21,025 | | | $ | 48,508 | | | $ | 109,228 | | | $ | 605,354 | |
| Special Mention | | 618 | | | 1,102 | | | 2,756 | | | 1,739 | | | 206 | | | 1,972 | | | 9,948 | | | 18,341 | |
| Substandard | | 143 | | | 164 | | | 1,283 | | | 1,530 | | | 607 | | | 5,416 | | | 5,935 | | | 15,078 | |
| Doubtful | | — | | | — | | | — | | | — | | | — | | | — | | | — | | | — | |
| Total Commercial and Industrial Loans | | $ | 260,788 | | | $ | 89,539 | | | $ | 50,720 | | | $ | 34,881 | | | $ | 21,838 | | | $ | 55,896 | | | $ | 125,111 | | | $ | 638,773 | |
| | | | | | | | | | | | | | | | |
| Commercial Real Estate: | | | | | | | | | | | | | | | | |
| Risk Rating | | | | | | | | | | | | | | | | |
| Pass | | $ | 296,265 | | | $ | 215,226 | | | $ | 179,129 | | | $ | 183,703 | | | $ | 171,016 | | | $ | 295,641 | | | $ | 29,634 | | | $ | 1,370,614 | |
| Special Mention | | 883 | | | 9,361 | | | 15,232 | | | 23,489 | | | 7,578 | | | 20,294 | | | 147 | | | 76,984 | |
| Substandard | | — | | | 1,131 | | | 1,735 | | | 1,692 | | | 4,292 | | | 10,849 | | | 100 | | | 19,799 | |
| Doubtful | | — | | | — | | | — | | | — | | | — | | | — | | | — | | | — | |
| Total Commercial Real Estate Loans | | $ | 297,148 | | | $ | 225,718 | | | $ | 196,096 | | | $ | 208,884 | | | $ | 182,886 | | | $ | 326,784 | | | $ | 29,881 | | | $ | 1,467,397 | |
| | | | | | | | | | | | | | | | |
| Agricultural: | | | | | | | | | | | | | | | | |
| Risk Rating | | | | | | | | | | | | | | | | |
| Pass | | $ | 49,242 | | | $ | 25,449 | | | $ | 31,285 | | | $ | 32,368 | | | $ | 22,702 | | | $ | 64,890 | | | $ | 75,871 | | | $ | 301,807 | |
| Special Mention | | 11,503 | | | 9,911 | | | 3,111 | | | 8,767 | | | 2,707 | | | 10,125 | | | 16,318 | | | 62,442 | |
| Substandard | | 578 | | | 73 | | | 394 | | | 1,228 | | | 4,466 | | | 5,198 | | | — | | | 11,937 | |
| Doubtful | | — | | | — | | | — | | | — | | | — | | | — | | | — | | | — | |
| Total Agricultural Loans | | $ | 61,323 | | | $ | 35,433 | | | $ | 34,790 | | | $ | 42,363 | | | $ | 29,875 | | | $ | 80,213 | | | $ | 92,189 | | | $ | 376,186 | |
| | | | | | | | | | | | | | | | |
| Leases: | | | | | | | | | | | | | | | | |
| Risk Rating | | | | | | | | | | | | | | | | |
| Pass | | $ | 18,258 | | | $ | 17,517 | | | $ | 9,176 | | | $ | 5,415 | | | $ | 1,605 | | | $ | 3,693 | | | $ | — | | | $ | 55,664 | |
| Special Mention | | — | | | — | | | — | | | — | | | — | | | — | | | — | | | — | |
| Substandard | | — | | | — | | | — | | | — | | | — | | | — | | | — | | | — | |
| Doubtful | | — | | | — | | | — | | | — | | | — | | | — | | | — | | | — | |
| Total Leases | | $ | 18,258 | | | $ | 17,517 | | | $ | 9,176 | | | $ | 5,415 | | | $ | 1,605 | | | $ | 3,693 | | | $ | — | | | $ | 55,664 | |
| | |
| Notes to the Consolidated Financial Statements |
| Dollars in thousands, except per share data |
NOTE 4 – Loans (continued)
The Company considers the performance of the loan portfolio and its impact on the allowance for credit losses. For residential, home equity and consumer loan classes, the Company also evaluates credit quality based on the aging status of the loan, which was previously presented, and by payment activity. The following tables presenttable presents the amortized cost in residential, home equity and consumer loans based on payment activity.activity as well as the current period gross charge-offs for the period ended December 31, 2023.
| | | | | | | | | | | | | | | | | | | | | | | | | | | | | | | | | | | | | | | | | | | | | | | | | | |
| | Term Loans Amortized Cost Basis by Origination Year | | | | |
| As of December 31, 2023 | | 2023 | | 2022 | | 2021 | | 2020 | | 2019 | | Prior | | Revolving Loans Amortized Cost Basis | | Total |
| Consumer: | | | | | | | | | | | | | | | | |
| Payment performance | | | | | | | | | | | | | | | | |
| Performing | | $ | 49,208 | | | $ | 21,459 | | | $ | 9,708 | | | $ | 2,756 | | | $ | 917 | | | $ | 1,911 | | | $ | 1,783 | | | $ | 87,742 | |
| Nonperforming | | 74 | | | 21 | | | 12 | | | — | | | — | | | 1 | | | 3 | | | 111 | |
| Total Consumer Loans | | $ | 49,282 | | | $ | 21,480 | | | $ | 9,720 | | | $ | 2,756 | | | $ | 917 | | | $ | 1,912 | | | $ | 1,786 | | | $ | 87,853 | |
| | | | | | | | | | | | | | | | |
| Current Period Gross Charge-Offs | | $ | 1,162 | | | $ | 42 | | | $ | 23 | | | $ | 71 | | | $ | 3 | | | $ | 1 | | | $ | 7 | | | $ | 1,309 | |
| | | | | | | | | | | | | | | | |
| Home Equity: | | | | | | | | | | | | | | | | |
| Payment performance | | | | | | | | | | | | | | | | |
| Performing | | $ | — | | | $ | 170 | | | $ | 236 | | | $ | 90 | | | $ | 165 | | | $ | 1,207 | | | $ | 296,784 | | | $ | 298,652 | |
| Nonperforming | | — | | | 247 | | | 252 | | | 60 | | | — | | | 102 | | | 372 | | | 1,033 | |
| Total Home Equity Loans | | $ | — | | | $ | 417 | | | $ | 488 | | | $ | 150 | | | $ | 165 | | | $ | 1,309 | | | $ | 297,156 | | | $ | 299,685 | |
| | | | | | | | | | | | | | | | |
| Current Period Gross Charge-Offs | | $ | — | | | $ | — | | | $ | — | | | $ | 55 | | | $ | — | | | $ | 24 | | | $ | 15 | | | $ | 94 | |
| | | | | | | | | | | | | | | | |
| Residential Mortgage: | | | | | | | | | | | | | | | | |
| Payment performance | | | | | | | | | | | | | | | | |
| Performing | | $ | 56,306 | | | $ | 65,301 | | | $ | 85,753 | | | $ | 41,352 | | | $ | 17,831 | | | $ | 94,926 | | | $ | — | | | $ | 361,469 | |
| Nonperforming | | 11 | | | 60 | | | 417 | | | 287 | | | 109 | | | 491 | | | — | | | 1,375 | |
| Total Residential Mortgage Loans | | $ | 56,317 | | | $ | 65,361 | | | $ | 86,170 | | | $ | 41,639 | | | $ | 17,940 | | | $ | 95,417 | | | $ | — | | | $ | 362,844 | |
| | | | | | | | | | | | | | | | |
| Current Period Gross Charge-Offs | | $ | — | | | $ | — | | | $ | 22 | | | $ | 36 | | | $ | — | | | $ | — | | | $ | — | | | $ | 58 | |
| | | | | | | | | | | | | | | | | | | | | | | | | | | | | | | | | | | | | | | | | | | | | | | | | | |
| | Term Loans Amortized Cost Basis by Origination Year | | | | |
| As of December 31, 2021 | | 2021 | | 2020 | | 2019 | | 2018 | | 2017 | | Prior | | Revolving Loans Amortized Cost Basis | | Total |
| Consumer: | | | | | | | | | | | | | | | | |
| Payment performance | | | | | | | | | | | | | | | | |
| Performing | | $ | 39,923 | | | $ | 15,900 | | | $ | 4,325 | | | $ | 4,531 | | | $ | 600 | | | $ | 1,655 | | | $ | 3,350 | | | $ | 70,284 | |
| Nonperforming | | 3 | | | — | | | — | | | — | | | — | | | 15 | | | — | | | 18 | |
| Total Consumer Loans | | $ | 39,926 | | | $ | 15,900 | | | $ | 4,325 | | | $ | 4,531 | | | $ | 600 | | | $ | 1,670 | | | $ | 3,350 | | | $ | 70,302 | |
| | | | | | | | | | | | | | | | |
| Home Equity: | | | | | | | | | | | | | | | | |
| Payment performance | | | | | | | | | | | | | | | | |
| Performing | | $ | — | | | $ | — | | | $ | — | | | $ | 21 | | | $ | — | | | $ | 835 | | | $ | 221,644 | | | $ | 222,500 | |
| Nonperforming | | — | | | — | | | — | | | — | | | — | | | 1 | | | 24 | | | 25 | |
| Total Home Equity Loans | | $ | — | | | $ | — | | | $ | — | | | $ | 21 | | | $ | — | | | $ | 836 | | | $ | 221,668 | | | $ | 222,525 | |
| | | | | | | | | | | | | | | | |
| Residential Mortgage: | | | | | | | | | | | | | | | | |
| Payment performance | | | | | | | | | | | | | | | | |
| Performing | | $ | 84,809 | | | $ | 38,717 | | | $ | 15,244 | | | $ | 17,369 | | | $ | 19,688 | | | $ | 87,164 | | | $ | — | | | $ | 262,991 | |
| Nonperforming | | — | | | — | | | — | | | — | | | — | | | 574 | | | — | | | 574 | |
| Total Residential Mortgage Loans | | $ | 84,809 | | | $ | 38,717 | | | $ | 15,244 | | | $ | 17,369 | | | $ | 19,688 | | | $ | 87,738 | | | $ | — | | | $ | 263,565 | |
| | | | | | | | | | | | | | | | | | | | | | | | | | | | | | | | | | | | | | | | | | | | | | | | | | |
| | Term Loans Amortized Cost Basis by Origination Year | | | | |
| As of December 31, 2020 | | 2020 | | 2019 | | 2018 | | 2017 | | 2016 | | Prior | | Revolving Loans Amortized Cost Basis | | Total |
| Consumer: | | | | | | | | | | | | | | | | |
| Payment performance | | | | | | | | | | | | | | | | |
| Performing | | $ | 33,857 | | | $ | 16,486 | | | $ | 8,456 | | | $ | 2,115 | | | $ | 910 | | | $ | 2,245 | | | $ | 2,563 | | | $ | 66,632 | |
| Nonperforming | | — | | | — | | | 11 | | | 2 | | | 14 | | | 23 | | | 35 | | | 85 | |
| Total Consumer Loans | | $ | 33,857 | | | $ | 16,486 | | | $ | 8,467 | | | $ | 2,117 | | | $ | 924 | | | $ | 2,268 | | | $ | 2,598 | | | $ | 66,717 | |
| | | | | | | | | | | | | | | | |
| Home Equity: | | | | | | | | | | | | | | | | |
| Payment performance | | | | | | | | | | | | | | | | |
| Performing | | $ | — | | | $ | — | | | $ | 34 | | | $ | 46 | | | $ | 67 | | | $ | 490 | | | $ | 218,440 | | | $ | 219,077 | |
| Nonperforming | | — | | | — | | | — | | | — | | | — | | | — | | | 271 | | | 271 | |
| Total Home Equity Loans | | $ | — | | | $ | — | | | $ | 34 | | | $ | 46 | | | $ | 67 | | | $ | 490 | | | $ | 218,711 | | | $ | 219,348 | |
| | | | | | | | | | | | | | | | |
| Residential Mortgage: | | | | | | | | | | | | | | | | |
| Payment performance | | | | | | | | | | | | | | | | |
| Performing | | $ | 45,945 | | | $ | 26,536 | | | $ | 28,050 | | | $ | 28,764 | | | $ | 25,155 | | | $ | 100,998 | | | $ | — | | | $ | 255,448 | |
| Nonperforming | | — | | | — | | | — | | | — | | | — | | | 828 | | | — | | | 828 | |
| Total Residential Mortgage Loans | | $ | 45,945 | | | $ | 26,536 | | | $ | 28,050 | | | $ | 28,764 | | | $ | 25,155 | | | $ | 101,826 | | | $ | — | | | $ | 256,276 | |
| | |
| Notes to the Consolidated Financial Statements |
| Dollars in thousands, except per share data |
NOTE 4 – Loans (continued)
The following table presents the amortized cost in residential, home equity and consumer loans based on payment activity for the period ended December 31, 2022.
| | | | | | | | | | | | | | | | | | | | | | | | | | | | | | | | | | | | | | | | | | | | | | | | | | |
| | Term Loans Amortized Cost Basis by Origination Year | | | | |
| As of December 31, 2022 | | 2022 | | 2021 | | 2020 | | 2019 | | 2018 | | Prior | | Revolving Loans Amortized Cost Basis | | Total |
| Consumer: | | | | | | | | | | | | | | | | |
| Payment performance | | | | | | | | | | | | | | | | |
| Performing | | $ | 42,685 | | | $ | 22,708 | | | $ | 5,610 | | | $ | 2,394 | | | $ | 1,543 | | | $ | 1,553 | | | $ | 3,157 | | | $ | 79,650 | |
| Nonperforming | | 3 | | | 19 | | | 212 | | | 8 | | | 2 | | | 10 | | | — | | | 254 | |
| Total Consumer Loans | | $ | 42,688 | | | $ | 22,727 | | | $ | 5,822 | | | $ | 2,402 | | | $ | 1,545 | | | $ | 1,563 | | | $ | 3,157 | | | $ | 79,904 | |
| | | | | | | | | | | | | | | | |
| Home Equity: | | | | | | | | | | | | | | | | |
| Payment performance | | | | | | | | | | | | | | | | |
| Performing | | $ | 63 | | | $ | — | | | $ | — | | | $ | — | | | $ | — | | | $ | 591 | | | $ | 278,784 | | | $ | 279,438 | |
| Nonperforming | | — | | | 20 | | | — | | | — | | | 19 | | | 1 | | | 270 | | | 310 | |
| Total Home Equity Loans | | $ | 63 | | | $ | 20 | | | $ | — | | | $ | — | | | $ | 19 | | | $ | 592 | | | $ | 279,054 | | | $ | 279,748 | |
| | | | | | | | | | | | | | | | |
| Residential Mortgage: | | | | | | | | | | | | | | | | |
| Payment performance | | | | | | | | | | | | | | | | |
| Performing | | $ | 69,982 | | | $ | 97,176 | | | $ | 46,851 | | | $ | 20,080 | | | $ | 16,664 | | | $ | 98,699 | | | $ | — | | | $ | 349,452 | |
| Nonperforming | | — | | | 161 | | | 253 | | | — | | | 78 | | | 738 | | | — | | | 1,230 | |
| Total Residential Mortgage Loans | | $ | 69,982 | | | $ | 97,337 | | | $ | 47,104 | | | $ | 20,080 | | | $ | 16,742 | | | $ | 99,437 | | | $ | — | | | $ | 350,682 | |
The Company considers the performance of the loan portfolio and its impact on the allowance for credit losses. For certain retail loan classes, the Company also evaluates credit quality based on the aging status of the loan, which was previously presented, and by payment activity. The following tables presenttable presents the recorded investment in credit cardsretail loans based on payment activity:
| | Credit Cards | Credit Cards | | December 31, 2021 | | December 31, 2020 | Credit Cards | | December 31, 2023 | | December 31, 2022 |
| | Performing | Performing | | $ | 14,293 | | | $ | 11,551 | |
| Performing | |
| Performing | |
| Nonperforming | Nonperforming | | 64 | | | 86 | |
| Total | Total | | $ | 14,357 | | | $ | 11,637 | |
The following table presents loans purchased and/or sold during the year by portfolio segment:
| | Commercial and Industrial Loans | | Commercial Real Estate Loans | | Agricultural Loans | | Leases | | Consumer Loans | | Home Equity Loans | | Credit Cards | | Residential Mortgage Loans | | Total |
| December 31, 2021 | | | | | | | | | | | | | | | | | | |
| | Commercial and Industrial Loans | | | | Commercial and Industrial Loans | | Commercial Real Estate Loans | | Agricultural Loans | | Leases | | Consumer Loans | | Home Equity Loans | | Credit Cards | | Residential Mortgage Loans | | Total |
| December 31, 2023 | |
| Purchases | |
| Purchases | |
| Purchases | Purchases | | $ | — | | | $ | 2,271 | | | $ | — | | | $ | — | | | $ | — | | | $ | — | | | $ | — | | | $ | — | | | $ | 2,271 | |
| Sales | Sales | | 2,273 | | | 15,415 | | | 111 | | | — | | | — | | | — | | | — | | | — | | | 17,799 | |
| | December 31, 2020 | |
| December 31, 2022 | |
| December 31, 2022 | |
| December 31, 2022 | |
| Purchases | |
| Purchases | |
| Purchases | Purchases | | $ | — | | | $ | — | | | $ | — | | | $ | — | | | $ | — | | | $ | — | | | $ | — | | | $ | — | | | $ | — | |
| Sales | Sales | | — | | | 3,128 | | | — | | | — | | | — | | | — | | | — | | | — | | | 3,128 | |
| | |
| Notes to the Consolidated Financial Statements |
| Dollars in thousands, except per share data |
NOTE 4 – Loans (continued)
Certain directors, executive officers, and principal shareholders of the Company, including their immediate families and companies in which they are principal owners, were loan customers of the Company during 2021.2023. A summary of the activity of these loans follows:
| | | | | | | | | | | | | | | | | | | | | | | | | | | | | | | | |
Balance
January 1,
2021 | | Additions | | Changes in Persons or Interests Included | | Deductions | | Balance
December 31,
2021 |
| | | Collected | | Charged-off | |
| | | | | | | | | | |
| $ | 41,022 | | | $ | 27,222 | | | $ | (2,848) | | | $ | (18,659) | | | $ | — | | | $ | 46,737 | |
Allowance for Loan Losses (Prior to January 1, 2020)
Prior to the adoption of ASC 326 on January 1, 2020, the Company calculated the allowance for loan losses using the incurred loss methodology. The following tables are disclosures related to the allowance for loan losses in prior periods.
The following tables present the activity in the allowance for loan losses by portfolio class for the year ended December 31, 2019:
| | | | | | | | | | | | | | | | | | | | | | | | | | | | | | | | | | | | | | | | | | | | | | | | | | |
| | Commercial
and
Industrial
Loans and
Leases | | Commercial
Real Estate
Loans | | Agricultural
Loans | | Home
Equity
Loans | | Consumer
Loans | | Residential
Mortgage
Loans | | Unallocated | | Total |
| December 31, 2019 | | | | | | | | | | | | | | | | |
| Beginning Balance | | $ | 2,953 | | | $ | 5,291 | | | $ | 5,776 | | | $ | 229 | | | $ | 420 | | | $ | 472 | | | $ | 682 | | | $ | 15,823 | |
| Provision for Loan Losses | | 5,600 | | | (308) | | | (461) | | | (27) | | | 727 | | | (29) | | | (177) | | | 5,325 | |
| Recoveries | | 56 | | | 29 | | | — | | | 8 | | | 432 | | | 7 | | | — | | | 532 | |
| Loans Charged-off | | (3,810) | | | (320) | | | — | | | (10) | | | (1,145) | | | (117) | | | — | | | (5,402) | |
| Ending Balance | | $ | 4,799 | | | $ | 4,692 | | | $ | 5,315 | | | $ | 200 | | | $ | 434 | | | $ | 333 | | | $ | 505 | | | $ | 16,278 | |
| | |
Notes to the Consolidated Financial Statements |
Dollars in thousands, except per share data |
NOTE 4 – Loans (continued)
The following tables present the average balance and related interest income of loans individually evaluated for impairment by class of loans for the year ended December 31, 2019:
| | | | | | | | | | | | | | | | | | | | |
| | Average
Recorded
Investment | | Interest
Income
Recognized | | Cash
Basis
Recognized |
| December 31, 2019 | | | | | | |
| With No Related Allowance Recorded: | | | | | | |
| Commercial and Industrial Loans and Leases | | $ | 1,175 | | | $ | 19 | | | $ | 1 | |
| Commercial Real Estate Loans | | 2,947 | | | 81 | | | 1 | |
| Agricultural Loans | | 1,790 | | | 1 | | | — | |
| Subtotal | | 5,912 | | | 101 | | | 2 | |
| With An Allowance Recorded: | | | | | | |
| Commercial and Industrial Loans and Leases | | 3,753 | | | — | | | 1 | |
| Commercial Real Estate Loans | | 3,141 | | | — | | | 1 | |
| Agricultural Loans | | — | | | — | | | — | |
| Subtotal | | 6,894 | | | — | | | 2 | |
| Total | | $ | 12,806 | | | $ | 101 | | | $ | 4 | |
| | | | | | |
| Loans Acquired With Deteriorated Credit Quality With No Related Allowance Recorded (Included in the Total Above) | | $ | 4,321 | | | $ | 61 | | | $ | 3 | |
| Loans Acquired With Deteriorated Credit Quality With An Additional Allowance Recorded (Included in the Total Above) | | $ | 1,766 | | | $ | — | | | $ | — | |
| | | | | | | | | | | | | | | | | | | | | | | | | | | | | | | | |
Balance
January 1,
2023 | | Additions | | Changes in Persons or Interests Included | | Deductions | | Balance
December 31,
2023 |
| | | Collected | | Charged-off | |
| | | | | | | | | | |
| $ | 51,086 | | | $ | 13,854 | | | $ | (7,087) | | | $ | (18,031) | | | $ | — | | | $ | 39,822 | |
NOTE 5 – Premises, Furniture, and Equipment
Premises, furniture, and equipment was comprised of the following classifications at December 31:
| | | | | 2021 | | 2020 | | | 2023 | | 2022 |
| | Land | |
| Land | |
| Land | Land | | $ | 20,776 | | | $ | 21,200 | |
| Buildings and Improvements | Buildings and Improvements | | 91,512 | | | 98,364 | |
| Furniture and Equipment | Furniture and Equipment | | 41,424 | | | 41,504 | |
| Total Premises, Furniture and Equipment | Total Premises, Furniture and Equipment | | 153,712 | | | 161,068 | |
| Less: Accumulated Depreciation | Less: Accumulated Depreciation | | (64,849) | | | (64,475) | |
| Total | Total | | $ | 88,863 | | | $ | 96,593 | |
Depreciation expense was $6,570, $6,648 and $5,802 $5,988for 2023, 2022 and $5,773 for 2021, 2020 and 2019, respectively.
NOTE 6 –- Deposits
At year end 2021,2023, stated maturities of time deposits were as follows:
| | 2022 | | $ | 268,452 | |
| 2023 | | 36,280 | |
| 2024 | 2024 | | 19,530 | |
| 2025 | 2025 | | 7,116 | |
| 2026 | 2026 | | 15,705 | |
| 2027 | |
| 2028 | |
| Thereafter | Thereafter | | 16 | |
| Total | Total | | $ | 347,099 | |
Time deposits and brokered certificates of deposit exceeding the FDIC insurance limit of $250 or more at December 31, 20212023 and 20202022 were $56,195$277,568 and $104,518,$71,081, respectively.
Time deposits originated from outside the geographic area, generally through brokers, totaled $3,801 and $3,277 at December 31, 2023 and 2022, respectively.
Deposits from principal officers, directors, and their affiliates at year-end 2023 and 2022 were $67,637 and $62,435, respectively.
| | |
| Notes to the Consolidated Financial Statements |
| Dollars in thousands, except per share data |
NOTE 6 – Deposits (continued)
Time deposits originated from outside the geographic area, generally through brokers, totaled $4,001 and $5,510 at December 31, 2021 and 2020, respectively.
Deposits from principal officers, directors, and their affiliates at year-end 2021 and 2020 were $72.0 million and $79.9 million, respectively.
NOTE 7 – FHLB Advances and Other Borrowings
The Company’s funding sources include Federal Home Loan Bank advances, borrowings from other third party correspondent financial institutions, issuance and sale of subordinated debt and other capital securities, and repurchase agreements. Information regarding each of these types of borrowings or other indebtedness is as follows:
| | | | | | | | | | | | | | |
| | | December 31, |
| | | 2021 | | 2020 |
| Long-term Advances from Federal Home Loan Bank collateralized by qualifying mortgages, investment securities, and mortgage-backed securities | | $ | 25,000 | | | $ | 83,000 | |
| Junior Subordinated Debentures assumed from American Community Bancorp, Inc. | | 6,225 | | | 6,075 | |
| Junior Subordinated Debentures assumed from River Valley Bancorp, Inc. | | 6,029 | | | 5,923 | |
| Junior Subordinated Debentures assumed from Citizens First Corporation | | 4,171 | | | 4,105 | |
| Subordinated Debentures | | 39,379 | | | 39,297 | |
| Finance Lease Obligation | | 3,051 | | | 3,224 | |
| Long-term Borrowings | | 83,855 | | | 141,624 | |
| | | | |
| Overnight Variable Rate Advances from Federal Home Loan Bank collateralized by qualifying mortgages, investment securities, and mortgage-backed securities | | $ | — | | | $ | — | |
| Federal Funds Purchased | | — | | | — | |
| Repurchase Agreements | | 68,328 | | | 52,905 | |
| Short-term Borrowings | | 68,328 | | | 52,905 | |
| | | | |
| Total Borrowings | | $ | 152,183 | | | $ | 194,529 | |
| | | | | | | | | | | | | | | | | | | | | | | | | | |
| | | December 31, |
| | | 2023 | | 2022 |
| | Principal | | Unamortized Discount and Debt Issuance Costs | | Principal | | Unamortized Discount and Debt Issuance Costs |
| Long-term Advances from Federal Home Loan Bank collateralized by qualifying mortgages, investment securities, and mortgage-backed securities | | $ | 50,000 | | | $ | — | | | $ | 25,000 | | | $ | — | |
| Junior Subordinated Debentures assumed from American Community Bancorp, Inc. | | 8,248 | | | (1,723) | | | 8,248 | | | (1,873) | |
| Junior Subordinated Debentures assumed from River Valley Bancorp, Inc. | | 7,217 | | | (977) | | | 7,217 | | | (1,082) | |
| Junior Subordinated Debentures assumed from Citizens First Corporation | | 5,155 | | | (853) | | | 5,155 | | | (919) | |
| Junior Subordinated Debentures assumed from Citizens Union Bancorp of Shelbyville, Inc. | | 20,600 | | | (1,885) | | | 20,600 | | | (2,020) | |
| Subordinated Debentures | | 40,000 | | | (455) | | | 40,000 | | | (538) | |
| Finance Lease Obligation | | 2,642 | | | — | | | 2,857 | | | — | |
| Long-term Borrowings | | 133,862 | | | (5,893) | | | 109,077 | | | (6,432) | |
| | | | | | | | |
| Overnight Variable Rate Advances from Federal Home Loan Bank collateralized by qualifying mortgages, investment securities, and mortgage-backed securities | | — | | | — | | | 25,000 | | | — | |
| Federal Funds Purchased | | 25,000 | | | — | | | 11,200 | | | — | |
| Repurchase Agreements | | 40,968 | | | — | | | 64,961 | | | — | |
| Short-term Borrowings | | 65,968 | | | — | | | 101,161 | | | — | |
| | | | | | | | |
| Total Borrowings | | $ | 199,830 | | | $ | (5,893) | | | $ | 210,238 | | | $ | (6,432) | |
Repurchase agreements, which are classified as secured borrowings, generally mature within one day of the transaction date. Repurchase agreements are reflected at the amount of cash received in connection with the transaction. The Company may be required to provide additional collateral based on the value of the underlying securities.
| | | | | 2021 | | 2020 | | | 2023 | | 2022 |
| Average Daily Balance During the Year | Average Daily Balance During the Year | | $ | 52,824 | | | $ | 58,000 | |
| Average Interest Rate During the Year | Average Interest Rate During the Year | | 0.10 | % | | 0.30 | % | Average Interest Rate During the Year | | 1.16 | % | | 0.20 | % |
| Maximum Month-end Balance During the Year | Maximum Month-end Balance During the Year | | $ | 71,764 | | | $ | 73,580 | |
| Weighted Average Interest Rate at Year-end | Weighted Average Interest Rate at Year-end | | 0.10 | % | | 0.10 | % | Weighted Average Interest Rate at Year-end | | 1.44 | % | | 0.57 | % |
At December 31, 2021,2023, interest rates on long-term FHLB Advances ranged from 1.54% to 3.57% with a weighted average rate of 2.56%. At December 31, 2022 the Company held 1one long-term FHLB advance with an interest rate of 1.54%. At December 31, 2020 interest rates on the fixed rate long-term FHLB advances ranged from 1.54% to 2.23% with a weighted average rate of 1.87%. At December 31, 20212023 and 2020,2022, the Company had no advances containing options whereby the FHLB may convert a fixed rate advance to an adjustable rate advance.
On June 25, 2019,At December 31, 2023 and 2022, the Company soldhad outstanding $39,545 and issued $40.0 million$39,462, respectively, in aggregate principal amount, of its 4.50% Fixed-to-Floating Rate Subordinated Notes due 2029 (the “Notes”). The Company used the proceeds from the offering to pay $15.0 million of the approximately $15.5 million of cash consideration upon closing of the Citizens First Corporation merger and the remaining balance to repay the Company’s $25.0 million term loan from U.S. Bank National Association (“U.S. Bank”) dated October 11, 2018.
The Notes have a ten-year term, from and including the date of issuance to but excluding June 30, 2024, and will bear interest at a fixed annual rate of 4.50%, until but excluding June 30, 2024, payable semi-annually in arrears. FromThe indenture for the Notes contemplates that, from and including June 30, 2024 to but excluding the maturity date of June 30, 2029, or early redemption date, the interest rate shallwill reset quarterly to an interest rate per annum equal to the then-current three-three-month CME Term SOFR, plus the applicable spread adjustment of 0.26161% percent, plus 2.68% percent. The Secured Overnight Financing Rate, or SOFR, is the preferred alternate rate to LIBOR, as identified by the Alternative Reference Rates Committee, a U.S.-based group convened by the Federal Reserve Board and the Federal Reserve Bank of New York. The Federal Reserve subsequently
| | |
| Notes to the Consolidated Financial Statements |
| Dollars in thousands, except per share data |
NOTE 7 - FHLB Advances and Other Borrowings (continued)
monthadopted final regulations that, among other things, established LIBOR (provided, however, that in the event three-monthbenchmark replacements based on SOFR under certain circumstances. See Replacement of LIBOR is less than zero, three-month LIBOR shall be deemed to be zero) plus 268 basis points, payable quarterly in arrears. The Notes are redeemable, in whole or in part, on June 30, 2024, on any scheduled interest payment date thereafter and at any time upon the occurrence of certain events. The Purchase Agreement contains certain customary representations, warranties and covenants made by the Company, on the one hand, and the Purchasers, severally and not jointly, on the other hand.Benchmark below for additional information.
The Notes were issued under an Indenture, dated June 25, 2019, by and between the Company and U.S. Bank National Association, as trustee. The Notes are not subject to any sinking fund and are not convertible into or exchangeable for any other securities or assets of the Company or any of its subsidiaries. The Notes are not subject to redemption at the option of the holder. The Notes are unsecured, subordinated obligations of the Company only and are not obligations of, and are not guaranteed by, any subsidiary of the Company. The Notes rank junior in right to payment to the Company’s current and future senior indebtedness. The Notes are intended to qualify as Tier 2 capital for regulatory capital purposes for the Company.
At December 31, 2021,2023, the parent company had a $15 million line of credit with U.S. Bank National Association, which had no outstanding balance. The line of credit matures September 26, 2022.25, 2024. Interest on the line of credit is based upon one-month LIBORTerm SOFR plus 1.75% and includes an unused commitment fee of 0.30%2.10%.
At December 31, 2021,2023, scheduled principal payments on long-term borrowings, excluding the capitalized lease obligation and acquired subordinated debentures (which are discussed below) are as follows:
| | 2022 | | $ | — | |
| 2023 | | — | |
| 2024 | 2024 | | 24,834 | |
| 2025 | 2025 | | — | |
| 2026 | 2026 | | — | |
| 2027 | |
| 2028 | |
| Thereafter | Thereafter | | 39,545 | |
| Total | Total | | $ | 64,379 | |
The Company assumed the obligations of junior subordinated debentures through the acquisitions of American Community Bancorp, Inc., River Valley Bancorp, Citizens First Corporation and Citizens First Corporation.Union Bancorp of Shelbyville, Inc. The junior subordinated debentures were issued to ACB Capital Trust I, ACB Capital Trust II, RIVR Statutory Trust I, and Citizens First Statutory Trust I.I, CUB Capital Trust I and CUB Capital Trust II. The trusts are wholly owned by the Company. In accordance with accounting guidelines, the trusts are not consolidated with the Company'sCompany’s financials, but rather the subordinated debentures are shown as borrowings. The Company guarantees payment of distributions on the trust preferred securities issued by ACB Trust I, ACB Trust II, RIVR Statutory Trust I, and Citizens First Statutory Trust I.the various trusts. Interest is payable on a quarterly basis. These securities qualify as Tier 1 capital (with certain limitations) for regulatory purposes. $16,081$34,829 of the junior subordinated debentures were treated as Tier 1 capital for regulatory capital purposes as of December 31, 2021. $15,7642023. $34,378 of the junior subordinated debentures were treated as Tier 1 capital for regulatory capital purposes as of December 31, 2020.2022. As a result of the acquisitions, of American Community, River Valley, and Citizens First these liabilities were recorded at fair value at the acquisition date with the discount amortizing into interest expense over the life of the liability, ultimately accreting to the issuance amount disclosed below.
The following table summarizes the terms of each issuance:
| | Date of
Issuance | | Issuance
Amount | | Carrying
Amount at
December 31, 2021 | | Variable Rate | | Rate as of
December 31, 2021 | | Rate as of
December 31, 2020 | | Maturity
Date |
| | Date of
Issuance | | | | Date of
Issuance | | Issuance
Amount | | Carrying
Amount at
December 31, 2023 | | Variable Rate (1) | | Rate as of
December 31, 2023 | | Rate as of December 31, 2022 (2) | | Maturity
Date |
| ACB Trust I | ACB Trust I | | 5/6/2005 | | $ | 5,155 | | | $ | 3,921 | | | 90 day LIBOR + 2.15% | | 2.37 | % | | 2.40 | % | | May 2035 | ACB Trust I | | 5/6/2005 | | $ | 5,155 | | | $ | | $ | 4,105 | | | 3-Month SOFR + 2.15% | | 3-Month SOFR + 2.15% | | 7.81 | % | | 6.90 | % | | May 2035 |
| ACB Trust II | ACB Trust II | | 7/15/2005 | | 3,093 | | | 2,304 | | | 90 day LIBOR + 1.85% | | 2.01 | % | | 2.06 | % | | July 2035 | ACB Trust II | | 7/15/2005 | | 3,093 | | | 2,420 | | 2,420 | | | 3-Month SOFR + 1.85% | | 3-Month SOFR + 1.85% | | 7.49 | % | | 6.54 | % | | July 2035 |
| RIVR Statutory Trust I | RIVR Statutory Trust I | | 3/26/2003 | | 7,217 | | | 6,029 | | | 3-Month LIBOR + 3.15% | | 3.37 | % | | 3.40 | % | | March 2033 | RIVR Statutory Trust I | | 3/26/2003 | | 7,217 | | | 6,240 | | 6,240 | | | 3-Month SOFR + 3.15% | | 3-Month SOFR + 3.15% | | 8.77 | % | | 7.87 | % | | March 2033 |
| Citizens First Statutory Trust I | Citizens First Statutory Trust I | | 10/16/2006 | | 5,155 | | | 4,171 | | | 3-Month LIBOR +1.65% | | 1.78 | % | | 1.88 | % | | January 2037 | Citizens First Statutory Trust I | | 10/16/2006 | | 5,155 | | | 4,302 | | 4,302 | | | 3-Month SOFR +1.65% | | 3-Month SOFR +1.65% | | 7.31 | % | | 5.39 | % | | January 2037 |
| CUB Capital Trust I | | CUB Capital Trust I | | 10/21/2004 | | 10,310 | | | 9,642 | | | 3-Month SOFR +2.00% | | 7.64 | % | | 6.69 | % | | November 2034 |
| CUB Capital Trust II | | CUB Capital Trust II | | 8/17/2005 | | 10,310 | | | 9,073 | | | 3-Month SOFR +1.50% | | 7.16 | % | | 5.58 | % | | October 2035 |
(1) “3-Month SOFR” refers to the three-month CME Term SOFR, which became effective following the first London banking day after June 30, 2023, plus the applicable spread adjustment of 0.26161% percent.
(2) Prior to CME Term SOFR becoming effective, the variable rate was based upon LIBOR rates and tenors. See Replacement of LIBOR Benchmark below for additional information.
| | |
| Notes to the Consolidated Financial Statements |
| Dollars in thousands, except per share data |
NOTE 7 - FHLB Advances and Other Borrowings (continued)
Replacement of LIBOR Benchmark:
On March 15, 2022, the Adjustable Interest Rate (LIBOR) Act (the “LIBOR Act”) was signed into law in response to the U.K. Financial Conduct Authority, the authority regulating LIBOR, announcing that, among other things, the 1-month, 3-month, 6-month and 12-month U.S. dollar LIBOR settings would cease to exist after June 30, 2023. The LIBOR Act establishes a uniform national approach for replacing LIBOR in legacy contracts that do not provide for the use of a clearly defined replacement benchmark rate. As directed by the LIBOR Act, on December 16, 2022, the Federal Reserve issued a final rule setting forth regulations to implement the LIBOR Act, including establishing benchmark replacements based on SOFR for contracts governed by U.S. law that reference certain tenors of U.S. dollar LIBOR (the overnight and one-, three-, six-, and 12-month tenors) and that do not have terms that provide for the use of a clearly defined and practicable replacement benchmark rate (“fallback provisions”) following the first London banking day after June 30, 2023.
As the junior subordinated debentures discussed above do not have LIBOR fallback provisions, after June 30, 2023, the interest paid on those debentures has been and will be based upon the CME Term SOFR, as the replacement benchmark, including a static spread adjustment for the appropriate tenor, as provided by the LIBOR Act and related Federal Reserve regulations. The relevant spread adjustment for a three-month tenor is 0.26161%.
NOTE 8 - Shareholders' Shareholders’ Equity
Banks and bank holding companies are subject to regulatory capital requirements administered by federal banking agencies. Capital adequacy guidelines and, additionally for banks, prompt corrective action regulations, involve quantitative measures of assets, liabilities, and certain off balance sheet items calculated under regulatory accounting practices. Capital amounts and classifications are also subject to qualitative judgments by regulators. Failure to meet capital requirements can initiate
| | |
Notes to the Consolidated Financial Statements |
Dollars in thousands, except per share data |
NOTE 8 – Shareholders' Equity (continued)
regulatory action. The current risk-based capital rules, as adopted by federal banking regulators, are based upon guidelines developed by the Basel Committee on Banking Supervision and reflect various requirements of the Dodd-Frank Act (the “Basel III Rules”). The Basel III Rules require banking organizations to, among other things, maintain a minimum ratio of Total Capital to risk-weighted assets, a minimum ratio of Tier 1 Capital to risk-weighted assets, a minimum ratio of “Common Equity
Tier 1 Capital” to risk-weighted assets, and a minimum leverage ratio (calculated as the ratio of Tier 1 Capital to adjusted average consolidated assets). In addition, under the Basel III Rules, in order to avoid limitations on capital distributions, including dividend payments, the Company is required to maintain a 2.5% capital conservation buffer above the adequately capitalized regulatory capital ratios. The net unrealized gain or loss on available for sale securities is not included in computing regulatory capital. At December 31, 2021,2023, the Company and Bank meet all capital adequacy requirements to which they are subject.
Prompt corrective action regulations provide five classifications, including well-capitalized, adequately capitalized, undercapitalized, significantly undercapitalized, and critically undercapitalized, although these terms are not used to represent overall financial condition. If adequately capitalized, regulatory approval is required to accept brokered deposits. If undercapitalized, capital distributions are limited, as is asset growth and expansion, and capital restoration plans are required. At year end 20212023 and 2020,2022, the most recent regulatory notifications categorized the Bank as well capitalized under the regulatory framework for prompt corrective action. There are no conditions or events since that notification that management believes have changed the institution'sinstitution’s category.
At December 31, 2021, consolidated and bank actual capital and minimum required levels are presented below:
| | | | | | | | | | | | | | | | | | | | | | | | | | | | | | | | | | | | | | |
| | | Actual: | | Minimum Required For Capital Adequacy Purposes: | | Minimum Required To Be Well-Capitalized Under Prompt Corrective Action Regulations: |
| | | Amount | | Ratio | | Amount | | Ratio ⁽¹⁾ | | Amount | | Ratio |
| Total Capital (to Risk Weighted Assets) | | | | | | | | | | | | |
| Consolidated | | $ | 611,624 | | | 16.20 | % | | $ | 302,060 | | | 8.00 | % | | N/A | | N/A |
| Bank | | 503,549 | | | 13.36 | | | 301,495 | | | 8.00 | | | $ | 376,868 | | | 10.00 | % |
| | | | | | | | | | | | |
| Tier 1 (Core) Capital (to Risk Weighted Assets) | | | | | | | | | | | | |
| Consolidated | | $ | 551,532 | | | 14.61 | % | | $ | 226,545 | | | 6.00 | % | | N/A | | N/A |
| Bank | | 483,457 | | | 12.83 | | | 226,121 | | | 6.00 | | | $ | 301,495 | | | 8.00 | % |
| | | | | | | | | | | | |
| Common Tier 1 (CET 1) Capital Ratio (to Risk Weighted Assets) | | | | | | | | | | | | |
| Consolidated | | $ | 535,451 | | | 14.18 | % | | $ | 169,909 | | | 4.50 | % | | N/A | | N/A |
| Bank | | 483,457 | | | 12.83 | | | 169,591 | | | 4.50 | | | $ | 244,964 | | | 6.50 | % |
| | | | | | | | | | | | |
| Tier 1 (Core) Capital (to Average Assets) | | | | | | | | | | | | |
| Consolidated | | $ | 551,532 | | | 10.10 | % | | $ | 218,352 | | | 4.00 | % | | N/A | | N/A |
| Bank | | 483,457 | | | 8.88 | | | 217,839 | | | 4.00 | | | $ | 272,299 | | | 5.00 | % |
(1) Excludes 2.5% capital conservation buffer.
| | |
| Notes to the Consolidated Financial Statements |
| Dollars in thousands, except per share data |
NOTE 8 – Shareholders'Shareholders’ Equity (continued)
At December 31, 2020,2023, consolidated and bank actual capital and minimum required levels are presented below:
| | | | | Actual: | | Minimum Required For Capital Adequacy Purposes: | | Minimum Required To Be Well-Capitalized Under Prompt Corrective Action Regulations: | | | Actual: | | Minimum Required For Capital Adequacy Purposes: | | Minimum Required To Be Well-Capitalized Under Prompt Corrective Action Regulations: |
| | | | Amount | | Ratio | | Amount | | Ratio ⁽¹⁾ | | Amount | | Ratio | | | Amount | | Ratio | | Amount | | Ratio ⁽¹⁾ | | Amount | | Ratio |
| Total Capital (to Risk Weighted Assets) | Total Capital (to Risk Weighted Assets) | | | | | | | | | | | | | Total Capital (to Risk Weighted Assets) | | |
| Consolidated | Consolidated | | $ | 554,168 | | | 15.86 | % | | $ | 279,554 | | | 8.00 | % | | N/A | | N/A | Consolidated | | $ | 810,391 | | | 16.50 | | 16.50 | % | | $ | 392,870 | | | 8.00 | | 8.00 | % | | N/A |
| Bank | Bank | | 488,409 | | | 14.00 | | | 279,088 | | | 8.00 | | | $ | 348,860 | | | 10.00 | % | Bank | | 723,998 | | | 14.76 | | 14.76 | | | 392,402 | | 392,402 | | | 8.00 | | 8.00 | | | $ | | $ | 490,503 | | | 10.00 | | 10.00 | % |
| | Tier 1 (Core) Capital (to Risk Weighted Assets) | Tier 1 (Core) Capital (to Risk Weighted Assets) | |
| Tier 1 (Core) Capital (to Risk Weighted Assets) | |
| Tier 1 (Core) Capital (to Risk Weighted Assets) | |
| Consolidated | |
| Consolidated | |
| Consolidated | Consolidated | | $ | 486,969 | | | 13.93 | % | | $ | 209,665 | | | 6.00 | % | | N/A | | N/A | | $ | 735,089 | | | 14.97 | | 14.97 | % | | $ | 294,652 | | | 6.00 | | 6.00 | % | | N/A |
| Bank | Bank | | 460,936 | | | 13.21 | | | 209,316 | | | 6.00 | | | $ | 279,088 | | | 8.00 | % | Bank | | 688,696 | | | 14.04 | | 14.04 | | | 294,302 | | 294,302 | | | 6.00 | | 6.00 | | | $ | | $ | 392,402 | | | 8.00 | | 8.00 | % |
| | Common Tier 1 (CET 1) Capital Ratio (to Risk Weighted Assets) | Common Tier 1 (CET 1) Capital Ratio (to Risk Weighted Assets) | |
| Common Tier 1 (CET 1) Capital Ratio (to Risk Weighted Assets) | |
| Common Tier 1 (CET 1) Capital Ratio (to Risk Weighted Assets) | |
| Consolidated | |
| Consolidated | |
| Consolidated | Consolidated | | $ | 470,931 | | | 13.48 | % | | $ | 157,249 | | | 4.50 | % | | N/A | | N/A | | $ | 700,260 | | | 14.26 | | 14.26 | % | | $ | 220,989 | | | 4.50 | | 4.50 | % | | N/A |
| Bank | Bank | | 460,936 | | | 13.21 | | | 156,987 | | | 4.50 | | | $ | 226,759 | | | 6.50 | % | Bank | | 688,696 | | | 14.04 | | 14.04 | | | 220,726 | | 220,726 | | | 4.50 | | 4.50 | | | $ | | $ | 318,827 | | | 6.50 | | 6.50 | % |
| | Tier 1 (Core) Capital (to Average Assets) | Tier 1 (Core) Capital (to Average Assets) | |
| Tier 1 (Core) Capital (to Average Assets) | |
| Tier 1 (Core) Capital (to Average Assets) | |
| Consolidated | |
| Consolidated | |
| Consolidated | Consolidated | | $ | 486,695 | | | 10.07 | % | | $ | 193,343 | | | 4.00 | % | | N/A | | N/A | | $ | 735,089 | | | 11.75 | | 11.75 | % | | $ | 250,162 | | | 4.00 | | 4.00 | % | | N/A |
| Bank | Bank | | 460,936 | | | 9.56 | | | 192,915 | | | 4.00 | | | $ | 241,143 | | | 5.00 | % | Bank | | 688,696 | | | 11.03 | | 11.03 | | | 249,642 | | 249,642 | | | 4.00 | | 4.00 | | | $ | | $ | 312,053 | | | 5.00 | | 5.00 | % |
(1) Excludes 2.5% capital conservation buffer.
At December 31, 2022, consolidated and bank actual capital and minimum required levels are presented below:
| | | | | | | | | | | | | | | | | | | | | | | | | | | | | | | | | | | | | | |
| | | Actual: | | Minimum Required For Capital Adequacy Purposes: | | Minimum Required To Be Well-Capitalized Under Prompt Corrective Action Regulations: |
| | | Amount | | Ratio | | Amount | | Ratio ⁽¹⁾ | | Amount | | Ratio |
| Total Capital (to Risk Weighted Assets) | | | | | | | | | | | | |
| Consolidated | | $ | 747,542 | | | 15.45 | % | | $ | 387,024 | | | 8.00 | % | | N/A | | N/A |
| Bank | | 680,695 | | | 14.07 | | | 386,959 | | | 8.00 | | | $ | 483,698 | | | 10.00 | % |
| | | | | | | | | | | | |
| Tier 1 (Core) Capital (to Risk Weighted Assets) | | | | | | | | | | | | |
| Consolidated | | $ | 676,068 | | | 13.97 | % | | $ | 290,268 | | | 6.00 | % | | N/A | | N/A |
| Bank | | 649,221 | | | 13.42 | | | 290,219 | | | 6.00 | | | $ | 386,959 | | | 8.00 | % |
| | | | | | | | | | | | |
| Common Tier 1 (CET 1) Capital Ratio (to Risk Weighted Assets) | | | | | | | | | | | | |
| Consolidated | | $ | 641,690 | | | 13.26 | % | | $ | 217,701 | | | 4.50 | % | | N/A | | N/A |
| Bank | | 649,221 | | | 13.42 | | | 217,664 | | | 4.50 | | | $ | 314,404 | | | 6.50 | % |
| | | | | | | | | | | | |
| Tier 1 (Core) Capital (to Average Assets) | | | | | | | | | | | | |
| Consolidated | | $ | 676,068 | | | 10.50 | % | | $ | 257,622 | | | 4.00 | % | | N/A | | N/A |
| Bank | | 649,221 | | | 10.09 | | | 257,341 | | | 4.00 | | | $ | 321,677 | | | 5.00 | % |
(1) Excludes 2.5% capital conservation buffer.
The Company and the Bank at year end 20212023 and 20202022 were categorized as well-capitalized. There have been no conditions or events that management believes has changed the classification of the Bank under the prompt corrective action regulations since the last notification from regulators. Regulations require the maintenance of certain capital levels at the Bank, and may limit the
| | |
| Notes to the Consolidated Financial Statements |
| Dollars in thousands, except per share data |
NOTE 8 – Shareholders’ Equity (continued)
dividends payable by the affiliate to the holding company, or by the holding company to its shareholders. At December 31, 20212023 the Bank had $75,000approximately $175,000 in retained earnings available for payment of dividends to the parent company without prior regulatory approval.
In December 2018, federal banking regulators approved a final rule to address changes to credit lossThe Company adopted the CECL accounting standard under GAAP including banking organizations’ implementation of CECL.effective January 1, 2020. The final rule provides banking organizationsregulatory capital rules applicable to the option to phase in over aCompany provided an optional three-year phase-in period for the day-one adverse regulatory capital effects of adopting CECL. In addition, as part of the CARES Act, banking organizations were further permitted to mitigate the estimated cumulative regulatory capital effects of CECL for up to an additional two years. As a result, on January 1, 2022, the Company began the required three-year phase-in by reflecting 25% of the previously deferred estimated capital impact of CECL in its regulatory capital effective January 1, 2022. An additional 25% was phased in on each of January 1, 2023 and January 1, 2024 and another 25% will be phased in on January 1, 2025 (at which time the cumulative effects of adopting CECL will have been fully phased into our regulatory capital). Under the five-year transition option, the amount of adjustments to regulatory capital that may result fromcould be deferred until the phase-in period began included both the initial impact of our adoption of the new accounting standard. On March 27,CECL at January 1, 2020 and 25% of subsequent changes in an action related to the CARES Act, the federal banking regulators announced an interim final rule to delay the estimated impact on regulatory capital stemming from the implementation of CECL. The interim final rule, which was finalized effective September 30, 2020, maintains the three-year transition option in the previous rule and provides banks the option to delayour allowance for two years an estimate of CECL’s effect on regulatory capital, relative to the incurred loss methodology’s effect on regulatory capital, followed by a three-year transition period (five-year transition option). The Company has taken advantagecredit losses during each quarter of the capital transition relief over the permissible five-yeartwo-year period and will begin the three-year phase-in of the regulatory impact effective January 1, 2022.ended December 31, 2021.
Equity Plans and Equity Based Compensation
During the periods presented, the Company maintained 2one equity incentive plansplan under which stock options, restricted stock, and other equity incentive awards could be granted. Those plans include (i) the Company’s 2009 Long-Term Equity Incentive Plan, under which no new grants may be made, and (ii) theThe Company’s 2019 Long-Term Equity Incentive Plan (the “2019 LTI Plan”). The 2019 LTI Plan,, which authorizes a maximum aggregate issuance of 1,000,000 shares of common stock (subject to certain permitted adjustments), became effective on May 16, 2019, following approval of the Company’s shareholders. It will remain in effect until May 16, 2029, or until all shares of common stock subject to the 2019 LTI Plan are distributed, all awards have expired or terminated, or the plan is terminated pursuant to its terms, whichever occurs first.
| | |
Notes to the Consolidated Financial Statements |
Dollars in thousands, except per share data |
NOTE 8 – Shareholders' Equity (continued)
Stock Options
Options may be designated as incentive stock options or as nonqualified stock options. While the date after which options are first exercisable is determined by the appropriate committee of the Board of Directors of the Company or, in the case of options granted to directors, by the Board of Directors, no stock option may be exercised after ten years from the date of grant (twenty years in the case of nonqualified stock options). The exercise price of stock options granted pursuant to the plans must be no less than the market value of the Common Stock on the date of the grant.
The plans authorize an optionee to pay the exercise price of options in cash or in common shares of the Company or in some combination of cash and common shares. An optionee may tender already-owned common shares to the Company in exercise of an option. Certain of these plans authorize an optionee to surrender the value of an unexercised option in payment of an equivalent amount of the exercise price of the option. The Company typically issues authorized but unissued common shares upon the exercise of options.
The intrinsic value for stock options is calculated based on the exercise price of the underlying awards and the market price of common stock as of the reporting date.
During 2021, 20202023, 2022 and 2019,2021, the Company granted no options, and recorded no stock compensation expense related to option grants. The Company recorded no other stock compensation expense applicable to options during the years ended December 31, 2021, 20202023, 2022 and 2019.2021.
Restricted Stock
During the periods presented, awards of long-term incentives were granted in the form of restricted stock. In 2019 and prior, awards that were granted to management and selected other employees under the Company’s management incentive plan were granted in tandem with cash credit entitlements in the form of 60% restricted stock grants and 40% cash credit entitlements. In 2020, awards granted under the management incentive plan were granted in tandem with cash credit entitlements in the form of 66.67% restricted stock grants and 33.33% cash credit entitlements. In 2019 and prior, the restricted stock grants and tandem cash credit entitlements, generally, vested in 3three annual installments of 33.3% each. In 2020, 100% of the cash portion of an award vests towards the end of the year in which the grant was made, followed by the restricted stock grants vesting 50% in each of the 2nd and 3rd years. Beginning in 2021, for named executive officers, awards are granted in the form of 100% restricted stock grants which will vest in one-third installments on the first, second and third anniversaries of the award date.
| | |
| Notes to the Consolidated Financial Statements |
| Dollars in thousands, except per share data |
NOTE 8 – Shareholders’ Equity (continued)
Awards that are granted to directors as additional retainers for their services do not include any cash credit entitlement. These director restricted stock grants are subject to forfeiture in the event that the recipient of the grant does not continue in service as a director of the Company through December 31 of the year after grant or does not satisfy certain meeting attendance requirements, at which time they generally vest 100 percent. For measuring compensation costs, restricted stock awards are valued based upon the market value of the common shares on the date of grant.
The following table presents expense recorded for restricted stock and cash entitlements as well as the related tax effect for the years ended 2021, 2020,2023, 2022, and 2019:2021:
| | | | | 2021 | | 2020 | | 2019 | | | 2023 | | 2022 | | 2021 |
| | Restricted Stock Expense | Restricted Stock Expense | | $ | 1,692 | | | $ | 1,051 | | | $ | 1,287 | |
| Restricted Stock Expense | |
| Restricted Stock Expense | |
| Cash Entitlement Expense | Cash Entitlement Expense | | 732 | | | 995 | | | 639 | |
| Tax Effect | Tax Effect | | (629) | | | (531) | | | (499) | |
| Net of Tax | Net of Tax | | $ | 1,795 | | | $ | 1,515 | | | $ | 1,427 | |
Unrecognized expense associated with the restricted stock grants and cash entitlements totaled $2,497, $2,046,$3,519, $2,781, and $2,022$2,497 as of December 31, 2021, 2020,2023, 2022, and 2019,2021, respectively.
| | |
Notes to the Consolidated Financial Statements |
Dollars in thousands, except per share data |
NOTE 8 – Shareholders' Equity (continued)
The following table presents information on restricted stock grants outstanding for the period shown:
| | | Year Ended
December 31, 2023 | | | | Year Ended
December 31, 2023 |
| | Restricted
Shares | | | | Restricted
Shares | | Weighted
Average Market
Price at Grant |
| | Year Ended
December 31, 2021 |
| Restricted
Shares | | Weighted
Average Market
Price at Grant |
| | Outstanding at Beginning of Period | |
| Outstanding at Beginning of Period | |
| Outstanding at Beginning of Period | Outstanding at Beginning of Period | | 64,401 | | | $ | 28.20 | |
| Granted | Granted | | 51,927 | | | 47.21 | |
| Issued and Vested | Issued and Vested | | (48,592) | | | 30.67 | |
| Forfeited | Forfeited | | (576) | | | 34.79 | |
| Outstanding at End of Period | Outstanding at End of Period | | 67,160 | | | 41.06 | |
Employee Stock Purchase Plan
Through August 16, 2019, the company maintained the 2009 Employee Stock Purchase Plan (the “2009 ESPP”) whereby eligible employees had the option to purchase the Company’s common stock at a discount. The purchase price of the shares under this plan was set at 95% of the market value of the Company’s common stock as of the last day of the plan year. The plan had provided for the purchase of up to 750,000 shares of common stock, which the Company may obtain by purchases on the open market or from private sources, or by issuing authorized but unissued common shares.
The Company’s shareholders approved the Company’s new 2019 Employee Stock Purchase Plan on May 16, 2019, as well as an Amended and Restated 2019 Employee Stock Purchase Plan on May 21, 2020, which was amended and restated to reflect certain clarifying changes (the “2019 ESPP”). The 2019 ESPP replacesreplaced the Company’s 2009 ESPP,Employee Stock Purchase Plan, which expired onby its own terms on August 16, 2019. The 2019 ESPP which first became effective as of October 1, 2019, provides for a series of 3-month offering periods, commencing on the first day and ending on the last trading day of each calendar quarter, for the purchase of the Company’s common stock by participating employees. The purchase price of the shares has been set at 95% of the fair market value of the Company’s common stock on the last trading day of the offering period. A total of 750,000 common shares has been reserved for issuance under the 2019 ESPP. The 2019 ESPP will continue until September 30, 2029, or, if earlier, until all of the shares of common stock allocated to the 2019 ESPP have been purchased. Funding for the purchase of common stock is from employee and Company contributions.
In 2021,2023, the Company recorded $45$29 of expense, $34$22 net of tax, for the employee stock purchase plan. In 2020,2022, the Company recorded $40$53 of expense, $30$39 net of tax, for the employee stock purchase plan. In 2019,2021, the Company recorded $23$45 of expense, $1$34 net of tax, for the employee stock purchase plan. There was no unrecognized compensation expense as of December 31, 2021, 20202023, 2022 and 20192021 for the Employee Stock Purchase Plans.
Stock Repurchase Plan
On January 25, 2021, the Company’s Board of Directors approved a plan to repurchase up to 1000000 shares of the Company’s outstanding common stock. On a share basis, the amount of common stock subject to the repurchase plan represented approximately 4% of the Company’s outstanding shares at the time it was adopted. During 2021, the Company did not repurchase any of its outstanding common stock. The 2021 plan replaced a similar share repurchase plan approved by the Company’s Board of Directors on January 27, 2020. At the time of its termination in 2021, the Company had repurchased 221,912 shares of common stock under the 2020 plan.
On January 31, 2022, the Company’s Board of Directors terminated the 2021 repurchase plan and approved a new plan to repurchase up to 1000000one million shares of the Company’s outstanding common stock. On a share basis, the amount of common stock subject to the new repurchase plan represented approximately 3% of the Company’s outstanding shares on the date it was approved. The Company is not obligated to purchase shares under the plan, and the plan may be discontinued at any time. The actual timing, number and share price of shares purchased under the repurchase plan will be determined by the Company at its discretion and will depend upon such factors as the market price of the stock, general market and economic conditions and applicable legal requirements.
| | |
| Notes to the Consolidated Financial Statements |
| Dollars in thousands, except per share data |
factors as the market price of the stock, general market and economic conditions and applicable legal requirements. The Company has not repurchased an shares under this repurchase plan.
In August 2022, the Inflation Reduction Act of 2022 (the “IRA”) was enacted. Among other things, the IRA imposes a new 1% excise tax on the fair market value of stock repurchased after December 31, 2022 by publicly traded U.S. corporations, like the Company. With certain exceptions, the value of stock repurchased is determined net of stock issued in the year, including shares issued pursuant to compensatory arrangements.
NOTE 9 - Employee Benefit Plans
The Company provides a contributory trusteed 401(k) deferred compensation and profit sharing plan, which covers substantially all employees. The Company agrees to match certain employee contributions under the 401(k) portion of the plan, while profit sharing contributions are discretionary and are subject to determination by the Board of Directors. Company contributions were $2,356, $2,152, and $2,050 $1,956,for 2023, 2022, and $1,755 for 2021, 2020, and 2019, respectively.
The Company self-insures employee health benefits. Stop loss insurance covers annual losses exceeding $175 per covered family. Management’s policy is to establish a reserve for claims not submitted by a charge to earnings based on prior experience. Charges to earnings were $7,227, $7,619, and $5,520 $5,234,for 2023, 2022, and $5,495 for 2021, 2020, and 2019, respectively.
The Company maintains deferred compensation plans for the benefit of certain directors and officers. Under the plans, the Company agrees in return for the directors and officers deferring the receipt of a portion of their current compensation, to pay a retirement benefit computed as the amount of the compensation deferred plus accrued interest at a variable rate. Accrued benefits payable totaled $2,279$2,651 and $2,089$3,212 at December 31, 20212023 and 2020.2022, respectively. Deferred compensation expense was $261, $1,143, and $302 $304,for 2023, 2022, and $243 for 2021, 2020, and 2019, respectively. In conjunction with the plans, the Company purchased life insurance on certain directors and officers.
Postretirement Medical and Life Benefit Plan
The Company has an unfunded postretirement benefit plan covering substantially all of its employees. The medical plan is contributory with the participants’ contributions adjusted annually; the life insurance plans are noncontributory.
| | Changes in Accumulated Postretirement Benefit Obligations: | Changes in Accumulated Postretirement Benefit Obligations: | | 2021 | | 2020 | Changes in Accumulated Postretirement Benefit Obligations: | | 2023 | | 2022 |
| Obligation at the Beginning of Year | Obligation at the Beginning of Year | | $ | 1,634 | | | $ | 1,498 | |
| Unrecognized Loss (Gain) | Unrecognized Loss (Gain) | | (68) | | | 114 | |
| | Components of Net Periodic Postretirement Benefit Cost | Components of Net Periodic Postretirement Benefit Cost | |
| Components of Net Periodic Postretirement Benefit Cost | |
| Components of Net Periodic Postretirement Benefit Cost | |
| Service Cost | |
| Service Cost | |
| Service Cost | Service Cost | | 119 | | | 110 | |
| Interest Cost | Interest Cost | | 28 | | | 41 | |
| | Net Expected Benefit Payments | Net Expected Benefit Payments | | (121) | | | (96) | |
| Net Expected Benefit Payments | |
| Net Expected Benefit Payments | |
| Amendments | Amendments | | — | | | (33) | |
| Obligation at End of Year | Obligation at End of Year | | $ | 1,592 | | | $ | 1,634 | |
| | | | | | | | | | | | | | | | | | | | |
| Components of Postretirement Benefit Expense: | | 2021 | | 2020 | | 2019 |
| Service Cost | | $ | 119 | | | $ | 110 | | | $ | 83 | |
| Interest Cost | | 28 | | | 41 | | | 43 | |
| Amortization of Prior Service Costs | | (2) | | | 2 | | | — | |
| Amortization of Unrecognized Net (Gain) Loss | | 55 | | | 64 | | | 37 | |
| Net Postretirement Benefit Expense | | 200 | | | 217 | | | 163 | |
| | | | | | |
| Net Gain (Loss) During Period Recognized in Other Comprehensive Income (Loss) | | (121) | | | 15 | | | 273 | |
| | | | | | |
| Total Recognized in Net Postretirement Benefit Expense and Other Comprehensive Income | | $ | 79 | | | $ | 232 | | | $ | 436 | |
| | | | | | | | | | | | | | | | | | | | |
| Assumptions Used to Determine Net Periodic Cost and Benefit Obligations: | | 2021 | | 2020 | | 2019 |
| Discount Rate | | 2.31 | % | | 1.81 | % | | 2.81 | % |
| | | | | | | | | | | | | | | | | | | | |
| Components of Postretirement Benefit Expense: | | 2023 | | 2022 | | 2021 |
| Service Cost | | $ | 101 | | | $ | 105 | | | $ | 119 | |
| Interest Cost | | 71 | | | 35 | | | 28 | |
| Amortization of Prior Service Costs | | (3) | | | (2) | | | (2) | |
| Amortization of Unrecognized Net (Gain) Loss | | 32 | | | 43 | | | 55 | |
| Net Postretirement Benefit Expense | | 201 | | | 181 | | | 200 | |
| | | | | | |
| Net Gain (Loss) During Period Recognized in Other Comprehensive Income (Loss) | | 158 | | | (112) | | | (121) | |
| | | | | | |
| Total Recognized in Net Postretirement Benefit Expense and Other Comprehensive Income | | $ | 359 | | | $ | 69 | | | $ | 79 | |
| | |
| Notes to the Consolidated Financial Statements |
| Dollars in thousands, except per share data |
NOTE 9 – Employee Benefit Plans (continued)
| | | | | | | | | | | | | | |
| Assumed Health Care Cost Trend Rates at Year-end: | | 2021 | | 2020 |
| Health Care Cost Trend Rate Assumed for Next Year | | 8.00 | % | | 8.00 | % |
| Rate that the Cost Trend Rate Gradually Declines to | | 4.50 | % | | 4.50 | % |
| Year that the Rate Reaches the Rate it is Assumed to Remain at | | 2028 | | 2027 |
| | | | | | | | | | | | | | | | | | | | |
| Assumptions Used to Determine Net Periodic Cost and Benefit Obligations: | | 2023 | | 2022 | | 2021 |
| Discount Rate | | 4.64 | % | | 4.83 | % | | 2.31 | % |
Assumed health care cost trend rates have a significant effect on the amounts reported for the health care plan. A one-percentage-point change in assumed health care cost trend rates would have the following effects as of December 31, 2021: | | | | | | | | | | | | | | |
| Assumed Health Care Cost Trend Rates at Year-end: | | 2023 | | 2022 |
| Health Care Cost Trend Rate Assumed for Next Year | | 8.00 | % | | 7.50 | % |
| Rate that the Cost Trend Rate Gradually Declines to | | 4.50 | % | | 4.50 | % |
| Year that the Rate Reaches the Rate it is Assumed to Remain at | | 2030 | | 2028 |
| | | | | | | | | | | | | | |
| | One-Percentage-Point
Increase | | One-Percentage-Point
Decrease |
| Effect on Total of Service and Interest Cost | | $ | 17 | | | $ | (15) | |
| Effect on Postretirement Benefit Obligation | | $ | 116 | | | $ | (103) | |
Contributions
The Company expects to contribute $131$169 to its postretirement medical and life insurance plan in 2022.2024.
Estimated Future Benefits
The following postretirement benefit payments, which reflect expected future service, are expected to be paid:
| | | | | | | | |
| 2022 | | $ | 131 | |
| 2023 | | 138 | |
| 2024 | | 112 | |
| 2025 | | 119 | |
| 2026 | | 138 | |
| 2027-2031 | | 749 | |
| | | | | | | | |
| 2024 | | $ | 169 | |
| 2025 | | 129 | |
| 2026 | | 167 | |
| 2027 | | 177 | |
| 2028 | | 184 | |
| 2029-2033 | | 931 | |
Multi-Employer Pension Plan
Through the acquisition of River Valley Bancorp, the Company acquired a participation in a multi-employer defined benefit pension plan. Effective December 31, 2015, the plan was frozen. Pension expense was approximately $66$141 and $42$53 during 20212023 and 2020,2022, respectively. Specific plan asset and accumulated benefit information for the Company'sCompany’s portion of the fund is not available. Under the Employee Retirement Income and Security Act of 1974 (“ERISA”), a contributor to a multi-employer pension plan may be liable in the event of complete or partial withdrawal for the benefit payments guaranteed under ERISA, but thereERISA. The Company is no intentionin process of withdrawing from this multi-employer pension plan with finalization expected to withdraw.occur in the second quarter of 2024. As a result, the Company has accrued a withdrawal liability in the amount of $101 as of December 31, 2023.
The Company participates in the Pentegra Defined Benefit Plan for Financial Institutions (the “Pentegra DB Plan”), a tax-qualified defined-benefit pension plan. The Pentegra DB Plan operates as a multi-employer plan for accounting purposes and as a multiple-employer plan under ERISA and the Internal Revenue Code. There are no collective bargaining agreements in place that require contributions to the Pentegra DB Plan.
The Pentegra DB Plan is a single plan under Internal Revenue Code Section 413(c) and, as a result, all of the assets stand behind all of the liabilities. Accordingly, under the Pentegra DB Plan, contributions made by a participating employer may be used to provide benefits to participants of other participating employers.
Total contributions made to the Pentegra DB Plan, as reported on Form 5500, equal $253,199$142,405 and $138,322$248,563 for the plan years ended June 30, 20202022 and 2019,2021, respectively. The Company'sCompany’s contributions to the Pentegra DB Plan for the fiscal year ending December 31, 20212023 were not more than 5% of total contributions to the Pentegra DB Plan for the year ending June 30, 2020.2022.
| | |
| Notes to the Consolidated Financial Statements |
| Dollars in thousands, except per share data |
NOTE 10 - Income Taxes
| | | | | | | | | | | | | | | | | | | | |
| The provision for income taxes consists of the following: | | 2021 | | 2020 | | 2019 |
| | | | | | |
| Current Federal | | $ | 13,437 | | | $ | 14,186 | | | $ | 8,263 | |
| Current State | | 2,547 | | | 2,265 | | | 1,004 | |
| Deferred Federal | | 2,056 | | | (2,765) | | | 3,545 | |
| Deferred State | | 608 | | | (852) | | | (795) | |
| Total | | $ | 18,648 | | | $ | 12,834 | | | $ | 12,017 | |
The provision for income taxes consists of the following:
| | | | | | | | | | | | | | | | | | | | |
| | 2023 | | 2022 | | 2021 |
| | | | | | |
| Current Federal | | $ | 13,067 | | | $ | 13,049 | | | $ | 13,437 | |
| Current State | | 1,934 | | | 1,763 | | | 2,547 | |
| Deferred Federal | | 2,602 | | | 1,868 | | | 2,056 | |
| Deferred State | | 156 | | | 671 | | | 608 | |
| Total | | $ | 17,759 | | | $ | 17,351 | | | $ | 18,648 | |
Effective tax rates differ from the federal statutory rate of 21% for 2021, 20202023, 2022 and 20192021 applied to income before income taxes due to the following:
| | | | | 2021 | | 2020 | | 2019 | | | 2023 | | 2022 | | 2021 |
| | Statutory Rate Times Pre-tax Income | Statutory Rate Times Pre-tax Income | | $ | 21,585 | | | $ | 15,759 | | | $ | 14,960 | |
| Statutory Rate Times Pre-tax Income | |
| Statutory Rate Times Pre-tax Income | |
| Add (Subtract) the Tax Effect of: | Add (Subtract) the Tax Effect of: | |
| Income from Tax-exempt Loans and Investments | Income from Tax-exempt Loans and Investments | | (3,872) | | | (2,681) | | | (2,246) | |
| Income from Tax-exempt Loans and Investments | |
| Income from Tax-exempt Loans and Investments | |
| Non-deductible Merger Costs | |
| State Income Tax, Net of Federal Tax Effect | State Income Tax, Net of Federal Tax Effect | | 2,492 | | | 1,116 | | | 165 | |
| General Business Tax Credits | General Business Tax Credits | | (1,013) | | | (1,085) | | | (1,039) | |
| Amortization of Tax Credit Investments | |
| Company Owned Life Insurance | Company Owned Life Insurance | | (321) | | | (484) | | | (421) | |
| Other Differences | Other Differences | | (223) | | | 209 | | | 598 | |
| Total Income Taxes | Total Income Taxes | | $ | 18,648 | | | $ | 12,834 | | | $ | 12,017 | |
The net deferred tax liability at December 31 consists of the following:
| | | | | | | | | | | | | | |
| | | 2021 | | 2020 |
| Deferred Tax Assets: | | | | |
| Allowance for Credit Losses | | $ | 8,470 | | | $ | 10,568 | |
| Lease Liability (Operating Leases) | | 1,542 | | | 2,055 | |
| Deferred Compensation and Employee Benefits | | 878 | | | 823 | |
| Other-than-temporary Impairment | | 246 | | | 246 | |
| Accrued Expenses | | 1,288 | | | 1,200 | |
| Business Combination Fair Value Adjustments | | 138 | | | 777 | |
| Pension and Postretirement Plans | | 200 | | | 200 | |
| Other Real Estate Owned | | — | | | 25 | |
| Non-Accrual Loan Interest Income | | 567 | | | 678 | |
| Net Operating Loss Carryforward | | 447 | | | 1,010 | |
| Mortgage Servicing Rights | | 49 | | | — | |
| Other | | 1,860 | | | 1,000 | |
| Total Deferred Tax Assets | | 15,685 | | | 18,582 | |
| Deferred Tax Liabilities: | | | | |
| Depreciation | | (2,496) | | | (2,331) | |
| Leasing Activities, Net | | (10,878) | | | (10,638) | |
| Unrealized Gain on Securities | | (4,366) | | | (9,734) | |
| FHLB Stock Dividends | | (199) | | | (206) | |
| Prepaid Expenses | | (646) | | | (641) | |
| Intangibles | | (1,651) | | | (1,670) | |
| Deferred Loan Fees | | (790) | | | (730) | |
| Mortgage Servicing Rights | | — | | | (9) | |
| Right of Use Asset (Operating Leases) | | (1,515) | | | (2,028) | |
| Other | | (75) | | | (230) | |
| Total Deferred Tax Liabilities | | (22,616) | | | (28,217) | |
| Valuation Allowance | | — | | | — | |
| Net Deferred Tax Liability | | $ | (6,931) | | | $ | (9,635) | |
| | |
| Notes to the Consolidated Financial Statements |
| Dollars in thousands, except per share data |
NOTE 10 – Income Taxes (continued)
The net deferred tax asset/(liability) at December 31 consists of the following:
| | | | | | | | | | | | | | |
| | | 2023 | | 2022 |
| Deferred Tax Assets: | | | | |
| Allowance for Credit Losses | | $ | 10,888 | | | $ | 10,478 | |
| Lease Liability (Operating Leases) | | 1,313 | | | 1,585 | |
| Unrealized Loss on Securities | | 57,882 | | | 70,234 | |
| Deferred Compensation and Employee Benefits | | 1,026 | | | 1,162 | |
| Other-than-temporary Impairment | | 245 | | | 246 | |
| Accrued Expenses | | 1,224 | | | 1,325 | |
| Business Combination Fair Value Adjustments | | — | | | 205 | |
| Pension and Postretirement Plans | | 182 | | | 182 | |
| Other Real Estate Owned | | 41 | | | 70 | |
| Non-Accrual Loan Interest Income | | 449 | | | 629 | |
| General Business Tax Credits | | — | | | 198 | |
| Net Operating Loss Carryforward | | 650 | | | 828 | |
| | | | |
| Other | | 879 | | | 1,190 | |
| Total Deferred Tax Assets | | 74,779 | | | 88,332 | |
| Deferred Tax Liabilities: | | | | |
| Depreciation | | (3,416) | | | (2,859) | |
| Leasing Activities, Net | | (12,926) | | | (10,983) | |
| | | | |
| FHLB Stock Dividends | | (455) | | | (488) | |
| Prepaid Expenses | | (154) | | | (684) | |
| Intangibles | | (2,376) | | | (3,181) | |
| Deferred Loan Fees | | (954) | | | (1,127) | |
| Mortgage Servicing Rights | | (51) | | | (58) | |
| Right of Use Asset (Operating Leases) | | (1,274) | | | (1,548) | |
| Business Combination Fair Value Adjustments | | (478) | | | — | |
| Other | | (1,325) | | | (924) | |
| Total Deferred Tax Liabilities | | (23,409) | | | (21,852) | |
| Valuation Allowance | | — | | | — | |
| Net Deferred Tax Asset/(Liability) | | $ | 51,370 | | | $ | 66,480 | |
Under the Internal Revenue Code, through 1996, three acquired banking companies, which are now a part of the Company’s single banking subsidiary, were allowed a special bad debt deduction related to additions to tax bad debt reserves established for the purpose of absorbing losses. The acquired banks were formerly known as River Valley Financial Bank (acquired in March 2016), Peoples Community Bank (acquired in October 2005) and First American Bank (acquired in January 1999). Subject to certain limitations, these banks were permitted to deduct from taxable income an allowance for bad debts based on a percentage of taxable income before such deductions or actual loss experience. Each of the banks generally computed its annual addition to its bad debt reserves using the percentage of taxable income method; however, due to certain limitations in 1996, the banks were only allowed a deduction based on actual loss experience.
Retained earnings at December 31, 2021,2023, include approximately $5,095 for which no provision for federal income taxes has been made. This amount represents allocations of income for allowable bad debt deductions. Reduction of amounts so allocated for purposes other than tax bad debt losses will create taxable income, which will be subject to the then current corporate income tax rate. It is not contemplated that amounts allocated to bad debt deductions will be used in any manner to create taxable income. The unrecorded deferred income tax liability on the above amount at December 31, 20212023 was approximately $1,070.
As of December 31, 2021,2023, the Company had Kentucky net operating loss carryforwards of $11,317,$16,462, which expire in years ranging from 20222029 through 2039.2040. These net operating loss carryforwards were primarily derived from the acquisition of First Security and Citizens First.are expected to be fully utilized before their expiration dates.
| | |
| Notes to the Consolidated Financial Statements |
| Dollars in thousands, except per share data |
NOTE 10 – Income Taxes (continued)
Unrecognized Tax Benefits
The Company had no unrecognized tax benefits as of December 31, 2021, 2020,2023, 2022, and 2019,2021, and did not recognize any increase in unrecognized benefits during 20212023 relative to any tax positions taken in 2021.2023. Should the accrual of any interest or penalties relative to unrecognized tax benefits be necessary, it is the Company’s policy to record such accruals in its income tax expense accounts; no such accruals existed as of December 31, 2021, 2020,2023, 2022, and 2019.2021. The Company and its corporate subsidiaries file a consolidated U.S. Federal income tax return, which is subject to examination for all years after 2016.2019. The Company and its corporate subsidiaries doing businessfile combined/unitary returns in Indiana file a combined Indiana unitary return,various states, which isare subject to examination for all years after 2016.2019.
NOTE 11 - Revenue Recognition
The following table presents non-interest income, segregated by revenue streams in-scope and out-of-scope of FASB ASU No. 2014-09, Revenue from Contracts with Customers (Topic 606), for the years ended December 31, 20212023, 2022 and 2020.2021. Trust and investment product fees are included in the wealth management services segment while insurance revenues are included in the insurance segment. All other revenue streams are primarily included in the banking segment.
| | Year Ended |
| December 31, |
| | Year Ended | | | | Year Ended |
| | December 31, | | | | December 31, |
| Non-interest Income | Non-interest Income | | 2021 | | 2020 | | 2019 | Non-interest Income | | 2023 | | 2022 | | 2021 |
| In-Scope of Topic 606: | In-Scope of Topic 606: | | | | | | |
| Wealth Management & Investment Services Income | | $ | 10,321 | | | $ | 8,005 | | | $ | 7,278 | |
| Wealth Management Fees | |
| Wealth Management Fees | |
| Wealth Management Fees | |
| Service Charges on Deposit Accounts | Service Charges on Deposit Accounts | | 7,723 | | | 7,334 | | | 8,718 | |
| Insurance Revenues | Insurance Revenues | | 9,268 | | | 8,922 | | | 8,940 | |
| Interchange Fee Income | Interchange Fee Income | | 13,116 | | | 10,529 | | | 9,450 | |
| Other Operating Income | | 2,877 | | | 2,361 | | | 2,073 | |
| Other Operating Income: | |
| ATM Fees | |
| ATM Fees | |
| ATM Fees | |
| Wire Transfer Fees | |
Other (1) | |
| Non-interest Income (in-scope of Topic 606) | Non-interest Income (in-scope of Topic 606) | | 43,305 | | | 37,151 | | | 36,459 | |
| Non-interest Income (out-of-scope of Topic 606) | Non-interest Income (out-of-scope of Topic 606) | | 16,157 | | | 17,323 | | | 9,042 | |
| Total Non-interest Income | Total Non-interest Income | | $ | 59,462 | | | $ | 54,474 | | | $ | 45,501 | |
(1) “Other” income includes safe deposit box rentals and other non-interest related fees totaling $1.2 million, $1.2 million, and $1.2 million for the years ended December 31, 2023, 2022, and 2021, respectively, all of which are within scope of ASC 606.
A description of the Company’s revenue streams accounted for under Topic 606 follows:
Service Charges on Deposit Accounts: The Company earns fees from its deposit customers for transaction-based, account maintenance, and overdraft services. Transaction-based fees, which include services such as stop payment charges and
| | |
Notes to the Consolidated Financial Statements |
Dollars in thousands, except per share data |
NOTE 11 – Revenue Recognition (continued)
statement rendering, are recognized at the time the transaction is executed (the point in time the Company fills the customer’s request). Account maintenance fees, which relate primarily to monthly maintenance, are earned over the course of a month, representing the period over which the Company satisfies the performance obligation. Overdraft fees are recognized at the point in time that the overdraft occurs.
Interchange Fee Income: The Company earns interchange fees from debit/credit cardholder transactions conducted through various payment networks. Interchange fees from cardholder transactions represent a percentage of the underlying transaction value and are recognized daily, concurrently with the transaction processing services provided to the cardholder.
Wealth Management and Investment Services Income:Fees: The Company earns wealth management and investment services income from its contracts with wealth management customers to manage assets for investment and/or to transact their accounts. These fees are primarily earned over time as the Company provides the contracted monthly or quarterly services and are generally assessed based on the market value of assets under management at month-end. Fees that are transaction based, including trade execution services, are recognized at the point in time that the transaction is executed (trade date).
| | |
| Notes to the Consolidated Financial Statements |
| Dollars in thousands, except per share data |
NOTE 11 – Revenue Recognition (continued)
Insurance Revenues: The Company earns insurance revenue from commissions derived from the sale of personal and corporate property and casualty insurance products. These commissions are primarily earned over time as the Company provides the contracted insurance product to customers.
Other Operating Income: The other operating income revenue streams within the scope of Topic 606 consist of ATM fees, wire transfer fees, safe deposit box rentals, check printing commissions and other non-interest related fees.
NOTE 12 –- Per Share Data
The computation of Basic Earnings per Share and Diluted Earnings per Share are provided below:
| | | | | 2021 | | 2020 | | 2019 | | | 2023 | | 2022 | | 2021 |
| Basic Earnings per Share: | Basic Earnings per Share: | | | | | | | Basic Earnings per Share: | | |
| Net Income | Net Income | | $ | 84,137 | | | $ | 62,210 | | | $ | 59,222 | |
| Weighted Average Shares Outstanding | Weighted Average Shares Outstanding | | 26,537,311 | | | 26,539,024 | | | 25,824,538 | |
| | Basic Earnings per Share | Basic Earnings per Share | | $ | 3.17 | | | $ | 2.34 | | | $ | 2.29 | |
| Basic Earnings per Share | |
| Basic Earnings per Share | |
| | Diluted Earnings per Share: | |
| Diluted Earnings per Share: | |
| Diluted Earnings per Share: | Diluted Earnings per Share: | | | | | | | | |
| Net Income | Net Income | | $ | 84,137 | | | $ | 62,210 | | | $ | 59,222 | |
| | Weighted Average Shares Outstanding | Weighted Average Shares Outstanding | | 26,537,311 | | | 26,539,024 | | | 25,824,538 | |
| Stock Options, Net | | — | | | — | | | — | |
| Weighted Average Shares Outstanding | |
| Weighted Average Shares Outstanding | |
| Potentially Dilutive Shares, Net | |
| Diluted Weighted Average Shares Outstanding | Diluted Weighted Average Shares Outstanding | | 26,537,311 | | | 26,539,024 | | | 25,824,538 | |
| | Diluted Earnings per Share | Diluted Earnings per Share | | $ | 3.17 | | | $ | 2.34 | | | $ | 2.29 | |
| Diluted Earnings per Share | |
| Diluted Earnings per Share | |
There were no anti-dilutive shares at December 31, 2021, 2020,2023, 2022, and 2019.2021. There were no stock options outstanding at December 31, 2021, 20202023, 2022 and 2019.2021. Restricted stock units are participating shares and included in outstanding shares for purposes of the calculation of earnings per share.
NOTE 13 - Leases
At the inception of a contract, an entity should determine whether the contract contains a lease. Topic 842 defines a lease as a contract, or part of a contract, that conveys the right to control the use of identified property, plant, or equipment (an identified asset) for a period of time in exchange for consideration. Control over the use of an identified asset means that the customer has both (1) the right to obtain substantially all of the economic benefits from the use of the asset and (2) the right to direct the use of the asset.
German AmericanThe Bank has finance leases for branch offices as well as operating leases for branch offices, ATM locations and certain office equipment. The right-of-use asset is included in the ‘Premises, Furniture and Equipment, Net’ line of the consolidated balance sheet.Consolidated Balance Sheet. The lease liability is included in the ‘Accrued Interest Payable and Other Liabilities’ line of the consolidated balance sheet.Consolidated Balance Sheet.
| | |
Notes to the Consolidated Financial Statements |
Dollars in thousands, except per share data |
NOTE 13 – Leases (continued)
The Company used the implicit lease rate when determining the present value of lease payments for finance leases. The present value of lease payments for operating leases was determined using the incremental borrowing rate as of the date the Company adopted this standard.
The components of lease expense were as follows:
| | | | | | | | | | | | | | |
| | December 31, 2021 | | December 31, 2020 |
| Finance Lease Cost: | | | | |
| Amortization of Right-of-Use Assets | | $ | 210 | | | $ | 210 | |
| Interest on Lease Liabilities | | 345 | | | 363 | |
| Operating Lease Cost | | 1,423 | | | 1,781 | |
| Short-term Lease Cost | | 80 | | | 34 | |
| Total Lease Cost | | $ | 2,058 | | | $ | 2,388 | |
The weighted average lease term and discount rates were as follows:
| | | | | | | | | | | | | | |
| | December 31, 2021 | | December 31, 2020 |
| Weighted Average Remaining Lease Term: | | | | |
| Finance Leases | | 10 years | | 11 years |
| Operating Leases | | 7 years | | 8 years |
| | | | |
| Weighted Average Discount Rate: | | | | |
| Finance Leases | | 11.45 | % | | 11.47 | % |
| Operating Leases | | 3.02 | % | | 3.17 | % |
Supplemental balance sheet information related to leases were as follows:
| | | | | | | | | | | | | | |
| | December 31, 2021 | | December 31, 2020 |
| | | | |
| Finance Leases |
| Premises, Furniture and Equipment, Net | | $ | 2,068 | | | $ | 2,278 | |
| Other Borrowings | | $ | 3,051 | | | $ | 3,224 | |
| | | | |
| Operating Leases |
| Operating Lease Right-of-Use Assets | | $ | 6,115 | | | $ | 8,217 | |
| Operating Lease Liabilities | | $ | 6,227 | | | $ | 8,325 | |
Supplemental cash flow information related to leases were as follows:
| | | | | | | | | | | | | | |
| | December 31, 2021 | | December 31, 2020 |
| Cash Paid for Amounts in the Measurement of Lease Liabilities: | | | | |
| Operating Cash Flows from Finance Leases | | $ | 345 | | | $ | 363 | |
| Operating Cash Flows from Operating Leases | | 2,808 | | | 1,710 | |
| Financing Cash Flows from Finance Leases | | 155 | | | 125 | |
| | | | | | | | | | | | | | |
| | December 31, 2023 | | December 31, 2022 |
| Finance Lease Cost: | | | | |
| Amortization of Right-of-Use Assets | | $ | 210 | | | $ | 210 | |
| Interest on Lease Liabilities | | 304 | | | 326 | |
| Operating Lease Cost | | 1,424 | | | 1,508 | |
| Short-term Lease Cost | | — | | | — | |
| Total Lease Cost | | $ | 1,938 | | | $ | 2,044 | |
| | |
| Notes to the Consolidated Financial Statements |
| Dollars in thousands, except per share data |
NOTE 13 – Leases (continued)
The weighted average lease term and discount rates were as follows:
| | | | | | | | | | | | | | |
| | December 31, 2023 | | December 31, 2022 |
| Weighted Average Remaining Lease Term: | | | | |
| Finance Leases | | 8 years | | 9 years |
| Operating Leases | | 7 years | | 7 years |
| | | | |
| Weighted Average Discount Rate: | | | | |
| Finance Leases | | 11.37 | % | | 11.41 | % |
| Operating Leases | | 3.07 | % | | 2.98 | % |
Supplemental balance sheet information related to leases were as follows:
| | | | | | | | | | | | | | |
| | December 31, 2023 | | December 31, 2022 |
| | | | |
| Finance Leases |
| Premises, Furniture and Equipment, Net | | $ | 1,648 | | | $ | 1,858 | |
| Other Borrowings | | $ | 2,642 | | | $ | 2,857 | |
| | | | |
| Operating Leases |
| Operating Lease Right-of-Use Assets | | $ | 5,180 | | | $ | 6,297 | |
| Operating Lease Liabilities | | $ | 5,337 | | | $ | 6,447 | |
Supplemental cash flow information related to leases were as follows:
| | | | | | | | | | | | | | |
| | December 31, 2023 | | December 31, 2022 |
| Cash Paid for Amounts in the Measurement of Lease Liabilities: | | | | |
| Operating Cash Flows from Finance Leases | | $ | 304 | | | $ | 326 | |
| Operating Cash Flows from Operating Leases | | 1,395 | | | 1,449 | |
| Financing Cash Flows from Finance Leases | | 211 | | | 186 | |
The following table presents a maturity analysis of Finance and Operating Lease Liabilities:
| | | December 31, 2023 | | | | December 31, 2023 |
| | Finance Leases | | | | Finance Leases | | Operating Leases |
| | December 31, 2021 |
| Finance Leases | | Operating Leases |
| | Year 1 | |
| Year 1 | |
| Year 1 | Year 1 | | $ | 519 | | | $ | 1,216 | |
| Year 2 | Year 2 | | 519 | | | 1,059 | |
| Year 3 | Year 3 | | 519 | | | 974 | |
| Year 4 | Year 4 | | 519 | | | 870 | |
| Year 5 | Year 5 | | 519 | | | 809 | |
| Thereafter | Thereafter | | 2,433 | | | 2,093 | |
| Total Lease Payments | Total Lease Payments | | 5,028 | | | 7,021 | |
| Less Imputed Interest | Less Imputed Interest | | (1,977) | | | (794) | |
| Total | Total | | $ | 3,051 | | | $ | 6,227 | |
NOTE 14 –- Commitments and Off-balance Sheet Items
In the normal course of business, there are various commitments and contingent liabilities, such as commitments to extend credit and commitments to sell loans, which are not reflected in the accompanying consolidated financial statements. The Company’s exposure to credit loss in the event of nonperformance by the other party to the financial instruments for commitments to make loans and standby letters of credit is represented by the contractual amount of those instruments. The Company uses the same credit policy to make commitments as it uses for on-balance sheet items.
The Company’s exposure to credit risk for commitments to sell loans is dependent upon the ability of the counter-party to purchase the loans. This is generally assured by the use of government sponsored entity counterparts. These commitments are subject to market risk resulting from fluctuations in interest rates.
| | |
| Notes to the Consolidated Financial Statements |
| Dollars in thousands, except per share data |
NOTE 14 – Commitments and Off-balance Sheet Items (continued)
Commitments and contingent liabilities are summarized as follows, at December 31:
| | | | | 2021 | | 2020 | | | 2023 | | 2022 |
| Fixed
Rate | | Variable
Rate | | Fixed
Rate | | Variable
Rate |
| | Fixed
Rate | | | | Fixed
Rate | | Variable
Rate | | Fixed
Rate | | Variable
Rate |
| Commitments to Fund Loans: | Commitments to Fund Loans: | | | | | | | | | Commitments to Fund Loans: | | |
| Consumer Lines | Consumer Lines | | $ | 16,784 | | | $ | 476,719 | | | $ | 15,319 | | | $ | 424,441 | |
| Commercial Operating Lines | Commercial Operating Lines | | 59,917 | | | 473,033 | | | 33,892 | | | 447,270 | |
| Residential Mortgages | Residential Mortgages | | 25,132 | | | 214 | | | 52,394 | | | 2,262 | |
| Total Commitments to Fund Loans | Total Commitments to Fund Loans | | $ | 101,833 | | | $ | 949,966 | | | $ | 101,605 | | | $ | 873,973 | |
| | Commitments to Sell Loans: | Commitments to Sell Loans: | |
| Commitments to Sell Loans: | |
| Commitments to Sell Loans: | |
| Mandatory | |
| Mandatory | |
| Mandatory | Mandatory | | $ | 288 | | | $ | — | | | $ | — | | | $ | — | |
| Non-mandatory | Non-mandatory | | $ | 12,589 | | | $ | — | | | $ | 19,724 | | | $ | — | |
| | Standby Letters of Credit | Standby Letters of Credit | | $ | 1,491 | | | $ | 8,447 | | | $ | 2,122 | | | $ | 5,463 | |
| Standby Letters of Credit | |
| Standby Letters of Credit | |
The fixed rate commitments to fund loans have interest rates ranging from 3.00%2.00% to 21.00%24.00% and maturities ranging from less than 1 year to 3227 years. Since many commitments to make loans expire without being used, these amounts do not necessarily represent future cash commitments. Collateral obtained upon exercise of the commitment is determined using management’s credit evaluation of the borrower, and may include accounts receivable, inventory, property, land, and other items.
| | |
Notes to the Consolidated Financial Statements |
Dollars in thousands, except per share data |
The Company maintains an allowance for credit losses on unfunded loan commitments to provide for the risk of loss inherent in these arrangements. The allowance is computed using a methodology similar to that used to determine the allowance for credit losses on loans, modified to take into account the probability of a drawdown on the commitment. The allowance for credit losses on unfunded loan commitments is classified as a liability account on the balance sheet within accrued interest payable and other liabilities.
NOTE 15 –- Fair Value
Fair value is the exchange price that would be received for an asset or paid to transfer a liability (exit price) in the principal or most advantageous market for the asset or liability in an orderly transaction between market participants on the measurement date. There are three levels of inputs that may be used to measure fair values:
Level 1: Quoted prices (unadjusted) for identical assets or liabilities in active markets that the entity has the ability to access as of the measurement date.
Level 2: Significant other observable inputs other than Level 1 prices such as quoted prices for similar assets or liabilities; quoted prices in markets that are not active; or other inputs that are observable or can be corroborated by observable market data.
Level 3: Significant unobservable inputs that reflect a reporting entity’s own assumptions about the assumptions that market participants would use in pricing an asset or liability.
The Company used the following methods and significant assumptions to estimate the fair value of each type of financial instrument:
Investment Securities: The fair values for investment securities are determined by quoted market prices, if available (Level 1). For investment securities where quoted prices are not available, fair values are calculated based on market prices of similar investment securities (Level 2). For investment securities where quoted prices or market prices of similar investment securities are not available, fair values are calculated using discounted cash flows or other market indicators (Level 3). Level 3 pricing is obtained from a third-party based upon similar trades that are not traded frequently without adjustment by the Company. At December 31, 2021,2023, the Company held no$75 in Level 3 securities which consist of non-rated Obligations of State and Political Subdivisions.Subdivisions and $984 in Level 3 securities which consist of non-rated MBS/CMO. Absent the credit rating, significant
| | |
| Notes to the Consolidated Financial Statements |
| Dollars in thousands, except per share data |
NOTE 15 – Fair Value (continued)
assumptions must be made such that the credit risk input becomes an unobservable input and thus these investment securities are reported by the Company in a Level 3 classification.
Derivatives: The fair values of derivatives are based on valuation models using observable market data as of the measurement date (Level 2).
Individually Analyzed Loans: Fair values for collateral dependent loans are generally based on appraisals obtained from licensed real estate appraisers and in certain circumstances includes consideration of offers obtained to purchase properties prior to foreclosure. Appraisals for commercial real estate generally use three methods to derive value: cost, sales or market comparison and income approach. The cost method bases value in the cost to replace the current property. Value of market comparison approach evaluates the sales price of similar properties in the same market area. The income approach considers net operating income generated by the property and an investor’s required return. Adjustments are routinely made in the appraisal process by the independent appraisers to adjust for differences between the comparable sales and income data available. Comparable sales adjustments are based on known sales prices of similar type and similar use properties and duration of time that the property has been on the market to sell. Such adjustments made in the appraisal process are typically significant and result in a Level 3 classification of the inputs for determining fair value.
Appraisals for both collateral-dependent impaired loans and other real estate owned are performed by certified general appraisers (for commercial properties) or certified residential appraisers (for residential properties) whose qualifications and licenses have been reviewed and verified by the Company. Once received, a member of the Company’s Risk Management Area reviews the assumptions and approaches utilized in the appraisal. In determining the value of impaired collateral dependent loans and other real estate owned, significant unobservable inputs may be used which include: physical condition of comparable properties sold, net operating income generated by the property and investor rates of return.
Other Real Estate: Nonrecurring adjustments to certain commercial and residential real estate properties classified as other real estate (ORE) are measured at the lower of carrying amount or fair value, less costs to sell. Fair values are generally based on third party appraisals of the property utilizing similar techniques as discussed above for Impaired Loans, resulting in a Level 3 classification. In cases where the carrying amount exceeds the fair value, less costs to sell, impairment loss is recognized.
Loans Held-for-Sale: The fair values of loans held for sale are determined by using quoted prices for similar assets, adjusted for specific attributes of that loan resulting in a Level 2 classification.
| | |
Notes to the Consolidated Financial Statements |
Dollars in thousands, except per share data |
NOTE 15 – Fair Value (continued)
Assets and Liabilities Measured on a Recurring Basis
Assets and liabilities measured at fair value on a recurring basis, including financial assets and liabilities for which the Company has elected the fair value option, are summarized below:
| | | | | | | | | | | | | | | | | | | | | | | | | | |
| | | Fair Value Measurements at December 31, 2021 Using |
| | Quoted Prices in
Active Markets for
Identical Assets
(Level 1) | | Significant Other
Observable Inputs
(Level 2) | | Significant
Unobservable Inputs
(Level 3) | | Total |
| Assets: | | | | | | | | |
| Obligations of State and Political Subdivisions | | $ | — | | | $ | 925,706 | | | $ | — | | | $ | 925,706 | |
| MBS/CMO | | — | | | 791,950 | | | — | | | 791,950 | |
| US Gov't Sponsored Entities & Agencies | | — | | | 171,961 | | | — | | | 171,961 | |
| Total Securities | | $ | — | | | $ | 1,889,617 | | | $ | — | | | $ | 1,889,617 | |
| | | | | | | | |
| Loans Held-for-Sale | | $ | — | | | $ | 10,585 | | | $ | — | | | $ | 10,585 | |
| | | | | | | | |
| Derivative Assets | | $ | — | | | $ | 4,519 | | | $ | — | | | $ | 4,519 | |
| | | | | | | | |
| Derivative Liabilities | | $ | — | | | $ | 4,762 | | | $ | — | | | $ | 4,762 | |
| | | | | | | | | | | | | | | | | | | | | | | | | | |
| | | Fair Value Measurements at December 31, 2020 Using |
| | Quoted Prices in
Active Markets for
Identical Assets
(Level 1) | | Significant Other
Observable Inputs
(Level 2) | | Significant
Unobservable Inputs
(Level 3) | | Total |
| Assets: | | | | | | | | |
| Obligations of State and Political Subdivisions | | $ | — | | | $ | 580,750 | | | $ | 497 | | | $ | 581,247 | |
| MBS/CMO | | — | | | 548,307 | | | — | | | 548,307 | |
| US Gov't Sponsored Entities & Agencies | | — | | | 88,298 | | | — | | | 88,298 | |
| Total Securities | | $ | — | | | $ | 1,217,355 | | | $ | 497 | | | $ | 1,217,852 | |
| | | | | | | | |
| Loans Held-for-Sale | | $ | — | | | $ | 16,904 | | | $ | — | | | $ | 16,904 | |
| | | | | | | | |
| Derivative Assets | | $ | — | | | $ | 8,806 | | | $ | — | | | $ | 8,806 | |
| | | | | | | | |
| Derivative Liabilities | | $ | — | | | $ | 9,353 | | | $ | — | | | $ | 9,353 | |
As of December 31, 2021 and 2020, the aggregate fair value, contractual balance (including accrued interest), and gain or loss on Loans Held-for-Sale were as follows:
| | | | | | | | | | | | | | |
| | 2021 | | 2020 |
| Aggregate Fair Value | | $ | 10,585 | | | $ | 16,904 | |
| Contractual Balance | | 10,296 | | | 16,378 | |
| Gain (Loss) | | 289 | | | 526 | |
The total amount of gains and losses from changes in fair value included in earnings for the years ended December 31, 2021, 2020 and 2019 for loans held for sale were $(237), $191, and $303, respectively. | | | | | | | | | | | | | | | | | | | | | | | | | | |
| | | Fair Value Measurements at December 31, 2023 Using |
| | Quoted Prices in
Active Markets for
Identical Assets
(Level 1) | | Significant Other
Observable Inputs
(Level 2) | | Significant
Unobservable Inputs
(Level 3) | | Total |
| Assets: | | | | | | | | |
| U.S. Treasury | | $ | — | | | $ | — | | | $ | — | | | $ | — | |
| Obligations of State and Political Subdivisions | | — | | | 768,800 | | | 75 | | | 768,875 | |
| MBS/CMO | | — | | | 644,056 | | | 984 | | | 645,040 | |
| US Gov’t Sponsored Entities & Agencies | | — | | | 182,917 | | | — | | | 182,917 | |
| Total Securities | | $ | — | | | $ | 1,595,773 | | | $ | 1,059 | | | $ | 1,596,832 | |
| | | | | | | | |
| Loans Held-for-Sale | | $ | — | | | $ | 5,226 | | | $ | — | | | $ | 5,226 | |
| | | | | | | | |
| Derivative Assets | | $ | — | | | $ | 7,458 | | | $ | — | | | $ | 7,458 | |
| | | | | | | | |
| Derivative Liabilities | | $ | — | | | $ | 7,467 | | | $ | — | | | $ | 7,467 | |
| | |
| Notes to the Consolidated Financial Statements |
| Dollars in thousands, except per share data |
NOTE 15 – Fair Value (continued)
| | | | | | | | | | | | | | | | | | | | | | | | | | |
| | | Fair Value Measurements at December 31, 2022 Using |
| | Quoted Prices in
Active Markets for
Identical Assets
(Level 1) | | Significant Other
Observable Inputs
(Level 2) | | Significant
Unobservable Inputs
(Level 3) | | Total |
| Assets: | | | | | | | | |
| U.S. Treasury | | $ | 64,119 | | | $ | — | | | $ | — | | | $ | 64,119 | |
| Obligations of State and Political Subdivisions | | — | | | 777,769 | | | 83 | | | $ | 777,852 | |
| MBS/CMO | | — | | | 713,775 | | | 906 | | | $ | 714,681 | |
| US Gov’t Sponsored Entities & Agencies | | — | | | 205,017 | | | — | | | 205,017 | |
| Total Securities | | $ | 64,119 | | | $ | 1,696,561 | | | $ | 989 | | | $ | 1,761,669 | |
| | | | | | | | |
| Loans Held-for-Sale | | $ | — | | | $ | 8,600 | | | $ | — | | | $ | 8,600 | |
| | | | | | | | |
| Derivative Assets | | $ | — | | | $ | 9,899 | | | $ | — | | | $ | 9,899 | |
| | | | | | | | |
| Derivative Liabilities | | $ | — | | | $ | 9,749 | | | $ | — | | | $ | 9,749 | |
As of December 31, 2023 and 2022, the aggregate fair value, contractual balance (including accrued interest), and gain or loss on Loans Held-for-Sale were as follows:
| | | | | | | | | | | | | | |
| | 2023 | | 2022 |
| Aggregate Fair Value | | $ | 5,226 | | | $ | 8,600 | |
| Contractual Balance | | 5,125 | | | 8,474 | |
| Gain (Loss) | | 101 | | | 126 | |
The total amount of gains and losses from changes in fair value included in earnings for the years ended December 31, 2023, 2022 and 2021 for loans held for sale were $(25), $(163), and $(237), respectively.
The table below presents a reconciliation of all assets measured at fair value on a recurring basis using significant unobservable inputs (Level 3) for the years ended December 31, 20212023 and 2020:2022:
| | | | | Obligations of State and Political Subdivisions | | | Obligations of State and Political Subdivisions | | MBS/CMO |
| | | | 2021 | | 2020 | | | 2023 | | 2022 | | 2023 | | 2022 |
| Balance of Recurring Level 3 Assets at January 1 | Balance of Recurring Level 3 Assets at January 1 | | $ | 497 | | | $ | 4,021 | |
| Total Gains (Losses) Included in Other Comprehensive Income | Total Gains (Losses) Included in Other Comprehensive Income | | (2) | | | (26) | |
| Maturities / Calls | Maturities / Calls | | (495) | | | (3,498) | |
| Purchases | | — | | | — | |
| Acquired through Bank Acquisition | |
| Balance of Recurring Level 3 Assets at December 31 | Balance of Recurring Level 3 Assets at December 31 | | $ | — | | | $ | 497 | |
Of the total gain/loss included in earnings for the years ended December 31, 20212023 and 2020, ($2)2022, $70 and ($26)$(93) was attributable to other changes in fair value, respectively.
Assets and Liabilities Measured on a Non-Recurring Basis
Assets and liabilities measured at fair value on a non-recurring basis are summarized below: | | | | | | | | | | | | | | | | | | | | | | | | | | |
| | | Fair Value Measurements at December 31, 2021 Using |
| | Quoted Prices in Active Markets for Identical Assets
(Level 1) | | Significant Other Observable Inputs
(Level 2) | | Significant Unobservable Inputs
(Level 3) | | Total |
| Assets: | | | | | | | | |
| Individually Analyzed Loans | | | | | | | | |
| Commercial and Industrial Loans | | $ | — | | | $ | — | | | $ | 4,423 | | | $ | 4,423 | |
| Commercial Real Estate Loans | | — | | | — | | | 1,672 | | | 1,672 | |
| Agricultural Loans | | — | | | — | | | 79 | | | 79 | |
| Home Equity Loans | | — | | | — | | | 345 | | | 345 | |
| Residential Mortgage Loans | | — | | | — | | | — | | | — | |
| | | | | | | | | | | | | | | | | | | | | | | | | | |
| | | Fair Value Measurements at December 31, 2020 Using |
| | Quoted Prices in Active Markets for Identical Assets
(Level 1) | | Significant Other Observable Inputs
(Level 2) | | Significant Unobservable Inputs
(Level 3) | | Total |
| Assets: | | | | | | | | |
| Individually Analyzed Loans | | | | | | | | |
| Commercial and Industrial Loans | | $ | — | | | $ | — | | | $ | 4,985 | | | $ | 4,985 | |
| Commercial Real Estate Loans | | — | | | — | | | 8,893 | | | 8,893 | |
| Agricultural Loans | | — | | | — | | | 551 | | | 551 | |
| Home Equity Loans | | — | | | — | | | 369 | | | 369 | |
| Residential Mortgage Loans | | — | | | — | | | 75 | | | 75 | |
There was no Other Real Estate carried at fair value less costs to sell at December 31, 2021 and 2020. No charge to earnings was included in the years ended December 31, 2021 and 2020.
| | |
| Notes to the Consolidated Financial Statements |
| Dollars in thousands, except per share data |
NOTE 15 – Fair Value (continued)
Assets and Liabilities Measured on a Non-Recurring Basis
Assets and liabilities measured at fair value on a non-recurring basis are summarized below:
| | | | | | | | | | | | | | | | | | | | | | | | | | |
| | | Fair Value Measurements at December 31, 2023 Using |
| | Quoted Prices in Active Markets for Identical Assets
(Level 1) | | Significant Other Observable Inputs
(Level 2) | | Significant Unobservable Inputs
(Level 3) | | Total |
| Assets: | | | | | | | | |
| Individually Analyzed Loans | | | | | | | | |
| Commercial and Industrial Loans | | $ | — | | | $ | — | | | $ | 2,506 | | | $ | 2,506 | |
| Commercial Real Estate Loans | | — | | | — | | | 3,447 | | | 3,447 | |
| Agricultural Loans | | — | | | — | | | 2,395 | | | 2,395 | |
| Consumer Loans | | — | | | — | | | 9 | | | 9 | |
| Home Equity Loans | | — | | | — | | | 326 | | | 326 | |
| Residential Mortgage Loans | | — | | | — | | | 450 | | | 450 | |
| | | | | | | | | | | | | | | | | | | | | | | | | | |
| | | Fair Value Measurements at December 31, 2022 Using |
| | Quoted Prices in Active Markets for Identical Assets
(Level 1) | | Significant Other Observable Inputs
(Level 2) | | Significant Unobservable Inputs
(Level 3) | | Total |
| Assets: | | | | | | | | |
| Individually Analyzed Loans | | | | | | | | |
| Commercial and Industrial Loans | | $ | — | | | $ | — | | | $ | 1,858 | | | $ | 1,858 | |
| Commercial Real Estate Loans | | — | | | — | | | 10,040 | | | 10,040 | |
| Agricultural Loans | | — | | | — | | | 2,970 | | | 2,970 | |
| Consumer Loans | | — | | | — | | | 8 | | | 8 | |
| Home Equity Loans | | — | | | — | | | 368 | | | 368 | |
| Residential Mortgage Loans | | — | | | — | | | 718 | | | 718 | |
There was no Other Real Estate carried at fair value less costs to sell at December 31, 2023 and 2022. No charge to earnings was included in the years ended December 31, 2023 and 2022.
The following table presents quantitative information about Level 3 fair value measurements for financial instruments measured at fair value on a non-recurring basis at December 31, 20212023 and 2020:2022:
| | | | | | | | | | | | | | | | | | | | | | | | | | |
December 31, 20212023 | | Fair Value | | Valuation Technique(s) | | Unobservable Input(s) | | Range (Weighted Average) |
| Individually Analyzed Loans - Commercial and Industrial Loans | | $ | 4,4232,506 | | | Sales comparison approach | | Adjustment for physical condition of comparable properties sold | | 30%23% - 100%
(69%(33%)
|
| Individually Analyzed Loans - Commercial Real Estate Loans | | $ | 1,6723,447 | | | Sales comparison approach | | Adjustment for physical condition of comparable properties sold | | 30%20% - 100%68%
(46%(42%)
|
| Individually Analyzed Loans - Agricultural Loans | | $ | 792,395 | | | Sales comparison approach | | Adjustment for physical condition of comparable properties sold | | 30%31% - 96%100%
(90%(51%)
|
| Individually Analyzed Loans - Consumer Loans | | $ | —9 | | | Sales comparison approach | | Adjustment for physical condition of comparable properties sold | | 100%20% - 20%
(100%(20%)
|
| Individually Analyzed Loans - Home Equity Loans | | $ | 345326 | | | Sales comparison approach | | Adjustment for physical condition of comparable properties sold | | 20% - 23%20% (22%(20%)
|
| Individually Analyzed Loans - Residential Mortgage Loans | | $ | —450 | | | Sales comparison approach | | Adjustment for physical condition of comparable properties sold | | —% -—%20% -20%
(—%(20%)
|
| | |
| Notes to the Consolidated Financial Statements |
| Dollars in thousands, except per share data |
NOTE 15 – Fair Value (continued)
| | | | | | | | | | | | | | | | | | | | | | | | | | |
December 31, 20202022 | | Fair Value | | Valuation Technique(s) | | Unobservable Input(s) | | Range (Weighted Average) |
| Individually Analyzed Loans - Commercial and Industrial Loans | | $ | 4,9851,858 | | | Sales comparison approach | | Adjustment for physical condition of comparable properties sold | | 26%0% - 100%
(61%(40%)
|
| Individually Analyzed Loans - Commercial Real Estate Loans | | $ | 8,89310,040 | | | Sales comparison approach | | Adjustment for physical condition of comparable properties sold | | 30% - 100% (56%(37%)
|
| Individually Analyzed Loans - Agricultural Loans | | $ | 5512,970 | | | Sales comparison approach | | Adjustment for physical condition of comparable properties sold | | 30% - 96%100% (65%(48%)
|
| Individually Analyzed Loans - Consumer Loans | | $ | —8 | | | Sales comparison approach | | Adjustment for physical condition of comparable properties sold | | 27% - 100% (100%(20%)
|
| Individually Analyzed Loans - Home Equity Loans | | $ | 369368 | | | Sales comparison approach | | Adjustment for physical condition of comparable properties sold | | 9%20% - 9%51%
(9%(20%)
|
| Individually Analyzed Loans - Residential Mortgage Loans | | $ | 75718 | | | Sales comparison approach | | Adjustment for physical condition of comparable properties sold | | 43%20% - 97%100%
(67%(21%)
|
The carrying amounts and estimated fair values of the Company’s financial instruments not previously presented are provided in the tables below for the periods ending December 31, 20212023 and 2020.2022. Not all of the Company’s assets and liabilities are considered financial instruments, and therefore are not included in the tables. Because no active market exists for a significant portion of the Company’s financial instruments, fair value estimates were based on subjective judgments, and therefore cannot be determined with precision.
| | |
Notes to the Consolidated Financial Statements |
Dollars in thousands, except per share data |
| | | | | | | | | | | | | | | | | | | | | | | | | | | | | | | | |
| | | | Fair Value Measurements at
December 31, 2023 Using |
| | | Carrying Value | | Level 1 | | Level 2 | | Level 3 | | Total |
| Financial Assets: | | | | | | | | | | |
| Cash and Short-term Investments | | $ | 115,330 | | | $ | 78,805 | | | $ | 36,525 | | | $ | — | | | $ | 115,330 | |
| Interest Bearing Time Deposits with Banks | | 500 | | | — | | | 500 | | | — | | | 500 | |
| Loans, Net | | 3,918,184 | | | — | | | — | | | 3,801,738 | | | 3,801,738 | |
| Accrued Interest Receivable | | 30,595 | | | — | | | 10,014 | | | 20,581 | | | 30,595 | |
| Financial Liabilities: | | | | | | | | | | |
| Demand, Savings, and Money Market Deposits | | (4,485,921) | | | (4,485,921) | | | — | | | — | | | (4,485,921) | |
| Time Deposits | | (767,042) | | | — | | | (759,217) | | | — | | | (759,217) | |
| Short-term Borrowings | | (65,968) | | | (25,000) | | | (40,968) | | | — | | | (65,968) | |
| Long-term Debt | | (127,969) | | | — | | | (52,522) | | | (74,562) | | | (127,084) | |
| Accrued Interest Payable | | (7,073) | | | — | | | (6,701) | | | (372) | | | (7,073) | |
NOTE 15 – Fair Value (continued)
| | | | | | | | | | | | | | | | | | | | | | | | | | | | | | | | |
| | | | Fair Value Measurements at
December 31, 2021 Using |
| | | Carrying Value | | Level 1 | | Level 2 | | Level 3 | | Total |
| Financial Assets: | | | | | | | | | | |
| Cash and Short-term Investments | | $ | 396,890 | | | $ | 47,173 | | | $ | 349,717 | | | $ | — | | | $ | 396,890 | |
| Interest Bearing Time Deposits with Banks | | 745 | | | — | | | 745 | | | — | | | 745 | |
| Loans, Net | | 2,960,728 | | | — | | | — | | | 2,980,555 | | | 2,980,555 | |
| Accrued Interest Receivable | | 20,229 | | | — | | | 9,213 | | | 11,016 | | | 20,229 | |
| Financial Liabilities: | | | | | | | | | | |
| Demand, Savings, and Money Market Deposits | | (4,397,217) | | | (4,397,217) | | | — | | | — | | | (4,397,217) | |
| Time Deposits | | (347,099) | | | — | | | (347,876) | | | — | | | (347,876) | |
| Short-term Borrowings | | (68,328) | | | — | | | (68,328) | | | — | | | (68,328) | |
| Long-term Debt | | (83,855) | | | — | | | (28,320) | | | (58,303) | | | (86,623) | |
| Accrued Interest Payable | | (613) | | | — | | | (579) | | | (34) | | | (613) | |
| | | | | | | | | | | | | | | | | | | | | | | | | | | | | | | | |
| | | | Fair Value Measurements at
December 31, 2020 Using |
| | | Carrying Value | | Level 1 | | Level 2 | | Level 3 | | Total |
| Financial Assets: | | | | | | | | | | |
| Cash and Short-term Investments | | $ | 345,748 | | | $ | 57,972 | | | $ | 287,776 | | | $ | — | | | $ | 345,748 | |
| Interest Bearing Time Deposits with Banks | | 1,241 | | | — | | | 1,241 | | | — | | | 1,241 | |
| Loans, Net | | 3,026,340 | | | — | | | — | | | 3,032,690 | | | 3,032,690 | |
| Accrued Interest Receivable | | 20,278 | | | — | | | 6,137 | | | 14,141 | | | 20,278 | |
| Financial Liabilities: | | | | | | | | | | |
| Demand, Savings, and Money Market Deposits | | (3,612,078) | | | (3,612,078) | | | — | | | — | | | (3,612,078) | |
| Time Deposits | | (494,452) | | | — | | | (495,171) | | | — | | | (495,171) | |
| Short-term Borrowings | | (52,905) | | | — | | | (52,905) | | | — | | | (52,905) | |
| Long-term Debt | | (141,624) | | | — | | | (88,342) | | | (54,960) | | | (143,302) | |
| Accrued Interest Payable | | (1,084) | | | — | | | (1,049) | | | (35) | | | (1,084) | |
| | | | | | | | | | | | | | | | | | | | | | | | | | | | | | | | |
| | | | Fair Value Measurements at
December 31, 2022 Using |
| | | Carrying Value | | Level 1 | | Level 2 | | Level 3 | | Total |
| Financial Assets: | | | | | | | | | | |
| Cash and Short-term Investments | | $ | 117,381 | | | $ | 75,476 | | | $ | 41,905 | | | $ | — | | | $ | 117,381 | |
| Interest Bearing Time Deposits with Banks | | 500 | | | — | | | 500 | | | — | | | 500 | |
| Loans, Net | | 3,724,804 | | | — | | | — | | | 3,688,903 | | | 3,688,903 | |
| Accrued Interest Receivable | | 27,741 | | | 38 | | | 10,863 | | | 16,840 | | | 27,741 | |
| Financial Liabilities: | | | | | | | | | | |
| Demand, Savings, and Money Market Deposits | | (4,921,582) | | | (4,921,582) | | | — | | | — | | | (4,921,582) | |
| Time Deposits | | (428,469) | | | — | | | (426,184) | | | — | | | (426,184) | |
| Short-term Borrowings | | (101,161) | | | (36,200) | | | (64,961) | | | — | | | (101,161) | |
| Long-term Debt | | (102,645) | | | — | | | (26,830) | | | (72,272) | | | (99,102) | |
| Accrued Interest Payable | | (1,513) | | | — | | | (1,205) | | | (308) | | | (1,513) | |
NOTE 16 - Segment Information
The Company’s operations include 3three primary segments: core banking, wealth management services, and insurance operations. The core banking segment involves attracting deposits from the general public and using such funds to originate consumer, commercial and agricultural, commercial and agricultural real estate, and residential mortgage loans, primarily in the Company’s local markets. The core banking segment also involves the sale of residential mortgage loans in the secondary
| | |
| Notes to the Consolidated Financial Statements |
| Dollars in thousands, except per share data |
NOTE 16 – Segment Information (continued)
market. The wealth management segment involves providing trust, investment advisory, brokerage and retirement planning services to customers. The insurance segment offers a full range of personal and corporate property and casualty insurance products, primarily in the Company’s banking subsidiary’s local markets.
The core banking segment is comprised by the Company’s banking subsidiary, German American Bank, which operated through 6376 banking offices at December 31, 2021.2023. Net interest income from loans and investments funded by deposits and borrowings is the primary revenue for the core-banking segment. The wealth management segment’s revenues are comprised primarily of fees generated by the trust operations of the Company'sCompany’s banking subsidiary and by German American Investment Services, Inc. These fees are derived by providing trust, investment advisory, brokerage and retirement planning services to its customers. The insurance segment primarily consists of German American Insurance, Inc., which provides a full line of personal and corporate insurance products. Commissions derived from the sale of insurance products are the primary source of revenue for the insurance segment.
The following segment financial information has been derived from the internal financial statements of the Company which are used by management to monitor and manage financial performance. The accounting policies of the 3three segments are the same as those of the Company. The evaluation process for segments does not include holding company income and expense. Holding company amounts are the primary differences between segment amounts and consolidated totals, and are reflected in the column labeled “Other” below, along with amounts to eliminate transactions between segments.
| | | | | | | | | | | | | | | | | | | | | | | | | | | | | | | | |
| | Core
Banking | | Wealth Management Services | | Insurance | | Other | | Consolidated
Totals |
| Year Ended December 31, 2023 | | | | | | | | | | |
| Net Interest Income | | $ | 195,215 | | | $ | 120 | | | $ | 56 | | | $ | (4,958) | | | $ | 190,433 | |
| Net Gains on Sales of Loans | | 2,363 | | | — | | | — | | | — | | | 2,363 | |
| Net Gains on Securities | | 40 | | | — | | | — | | | — | | | 40 | |
| Wealth Management Fees | | 5 | | | 11,706 | | | — | | | — | | | 11,711 | |
| Insurance Revenues | | 1 | | | 24 | | | 9,572 | | | (1) | | | 9,596 | |
| Noncash Items: | | | | | | | | | | |
| Provision for Credit Losses | | 2,550 | | | — | | | — | | | — | | | 2,550 | |
| Depreciation and Amortization | | 9,025 | | | 31 | | | 48 | | | 456 | | | 9,560 | |
| Income Tax Expense (Benefit) | | 18,698 | | | 695 | | | 556 | | | (2,190) | | | 17,759 | |
| Segment Profit (Loss) | | 85,037 | | | 2,974 | | | 1,682 | | | (3,805) | | | 85,888 | |
| Segment Assets at December 31, 2023 | | 6,137,687 | | | 9,508 | | | 3,509 | | | 1,494 | | | 6,152,198 | |
| | | | | | | | | | | | | | | | | | | | | | | | | | | | | | | | |
| | Core
Banking | | Wealth Management Services | | Insurance | | Other | | Consolidated
Totals |
| Year Ended December 31, 2022 | | | | | | | | | | |
| Net Interest Income | | $ | 204,259 | | | $ | 46 | | | $ | 27 | | | $ | (3,748) | | | $ | 200,584 | |
| Net Gains on Sales of Loans | | 3,818 | | | — | | | — | | | — | | | 3,818 | |
| Net Gains on Securities | | 589 | | | — | | | — | | | (27) | | | 562 | |
| Wealth Management Fees | | 4 | | | 10,072 | | | — | | | — | | | 10,076 | |
| Insurance Revenues | | 31 | | | 12 | | | 9,977 | | | — | | | 10,020 | |
| Noncash Items: | | | | | | | | | | |
| Provision for Credit Losses | | 6,350 | | | — | | | — | | | — | | | 6,350 | |
| Depreciation and Amortization | | 9,571 | | | 41 | | | 48 | | | 456 | | | 10,116 | |
| Income Tax Expense (Benefit) | | 17,873 | | | 691 | | | 720 | | | (1,933) | | | 17,351 | |
| Segment Profit (Loss) | | 82,965 | | | 2,157 | | | 2,281 | | | (5,578) | | | 81,825 | |
| Segment Assets at December 31, 2022 | | 6,152,346 | | | 8,846 | | | 14,706 | | | (19,907) | | | 6,155,991 | |
| | |
| Notes to the Consolidated Financial Statements |
| Dollars in thousands, except per share data |
NOTE 16 – Segment Information (continued)
| | Core
Banking | | Wealth Management Services | | Insurance | | Other | | Consolidated
Totals |
| | Core
Banking | | | | Core
Banking | | Wealth Management Services | | Insurance | | Other | | Consolidated
Totals |
| Year Ended December 31, 2021 | Year Ended December 31, 2021 | | | | | | | | | | | Year Ended December 31, 2021 | | |
| Net Interest Income | Net Interest Income | | $ | 163,395 | | | $ | 42 | | | $ | 11 | | | $ | (2,618) | | | $ | 160,830 | |
| Net Gains on Sales of Loans | Net Gains on Sales of Loans | | 8,267 | | | — | | | — | | | — | | | 8,267 | |
| Net Gains on Securities | Net Gains on Securities | | 2,247 | | | — | | | — | | | — | | | 2,247 | |
| Wealth Management and Investment Services Income | | 4 | | | 10,317 | | | — | | | — | | | 10,321 | |
| Wealth Management Fees | |
| Insurance Revenues | Insurance Revenues | | 14 | | | 7 | | | 9,247 | | | — | | | 9,268 | |
| Noncash Items: | Noncash Items: | |
| Provision for Credit Losses | |
| Provision for Credit Losses | |
| Provision for Credit Losses | Provision for Credit Losses | | (6,500) | | | — | | | — | | | — | | | (6,500) | |
| Depreciation and Amortization | Depreciation and Amortization | | 8,346 | | | 46 | | | 57 | | | 321 | | | 8,770 | |
| Income Tax Expense (Benefit) | Income Tax Expense (Benefit) | | 18,774 | | | 826 | | | 652 | | | (1,604) | | | 18,648 | |
| Segment Profit (Loss) | Segment Profit (Loss) | | 82,066 | | | 2,543 | | | 2,034 | | | (2,506) | | | 84,137 | |
| Segment Assets at December 31, 2021 | Segment Assets at December 31, 2021 | | 5,595,721 | | | 6,115 | | | 12,245 | | | (5,542) | | | 5,608,539 | |
| | | | | | | | | | | | | | | | | | | | | | | | | | | | | | | | |
| | Core
Banking | | Wealth Management Services | | Insurance | | Other | | Consolidated
Totals |
| Year Ended December 31, 2020 | | | | | | | | | | |
| Net Interest Income | | $ | 157,936 | | | $ | 18 | | | $ | 11 | | | $ | (2,722) | | | $ | 155,243 | |
| Net Gains on Sales of Loans | | 9,908 | | | — | | | — | | | — | | | 9,908 | |
| Net Gains on Securities | | 4,081 | | | — | | | — | | | — | | | 4,081 | |
| Wealth Management and Investment Services Income | | 3 | | | 8,002 | | | — | | | — | | | 8,005 | |
| Insurance Revenues | | 12 | | | 15 | | | 8,895 | | | — | | | 8,922 | |
| Noncash Items: | | | | | | | | | | |
| Provision for Credit Losses | | 17,550 | | | — | | | — | | | — | | | 17,550 | |
| Depreciation and Amortization | | 9,012 | | | 28 | | | 68 | | | 321 | | | 9,429 | |
| Income Tax Expense (Benefit) | | 13,758 | | | 452 | | | 536 | | | (1,912) | | | 12,834 | |
| Segment Profit (Loss) | | 60,812 | | | 1,355 | | | 1,655 | | | (1,612) | | | 62,210 | |
| Segment Assets at December 31, 2020 | | 4,963,655 | | | 4,480 | | | 10,263 | | | (821) | | | 4,977,577 | |
| | | | | | | | | | | | | | | | | | | | | | | | | | | | | | | | |
| | Core
Banking | | Wealth Management Services | | Insurance | | Other | | Consolidated
Totals |
| Year Ended December 31, 2019 | | | | | | | | | | |
| Net Interest Income | | $ | 147,735 | | | $ | 15 | | | $ | 18 | | | $ | (2,543) | | | $ | 145,225 | |
| Net Gains on Sales of Loans | | 4,633 | | | — | | | — | | | — | | | 4,633 | |
| Net Gains on Securities | | 1,248 | | | — | | | — | | | — | | | 1,248 | |
| Wealth Management and Investment Services Income | | 4 | | | 7,274 | | | — | | | — | | | 7,278 | |
| Insurance Revenues | | 25 | | | 28 | | | 8,887 | | | — | | | 8,940 | |
| Noncash Items: | | | | | | | | | | |
| Provision for Loan Losses | | 5,325 | | | — | | | — | | | — | | | 5,325 | |
| Depreciation and Amortization | | 8,265 | | | 6 | | | 71 | | | 288 | | | 8,630 | |
| Income Tax Expense (Benefit) | | 12,724 | | | 469 | | | 511 | | | (1,687) | | | 12,017 | |
| Segment Profit (Loss) | | 58,793 | | | 1,366 | | | 1,538 | | | (2,475) | | | 59,222 | |
| Segment Assets at December 31, 2019 | | 4,381,945 | | | 3,670 | | | 9,080 | | | 2,977 | | | 4,397,672 | |
| | |
Notes to the Consolidated Financial Statements |
Dollars in thousands, except per share data |
NOTE 17 - Parent Company Financial Statements
The condensed financial statements of German American Bancorp, Inc. are presented below:
CONDENSED BALANCE SHEETS
| | | | | | | | | | | | | | |
| | | December 31, |
| | | 2021 | | 2020 |
| ASSETS | | | | |
| Cash | | $ | 86,391 | | | $ | 47,533 | |
| Other Investments | | 353 | | | 353 | |
| Investment in Subsidiary Bank | | 616,459 | | | 614,661 | |
| Investment in Non-banking Subsidiaries | | 5,973 | | | 5,956 | |
| Other Assets | | 20,678 | | | 17,247 | |
| Total Assets | | $ | 729,854 | | | $ | 685,750 | |
| | | | |
| LIABILITIES | | | | |
| Borrowings | | $ | 55,804 | | | $ | 55,400 | |
| Other Liabilities | | 5,591 | | | 5,641 | |
| Total Liabilities | | 61,395 | | | 61,041 | |
| | | | |
| SHAREHOLDERS’ EQUITY | | | | |
| Common Stock | | 26,554 | | | 26,502 | |
| Additional Paid-in Capital | | 276,057 | | | 274,385 | |
| Retained Earnings | | 350,364 | | | 288,447 | |
| Accumulated Other Comprehensive Income (Loss) | | 15,484 | | | 35,375 | |
| Total Shareholders’ Equity | | 668,459 | | | 624,709 | |
| Total Liabilities and Shareholders’ Equity | | $ | 729,854 | | | $ | 685,750 | |
| | | | | | | | | | | | | | |
| | | December 31, |
| | | 2023 | | 2022 |
| ASSETS | | | | |
| Cash | | $ | 66,835 | | | $ | 46,541 | |
| Securities Available-for-Sale | | 4,112 | | | — | |
| Other Investments | | 353 | | | 353 | |
| Investment in Subsidiary Bank | | 652,452 | | | 566,494 | |
| Investment in Non-banking Subsidiaries | | 1,975 | | | 6,747 | |
| Other Assets | | 15,097 | | | 19,165 | |
| Total Assets | | $ | 740,824 | | | $ | 639,300 | |
| | | | |
| LIABILITIES | | | | |
| Borrowings | | $ | 75,327 | | | $ | 74,788 | |
| Other Liabilities | | 1,939 | | | 6,119 | |
| Total Liabilities | | 77,266 | | | 80,907 | |
| | | | |
| SHAREHOLDERS’ EQUITY | | | | |
| Common Stock | | 29,585 | | | 29,493 | |
| Additional Paid-in Capital | | 389,411 | | | 387,171 | |
| Retained Earnings | | 461,622 | | | 405,167 | |
| Accumulated Other Comprehensive Income (Loss) | | (217,060) | | | (263,438) | |
| Total Shareholders’ Equity | | 663,558 | | | 558,393 | |
| Total Liabilities and Shareholders’ Equity | | $ | 740,824 | | | $ | 639,300 | |
| | |
| Notes to the Consolidated Financial Statements |
| Dollars in thousands, except per share data |
NOTE 17 – Parent Company Financial Statements (continued)
CONDENSED STATEMENTS OF INCOME AND COMPREHENSIVE INCOME (LOSS)
| | | | | | | | | | | | | | | | | | | | |
| | | Years Ended December 31, |
| | | 2021 | | 2020 | | 2019 |
| INCOME | | | | | | |
| Dividends from Subsidiaries | | | | | | |
| Bank | | $ | 65,000 | | | $ | 40,000 | | | $ | 45,000 | |
| Non-bank | | 1,470 | | | 1,580 | | | 1,400 | |
| Interest Income | | 109 | | | 118 | | | 102 | |
| Other Income (Loss) | | 11 | | | 25 | | | (2) | |
| Total Income | | 66,590 | | | 41,723 | | | 46,500 | |
| | | | | | |
| EXPENSES | | | | | | |
| Salaries and Employee Benefits | | 537 | | | 498 | | | 530 | |
| Professional Fees | | 1,256 | | | 564 | | | 1,685 | |
| Occupancy and Equipment Expense | | 10 | | | 7 | | | 7 | |
| Interest Expense | | 2,763 | | | 2,907 | | | 2,781 | |
| Other Expenses | | 1,200 | | | 1,286 | | | 975 | |
| Total Expenses | | 5,766 | | | 5,262 | | | 5,978 | |
| INCOME BEFORE INCOME TAXES AND EQUITY IN UNDISTRIBUTED INCOME OF SUBSIDIARIES | | 60,824 | | | 36,461 | | | 40,522 | |
| Income Tax Benefit | | 1,607 | | | 1,922 | | | 1,712 | |
| INCOME BEFORE EQUITY IN UNDISTRIBUTED INCOME OF SUBSIDIARIES | | 62,431 | | | 38,383 | | | 42,234 | |
| Equity in Undistributed Income of Subsidiaries | | 21,706 | | | 23,827 | | | 16,988 | |
| NET INCOME | | 84,137 | | | 62,210 | | | 59,222 | |
| | | | | | |
| Other Comprehensive Income: | | | | | | |
| Changes in Unrealized Gain (Loss) on Securities, Available-for-Sale | | (19,891) | | | 20,270 | | | 22,432 | |
| Changes in Unrecognized Loss in Postretirement Benefit Obligation, Net | | — | | | — | | | (229) | |
| TOTAL COMPREHENSIVE INCOME | | $ | 64,246 | | | $ | 82,480 | | | $ | 81,425 | |
| | | | | | | | | | | | | | | | | | | | |
| | | Years Ended December 31, |
| | | 2023 | | 2022 | | 2021 |
| INCOME | | | | | | |
| Dividends from Subsidiaries | | | | | | |
| Bank | | $ | 50,000 | | | $ | 35,000 | | | $ | 65,000 | |
| Non-bank | | — | | | — | | | 1,470 | |
| Interest Income | | 277 | | | 104 | | | 109 | |
| Other Income (Loss) | | (28) | | | 31 | | | 11 | |
| Total Income | | 50,249 | | | 35,135 | | | 66,590 | |
| | | | | | |
| EXPENSES | | | | | | |
| Salaries and Employee Benefits | | 535 | | | 535 | | | 537 | |
| Professional Fees | | 777 | | | 1,989 | | | 1,256 | |
| Occupancy and Equipment Expense | | 8 | | | 8 | | | 10 | |
| Interest Expense | | 5,360 | | | 3,963 | | | 2,763 | |
| Other Expenses | | 1,183 | | | 1,162 | | | 1,200 | |
| Total Expenses | | 7,863 | | | 7,657 | | | 5,766 | |
| INCOME BEFORE INCOME TAXES AND EQUITY IN UNDISTRIBUTED INCOME OF SUBSIDIARIES | | 42,386 | | | 27,478 | | | 60,824 | |
| Income Tax Benefit | | 2,215 | | | 1,947 | | | 1,607 | |
| INCOME BEFORE EQUITY IN UNDISTRIBUTED INCOME OF SUBSIDIARIES | | 44,601 | | | 29,425 | | | 62,431 | |
| Equity in Undistributed Income of Subsidiaries | | 41,287 | | | 52,400 | | | 21,706 | |
| NET INCOME | | 85,888 | | | 81,825 | | | 84,137 | |
| | | | | | |
| Other Comprehensive Income (Loss): | | | | | | |
| Changes in Unrealized Gain (Loss) on Securities, Available-for-Sale | | 46,378 | | | (278,976) | | | (19,891) | |
| Changes in Unrecognized Loss in Postretirement Benefit Obligation, Net | | — | | | 54 | | | — | |
| TOTAL COMPREHENSIVE INCOME (LOSS) | | $ | 132,266 | | | $ | (197,097) | | | $ | 64,246 | |
| | |
| Notes to the Consolidated Financial Statements |
| Dollars in thousands, except per share data |
NOTE 17 – Parent Company Financial Statements (continued)
CONDENSED STATEMENTS OF CASH FLOWS
| | | | | Years Ended December 31, | | | Years Ended December 31, |
| | | | 2021 | | 2020 | | 2019 | | | 2023 | | 2022 | | 2021 |
| CASH FLOWS FROM OPERATING ACTIVITIES | CASH FLOWS FROM OPERATING ACTIVITIES | | | | | | |
| Net Income | Net Income | | $ | 84,137 | | | $ | 62,210 | | | $ | 59,222 | |
| Net Income | |
| Net Income | |
| Adjustments to Reconcile Net Income to Net Cash from Operations | Adjustments to Reconcile Net Income to Net Cash from Operations | |
| Change in Other Assets | |
| Change in Other Assets | |
| Change in Other Assets | Change in Other Assets | | (3,939) | | | (8,575) | | | 31 | |
| Change in Other Liabilities | Change in Other Liabilities | | 863 | | | (142) | | | (406) | |
| Equity Based Compensation | Equity Based Compensation | | 1,723 | | | 1,051 | | | 1,287 | |
| Excess Tax Benefit from Restricted Share Grant | | — | | | 3 | | | 25 | |
| | Equity in Excess Undistributed Income of Subsidiaries | |
| Equity in Excess Undistributed Income of Subsidiaries | |
| Equity in Excess Undistributed Income of Subsidiaries | Equity in Excess Undistributed Income of Subsidiaries | | (21,706) | | | (23,827) | | | (16,988) | |
| Net Cash from Operating Activities | Net Cash from Operating Activities | | 61,078 | | | 30,720 | | | 43,171 | |
| | CASH FLOWS FROM INVESTING ACTIVITIES | CASH FLOWS FROM INVESTING ACTIVITIES | | | |
| CASH FLOWS FROM INVESTING ACTIVITIES | |
| CASH FLOWS FROM INVESTING ACTIVITIES | |
| | Cash Used for Business Acquisitions | Cash Used for Business Acquisitions | | — | | | — | | | (14,958) | |
| | Cash Used for Business Acquisitions | |
| | Cash Used for Business Acquisitions | |
| Net Equity in Dissolution of Subsidiary | |
| Net Cash from Investing Activities | Net Cash from Investing Activities | | — | | | — | | | (14,958) | |
| | CASH FLOWS FROM FINANCING ACTIVITIES | CASH FLOWS FROM FINANCING ACTIVITIES | |
| Proceeds from Issuance of Long-term Debt | | — | | | — | | | 39,213 | |
| Repayment of Long-term Debt | | — | | | — | | | (25,000) | |
| Issuance (Retirement) of Common Stock | | — | | | (5,789) | | | — | |
| CASH FLOWS FROM FINANCING ACTIVITIES | |
| CASH FLOWS FROM FINANCING ACTIVITIES | |
| | Dividends Paid | |
| | Dividends Paid | |
| | Dividends Paid | Dividends Paid | | (22,220) | | | (20,136) | | | (17,556) | |
| Net Cash from Financing Activities | Net Cash from Financing Activities | | (22,220) | | | (25,925) | | | (3,343) | |
| | Net Change in Cash and Cash Equivalents | Net Change in Cash and Cash Equivalents | | 38,858 | | | 4,795 | | | 24,870 | |
| Net Change in Cash and Cash Equivalents | |
| Net Change in Cash and Cash Equivalents | |
| Cash and Cash Equivalents at Beginning of Year | Cash and Cash Equivalents at Beginning of Year | | 47,533 | | | 42,738 | | | 17,868 | |
| Cash and Cash Equivalents at End of Year | Cash and Cash Equivalents at End of Year | | $ | 86,391 | | | $ | 47,533 | | | $ | 42,738 | |
NOTE 18 - Business Combinations, Goodwill and Intangible Assets
Business Combinations
Citizens First Acquisition
Effective July 1, 2019, the Company acquired Citizens First Corporation (“Citizens First”) and its subsidiary, Citizens First Bank, Inc., pursuant to an Agreement and Plan of Reorganization dated February 22, 2019. The acquisition was accomplished by the merger of Citizens First with and into the Company, immediately followed by the merger of Citizens First Bank with and into the Company’s subsidiary bank, German American Bank. Citizens First Bank operated 8 banking offices in Barren, Hart, Simpson and Warren Counties in Kentucky. Citizens First’s consolidated assets and equity (unaudited) as of July 1, 2019 totaled $456.0 million and $49.8 million, respectively. The Company accounted for the transaction under the acquisition method of accounting which means that the acquired assets and liabilities were recorded at fair value at the date of acquisition.
In accordance with ASC 805, the Company expensed approximately $3.3 million of direct acquisition costs and recorded $17.7 million of goodwill and $4.5 million of intangible assets. The intangible assets are related to core deposits and are being amortized over 8 years. For tax purposes, goodwill totaling $17.7 million is non-deductible but will be evaluated annually for impairment. The following table summarizes the fair value of the total consideration transferred as a part of the Citizens First acquisition as well as the fair value of identifiable assets acquired and liabilities assumed as of the effective date of the transaction.
| | |
Notes to the Consolidated Financial Statements |
Dollars in thousands, except per share data |
NOTE 18 – Business Combinations, Goodwill and Intangible Assets (continued)
| | | | | | | | |
Consideration | | |
Cash for Options and Fractional Shares | | $ | 216 | |
Cash Consideration | | 15,294 | |
Equity Instruments | | 50,118 | |
| | |
Fair Value of Total Consideration Transferred | | $ | 65,628 | |
| | |
Recognized Amounts of Identifiable Assets Acquired and Liabilities Assumed: | | |
Cash | | $ | 21,055 | |
Interest-bearing Time Deposits with Banks | | 2,231 | |
Securities | | 43,839 | |
Loans | | 356,970 | |
Stock in FHLB of Indianapolis and Other Restricted Stock, at Cost | | 2,065 | |
Premises, Furniture & Equipment | | 10,772 | |
Other Real Estate | | — | |
Intangible Assets | | 4,547 | |
Company Owned Life Insurance | | 8,796 | |
Accrued Interest Receivable and Other Assets | | 3,863 | |
Deposits - Non-interest Bearing | | (52,521) | |
Deposits - Interest Bearing | | (318,966) | |
FHLB Advances and Other Borrowings | | (31,068) | |
Accrued Interest Payable and Other Liabilities | | (3,694) | |
| | |
Total Identifiable Net Assets | | $ | 47,889 | |
| | |
Goodwill | | $ | 17,739 | |
Under the terms of the merger agreement, each Citizens First common shareholder of record at the effective time of the merger (other than those holding shares in the Citizens First Bank 401(k) Profit Sharing Plan (the “CFB 401(k) Plan”)) became entitled to receive a cash payment of $5.80 and a 0.6629 share of common stock of the Company for each of their former shares of Citizens First common stock. In addition, as record holder of shares of Citizens First common stock held in the CFB 401(k) Plan, the plan administrator was entitled to receive a cash payment of $25.77 for each share held by the CFB 401(k) Plan, which amount is equal to (i) the exchange ratio multiplied by the closing trading price of the Company’s common stock on June 28, 2019, plus (ii) $5.80. As a result, in connection with the closing of the merger on July 1, 2019, the Company issued approximately 1,664,000 shares of its common stock to the former shareholders of Citizens First and paid cash consideration in the aggregate amount of $15.5 million.
This acquisition is consistent with the Company’s strategy to build a regional presence in central and western Kentucky. The acquisition offers the Company the opportunity to increase profitability by introducing existing products and services to the acquired customer base as well as add new customers in the expanded region.
The fair value of net assets acquired includes fair value adjustments to certain receivables that were not considered impaired as of the acquisition date. The fair value adjustments were determined using discounted cash flows. However, the Company believes that all contractual cash flows related to these financial instruments will be collected. As such, these receivables were not considered impaired at the acquisition date and were not subject to the guidance relating to purchased credit impaired loans, which are loans that have shown evidence of credit deterioration since origination. Receivables acquired that were not subject to these requirements include non-impaired loans and customer receivables with a fair value of $349.9 million and unpaid principal of $353.3 million on the date of acquisition.
| | |
Notes to the Consolidated Financial Statements |
Dollars in thousands, except per share data |
NOTE 18 – Business Combinations, Goodwill and Intangible Assets (continued)
Goodwill
The changes in the carrying amount of goodwill for the periods ended December 31, 2021, 2020, and 2019, were classified as follows:
| | | | | | | | | | | | | | | | | | | | |
| | | 2021 | | 2020 | | 2019 |
| | | | | | |
| Beginning of Year | | $ | 121,956 | | | $ | 121,306 | | | $ | 103,681 | |
| Acquired Goodwill | | — | | | 650 | | | 17,625 | |
| Adjustments | | (195) | | | — | | | — | |
| End of Year | | $ | 121,761 | | | $ | 121,956 | | | $ | 121,306 | |
Of the $121,761 carrying amount of goodwill, $120,429 is allocated to the core banking segment, and $1,332 is allocated to the insurance segment for the period ended December 31, 2021. The decrease of $195 in 2021 is attributable to the sale of 2 branches located in Lexington, Kentucky. Of the $121,956 carrying amount of goodwill, $120,624 is allocated to the core banking segment, and $1,332 is allocated to the insurance segment for the period ended December 31, 2020. During 2020, the Company finalized valuation estimates for the Citizens First acquisition and recorded $650 of additional goodwill. Of the $121,306 carrying amount of goodwill, $119,974 is allocated to the core banking segment, and $1,332 is allocated to the insurance segment for the period ended December 31, 2019.
Impairment exists when a reporting unit’s carrying value of goodwill exceeds its fair value. At December 31, 2021, the Company’s reporting units had positive equity, and the Company elected to perform a qualitative assessment to determine if it was more likely than not that the fair value of the reporting units exceeded its carrying value, including goodwill. The qualitative assessment indicated that it was more likely than not that the fair value of the reporting unit exceeded its carrying value, resulting in no impairment.
Acquired Intangible Assets
Acquired intangible assets were as follows as of year end:
| | | | | | | | | | | | | | |
| | 2021 |
| | | Gross Amount | | Accumulated Amortization |
| Core Banking | | | | |
| Core Deposit Intangible | | $ | 25,675 | | | $ | (21,320) | |
| Branch Acquisition Intangible | | 257 | | | (257) | |
| Insurance | | | | |
| Customer List | | 5,408 | | | (5,348) | |
| Total | | $ | 31,340 | | | $ | (26,925) | |
| | | | | | | | | | | | | | |
| | 2020 |
| | | Gross Amount | | Accumulated Amortization |
| Core Banking | | | | |
| Core Deposit Intangible | | $ | 25,780 | | | $ | (18,619) | |
| Branch Acquisition Intangible | | 257 | | | (257) | |
| Insurance | | | | |
| Customer List | | 5,408 | | | (5,318) | |
| Total | | $ | 31,445 | | | $ | (24,194) | |
Amortization Expense was $2,731, $3,539 and $3,721, for 2021, 2020 and 2019.
| | |
Notes to the Consolidated Financial Statements |
Dollars in thousands, except per share data |
NOTE 18 – Business Combinations, Goodwill and Intangible Assets (continued)
Estimated amortization expense for each of the next five years is as follows:
| | | | | | | | |
| 2022 | | $ | 1,947 | |
| 2023 | | 1,310 | |
| 2024 | | 736 | |
| 2025 | | 332 | |
| 2026 | | 89 | |
NOTE 19 – Other Comprehensive Income (Loss)
The tables below summarize the changes in accumulated other comprehensive income (loss) by component for the years ended December 31, 2021 and 2020, net of tax:
| | | | | | | | | | | | | | | | | | | | |
| December 31, 2021 | | Unrealized
Gains and Losses on
Available-for-Sale
Securities | | Postretirement
Benefit Items | | Total |
| | | | | | |
| Beginning Balance | | $ | 35,943 | | | $ | (568) | | | $ | 35,375 | |
Other Comprehensive Income (Loss) Before
Reclassification | | (18,116) | | | — | | | (18,116) | |
Amounts Reclassified from Accumulated
Other Comprehensive Income (Loss) | | (1,775) | | | — | | | (1,775) | |
| Net Current Period Other | | | | | | |
| Comprehensive Income (Loss) | | (19,891) | | | — | | | (19,891) | |
| Ending Balance | | $ | 16,052 | | | $ | (568) | | | $ | 15,484 | |
| | | | | | | | | | | | | | | | | | | | |
| December 31, 2020 | | Unrealized
Gains and Losses on
Available-for-Sale
Securities | | Postretirement
Benefit Items | | Total |
| | | | | | |
| Beginning Balance | | $ | 15,673 | | | $ | (568) | | | $ | 15,105 | |
Other Comprehensive Income (Loss) Before
Reclassification | | 23,494 | | | — | | | 23,494 | |
Amounts Reclassified from Accumulated
Other Comprehensive Income (Loss) | | (3,224) | | | — | | | (3,224) | |
| Net Current Period Other | | | | | | |
| Comprehensive Income (Loss) | | 20,270 | | | — | | | 20,270 | |
| Ending Balance | | $ | 35,943 | | | $ | (568) | | | $ | 35,375 | |
The table below summarizes the classifications out of accumulated other comprehensive income (loss) by component for the year ended December 31, 2021:
| | | | | | | | | | | | | | |
Details about Accumulated Other Comprehensive Income (Loss) Components | | Amount Reclassified From Accumulated Other Comprehensive Income (Loss) | | Affected Line Item in the Statement Where Net Income is Presented |
| | | | |
Unrealized Gains and Losses on | | | | |
Available-for-Sale Securities | | $ | 2,247 | | | Net Gain (Loss) on Securities |
| | (472) | | | Income Tax Expense |
| | 1,775 | | | Net of Tax |
Amortization of Post Retirement Plan Items | | | | |
Actuarial Gains (Losses) | | $ | — | | | Salaries and Employee Benefits |
| | — | | | Income Tax Expense |
| | — | | | Net of Tax |
| | | | |
Total Reclassifications for the Period | | $ | 1,775 | | | |
| | |
Notes to the Consolidated Financial Statements |
Dollars in thousands, except per share data |
NOTE 19 – Other Comprehensive Income (Loss) (continued)
The table below summarizes the classifications out of accumulated other comprehensive income (loss) by component for the year ended December 31, 2020:
| | | | | | | | | | | | | | |
Details about Accumulated Other Comprehensive Income (Loss) Components | | Amount Reclassified From Accumulated Other Comprehensive Income (Loss) | | Affected Line Item in the Statement Where Net Income is Presented |
| | | | |
Unrealized Gains and Losses on | | | | |
Available-for-Sale Securities | | $ | 4,081 | | | Net Gain (Loss) on Securities |
| | (857) | | | Income Tax Expense |
| | 3,224 | | | Net of Tax |
Amortization of Post Retirement Plan Items | | | | |
Actuarial Gains (Losses) | | $ | — | | | Salaries and Employee Benefits |
| | — | | | Income Tax Expense |
| | — | | | Net of Tax |
| | | | |
Total Reclassifications for the Period | | $ | 3,224 | | | |
The table below summarizes the classifications out of accumulated other comprehensive income (loss) by component for the year ended December 31, 2019:
| | | | | | | | | | | | | | |
Details about Accumulated Other Comprehensive Income (Loss) Components | | Amount Reclassified From Accumulated Other Comprehensive Income (Loss) | | Affected Line Item in the Statement Where Net Income is Presented |
| | | | |
Unrealized Gains and Losses on | | | | |
Available-for-Sale Securities | | $ | 1,248 | | | Net Gain (Loss) on Securities |
| | (262) | | | Income Tax Expense |
| | 986 | | | Net of Tax |
Amortization of Post Retirement Plan Items | | | | |
Actuarial Gains (Losses) | | $ | (37) | | | Salaries and Employee Benefits |
| | 10 | | | Income Tax Expense |
| | (27) | | | Net of Tax |
| | | | |
Total Reclassifications for the Period | | $ | 959 | | | |
NOTE 20 - Subsequent Events
On January 1, 2022, the Company acquired Citizens Union Bancorp of Shelbyville, Inc. (“CUB”) through the merger of CUB with and into the Company. This was immediately followed by the merger of Citizens Union Bank of Shelbyville, Inc., a wholly-owned subsidiary of CUB, into the Company’s subsidiary bank, German American Bank. CUB, headquartered in Shelbyville, Kentucky, operated 15 retail banking offices located in Shelby, Jefferson, Spencer, Bullitt, Oldham, Owen, Gallatin and Hardin counties in Kentucky through Citizens Union Bank of Shelbyville, Inc. in Kentucky.
As of the closing of the transaction, CUB had total assets of approximately $1,108,546, (unaudited), total loans of approximately $683,807, (unaudited), and total deposits of approximately $930,533 (unaudited).$930,533. The acquiredCompany accounted for the transaction under the acquisition method of accounting which means these financial assets and liabilities will bewere recorded at fair value at the dateday of acquisition. The fair value of the common shares issued as part of the consideration paid for CUB was based upon the closing price of the Company’s common shares on the acquisition date.
In accordance with ASC 805, the Company has expensed approximately $12,323 of direct acquisition costs and recorded $58,596 of goodwill and $7,572 of intangible assets. The goodwill of $58,596 arising from the acquisition consisted largely of synergies and the cost savings resulting from the combining of the operations of the companies. This goodwill will be reflected inevaluated annually for impairment and is non-deductible for tax purposes. The intangible assets are related to core deposits and are being amortized over 8 years. The following table summarizes the Company’s March 31, 2022 financial statementsfair value of the total consideration transferred as such. Ata part of the timeCUB acquisition as well as the fair value of these consolidated financial statements, the Company is evaluating CUB’s loan portfolio to determine the impact of day-one accounting under the CECL methodology. Valuations and appraisals on otheridentifiable assets acquired and liabilities are also in process and are not completeassumed as of the time of these financial statements.
The Company issued approximately 2.9 million shares of its common stock, and paid approximately $50,805 in cash, in exchange for alleffective date of the issued and outstanding shares of common stock of CUB.
| | |
| Notes to the Consolidated Financial Statements |
| Dollars in thousands, except per share data |
NOTE 2018 – Subsequent EventsBusiness Combinations, Goodwill and Intangible Assets (continued)
| | | | | | | | |
| Consideration | | |
| Cash for Options and Fractional Shares | | $ | 942 | |
| Cash Consideration | | 49,863 | |
| Equity Instruments | | 111,914 | |
| | |
| Fair Value of Total Consideration Transferred | | $ | 162,719 | |
| | |
| Recognized Amounts of Identifiable Assets Acquired and Liabilities Assumed: | | |
| Cash | | $ | 20,244 | |
| Federal Funds Sold and Other Short-term Investments | | 238,325 | |
| Interest-bearing Time Deposits with Banks | | 250 | |
| Securities | | 102,233 | |
| Loans | | 678,142 | |
| Stock in FHLB of Indianapolis and Other Restricted Stock, at Cost | | 10,078 | |
| Premises, Furniture & Equipment | | 19,805 | |
| Other Real Estate | | 40 | |
| Intangible Assets | | 7,572 | |
| Company Owned Life Insurance | | 12,881 | |
| Accrued Interest Receivable and Other Assets | | 18,309 | |
| Deposits - Non-interest Bearing | | (237,472) | |
| Deposits - Interest Bearing | | (696,750) | |
| FHLB Advances and Other Borrowings | | (60,837) | |
| Accrued Interest Payable and Other Liabilities | | (8,697) | |
| | |
| Total Identifiable Net Assets | | $ | 104,123 | |
| | |
| Goodwill | | $ | 58,596 | |
Under the terms of the merger agreement, each CUB common shareholder of record at the effective time of the merger became entitled to receive a cash payment of $13.44 and a 0.7739 share of common stock of the Company for each of their former shares of CUB common stock. As a result, in connection with the closing of the merger on January 1, 2022, the Company issued 2,870,975 shares of its common stock to the former shareholders of CUB and paid cash consideration in the aggregate amount of $50.8 million.
This acquisition wasis consistent with the Company’s strategy to build a regional presence in Southern Indianacentral and western Kentucky. The acquisition offers the Company the opportunity to increase profitability by introducing existing products and services to the acquired customer base as well as add new customers in the expanded region.
The fair value of purchased financial assets with credit deterioration was $29,868 on the date of acquisition. The gross contractual amounts receivable relating to the purchased financial assets with credit deterioration was $34,453. The Company estimates, on the date of acquisition, that $3,117 of the contractual cash flows specific to the purchased financial assets with credit deterioration will not be collected.
The following table presents unaudited pro forma information as if the acquisition had occurred on January 1, 2021 after giving effect to certain adjustments. The unaudited pro forma information for the year ended December 30, 2022 and 2021 includes adjustments for interest income on loans and securities acquired, amortization of intangibles arising from the transaction, interest expense on deposits and borrowings acquired, and the related income tax effects. The unaudited pro forma financial information is not necessarily indicative of the results of operations that would have occurred had the transaction been effected on the assumed date.
| | |
| | | | | Notes to the Consolidated Financial Statements |
ConsiderationDollars in thousands, except per share data |
NOTE 18 – Business Combinations, Goodwill and Intangible Assets (continued)
| | | | | | | | | | | | | | |
| | Unaudited Pro Forma
Year Ended 12/31/2022 | | Unaudited Pro Forma
Year Ended 12/31/2021 |
| Net Interest Income | | $ | 200,584 | | | $ | 195,691 | |
| Non-interest Income | | 59,133 | | | 64,951 | |
| Total Revenue | | 259,717 | | | 260,642 | |
| Provision for Credit Losses | | 50 | | | (8,707) | |
| Non-interest Expense | | 141,868 | | | 142,978 | |
| Income Before Income Taxes | | 117,799 | | | 126,371 | |
| Income Tax Expense | | 21,858 | | | 24,260 | |
| Net Income | | $ | 95,941 | | | $ | 102,111 | |
| Earnings Per Share and Diluted Earnings Per Share | | $ | 3.26 | | | $ | 3.47 | |
For the year ended December 31, 2022, the above pro forma financial information excludes non-recurring merger costs that totaled $12,323 on a pre-tax basis and Day 1 provision for credit losses under the CECL model of $6,300 on a pre-tax basis.
Goodwill
The changes in the carrying amount of goodwill for the periods ended December 31, 2023, 2022, and 2021, were classified as follows:
| | | | | | | | | | | | | | | | | | | | |
| | | 2023 | | 2022 | | 2021 |
| | | | | | |
| Beginning of Year | | $ | 180,357 | | | $ | 121,761 | | | $ | 121,956 | |
| Acquired Goodwill | | — | | | 58,596 | | | (195) | |
| Impairment | | — | | | — | | | — | |
| End of Year | | $ | 180,357 | | | $ | 180,357 | | | $ | 121,761 | |
Of the $180,357 carrying amount of goodwill, $179,025 is allocated to the core banking segment, and $1,332 is allocated to the insurance segment for both periods ended December 31, 2023 and 2022. Of the $121,761 carrying amount of goodwill, $120,429 is allocated to the core banking segment, and $1,332 is allocated to the insurance segment for the period ended December 31, 2021. The decrease of $195 in 2021 is attributable to the sale of two branches located in Lexington, Kentucky.
Impairment exists when a reporting unit’s carrying value of goodwill exceeds its fair value. At December 31, 2023, the Company’s reporting units had positive equity, and the Company elected to perform a qualitative assessment to determine if it was more likely than not that the fair value of the reporting units exceeded its carrying value, including goodwill. The qualitative assessment indicated that it was more likely than not that the fair value of the reporting unit exceeded its carrying value, resulting in no impairment.
Acquired Intangible Assets
Acquired intangible assets were as follows as of year end:
| | | | | | | | | | | | | | |
| | 2023 |
| | | Gross Amount | | Accumulated Amortization |
| Core Banking | | | | |
| Core Deposit Intangible | | $ | 33,247 | | | $ | (27,811) | |
| Branch Acquisition Intangible | | 257 | | | (257) | |
| Insurance | | | | |
| Customer List | | 5,408 | | | (5,408) | |
| Total | | $ | 38,912 | | | $ | (33,476) | |
| | |
| Notes to the Consolidated Financial Statements |
Cash for Stock OptionsDollars in thousands, except per share data |
NOTE 18 – Business Combinations, Goodwill and Intangible Assets (continued)
| | | | | | | | | | | | | | |
| | 2022 |
| | | Gross Amount | | Accumulated Amortization |
| Core Banking | | | | |
| Core Deposit Intangible | | $ | 33,247 | | | $ | (25,001) | |
| Branch Acquisition Intangible | | 257 | | | (257) | |
| Insurance | | | | |
| Customer List | | 5,408 | | | (5,378) | |
| Total | | $ | 38,912 | | | $ | (30,636) | |
Amortization Expense was $2,840, $3,711 and $2,731, for 2023, 2022 and 2021, respectively.
Estimated amortization expense for each of the next five years is as follows:
| | | | | | | | |
| 2024 | | $ | 2,032 | |
| 2025 | | 1,394 | |
| 2026 | | 916 | |
| 2027 | | 593 | |
| 2028 | | 361 | |
NOTE 19 - Other Comprehensive Income (Loss)
The tables below summarize the changes in accumulated other comprehensive income (loss) by component for the years ended December 31, 2023 and 2022, net of tax:
| | | | | | | | | | | | | | | | | | | | |
| December 31, 2023 | | Unrealized
Gains and Losses on
Available-for-Sale
Securities | | Postretirement
Benefit Items | | Total |
| | | | | | |
| Beginning Balance | | $ | (262,924) | | | $ | (514) | | | $ | (263,438) | |
Other Comprehensive Income (Loss) Before
Reclassification | | 46,410 | | | — | | | 46,410 | |
Amounts Reclassified from Accumulated
Other Comprehensive Income (Loss) | | (32) | | | — | | | (32) | |
| Net Current Period Other | | | | | | |
| Comprehensive Income (Loss) | | 46,378 | | | — | | | 46,378 | |
| Ending Balance | | $ | (216,546) | | | $ | (514) | | | $ | (217,060) | |
| | | | | | | | | | | | | | | | | | | | |
| December 31, 2022 | | Unrealized
Gains and Losses on
Available-for-Sale
Securities | | Postretirement
Benefit Items | | Total |
| | | | | | |
| Beginning Balance | | $ | 16,052 | | | $ | (568) | | | $ | 15,484 | |
Other Comprehensive Income (Loss) Before
Reclassification | | (278,532) | | | — | | | (278,532) | |
Amounts Reclassified from Accumulated
Other Comprehensive Income (Loss) | | (444) | | | 54 | | | (390) | |
| Net Current Period Other | | | | | | |
| Comprehensive Income (Loss) | | (278,976) | | | 54 | | | (278,922) | |
| Ending Balance | | $ | (262,924) | | | $ | (514) | | | $ | (263,438) | |
| | |
| Notes to the Consolidated Financial Statements |
| Dollars in thousands, except per share data |
NOTE 19 – Other Comprehensive Income (Loss) (continued)
The table below summarizes the classifications out of accumulated other comprehensive income (loss) by component for the year ended December 31, 2023:
| | | | | | | | | | | | | | |
| Details about Accumulated Other Comprehensive Income (Loss) Components | | Amount Reclassified From Accumulated Other Comprehensive Income (Loss) | | Affected Line Item in the Statement Where Net Income is Presented |
| | | | |
Unrealized Gains and Fractional SharesLosses on | | | | |
| Available-for-Sale Securities | | $ | 94240 | | | Net Gain (Loss) on Securities |
| | (8) | | | Income Tax Expense |
| | 32 | | | Net of Tax |
Cash ConsiderationAmortization of Post Retirement Plan Items | | 49,863 | | |
Equity InstrumentsActuarial Gains (Losses) | | 111,914 | |
Fair Value of Total Consideration Transferred | | $ | 162,719— | | | Salaries and Employee Benefits |
| | — | | | Income Tax Expense |
| | — | | | Net of Tax |
| | | | |
| Total Reclassifications for the Period | | $ | 32 | | | |
The table below summarizes the classifications out of accumulated other comprehensive income (loss) by component for the year ended December 31, 2022:
| | | | | | | | | | | | | | |
| Details about Accumulated Other Comprehensive Income (Loss) Components | | Amount Reclassified From Accumulated Other Comprehensive Income (Loss) | | Affected Line Item in the Statement Where Net Income is Presented |
| | | | |
| Unrealized Gains and Losses on | | | | |
| Available-for-Sale Securities | | $ | 562 | | | Net Gain (Loss) on Securities |
| | (118) | | | Income Tax Expense |
| | 444 | | | Net of Tax |
| Amortization of Post Retirement Plan Items | | | | |
| Actuarial Gains (Losses) | | $ | — | | | Salaries and Employee Benefits |
| | — | | | Income Tax Expense |
| | — | | | Net of Tax |
| | | | |
| Total Reclassifications for the Period | | $ | 444 | | | |
The table below summarizes the classifications out of accumulated other comprehensive income (loss) by component for the year ended December 31, 2021:
| | | | | | | | | | | | | | |
| Details about Accumulated Other Comprehensive Income (Loss) Components | | Amount Reclassified From Accumulated Other Comprehensive Income (Loss) | | Affected Line Item in the Statement Where Net Income is Presented |
| | | | |
| Unrealized Gains and Losses on | | | | |
| Available-for-Sale Securities | | $ | 2,247 | | | Net Gain (Loss) on Securities |
| | (472) | | | Income Tax Expense |
| | 1,775 | | | Net of Tax |
| Amortization of Post Retirement Plan Items | | | | |
| Actuarial Gains (Losses) | | $ | — | | | Salaries and Employee Benefits |
| | — | | | Income Tax Expense |
| | — | | | Net of Tax |
| | | | |
| Total Reclassifications for the Period | | $ | 1,775 | | | |
Item 9. Changes in and Disagreements with Accountants on Accounting and Financial Disclosure.
Not Applicable.
Item 9A. Controls and Procedures.
Disclosure Controls and Procedures
As of December 31, 2021,2023, the Company carried out an evaluation, under the supervision and with the participation of its principal executive officer and principal financial officer, of the effectiveness of the design and operation of its disclosure controls and procedures. Based on this evaluation, the Company’s principal executive officer and principal financial officer concluded that the Company’s disclosure controls and procedures are effective in timely alerting them to material information required to be included in the Company’s periodic reports filed with the Securities and Exchange Commission. There are inherent limitations to the effectiveness of systems of disclosure controls and procedures, including the possibility of human error and the circumvention or overriding of the controls and procedures. Accordingly, even effective systems of disclosure controls and procedures can provide only reasonable assurances of achieving their control objectives.
Changes in Internal Control Over Financial Reporting in Most Recent Fiscal Quarter
There was no change in the Company’s internal control over financial reporting that occurred during the Company’s fourth fiscal quarter of 20212023 that has materially affected, or is reasonably likely to materially affect, the Company’s internal control over financial reporting.
Management’s Report on Internal Control Over Financial Reporting
The management of the Company is responsible for establishing and maintaining adequate internal control over financial reporting as defined in Rules 13a-15(f) and 15d-15(f) under the Securities Exchange Act of 1934. The Company’s internal control over financial reporting is designed to provide reasonable assurance regarding the reliability of financial reporting and the preparation of financial statements for external purposes in accordance with U.S. generally accepted accounting principles. The Company’s internal control over financial reporting includes those policies and procedures that: (i) pertain to the maintenance of records that, in reasonable detail, accurately and fairly reflect the transactions and dispositions of the assets of the Company; (ii) provide reasonable assurance that transactions are recorded as necessary to permit preparation of financial statements in accordance with U.S. generally accepted accounting principles, and that receipts and expenditures of the Company are being made only in accordance with authorizations of management and directors of the Company; and (iii) provide reasonable assurance regarding prevention or timely detection of unauthorized acquisition, use or disposition of the Company’s assets that could have a material effect on the financial statements.
Because of its inherent limitations, internal control over financial reporting may not prevent or detect misstatements. Also, projections of any evaluation of effectiveness to future periods are subject to the risk that controls may become inadequate because of changes in conditions, or that the degree of compliance with the policies or procedures may deteriorate. Management assessed the effectiveness of the Company’s internal control over financial reporting as of December 31, 2021.2023. In making this assessment, management used the criteria set forth by the Committee of Sponsoring Organizations of the Treadway Commission (COSO) in the 2013 Internal Control-Integrated Framework. Based on our assessment and those criteria, management concluded that the Company maintained effective internal control over financial reporting as of December 31, 2021.2023.
The Company’s independent registered public accounting firm has issued their report on the Company’s internal control over financial reporting. That report is included in Item 8. Financial Statements and Supplementary Data of this Report under the heading, Report of Independent Registered Public Accounting Firm.
Item 9B. Other Information.
(a) Information required to be disclosed in a report on Form 8-K.
None.
(b) Insider trading arrangements.
During the three months ended December 31, 2023, no director or officer of the Company adopted or terminated a “Rule 10b5-1 trading arrangement” or “non-Rule 10b5-1 trading arrangement,” as each term is defined in Item 408(a) of Regulation S-K.
Item 9C. Disclosure Regarding Foreign Jurisdictions that Prevent Inspections.
Not applicable.
PART III
Item 10. Directors, Executive Officers, and Corporate Governance.
Information responsive to this Item 10 will be included under the captions “Election of Directors,” “Our Executive Officers” andOfficers,” “Section 16(a): Beneficial Ownership Reporting Compliance”Compliance,” “Corporate Governance – Code of Business Conduct,” “Corporate Governance – Committees and Attendance,” “Corporate Governance – Director Nominations Process,” “Report of the Audit Committee,” and “Executive Compensation and Related Information – Insider Trading Policy and Anti-Hedging Provision” in the Company’s Proxy Statement for the Annual Meeting of Shareholders to be held in May 2022April 2024 which will be filed within 120 days of the end of the fiscal year covered by this Report (the “2022“2024 Proxy Statement”), which sections are incorporated herein by reference.
Item 11. Executive Compensation.
Information relating to compensation of the Company’s executive officers and directors (including the required disclosures under the subheadings “Compensation Committee Interlocks and Insider Participation” and “Compensation Committee Report”) will be included under the caption “Executive and Director Compensation” in the 20222024 Proxy Statement, which section is incorporated herein by reference.
Item 12. Security Ownership of Certain Beneficial Owners and Management and Related Stockholder Matters.
The information required under this Item 12 relating to equity compensation plans is set forth under the heading “Equity Compensation Plan Information” in Part II, Item 5 of this Report. Information relating to security ownership of certain beneficial owners and the directors and executive officers of the Company will be included under the captions “Ownership of Our Common Shares by Our Directors and Executive Officers” and “Principal Owners of Common Shares” of the 20222024 Proxy Statement, which sections are incorporated herein by reference.
Equity Compensation Plan Information
The Company maintains two equity incentive plans under which it has authorized the issuance of its Common Shares to employees and non-employee directors as compensation: its 2019 Long-Term Equity Incentive Plan (the “2019 LTI Plan”) and its 2019 Employee Stock Purchase Plan (the “2019 ESPP”). Each of these plans was approved by the requisite vote of the Company’s common shareholders in the year of adoption by the Board of Directors. The Company is not a party to any individual compensation arrangement involving the authorization for issuance of its equity securities to any single person, other than option agreements and restricted stock award agreements that have been granted under the terms of one of the three plans identified above. The following table sets forth information regarding these plans as of December 31, 2023:
| | | | | | | | | | | | | | | | | | | | | | | |
| Plan Category | | Number of Securities
to be Issued upon Exercise
of Outstanding Options, Warrants or Rights | | Weighted Average
Exercise Price of
Outstanding Options, Warrants and Rights | | Number of Securities
Remaining Available for
Future Issuance under
Equity Compensation
Plans (Excluding
Securities Reflected in First Column) | |
| | | | | | | |
| Equity compensation plans approved by security holders | | — | | (a) | $ | — | | (a) | 1,470,546 | | (b) |
| Equity compensation plans not approved by security holders | | — | | | — | | | — | | |
| Total | | — | | | $ | — | | | 1,470,546 | | |
(a)On December 31, 2023, participants under the 2019 ESPP exercised options to purchase 5,142 Common Shares at the purchase price of $32.33 per share. The Company settled the option exercises in January 2024 with shares purchased on the open market.
(b)Represents 750,000 shares at December 31, 2023 that the Company may in the future issue to employees under the 2019 ESPP (although the Company typically purchases the shares needed for sale to participating employees on the open market rather than issuing new issue shares to such employees) and 720,546 shares that were available for grant or issuance at December 31, 2023 under the 2019 LTI Plan.
For additional information regarding the Company’s equity incentive plans and employee stock purchase plan, see Note 8 (Shareholders’ Equity) of the Notes to the Consolidated Financial Statements included in Item 8 of this Report.
Item 13. Certain Relationships and Related Transactions, and Director Independence.
Information responsive to this Item 13 will be included under the captions “Election of Directors” and “Transactions with Related Persons” of the 20222024 Proxy Statement, which sections are incorporated herein by reference.
Item 14. Principal Accounting Fees and Services.
Information responsive to this Item 14 will be included in the 20222024 Proxy Statement under the caption “Principal Accountant Fees and Services”, which section is incorporated herein by reference.
PART IV
Item 15. Exhibits, Financial Statement Schedules.
(a)(1) Financial Statements
The following items are included in Item 8 of this Report:
| | | | | |
| German American Bancorp, Inc. and Subsidiaries: | Page # |
| | |
| Report of Independent Registered Public Accounting Firm PCAOB ID 173 | |
| | |
Consolidated Balance Sheets at December 31, 20212023 and 20202022 | |
| | |
Consolidated Statements of Income, years ended December 31, 2021, 20202023, 2022 and 20192021 | |
| | |
Consolidated Statements of Comprehensive Income (Loss), years ended December 31, 2021, 20202023, 2022 and 20192021 | |
| | |
Consolidated Statements of Changes in Shareholders’ Equity, years ended December 31, 2021, 20202023, 2022 and 20192021 | |
| | |
Consolidated Statements of Cash Flows, years ended December 31, 2021, 20202023, 2022 and 20192021 | |
| | |
| Notes to the Consolidated Financial Statements | |
(a)(2) Financial Statement Schedules
None.
(a)(3) Exhibits
The following exhibits are included with this report or incorporated herein by reference:
| | | | | |
| Exhibit No. | Description |
| |
| |
| |
| |
| |
| |
| |
| |
10.1* | Form of Director Deferred Compensation Agreement between The German American Bank and certain of its Directors is incorporated herein by reference from Exhibit 10.4 to the Registrant’s Registration Statement on Form S-4 filed January 21, 1993 (the Agreement entered into by former director George W. Astrike, a copy of which was filed as Exhibit 10.4 to the Registrant’s Registration Statement on Form S-4 filed January 21, 1993, is substantially identical to the Agreements entered into by the other Directors, some of whom remain directors of the Registrant). The schedule following such Exhibit 10.4 lists the Agreements with the other Directors and sets forth the material detail in which such Agreements differ from the Agreement filed as such Exhibit 10.4. |
| |
| |
| |
| |
| |
| |
| |
| |
| |
| | | | | |
10.14*Exhibit No. | |
| |
| |
| |
| |
| |
| |
| |
| |
| |
| |
| |
| |
| 101.INS+ | Inline XBRL Instance Document (The instance document does not appear in the Interactive Data File because its XBRL tags are embedded within the Inline XBRL document.) |
| 101.SCH+ | Inline XBRL Taxonomy Extension Schema Document. |
| 101.CAL+ | Inline XBRL Taxonomy Extension Calculation Linkbase Document. |
| 101.DEF+ | Inline XBRL Taxonomy Extension Definition Linkbase Document. |
| 101.LAB+ | Inline XBRL Taxonomy Extension Label Linkbase Document. |
| 101.PRE+ | Inline XBRL Taxonomy Extension Presentation Linkbase Document. |
| 104 | Cover Page Interactive Data File (formatted as Inline XBRL and contained in Exhibit 101). |
# Schedules to the subject agreement have been omitted pursuant to Item 601(b)(2) of Regulation S-K. A copy of any omitted schedule will be furnished to the Securities and Exchange Commission upon request.
* Exhibits that describe or evidence all management contracts or compensatory plans or arrangements required to be filed as exhibits to this Report are indicated by an asterisk.
+ Exhibits that are filed with this Report (other than through incorporation by reference to other disclosures or exhibits) are indicated by a plus sign.
++ Exhibits that are furnished with this Report are indicated by a double plus sign.
Note: No long-term debt instrument issued by the Registrant exceeds 10% of consolidated total assets or is registered. In accordance with paragraph 4 (iii) of Item 601(b) of Regulation S-K, to the extent not otherwise filed herewith or incorporated by reference hereby, the Registrant will furnish the Securities and Exchange Commission copies of long-term debt instruments and related agreements upon request.
In reviewing any agreements included as exhibits to this Report, please remember that they are included to provide you with information regarding their terms and are not intended to provide any other factual or disclosure information about us or the other parties to the agreements. The agreements may contain representations and warranties by the parties to the agreements, including us. These representations and warranties have been made solely for the benefit of the other parties to the applicable agreement and:
•should not in all instances be treated as categorical statements of fact, but rather as a way of allocating the risk to one of the parties if those statements prove to be inaccurate;
•may have been qualified by disclosures that were made to the other party in connection with the negotiation of the applicable agreement, which disclosures are not necessarily reflected in the agreement;
•may apply standards of materiality in a way that is different from what may be viewed as material to you or other investors; and
•were made only as of the date of the applicable agreement or such other date or dates as may be specified in the agreement and are subject to more recent developments.
Accordingly, these representations and warranties may not describe the actual state of affairs as of the date they were made or at any other time.
Item 16. Form 10-K Summary.
Not applicable.
Pursuant to the requirements of Section 13 of the Securities Exchange Act of 1934, the Registrant has duly caused this Report to be signed on its behalf by the undersigned, thereunto duly authorized.
| | | | | | | | |
| | | GERMAN AMERICAN BANCORP, INC. |
| | | (Registrant) |
| | | |
| Date: | March 1, 2022February 27, 2024 | By: /s/D. Neil Dauby |
| | | D. Neil Dauby, PresidentChairman and Chief Executive Officer |
Pursuant to the requirements of the Securities Exchange Act of 1934, this Report has been signed below by the following persons on behalf of the Registrant and in the capacities and on the dates indicated.
| | | | | | | | |
| Date: | March 1, 2022 | /s/Mark A. Schroeder |
| | Mark A. Schroeder, Executive Chairman |
| | |
Date: | March 1, 2022February 27, 2024 | /s/D. Neil Dauby |
| | D. Neil Dauby, Director, PresidentChairman and Chief Executive Officer (principal executive officer) |
| | |
| Date: | March 1, 2022February 27, 2024 | /s/Zachary W. Bawel |
| | | Zachary W. Bawel, Director |
| | |
| Date: | February 27, 2024 | /s/Angela Curry |
| | Angela Curry, Director |
| | | |
| Date: | March 1, 2022February 27, 2024 | /s/Sue J. EllspermanEllspermann |
| | Sue J. Ellsperman,Ellspermann, Director |
| | |
| Date: | March 1, 2022February 27, 2024 | /s/Marc D. Fine |
| | | Marc D. Fine, Director |
| | | |
| Date: | March 1, 2022February 27, 2024 | /s/Jason M. Kelly |
| | | Jason M. Kelly, Director |
| | |
| Date: | March 1, 2022February 27, 2024 | /s/J. David LettDiane B. Medley |
| | | J. David Lett,Diane B. Medley, Director |
| | |
| Date: | March 1, 2022 | /s/Chris A. Ramsey |
| | Chris A. Ramsey, Director |
| | |
Date: | March 1, 2022February 27, 2024 | /s/M. Darren Root |
| | | M. Darren Root, Director |
| | |
| Date: | March 1, 2022February 27, 2024 | /s/Christina M. Ryan |
| | | Christina M. Ryan, Director |
| | | |
| Date: | March 1, 2022February 27, 2024 | /s/Thomas W. Seger |
| | | Thomas W. Seger, Director |
| | | |
| Date: | March 1, 2022February 27, 2024 | /s/Jack W. Sheidler |
| | | Jack W. Sheidler, Director |
| | | |
| Date: | March 1, 2022February 27, 2024 | /s/Tyson J. Wagler |
| | | Tyson J. Wagler, Director |
| | | |
| Date: | March 1, 2022February 27, 2024 | /s/Bradley M. Rust |
| | | Bradley M. Rust, Senior Executive Vice President Chief Operating Officer and Chief Financial Officer (principal financial officer) |
| | |
| Date: | March 1, 2022February 27, 2024 | /s/Vicki L. Schuler |
| | Vicki L. Schuler, Senior Vice President, Controller (principal accounting officer) |