SECURITIES AND EXCHANGE COMMISSION
WASHINGTON, D.C. 20549
FORM 10‑K
ANNUAL REPORT PURSUANT TO SECTION 13 or 15(d) of the
Securities Exchange Act of 1934
For the fiscal year ended December 31, 2018
Commission file number 0-11487
Indiana | 35-1559596 |
(State of incorporation) | (I.R.S. Employer Identification No.) |
202 East Center Street, P.O. Box 1387, Warsaw, Indiana 46581‑46581-1387
(Address of principal executive offices)
Telephone: (574) 267-6144
Securities registered pursuant to Section 12(b) of the Act:
| ||
Common Stock, no par value | LKFN | The Nasdaq |
(Title of class) | (Trading symbol) | (Name of each exchange on which registered) |
Indicate by check mark if the registrant is a well-known seasoned issuer, as defined in Rule 405 of the Securities Act. Yes X
No__Indicate by check mark if the registrant is not required to file reports pursuant to Section 13 or Section 15(d) of the Exchange Act. Yes __No X
Indicate by check mark whether the registrant (1) has filed all reports required to be filed by Section 13 or 15(d) of the Securities Exchange Act of 1934 during the preceding twelve months (or for such other period that the registrant was required to file such reports), and (2) has been subject to such filing requirements for the past 90 days. Yes X
No __Indicate by check mark whether the registrant has submitted electronically and posted on its corporate Web site, if any, every Interactive Data File required to be submitted and posted pursuant to Rule 405 of Regulation S-T during the preceding 12 months (or for such shorter period that the registrant was required to submit and post such files). Yes X
No __Indicate by check mark whether the registrant is a large accelerated filer, an accelerated filer, a non-accelerated filer, a smaller reporting company, or an emerging growth company. See the definitions of “large accelerated filer”, “accelerated filer”, “smaller reporting company”, and “emerging growth company” in Rule 12b-2 of the Exchange Act.
| | | | | ||||||
Large accelerated filer [X] | | Accelerated filer [ ] | | Non-accelerated filer* [ ] | | Smaller reporting company | ☐ | | Emerging growth company | ☐ |
*Do not check if a smaller reporting company
If an emerging growth company, indicate by check mark if the registrant has elected not to use the extended transition period for complying with any new or revised financial accounting standards provided pursuant to Section 13(a) of the Exchange Act. [ ]
Indicate by check mark whether the registrant is a shell company (as defined in Rule 12b-2 of the Act) Yes __☐ No X
The aggregate market value of the voting and non-voting common equity held by non-affiliates of the registrant, based on the last sales price quoted on the Nasdaq Global Select Market on June 30, 2018,2019, the last business day of the registrant’s most recently completed second fiscal quarter, was approximately $1,158,232,579.
Number of shares of common stock outstanding at February 19, 2019: 25,614,046
DOCUMENTS INCORPORATED BY REFERENCE
Part III - Portions of the Proxy Statement for the Annual Meeting of Stockholders to be held on April 9, 201914, 2020 are incorporated by reference into Part III hereof.
Annual Report on Form 10-K
Page Number | ||
PART I | ||
PART II | ||
| . | ||
PART III | ||
PART IV | ||
PART I
The Company
Lakeland Financial Corporation (“Lakeland Financial”), an Indiana corporation incorporated in 1983, is a bank holding company headquartered in Warsaw, Indiana that provides, through its wholly-owned subsidiary Lake City Bank (the “Bank” and together with Lakeland Financial, the “Company”), a broad array of products and services throughout its northernNorthern and centralCentral Indiana markets. The Company offers commercial and consumer banking services, as well as trust and wealth management, brokerage, and treasury management commercial services. The Company serves a wide variety of industries including, among others, commercial real estate, manufacturing, agriculture, construction, retail, wholesale, finance and insurance, accommodation and food services and health care. The Company’s customer base is similarly diverse. The Company is not dependent upon any single industry or customer. At December 31, 2018,2019, Lakeland Financial had consolidated total assets of $4.9 billion and was the fourthsixth largest independent bank holding company headquartered in the State of Indiana.
Company’s Business
. Lakeland Financial is a bank holding company as defined in the Bank Holding Company Act of 1956, as amended. Lakeland Financial owns all of the outstanding stock of the Bank, a full-service commercial bank organized under Indiana law. Lakeland Financial conducts no business except that which is incident to its ownership of the outstanding stock of the Bank and the operation of the Bank. Although Lakeland Financial is a corporate entity, legally separate and distinct from its affiliates, bank holding companies such as Lakeland Financial are required to act as a source of financial strength for their subsidiary banks. The principal source of Lakeland Financial’s income is dividends from the Bank. There are certain regulatory restrictions on the extent to which subsidiary banks can pay dividends or otherwise supply funds to their holding companies. See the section captioned “Supervision and Regulation” below for further discussion of these matters. Lakeland Financial’s executive offices are located at 202 East Center Street, Warsaw, IndianaBank’s Business.
The Bank was originally organized in 1872 and has continuously operated under the laws of the State of Indiana since its organization. As of December 31,We operate branch offices in four geographical markets concentrated in northern Indiana and we have six full service offices in central Indiana in the Indianapolis market. We have divided our northern Indiana markets into three distinct regions, the North Region, the South Region and the East Region. Our most mature market, the South Region, includes Kosciusko County and several contiguous counties. Warsaw is this region's primary city. The Bank entered the North Region in 1990, which includes portions of Elkhart and St. Joseph counties. This region includes the cities of Elkhart, Goshen and South Bend. The North Region represents relatively olderour oldest and most established markets, for us withwhere we’ve had nearly 2530 years of business activity. We entered the East Region in 1999, which includes Allen and DeKalb counties. Fort Wayne represents the primary city in this market. We have experienced rapid commercial loan growth in this market over the past 1520 years. We entered the Indianapolis market in 2006 with the opening of a loan production office in Hamilton County andCounty. We then opened a full service retail and commercial branch in late 2011. The Bank currently operates six branches in the Indianapolis footprint.
The Bank’s business strategy is focused on building long-term relationships with its customers based on top quality service, high ethical standards and safe and sound lending. The Bank operates as a community-based financial services organization augmented by experienced, centralized support in select critical areas. The Bank’s local market orientation is reflected in its regional management, which divides the Bank’s market area into five distinct geographic regions, each headed by a retail and commercial regional manager. This arrangement allows decision making to be as close to the customer as possible and enhances responsiveness to local banking needs. Despite this local-market, community-based focus, the Bank offers many of the products and services available at much larger regional and national competitors. While our strategy encompasses all phases of traditional community banking, including consumer lending and wealth advisory and trust services, we focus on building expansive commercial relationships and developing retail and commercial deposit gathering strategies through relationship-based client services. Substantially all of the Bank’s assets and income are located in and derived from the United States.
3
At December 31, 2018,2019, the Company had 553568 full-time equivalent employees. The Company is not a party to any collective bargaining agreements, and employee relations are considered good.
Operating Segment.
While the Company has assigned certain management responsibilities by region and business-line, the Company’s chief decision-makers monitor and evaluate financial performance on a Company-wide basis. The majority of the Company’s revenue is from the business of banking and the Company’s assigned regions have similar economic characteristics,Expansion Strategy.
Since 1990, the Company has expanded from 17 offices in four Indiana counties to 50 offices in fifteen Indiana counties primarily through de novo branching. During this period, the Company has grown its assets from $286 million to $4.9 billion, a compound annual growth rate ofOver the past fifteentwenty years, the Company has primarily targeted growth in the larger cities located in northernNorthern Indiana and the Indianapolis market in centralCentral Indiana. The Company believes these areas offer above average growth potential with attractive demographics and potential for commercial lending and deposit gathering opportunities. The Company considers expanding into a market when the Company believes that market would be receptive to its strategic plan to deliver broad-based financial services with a commitment to local communities. When entering new markets, the Company believes it is critical to attract experienced local management and staff with a similar philosophy in order to provide a basis for success.
Competition.
The financial services industry is highly competitive. Competition is based on a number of factors including, among others, customer service, quality and range of products and services offered, price, reputation, interest rates on loans and deposits, lending limits and customer convenience. Our competitors include national, regional andForward-looking Statements
This document (including information incorporated by reference) contains, and future oral and written statements of the Company and its management may contain, forward-looking statements, within the meaning of such term in the federal securities law. Forward-looking statements are not historical facts and are generally identifiable by the use of words such as “believe,” “expect,” “anticipate,” “project,” “possible,” “continue,” “plan,” “intend,” “estimate,” “may,” “will,” “would,” “could,” “should” or other similar expressions. Additionally, all statements in this document, including forward-looking statements, speak only as of the date they are made, and the Company undertakes no obligation to update any statement in light of new information or future events.
The Company’s ability to predict results or the actual effect of future plans or strategies is inherently uncertain and, accordingly, the reader is cautioned not to place undue reliance on any forward-looking statement made by the Company. Actual results could differ materially from those addressed in the forward-looking statements as a result of numerous factors, including, without limitation:
| the effects of future economic, business and market conditions and changes, both domestic and foreign; |
| governmental monetary and fiscal policies; |
| the timing and scope of any legislative and regulatory changes, including changes in banking, securities and tax laws and regulations and their application by our regulators; |
| the risks of changes in interest rates on the levels, composition and costs of deposits, loan demand, and the values and liquidity of loan collateral, securities and other interest sensitive assets and liabilities; |
4
| the phase out of LIBOR by the end of 2021 and establishing a new reference rate |
| ● | changes in borrowers’ credit risks and payment behaviors; |
| changes in the availability and cost of credit and capital in the financial markets; |
| the effects of disruption and volatility in capital markets on the value of our investment portfolio; |
| cyber-security risks and or cyber-security damage that could result from attacks on the Company’s or third-party service providers networks or data of the Company; |
| changes in the prices, values and sales volumes of residential and commercial real estate; |
| the effects of competition from a wide variety of local, regional, national and other providers of financial, investment and insurance services; |
| changes in technology or products that may be more difficult or costly, or less effective than anticipated; |
| the effects of war or other conflicts, acts of terrorism or other catastrophic events, including storms, droughts, tornados and flooding, that may affect general economic conditions, including agricultural production and demand and prices for agricultural goods and land used for agricultural purposes, generally and in our markets; |
| the risk of trade policy and tariffs could impact loan demand from the manufacturing sector |
| ● | the failure of assumptions and estimates used in our reviews of our loan portfolio, underlying the establishment of reserves for possible loan losses, our analysis of our capital position and other estimates; |
| changes in the scope and cost of FDIC insurance, the state of Indiana’s Public Deposit Insurance Fund and other coverages; |
| the effects of the Tax Cuts and Jobs Act, including any effects on the housing market, and on the demand for home equity loans and other loan products that we offer; |
| changes in accounting policies, rules and practices; |
| the risks of mergers, acquisitions and divestitures, including, without limitation, the related time and costs of implementing such transactions, integrating operations as part of these transactions and possible failures to achieve expected gains, revenue growth and/or expense savings from such transactions; and |
| ● | the risks noted in the Risk Factors discussed under Item 1A of Part 1 of this Annual Report on Form 10-K, as well as other risks and uncertainties set forth from time to time in the Company’s other filings with the Securities and Exchange Commission (the “SEC”). |
These risks and uncertainties should be considered in evaluating forward-looking statements and undue reliance should not be placed on such statements.
Internet Website
The Company maintains an internet site at www.lakecitybank.com. The Company makes available free of charge in the Investor Relations section on this site, its annual reportAnnual Report on Form 10-K, quarterly reportsQuarterly Reports on Form 10-Q, current reports on Form 8-K and other statements and reports filed or furnished pursuant to Section 13(a) or 15(d) of the Securities Exchange Act of
5
1934, as amended (the “Exchange Act”), as soon as reasonably practicable after it electronically files such material with, or furnishes it to, the SEC. All such documents filed with the SEC are also available for free on the SEC’s website (www.sec.gov)(www.sec.gov). The Company’s Articles of Incorporation, Bylaws, Code of Conduct and the charters of its various committees of the Company’s board of directors are also available on the website.
SUPERVISION AND REGULATION
General
FDIC-insured institutions, like the Bank, their holding companies and their affiliates are extensively regulated under federal and state law. As a result, our growth and earnings performance may be affected not only by management decisions and general economic conditions, but also by the requirements of federal and state statutes and by the regulations and policies of various bank regulatory agencies, including the Indiana Department of Financial Institutions (the “DFI”), the Board of Governors of the Federal Reserve System (the “Federal Reserve”), the FDIC and the Consumer Financial Protection Bureau (the “CFPB”). Furthermore, taxation laws administered by the Internal Revenue Service and state taxing authorities, accounting rules developed by the Financial Accounting Standards Board (the “FASB”), securities laws administered by the Securities and Exchange Commission (“SEC”)SEC and state securities authorities, and anti-money laundering laws enforced by the U.S. Department of the Treasury (“Treasury”) have an impact on our business. The effect of these statutes, regulations, regulatory policies and accounting rules are significant to our operations and results.
Federal and state banking laws impose a comprehensive system of supervision, regulation and enforcement on the operations of FDIC-insured institutions, their holding companies and affiliates that is intended primarily for the protection of the FDIC-insured deposits and depositors of banks, rather than shareholders. These laws, and the regulations of the bank regulatory agencies issued under them, affect, among other things, the scope of the Company’s business, the kinds and amounts of investments we may make, reserve requirements, required capital levels relative to the Company’s assets, the nature and amount of collateral for loans, the establishment of branches, the Company’s ability to merge, consolidate and acquire, dealings with the Company’s insiders and affiliates and the Company’s payment of dividends. In reaction to the global financial crisis and particularly following passage of the Dodd-Frank Wall Street Reform and Consumer Protection Act of 2010 (the “Dodd-Frank Act”), we experienced heightened regulatory requirements and scrutiny. Although the reforms primarily targeted systemically important financial service providers, their influence filtered down in varying degrees to community banks over time and caused the Company’s compliance and risk management processes, and the costs thereof, to increase. After the 2016 federal elections, momentum to decrease the regulatory burden on community banks gathered strength. InHowever, in May 2018, the Economic Growth, Regulatory Relief and Consumer Protection Act (the “Regulatory(“Regulatory Relief Act”) was enacted by Congress in part to modify or remove certain financial reform rules and regulations. While the Regulatory Relief Act maintains most of the regulatory structure established by the Dodd-Frank Act, it amends certain aspects of the regulatory framework for small depository institutions with assets of less than $10 billion, like us, and for large banks with assets of more than $50 billion. Many of these changes are intended to result in meaningfulprovide regulatory relief for community banks and their holding companies, including new rulescompanies. To that may make our capital requirements less complex. For a discussion of capital requirements, see
The supervisory framework for U.S. banking organizations subjects banks and bank holding companies to regular examination by their respective regulatory agencies, which results in examination reports and ratings that are not publicly available and that can impact the conduct and growth of their business. These examinations consider not only compliance with applicable laws and regulations, but also capital levels, asset quality and risk, management ability and performance, earnings, liquidity, and various other factors. The regulatory agencies generally have broad discretion to impose restrictions and limitations on the operations of a regulated entity where the agencies determine, among other things, that such operations are unsafe or unsound, fail to comply with applicable law or are otherwise inconsistent with laws and regulations or with the supervisory policies of these agencies.
The following is a summary of the material elements of the supervisory and regulatory framework applicable to the Company and the Bank, beginning with a discussion of the continuing regulatory emphasis on the Company’s capital levels. It does not describe all of the statutes, regulations and regulatory policies that apply, nor does it restate all of the requirements of those that are described. The descriptions are qualified in their entirety by reference to the particular statutory and regulatory provision.
The Role of Capital
Regulatory capital represents the net assets of a banking organization available to absorb losses. Because of the risks attendant to their business, FDIC-insured institutions are generally required to hold more capital than other businesses, which directly affects the Company’s earnings capabilities. While capital has historically been one of the key measures of the financial health of both
6
bank holding companies and banks, its role became fundamentally more important in the wake of the global financial crisis, as the banking regulators recognized that the amount and quality of capital held by banks prior to the crisis was insufficient to absorb losses during periods of severe stress. Certain provisions of the Dodd-Frank Act and Basel III, discussed below, establish strengthened capital standards for banks and bank holding companies that are meaningfully more stringent than those in place previously.
Minimum Required Capital Levels.
Banks have been required to hold minimum levels of capital based on guidelines established by the bank regulatory agencies since 1983. The minimums have been expressed in terms of ratios of capital divided by total assets. As discussed below, bank capital measures have become more sophisticated over the years and have focused more on the quality of capital and the risk of assets. Bank holding companies have historically had to comply with less stringent capital standards than their bank subsidiaries and have been able to raise capital with hybrid instruments such as trust preferred securities. The Dodd-Frank Act mandated the Federal Reserve to establish minimum capital levels for holding companies on a consolidated basis as stringent as those required for FDIC-insured institutions.The Basel International Capital Accords.
The risk-based capital guidelines for U.S. banks since 1989 were based upon the 1988 capital accord known as “Basel I” adopted by the international Basel Committee on Banking Supervision, a committee of central banks and bank supervisors that acts as the primary global standard-setter for prudential regulation, as implemented by the U.S. bank regulatory agencies on an interagency basis. The accord recognized that bank assets for the purpose of the capital ratio calculations needed to be assigned risk weights (the theory being that riskier assets should require more capital) and that off-balance sheet exposures needed to be factored in the calculations. Basel I had a very simple formula for assigning risk weights to bank assets from 0% to 100% based on four categories. In 2008, the banking agencies collaboratively began to phase-in capital standards based on a second capital accord, referred to as “Basel II,” for large or “core” international banks (generally defined for U.S. purposes as having total assets of $250 billion or more, or consolidated foreign exposures of $10 billion or more) known as “advanced approaches” banks. The primary focus of Basel II was on the calculation of risk weights based on complex models developed by each advanced approaches bank. Because most banks were not subject to Basel II, the U.S. bank regulators worked to improve the risk sensitivity of Basel I standards without imposing the complexities of Basel II. This “standardized approach” increased the number of risk weight categories and recognized risks well above the original 100% risk weight. It is institutionalized by the Dodd-Frank Act for all banking organizations, even for the advanced approaches banks, as a floor.On September 12, 2010, the Group of Governors and Heads of Supervision, the oversight body of the Basel Committee on Banking Supervision, announced agreement on a strengthened set of capital requirements for banking organizations around the world, known as Basel III, to address deficiencies recognized in connection with the global financial crisis.
The Basel III Rule
. In July 2013, the U.S. federal banking agencies approved the implementation of the Basel III regulatory capital reforms in pertinent part, and, at the same time, promulgated rules effecting certain changes required by the Dodd-Frank Act (the “Basel III Rule”). In contrast to capital requirements historically, which were in the form of guidelines, Basel III was released in the form of enforceable regulations by each of the regulatory agencies. The Basel III Rule is applicable to all banking organizations that are subject to minimum capital requirements, including federal and state banks and savings and loan associations, as well as toThe Basel III Rule increased the required quantity and quality of capital, and for nearly every class of assets, it requires a more complex, detailed and calibrated assessment of credit risk and calculation of risk weight amounts.
Not only did the Basel III Rule increase most of the required minimum capital ratios in effect prior to January 1, 2015, but it introduced the concept of Common Equity Tier 1 Capital, which consists primarily of common stock, related surplus (net of Treasury stock), retained earnings, and Common Equity Tier 1 minority interests subject to certain regulatory adjustments. The Basel III Rule also changed the definition of capital by establishing more stringent criteria that instruments must meet to be considered Additional Tier 1 Capital (primarily non-cumulative perpetual preferred stock that meets certain requirements) and Tier 2 Capital (primarily other types of preferred stock and subordinated debt, subject to limitations). A number of instruments that qualified as Tier 1 Capital under Basel I do not qualify, or their qualifications changed. For example, noncumulative perpetual preferred stock, which qualified as simple Tier 1 Capital under Basel I, does not qualify as Common Equity Tier 1 Capital, but qualifies as Additional Tier 1 Capital. The Basel III Rule also constrained the inclusion of minority interests, mortgage-servicing assets, and deferred tax assets in
7
capital and requires deductions from Common Equity Tier 1 Capital in the event that such assets exceed a certain percentage of a banking institution’s Common Equity Tier 1 Capital.
The Basel III Rule required requires minimum capital ratios, as of January 1, 2015, as follows:
| ● | A ratio of minimum Common Equity Tier 1 Capital equal to 4.5% of risk-weighted assets; |
| ● | An increase in the minimum required amount of Tier 1 Capital from 4% to 6% of risk-weighted assets; |
| ● | A continuation of the minimum required amount of Total Capital (Tier 1 plus Tier 2) at 8% of risk-weighted assets; and |
| ● | A minimum leverage ratio of Tier 1 Capital to total quarterly average assets equal to 4% in all circumstances. |
In addition, institutions that seek the freedom to make capital distributions (including for dividends and repurchases of stock) and pay discretionary bonuses to executive officers without restriction must also maintain 2.5% in Common Equity Tier 1 Capital attributable to a capital conservation buffer (fully phased-in as of January 1, 2019).buffer. The purpose of the conservation buffer is to ensure that banking institutions maintain a buffer of capital that can be used to absorb losses during periods of financial and economic stress. Factoring in the fully phased-in conservation buffer increases the minimum ratios depicted above to 7% for Common Equity Tier 1 Capital; 8.5% for Tier 1 Capital; and 10.5% for Total Capital.
Well-Capitalized Requirements
. The ratios described above are minimum standards in order for banking organizations to be considered “adequately capitalized.” Bank regulatory agencies uniformly encourage banks to hold more capital and be “well-capitalized” and, to that end, federal law and regulations provide various incentives for banking organizations to maintain regulatory capital at levels in excess of minimum regulatory requirements. For example, a banking organization that is well-capitalized may: (i) qualify for exemptions from prior notice or application requirements otherwise applicable to certain types of activities; (ii) qualify for expedited processing of other required notices or applications; and (iii) accept, roll-over or renew brokered deposits. Higher capital levels could also be required if warranted by the particular circumstances or risk profiles of individual banking organizations. For example, the Federal Reserve’s capital guidelines contemplate that additional capital may be required to take adequate account of, among other things, interest rate risk, or the risks posed by concentrations of credit, nontraditional activities or securities trading activities. Further, any banking organization experiencing or anticipating significant growth would be expected to maintain capital ratios, including tangible capital positions (i.e., Tier 1 Capital less all intangible assets), well above the minimum levels.Under the capital regulations of the Federal Reserve, in order to be well‑capitalized,well-capitalized, a banking organization must maintain:
| ● | A Common Equity Tier 1 Capital ratio to risk-weighted assets of 6.5% or more; |
| ● | A ratio of Tier 1 Capital to total risk-weighted assets of 8% or |
| ● | A ratio of Total Capital to total risk-weighted assets of 10% or |
| ● | A leverage ratio of Tier 1 Capital to total adjusted average quarterly assets of 5% or greater. |
It is possible under the Basel III Rule to be well-capitalized while remaining out of compliance with the capital conservation buffer discussed above.
As of December 31, 2018:2019: (i) the Bank was not subject to a directive from the FDIC to increase its capital and (ii) the Bank was well-capitalized, as defined by Federal Reserve regulations. As of December 31, 2018,2019, the Company had regulatory capital in excess of the Federal Reserve’s requirements and met the Basel III Rule requirements to be well-capitalized.
Prompt Corrective Action
. The concept of an institution being “well-capitalized” is part of a regulatory enforcement regime that provides the federal banking regulators with broad power to take “prompt corrective action” to resolve the problems of institutions based on the capital level of each particular institution. The extent of the regulators’ powers depends on whether the8
institution in question is “adequately capitalized,” “undercapitalized,” “significantly undercapitalized” or “critically undercapitalized,”
Community Bank Capital Simplification
. Community banks have long raised concerns with bank regulators about the regulatory burden, complexity, and costs associated with certain provisions of the Basel III Rule. In response, Congress providedRegulation and Supervision of the Company
General.
The Company, as the sole shareholder of the Bank, is a bank holding company. As a bank holding company, we are registered with, and subject to regulation by, the Federal Reserve under the Bank Holding Company Act of 1956, as amended (“BHCA”). We are legally obligated to act as a source of financial and managerial strength to the Bank and to commit resources to support the Bank in circumstances where we might not otherwise do so. Under the BHCA, we are subject to periodic examination by the Federal Reserve and are required to file with the Federal Reserve periodic reports of the Company’s operations and such additional information regarding us and the Bank as the Federal Reserve may require.Acquisitions and Activities
. The primary purpose of a bank holding company is to control and manage banks.The BHCA generally requires the prior approval of the Federal Reserve for any merger involving a bank holding company or any acquisition by a bank holding company of another bank or bank holding company. Subject to certain conditions (including deposit concentration limits established by the BHCA), the Federal Reserve may allow a bank holding company to acquire banks located in any state of the United States. In approving interstate acquisitions, the Federal Reserve is required to give effect to applicable state law limitations on the aggregate amount of deposits that may be held by the acquiring bank holding company and its FDIC-insured institution affiliates in the state in which the target bank is located (provided that those limits do not discriminate against out-of-state institutions or their holding companies) and state laws that require that the target bank have been in existence for a minimum period of time (not to exceed five years) before being acquired by an out-of-state bank holding company. Furthermore, in accordance with the Dodd-Frank Act, bank holding companies must be well-capitalized and well-managed in order to effect interstate mergers or acquisitions. For a discussion of the capital requirements, seeThe BHCA generally prohibits the Company from acquiring direct or indirect ownership or control of more than 5% of the voting shares of any company that is not a bank and from engaging in any business other than that of banking, managing and controlling banks or furnishing services to banks and their subsidiaries. This general prohibition is subject to a number of exceptions. The principal exception allows bank holding companies to engage in, and to own shares of companies engaged in, certain businesses found by the Federal Reserve prior to November 11, 1999 to be “so closely related to banking ... as to be a proper incident thereto.” This authority permits us to engage in a variety of banking-related businesses, including the ownership and operation of a savings association, or any entity engaged in consumer finance, equipment leasing, the operation of a computer service bureau (including software development) and mortgage banking and brokerage services. The BHCA does not place territorial restrictions on the domestic activities of nonbank subsidiaries of bank holding companies.
Additionally, bank holding companies that meet certain eligibility requirements prescribed by the BHCA and elect to operate as financial holding companies may engage in, or own shares in companies engaged in, a wider range of nonbanking activities, including securities and insurance underwriting and sales, merchant banking and any other activity that the Federal Reserve, in consultation with the Secretary of the Treasury, determines by regulation or order is financial in nature or incidental to any such financial activity or that the Federal Reserve determines by order to be complementary to any such financial activity and does not pose
9
a substantial risk to the safety or soundness of FDIC-insured institutions or the financial system generally. The Company elected to, and continues to operate as, a financial holding company. In order to maintain status as a financial holding company, both the bank holding company and its subsidiary bank must be well-capitalized, well-managed, and have at least a satisfactory Community Reinvestment Act (“CRA”) rating. If the Federal Reserve determines that we are not well-capitalized or well-managed, we will have a period of time in which to achieve compliance, but during the period of noncompliance, the Federal Reserve may place any limitations on us it believes to be appropriate. Furthermore, if the Federal Reserve determines that the Bank has not received a satisfactory CRA
Change in Control
. Federal law prohibits any person or company from acquiring “control” of an FDIC-insured depository institution or its holding company without prior notice to the appropriate federal bank regulator. “Control” is conclusively presumed to exist upon the acquisition of 25% or more of the outstanding voting securities of a bank or bank holding company, but may arise under certain circumstances between 10% and 24.99% ownership.Capital Requirements.
As a bank holding company, we are required to maintain capital in accordance with Federal Reserve capital adequacy requirements. For a discussion of capital requirements, seeDividend Payments.
TheAs a general matter, the Federal Reserve has indicated that the board of directors of a bank holding company should eliminate, defer or significantly reduce dividends to shareholders if: (i) the company’s net income available to shareholders for the past four quarters, net of dividends previously paid during that period, is not sufficient to fully fund the dividends; (ii) the prospective rate of earnings retention is inconsistent with the company’s capital needs and overall current and prospective financial condition; or (iii) the company will not meet, or is in danger of not meeting, its minimum regulatory capital adequacy ratios. The Federal Reserve also possesses enforcement powers over bank holding companies and their nonbank subsidiaries to prevent or remedy actions that represent unsafe or unsound practices or violations of applicable statutes and regulations. Among these powers is the ability to proscribe the payment of dividends by banks and bank holding companies.
Monetary Policy.
The monetary policy of the Federal Reserve has a significant effect on the operating results of financial or bank holding companies and their subsidiaries. Among the tools available to the Federal Reserve to affect the money supply are open market transactions in U.S. government securities, changes in the discount rate on bank borrowings and changes in reserve requirements against bank deposits. These means are used in varying combinations to influence overall growth and distribution of bank loans, investments and deposits, and their use may affect interest rates charged on loans or paid on deposits.Federal Securities Regulation.
The Company’s common stock is registered with the SEC under the Securities Act of 1933, as amended, and the Exchange Act. Consequently, we are subject to the information, proxy solicitation, insider trading and other restrictions and requirements of the SEC under the Exchange Act.Corporate Governance
. The Dodd-Frank Act addressed many investor protection, corporate governance and executive compensation matters that will affect most U.S. publicly traded companies.10
Regulation and Supervision of the Bank
General.
The Bank is an Indiana-chartered bank. The deposit accounts of the Bank are insured by theDeposit Insurance
. As an FDIC-insured institution, the Bank is required to pay deposit insurance premium assessments to the FDIC. The FDIC has adopted a risk-based assessment system whereby FDIC-insured institutions pay insurance premiums at rates based on their risk classification. For institutions like the Bank that are not considered large and highly complex banking organizations, assessments are now based on examination ratings and financial ratios. The total base assessment rates currently range from 1.5 basis points to 30 basis points. At least semi-annually, the FDIC updates its loss and income projections for the DIF and, if needed, increases or decreases the assessment rates, following notice and comment on proposed rulemaking. The assessment base against which an FDIC-insured institution’s deposit insurance premiums paid to the DIF have been calculated since effectiveness of the Dodd-Frank Act based on its average consolidated total assets less its average tangible equity. This method shifted the burden of deposit insurance premiums toward those large depository institutions that rely on funding the resources other than U.S. deposits.The reserve ratio is the FDIC insurance fund balance divided by estimated insured deposits. The Dodd-Frank Act altered the minimum reserve ratio of the DIF, increasing the minimum from 1.15% to 1.35% of the estimated amount of total insured deposits,
Supervisory Assessments
. All Indiana banks are required to pay supervisory assessments to the DFI to fund the operations of that agency. The amount of the assessment is calculated on the basis of the Bank’s total assets. During the year ended December 31,Capital Requirements.
Banks are generally required to maintain capital levels in excess of other businesses. For a discussion of capital requirements, seeLiquidity Requirements.
Liquidity is a measure of the ability and ease with which bank assets may be converted to cash. Liquid assets are those that can be converted to cash quickly if needed to meet financial obligations. To remain viable, FDIC-insured institutions must have enough liquid assets to meet their near-term obligations, such as withdrawals by depositors. Because the global financial crisis was in part a liquidity crisis, Basel III also includes a liquidity framework that requires FDIC-insured institutions to measure their liquidity against specific liquidity tests.One test, referred to asthe Liquidity Coverage Ratio, is designed to ensure that the banking entity has an adequate stock of unencumbered high-quality liquid assets that can be converted easily and immediately in private markets into cash to meet liquidity needs for a 30-calendar day liquidity stress scenario. The other test, known as the Net Stable Funding Ratio, is designed to promote more medium- and long-term funding of the assets and activities of FDIC-insured institutions over a one-year horizon. These tests provide an incentive for banks and holding companies to increase their holdings in Treasury securities and other sovereign debt as a component of assets, increase the use of long-term debt as a funding source and rely on stable funding like core deposits (in lieu of brokered deposits). While these rules do not, and will not, apply to the Bank, we continue to review our liquidity risk management policies in light of developments.Dividend Payments.
The primary source of funds for the Company is dividends from the Bank. Indiana law prohibits the Bank from paying dividends in an amount greater than its undivided profits. The Bank is required to obtain the approval of the DFI for the payment of any dividend if the total of all dividends declared by the Bank during the calendar year, including the proposed dividend, would exceed the sum of the11
two years. Indiana law defines "retained net income" to mean the net income of a specified period, calculated under the consolidated report of income instructions, less the total amount of all dividends declared for the specified period. The Federal Reserve Act also imposes limitations on the amount of dividends that may be paid by state member banks, such as the Bank. Without Federal Reserve approval, a state member bank may not pay dividends in any calendar year that, in the aggregate, exceed that bank'sbank’s calendar year-to-date net income plus the bank'sbank’s retained net income for the two preceding calendar years. Moreover, the payment of dividends by any FDIC-insured institution is affected by the requirement to maintain adequate capital pursuant to applicable capital adequacy guidelines and regulations, and an FDIC-insured institution generally is prohibited from paying any dividends if, following payment thereof, the institution would be undercapitalized. As described above, the Bank exceeded its capital requirements under applicable guidelines as of December 31, 2018.2019. Notwithstanding the availability of funds for dividends, however, the Federal Reserve and the DFI may prohibit the payment of dividends by the Bank if either or both determine such payment would constitute an unsafe or unsound practice. In addition, under the Basel III Rule, institutions that seek the freedom to pay dividends will have to maintain 2.5% in Common Equity Tier 1 Capital attributable to the capital conservation buffer. See “-The“The Role of Capital” above.
State Bank Investments and Activities.
The Bank is permitted to make investments and engage in activities directly or through subsidiaries as authorized by Indiana law. However, under federal law, FDIC-insured institutions are prohibited, subject to certain exceptions, from making or retaining equity investments of a type, or in an amount that are not permissible for a national bank. Federal law also prohibits FDIC-insured state banks and their subsidiaries, subject to certain exceptions, from engaging as principal in any activity that is not permitted for a national bank unless the bank meets, and continues to meet, its minimum regulatory capital requirements and the FDIC determines that the activity would not pose a significant risk to the DIF. These restrictions have not had, and are not currently expected to have, a material impact on the operations of the Bank.Insider Transactions.
The Bank is subject to certain restrictions imposed by federal law on “covered transactions” between the Bank and its “affiliates.” The Company is an affiliate of the Bank for purposes of these restrictions, and covered transactions subject to the restrictions include extensions of credit to the Company, investments in the stock or other securities of the Company andCertain limitations and reporting requirements are also placed on extensions of credit by the Bank to its directors and officers, to directors and officers of the Company and its subsidiaries, to principal shareholders of the Company and to “related interests” of such directors, officers and principal shareholders. In addition, federal law and regulations may affect the terms upon which any person who is a director or officer of the Company or the Bank, or a principal shareholder of the Company, may obtain credit from banks with which the Bank maintains a correspondent relationship.
Safety and Soundness Standards/Risk Management.
The federal banking agencies have adopted operational and managerial standards to promote the safety and soundness of FDIC-insured institutions. The standards apply to internal controls, information systems, internal audit systems, loan documentation, credit underwriting, interest rate exposure, asset growth, compensation, fees and benefits, asset quality and earnings.In general, the safety and soundness standards prescribe the goals to be achieved in each area, and each institution is responsible for establishing its own procedures to achieve those goals. While regulatory standards do not have the force of law, if an institution operates in an unsafe and unsound manner, the FDIC-insured institution’s primary federal regulator may require the institution to submit a plan for achieving and maintaining compliance. If an FDIC-insured institution fails to submit an acceptable compliance plan, or fails in any material respect to implement a compliance plan that has been accepted by its primary federal regulator, the regulator is required to issue an order directing the institution to cure the deficiency. Until the deficiency cited in the regulator’s order is cured, the regulator may restrict the FDIC-insured institution’s rate of growth, require the FDIC-insured institution to increase its capital, restrict the rates the institution pays on deposits or require the institution to take any action the regulator deems appropriate under the circumstances. Noncompliance with safety and soundness may also constitute grounds for other enforcement action by the federal bank regulatory agencies, including cease and desist orders and civil money penalty assessments.
During the past decade, the bank regulatory agencies have increasingly emphasized the importance of sound risk management processes and strong internal controls when evaluating the activities of the FDIC-insured institutions they supervise. Properly managing risks has been identified as critical to the conduct of safe and sound banking activities and has become even more important as new technologies, product innovation, and the size and speed of financial transactions have changed the nature
12
of banking markets. The agencies have identified a spectrum of risks facing a banking institution including, but not limited to, credit, market, liquidity, operational, legal, and reputational risk. In particular, recent regulatory pronouncements have focused onThe key risk themes identified for 2020 are: (i) elevated operational risk which arisesas banks adapt to an evolving technology environment and persistent cybersecurity risks; (ii) the need for banks to prepare for a cyclical change in credit risk while credit performance is strong; (iii) elevated interest rate risk due to lower rates continuing to compress net interest margins; and (iv) strategic risks from the potential that inadequate information systems, operational problems, breaches in internal controls, fraud, or unforeseen catastrophes will result in unexpected losses. New productsnon-depository financial institutions, use of innovative and services, incentive compensation, third-party riskevolving technology, and cybersecurity are critical sources of risk that FDIC-insured institutions must address in the current environment.progressive data analysis capabilities. The Bank is expected to have active board and senior management oversight; adequate policies, procedures and limits; adequate risk measurement, monitoring and management information systems; and comprehensive internal controls.
Branching Authority
.Indiana banks, such as the Bank, have the authority under Indiana law to establish branches anywhere in the State of Indiana, subject to receipt of all required regulatory approvals. Federal law permits state and national banks to merge with banks in other states subject to: (i) regulatory approval; (ii) federal and state deposit concentration limits; and (iii) state law limitations requiring the merging bank to have been in existence for a minimum period of time (not to exceed five years) prior to the merger. The establishment of new interstate branches has historically been permitted only in those states the laws of which expressly authorize such expansion. The Dodd-Frank Act permits well-capitalized and well-managed banks to establish new interstate branches or the acquisition of individual branches of a bank in another state (rather than the acquisition of an out-of-state bank in its entirety) without impediments.Transaction Account Reserves.
Federal Reserve regulations require FDIC-insured institutions to maintain reserves against their transaction accounts (primarily NOW and regular checking accounts). ForCommunity Reinvestment Act Requirements.
CRA requires the Bank to have a continuing and affirmative obligation in a safe and sound manner to help meet the credit needs of its entire community, including low- and moderate-income neighborhoods. Federal regulators regularly assess the Bank’s record of meeting the credit needs of its communities. Applications for additional acquisitions would be affected by the evaluation of the Bank’s effectiveness in meeting its CRA requirements.Privacy and Cybersecurity. The Bank is subject to many U.S. federal and state laws and regulations governing requirements for maintaining policies and procedures to protect non-public confidential information of their customers. These laws require the Bank to periodically disclose its privacy policies and practices relating to sharing such information and permit consumers to opt out of their ability to share information with unaffiliated third parties under certain circumstances. They also impact the Bank’s ability to share certain information with affiliates and non-affiliates for marketing and/or non-marketing purposes, or to contact customers with marketing offers. In addition, as a part of its operational risk mitigation, the Bank is required to implement a comprehensive information security program that includes administrative, technical, and physical safeguards to ensure the security and confidentiality of customer records and information and to require the same of its service providers. These security and privacy policies and procedures, for the protection of personal and confidential information, are in effect across all business lines and geographic locations.
Anti-Money Laundering.
The Uniting and Strengthening America by Providing Appropriate Tools Required to Intercept and Obstruct Terrorism Act of 2001 (“USA PATRIOT Act”) is designed to deny terrorists and criminals the ability to obtain access to the U.S. financial system and has significant implications for FDIC-insured institutions, brokers, dealers and other businesses involved in the transfer of money. The USA PATRIOT Act mandates financial services companies to have policies and procedures with respect to measures designed to address any or all of the following matters: (i) customer identification programs; (ii) money laundering; (iii) terrorist financing; (iv) identifying and reporting suspicious activities and currency transactions; (v) currency crimes; andConcentrations in Commercial Real Estate.
Concentration risk exists when FDIC-insured institutions deploy too many assets to any one industry or segment. A concentration in commercial real estate is one example of regulatory concern. The interagency Concentrations in Commercial Real Estate Lending, Sound Risk Management Practices guidance (“CRE Guidance”) provides supervisory criteria, including the following numerical indicators, to assist bank examiners in identifying banks with potentially significant commercial real estate loan concentrations that may warrant greater supervisory scrutiny: (i) commercial real estate loans exceeding 300% of capital and increasing 50% or more in the preceding three years; or (ii) construction and land13
development loans exceeding 100% of capital. The CRE Guidance does not limit banks’ levels of commercial real estate lending activities, but rather guides institutions in developing risk management practices and levels of capital that are commensurate with the level and nature of their commercial real estate concentrations. On December 18, 2015, the federal banking agencies issued a statement to reinforce prudent risk-management practices related to CRE lending, having observed substantial growth in many CRE asset and lending markets, increased competitive pressures, rising CRE concentrations in banks, and an easing of CRE underwriting standards. The federal bank agencies reminded FDIC-insured institutions to maintain underwriting discipline and exercise prudent risk-management practices to identify, measure, monitor, and manage the risks arising from CRE lending. In addition, FDIC-insured institutions must maintain capital commensurate with the level and nature of their CRE concentration risk.
Based on the Bank’s loan portfolio as of December 31, 2018,2019, it did not exceed the 300% guidance for commercial real estate loans or the 100% guideline for construction and land development loans.
Consumer Financial Services.
The historical structure of federal consumer protection regulation applicable to all providers of consumer financial products and services changed significantly on July 21, 2011, when the CFPB commenced operations to supervise and enforce consumer protection laws. The CFPB has broad rulemaking authority for a wide range of consumer protection laws that apply to all providers of consumer products and services, including the Bank, as well as the authority to prohibit “unfair, deceptive or abusive” acts and practices. The CFPB has examination and enforcement authority over providers with more than $10 billion in assets. FDIC-insured institutions with $10 billion or less in assets, like the Bank, continue to be examined by their applicable bank regulators.Because abuses in connection with residential mortgages were a significant factor contributing to the financial crisis, many new rules issued by the CFPB and required by the Dodd-Frank Act addressed mortgage and mortgage-related products, their underwriting, origination, servicing and sales. The Dodd-Frank Act significantly expanded underwriting requirements applicable to loans secured by 1-4 family residential real property and augmented federal law combating predatory lending practices. In addition to numerous disclosure requirements, the Dodd‑FrankDodd-Frank Act imposed new standards for mortgage loan originations on all lenders, including banks and savings associations, in an effort to strongly encourage lenders to verify a borrower’s ability to repay, while also establishing a presumption of compliance for certain “qualified mortgages.” The Regulatory Relief Act provided relief in connection with mortgages for banks with assets of less than $10 billion, and, as a result, mortgages the Bank makes are now considered to be qualified mortgages if they are held in portfolio for the life of the loan.
In addition to the other information in this Annual Report on Form 10-K, stockholders or prospective investors should carefully consider the following risk factors:
A downturn in the general economic or business conditions, nationally or in markets where our business is concentrated, could have an adverse effect on our business, results of operations and financial condition.
Our success depends upon the business activity, population, employment rates, income levels, deposits and real estate activity in our markets in northern and central Indiana. Although our customers’ business and financial interests may extend well beyond these market areas, adverse economic conditions that affect these market areas could reduce our growth rate, diminish the ability of our customers to repay their loans to us, decrease the value of any collateral securing our loans and generally adversely affect our financial condition and results of operations. While economic conditions in our markets have generally improved since the nationwide recession in 2008 and 2009, there can be no guarantee that they will continue to do so, or that they will be as strong as national economic conditions. The impact on tariffs could result in a manufacturing slowdown for certain business sectors, which could negatively impact our loan demand. Moreover, because of our geographic concentration, we are less able than other regional or national financial institutions to diversify our credit risks across multiple markets.
If we do not effectively manage our credit risk, we may experience increased levels of nonperforming loans, charge - offs and delinquencies, which could require further increases in our provision for loan losses.
There are risks inherent in making any loan, including risks inherent in dealing with individual borrowers, risks of nonpayment, risks resulting from uncertainties as to the future value of collateral and risks resulting from changes in economic and industry conditions. We attempt to minimize our credit risk through prudent loan application approval procedures, careful monitoring
14
of the concentration of our loans within specific industries, a centralized credit administration department and periodic independent reviews of outstanding loans by our loan review department. However, we cannot make assurances that such approval and monitoring procedures will reduce these credit risks. If the overall economic climate in the United States, generally, and our market areas, specifically, does not continue to improve, or even if it does, our borrowers may experience difficulties in repaying their loans, and the level of nonperforming loans, charge-offs and delinquencies could rise and require increases in the provision for loan losses, which would cause our net income and return on equity to decrease.
If our allowance for loan losses is not sufficient to absorb losses that may occur in our loan portfolio, our financial condition and liquidity could suffer.
We establish our allowance for loan losses and maintain it at a level considered adequate by management to absorb probable incurred loan losses that are inherent in the portfolio. The allowance contains provisions for probable incurred losses that have been identified relating to specific borrowing relationships, as well as probable losses inherent in the loan portfolio and credit undertakings that are not specifically identified. Additions to the allowance for loan losses, which are charged to earnings through the provision for loan losses, are determined based on a variety of factors, including an analysis of the loan portfolio, historical loss experience and an evaluation of current economic conditions in our market areas. The actual amount of loan losses is affected by changes in economic, operating and other conditions within our markets, which may be beyond our control, and such losses may exceed current estimates.
At December 31, 2018,2019, our allowance for loan losses as a percentage of total loans was 1.24%1.25% and as a percentage of total nonperforming loans was 667%271%. Because of the nature of our loan portfolio and our concentration in commercial and industrial loans, which tend to be larger loans, the movement of a small number of loans to nonperforming status can have a significant impact on these ratios. Although management believes that the allowance for loan losses is adequate to absorb probable losses on any existing loans, we cannot predict loan losses with certainty and we cannot assure you that our allowance for loan losses will prove sufficient to cover actual loan losses in the future. Loan losses in excess of our reserves may adversely affect our business, results of operations and financial condition.
Commercial and industrial loans make up a significant portion of our loan portfolio.
Commercial and industrial loans were $1.405$1.427 billion, or approximately 35.9%35.1% of our total loan portfolio, as of December 31, 2018.2019. Commercial and industrial loans are often larger and involve greater risks than other types of lending. Because payments on such loans are often dependent on the successful operation of the borrower involved, repayment of such loans is often more sensitive than other types of loans to adverse conditions in the general economy. For example, increased input costs as a result of escalating tariffs could adversely affect commercial and industrial loans. Our commercial and industrial loans are primarily made based on the identified cash flow of the borrower and secondarily on the underlying collateral provided by the borrower. Most often, this collateral is accounts receivable, inventory, machinery or real estate. Whenever practical, we require a personal guarantee on commercial and industrial loans. Credit support provided by the borrower for most of these loans and the probability of repayment is based on the liquidation of the pledged collateral and enforcement of a personal guarantee, if any exists. As a result, in the case of loans secured by accounts receivable, the availability of funds for the repayment of these loans may be substantially dependent on the ability of the borrower to collect amounts due from its customers. The collateral securing other loans may depreciate over time, may be difficult to appraise and may fluctuate in value based on the success of the business. Due to the larger average size of each commercial loan as compared with other loans such as residential loans, as well as collateral that is generally less readily-marketable, losses incurred on a small number of commercial loans could adversely affect our business, results of operations and growth prospects.
Our loan portfolio includes commercial real estate loans, which involve risks specific to real estate value.
Commercial real estate loans were $1.570$1.673 billion, or approximately 40.1%41.1% of our total loan portfolio as of December 31, 2018.2019. The market value of real estate can fluctuate significantly in a short period of time as a result of market conditions in the geographic area in which the real estate is located. Although a significant portion of such loans are secured by real estate as a secondary form of collateral, adverse developments affecting real estate values in one or more of our markets could increase the credit risk associated with our loan portfolio. Additionally, real estate lending typically involves higher loan principal amounts and the repayment of the loans generally is dependent, in large part, on sufficient income from the properties securing the loans to cover operating expenses and debt service. Economic events or governmental regulations outside of the control of the borrower or lender could negatively impact the future cash flow and market values of the affected properties.
15
If the loans that are collateralized by real estate become troubled and the value of the real estate has been significantly impaired, then we may not be able to recover the full contractual amount of principal and interest that we anticipated at the time of originating the loan, which could cause us to increase our provision for loan losses and adversely affect our operating results and financial condition.
Our loan portfolio has a notable concentration in agri-business, which has a higher level of uncontrolled risk.
Our agri-business loans, which totaled $370.5$379.5 million, or approximately 9.5%9.3% of our total loan portfolio as of December 31, 2018,2019, are subject to risks outside of our or the borrower’s control. These risk, specific to the agricultural industry, include decreases in livestock and crop prices, increases in labor and seed prices, increase in stockpiles of agricultural commodities, the strength of the U.S. dollar, the potential impact of tariffs on commodities and the nature of weather conditions. To the extent these or other factors affect the performance or financial condition of our agri-business borrowers, our results of operations and financial performance could suffer.
Our consumer loans generally have a higher degree of risk of default than our other loans.
At December 31, 2018,2019, consumer loans totaled $86.1$98.6 million, or 2.2%2.4% of our total loan portfolio. Consumer loans typically have shorter terms and lower balances with higher yields as compared to commercial loans, but generally carry higher risks of default. Consumer loan collections are dependent on the borrower’s continuing financial stability, and thus are more likely to be affected by adverse personal circumstances. Furthermore, the application of various federal and state laws, including bankruptcy and insolvency laws, may limit the amount which can be recovered on these loans.
We may need to raise additional capital in the future to achieve our growth plans, but that capital may not be available when it is needed.
We are required by federal and state regulatory authorities to maintain adequate levels of capital to support our operations. Accordingly, we may need to raise additional capital to support our future growth plans. Our ability to raise additional capital depends on conditions in the capital markets, economic conditions and a number of other factors, including investor perceptions regarding the banking industry, market conditions and governmental activities, and on our financial condition and performance. Accordingly, we cannot make assurances of our ability to raise additional capital, if needed, on terms acceptable to us. If we cannot raise additional capital when needed, our financial condition and our ability to further expand our operations through internal growth or acquisitions could be materially impaired.
Interest rate shifts may reduce net interest income and otherwise negatively impact our financial condition and results of operations.
Shifts in short-term interest rates may reduce net interest income, which is the principal component of our earnings. Net interest income is the difference between the amounts received by us on our interest-earning assets and the interest paid by us on our interest-bearing liabilities. When interest rates rise, the rate of interest we pay on our liabilities may rise more quickly than the rate of interest that we receive on our interest-bearing assets, which may cause our profits to decrease. Conversely, when interest rates fall our interest-bearing assets reprice more quickly than our interest-bearing liabilities, given our asset-sensitive balance sheet, which may cause our net interest income to decrease. The impact on earnings is more adverse when the slope of the yield curve flattens, i.e. when short-term interest rates increase more than corresponding changes in long-term interest rates or when long-term interest rates decrease more than corresponding changes in short-term interest rates.
Interest rate increases often result in larger payment requirements for our borrowers, which increases the potential for default. At the same time, the marketability of the underlying property may be adversely affected by any reduced demand resulting from higher interest rates. In a declining interest rate environment, there may be an increase in prepayments on the loans as borrowers refinance their mortgages at lower rates.
Changes in interest rates also can affect the value of loans, securities and other assets. An increase in interest rates that adversely affects the ability of borrowers to pay the principal or interest on loans may lead to an increase in nonperforming assets and a reduction of income recognized, which could have a material adverse effect on our results of operations and cash flows. Thus, an increase in the amount of nonperforming assets would have an adverse impact on net interest income.
16
The Federal Reserve Bank has raisedlowered the target fed funds rate range to 2.25%-2.50%1.50%-1.75%, and short-term interest rates have remained at their historically low levels for a prolonged period. If rates remain low and long-term interest rates do not rise as quickly as short-term rates, we could experience net interest margin compression. This would have a material adverse effect on our net interest income and our results of operations.
Nonperforming assets take significant time to resolve and adversely affect our results of operations and financial condition and could result in further losses in the future.
Our nonperforming assets adversely affect our net income in various ways. We do not record interest income on nonaccrual loans or other real estate owned, which adversely affects our net income and returns on assets and equity, increases our loan administration costs and adversely affects our efficiency ratio. When we take collateral in foreclosure and similar proceedings, we are required to mark the collateral to its current fair market value at the time of transfer, which may result in a loss. These nonperforming loans and other real estate owned also increase our risk profile and our regulatory capital requirements may increase in light of such risks. The resolution of nonperforming assets requires significant time commitments from management and can be detrimental to the performance of their other responsibilities. If we experience increases in nonperforming loans and nonperforming assets, our net interest income and provision expense may be negatively impacted and our loan administration costs could increase, each of which could have an adverse effect on our net income and related ratios, such as return on assets and equity.
Liquidity risks could affect operations and jeopardize our business, results of operations and financial condition.
Liquidity is essential to our business. An inability to raise funds through deposits, borrowings, the sale of loans and other sources could have a substantial, negative effect on our liquidity. Our primary sources of funds consist of deposits, cash from operations and investment maturities and sales. Additional liquidity is provided by brokered deposits, Certificate of Deposit Account Registry Service (“CDARS”) deposits, repurchase agreementsAmerican Financial Exchange overnight borrowings, Promontory Interfinancial Network’s insured cash sweep program, as well as our ability to borrow from federal funds lines at correspondent banks, the Federal Reserve and the Federal Home Loan Bank (the “FHLB”). Our access to funding sources in amounts adequate to finance or capitalize our activities or on terms that are acceptable to us could be impaired by factors that affect us directly or the financial services industry or economy in general, such as disruptions in the financial markets or negative views and expectations about the prospects for the financial services industry. In addition, increased competition with the largest banks for retail deposits due to the higher liquidity requirements these banks are now subject to may impact our ability to raise funds through deposits and could have a negative effect on our liquidity.
During the recentlast recession, the financial services industry and the credit markets generally were materially and adversely affected by significant declines in asset values and historically depressed levels of liquidity. The liquidity issues were also particularly acute for regional and community banks, as many of the larger financial institutions curtailed their lending to regional and community banks to reduce their exposure to the risks of other banks. In addition, many of the larger correspondent lenders reduced or even eliminated federal funds lines for their correspondent customers. Furthermore, regional and community banks generally have less access to the capital markets than national and super-regional banks because of their smaller size and limited analyst coverage. Any decline in available funding could adversely impact our ability to originate loans, invest in securities, meet our expenses, pay dividends to our stockholders, or fulfill obligations such as repaying our borrowings or meeting deposit withdrawal demands, any of which could have a material adverse impact on our liquidity, business, results of operations and financial condition.
Any action or steps to change coverages or eliminate Indiana’s Public Deposit Insurance Fund could require us to find alternative, higher-cost funding sources to replace public fund deposits or to provide for collateralization of these deposits.
Approximately 30%27% of our deposits are concentrated in public funds from a small number of municipalities and government agencies.agencies located in the Bank’s geographic footprint. A shift in funding away from public fund deposits would likely increase our cost of funds, as the alternate funding sources, such as brokered certificates of deposit, are higher-cost, less favorable deposits. The inability to maintain these public funds on deposit could result in a material adverse effect on the Bank’s liquidity and could materially impact our ability to grow and remain profitable.
17
Declines in asset values may result in impairment charges and adversely affect the value of our investments, financial performance and capital.
We maintain an investment portfolio that includes, but is not limited to, mortgage-backed securities and municipal securities. The market value of investments may be affected by factors other than the underlying performance of the servicer of the securities or the mortgages underlying the securities, such as ratings downgrades, adverse changes in the business climate and a lack of liquidity in the secondary market for certain investment securities. On a quarterly basis, we evaluate investments and other assets for impairment indicators. We may be required to record additional impairment charges if our investments suffer a decline in value that is considered other-than-temporary. If we determine that a significant impairment has occurred, we would be required to charge against earnings the credit-related portion of the other-than-temporary impairment, which could have a material adverse effect on our results of operations in the periods in which the write-offs occur.
We may experience difficulties in managing our growth, and our growth strategy involves risks that may negatively impact our net income.
In addition to our continuing expansion in Indianapolis and larger cities in Northern Indiana, we may expand into additional communities or attempt to strengthen our position in our current markets through opportunistic acquisitions of all or part of other financial institutions, or by opening new branches in or contiguous to our geographic footprint. To the extent that we undertake acquisitions or new branch openings, we are likely to experience the effects of higher operating expenses relative to operating income from the new operations, which may have an adverse effect on our levels of reported net income, return on average equity and return on average assets. Other effects of engaging in such growth strategies may include potential diversion of our management’s time and attention and general disruption to our business.
To the extent that we grow through acquisitions and branch openings, we cannot assure you that we will be able to adequately and profitably manage this growth. Acquiring other banks and businesses will involve similar risks to those commonly associated with branching but may also involve additional risks, including:
| potential exposure to unknown or contingent liabilities of banks and businesses we acquire; |
| exposure to potential asset quality issues of the acquired bank or related business; |
| difficulty and expense of integrating the operations and personnel of banks and businesses we acquire; and |
| the possible loss of key employees and customers of the banks and businesses we acquire. |
We face intense competition in all phases of our business from other banks and financial institutions.
The banking and financial services business in our market is highly competitive. Our competitors include large national, and regional banks,and local community banks, savings and loan associations, securities and brokerage companies, mortgage companies, insurance companies, finance companies, money market mutual funds, credit unions, farm credit services and other Fintech and nonbank financial service providers. Many of these competitors are not subject to the same regulatory restrictions as we are and are able to provide customers with a feasible alternative to traditional banking services.
Increased competition in our market may also result in a decrease in the amounts of our loans and deposits, reduced spreads between loan rates and deposit rates or loan terms that are more favorable to the borrower. Any of these results could have a material adverse effect on our ability to grow and remain profitable. If increased competition causes us to significantly discount the interest rates we offer on loans or increase the amount we pay on deposits, our net interest income could be adversely impacted. If increased competition causes us to relaxour underwriting standards, we could be exposed to higher losses from lending activities. Moreover, we rely on deposits to be a low cost source of funding, and a loss in our deposit base could cause us to incur higher funding costs. Additionally, many of our competitors are much larger in total assets and capitalization, have greater access to capital markets, possess larger lending limits and offer a broader range of financial services than we can offer.
18
Attractive acquisition opportunities may not be available to us in the future.
We expect that other banking and financial service companies, many of which have significantly greater resources than us, will compete with us in acquiring other financial institutions if we pursue such acquisitions. This competition could increase prices for potential acquisitions that we believe are attractive. Also, acquisitions are subject to various regulatory approvals. If we fail to receive the appropriate regulatory approvals, we will not be able to consummate an acquisition that we believe is in our best interests. Among other things, our regulators consider our capital, liquidity, profitability, regulatory compliance and levels of goodwill and intangibles when considering acquisition and expansion proposals. Any acquisition could be dilutive to our earnings and stockholders’ equity per share of our common stock.
Our accounting policies and methods are the basis for how we prepare our consolidated financial statements and how we report our financial condition and results of operations, and they require management to make estimates about matters that are inherently uncertain.
Our accounting policies and methods are fundamental to how we record and report our financial condition and results of operations. Our management must exercise judgment in selecting and applying many of these accounting policies and methods in order to ensure they comply with GAAP and reflect management’s judgment as to the most appropriate manner in which to record and report our financial condition and results of operations. In some cases, management must select the accounting policy or method to apply from two or more alternatives, any of which might be reasonable under the circumstances. The application of that chosen accounting policy or method might result in the Company reporting different amounts than would have been reported under a different alternative. If management’s estimates or assumptions are incorrect, the Company may experience material losses.
Management has identified two accounting policies as being “critical” to the presentation of the Company’s financial condition and results of operations because they require management to make particularly subjective and complex judgments about matters that are inherently uncertain and because of the likelihood that materially different amounts would be reported under different conditions or using different assumptions. These critical accounting policies relate to: (1) the allowance for loan losses and (2) determining the fair value and possible other than temporary impairment of investment securities available for sale.available-for-sale. Because of the inherent uncertainty of these estimates, no assurance can be given that the application of alternative policies or methods might not result in the reporting of different amounts of the fair value of securities available for sale,available-for-sale, or the allowance for loan losses and, accordingly, net income.
From time to time, the Financial Accounting Standards Board (FASB)FASB and the SEC change the financial accounting and reporting standards or the interpretation of those standards that govern the preparation of our external financial statements. These changes are beyond our control, can be difficult to predict and could materially impact how we report our financial condition and results of operations. Changes in these standards are continuously occurring, and given the current economic environment, more drastic changes may occur. The implementation of such changes could have a material adverse effect on our financial condition and results of operations.
Monetary policies and regulations of the Federal Reserve could adversely affect our business, financial condition and results of operations.
In addition to being affected by general economic conditions, our earnings and growth are affected by the policies of the Federal Reserve. An important function of the Federal Reserve is to regulate the money supply and credit conditions. Among the instruments used by the Federal Reserve to implement these objectives are open market operations in U.S. government securities, adjustments of the discount rate and changes in reserve requirements against bank deposits. These instruments are used in varying combinations to influence overall economic growth and the distribution of credit, bank loans, investments and deposits. Their use also affects interest rates charged on loans or paid on deposits.
The monetary policies and regulations of the Federal Reserve have had a significant effect on the operating results of commercial banks in the past and are expected to continue to do so in the future. The effects of such policies upon our business, financial condition and results of operations cannot be predicted.
19
We are required to maintain capital to meet regulatory requirements, and, if we fail to maintain sufficient capital, whether due to losses, an inability to raise additional capital or otherwise, our financial condition, liquidity and results of operations, as well as our ability to maintain regulatory compliance, would be adversely affected.
The Company, on a consolidated basis, and the Bank, on a stand-alone basis, must meet certain regulatory capital requirements and maintain sufficient liquidity. We face significant capital and other regulatory requirements as a financial institution, which were heightened with the implementation of the Basel III rule on January 1, 2015 and the phase-in of capital conservation buffer requirement through January 1, 2019.requirement. Our ability to raise additional capital depends on conditions in the capital markets, economic conditions and a number of other factors, including investor perceptions regarding the banking industry, market conditions and governmental activities and on our financial condition and performance. Accordingly, we cannot assure you that we will be able to raise additional capital if needed or on terms acceptable to us. If we fail to maintain capital to meet regulatory requirements, our financial condition, liquidity and results of operations would be materially and adversely affected.
We may be materially and adversely affected by the highly regulated environment in which we operate.
We are subject to extensive federal and state regulation, supervision and examination. A more detailed description of the primary federal and state banking laws and regulations that affect us is contained in the section of this Annual Report on Form 10-K captioned “Supervision and Regulation.” Banking regulations are primarily intended to protect depositors’ funds, FDIC funds, customers and the banking system as a whole, rather than our shareholders. These regulations affect our lending practices, capital structure, investment practices, dividend policy and growth, among other things.
As a bank holding company, we are subject to extensive regulation and supervision and undergo periodic examinations by our regulators, who have extensive discretion and authority to prevent or remedy unsafe or unsound practices or violations of law by banks and bank holding companies. Failure to comply with applicable laws, regulations or policies could result in sanctions by regulatory agencies, civil monetary penalties and/or damage to our reputation, which could have a material adverse effect on us. Although we have policies and procedures designed to mitigate the risk of any such violations, there can be no assurance that such violations will not occur.
The laws, regulations, rules, standards, policies and interpretations governing us are constantly evolving and may change significantly over time. For example, on July 21, 2010, the Dodd-Frank Act was signed into law, which significantly changed the regulation of financial institutions and the financial services industry. The Dodd-Frank Act, together with the regulations to be developed thereunder, includes provisions affecting large and small financial institutions alike, including several provisions that affect how community banks, thrifts and small bank and thrift holding companies will be regulated. In addition, the Federal Reserve, in recent years, has adopted numerous new regulations addressing banks’ overdraft and mortgage lending practices. Further, the CFPB was recently established, with broad powers to supervise and enforce consumer protection laws, and additional consumer protection legislation and regulatory activity is anticipated in the near future.
In addition, in July 2013, the U.S. federal banking authorities approved the implementation of the Basel III Rules. The Basel III Rules are applicable to all U.S. banks that are subject to minimum capital requirements as well as to bank and saving and loan holding companies, other than “small bank holding companies” (generally bank holding companies with consolidated assets of less than $1$3 billion).
These provisions, as well as any other aspects of current or proposed regulatory or legislative changes to laws applicable to the financial industry, may impact the profitability of our business activities and may change certain of our business practices, including our ability to offer new products, obtain financing, attract deposits, make loans and achieve satisfactory interest spreads and could expose us to additional costs, including increased compliance costs. Although we are currently compliant with the Basel III Rules, these changes also may require us to invest significant management attention and resources to make any necessary changes to operations in order to comply and could therefore also materially and adversely affect our business, financial condition and results of operations.
20
Our ability to attract and retain management and key personnel and any damage to our reputation may affect future growth and earnings.
Much of our success and growth has been influenced strongly by our ability to attract and retain management experienced in banking and financial services and familiar with the communities in our market areas. Our ability to retain the executive officers, management teams, branch managers and loan officers at the Bank will continue to be important to the successful implementation of our strategy. It is also critical, as we grow, to be able to attract and retain qualified additional management and loan officers with the appropriate level of experience and knowledge about our market areas to implement our community‑basedcommunity-based operating strategy. The unexpected loss of services of any key management personnel, or the inability to recruit and retain qualified personnel in the future, could have an adverse effect on our business, results of operations and financial condition.
In addition, our business depends on earning and maintaining the trust of our customers and communities. Harm to our reputation could arise from numerous sources, including employee misconduct, compliance failures, litigation or our failure to deliver appropriate levels of service. If any events or circumstances occur which could undermine our reputation, there can be no assurance that the additional costs and expenses we may incur as a result would not have an adverse impact on our business.
We have a continuing need to adapt to technological change and we may not have the resources to effectively implement new technology.
The financial services industry is constantly undergoing rapid technological changes with frequent introductions of new technology‑driventechnology-driven products and services. In addition to better serving customers, the effective use of technology increases efficiency and enables financial institutions to reduce costs. Our future success will depend in part upon our ability to address the needs of our customers by using technology to provide products and services that will satisfy customer demands for convenience as well as to create additional efficiencies in our operations as we continue to grow and expand our market areas. Many of our larger competitors have substantially greater resources to invest in technological improvements. As a result, they may be able to offer additional or superior products to those that we will be able to offer, which would put us at a competitive disadvantage. Accordingly, we cannot provide assurances that we will be able to effectively implement new technology‑driventechnology-driven products and services or be successful in marketing such products and services to our customers.
The Company’s information systems may experience an interruption or breach in security and cyber-attacks, all of which could have a material adverse effect on the Company’s business.
The Company relies heavily on internal and outsourced technologies, communications, and information systems to conduct its business. Additionally, in the normal course of business, the Company collects, processes and retains sensitive and confidential information regarding our customers. As the Company’s reliance on technology has increased, so have the potential risks of a technology-related operation interruption (such as disruptions in the Company’s customer relationship management,core provider, general ledger, deposit, loan, or other systems) or the occurrence of a cyber-attacks (such as unauthorized access to the Company’s systems). These risks have increased for all financial institutions as new technologies, the use of the Internet and telecommunications technologies (including mobile devices) to conduct financial and other business transactions and the increased sophistication and activities of organized crime, perpetrators of fraud, hackers, terrorists and others have increased. In addition to cyber-attacks or other security breaches involving the theft of sensitive and confidential information, hackers recently have engaged in attacks against large financial institutions, particularly denial of service attacks, which are designed to disrupt key business services, such as customer-facing web sites.sites and social engineering attacks that could influence an employee of the Company to click on a link that downloads malware or ransomware to the Company’s system. The Company is not able to anticipate or implement effective preventive measures against all security breaches of these types, especially because the techniques used change frequently and because attacks can originate from a wide variety of sources. In addition, it is possible that we may not be able to detect security breaches on a timely basis, or at all, which could increase the costs and risks associated with any such breach.
The Company also faces risks related to cyber-attacks and other security breaches in connection with credit card and debit card transactions that typically involve the transmission of sensitive information regarding the Company’s customers through various third parties, including merchant acquiring banks, payment processors, payment card networks and its processors. Some of these parties have in the past been the target of security breaches and cyber-attacks, and because the transactions involve third parties and environments such as the point of sale that the Company does not control or secure, future security breaches or cyber-attacks affecting any of these third parties could impact the Company through no fault of its own, and in some cases it may have exposure and suffer
21
losses for breaches or attacks relating to them. In addition, the Company offers its customers protection against fraud and certain losses for unauthorized use of debit cards in order to stay competitive with other financial institutions. Offering such protection exposes the Company to losses that could adversely affect its business, financial condition and results of operations. Further cyber-attacks or other breaches in the future, whether affecting the Company or others, could intensify consumer concern and regulatory focus and result in reduced use of payment cards and increased costs, all of which could have a material adverse effect on the Company’s business. To the extent we are involved in any future cyber-attacks or other breaches, the Company’s reputation could be affected, which could also have a material adverse effect on the Company’s business, financial condition or results of operations.
We are subject to certain operational risks, including, but not limited to, customer or employee fraud and data processing system failures and errors.
Employee errors and misconduct could subject us to financial losses or regulatory sanctions and seriously harm our reputation. Misconduct by our employees could include hiding their own unauthorized activities from us, improper or unauthorized activities on behalf of our customers or improper use of confidential information. It is not always possible to prevent employee errors and misconduct, and the precautions we take to prevent and detect this activity may not be effective in all cases. Employee errors could also subject us to financial claims for negligence, among others.
We maintain a system of internal controls and insurance coverage to mitigate operational risks, including data processing system failures and errors, cyber-attacks, and customer or employee fraud. Should our internal controls fail to prevent or detect an occurrence, or if any resulting loss is not insured or exceeds applicable insurance limits, it could have a material adverse effect on our business, results of operations and financial condition.
We may be adversely affected by changes in U.S. tax laws and regulations.
The Tax Cuts and Jobs Act was enacted in December 2017. While the Company benefited from the decrease in the federal corporate income tax rate from 35% to 21%, several changes could adversely affect our customers, including a cap on the deductibility of state and local income taxes, lower limits on the deductibility of mortgage interest and the elimination of deductions for new home equity loans. These changes could make it more difficult for borrowers to make their loan payments, reduce the demand for certain of our loan products, and could also negatively impact the housing market, which could adversely affect our financial condition and results of operations.
We may be subject to a higher consolidated effective tax rate if there is a change in tax laws relating to LCB Investments II, Inc. or if LCB Funding, Inc. fails to qualify as a real estate investment trust.
The Bank holds certain investment securities in its wholly-owned subsidiary LCB Investments II, Inc., which is incorporated in Nevada. Pursuant to the State of Indiana’s current tax laws and regulations, we are not subject to Indiana income tax for income earned through that subsidiary. If there are changes in Indiana’s tax laws or interpretations thereof requiring us to pay state taxes for income generated by LCB Investments II, Inc., the resulting tax consequences could increase our effective tax rate or cause us to have a tax liability for prior years.
The Bank also holds certain commercial real estate loans, residential real estate loans and other loans in a real estate investment trust through LCB Investments II, Inc., which is incorporated in Indiana. Qualification as a real estate investment trust involves application of specific provisions of the Internal Revenue Code relating to various asset tests. If LCB Funding, Inc. fails to meet any of the required provisions for real estate investment trusts, it could no longer qualify as a real estate investment trust and the resulting tax consequences would increase our effective tax rate or cause us to have a tax liability for prior years.
We may be adversely impacted by the discontinuance of LIBOR as a short-term interest rate utilized for loans and other financing agreements.
In July 2017, the Financial Conduct Authority (the authority that regulates LIBOR) announced it intends to stop compelling banks to submit rates for the calculation of LIBOR after 2021. The Alternative Reference Rates Committee ("ARRC") has proposed that the Secured Overnight Financing Rate ("SOFR") is the rate that represents best practice as the alternative to USD-LIBOR for use in derivatives and other financial contracts that are currently indexed to USD-LIBOR. ARRC has proposed a paced market transition plan to SOFR from USD-LIBOR and organizations are currently working on industry wide and company specificcompany-specific transition plans as it
22
relates to derivatives and cash markets exposed to USD-LIBOR. The Company has material contracts that are indexed to USD-LIBOR and is monitoring this activity and evaluating the related risks.
We may experience volatility in the balance of the allowance for credit losses and related provision expense due to the adoption of the current expected credit losses (“CECL”) methodology.
The CECL methodology requires increased use of judgments and dependence on forward-looking information and forecasts which may prove to be incorrect.
The Company will adopt the CECL methodology for accounting for credit losses on loans and debt securities on January 1, 2020. The CECL model differs substantially from the incurred loss model currently used in that it is forward looking, requiring measurement to occur when a financial asset is first added to the balance sheet and periodically thereafter. The measurements will require increased use of management judgments as well as forward-looking information and forecasts. Although every effort is made to ensure that the judgments are correct and the forecasts accurate, the future is uncertain, and there can be no guarantee that the judgments and forecasts will prove to be correct.
We may be adversely affected by a world-wide pandemic.
The coronavirus outbreak may have an adverse impact on certain of the Company’s customers directly or indirectly engaged in international trade and travel.
Certain of the Company’s customers are engaged in international trade, travel and tourism. Their businesses may be adversely affected by quarantines and travel restrictions in countries most affected by the coronavirus. In addition, entire industries such as agriculture, may be adversely impacted due to lower exports caused by reduced economic activity in the affected countries.
We may be adversely affected by the 2020 election.
Uncertainty around the 2020 elected may result in reduced economic activity as business and individuals wait to see who will control Congress and the White House. In addition, if enacted, certain proposals of the various presidential candidates may have an adverse impact on the Company through increased taxation and regulation.
ITEM 1B. UNRESOLVED STAFF COMMENTS
We have no unresolved SEC staff comments.
The Company is headquartered in the main office building of the Bank at 202 E. Center Street, Warsaw, Indiana.Indiana 46580. The Company operates in 5655 locations, 49 of which are owned by the Bank and sevensix of which are leased from third parties.
None of the Company’s real property assets are the subject of any material encumbrances.
There are no material pending legal proceedings, other than ordinary routine litigation incidental to the business of the Company, to which the Company andLakeland Financial or the Bank areis a party or ofto which any of their property is subject.
23
PART II
ITEM 5. MARKET FOR REGISTRANT’S COMMON EQUITY, RELATED STOCKHOLDER MATTERS AND ISSUER PURCHASES OF EQUITY SECURITIES
The quarterly high and low closing prices for the Company’s common stock and the cash dividends declared and paid on that common stock are set forth in the table below.
| 2018 | 2017 | ||||||
| Cash | Cash | ||||||
| High* | Low* | Dividend | High* | Low* | Dividend | ||
| Fourth quarter | $47.41 | $37.79 | $0.260 | $52.43 | $45.26 | $0.220 | |
| Third quarter | $51.25 | $46.35 | $0.260 | $49.22 | $41.30 | $0.220 | |
| Second quarter | $51.15 | $45.15 | $0.260 | $48.70 | $41.38 | $0.220 | |
| First quarter | $51.76 | $45.01 | $0.220 | $48.32 | $39.68 | $0.190 | |
| | | | | | | | | | | | | | | | | | |
|
| 2019 |
| 2018 | ||||||||||||||
| | | | | | | Cash | | | | | | | | Cash | |||
|
| High* |
| Low* |
| Dividend |
| High* |
| Low* |
| Dividend | ||||||
Fourth quarter | | $ | 49.90 | | $ | 42.48 | | $ | 0.300 | | $ | 47.41 | | $ | 37.79 | | $ | 0.260 |
Third quarter | | $ | 47.10 | | $ | 41.41 | | $ | 0.300 | | $ | 51.25 | | $ | 46.35 | | $ | 0.260 |
Second quarter | | $ | 49.04 | | $ | 43.95 | | $ | 0.300 | | $ | 51.15 | | $ | 45.15 | | $ | 0.260 |
First quarter | | $ | 48.68 | | $ | 40.75 | | $ | 0.260 | | $ | 51.76 | | $ | 45.01 | | $ | 0.220 |
The common stock of the Company was first quoted on The Nasdaq Stock Market under the symbol “LKFN” on August 14, 1997. Currently, the Company’s common stock is listed for trading on the Nasdaq Global Select Market under the symbol “LKFN”.“LKFN.” On February 19, 2019,18, 2020, the Company had approximately 349341 stockholders of record.
The Company paid dividends on its common stock as set forth in the table above. The Company’s ability to pay dividends to stockholders is largely dependent upon the dividends it receives from the Bank, and the Bank is subject to regulatory limitations on the amount of cash dividends it may pay. See “Supervision and Regulation – Dividend Payments” for additional information.
Equity Compensation Plan Information
The table below sets forth the following information as of December 31, 20182019 for (i) all compensation plans previously approved by the Company’s stockholders and (ii) all compensation plans not previously approved by the Company’s stockholders:
(a) the number of securities to be issued upon the exercise of outstanding options, warrants and rights;
(b) the weighted-average exercise price of such outstanding options, warrants and rights; and
(c) other than securities to be issued upon the exercise of such outstanding options, warrants and rights, the number of securities remaining available for future issuance under the plans.
EQUITY COMPENSATION PLAN INFORMATION
| Number of securities | |||
| remaining available | |||
| Number of securities to be | Weighted-average | for future issuance | |
| issued upon exercise of | exercise price of | under equity | |
| Plan category | outstanding options | outstanding options | compensation plans |
| Equity compensation plans | |||
| approved by security | |||
holders(1) | 0 | $0.00 | 839,459 |
| Equity compensation plans | |||
| not approved by security | |||
| holders | 0 | 0.00 | 0 |
| Total | 0 | $0.00 | 839,459 |
| | | | | | | |
|
| |
| | |
| Number of securities |
| | | | | | | remaining available |
| | Number of securities to be | | Weighted-average | | for future issuance | |
| | issued upon exercise of | | exercise price of | | under equity | |
Plan category |
| outstanding options |
| outstanding options |
| compensation plans | |
Equity compensation plans approved by security holders(1) |
| 0 | | $ | 0.00 |
| 684,926 |
| | | | | | | |
Equity compensation plans not approved by security holders |
| 0 | |
| 0.00 |
| 0 |
Total |
| 0 | | $ | 0.00 |
| 684,926 |
(1)
Lakeland Financial Corporation 2017 Equity Incentive Plan was adopted on April 12, 2017 by the24
STOCK PRICE PERFORMANCE GRAPH
The graph below compares the cumulative total return of the Company, the Nasdaq Market Index, and the SNL U.S. Bank Nasdaq Index.
| INDEX | 12/31/13 | 12/31/14 | 12/31/15 | 12/31/16 | 12/31/17 | 12/31/18 | |
| Lakeland Financial Corporation | $100.00 | $113.93 | $124.93 | $194.86 | $203.26 | $172.01 | |
| Nasdaq Composite Index | 100.00 | 114.75 | 122.74 | 133.62 | 173.22 | 168.30 | |
| SNL U.S. Bank Nasdaq Index | 100.00 | 103.57 | 111.80 | 155.02 | 163.20 | 137.56 |
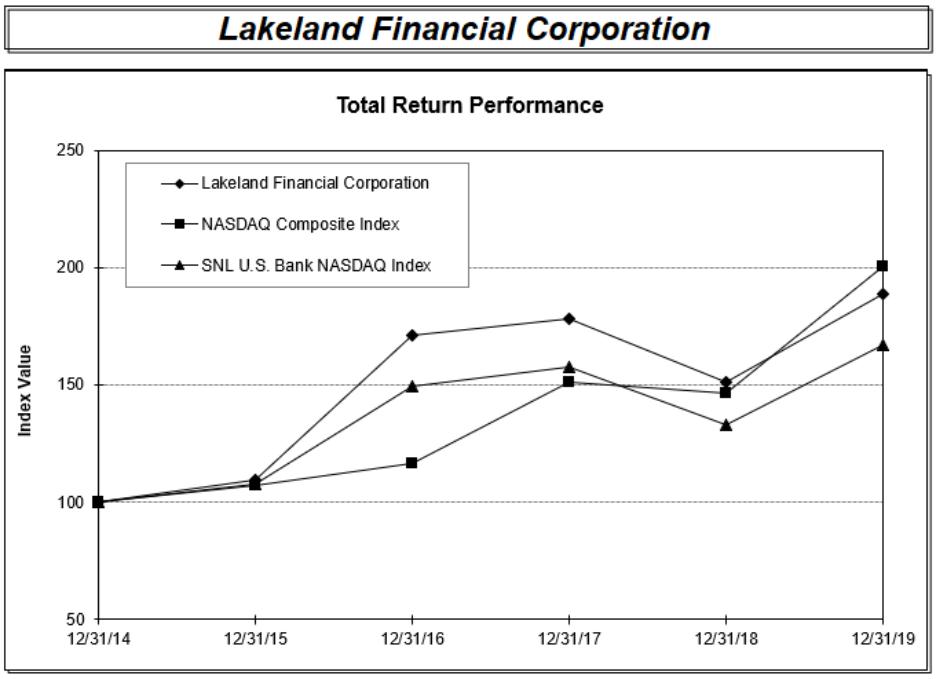
| | | | | | | | | | | | | | | | | | |
| | Period Ending | ||||||||||||||||
Index |
| 12/31/14 |
| 12/31/15 |
| 12/31/16 |
| 12/31/17 |
| 12/31/18 |
| 12/31/19 | ||||||
Lakeland Financial Corporation | | | 100.00 | | | 109.66 | | | 171.03 | | | 178.40 | | | 150.97 | | | 188.68 |
NASDAQ Composite Index | |
| 100.00 | |
| 106.96 | |
| 116.45 | |
| 150.96 | |
| 146.67 | |
| 200.49 |
SNL U.S. Bank NASDAQ Index | |
| 100.00 | |
| 107.95 | |
| 149.68 | |
| 157.58 | |
| 132.82 | |
| 166.75 |
The above returns assume that $100 invested on December 31, 20132014 and that all dividends were reinvested.
ISSUER PURCHASES OF EQUITY SECURITIES
On January 8, 2019, the Company'sCompany’s board of directors approved a share repurchase program, under which the Company is authorized to repurchase, from time to time as the Company deems appropriate, shares of the Company'sCompany’s common stock with an aggregate purchase price of up to $30 million. Repurchases may be made in the open market, through block trades or otherwise, and in privately negotiated transactions. The repurchase program expiresexpired on December 31, 2019.2019, and it was reauthorized by the Company’s board of directors on January 14, 2020 through January 31, 2021, with an aggregate purchase price cap of $30 million. The repurchase program does not obligate the Company to repurchase any dollar amount or number of shares, and the program may be extended,
25
modified, suspended or discontinued at any time. None of the purchases reflected in the table below were purchases under the share repurchase program.
On February 8, 2019 the Company issued 224,066 shares of common stock to the holder of a warrant the Company originally issued to the Treasury in February 2009. The aggregate exercise price was approximately $4.2 million, which was paid pursuant to the cashless exercise of the warrant. The issuance of the shares was exempt from registration pursuant to Section 3(a)(9) under the Securities Act of 1933.
The following table provides information about purchases by the Company and its affiliates during the quarter ended December 31, 20182019 of equity securities that are registered by the Company pursuant to Section 12 of the Exchange Act:
| Maximum Number (or | ||||||||
| Total Number of | Appropriate Dollar | |||||||
| Shares Purchased as | Value) of Shares that | |||||||
| Part of Publicly | May Yet Be Purchased | |||||||
| Total Number of | Average Price | Announced Plans or | Under the Plans or | |||||
| Period | Shares Purchased | Paid per Share | Programs | Programs(1) | ||||
| 10/01/18-10/31/18 | 0 | $0.00 | 0 | $0.00 | ||||
| 11/01/18-11/30/18 | 1,023 | 43.68 | 0 | 0.00 | ||||
| 12/01/18-12/31/18 | 0 | 0.00 | 0 | 0.00 | ||||
| Total | 1,023 | $43.68 | 0 | $0.00 |
| | | | | | | | | | |
|
| |
| | |
|
|
| Maximum Number (or | |
| | | | | | | Total Number of | | Appropriate Dollar | |
| | | | | | | Shares Purchased as | | Value) of Shares that | |
| | | | | | | Part of Publicly | | May Yet Be Purchased | |
| | Total Number of | | Average Price | | Announced Plans or | | Under the Plans or | ||
Period |
| Shares Purchased |
| Paid per Share |
| Programs |
| Programs(1) | ||
| | | | | | | | | | |
10/01/19 - 10/31/19 |
| 0 | | $ | 0.00 |
| 0 | | $ | 0.00 |
11/01/19 - 11/30/19 |
| 1,125 | |
| 47.38 |
| 0 | |
| 0.00 |
12/01/19 - 12/31/19 |
| 0 | |
| 0.00 |
| 0 | |
| 0.00 |
| | | | | | | | | | |
Total |
| 1,125 | | $ | 47.38 |
| 0 | | $ | 0.00 |
| (1) | Does not reflect $30 million shares that were authorized for purchase after the periods reflected in this table. |
The shares purchased during the quarter were held as treasury stock and credited to the deferred share accounts of nine nonemployeenon-employee directors under the Company’s directors’ deferred compensation plan.
26
The following selected financial data as of the year-end for each of the five years in the five-year period ended December 31, 2018,2019 has been derived from the Company’s Consolidated Financial Statements and the results of operations for each such period. This financial data should be read in conjunction with the Consolidated Financial Statements included in this Annual reportReport of Form 10-K.
| (in thousands except share and per share data) | 2018 | 2017 | 2016 | 2015 | 2014 | ||||
| Ending period balances | |||||||||
| Assets | $4,875,254 | $4,682,976 | $4,290,025 | $3,766,286 | $3,443,284 | ||||
| Deposits | 4,044,065 | 4,008,655 | 3,577,912 | 3,183,421 | 2,873,120 | ||||
| Loans, net of deferred fees | 3,914,745 | 3,818,459 | 3,470,927 | 3,080,929 | 2,762,320 | ||||
| Allowance for loan losses | 48,453 | 47,121 | 43,718 | 43,610 | 46,262 | ||||
| Total equity | 521,704 | 468,667 | 427,067 | 392,901 | 361,385 | ||||
| Average balances | |||||||||
| Total assets | $4,758,392 | $4,443,106 | $4,039,719 | $3,597,190 | $3,318,271 | ||||
| Earning assets | 4,461,366 | 4,183,112 | 3,799,963 | 3,384,178 | 3,141,290 | ||||
| Investments | 562,385 | 530,275 | 493,656 | 476,153 | 475,068 | ||||
| Loans, net of deferred fees | 3,843,912 | 3,610,908 | 3,225,635 | 2,885,568 | 2,650,678 | ||||
| Total deposits | 4,093,894 | 3,757,209 | 3,477,816 | 3,088,598 | 2,797,929 | ||||
| Interest bearing deposits | 3,235,867 | 2,967,902 | 2,753,466 | 2,478,674 | 2,299,578 | ||||
| Interest bearing liabilities | 3,382,507 | 3,178,439 | 2,872,691 | 2,589,915 | 2,461,352 | ||||
| Total equity | 487,062 | 450,796 | 416,034 | 378,106 | 343,135 | ||||
| Income statement data | |||||||||
| Net interest income | $151,271 | $135,892 | $118,481 | $105,927 | $102,303 | ||||
| Net interest income-fully tax equivalent | 153,088 | 139,015 | 120,719 | 107,902 | 104,232 | ||||
| Provision for loan loss | 6,400 | 3,000 | 1,150 | 0 | 0 | ||||
| Non-interest income | 40,110 | 36,009 | 32,864 | 31,479 | 30,053 | ||||
| Non-interest expense | 86,037 | 79,267 | 72,978 | 68,206 | 66,166 | ||||
| Net income | 80,411 | 57,330 | 52,084 | 46,367 | 43,805 | ||||
| Per share data * | |||||||||
| Basic net income per common share | $3.18 | $2.28 | $2.08 | $1.86 | $1.77 | ||||
| Diluted net income per common share | 3.13 | 2.23 | 2.05 | 1.84 | 1.74 | ||||
| Cash dividends declared per common share | 1.00 | 0.85 | 0.73 | 0.63 | 0.55 | ||||
| Dividend payout | 31.95% | 38.12% | 35.61% | 34.36% | 31.42% | ||||
| Book value per common share | 20.62 | 18.60 | 17.01 | 15.74 | 14.55 | ||||
| Basic weighted average common shares outstanding | 25,288,533 | 25,181,208 | 25,056,095 | 24,926,354 | 24,803,295 | ||||
| Diluted weighted average common shares outstanding | 25,727,831 | 25,663,381 | 25,460,727 | 25,245,569 | 25,172,183 | ||||
| Key ratios | |||||||||
| Return on average assets | 1.69% | 1.29% | 1.29% | 1.29% | 1.32% | ||||
| Return on average total equity | 16.51% | 12.72% | 12.52% | 12.26% | 12.77% | ||||
| Equity to average assets | 10.24% | 10.15% | 10.30% | 10.51% | 10.34% | ||||
| Net interest margin | 3.43% | 3.33% | 3.18% | 3.19% | 3.32% | ||||
| Efficiency | 44.96% | 46.11% | 48.22% | 49.64% | 49.99% | ||||
| Asset Quality | |||||||||
| Net charge offs to average loans | 0.13% | -0.01% | 0.03% | 0.09% | 0.10% | ||||
| Loan loss reserve to total loans | 1.24% | 1.23% | 1.26% | 1.42% | 1.67% | ||||
| Loan loss reserve to nonperforming loans | 667.40% | 500.91% | 653.31% | 334.04% | 337.51% | ||||
| Nonperforming assets to total loans | 0.19% | 0.25% | 0.20% | 0.43% | 0.51% | ||||
| Other Data | |||||||||
| Full-time equivalent employees | 553 | 539 | 524 | 518 | 496 | ||||
| Offices | 49 | 49 | 48 | 47 | 46 |
| | | | | | | | | | | | | | | | |
(in thousands except share and per share data) |
| 2019 |
| 2018 |
| 2017 |
| 2016 |
| 2015 |
| |||||
Ending period balances |
| |
|
| |
|
| |
|
| |
|
| |
| |
Assets | | $ | 4,946,745 | | $ | 4,875,254 | | $ | 4,682,976 | | $ | 4,290,025 | | $ | 3,766,286 | |
Deposits | |
| 4,133,819 | |
| 4,044,065 | |
| 4,008,655 | |
| 3,577,912 | |
| 3,183,421 | |
Loans, net of deferred fees | |
| 4,065,828 | |
| 3,914,745 | |
| 3,818,459 | |
| 3,470,927 | |
| 3,080,929 | |
Allowance for loan losses | |
| 50,652 | |
| 48,453 | |
| 47,121 | |
| 43,718 | |
| 43,610 | |
Total equity | |
| 598,100 | |
| 521,704 | |
| 468,667 | |
| 427,067 | |
| 392,901 | |
Average balances | |
| | |
|
| |
|
| |
|
| |
|
| |
Total assets | | $ | 4,941,904 | | $ | 4,758,392 | | $ | 4,443,106 | | $ | 4,039,719 | | $ | 3,597,190 | |
Earning assets | |
| 4,656,707 | |
| 4,461,366 | |
| 4,183,112 | |
| 3,799,963 | |
| 3,384,178 | |
Investments - available-for-sale | |
| 603,580 | |
| 562,385 | |
| 530,275 | |
| 493,656 | |
| 476,153 | |
Loans, net of deferred fees | |
| 3,974,532 | |
| 3,843,912 | |
| 3,610,908 | |
| 3,225,635 | |
| 2,885,568 | |
Total deposits | |
| 4,242,524 | |
| 4,093,894 | |
| 3,757,209 | |
| 3,477,816 | |
| 3,088,598 | |
Interest bearing deposits | |
| 3,298,406 | |
| 3,235,867 | |
| 2,967,902 | |
| 2,753,466 | |
| 2,478,674 | |
Interest bearing liabilities | |
| 3,390,512 | |
| 3,382,507 | |
| 3,178,439 | |
| 2,872,691 | |
| 2,589,915 | |
Total equity | |
| 562,601 | |
| 487,062 | |
| 450,796 | |
| 416,034 | |
| 378,106 | |
Income statement data | |
|
| |
|
| |
|
| |
|
| |
|
| |
Net interest income | | $ | 155,047 | | $ | 151,271 | | $ | 135,892 | | $ | 118,481 | | $ | 105,927 | |
Net interest income-fully tax equivalent | |
| 157,176 | |
| 153,088 | |
| 139,015 | |
| 120,719 | |
| 107,902 | |
Provision for loan loss | |
| 3,235 | |
| 6,400 | |
| 3,000 | |
| 1,150 | |
| 0 | |
Non-interest income | |
| 44,997 | |
| 40,302 | |
| 36,040 | |
| 32,864 | |
| 31,479 | |
Non-interest expense | |
| 89,424 | |
| 86,229 | |
| 79,298 | |
| 72,978 | |
| 68,206 | |
Net income | |
| 87,047 | |
| 80,411 | |
| 57,330 | |
| 52,084 | |
| 46,367 | |
Per share data * | |
|
| |
|
| |
|
| |
|
| |
|
| |
Basic net income per common share | | $ | 3.40 | | $ | 3.18 | | $ | 2.28 | | $ | 2.08 | | $ | 1.86 | |
Diluted net income per common share | |
| 3.38 | |
| 3.13 | |
| 2.23 | |
| 2.05 | |
| 1.84 | |
Cash dividends declared per common share | |
| 1.16 | |
| 1.00 | |
| 0.85 | |
| 0.73 | |
| 0.63 | |
Dividend payout | |
| 34.32 | % |
| 31.95 | % |
| 38.12 | % |
| 35.61 | % |
| 34.36 | % |
Book value per common share | |
| 23.34 | |
| 20.62 | |
| 18.60 | |
| 17.01 | |
| 15.74 | |
Basic weighted average common shares outstanding | |
| 25,588,404 | |
| 25,288,533 | |
| 25,181,208 | |
| 25,056,095 | |
| 24,926,354 | |
Diluted weighted average common shares outstanding | |
| 25,758,893 | |
| 25,727,831 | |
| 25,663,381 | |
| 25,460,727 | |
| 25,245,569 | |
Key ratios | |
|
| |
|
| |
|
| |
|
| |
|
| |
Return on average assets | |
| 1.76 | % |
| 1.69 | % |
| 1.29 | % |
| 1.29 | % |
| 1.29 | % |
Return on average total equity | |
| 15.47 | % |
| 16.51 | % |
| 12.72 | % |
| 12.52 | % |
| 12.26 | % |
Average Equity to average assets | |
| 11.38 | % |
| 10.24 | % |
| 10.15 | % |
| 10.30 | % |
| 10.51 | % |
Net interest margin | |
| 3.38 | % |
| 3.43 | % |
| 3.33 | % |
| 3.18 | % |
| 3.19 | % |
Efficiency | |
| 44.70 | % |
| 45.01 | % |
| 46.11 | % |
| 48.22 | % |
| 49.64 | % |
Asset Quality | |
|
| |
|
| |
|
| |
|
| |
|
| |
Net charge offs to average loans | |
| 0.03 | % |
| 0.13 | % |
| (0.01) | % |
| 0.03 | % |
| 0.09 | % |
Loan loss reserve to total loans | |
| 1.25 | % |
| 1.24 | % |
| 1.23 | % |
| 1.26 | % |
| 1.42 | % |
Loan loss reserve to nonperforming loans | |
| 270.58 | % |
| 667.40 | % |
| 500.91 | % |
| 653.31 | % |
| 334.04 | % |
Nonperforming assets to total loans | |
| 0.47 | % |
| 0.19 | % |
| 0.25 | % |
| 0.20 | % |
| 0.43 | % |
Other Data | |
| | |
|
| |
|
| |
|
| |
|
| |
Full-time equivalent employees | |
| 568 | |
| 553 | |
| 539 | |
| 524 | |
| 518 | |
Offices | |
| 50 | |
| 49 | |
| 49 | |
| 48 | |
| 47 | |
* Share and per per share data has been adjusted for a 3-for-2 stock split on July 25, 2016 in the form of a stock dividend on August 5, 2016.
27
OVERVIEW
Net income in 20182019 was $87.0 million, up 8.3% from $80.4 million in 2018 and up 40.3%51.8% from $57.3 million in 2017 and up from $52.1 million in 2016.2017. Diluted net income per common share was $3.38 in 2019, $3.13 in 2018 and $2.23 in 2017 and $2.05 in 2016.2017. Return on average total assets was 1.76% in 2019 versus 1.69% in 2018 versusand 1.29% in 2017 and 2016.2017. Return on average common shareholders’total equity was 15.47% in 2019 versus 16.51% in 2018 versusand 12.72% in 2017 and 12.52% in 2016.2017. The dividend payout ratio, with respect to diluted earnings per share, was 34.32% in 2019, 31.95% in 2018 and 38.12% in 2017 and 35.61% in 2016.2017. The average equity to average assets ratio was 11.38% in 2019 compared to 10.24% in 2018 compared toand 10.15% in 20172017.
Net income in 2019 was positively impacted by a $4.7 million increase in noninterest income, a $3.8 million increase in net interest income and 10.30%a $3.2 million decrease in 2016.
Net income in 2018 was positively impacted by a $15.4 million increase in net interest income and a $4.1$4.3 million increase in noninterest income. In addition, income tax expense decreased $13.8 million from 2017. The decrease was largely due to the Tax Cuts and Jobs Act which lowered the Company’s federal tax rate to 21% from 35%. Offsetting these positive impacts was a $6.8$6.9 million increase in noninterest expense and a $3.4 million increase in the provision for loan losses.
Total assets were $4.947 billion as of the Tax Cuts and Jobs Act that was enacted into law on December 22, 2017, the Company revalued its net deferred tax asset position to reflect the reduction in its federal corporate income tax rate from 35% to 21%. This revaluation resulted in a non-cash, non-operating and non-recurring income tax expense adjustment of approximately $4.1 million, or $0.16 per diluted share, for the year ending December 31, 2017.
CRITICAL ACCOUNTING POLICIES
Certain of the Company’s accounting policies are important to the portrayal of the Company’s financial condition, since they require management to make difficult, complex or subjective judgments, some of which may relate to matters that are inherently uncertain. Estimates associated with these policies are susceptible to material changes as a result of changes in facts and circumstances. Some of the facts and circumstances which could affect these judgments include changes in interest rates, in the performance of the economy or in the financial condition of borrowers. Management believes that its critical accounting policies include determining the allowance for loan losses and the valuation and other-than-temporary impairment of investment securities.
Allowance for Loan Losses
The Company maintains an allowance for loan losses to provide for probable incurred credit losses. Loan losses are charged against the allowance when management believes that the principal is uncollectable. Subsequent recoveries, if any, are credited to the allowance. Allocations of the allowance are made for specific loans and for pools of similar types of loans, although the entire allowance is available for any loan that, in management’s judgment, should be charged against the allowance. A provision for loan losses is taken based on management’s ongoing evaluation of the appropriate allowance balance. A formal evaluation of the adequacy of the loan loss allowance is conducted monthly. The ultimate recovery of all loans is susceptible to future market factors beyond the Company’s control.
The level of loan loss provision is influenced by growth in the overall loan portfolio, emerging market risk, emerging concentration risk, commercial loan focus and large credit concentration, new industry lending activity, general economic conditions and historical loss analysis. In addition, management gives consideration to changes in the allocation for specific watch list credits in determining the appropriate level of the loan loss provision. Furthermore, management’s overall view on credit quality is a factor in the determination of the provision.
The determination of the appropriate allowance is inherently subjective, as it requires significant estimates by management. The Company has an established process to determine the adequacy of the allowance for loan losses that generally includes consideration of the following factors: changes in the nature and volume of the loan portfolio, overall portfolio quality and current economic conditions that may affect the borrowers’ ability to repay. Consideration is not limited to these factors although they represent the most commonly cited factors. With respect to specific allocation levels for individual credits, management considers the current valuation of collateral and the amounts and timing of expected future cash flows as the primary measures. Management also considers trends in adversely classified loans based upon an ongoing review of those credits. With respect to pools of similar loans,
28
allocations are assigned based upon historical experience subject to a floor, unless the rate of loss is expected to be greater than historical losses as noted
Commercial loans are subject to a dual standardized grading process administered by the credit administration function. These grade assignments are performed independent of each other and a consensus is reached by credit administration and the loan review officer. Specific allowances are established in cases where management has identified significant conditions or circumstances related to an individual credit that indicate the loan is impaired. Considerations with respect to specific allocations for these individual credits include, but are not limited to, the following: (a) does the customer’s cash flow or net worth appear insufficient to repay the loan; (b) is there adequate collateral to repay the loan; (c) has the loan been criticized in a regulatory examination; (d) is the loan impaired; (e) are there other reasons where the ultimate collectability of the loan is in question; or (f) are there unique loan characteristics that require special monitoring.
Allocations are also applied to categories of loans considered not to be individually impaired, but for which the rate of loss is expected to be consistent with or greater than historical averages. Such allocations are based on past loss experience and information about specific borrower situations and estimated collateral values. In addition, general allocations are made for other pools of loans, including non-classified loans. These general pooled loan allocations are performed for portfolio segments of commercial and industrial, commercial real estate and multi-family, agri-business and agricultural, other commercial, consumer 1-4 family mortgage and other consumer loans, and loans within certain industry categories believed to present unique risk of loss. General allocations of the allowance are primarily made based on a three-year historical average for loan losses for these portfolios, subject to a floor, and are subjectively adjusted for economic factors and portfolio trends.
Due to the imprecise nature of estimating the allowance for loan losses, the Company’s allowance for loan losses includes an unallocated component. The unallocated component of the allowance for loan losses incorporates the Company’s judgmental determination of inherent losses that may not be fully reflected in other allocations, including factors such as the level of classified credits, economic uncertainties, industry trends impacting specific portfolio segments, broad portfolio quality trends and trends in the composition of the Company’s large commercial loan portfolio and related large dollar exposures to individual borrowers.
Valuation and Other-Than-Temporary Impairment of Available-for-Sale Investment Securities
The fair values of securities available for saleavailable-for-sale are determined on a recurring basis by obtaining quoted prices on nationally recognized securities exchanges or pricing models, which utilize significant observable inputs such as matrix pricing. This is a mathematical technique widely used in the industry to value debt securities without relying exclusively on quoted prices for the specific securities but rather by relying on the securities’ relationship to other benchmark quoted securities. Different judgments and assumptions used in pricing could result in different estimates of value. The fair value of certain securities is determined using unobservable inputs, primarily observable inputs of similar securities.
At the end of each reporting period, securities held in the investment portfolio are evaluated on an individual security level for other-than-temporary impairment in accordance with current accounting guidance. Impairment is other-than-temporary if the decline in the fair value of the security is below its amortized cost and it is probable that all amounts due according to the contractual terms of a debt security will not be received.
Significant judgments are required in determining impairment, which includes making assumptions regarding the estimated prepayments, loss assumptions and the change in interest rates.
29
We consider the following factors when determining other-than-temporary impairment for a security or investment:
| the length of time and the extent to which the market value has been less than amortized cost; |
| the financial condition and near-term prospects of the issuer; |
| the underlying fundamentals of the relevant market and the outlook for such market for the near future; and |
| our intent and ability to hold the security for a period of time sufficient to allow for any anticipated recovery in market value. |
The assessment of whether a decline exists that is other-than-temporary, involves a high degree of subjectivity and judgment and is based on the information available to management at a point in time. If, in management’s judgment, other-than-temporary
RESULTS OF OPERATIONS
Overview
In 20182019 and 2017,2018, the Company continued to grow loans and deposits organically, in its geographic footprint of northern Indiana and in central Indiana in the Indianapolis market. The Company had 4950 branches as of December 31, 2018 and opened its 50th branch located in downtown Indianapolis in January of 2019. The Company’s profitability has been positively impacted by growth in loans and deposits. In addition, asset quality has remained stable. The core banking contributions to noninterest income of deposit,mortgage banking, loan and wealth management fee income increased in 2018.2019. Overall, expense growth has reflected our continued investment in people, technology and our branch infrastructure. The outlook for 20192020 includes plans for continued organic loan and deposit growth, a disciplined credit philosophy, and continued investment in the Company in the form of staff additions, continued expansion in the Indianapolis marketplace andour geographic footprint, continued investments in technology.
Selected income statement information for the years ended December 31, 2019, 2018 2017 and 20162017 is presented in the following table.
| (dollars in thousands) | 2018 | 2017 | 2016 | ||
| Income Statement Summary: | |||||
| Net interest income | $151,271 | $135,892 | $118,481 | ||
| Provision for loan losses | 6,400 | 3,000 | 1,150 | ||
| Noninterest income | 40,110 | 36,009 | 32,864 | ||
| Noninterest expense | 86,037 | 79,267 | 72,978 | ||
| Other Data: | |||||
| Efficiency ratio (1) | 44.96% | 46.11% | 48.22% | ||
| Dilutive EPS | $3.13 | $2.23 | $2.05 | ||
| Tangible capital ratio (2) | 10.63% | 9.93% | 9.89% | ||
| Net charge-offs to average loans | 0.13% | -0.01% | 0.03% | ||
| Net interest margin | 3.43% | 3.33% | 3.18% | ||
| Noninterest income to total revenue | 20.96% | 20.95% | 21.71% |
| | | | | | | | | | |
(dollars in thousands) |
| 2019 |
| 2018 |
| 2017 |
| |||
Income Statement Summary: | |
| | |
| | |
| |
|
Net interest income | | $ | 155,047 | | $ | 151,271 | | $ | 135,892 | |
Provision for loan losses | |
| 3,235 | |
| 6,400 | |
| 3,000 | |
Noninterest income | |
| 44,997 | |
| 40,302 | |
| 36,040 | |
Noninterest expense | |
| 89,424 | |
| 86,229 | |
| 79,298 | |
Other Data: | |
|
| |
|
| |
|
| |
Efficiency ratio (1) | |
| 44.70 | % |
| 45.01 | % |
| 46.11 | % |
Dilutive EPS | | $ | 3.38 | | $ | 3.13 | | $ | 2.23 | |
Tangible capital ratio (2) | |
| 12.02 | % |
| 10.63 | % |
| 9.93 | % |
Net charge-offs (recoveries) to average loans | |
| 0.03 | % |
| 0.13 | % |
| (0.01) | % |
Net interest margin | |
| 3.38 | % |
| 3.43 | % |
| 3.33 | % |
Noninterest income to total revenue | |
| 22.49 | % |
| 21.04 | % |
| 20.96 | % |
| (1) | Noninterest expense/Net interest income plus Noninterest |
| (2) | Tangible common equity, tangible assets, and the tangible capital ratio are non-GAAP financial measures calculated using GAAP amounts. Tangible common equity is calculated by excluding the balance of goodwill and other intangible assets from the calculation of |
Net Income
Net income was $87.0 million in 2019, an increase of $6.6 million, or 8.3%, versus net income of $80.4 million in 2018. The increase in net income from 2018 to 2019 was primarily due to the increase in noninterest income of $4.7 million, or 11.6%. In
30
addition, net interest income increased $3.8 million, or 2.5%, to $155.0 million versus $151.3 million in 2018 and the provision for loan losses decreased $3.2 million, or 49.5%. Noninterest expense increased by $3.2 million, or 3.7% and income tax expense increased $1.8 million, or 9.7%.
Net income was $80.4 million in 2018, an increase of $23.1 million, or 40.3%, versus net income of $57.3 million in 2017. The increase in net income from 2017 to 2018 was primarily due to the increase in net interest income in the amount of $15.4 million, or 11.3%, to $151.3 million versus $135.9 million in 2017. In addition, income tax expense decreased by $13.8 million to $18.5 million and noninterest income increased $4.1$4.3 million to $40.1$40.3 million, offset by increases in noninterest expense and provision expense of $6.8$6.9 million and $3.4 million, respectively.
Net Interest Income
The following table presents a three-year average balance sheet and, for each major asset and liability category, its related interest income and yield or its expense and rate for the years ended December 31.
THREE YEAR AVERAGE BALANCE SHEET AND NET INTEREST ANALYSIS
| 2018 | 2017 | 2016 | ||||||||||||||||||
| Average | Interest | Yield (1)/ | Average | Interest | Yield (1)/ | Average | Interest | Yield (1)/ | ||||||||||||
| (fully tax equivalent basis, dollars in thousands) | Balance | Income | Rate | Balance | Income | Rate | Balance | Income | Rate | |||||||||||
| Earning Assets | ||||||||||||||||||||
| Loans: | ||||||||||||||||||||
| Taxable (2)(3) | $3,821,182 | $181,451 | 4.75 | % | $3,589,734 | $150,295 | 4.19 | % | $3,213,188 | $124,830 | 3.88 | % | ||||||||
| Tax exempt (1) | 22,730 | 1,016 | 4.47 | 21,174 | 1,103 | 5.21 | 12,447 | 687 | 5.52 | |||||||||||
| Investments: (1) | ||||||||||||||||||||
| Available for sale | 562,385 | 17,411 | 3.10 | 530,275 | 17,069 | 3.23 | 493,656 | 15,319 | 3.10 | |||||||||||
| Short-term investments | 3,868 | 49 | 1.27 | 5,565 | 27 | 0.49 | 6,007 | 14 | 0.23 | |||||||||||
| Interest bearing deposits | 51,201 | 860 | 1.68 | 36,364 | 327 | 0.90 | 74,665 | 339 | 0.45 | |||||||||||
| Total earning assets | $4,461,366 | $200,787 | 4.50 | % | $4,183,112 | $168,821 | 4.04 | % | $3,799,963 | $141,189 | 3.72 | % | ||||||||
| Less: Allowance for loan losses | (47,722) | (44,849) | (43,274) | |||||||||||||||||
| Nonearning Assets | ||||||||||||||||||||
| Cash and due from banks | 144,727 | 114,967 | 110,104 | |||||||||||||||||
| Premises and equipment | 56,842 | 55,141 | 49,782 | |||||||||||||||||
| Other nonearning assets | 143,179 | 134,735 | 123,144 | |||||||||||||||||
| Total assets | $4,758,392 | $4,443,106 | $4,039,719 | |||||||||||||||||
| Interest Bearing Liabilities | ||||||||||||||||||||
| Savings deposits | $257,959 | $331 | 0.13 | % | $272,811 | $401 | 0.15 | % | $264,669 | $441 | 0.17 | % | ||||||||
| Interest bearing checking accounts | 1,475,776 | 17,940 | 1.22 | 1,401,216 | 9,999 | 0.71 | 1,282,257 | 5,654 | 0.44 | |||||||||||
| Time deposits: | ||||||||||||||||||||
| In denominations under $100,000 | 265,604 | 4,017 | 1.51 | 241,170 | 2,927 | 1.21 | 246,971 | 2,832 | 1.15 | |||||||||||
| In denominations over $100,000 | 1,236,528 | 22,625 | 1.83 | 1,052,705 | 13,699 | 1.30 | 959,569 | 10,017 | 1.04 | |||||||||||
| Miscellaneous short-term borrowings | 115,711 | 1,143 | 0.99 | 179,579 | 1,446 | 0.81 | 88,265 | 352 | 0.40 | |||||||||||
| Long-term borrowings and | ||||||||||||||||||||
| subordinated debentures | 30,929 | 1,643 | 5.31 | 30,958 | 1,334 | 4.31 | 30,960 | 1,174 | 3.79 | |||||||||||
| Total interest bearing liabilities | $3,382,507 | $47,699 | 1.41 | % | $3,178,439 | $29,806 | 0.94 | % | $2,872,691 | $20,470 | 0.71 | % | ||||||||
| Noninterest Bearing Liabilities | ||||||||||||||||||||
| Demand deposits | 858,027 | 789,307 | 724,350 | |||||||||||||||||
| Other liabilities | 30,796 | 24,564 | 26,644 | |||||||||||||||||
| Stockholders' Equity | 487,062 | 450,796 | 416,034 | |||||||||||||||||
| Total liabilities and stockholders' equity | $4,758,392 | $4,443,106 | $4,039,719 | |||||||||||||||||
| Interest Margin Recap | ||||||||||||||||||||
| Interest income/average earning assets | 200,787 | 4.50 | 168,821 | 4.04 | 141,189 | 3.72 | ||||||||||||||
| Interest expense/average earning assets | 47,699 | 1.07 | 29,806 | 0.71 | 20,470 | 0.54 | ||||||||||||||
| Net interest income and margin | $153,088 | 3.43 | % | $139,015 | 3.33 | % | $120,719 | 3.18 | % | |||||||||||
| | | | | | | | | | | | | | | | | | | | | | | | | | |
|
| 2019 |
| 2018 |
| 2017 |
| |||||||||||||||||||
| | Average | | Interest | | Yield (1)/ | | Average | | Interest | | Yield (1)/ | | Average | | Interest | | Yield (1)/ |
| |||||||
(fully tax equivalent basis, dollars in thousands) |
| Balance |
| Income |
| Rate |
| Balance |
| Income |
| Rate |
| Balance |
| Income |
| Rate |
| |||||||
Earning Assets |
| |
|
| |
|
| |
|
| |
|
| |
|
|
|
| |
|
| |
|
|
| |
Loans: |
| |
|
| |
|
| |
|
| |
|
| |
|
|
|
| |
|
| |
|
|
| |
Taxable (2)(3) | | $ | 3,950,130 | | $ | 196,733 |
| | 4.98 | % | $ | 3,821,182 | | $ | 181,451 |
| 4.75 | % | $ | 3,589,734 | | $ | 150,295 |
| 4.19 | % |
Tax exempt (1) | |
| 24,402 | |
| 1,186 |
| | 4.86 | |
| 22,730 | |
| 1,016 |
| 4.47 | |
| 21,174 | |
| 1,103 |
| 5.21 | |
Investments: (1) | |
|
| |
|
|
| |
| |
|
| |
|
|
| |
|
|
| |
|
|
|
| |
Available-for-sale | |
| 603,580 | |
| 17,930 |
| | 2.97 | |
| 562,385 | |
| 17,411 |
| 3.10 | |
| 530,275 | |
| 17,069 |
| 3.23 | |
Short-term investments | |
| 18,771 | |
| 339 |
| | 1.81 | |
| 3,868 | |
| 49 |
| 1.27 | |
| 5,565 | |
| 27 |
| 0.49 | |
Interest bearing deposits | |
| 59,824 | |
| 1,151 |
| | 1.92 | |
| 51,201 | |
| 860 |
| 1.68 | |
| 36,364 | |
| 327 |
| 0.90 | |
Total earning assets | | $ | 4,656,707 | | $ | 217,339 |
| | 4.67 | % | $ | 4,461,366 | | $ | 200,787 |
| 4.50 | % | $ | 4,183,112 | | $ | 168,821 |
| 4.04 | % |
Less: Allowance for loan losses | |
| (50,062) | |
| |
| | | |
| (47,722) | |
| |
| | |
| (44,849) | |
|
|
|
| |
Nonearning Assets | |
|
| |
|
|
| |
| |
|
| |
|
|
| |
|
|
| |
|
|
|
| |
Cash and due from banks | |
| 119,450 | | | |
| | | |
| 144,727 | | | |
| | | | 114,967 | |
|
|
|
| |
Premises and equipment | |
| 59,147 | | | |
| | | |
| 56,842 | | | |
| | | | 55,141 | |
|
|
|
| |
Other nonearning assets | |
| 156,662 | | | |
| | | |
| 143,179 | | | |
| | | | 134,735 | |
|
|
|
| |
Total assets | | $ | 4,941,904 | | | | | | | | $ | 4,758,392 | | | | | | | $ | 4,443,106 | |
|
|
|
| |
| | | | | | | | | | | | | | | | | | | | | | | | | | |
Interest Bearing Liabilities | |
|
| |
|
| |
|
| |
|
| |
|
| |
|
|
|
| |
|
|
|
| |
Savings deposits | | $ | 240,293 | | $ | 260 | |
| 0.11 | % | $ | 257,959 | | $ | 331 | | 0.13 | % | $ | 272,811 | | $ | 401 |
| 0.15 | % |
Interest bearing checking accounts | |
| 1,669,045 | |
| 26,006 | |
| 1.56 | |
| 1,475,776 | |
| 17,940 | | 1.22 | |
| 1,401,216 | |
| 9,999 |
| 0.71 | |
Time deposits: | |
|
| |
|
| |
|
| |
|
| |
|
| |
|
|
|
| |
|
|
|
| |
In denominations under $100,000 | |
| 277,896 | |
| 5,337 | |
| 1.92 | |
| 265,604 | |
| 4,017 | | 1.51 | |
| 241,170 | |
| 2,927 |
| 1.21 | |
In denominations over $100,000 | |
| 1,111,172 | |
| 25,545 | |
| 2.30 | |
| 1,236,528 | |
| 22,625 | | 1.83 | |
| 1,052,705 | |
| 13,699 |
| 1.30 | |
Miscellaneous short-term borrowings | |
| 61,347 | |
| 1,311 | |
| 2.14 | |
| 115,711 | |
| 1,143 | | 0.99 | |
| 179,579 | |
| 1,446 |
| 0.81 | |
Long-term borrowings and | |
|
| |
|
| |
|
| |
|
| |
|
| |
|
|
|
| |
|
|
|
| |
subordinated debentures | |
| 30,759 | |
| 1,704 | |
| 5.54 | |
| 30,929 | |
| 1,643 | | 5.31 | |
| 30,958 | |
| 1,334 |
| 4.31 | |
Total interest bearing liabilities | | $ | 3,390,512 | | $ | 60,163 | |
| 1.77 | % | $ | 3,382,507 | | $ | 47,699 | | 1.41 | % | $ | 3,178,439 | | $ | 29,806 |
| 0.94 | % |
Noninterest Bearing Liabilities | |
|
| |
|
| |
|
| |
|
| |
|
| |
|
|
|
| |
|
|
|
| |
Demand deposits | |
| 944,118 | | | | |
| | |
| 858,027 | | | | |
| |
| 789,307 | |
|
|
|
| |
Other liabilities | |
| 44,673 | | | | |
| | |
| 30,796 | | | | |
| |
| 24,564 | |
|
|
|
| |
Stockholders' Equity | |
| 562,601 | | | | |
| | |
| 487,062 | | | | |
| |
| 450,796 | |
|
|
|
| |
Total liabilities and stockholders' equity | | $ | 4,941,904 | | | | | | | | $ | 4,758,392 | | | | | | | $ | 4,443,106 | |
|
|
|
| |
| | | | | | | | | | | | | | | | | | | | | | | | | | |
Interest Margin Recap | |
|
| |
|
| |
|
| |
|
| |
|
| |
|
|
|
| |
|
|
|
| |
Interest income/average earning assets | | | | |
| 217,339 | |
| 4.67 | |
| | |
| 200,787 | | 4.50 | |
| | |
| 168,821 |
| 4.04 | |
Interest expense/average earning assets | | | | |
| 60,163 | |
| 1.29 | |
| | |
| 47,699 | | 1.07 | |
| | |
| 29,806 |
| 0.71 | |
Net interest income and margin | | | | | $ | 157,176 | | | 3.38 | % |
| | | $ | 153,088 | | 3.43 | % |
| | | $ | 139,015 |
| 3.33 | % |
| (1) | Tax exempt income was converted to a fully taxable equivalent basis at a 21 percent tax rate for 2019 and 2018 and 35 percent tax rate for |
| (2) | Loan fees, which are immaterial in relation to total taxable loan interest income for the years ended December 31, 2019, 2018 |
| (3) | Nonaccrual loans are included in the average balance of taxable loans. |
31
The following table shows fluctuations in net interest income attributable to changes in the average balances of assets and liabilities and the yields earned or rates paid for the years ended December 31.
NET INTEREST INCOME – RATE/VOLUME ANALYSIS (fully tax equivalent basis, dollars in thousands)
2018 Over (Under) 2017 (1) | 2017 Over (Under) 2016 (1) | ||||||||||
| Attributable to | Total | Attributable to | Total | ||||||||
| Volume | Rate | Change | Volume | Rate | Change | ||||||
| Interest Income (2) | |||||||||||
| Loans: | |||||||||||
| Taxable | $10,112 | $21,044 | $31,156 | $15,312 | $10,153 | $25,465 | |||||
| Tax exempt | 77 | (164) | (87) | 457 | (41) | 416 | |||||
| Investments: | |||||||||||
| Available for sale | 1,009 | (667) | 342 | 1,165 | 585 | 1,750 | |||||
| Short-term investments | (10) | 32 | 22 | (1) | 14 | 13 | |||||
| Interest bearing deposits | 170 | 363 | 533 | (232) | 220 | (12) | |||||
| Total interest income | 11,358 | 20,608 | 31,966 | 16,701 | 10,931 | 27,632 | |||||
| Interest Expense | |||||||||||
| Savings deposits | (21) | (49) | (70) | 13 | (53) | (40) | |||||
| Interest bearing checking accounts | 558 | 7,383 | 7,941 | 567 | 3,778 | 4,345 | |||||
| Time deposits: | |||||||||||
| In denominations under $100,000 | 318 | 772 | 1,090 | (68) | 163 | 95 | |||||
| In denominations over $100,000 | 2,684 | 6,242 | 8,926 | 1,040 | 2,642 | 3,682 | |||||
| Miscellaneous short-term borrowings | (585) | 282 | (303) | 551 | 543 | 1,094 | |||||
| Long-term borrowings and | |||||||||||
| subordinated debentures | (1) | 310 | 309 | 0 | 160 | 160 | |||||
| Total interest expense | 2,953 | 14,940 | 17,893 | 2,103 | 7,233 | 9,336 | |||||
| Net Interest Income (tax equivalent) | $8,405 | $5,668 | $14,073 | $14,598 | $3,698 | $18,296 | |||||
| | | | | | | | | | | | | | | | | | |
|
| 2019 Over (Under) 2018 (1) |
| 2018 Over (Under) 2017 (1) | ||||||||||||||
| | Attributable to | | Total | | Attributable to | | Total | ||||||||||
|
| Volume |
| Rate |
| Change |
| Volume |
| Rate |
| Change | ||||||
Interest Income (2) |
| |
|
| |
|
| |
|
| |
|
| |
|
| |
|
Loans: |
| |
|
| |
|
| |
|
| |
|
| |
|
| |
|
Taxable | | $ | 6,245 | | $ | 9,037 | | $ | 15,282 | | $ | 10,112 | | $ | 21,044 | | $ | 31,156 |
Tax exempt | |
| 78 | |
| 92 | |
| 170 | |
| 77 | |
| (164) | |
| (87) |
Investments: | |
|
| |
|
| |
|
| |
|
| |
|
| |
|
|
Available-for-sale | |
| 1,242 | |
| (723) | |
| 519 | |
| 1,009 | |
| (667) | |
| 342 |
Short-term investments | |
| 261 | |
| 29 | |
| 290 | |
| (10) | |
| 32 | |
| 22 |
Interest bearing deposits | |
| 156 | |
| 135 | |
| 291 | |
| 170 | |
| 363 | |
| 533 |
Total interest income | |
| 7,982 | |
| 8,570 | |
| 16,552 | |
| 11,358 | |
| 20,608 | |
| 31,966 |
| | | | | | | | | | | | | | | | | | |
Interest Expense | |
|
| |
|
| |
|
| |
|
| |
|
| |
|
|
Savings deposits | |
| (22) | |
| (49) | |
| (71) | |
| (21) | |
| (49) | |
| (70) |
Interest bearing checking accounts | |
| 2,559 | |
| 5,507 | |
| 8,066 | |
| 558 | |
| 7,383 | |
| 7,941 |
Time deposits: | |
|
| |
|
| |
|
| |
|
| |
|
| |
|
|
In denominations under $100,000 | |
| 193 | |
| 1,127 | |
| 1,320 | |
| 318 | |
| 772 | |
| 1,090 |
In denominations over $100,000 | |
| (2,460) | |
| 5,380 | |
| 2,920 | |
| 2,684 | |
| 6,242 | |
| 8,926 |
Miscellaneous short-term borrowings | |
| (717) | |
| 885 | |
| 168 | |
| (585) | |
| 282 | |
| (303) |
Long-term borrowings and | |
|
| |
|
| |
|
| |
|
| |
|
| |
|
|
subordinated debentures | |
| (9) | |
| 70 | |
| 61 | |
| (1) | |
| 310 | |
| 309 |
Total interest expense | |
| (456) | |
| 12,920 | |
| 12,464 | |
| 2,953 | |
| 14,940 | |
| 17,893 |
Net Interest Income (tax equivalent) | | $ | 8,438 | | $ | (4,350) | | $ | 4,088 | | $ | 8,405 | | $ | 5,668 | | $ | 14,073 |
| (1) | The earning assets and interest bearing liabilities used to calculate interest differentials are based on average daily balances for 2019, 2018 |
| (2) | Tax exempt income was converted to a fully taxable equivalent basis at a 21 percent tax rate for 2019 and 2018 and 35 percent tax rate for |
Net interest income increased by $3.8 million to $155.0 million in 2019 compared to 2018, primarily due to a 17 basis point increase in the yield on earning assets to 4.67% from 4.50%. In addition, average earning assets increased $195.3 million, or 4.4%, in 2019, driven by an increase of 3.8% in the average commercial loan portfolio, which reflects our continuing strategic focus on commercial lending. The net interest margin decreased to 3.38% in 2019 versus 3.43% in 2018, due to higher costs on average interest bearing liabilities, which offset an increase in the yield of earning assets during 2019. Net interest income increased by $15.4 million to $151.3 million in 2018 compared to 2017, primarily due to a 46 basis point increase in the yield on earning assets to 4.50% from 4.04%. In addition, average earning assets increased $278.3 million, or 6.7% in 2018, driven by an increase of 6.2% in the average commercial loan portfolio, which reflects our continuing strategic focus on commercial lending. The net interest margin increased to 3.43% in 2018 versus 3.33% in 2017, due to higher yields on average earning assets, which more than offset an increase in the cost of interest bearing liabilities during 2018. Net interest income increased by $17.4 million to $135.9 million in 2017 compared to 2016, primarily due to a 10.1% increase in average earning assets in 2017, driven by an increase
32
Growth in the commercial loan portfolio accounted for most of the growth in loans, as well as total earning assets, during both 20182019 and 2017,2018 and positively impacted total interest income. Management believes that the growth in the loan portfolio will likely continue in a measured butand prudent fashion as a result of our continued strategic focus on commercial and industrial lending, as well as commercial real estate lending. Loan growth was slower in 2019 and 2018 as compared to prior years due to a slowdown in manufacturing and industrial loans. In addition, managementthe utilization of commercial lines of credit has dropped in 2019 and 2018 due to softened loan demand. Management believes its organic growth strategy of continued expansion in its current geographic footprint and in Indianapolis will provide continued loan growth opportunities. During 2018,2019, growth in average loans of $233.0$130.6 million and growth in available-for-sale investment securities of $32.1$41.2 million was funded through an increase in deposits. Average demand deposits increased $86.1 million in 2019 and average interest bearing deposit accounts increased $268.0 million and average demand deposits increased $68.7 million in 2018.
The increase in the Company’s yields on average earning assets during 20182019 and 20172018 resulted from increases in market rates overall, including increases in loan portfolio yields during both years. MarketIn the third and fourth quarter of 2019, market rates were impacted by fourthree Federal Reserve Bank increasesdecreases of 25 basis points each in the Federal Funds rate,Rate, which occurred in March 2018, June 2018,July 2019, September 2018,2019, and December 2018. Yields on commercial loans increasedOctober 2019. However, the impact of these decreases was not felt until later in 2018, as a resultthe second half of higher market interest rates and due to the variable nature of the commercial loan portfolio.2019. During 20182019 management continued to focus on growing the commercial portfolio in a prudent and
Provision for Loan Losses
In 2019 the Company recorded provision for loan loss expense of $6.4$3.2 million primarily due to a charge off of $5.1 million from a single commercial loan relationship in addition to growth in the loan portfolio. The 20182019 provision expense compares to $6.4 million of provision expense recorded in 2018 and $3.0 million of provision expense recorded in 2017 and $1.2 million of provision expense recorded in 2016.2017. The allowance for loan losses at December 31, 20182019 was $48.5$50.7 million, whichand represented 1.24%1.25% of the loan portfolio, versus an allowance for loan losses of $48.5 million at the end of 2018, which represented 1.24% of the loan portfolio. The allowance for loan losses was $47.1 million at the end of 2017, which represented 1.23% of the loan portfolio. The allowance for loan losses was $43.7 million at the end of 2016, which represented 1.26% of the loan portfolio. The provision in 20172018 and 20162017 was attributable to the increasing size of the loan portfolio with consideration to the level of nonperforming loans and net charge-offs (recoveries). Net charge-offs (recoveries) of $5.1$1.0 million, or 0.13%0.03% of average loans, and net recoveriescharge-offs of ($403,000),$5.1, or (0.01)%0.13% of average loans, were recorded in 20182019 and 2017,2018, respectively. Provision expense for 2019, 2018, 2017, and 20162017 was attributable to a number of factors but was primarily determined based on key loan quality metrics, including the level of net charge-offs, strong reserve coverage of nonperforming loans, a decrease in historical loss percentages, stabilization instable economic conditions in the Company’s markets and general signs of improvement in borrower performance and future prospects.performance. In addition, management gave consideration to changes in the allocation for specific watch list credits in determining the appropriate level of the loan loss provision. Management’s overall view on current credit quality was also a factor in the determination of the provision for loan losses. The Company’s management continues to monitor the adequacy of the provision based on loan levels, asset quality, economic conditions and other factors that may influence the assessment of the collectability of loans.
33
Noninterest Income
The following table presents changes in the components of noninterest income for the years ended December 31.
| % Change From | |||||||||
| Prior Year | |||||||||
| (dollars in thousands) | 2018 | 2017 | 2016 | 2018 | 2017 | ||||
| Wealth advisory fees | $6,344 | $5,481 | $4,805 | 15.7% | 14.1% | ||||
| Investment brokerage fees | 1,458 | 1,273 | 1,010 | 14.5% | 26.0% | ||||
| Service charges on deposit accounts | 15,831 | 13,696 | 12,013 | 15.6% | 14.0% | ||||
| Loan and service fees | 9,291 | 7,900 | 7,681 | 17.6% | 2.9% | ||||
| Merchant card fee income | 2,461 | 2,279 | 2,098 | 8.0% | 8.6% | ||||
| Bank owned life insurance | 1,244 | 1,768 | 1,392 | -29.6% | 27.0% | ||||
| Other income | 2,381 | 2,598 | 2,213 | -8.4% | 17.4% | ||||
| Mortgage banking income | 1,150 | 982 | 1,586 | 17.1% | -38.1% | ||||
| Net securities gains (losses) | (50) | 32 | 66 | -256.3% | -51.5% | ||||
| Total noninterest income | $40,110 | $36,009 | $32,864 | 11.4% | 9.6% | ||||
| Noninterest income to total revenue | 21.0 | % | 21.0 | % | 21.7 | % | |||
| | | | | | | | | | | | | | |
|
| | |
|
| |
|
| |
| % Change From |
| ||
| | | | |
| | |
| | | Prior Year |
| ||
(dollars in thousands) |
| 2019 |
| 2018 |
| 2017 |
| 2019 |
| 2018 |
| |||
Wealth advisory fees | | $ | 6,835 | | $ | 6,344 | | $ | 5,481 |
| 7.7 | % | 15.7 | % |
Investment brokerage fees | |
| 1,687 | |
| 1,458 | |
| 1,273 |
| 15.7 | % | 14.5 | % |
Service charges on deposit accounts | |
| 15,717 | |
| 15,831 | |
| 13,696 |
| (0.7) | % | 15.6 | % |
Loan and service fees | |
| 9,911 | |
| 9,291 | |
| 7,900 |
| 6.7 | % | 17.6 | % |
Merchant card fee income | |
| 2,641 | |
| 2,461 | |
| 2,279 |
| 7.3 | % | 8.0 | % |
Bank owned life insurance | |
| 1,890 | |
| 1,244 | |
| 1,768 |
| 51.9 | % | (29.6) | % |
Mortgage banking income | |
| 1,626 | |
| 1,150 | |
| 982 |
| 41.4 | % | 17.1 | % |
Net securities gains (losses) | |
| 142 | |
| (50) | |
| 32 |
| 384.0 | % | (256.3) | % |
Other income | |
| 4,548 | |
| 2,573 | |
| 2,629 |
| 76.8 | % �� | (2.1) | % |
Total noninterest income | | $ | 44,997 | | $ | 40,302 | | $ | 36,040 |
| 11.6 | % | 11.8 | % |
Noninterest income to total revenue | |
| 22.5 | % |
| 21.0 | % |
| 21.0 | % |
|
|
| |
Noninterest income was $40.1$45.0 million in 2019 versus $40.3 million in 2018, an increase of $4.7 million, or 11.6%. The increase was primarily driven by a $2.0 million increase in other income related to $1.7 million of swap fees generated from commercial lending transactions, as well as life insurance proceeds on bank owned life insurance policies. Noninterest income was also positively impacted by increases in bank owned life insurance income, loan and service fees, mortgage banking income, and wealth advisory and brokerage fees due to continued growth of client relationships. Offsetting the increases was a decrease in service charges on deposit accounts driven by lower treasury management fees from a single commercial treasury management relationship. This relationship contributed $4.5 million to services charges on deposit accounts during 2019. The related treasury management activity was terminated and the revenue will not recur in future periods.
Noninterest income was $40.3 million in 2018 versus $36.0 million in 2017, an increase of $4.1$4.3 million, or 11.4%11.8%. The increase was primarily driven by a $2.1 million increase in service charges on deposit accounts driven by growth in fees from business accounts. In addition, wealth advisory fees increased $863,000 due to new business development, as well as growth in assets managed for existing clients. Noninterest income was also positively impacted by growth in the amount of $1.4 million in loan and service fees. Noninterest income was negatively impacted by a decrease in bank owned life insurance income which declined by $524,000, or 29.6%, primarily due to a variable bank owned life insurance product that contains equity based investments.
Noninterest Expense
The following table presents changes in the components of noninterest expense for the years ended December 31.
| | | | | | | | | | | | | | |
|
| | |
|
| |
|
| |
| % Change From |
| ||
| | | | | | | | | | | Prior Year |
| ||
(dollars in thousands) | | 2019 | | 2018 | | 2017 | | 2019 | | 2018 |
| |||
Salaries and employee benefits | | $ | 49,434 | | $ | 48,353 | | $ | 45,306 |
| 2.2 | % | 6.7 | % |
Net occupancy expense | |
| 5,295 | |
| 5,149 | |
| 4,595 |
| 2.8 | % | 12.1 | % |
Equipment costs | |
| 5,521 | |
| 5,243 | |
| 4,629 |
| 5.3 | % | 13.3 | % |
Data processing fees and supplies | |
| 10,407 | |
| 9,685 | |
| 8,233 |
| 7.5 | % | 17.6 | % |
Corporate and business development | |
| 4,371 | |
| 5,066 | |
| 4,744 |
| (13.7) | % | 6.8 | % |
FDIC insurance and other regulatory fees | |
| 638 | |
| 1,701 | |
| 1,798 |
| (62.5) | % | (5.4) | % |
Professional fees | |
| 4,644 | |
| 3,798 | |
| 3,574 |
| 22.3 | % | 6.3 | % |
Other expense | |
| 9,114 | |
| 7,234 | |
| 6,419 |
| 26.0 | % | 12.7 | % |
Total noninterest expense | | $ | 89,424 | | $ | 86,229 | | $ | 79,298 |
| 3.7 | % | 8.7 | % |
34
| % Change From | |||||||||
| Prior Year | |||||||||
| (dollars in thousands) | 2018 | 2017 | 2016 | 2018 | 2017 | ||||
| Salaries and employee benefits | $48,353 | $45,306 | $41,656 | 6.7% | 8.8% | ||||
| Net occupancy expense | 5,149 | 4,595 | 4,266 | 12.1% | 7.7% | ||||
| Equipment costs | 5,243 | 4,629 | 3,850 | 13.3% | 20.2% | ||||
| Data processing fees and supplies | 9,685 | 8,233 | 8,148 | 17.6% | 1.0% | ||||
| Corporate and business development | 5,066 | 4,744 | 3,328 | 6.8% | 42.5% | ||||
| FDIC insurance and other regulatory fees | 1,701 | 1,798 | 2,001 | -5.4% | -10.1% | ||||
| Professional fees | 3,798 | 3,574 | 3,208 | 6.3% | 11.4% | ||||
| Other expense | 7,042 | 6,388 | 6,521 | 10.2% | -2.0% | ||||
| Total noninterest expense | $86,037 | $79,267 | $72,978 | 8.5% | 8.6% | ||||
Noninterest expense was $86.0$89.4 million in 2019 versus $86.2 million in 2018, an increase of $3.2 million, or 3.7%. Salaries and employee benefits increased by $1.1 million primarily due to an increase in staffing in revenue producing and risk management areas as well as normal merit increases. Professional fees increased due to higher legal expenses and increased utilization of accounting firms for outsourced services. Data processing fees also increased during 2019 primarily due to the Company’s continued investment in customer focused, technology-based solutions and ongoing cybersecurity and data management enhancements. Offsetting these increases were decreases in FDIC insurance and other regulatory fees as well as decreases in corporate and business development. In the third quarter of 2019, the FDIC announced that due to the Deposit Insurance Fund reserve ratio exceeding 1.38%, banks with consolidated assets of less than $10 billion would be receiving credits against their deposit insurance assessments. The bank’s $1.1 million credit was applied as a reduction of FDIC assessments commencing with the payment of the second quarter assessment paid in September 2019 and is expected to be fully utilized by the end of the first quarter of 2020.
Noninterest expense was $86.2 million in 2018 versus $79.3 million in 2017, an increase of $6.8$6.9 million, or 8.5%8.7%. Salaries and employee benefits increased by $3.0 million primarily due to an increase to the Company’s minimum hiring wage, normal merit increases, equity-based compensation expense and increased health insurance cost. Data processing fees also increased during 2018 by $1.5 million primarily due to the Company’s continued investment in technology-based solutions and ongoing transition to cloud-based technology. Occupancy and equipment costs increased during 2018 due to continued branch expansion and remodeling of existing branches and other offices. In addition, corporate and business development expense increased due to higher community support and donation expense.
Income Taxes
The Company recognized income tax expense in 20182019 of $18.5$20.3 million, compared to $18.5 million in 2018 and $32.3 million in 2017, and $25.1 million in 2016.2017. The effective tax rate in 20182019 was 18.7%18.9% compared to 18.7% in 2018, and 36.0% in 2017, and 32.5% in 2016.2017. The effective tax rate was lower in 2019 and 2018 compared to 2017 and 2016 due to the effects of the Tax Cuts and Jobs Act, which reduced the Company’s federal tax rate to 21% from 35% effective January 1, 2018. Results for 2017 included a non-cash, non-operating and non-recurring income tax provision of $4.1 million, or $0.16 per diluted share.share, due to the effects of the Tax Cuts and Jobs Act. For a detailed analysis of the Company’s income taxes see Note 13 – Income Taxes.
FINANCIAL CONDITION
Overview
Total assets of the Company were $4.947 billion as of December 31, 2019, an increase of $71.5 million, or 1.5%, when compared to $4.875 billion as of December 31, 2018, an increase of $192.3 million, or 4.1%, when compared to $4.683 billion as of December 31, 2017.2018. Total loans increased by $96.8$151.1 million, or 2.5%3.9%, to $3.916$4.066 billion at December 31, 20182019 from $3.820$3.915 billion at December 31, 2017.2018. Cash and cash equivalents increaseddecreased by $40.7$117.5 million and available-for-sale securities increased by $47.1$22.7 million. Funding for the loan and investment growth came from a $94.9 million increase in total borrowings as well as a $35.4an $89.8 million increase in total deposits in 2018. Most of theas well as a $56.1 million increase in short-term borrowings resulted from short-term advances from the Federal Home Loan Bank of Indianapolis.retained earnings, offset by a $106.5 million decrease in total borrowings. The Company used wholesale funding, including brokered deposits and Federal Home Loan Bank advances, to fund part of itsprovide liquidity for loan growth and to help maintain its desired interest rate risk position.
35
Uses of Funds
Investment Portfolio
The amortized cost and the fair value of securities as of December 31, 2019, 2018 2017 and 20162017 were as follows:
| 2018 | 2017 | 2016 | |||||||||
| Amortized | Fair | Amortized | Fair | Amortized | Fair | ||||||
| (fully tax equivalent basis dollars in thousands) | Cost | Value | Cost | Value | Cost | Value | |||||
| Securities available for sale: | |||||||||||
| U.S. Treasury securities | $994 | $987 | $992 | $997 | $990 | $1,003 | |||||
| U.S. government sponsored agencies | 4,435 | 4,350 | 5,191 | 5,122 | 6,312 | 6,241 | |||||
| Mortgage-backed securities: residential | 329,516 | 325,412 | 314,650 | 313,774 | 304,172 | 304,495 | |||||
| Mortgage-backed securities: commercial | 38,712 | 38,141 | 44,208 | 44,211 | 46,936 | 47,073 | |||||
| State and municipal securities | 217,964 | 216,659 | 172,375 | 174,389 | 146,917 | 145,379 | |||||
| Total debt securities available for sale | $591,621 | $585,549 | $537,416 | $538,493 | $505,327 | $504,191 | |||||
| | | | | | | | | | | | | | | | | | |
|
| 2019 |
| 2018 |
| 2017 | ||||||||||||
| | Amortized | | Fair | | Amortized | | Fair | | Amortized | | Fair | ||||||
(fully tax equivalent basis dollars in thousands) |
| Cost |
| Value |
| Cost |
| Value |
| Cost |
| Value | ||||||
Securities available for sale: | | | | | | | | | | | | | | | | | | |
U.S. Treasury securities | | $ | 0 | | $ | 0 | | $ | 994 | | $ | 987 | | $ | 992 | | $ | 997 |
U.S. government sponsored agencies | |
| 0 | |
| 0 | |
| 4,435 | |
| 4,350 | |
| 5,191 | |
| 5,122 |
Mortgage-backed securities: residential | |
| 283,817 | |
| 288,181 | |
| 329,516 | |
| 325,412 | |
| 314,650 | |
| 313,774 |
Mortgage-backed securities: commercial | |
| 36,712 | |
| 36,972 | |
| 38,712 | |
| 38,141 | |
| 44,208 | |
| 44,211 |
State and municipal securities | |
| 270,480 | |
| 283,080 | |
| 217,964 | |
| 216,659 | |
| 172,375 | |
| 174,389 |
Total debt securities available for sale | | $ | 591,009 | | $ | 608,233 | | $ | 591,621 | | $ | 585,549 | | $ | 537,416 | | $ | 538,493 |
At year-end 2019, 2018 2017 and 2016,2017, there were no holdings of securities of any one issuer, other than the U.S. government, government agencies and government sponsored agencies, in an amount greater than 10% of stockholders’ equity. See Note 2 – Securities for more information on these investments.
Purchases of securities available for saleavailable-for-sale totaled $129.5 million in 2019, $126.6 million in 2018 and $139.3 million in 2017 and $116.2 million in 2016. The growth2017. Growth of the investment portfolio during the past three years serves to enhanceprovide liquidity for the Company and manageprovide longer duration as an offset to the levelshort duration of interest rate risk in relation to the loan portfolio. The Company targets investment securities as a percentage of total assets in a range from 11% - 14%. Securities sales totaled $57.1 million in 2019, $15.3 million in 2018 and $40.9 million in 2017 and $12.1 million in 2016.2017. Paydowns from prepayments and scheduled payments of $53.0 million, $42.8 million $50.0 million and $56.4$50.0 million were received in 2019, 2018 2017 and 2016,2017, and the amortization of premiums, net of the accretion of discounts, was $3.9 million, $3.2 million $3.1 million and $2.9$3.1 million, respectively. Maturities and calls of securities totaled $14.8 million, $11.0 million and $11.7 million in 2019, 2018 and $12.9 million in 2018, 2017, and 2016, respectively. No other-than-temporary impairment was recognized in 2019, 2018 2017 or 2016.2017. The investment portfolio is managed to provide for an appropriate balance between liquidity, credit risk and investment return and to limit the Company’s exposure to risk to an acceptable level.
The weighted average yields and maturity distribution for the securities portfolio at December 31, 2018,2019, were as follows:
| Within | After One | After Five Years | Over Ten | |||||||||||||
| One Year | Within Five Years | Within Ten years | Years | |||||||||||||
| Fair | Fair | Fair | Fair | |||||||||||||
| Value | Yield | Value | Yield | Value | Yield | Value | Yield | |||||||||
| (fully tax equivalent basis, dollars in thousands) | ||||||||||||||||
| U.S. Treasury securities | $0 | 0.00 | % | $987 | 3.50 | % | $0 | 0.00 | % | $0 | 0.00 | % | ||||
| U.S. government sponsor agency | 0 | 0.00 | % | 1,995 | 0.41 | % | 0 | 0.00 | % | 2,355 | 3.00 | % | ||||
| Mortgage-backed securities: residential | 111 | 3.03 | % | 38,386 | 3.93 | % | 43,959 | 3.34 | % | 242,956 | 3.53 | % | ||||
| Mortgage-backed securities: commercial | 0 | 0.00 | % | 34,101 | 4.25 | % | 4,040 | 5.50 | % | 0 | 0.00 | % | ||||
| State and municipal securities | 2,541 | 3.43 | % | 19,540 | 3.80 | % | 32,656 | 3.45 | % | 161,922 | 3.82 | % | ||||
| Total Securities | $2,652 | 3.41 | % | $95,009 | 3.94 | % | $80,655 | 3.49 | % | $407,233 | 3.64 | % | ||||
| | | | | | | | | | | | | | | | | | | | | |
| | Within |
| After One |
| After Five Years |
| Over Ten |
| ||||||||||||
| | One Year | | Within Five Years | | Within Ten years | | Years |
| ||||||||||||
| | Fair | | | | Fair | | | | Fair | | | | Fair | | |
| ||||
|
| Value |
| Yield |
| Value |
| Yield |
| Value |
| Yield |
| Value |
| Yield | | ||||
(fully tax equivalent basis, dollars in thousands) |
| |
|
|
|
| |
|
|
|
| |
|
|
|
| |
|
|
| |
Mortgage-backed securities: residential | |
| 0 |
| 0.00 | % |
| 27,605 |
| 3.08 | % |
| 40,650 |
| 3.45 | % |
| 219,926 |
| 3.23 | % |
Mortgage-backed securities: commercial | |
| 2,537 |
| 3.03 | % |
| 34,435 |
| 3.08 | % |
| 0 |
| 0.00 | % |
| 0 |
| 0.00 | % |
State and municipal securities | |
| 4,610 |
| 3.00 | % |
| 15,453 |
| 3.75 | % |
| 26,061 |
| 3.85 | % |
| 236,956 |
| 3.78 | % |
Total Securities | | $ | 7,147 |
| 3.01 | % | $ | 77,493 |
| 3.21 | % | $ | 66,711 |
| 3.61 | % | $ | 456,882 |
| 3.51 | % |
The companyCompany does not trade or invest in or sponsor certain unregistered investment companies defined as hedge funds and private equity funds in the Volcker Rule.
Real Estate Mortgage Loans Held For Sale
Real estate mortgages held for sale decreasedincreased by $1.0$2.2 million to $4.5 million at December 31, 2019 from $2.3 million at December 31, 2018 from $3.3 million at December 31, 2017.2018. This asset category is subject to a high degree of variability depending on, among other things, recent mortgage loan rates and the timing of loan sales into the secondary market. The Company generally sells almost all of the mortgage loans it originates on the secondary market. Proceeds from sales totaled $64.8 million in 2019, $51.7 million in 2018 and $57.6 million in 2017 and $68.7 million in 2016.2017.
36
Loan Portfolio
The loan portfolio by class as of December 31, 2019, 2018, 2017, 2016 2015 and 20142015 was as follows:
| (dollars in thousands) | 2018 | 2017 | 2016 | 2015 | 2014 | ||||
| Commercial and industrial loans: | |||||||||
| Working capital lines of credit loans | $690,620 | $743,609 | $624,404 | $581,025 | $544,043 | ||||
| Non-working capital loans | 714,759 | 675,072 | 644,086 | 598,487 | 491,330 | ||||
| Total commercial and industrial loans | 1,405,379 | 1,418,681 | 1,268,490 | 1,179,512 | 1,035,373 | ||||
| Commercial real estate and multi-family residential loans: | |||||||||
| Construction and land development loans | 266,805 | 224,474 | 245,182 | 230,719 | 156,636 | ||||
| Owner occupied loans | 586,325 | 538,603 | 469,705 | 412,026 | 403,154 | ||||
| Nonowner occupied loans | 520,901 | 508,121 | 458,404 | 407,883 | 394,458 | ||||
| Multi-family loans | 195,604 | 173,715 | 127,632 | 79,425 | 71,811 | ||||
| Total commercial real estate and multi-family residential loans | 1,569,635 | 1,444,913 | 1,300,923 | 1,130,053 | 1,026,059 | ||||
| Agri-business and agricultural loans: | |||||||||
| Loans secured by farmland | 177,503 | 186,437 | 172,633 | 164,375 | 137,407 | ||||
| Loans for agricultural production | 193,010 | 196,404 | 222,210 | 141,719 | 136,380 | ||||
| Total agri-business and agricultural loans | 370,513 | 382,841 | 394,843 | 306,094 | 273,787 | ||||
| Other commercial loans | 95,657 | 124,076 | 98,270 | 85,075 | 75,715 | ||||
| Total commercial loans | 3,441,184 | 3,370,511 | 3,062,526 | 2,700,734 | 2,410,934 | ||||
| Consumer 1-4 family mortgage loans: | |||||||||
| Closed end first mortgage loans | 185,822 | 179,302 | 163,155 | 158,062 | 145,167 | ||||
| Open end and junior lien loans | 187,030 | 181,865 | 169,664 | 163,700 | 150,220 | ||||
| Residential construction and land development loans | 16,226 | 13,478 | 15,015 | 9,341 | 6,742 | ||||
| Total consumer 1-4 family mortgage loans | 389,078 | 374,645 | 347,834 | 331,103 | 302,129 | ||||
| Other consumer loans | 86,064 | 74,369 | 61,308 | 49,113 | 49,541 | ||||
| Total consumer loans | 475,142 | 449,014 | 409,142 | 380,216 | 351,670 | ||||
| Subtotal | 3,916,326 | 3,819,525 | 3,471,668 | 3,080,950 | 2,762,604 | ||||
| Less: Allowance for loan losses | (48,453) | (47,121) | (43,718) | (43,610) | (46,262) | ||||
| Net deferred loan fees | (1,581) | (1,066) | (741) | (21) | (284) | ||||
| Loans, net | $3,866,292 | $3,771,338 | $3,427,209 | $3,037,319 | $2,716,058 |
| | | | | | | | | | | | | | | |
(dollars in thousands) |
| 2019 |
| 2018 |
| 2017 |
| 2016 |
| 2015 | |||||
Commercial and industrial loans: |
| |
|
| |
|
| |
|
| |
|
| |
|
Working capital lines of credit loans | | $ | 709,849 | | $ | 690,620 | | $ | 743,609 | | $ | 624,404 | | $ | 581,025 |
Non-working capital loans | |
| 717,019 | |
| 714,759 | |
| 675,072 | |
| 644,086 | |
| 598,487 |
Total commercial and industrial loans | |
| 1,426,868 | |
| 1,405,379 | |
| 1,418,681 | |
| 1,268,490 | |
| 1,179,512 |
Commercial real estate and multi-family residential loans: | |
|
| |
|
| |
|
| |
|
| |
|
|
Construction and land development loans | |
| 287,641 | |
| 266,805 | |
| 224,474 | |
| 245,182 | |
| 230,719 |
Owner occupied loans | |
| 573,665 | |
| 586,325 | |
| 538,603 | |
| 469,705 | |
| 412,026 |
Nonowner occupied loans | |
| 571,364 | |
| 520,901 | |
| 508,121 | |
| 458,404 | |
| 407,883 |
Multi-family loans | |
| 240,652 | |
| 195,604 | |
| 173,715 | |
| 127,632 | |
| 79,425 |
Total commercial real estate and multi-family residential loans | |
| 1,673,322 | |
| 1,569,635 | |
| 1,444,913 | |
| 1,300,923 | |
| 1,130,053 |
Agri-business and agricultural loans: | |
|
| |
|
| |
|
| |
|
| |
|
|
Loans secured by farmland | |
| 174,380 | |
| 177,503 | |
| 186,437 | |
| 172,633 | |
| 164,375 |
Loans for agricultural production | |
| 205,151 | |
| 193,010 | |
| 196,404 | |
| 222,210 | |
| 141,719 |
Total agri-business and agricultural loans | |
| 379,531 | |
| 370,513 | |
| 382,841 | |
| 394,843 | |
| 306,094 |
Other commercial loans | |
| 112,302 | |
| 95,657 | |
| 124,076 | |
| 98,270 | |
| 85,075 |
Total commercial loans | |
| 3,592,023 | |
| 3,441,184 | |
| 3,370,511 | |
| 3,062,526 | |
| 2,700,734 |
Consumer 1-4 family mortgage loans: | |
|
| |
|
| |
|
| |
|
| |
|
|
Closed end first mortgage loans | |
| 177,227 | |
| 185,822 | |
| 179,302 | |
| 163,155 | |
| 158,062 |
Open end and junior lien loans | |
| 186,552 | |
| 187,030 | |
| 181,865 | |
| 169,664 | |
| 163,700 |
Residential construction and land development loans | |
| 12,966 | |
| 16,226 | |
| 13,478 | |
| 15,015 | |
| 9,341 |
Total consumer 1-4 family mortgage loans | |
| 376,745 | |
| 389,078 | |
| 374,645 | |
| 347,834 | |
| 331,103 |
Other consumer loans | |
| 98,617 | |
| 86,064 | |
| 74,369 | |
| 61,308 | |
| 49,113 |
Total consumer loans | |
| 475,362 | |
| 475,142 | |
| 449,014 | |
| 409,142 | |
| 380,216 |
Gross loans | |
| 4,067,385 | |
| 3,916,326 | |
| 3,819,525 | |
| 3,471,668 | |
| 3,080,950 |
Less: Allowance for loan losses | |
| (50,652) | |
| (48,453) | |
| (47,121) | |
| (43,718) | |
| (43,610) |
Net deferred loan fees | |
| (1,557) | |
| (1,581) | |
| (1,066) | |
| (741) | |
| (21) |
Loans, net | | $ | 4,015,176 | | $ | 3,866,292 | | $ | 3,771,338 | | $ | 3,427,209 | | $ | 3,037,319 |
The ratio of loans to total loans by portfolio segment as of December 31, 2019, 2018, 2017, 2016 2015 and 20142015 was as follows:
| 2018 | 2017 | 2016 | 2015 | 2014 | |||||
| Commercial and industrial loans | 35.89% | 37.14% | 36.54% | 38.28% | 37.48% | ||||
| Commercial real estate and multi-family residential loans | 40.08% | 37.83% | 37.47% | 36.68% | 37.14% | ||||
| Agri-business and agricultural loans | 9.46% | 10.02% | 11.36% | 9.93% | 9.91% | ||||
| Other commercial loans | 2.44% | 3.25% | 2.83% | 2.76% | 2.74% | ||||
| Consumer 1-4 family mortgage loans | 9.93% | 9.81% | 10.02% | 10.75% | 10.94% | ||||
| Other consumer loans | 2.20% | 1.95% | 1.78% | 1.60% | 1.79% | ||||
| Total Loans | 100.00% | 100.00% | 100.00% | 100.00% | 100.00% |
| | | | | | | | | | | |
|
| 2019 |
| 2018 |
| 2017 |
| 2016 |
| 2015 |
|
| | | | | | | | | | | |
Commercial and industrial loans |
| 35.08 | % | 35.89 | % | 37.14 | % | 36.54 | % | 38.28 | % |
Commercial real estate and multi-family residential loans |
| 41.14 | % | 40.08 | % | 37.83 | % | 37.47 | % | 36.68 | % |
Agri-business and agricultural loans |
| 9.33 | % | 9.46 | % | 10.02 | % | 11.36 | % | 9.93 | % |
Other commercial loans |
| 2.76 | % | 2.44 | % | 3.25 | % | 2.83 | % | 2.76 | % |
Consumer 1-4 family mortgage loans |
| 9.26 | % | 9.93 | % | 9.81 | % | 10.02 | % | 10.75 | % |
Other consumer loans |
| 2.43 | % | 2.20 | % | 1.95 | % | 1.78 | % | 1.60 | % |
Total Loans |
| 100.00 | % | 100.00 | % | 100.00 | % | 100.00 | % | 100.00 | % |
In 2019, net loan balances increased by $148.9 million to $4.015 billion, which excludes approximately $66.0 million in loans originated for sale. In 2018, net loan balances increased by $95.0 million to $3.866 billion, which is net ofexcludes approximately $49.8 million in loans originated and soldfor sale and $316,000 transferred to other real estate in 2018. In 2017, net loan balances increased by $344.1 million to $3.771 billion, which is net ofexcludes approximately $54.2 million in loans originated and soldfor sale and $88,000 transferred to other real estate in 2017. In 2016, loan balances increased by $389.9 million to $3.427 billion, which is net
37
The mix of loan types within the Company’s portfolio continued a trend toward a higher percentage of the total loan portfolio being in commercial loans. This higher percentage of commercial loans to the total portfolio was a result of the Company’s long standing strategic plan that is focused on organic expansion and growth in the commercial business.loans. Commercial and industrial loans together with owner-occupied commercial real estate loans represent 49.2% and 50.8% of total loans as of December 31, 2019 and 2018, respectively. The owner-occupied commercial real estate loans tend to represent the real estate holding of our commercial and industrial loan customers. Another significant loan segment are loans to the agri-business sector, which has resulted in the Company becoming one of the largest agricultural lenders in the State of Indiana.
The residential construction and land development loans class included construction loans totaling $8.1 million, $12.5 million, $10.0 million, $11.4 million $7.3 million and $5.3$7.3 million as of December 31, 2019, 2018, 2017, 2016 2015 and 2014.2015. The Bank generally sells conforming mortgage loans which it originates on the secondary market. These loans generally represent mortgage loans that are made to clients with long-term or substantial relationships with the Bank on terms consistent with secondary market requirements. The loan classifications are based on the nature of the loans as of the loan origination date. There were no foreign loans included in the loan portfolio for the periods presented.
Repricing opportunities of the loan portfolio occur either according to predetermined float rate indices, adjustable rate schedules included in the related loan agreements or upon maturity of each principal payment. The following table indicates the scheduled maturities of the loan portfolio as of December 31, 2018:
| Commercial | ||||||||||||||||
| Real Estate | ||||||||||||||||
| and | Agri-business | Consumer | ||||||||||||||
| Commercial and | Multi-family | and | Other | 1-4 Family | Other | |||||||||||
| (dollars in thousands) | Industrial | Residential | Agricultural | Commercial | Mortgage | Consumer | Total | Percent | ||||||||
| Within one year | $699,601 | $286,261 | $155,117 | $31,461 | $17,662 | $13,149 | $1,203,251 | 30.72 | % | |||||||
| After one year, within five years | 581,655 | 840,277 | 136,908 | 25,773 | 81,591 | 42,198 | 1,708,402 | 43.62 | ||||||||
| Over five years | 120,305 | 440,828 | 78,205 | 38,423 | 288,935 | 30,717 | 997,413 | 25.47 | ||||||||
| Nonaccrual loans | 3,818 | 2,269 | 283 | 0 | 890 | 0 | 7,260 | 0.19 | ||||||||
| Total loans | $1,405,379 | $1,569,635 | $370,513 | $95,657 | $389,078 | $86,064 | $3,916,326 | 100.00 | % |
| | | | | | | | | | | | | | | | | | | | | | | | |
|
| | |
| Commercial |
|
| |
|
| |
|
| |
|
| |
|
| |
|
|
| |
| | | | | Real Estate | | | | | | | | | | | | | | | | | |
| |
| | | | | and | | Agri-business | | | | | Consumer | | | | | | | | |
| |||
| | Commercial and | | Multi-family | | and | | Other | | 1-4 Family | | Other | | | | | |
| ||||||
(dollars in thousands) |
| Industrial |
| Residential |
| Agricultural |
| Commercial |
| Mortgage |
| Consumer |
| Total |
| Percent | | |||||||
Within one year | | $ | 781,177 | | $ | 333,987 | | $ | 142,509 | | $ | 30,788 | | $ | 18,287 | | $ | 23,060 | | $ | 1,329,808 |
| 32.69 | % |
After one year, within five years | |
| 520,609 | |
| 885,556 | |
| 157,258 | |
| 44,115 | |
| 76,366 | |
| 49,270 | |
| 1,733,174 |
| 42.61 | |
Over five years | |
| 112,564 | |
| 449,723 | |
| 79,320 | |
| 37,399 | |
| 280,452 | |
| 26,270 | |
| 985,728 |
| 24.23 | |
Nonaccrual loans | |
| 12,518 | |
| 4,056 | |
| 444 | |
| 0 | |
| 1,640 | |
| 17 | |
| 18,675 |
| 0.46 | |
Total loans | | $ | 1,426,868 | | $ | 1,673,322 | | $ | 379,531 | | $ | 112,302 | | $ | 376,745 | | $ | 98,617 | | $ | 4,067,385 |
| 100.00 | % |
At maturity, credits are reviewed and, if renewed, are renewed at rates and conditions that prevail at the time of maturity.
Based upon the table above, all loans due after one year which have a predetermined interest rate and loans due after one year which have floating or adjustable interest rates as of December 31, 20182019 amounted to $878.0 million$1.291 billion and $1.156$1.428 billion, respectively.
Bank Owned Life Insurance
Bank owned life insurance increased by $6.7 million to $83.8 million at December 31, 2019 and by $1.2 million to $77.1 million at December 31, 2018 and by $1.9 million tofrom $75.9 million at December 31, 2017 from $74.0 million at December 31, 2016.2017. The increase during 2019 was primarily due to the purchase of additional life insurance policies on officers of the Bank. The increases during 2018 and 2017 were primarily due to investment returns on the life insurance policies of pre-existing life insurance policies. Bank owned life insurance provides investment income from the securities the life insurance is invested in and offsets benefit plan expenses.
38
Sources of Funds
The average daily deposits and borrowings together with the average rates paid on those deposits and borrowings for the years ended December 31, 2019, 2018 2017 and 20162017 are summarized in the following table:
| % Balance Change | ||||||||||||||||
| 2018 | 2017 | 2016 | From Prior Year | |||||||||||||
| (dollars in thousands) | Balance | Rate | Balance | Rate | Balance | Rate | 2018 | 2017 | ||||||||
| Noninterest bearing demand deposits | $858,027 | 0.00 | % | $789,307 | 0.00 | % | $724,350 | 0.00 | % | 9 | % | 9 | % | |||
| Savings and transaction accounts: | ||||||||||||||||
| Savings deposits | 257,959 | 0.13 | 272,811 | 0.15 | 264,669 | 0.17 | (5) | 3 | ||||||||
| Interest bearing demand deposits | 1,475,776 | 1.22 | 1,401,216 | 0.71 | 1,282,257 | 0.44 | 5 | 9 | ||||||||
| Time deposits: | ||||||||||||||||
| Deposits of $100,000 or more | 1,236,528 | 1.83 | 1,052,705 | 1.30 | 959,569 | 1.04 | 17 | 10 | ||||||||
| Other time deposits | 265,604 | 1.51 | 241,170 | 1.21 | 246,971 | 1.15 | 10 | (2) | ||||||||
| Total deposits | $4,093,894 | 1.10 | % | $3,757,209 | 0.72 | % | $3,477,816 | 0.54 | % | 9 | % | 8 | % | |||
| FHLB advances and other borrowings | 146,640 | 1.90 | 210,537 | 1.32 | 119,225 | 1.28 | (30) | 77 | ||||||||
| Total funding sources | $4,240,534 | 1.12 | % | $3,967,746 | 0.75 | % | $3,597,041 | 0.57 | % | 7 | % | 10 | % | |||
| | | | | | | | | | | | | | | | | | | | |
| | | | | | | | | | | | | | | | | % Balance Change |
| ||
| | 2019 | | 2018 | | 2017 | | From Prior Year |
| |||||||||||
(dollars in thousands) |
| Balance |
| Rate |
| Balance |
| Rate |
| Balance |
| Rate |
| 2019 |
| 2018 |
| |||
Noninterest bearing demand deposits | | $ | 944,118 |
| 0.00 | % | $ | 858,027 |
| 0.00 | % | $ | 789,307 |
| 0.00 | % | 10.03 | % | 8.71 | % |
Savings and transaction accounts: | |
|
|
|
| |
|
|
|
| |
|
|
|
|
|
|
|
| |
Savings deposits | |
| 240,293 |
| 0.11 | |
| 257,959 |
| 0.13 | |
| 272,811 |
| 0.15 |
| (6.85) |
| (5.44) | |
Interest bearing demand deposits | |
| 1,669,045 |
| 1.56 | |
| 1,475,776 |
| 1.22 | |
| 1,401,216 |
| 0.71 |
| 13.10 |
| 5.32 | |
Time deposits: | |
| |
| | |
|
|
|
| |
|
|
|
|
|
|
|
| |
Deposits of $100,000 or more | |
| 1,111,172 |
| 2.30 | |
| 1,236,528 |
| 1.83 | |
| 1,052,705 |
| 1.30 |
| (10.14) |
| 17.46 | |
Other time deposits | |
| 277,896 |
| 1.92 | |
| 265,604 |
| 1.51 | |
| 241,170 |
| 1.21 |
| 4.63 |
| 10.13 | |
Total deposits | | $ | 4,242,524 |
| 1.35 | % | $ | 4,093,894 |
| 1.10 | % | $ | 3,757,209 |
| 0.72 | % | 3.63 | % | 8.96 | % |
FHLB advances and other borrowings | |
| 92,106 |
| 3.27 | |
| 146,640 |
| 1.90 | |
| 210,537 |
| 1.32 |
| (37.19) |
| (30.35) | |
Total funding sources | | $ | 4,334,630 |
| 1.39 | % | $ | 4,240,534 |
| 1.12 | % | $ | 3,967,746 |
| 0.75 | % | 2.22 | % | 6.88 | % |
Time deposits as of December 31, 20182019 will mature as follows:
| $100,000 | % of | |||||||
| (dollars in thousands) | or more | Other | Total | Total | ||||
| Within three months | $395,750 | $41,423 | $437,173 | 30.79 | % | |||
| Over three months, within six months | 203,838 | 41,840 | 245,678 | 17.31 | ||||
| Over six months, within twelve months | 205,874 | 44,598 | 250,472 | 17.64 | ||||
| Over twelve months | 340,759 | 145,672 | 486,431 | 34.26 | ||||
| Total time certificates of deposit | $1,146,221 | $273,533 | $1,419,754 | 100.00 | % |
| | | | | | | | | | | | |
| | $100,000 | | $100,000 | | | | | % of |
| ||
(dollars in thousands) |
| or more |
| or less |
| Total |
| Total | | |||
Within three months | | $ | 212,142 | | $ | 43,239 | | $ | 255,381 |
| 21.42 | % |
Over three months, within six months | |
| 205,467 | |
| 59,550 | |
| 265,017 |
| 22.23 | |
Over six months, within twelve months | |
| 292,547 | |
| 82,656 | |
| 375,203 |
| 31.48 | |
Over twelve months | |
| 199,977 | |
| 96,489 | |
| 296,466 |
| 24.87 | |
Total time certificates of deposit | | $ | 910,133 | | $ | 281,934 | | $ | 1,192,067 |
| 100.00 | % |
Deposits
Total deposits increased by $89.8 million to $4.134 billion, comparing December 31, 2019 to December 31, 2018. The growth in deposits consisted of $141.1 million in core deposit growth offset by a decrease of $51.4 million in brokered deposits. Total deposit growth was led by an increase of $200.6 million in commercial deposits. In addition, retail deposits increased by $28.9 million while public funds deposits decreased by $88.4 million. The growth in deposits in 2019 resulted from increased deposit balances from new and existing customers, as well as a decreased utilization of brokered deposits. Core deposit growth enabled the Company to reduce reliance on wholesale funding during 2019.
Total deposits increased by $35.4 million to $4.044 billion, comparing December 31, 2018 to December 31, 2017. The growth in deposits consisted of $135.5 million in core deposit growth offset by a decrease of $100.1 million in brokered deposits. Total deposit growth was led by an increase of $112.4 million in commercial deposits. In addition, retail deposits increased by $57.9 million while public funds deposits decreased by $34.7 million. The growth in deposits in 2018 resulted from increased deposit balances from new and existing customers, as well as a decreased utilization of brokered deposits. Core deposit growth enabled the Company to reduce reliance on wholesale funding during 2018.
As previously noted, 30%27% of the Company’s deposit base is attributable to public fund entities which primarily represent customers in the Company’s geographic footprint. A shift in funding away from public fund deposits could require the Company to
39
execute alternatealternative funding plans under the Contingency Funding Plan discussed in further detail under “Liquidity Risk” below. The following table presents total deposits by portfolio segment as of December 31, 2019, 2018 2017 and 2016:
| (dollars in thousands) | 2018 | 2017 | 2016 | ||||||
| Retail | $1,588,225 | 39.3% | $1,530,368 | 38.2% | $1,388,637 | 38.8% | |||
| Commercial | 1,075,419 | 26.6% | 963,064 | 24.0% | 884,178 | 24.7% | |||
| Public funds | 1,215,533 | 30.0% | 1,250,243 | 31.2% | 1,206,920 | 33.8% | |||
| Core deposits | 3,879,177 | 95.9% | 3,743,675 | 93.4% | 3,479,735 | 97.3% | |||
| Brokered deposits | 164,888 | 4.1% | 264,980 | 6.6% | 98,177 | 2.7% | |||
| Total deposits | $4,044,065 | 100.0% | $4,008,655 | 100.0% | $3,577,912 | 100.0% | |||
| | | | | | | | | | | | | | | | |
(dollars in thousands) | | 2019 |
| 2018 |
| 2017 |
| |||||||||
Retail |
| $ | 1,617,133 |
| 39.1 | % | $ | 1,588,225 |
| 39.3 | % | $ | 1,530,368 |
| 38.2 | % |
Commercial | |
| 1,276,047 |
| 30.9 | % |
| 1,075,419 |
| 26.6 | % |
| 963,064 |
| 24.0 | % |
Public funds | |
| 1,127,111 |
| 27.2 | % |
| 1,215,533 |
| 30.1 | % |
| 1,250,243 |
| 31.3 | % |
Core deposits | |
| 4,020,291 |
| 97.2 | % |
| 3,879,177 |
| 96.0 | % |
| 3,743,675 |
| 93.4 | % |
Brokered deposits | |
| 113,528 |
| 2.8 | % |
| 164,888 |
| 4.0 | % |
| 264,980 |
| 6.6 | % |
Total deposits | | $ | 4,133,819 |
| 100.0 | % | $ | 4,044,065 |
| 100.0 | % | $ | 4,008,655 |
| 100.0 | % |
FHLB Advances and Other Borrowings
During 2018,2019, average total short-term borrowings decreased by $63.9$54.5 million to $115.7$61.3 million, primarily due to a decreasethe discontinuance of securities sold under agreements to repurchase products in advances with2019. In addition, on December 30, 2019, the Federal Home Loan BankCompany redeemed $30.0 million of Indianapolis (“FHLBI”).subordinated debentures price at three-month LIBOR plus 305 basis points. Ending balances of total short-term borrowings increased $94.9decreased $75.6 million during 20182019 to $245.6$170.0 million, due to increasesdecreases in FHLBI advances that typically increase at the end of the year.securities sold under agreements to repurchase. Short-term Federal Home Loan Bank (“FHLB”) borrowings are used to fund short-term balance sheet growth due to the flexible nature of the financial instrument and allows the Company to prudently lend to commercial or retail borrowers when opportunities are presented.
During 2017,2018, average total short-term borrowings increaseddecreased by $91.3$63.9 million to $ 179.6$115.7 million, primarily due to an increasea decrease in advances with the FHLBI.advances. Ending balances of total short-term borrowings decreased $79.4increased $94.9 million during 20172018 to $150.7$245.6 million, due to decreases in FHLBI advances offset by increases in securities sold under agreements to repurchase and brokered certificates of deposit. Short-term borrowings are used to fund short-term balance sheet growth due toFHLB advances that typically increase at the flexible natureend of the financial instrument and allows the Company to prudently lend to commercial or retail borrowers when opportunities are presented. In September of 2017, the Company raised $150.0 million in brokered deposits and repaid all outstanding short-term borrowings.
Capital
The Company believes that a strong, appropriately managed capital position is critical to long-term earnings and continuing growth in loans. Capital is used primarily to fund continued organic loan growth and to support dividends per share to shareholders. The Company had a total risk-based capital ratio of 14.2%14.4%, a Tier I risk-based capital ratio of 13.1%13.2% and a common Tier 1 risk-based capital ratio of 12.4%13.2% as of December 31, 2018.2019. These ratios met or exceeded the Federal Reserve’sReserve Bank’s “well-capitalized” minimums of 10.0%, 8.0% and 6.5%, respectively. The Company also had a Tier 1 leverage ratio of 11.4%11.7% and a tangible equity ratio of 10.6%12.0%. See Note 16 – Capital Requirements for more information.
The ability to maintain these ratios is a function of the balance between net income and a prudent dividend policy. Total stockholders’ equity increased by 11.3%14.6% to $598.0 million as of December 31, 2019 from $521.6 million as of December 31, 2018 from $468.6 million as of December 31, 2017.2018. The Company earned $87.0 million in 2019 and $80.4 million in 2018 and $57.3 million2018. The Company declared cash dividends of $1.16 per share in 2017.2019, which decreased equity by $29.7 million. The Company declared cash dividends of $1.00 per share in 2018, which decreased equity by $25.3 million. The Company declared cash dividends of $0.85 per share in 2017, which decreased equity by $21.4 million. The change in accumulated other comprehensive income (loss) was largely due to changes in the fair values of available-for-sale securities decreasedwhich increased equity by $18.3 million in 2019 compared to a decrease of $5.3 million in 2018 compared to an increase of $1.7 million in 2017.2018. The impact to equity due to other comprehensive income is not included in regulatory capital. Amortization of stock based compensation expense increased equity by $5.6 million in 2018 and $5.7 million in 2017.
On January 8, 2019,14, 2020, the Boardboard of Directors authorizeddirectors (the “Board”) reauthorized the purchase of up to $30,000,000$30.0 million worth of shares of the Company’s common stock, representing approximately 3.0%2.4% of the company’sCompany’s issued and outstanding shares of common stock as of December 31, 2018.2019. The Board authorizedreauthorized this stock repurchase plan based on the strength of the company’sCompany’s balance sheet and capital position. The Board believes that a stock repurchase plan is an important tool that can be utilized to enhance long term shareholder value. Share repurchases may be made periodically as permitted by securities laws and other legal and regulatory requirements and will be subject to market conditions as well as other factors. The timing, price and quantity of purchases will be at the discretion of the corporation and the program may be discontinued or suspended at any time. Repurchases may be made in the open market, through block trades or otherwise, and in privately negotiated transactions. If anyThe share purchases are made, they will be maderepurchase authorization expires annually on or priorJanuary 31, 2020 and is subject to December 31, 2019.Board and regulatory approvals.
40
RISK MANAGEMENT
Overview
The Company, with the oversight of the Corporate Risk Committee of the Board, has developed a company-wide risk management program intended to help identify, manage and mitigate the various business risks the Company is exposed to. Following is a discussion addressing the risks identified as most significant to the Company – Credit, Liquidity, and Interest Rate orand Market Risk. Item 7A. includes additional discussion about market risk discussion.
Credit Risk
Credit risk represents the risk of loss arising from an obligor’s inability or failure to meet contractual payment or performance terms. Our primary credit risks result from lending and to a lesser extent, investment activities.
Investment Portfolio
The Company’s investment portfolio consists of Treasury securities, government agencies and municipal bonds.bonds subject to an investment security policy that is approved annually by the Board. During 2018,2019, purchases in the securities portfolio consisted of primarily mortgage-backed securities and municipal bonds. As of December 31, 2018,2019, the Company’s investment in mortgage-backed securities represented approximately 62%53% of total securities consisting of Collateralized Mortgage Obligations, (“CMOs”), Commercial Mortgage-Backed Securities (“CMBSs”) and mortgage pools issued by Ginnie Mae, Fannie Mae and Freddie Mac. Ginnie Mae, Fannie Mae and Freddie Mac securities are each guaranteed by their respective agencies as to principal and interest. All mortgage securities purchased by the Company in 20182019 were within risk tolerances for price, prepayment, extension and original life risk characteristics contained in the Company’s investment policy. Municipal securities represent 47% of total securities as of December 31, 2019 and were rated investment grade at the time of purchase. The Company uses analytics provided by its third party portfolio advisor to evaluate and monitor credit risk for all investments on a quarterly basis. Based upon these analytics as of December 31, 2018,2019, the securities in the available for saleavailable-for-sale portfolio had approximately a 4.14.0 year effective duration with approximately a negative 13.96%14.74% change in market value in the event of a 300 basis point upward, instantaneous rate shock and an approximate positive 3.35%2.97% change in market value in the event of a 100 basis point downward, instantaneous rate shock. As of December 31, 2018,2019, all mortgage-backed securities were performing in a manner consistent with management’s ALCO modeled expectations at time of purchase.
Loan Portfolio
The Company has a relatively high percentage of commercial and commercial real estate loans most of which are extended to small or medium-sized businesses fromwith a broad range of revenue and within a wide variety of industries. Traditionally, this type of lending may have more credit risk than other types of lending because of the size and diversity of the credits. The Company manages this risk by utilizing conservative credit structures, by adjusting its pricing to the perceived risk of each individual credit and by diversifying the portfolio by customer, product, industry and market area.
There were no loan concentrations within industries, which exceeded ten percent of total loans, except commercial real estate manufacturing and agri-business.manufacturing. Commercial real estate was $1.570$1.673 billion, or 40.1% of total loans, manufacturing was $472.2 million, or 12.1%41.1%, of total loans and agri-businessmanufacturing was $370.5$411.2 million, or 9.5%10.1%, of total loans at December 31, 2018.2019. Manufacturing loans are included in the commercial and industrial loans total. Agri-business and agricultural loans represent 9.3% of total loans as of December 31, 2019 and are not concentrated to any agricultural sector. Nearly all of the Bank’s commercial, industrial, agricultural real estate mortgage, real estate construction mortgage and consumer loans are made within its geographic market areas and to diverse industries.
41
The following is a summary of nonperforming loans as of December 31, 2019, 2018, 2017, 2016 2015 and 2014.2015.
| | | | | | | | | | | | | | | |
(dollars in thousands) |
| 2019 |
| 2018 |
| 2017 |
| 2016 |
| 2015 | |||||
Commercial and industrial loans |
| |
|
| |
|
| |
|
| |
|
| |
|
Past due accruing loans (90 days or more) | | $ | 0 | | $ | 0 | | $ | 0 | | $ | 0 | | $ | 0 |
Nonaccrual loans(1) | |
| 12,518 | |
| 3,822 | |
| 4,922 | |
| 2,224 | |
| 5,109 |
Subtotal nonperforming loans | |
| 12,518 | |
| 3,822 | |
| 4,922 | |
| 2,224 | |
| 5,109 |
Commercial real estate and multi-family residential loans | |
|
| |
|
| |
|
| |
|
| |
|
|
Past due accruing loans (90 days or more) | |
| 0 | |
| 0 | |
| 0 | |
| 0 | |
| 0 |
Nonaccrual loans(1) | |
| 4,056 | |
| 2,269 | |
| 3,621 | |
| 3,723 | |
| 7,174 |
Subtotal nonperforming loans | |
| 4,056 | |
| 2,269 | |
| 3,621 | |
| 3,723 | |
| 7,174 |
Agri-business and agricultural loans | |
|
| |
|
| |
|
| |
|
| |
|
|
Past due accruing loans (90 days or more) | |
| 0 | |
| 0 | |
| 0 | |
| 0 | |
| 0 |
Nonaccrual loans(1) | |
| 444 | |
| 283 | |
| 282 | |
| 283 | |
| 471 |
Subtotal nonperforming loans | |
| 444 | |
| 283 | |
| 282 | |
| 283 | |
| 471 |
Other commercial loans | |
|
| |
|
| |
|
| |
|
| |
|
|
Past due accruing loans (90 days or more) | |
| 0 | |
| 0 | |
| 0 | |
| 0 | |
| 0 |
Nonaccrual loans(1) | |
| 0 | |
| 0 | |
| 0 | |
| 0 | |
| 0 |
Subtotal nonperforming loans | |
| 0 | |
| 0 | |
| 0 | |
| 0 | |
| 0 |
Consumer 1-4 family mortgage loans | |
|
| |
|
| |
|
| |
|
| |
|
|
Past due accruing loans (90 days or more) | |
| 45 | |
| 0 | |
| 6 | |
| 53 | |
| 0 |
Nonaccrual loans(1) | |
| 1,640 | |
| 891 | |
| 341 | |
| 409 | |
| 301 |
Subtotal nonperforming loans | |
| 1,685 | |
| 891 | |
| 347 | |
| 462 | |
| 301 |
Other consumer loans | |
|
| |
|
| |
|
| |
|
| |
|
|
Past due accruing loans (90 days or more) | |
| 0 | |
| 0 | |
| 0 | |
| 0 | |
| 0 |
Nonaccrual loans(1) | |
| 17 | |
| 0 | |
| 235 | |
| 0 | |
| 0 |
Subtotal nonperforming loans | |
| 17 | |
| 0 | |
| 235 | |
| 0 | |
| 0 |
Total nonperforming loans | | $ | 18,720 | | $ | 7,265 | | $ | 9,407 | | $ | 6,692 | | $ | 13,055 |
| (1) | Includes nonaccrual troubled debt restructured loans. |
| (dollars in thousands) | 2018 | 2017 | 2016 | 2015 | 2014 | ||||
| Commercial and industrial loans | |||||||||
| Past due accruing loans (90 days or more) | $0 | $0 | $0 | $0 | $101 | ||||
| Nonaccrual loans(1) | 3,818 | 4,922 | 2,224 | 5,109 | 4,230 | ||||
| Subtotal nonperforming loans | 3,818 | 4,922 | 2,224 | 5,109 | 4,331 | ||||
| Commercial real estate and multi-family residential loans | |||||||||
| Past due accruing loans (90 days or more) | 0 | 0 | 0 | 0 | 0 | ||||
| Nonaccrual loans(1) | 2,269 | 3,621 | 3,723 | 7,174 | 7,204 | ||||
| Subtotal nonperforming loans | 2,269 | 3,621 | 3,723 | 7,174 | 7,204 | ||||
| Agri-business and agricultural loans | |||||||||
| Past due accruing loans (90 days or more) | 0 | 0 | 0 | 0 | 0 | ||||
| Nonaccrual loans(1) | 283 | 282 | 283 | 471 | 486 | ||||
| Subtotal nonperforming loans | 283 | 282 | 283 | 471 | 486 | ||||
| Other commercial loans | |||||||||
| Past due accruing loans (90 days or more) | 0 | 0 | 0 | 0 | 0 | ||||
| Nonaccrual loans(1) | 0 | 0 | 0 | 0 | 30 | ||||
| Subtotal nonperforming loans | 0 | 0 | 0 | 0 | 30 | ||||
| Consumer 1-4 family mortgage loans | |||||||||
| Past due accruing loans (90 days or more) | 0 | 6 | 53 | 0 | 29 | ||||
| Nonaccrual loans(1) | 890 | 341 | 409 | 301 | 1,576 | ||||
| Subtotal nonperforming loans | 890 | 347 | 462 | 301 | 1,605 | ||||
| Other consumer loans | |||||||||
| Past due accruing loans (90 days or more) | 0 | 0 | 0 | 0 | 0 | ||||
| Nonaccrual loans(1) | 0 | 235 | 0 | 0 | 51 | ||||
| Subtotal nonperforming loans | 0 | 235 | 0 | 0 | 51 | ||||
| Total nonperforming loans | $7,260 | $9,407 | $6,692 | $13,055 | $13,707 |
Nonperforming assets of the Company include nonperforming loans (as indicated above), nonaccrual investments and other real estate owned and repossessions, the total of which amounted to $7.6$19.0 million and $9.5$7.6 million at December 31, 2019 and 2018, and 2017, respectively. Nonperforming loans increased by $11.4 million during 2019, due primarily to the addition of a single manufacturing borrower with an outstanding balance of $8.3 million as of December 31, 2019. As of December 31, 2018,2019, management believed that there were no significant foreseeable losses relating to nonperforming assets, except as discussed below.
Loans for which the borrower appears to be unable or unwilling to repay its debt in full or on time and the collateral is insufficient to cover all principal and accrued interest, will be reclassified as nonperforming loans to the extent they are unsecured, on or before the date when the loan becomes 90 days delinquent, with the exception of small dollar other consumer loans which are not placed on nonaccrual status since these loans are charged-off when they have been delinquent from 90 to 180 days, and when the related collateral, if any, is not sufficient to offset the indebtedness. When a loan is classified as a nonaccrual loan, interest on the loan is no longer accrued, all unpaid accrued interest is reversed and interest income is subsequently recorded only to the extent cash payments are received. Accrual status is resumed when all contractually due payments are brought current and future payments are reasonably assured.
A loan is impaired when full payment under the original loan terms is not expected. Impairment is evaluated in total for smaller-balance loans of similar nature not in nonaccrual or troubled debt restructured status such as residential mortgage, consumer, and credit card loans, and on an individual loan basis for other loans. If a loan is impaired, a portion of the allowance may be allocated so that the loan is reported, net, at the present value of estimated future cash flow or at the fair value of collateral if repayment is expected solely from the collateral.
42
Total nonperforming loans on nonaccrual status were also on impaired status.$18.7 million, or 0.46% of total loans, at year end 2019 versus $7.3 million, or 0.19% of total loans, at year end 2018. There were $26.754 loans totaling $27.8 million and $13.9 million of loans classified as impaired as of December 31, 2018 and 2017.
Loans renegotiated as troubled debt restructurings are those loans for which either the contractual interest rate has been reduced below market rates and/or other concessions to market terms are granted to the borrower because of a deterioration in the financial condition of the borrower which results in the inability of the borrower to meet the terms of the loan.
As of December 31, 2019, there were 35 loans totaling $9.1 million renegotiated as troubled debt restructurings of which $35,000 were modified in 2019. Of these loans, $3.2 million were included in nonaccrual loans in the previous table and the remaining $5.9 million were performing under their modified terms. The reduction in troubled debt restructurings during 2019 resulted primarily from the paydown of loan balances. As of December 31, 2018, there were 40 loans totaling $12.4 million renegotiated as troubled debt restructurings of which $7.2 million were modified in 2018. Of these loans, $4.4 million were included in nonaccrual loans in the previous table and the remaining $8.0 million were performing under their modified terms. As of December 31, 2017, there were 42 loans totaling $10.6 million renegotiated as troubled debt restructurings of which $3.9 million were modified in 2017. Of these loans, $7.7 million were included in nonaccrual loans in the previous table and the remaining $2.9 million were performing under their modified terms. The Company has no commitments to lend additional funds to any of the borrowers.
43
The following is a summary of the loan loss experience for the years ended December 31, 2019, 2018, 2017, 2016 2015 and 2014.2015.
| | | | | | | | | | | | | | | | |
(dollars in thousands) |
| 2019 |
| 2018 |
| 2017 |
| 2016 |
| 2015 |
| |||||
Amount of loans outstanding, net of deferred fees, December 31, | | $ | 4,065,828 | | $ | 3,914,745 | | $ | 3,818,459 | | $ | 3,470,927 | | $ | 3,080,929 | |
Average daily loans outstanding during the year ended December 31, | | $ | 3,974,532 | | $ | 3,843,912 | | $ | 3,610,908 | | $ | 3,225,635 | | $ | 2,885,568 | |
Allowance for loan losses, January 1, | | $ | 48,453 | | $ | 47,121 | | $ | 43,718 | | $ | 43,610 | | $ | 46,262 | |
Loans charged-off: | |
|
| |
|
| |
|
| |
|
| |
|
| |
Commercial and industrial loans | |
| 1,447 | |
| 5,215 | |
| 842 | |
| 801 | |
| 1,320 | |
Commercial real estate and multi-family residential loans | |
| 17 | |
| 491 | |
| 406 | |
| 566 | |
| 1,114 | |
Agri-business and agricultural loans | |
| 0 | |
| 0 | |
| 0 | |
| 0 | |
| 0 | |
Other commercial loans | |
| 0 | |
| 0 | |
| 0 | |
| 0 | |
| 122 | |
Consumer 1-4 family mortgage loans | |
| 110 | |
| 48 | |
| 53 | |
| 478 | |
| 362 | |
Other consumer loans | |
| 336 | |
| 357 | |
| 259 | |
| 210 | |
| 255 | |
Total loans charged-off | |
| 1,910 | |
| 6,111 | |
| 1,560 | |
| 2,055 | |
| 3,173 | |
Recoveries of loans previously charged-off: | |
|
| |
|
| |
|
| |
|
| |
|
| |
Commercial and industrial loans | |
| 459 | |
| 752 | |
| 1,053 | |
| 461 | |
| 216 | |
Commercial real estate and multi-family residential loans | |
| 161 | |
| 30 | |
| 671 | |
| 336 | |
| 107 | |
Agri-business and agricultural loans | |
| 8 | |
| 42 | |
| 23 | |
| 19 | |
| 20 | |
Other commercial loans | |
| 0 | |
| 0 | |
| 0 | |
| 0 | |
| 0 | |
Consumer 1-4 family mortgage loans | |
| 123 | |
| 108 | |
| 99 | |
| 107 | |
| 52 | |
Other consumer loans | |
| 123 | |
| 111 | |
| 117 | |
| 90 | |
| 126 | |
Total recoveries | |
| 874 | |
| 1,043 | |
| 1,963 | |
| 1,013 | |
| 521 | |
Net loans charged-off (recovered) | |
| 1,036 | |
| 5,068 | |
| (403) | |
| 1,042 | |
| 2,652 | |
Provision for loan loss charged to expense | |
| 3,235 | |
| 6,400 | |
| 3,000 | |
| 1,150 | |
| — | |
Balance, December 31, | | $ | 50,652 | | $ | 48,453 | | $ | 47,121 | | $ | 43,718 | | $ | 43,610 | |
| | | | | | | | | | | | | | | | |
Ratio of net charge-offs during the period to average daily loans outstanding: | |
|
| |
|
| |
|
| |
|
| |
|
| |
Commercial and industrial loans | |
| 0.02 | % |
| 0.11 | % |
| 0.00 | % |
| 0.01 | % |
| 0.04 | % |
Commercial real estate and multi-family residential loans | |
| 0.00 | |
| 0.01 | |
| (0.01) | |
| 0.01 | |
| 0.03 | |
Agri-business and agricultural loans | |
| 0.00 | |
| 0.00 | |
| 0.00 | |
| 0.00 | |
| 0.00 | |
Other commercial loans | |
| 0.00 | |
| 0.00 | |
| 0.00 | |
| 0.00 | |
| 0.00 | |
Consumer 1-4 family mortgage loans | |
| 0.00 | |
| 0.00 | |
| 0.00 | |
| 0.01 | |
| 0.01 | |
Other consumer loans | |
| 0.01 | |
| 0.01 | |
| 0.00 | |
| 0.00 | |
| 0.01 | |
Total ratio of net charge-offs (recoveries) | |
| 0.03 | % |
| 0.13 | % |
| (0.01) | % |
| 0.03 | % |
| 0.09 | % |
Ratio of allowance for loan losses to nonperforming loans | |
| 270.58 | % |
| 667.40 | % |
| 500.91 | % |
| 653.31 | % |
| 334.04 | % |
44
| (dollars in thousands) | 2018 | 2017 | 2016 | 2015 | 2014 | |||||
| Amount of loans outstanding, net of deferred fees, December 31, | $3,914,745 | $3,818,459 | $3,470,927 | $3,080,929 | $2,762,320 | |||||
| Average daily loans outstanding during the year ended December 31, | $3,843,912 | $3,610,908 | $3,225,635 | $2,885,568 | $2,650,678 | |||||
| Allowance for loan losses, January 1, | $47,121 | $43,718 | $43,610 | $46,262 | $48,797 | |||||
| Loans charged-off: | ||||||||||
| Commercial and industrial loans | 5,215 | 842 | 801 | 1,320 | 1,441 | |||||
| Commercial real estate and multi-family residential loans | 491 | 406 | 566 | 1,114 | 2,560 | |||||
| Agri-business and agricultural loans | 0 | 0 | 0 | 0 | 0 | |||||
| Other commercial loans | 0 | 0 | 0 | 122 | 0 | |||||
| Consumer 1-4 family mortgage loans | 48 | 53 | 478 | 362 | 439 | |||||
| Other consumer loans | 357 | 259 | 210 | 255 | 245 | |||||
| Total loans charged-off | 6,111 | 1,560 | 2,055 | 3,173 | 4,685 | |||||
| Recoveries of loans previously charged-off: | ||||||||||
| Commercial and industrial loans | 752 | 1,053 | 461 | 216 | 914 | |||||
| Commercial real estate and multi-family residential loans | 30 | 671 | 336 | 107 | 928 | |||||
| Agri-business and agricultural loans | 42 | 23 | 19 | 20 | 20 | |||||
| Other commercial loans | 0 | 0 | 0 | 0 | 0 | |||||
| Consumer 1-4 family mortgage loans | 108 | 99 | 107 | 52 | 153 | |||||
| Other consumer loans | 111 | 117 | 90 | 126 | 135 | |||||
| Total recoveries | 1,043 | 1,963 | 1,013 | 521 | 2,150 | |||||
| Net loans charged-off | 5,068 | (403) | 1,042 | 2,652 | 2,535 | |||||
| Provision for loan loss charged to expense | 6,400 | 3,000 | 1,150 | 0 | 0 | |||||
| Balance, December 31, | $48,453 | $47,121 | $43,718 | $43,610 | $46,262 | |||||
Ratio of net charge-offs during the period to average daily loans outstanding: | ||||||||||
| Commercial and industrial loans | 0.11 | % | 0.00 | % | 0.01 | % | 0.04 | % | 0.02 | % |
| Commercial real estate and multi-family residential loans | 0.01 | (0.01) | 0.01 | 0.03 | 0.06 | |||||
| Agri-business and agricultural loans | 0.00 | 0.00 | 0.00 | 0.00 | 0.00 | |||||
| Other commercial loans | 0.00 | 0.00 | 0.00 | 0.00 | 0.00 | |||||
| Consumer 1-4 family mortgage loans | (0.00) | 0.00 | 0.01 | 0.01 | 0.01 | |||||
| Other consumer loans | 0.01 | 0.00 | 0.00 | 0.01 | 0.01 | |||||
| Total ratio of net charge-offs | 0.13 | % | (0.01) | % | 0.03 | % | 0.09 | % | 0.10 | % |
| Ratio of allowance for loan losses to nonperforming loans | 667.40 | % | 500.91 | % | 653.29 | % | 334.05 | % | 337.51 | % |
The following is a summary of the allocation for loan losses as of December 31, 2019, 2018, 2017, 2016 2015 and 2014.
| (dollars in thousands) | 2018 | 2017 | 2016 | 2015 | 2014 | ||||
| Allocated allowance for loan losses: | |||||||||
| Commercial and industrial loans | $22,518 | $21,097 | $20,272 | $21,564 | $22,785 | ||||
| Commercial real estate and multi-family residential loans | 15,393 | 14,714 | 13,452 | 12,473 | 14,153 | ||||
| Agri-business and agricultural loans | 4,305 | 4,920 | 3,532 | 2,445 | 1,790 | ||||
| Other commercial loans | 368 | 577 | 461 | 574 | 276 | ||||
| Consumer 1-4 family mortgage loans | 2,292 | 2,768 | 2,827 | 3,395 | 3,459 | ||||
| Other consumer loans | 283 | 379 | 387 | 319 | 483 | ||||
| Total allocated allowance for loan losses | 45,159 | 44,455 | 40,931 | 40,770 | 42,946 | ||||
| Unallocated allowance for loan losses | 3,294 | 2,666 | 2,787 | 2,840 | 3,316 | ||||
| Total allowance for loan losses | $48,453 | $47,121 | $43,718 | $43,610 | $46,262 |
| | | | | | | | | | | | | | | |
(dollars in thousands) |
| 2019 |
| 2018 |
| 2017 |
| 2016 |
| 2015 | |||||
Allocated allowance for loan losses: | |
| | |
| | |
| | |
| | |
| |
Commercial and industrial loans | | $ | 25,789 | | $ | 22,518 | | $ | 21,097 | | $ | 20,272 | | $ | 21,564 |
Commercial real estate and multi-family residential loans | |
| 15,796 | |
| 15,393 | |
| 14,714 | |
| 13,452 | |
| 12,473 |
Agri-business and agricultural loans | |
| 3,869 | |
| 4,305 | |
| 4,920 | |
| 3,532 | |
| 2,445 |
Other commercial loans | |
| 447 | |
| 368 | |
| 577 | |
| 461 | |
| 574 |
Consumer 1-4 family mortgage loans | |
| 2,086 | |
| 2,292 | |
| 2,768 | |
| 2,827 | |
| 3,395 |
Other consumer loans | |
| 345 | |
| 283 | |
| 379 | |
| 387 | |
| 319 |
Total allocated allowance for loan losses | |
| 48,332 | |
| 45,159 | |
| 44,455 | |
| 40,931 | |
| 40,770 |
Unallocated allowance for loan losses | |
| 2,320 | |
| 3,294 | |
| 2,666 | |
| 2,787 | |
| 2,840 |
Total allowance for loan losses | | $ | 50,652 | | $ | 48,453 | | $ | 47,121 | | $ | 43,718 | | $ | 43,610 |
At December 31, 2018,2019, the allowance for loan losses was 1.24%1.25% of total loans outstanding, versus 1.23%1.24% of total loans outstanding at December 31, 2017.2018. Management believes the allowance for loan losses is at a level commensurate with the overall risk exposure of the loan portfolio. However, if economic conditions do not remain stabilized, certain borrowers may experience difficulty and the level of nonperforming loans, charge-offs and delinquencies could rise and require increases in the provision for loan losses. The process of identifying probable incurred credit losses is a subjective process. Therefore, the Company maintains a general allowance to cover probable incurred credit losses within the entire portfolio. The methodology management uses to determine the adequacy of the loan loss reserve includes the considerations below.
Loans are charged against the allowance for loan losses when management believes that the principal is uncollectible. Subsequent recoveries, if any, are credited to the allowance. The allowance is an amount that management believes will be adequate to absorb probable incurred credit losses relating to specifically identified loans based on an evaluation of the loans by management, as well as other probable incurred losses inherent in the loan portfolio. The evaluations take into consideration such factors as changes in the nature and volume of the loan portfolio, overall portfolio quality, review of specific problem loans and current economic conditions that may affect the borrower’s ability to repay. Management also considers trends in adversely classified loans based upon a monthly review of those credits. An appropriate level of general allowance is determined after considering the following factors: applicationchanges in the nature and volume of historical loss percentages, emerging market risk, commercialthe loan focus and large credit concentrations, new industry lending activityportfolio, overall portfolio quality and current economic conditions.conditions that may affect the borrowers’ ability to repay. Consideration is not limited to these factors although they represent the most commonly cited factors. Federal regulations require insured institutions to classify their own assets on a regular basis. The regulations provide for three categories of classified loans: Substandard, Doubtful and Loss. The regulations also contain a Special Mention category. Special Mention is defined as loans that do not currently expose an insured institution to a sufficient degree of risk to warrant classification as Substandard, Doubtful or Loss but do possess credit deficiencies or potential weaknesses deserving management’s close attention. The Company’s policy is to establish a specific allowance for loan losses for any assets where management has identified conditions or circumstances that indicate an asset is impaired. If an asset or portion thereof is classified as loss, the Company’s policy is to either establish specific allowances for loan losses in the amount of 100% of the portion of the asset classified loss or charge-off such amount.
At December 31, 2018,2019, on the basis of management’s review of the loan portfolio, the Company had 91103 credits totaling $186.6$180.2 million on the classified loan list versus 9591 credits totaling $171.7$186.6 million on December 31, 2017.2018. As of December 31, 2018,2019, the Company had $101.4$96.6 million of assets classified as Special Mention, $85.2$84.6 million classified as Substandard, $0 classified as Doubtful and $0 classified as Loss as compared to $93.2$101.4 million, $78.5$85.2 million, $0 and $0, respectively at December 31, 2017.
Included in the classified loan amounts for December 31, 2019 above were the following troubled debt restructured loans: 17 mortgage loans totaling $1.1 million with total allocations of $247,000 and 18 commercial loans totaling $8.0 million with total allocations of $2.3 million. Included in the classified loan amounts for December 31, 2018 above were the following troubled debt restructured loans: 17 mortgage loans totaling $1.2 million with total allocations of $194,000, and 23 commercial loans totaling $11.2 million with total allocations of $3.5 million. Included in the classified loan amounts for December 31, 2017 above were the following troubled debt restructured loans: 17 mortgage loans totaling $1.2 million with total allocations of $210,000, and 25 commercial loans totaling $9.5 million with total allocations of $2.1 million.
Allowance estimates are developed by management taking into account actual loss experience, subject to a floor, adjusted for current economic conditions. Allowance estimates are considered a prudent measurement of the risk in the Company’s loan portfolio and are applied to individual loans based on loan type. In accordance with current accounting guidance, the allowance is provided for
45
losses that have been incurred as of the balance sheet date and is based on past events and current economic conditions and does not include the effects of expected losses on specific loans or groups of loans that are related to future events or expected changes in economic conditions. For a more thorough discussion of the allowance for loan losses methodology see the Critical Accounting Policies section of this Item 7.
The allowance for loan losses increased 2.8%4.5%, or $1.3$2.2 million, from $47.1 million at December 31, 2017 to $48.5 million at December 31, 2018. Pooled loan allocations decreased $6.1 million from $41.22018 to $50.7 million at December 31, 2017 to2019. Pooled loan allocations increased $2.8 million from $35.1 million at December 31, 2018 to $37.9 million at December 31, 2019, which was due to agrade migration of commercial loans from substandard to impaired inwithin the loan portfolio. This migration resulted in impairedpools and overall loan allocations increasing $6.8 million from $3.2 million at December 31, 2017 to $10.0 million at December 31, 2018. This increase in specific allocations on impaired loans was primarily due to higher levels of impaired loans with similar reserve levels at 20-25% of impaired loans, which is determined based on collateral shortfalls of each individual loan.growth. The unallocated component of the allowance for loan losses was $3.3$2.3 million at December 31, 2018,2019, which was similar to $2.7decreased from $3.3 million reported at December 31, 2017,2018, and increaseddecreased primarily due to growth in the loan portfolio.favorable watchlist trends. While general trends in credit quality were stable or favorable, the Company believes that the unallocated component is appropriate given the uncertainty that exists regarding near termcurrent economic conditions, including the risk of an economic downturn.
The Company has experienced growth in total loans over the last several years with growth of $151.1 million, or 3.9%, from December 31, 2018 to December 31, 2019 and $96.3 million, or 2.5%, from December 31, 2017 to December 31, 2018 and $347.5 million, or 10.0%, from December 31, 2016 to December 31, 2017.2018. The concentration of this loan growth was in the commercial loan portfolio, which can result in overall asset quality being influenced by a small number of credits. Management has historically considered growth and portfolio composition when determining loan loss allocations. Management believes that it is prudent to continue to provide for loan losses in a manner consistent with its historical approach due to the loan growth described above and current economic conditions.
Economic conditions in the Company’s markets are stable. Commercial real estate activity and manufacturing growth is continuing to occur in the Company’s market area. During 2019 and 2018, commercial and industrial loan growth was negatively impacted by a slowdown in manufacturing and consolidation in the recreational vehicle industry for borrowers in the Company’s geographic footprint. The Company’s continued growth strategy promotes diversification among industries, as well as continued focus on enforcement of a strong credit environment and an aggressive positiona disciplined approach in loan work-out situations.
Liquidity Risk
Liquidity risk arises from the possibility that the Company may not be able to satisfy current or future financial commitments or may become unduly reliant on alternative funding sources. Liquidity is monitored and closely managed by the ALCO Committee.
Management maintains a liquidity position that it believes will adequately provide funding for loan demand and deposit run-off that may occur in the normal course of business. The liquidity structure is expressly detailed in the Company’s Contingency Funding Plan, which is discussed below. The Company relies on a number of different sources in order to meet these potential liquidity demands. The primary sources are increases in deposit accounts and cash flows from loan payments and the securities portfolio. The cash flow from the securities portfolio is expected to provide approximately $62.8$75.8 million of potential contingent funding in 2019.
The Company has approval of $1.863$2.278 billion in secondary funding sources available as of December 31, 2018,2019, of which $334.9$283.5 million was utilized. The Company had $325.0 million of availability in federal funds lines with twelve correspondent banks, none of which was drawn on as of December 31, 2018.2019. The Company has Board approval to borrow up to $800.0 million at the FHLB, but, given the Company’s current collateral structure and outstanding borrowings as of December 31, 2018,2019, the Company could have only borrowed up to $85.6$115.5 million under this authority based on utilization of $170.0 million of advances at December 31, 2018.2019. The Company also has additional collateral that could be pledged to the FHLB of $204.1$265.9 million as of December 31, 20182019 to generate additional liquidity. Further, the Company had available capacity at the Federal Reserve Bank of Chicago of up to $286.5$339.5 million given its current collateral structure at the Federal Reserve Bank discount window program and the terms of these facilities at December 31, 2018.2019, with no balances outstanding at December 31, 2019. The Company also has established relationships in the brokered time deposit and brokered money market sectors, as well as the Promontory Interfinancial Network CDARS One-Way Buy program, to access these funds when desired with settlement of funds in one to two weeks’ time. Additionally, during 20182019 the Bank becomeentered into agreements with Promontory Interfinancial Network relative to their Insured Cash Sweep One-Way Buy program. As of December 31, 2019 the total amount available to the Bank via this program was $200.0 million, of which $75.1 million was drawn on. The Bank is also a member of the American Financial Exchange (AFX) where overnight fed funds purchased can be obtained from other banks on the Exchange that have approved the Bank for an unsecured, overnight line. These funds are only available if the approving banks have an ‘offer’ out to sell that day. As of December 31, 2018,2019, the total amount approved for Lake City Bank via AFX banks was $119.0$244.0 million and none was outstanding at year end.
46
The Company had all of its securities in the available for saleavailable-for-sale portfolio at December 31, 2018,2019, allowing the Company maximum flexibility to sell securities to meet funding demands. Management believes the majority of the securities in the available for saleavailable-for-sale portfolio are of high quality and marketable. Approximately 63%53% of this portfolio is comprised of U.S. government agency securities or mortgage-backed securities directly or indirectly backed by the U.S. government. In addition, the Company has historically sold the majority of its originated mortgage loans on the secondary market to reduce interest rate risk and to create an additional source of funding.
The Company has a formalized Contingency Funding Plan (“CFP”). The Board and management recognize the importance of liquidity during times of normal operations and in times of stress. The CFP was developed to ensure that the multiple liquidity sources available to the Company are readily available. The CFP specifically considers liquidity at the Bank and the Company level. The CFP identifies the potential funding sources at the Bank level, which includes the FHLB, the Federal Reserve Bank, brokered deposits,
Further, the CFP identifies CFP team members and expressly details their respective roles. Potential risk scenarios are identified and the plan includes multiple scenarios, including short-term and long-term funding crisis situations. Under the long-term funding crisis, two additional scenarios are identified: a moderate risk scenario and a highly stressed scenario. The CFP details the responsibilities and the actions to be taken by the CFP team under each scenario. Quarterly reports to management and the Board under the CFP include an early warning indicator matrix and pro forma cash flows for the various scenarios.
The following table discloses information on the maturity of the Company’s contractual long-term obligations as of December 31, 2018.
| Payments Due by Period | |||||||||
| One year | After 5 | ||||||||
| (dollars in thousands) | Total | or less | 1-3 years | 3-5 years | years | ||||
| Operating leases | $5,604 | $553 | $1,153 | $1,106 | $2,792 | ||||
| Pension and SERP plans | 2,797 | 356 | 626 | 594 | 1,221 | ||||
| Subordinated debentures | 30,928 | 0 | 0 | 0 | 30,928 | ||||
| Total contractual long-term cash obligations | $39,329 | $909 | $1,779 | $1,700 | $34,941 | ||||
| | | | | | | | | | | | | | | |
|
| Payments Due by Period | |||||||||||||
|
| | |
| One year | | | | | | | | After 5 | ||
(dollars in thousands) |
| | Total |
| or less |
| 1-3 years |
| 3-5 years |
| years | ||||
Operating leases | | $ | 5,838 | | $ | 561 | | $ | 1,176 | | $ | 1,228 | | $ | 2,873 |
Pension and SERP plans | |
| 2,941 | |
| 391 | |
| 694 | |
| 622 | |
| 1,234 |
Total contractual long-term cash obligations | | $ | 8,779 | | $ | 952 | | $ | 1,870 | | $ | 1,850 | | $ | 4,107 |
During the normal course of business, the Company becomes a party to financial instruments with off‑balanceoff-balance sheet risk in order to meet the financing needs of its customers. These financial instruments include commitments to make loans and open‑endedopen-ended revolving lines of credit. The Company follows the same credit policy (including requiring collateral, if deemed appropriate) to make such commitments as is followedit follows for those loans that are recorded in its financial statements.
The Company’s exposure to credit losses in the event of nonperformance is represented by the contractual amount of the commitments. Management does not expect any significant losses as a result of these commitments. Off-balance sheet transactions are more fully discussed in Note 18 – Commitments, Off-Balance Sheet Risks and Contingencies.
The following table discloses information on the maturity of the Company’s commitments.
| | | | | | | | | |
|
| Amount of Commitment Expiration Per Period | |||||||
| | Total | | | | | | | |
| | Amount | | One year | | Over one | |||
(dollars in thousands) |
| Committed |
| or less |
| year | |||
Unused loan commitments | | $ | 1,764,219 | | $ | 1,064,788 | | $ | 699,431 |
Standby letters of credit | |
| 70,932 | |
| 67,469 | |
| 3,463 |
Total commitments and letters of credit | | $ | 1,835,151 | | $ | 1,132,257 | | $ | 702,894 |
47
Amount of Commitment Expiration Per Period | |||||
| Total | |||||
| Amount | One year | Over one | |||
| (dollars in thousands) | Committed | or less | year | ||
| Unused loan commitments | $1,656,388 | $1,012,238 | $644,150 | ||
| Commercial letters of credit | 3,245 | 3,245 | 0 | ||
| Standby letters of credit | 81,512 | 77,267 | 4,245 | ||
| Total commitments and letters of credit | $1,741,145 | $1,092,750 | $648,395 | ||
Interest Rate Risk
Interest rate risk is the risk that the estimated fair value of the Company’s assets, liabilities and derivative financial instruments will decline as a result of changes in interest rates or financial market volatility, or that net income will be significantly reduced by interest rate changes.
Interest rate risk represents the Company’s primary market risk exposure. The Company does not have material exposure to foreign currency exchange risk and does not maintain a trading portfolio. The Corporate Risk Committee of the Board annually reviews and approves the ALCO policy and the Derivatives and Hedging policy used to manage interest rate risk. These policies set guidelines for balance sheet structure, which are designed to protect the Company from the impact that interest rate changes could have on net income, but it does not necessarily indicate the effect on future net interest income. Given the Company’s mix of interest bearing liabilities and interest earning assets on December 31, 20182019 and using changes in the interest rate environment over a one-year period, the net interest margin could be expected to decline in a falling interest rate environment and increase in a rising interest rate environment. Earnings can also be affected by the monetary and fiscal policies of the U.S. Government and its agencies, particularly the Federal Reserve Board.
During 20182019 the Federal Reserve Board’s Federal Open Market Committee (“FOMC”) raisedreduced interest rates by 25 basis points on fourthree different occasions: March, June,July, September and December.October. The December increase ended the year witheffect of these combined decreases lowered the target federal funds rate atto a range of 2.25% to 2.50% and marked1.50% - 1.75%. At the ninth rate increase overall since liftoffFOMC meeting in December 2015. The FOMC indicated in December2019 rates were left unchanged. At that “the labor market has continuedtime the Committee remained generally optimistic regarding the current state of the economy, pointing to strengthensolid job gains and economic activity has been rising at a strong rate”, while further stating that “householdpace of household spending, has continued to grow strongly, while growth ofdespite weak business fixed investment has moderatedresulting from its rapid pace earlier in the year”.uncertainty surrounding global trade policies and muted inflation. The updated economic projections released at the December meeting project twono rate hikeschanges in 20192020, a single rate increase in 2021 and one final hikemore in 2020.2022. Additionally, the longer run Fed median forecast for the federal funds rate was decreasedleft unchanged at 2.50%. The combined result of the increase in the yield on earning assets offset by 2 basis pointsan increase in the cost of funding earning assets led to 2.80%.decrease in the net interest margin from 3.43% for 2018 to 3.38% for 2019. The Company’s yield on earning assets increased 4617 basis points during 2018.2019. Contributing to this increase was the full year impact of the four 25 basis point FOMC rate increases made during 2018 given the year as well as theCompany’s asset sensitive balance sheet for the Company.sheet. The commercial loan portfolio represents 88% of the total loan portfolio. Approximately 65%64% of the commercial loan portfolio are variable rate loans which are primarily indexed to prime, 30 day LIBOR and FHLBIFHLB indices. The rate paid on deposit accounts and purchased funds increased 3627 basis points for 20182019 mainly due to increased rates paid on public fund accounts, including transactional accounts and time deposit accounts, as these accounts are typically higher priced and more sensitive to interest rates. Deposit rates as well as LIBOR-based funding in the form of subordinated debentures and increasesalso increased due to the rates paid on jumbo time deposits (non-public) due mainly to product pricing decisions driven by liquidity needs and competitive pricing pressure.
Future changes in the net interest margin will be dependent upon multiple factors including further actions by the FOMC during 20192020 in response to economic conditions and geopolitical concerns, the results of any of the current administrationadministration’s changes to economic policy and laws, particularly during an election year, competitive pressures in the various markets served, and changes in the structure of the balance sheet as a result of changes in customer demands for products and services. In general, we expect loans to reprice quicker than deposits in a rising and falling rate environment as quantified in the sensitivity to market rates table in Item 7A..
The effects of price changes and inflation can vary substantially for most financial institutions. While management believes that inflation affects the growth of total assets, it believes that it is difficult to assess the overall impact. Management believes this to be the case due to the fact that generally neither the timing nor the magnitude of the inflationary changes in the consumer price index (“CPI”) coincides with changes in interest rates. The price of one or more of the components of the CPI may fluctuate considerably and thereby influence the overall CPI without having a corresponding effect on interest rates or upon the cost of those goods and services normally purchased by the Company. In years of high inflation and high interest rates, intermediate and long-term interest rates tend to increase, thereby adversely impacting the market values of investment securities, mortgage loans and other long-term fixed rate loans. In addition, higher short-term interest rates caused by inflation tend to increase the cost of funds. In other years, the reverse situation may occur.
48
Market Risk
The Company’s primary market risk exposure is interest rate risk. The Company does not have a material exposure to foreign currency exchange rate risk and does not maintain a trading portfolio.
The following table provides information regarding the Company’s financial instruments that are sensitive to changes in interest rates. For loans, securities and liabilities with contractual maturities, the table presents principal cash flows and related weighted-average interest rates by contractual maturities, as well as the Company’s assumptions relative to the impact of interest-rate fluctuations on the prepayment of certain commercial, residential and home equity loans and mortgage-backed securities. Core deposits such as noninterest bearing deposits, interest-bearing checking, savings and money market deposits and securities sold under agreements to repurchase that have no contractual maturity, are shown based on management’s judgment and historical experience that indicates some portion of the balances are retained over time. Weighted-average variable rates are based upon rates existing at the reporting date.
| 2018 | |||||||||||||||
| Principal/Notional Amount Maturing in: | |||||||||||||||
| Fair | |||||||||||||||
| Value | |||||||||||||||
| (dollars in thousands) | Year 1 | Year 2 | Year 3 | Year 4 | Year 5 | Thereafter | Total | 12/31/2018 | |||||||
| Rate sensitive assets: | |||||||||||||||
| Fixed interest rate loans | $540,165 | $374,350 | $231,403 | $127,303 | $59,435 | $69,240 | $1,401,896 | $1,362,854 | |||||||
| Average interest rate | 4.47% | 4.54% | 4.53% | 4.63% | 4.69% | 4.60% | |||||||||
| Variable interest rate loans | $1,344,600 | $339,961 | $190,918 | $132,997 | $160,863 | $343,510 | $2,512,849 | $2,480,842 | |||||||
| Average interest rate | 5.16% | 5.11% | 5.00% | 5.08% | 5.17% | 5.30% | |||||||||
| Total loans | $1,884,765 | $714,311 | $422,321 | $260,300 | $220,298 | $412,750 | $3,914,745 | $3,843,696 | |||||||
| Average interest rate | 4.96% | 4.81% | 4.74% | 4.86% | 5.04% | 5.18% | |||||||||
| Fixed interest rate securities | $86,832 | $68,118 | $69,231 | $59,361 | $45,675 | $261,009 | $590,226 | $584,142 | |||||||
| Average interest rate | 3.04% | 2.72% | 2.47% | 2.68% | 2.80% | 3.06% | |||||||||
| Variable interest rate securities | $369 | $263 | $197 | $148 | $110 | $308 | $1,395 | $1,407 | |||||||
| Average interest rate | 5.53% | 5.74% | 5.74% | 5.74% | 5.74% | 5.74% | |||||||||
| Other interest-bearing assets | $24,632 | $0 | $0 | $0 | $0 | $0 | $24,632 | $24,632 | |||||||
| Average interest rate | 2.10% | 0.00% | 0.00% | 0.00% | 0.00% | 0.00% | |||||||||
| Total earning assets | $1,996,598 | $782,692 | $491,749 | $319,809 | $266,083 | $674,067 | $4,530,998 | $4,453,877 | |||||||
| Average interest rate | 4.84% | 4.63% | 4.42% | 4.46% | 4.66% | 4.36% | |||||||||
| Rate sensitive liabilities: | |||||||||||||||
| Noninterest bearing checking | $14,901 | $0 | $0 | $2,330 | $0 | $929,607 | $946,838 | $946,838 | |||||||
| Average interest rate | 0.00% | 0.00% | 0.00% | 0.00% | 0.00% | 0.00% | |||||||||
| Savings & interest bearing checking | $125,104 | $69,974 | $51,119 | $311,093 | $35,568 | $1,084,615 | $1,677,473 | $1,677,473 | |||||||
| Average interest rate | 0.97% | 0.56% | 0.58% | 2.25% | 0.61% | 1.21% | |||||||||
| Time deposits | $933,323 | $383,254 | $58,944 | $27,978 | $15,950 | $305 | $1,419,754 | $1,424,553 | |||||||
| Average interest rate | 2.10% | 2.05% | 1.95% | 2.14% | 2.81% | 1.36% | |||||||||
| Total deposits | $1,073,328 | $453,228 | $110,063 | $341,401 | $51,518 | $2,014,527 | $4,044,065 | $4,048,864 | |||||||
| Average interest rate | 1.94% | 1.82% | 1.31% | 2.22% | 1.28% | 0.65% | |||||||||
| Fixed interest rate borrowings | $170,000 | $0 | $0 | $0 | $0 | $0 | $170,000 | $169,996 | |||||||
| Average interest rate | 2.52% | 0.00% | 0.00% | 0.00% | 0.00% | 0.00% | |||||||||
| Variable interest rate borrowings | $5,379 | $10,646 | $6,679 | $52,851 | $0 | $30,928 | $106,483 | $106,750 | |||||||
| Average interest rate | 0.80% | 0.80% | 0.80% | 0.80% | 0.00% | 5.86% | |||||||||
| Total funds | $1,248,707 | $463,874 | $116,742 | $394,252 | $51,518 | $2,045,455 | $4,320,548 | $4,325,610 | |||||||
| Average interest rate | 1.67% | 1.80% | 1.28% | 2.03% | 1.28% | 0.73% | |||||||||
| Cumulative rate sensitivity gap | $747,891 | $318,818 | $375,007 | $(74,443) | $214,565 | $(1,371,388) | |||||||||
| Cumulative rate sensitivity gap ratio | $747,891 | $1,066,709 | $1,441,716 | $1,367,273 | $1,581,838 | $210,450 | |||||||||
| at December 31, 2018 | 159.9% | 168.7% | 421.2% | 81.1% | 516.5% | 33.0% | |||||||||
| at December 31, 2017 | 157.9% | 189.8% | 353.9% | 73.0% | 379.3% | 32.5% | |||||||||
| | | | | | | | | | | | | | | | | | | | | | | | |
|
| 2019 | ||||||||||||||||||||||
| | Principal/Notional Amount Maturing in: | ||||||||||||||||||||||
| | | | | | | | | | | | | | | | | | | | | | | Fair | |
| | | | | | | | | | | | | | | | | | | | | | | Value | |
(dollars in thousands) |
| Year 1 |
| Year 2 |
| Year 3 |
| Year 4 |
| Year 5 |
| Thereafter |
| Total |
| 12/31/2019 | ||||||||
Rate sensitive assets: |
| |
|
| |
|
| |
|
| |
|
| |
|
| |
|
| |
|
| |
|
Fixed interest rate loans | | $ | 636,738 | | $ | 364,120 | | $ | 224,197 | | $ | 119,225 | | $ | 57,211 | | $ | 44,887 | | $ | 1,446,378 | | $ | 1,438,244 |
Average interest rate | |
| 4.25 | % |
| 4.63 | % |
| 4.71 | % |
| 4.79 | % |
| 4.83 | % |
| 4.82 | % |
| | |
|
|
Variable interest rate loans | | $ | 1,463,554 | | $ | 409,016 | | $ | 201,450 | | $ | 166,141 | | $ | 108,585 | | $ | 270,704 | | $ | 2,619,450 | | $ | 2,603,580 |
Average interest rate | |
| 4.49 | % |
| 4.53 | % |
| 4.44 | % |
| 4.41 | % |
| 4.29 | % |
| 4.56 | % |
| | |
|
|
Total loans | | $ | 2,100,292 | | $ | 773,136 | | $ | 425,647 | | $ | 285,366 | | $ | 165,796 | | $ | 315,591 | | $ | 4,065,828 | | $ | 4,041,824 |
Average interest rate | |
| 4.41 | % |
| 4.58 | % |
| 4.58 | % |
| 4.57 | % |
| 4.48 | % |
| 4.59 | % |
| | |
|
|
Fixed interest rate securities | | $ | 102,446 | | $ | 83,025 | | $ | 65,383 | | $ | 55,644 | | $ | 28,742 | | $ | 254,811 | | $ | 590,051 | | $ | 424,419 |
Average interest rate | |
| 2.74 | % |
| 2.59 | % |
| 2.66 | % |
| 2.72 | % |
| 2.73 | % |
| 2.97 | % |
| | |
|
|
Variable interest rate securities | | $ | 267 | | $ | 190 | | $ | 139 | | $ | 101 | | $ | 74 | | $ | 188 | | $ | 959 | | $ | 183,814 |
Average interest rate | |
| 5.37 | % |
| 5.49 | % |
| 5.49 | % |
| 5.49 | % |
| 5.49 | % |
| 5.49 | % |
| | |
|
|
Other interest-bearing assets | | $ | 30,776 | | $ | 0 | | $ | 0 | | $ | 0 | | $ | 0 | | $ | 0 | | $ | 30,776 | | $ | 27,449 |
Average interest rate | |
| 1.54 | % |
| 0.00 | % |
| 0.00 | % |
| 0.00 | % |
| 0.00 | % |
| 0.00 | % |
| | |
|
|
Total earning assets | | $ | 2,233,781 | | $ | 856,351 | | $ | 491,169 | | $ | 341,111 | | $ | 194,612 | | $ | 570,590 | | $ | 4,687,614 | | $ | 4,677,506 |
Average interest rate | |
| 4.30 | % |
| 4.39 | % |
| 4.33 | % |
| 4.26 | % |
| 4.22 | % |
| 3.87 | % |
|
| |
|
|
Rate sensitive liabilities: | |
| | |
|
| |
|
| |
|
| |
|
| |
|
| |
|
| |
|
|
Noninterest bearing checking | | $ | 153,211 | | $ | 85,146 | | $ | 76,385 | | $ | 68,510 | | $ | 61,521 | | $ | 538,534 | | $ | 983,307 | | $ | 983,307 |
Average interest rate | |
| 0.00 | % |
| 0.00 | % |
| 0.00 | % |
| 0.00 | % |
| 0.00 | % |
| 0.00 | % |
|
| |
|
|
Savings & interest bearing checking | | $ | 504,434 | | $ | 159,388 | | $ | 138,038 | | $ | 120,235 | | $ | 105,226 | | $ | 931,124 | | $ | 1,958,445 | | $ | 1,958,445 |
Average interest rate | |
| 1.24 | % |
| 0.97 | % |
| 0.98 | % |
| 0.99 | % |
| 0.99 | % |
| 1.08 | % |
|
| |
|
|
Time deposits | | $ | 895,601 | | $ | 206,303 | | $ | 35,181 | | $ | 23,143 | | $ | 29,747 | | $ | 2,092 | | $ | 1,192,067 | | $ | 1,202,060 |
Average interest rate | |
| 2.10 | % |
| 2.07 | % |
| 2.20 | % |
| 2.66 | % |
| 2.69 | % |
| 1.92 | % |
|
| |
|
|
Total deposits | | $ | 1,553,246 | | $ | 450,837 | | $ | 249,604 | | $ | 211,888 | | $ | 196,494 | | $ | 1,471,750 | | $ | 4,133,819 | | $ | 4,143,812 |
Average interest rate | |
| 1.61 | % |
| 1.29 | % |
| 0.85 | % |
| 0.85 | % |
| 0.94 | % |
| 0.68 | % |
| | |
|
|
Fixed interest rate borrowings | | $ | 170,000 | | $ | 0 | | $ | 0 | | $ | 0 | | $ | 0 | | $ | 0 | | $ | 170,000 | | $ | 169,998 |
Average interest rate | |
| 1.63 | % |
| 0.00 | % |
| 0.00 | % |
| 0.00 | % |
| 0.00 | % |
| 0.00 | % |
|
| |
|
|
Variable interest rate borrowings | | $ | 0 | | $ | 0 | | $ | 0 | | $ | 0 | | $ | 0 | | $ | 0 | | $ | 0 | | $ | 0 |
Average interest rate | |
| 0.00 | % |
| 0.00 | % |
| 0.00 | % |
| 0.00 | % |
| 0.00 | % |
| 0.00 | % |
|
| |
|
|
Total funds | | $ | 1,723,246 | | $ | 450,837 | | $ | 249,604 | | $ | 211,888 | | $ | 196,494 | | $ | 1,471,750 | | $ | 4,303,819 | | $ | 4,313,810 |
Average interest rate | |
| 1.61 | % |
| 1.29 | % |
| 0.85 | % |
| 0.85 | % |
| 0.94 | % |
| 0.68 | % |
|
| |
|
|
Interest rate sensitivity gap by period | | $ | 510,535 | | $ | 405,514 | | $ | 241,565 | | $ | 129,223 | | $ | (1,882) | | $ | (901,160) | | | | | | |
Cumulative rate sensitivity gap | | $ | 510,535 | | $ | 916,049 | | $ | 1,157,614 | | $ | 1,286,837 | | $ | 1,284,955 | | $ | 383,795 | |
|
| |
|
|
Cumulative rate sensitivity ratio | | | | | | | | | | | | | | | | | | | |
|
| |
|
|
at December 31, 2019 | |
| 129.6 | % |
| 189.9 | % |
| 196.8 | % |
| 161.0 | % |
| 99.0 | % |
| 38.8 | % |
|
| |
|
|
at December 31, 2018 | |
| 159.9 | % |
| 168.7 | % |
| 421.2 | % |
| 81.1 | % |
| 516.5 | % |
| 33.0 | % |
|
| |
|
|
The Company utilizes computer modeling software to stress test the balance sheet under a wide variety of interest rate scenarios. The model quantifies the income impact of changes in customer preference for products, basis risk between the assets and the liabilities that support them and the risk inherent in different yield curves as well as other factors. The ALCO committee reviews these possible outcomes and makes loan, investment and deposit decisions that maintain reasonable balance sheet structure in light of potential interest rate movements. It is the objective of the Company to monitor and manage risk exposure to net interest income caused by changes in interest rates. It is the goal of the Company’s asset/liability function to provide optimum and stable net interest
49
income. To accomplish this, management uses two asset liability tools: GAP/Interest Rate Sensitivity Reports and Net Interest Income Simulation Modeling, which are constructed, presented and monitored quarterly. Management believes that the Company’s liquidity and interest sensitivity position at December 31, 2018,2019, remained adequate to meet the Company’s primary goal of achieving optimum interest margins while avoiding undue interest rate risk. The Company places a greater level of credence in net interest income simulation modeling. The GAP/Interest Rate Sensitivity Report is believed by the Company’s management to have two major shortfalls. The GAP/Interest Rate Sensitivity Report fails to precisely gauge how often an interest rate sensitive product reprices, nor is it able to measure the magnitude of potential future rate movements. Although management does not consider GAP ratios in
Net interest income simulation modeling, or earnings-at-risk, measures the sensitivity of net interest income to various interest rate movements. The Company’s asset liability process monitors simulated net interest income under three separate interest rate scenarios; base, rising and falling. Estimated net interest income for each scenario is calculated over a twelve-month horizon. The immediate and parallel changes to the base case scenario used in the model are presented below. The interest rate scenarios are used for analytical purposes and do not necessarily represent management’s view of future market movements. Rather, these are intended to provide a measure of the degree of volatility interest rate movements may introduce into the earnings of the Company.
The base scenario is highly dependent on numerous assumptions embedded in the model. While the base sensitivity analysis incorporates management’s best estimate of interest rate and balance sheet dynamics under various market rate movements, the actual behavior and resulting earnings impact will likely differ from that projected. For certain assets, the base simulation model captures the expected prepayment behavior under changing interest rate environments. Assumptions and methodologies regarding the interest rate or balance behavior of indeterminate maturity core deposit products, such as savings, money market, NOW and demand deposits reflect management’s best estimate of expected future behavior.
Results for the base, falling 100 basis points, falling 50 basis points, falling 25 basis points, rising 25 basis points, rising 50 basis points, rising 100 basis points, rising 200 basis points, and rising 300 basis points interest rate scenarios are listed below based upon the Company’s rate sensitive assets and liabilities at December 31, 2018.2019. The net interest income shown represents cumulative net interest income over a twelve-month time horizon. Balance sheet assumptions used for the base scenario are the same for the rising and falling simulations.
| Falling | Rising | Rising | Rising | Rising | Rising | |||||||||
| Base | (100 Basis Points) | (25 Basis Points) | (50 Basis Points) | (100 Basis Points) | (200 Basis Points) | (300 Basis Points) | ||||||||
| (dollars in thousands) | ||||||||||||||
| Net interest income | $160,865 | $149,428 | $163,155 | $165,406 | $169,894 | $178,776 | $187,542 | |||||||
| Variance from Base | $(11,437) | $2,290 | $4,541 | $9,029 | $17,911 | $26,677 | ||||||||
| Percent of change from Base | (7.11) | % | 1.42 | % | 2.82 | % | 5.61 | % | 11.13 | % | 16.58 | % | ||
| | | | | | | | | | | | | | | | | | | | | | | | | | | | |
|
| | |
| Falling |
| Falling |
| Falling |
| Rising |
| Rising |
| Rising |
| Rising |
| Rising |
| ||||||||
|
| Base |
| (100 Basis Points) |
| (50 Basis Points) |
| (25 Basis Points) |
| (25 Basis Points) |
| (50 Basis Points) |
| (100 Basis Points) |
| (200 Basis Points) |
| (300 Basis Points) |
| |||||||||
(dollars in thousands) | |
| | |
| | |
| | |
| | |
| | |
| | |
| | |
| | |
| |
|
Net interest income | | $ | 164,152 | | $ | 154,745 | | $ | 159,914 | | $ | 162,087 | | $ | 165,842 | | $ | 167,548 | | $ | 170,890 | | $ | 177,252 | | $ | 183,247 | |
Variance from Base | | | | | $ | (9,407) | | $ | (4,238) | | $ | (2,064) | | $ | 1,690 | | $ | 3,397 | | $ | 6,738 | | $ | 13,100 | | $ | 19,096 | |
Percent of change from Base | | | | |
| (5.73) | % |
| (2.58) | % |
| (1.26) | % |
| 1.03 | % |
| 2.07 | % |
| 4.11 | % |
| 7.98 | % |
| 11.63 | % |
For more information on the Company’s interest rate sensitivity see the Interest Rate Risk discussion in Item 7.7A. above.
50
Stockholders and Board of Directors
Lakeland Financial Corporation
Warsaw, Indiana
Opinions on the Financial Statements and Internal Control over Financial Reporting
We have audited the accompanying consolidated balance sheets of Lakeland Financial Corporation (the "Company") as of December 31, 20182019 and 2017,2018, the related consolidated statements of income, comprehensive income, changes in stockholders’ equity, and cash flows for each of the years in the three-year period ended December 31, 2018,2019, and the related notes (collectively referred to as the "financial statements"). We also have audited the Company’s internal control over financial reporting as of December 31, 2018,2019, based on “criteriacriteria established in Internal Control – Integrated Framework: (2013) issued by the Committee of Sponsoring Organizations of the Treadway Commission (COSO).”
In our opinion, the financial statements referred to above present fairly, in all material respects, the financial position of the Company as of December 31, 20182019 and 2017,2018, and the results of its operations and its cash flows for each of the years in the three-year period ended December 31, 20182019 in conformity with accounting principles generally accepted in the United States of America. Also in our opinion, the Company maintained, in all material respects, effective internal control over financial reporting as of December 31, 2018,2019, based on “criteriacriteria established in Internal Control – Integrated Framework: (2013) issued by COSO.”
Basis for Opinions
The Company’s management is responsible for these financial statements, for maintaining effective internal control over financial reporting, and for its assessment of the effectiveness of internal control over financial reporting, included in the accompanying Management’s Report on Internal Control over Financial Reporting.Reporting. Our responsibility is to express an opinion on the Company’s financial statements and an opinion on the Company’s internal control over financial reporting based on our audits. We are a public accounting firm registered with the Public Company Accounting Oversight Board (United States) ("PCAOB") and are required to be independent with respect to the Company in accordance with the U.S. federal securities laws and the applicable rules and regulations of the Securities and Exchange Commission and the PCAOB.
We conducted our audits in accordance with the standards of the PCAOB. Those standards require that we plan and perform the audits to obtain reasonable assurance about whether the financial statements are free of material misstatement, whether due to error or fraud, and whether effective internal control over financial reporting was maintained in all material respects.
Our audits of the financial statements included performing procedures to assess the risks of material misstatement of the financial statements, whether due to error or fraud, and performing procedures that respond to those risks. Such procedures included examining, on a test basis, evidence regarding the amounts and disclosures in the financial statements. Our audits also included evaluating the accounting principles used and significant estimates made by management, as well as evaluating the overall presentation of the financial statements. Our audit of internal control over financial reporting included obtaining an understanding of internal control over financial reporting, assessing the risk that a material weakness exists, and testing and evaluating the design and operating effectiveness of internal control based on the assessed risk. Our audits also included performing such other procedures as we considered necessary in the circumstances. We believe that our audits provide a reasonable basis for our opinions.
Definition and Limitations of Internal Control Over Financial Reporting
A company’s internal control over financial reporting is a process designed to provide reasonable assurance regarding the reliability of financial reporting and the preparation of financial statements for external purposes in accordance with generally accepted accounting principles. A company’s internal control over financial reporting includes those policies and procedures that (1) pertain to the maintenance of records that, in reasonable detail, accurately and fairly reflect the transactions and dispositions of the assets of the company; (2) provide reasonable assurance that transactions are recorded as necessary to permit preparation of financial statements in accordance with generally accepted accounting principles, and that receipts and expenditures of the company are being made only in accordance with authorizations of
51
or timely detection of unauthorized acquisition, use, or disposition of the company’s assets that could have a material effect on the financial statements.
Because of its inherent limitations, internal control over financial reporting may not prevent or detect misstatements. Also, projections of any evaluation of effectiveness to future periods are subject to the risk that controls may become inadequate because of changes in conditions, or that the degree of compliance with the policies or procedures may deteriorate.
Critical Audit Matter
The critical audit matter communicated below is a matter arising from the current period audit of the consolidated financial statements that was communicated or required to be communicated to the audit committee and that: (1) relates to accounts or disclosures that are material to the consolidated financial statements and (2) involved our especially challenging, subjective, or complex judgments. The communication of critical audit matters does not alter in any way our opinion on the consolidated financial statements, taken as a whole, and we are not, by communicating the critical audit matter below, providing a separate opinion on the critical audit matter or on the accounts or disclosures to which it relates.
Allowance for Loan Losses – Qualitative Factors
As described in Notes 1 and 4 to the consolidated financial statements, the Company’s allowance for loan losses is a valuation account that reflects the Company’s estimation of incurred losses in its loan portfolio to the extent they are both probable and reasonable to estimate. The allowance for loan losses was $50,652,000 at December 31, 2019, which consists of two components: the valuation allowance for loans individually evaluated for impairment (“specific component”), representing $10,384,000, and the valuation allowance for loans collectively evaluated for impairment (“general component”), representing $40,268,000. The general component is based on the Company’s historical loss experience over the most recent three years subject to a floor, adjusted for qualitative factors.
The qualitative factors include consideration of the following: levels of, and trends in, delinquencies and impaired loans; trends in volume and terms of loans; effects of any changes in risk selection and underwriting standards; other changes in lending policies, procedure, and practices; experience, ability, and depth of lending management and other relevant staff; national and local economic trends and conditions; industry conditions; and effects of changes in credit concentrations. Due to the significant judgment applied by management to determine the effect of the qualitative factors, we identified the effect of the qualitative factors on the allowance for loan losses as a critical audit matter as it involved especially subjective auditor judgment to audit management’s determination of the qualitative factors.
The primary procedures we performed to address this critical audit matter included:
| ● | Testing the effectiveness of controls over the evaluation of the items used to estimate the qualitative factors, including controls addressing: |
o | Management’s review of the completeness and accuracy of data inputs used as the basis for the allowance allocations resulting from the qualitative factors. |
o | Management’s review of the reasonableness of the judgments and assumptions used to develop the qualitative factors for the general component of the allowance for loan losses. |
o | Management’s review of the mathematical accuracy of the allowance calculation. |
| ● | Substantively testing management’s process, including evaluating their judgments and assumptions, for developing the qualitative factors, which included: |
o | Evaluation of the completeness and accuracy of data inputs used as a basis for the qualitative factors. |
o | Evaluation of the reasonableness of management’s judgments related to the qualitative and quantitative assessment of the data used in the determination of the qualitative factors and the resulting allocation to the |
52
allowance. Among other procedures, our evaluation considered, evidence from internal and external sources, loan portfolio performance and whether such assumptions were applied consistently from period to period.
o | Analytically evaluating the qualitative factors year over year for directional consistency, testing for reasonableness, and obtaining evidence for significant changes. |
o | Testing the mathematical accuracy of the allowance calculation, including the application of the qualitative factors. |
/s/ Crowe LLP
We have served as the Company'sCompany’s auditor since 1983.
South Bend, Indiana
February 24, 2020
53
| CONSOLIDATED BALANCE SHEETS (in thousands except share data) | |||
| December 31 | 2018 | 2017 | |
| ASSETS | |||
| Cash and due from banks | $192,290 | $140,402 | |
| Short-term investments | 24,632 | 35,778 | |
| Total cash and cash equivalents . . . . . . . . . . . . . . . . . . . . . . . . . . . . . . . . . . . . . . . . . . . . . . . . . . . . . . . . . . . . . . . . . . . . . . . . . . . . . . | 216,922 | 176,180 | |
| Securities available for sale (carried at fair value) | 585,549 | 538,493 | |
| Real estate mortgage loans held for sale | 2,293 | 3,346 | |
| Loans, net of allowance for loan losses of $48,453 and $47,121 . . . . . . . . . . . . . . . . . . . . . . . . . . . . . . . . . . . . . . . . . . . . . . . . . . . . . . . . . . . | 3,866,292 | 3,771,338 | |
| Land, premises and equipment, net | 58,097 | 56,466 | |
| Bank owned life insurance | 77,106 | 75,879 | |
| Federal Reserve and Federal Home Loan Bank Stock | 13,772 | 13,772 | |
| Accrued interest receivable | 15,518 | 14,093 | |
| Goodwill | 4,970 | 4,970 | |
| Other assets | 34,735 | 28,439 | |
| Total assets . . . . . . . . . . . . . . . . . . . . . . . . . . . . . . . . . . . . . . . . . . . . . . . . . . . . . . . . . . . . . . . . . . . . . . . . . . . . . . . . . . . . . . . . . . . . . . . . . . | $4,875,254 | $4,682,976 | |
| LIABILITIES AND STOCKHOLDERS' EQUITY | |||
| LIABILITIES | |||
| Noninterest bearing deposits | $946,838 | $885,622 | |
| Interest bearing deposits | 3,097,227 | 3,123,033 | |
| Total deposits . . . . . . . . . . . . . . . . . . . . . . . . . . . . . . . . . . . . . . . . . . . . . . . . . . . . . . . . . . . . . . . . . . . . . . . . . . . . . . . . . . . . . . . . . . . . . . . . | 4,044,065 | 4,008,655 | |
| Borrowings | |||
| Securities sold under agreements to repurchase | 75,555 | 70,652 | |
| Federal Home Loan Bank advances | 170,000 | 80,030 | |
| Subordinated debentures | 30,928 | 30,928 | |
| Total borrowings . . . . . . . . . . . . . . . . . . . . . . . . . . . . . . . . . . . . . . . . . . . . . . . . . . . . . . . . . . . . . . . . . . . . . . . . . . . . . . . . . . . . . . . . . . . . . . . . | 276,483 | 181,610 | |
| Accrued interest payable | 10,404 | 6,311 | |
| Other liabilities | 22,598 | 17,733 | |
| Total liabilities . . . . . . . . . . . . . . . . . . . . . . . . . . . . . . . . . . . . . . . . . . . . . . . . . . . . . . . . . . . . . . . . . . . . . . . . . . . . . . . . . . . . . . . . . . . . . . . | 4,353,550 | 4,214,309 | |
| Commitments, off-balance sheet risks and contingencies (Notes 1 and 18) | |||
| STOCKHOLDERS' EQUITY | |||
| Common stock: 90,000,000 shares authorized, no par value | |||
| 25,301,732 shares issued and 25,128,773 outstanding as of December 31, 2018 | |||
| 25,194,903 shares issued and 25,025,933 outstanding as of December 31, 2017 | 112,383 | 108,862 | |
| Retained earnings | 419,179 | 363,794 | |
| Accumulated other comprehensive income (loss) | (6,191) | (670) | |
| Treasury stock, at cost (2018 - 172,959 shares, 2017 - 168,970 shares) | (3,756) | (3,408) | |
| Total stockholders' equity . . . . . . . . . . . . . . . . . . . . . . . . . . . . . . . . . . . . . . . . . . . . . . . . . . . . . . . . . . . . . . . . . . . . . . . . . . . . . . . . . . . . | 521,615 | 468,578 | |
| Noncontrolling interest | 89 | 89 | |
| Total equity | 521,704 | 468,667 | |
| Total liabilities and stockholders' equity . . . . . . . . . . . . . . . . . . . . . . . . . . . . . . . . . . . . . . . . . . . . . . . . . . . . . . . . . . . . . . . . . . . . | $4,875,254 | $4,682,976 |
CONSOLIDATED BALANCE SHEETS (in thousands, except share data)
| | | | | | |
December 31 |
| 2019 |
| 2018 | ||
ASSETS |
| |
|
| |
|
Cash and due from banks | | $ | 68,605 | | $ | 192,290 |
Short-term investments | |
| 30,776 | |
| 24,632 |
Total cash and cash equivalents | |
| 99,381 | |
| 216,922 |
| | | | | | |
Securities available-for-sale (carried at fair value) | |
| 608,233 | |
| 585,549 |
Real estate mortgage loans held-for-sale | |
| 4,527 | |
| 2,293 |
| | | | | | |
Loans, net of allowance for loan losses of $50,652 and $48,453 | |
| 4,015,176 | |
| 3,866,292 |
| | | | | | |
Land, premises and equipment, net | |
| 60,154 | |
| 58,097 |
Bank owned life insurance | |
| 83,848 | |
| 77,106 |
Federal Reserve and Federal Home Loan Bank Stock | |
| 13,772 | |
| 13,772 |
Accrued interest receivable | |
| 15,391 | |
| 15,518 |
Goodwill | |
| 4,970 | |
| 4,970 |
Other assets | |
| 41,293 | |
| 34,735 |
Total assets | | $ | 4,946,745 | | $ | 4,875,254 |
| | | | | | |
LIABILITIES AND STOCKHOLDERS’ EQUITY | |
|
| |
|
|
| | | | | | |
LIABILITIES | |
|
| |
|
|
Noninterest bearing deposits | | $ | 983,307 | | $ | 946,838 |
Interest bearing deposits | |
| 3,150,512 | |
| 3,097,227 |
Total deposits | |
| 4,133,819 | |
| 4,044,065 |
| | | | | | |
Borrowings | |
|
| |
|
|
Securities sold under agreements to repurchase | |
| 0 | |
| 75,555 |
Federal Home Loan Bank advances | |
| 170,000 | |
| 170,000 |
Subordinated debentures | |
| 0 | |
| 30,928 |
Total borrowings | |
| 170,000 | |
| 276,483 |
| | | | | | |
Accrued interest payable | |
| 11,604 | |
| 10,404 |
Other liabilities | |
| 33,222 | |
| 22,598 |
Total liabilities | |
| 4,348,645 | |
| 4,353,550 |
| | | | | | |
Commitments, off-balance sheet risks and contingencies (Notes 1 and 18) | |
|
| |
|
|
| | | | | | |
STOCKHOLDERS’ EQUITY | |
|
| |
|
|
Common stock: 90,000,000 shares authorized, no par value | |
|
| |
|
|
25,623,016 shares issued and 25,444,275 outstanding as of December 31, 2019 | |
|
| |
|
|
25,301,732 shares issued and 25,128,773 outstanding as of December 31, 2018 | |
| 114,858 | |
| 112,383 |
Retained earnings | |
| 475,247 | |
| 419,179 |
Accumulated other comprehensive income (loss) | |
| 12,059 | |
| (6,191) |
Treasury stock, at cost (178,741 shares and 172,959 shares as of December 31, 2019 and 2018, respectively) | |
| (4,153) | |
| (3,756) |
Total stockholders’ equity | |
| 598,011 | |
| 521,615 |
Noncontrolling interest | |
| 89 | |
| 89 |
Total equity | |
| 598,100 | |
| 521,704 |
Total liabilities and equity | | $ | 4,946,745 | | $ | 4,875,254 |
The accompanying notes are an integral part of these consolidated financial statements.
54
| CONSOLIDATED STATEMENTS OF INCOME (in thousands except share and per share data) | |||||
| Years Ended December 31 | 2018 | 2017 | 2016 | ||
| NET INTEREST INCOME | |||||
| Interest and fees on loans | |||||
| Taxable | $181,451 | $150,295 | $124,830 | ||
| Tax exempt | 814 | 729 | 462 | ||
| Interest and dividends on securities | |||||
| Taxable | 9,717 | 9,218 | 9,421 | ||
| Tax exempt | 6,079 | 5,102 | 3,885 | ||
| Interest on short-term investments | 909 | 354 | 353 | ||
| Total interest income | 198,970 | 165,698 | 138,951 | ||
| Interest on deposits | 44,913 | 27,026 | 18,944 | ||
| Interest on borrowings | |||||
| Short-term | 1,143 | 1,446 | 352 | ||
| Long-term | 1,643 | 1,334 | 1,174 | ||
| Total interest expense | 47,699 | 29,806 | 20,470 | ||
| NET INTEREST INCOME . . . . . . . . . . . . . . . . . . . . . . . . . . . . . . . . . . . . . . . . . . . . . . . . . . . . . . . . . . . . . . . . | 151,271 | 135,892 | 118,481 | ||
| Provision for loan losses | 6,400 | 3,000 | 1,150 | ||
| NET INTEREST INCOME AFTER PROVISION FOR | |||||
| LOAN LOSSES . . . . . . . . . . . . . . . . . . . . . . . . . . . . . . . . . . . . . . . . . . . . . . . . . . . . . . . . . . . . . . . . . . . . . . . | 144,871 | 132,892 | 117,331 | ||
| NONINTEREST INCOME | |||||
| Wealth advisory fees | 6,344 | 5,481 | 4,805 | ||
| Investment brokerage fees | 1,458 | 1,273 | 1,010 | ||
| Service charges on deposit accounts | 15,831 | 13,696 | 12,013 | ||
| Loan and service fees | 9,291 | 7,900 | 7,681 | ||
| Merchant and interchange fee income | 2,461 | 2,279 | 2,098 | ||
| Bank owned life insurance income | 1,244 | 1,768 | 1,392 | ||
| Other income | 2,381 | 2,598 | 2,213 | ||
| Mortgage banking income | 1,150 | 982 | 1,586 | ||
| Net securities gains (losses) | (50) | 32 | 66 | ||
| Total noninterest income . . . . . . . . . . . . . . . . . . . . . . . . . . . . . . . . . . . . . . . . . . . . . . . . . . . . . . . . . . . . . . . | 40,110 | 36,009 | 32,864 | ||
| NONINTEREST EXPENSE | |||||
| Salaries and employee benefits | 48,353 | 45,306 | 41,656 | ||
| Net occupancy expense | 5,149 | 4,595 | 4,266 | ||
| Equipment costs | 5,243 | 4,629 | 3,850 | ||
| Data processing fees and supplies | 9,685 | 8,233 | 8,148 | ||
| Corporate and business development | 5,066 | 4,744 | 3,328 | ||
| FDIC insurance and other regulatory fees | 1,701 | 1,798 | 2,001 | ||
| Professional fees | 3,798 | 3,574 | 3,208 | ||
| Other expense | 7,042 | 6,388 | 6,521 | ||
| Total noninterest expense . . . . . . . . . . . . . . . . . . . . . . . . . . . . . . . . . . . . . . . . . . . . . . . . . . . . . . . . . . . . . . . . . | 86,037 | 79,267 | 72,978 | ||
| INCOME BEFORE INCOME TAX EXPENSE | 98,944 | 89,634 | 77,217 | ||
| Income tax expense | 18,533 | 32,304 | 25,133 | ||
| NET INCOME . . . . . . . . . . . . . . . . . . . . . . . . . . . . . . . . . . . . . . . . . . . . . . . . . . . . . . . . . . . . . . . . . . . . . . . . . . . . . . | $80,411 | $57,330 | $52,084 | ||
| BASIC WEIGHTED AVERAGE COMMON SHARES | 25,288,533 | 25,181,208 | 25,056,095 | ||
| BASIC EARNINGS PER COMMON SHARE | $3.18 | $2.28 | $2.08 | ||
| DILUTED WEIGHTED AVERAGE COMMON SHARES | 25,727,831 | 25,663,381 | 25,460,727 | ||
| DILUTED EARNINGS PER COMMON SHARE | $3.13 | $2.23 | $2.05 | ||
CONSOLIDATED STATEMENTS OF INCOME (in thousands, except share and per share data)
| | | | | | | | | |
Years Ended December 31 |
| 2019 |
| 2018 |
| 2017 | |||
NET INTEREST INCOME |
| |
|
| |
|
| |
|
Interest and fees on loans |
| |
|
| |
|
| |
|
Taxable | | $ | 196,733 | | $ | 181,451 | | $ | 150,295 |
Tax exempt | |
| 951 | |
| 814 | |
| 729 |
Interest and dividends on securities | |
| | |
|
| |
|
|
Taxable | |
| 8,909 | |
| 9,717 | |
| 9,218 |
Tax exempt | |
| 7,127 | |
| 6,079 | |
| 5,102 |
Interest on short-term investments | |
| 1,490 | |
| 909 | |
| 354 |
Total interest income | |
| 215,210 | |
| 198,970 | |
| 165,698 |
| | | | | | | | | |
Interest on deposits | |
| 57,148 | |
| 44,913 | |
| 27,026 |
Interest on borrowings | |
|
| |
|
| |
|
|
Short-term | |
| 1,311 | |
| 1,143 | |
| 1,446 |
Long-term | |
| 1,704 | |
| 1,643 | |
| 1,334 |
Total interest expense | |
| 60,163 | |
| 47,699 | |
| 29,806 |
| | | | | | | | | |
NET INTEREST INCOME | |
| 155,047 | |
| 151,271 | |
| 135,892 |
| | | | | | | | | |
Provision for loan losses | |
| 3,235 | |
| 6,400 | |
| 3,000 |
| | | | | | | | | |
NET INTEREST INCOME AFTER PROVISION FOR | |
|
| |
|
| |
|
|
LOAN LOSSES | |
| 151,812 | |
| 144,871 | |
| 132,892 |
| | | | | | | | | |
NONINTEREST INCOME | |
|
| |
|
| |
|
|
Wealth advisory fees | |
| 6,835 | |
| 6,344 | |
| 5,481 |
Investment brokerage fees | |
| 1,687 | |
| 1,458 | |
| 1,273 |
Service charges on deposit accounts | |
| 15,717 | |
| 15,831 | |
| 13,696 |
Loan and service fees | |
| 9,911 | |
| 9,291 | |
| 7,900 |
Merchant and interchange fee income | |
| 2,641 | |
| 2,461 | |
| 2,279 |
Bank owned life insurance income | |
| 1,890 | |
| 1,244 | |
| 1,768 |
Mortgage banking income | |
| 1,626 | |
| 1,150 | |
| 982 |
Net securities gains (losses) | |
| 142 | |
| (50) | |
| 32 |
Other income | |
| 4,548 | |
| 2,573 | |
| 2,629 |
Total noninterest income | |
| 44,997 | |
| 40,302 | |
| 36,040 |
| | | | | | | | | |
NONINTEREST EXPENSE | |
|
| |
|
| |
|
|
Salaries and employee benefits | |
| 49,434 | |
| 48,353 | |
| 45,306 |
Net occupancy expense | |
| 5,295 | |
| 5,149 | |
| 4,595 |
Equipment costs | |
| 5,521 | |
| 5,243 | |
| 4,629 |
Data processing fees and supplies | |
| 10,407 | |
| 9,685 | |
| 8,233 |
Corporate and business development | |
| 4,371 | |
| 5,066 | |
| 4,744 |
FDIC insurance and other regulatory fees | |
| 638 | |
| 1,701 | |
| 1,798 |
Professional fees | |
| 4,644 | |
| 3,798 | |
| 3,574 |
Other expense | |
| 9,114 | |
| 7,234 | |
| 6,419 |
Total noninterest expense | |
| 89,424 | |
| 86,229 | |
| 79,298 |
| | | | | | | | | |
INCOME BEFORE INCOME TAX EXPENSE | |
| 107,385 | |
| 98,944 | |
| 89,634 |
Income tax expense | |
| 20,338 | |
| 18,533 | |
| 32,304 |
NET INCOME | | $ | 87,047 | | $ | 80,411 | | $ | 57,330 |
| | | | | | | | | |
BASIC WEIGHTED AVERAGE COMMON SHARES | |
| 25,588,404 | |
| 25,288,533 | |
| 25,181,208 |
| | | | | | | | | |
BASIC EARNINGS PER COMMON SHARE | | $ | 3.40 | | $ | 3.18 | | $ | 2.28 |
| | | | | | | | | |
DILUTED WEIGHTED AVERAGE COMMON SHARES | |
| 25,758,893 | |
| 25,727,831 | |
| 25,663,381 |
| | | | | | | | | |
DILUTED EARNINGS PER COMMON SHARE | | $ | 3.38 | | $ | 3.13 | | $ | 2.23 |
The accompanying notes are an integral part of these consolidated financial statements.
55
| CONSOLIDATED STATEMENTS OF COMPREHENSIVE INCOME (in thousands) | |||||||
| Years Ended December 31 | 2018 | 2017 | 2016 | ||||
| Net income | $80,411 | $57,330 | $52,084 | ||||
| Other comprehensive income (loss) | |||||||
| Change in securities available for sale: | |||||||
| Unrealized holding gain (loss) on securities available for sale | |||||||
| arising during the period | (7,339) | 2,245 | (7,238) | ||||
| Reclassification adjustment for (gains)/losses included in net income | 50 | (32) | (66) | ||||
| Net securities gain (loss) activity during the period | (7,289) | 2,213 | (7,304) | ||||
| Tax effect | 1,637 | (707) | 2,746 | ||||
| Net of tax amount | (5,652) | 1,506 | (4,558) | ||||
| Defined benefit pension plans: | |||||||
| Net gain(loss) on defined benefit pension plans | 269 | 97 | (151) | ||||
| Amortization of net actuarial loss | 266 | 265 | 215 | ||||
| Net gain on activity during the period | 535 | 362 | 64 | ||||
| Tax effect | (163) | (151) | (35) | ||||
| Net of tax amount | 372 | 211 | 29 | ||||
| Total other comprehensive income (loss), net of tax . . . . . . . . . . . . . . . . . . . . . . . . . . . . . . . . . . . . . . . . . . . | (5,280) | 1,717 | (4,529) | ||||
| Comprehensive income . . . . . . . . . . . . . . . . . . . . . . . . . . . . . . . . . . . . . . . . . . . . . . . . . . . . . . . . . . . . . . . . . . . . . . . . . . . | $75,131 | $59,047 | $47,555 | ||||
CONSOLIDATED STATEMENTS OF COMPREHENSIVE INCOME (in thousands)
| | | | | | | | | |
Years Ended December 31 |
| 2019 |
| 2018 |
| 2017 | |||
Net income | | $ | 87,047 | | $ | 80,411 | | $ | 57,330 |
Other comprehensive income (loss) | | | | | | | | | |
Change in securities available-for-sale: | | | | | | | | | |
Unrealized holding gain (loss) on securities available-for-sale arising during the period | |
| 23,438 | |
| (7,339) | |
| 2,245 |
Reclassification adjustment for (gains) losses included in net income | |
| (142) | |
| 50 | |
| (32) |
Net securities gain (loss) activity during the period | |
| 23,296 | |
| (7,289) | |
| 2,213 |
Tax effect | |
| (4,893) | |
| 1,637 | |
| (707) |
Net of tax amount | |
| 18,403 | |
| (5,652) | |
| 1,506 |
Defined benefit pension plans: | | | | | | | | | |
Net gain (loss) on defined benefit pension plans | |
| (409) | |
| 269 | |
| 97 |
Amortization of net actuarial loss | |
| 205 | |
| 266 | |
| 265 |
Net gain (loss) on activity during the period | |
| (204) | |
| 535 | |
| 362 |
Tax effect | |
| 51 | |
| (163) | |
| (151) |
Net of tax amount | |
| (153) | |
| 372 | |
| 211 |
Total other comprehensive income (loss), net of tax | |
| 18,250 | |
| (5,280) | |
| 1,717 |
Comprehensive income | | $ | 105,297 | | $ | 75,131 | | $ | 59,047 |
The accompanying notes are an integral part of these consolidated financial statements.
56
| CONSOLIDATED STATEMENTS OF CHANGES IN STOCKHOLDERS' EQUITY (in thousands except share and per share data) | |||||||||||
| Accumulated | |||||||||||
| Other | Total | ||||||||||
| Common Stock | Retained | Comprehensive | Treasury | Stockholders' | |||||||
| Shares | Amount | Earnings | Income (Loss) | Stock | Equity | ||||||
| Balance at January 1, 2016 | 24,819,066 | $99,123 | $294,002 | $2,142 | $(2,455) | $392,812 | |||||
| Net income | 52,084 | 52,084 | |||||||||
| Other comprehensive income (loss), net of tax | (4,529) | (4,529) | |||||||||
| Comprehensive income (loss) | 47,555 | ||||||||||
| Cash dividends declared, $0.73 per share | (18,213) | (18,213) | |||||||||
| Treasury shares purchased under deferred | |||||||||||
| directors' plan | (14,811) | 458 | (458) | 0 | |||||||
| Stock activity under equity incentive plans | 133,646 | 614 | 614 | ||||||||
| Stock based compensation expense | 4,210 | 4,210 | |||||||||
| Fractional shares retired due to 3-for-2 stock split | (36) | ||||||||||
| Balance at December 31, 2016 | 24,937,865 | $104,405 | $327,873 | $(2,387) | $(2,913) | $426,978 | |||||
| Net income | 57,330 | 57,330 | |||||||||
| Other comprehensive income (loss), net of tax | 1,717 | 1,717 | |||||||||
| Comprehensive income (loss) | 59,047 | ||||||||||
| Cash dividends declared, $0.85 per share | (21,409) | (21,409) | |||||||||
| Treasury shares purchased under deferred | |||||||||||
| directors' plan | (10,748) | 495 | (495) | 0 | |||||||
| Stock activity under equity incentive plans | 98,816 | (1,736) | (1,736) | ||||||||
| Stock based compensation expense | 5,698 | 5,698 | |||||||||
| Balance at December 31, 2017 | 25,025,933 | $108,862 | $363,794 | $(670) | $(3,408) | $468,578 | |||||
| Adoption of ASU 2018-02 (See Note 1) | 173 | (173) | 0 | ||||||||
| Adoption of ASU 2014-09 (See Note 1) | 24 | 24 | |||||||||
| Adoption of ASU 2016-01 (See Note 1) | 68 | (68) | 0 | ||||||||
| Net income | 80,411 | 80,411 | |||||||||
| Other comprehensive income (loss), net of tax | (5,280) | (5,280) | |||||||||
| Comprehensive income (loss) | 75,131 | ||||||||||
| Cash dividends declared, $1.00 per share | (25,291) | (25,291) | |||||||||
| Treasury shares purchased under deferred | |||||||||||
| directors' plan | (9,625) | 463 | (463) | 0 | |||||||
| Treasury shares sold and distributed under deferred | |||||||||||
| directors' plan | 5,636 | (115) | 115 | 0 | |||||||
| Stock activity under equity incentive plans | 106,829 | (2,435) | (2,435) | ||||||||
| Stock based compensation expense | 5,608 | 5,608 | |||||||||
| Balance at December 31, 2018 | 25,128,773 | $112,383 | $419,179 | $(6,191) | $(3,756) | $521,615 | |||||
CONSOLIDATED STATEMENTS OF CHANGES IN STOCKHOLDERS’ EQUITY (in thousands, except share and per share data)
| | | | | | | | | | | | | | | | | | | | | | | |
| | | | | | | | | | Accumulated | | | | | | | | | | | |
| |
| | | | | | | | | | Other | | | | | Total | | | | | |
| ||
| | Common Stock | | Retained | | Comprehensive | | Treasury | | Stockholders’ | | Noncontrolling | | Total | |||||||||
|
| Shares |
| Amount |
| Earnings |
| Income (Loss) |
| Stock |
| Equity |
| Interest |
| Equity | |||||||
| | | | | | | | | | | | | | | | | | | | | | | |
Balance at January 1, 2017 |
| 24,937,865 | | $ | 104,405 | | $ | 327,873 | | $ | (2,387) | | $ | (2,913) | | $ | 426,978 | | $ | 89 | | $ | 427,067 |
Net income | | | | | | |
| 57,330 | |
| | |
|
| |
| 57,330 | | | | | | 57,330 |
Other comprehensive income, net of tax |
| | | | | |
|
| |
| 1,717 | |
|
| |
| 1,717 | | | | | | 1,717 |
Cash dividends declared, $0.85 per share |
| | | | | |
| (21,409) | |
|
| |
|
| |
| (21,409) | | | | | | (21,409) |
Treasury shares purchased under deferred |
| | | | | | | | | | | | | | | | | | | | | | 0 |
directors’ plan | | (10,748) | |
| 495 | | | | | | | |
| (495) | |
| 0 | | | | | | 0 |
Stock activity under equity incentive plans |
| 98,816 | |
| (1,736) | | | | |
|
| |
|
| |
| (1,736) | | | | | | (1,736) |
Stock based compensation expense | | | |
| 5,698 | |
|
| |
|
| |
|
| |
| 5,698 | | | | | | 5,698 |
Balance at December 31, 2017 |
| 25,025,933 | | $ | 108,862 | | $ | 363,794 | | $ | (670) | | $ | (3,408) | | $ | 468,578 | | $ | 89 | | $ | 468,667 |
Adoption of ASU 2018-02 | | | | | | |
| 173 | |
| (173) | |
|
| |
| 0 | | | | | | 0 |
Adoption of ASU 2014-09 | | | | | | |
| 24 | |
|
| |
|
| |
| 24 | | | | | | 24 |
Adoption of ASU 2016-01 | | | | | | |
| 68 | |
| (68) | |
|
| |
| 0 | | | | | | 0 |
Net income | | | | | | |
| 80,411 | |
|
| |
|
| |
| 80,411 | | | | | | 80,411 |
Other comprehensive loss, net of tax | | | | | | |
|
| |
| (5,280) | |
|
| |
| (5,280) | | | | | | (5,280) |
Cash dividends declared, $1.00 per share | | | | | | |
| (25,291) | |
|
| |
|
| |
| (25,291) | | | | | | (25,291) |
Treasury shares purchased under deferred |
| | | | | | | | | | | | | | | | | | | | | | |
directors’ plan | | (9,625) | |
| 463 | | | | | | | |
| (463) | |
| 0 | | | | | | 0 |
Treasury shares sold and distributed under deferred |
|
| |
|
| | | | | | | |
|
| |
|
| | | | | | |
directors’ plan |
| 5,636 | |
| (115) | | | | | | | |
| 115 | |
| 0 | | | | | | 0 |
Stock activity under equity incentive plans |
| 106,829 | |
| (2,435) | | | | |
|
| |
|
| |
| (2,435) | | | | | | (2,435) |
Stock based compensation expense | | | |
| 5,608 | |
|
| |
|
| |
|
| |
| 5,608 | | | | | | 5,608 |
Balance at December 31, 2018 | | 25,128,773 | | $ | 112,383 | | $ | 419,179 | | $ | (6,191) | | $ | (3,756) | | $ | 521,615 | | $ | 89 | | $ | 521,704 |
Adoption of ASU 2017-08 (See Note 1) | | | | | | |
| (1,327) | |
| | |
|
| |
| (1,327) | | | | | | (1,327) |
Net income | | | | | | |
| 87,047 | |
|
| |
|
| |
| 87,047 | | | | | | 87,047 |
Other comprehensive income, net of tax | | | | | | |
|
| |
| 18,250 | |
|
| |
| 18,250 | | | | | | 18,250 |
Cash dividends declared, $1.16 per share | | | | | | |
| (29,652) | |
|
| |
|
| |
| (29,652) | | | | | | (29,652) |
Cashless exercise of warrants | | 224,066 | | | 0 | | | | | | | | | | | | 0 | | | | | | 0 |
Treasury shares purchased under deferred |
| | | | | | | | | | | | | | | | | | | | | | |
directors’ plan | | (11,481) | |
| 515 | | | | | | | |
| (515) | |
| 0 | | | | | | 0 |
Treasury shares sold and distributed under deferred |
|
| |
|
| | | | | | | |
|
| |
|
| | | | | | |
directors’ plan |
| 5,699 | |
| (118) | | | | | | | |
| 118 | |
| 0 | | | | | | 0 |
Stock activity under equity incentive plans |
| 97,218 | |
| (2,109) | | | | |
|
| |
|
| |
| (2,109) | | | | | | (2,109) |
Stock based compensation expense | | | |
| 4,187 | |
|
| |
|
| |
|
| |
| 4,187 | | | | | | 4,187 |
Balance at December 31, 2019 | | 25,444,275 | | $ | 114,858 | | $ | 475,247 | | $ | 12,059 | | $ | (4,153) | | $ | 598,011 | | $ | 89 | | $ | 598,100 |
The accompanying notes are an integral part of these consolidated financial statements.
57
| CONSOLIDATED STATEMENTS OF CASH FLOWS (in thousands) | |||||
| Years Ended December 31 | 2018 | 2017 | 2016 | ||
| Cash flows from operating activities: | |||||
| Net income | $80,411 | $57,330 | $52,084 | ||
| Adjustments to reconcile net income to net cash from operating activities: | |||||
| Depreciation | 5,654 | 5,119 | 4,229 | ||
| Provision for loan losses | 6,400 | 3,000 | 1,150 | ||
| Net loss on sale and write down of other real estate owned | 16 | 12 | 17 | ||
| Amortization of loan servicing rights | 503 | 599 | 598 | ||
| Loans originated for sale | (49,816) | (54,188) | (69,998) | ||
| Net gain on sales of loans | (1,713) | (1,749) | (2,047) | ||
| Proceeds from sale of loans | 51,715 | 57,621 | 68,692 | ||
| Net loss on sale of premises and equipment | 1 | 79 | 160 | ||
| Net (gain) loss on sales and calls of securities available for sale | 50 | (32) | (66) | ||
| Net securities amortization | 3,177 | 3,114 | 2,860 | ||
| Stock based compensation expense | 5,608 | 5,698 | 4,210 | ||
| Earnings on life insurance | (1,244) | (1,768) | (1,392) | ||
| Gain on life insurance | (206) | 0 | 0 | ||
| Tax benefit of stock award issuances | (761) | (964) | (669) | ||
| Net change: | |||||
| Interest receivable and other assets | (3,301) | 787 | (1,386) | ||
| Interest payable and other liabilities | 8,481 | 2,584 | 3,757 | ||
| Total adjustments | 24,564 | 19,912 | 10,115 | ||
| Net cash from operating activities . . . . . . . . . . . . . . . . . . . . . . . . . . . . . . . . . . . . . . . . . . . . . . . . . . . . . . . . . . . . . . . . . . . . . . . . . . . . . . . | 104,975 | 77,242 | 62,199 | ||
| Cash flows from investing activities: | |||||
| Proceeds from sale of securities available for sale | 15,302 | 40,877 | 12,095 | ||
| Proceeds from maturities, calls and principal paydowns of | |||||
| securities available for sale | 53,817 | 61,745 | 69,343 | ||
| Purchases of securities available for sale | (126,551) | (139,252) | (116,196) | ||
| Purchase of life insurance | (423) | (580) | (3,390) | ||
| Net increase in total loans | (101,670) | (347,217) | (391,145) | ||
| Proceeds from sales of land, premises and equipment | 461 | 10 | 28 | ||
| Purchases of land, premises and equipment | (7,968) | (9,582) | (9,825) | ||
| Purchase of Federal Home Loan Bank Stock | 0 | (2,250) | (3,854) | ||
| Proceeds from sales of other real estate owned | 21 | 199 | 136 | ||
| Proceeds from life insurance | 569 | 0 | 360 | ||
| Net cash from investing activities . . . . . . . . . . . . . . . . . . . . . . . . . . . . . . . . . . . . . . . . . . . . . . . . . . . . . . . . . . . . . . . . . . . . . . . | (166,442) | (396,050) | (442,448) | ||
| Cash flows from financing activities: | |||||
| Net increase in total deposits | 35,410 | 430,743 | 394,491 | ||
| Net increase/(decrease) in short-term borrowings | 174,903 | 100,607 | (19,577) | ||
| Proceeds on long-term borrowings | 0 | 95,000 | 180,000 | ||
| Payments on long-term borrowings | (80,030) | (275,002) | (70,002) | ||
| Common dividends paid | (25,278) | (21,396) | (18,200) | ||
| Preferred dividends paid | (13) | (13) | (13) | ||
| Proceeds (Payments) related to equity incentive plans | (2,435) | (1,736) | 614 | ||
| Purchase of treasury stock | (463) | (495) | (458) | ||
| Sales of treasury stock | 115 | 0 | 0 | ||
| Net cash from financing activities . . . . . . . . . . . . . . . . . . . . . . . . . . . . . . . . . . . . . . . . . . . . . . . . . . . . . . . . . . . . . . . . . . . . . | 102,209 | 327,708 | 466,855 | ||
| Net change in cash and cash equivalents | 40,742 | 8,900 | 86,606 | ||
| Cash and cash equivalents at beginning of the year | 176,180 | 167,280 | 80,674 | ||
| Cash and cash equivalents at end of the year . . . . . . . . . . . . . . . . . . . . . . . . . . . . . . . . . . . . . . . . . . . . . . . . . . . . . . . . . . . . . | $216,922 | $176,180 | $167,280 | ||
| Cash paid during the year for: | |||||
| Interest | $43,606 | $29,171 | $18,567 | ||
| Income taxes | 19,033 | 29,120 | 21,613 | ||
| Supplemental non-cash disclosures: | |||||
| Loans transferred to other real estate owned | 316 | 88 | 105 | ||
| Security purchased not settled | 0 | 0 | 1,459 | ||
| Property transferred to held for sale | 221 | 0 | 0 |
CONSOLIDATED STATEMENTS OF CASH FLOWS (in thousands)
| | | | | | | | | |
Years Ended December 31 |
| 2019 |
| 2018 |
| 2017 | |||
Cash flows from operating activities: |
| |
|
| |
|
| |
|
Net income | | $ | 87,047 | | $ | 80,411 | | $ | 57,330 |
Adjustments to reconcile net income to net cash from operating activities: | |
|
| |
|
| |
|
|
Depreciation | |
| 5,930 | |
| 5,654 | |
| 5,119 |
Provision for loan losses | |
| 3,235 | |
| 6,400 | |
| 3,000 |
Net loss on sale and write down of other real estate owned | |
| 0 | |
| 16 | |
| 12 |
Amortization of loan servicing rights | |
| 528 | |
| 503 | |
| 599 |
Loans originated for sale | |
| (66,008) | |
| (49,816) | |
| (54,188) |
Net gain on sales of loans | |
| (2,043) | |
| (1,713) | |
| (1,749) |
Proceeds from sale of loans | |
| 64,820 | |
| 51,715 | |
| 57,621 |
Net (gain) loss on sale of premises and equipment | |
| (3) | |
| 1 | |
| 79 |
Net (gain) loss on sales and calls of securities available-for-sale | |
| (142) | |
| 50 | |
| (32) |
Net amortization of available-for-sale securities | |
| 3,947 | |
| 3,177 | |
| 3,114 |
Stock based compensation expense | |
| 4,187 | |
| 5,608 | |
| 5,698 |
Earnings on life insurance | |
| (1,890) | |
| (1,244) | |
| (1,768) |
Gain on life insurance | |
| (841) | |
| (206) | |
| 0 |
Tax benefit of stock award issuances | |
| (529) | |
| (761) | |
| (964) |
Net change: | |
|
| |
|
| |
|
|
Interest receivable and other assets | |
| (4,733) | |
| (3,301) | |
| 787 |
Interest payable and other liabilities | |
| 6,534 | |
| 8,481 | |
| 2,584 |
Total adjustments | |
| 12,992 | |
| 24,564 | |
| 19,912 |
Net cash from operating activities | |
| 100,039 | |
| 104,975 | |
| 77,242 |
Cash flows from investing activities: | |
|
| |
|
| |
|
|
Proceeds from sale of securities available-for-sale | |
| 57,114 | |
| 15,302 | |
| 40,877 |
Proceeds from maturities, calls and principal paydowns of | |
|
| |
|
| |
|
|
securities available-for-sale | |
| 67,818 | |
| 53,817 | |
| 61,745 |
Purchases of securities available-for-sale | |
| (129,453) | |
| (126,551) | |
| (139,252) |
Purchase of life insurance | |
| (5,552) | |
| (423) | |
| (580) |
Net increase in total loans | |
| (152,119) | |
| (101,670) | |
| (347,217) |
Proceeds from sales of land, premises and equipment | |
| 14 | |
| 461 | |
| 10 |
Purchases of land, premises and equipment | |
| (7,998) | |
| (7,968) | |
| (9,582) |
Purchase of Federal Home Loan Bank Stock | |
| 0 | |
| 0 | |
| (2,250) |
Proceeds from sales of other real estate owned | |
| 0 | |
| 21 | |
| 199 |
Proceeds from life insurance | |
| 1,483 | |
| 569 | |
| 0 |
Net cash from investing activities | |
| (168,693) | |
| (166,442) | |
| (396,050) |
Cash flows from financing activities: | |
|
| |
|
| |
|
|
Net increase in total deposits | |
| 89,754 | |
| 35,410 | |
| 430,743 |
Net increase (decrease) in short-term borrowings | |
| (75,555) | |
| 174,903 | |
| 20,607 |
Proceeds from short-term FHLB borrowings | | | 0 | | | 0 | | | 80,000 |
Payments on short-term FHLB borrowings | | | 0 | | | (80,000) | | | (180,000) |
Payments on long-term FHLB borrowings | |
| 0 | |
| (30) | |
| (2) |
Payments on subordinated debentures | |
| (30,928) | |
| 0 | |
| 0 |
Common dividends paid | |
| (29,639) | |
| (25,278) | |
| (21,396) |
Preferred dividends paid | |
| (13) | |
| (13) | |
| (13) |
Payments related to equity incentive plan | |
| (2,109) | |
| (2,435) | |
| (1,736) |
Purchase of treasury stock | |
| (515) | |
| (463) | |
| (495) |
Sales of treasury stock | |
| 118 | |
| 115 | |
| 0 |
Net cash from financing activities | |
| (48,887) | |
| 102,209 | |
| 327,708 |
Net change in cash and cash equivalents | |
| (117,541) | |
| 40,742 | |
| 8,900 |
Cash and cash equivalents at beginning of the year | |
| 216,922 | |
| 176,180 | |
| 167,280 |
Cash and cash equivalents at end of the year | | $ | 99,381 | | $ | 216,922 | | $ | 176,180 |
Cash paid during the year for: | |
|
| |
|
| |
|
|
Interest | | $ | 58,964 | | $ | 43,606 | | $ | 29,171 |
Income taxes | |
| 21,035 | |
| 19,033 | |
| 29,120 |
Supplemental non-cash disclosures: | |
|
| |
|
| |
|
|
Loans transferred to other real estate owned | |
| 0 | |
| 316 | |
| 88 |
Property transferred to held for sale | |
| 0 | |
| 221 | |
| 0 |
Right-of-use assets obtained in exchange for lease liabilities | |
| 5,483 | |
| 0 | |
| 0 |
The accompanying notes are an integral part of these consolidated financial statements.
58
NOTE 1 – SUMMARY OF SIGNIFICANT ACCOUNTING POLICIES
Nature of Operations and Principles of Consolidation:
The consolidated financial statements include Lakeland Financial Corporation (the “Holding Company”) and its wholly-owned subsidiaries, Lake City Bank (the “Bank”) and LCB Risk Management, Inc., together referred to as (the “Company”). On December 18, 2006, LCB Investments II, Inc. was formed as a wholly owned subsidiary of the Bank incorporated in Nevada to manage a portion of the Bank’s investment portfolio beginning in 2007. On December 21, 2006, LCB Funding, Inc., a real estate investment trust incorporated in Maryland, was formed as a wholly owned subsidiary of LCB Investments II, Inc. On December 28, 2012, LCB Risk Management, Inc., a captive insurance company incorporated in Nevada, was formed as a wholly owned subsidiary of the Holding Company. All intercompany transactions and balances are eliminated in consolidation.
The Company provides financial services through the Bank, a full-service commercial bank with 4950 branch offices in fifteen counties in Northern and Central Indiana with its 50th branch that opened in downtown Indianapolis in January 2019.Indiana. The Company provides commercial, retail, trust and investment services to its customers. Commercial products include commercial loans and technology-driven solutions to meet commercial customers’ treasury management needs such as internet business banking and on-line treasury management services. Retail banking clients are provided a wide array of traditional retail banking services, including lending, deposit and investment services. Retail lending programs are focused on mortgage loans, home equity lines of credit and traditional retail installment loans. The Company provides credit card services to retail and commercial customers through its retail card program and merchant processing activity. The Company provides wealth advisory and trust clients with traditional personal and corporate trust services. The Company also provides retail brokerage services, including an array of financial and investment products such as annuities and life insurance. Other financial instruments, which represent potential concentrations of credit risk, include deposit accounts in other financial institutions.
Use of Estimates:
To prepare financial statements in conformity with U.S. generally accepted accounting principles (“GAAP”), management makes estimates and assumptions based on available information. These estimates and assumptions affect the amounts reported in the financial statements and the disclosures provided and future results could differ.
Cash Flows:
Cash and cash equivalents include cash, demand deposits in other financial institutions and short-term investments and certificates of deposit with maturities of 90 days or less. Cash flows are reported net for customer loan and deposit transactions, and short-term borrowings.
Securities:
Securities are classified as available for saleavailable-for-sale when they might be sold before maturity. Securities available for saleavailable-for-sale are carried at fair value, with unrealized holding gains and losses reported in other comprehensive income (loss), net of tax. Trading securities are bought for sale in the near term and are carried at fair value, with changes in unrealized holding gains and losses included in income. Securities are classified as held to maturityheld-to-maturity and carried at amortized cost when management has the positive intent and ability to hold them to maturity.
Purchase premiums or discounts are recognized in interest income using the interest method over the terms of the securities or overestimated lives for mortgage-backed securities. Gains and losses on sales are based on the amortized cost of the security sold and recorded on the trade date. For securities in an unrealized loss position, management considers the extent and duration of the unrealized loss, and the financial condition and near-term prospects of the issuer. Management also assesses whether it intends to sell, or it is more likely than not that it will be required to sell, a security in an unrealized loss position before recovery of its amortized cost basis. If either of the criteria regarding intent or requirement to sell is met, the entire difference between amortized cost and fair value is recognized as impairment through earnings. For debt securities that do not meet the aforementioned criteria, the amount of impairment is split into two components as follows: 1) other-than-temporary impairment (OTTI) related to credit loss, which must be recognized in the income statement and 2) OTTI related to other factors, which is recognized in other comprehensive income. The credit loss is defined as the difference between the present value of the cash flows expected to be collected and the amortized cost basis. For equityEquity securities which are included in other assets, the entire amountare carried at fair value with changes in fair value recorded through earnings.
59
NOTE 1
– SUMMARY OF SIGNIFICANT ACCOUNTING POLICIES (continued)Real Estate Mortgage Loans Held for Sale:
Loans held for sale are reported at the lower of cost or fair value on an aggregate basis. Net unrealized losses, if any, are recorded as a valuation allowance and charged to earnings.
Loan sales occur on the delivery date agreed to in the relevant commitment agreement. The Company retains servicing on the majority of loans sold. The carrying value of loans sold is reduced by the amount allocated to the servicing right. The gain or loss on the sale of loans is the difference between the carrying value of the loans sold and the funds received from the sale.
Loans:
Loans that management has the intent and ability to hold for the foreseeable future or until maturity or payoff are reported at the principal balance outstanding, net of unearned interest, deferred loan fees and costs, and an allowance for loan losses.
Interest income is reported on the interest method and includes amortization of net deferred loan fees and costs over the loan term. All classes of commercial and industrial, commercial real estate and multi-family residential, agri-business and agricultural, other commercial and consumer 1-4 family mortgage loans for which collateral is insufficient to cover all principal and accrued interest are reclassified as nonaccrual loans, on or before the date when the loan becomes 90 days delinquent. When a loan is classified as a nonaccrual loan, interest on the loan is no longer accrued, all unpaid accrued interest is reversed and interest income is subsequently recorded on the cash-basis or cost-recovery method. Accrual status is resumed when all contractually due payments are brought current and future payments are reasonably assured. Other consumer loans are not placed on a nonaccrual status since these loans are charged-off when they have been delinquent from 90 to 180 days, and when the related collateral, if any, is not sufficient to offset the indebtedness. Nonaccrual loans and loans past due 90 days still on accrual include both smaller balance homogeneous loans that are collectively evaluated for impairment and individually classified impaired loans.
The recorded investment in loans is the loan balance net of unamortized net deferred loan fees and costs less unamortized net deferred loan fees.costs. The total amount of accrued interest on loans as of December 31, 2019 and 2018 and 2017 was $11.8$11.5 million and $11.0$11.8 million.
Allowance for Loan Losses:
The allowance for loan losses is a valuation allowance for probable incurred credit losses. Loan losses are charged against the allowance when management believes the inability to fully collect a loan balance is confirmed. Subsequent recoveries, if any, are credited to the allowance. The Company has an established process to determine the adequacy of the allowance for loan losses that generally includes consideration of the following factors: changes in the nature and volume of the loan portfolio, overall portfolio quality and current economic conditions that may affect the borrowers’ ability to repay. Consideration is not limited to these factors, although they represent the most commonly cited factors. This evaluation is inherently subjective, as it requires estimates that are susceptible to significant revision as more information becomes available or as future events change. Allocations of the allowance may be made for specific loans, but the entire allowance is available for any loan that, in management’s judgment, should be charged-off.
The allowance consists of specific and general components. The specific component relates to loans that are individually classified as impaired. The general component covers non-impaired loans and is based on historical loss experience, subject to a floor, adjusted for current factors. A detailed analysis is performed on loans that are classified but determined not to be impaired which incorporates different scenarios where the risk that the borrower will be unable or unwilling to repay its debt in full or on time is combined with an estimate of loss in the event the borrower cannot pay to develop non-specific allocations for such loan pools. The historical loss experience is determined by portfolio segment and is based on the actual loss history experienced by the Company over the most recent three years.years, subject to a floor. This actual loss experience is supplemented with other environmental factors based on the risks present for each portfolio segment. These factors include consideration of the following: levels of, and trends in, delinquencies and impaired loans; levels of, and trends in, charge-offs and recoveries over the historical three and five year periods; trends in volume and terms of loans; effects of any changes in risk selection and underwriting standards; other changes in lending policies, procedure, and practices; experience, ability, and depth of lending management and other relevant staff; national and local economic trends and conditions; industry conditions; and effects of changes in credit concentrations. The following portfolio segments have been identified: commercial and industrial, commercial real estate and multi-family residential, agri-business and agricultural, other commercial, consumer 1-4 family mortgage and other consumer. The risk characteristics of each of the identified portfolio segments are as follows:
60
NOTE 1
– SUMMARY OF SIGNIFICANT ACCOUNTING POLICIES (continued)Commercial and Industrial
– Borrowers may be subject to industry conditions including decreases in product demand; increases in material or other production costs that cannot be immediately recaptured in the sales or distribution cycle; interest rate increases that could have an adverse impact on profitability; non-payment of credit that has been extended under normal vendor terms for goods sold or services; and interruption related to the importing or exporting of production materials or sold products.Commercial Real Estate and Multi-Family Residential
– Borrowers may be subject to potential adverse market conditions that cause a decrease in market value or lease rates; the potential for environmental impairment from events occurring on subject or neighboring properties; and obsolescence in location or function. Multi-Family Residential is also subject to adverse market conditions associated with a change in governmental or personal funding sources for tenants; over supply of units in a specific region; a shift in population; and reputational risks. Construction and Land Development risks include slower absorption than anticipated on speculative projects; deterioration in market conditions that may impact a project’s value; unforeseen costs not considered in the original construction budget; or any other factors that may impact the completion or success of the project.Agri-business and Agricultural
– Borrowers may be subject to adverse market or weather conditions including changes in local or foreign demand; lower yields than anticipated; political or other impact on storage, distribution or use; foreign trade policies, including tariffs; and exposure to increasing commodity prices which result in higher production, distribution or exporting costs.Other Commercial
– Borrowers may be subject to the uninterrupted flow of funds to states and other political subdivisions for the purpose of debt repayments on loans held by the Bank.Consumer 1-4 Family Mortgage
– Borrowers may be subject to adverse employment conditions in the local economy leading to increased default rates; decreased market values from oversupply in a geographic area; and impact to borrowers’ ability to maintain payments in the event of incremental rate increases on adjustable rate mortgages.Other Consumer
– Borrowers may be subject to adverse employment conditions in the local economy which may lead to higher default rates; and decreases in the value of underlying collateral.A loan is impaired when, based on current information and events, it is probable that the Company will be unable to collect all amounts due according to the contractual terms of the loan agreement. Loans, for which the terms have been modified and a concession has been granted for borrowers experiencing financial difficulties, are considered troubled debt restructurings and classified as impaired and may be either accruing or non-accruing. Nonaccrual troubled debt restructurings follow the same policy as described above for other loans. Impairment for troubled debt restructurings is measured at the present value of estimated future cash flows using the loan’s effective rate at inception or at discounted collateral value for collateral dependent loans. Impairment is evaluated individually or in total for smaller-balance loans of similar nature such as all classes of consumer 1-4 family and other consumer loans, and individually for all classes of commercial and industrial, commercial real estate and multi-family, agri-business and agricultural and other commercial loans. The Company analyzes commercial loans individually by classifying the loans as to credit risk. This analysis is performed on a quarterly basis for Special Mention, Substandard and Doubtful grade loans and annually on Pass grade loans over $250,000. Factors considered by management in determining impairment include payment status, collateral value and the probability of collecting scheduled principal and interest payments when due. Loans that experience insignificant payment delays and payment shortfalls generally are not classified as impaired. Management determines the significance of payment delays and payment shortfalls on a case-by-case basis, taking into consideration all of the circumstances surrounding the loan and the borrower, including the length of the delay, the reasons for the delay, the borrower’s prior payment record, and the amount of the shortfall in relation to the principal and interest owed. If a loan is impaired, a portion of the allowance may be allocated so that the loan is reported, net, at the present value of estimated future cash flows using the loan’s existing rate or at the fair value of collateral less anticipated costs to sell if repayment is expected solely from the collateral. All classes of commercial and industrial, commercial real estate and multifamily residential, agri-business and agricultural, other commercial and consumer 1-4 family mortgage loans that become delinquent beyond 90 days are analyzed and a charge-off is taken when it is determined that the underlying collateral, if any, is not sufficient to offset the indebtedness.
61
NOTE 1 – SUMMARY OF SIGNIFICANT ACCOUNTING POLICIES (continued)
Troubled debt restructured loans are considered for removal from troubled debt restructuring status in the year following modification or at time of subsequent restructuring for loans with cumulative principal forgiveness if the interest rate is considered a market rate at the time of modification and it has been performing according to the terms of the modification for a reasonable period of time long enough to observe an ability to repay under the modified terms. If removed from troubled debt restructuring status, the loan continues to be evaluated for impairment with either the present value of estimated future cash flows using the loan’s effective rate at inception or at discounted collateral value for collateral dependent loans. In addition, troubled debt restructured loans with subsequent modifications that do not have cumulative principal forgiveness are considered for removal from troubled debt restructuring status at the time of the subsequent modification if the following circumstances exist: (1) at the time of the subsequent restructuring, the borrower is not experiencing financial difficulties; (2) under the terms of the subsequent restructuring agreement no concession has been granted to the borrower; and (3) the subsequent restructuring agreement includes market terms that are no less
Investments in Limited Partnerships:
The Company enters into and invests in limited partnerships in order to invest in affordable housing projects for the primary purpose of obtaining available tax benefits. The Company is a limited partner in these investments and, as such, the Company is not involved in the management or operation of such investments. These investments are accounted for using the equity method of accounting. Under the equity method of accounting, the Company records its share of the partnership’s earnings or losses in its income statement and adjusts the carrying amount of the investments on the consolidated balance sheet. These investments are evaluated for impairment when events indicate the carrying amount may not be recoverable. The investments recorded at December 31, 2019 and 2018 and 2017 were $7.0$6.7 million and $5.3$7.0 million, respectively and are included with other assets in the consolidated balance sheet. The Company also has a commitment to fund an additional $2.1$1.6 million at December 31, 20182019 in two of the limited partnerships compared to $1.0$2.1 million at December 31, 2017,2018, which is included with other liabilities in the consolidated balance sheet.
Foreclosed Assets:
Assets acquired through loan foreclosure are initially recorded at fair value less costs to sell when acquired, establishing a new cost basis. These assets are subsequently accounted for at lower of cost or fair value less estimated costs to sell. If fair value declines, a valuation allowance is recorded through expense. Costs incurred after acquisition are expensed. At December 31, 20182019 and 2017,2018, the balance of other real estate owned was $316,000 and $40,000 and areis included with other assets on the consolidated balance sheet.
Land, Premises and Equipment:
Land is carried at cost. Premises and equipment are stated at cost less accumulated depreciation. Depreciation is computed on the straight-line method over the useful lives of the assets. Premises and improvements assets have useful lives between 5 and 40 years. Equipment and furniture assets have useful lives between 3 and 7 years.
Loan Servicing Rights:
Servicing rights are recognized separately when they are acquired through sales of loans. When mortgage loans are sold, servicing rights are initially recorded at fair value with the income statement effect recorded in mortgage banking income. Fair value is based on a valuation model that calculates the present value of estimated future net servicing income. All classes of servicing assets are subsequently measured using the amortization method which requires servicing rights to be amortized into noninterest income in proportion to, and over the period of, the estimated future net servicing income of the underlying loans. The amortization of servicing rights is netted against mortgage banking income. Servicing fees totaled $1.1 million, $1.1 million and $1.0 million for the years ended December 31, 2019, 2018 and 2017, respectively. Late fees and ancillary fees related to loan servicing are not material.
62
NOTE 1 – SUMMARY OF SIGNIFICANT ACCOUNTING POLICIES (continued)
Servicing rights are evaluated for impairment based upon the fair value of the rights as compared to carrying amount. Impairment is determined by stratifying rights into groupings based on predominant risk characteristics, such as loan type, term and interest rate. Any impairment of a grouping is reported as a valuation allowance, to the extent that fair value is less than the carrying amount. If the Company later determines that all or a portion of the impairment no longer exists for a particular grouping, a reduction of the allowance may be recorded as an increase to income. Changes in the valuation allowance are reported with mortgage banking income on the income statement. The fair values of servicing rights are subject to significant fluctuations as a result of changes in estimated and actual prepayment speeds and default rates and losses.
The carrying value of mortgage servicing rights, which is included with other assets in the consolidated balance sheet, was $3.3$3.8 million and $3.0$3.3 million as of December 31, 20182019 and 2017.
Mortgage loans serviced for others are not included in the accompanying consolidated balance sheets. The unpaid principal balances of these loans were $343.5$337.9 million and $344.4$343.5 million at December 31, 20182019 and 2017.2018. Custodial escrow balances maintained in connection with serviced loans were $1.6 million and $1.5$1.6 million at year end 20182019 and 2017.
Servicing fee income/income (loss), which is included in loan and service fees on the income statement, is recorded for fees earned for servicing loans. Fees earned for servicing loans are based on a contractual percentage of the outstanding principal amount of the loan and are recorded as income when earned. The amortization of servicing rights is netted against mortgage banking income. Servicing fees totaled $1.1 million, $1.0 million and $987,000 for the years ended December 31, 2018, 2017 and 2016, respectively. Late fees and ancillary fees related to loan servicing are not material.
Transfers of Financial Assets:
Transfers of financial assets are accounted for as sales, when control over the assets has been relinquished. Control over transferred assets is deemed to be surrendered when the assets have been isolated from the Company, the transferee obtains the right (free of conditions that constrain it from taking advantage of that right) to pledge or exchange the transferred assets and the Company does not maintain effective control over the transferred assets through an agreement to repurchase them before their maturity.
Mortgage Banking Derivatives:
Commitments to fund mortgage loans (interest rate locks) to be sold into the secondary market and forward commitments for the future delivery of these mortgage loans are accounted for as free standing derivatives. Fair values of these mortgage derivatives are estimated based on changes in mortgage interest rates from the date the interest on the loan is locked. The Company enters into forward commitments for the future delivery of mortgage loans when interest rate locks are entered into, in order to hedge the change in interest rates resulting from its commitments to fund the loans. Changes in fair values of these derivatives are included in mortgage banking income.
Interest Rate Swap Derivatives:
The Company offers a derivative product to certain creditworthy commercial banking customers. This product allows the commercial banking customers to enter into an agreement with the Company to swap a variable rate loan to a fixed rate. These derivative products are designed to reduce, eliminate or modify the borrower'sborrower’s interest rate exposure. The extension of credit incurred in connection with these derivative products is subject to the same approval and underwriting standards as traditional credit products. The Company limits its risk exposure by simultaneously entering into a similar, offsetting swap agreement with a separate, well-capitalized and highly rated counterparty previously approved by the Company’s Asset Liability Committee. By using these interest rate swap arrangements, the Company is also better insulated from the interest rate risk associated with underwriting fixed-rate loans and is better able to meet customer demand for fixed rate loans. These derivative contracts are not designated against specific assets or liabilities and, therefore, do not qualify for hedge accounting. The derivatives are recorded as assets and liabilities on the balance sheet at fair value with changes in fair value recorded in non-interest income for both the commercial banking customer swaps and the related offsetting swaps. The fair value of the derivative instruments incorporates a consideration of credit risk (in accordance with ASC 820), resulting in some potential volatility in earnings each period.
63
NOTE 1 – SUMMARY OF SIGNIFICANT ACCOUNTING POLICIES (continued)
The notional amount of the combined interest rate swaps with customers and counterparties at December 31, 2019 and 2018 was $349.6 million and 2017 was $258.0 million, and $229.6 million.respectively. The fair value of the interest rate swap asset was $3.9$7.3 million and $2.4$3.9 million and the fair value of the interest rate swap liability was $4.0$7.9 million and $2.6$4.0 million respectively at December 31, 2019 and 2018, and 2017.
Bank Owned Life Insurance:
At December 31, 20182019 and 2017,2018, the Company owned $79.8 million and $73.9 million, and $73.0 millionrespectively, of life insurance policies on certain officers to provide a life insurance benefit for these officers. At December 31, 20182019 and 2017,2018, the Company also owned $3.2$4.0 million and $2.9$3.2 million, respectively, of variable life insurance on certain officers related to a deferred compensation plan. Bank owned life insurance is recorded at the amount that can be realized under the insurance contract at the balance sheet date, i.e., the cash surrender value adjusted for other changes or other amounts due that are probable at settlement.
Goodwill and Other Intangible Assets:
All goodwill on the Company’s consolidated balance sheet resulted from business combinations prior to January 1, 2009 and represents the excess of the purchase price over the fair value of acquired tangible assets and liabilities and identifiable intangible assets. Goodwill is not amortized, but assessed at least annually for impairment and any such impairment will be recognized in the period identified.
FHLB and Federal Reserve Bank Stock:
FHLB and Federal Reserve Bank stock are carried at cost in other assets, classified as a restricted security and are periodically evaluated for impairment based on ultimate recoverability of par value. Both cash and stock dividends are reported as income.
Repurchase Agreements:
Substantially all repurchase agreement liabilities represent amounts advanced by various customers. Securities are pledged to cover these liabilities, which are not covered by federal deposit insurance.
Long-term Assets:
Premises and equipment, and other long-term assets are reviewed for impairment when events indicate their carrying amount may not be recoverable from future undiscounted cash flows. If impaired, the assets are recorded at fair value.
Benefit Plans:
The Company has a noncontributory defined benefit pension plan, which covered substantially all employees until the plan was frozen effective April 1, 2000. Funding of the plan equals or exceeds the minimum funding requirement determined by the actuary. Pension expense is the net of interest cost, return on plan assets and amortization of gains and losses not immediately recognized. Benefits are based on years of service and compensation levels.
The Company maintains a 401(k) profit sharing plan for all employees meeting certain age and service requirements. The Company contributions are based upon the percentage of budgeted net income earned during the year.
An employee deferred compensation plan is available to certain employees with returns based on investments in mutual funds.
The Company maintains a directors’ deferred compensation plan. Effective January 1, 2003, the directors’ deferred compensation plan was amended to restrict the deferral to be in stock only and deferred directors’ fees are included in equity. The Company acquires shares on the open market and records such shares as treasury stock.
64
NOTE 1 – SUMMARY OF SIGNIFICANT ACCOUNTING POLICIES (continued)
Stock Based Compensation:
Compensation cost is recognized for stock options and restricted stock awards issued to employees, based on the fair value of these awards at the date of grant. A Black-Scholes model is utilized to estimate the fair value of stock options, while the market price of the Company’s common stock at the date of grant adjusted for the present value of expected dividends is used for restricted stock awards. Compensation cost is recognized over the required service period, generally defined as the vesting period. Certain of the restricted stock awards are performance based, as more fully discussed in Note 15.
Income Taxes:
Annual consolidated federal and state income tax returns are filed by the Company. Deferred income tax assets and liabilities are determined using the liability (or balance sheet) method. Income tax expense is recorded based on the amount of taxes due on its tax return plus net deferred taxes computed based upon the expected future tax consequences of temporary differences between carrying amounts and tax basis of assets and liabilities, using enacted tax rates. A valuation allowance, if needed, reduces deferred tax assets to the amount expected to be realized.
A tax position is recognized as a benefit only if it is “more likely than not” that the tax position would be sustained in a tax examination, with a tax examination being presumed to occur. The amount recognized is the largest amount of tax benefit that is more likely of being realized on examination than not. For tax positions not meeting the “more likely than not” test, no tax benefit is recorded.
The Company recognizes interest and/or penalties related to income tax matters in income tax expense.
Off-Balance Sheet Financial Instruments:
Financial instruments include credit instruments, such as commitments to make loans and standby letters of credit, issued to meet customer financing needs. The face amount for these items represents the exposure to loss, before considering customer collateral or ability to repay. Such financial instruments are recorded when they are funded. The fair value of standby letters of credit is recorded as a liability during the commitment period.
Earnings Per Common Share:
Basic earnings per common share is net income divided by the weighted average number of common shares outstanding during the period. Diluted earnings per common share includes the dilutive effect of additional potential common shares issuable under stock options, restricted stock awards and warrants. Earnings and dividends per share are restated for all stock splits and dividends through the date of issue of the financial statements. The common shares included in treasury stock for 2019 and 2018 include 178,741 and 2017 include 172,959 and 168,970 shares, respectively, of Company common stock that has been purchased under the directors’ deferred compensation plan described above. Because these shares are held in trust for the participants, they are treated as outstanding when computing the weighted-average common shares outstanding for the calculation of both basic and diluted earnings per share.
Comprehensive Income:
Comprehensive income consists of net income and other comprehensive income (loss). Other comprehensive income (loss) includes unrealized gains and losses on securities available for saleavailable-for-sale and changes in the funded status of the pension plan, which are also recognized as separate components of equity.
65
NOTE 1 – SUMMARY OF SIGNIFICANT ACCOUNTING POLICIES (continued)
Loss Contingencies:
Loss contingencies, including claims and legal actions arising in the ordinary course of business, are recorded as liabilities when the likelihood of loss is probable and an amount or range of loss can be reasonably estimated. Management does not believe there currently are such matters that will have a material effect on the financial statements.
Restrictions on Cash:
The Company was required to have $6.4$28.9 million and $10.5$6.4 million of cash on hand or on deposit with the Federal Reserve Bank to meet regulatory reserve and clearing requirements at year-end 20182019 and 2017,2018, respectively. The Company met this requirement both years.
Dividend Restriction:
Banking regulations require maintaining certain capital levels and may limit the dividends paid by the Bank to the Company or by the Company to its stockholders. These restrictions currently pose no practical limit on the ability of the Bank or Company to pay dividends at historical levels.
Fair Value of Financial Instruments:
Fair values of financial instruments are estimated using relevant market information and other assumptions, as more fully disclosed in Note 5.5 - Fair Value. Fair value estimates involve uncertainties and matters of significant judgment regarding interest rates, credit risk, prepayments and other factors, especially in the absence of broad markets for particular items. Changes in assumptions or in market conditions could significantly affect the estimates.
Operating Segments:
The Company’s chief decision-makers monitor and evaluate financial performance on a Company-wide basis. All of the Company’s financial service operations are similar and considered by management to be aggregated into one reportable operating segment. While the Company has assigned certain management responsibilities by region and business-line, the Company'sCompany’s chief decision-makers monitor and evaluate financial performance on a Company-wide basis. The majority of the Company'sCompany’s revenue is from the business of banking and the Company'sCompany’s assigned regions have similar economic characteristics, products, services and customers. Accordingly, all of the Company’s operations are considered by management to be aggregated in one reportable operating segment.
Adoption of New Accounting Standards:
The Company accounts for revenueleases in accordance with ASU No. 2014-09, “Revenue from Contracts with Customers” and all the subsequent amendments to the ASU (collectively “ASC 606”)2016-02, “Leases”, which the Company adopted on January 1, 2018, using the modified retrospective approach. Results for reporting periods beginning after January 1, 2018 are presented under ASC 606, while prior period amounts are not adjusted and continue to be reported under the accounting standards in effect for the prior period. We recorded a net increase to opening retained earnings of $24,000 as of January 1, 2018 due to the cumulative impact of adopting ASC 606. Revenue is split between net interest income and noninterest income at a ratio of approximately 80% to 20%, respectively. The scope of the guidance explicitly excludes net interest income as well as many other revenues for financial assets and liabilities including loans, leases, securities, and derivatives. The Company’s services that fall within ASC 606 are presented in noninterest income and are recognized as revenue as the Company satisfies its obligation to the customer. The majority of the Company's revenue is from the business of banking and the Company's assigned regions have similar economic characteristics, products, services and customers. Accordingly, all of the Company's operations are considered by management to be aggregated in one reportable operating segment.
| For the year ended December 31, 2018 | |||||
| As reported | Under legacy GAAP | Impact of ASC 606 | |||
| Noninterest income | |||||
| Loan and service fees | $9,291 | $8,520 | $771 | ||
| Other income | 2,381 | 2,625 | (244) | ||
| Total | $11,672 | $11,145 | $527 | ||
| Noninterest expense | |||||
| Data processing fees and supplies | 9,685 | 9,158 | 527 | ||
| Total | $9,685 | $9,158 | $527 | ||
| Net Impact | $1,987 | $1,987 | $0 | ||
| Net income | $80,411 | $80,411 | $0 | ||
| Comprehensive income | 75,131 | 75,131 | 0 | ||
| Basic earnings per share | $3.18 | $3.18 | $0 | ||
| Diluted earnings per share | 3.13 | 3.13 | 0 | ||
66
NOTE 1 – SUMMARY OF SIGNIFICANT ACCOUNTING POLICIES (continued)
In March 2017, the FASB issued ASU No. 2017-08, “Receivables-Nonrefundable Fees and Other Costs: Premium Amortization on Purchased Callable Debt Securities.” This update amends the amortization period for certain purchased callable debt securities held at a premium. FASB has shortened the amortization period for the premium to the earliest call date. Under legacy GAAP, entities generally amortized the premium as an adjustment of yield over the contractual life of the instrument. The amendments in this update became effective for annual periods and interim periods within those annual periods beginning after December 15, 2018. The Company adopted this new accounting standard on January 1, 2019. The effect of adoption was a reduction in retained earnings of approximately $1.3 million to reflect the acceleration of amortization of premiums on available-for-sale debt securities.
In August 2017, the FASB issued ASU 2017-12, “Derivatives and Hedging: Targeted Improvements to Accounting for Hedging Activities”. The purpose of this updated guidance is to better align a company's financial reporting for hedging activities with the economic objectives of those activities. ASU 2017-12 is effective for public business entities for fiscal years beginning after December 15, 2018, with early adoption, including adoption in an interim period, permitted. The Company adopted ASU 2017-12 on January 1, 2019. ASU 2017-12 required a modified retrospective transition method in which the Company recognized the cumulative effect of the change on the opening balance of each affected component of equity in the consolidated balance sheet as both assets and liabilities upon adoption of the date of adoption. Adopting this accounting standard.
Newly Issued But Not Yet Effective Accounting Standards:
In June 2016, the FASB issued guidance related to credit losses on financial instruments. This update, commonly referred to as the current expected credit losses methodology (“CECL”), will change the accounting for credit losses on loans and debt securities. TheUnder the new guidance, the Company’s measurement of expected credit losses is to be based on information about past events, including historical experience, current conditions, and reasonable and supportable forecasts that affect the collectability of the reported amount. For loans, this measurement will take place at the time the financial asset is first added to the balance sheet and periodically thereafter. This differs significantly from the “incurred loss” model required under current GAAP, which delays recognition until it is probable a loss has been incurred. In addition, the guidance will modify the other-than-temporary impairment model for available-for-sale debt securities to require an allowance for credit impairment instead of a direct write-down, which will allow for reversal of credit impairments in future periods. This guidance is effective for public business entities that meet the definition of an SEC filerCompany for fiscal years beginning after December 15, 2019, including interim periods in those fiscal years. This amendment is required to be adopted using a modified retrospective approach with a cumulative-effect adjustment to beginning retained earnings, as of the beginning of the first reporting period in which the guidance is effective.
The Company has formed a cross-functional committee that has evaluated existing technology and other solutions forto assist with calculating losses under this new standard, selected a vendor to validate data currently loaded in the technology solution, selected, and reviewed the validation assessment report. TheAdditionally, the committee is continuing to evaluate the various methods available for calculating the credit losses, including but not limited to discounted cash flows, migration,has selected a probability of default/loss given default model, run parallel calculations and vintage. Management expectsevaluated changes to the overall internal control structure under the new model. Upon adoption of this standard, the Company will recognize credit losses earlier upon adoption of this accounting standard and the expected credit loss model than it historically has historically done under the current incurred loss model. The Company will utilize a one to two year reasonable and supportable forecast period.
Due to this change in methodology, the Company anticipates larger increases in credit loss model. Management will be calculatingallowances for its longer-lived retail portfolios and smaller increases for its shorter-lived commercial portfolio. Based upon the Company’s loan portfolio composition at December 31, 2019, and the current economic environment and management’s current forecast and qualitative adjustment assumptions, the Company estimates an 8% - 13% increase in its allowance for credit losses upon adoption of this standard. The final impact of CECL on its allowance for internal purposescredit losses, effective January 1, 2020, will depend on refinements to key assumptions including forecasting and qualitative factors. Once final, the calculation will require approval by the loan review committee and governance in accordance with the new standard during 2019, in orderCompany’s internal controls over financial reporting. Additionally, the Company has evaluated the need to evaluaterecognize an allowance for credit impairment for available-for-sale debt securities. The impact on available-for-sale debt securities is subject to a limitation, which is based on the impactfair value of adopting this new accounting standard onthe debt securities. When evaluating the credit quality of our financial statements.existing portfolio, the Company does not expect the allowance for credit impairment for available-for-sale securities to be significant.
67
NOTE 1 – SUMMARY OF SIGNIFICANT ACCOUNTING POLICIES (continued)
In January 2017, the FASB issued ASU No. 2017-04 "Intangibles - Goodwill and Other - Simplifying the Test for Goodwill Impairment." These amendments eliminate Step 2 from the goodwill impairment test. The amendments also eliminate the requirements for any reporting unit with a zero or negative carrying amount to perform a qualitative assessment and, if it fails that qualitative test, to perform Step 2 of the goodwill impairment test. An entity still has the option to perform the qualitative assessment for a reporting unit to determine if the quantitative impairment test is necessary. The guidance is effective for annual or any interim goodwill impairment tests in fiscal years beginning after December 15, 2019. Early adoption is permitted for interim or annual goodwill impairment tests performed on testing dates after January 1, 2017. ASU 2017-04 should be adopted on a prospective basis. Management does not expect the adoption of this new accounting standard to have a material impact on our financial statements.
Reclassifications:
Certain amounts appearing in the financial statements and notes thereto for prior periods have been reclassified to conform with the current presentation. The reclassifications had no effect on net income or stockholders’ equity as previously reported.
Information related to the fair value and amortized cost of securities available for saleavailable-for-sale and the related gross unrealized gains and losses recognized in accumulated other comprehensive income (loss) at December 31 is provided in the tables below.
| | | | | | | | | | | | |
| | | | | Gross | | Gross | | | | ||
| | Amortized | | Unrealized | | Unrealized | | Fair | ||||
(dollars in thousands) |
| Cost |
| Gain |
| Losses |
| Value | ||||
2019 |
| |
|
| |
|
| |
|
| |
|
Mortgage-backed securities: residential | | $ | 283,817 | | $ | 4,751 | | $ | (387) | | $ | 288,181 |
Mortgage-backed securities: commercial | |
| 36,712 | |
| 262 | |
| (2) | |
| 36,972 |
State and municipal securities | |
| 270,480 | |
| 12,828 | |
| (228) | |
| 283,080 |
Total | | $ | 591,009 | | $ | 17,841 | | $ | (617) | | $ | 608,233 |
| | | | | | | | | | | | |
2018 | |
|
| |
|
| |
|
| |
|
|
U.S. Treasury securities | | $ | 994 | | $ | 0 | | $ | (7) | | $ | 987 |
U.S. government sponsored agencies | |
| 4,435 | |
| 0 | |
| (85) | |
| 4,350 |
Mortgage-backed securities: residential | |
| 329,516 | |
| 1,392 | |
| (5,496) | |
| 325,412 |
Mortgage-backed securities: commercial | |
| 38,712 | |
| 0 | |
| (571) | |
| 38,141 |
State and municipal securities | |
| 217,964 | |
| 1,403 | |
| (2,708) | |
| 216,659 |
Total | | $ | 591,621 | | $ | 2,795 | | $ | (8,867) | | $ | 585,549 |
68
| Gross | Gross | ||||||
| Amortized | Unrealized | Unrealized | Fair | ||||
| (dollars in thousands) | Cost | Gain | Losses | Value | |||
| 2018 | |||||||
| U.S. Treasury securities | $994 | $0 | $(7) | $987 | |||
| U.S. government sponsored agencies | 4,435 | 0 | (85) | 4,350 | |||
| Mortgage-backed securities: residential | 329,516 | 1,392 | (5,496) | 325,412 | |||
| Mortgage-backed securities: commercial | 38,712 | 0 | (571) | 38,141 | |||
| State and municipal securities | 217,964 | 1,403 | (2,708) | 216,659 | |||
| Total | $591,621 | $2,795 | $(8,867) | $585,549 | |||
| 2017 | |||||||
| U.S. Treasury securities | $992 | $5 | $0 | $997 | |||
| U.S. government sponsored agencies | 5,191 | 0 | (69) | 5,122 | |||
| Mortgage-backed securities: residential | 314,650 | 2,099 | (2,975) | 313,774 | |||
| Mortgage-backed securities: commercial | 44,208 | 75 | (72) | 44,211 | |||
| State and municipal securities | 172,375 | 2,990 | (976) | 174,389 | |||
| Total | $537,416 | $5,169 | $(4,092) | $538,493 |
Information regarding the fair value and amortized cost of available for saleavailable-for-sale debt securities by maturity as of December 31, 20182019, is presented below. Maturity information is based on contractual maturity for all securities other than mortgage-backed securities. Actual maturities of securities may differ from contractual maturities because borrowers may have the right to prepay the obligation without prepayment penalty.
| Amortized | Fair | ||
| (dollars in thousands) | Cost | Value | |
| Due in one year or less | $2,540 | $2,541 | |
| Due after one year through five years | 22,363 | 22,522 | |
| Due after five years through ten years | 32,702 | 32,656 | |
| Due after ten years | 165,788 | 164,277 | |
| 223,393 | 221,996 | ||
| Mortgage-backed securities | 368,228 | 363,553 | |
| Total debt securities . . . . . . . . . . . . . . . . . . . . . . . . . . . . . . . . . . . . . . . . . . . . . . . . . . . . . . . . . . . . . . . . . . | $591,621 | $585,549 |
| | | | | | |
| | Amortized | | Fair | ||
(dollars in thousands) |
| Cost |
| Value | ||
Due in one year or less | | $ | 4,587 | | $ | 4,610 |
Due after one year through five years | |
| 15,115 | |
| 15,453 |
Due after five years through ten years | |
| 24,962 | |
| 26,061 |
Due after ten years | |
| 225,816 | |
| 236,956 |
| |
| 270,480 | |
| 283,080 |
Mortgage-backed securities | |
| 320,529 | |
| 325,153 |
Total debt securities | | $ | 591,009 | | $ | 608,233 |
Security proceeds, gross gains and gross losses for 2019, 2018 2017 and 20162017 were as follows:
| (dollars in thousands) | 2018 | 2017 | 2016 | ||
| Sales of securities available for sale | |||||
| Proceeds | $15,302 | $40,877 | $12,095 | ||
| Gross gains | 21 | 267 | 83 | ||
| Gross losses | (71) | (235) | (17) | ||
| Number of securities | 29 | 50 | 15 |
| | | | | | | | | |
(dollars in thousands) |
| 2019 |
| 2018 |
| 2017 | |||
Sales of securities available-for-sale | | | | | | | | | |
Proceeds | | $ | 57,114 | | $ | 15,302 | | $ | 40,877 |
Gross gains | |
| 279 | |
| 21 | |
| 267 |
Gross losses | |
| (137) | |
| (71) | |
| (235) |
Number of securities | |
| 46 | |
| 29 | |
| 50 |
Securities with carrying values of $164.7$59.3 million and $171.1$164.7 million were pledged as of December 31, 2019 and 2018, and 2017,respectively, as collateral for securities sold under agreements to repurchase, borrowings from the FHLB and for other purposes as permitted or required by law.
Information regarding securities with unrealized losses as of December 31, 20182019 and 20172018, is presented below. The tables distribute the securities between those with unrealized losses for less than twelve months and those with unrealized losses for twelve months or more.
| | | | | | | | | | | | | | | | | | |
| | Less than 12 months | | 12 months or more | | Total | ||||||||||||
| | Fair | | Unrealized | | Fair | | Unrealized | | Fair | | Unrealized | ||||||
(dollars in thousands) |
| Value |
| Losses |
| Value |
| Losses |
| Value |
| Losses | ||||||
2019 |
| |
|
| |
|
| |
|
| |
|
| |
|
| |
|
Mortgage-backed securities: residential | | $ | 23,436 | | $ | 112 | | $ | 14,174 | | $ | 275 | | $ | 37,610 | | $ | 387 |
Mortgage-backed securities: commercial | |
| 4,591 | |
| 2 | |
| 0 | |
| 0 | |
| 4,591 | |
| 2 |
State and municipal securities | |
| 14,188 | |
| 228 | |
| 0 | |
| 0 | |
| 14,188 | |
| 228 |
Total temporarily impaired | | $ | 42,215 | | $ | 342 | | $ | 14,174 | | $ | 275 | | $ | 56,389 | | $ | 617 |
| | | | | | | | | | | | | | | | | | |
2018 | |
|
| |
|
| |
|
| |
|
| |
|
| |
|
|
U.S. Treasury securities | | $ | 0 | | $ | 0 | | $ | 987 | | $ | 7 | | $ | 987 | | $ | 7 |
U.S. government sponsored agencies | |
| 0 | |
| 0 | |
| 4,350 | |
| 85 | |
| 4,350 | |
| 85 |
Mortgage-backed securities: residential | |
| 11,619 | |
| 12 | |
| 217,182 | |
| 5,484 | |
| 228,801 | |
| 5,496 |
Mortgage-backed securities: commercial | |
| 0 | |
| 0 | |
| 38,141 | |
| 571 | |
| 38,141 | |
| 571 |
State and municipal securities | |
| 26,229 | |
| 124 | |
| 85,982 | |
| 2,584 | |
| 112,211 | |
| 2,708 |
Total temporarily impaired | | $ | 37,848 | | $ | 136 | | $ | 346,642 | | $ | 8,731 | | $ | 384,490 | | $ | 8,867 |
69
| Less than 12 months | 12 months or more | Total | |||||||||
| Fair | Unrealized | Fair | Unrealized | Fair | Unrealized | ||||||
| (dollars in thousands) | Value | Losses | Value | Losses | Value | Losses | |||||
| 2018 | |||||||||||
| U.S. Treasury securities | $0 | $0 | $987 | $7 | $987 | $7 | |||||
| U.S. government sponsored agencies | 0 | 0 | 4,350 | 85 | 4,350 | 85 | |||||
| Mortgage-backed securities: residential | 11,619 | 12 | 217,182 | 5,484 | 228,801 | 5,496 | |||||
| Mortgage-backed securities: commercial | 0 | 0 | 38,141 | 571 | 38,141 | 571 | |||||
| State and municipal securities | 26,229 | 124 | 85,982 | 2,584 | 112,211 | 2,708 | |||||
| Total temporarily impaired | $37,848 | $136 | $346,642 | $8,731 | $384,490 | $8,867 | |||||
| 2017 | |||||||||||
| U.S. government sponsored agencies | $2,353 | $6 | $2,769 | $63 | $5,122 | $69 | |||||
| Mortgage-backed securities: residential | 142,834 | 1,412 | 59,024 | 1,563 | 201,858 | 2,975 | |||||
| Mortgage-backed securities: commercial | 23,505 | 72 | 0 | 0 | 23,505 | 72 | |||||
| State and municipal securities | 8,585 | 47 | 49,552 | 929 | 58,137 | 976 | |||||
| Total temporarily impaired | $177,277 | $1,537 | $111,345 | $2,555 | $288,622 | $4,092 | |||||
The number of securities with unrealized losses as of December 31, 20182019 and 20172018 is presented below.
| Less than | 12 months | ||||
| 12 months | or more | Total | |||
| 2018 | |||||
| U.S. Treasury securities | 0 | 1 | 1 | ||
| U.S. government sponsored agencies | 0 | 2 | 2 | ||
| Mortgage-backed securities: residential | 5 | 84 | 89 | ||
| Mortgage-backed securities: commercial | 0 | 9 | 9 | ||
| State and municipal securities | 35 | 111 | 146 | ||
| Total temporarily impaired | 40 | 207 | 247 | ||
| 2017 | |||||
| U.S. government sponsored agencies | 1 | 1 | 2 | ||
| Mortgage-backed securities: residential | 46 | 21 | 67 | ||
| Mortgage-backed securities: commercial | 5 | 0 | 5 | ||
| State and municipal securities | 17 | 62 | 79 | ||
| Total temporarily impaired | 69 | 84 | 153 |
| | | | | | |
| | Less than | | 12 months | | |
|
| 12 months |
| or more |
| Total |
2019 |
|
|
|
| | |
Mortgage-backed securities: residential |
| 7 |
| 6 |
| 13 |
Mortgage-backed securities: commercial |
| 1 |
| 0 |
| 1 |
State and municipal securities |
| 11 |
| 0 |
| 11 |
Total temporarily impaired |
| 19 |
| 6 |
| 25 |
| | | | | | |
2018 |
|
|
|
| | |
U.S. Treasury securities | | 0 |
| 1 |
| 1 |
U.S. government sponsored agencies |
| 0 |
| 2 |
| 2 |
Mortgage-backed securities: residential |
| 5 |
| 84 |
| 89 |
Mortgage-backed securities: commercial |
| 0 |
| 9 |
| 9 |
State and municipal securities |
| 35 |
| 111 |
| 146 |
Total temporarily impaired |
| 40 |
| 207 |
| 247 |
There were no debt securities with credit losses recognized in income during 2019, 2018 2017 or 2016.
Ninety-nine percent of the securities are backed by the U.S. government, government agencies, government sponsored agencies or are rated above investment grade, except for certain non-local or local municipal securities, which are not rated. For the government, government-sponsored agency and municipal securities, management did not have concerns of credit losses and there was nothing to indicate that full principal will not be received. Management considered the unrealized losses on these securities to be primarily interest rate driven and does not expect material losses given current market conditions unless the securities are sold. However, at this time management does not have the intent to sell and it is more likely than not that it will not be required to sell these securities before the recovery of their amortized cost basis.
The Company does not have a history of actively trading securities, but keeps the securities availableavailable-for-sale should liquidity for sale should liquidityinterest rate risk management or other needs develop that would warrant the sale of securities. While these securities are held in the available for saleavailable-for-sale portfolio, it is management’s current intent and ability to hold them until a recovery in fair value or maturity.
70
Total loans outstanding as of the years ended December 31, 20182019 and 20172018 consisted of the following:
| (dollars in thousands) | 2018 | 2017 | |
| Commercial and industrial loans: | |||
| Working capital lines of credit loans | $690,620 | $743,609 | |
| Non-working capital loans | 714,759 | 675,072 | |
| Total commercial and industrial loans | 1,405,379 | 1,418,681 | |
| Commercial real estate and multi-family residential loans: | |||
| Construction and land development loans | 266,805 | 224,474 | |
| Owner occupied loans | 586,325 | 538,603 | |
| Nonowner occupied loans | 520,901 | 508,121 | |
| Multi-family loans | 195,604 | 173,715 | |
| Total commercial real estate and multi-family residential loans | 1,569,635 | 1,444,913 | |
| Agri-business and agricultural loans: | |||
| Loans secured by farmland | 177,503 | 186,437 | |
| Loans for agricultural production | 193,010 | 196,404 | |
| Total agri-business and agricultural loans | 370,513 | 382,841 | |
| Other commercial loans | 95,657 | 124,076 | |
| Total commercial loans | 3,441,184 | 3,370,511 | |
| Consumer 1-4 family mortgage loans: | |||
| Closed end first mortgage loans | 185,822 | 179,302 | |
| Open end and junior lien loans | 187,030 | 181,865 | |
| Residential construction and land development loans | 16,226 | 13,478 | |
| Total consumer 1-4 family mortgage loans | 389,078 | 374,645 | |
| Other consumer loans | 86,064 | 74,369 | |
| Total consumer loans | 475,142 | 449,014 | |
| Total loans . . . . . . . . . . . . . . . . . . . . . . . . . . . . . . . . . . . . . . . . . . . . . . . . . . . . . . . . . . . . . . . . . . . . . . . . . . . . . . . | 3,916,326 | 3,819,525 | |
| Less: Allowance for loan losses | (48,453) | (47,121) | |
| Net deferred loan fees | (1,581) | (1,066) | |
| Loans, net . . . . . . . . . . . . . . . . . . . . . . . . . . . . . . . . . . . . . . . . . . . . . . . . . . . . . . . . . . . . . . . . . . . . . . . . . . . | $3,866,292 | $3,771,338 |
| | | | | | |
(dollars in thousands) |
| 2019 |
| 2018 | ||
Commercial and industrial loans: | | | | | | |
Working capital lines of credit loans | | $ | 709,849 | | $ | 690,620 |
Non-working capital loans | |
| 717,019 | |
| 714,759 |
Total commercial and industrial loans | |
| 1,426,868 | |
| 1,405,379 |
| | | | | | |
Commercial real estate and multi-family residential loans: | |
|
| |
|
|
Construction and land development loans | |
| 287,641 | |
| 266,805 |
Owner occupied loans | |
| 573,665 | |
| 586,325 |
Nonowner occupied loans | |
| 571,364 | |
| 520,901 |
Multi-family loans | |
| 240,652 | |
| 195,604 |
Total commercial real estate and multi-family residential loans | |
| 1,673,322 | |
| 1,569,635 |
| | | | | | |
Agri-business and agricultural loans: | |
|
| |
|
|
Loans secured by farmland | |
| 174,380 | |
| 177,503 |
Loans for agricultural production | |
| 205,151 | |
| 193,010 |
Total agri-business and agricultural loans | |
| 379,531 | |
| 370,513 |
| | | | | | |
Other commercial loans | |
| 112,302 | |
| 95,657 |
Total commercial loans | |
| 3,592,023 | |
| 3,441,184 |
| | | | | | |
Consumer 1-4 family mortgage loans: | |
|
| |
|
|
Closed end first mortgage loans | |
| 177,227 | |
| 185,822 |
Open end and junior lien loans | |
| 186,552 | |
| 187,030 |
Residential construction and land development loans | |
| 12,966 | |
| 16,226 |
Total consumer 1-4 family mortgage loans | |
| 376,745 | |
| 389,078 |
| | | | | | |
Other consumer loans | |
| 98,617 | |
| 86,064 |
Total consumer loans | |
| 475,362 | |
| 475,142 |
Gross loans | |
| 4,067,385 | |
| 3,916,326 |
Less: Allowance for loan losses | |
| (50,652) | |
| (48,453) |
Net deferred loan fees | |
| (1,557) | |
| (1,581) |
Loans, net | | $ | 4,015,176 | | $ | 3,866,292 |
The recorded investment in loans does not include accrued interest.
The Company had $586,000$1.6 million and $47,000$586,000 in residential real estate loans in process of foreclosure as of December 31, 2019 and 2018, and 2017, respectively.
71
The following tables present the activity and balance in the allowance for loan losses by portfolio segment for the year ended December 31, 2019, 2018 2017 and 2016:2017:
| | | | | | | | | | | | | | | | | | | | | | | | |
| | | | | Commercial | | | | | | | | | | | | | | | | | | | |
| | | | | Real Estate | | | | | | | | | | | | | | | | | | | |
| | Commercial | | and | | Agri-business | | | | | Consumer | | | | | | | | | | ||||
| | and | | Multi-family | | and | | Other | | 1-4 Family | | Other | | | | | | | ||||||
(dollars in thousands) |
| Industrial |
| Residential |
| Agricultural |
| Commercial |
| Mortgage |
| Consumer |
| Unallocated |
| Total | ||||||||
December 31, 2019 |
| |
|
| |
|
| |
|
| |
|
| |
|
| |
|
| |
|
| |
|
Beginning balance | | $ | 22,518 | | $ | 15,393 | | $ | 4,305 | | $ | 368 | | $ | 2,292 | | $ | 283 | | $ | 3,294 | | $ | 48,453 |
Provision for loan losses | |
| 4,259 | |
| 259 | |
| (444) | |
| 79 | |
| (219) | |
| 275 | |
| (974) | |
| 3,235 |
Loans charged-off | |
| (1,447) | |
| (17) | |
| 0 | |
| 0 | |
| (110) | |
| (336) | |
| 0 | |
| (1,910) |
Recoveries | |
| 459 | |
| 161 | |
| 8 | |
| 0 | |
| 123 | |
| 123 | |
| 0 | |
| 874 |
Net loans (charged-off) recovered | |
| (988) | |
| 144 | |
| 8 | |
| 0 | |
| 13 | |
| (213) | |
| 0 | |
| (1,036) |
Ending balance | | $ | 25,789 | | $ | 15,796 | | $ | 3,869 | | $ | 447 | | $ | 2,086 | | $ | 345 | | $ | 2,320 | | $ | 50,652 |
| | | | | | | | | | | | | | | | | | | | | | | | |
| | | | | Commercial | | | | | | | | | | | | | | | | | | | |
| | | | | Real Estate | | | | | | | | | | | | | | | | | | | |
| | Commercial | | and | | Agri-business | | | | | Consumer | | | | | | | | | | ||||
| | and | | Multi-family | | and | | Other | | 1-4 Family | | Other | | | | | | | ||||||
(dollars in thousands) |
| Industrial |
| Residential |
| Agricultural |
| Commercial |
| Mortgage |
| Consumer |
| Unallocated |
| Total | ||||||||
December 31, 2018 | | | | | | | | | | | | | | | | | | | | | | | | |
Beginning balance | | $ | 21,097 | | $ | 14,714 | | $ | 4,920 | | $ | 577 | | $ | 2,768 | | $ | 379 | | $ | 2,666 | | $ | 47,121 |
Provision for loan losses | |
| 5,884 | |
| 1,140 | |
| (657) | |
| (209) | |
| (536) | |
| 150 | |
| 628 | |
| 6,400 |
Loans charged-off | |
| (5,215) | |
| (491) | |
| 0 | |
| 0 | |
| (48) | |
| (357) | |
| 0 | |
| (6,111) |
Recoveries | |
| 752 | |
| 30 | |
| 42 | |
| 0 | |
| 108 | |
| 111 | |
| 0 | |
| 1,043 |
Net loans (charged-off) recovered | |
| (4,463) | |
| (461) | |
| 42 | |
| 0 | |
| 60 | |
| (246) | |
| 0 | |
| (5,068) |
Ending balance | | $ | 22,518 | | $ | 15,393 | | $ | 4,305 | | $ | 368 | | $ | 2,292 | | $ | 283 | | $ | 3,294 | | $ | 48,453 |
| | | | | | | | | | | | | | | | | | | | | | | | |
| | | | | Commercial | | | | | | | | | | | | | | | | | | | |
| | | | | Real Estate | | | | | | | | | | | | | | | | | | | |
| | Commercial | | and | | Agri-business | | | | | Consumer | | | | | | | | | | ||||
| | and | | Multi-family | | and | | Other | | 1-4 Family | | Other | | | | | | | ||||||
(dollars in thousands) |
| Industrial |
| Residential |
| Agricultural |
| Commercial |
| Mortgage |
| Consumer |
| Unallocated |
| Total | ||||||||
December 31, 2017 | | | | | | | | | | | | | | | | | | | | | | | | |
Beginning balance | | $ | 20,272 | | $ | 13,452 | | $ | 3,532 | | $ | 461 | | $ | 2,827 | | $ | 387 | | $ | 2,787 | | $ | 43,718 |
Provision for loan losses | |
| 614 | |
| 997 | |
| 1,365 | |
| 116 | |
| (105) | |
| 134 | |
| (121) | |
| 3,000 |
Loans charged-off | |
| (842) | |
| (406) | |
| 0 | |
| 0 | |
| (53) | |
| (259) | |
| 0 | |
| (1,560) |
Recoveries | |
| 1,053 | |
| 671 | |
| 23 | |
| 0 | |
| 99 | |
| 117 | |
| 0 | |
| 1,963 |
Net loans (charged-off) recovered | |
| 211 | |
| 265 | |
| 23 | |
| 0 | |
| 46 | |
| (142) | |
| 0 | |
| 403 |
Ending balance | | $ | 21,097 | | $ | 14,714 | | $ | 4,920 | | $ | 577 | | $ | 2,768 | | $ | 379 | | $ | 2,666 | | $ | 47,121 |
72
| Commercial | |||||||||||||||
| Real Estate | |||||||||||||||
| Commercial | and | Agri-business | Consumer | ||||||||||||
| and | Multi-family | and | Other | 1-4 Family | Other | ||||||||||
| (dollars in thousands) | Industrial | Residential | Agricultural | Commercial | Mortgage | Consumer | Unallocated | Total | |||||||
| December 31, 2018 | |||||||||||||||
| Beginning balance | $21,097 | $14,714 | $4,920 | $577 | $2,768 | $379 | $2,666 | $47,121 | |||||||
| Provision for loan losses | 5,884 | 1,140 | (657) | (209) | (536) | 150 | 628 | 6,400 | |||||||
| Loans charged-off | (5,215) | (491) | 0 | 0 | (48) | (357) | 0 | (6,111) | |||||||
Recoveries | 752 | 30 | 42 | 0 | 108 | 111 | 0 | 1,043 | |||||||
| Net loans charged-off/(recovered) | (4,463) | (461) | 42 | 0 | 60 | (246) | 0 | (5,068) | |||||||
| Ending balance | $22,518 | $15,393 | $4,305 | $368 | $2,292 | $283 | $3,294 | $48,453 | |||||||
| Commercial | |||||||||||||||
| Real Estate | |||||||||||||||
| Commercial | and | Agri-business | Consumer | ||||||||||||
| and | Multi-family | and | Other | 1-4 Family | Other | ||||||||||
| (dollars in thousands) | Industrial | Residential | Agricultural | Commercial | Mortgage | Consumer | Unallocated | Total | |||||||
| December 31, 2017 | |||||||||||||||
| Beginning balance | $20,272 | $13,452 | $3,532 | $461 | $2,827 | $387 | $2,787 | $43,718 | |||||||
| Provision for loan losses | 614 | 997 | 1,365 | 116 | (105) | 134 | (121) | 3,000 | |||||||
| Loans charged-off | (842) | (406) | 0 | 0 | (53) | (259) | 0 | (1,560) | |||||||
| Recoveries | 1,053 | 671 | 23 | 0 | 99 | 117 | 0 | 1,963 | |||||||
| Net loans charged-off/(recovered) | 211 | 265 | 23 | 0 | 46 | (142) | 0 | 403 | |||||||
| Ending balance | $21,097 | $14,714 | $4,920 | $577 | $2,768 | $379 | $2,666 | $47,121 | |||||||
| Commercial | |||||||||||||||
| Real Estate | |||||||||||||||
| Commercial | and | Agri-business | Consumer | ||||||||||||
| and | Multi-family | and | Other | 1-4 Family | Other | ||||||||||
| (dollars in thousands) | Industrial | Residential | Agricultural | Commercial | Mortgage | Consumer | Unallocated | Total | |||||||
| December 31, 2016 | |||||||||||||||
| Beginning balance | $21,564 | $12,473 | $2,445 | $574 | $3,395 | $319 | $2,840 | $43,610 | |||||||
| Provision for loan losses | (952) | 1,209 | 1,068 | (113) | (197) | 188 | (53) | 1,150 | |||||||
| Loans charged-off | (801) | (566) | 0 | 0 | (478) | (210) | 0 | (2,055) | |||||||
| Recoveries | 461 | 336 | 19 | 0 | 107 | 90 | 0 | 1,013 | |||||||
| Net loans charged-off/(recovered) | (340) | (230) | 19 | 0 | (371) | (120) | 0 | (1,042) | |||||||
| Ending balance | $20,272 | $13,452 | $3,532 | $461 | $2,827 | $387 | $2,787 | $43,718 | |||||||
The following tables present balance in the allowance for loan losses and the recorded investment in loans by portfolio segment and based on impairment method as of December 31, 20182019 and 2017:2018:
| | | | | | | | | | | | | | | | | | | | | | | | |
| | | | | Commercial | | | | | | | | | | | | | | | | | | | |
| | | | | Real Estate | | | | | | | | | | | | | | | | | | | |
| | Commercial | | and | | Agri-business | | | | | Consumer | | | | | | | | | | ||||
| | and | | Multi-family | | and | | Other | | 1-4 Family | | Other | | | | | | | ||||||
(dollars in thousands) |
| Industrial |
| Residential |
| Agricultural |
| Commercial | �� | Mortgage |
| Consumer |
| Unallocated |
| Total | ||||||||
December 31, 2019 | | | | | | | | | | | | | | | | | | | | | | | | |
Allowance for loan losses: | | | | | | | | | | | | | | | | | | | | | | | | |
Ending allowance balance attributable to loans: | | | | | | | | | | | | | | | | | | | | | | | | |
Individually evaluated for impairment | | $ | 9,324 | | $ | 538 | | $ | 90 | | $ | 0 | | $ | 426 | | $ | 6 | | $ | 0 | | $ | 10,384 |
Collectively evaluated for impairment | |
| 16,465 | |
| 15,258 | |
| 3,779 | |
| 447 | |
| 1,660 | |
| 339 | |
| 2,320 | |
| 40,268 |
Total ending allowance balance | | $ | 25,789 | | $ | 15,796 | | $ | 3,869 | | $ | 447 | | $ | 2,086 | | $ | 345 | | $ | 2,320 | | $ | 50,652 |
| | | | | | | | | | | | | | | | | | | | | | | | |
Loans: | | | | | | | | | | | | | | | | | | | | | | | | |
Loans individually evaluated for impairment | | $ | 19,580 | | $ | 4,998 | | $ | 445 | | $ | 0 | | $ | 2,789 | | $ | 17 | | $ | 0 | | $ | 27,829 |
Loans collectively evaluated for impairment | |
| 1,407,246 | |
| 1,665,842 | |
| 379,186 | |
| 112,166 | |
| 375,210 | |
| 98,349 | |
| 0 | |
| 4,037,999 |
Total ending loans balance | | $ | 1,426,826 | | $ | 1,670,840 | | $ | 379,631 | | $ | 112,166 | | $ | 377,999 | | $ | 98,366 | | $ | 0 | | $ | 4,065,828 |
| | | | | | | | | | | | | | | | | | | | | | | | |
| | | | | Commercial | | | | | | | | | | | | | | | | | | | |
| | | | | Real Estate | | | | | | | | | | | | | | | | | | | |
| | Commercial | | and | | Agri-business | | | | | Consumer | | | | | | | | | | ||||
| | and | | Multi-family | | and | | Other | | 1-4 Family | | Other | | | | | | | ||||||
(dollars in thousands) |
| Industrial |
| Residential |
| Agricultural |
| Commercial |
| Mortgage |
| Consumer |
| Unallocated |
| Total | ||||||||
December 31, 2018 | | | | | | | | | | | | | | | | | | | | | | | | |
Allowance for loan losses: | | | | | | | | | | | | | | | | | | | | | | | | |
Ending allowance balance attributable to loans: | | | | | | | | | | | | | | | | | | | | | | | | |
Individually evaluated for impairment | | $ | 8,552 | | $ | 921 | | $ | 73 | | $ | 0 | | $ | 457 | | $ | 26 | | $ | 0 | | $ | 10,029 |
Collectively evaluated for impairment | |
| 13,966 | |
| 14,472 | |
| 4,232 | |
| 368 | |
| 1,835 | |
| 257 | |
| 3,294 | |
| 38,424 |
Total ending allowance balance | | $ | 22,518 | | $ | 15,393 | | $ | 4,305 | | $ | 368 | | $ | 2,292 | | $ | 283 | | $ | 3,294 | | $ | 48,453 |
| | | | | | | | | | | | | | | | | | | | | | | | |
Loans: | | | | | | | | | | | | | | | | | | | | | | | | |
Loans individually evaluated for impairment | | $ | 19,734 | | $ | 4,266 | | $ | 433 | | $ | 0 | | $ | 2,240 | | $ | 44 | | $ | 0 | | $ | 26,717 |
Loans collectively evaluated for impairment | |
| 1,385,604 | |
| 1,562,899 | |
| 370,174 | |
| 95,520 | |
| 388,053 | |
| 85,778 | |
| 0 | |
| 3,888,028 |
Total ending loans balance | | $ | 1,405,338 | | $ | 1,567,165 | | $ | 370,607 | | $ | 95,520 | | $ | 390,293 | | $ | 85,822 | | $ | 0 | | $ | 3,914,745 |
73
| Commercial | |||||||||||||||
| Real Estate | |||||||||||||||
| Commercial | and | Agri-business | Consumer | ||||||||||||
| and | Multi-family | and | Other | 1-4 Family | Other | ||||||||||
| (dollars in thousands) | Industrial | Residential | Agricultural | Commercial | Mortgage | Consumer | Unallocated | Total | |||||||
| December 31, 2018 | |||||||||||||||
| Allowance for loan losses: | |||||||||||||||
| Ending allowance balance attributable to loans: | |||||||||||||||
| Individually evaluated for impairment | $8,552 | $921 | $73 | $0 | $457 | $26 | $0 | $10,029 | |||||||
| Collectively evaluated for impairment | 13,966 | 14,472 | 4,232 | 368 | 1,835 | 257 | 3,294 | 38,424 | |||||||
| Total ending allowance balance | $22,518 | $15,393 | $4,305 | $368 | $2,292 | $283 | $3,294 | $48,453 | |||||||
| Loans: | |||||||||||||||
| Loans individually evaluated for impairment | $19,734 | $4,266 | $433 | $0 | $2,240 | $44 | $0 | $26,717 | |||||||
| Loans collectively evaluated for impairment | 1,385,604 | 1,562,899 | 370,174 | 95,520 | 388,053 | 85,778 | 0 | 3,888,028 | |||||||
| Total ending loans balance | $1,405,338 | $1,567,165 | $370,607 | $95,520 | $390,293 | $85,822 | $0 | $3,914,745 | |||||||
| Commercial | |||||||||||||||
| Real Estate | |||||||||||||||
| Commercial | and | Agri-business | Consumer | ||||||||||||
| and | Multi-family | and | Other | 1-4 Family | Other | ||||||||||
| (dollars in thousands) | Industrial | Residential | Agricultural | Commercial | Mortgage | Consumer | Unallocated | Total | |||||||
| December 31, 2017 | |||||||||||||||
| Allowance for loan losses: | |||||||||||||||
| Ending allowance balance attributable to loans: | |||||||||||||||
| Individually evaluated for impairment | $2,067 | $795 | $0 | $0 | $310 | $44 | $0 | $3,216 | |||||||
| Collectively evaluated for impairment | 19,030 | 13,919 | 4,920 | 577 | 2,458 | 335 | 2,666 | 43,905 | |||||||
| Total ending allowance balance | $21,097 | $14,714 | $4,920 | $577 | $2,768 | $379 | $2,666 | $47,121 | |||||||
| Loans: | |||||||||||||||
| Loans individually evaluated for impairment | $6,979 | $4,802 | $283 | $0 | $1,756 | $50 | $0 | $13,870 | |||||||
| Loans collectively evaluated for impairment | 1,411,648 | 1,438,219 | 382,643 | 123,922 | 374,013 | 74,144 | 0 | 3,804,589 | |||||||
| Total ending loans balance | $1,418,627 | $1,443,021 | $382,926 | $123,922 | $375,769 | $74,194 | $0 | $3,818,459 | |||||||
NOTE 4
The following table presents loans individually evaluated for impairment by class of loans as of December 31, 2019:
| | | | | | | | | |
|
| Unpaid |
| | |
| Allowance for | ||
| | Principal | | Recorded | | Loan Losses | |||
(dollars in thousands) | | Balance | | Investment | | Allocated | |||
With no related allowance recorded: |
| |
|
| |
|
| |
|
Commercial and industrial loans: |
| |
|
| |
|
| |
|
Working capital lines of credit loans | | $ | 22 | | $ | 22 | | $ | 0 |
Non-working capital loans | | | 2,130 | | | 735 | | | 0 |
Commercial real estate and multi-family residential loans: | |
|
| |
|
| |
|
|
Owner occupied loans | |
| 3,189 | |
| 3,010 | |
| 0 |
Agri-business and agricultural loans: | |
|
| |
|
| |
|
|
Loans secured by farmland | |
| 603 | |
| 283 | |
| 0 |
Loans for ag production | | | 15 | | | 15 | | | 0 |
Consumer 1-4 family loans: | |
|
| |
|
| |
|
|
Closed end first mortgage loans | |
| 411 | |
| 330 | |
| 0 |
Open end and junior lien loans | |
| 121 | |
| 121 | |
| 0 |
With an allowance recorded: | |
|
| |
|
| |
|
|
Commercial and industrial loans: | |
|
| |
|
| |
|
|
Working capital lines of credit loans | |
| 6,214 | |
| 6,214 | |
| 3,089 |
Non-working capital loans | |
| 13,230 | |
| 12,609 | |
| 6,235 |
Commercial real estate and multi-family residential loans: | |
|
| |
|
| |
|
|
Owner occupied loans | |
| 1,988 | |
| 1,988 | |
| 538 |
Agri-business and agricultural loans: | |
|
| |
|
| |
|
|
Loans secured by farmland | |
| 147 | |
| 147 | |
| 90 |
Consumer 1-4 family mortgage loans: | |
|
| |
|
| |
|
|
Closed end first mortgage loans | |
| 1,643 | |
| 1,646 | |
| 363 |
Open end and junior lien loans | | | 641 | | | 640 | | | 53 |
Residential construction loans | | | 51 | | | 52 | | | 10 |
Other consumer loans | |
| 17 | |
| 17 | |
| 6 |
Total | | $ | 30,422 | | $ | 27,829 | | $ | 10,384 |
74
NOTE 4 - ALLOWANCE FOR LOAN LOSSES AND CREDIT QUALITY (continued)
The following table presents loans individually evaluated for impairment by class of loans as of December 31, 2018:
| | | | | | | | | |
|
| Unpaid |
| | |
| Allowance for | ||
| | Principal | | Recorded | | Loan Losses | |||
(dollars in thousands) | | Balance | | Investment | | Allocated | |||
With no related allowance recorded: |
| |
|
| |
|
| |
|
Commercial and industrial loans: |
| |
|
| |
|
| |
|
Non-working capital loans | | $ | 3,284 | | $ | 1,889 | | $ | 0 |
Commercial real estate and multi-family residential loans: | |
| | |
| | |
| |
Owner occupied loans | |
| 1,773 | |
| 1,527 | |
| 0 |
Agri-business and agricultural loans: | |
|
| |
|
| |
|
|
Loans secured by farmland | |
| 603 | |
| 283 | |
| 0 |
Consumer 1-4 family loans: | |
| | | | | | | |
Closed end first mortgage loans | | | 583 | |
| 502 | |
| 0 |
Open end and junior lien loans | |
| 220 | |
| 220 | |
| 0 |
With an allowance recorded: | |
|
| |
|
| |
|
|
Commercial and industrial loans: | |
| | | | | | | |
Working capital lines of credit loans | |
| 9,691 | |
| 6,694 | |
| 2,602 |
Non-working capital loans | |
| 11,099 | |
| 11,151 | |
| 5,950 |
Commercial real estate and multi-family residential loans: | |
| | | | | | | |
Construction and land development loans | |
| 291 | |
| 291 | |
| 142 |
Owner occupied loans | |
| 2,938 | |
| 2,448 | |
| 779 |
Agri-business and agricultural loans: | |
| | | | | | | |
Loans secured by farmland | | | 150 | | | 150 | | | 73 |
Consumer 1-4 family mortgage loans: | | | | | | | | | |
Closed end first mortgage loans | |
| 1,517 | |
| 1,518 | |
| 457 |
Other consumer loans | |
| 45 | |
| 44 | |
| 26 |
Total | | $ | 32,194 | | $ | 26,717 | | $ | 10,029 |
75
| Unpaid | Allowance for | ||||
| Principal | Recorded | Loan Losses | |||
| (dollars in thousands) | Balance | Investment | Allocated | ||
| With no related allowance recorded: | |||||
| Commercial and industrial loans: | |||||
| Non-working capital loans | $3,284 | $1,889 | $0 | ||
| Commercial real estate and multi-family residential loans: | |||||
| Owner occupied loans | 1,773 | 1,527 | 0 | ||
| Agri-business and agricultural loans: | |||||
| Loans secured by farmland | 603 | 283 | 0 | ||
| Consumer 1-4 family loans: | |||||
| Closed end first mortgage loans | 583 | 502 | 0 | ||
| Open end and junior lien loans | 220 | 220 | 0 | ||
| With an allowance recorded: | |||||
| Commercial and industrial loans: | |||||
| Working capital lines of credit loans | 9,691 | 6,694 | 2,602 | ||
| Non-working capital loans | 11,099 | 11,151 | 5,950 | ||
| Commercial real estate and multi-family residential loans: | |||||
| Construction and land development loans | 291 | 291 | 142 | ||
| Owner occupied loans | 2,938 | 2,448 | 779 | ||
| Agri-business and agricultural loans: | |||||
| Loans secured by farmland | 150 | 150 | 73 | ||
| Consumer 1-4 family mortgage loans: | |||||
| Closed end first mortgage loans | 1,517 | 1,518 | 457 | ||
| Other consumer loans | 45 | 44 | 26 | ||
| Total | $32,194 | $26,717 | $10,029 |
The following table presents loans individually evaluated for impairment by class of loans as offor the year ended December 31, 2017:2019:
| | | | | | | | | |
|
| | |
|
| |
| Cash Basis | |
| | Average | | Interest | | Interest | |||
| | Recorded | | Income | | Income | |||
(dollars in thousands) | | Investment | | Recognized | | Recognized | |||
With no related allowance recorded: | | | | | | | | | |
Commercial and industrial loans: | | | | | | | | | |
Working capital lines of credit loans | | $ | 176 | | $ | 9 | | $ | 9 |
Non-working capital loans | |
| 1,170 | |
| 40 | |
| 30 |
Commercial real estate and multi-family residential loans: | | | | | | | | | |
Owner occupied loans | |
| 2,354 | |
| 34 | |
| 34 |
Agri-business and agricultural loans: | | | | | | | | | |
Loans secured by farmland | |
| 283 | |
| 0 | |
| 0 |
Loans for ag production | | | 4 | | | 0 | | | 0 |
Consumer 1-4 family loans: | | | | | | | | | |
Closed end first mortgage loans | |
| 272 | |
| 3 | |
| 3 |
Open end and junior lien loans | |
| 133 | |
| 0 | |
| 0 |
With an allowance recorded: | | | | | | | | | |
Commercial and industrial loans: | | | | | | | | | |
Working capital lines of credit loans | |
| 6,335 | |
| 143 | |
| 81 |
Non-working capital loans | |
| 11,800 | |
| 448 | |
| 410 |
Commercial real estate and multi-family residential loans: | | | | | | | | | |
Owner occupied loans | |
| 1,849 | |
| 43 | |
| 39 |
Agri-business and agricultural loans: | | | | | | | | | |
Loans secured by farmland | |
| 147 | |
| 3 | |
| 1 |
Consumer 1-4 family mortgage loans: | | | | | | | | | |
Closed end first mortgage loans | |
| 1,643 | |
| 45 | |
| 43 |
Open end and junior lien loans | |
| 268 | |
| 0 | |
| 0 |
Residential construction loans | | | 9 | | | 0 | | | 0 |
Other consumer loans | |
| 21 | |
| 2 | |
| 1 |
Total | | $ | 26,464 | | $ | 770 | | $ | 651 |
76
| Unpaid | Allowance for | ||||
| Principal | Recorded | Loan Losses | |||
| (dollars in thousands) | Balance | Investment | Allocated | ||
| With no related allowance recorded: | |||||
| Commercial and industrial loans: | |||||
| Working capital lines of credit loans | $491 | $491 | $0 | ||
| Non-working capital loans | 2,973 | 1,579 | 0 | ||
| Commercial real estate and multi-family residential loans: | |||||
| Construction and land development loans | 88 | 88 | 0 | ||
| Owner occupied loans | 2,558 | 2,310 | 0 | ||
| Agri-business and agricultural loans: | |||||
| Loans secured by farmland | 603 | 283 | 0 | ||
| Consumer 1-4 family loans: | |||||
| Closed end first mortgage loans | 636 | 570 | 0 | ||
| With an allowance recorded: | |||||
| Commercial and industrial loans: | |||||
| Working capital lines of credit loans | 1,617 | 1,617 | 667 | ||
| Non-working capital loans | 3,292 | 3,292 | 1,400 | ||
| Commercial real estate and multi-family residential loans: | |||||
| Construction and land development loans | 827 | 827 | 350 | ||
| Owner occupied loans | 1,577 | 1,577 | 445 | ||
| Consumer 1-4 family mortgage loans: | |||||
| Closed end first mortgage loans | 950 | 950 | 269 | ||
| Open end and junior lien loans | 235 | 236 | 41 | ||
| Other consumer loans | 50 | 50 | 44 | ||
| Total | $15,897 | $13,870 | $3,216 |
The following table presents loans individually evaluated for impairment by class of loans for the year ended December 31, 2018:
| | | | | | | | | |
|
| | |
|
| |
| Cash Basis | |
| | Average | | Interest | | Interest | |||
| | Recorded | | Income | | Income | |||
(dollars in thousands) | | Investment | | Recognized | | Recognized | |||
With no related allowance recorded: |
| |
|
| |
|
| |
|
Commercial and industrial loans: |
| |
|
| |
|
| |
|
Working capital lines of credit loans | | $ | 785 | | $ | 26 | | $ | 23 |
Non-working capital loans | |
| 1,862 | |
| 74 | |
| 68 |
Commercial real estate and multi-family residential loans: | |
| | | | | | | |
Construction and land development loans | |
| 58 | |
| 5 | |
| 4 |
Owner occupied loans | |
| 2,291 | |
| 36 | |
| 37 |
Agri-business and agricultural loans: | |
| | | | | | | |
Loans secured by farmland | |
| 283 | |
| 0 | |
| 0 |
Consumer 1-4 family loans: | |
| | | | | | | |
Closed end first mortgage loans | |
| 521 | |
| 13 | |
| 12 |
Open end and junior lien loans | |
| 205 | |
| 0 | |
| 0 |
With an allowance recorded: | |
| | | | | | | |
Commercial and industrial loans: | |
| | | | | | | |
Working capital lines of credit loans | |
| 3,307 | |
| 74 | |
| 12 |
Non-working capital loans | |
| 5,328 | |
| 138 | |
| 81 |
Commercial real estate and multi-family residential loans: | |
| | | | | | | |
Construction and land development loans | |
| 453 | |
| 26 | |
| 29 |
Owner occupied loans | |
| 1,631 | |
| 9 | |
| 1 |
Agri-business and agricultural loans: | |
| | | | | | | |
Loans secured by farmland | |
| 12 | |
| 1 | |
| 0 |
Consumer 1-4 family mortgage loans: | |
| | | | | | | |
Closed end first mortgage loans | |
| 1,214 | |
| 37 | |
| 36 |
Open end and junior lien loans | |
| 38 | |
| 0 | |
| 0 |
Other consumer loans | |
| 47 | |
| 3 | |
| 3 |
Total | | $ | 18,035 | | $ | 442 | | $ | 306 |
77
| Cash Basis | |||||
| Average | Interest | Interest | |||
| Recorded | Income | Income | |||
| (dollars in thousands) | Investment | Recognized | Recognized | ||
| With no related allowance recorded: | |||||
| Commercial and industrial loans: | |||||
| Working capital lines of credit loans | $785 | $26 | $23 | ||
| Non-working capital loans | 1,862 | 74 | 68 | ||
| Commercial real estate and multi-family residential loans: | |||||
| Construction and land development loans | 58 | 5 | 4 | ||
| Owner occupied loans | 2,291 | 36 | 37 | ||
| Agri-business and agricultural loans: | |||||
| Loans secured by farmland | 283 | 0 | 0 | ||
| Consumer 1-4 family loans: | |||||
| Closed end first mortgage loans | 521 | 13 | 12 | ||
| Open end and junior lien loans | 205 | 0 | 0 | ||
| With an allowance recorded: | |||||
| Commercial and industrial loans: | |||||
| Working capital lines of credit loans | 3,307 | 74 | 12 | ||
| Non-working capital loans | 5,328 | 138 | 81 | ||
| Commercial real estate and multi-family residential loans: | |||||
| Construction and land development loans | 453 | 26 | 29 | ||
| Owner occupied loans | 1,631 | 9 | 1 | ||
| Agri-business and agricultural loans: | |||||
| Loans secured by farmland | 12 | 1 | 0 | ||
| Consumer 1-4 family mortgage loans: | |||||
| Closed end first mortgage loans | 1,214 | 37 | 36 | ||
| Open end and junior lien loans | 38 | 0 | 0 | ||
| Other consumer loans | 47 | 3 | 3 | ||
| Total | $18,035 | $442 | $306 |
The following table presents loans individually evaluated for impairment by class of loans for the year ended December 31, 2017:
| Cash Basis | |||||
| Average | Interest | Interest | |||
| Recorded | Income | Income | |||
| (dollars in thousands) | Investment | Recognized | Recognized | ||
| With no related allowance recorded: | |||||
| Commercial and industrial loans: | |||||
| Working capital lines of credit loans | $407 | $46 | $39 | ||
| Non-working capital loans | 1,341 | 57 | 51 | ||
| Commercial real estate and multi-family residential loans: | |||||
| Construction and land development loans | 110 | 5 | 5 | ||
| Owner occupied loans | 2,349 | 17 | 15 | ||
| Nonowner occupied loans | 3,009 | 294 | 284 | ||
| Agri-business and agricultural loans: | |||||
| Loans secured by farmland | 287 | 0 | 0 | ||
| Consumer 1-4 family loans: | |||||
| Closed end first mortgage loans | 293 | 9 | 8 | ||
| Open end and junior lien loans | 103 | 0 | 0 | ||
| With an allowance recorded: | |||||
| Commercial and industrial loans: | |||||
| Working capital lines of credit loans | 2,083 | 17 | 17 | ||
| Non-working capital loans | 5,715 | 103 | 103 | ||
| Commercial real estate and multi-family residential loans: | |||||
| Construction and land development loans | 69 | 5 | 0 | ||
| Owner occupied loans | 1,664 | 3 | 2 | ||
| Agri-business and agricultural loans: | |||||
| Loans secured by farmland | 2 | 0 | 0 | ||
| Consumer 1-4 family mortgage loans: | |||||
| Closed end first mortgage loans | 1,006 | 25 | 22 | ||
| Open end and junior lien loans | 80 | 0 | 0 | ||
| Other consumer loans | 52 | 3 | 3 | ||
| Total | $18,570 | $584 | $549 |
| Cash Basis | |||||
| Average | Interest | Interest | |||
| Recorded | Income | Income | |||
| (dollars in thousands) | Investment | Recognized | Recognized | ||
| With no related allowance recorded: | |||||
| Commercial and industrial loans: | |||||
| Working capital lines of credit loans | $331 | $15 | $14 | ||
| Non-working capital loans | 996 | 16 | 13 | ||
| Commercial real estate and multi-family residential loans: | |||||
| Construction and land development loans | 114 | 10 | 10 | ||
| Owner occupied loans | 2,555 | 3 | 3 | ||
| Nonowner occupied loans | 4,732 | 292 | 286 | ||
| Multifamily loans | 8 | 0 | 0 | ||
| Agri-business and agricultural loans: | |||||
| Loans secured by farmland | 393 | 0 | 0 | ||
| Loans for ag production | 677 | 5 | 4 | ||
| Other commercial loans | 1 | 0 | 0 | ||
| Consumer 1-4 family loans: | |||||
| Closed end first mortgage loans | 91 | 2 | 2 | ||
| Open end and junior lien loans | 58 | 0 | 0 | ||
| With an allowance recorded: | |||||
| Commercial and industrial loans: | |||||
| Working capital lines of credit loans | 1,199 | 33 | 30 | ||
| Non-working capital loans | 4,685 | 151 | 151 | ||
| Commercial real estate and multi-family residential loans: | |||||
| Construction and land development loans | 186 | 0 | 0 | ||
| Owner occupied loans | 1,143 | 3 | 3 | ||
| Nonowner occupied loans | 19 | 0 | 0 | ||
| Multifamily loans | 256 | 12 | 11 | ||
| Agri-business and agricultural loans: | |||||
| Other commercial loans | 8 | 0 | 1 | ||
| Consumer 1-4 family mortgage loans: | |||||
| Closed end first mortgage loans | 1,392 | 36 | 34 | ||
| Open end and junior lien loans | 166 | 0 | 0 | ||
| Other consumer loans | 57 | 4 | 4 | ||
| Total | $19,067 | $582 | $566 |
| | | | | | | | | |
|
| | |
|
| |
| Cash Basis | |
| | Average | | Interest | | Interest | |||
| | Recorded | | Income | | Income | |||
(dollars in thousands) | | Investment | | Recognized | | Recognized | |||
With no related allowance recorded: |
| |
|
| |
|
| |
|
Commercial and industrial loans: |
| |
|
| |
|
| |
|
Working capital lines of credit loans | | $ | 407 | | $ | 46 | | $ | 39 |
Non-working capital loans | |
| 1,341 | |
| 57 | |
| 51 |
Commercial real estate and multi-family residential loans: | |
|
| |
|
| |
|
|
Construction and land development loans | |
| 110 | |
| 5 | |
| 5 |
Owner occupied loans | |
| 2,349 | |
| 17 | |
| 15 |
Nonowner occupied loans | |
| 3,009 | |
| 294 | |
| 284 |
Agri-business and agricultural loans: | |
| | | | | | | |
Loans secured by farmland | |
| 287 | |
| 0 | |
| 0 |
Consumer 1‑4 family loans: | |
|
| |
|
| |
|
|
Closed end first mortgage loans | |
| 293 | |
| 9 | |
| 8 |
Open end and junior lien loans | |
| 103 | |
| 0 | |
| 0 |
With an allowance recorded: | |
| | | | | | | |
Commercial and industrial loans: | |
|
| |
|
| |
|
|
Working capital lines of credit loans | |
| 2,083 | |
| 17 | |
| 17 |
Non-working capital loans | |
| 5,715 | |
| 103 | |
| 103 |
Commercial real estate and multi-family residential loans: | |
|
| |
|
| |
|
|
Construction and land development loans | |
| 69 | |
| 5 | |
| 0 |
Owner occupied loans | |
| 1,664 | |
| 3 | |
| 2 |
Agri-business and agricultural loans: | |
| | |
| | |
| |
Loans secured by farmland | |
| 2 | | | 0 | | | 0 |
Consumer 1‑4 family mortgage loans: | |
|
| |
|
| |
|
|
Closed end first mortgage loans | |
| 1,006 | |
| 25 | |
| 22 |
Open end and junior lien loans | |
| 80 | |
| 0 | |
| 0 |
Other consumer loans | |
| 52 | |
| 3 | |
| 3 |
Total | | $ | 18,570 | | $ | 584 | | $ | 549 |
Nonaccrual loans and loans past due 90 days still on accrual include both smaller balance homogeneous loans that are collectively evaluated for impairment and individually classified impaired loans.
78
NOTE 4 - ALLOWANCE FOR LOAN LOSSES AND CREDIT QUALITY (continued)
The following table presents the aging of the recorded investment in past due loans as of December 31, 2019 by class of loans:
| | | | | | | | | | | | | | | | | | |
| | | | | | | | Greater than | | | | | | | | | | |
| | | | | 30‑89 | | 90 Days Past | | | | | Total Past | | | | |||
|
| Loans Not |
| Days |
| Due and Still |
| | |
| Due and |
| | | ||||
(dollars in thousands) | | Past Due | | Past Due | | Accruing | | Nonaccrual | | Nonaccrual | | Total | ||||||
Commercial and industrial loans: |
| |
|
| |
|
| |
|
| |
|
| |
|
| |
|
Working capital lines of credit loans | | $ | 703,737 | | $ | 10 | | $ | 0 | | $ | 6,236 | | $ | 6,246 | | $ | 709,983 |
Non-working capital loans | |
| 710,557 | |
| 4 | |
| 0 | |
| 6,282 | |
| 6,286 | |
| 716,843 |
Commercial real estate and multi-family residential loans: | |
|
| |
|
| |
|
| |
|
| |
|
| |
|
|
Construction and land development loans | |
| 286,534 | |
| 0 | |
| 0 | |
| 0 | |
| 0 | |
| 286,534 |
Owner occupied loans | |
| 569,303 | |
| 0 | |
| 0 | |
| 4,056 | |
| 4,056 | |
| 573,359 |
Nonowner occupied loans | |
| 570,687 | |
| 0 | |
| 0 | |
| 0 | |
| 0 | |
| 570,687 |
Multi-family loans | |
| 240,260 | |
| 0 | |
| 0 | |
| 0 | |
| 0 | |
| 240,260 |
Agri-business and agricultural loans: | |
|
| |
|
| |
|
| |
|
| |
|
| |
|
|
Loans secured by farmland | |
| 173,959 | |
| 0 | |
| 0 | |
| 430 | |
| 430 | |
| 174,389 |
Loans for agricultural production | |
| 205,228 | |
| 0 | |
| 0 | |
| 14 | |
| 14 | |
| 205,242 |
Other commercial loans | |
| 112,166 | |
| 0 | |
| 0 | |
| 0 | |
| 0 | |
| 112,166 |
Consumer 1-4 family mortgage loans: | |
|
| |
|
| |
|
| |
|
| |
|
| |
|
|
Closed end first mortgage loans | |
| 174,902 | |
| 1,099 | |
| 45 | |
| 827 | |
| 1,971 | |
| 176,873 |
Open end and junior lien loans | |
| 187,255 | |
| 188 | |
| 0 | |
| 761 | |
| 949 | |
| 188,204 |
Residential construction loans | |
| 12,870 | |
| 0 | |
| 0 | |
| 52 | |
| 52 | |
| 12,922 |
Other consumer loans | |
| 98,176 | |
| 173 | |
| 0 | |
| 17 | |
| 190 | |
| 98,366 |
Total | | $ | 4,045,634 | | $ | 1,474 | | $ | 45 | | $ | 18,675 | | $ | 20,194 | | $ | 4,065,828 |
79
NOTE 4 - ALLOWANCE FOR LOAN LOSSES AND CREDIT QUALITY (continued)
The following table presents the aging of the recorded investment in past due loans as of December 31, 2018 by class of loans:
| | | | | | | | | | | | | | | | | | |
|
| | |
| | |
| Greater than |
| | |
| | |
| | | |
| | | | | 30‑89 | | 90 Days Past | | | | | Total Past | | | | |||
| | Loans Not | | Days | | Due and Still | | | | | Due and | | | | ||||
(dollars in thousands) | | Past Due | | Past Due | | Accruing | | Nonaccrual | | Nonaccrual | | Total | ||||||
Commercial and industrial loans: |
| |
|
| |
|
| |
|
| |
|
| |
|
| |
|
Working capital lines of credit loans | | $ | 684,191 | | $ | 4,328 | | $ | 0 | | $ | 2,245 | | $ | 6,573 | | $ | 690,764 |
Non-working capital loans | |
| 709,629 | |
| 3,368 | |
| 0 | |
| 1,577 | |
| 4,945 | |
| 714,574 |
Commercial real estate and multi-family residential loans: | |
|
| |
|
| |
|
| |
|
| |
|
| |
|
|
Construction and land development loans | |
| 265,544 | |
| 0 | |
| 0 | |
| 0 | |
| 0 | |
| 265,544 |
Owner occupied loans | |
| 583,214 | |
| 486 | |
| 0 | |
| 2,269 | |
| 2,755 | |
| 585,969 |
Nonowner occupied loans | |
| 520,431 | |
| 57 | |
| 0 | |
| 0 | |
| 57 | |
| 520,488 |
Multi-family loans | |
| 195,164 | |
| 0 | |
| 0 | |
| 0 | |
| 0 | |
| 195,164 |
Agri-business and agricultural loans: | |
|
| |
|
| |
|
| |
|
| |
|
| |
|
|
Loans secured by farmland | |
| 177,080 | |
| 150 | |
| 0 | |
| 283 | |
| 433 | |
| 177,513 |
Loans for agricultural production | |
| 193,094 | |
| 0 | |
| 0 | |
| 0 | |
| 0 | |
| 193,094 |
Other commercial loans | |
| 95,520 | |
| 0 | |
| 0 | |
| 0 | |
| 0 | |
| 95,520 |
Consumer 1-4 family mortgage loans: | |
|
| |
|
| |
|
| |
|
| |
|
| |
|
|
Closed end first mortgage loans | |
| 183,420 | |
| 1,370 | |
| 0 | |
| 671 | |
| 2,041 | |
| 185,461 |
Open end and junior lien loans | |
| 188,320 | |
| 98 | |
| 0 | |
| 220 | |
| 318 | |
| 188,638 |
Residential construction loans | |
| 16,194 | |
| 0 | |
| 0 | |
| 0 | |
| 0 | |
| 16,194 |
Other consumer loans | |
| 85,654 | |
| 168 | |
| 0 | |
| 0 | |
| 168 | |
| 85,822 |
Total | | $ | 3,897,455 | | $ | 10,025 | | $ | 0 | | $ | 7,265 | | $ | 17,290 | | $ | 3,914,745 |
80
| Greater than | |||||||||||
| 30-89 | 90 Days Past | Total Past | |||||||||
| Loans Not | Days | Due and Still | Due and | ||||||||
| (dollars in thousands) | Past Due | Past Due | Accruing | Nonaccrual | Nonaccrual | Total | |||||
| Commercial and industrial loans: | |||||||||||
| Working capital lines of credit loans | $684,191 | $4,328 | $0 | $2,245 | $6,573 | $690,764 | |||||
| Non-working capital loans | 709,629 | 3,368 | 0 | 1,577 | 4,945 | 714,574 | |||||
| Commercial real estate and multi-family | |||||||||||
| residential loans: | |||||||||||
| Construction and land development loans | 265,544 | 0 | 0 | 0 | 0 | 265,544 | |||||
| Owner occupied loans | 583,214 | 486 | 0 | 2,269 | 2,755 | 585,969 | |||||
| Nonowner occupied loans | 520,431 | 57 | 0 | 0 | 57 | 520,488 | |||||
| Multi-family loans | 195,164 | 0 | 0 | 0 | 0 | 195,164 | |||||
| Agri-business and agricultural loans: | |||||||||||
| Loans secured by farmland | 177,080 | 150 | 0 | 283 | 433 | 177,513 | |||||
| Loans for agricultural production | 193,094 | 0 | 0 | 0 | 0 | 193,094 | |||||
| Other commercial loans | 95,520 | 0 | 0 | 0 | 0 | 95,520 | |||||
| Consumer 1-4 family mortgage loans: | |||||||||||
| Closed end first mortgage loans | 183,420 | 1,370 | 0 | 671 | 2,041 | 185,461 | |||||
| Open end and junior lien loans | 188,320 | 98 | 0 | 220 | 318 | 188,638 | |||||
| Residential construction loans | 16,194 | 0 | 0 | 0 | 0 | 16,194 | |||||
| Other consumer loans | 85,654 | 168 | 0 | 0 | 168 | 85,822 | |||||
| Total | $3,897,455 | $10,025 | $0 | $7,265 | $17,290 | $3,914,745 |
| Greater than | |||||||||||
| 30-89 | 90 Days Past | Total Past | |||||||||
| Loans Not | Days | Due and Still | Due and | ||||||||
| (dollars in thousands) | Past Due | Past Due | Accruing | Nonaccrual | Nonaccrual | Total | |||||
| Commercial and industrial loans: | |||||||||||
| Working capital lines of credit loans | $742,205 | $11 | $0 | $1,459 | $1,470 | $743,675 | |||||
| Non-working capital loans | 671,490 | 0 | 0 | 3,462 | 3,462 | 674,952 | |||||
| Commercial real estate and multi-family | |||||||||||
| residential loans: | |||||||||||
| Construction and land development loans | 215,713 | 8,000 | 0 | 0 | 8,000 | 223,713 | |||||
| Owner occupied loans | 534,648 | 0 | 0 | 3,620 | 3,620 | 538,268 | |||||
| Nonowner occupied loans | 507,696 | 0 | 0 | 0 | 0 | 507,696 | |||||
| Multi-family loans | 173,100 | 244 | 0 | 0 | 244 | 173,344 | |||||
| Agri-business and agricultural loans: | |||||||||||
| Loans secured by farmland | 186,160 | 0 | 0 | 283 | 283 | 186,443 | |||||
| Loans for agricultural production | 196,483 | 0 | 0 | 0 | 0 | 196,483 | |||||
| Other commercial loans | 123,922 | 0 | 0 | 0 | 0 | 123,922 | |||||
| Consumer 1-4 family mortgage loans: | |||||||||||
| Closed end first mortgage loans | 177,410 | 1,183 | 6 | 342 | 1,531 | 178,941 | |||||
| Open end and junior lien loans | 183,056 | 89 | 0 | 236 | 325 | 183,381 | |||||
| Residential construction loans | 13,447 | 0 | 0 | 0 | 0 | 13,447 | |||||
| Other consumer loans | 74,102 | 92 | 0 | 0 | 92 | 74,194 | |||||
| Total | $3,799,432 | $9,619 | $6 | $9,402 | $19,027 | $3,818,459 |
Troubled Debt Restructurings:
Troubled debt restructured loans are included in the totals for impaired loans. The Company has allocated $3.7$2.5 million and $2.3$3.7 million of specific reserves to customers whose loan terms have been modified in troubled debt restructurings as of December 31, 20182019 and 2017.2018. The Company is not committed to lend additional funds to debtors whose loans have been modified in a troubled debt restructuring.
| (dollars in thousands) | 2018 | 2017 | |
| Accruing troubled debt restructured loans | $8,016 | $2,893 | |
| Nonaccrual troubled debt restructured loans | 4,384 | 7,750 | |
| Total troubled debt restructured loans | $12,400 | $10,643 |
| | | | | | |
(dollars in thousands) |
| 2019 |
| 2018 | ||
Accruing troubled debt restructured loans | | $ | 5,909 | | $ | 8,016 |
Nonaccrual troubled debt restructured loans | |
| 3,188 | |
| 4,384 |
Total troubled debt restructured loans | | $ | 9,097 | | $ | 12,400 |
During the year ending December 31, 2019, certain loans were modified as troubled debt restructurings. The modified terms of these loans include one or a combination of the following: inadequate compensation for the terms of the restructure or renewal; a modification of the repayment terms which delays principal repayment for some period; or renewal terms offered to borrowers in financial distress where no additional credit enhancements were obtained at the time of renewal.
Additional concessions were granted to borrowers during 2019 with previously identified troubled debt restructured loans. There were three commercial real estate loans with recorded investments totaling $1.9 million and five commercial and industrial loans with recorded investments totaling $2.4 million where the collateral values or cash flows were insufficient to support the loans. These troubled debt restructured loans with additional concessions decreased the allowance by $484,000 and resulted in no charge-offs for year ending December 31, 2019. These concessions are not included in the table below.
The following table presents loans by class modified as new troubled debt restructurings that occurred during the year ending December 31, 2019:
| | | | | | | | | | | | |
|
| |
| | |
| | |
| Modified Repayment Terms | ||
| | | | Pre-Modification | | Post-Modification | | | | Extension | ||
| | | | Outstanding | | Outstanding | | | | Period or | ||
| | Number of | | Recorded | | Recorded | | Number of | | Range | ||
(dollars in thousands) |
| Loans |
| Investment |
| Investment |
| Loans |
| (in months) | ||
Troubled Debt Restructurings Commercial and industrial loans: |
|
|
| |
|
| |
|
|
|
|
|
Working capital lines of credit loans |
| 1 | | $ | 35 | | $ | 35 |
| 1 |
| 1 |
Total |
| 1 | | $ | 35 | | $ | 35 |
| 1 |
| 1 |
For the period ending December 31, 2019, the working capital line of credit loan troubled debt restructuring described above had no impact to the allowance and no charge-offs were recorded.
During the year ending December 31, 2018, certain loans were modified as troubled debt restructurings. The modified terms of these loans include one or a combination of the following: inadequate compensation for the terms of the restructure or renewal; a modification of the repayment terms which delays principal repayment for some period; or renewal terms offered to borrowers in financial distress where no additional credit enhancements were obtained at the time of renewal.
Additional concessions were granted to borrowers during 2018 with previously identified troubled debt restructured loans. There were three commercial real estate loans with recorded investments totaling $1.3 million and three commercial and industrial loans with recorded investments totaling $1.4 million where the collateral value and/or cash flows do not support those loans. The other three loans are to borrowers for investments in land for residential development which have not had sales activity to support loans with a recorded investments totaling $593,000. These troubled debt restructured loans with additional concessions increased the allowance by $189,000 and resulted in no charge-offs for year ending December 31, 2018. These concessions are not included in the table below.
81
NOTE 4 - ALLOWANCE FOR LOAN LOSSES AND CREDIT QUALITY (continued)
The following table presents loans by class modified as new troubled debt restructurings that occurred during the year ending December 31, 2018:
| Modified Repayment Terms | |||||||||
| Pre-Modification | Post-Modification | Extension | |||||||
| Outstanding | Outstanding | Period or | |||||||
| Number of | Recorded | Recorded | Number of | Range | |||||
| (dollars in thousands) | Loans | Investment | Investment | Loans | (in months) | ||||
| Troubled Debt Restructurings | |||||||||
| Commercial and industrial loans: | |||||||||
| Working capital lines of credit loans | 1 | $600 | $600 | 1 | 0 | ||||
| Non-working capital loans | 7 | 4,628 | 4,628 | 7 | 0-6 | ||||
| Commercial real estate and multi- | |||||||||
| family residential loans: | |||||||||
| Construction and land | |||||||||
| development loans | 1 | 824 | 824 | 1 | 12 | ||||
| Owner occupied loans | 2 | 933 | 933 | 2 | 12 | ||||
| Consumer 1-4 family loans: | |||||||||
| Closed end first mortgage loans | 1 | 198 | 197 | 1 | 239 | ||||
| Total | 12 | $7,183 | $7,182 | 12 | 0-239 | ||||
| | | | | | | | | | | | |
| | | | | | | | | | Modified Repayment Terms | ||
|
| |
| Pre-Modification |
| Post-Modification |
| |
| Extension | ||
| | | | Outstanding | | Outstanding | | | | Period or | ||
| | Number of | | Recorded | | Recorded | | Number of | | Range | ||
(dollars in thousands) | | Loans | | Investment | | Investment | | Loans | | (in months) | ||
Troubled Debt Restructurings Commercial and industrial loans: |
|
|
| |
|
| |
|
|
|
|
|
Working capital lines of credit loans |
| 1 | | $ | 600 | | $ | 600 |
| 1 |
| 0 |
Non-working capital loans |
| 7 | |
| 4,628 | |
| 4,628 |
| 7 |
| 0‑6 |
Commercial real estate and multi-family residential loans: |
|
| |
|
| |
|
|
|
|
|
|
Construction and land development loans | | 1 | |
| 824 | |
| 824 |
| 1 |
| 12 |
Owner occupied loans |
| 2 | |
| 933 | |
| 933 |
| 2 |
| 12 |
Consumer 1-4 family loans: |
|
| |
|
| |
|
|
|
|
|
|
Closed end first mortgage loans |
| 1 | |
| 198 | |
| 197 |
| 1 |
| 239 |
Total |
| 12 | | $ | 7,183 | | $ | 7,182 |
| 12 |
| 0‑239 |
Additional concessions were granted to borrowers during 2017 with previously identified troubled debt restructured loans. There were four loans for commercial real estate buildings where the collateral value and cash flows from the companies occupying the buildings do not support the loans with recorded investments of $1.9 million. There were five loans for commercial and industrial non-working capital loans with recorded investments of $2.5 million. These concessions are not included in table below.
The following table presents loans by class modified as new troubled debt restructurings that occurred during the year ending December 31, 2017:
| Pre-Modification | Post-Modification | Extension | |||||||
| Outstanding | Outstanding | Period or | |||||||
| Number of | Recorded | Recorded | Number of | Range | |||||
| (dollars in thousands) | Loans | Investment | Investment | Loans | (in months) | ||||
| Troubled Debt Restructurings | |||||||||
| Commercial and industrial loans: | |||||||||
| Working capital lines of credit loans | 1 | $1,324 | $1,324 | 1 | 9 | ||||
| Non-working capital loans | 4 | 1,922 | 1,922 | 4 | 0-6 | ||||
| Commercial real estate and multi- | |||||||||
| family residential loans: | |||||||||
| Owner occupied loans | 1 | 486 | 486 | 1 | 6 | ||||
| Consumer 1-4 family loans: | |||||||||
| Closed end first mortgage loans | 2 | 120 | 122 | 2 | 198-350 | ||||
| Total | 8 | $3,852 | $3,854 | 8 | 0-350 |
| | | | | | | | | | | | |
| | | | | | | | | | Modified Repayment Terms | ||
|
| |
| Pre-Modification |
| Post-Modification |
| |
| Extension | ||
| | | | Outstanding | | Outstanding | | | | Period or | ||
| | Number of | | Recorded | | Recorded | | Number of | | Range | ||
(dollars in thousands) | | Loans | | Investment | | Investment | | Loans | | (in months) | ||
Troubled Debt Restructurings Commercial and industrial loans: |
|
|
| |
|
| |
|
|
|
|
|
Working capital lines of credit loans |
| 1 | | $ | 1,324 | | $ | 1,324 |
| 1 |
| 9 |
Non-working capital loans |
| 4 | |
| 1,922 | |
| 1,922 |
| 4 |
| 0‑6 |
Commercial real estate and multi-family residential loans: |
|
| |
|
| |
|
|
|
|
|
|
Owner occupied loans |
| 1 | |
| 486 | |
| 486 |
| 1 |
| 6 |
Consumer 1-4 family loans: | |
| |
|
| |
|
|
|
|
|
|
Closed end first mortgage loans | | 2 | |
| 120 | |
| 122 |
| 2 |
| 198‑350 |
Total | | 8 | | $ | 3,852 | | $ | 3,854 |
| 8 |
| 0‑350 |
For the period ending December 31, 2017, the commercial and industrial troubled debt restructurings described above increased the allowance for loan losses by $513,000 and the commercial real estate and multi-family residential loan troubled debt restructurings increased the allowance for loan losses by $27,000.
82
A loan is considered to be in payment default once it is 30 days contractually past due under the modified terms. The following table presents loans by class modified as new troubled debt restructurings that occurred during the year ending December 31, 2016:
| Pre-Modification | Post-Modification | Extension | |||||||
| Outstanding | Outstanding | Period or | |||||||
| Number of | Recorded | Recorded | Number of | Range | |||||
| (dollars in thousands) | Loans | Investment | Investment | Loans | (in months) | ||||
| Troubled Debt Restructurings | |||||||||
| Commercial and industrial loans: | |||||||||
| Non-working capital loans | 6 | $1,841 | $1,902 | 5 | 9-356 | ||||
| Commercial real estate and multi- | |||||||||
| family residential loans: | |||||||||
| Owner occupied loans | 3 | 718 | 717 | 3 | 13-24 | ||||
| Total | 9 | $2,559 | $2,619 | 8 | 9-356 |
| | | | | | | | | | | | | | | |
|
| 2019 |
| 2018 |
| 2017 | |||||||||
|
| Number of |
| Recorded |
| Number of |
| Recorded |
| Number of |
| Recorded | |||
(dollars in thousands) | | Loans | | Investment | | Loans | | Investment | | Loans | | Investment | |||
Troubled Debt Restructurings that Subsequently Defaulted Commercial and industrial loans: | |
|
| |
| |
|
| |
| |
|
| |
|
Non-working capital loans | | 1 | | $ | 601 | | 0 | | $ | 0 | | 0 | | $ | 0 |
Total | | 1 | | $ | 601 | | 0 | | $ | 0 | | 0 | | $ | 0 |
Credit Quality Indicators:
The Company categorizes loans into risk categories based on relevant information about the ability of borrowers to service their debt such as: current financial information, historical payment experience, credit documentation, public information, and current economic trends, among other factors. The Company analyzes commercial loans individually by classifying the loans as to credit risk. This analysis is performed on a quarterly basis for Special Mention, Substandard and Doubtful grade loans and annually on Pass grade loans over $250,000.
The Company uses the following definitions for risk ratings:
Special Mention.
Loans classified as Special Mention have a potential weakness that deserves management’s close attention. If left uncorrected, these potential weaknesses may result in deterioration of the repayment prospects for the loan or of the institution’s credit position at some future date.Substandard.
Loans classified as Substandard are inadequately protected by the current net worth and paying capacity of the obligor or of the collateral pledged, if any. Loans so classified have a well-defined weakness or weaknesses that jeopardize the liquidation of the debt. They are characterized as the distinct possibility that the institution will sustain some loss if the deficiencies are not corrected.Doubtful.
Loans classified as Doubtful have all the weaknesses inherent in those classified as Substandard, with the added characteristics that the weaknesses make collection or liquidation in full, on the basis of currently existing facts, conditions, and values, highly questionable and improbable.Loans not meeting the criteria above that are analyzed individually as part of the above-described process are considered to be Pass rated loans with the exception of consumer troubled debt restructurings which are evaluated and listed with Substandard consumer loans and consumer nonaccrual loans which are evaluated individually and listed with Not Rated loans. Loans listed as Not Rated are consumer loans or commercial loans with consumer characteristics included in groups of homogenous loans which are analyzed for credit quality indicators utilizing delinquency status.
83
NOTE 4 - ALLOWANCE FOR LOAN LOSSES AND CREDIT QUALITY (continued)
As of December 31, 2019, and based on the most recent analysis performed, the risk category of loans by class of loans is as follows:
| | | | | | | | | | | | | | | | | | |
|
| | |
| Special |
|
| |
|
| |
| Not |
|
| | ||
(dollars in thousands) | | Pass | | Mention | | Substandard | | Doubtful | | Rated | | Total | ||||||
Commercial and industrial loans: |
| |
|
| |
|
| |
|
| |
|
| |
|
| |
|
Working capital lines of credit loans | | $ | 631,728 | | $ | 40,551 | | $ | 37,278 | | $ | 0 | | $ | 426 | | $ | 709,983 |
Non-working capital loans | |
| 673,370 | |
| 18,782 | |
| 19,381 | |
| 0 | |
| 5,310 | |
| 716,843 |
Commercial real estate and multi-family residential loans: | |
|
| |
|
| |
|
| |
|
| |
|
| |
|
|
Construction and land development loans | |
| 286,534 | |
| 0 | |
| 0 | |
| 0 | |
| 0 | |
| 286,534 |
Owner occupied loans | |
| 535,496 | |
| 14,804 | |
| 23,059 | |
| 0 | |
| 0 | |
| 573,359 |
Nonowner occupied loans | |
| 569,315 | |
| 781 | |
| 591 | |
| 0 | |
| 0 | |
| 570,687 |
Multi-family loans | |
| 240,260 | |
| 0 | |
| 0 | |
| 0 | |
| 0 | |
| 240,260 |
Agri-business and agricultural loans: | |
|
| |
|
| |
|
| |
|
| |
|
| |
|
|
Loans secured by farmland | |
| 165,005 | |
| 7,952 | |
| 1,432 | |
| 0 | |
| 0 | |
| 174,389 |
Loans for agricultural production | |
| 191,489 | |
| 13,738 | |
| 15 | |
| 0 | |
| 0 | |
| 205,242 |
Other commercial loans | |
| 112,166 | |
| 0 | |
| 0 | |
| 0 | |
| 0 | |
| 112,166 |
Consumer 1-4 family mortgage loans: | |
|
| |
|
| |
|
| |
|
| |
|
| |
|
|
Closed end first mortgage loans | |
| 47,405 | |
| 0 | |
| 1,976 | |
| 0 | |
| 127,492 | |
| 176,873 |
Open end and junior lien loans | |
| 10,845 | |
| 0 | |
| 762 | |
| 0 | |
| 176,597 | |
| 188,204 |
Residential construction loans | |
| 0 | |
| 0 | |
| 51 | |
| 0 | |
| 12,871 | |
| 12,922 |
Other consumer loans | |
| 27,250 | |
| 0 | |
| 17 | |
| 0 | |
| 71,099 | |
| 98,366 |
Total | | $ | 3,490,863 | | $ | 96,608 | | $ | 84,562 | | $ | 0 | | $ | 393,795 | | $ | 4,065,828 |
As of December 31, 2018, and based on the most recent analysis performed, the risk category of loans by class of loans is as follows:
| | | | | | | | | | | | | | | | | | |
|
| | |
| Special |
|
| |
|
| |
| Not |
|
| | ||
(dollars in thousands) | | Pass | | Mention | | Substandard | | Doubtful | | Rated | | Total | ||||||
Commercial and industrial loans: |
| |
|
| |
|
| |
|
| |
|
| |
|
| |
|
Working capital lines of credit loans | | $ | 618,612 | | $ | 43,240 | | $ | 28,563 | | $ | 0 | | $ | 349 | | $ | 690,764 |
Non-working capital loans | |
| 664,787 | |
| 15,992 | |
| 27,548 | |
| 0 | |
| 6,247 | |
| 714,574 |
Commercial real estate and multi-family residential loans: | |
|
| |
|
| |
|
| |
|
| |
|
| |
|
|
Construction and land development loans | |
| 264,900 | |
| 353 | |
| 291 | |
| 0 | |
| 0 | |
| 265,544 |
Owner occupied loans | |
| 541,734 | |
| 21,864 | |
| 22,371 | |
| 0 | |
| 0 | |
| 585,969 |
Nonowner occupied loans | |
| 517,356 | |
| 2,491 | |
| 641 | |
| 0 | |
| 0 | |
| 520,488 |
Multi-family loans | |
| 194,948 | |
| 216 | |
| 0 | |
| 0 | |
| 0 | |
| 195,164 |
Agri-business and agricultural loans: | |
|
| |
|
| |
|
| |
|
| |
|
| |
|
|
Loans secured by farmland | |
| 166,623 | |
| 9,107 | |
| 1,783 | |
| 0 | |
| 0 | |
| 177,513 |
Loans for agricultural production | |
| 183,189 | |
| 8,155 | |
| 1,750 | |
| 0 | |
| 0 | |
| 193,094 |
Other commercial loans | |
| 95,516 | |
| 0 | |
| 0 | |
| 0 | |
| 4 | |
| 95,520 |
Consumer 1-4 family mortgage loans: | |
|
| |
|
| |
|
| |
|
| |
|
| |
|
|
Closed end first mortgage loans | |
| 54,879 | |
| 0 | |
| 2,021 | |
| 0 | |
| 128,561 | |
| 185,461 |
Open end and junior lien loans | |
| 8,810 | |
| 0 | |
| 220 | |
| 0 | |
| 179,608 | |
| 188,638 |
Residential construction loans | |
| 0 | |
| 0 | |
| 0 | |
| 0 | |
| 16,194 | |
| 16,194 |
Other consumer loans | |
| 12,700 | |
| 0 | |
| 44 | |
| 0 | |
| 73,078 | |
| 85,822 |
Total | | $ | 3,324,054 | | $ | 101,418 | | $ | 85,232 | | $ | 0 | | $ | 404,041 | | $ | 3,914,745 |
84
| Special | Not | ||||||||||
| (dollars in thousands) | Pass | Mention | Substandard | Doubtful | Rated | Total | |||||
| Commercial and industrial loans: | |||||||||||
| Working capital lines of credit loans | $618,612 | $43,240 | $28,563 | $0 | $349 | $690,764 | |||||
| Non-working capital loans | 664,787 | 15,992 | 27,548 | 0 | 6,247 | 714,574 | |||||
| Commercial real estate and multi- | |||||||||||
| family residential loans: | |||||||||||
| Construction and land | |||||||||||
| development loans | 264,900 | 353 | 291 | 0 | 0 | 265,544 | |||||
| Owner occupied loans | 541,734 | 21,864 | 22,371 | 0 | 0 | 585,969 | |||||
| Nonowner occupied loans | 517,356 | 2,491 | 641 | 0 | 0 | 520,488 | |||||
| Multi-family loans | 194,948 | 216 | 0 | 0 | 0 | 195,164 | |||||
| Agri-business and agricultural loans: | |||||||||||
| Loans secured by farmland | 166,623 | 9,107 | 1,783 | 0 | 0 | 177,513 | |||||
| Loans for agricultural production | 183,189 | 8,155 | 1,750 | 0 | 0 | 193,094 | |||||
| Other commercial loans | 95,516 | 0 | 0 | 0 | 4 | 95,520 | |||||
| Consumer 1-4 family mortgage loans: | |||||||||||
| Closed end first mortgage loans | 54,879 | 0 | 2,021 | 0 | 128,561 | 185,461 | |||||
| Open end and junior lien loans | 8,810 | 0 | 220 | 0 | 179,608 | 188,638 | |||||
| Residential construction loans | 0 | 0 | 0 | 0 | 16,194 | 16,194 | |||||
| Other consumer loans | 12,700 | 0 | 44 | 0 | 73,078 | 85,822 | |||||
| Total | $3,324,054 | $101,418 | $85,232 | $0 | $404,041 | $3,914,745 |
| Special | Not | ||||||||||
| (dollars in thousands) | Pass | Mention | Substandard | Doubtful | Rated | Total | |||||
| Commercial and industrial loans: | |||||||||||
| Working capital lines of credit loans | $688,748 | $33,337 | $21,350 | $0 | $240 | $743,675 | |||||
| Non-working capital loans | 624,275 | 20,171 | 25,834 | 0 | 4,672 | 674,952 | |||||
| Commercial real estate and multi- | |||||||||||
| family residential loans: | |||||||||||
| Construction and land | |||||||||||
| development loans | 222,445 | 441 | 827 | 0 | 0 | 223,713 | |||||
| Owner occupied loans | 496,231 | 19,361 | 22,676 | 0 | 0 | 538,268 | |||||
| Nonowner occupied loans | 505,033 | 1,970 | 693 | 0 | 0 | 507,696 | |||||
| Multi-family loans | 173,100 | 244 | 0 | 0 | 0 | 173,344 | |||||
| Agri-business and agricultural loans: | |||||||||||
| Loans secured by farmland | 174,118 | 7,988 | 4,337 | 0 | 0 | 186,443 | |||||
| Loans for agricultural production | 185,772 | 9,716 | 995 | 0 | 0 | 196,483 | |||||
| Other commercial loans | 123,917 | 0 | 0 | 0 | 5 | 123,922 | |||||
| Consumer 1-4 family mortgage loans: | |||||||||||
| Closed end first mortgage loans | 52,301 | 0 | 1,520 | 0 | 125,120 | 178,941 | |||||
| Open end and junior lien loans | 8,259 | 0 | 236 | 0 | 174,886 | 183,381 | |||||
| Residential construction loans | 0 | 0 | 0 | 0 | 13,447 | 13,447 | |||||
| Other consumer loans | 18,642 | 0 | 50 | 0 | 55,502 | 74,194 | |||||
| Total | $3,272,841 | $93,228 | $78,518 | $0 | $373,872 | $3,818,459 | |||||
NOTE 5
– FAIR VALUEFair value is the exchange price that would be received for an asset or paid to transfer a liability (exit price) in the principal or most advantageous market for the asset or liability in an orderly transaction between market participants on the measurement date. There are three levels of inputs that may be used to measure fair values:
Level 1 Quoted prices (unadjusted) for identical assets or liabilities in active markets that the entity has the ability to access as of the measurement date.
Level 2 Significant other observable inputs other than Level 1 prices such as quoted prices for similar assets or liabilities; quoted prices in markets that are not active; or other inputs that are observable or can be corroborated by observable market data.
Level 3 Significant unobservable inputs that reflect a company’s own assumptions about the assumptions that market participants would use in pricing an asset or liability.
The Company used the following methods and significant assumptions to estimate the fair value of each type of financial instrument:
Securities:
SecuritiesThe Company’s Finance Department, which is responsible for all accounting and SEC compliance, and the Company’s Treasury Department, which is responsible for investment portfolio management and asset/liability modeling, are the two areas that determine the Company’s valuation policies and procedures. Both of these areas report directly to the Executive Vice President and Chief Financial Officer of the Company. For assets or liabilities that may be considered for Level 3 fair value measurement on a recurring basis, these two departments and the Executive Vice President and Chief Financial Officer determine the appropriate level of the assets or liabilities under consideration. If there are assets or liabilities that are determined to be Level 3 by this group, the Risk Management Committee of the Company and the Audit Committee of the Boardboard of directors (the “Board”) are made aware of such assets at their next scheduled meeting.
Securities pricing is obtained on securities from a third party pricing service and all security prices are tested annually against prices from another third party provider and reviewed with a market value price tolerance variance that varies by sector: municipal securities +/- 5%, government mbs/cmo +/- 3% and U.S. treasuries +/-1%. If any securities fall outside the tolerance threshold and have a variance of $100,000 or more, a determination of materiality is made for the amount over the threshold. Any security that would have a material threshold difference would be further investigated to determine why the variance exists and if any action is needed concerning the security pricing for that individual security. Changes in market value are reviewed monthly in aggregate by security type and any material differences are reviewed to determine why they exist. At least annually, the pricing methodology of the pricing service is received and reviewed to support the fair value levels used by the Company. A detailed pricing evaluation is requested and reviewed on any security determined to be fair valued using unobservable inputs by the pricing service.
Mortgage banking derivative:
The fair values of mortgage banking derivatives are based on observable market data as of the measurement date (Level 2).
85
NOTE 5 – FAIR VALUE (continued)
Interest rate swap derivatives: Our derivatives are traded in an over-the-counter market where quoted market prices are not always available. Therefore, the fair values of derivatives are determined using quantitative models that utilize multiple market inputs. The inputs will vary based on the type of derivative, but could include interest rates, prices and indices to generate continuous yield or pricing curves, prepayment rates, and volatility factors to value the position. The majority of market inputs are actively quoted and can be validated through external sources, including brokers, market transactions and third-party pricing services. The fair value of interest rate swap derivatives is determined by pricing or valuation models using observable market data as of the measurement date (Level 2).
Impaired loans:
Impaired loans with specific allocations of the allowance for loan losses are generally based on the fair value of the underlying collateral if repayment is expected solely from the collateral. Fair value is determined using several methods. Generally, the fair value of real estate is based on appraisals by qualified third party appraisers. These appraisals may utilize a single valuation approach or a combination of approaches including comparable sales and the income approach. Adjustments are routinely made in the appraisal process by the appraisers to adjust for differences between the comparable sales and income data available. Such adjustments are usually significant and result in a Level 3 classification of the inputs for determining fair value. In addition, theMortgage servicing rights:
As of December 31,At December 31, 2018,2019, the sensitivity of the current fair value of MSRs to an immediate 10% and 20% adverse change in the PSA and discount rate was ($94,000)124,000) and ($183,000)242,000), respectively for the PSA, and was ($186,000)170,000) and ($358,000)329,000), respectively for the discount rate. These sensitivities are hypothetical and should not be relied upon. As the figures indicate, changes in value based on a 10% and 20% variation in assumptions generally cannot be extrapolated because the relationship of the change in assumption to the change in value may not be linear. Also, in this example, the effect of a variation in a particular assumption on the value of the MSR is calculated without changing any other assumption; however, in reality, changes in one factor may result in changes in another (for example, increases in market interest rates may result in lower prepayments), which might magnify or counteract the sensitivities.
86
NOTE 5 – FAIR VALUE (continued)
Other real estate owned: Nonrecurring adjustments to certain commercial and residential real estate properties classified as other real estate owned are measured at the lower of carrying amount or fair value less costs to sell. Fair values are generally based on third party appraisals of the property and are reviewed by the Company’s internal appraisal officer. Adjustments are routinely made in the appraisal process by the appraisers to adjust for differences between the comparable properties used to determine value. Such adjustments are usually significant and result in a Level 3 classification. In addition, the Company’s management may apply discount factors to the appraisals to take into account changing business factors and market conditions, as well as value impairment in cases where the appraisal date predates a likely change in market conditions. In cases where the carrying amount exceeds the fair value, less costs to sell, an impairment loss is recognized.
Real estate mortgage loans held for sale
The table below presents the balances of assets and liabilities measured at fair value on a recurring basis:
| December 31, 2018 | |||||||
| Fair Value Measurements Using | Assets | ||||||
| (dollars in thousands) | Level 1 | Level 2 | Level 3 | at Fair Value | |||
| Assets | |||||||
| U.S. Treasury securities | $987 | $0 | $0 | $987 | |||
| U.S. government sponsored agency securities | 0 | 4,350 | 0 | 4,350 | |||
| Mortgage-backed securities: residential | 0 | 325,412 | 0 | 325,412 | |||
| Mortgage-backed securities: commercial | 0 | 38,141 | 0 | 38,141 | |||
| State and municipal securities | 0 | 216,509 | 150 | 216,659 | |||
| Total Securities | 987 | 584,412 | 150 | 585,549 | |||
| Mortgage banking derivative | 0 | 95 | 0 | 95 | |||
| Interest rate swap derivative | 0 | 3,869 | 0 | 3,869 | |||
| Total assets | $987 | $588,376 | $150 | $589,513 | |||
| Liabilities | |||||||
| Mortgage banking derivative | 0 | 23 | 0 | 23 | |||
| Interest rate swap derivative | 0 | 4,025 | 0 | 4,025 | |||
| Total liabilities | $0 | $4,048 | $0 | $4,048 | |||
| December 31, 2017 | |||||||
| Fair Value Measurements Using | Assets | ||||||
| (dollars in thousands) | Level 1 | Level 2 | Level 3 | at Fair Value | |||
| Assets | |||||||
| U.S. Treasury securities | $997 | $0 | $0 | $997 | |||
| U.S. government sponsored agency securities | 0 | 5,122 | 0 | 5,122 | |||
| Mortgage-backed securities: residential | 0 | 313,774 | 0 | 313,774 | |||
| Mortgage-backed securities: commercial | 0 | 44,211 | 0 | 44,211 | |||
| State and municipal securities | 0 | 173,509 | 880 | 174,389 | |||
| Total Securities | 997 | 536,616 | 880 | 538,493 | |||
| Mortgage banking derivative | 0 | 136 | 0 | 136 | |||
| Interest rate swap derivative | 0 | 2,441 | 0 | 2,441 | |||
| Total assets | $997 | $539,193 | $880 | $541,070 | |||
| Liabilities | |||||||
| Mortgage banking derivative | 0 | 3 | 0 | 3 | |||
| Interest rate swap derivative | 0 | 2,562 | 0 | 2,562 | |||
| Total liabilities | $0 | $2,565 | $0 | $2,565 | |||
| | | | | | | | | | | | |
|
| December 31, 2019 | ||||||||||
|
| Fair Value Measurements Using | | Assets | ||||||||
(dollars in thousands) |
| Level 1 |
| Level 2 |
| Level 3 |
| at Fair Value | ||||
Assets: | | | | | | | | | | | | |
Mortgage-backed securities: residential | | $ | 0 | | $ | 288,181 | | $ | 0 | | $ | 288,181 |
Mortgage-backed securities: commercial | |
| 0 | |
| 36,972 | |
| 0 | |
| 36,972 |
State and municipal securities | |
| 0 | |
| 282,935 | |
| 145 | |
| 283,080 |
Total Securities | |
| 0 | |
| 608,088 | |
| 145 | |
| 608,233 |
Mortgage banking derivative | |
| 0 | |
| 198 | |
| 0 | |
| 198 |
Interest rate swap derivative | |
| 0 | |
| 7,263 | |
| 0 | |
| 7,263 |
Total assets | | $ | 0 | | $ | 615,549 | | $ | 145 | | $ | 615,694 |
| | | | | | | | | | | | |
Liabilities: | | | | | | | | | | | | |
Mortgage banking derivative | |
| 0 | |
| 14 | |
| 0 | |
| 14 |
Interest rate swap derivative | |
| 0 | |
| 7,860 | |
| 0 | |
| 7,860 |
Total liabilities | | $ | 0 | | $ | 7,874 | | $ | 0 | | $ | 7,874 |
| | | | | | | | | | | | |
|
| December 31, 2018 | ||||||||||
| | Fair Value Measurements Using | | Assets | ||||||||
(dollars in thousands) |
| Level 1 |
| Level 2 |
| Level 3 |
| at Fair Value | ||||
Assets: |
| |
|
| |
|
| |
|
| |
|
U.S. Treasury securities | | $ | 987 | | $ | 0 | | $ | 0 | | $ | 987 |
U.S. government sponsored agency securities | |
| 0 | |
| 4,350 | |
| 0 | |
| 4,350 |
Mortgage-backed securities: residential | |
| 0 | |
| 325,412 | |
| 0 | |
| 325,412 |
Mortgage-backed securities: commercial | |
| 0 | |
| 38,141 | |
| 0 | |
| 38,141 |
State and municipal securities | |
| 0 | |
| 216,509 | |
| 150 | |
| 216,659 |
Total Securities | |
| 987 | |
| 584,412 | |
| 150 | |
| 585,549 |
Mortgage banking derivative | |
| 0 | |
| 95 | |
| 0 | |
| 95 |
Interest rate swap derivative | |
| 0 | |
| 3,869 | |
| 0 | |
| 3,869 |
Total assets | | $ | 987 | | $ | 588,376 | | $ | 150 | | $ | 589,513 |
| | | | | | | | | | | | |
Liabilities: | |
| | | | | | | | | | |
Mortgage banking derivative | |
| 0 | |
| 23 | |
| 0 | |
| 23 |
Interest rate swap derivative | |
| 0 | |
| 4,025 | |
| 0 | |
| 4,025 |
Total liabilities | | $ | 0 | | $ | 4,048 | | $ | 0 | | $ | 4,048 |
There were no transfers between Level 1 and Level 2 during 20182019 and 2017.2018.
87
The table below presents a reconciliation of all assets measured at fair value on aof Level 3 available-for-sale securities was immaterial to warrant additional recurring basis using significant unobservable inputs (Level 3) for the years endedfair value disclosures as of December 31, 20182019 and 2017:
| State and Municipal Securities | |||||||
| (dollars in thousands) | 2018 | 2017 | |||||
| Balance of recurring Level 3 assets at January 1 | $880 | $670 | |||||
| Transfers into Level 3 | 0 | 325 | |||||
| Changes in fair value of securities | |||||||
| included in other comprehensive income | (10) | (10) | |||||
| Principal payments | (720) | (105) | |||||
| Sales | 0 | 0 | |||||
| Balance of recurring Level 3 assets at December 31 | $150 | $880 | |||||
The state and municipal securities measured at fair value includedtables below are nonrated Indiana municipal revenue bonds and are not actively traded.
| | | | | | | | | | | | |
|
| December 31, 2019 | ||||||||||
| | Fair Value Measurements Using | | Assets | ||||||||
(dollars in thousands) |
| Level 1 |
| Level 2 |
| Level 3 |
| at Fair Value | ||||
Assets | | | | | | | | | | | | |
Impaired loans: | | | | | | | | | | | | |
Commercial and industrial loans: | | | | | | | | | | | | |
Working capital lines of credit loans | | $ | 0 | | $ | 0 | | $ | 3,126 | | $ | 3,126 |
Non-working capital loans | |
| 0 | |
| 0 | |
| 6,374 | |
| 6,374 |
Commercial real estate and multi-family residential loans: | | | | | | | | | | | | |
Construction and land development loans | |
| 0 | |
| 0 | |
| 43 | |
| 43 |
Owner occupied loans | |
| 0 | |
| 0 | |
| 1,449 | |
| 1,449 |
Agri-business and agricultural loans: | | | | | | | | | | | | |
Loans secured by farmland | |
| 0 | |
| 0 | |
| 57 | |
| 57 |
Consumer 1-4 family mortgage loans: | | | | | | | | | | | | |
Closed end first mortgage loans | |
| 0 | |
| 0 | |
| 474 | |
| 474 |
Open end and junior lien loans | | | 0 | | | 0 | | | 587 | | | 587 |
Other consumer loans | | | 0 | |
| 0 | | | 11 | | | 11 |
Total impaired loans | | $ | 0 | | $ | 0 | | $ | 12,121 | | $ | 12,121 |
Other real estate owned | |
| 0 | |
| 0 | |
| 0 | |
| 0 |
Total assets | | $ | 0 | | $ | 0 | | $ | 12,121 | | $ | 12,121 |
| | | | | | | | | | | | |
|
| December 31, 2018 | ||||||||||
| | Fair Value Measurements Using | | Assets | ||||||||
(dollars in thousands) |
| Level 1 |
| Level 2 |
| Level 3 |
| at Fair Value | ||||
Assets |
| |
|
| |
|
| |
|
| |
|
Impaired loans: |
| |
|
| |
|
| |
|
| |
|
Commercial and industrial loans: |
| |
|
| |
|
| |
|
| |
|
Working capital lines of credit loans | | $ | 0 | | $ | 0 | | $ | 4,092 | | $ | 4,092 |
Non-working capital loans | |
| 0 | |
| 0 | |
| 4,967 | |
| 4,967 |
Commercial real estate and multi-family residential loans: | |
|
| |
|
| |
| | |
| |
Construction and land development loans | |
| 0 | |
| 0 | |
| 148 | |
| 148 |
Owner occupied loans | |
| 0 | |
| 0 | |
| 1,669 | |
| 1,669 |
Agri-business and agricultural loans: | | | | | | | | | | | | |
Loans secured by farmland | | | 0 | | | 0 | | | 77 | | | 77 |
Consumer 1-4 family mortgage loans: | |
|
| |
|
| |
| | |
| |
Closed end first mortgage loans | |
| 0 | |
| 0 | |
| 553 | |
| 553 |
Total impaired loans | | $ | 0 | | $ | 0 | | $ | 11,506 | | $ | 11,506 |
Other real estate owned | |
| 0 | |
| 0 | |
| 316 | |
| 316 |
Total assets | | $ | 0 | | $ | 0 | | $ | 11,822 | | $ | 11,822 |
88
| December 31, 2018 | |||||||
| Fair Value Measurements Using | Assets | ||||||
| (dollars in thousands) | Level 1 | Level 2 | Level 3 | at Fair Value | |||
| Assets | |||||||
| Impaired loans: | |||||||
| Commercial and industrial loans: | |||||||
| Working capital lines of credit loans | $0 | $0 | $4,092 | $4,092 | |||
| Non-working capital loans | 0 | 0 | 4,967 | 4,967 | |||
| Commercial real estate and multi-family | |||||||
| residential loans: | |||||||
| Construction and land development loans | 0 | 0 | 148 | 148 | |||
| Owner occupied loans | 0 | 0 | 1,669 | 1,669 | |||
| Agri-business and agricultural loans: | |||||||
| Loans secured by farmland | 0 | 0 | 77 | 77 | |||
| Consumer 1-4 family mortgage loans: | |||||||
| Closed end first mortgage loans | 0 | 0 | 553 | 553 | |||
| Total impaired loans | $0 | $0 | $11,506 | $11,506 | |||
| Other real estate owned | 0 | 0 | 316 | 316 | |||
| Total assets | $0 | $0 | $11,822 | $11,822 | |||
NOTE 5 – FAIR VALUE (continued)
The following table below presents the amount ofvaluation methodology and unobservable inputs for Level 3 assets measured at fair value on a nonrecurring basis:non-recurring basis at December 31, 2019:
| | | | | | | | | | | |
(dollars in thousands) |
| Fair Value |
| Valuation Methodology |
| Unobservable Inputs |
| Average |
| Range of Inputs | |
Impaired loans: |
| |
|
|
|
|
|
|
|
|
|
Commercial and industrial | | $ | 9,500 |
| Collateral based measurements |
| Discount to reflect current market conditions and ultimate collectability |
| 53 | % | 1%-100% |
| | | |
| |
| | | | | |
| | | | | |
| | | | | |
Impaired loans: | |
|
|
|
|
|
|
|
|
|
|
Commercial real estate | |
| 1,492 |
| Collateral based measurements |
| Discount to reflect current market conditions and ultimate collectability |
| 27 | % | 7%-61% |
| | | |
| |
| | | | | |
| | | | | |
| | | | | |
| | | | | | | | | | | |
Impaired loans: | |
|
|
|
|
|
|
| |
|
|
Agribusiness and agricultural | |
| 57 |
| Collateral based measurements |
| Discount to reflect current market conditions and ultimate collectability |
| 61 | % |
|
| | | |
| |
| | | | | |
| | | | | |
| | | | | |
Impaired loans: | |
|
|
|
|
|
|
|
|
|
|
Consumer 1-4 family mortgage | |
| 1,061 |
| Collateral based measurements |
| Discount to reflect current market conditions and ultimate collectability |
| 14 | % | 5%-100% |
| | | |
| |
| | | | | |
| | | |
| | | | | | | |
Impaired loans: | | | | | | | | | | | |
Other consumer | |
| 11 |
| Collateral based measurements |
| Discount to reflect current market conditions and ultimate collectability |
| 36 | % |
|
89
| December 31, 2017 | |||||||
| Fair Value Measurements Using | Assets | ||||||
| (dollars in thousands) | Level 1 | Level 2 | Level 3 | at Fair Value | |||
| Assets | |||||||
| Impaired loans: | |||||||
| Commercial and industrial loans: | |||||||
| Working capital lines of credit loans | $0 | $0 | $934 | $934 | |||
| Non-working capital loans | 0 | 0 | 1,693 | 1,693 | |||
| Commercial real estate and multi-family | |||||||
| residential loans: | |||||||
| Construction and land development loans | 0 | 0 | 477 | 477 | |||
| Owner occupied loans | 0 | 0 | 1,133 | 1,133 | |||
| Consumer 1-4 family mortgage loans: | |||||||
| Open end and junior lien loans | 0 | 0 | 195 | 195 | |||
| Total impaired loans | $0 | $0 | $4,432 | $4,432 | |||
| Other real estate owned | 0 | 0 | 0 | 0 | |||
| Total assets | $0 | $0 | $4,432 | $4,432 | |||
The following table presents the valuation methodology and unobservable inputs for Level 3 assets measured at fair value on a non-recurring basis at December 31, 2018:
| | | | | | | | | | | |
(dollars in thousands) |
| Fair Value |
| Valuation Methodology |
| Unobservable Inputs |
| Average |
| Range of Inputs | |
Impaired loans: |
| |
|
|
|
|
|
|
|
|
|
Commercial and industrial | | $ | 9,059 |
| Collateral based measurements |
| Discount to reflect current market conditions and ultimate collectability |
| 48 | % | 4%-100% |
| | | |
| |
| | | | | |
| | | | | |
| | | | | |
Impaired loans: | |
|
|
|
|
|
|
|
|
|
|
Commercial real estate | |
| 1,817 |
| Collateral based measurements |
| Discount to reflect current market conditions and ultimate collectability |
| 34 | % | 6%-53% |
| | | |
| |
| | | | | |
| | | | | |
| | | | | |
| | | | | | | | | | | |
Impaired loans: | |
|
|
|
|
|
|
|
|
|
|
Agribusiness and agricultural | |
| 77 |
| Collateral based measurements |
| Discount to reflect current market conditions and ultimate collectability |
| 49 | % |
|
| | | |
| |
| | | | | |
| | | | | |
| | | | | |
Impaired loans: | |
|
|
|
|
|
|
|
|
|
|
Consumer 1-4 family mortgage | |
| 553 |
| Collateral based measurements |
| Discount to reflect current market conditions and ultimate collectability |
| 23 | % | 0%-64% |
| | | |
| |
| | | | | |
| | | |
| | | | | | | |
| | | | | | | | | | | |
Other real estate owned | |
| 316 |
| Collateral based measurements |
| Discount to reflect current market conditions |
| 0 | % |
|
90
| (dollars in thousands) | Fair Value | Valuation Methodology | Unobservable Inputs | Average | Range of Inputs | |||||
| Impaired loans: | ||||||||||
| Commercial and industrial | $9,059 | Collateral based | Discount to reflect | 48% | 4%-100% | |||||
| measurements | current market conditions | |||||||||
| and ultimate collectability | ||||||||||
| Impaired loans: | ||||||||||
| Commercial real estate | 1,817 | Collateral based | Discount to reflect | 34% | 6%-53% | |||||
| measurements | current market conditions | |||||||||
| and ultimate collectability | ||||||||||
| Impaired loans: | ||||||||||
| Agribusiness and agricultural | 77 | Collateral based | Discount to reflect | 49% | ||||||
| measurements | current market conditions | |||||||||
| and ultimate collectability | ||||||||||
| Impaired loans: | ||||||||||
| Consumer 1-4 family mortgage | 553 | Collateral based | Discount to reflect | 23% | 0%-64% | |||||
| measurements | current market conditions | |||||||||
| and ultimate collectability | ||||||||||
| �� | ||||||||||
| Other real estate owned | 316 | Collateral based | Discount to reflect | 0% | ||||||
| measurements | current market conditions | |||||||||
| (dollars in thousands) | Fair Value | Valuation Methodology | Unobservable Inputs | Average | Range of Inputs | |||||
| Impaired loans: | ||||||||||
| Commercial and industrial | $2,627 | Collateral based | Discount to reflect | 37% | 23% - 100% | |||||
| measurements | current market conditions | |||||||||
| and ultimate collectability | ||||||||||
| Impaired loans: | ||||||||||
| Commercial real estate | 1,610 | Collateral based | Discount to reflect | 33% | 2% - 58% | |||||
| measurements | current market conditions | |||||||||
| and ultimate collectability | ||||||||||
| Impaired loans: | ||||||||||
| Consumer 1-4 family mortgage | 195 | Collateral based | Discount to reflect | 17% | ||||||
| measurements | current market conditions | |||||||||
| and ultimate collectability |
NOTE 5 – FAIR VALUE (continued)
Impaired loans, which are measured for impairment using the fair value of the collateral for collateral dependent loans, had a gross carrying amount of $22.2 million, with a valuation allowance of $10.1 million at December 31, 2019, resulting in an increase in provision for loan losses of $600,000 for the year ended December 31, 2019. At December 31, 2018, impaired loans had a gross carrying amount of $21.0 million, with a valuation allowance of $9.5 million, at December 31, 2018, resulting in an increase in provision for loan losses of $7.1 million for the year ended December 31, 2018.
At December 31, 2017, impaired loans had a gross carrying amount of $6.8 million, with a valuation allowance of $2.4 million, resulting in a reduction in provision for loan losses of $700,000 for the year ended December 31, 2017.
The following table contains the estimated fair value less costs to sell,values and the related carrying values of the Company’s financial instruments at December 31, 2017.
| | | | | | | | | | | | | | | |
|
| December 31, 2019 | |||||||||||||
|
| Carrying |
| Estimated Fair Value | |||||||||||
(dollars in thousands) |
| Value |
| Level 1 |
| Level 2 |
| Level 3 |
| Total | |||||
Financial Assets: | | |
| | |
|
| |
|
| |
|
| |
|
Cash and cash equivalents | | $ | 99,381 | | $ | 96,603 | | $ | 2,778 | | $ | 0 | | $ | 99,381 |
Securities available-for-sale | |
| 608,233 | |
| 0 | |
| 608,088 | |
| 145 | |
| 608,233 |
Real estate mortgages held-for-sale | |
| 4,527 | |
| 0 | |
| 4,614 | |
| 0 | |
| 4,614 |
Loans, net | |
| 4,015,176 | |
| 0 | |
| 0 | |
| 3,979,006 | |
| 3,979,006 |
Federal Reserve and Federal Home Loan Bank Stock | |
| 13,772 | |
| N/A | |
| N/A | |
| N/A | |
| N/A |
Accrued interest receivable | |
| 15,391 | |
| 0 | |
| 3,729 | |
| 11,662 | |
| 15,391 |
Financial Liabilities: | |
|
| |
|
| |
|
| |
|
| |
|
|
Certificates of deposit | |
| (1,192,067) | |
| 0 | |
| (1,202,060) | |
| 0 | |
| (1,202,060) |
All other deposits | |
| (2,941,752) | |
| (2,941,752) | |
| 0 | |
| 0 | |
| (2,941,752) |
Federal Home Loan Bank advances | |
| (170,000) | |
| 0 | |
| (169,998) | |
| 0 | |
| (169,998) |
Standby letters of credit | |
| (915) | |
| 0 | |
| 0 | |
| (915) | |
| (915) |
Accrued interest payable | |
| (11,604) | |
| (102) | |
| (11,502) | |
| 0 | |
| (11,604) |
The following table contains the estimated fair values and the related carrying values of the Company’s financial instruments at December 31, 2018. Items which are not financial instruments are not included. Due to the adoption
| | | | | | | | | | | | | | | |
| | December 31, 2018 | |||||||||||||
|
| Carrying |
| Estimated Fair Value | |||||||||||
(dollars in thousands) |
| Value |
| Level 1 |
| Level 2 |
| Level 3 |
| Total | |||||
Financial Assets: | | |
| | |
|
| |
|
| |
|
| |
|
Cash and cash equivalents | | $ | 216,922 | | $ | 214,452 | | $ | 2,470 | | $ | 0 | | $ | 216,922 |
Securities available-for-sale | |
| 585,549 | |
| 987 | |
| 584,412 | |
| 150 | |
| 585,549 |
Real estate mortgages held-for-sale | |
| 2,293 | |
| 0 | |
| 2,314 | |
| 0 | |
| 2,314 |
Loans, net | |
| 3,866,292 | |
| 0 | |
| 0 | |
| 3,786,175 | |
| 3,786,175 |
Federal Reserve and Federal Home Loan Bank Stock | |
| 13,772 | |
| N/A | |
| N/A | |
| N/A | |
| N/A |
Accrued interest receivable | |
| 15,518 | |
| 3 | |
| 3,569 | |
| 11,946 | |
| 15,518 |
Financial Liabilities: | |
|
| |
|
| |
|
| |
|
| |
|
|
Certificates of deposit | |
| (1,419,754) | |
| 0 | |
| (1,424,553) | |
| 0 | |
| (1,424,553) |
All other deposits | |
| (2,624,311) | |
| (2,624,311) | |
| 0 | |
| 0 | |
| (2,624,311) |
Securities sold under agreements to repurchase | |
| (75,555) | |
| 0 | |
| (75,555) | |
| 0 | |
| (75,555) |
Federal Home Loan Bank advances | |
| (170,000) | |
| 0 | |
| (169,996) | |
| 0 | |
| (169,996) |
Subordinated debentures | |
| (30,928) | |
| 0 | |
| 0 | |
| (31,195) | |
| (31,195) |
Standby letters of credit | |
| (978) | |
| 0 | |
| 0 | |
| (978) | |
| (978) |
Accrued interest payable | |
| (10,404) | |
| (110) | |
| (10,289) | |
| (5) | |
| (10,404) |
91
| December 31, 2018 | |||||||||
| Carrying | Estimated Fair Value | ||||||||
| (dollars in thousands) | Value | Level 1 | Level 2 | Level 3 | Total | ||||
| Financial Assets: | |||||||||
| Cash and cash equivalents | $216,922 | $214,452 | $2,470 | $0 | $216,922 | ||||
| Securities available for sale | 585,549 | 987 | 584,412 | 150 | 585,549 | ||||
| Real estate mortgages held for sale | 2,293 | 0 | 2,314 | 0 | 2,314 | ||||
| Loans, net | 3,866,292 | 0 | 0 | 3,786,175 | 3,786,175 | ||||
| Federal Reserve and Federal Home Loan Bank stock | 13,772 | N/A | N/A | N/A | N/A | ||||
| Accrued interest receivable | 15,518 | 3 | 3,569 | 11,946 | 15,518 | ||||
| Financial Liabilities: | |||||||||
| Certificates of deposit | (1,419,754) | 0 | (1,424,553) | 0 | (1,424,553) | ||||
| All other deposits | (2,624,311) | (2,624,311) | 0 | 0 | (2,624,311) | ||||
| Securities sold under agreements | |||||||||
| to repurchase | (75,555) | 0 | (75,555) | 0 | (75,555) | ||||
| Other short-term borrowings | (170,000) | 0 | (169,996) | 0 | (169,996) | ||||
| Subordinated debentures | (30,928) | 0 | 0 | (31,195) | (31,195) | ||||
| Standby letters of credit | (978) | 0 | 0 | (978) | (978) | ||||
| Accrued interest payable | (10,404) | (110) | (10,289) | (5) | (10,404) | ||||
| Carrying | Estimated Fair Value | ||||||||
| (dollars in thousands) | Value | Level 1 | Level 2 | Level 3 | Total | ||||
| Financial Assets: | |||||||||
| Cash and cash equivalents | $176,180 | $174,045 | $2,127 | $0 | $176,172 | ||||
| Securities available for sale | 538,493 | 997 | 536,616 | 880 | 538,493 | ||||
| Real estate mortgages held for sale | 3,346 | 0 | 3,390 | 0 | 3,390 | ||||
| Loans, net | 3,771,338 | 0 | 0 | 3,744,842 | 3,744,842 | ||||
| Federal Reserve and Federal Home Loan Bank stock | 13,772 | N/A | N/A | N/A | N/A | ||||
| Accrued interest receivable | 14,093 | 3 | 2,925 | 11,165 | 14,093 | ||||
| Financial Liabilities: | |||||||||
| Certificates of deposit | (1,412,583) | 0 | (1,417,075) | 0 | (1,417,075) | ||||
| All other deposits | (2,596,072) | (2,596,072) | 0 | 0 | (2,596,072) | ||||
| Securities sold under agreements | |||||||||
| to repurchase | (70,652) | 0 | (70,652) | 0 | (70,652) | ||||
| Long-term borrowings | (80,030) | 0 | (80,035) | 0 | (80,035) | ||||
| Subordinated debentures | (30,928) | 0 | 0 | (31,194) | (31,194) | ||||
| Standby letters of credit | (758) | 0 | 0 | (758) | (758) | ||||
| Accrued interest payable | (6,311) | (149) | (6,158) | (4) | (6,311) | ||||
Land, premises and equipment and related accumulated depreciation were as follows at December 31, 20182019 and 2017:
| (dollars in thousands) | 2018 | 2017 | |
| Land | $16,649 | $16,172 | |
| Premises | 44,717 | 41,694 | |
| Equipment | 36,111 | 34,349 | |
| Total cost . . . . . . . . . . . . . . . . . . . . . . . . . . . . . . . . . . . . . . . . . . . . . . . . . . . . . . . . . . . . . . . . . . . . . . . . . . . . | 97,477 | 92,215 | |
| Less accumulated depreciation | 39,380 | 35,749 | |
| Land, premises and equipment, net | $58,097 | $56,466 |
| | | | | | |
(dollars in thousands) |
| 2019 |
| 2018 | ||
Land | | $ | 12,511 | | $ | 12,302 |
Premises and improvements | |
| 53,213 | |
| 49,064 |
Equipment and furniture | |
| 38,691 | |
| 36,111 |
Total cost | |
| 104,415 | |
| 97,477 |
Less accumulated depreciation | |
| 44,261 | |
| 39,380 |
Land, premises and equipment, net | | $ | 60,154 | | $ | 58,097 |
The Company had land, premises and equipment of $100,000 and $0 held for sale and included in other assets as of December 31, 20182019 and 2017, respectively.
| (dollars in thousands) | 2018 |
| 2019 | $553 |
| 2020 | 571 |
| 2021 | 582 |
| 2022 | 595 |
| 2023 | 511 |
| Thereafter | 2,792 |
| Total | $5,604 |
NOTE 7
– GOODWILL AND OTHER INTANGIBLE ASSETSGoodwill
There have been no changes in the $5.0 million carrying amount of goodwill since 2002.
Impairment exists when a reporting unit’s carrying value of goodwill exceeds its fair value, which is determined through a two-step impairment test. Step 1 of the impairment test includes the determination of the carrying value of our single reporting unit, including the existing goodwill and intangible assets, and estimating the fair value of the reporting unit. The Company determined the fair value of our reporting unit and compared it to its carrying amount. If the carrying amount of a reporting unit exceeds its fair value, the Company is required to perform a second step to the impairment test. Our annual impairment analysis as of May 31, 2018,2019, indicated that the Step 2 analysis was not necessary. Circumstances did not substantially change during the second half of the year such that the Company did not believe it was necessary to do an additional impairment analysis.
The following table details total deposits as of December 31, 20182019 and 2017:2018:
| | | | | | |
(dollars in thousands) |
| 2019 |
| 2018 | ||
Non-interest bearing demand deposits | | $ | 983,307 | | $ | 946,838 |
Savings and transaction accounts: | |
|
| |
|
|
Savings deposits | |
| 234,508 | |
| 247,903 |
Interest bearing demand deposits | |
| 1,723,937 | |
| 1,429,570 |
Time deposits: | |
|
| |
|
|
Other time deposits | |
| 281,934 | |
| 273,533 |
Deposits of $100,000 to $250,000 | |
| 291,805 | |
| 268,058 |
Deposits of $250,000 or more | |
| 618,328 | |
| 878,163 |
Total deposits | | $ | 4,133,819 | | $ | 4,044,065 |
92
| (dollars in thousands) | 2018 | 2017 | |
| Non-interest bearing demand deposits | $946,838 | $885,622 | |
| Savings and transaction accounts: | |||
| Savings deposits | 247,903 | 263,570 | |
| Interest bearing demand deposits | 1,429,570 | 1,446,880 | |
| Time deposits: | |||
| Other time deposits | 273,533 | 251,218 | |
| Deposits of $100,000 to $250,000 | 268,058 | 236,354 | |
| Deposits of $250,000 or more | 878,163 | 925,011 | |
| Total deposits | $4,044,065 | $4,008,655 |
NOTE 8 – DEPOSITS (continued)
At December 31, 2018,2019, the scheduled maturities of time deposits were as follows:
| | | |
(dollars in thousands) |
| Amount | |
Maturing in 2020 | | $ | 895,601 |
Maturing in 2021 | |
| 206,303 |
Maturing in 2022 | |
| 35,181 |
Maturing in 2023 | |
| 23,143 |
Maturing in 2024 | |
| 29,747 |
Thereafter | |
| 2,092 |
Total time deposits | | $ | 1,192,067 |
During 2019 the Bank entered into agreements with Promontory Interfinancial Network relative to their Insured Cash Sweep One-Way Buy program. As of December 31, 2019, the total amount available to the Bank via this program was $200.0 million, of which, $75.1 million was drawn.
NOTE 9
– BORROWINGSFor the years ending December 31, advances from the Federal Home Loan Bank were as follows:
| (dollars in thousands) | 2018 | 2017 | |
| Federal Home Loan Bank of Indianapolis Notes, 2.52%, Due January 7, 2019 | $170,000 | $0 | |
| Federal Home Loan Bank of Indianapolis Notes, 1.67%, Due June 27, 2018 | 0 | 80,000 | |
| Federal Home Loan Bank of Indianapolis Notes, 6.15%, Due January 16, 2018 | 0 | 30 | |
| Total | $170,000 | $80,030 |
| | | | | | |
(dollars in thousands) |
| 2019 |
| 2018 | ||
Federal Home Loan Bank of Indianapolis Advance, 1.61%, Due January 7, 2020 | | $ | 170,000 | | $ | 0 |
Federal Home Loan Bank of Indianapolis Advance, 2.52%, Due January 7, 2019 | |
| 0 | |
| 170,000 |
Total | | $ | 170,000 | | $ | 170,000 |
The outstanding FHLB advance at December 31, 20182019 of $170.0 million is a fixed rate advance and may not be prepaid without penalty. All FHLB notes require monthly interest payments and are secured by residential real estate loans and securities with a carrying value of $412.9$453.2 million and $370.0$412.9 million at December 31, 2019 and 2018, and 2017.respectively. At December 31, 2019 and 2018, the Company owned $10.4 million of FHLB stock, which also secures debts owed to the FHLB. The Company is authorized by the Board to borrow up to $800.0 million at the FHLB, but availability is limited to $85.6$115.5 million based on collateral and outstanding borrowings. Federal Reserve Discount Window borrowings were secured by commercial loans with a carrying value of $381.5$446.9 million and $282.1$381.5 million as of December 31, 20182019 and 2017.2018. The Company had a borrowing capacity of $339.5 million and $286.5 million at the Federal Reserve Bank atas of December 31, 2018.2019 and 2018, respectively. There were no borrowings outstanding at the Federal Reserve Bank at December 31, 20182019 and 2017.
The Company had $325.0 million of availability in federal funds lines with twelve correspondent banks, none of which was drawn on as of December 31, 20182019 and 2017. Additionally, during 2018 the2018. The Bank becomeis also a member of the American Financial Exchange (AFX) where overnight fed funds purchased can be obtained from other banks on the Exchange that have approved the Bank for an unsecured, overnight line. These funds are only available if the approving banks have an ‘offer’ out to sell that day. As of December 31, 2019 and 2018, the total amount approved for the Bank via AFX banks was $119$244.0 million none of which wasand $119.0 million, respectively. There were no amounts drawn on as of December 31, 2019 and 2018.
On August 2, 2019 the Company entered into an unsecured revolving credit agreement with another financial institution allowing the Company to borrow up to $30.0 million. Funds provided under the agreement may be used to repurchase shares of the Company’s common stock under the share repurchase program, which was reauthorized by the Company’s board of directors on January 14, 2020. The credit agreement includes a negative pledge agreement whereby the Company agrees not to pledge or otherwise encumber the stock of the Bank. The credit agreement has a one year term which may be amended, extended, modified or renewed. There was 0 amount drawn on the line as of December 31, 2019.
93
NOTE 9 – BORROWINGS (continued)
Securities sold under agreements to repurchase (“repo accounts”) represent collateralized borrowings with customers located primarily within the Company’s service area. The Bank discontinued offering this product in early 2019. All reposrepo accounts at December 31, 2018 2017 and 2016 maturematured on demand. Repo accounts are not covered by federal deposit insurance and are secured by securities owned. The Company retains the right to substitute similar type securities and has the right to withdraw all excess collateral applicable to repo accounts whenever the collateral values are in excess of the related repurchase liabilities. However, as a means of mitigating market risk, the Company maintains excess collateral to cover normal changes in the repurchase liability by monitoring daily usage. At December 31, 2018, there were no material amounts of securities at risk with any one customer. The Company maintains control of these securities through the use of third-party safekeeping arrangements.
The following is a schedule, at the end of the year indicated, of statistical information relating to securities sold under agreement to repurchase secured by either U.S. government agency securities or mortgage-backed securities classified as other debt securities.securities available-for-sale. There were no other categories of short-term borrowings for which the average balance outstanding during the period was 30 percent or more of stockholders' equity at the end of each period.
| (dollars in thousands) | 2018 | 2017 | 2016 | |||
| Securities sold under agreements to repurchase | ||||||
| Outstanding at year end | $75,555 | $70,652 | $50,045 | |||
| Approximate average interest rate at year end | 0.74 | % | 0.46 | % | 0.29 | % |
| Highest amount outstanding as of any month end | ||||||
| during the year | $106,239 | $77,886 | $60,198 | |||
| Approximate average outstanding during the year | 86,874 | 63,379 | 57,945 | |||
| Approximate average interest rate during the year | 0.58 | % | 0.39 | % | 0.25 | % |
| | | | | | | | | | |
(dollars in thousands) |
| 2019 |
| 2018 |
| 2017 |
| |||
Securities sold under agreements to repurchase |
| |
|
| |
|
| |
| |
Outstanding at year end | | $ | 0 | | $ | 75,555 | | $ | 70,652 | |
Approximate average interest rate at year end | |
| 0.00 | % |
| 0.74 | % |
| 0.46 | % |
Highest amount outstanding as of any month end during the year | | $ | 72,814 | | $ | 106,239 | | $ | 77,886 | |
Approximate average outstanding during the year | |
| 15,104 | |
| 86,874 | |
| 63,379 | |
Approximate average interest rate during the year | |
| 0.86 | % |
| 0.58 | % |
| 0.39 | % |
NOTE 10 – SUBORDINATED DEBENTURES
Lakeland Statutory Trust II, a trust formed by the Company (the “Trust”), issued $30.0 million of floating rate trust preferred securities on October 1, 2003 as part of a privately placed offering of such securities. The Company issued $30.9 million of subordinated debentures to the Trust in exchange for the proceeds of the Trust. The Company holdsheld a controlling interest in the Trust, but doesdid not have a majority of voting rights; therefore the Trust iswas considered a variable interest entity. The Company iswas not considered the primary beneficiary of this Trust; therefore, the Trust iswas not consolidated in the Company’s financial statements, but rather the subordinated debentures arewas shown as a liability. The Company’s investment in the common stock of the Trust was $928,000 and is included in other assets.
Subject to the Company having received prior approval of the Federal Reserve, if required, the Company maywas able to redeem the subordinated debentures, in whole or in part, but in all cases in a principal amount with integral multiples of $1,000, on any interest payment date on or after October 1, 2008 at 100% of the principal amount, plus accrued and unpaid interest. The subordinated debentures mustwere required to be redeemed no later than 2033. These securities arewere considered Tier I capital (with certain limitations applicable) under current regulatory guidelines and, subject to certain limitations, willwere also be considered Tier 1 capital under Basel III.
On December 31, 2019, the Company redeemed $30.0 million of trust preferred securities of the Trust. The trust preferred securities were redeemed, along with $928,000 in common securities issued by the Trust and held by the Company, as a result of the concurrent redemption of 100% of the Company’s junior subordinated debentures due 2033 and held by the Trust, which underlie the trust preferred securities. The redemption price for the junior subordinated debentures was equal to 100% of the principal amount plus accrued interest up to, but not including, the redemption date. The proceeds from the redemption of the junior subordinated debentures were simultaneously applied to redeem all of the outstanding common securities and the outstanding trust preferred securities at a price of 100% of the aggregate liquidation amount of the trust preferred securities plus accumulated but unpaid distributions up to, but not including, the redemption date. The redemption was pursuant to the optional redemption provisions of the underlying indenture.
The floating rate of the trust preferred securities and subordinated debentures arewas equal to the three-month London Interbank Offered Rate (“LIBOR”) plus 3.05%, which was 5.8530%, 4.4745% and 4.0479%5.85% at December 31, 2018, 2017 and 2016, respectively.2018.
94
In April 2000, the Lakeland Financial Corporation Pension Plan was frozen. The Company also maintains a Supplemental Executive Retirement Plan (“SERP”) for select officers that was established as a funded, non-qualified deferred compensation plan. Currently, six retired officers are the only participants in the SERP. The measurement date for both the pension plan and SERP is December 31, 20182019 and 2017.
Information as to the Company’s employee benefit plans at December 31, 20182019 and 20172018 is as follows:
Pension Benefits | SERP Benefits | ||||||
| (dollars in thousands) | 2018 | 2017 | 2018 | 2017 | |||
| Change in benefit obligation: | |||||||
| Beginning benefit obligation | $2,862 | $2,841 | $1,086 | $1,163 | |||
| Interest cost | 93 | 104 | 34 | 40 | |||
| Actuarial (gain)/loss | (325) | 134 | (62) | 20 | |||
| Benefits paid | (512) | (217) | (134) | (137) | |||
| Ending benefit obligation . . . . . . . . . . . . . . . . . . . . . . . . . . . . . . . . . . . . . . . . . . . . . . . . . . . . . | 2,118 | 2,862 | 924 | 1,086 | |||
| Change in plan assets (primarily equity and fixed | |||||||
| income investments and money market funds), | |||||||
| at fair value: | |||||||
| Beginning plan assets | 2,356 | 2,063 | 1,047 | 1,000 | |||
| Actual return | (61) | 313 | (28) | 144 | |||
| Employer contribution | 368 | 197 | 0 | 40 | |||
| Benefits paid | (512) | (217) | (134) | (137) | |||
| Ending plan assets . . . . . . . . . . . . . . . . . . . . . . . . . . . . . . . . . . . . . . . . . . . . . . . . . . . . . . . . | 2,151 | 2,356 | 885 | 1,047 | |||
| Funded status at end of year | $33 | $(506) | $(39) | $(39) | |||
| | | | | | | | | | | | |
| | Pension Benefits | | SERP Benefits | ||||||||
(dollars in thousands) |
| 2019 |
| 2018 |
| 2019 |
| 2018 | ||||
Change in benefit obligation: |
| |
|
| |
|
| |
|
| |
|
Beginning benefit obligation | | $ | 2,118 | | $ | 2,862 | | $ | 924 | | $ | 1,086 |
Interest cost | |
| 87 | |
| 93 | |
| 37 | |
| 34 |
Actuarial (gain) loss | |
| 631 | |
| (325) | |
| 164 | |
| (62) |
Benefits paid | |
| (121) | |
| (512) | |
| (134) | |
| (134) |
Ending benefit obligation | |
| 2,715 | |
| 2,118 | |
| 991 | |
| 924 |
| | | | | | | | | | | | |
Change in plan assets (primarily equity and fixed income investments and money market funds), at fair value: | |
|
| |
|
| |
|
| |
|
|
Beginning plan assets | |
| 2,151 | |
| 2,356 | |
| 885 | |
| 1,047 |
Actual return | |
| 415 | |
| (61) | |
| 163 | |
| (28) |
Employer contribution | |
| 27 | |
| 368 | |
| 0 | |
| 0 |
Benefits paid | |
| (121) | |
| (512) | |
| (134) | |
| (134) |
Ending plan assets | |
| 2,472 | |
| 2,151 | |
| 914 | |
| 885 |
Funded status at end of year | | $ | (243) | | $ | 33 | | $ | (77) | | $ | (39) |
Amounts recognized in the consolidated balance sheets consist of:
Pension Benefits | SERP Benefits | ||||||
| (dollars in thousands) | 2018 | 2017 | 2018 | 2017 | |||
| Funded status included in other liabilities | $33 | $(506) | $(39) | $(39) | |||
| | | | | | | | | | | | |
| | Pension Benefits | | SERP Benefits | ||||||||
(dollars in thousands) |
| 2019 |
| 2018 |
| 2019 |
| 2018 | ||||
Funded status included in other liabilities | | $ | (243) | | $ | 33 | | $ | (77) | | $ | (39) |
Amounts recognized in accumulated other comprehensive income (loss) consist of:
Pension Benefits | SERP Benefits | ||||||
| (dollars in thousands) | 2018 | 2017 | 2018 | 2017 | |||
| Net actuarial loss | $1,242 | $1,731 | $615 | $661 | |||
| | | | | | | | | | | | |
| | Pension Benefits | | SERP Benefits | ||||||||
(dollars in thousands) |
| 2019 |
| 2018 |
| 2019 |
| 2018 | ||||
Net actuarial loss | | $ | 1,464 | | $ | 1,242 | | $ | 597 | | $ | 615 |
The accumulated benefit obligation for the pension plan was $2.1$2.7 million and $2.9$2.1 million for December 31, 20182019 and 2017,2018, respectively. The accumulated benefit obligation for the SERP was $900,000$1.0 million and $1.1 million$900,000 for December 31, 2019 and 2018, and 2017, respectively.
95
Net pension expenseperiod benefit cost and other amounts recognized in other comprehensive income (loss) include the following:
Pension Benefits | SERP Benefits | ||||||||||
| (dollars in thousands) | 2018 | 2017 | 2016 | 2018 | 2017 | 2016 | |||||
| Net pension expense: | |||||||||||
| Service cost | $0 | $0 | $0 | $0 | $0 | $0 | |||||
| Interest cost | 93 | 104 | 105 | 34 | 40 | 45 | |||||
| Expected return on plan assets | (138) | (143) | (139) | (61) | (63) | (70) | |||||
| Recognized net actuarial loss | 193 | 185 | 135 | 73 | 80 | 80 | |||||
| Settlement cost | 224 | 0 | 128 | 0 | 0 | 0 | |||||
| Net pension expense | $372 | $146 | $229 | $46 | $57 | $55 | |||||
| Net (gain)/loss | $(296) | $(36) | $122 | $27 | $(61) | $29 | |||||
| Amortization of net loss | (193) | (185) | (135) | (73) | (80) | (80) | |||||
| Total recognized in other comprehensive | |||||||||||
| income | (489) | (221) | (13) | (46) | (141) | (51) | |||||
| Total recognized in net pension expense | |||||||||||
| and other comprehensive income | $(117) | $(75) | $216 | $0 | $(84) | $4 | |||||
| | | | | | | | | | | | | | | | | | |
| | Pension Benefits | | SERP Benefits | ||||||||||||||
(dollars in thousands) |
| 2019 |
| 2018 |
| 2017 |
| 2019 |
| 2018 |
| 2017 | ||||||
Net pension expense: |
| |
|
| |
|
| |
|
| |
|
| |
|
| |
|
Service cost | | $ | 0 | | $ | 0 | | $ | 0 | | $ | 0 | | $ | 0 | | $ | 0 |
Interest cost | |
| 87 | |
| 93 | |
| 104 | |
| 37 | |
| 34 | |
| 40 |
Expected return on plan assets | |
| (137) | |
| (138) | |
| (143) | |
| (55) | |
| (61) | |
| (63) |
Recognized net actuarial loss | |
| 132 | |
| 193 | |
| 185 | |
| 73 | |
| 73 | |
| 80 |
Settlement cost | |
| 0 | |
| 224 | |
| 0 | |
| 0 | |
| 0 | |
| 0 |
Net pension expense | | $ | 82 | | $ | 372 | | $ | 146 | | $ | 55 | | $ | 46 | | $ | 57 |
| | | | | | | | | | | | | | | | | | |
Net (gain) loss | | $ | 353 | | $ | (296) | | $ | (36) | | $ | 56 | | $ | 27 | | $ | (61) |
Amortization of net loss | |
| (132) | |
| (193) | |
| (185) | |
| (73) | |
| (73) | |
| (80) |
Total recognized in other comprehensive income (loss) | |
| 221 | |
| (489) | |
| (221) | |
| (17) | |
| (46) | |
| (141) |
Total recognized in net pension expense and other comprehensive income (loss) | | $ | 303 | | $ | (117) | | $ | (75) | | $ | 38 | | $ | 0 | | $ | (84) |
The estimated net loss (gain) for the defined benefit pension plan and SERP that will be amortized from accumulated other comprehensive income (loss) into net periodic benefit cost over the next fiscal year is $132,000$172,000 for the pension plan and $73,000$80,000 for the SERP. The settlement costs in 2018 and 2016 were related to participants taking lump sum distributions from the pension plan during those years.
For 2019, 2018 2017 and 2016,2017, the assumed form of payment elected by active participants upon retirement was a lump sum to reflect participant trends. The lump sum assumed interest rates, below, for December 31, 2019, 2018 2017 and 20162017 reflect the mortality table in effect for 2019, 2018 and 2017, and 2016, respectively. For 2019, the mortality assumption was changed to the PRI-2012 White Collar Mortality Table, with full generational Projection Scale MP-2019 as of December 31, 2019, to reflect improved mortality expectations. For 2018, the mortality assumption was changed to the RP-2014 Mortality Table, adjusted to 2006, with full generational Projection Scale MP-2018 as of December 31, 2018, to reflect improved mortality expectations. For 2017, the mortality assumption was changed to the RP-2014 Mortality Table, adjusted to 2006, with full generational Projection Scale MP-2017 as of December 31, 2017, to reflect improved mortality expectations. For 2016, the mortality assumption was changed to the RP-2014 Mortality Table, adjusted to 2006, with full generational Projection Scale MP-2016 as of December 31, 2016 to reflect improved mortality expectations.
| | | | | | | | | | | | | |
| | Pension Benefits | | SERP Benefits |
| ||||||||
|
| 2019 |
| 2018 |
| 2017 |
| 2019 |
| 2018 |
| 2017 |
|
The following assumptions were used in calculating the net benefit obligation: | | | | | | | | | | | | | |
| | | | | | | | | | | | | |
Weighted average discount rate |
| 2.98 | % | 4.08 | % | 3.46 | % | 2.98 | % | 4.08 | % | 3.46 | % |
Rate of increase in future compensation |
| N/A |
| N/A |
| N/A |
| N/A |
| N/A |
| N/A | |
Lump sum assumed interest rates | | | | | | | | | | | | | |
First 5 years |
| 2.01 | % | 3.33 | % | 2.05 | % | N/A |
| N/A |
| N/A | |
Next 15 years |
| 3.06 | % | 4.39 | % | 3.61 | % | N/A |
| N/A |
| N/A | |
All future years |
| 3.65 | % | 4.72 | % | 4.27 | % | N/A |
| N/A |
| N/A | |
| | | | | | | | | | | | | |
The following assumptions were used in calculating the net pension expense: | | | | | | | | | | | | | |
| | | | | | | | | | | | | |
Weighted average discount rate |
| 4.08 | % | 3.46 | % | 3.86 | % | 4.08 | % | 3.46 | % | 3.86 | % |
Rate of increase in future compensation |
| N/A |
| N/A |
| N/A |
| N/A |
| N/A |
| N/A | |
Expected long-term rate of return |
| 6.50 | % | 6.50 | % | 6.50 | % | 6.50 | % | 6.50 | % | 6.50 | % |
96
Pension Benefits | SERP Benefits | ||||||||||
| 2018 | 2017 | 2016 | 2018 | 2017 | 2016 | ||||||
| The following assumptions were used in calculating the net benefit obligation: | |||||||||||
| Weighted average discount rate | 4.08% | 3.46% | 3.86% | 4.08% | 3.46% | 3.86% | |||||
| Rate of increase in future compensation | N/A | N/A | N/A | N/A | N/A | N/A | |||||
| Lump sum assumed interest rates | |||||||||||
| First 5 years | 3.33% | 2.05% | 1.57% | N/A | N/A | N/A | |||||
| Next 15 years | 4.39% | 3.61% | 3.45% | N/A | N/A | N/A | |||||
| All future years | 4.72% | 4.27% | 4.39% | N/A | N/A | N/A | |||||
| The following assumptions were used in calculating the net pension expense: | |||||||||||
| Weighted average discount rate | 3.46% | 3.86% | 3.96% | 3.46% | 3.86% | 3.96% | |||||
| Rate of increase in future compensation | N/A | N/A | N/A | N/A | N/A | N/A | |||||
| Expected long-term rate of return | 6.50% | 6.50% | 7.00% | 6.50% | 6.50% | 7.00% | |||||
Pension Plan and SERP Assets
The Company's investment strategies are to invest in a prudent manner for the purpose of providing benefits to participants in the pension plan and the SERP. The investment strategies are targeted to maximize the total return of the portfolio net of inflation, spending and expenses. Risk is controlled through diversification of asset types and investments in domestic and international equities and fixed income securities. The target allocations for plan assets are shown in the tables below. Equity securities primarily include investments in common stocks. Debt securities include government agency and commercial bonds. Other investments consist of money market mutual funds.
The weighted average expected long-term rate of return on pension plan and SERP assets is developed in consultation with the plans actuary. It is primarily based upon industry trends and consensus rates of return which are then adjusted to reflect the specific asset allocations and historical rates of return of the Company's plan assets. The following assumptions were used in determining the total long term rate of return: equity securities were assumed to have a long-term rate of return of approximately 8.70%8.85% and debt securities were assumed to have a long-term rate of return of approximately 3.0%. These rates of return were adjusted to reflect an approximate target allocation of 60% equity securities and 40% debt securities with a small downward adjustment due to investments in the “Other” category, which consist of low yielding money market mutual funds.
Certain asset types and investment strategies are prohibited including, the investment in commodities, options, futures, short sales, margin transactions and non-marketable securities.
The Company's pension plan asset allocation at year-end 20182019 and 2017,2018, target allocation for 2019,2020, and expected long-term rate of return by asset category are as follows:
| Percentage of Plan | Weighted | ||||||
| Target | Assets | Average Expected | |||||
| Allocation | at Year End | Long-Term Rate | |||||
| Asset Category | 2019 | 2018 | 2017 | of Return | |||
| Equity securities | 55-65% | 59% | 63% | 8.69% | |||
| Debt securities | 35-45% | 40% | 33% | 3.00% | |||
| Other | 5-10% | 1% | 4% | 0.10% | |||
| Total | 100% | 100% | 6.50% | ||||
| | | | | | | | | |
| | | | Percentage of Plan | | Weighted |
| ||
| | Target | | Assets | | Average Expected |
| ||
| | Allocation | | at Year End | | Long-Term Rate |
| ||
Asset Category |
| 2020 |
| 2019 |
| 2018 |
| of Return |
|
Equity securities |
| 55-65 | % | 61 | % | 59 | % | 8.85 | % |
Debt securities |
| 35-45 | % | 36 | % | 40 | % | 3.00 | % |
Other |
| 5-10 | % | 3 | % | 1 | % | 0.10 | % |
Total |
| | | 100 | % | 100 | % | 6.50 | % |
The Company'sCompany’s SERP plan asset allocation at year-end 20182019 and 2017,2018, target allocation for 2019,2020, and expected long-term rate of return by asset category are as follows:
| | | | | | | | | |
| | | | Percentage of Plan | | Weighted |
| ||
| | Target | | Assets | | Average Expected |
| ||
| | Allocation | | at Year End | | Long-Term Rate |
| ||
Asset Category |
| 2020 |
| 2019 |
| 2018 |
| of Return |
|
Equity securities |
| 55-65 | % | 65 | % | 58 | % | 8.85 | % |
Debt securities |
| 35-45 | % | 34 | % | 40 | % | 3.00 | % |
Other |
| 5-10 | % | 1 | % | 2 | % | 0.10 | % |
Total |
| | | 100 | % | 100 | % | 6.50 | % |
97
| Percentage of Plan | Weighted | ||||||
| Target | Assets | Average Expected | |||||
| Allocation | at Year End | Long-Term Rate | |||||
| Asset Category | 2019 | 2018 | 2017 | of Return | |||
| Equity securities | 55-65% | 58% | 66% | 8.69% | |||
| Debt securities | 35-45% | 40% | 32% | 3.00% | |||
| Other | 5-10% | 2% | 2% | 0.10% | |||
| Total | 100% | 100% | 6.50% | ||||
NOTE 11 – PENSION AND OTHER POSTRETIREMENT PLANS (continued)
Fair Value of Pension Plan and SERP Assets
Fair value is the exchange price that would be received for an asset in the principal or most advantageous market for the asset in an orderly transaction between market participants on the measurement date. Also a fair value hierarchy requires an entity to maximize the use of observable inputs and minimize the use of unobservable inputs when measuring fair value.
The Company used the following methods and significant assumptions to estimate the fair value of each type of financial instrument:
Equity and debt securities: The fair values of securities are determined on a recurring basis by obtaining quoted prices on nationally recognized securities exchanges (Level 1 inputs) or pricing models, which utilize significant observable inputs such as matrix pricing. This is a mathematical technique widely used in the industry to value debt securities without relying exclusively on quoted prices for the specific securities but rather by relying on the securities’ relationship to other benchmark quoted securities (Level 2 inputs).
The fair values of the Company'sCompany’s pension plan assets at December 31, 2019, by asset category are as follows:
| | | | | | | | | | | | |
| | | | | Quoted Prices | | | | | | | |
| | | | | in Active | | Significant | | Significant | |||
| | | | | Markets for | | Observable | | Unobservable | |||
| | | | | Identical Assets | | Inputs | | Inputs | |||
Asset Category |
| Total |
| (Level 1) |
| (Level 2) |
| (Level 3) | ||||
(dollars in thousands) | | | | | | | | | | | | |
Equity securities - US large cap common stocks | | $ | 912 | | $ | 912 | | $ | 0 | | $ | 0 |
Equity securities - US mid cap stock mutual funds | |
| 115 | |
| 115 | |
| 0 | |
| 0 |
Equity securities - US small cap stock mutual funds | |
| 119 | |
| 119 | |
| 0 | |
| 0 |
Equity securities - international stock mutual funds | |
| 257 | |
| 257 | |
| 0 | |
| 0 |
Equity securities - emerging markets stock mutual funds | |
| 111 | |
| 111 | |
| 0 | |
| 0 |
Debt securities - intermediate term bond mutual funds | |
| 402 | |
| 402 | |
| 0 | |
| 0 |
Debt securities - short term bond mutual funds | |
| 480 | |
| 480 | |
| 0 | |
| 0 |
Cash - money market account | |
| 74 | |
| 74 | |
| 0 | |
| 0 |
Total | | $ | 2,470 | | $ | 2,470 | | $ | 0 | | $ | 0 |
Total pension plan assets available for benefits also include $2,000 in accrued interest and dividend income.
The fair values of the Company’s pension plan assets at December 31, 2018, by asset category are as follows:
| | | | | | | | | | | | |
| | | | | Quoted Prices | | | | | | | |
| | | | | in Active | | Significant | | Significant | |||
| | | | | Markets for | | Observable | | Unobservable | |||
| | | | | Identical Assets | | Inputs | | Inputs | |||
Asset Category |
| Total |
| (Level 1) |
| (Level 2 ) |
| (Level 3) | ||||
(dollars in thousands) |
| |
|
| |
|
| |
|
| |
|
Equity securities - US large cap common stocks | | $ | 784 | | $ | 784 | | $ | 0 | | $ | 0 |
Equity securities - US mid cap stock mutual funds | |
| 107 | |
| 107 | |
| 0 | |
| 0 |
Equity securities - US small cap stock mutual funds | |
| 114 | |
| 114 | |
| 0 | |
| 0 |
Equity securities - international stock mutual funds | |
| 225 | |
| 225 | |
| 0 | |
| 0 |
Equity securities - emerging markets stock mutual funds | |
| 49 | |
| 49 | |
| 0 | |
| 0 |
Debt securities - intermediate term bond mutual funds | |
| 309 | |
| 309 | |
| 0 | |
| 0 |
Debt securities - short term bond mutual funds | |
| 543 | |
| 543 | |
| 0 | |
| 0 |
Cash - money market account | |
| 17 | |
| 17 | |
| 0 | |
| 0 |
Total | | $ | 2,148 | | $ | 2,148 | | $ | 0 | | $ | 0 |
98
| Quoted Prices | |||||||
| in Active | Significant | Significant | |||||
| Markets for | Observable | Unobservable | |||||
| Identical Assets | Inputs | Inputs | |||||
| Asset Category | Total | (Level 1) | (Level 2 ) | (Level 3) | |||
| (dollars in thousands) | |||||||
| Equity securities - US large cap common stocks | $784 | $784 | $0 | $0 | |||
| Equity securities - US mid cap stock mutual funds | 107 | 107 | 0 | 0 | |||
| Equity securities - US small cap stock mutual funds | 114 | 114 | 0 | 0 | |||
| Equity securities - international stock mutual funds | 225 | 225 | 0 | 0 | |||
| Equity securities - emerging markets stock mutual funds | 49 | 49 | 0 | 0 | |||
| Debt securities - intermediate term bond mutual funds | 309 | 309 | 0 | 0 | |||
| Debt securities - short term bond mutual funds | 543 | 543 | 0 | 0 | |||
| Cash - money market account | 17 | 17 | 0 | 0 | |||
| Total | $2,148 | $2,148 | $0 | $0 | |||
NOTE 11 – PENSION AND OTHER POSTRETIREMENT PLANS (continued)
Total pension plan assets available for benefits also include $3,000 in accrued interest and dividend income.
There were no Level 2 or 3 securities during either year.
The fair values of the Company's pension planCompany’s SERP assets at December 31, 2017,2019, by asset category are as follows:
| Quoted Prices | |||||||
| in Active | Significant | Significant | |||||
| Markets for | Observable | Unobservable | |||||
| Identical Assets | Inputs | Inputs | |||||
| Asset Category | Total | (Level 1) | (Level 2 ) | (Level 3) | |||
| (dollars in thousands) | |||||||
| Equity securities - US large cap common stocks | $911 | $911 | $0 | $0 | |||
| Equity securities - US mid cap stock mutual funds | 119 | 119 | 0 | 0 | |||
| Equity securities - US small cap stock mutual funds | 125 | 125 | 0 | 0 | |||
| Equity securities - international stock mutual funds | 240 | 240 | 0 | 0 | |||
| Equity securities - emerging markets stock mutual funds | 95 | 95 | 0 | 0 | |||
| Debt securities - intermediate term bond mutual funds | 344 | 344 | 0 | 0 | |||
| Debt securities - short term bond mutual funds | 387 | 387 | 0 | 0 | |||
| Debt securities - commercial | 50 | 0 | 50 | 0 | |||
| Cash - money market account | 82 | 82 | 0 | 0 | |||
| Total | $2,353 | $2,303 | $50 | $0 | |||
| | | | | | | | | | | | |
| | | | | Quoted Prices | | | | | | | |
| | | | | in Active | | Significant | | Significant | |||
| | | | | Markets for | | Observable | | Unobservable | |||
| | | | | Identical Assets | | Inputs | | Inputs | |||
Asset Category |
| Total |
| (Level 1) |
| (Level 2 ) |
| (Level 3) | ||||
(dollars in thousands) |
| |
|
| |
|
| |
|
| |
|
Equity securities - US large cap common stocks | | $ | 353 | | $ | 353 | | $ | 0 | | $ | 0 |
Equity securities - US mid cap stock mutual funds | |
| 46 | |
| 46 | |
| 0 | |
| 0 |
Equity securities - US small cap stock mutual funds | |
| 47 | |
| 47 | |
| 0 | |
| 0 |
Equity securities - emerging markets stock mutual funds | |
| 43 | |
| 43 | |
| 0 | |
| 0 |
Equity securities - international stock mutual funds | |
| 100 | |
| 100 | |
| 0 | |
| 0 |
Debt securities - intermediate term bond mutual funds | |
| 156 | |
| 156 | |
| 0 | |
| 0 |
Debt securities - short term bond mutual funds | |
| 155 | |
| 155 | |
| 0 | |
| 0 |
Cash - money market account | |
| 13 | |
| 13 | |
| 0 | |
| 0 |
Total | | $ | 913 | | $ | 913 | | $ | 0 | | $ | 0 |
Total pensionSERP plan assets available for benefits also include $3,000$1,000 in accrued interest and dividend income.
The fair values of the Company's SERP assets at December 31, 2018, by asset category are as follows:
| Quoted Prices | |||||||
| in Active | Significant | Significant | |||||
| Markets for | Observable | Unobservable | |||||
| Identical Assets | Inputs | Inputs | |||||
| Asset Category | Total | (Level 1) | (Level 2 ) | (Level 3) | |||
| (dollars in thousands) | |||||||
| Equity securities - US large cap common stocks | $322 | $322 | $0 | $0 | |||
| Equity securities - US mid cap stock mutual funds | 43 | 43 | 0 | 0 | |||
| Equity securities - US small cap stock mutual funds | 43 | 43 | 0 | 0 | |||
| Equity securities - emerging markets stock mutual funds | 18 | 18 | 0 | 0 | |||
| Equity securities - international stock mutual funds | 89 | 89 | 0 | 0 | |||
| Debt securities - intermediate term bond mutual funds | 123 | 123 | 0 | 0 | |||
| Debt securities - short term bond mutual funds | 231 | 231 | 0 | 0 | |||
| Cash - money market account | 15 | 15 | 0 | 0 | |||
| Total | $884 | $884 | $0 | $0 | |||
| | | | | | | | | | | | |
| | | | | Quoted Prices | | | | | | | |
| | | | | in Active | | Significant | | Significant | |||
| | | | | Markets for | | Observable | | Unobservable | |||
| | | | | Identical Assets | | Inputs | | Inputs | |||
Asset Category |
| Total |
| (Level 1) |
| (Level 2) |
| (Level 3) | ||||
(dollars in thousands) |
| |
|
| |
|
| |
|
| |
|
Equity securities - US large cap common stocks | | $ | 322 | | $ | 322 | | $ | 0 | | $ | 0 |
Equity securities - US mid cap stock mutual funds | |
| 43 | |
| 43 | |
| 0 | |
| 0 |
Equity securities - US small cap stock mutual funds | |
| 43 | |
| 43 | |
| 0 | |
| 0 |
Equity securities - emerging markets stock mutual funds | |
| 18 | |
| 18 | |
| 0 | |
| 0 |
Equity securities - international stock mutual funds | |
| 89 | |
| 89 | |
| 0 | |
| 0 |
Debt securities - intermediate term bond mutual funds | |
| 123 | |
| 123 | |
| 0 | |
| 0 |
Debt securities - short term bond mutual funds | |
| 231 | |
| 231 | |
| 0 | |
| 0 |
Cash - money market account | |
| 15 | |
| 15 | |
| 0 | |
| 0 |
Total | | $ | 884 | | $ | 884 | | $ | 0 | | $ | 0 |
Total SERP plan assets available for benefits also include $1,000 in accrued interest and dividend income.
| Quoted Prices | |||||||
| in Active | Significant | Significant | |||||
| Markets for | Observable | Unobservable | |||||
| Identical Assets | Inputs | Inputs | |||||
| Asset Category | Total | (Level 1) | (Level 2 ) | (Level 3) | |||
| (dollars in thousands) | |||||||
| Equity securities - US large cap common stocks | $422 | $422 | $0 | $0 | |||
| Equity securities - US mid cap stock mutual funds | 58 | 58 | 0 | 0 | |||
| Equity securities - US small cap stock mutual funds | 60 | 60 | 0 | 0 | |||
| Equity securities - emerging markets stock mutual funds | 42 | 42 | 0 | 0 | |||
| Equity securities - international stock mutual funds | 115 | 115 | 0 | 0 | |||
| Debt securities - intermediate term bond mutual funds | 146 | 146 | 0 | 0 | |||
| Debt securities - short term bond mutual funds | 158 | 158 | 0 | 0 | |||
| Debt securities - commercial | 30 | 0 | 30 | 0 | |||
| Cash - money market account | 15 | 15 | 0 | 0 | |||
| Total | $1,046 | $1,016 | $30 | $0 | |||
There were no significant transfers between Level 1 and Level 2 or 3 securities during 2018 and 2017.
Contributions
The Company expectsdoes not expect to contribute $0 to its pension plan and $0 to itsor SERP planplans in 2019.2020.
99
Estimated Future Benefit Payments
The following benefit payments are expected to be paid over the next ten years:
| Pension | SERP | ||||||
| Plan Year | Benefits | Benefits | |||||
| (dollars in thousands) | |||||||
| 2019 | $223 | $133 | |||||
| 2020 | 183 | 127 | |||||
| 2021 | 195 | 121 | |||||
| 2022 | 194 | 114 | |||||
| 2023 | 180 | 106 | |||||
| 2024-2028 | 829 | 392 |
| | | | | | |
| | Pension | | SERP | ||
Plan Year |
| Benefits |
| Benefits | ||
(dollars in thousands) | | | | | | |
2020 | | $ | 259 | | $ | 132 |
2021 | |
| 220 | |
| 126 |
2022 | |
| 228 | |
| 120 |
2023 | |
| 205 | |
| 112 |
2024 | |
| 202 | |
| 103 |
2025-2029 | |
| 870 | |
| 364 |
NOTE 12
– OTHER BENEFIT PLANS401(k) Plan
The Company maintains a 401(k) profit sharing plan for all employees meeting certain age and service requirements. The 401(k) plan allows employees to contribute up to the maximum amount allowable under the Internal Revenue Code, which are matched based upon the percentage of budgeted net income earned during the year on the first 6% of the compensation contributed. The expense recognized from matching was $1.8 million, $1.8 million and $1.7 million in 2019, 2018 and $1.6 million in 2018, 2017, and 2016.
Deferred Compensation Plan
Effective January 1, 2004, the Company adopted the Lake City Bank Deferred Compensation Plan. The purpose of the deferred compensation plan is to extend full 401(k) type retirement benefits to certain individuals without regard to statutory limitations under tax qualified plans. A liability is accrued by the Company for its obligation under this plan. The (income) expense recognized for each ofwas $461,000, ($31,000) and $456,000 during the last three years was ($31,000), $456,000ended December 31, 2019, 2018 and $124,000 resulting2017, respectively. This resulted in a deferred compensation liability of $3.3 million, $2.9$4.2 million and $2.5$3.3 million as of year-end 2018, 20172019 and 2016,2018, respectively. The deferred compensation plan is funded solely by participant contributions and does not receive a Company match.
Employee Agreements
Under employment agreements with certain executives, certain events leading to separation from the Company could result in cash payments totaling $5.3 million as of December 31, 2018.2019. On December 31, 2018,2019, no amounts were accrued on these contingent obligations.
Directors’ Deferred Compensation and Cash Plans
The Company maintains a directors’ deferred compensation plan and a cash plan. The amount owed to directors for fees under the deferred directors’ compensation and cash plans as of December 31, 2019 and 2018 was $4.4 million and 2017 was $4.0 million, and $3.6 million.respectively. The related expense for the deferred directors’ compensation and cash plans as offor the years ended December 31, 2019, 2018 and 2017 was $515,000, $486,000 and 2016 was $703,000, $491,000, and $501,000.respectively.
100
On December 22, 2017, the Tax Cuts and Jobs Act (“Act”) was enacted into law and, among other items, reduces the corporate income tax rate from 35% to 21%, effective January 1, 2018. The enactment of this law resulted in a lower federal income tax rate resulting in a reduction of the benefit provided by the Company’s existing deferred tax assets.
In accordance with ASC Topic 740, “Income Taxes”, the Company revalued its net deferred tax asset based on facts and circumstances available for the reporting period ending December 31, 2017 in which the Act was enacted and through the time the Company issues its financial statements for that reporting period. As a result of this revaluation, the Company recorded a non-cash, non-operating and non-recurringan income tax provision of $4.1 million for the period ending December 31, 2017. In addition, through the preparation the Company’s 2017 corporate tax return and the completion of cost segregation studies on new construction projects, the Company recognized a tax benefit of $408,000 for the year ending December 31, 2018.
Income tax expense for the years ended December 31, 2019, 2018 2017 and 20162017 consisted of the following:
| (dollars in thousands) | 2018 | 2017 | 2016 | ||
| Current federal | $16,871 | $27,064 | $23,749 | ||
| Deferred federal | 707 | (199) | 268 | ||
| Revalue deferred taxes due to tax reform | (408) | 4,137 | 0 | ||
| Current state | 1,462 | 1,559 | 1,086 | ||
| Deferred state | (99) | (257) | 30 | ||
| Total income tax expense . . . . . . . . . . . . . . . . . . . . . . . . . . . . . . . . . . . . . . . . . . | $18,533 | $32,304 | $25,133 |
| | | | | | | | | |
(dollars in thousands) |
| 2019 |
| 2018 |
| 2017 | |||
Current federal | | $ | 19,430 | | $ | 16,871 | | $ | 27,064 |
Deferred federal | |
| (408) | |
| 707 | |
| (199) |
Revalue deferred taxes due to tax reform | |
| 0 | |
| (408) | |
| 4,137 |
Current state | |
| 1,394 | |
| 1,462 | |
| 1,559 |
Deferred state | |
| (78) | |
| (99) | |
| (257) |
Total income tax expense | | $ | 20,338 | | $ | 18,533 | | $ | 32,304 |
The differences between financial statement tax expense and amounts computed by applying the statutory federal income tax rate of 21% for 2019 and 2018 and 35% for 2017 and 2016 to income before income taxes were as follows:
| | | | | | | | | |
(dollars in thousands) |
| 2019 |
| 2018 |
| 2017 | |||
Income taxes at statutory federal rate of 21% (2019 and 2018) and 35% (2017) | | $ | 22,551 | | $ | 20,778 | | $ | 31,372 |
Increase (decrease) in taxes resulting from: | |
| | |
|
| |
|
|
Tax exempt income | |
| (1,682) | |
| (1,434) | |
| (2,015) |
Nondeductible expense | |
| 194 | |
| 165 | |
| 193 |
State income tax, net of federal tax effect | |
| 1,040 | |
| 1,077 | |
| 846 |
Captive insurance premium income | |
| (310) | |
| (292) | |
| (378) |
Tax credits | |
| (548) | |
| (412) | |
| (326) |
Bank owned life insurance | |
| (573) | |
| (303) | |
| (619) |
Long - term incentive plan | |
| (421) | |
| (641) | |
| (854) |
Revaluation deferred tax asset at 21% rate | |
| 0 | |
| (408) | |
| 4,137 |
Other | |
| 87 | |
| 3 | |
| (52) |
Total income tax expense | | $ | 20,338 | | $ | 18,533 | | $ | 32,304 |
101
| (dollars in thousands) | 2018 | 2017 | 2016 | ||
| Income taxes at statutory federal rate of 21% (2018) and 35% (prior years) | $20,778 | $31,372 | $27,026 | ||
| Increase (decrease) in taxes resulting from: | |||||
| Tax exempt income | (1,434) | (2,015) | (1,498) | ||
| Nondeductible expense | 165 | 193 | 190 | ||
| State income tax, net of federal tax effect | 1,077 | 846 | 726 | ||
| Captive insurance premium income | (292) | (378) | (361) | ||
| Tax credits | (412) | (326) | (311) | ||
| Bank owned life insurance | (303) | (619) | (554) | ||
| Long - term incentive plan | (641) | (854) | 0 | ||
| Revaluation deferred tax asset at 21% rate | (408) | 4,137 | 0 | ||
| Other | 3 | (52) | (85) | ||
| Total income tax expense . . . . . . . . . . . . . . . . . . . . . . . . . . . . . . . . . . . . . . . . . . . . . . . . . . . . . . . . . . . . . . | $18,533 | $32,304 | $25,133 |
The net deferred tax asset recorded in the consolidated balance sheets at December 31, 20182019 and 20172018 consisted of the following:
| (dollars in thousands) | 2018 | 2017 | |
| Deferred tax assets: | |||
| Bad debts | $12,478 | $12,043 | |
| Pension and deferred compensation liability | 1,188 | 1,028 | |
| Nonaccrual loan interest | 937 | 970 | |
| Long-term incentive plan | 2,357 | 2,043 | |
| Other | 506 | 403 | |
| 17,466 | 16,487 | ||
| Deferred tax liabilities: | |||
| Depreciation | 4,583 | 3,614 | |
| Loan servicing rights | 877 | 793 | |
| State taxes | 447 | 426 | |
| Intangible assets | 1,280 | 1,261 | |
| REIT spillover dividend | 1,231 | 1,242 | |
| Prepaid expenses | 786 | 752 | |
| Other | 475 | 412 | |
| 9,679 | 8,500 | ||
| Valuation allowance | 0 | 0 | |
| Net deferred tax asset . . . . . . . . . . . . . . . . . . . . . . . . . . . . . . . . . . . . . . . . . . . . . . . . . . . . . . . . . . . . . . . . . . . . . . . . . . . . . . . . . . . . . . | $7,787 | $7,987 |
| | | | | | |
(dollars in thousands) |
| 2019 |
| 2018 | ||
Deferred tax assets: |
| |
|
| |
|
Bad debts | | $ | 12,945 | | $ | 12,478 |
Pension and deferred compensation liability | |
| 1,505 | |
| 1,188 |
Nonaccrual loan interest | |
| 1,104 | |
| 937 |
Long-term incentive plan | |
| 2,281 | |
| 2,357 |
Lease liability | | | 1,303 | | | 0 |
Other | |
| 510 | |
| 506 |
| |
| 19,648 | |
| 17,466 |
Deferred tax liabilities: | |
|
| |
|
|
Depreciation | |
| 4,741 | |
| 4,583 |
Loan servicing rights | |
| 1,019 | |
| 877 |
State taxes | |
| 464 | |
| 447 |
Intangible assets | |
| 1,270 | |
| 1,280 |
REIT spillover dividend | |
| 1,401 | |
| 1,231 |
Prepaid expenses | |
| 795 | |
| 786 |
Lease Right of Use | | | 1,303 | | | 0 |
Other | |
| 382 | |
| 475 |
| |
| 11,375 | |
| 9,679 |
Valuation allowance | |
| 0 | |
| 0 |
Net deferred tax asset | | $ | 8,273 | | $ | 7,787 |
In addition to the net deferred tax assets included above, the deferred income tax asset/liabilityasset (liability) allocated to the unrealized net gain/gain (loss) on securities available for saleavailable-for-sale included in equity was ($3.6) million and $1.3 million for 2019 and ($226,000) for 2018, and 2017.respectively. The deferred income tax asset allocated to the pension plan and SERP included in equity was $512,000 and $462,000 for 2019 and $625,000 for 2018, and 2017, respectively.
The Company evaluated its deferred tax asset at year end 20182019 and has concluded that it is more likely than not that it will be realized. The Company expects to have taxable income in the future such that the deferred tax asset will be realized. Therefore, no valuation allowance is required.
Unrecognized Tax Benefits
The Company did not have any unrecognized tax benefits at December 31, 20182019 or 2017.2018. The Company does not expect the total amount of unrecognized tax benefits to significantly increase or decrease in the next twelve months.
No interest or penalties were recorded in the income statement and no amount was accrued for interest and penalties for the period ending December 31, 2019, 2018 2017 and 2016.2017. Should the accrual of any interest or penalties relative to unrecognized tax benefits be necessary, it is the Company’s policy to record such accruals in its income taxes accounts.
The Company and its subsidiaries file a consolidated U.S. federal tax return and a combined unitary return in the States of Indiana and Michigan. These returns are subject to examinations by authorities for all years after 2014.2015.
102
Loans to principal officers, directors, and their affiliates as of December 31, 20182019 and 20172018 were as follows:
| (dollars in thousands) | 2018 | 2017 | |
| Beginning balance | $105,242 | $118,305 | |
| New loans and advances | 94,542 | 79,570 | |
| Effect of changes in related parties | 0 | (66) | |
| Repayments and renewals | (116,238) | (92,567) | |
| Ending balance . . . . . . . . . . . . . . . . . . . . . . . . . . . . . . . . . . . . . . . . . . . . . . . . . . . . . . . . . . . . . . . . . . . . . . . . | $83,546 | $105,242 |
| | | | | | |
(dollars in thousands) |
| 2019 |
| 2018 | ||
Beginning balance | | $ | 83,546 | | $ | 105,242 |
New loans and advances | |
| 55,465 | |
| 94,542 |
Effect of changes in related parties | |
| (5,967) | |
| 0 |
Repayments and renewals | |
| (49,064) | |
| (116,238) |
Ending balance | | $ | 83,980 | | $ | 83,546 |
Deposits from principal officers, directors, and their affiliates at year-end 2019 were $33.3 million and there were 0 securities sold under agreements to repurchase. Deposits from principal officers, directors, and their affiliates at year-end 2018 were $12.1 million plus an additional $1.9 million included in securities sold under agreements to repurchase. Deposits from principal officers, directors, and their affiliates at year-end 2017 were $9.6 million plus an additional $862,000 included in securities sold under agreements to repurchase.
Effective April 8, 2008, the Company adopted the Lakeland Financial Corporation 2008 Equity Incentive Plan (the “2008 Plan”), which was approved by the Company’s stockholders. At its inception there were 1,125,000 shares of common stock reserved for grants of stock options, stock appreciation rights, stock awards and cash incentive awards to employees of the Company, its subsidiaries and Board. Effective April 9, 2013, the Company adopted the Lakeland Financial Corporation 2013 Equity Incentive Plan (the “2013 Plan”), which was also approved by the Company’s stockholders. At its inception the remaining shares of common stock available to grant under the 2008 Plan of 435,867 were transferred to the 2013 Plan and reserved for grants of stock options, stock appreciation rights, stock awards and cash incentive awards to employees of the Company, its subsidiaries and Board. NonvestedNon-vested shares from the 2008 Plan that are unused at vesting are added to the shares available to grant of the 2013 Plan. Effective April 12, 2017, the Company adopted the Lakeland Financial Corporation 2017 Equity Incentive Plan (the “2017 Plan”), which was also approved by the Company’s stockholders. At its inception there were 1,000,000 shares of common stock reserved for grants of stock options, stock appreciation rights, stock awards and cash incentive awards to employees of the Company, its subsidiaries and Board. As of December 31, 2018, 839,4592019, 684,926 shares were available for future grants. Certain stock awards provide for accelerated vesting if there is a change in control. The Company has a policy of issuing new shares to satisfy exercises of stock awards.
Included in net income for the years ended December 31, 2019, 2018 2017 and 20162017 was employee stock compensation expense of $4.2 million, $5.6 million $5.7 million and $4.2$5.7 million, and a related tax benefit of $1.1 million, $1.5 million and $2.2 million, and $1.7 million, respectively.
Stock Options
The equity incentive plan requires that the exercise price for options be the market price on the date the options are granted. The maximum option term is ten years and the awards usually vest over three years. The fair value of each stock option is estimated with the Black Scholes pricing model, using the following weighted-average assumptions as of the grant date for stock options granted during the years presented. Expected volatilities are based on historical volatility of the Company’s stock over the immediately preceding expected life period, as well as other factors known on the grant date that would have a significant effect on the stock price during the expected life period. The expected stock option life used is the historical option life of the similar employee base or Board. The turnover rate is based on historical data of the similar employee base as a group and the Board as a group. The risk-free interest rate is the Treasury rate on the date of grant corresponding to the expected life period of the stock option.
There were no0 stock option grants in 2019, 2018 2017 or 2016.2017. Also, there were 0 modifications of stock option awards during the years ended December 31, 2019, 2018 and 2017. As of December 31, 2019, there was 0 unrecognized compensation cost related to non-vested stock options granted under the plan.
103
All outstanding stock options were exercised during the activity in the stock option plan as ofyear ended December 31, 2018 and changes during the period then ended follows:
| Weighted- | |||||||
| Weighted- | Average | ||||||
| Average | Remaining | Aggregate | |||||
| Exercise | Contractual | Intrinsic | |||||
| Shares | Price | Term (years) | Value | ||||
| (in thousands) | |||||||
| Outstanding at beginning of the year | 7,500 | $16.03 | |||||
| Granted | 0 | 0.00 | |||||
| Exercised | (7,500) | 16.03 | |||||
| Forfeited | 0 | 0 | |||||
| Outstanding at end of the year . . . . . . . . . . . . . . . . . . . . . . . . . . . . . . . . . . . . . . | 0 | $0 | 0.0 | $0 | |||
| Options exercisable at end of the year | 0 | $0 | 0.0 | $0 |
| (dollars in thousands) | 2018 | 2017 | 2016 | ||||
| Total intrinsic value | $243 | $44 | $755 | ||||
| Cash received | 118 | 24 | 625 | ||||
| Actual tax benefit realized for tax deductions | 0 | 0 | 669 |
| | | | | | | | | |
(dollars in thousands) |
| 2019 |
| 2018 |
| 2017 | |||
Total intrinsic value | | $ | 0 | | $ | 243 | | $ | 44 |
Cash received | |
| 0 | |
| 118 | |
| 24 |
Actual tax benefit realized for tax deductions | |
| 0 | |
| 0 | |
| 0 |
Restricted Stock Awards and Units
The fair value of restricted stock awards and units is the closing price of the Company’s common stock on the date of grant adjusted for the present value of expected dividends. The restricted stock awards fully vest on either the first or third anniversary ofbased upon a schedule determined at the grant date, with the exception of 14,80015,600 shares included as vested, below, which vested on the grant date.
A summary of the changes in the Company’s nonvestednon-vested shares for the year follows:
| Weighted-Average | |||
| Grant-Date | |||
| Nonvested Shares | Shares | Fair Value | |
| Nonvested at January 1, 2018 | 500 | $41.22 | |
| Granted | 15,300 | 49.09 | |
| Vested | (14,800) | 48.89 | |
| Forfeited | 0 | 0.00 | |
| Nonvested at December 31, 2018 . . . . . . . . . . . . . . . . . . . . . . . . . . . . . . . . . . . . . . . . . . . . . . . . . . . . . . . | 1,000 | $48.14 |
| | | | | |
| | | | Weighted-Average | |
| | | | Grant-Date | |
Nonvested Shares |
| Shares |
| Fair Value | |
Nonvested at January 1, 2019 |
| 1,000 | | $ | 48.14 |
Granted |
| 19,100 | |
| 44.59 |
Vested |
| (16,600) | |
| 44.56 |
Nonvested at December 31, 2019 |
| 3,500 | | $ | 45.70 |
As of December 31, 2018,2019, there was $24,000$135,000 of total unrecognized compensation cost related to nonvestednon-vested shares granted under the plan. The cost is expected to be recognized over a weighted period of 0.481.01 years. The total fair value of shares vested during the years ended December 31, 2019, 2018 and 2017 and 2016 was $737,000, $726,000 and $1.2 million, and $1.1 million.
Performance Stock Units
The fair value of stock awards is the closing price of the Company’s common stock on the date of grant adjusted for the present value of expected dividends. The expected dividend rate is assumed to be the most recent dividend rate declared by the Board on the grant date. The grant date fair value of stock awards is assumed at the target payout rate. The stock awards fully vest on the third anniversary of the grant date. The 2019-2021, 2018-2020 2017-2019 and 2016-20182017-2019 Long-Term Incentive Plans must be paid in stock and have performance conditions which include revenue growth, diluted earnings per share growth and average return on beginning equity. Shares granted below include the number of shares assumed granted based on meeting theactual performance criteria of the 2019-2021, 2018-2020 2017-2019 and 2016-20182017-2019 Long-Term Incentive Plans at December 31, 2018.
| Weighted-Average | |||
| Grant-Date | |||
| Nonvested Shares | Shares | Fair Value | |
| Nonvested at January 1, 2018 | 387,693 | $33.39 | |
| Granted | 118,282 | 46.07 | |
| Vested | (137,472) | 27.05 | |
| Forfeited | 0 | 0.00 | |
| Nonvested at December 31, 2018 . . . . . . . . . . . . . . . . . . . . . . . . . . . . . . . . . . . . . . . . . . . . . . . . . . . . . . . | 368,503 | $39.83 |
| | | | | |
| | | | Weighted-Average | |
| | | | Grant-Date | |
Nonvested Shares |
| Shares |
| Fair Value | |
Nonvested at January 1, 2019 |
| 368,503 | | $ | 39.83 |
Granted |
| 39,715 | |
| 41.78 |
Vested |
| (126,672) | |
| 29.23 |
Forfeited |
| (4,461) | |
| 45.42 |
Nonvested at December 31, 2019 |
| 277,085 | | $ | 44.86 |
As of December 31, 2018,2019, there was $5.5$3.4 million of total unrecognized compensation cost related to nonvestednon-vested shares granted under the Plan. The cost is expected to be recognized over a weighted period of 1.661.55 years. The total fair value of shares vested during the year ended December 31, 2019, 2018 and 2017 and 2016 was $5.7 million, $6.6 million and $5.1 million, and $4.1 million, respectively. AtDuring the years ended December 31, 2019, 2018 and 2017, 126,672, 137,472 and 2016, 137,472, 112,055 and 95,600 shares vested, respectively.
104
NOTE 16 – CAPITAL REQUIREMENTS AND RESTRICTIONS ON RETAINED EARNINGS
The Company became a financial holding company effective May 30, 2012 and is now required to be well capitalized under the applicable regulatory guidelines. The Company and the Bank are subject to various regulatory capital requirements administered by federal banking agencies. Failure to meet certain heightened minimum capital requirements can initiate certain mandatory, and possibly discretionary actions by regulators that, if undertaken, could have a direct material effect on the financial statements. Under capital adequacy guidelines and the regulatory framework for prompt corrective action, the Company and the Bank must meet specific capital guidelines that involve quantitative measures of the assets, liabilities, and certain off-balance sheet items as calculated under regulatory accounting practices. The capital amounts and classification are also subject to qualitative judgments by the regulators about components, risk weighting and other factors.
The capital adequacy requirements were heightened by the Basel III Rules, which went into effect on January 1, 2015 with a phase-in period for certain aspects of the rule through 2019. Under the Basel III rules, the Company must hold a capital conservation buffer above the adequately capitalized risk-based capital ratios. The capital conservation buffer is being phased in from 0.000% for 2015 to 2.50% by 2019. The capital conservation buffer for 2019 and 2018 was 2.50% and 2017 is 1.875% and 1.25%, respectively. The net unrealized gain or loss on available for saleavailable-for-sale securities is not included in computing regulatory capital. The quantitative measures established by regulation to ensure capital adequacy that were in effect on December 31, 20182019 and 2017,2018, require the Company and the Bank to maintain minimum capital amounts and ratios (set forth in the following table) of Total, Tier I and Common Equity Tier 1 capital (as defined in the regulations) to risk-weighted assets (as defined in the regulation), and of Tier I capital (as defined in the regulation) to average assets (as defined). Management believes, as of the years ended December 31, 20182019 and 2017,2018, that the Company and the Bank met all capital adequacy requirements to which they are subject.
105
As of December 31, 2018,2019, the most recent notification from the federal regulators categorized the Company and the Bank as well capitalized under the regulatory framework for prompt corrective action. To be categorized as well capitalized, the Company and the Bank must maintain minimum Total risk-based capital ratios, Tier I risk-based capital ratios and Tier I leverage capital ratios as set forth in the table. There have been no conditions or events since that notification that management believes have changed the Company and the Bank’s category.
| Minimum Required to | |||||||||||||||
| Minimum Required | For Capital Adequacy | Be Well Capitalized | |||||||||||||
| For Capital | Purposes Plus Capital | Under Prompt Corrective | |||||||||||||
| Actual | Adequacy Purposes | Conservation Buffer | Action Regulations | ||||||||||||
| (dollars in thousands) | Amount | Ratio | Amount | Ratio | Amount | Ratio | Amount | Ratio | |||||||
| As of December 31, 2018: | |||||||||||||||
| Total Capital (to Risk | |||||||||||||||
| Weighted Assets) | |||||||||||||||
| Consolidated | $601,379 | 14.20% | $338,690 | 8.00% | $418,070 | N/A | N/A | N/A | |||||||
| Bank | $583,206 | 13.80% | $338,098 | 8.00% | $417,340 | 9.875% | $422,623 | 10.00% | |||||||
| Tier I Capital (to Risk | |||||||||||||||
| Weighted Assets) | |||||||||||||||
| Consolidated | $552,836 | 13.06% | $254,017 | 6.00% | $333,398 | N/A | N/A | N/A | |||||||
| Bank | $534,664 | 12.65% | $253,574 | 6.00% | $332,815 | 7.875% | $338,098 | 8.00% | |||||||
| Common Equity Tier 1 (CET1) | |||||||||||||||
| Consolidated | $522,836 | 12.35% | $190,513 | 4.50% | $269,893 | N/A | N/A | N/A | |||||||
| Bank | $534,664 | 12.65% | $190,180 | 4.50% | $269,422 | 6.375% | $274,705 | 6.50% | |||||||
| Tier I Capital (to Average Assets) | |||||||||||||||
| Consolidated | $552,836 | 11.44% | $193,305 | 4.00% | $193,305 | N/A | N/A | N/A | |||||||
| Bank | $534,664 | 11.06% | $193,312 | 4.00% | $193,312 | 4.00% | $241,639 | 5.00% | |||||||
| As of December 31, 2017: | |||||||||||||||
| Total Capital (to Risk | |||||||||||||||
| Weighted Assets) | |||||||||||||||
| Consolidated | $541,475 | 13.26% | $326,782 | 8.00% | $377,842 | N/A | N/A | N/A | |||||||
| Bank | $525,482 | 12.89% | $326,140 | 8.00% | $377,099 | 9.250% | $407,675 | 10.00% | |||||||
| Tier I Capital (to Risk | |||||||||||||||
| Weighted Assets) | |||||||||||||||
| Consolidated | $494,265 | 12.10% | $245,087 | 6.00% | $296,147 | N/A | N/A | N/A | |||||||
| Bank | $478,272 | 11.73% | $244,605 | 6.00% | $295,564 | 7.250% | $326,140 | 8.00% | |||||||
| Common Equity Tier 1 (CET1) | |||||||||||||||
| Consolidated | $464,265 | 11.37% | $183,815 | 4.50% | $234,875 | N/A | N/A | N/A | |||||||
| Bank | $478,272 | 11.73% | $183,454 | 4.50% | $234,413 | 5.750% | $264,988 | 6.50% | |||||||
| Tier I Capital (to Average Assets) | |||||||||||||||
| Consolidated | $494,265 | 10.76% | $183,793 | 4.00% | $183,793 | N/A | N/A | N/A | |||||||
| Bank | $478,272 | 10.44% | $183,187 | 4.00% | $183,187 | 4.00% | $228,984 | 5.00% | |||||||
| | | | | | | | | | | | | | | | | | | | | |
| | | | | | | | | | | | | | | | | Minimum Required to |
| |||
| | | | | | | Minimum Required | | For Capital Adequacy | | Be Well Capitalized |
| |||||||||
| | | | | | | For Capital | | Purposes Plus Capital | | Under Prompt Corrective |
| |||||||||
| | Actual | | Adequacy Purposes | | Conservation Buffer | | Action Regulations |
| ||||||||||||
(dollars in thousands) |
| Amount |
| Ratio |
| Amount |
| Ratio |
| Amount |
| Ratio |
| Amount |
| Ratio |
| ||||
As of December 31, 2019: |
| |
|
|
|
| |
|
|
|
| |
|
|
|
| |
|
|
| |
Total Capital (to Risk Weighted Assets) |
| |
|
|
|
| |
|
|
|
| |
|
|
|
| |
|
|
| |
Consolidated | | $ | 631,723 |
| 14.36 | % | $ | 351,894 |
| 8.00 | % | $ | 461,862 |
| N/A |
| | N/A |
| N/A | |
Bank | | $ | 616,386 |
| 14.04 | % | $ | 351,227 |
| 8.00 | % | $ | 460,985 |
| 10.50 | % | $ | 439,034 |
| 10.00 | % |
Tier I Capital (to Risk Weighted Assets) | |
|
|
|
| |
|
|
|
| |
|
|
|
| |
|
|
|
| |
Consolidated | | $ | 580,982 |
| 13.21 | % | $ | 263,921 |
| 6.00 | % | $ | 373,887 |
| N/A | |
| N/A |
| N/A | |
Bank | | $ | 565,645 |
| 12.88 | % | $ | 263,420 |
| 6.00 | % | $ | 373,179 |
| 8.50 | % | $ | 351,227 |
| 8.00 | % |
Common Equity Tier 1 (CET1) | |
|
|
|
| |
|
|
|
| |
|
|
|
| |
|
|
|
| |
Consolidated | | $ | 580,982 |
| 13.21 | % | $ | 197,941 |
| 4.50 | % | $ | 307,908 |
| N/A | |
| N/A |
| N/A | |
Bank | | $ | 565,645 |
| 12.88 | % | $ | 197,565 |
| 4.50 | % | $ | 307,324 |
| 7.00 | % | $ | 285,372 |
| 6.50 | % |
Tier I Capital (to Average Assets) | |
| |
| | |
|
|
|
| |
|
|
|
| |
|
|
|
| |
Consolidated | | $ | 580,982 |
| 11.67 | % | $ | 199,099 |
| 4.00 | % | $ | 199,099 |
| N/A | |
| N/A |
| N/A | |
Bank | | $ | 565,645 |
| 11.43 | % | $ | 197,923 |
| 4.00 | % | $ | 197,923 |
| 4.00 | % | $ | 247,404 |
| 5.00 | % |
| | | | | | | | | | | | | | | | | | | | | |
As of December 31, 2018: | |
|
|
|
| |
|
|
|
| |
|
|
|
| |
|
|
|
| |
Total Capital (to Risk Weighted Assets) | |
|
|
|
| |
|
|
|
| |
|
|
|
| |
|
|
|
| |
Consolidated | | $ | 601,379 |
| 14.20 | % | $ | 338,690 |
| 8.00 | % | $ | 418,070 |
| N/A |
| | N/A |
| N/A | |
Bank | | $ | 583,206 |
| 13.80 | % | $ | 338,098 |
| 8.00 | % | $ | 417,340 |
| 9.875 | % | $ | 422,623 |
| 10.00 | % |
Tier I Capital (to Risk Weighted Assets) | |
|
|
|
| |
|
|
|
| |
|
|
|
| |
|
|
|
| |
Consolidated | | $ | 552,836 |
| 13.06 | % | $ | 254,017 |
| 6.00 | % | $ | 333,398 |
| N/A | |
| N/A |
| N/A | |
Bank | | $ | 534,664 |
| 12.65 | % | $ | 253,574 |
| 6.00 | % | $ | 332,815 |
| 7.875 | % | $ | 338,098 |
| 8.00 | % |
Common Equity Tier 1 (CET1) | |
|
|
|
| |
|
|
|
| |
|
|
|
| |
|
|
|
| |
Consolidated | | $ | 522,836 |
| 12.35 | % | $ | 190,513 |
| 4.50 | % | $ | 269,893 |
| N/A | |
| N/A |
| N/A | |
Bank | | $ | 534,664 |
| 12.65 | % | $ | 190,180 |
| 4.50 | % | $ | 269,422 |
| 6.375 | % | $ | 274,705 |
| 6.50 | % |
Tier I Capital (to Average Assets) | |
|
|
|
| |
|
|
|
| |
|
|
|
| |
|
|
|
| |
Consolidated | | $ | 552,836 |
| 11.44 | % | $ | 193,305 |
| 4.00 | % | $ | 193,305 |
| N/A | |
| N/A |
| N/A | |
Bank | | $ | 534,664 |
| 11.06 | % | $ | 193,312 |
| 4.00 | % | $ | 193,312 |
| 4.00 | % | $ | 241,639 |
| 5.00 | % |
The Bank is required to obtain the approval of the Indiana Department of Financial Institutions for the payment of any dividend if the total amount of all dividends declared by the Bank during the calendar year, including the proposed dividend, would exceed the sum of the retained net income for the year-to-date combined with the retained net income for the previous two years. Indiana law defines “retained net income” to mean the net income of a specified period, calculated under the consolidated report of income instructions, less the total amount of all dividends declared for the specified period. As of December 31, 2018,2019, approximately $96.1$89.1 million was available to be paid as dividends to the Company by the Bank.
The payment of dividends by any financial institution or its holding company is affected by the requirement to maintain adequate capital pursuant to applicable capital adequacy guidelines and regulations, and a financial institution generally is prohibited from paying any dividends if, following payment thereof, the institution would be undercapitalized. As described above, the Bank exceeded its minimum capital requirements under applicable guidelines as of December 31, 2018.2019. Notwithstanding the availability of funds for dividends however, the FDIC may prohibit the payment of any dividends by the Bank if the FDIC determines such payment would constitute an unsafe or unsound practice.
106
The following tables summarize gross and net information about financial instruments and derivative instruments that are offset in the statement of financial position or that are subject to an enforceable master netting arrangement at December 31, 20182019 and 2017.
| December 31, 2018 | |||||||||||
| Gross | |||||||||||
| Gross | Amounts | Net Amounts | Gross Amounts Not | ||||||||
| Amounts of | Offset in the | presented in | Offset in the Statement | ||||||||
| Recognized | Statement of | the Statement | of Financial Position | ||||||||
| Assets/ | Financial | of Financial | Financial | Cash Collateral | |||||||
| (dollars in thousands) | Liabilities | Position | Position | Instruments | Received | Net Amount | |||||
| Assets | |||||||||||
| Interest Rate Swap Derivatives | $3,869 | $0 | $3,869 | $0 | $(760) | $3,109 | |||||
| Total Assets | $3,869 | $0 | $3,869 | $0 | $(760) | $3,109 | |||||
| Liabilities | |||||||||||
| Interest Rate Swap Derivatives | $4,025 | $0 | $4,025 | $0 | $(560) | $3,465 | |||||
| Repurchase Agreements | 75,555 | 0 | 75,555 | (75,555) | 0 | 0 | |||||
| Total Liabilities | $79,580 | $0 | $79,580 | $(75,555) | $(560) | $3,465 | |||||
| December 31, 2017 | |||||||||||
| Gross | |||||||||||
| Gross | Amounts | Net Amounts | Gross Amounts Not | ||||||||
| Amounts of | Offset in the | presented in | Offset in the Statement | ||||||||
| Recognized | Statement of | the Statement | of Financial Position | ||||||||
| Assets/ | Financial | of Financial | Financial | Cash Collateral | |||||||
| (dollars in thousands) | Liabilities | Position | Position | Instruments | Received | Net Amount | |||||
| Assets | |||||||||||
| Interest Rate Swap Derivatives | $2,441 | $0 | $2,441 | $0 | $0 | $2,441 | |||||
| Total Assets | $2,441 | $0 | $2,441 | $0 | $0 | $2,441 | |||||
| Liabilities | |||||||||||
| Interest Rate Swap Derivatives | $2,562 | $0 | $2,562 | $0 | $(750) | $1,812 | |||||
| Repurchase Agreements | 70,652 | 0 | 70,652 | (70,652) | 0 | 0 | |||||
| Total Liabilities | $73,214 | $0 | $73,214 | $(70,652) | $(750) | $1,812 | |||||
| | | | | | | | | | | | | | | | | | |
| | December 31, 2019 | ||||||||||||||||
| | | | | Gross | | | | | | | | | | | | | |
| | Gross | | Amounts | | Net Amounts | | Gross Amounts Not | | | | |||||||
| | Amounts of | | Offset in the | | presented in | | Offset in the Statement | | | | |||||||
| | Recognized | | Statement of | | the Statement | | of Financial Position | | | | |||||||
| | Assets/ | | Financial | | of Financial | | Financial | | Cash Collateral | | Net | ||||||
(dollars in thousands) |
| Liabilities |
| Position |
| Position |
| Instruments |
| Position |
| Amount | ||||||
Assets |
| |
|
| |
|
| |
|
| |
|
| |
|
| |
|
Interest Rate Swap Derivatives | | $ | 7,263 | | $ | 0 | | $ | 7,263 | | $ | 0 | | $ | 0 | | $ | 7,263 |
Total Assets | | $ | 7,263 | | $ | 0 | | $ | 7,263 | | $ | 0 | | $ | 0 | | $ | 7,263 |
Liabilities | |
|
| |
|
| |
|
| |
|
| |
|
| |
|
|
Interest Rate Swap Derivatives | | $ | 7,860 | | $ | 0 | | $ | 7,860 | | $ | 0 | | $ | (7,560) | | $ | 300 |
Repurchase Agreements | |
| 0 | |
| 0 | |
| 0 | |
| 0 | |
| 0 | |
| 0 |
Total Liabilities | | $ | 7,860 | | $ | 0 | | $ | 7,860 | | $ | 0 | | $ | (7,560) | | $ | 300 |
| | | | | | | | | | | | | | | | | | |
| | December 31, 2018 | ||||||||||||||||
| | | | | Gross | | | | | | | | | | | | | |
| | Gross | | Amounts | | Net Amounts | | Gross Amounts Not | | | | |||||||
| | Amounts of | | Offset in the | | presented in | | Offset in the Statement | | | | |||||||
| | Recognized | | Statement of | | the Statement | | of Financial Position | | | | |||||||
| | Assets/ | | Financial | | of Financial | | Financial | | Cash Collateral | | Net | ||||||
(dollars in thousands) |
| Liabilities |
| Position |
| Position |
| Instruments |
| Position |
| Amount | ||||||
Assets |
| |
|
| |
|
| |
|
| |
|
| |
|
| |
|
Interest Rate Swap Derivatives | | $ | 3,869 | | $ | 0 | | $ | 3,869 | | $ | 0 | | $ | (760) | | $ | 3,109 |
Total Assets | | $ | 3,869 | | $ | 0 | | $ | 3,869 | | $ | 0 | | $ | (760) | | $ | 3,109 |
Liabilities | |
|
| |
|
| |
|
| |
|
| |
|
| |
|
|
Interest Rate Swap Derivatives | | $ | 4,025 | | $ | 0 | | $ | 4,025 | | $ | 0 | | $ | (560) | | $ | 3,465 |
Repurchase Agreements | |
| 75,555 | |
| 0 | |
| 75,555 | |
| (75,555) | |
| 0 | |
| 0 |
Total Liabilities | | $ | 79,580 | | $ | 0 | | $ | 79,580 | | $ | (75,555) | | $ | (560) | | $ | 3,465 |
If an event of default occurs causing an early termination of an interest rate swap derivative, any early termination amount payable to one party by the other party may be reduced by set-off against any other amount payable by the one party to the other party. If a default in performance of any obligation of a repurchase agreement occurs, each party will set-off property held in respect of transactions against obligations owing in respect of any other transactions.
107
During the normal course of business, the Company becomes a party to financial instruments with off-balance sheet risk in order to meet the financing needs of its customers. These financial instruments include commitments to make loans and open-ended revolving lines of credit. Amounts as of the years ended December 31, 20182019 and 2017,2018, were as follows:
| 2018 | 2017 | ||||||
| Fixed | Variable | Fixed | Variable | ||||
| (dollars in thousands) | Rate | Rate | Rate | Rate | |||
| Commercial loan lines of credit | $63,625 | $1,337,437 | $53,998 | $1,155,096 | |||
| Commercial letters of credit | 0 | 3,245 | 0 | 50 | |||
| Standby letters of credit | 0 | 81,512 | 0 | 71,046 | |||
| Real estate mortgage loans | 2,811 | 2,881 | 4,973 | 5,722 | |||
| Real estate construction mortgage loans | 400 | 2,189 | 2,365 | 6,042 | |||
| Home equity mortgage open-ended revolving lines | 0 | 232,362 | 0 | 212,776 | |||
| Consumer loan open-ended revolving lines | 215 | 14,468 | 249 | 11,892 | |||
| Total . . . . . . . . . . . . . . . . . . . . . . . . . . . . . . . . . . . . . . . . . . . . . . . . . . . . | $67,051 | $1,674,094 | $61,585 | $1,462,624 | |||
| | | | | | | | | | | | |
| | 2019 |
| 2018 | ||||||||
|
| Fixed |
| Variable | | Fixed |
| Variable | ||||
(dollars in thousands) | | Rate | | Rate | | Rate | | Rate | ||||
Commercial loan lines of credit | | $ | 39,104 | | $ | 1,451,704 | | $ | 63,625 | | $ | 1,337,437 |
Commercial letters of credit | |
| 0 | |
| 0 | |
| 0 | |
| 3,245 |
Standby letters of credit | |
| 0 | |
| 70,932 | |
| 0 | |
| 81,512 |
Real estate mortgage loans | |
| 4,448 | |
| 1,488 | |
| 2,811 | |
| 2,881 |
Real estate construction mortgage loans | |
| 478 | |
| 2,139 | |
| 400 | |
| 2,189 |
Home equity mortgage open-ended revolving lines | |
| 0 | |
| 247,562 | |
| 0 | |
| 232,362 |
Consumer loan open-ended revolving lines | |
| 180 | |
| 17,116 | |
| 215 | |
| 14,468 |
Total | | $ | 44,210 | | $ | 1,790,941 | | $ | 67,051 | | $ | 1,674,094 |
The index on variable rate commercial loan commitments is principally the national prime rate. Interest rate ranges on commitments and open-ended revolving lines of credit for years ended December 31, 20182019 and 2017,2018, were as follows:
| 2018 | 2017 | |||||||
| Fixed | Variable | Fixed | Variable | |||||
| Rate | Rate | Rate | Rate | |||||
| Commercial loan | 0.75-14.50 | % | 2.65-10.00 | % | 2.00-14.50 | % | 2.48-9.50 | % |
| Real estate mortgage loan | 3.75-6.13 | % | 3.75-11.00 | % | 3.25-4.50 | % | 3.50-5.75 | % |
| Consumer loan open-ended revolving line | 15.00 | % | 3.88-15.00 | % | 15.00 | % | 4.00-15.00 | % |
| | | | | | | | | |
| | 2019 | | 2018 |
| ||||
| | Fixed | | Variable | | Fixed | | Variable |
|
|
| Rate |
| Rate |
| Rate |
| Rate |
|
Commercial loan |
| 0.75-14.50 | % | 2.65-9.25 | % | 0.75-14.50 | % | 2.65-10.00 | % |
Real estate mortgage loan |
| 3.13-4.00 | % | 3.75-4.25 | % | 3.75-6.13 | % | 3.75-11.00 | % |
Consumer loan open-ended revolving line |
| 15.00 | % | 3.88-15.00 | % | 15.00 | % | 3.88-15.00 | % |
Commitments, excluding open-ended revolving lines, generally have fixed expiration dates of one year or less. Open-ended revolving lines are monitored for proper performance and compliance on a monthly basis. Since many commitments expire without being drawn upon, the total commitment amount does not necessarily represent future cash requirements. The Company follows the same credit policy (including requiring collateral, if deemed appropriate) to make such commitments as it follows for those loans that are recorded in its financial statements.
The Company’s exposure to credit losses in the event of nonperformance is represented by the contractual amount of the commitments. Management does not expect any significant losses as a result of these commitments.
108
The Company operates primarily in the banking industry, which accounts for substantially all of its revenues, operating income and assets. Presented below are parent only financial statements:
CONDENSED BALANCE SHEETS
| | | | | | |
| | December 31, | ||||
(dollars in thousands) |
| 2019 |
| 2018 | ||
ASSETS |
| |
|
| |
|
Deposits with Lake City Bank | | $ | 1,762 | | $ | 1,283 |
Deposits with other depository institutions | |
| 2,104 | |
| 7,613 |
Cash | |
| 3,866 | |
| 8,896 |
Investments in banking subsidiary | |
| 582,674 | |
| 533,442 |
Investments in other subsidiaries | |
| 3,276 | |
| 3,992 |
Other assets | |
| 8,457 | |
| 6,468 |
Total assets | | $ | 598,273 | | $ | 552,798 |
LIABILITIES | |
|
| |
|
|
Dividends payable and other liabilities | | $ | 262 | | $ | 255 |
Subordinated debt | |
| 0 | |
| 30,928 |
STOCKHOLDERS’ EQUITY | |
| 598,011 | |
| 521,615 |
Total liabilities and stockholders’ equity | | $ | 598,273 | | $ | 552,798 |
109
| December 31, | |||
| (dollars in thousands) | 2018 | 2017 | |
| ASSETS | |||
| Deposits with Lake City Bank | $1,283 | $850 | |
| Deposits with other depository institutions | 7,613 | 4,969 | |
| Cash | 8,896 | 5,819 | |
| Investments in banking subsidiary | 533,442 | 482,585 | |
| Investments in other subsidiaries | 3,992 | 3,552 | |
| Other assets | 6,468 | 7,789 | |
| Total assets . . . . . . . . . . . . . . . . . . . . . . . . . . . . . . . . . . . . . . . . . . . . . . . . . . . . . . . . . . . . . . . . . . . . . . . . . . . . . | $552,798 | $499,745 | |
| LIABILITIES | |||
| Dividends payable and other liabilities | $255 | $239 | |
| Subordinated debt | 30,928 | 30,928 | |
| STOCKHOLDERS' EQUITY | 521,615 | 468,578 | |
| Total liabilities and stockholders' equity . . . . . . . . . . . . . . . . . . . . . . . . . . . . . . . . . . . . . . . . . . . . . . . . . . . | $552,798 | $499,745 | |
Years Ended December 31, | |||||
| (dollars in thousands) | 2018 | 2017 | 2016 | ||
| Dividends from Lake City Bank | $27,933 | $21,822 | $20,622 | ||
| Dividends from non-bank subsidiaries | 1,010 | 1,030 | 1,035 | ||
| Other income | 171 | 57 | 50 | ||
| Interest expense on subordinated debt | (1,643) | (1,349) | (1,190) | ||
| Miscellaneous expense | (6,422) | (6,491) | (5,006) | ||
| INCOME BEFORE INCOME TAXES AND EQUITY IN | |||||
| UNDISTRIBUTED INCOME OF SUBSIDIARIES | 21,049 | 15,069 | 15,511 | ||
| Income tax benefit | 2,795 | 2,688 | 2,483 | ||
| INCOME BEFORE EQUITY IN UNDISTRIBUTED | |||||
| INCOME OF SUBSIDIARIES | 23,844 | 17,757 | 17,994 | ||
| Equity in undistributed income of subsidiaries | 56,567 | 39,573 | 34,090 | ||
| NET INCOME . . . . . . . . . . . . . . . . . . . . . . . . . . . . . . . . . . . . . . . . . . . . . . . . . . . . . . . . . . . . . . . . . | $80,411 | $57,330 | $52,084 | ||
| COMPREHENSIVE INCOME | $75,131 | $59,047 | $47,555 | ||
| | | | | | | | | |
| | Years Ended December 31, | |||||||
(dollars in thousands) |
| 2019 |
| 2018 |
| 2017 | |||
Dividends from Lake City Bank | | $ | 57,842 | | $ | 27,933 | | $ | 21,822 |
Dividends from non-bank subsidiaries | |
| 1,302 | |
| 1,010 | |
| 1,030 |
Other income | |
| 155 | |
| 171 | |
| 57 |
Interest expense on subordinated debt | |
| (1,720) | |
| (1,643) | |
| (1,349) |
Miscellaneous expense | |
| (5,321) | |
| (6,422) | |
| (6,491) |
INCOME BEFORE INCOME TAXES AND EQUITY IN UNDISTRIBUTED INCOME OF SUBSIDIARIES | |
| 52,258 | |
| 21,049 | |
| 15,069 |
Income tax benefit | |
| 2,256 | |
| 2,795 | |
| 2,688 |
INCOME BEFORE EQUITY IN UNDISTRIBUTED INCOME OF SUBSIDIARIES | |
| 54,514 | |
| 23,844 | |
| 17,757 |
Equity in undistributed income of subsidiaries | |
| 32,533 | |
| 56,567 | |
| 39,573 |
NET INCOME | | $ | 87,047 | | $ | 80,411 | | $ | 57,330 |
COMPREHENSIVE INCOME | | $ | 105,297 | | $ | 75,131 | | $ | 59,047 |
CONDENSED STATEMENTS OF CASH FLOWS
| | | | | | | | | |
| | Years Ended December 31, | |||||||
(dollars in thousands) |
| 2019 |
| 2018 |
| 2017 | |||
Cash flows from operating activities: |
| |
|
| |
|
| |
|
Net income | | $ | 87,047 | | $ | 80,411 | | $ | 57,330 |
Adjustments to net cash from operating activities: | |
| | |
|
| |
|
|
Equity in undistributed income of subsidiaries | |
| (32,533) | |
| (56,567) | |
| (39,573) |
Other changes | |
| 3,529 | |
| 7,294 | |
| 3,586 |
Net cash from operating activities | |
| 58,043 | |
| 31,138 | |
| 21,343 |
Cash flows from financing activities | |
| | |
|
| |
|
|
Repayment of long-term debt | | | (30,928) | | | 0 | | | 0 |
Payments related to equity incentive plans | |
| (2,109) | |
| (2,435) | |
| (1,736) |
Purchase of treasury stock | |
| (515) | |
| (463) | |
| (495) |
Sales of treasury stock | |
| 118 | |
| 115 | |
| 0 |
Dividends paid | |
| (29,639) | |
| (25,278) | |
| (21,396) |
Cash flows from financing activities | |
| (63,073) | |
| (28,061) | |
| (23,627) |
Net increase (decrease) in cash and cash equivalents | |
| (5,030) | |
| 3,077 | |
| (2,284) |
Cash and cash equivalents at beginning of the year | |
| 8,896 | |
| 5,819 | |
| 8,103 |
Cash and cash equivalents at end of the year | | $ | 3,866 | | $ | 8,896 | | $ | 5,819 |
110
Years Ended December 31, | |||||
| (dollars in thousands) | 2018 | 2017 | 2016 | ||
| Cash flows from operating activities: | |||||
| Net income | $80,411 | $57,330 | $52,084 | ||
| Adjustments to net cash from operating activities: | |||||
| Equity in undistributed income of subsidiaries | (56,567) | (39,573) | (34,090) | ||
| Other changes | 7,294 | 3,586 | 3,818 | ||
| Net cash from operating activities . . . . . . . . . . . . . . . . . . . . . . . . . . . . . . . . . . . . . . . . . . . . . . . . | 31,138 | 21,343 | 21,812 | ||
| Cash flows from financing activities | |||||
| Proceeds (Payments) related to equity incentive plans | (2,435) | (1,736) | 614 | ||
| Purchase of treasury stock | (463) | (495) | (458) | ||
| Sales of treasury stock | 115 | 0 | 0 | ||
| Dividends paid | (25,278) | (21,396) | (18,200) | ||
| Cash flows from financing activities | (28,061) | (23,627) | (18,044) | ||
| Net increase in cash and cash equivalents . . . . . . . . . . . . . . . . . . . . . . . . . . . . . . . . . . . . . . . . . . . | 3,077 | (2,284) | 3,768 | ||
| Cash and cash equivalents at beginning of the year | 5,819 | 8,103 | 4,335 | ||
| Cash and cash equivalents at end of the year . . . . . . . . . . . . . . . . . . . . . . . . . . . . . . . . . . . . . . . . . | $8,896 | $5,819 | $8,103 | ||
Following are the factors used in the earnings per share computations:
| (dollars in thousand except share and per share data) | 2018 | 2017 | 2016 | ||
| Basic earnings per common share: | |||||
| Net income | $80,411 | $57,330 | $52,084 | ||
| Weighted-average common shares outstanding | 25,288,533 | 25,181,208 | 25,056,095 | ||
| Basic earnings per common share | $3.18 | $2.28 | $2.08 | ||
| Diluted earnings per common share: | |||||
| Net income | $80,411 | $57,330 | $52,084 | ||
| Weighted-average common shares outstanding for | |||||
| basic earnings per common share | 25,288,533 | 25,181,208 | 25,056,095 | ||
| Add: Dilutive effect of assumed exercise of warrant | 225,831 | 219,273 | 184,205 | ||
| Add: Dilutive effect of assumed exercises of stock options | |||||
| and awards | 213,467 | 262,900 | 220,427 | ||
| Average shares and dilutive potential common shares | 25,727,831 | 25,663,381 | 25,460,727 | ||
| Diluted earnings per common share | $3.13 | $2.23 | $2.05 |
| | | | | | | | | |
(dollars in thousand except share and per share data) |
| 2019 |
| 2018 |
| 2017 | |||
Basic earnings per common share: |
| |
|
| |
|
| |
|
Net income | | $ | 87,047 | | $ | 80,411 | | $ | 57,330 |
Weighted-average common shares outstanding | |
| 25,588,404 | |
| 25,288,533 | |
| 25,181,208 |
Basic earnings per common share | | $ | 3.40 | | $ | 3.18 | | $ | 2.28 |
Diluted earnings per common share: | |
|
| |
|
| |
|
|
Net income | | $ | 87,047 | | $ | 80,411 | | $ | 57,330 |
Weighted-average common shares outstanding for basic earnings per common share | |
| 25,588,404 | |
| 25,288,533 | |
| 25,181,208 |
Add: Dilutive effect of assumed exercise of warrant | |
| 0 | |
| 225,831 | |
| 219,273 |
Add: Dilutive effect of assumed exercises of stock options and awards | |
| 170,489 | |
| 213,467 | |
| 262,900 |
Average shares and dilutive potential common shares | |
| 25,758,893 | |
| 25,727,831 | |
| 25,663,381 |
Diluted earnings per common share | | $ | 3.38 | | $ | 3.13 | | $ | 2.23 |
There were no antidilutive stock options for 2019, 2018 2017 and 2016.
The following tables summarize the changes within each classification of accumulated other comprehensive income (loss) for December 31, 20182019 and 20172018 all shown net of tax:
| | | | | | | | | |
| | Unrealized | | | | | | | |
| | Gains and | | | | | | | |
| | (Losses) on | | Defined | | | | ||
| | Available- | | Benefit | | | | ||
| | for-Sales | | Pension | | | | ||
(dollars in thousands) |
| Securities |
| Items |
| Total | |||
Balance at December 31, 2018 | | $ | (4,796) | | $ | (1,395) | | $ | (6,191) |
Other comprehensive income (loss) before reclassification | |
| 18,515 | |
| (306) | |
| 18,209 |
Amounts reclassified from accumulated other comprehensive income (loss) | |
| (112) | |
| 153 | |
| 41 |
Net current period other comprehensive income (loss) | |
| 18,403 | |
| (153) | |
| 18,250 |
Balance at December 31, 2019 | | $ | 13,607 | | $ | (1,548) | | $ | 12,059 |
| | | | | | | | | |
| | Unrealized | | | | | | | |
| | Gains and | | | | | | | |
| | (Losses) on | | Defined | | | | ||
| | Available- | | Benefit | | | | ||
| | for-Sales | | Pension | | | | ||
(dollars in thousands) |
| Securities |
| Items |
| Total | |||
Balance at December 31, 2017 | | $ | 784 | | $ | (1,454) | | $ | (670) |
Other comprehensive income (loss) before reclassification | |
| (5,691) | |
| 175 | |
| (5,516) |
Amounts reclassified from accumulated other comprehensive income (loss) | |
| 39 | |
| 197 | |
| 236 |
Net current period other comprehensive income (loss) | |
| (5,652) | |
| 372 | |
| (5,280) |
Adoption of ASU 2018-02 | | | 140 | |
| (313) | |
| (173) |
Adoption of ASU 2016-01 | |
| (68) | |
| 0 | |
| (68) |
Balance at December 31, 2018 | | $ | (4,796) | | $ | (1,395) | | $ | (6,191) |
111
| Unrealized | |||||
| Gains and | |||||
| Losses on | Defined | ||||
| Available- | Benefit | ||||
| for-Sales | Pension | ||||
| (dollars in thousands) | Securities | Items | Total | ||
| Balance at December 31, 2017 | $784 | $(1,454) | $(670) | ||
| Other comprehensive income before reclassification | (5,691) | 175 | (5,516) | ||
| Amounts reclassified from accumulated other comprehensive income (loss) | 39 | 197 | 236 | ||
| Net current period other comprehensive income | (5,652) | 372 | (5,280) | ||
| Adoption of ASU 2018-02 | 140 | (313) | (173) | ||
| Adoption of ASU 2016-01 | (68) | 0 | (68) | ||
| Balance at December 31, 2018 | $(4,796) | $(1,395) | $(6,191) |
| Unrealized | |||||
| Gains and | |||||
| Losses on | Defined | ||||
| Available- | Benefit | ||||
| for-Sales | Pension | ||||
| (dollars in thousands) | Securities | Items | Total | ||
| Balance at December 31, 2016 | $(722) | $(1,665) | $(2,387) | ||
| Other comprehensive income before reclassification | 1,525 | 50 | 1,575 | ||
| Amounts reclassified from accumulated other comprehensive income (loss) | (19) | 161 | 142 | ||
| Net current period other comprehensive income | 1,506 | 211 | 1,717 | ||
| Balance at December 31, 2017 | $784 | $(1,454) | $(670) |
Reclassifications out of accumulated comprehensive income for the years ended December 31, 2019, 2018 2017 and 20162017 are as follows:
| | | | | |
Details about |
| Amount |
| Affected Line Item | |
Accumulated Other | | Reclassified From | | in the Statement | |
Comprehensive | | Accumulated Other | | Where Net | |
Income (Loss) Components | | Comprehensive Income (Loss) | | Income is Presented | |
2019 | | | | | |
(dollars in thousands) | | | | | |
Realized gains and losses on available-for-sale securities | | $ | 142 |
| Net securities gains (losses) |
Tax effect | |
| (30) |
| Income tax expense |
Subtotal | |
| 112 |
| Net of tax |
Amortization of defined benefit pension items(1) | |
| (205) |
| Salaries and employee benefits |
Tax effect | |
| 52 |
| Income tax expense |
Subtotal | |
| (153) |
| Net of tax |
Total reclassifications for the period | | $ | (41) |
| Net income |
| | | | | |
| | | | | |
2018 | |
|
|
|
|
(dollars in thousands) | |
|
|
|
|
Realized gains and losses on available-for-sale securities | | $ | (50) |
| Net securities gains (losses) |
Tax effect | |
| 11 |
| Income tax expense |
Subtotal | |
| (39) |
| Net of tax |
Amortization of defined benefit pension items(1) | |
| (266) |
| Salaries and employee benefits |
Tax effect | |
| 69 |
| Income tax expense |
Subtotal | |
| (197) |
| Net of tax |
Total reclassifications for the period | | $ | (236) |
| Net income |
| | | | | |
| | | | | |
2017 | |
|
|
|
|
(dollars in thousands) | |
|
|
|
|
Realized gains and losses on available-for-sale securities | | $ | 32 |
| Net securities gains (losses) |
Tax effect | |
| (13) |
| Income tax expense |
Subtotal | |
| 19 |
| Net of tax |
Amortization of defined benefit pension items(1) | |
| (265) |
| Salaries and employee benefits |
Tax effect | |
| 104 |
| Income tax expense |
Subtotal | |
| (161) |
| Net of tax |
Total reclassifications for the period | | $ | (142) |
| Net income |
| Included in the | ||||
112
| 2018 | 4th | 3rd | 2nd | 1st | |||
| Quarter | Quarter | Quarter | Quarter | ||||
| Interest income | $53,728 | $50,379 | $48,795 | $46,068 | |||
| Interest expense | 14,138 | 12,454 | 11,262 | 9,845 | |||
| Net interest income . . . . . . . . . . . . . . . . . . . . . . . . . . . . . . . . . . . . | 39,590 | 37,925 | 37,533 | 36,223 | |||
| Provision for loan losses | 300 | 1,100 | 1,700 | 3,300 | |||
| Net interest income after provision | 39,290 | 36,825 | 35,833 | 32,923 | |||
| Noninterest income | 10,105 | 10,433 | 9,693 | 9,879 | |||
| Noninterest expense | 22,552 | 22,009 | 20,274 | 21,202 | |||
| Income tax expense | 5,480 | 4,679 | 5,110 | 3,264 | |||
| Net income . . . . . . . . . . . . . . . . . . . . . . . . . . . . . . . . . . . . . . . . . . . . | $21,363 | $20,570 | $20,142 | $18,336 | |||
| Basic earnings per common share | $0.84 | $0.81 | $0.80 | $0.73 | |||
| Diluted earnings per common share | $0.83 | $0.80 | $0.78 | $0.71 | |||
| 2017 | 4th | 3rd | 2nd | 1st | |||
| Quarter | Quarter | Quarter | Quarter | ||||
| Interest income | $44,161 | $42,589 | $40,821 | $38,127 | |||
| Interest expense | 8,769 | 7,969 | 7,002 | 6,066 | |||
| Net interest income . . . . . . . . . . . . . . . . . . . . . . . . . . . . . . . . . . . . | 35,392 | 34,620 | 33,819 | 32,061 | |||
| Provision for loan losses | 1,850 | 450 | 500 | 200 | |||
| Net interest income after provision | 33,542 | 34,170 | 33,319 | 31,861 | |||
| Noninterest income | 9,462 | 9,497 | 8,791 | 8,259 | |||
| Noninterest expense | 19,598 | 20,269 | 19,352 | 20,048 | |||
| Income tax expense | 11,779 | 7,573 | 7,394 | 5,558 | |||
| Net income . . . . . . . . . . . . . . . . . . . . . . . . . . . . . . . . . . . . . . . . . . . . | $11,627 | $15,825 | $15,364 | $14,514 | |||
| Basic earnings per common share | $0.46 | $0.63 | $0.61 | $0.58 | |||
| Diluted earnings per common share | $0.45 | $0.62 | $0.60 | $0.57 |
| | | | | | | | | | | | |
| | 4th | | 3rd | | 2nd | | 1st | ||||
2019 |
| Quarter |
| Quarter |
| Quarter |
| Quarter | ||||
Interest income | | $ | 52,312 | | $ | 54,769 | | $ | 54,635 | | $ | 53,494 |
Interest expense | |
| 13,430 | |
| 15,224 | |
| 16,224 | |
| 15,285 |
Net interest income | |
| 38,882 | |
| 39,545 | |
| 38,411 | |
| 38,209 |
Provision for loan losses | |
| 250 | |
| 1,000 | |
| 785 | |
| 1,200 |
Net interest income after provision | |
| 38,632 | |
| 38,545 | |
| 37,626 | |
| 37,009 |
Noninterest income | |
| 11,119 | |
| 10,765 | |
| 11,588 | |
| 11,525 |
Noninterest expense | |
| 22,122 | |
| 22,737 | |
| 22,092 | |
| 22,473 |
Income tax expense | |
| 5,431 | |
| 5,119 | |
| 5,409 | |
| 4,379 |
Net income | | $ | 22,198 | | $ | 21,454 | | $ | 21,713 | | $ | 21,682 |
| | | | | | | | | | | | |
Basic earnings per common share | | $ | 0.86 | | $ | 0.84 | | $ | 0.85 | | $ | 0.85 |
Diluted earnings per common share | | $ | 0.86 | | $ | 0.83 | | $ | 0.85 | | $ | 0.84 |
| | | | | | | | | | | | |
| | 4th | | 3rd | | 2nd | | 1st | ||||
2018 | | Quarter | | Quarter | | Quarter | | Quarter | ||||
Interest income | | $ | 53,728 | | $ | 50,379 | | $ | 48,795 | | $ | 46,068 |
Interest expense | |
| 14,138 | |
| 12,454 | |
| 11,262 | |
| 9,845 |
Net interest income | |
| 39,590 | |
| 37,925 | |
| 37,533 | |
| 36,223 |
Provision for loan losses | |
| 300 | |
| 1,100 | |
| 1,700 | |
| 3,300 |
Net interest income after provision | |
| 39,290 | |
| 36,825 | |
| 35,833 | |
| 32,923 |
Noninterest income | |
| 10,077 | | | 10,624 | |
| 9,722 | |
| 9,879 |
Noninterest expense | |
| 22,524 | |
| 22,200 | |
| 20,303 | |
| 21,202 |
Income tax expense | |
| 5,480 | |
| 4,679 | |
| 5,110 | |
| 3,264 |
Net income | | $ | 21,363 | | $ | 20,570 | | $ | 20,142 | | $ | 18,336 |
| | | | | | | | | | | | |
Basic earnings per common share | | $ | 0.84 | | $ | 0.81 | | $ | 0.80 | | $ | 0.73 |
Diluted earnings per common share | | $ | 0.83 | | $ | 0.80 | | $ | 0.79 | | $ | 0.71 |
NOTE 23
– WARRANTOn February 27, 2009, the Company entered into a Letter Agreement with the Treasury, pursuant to which the Company issued (i) 56,044 shares of the Company’s Series A Preferred Stock and (ii) the Warrant to purchase 396,538 shares of the Company’s common stock, no par value, for an aggregate purchase price of $56,044,000 in cash. This transaction was conducted in accordance with the CPP.
The Warrant hashad a 10-year term and iswas immediately exercisable upon its issuance, with an exercise price, subject to anti-dilution adjustments, equal to $21.20 per share of the common stock (trailing 20-day Lakeland average closing price as of December 17, 2008, which was the last trading day prior to date of receipt of Treasury’s preliminary approval for our participation in the CPP). The Warrant was valued using the Black-Scholes model with the following assumptions: market price of $17.45; exercise price of $21.20; risk-free interest rate of 3.02%; expected life of 10 years; expected dividend rate on common stock of 4.5759% and volatility of common stock price of 41.8046%. This resulted in a value of $4.4433 per share of common stock underlying the Warrant.
On December 3, 2009, the Company was notified by Treasury that, as a result of the Company'sCompany’s completion of our November 18, 2009 Qualified Equity Offering, the amount of the Warrant was reduced by 50% to 198,269 shares. In accordance with the terms of the Warrant, the number of shares issuable upon exercise and the exercise price arewere adjusted each time the Company payspaid a dividend to its stockholders in excess of the dividend paid at the time the warrant was issued. In 2017 and 2016, the Company paid four dividends each year in excess of dividend paid at the time the Warrant was issued. In 2016, the number of shares issuable upon exercise and the exercise price were also adjusted for a 3-for-2 stock split on July 25, 2016 paid in the form of a dividend on August 5, 2016. Based on the formula set forth in the warrant, at December 31, 2018, the amountnumber of shares issuable upon exercise of the Warrant waswere 314,846 and the exercise price was $13.3503. Based on the formula set forth in the Warrant, at December 31, 2017, the amount
113
NOTE 23 – WARRANT (continued)
On June 9, 2010, the Company redeemed the Series A Preferred Stock and accreted the remaining unamortized discount on these shares. The Company did not repurchase the Warrant, and the Warrant was sold by Treasury to an independent, third party. The Warrant had not been exercised as of December 31, 2018, however on February 4, 2019 the Company was notified that the holder of the Warrant was initiating the exercise on a cashless basis. At the time of exercise, the holder was entitled to 315,961 shares of common stock. The cost to exercise the Warrant was approximately $4.2 million, which was the equivalent of 91,894 shares of common stock with a fair value of $45.74 per share. On February 8, 2019, the Company issued 224,066 shares to the Warrant holder as a cashless exercise and the Warrant was retired.
NOTE 24
– REVENUE RECOGNITIONAll of the Company'sCompany’s revenue from contracts with customers in the scope of ASC 606 is recognized within noninterest income. The following table presents the Company'sCompany’s sources of noninterest income for the years ended 2019, 2018 2017, and 2016.2017. Items outside of scope of ASC 606 are noted as such.
| 2018 | 2017 (2) | 2016 (2) | |||
| NONINTEREST INCOME | |||||
| Wealth advisory fees | $6,344 | $5,481 | $4,805 | ||
| Investment brokerage fees | 1,458 | 1,273 | 1,010 | ||
| Service charges on deposit accounts | |||||
| Service charges on commercial deposit acounts | 10,234 | 8,230 | 6,224 | ||
| Service charges on retail deposit acounts | 879 | 905 | 989 | ||
| Overdrafts, net | 3,581 | 3,452 | 3,700 | ||
| Other | 1,137 | 1,109 | 1,100 | ||
| Loan and service fees | |||||
| Debit card interchange fees | 5,883 | 4,663 | 4,332 | ||
| Loan fees (1) | 2,423 | 2,231 | 2,421 | ||
| Other | 985 | 1,006 | 928 | ||
| Merchant card fee income | 2,461 | 2,279 | 2,098 | ||
| Bank owned life insurance income (1) | 1,244 | 1,768 | 1,392 | ||
| Other income | 2,381 | 2,598 | 2,213 | ||
| Mortgage banking income (1) | 1,150 | 982 | 1,586 | ||
| Net securities gains/(losses) (1) | (50) | 32 | 66 | ||
| Total noninterest income | $40,110 | $36,009 | $32,864 |
| | | | | | | | | |
| | Year Ended December 31, | |||||||
|
| 2019 |
| 2018 |
| 2017 (2) | |||
NONINTEREST INCOME | | | | | | | | | |
Wealth advisory fees | | $ | 6,835 | | $ | 6,344 | | $ | 5,481 |
Investment brokerage fees | |
| 1,687 | |
| 1,458 | |
| 1,273 |
Service charges on deposit accounts | |
|
| |
|
| |
|
|
Service charges on commercial deposit acounts | |
| 10,082 | |
| 10,234 | |
| 8,230 |
Service charges on retail deposit acounts | |
| 880 | |
| 879 | |
| 905 |
Overdrafts, net | |
| 3,585 | |
| 3,581 | |
| 3,452 |
Other | |
| 1,170 | |
| 1,137 | |
| 1,109 |
Loan and service fees | |
|
| |
|
| |
|
|
Debit card interchange fees | |
| 6,344 | |
| 5,883 | |
| 4,663 |
Loan fees (1) | |
| 2,544 | |
| 2,423 | |
| 2,231 |
Other | |
| 1,023 | |
| 985 | |
| 1,006 |
Merchant card fee income | |
| 2,641 | |
| 2,461 | |
| 2,279 |
Bank owned life insurance income (1) | |
| 1,890 | |
| 1,244 | |
| 1,768 |
Mortgage banking income (1) | |
| 1,626 | |
| 1,150 | |
| 982 |
Net securities gains (losses) (1) | |
| 142 | |
| (50) | |
| 32 |
Other income | | | 4,548 | | | 2,573 | | | 2,629 |
Total noninterest income | | $ | 44,997 | | $ | 40,302 | | $ | 36,040 |
(1) | Not within scope of ASC 606 |
(2) | The Company elected the modified retrospective approach of adoption; therefore, prior period balances are presented under legacy GAAP and may not be comparable to current year presentation. As a result of this new standard, the only revenue streams with changes in reporting in the current periods compared to the prior year comparable periods are loan and service fees and other income. |
The following is a description of principal activities from which we generate revenue. Revenues are recognized as the Company satisfies its obligations with our customers, in an amount that reflects the consideration that we expect to receive in exchange for those services.
Wealth advisory fees
The Company provides wealth advisory services to its customers and earns fees from its contracts with trust customers to manage assets for investment and/or to transact on their accounts. These fees are primarily earned over time as the Company provides the contracted monthly, quarterly, or annual services and are generally assessed based on a tiered scale of the market value of assets under management (AUM) at month-end. Fees that are transaction based, including trade execution services, are recognized at the point in time that the transaction is executed. Other related services, such as escrow accounts that are based on a fixed schedule, are recognized when the services are rendered.
114
NOTE 24 – REVENUE RECOGNITION (continued)
Investment brokerage services
The Company provides investment brokerage services through a full service brokerage and investment and advisory firm, Cetera Investment Services LLC (“Cetera”). The Company receives commissions from Cetera on a monthly basis based upon customer activity for the month. The fees are recognized monthly and a receivable is recorded until commissions are generally paid by the 5th business day of the following month. Because the Company (i) acts as an agent in arranging the relationship between the customer and the Cetera and (ii) does not control the services to the customers, investment brokerage service fees are presented net of Cetera’s related costs.
Service charges on deposit accounts
The Company earns fees from its deposit customers for transaction-based, account maintenance, and overdraft services. Transaction-based fees, which include services such as ATM use fees, stop payment charges, statement rendering, and ACH fees, are recognized at the time the transaction is executed as that is the point in time the Company fulfills the customer’s request. Account maintenance fees, which relate primarily to monthly maintenance, are earned over the course of a month, representing the period over which the Company satisfies the performance obligation. Overdraft fees are recognized at the point in time that the overdraft occurs. Service charges on deposits are withdrawn from the customer’s balance.
Interchange income
The Company provides the ability to transact on certain deposit accounts through the use of debit cards by outsourcing the services through third party service providers. Performance obligations are met on a transactional basis and income is recognized monthly based on transaction type and volume. Under the accounting standards in effect in the prior period, revenue was previously recognized net of the third party’s costs. Under ASC 606, fees from interchange income related to its customers use of debit cards will be reported gross in loan and service fees under noninterest income. The cost of using third party providers for these interchange services will be reported in data processing fees and supplies under noninterest expense, which has no effect on net income for the period.
Gain on sale of other real estate (OREO) owned financed by seller
On occasion, the Company underwrites a loan to purchase property owned by the Company. Under the accounting standards in effect in the prior period, the gain on the sale of the Company owned property was deferred and recognized over the life of the loan. Under ASC 606, the Company assesses whether the buyer is committed to perform their obligations under the contract and whether collectability of the transaction price is probable. Once these criteria are met, the OREO asset is derecognized and the gain or loss on sale is recorded upon the transfer of control of the property to the buyer. In determining the gain or loss on the sale, the Company adjusts the transaction price and related gain (loss) on sale if a significant financing component is present. As a result of the adoption of ASC 606, the Company reported a net increase of $24,000 to opening retained earnings as of January 1, 2018.
Debit card incentive rebates
The Company receives incentive rebates based on debit card transaction volume. Performance obligations are met on a transactional basis and income is recognized monthly based on transaction volume. Under the accounting standards in effect in the prior period, revenue was previously recognized in other income under noninterest income. Under ASC 606, these rebates related to debit card transaction volume will be reported as a contra expense in data processing fees and supplies under noninterest expense, which has no effect on net income for the period.
115
NOTE 25 – LEASES
The Company leases certain office facilities under long-term operating lease agreements. The leases expire at various dates through 2029 and some include renewal options. Many of these leases require the payment of property taxes, insurance premiums, maintenance, utilities and other costs. In many cases, rentals are subject to increase in relation to a cost-of-living index. The Company accounts for lease and non-lease components together as a single lease component. The Company determines if an arrangement is a lease at inception. Operating leases are recorded as a right-of-use (“ROU”) lease assets and are included in other assets on the consolidated balance sheet. The Company’s corresponding lease obligations are included in other liabilities on the consolidated balance sheet. ROU lease assets represent the Company’s right to use an underlying asset for the lease term and lease obligations represent the Company’s obligation to make lease payments arising from the lease. Operating ROU lease assets and obligations are recognized at the commencement date based on the present value of lease payments over the lease term. As most of the Company’s leases do not provide an implicit rate, the Company uses its incremental borrowing rate based on the information available at the commencement date in determining the present value of lease payments. The ROU lease asset also includes any lease payments made and excludes lease incentives. The Company’s lease terms may include options to extend or terminate the lease when it is reasonably certain that the Company will exercise that option.
Lease expense for lease payments is recognized on a straight-line basis over the lease term. Short-term leases are leases having a term of twelve months or less. The Company recognizes short-term leases on a straight-line basis and does not record a related lease asset or liability for such leases, as allowed as practical expedient of the standard. The following is a maturity analysis of the operating lease liabilities as of December 31, 2019:
| | | |
|
| Operating Lease | |
Years ending December 31, (in thousands) | | Obligation | |
2020 | | $ | 561 |
2021 | |
| 581 |
2022 | |
| 595 |
2023 | |
| 606 |
2024 | |
| 622 |
2025 and thereafter | |
| 2,873 |
Total undiscounted lease payments | |
| 5,838 |
Less imputed interest | |
| (738) |
Lease liability | | $ | 5,100 |
Right-of-use asset | | $ | 5,100 |
| | | | |
|
| Year Ended |
| |
| | December 31,2019 |
| |
Lease cost |
| |
| |
Operating lease cost | | $ | 498 | |
Short-term lease cost | |
| 24 | |
Total lease cost | | $ | 522 | |
| | | | |
Other information | |
|
| |
Operating cash outflows from operating leases | | $ | 498 | |
Weighted-average remaining lease term - operating leases | |
| 9.8 | years |
Weighted average discount rate - operating leases | |
| 2.8 | % |
116
Within the prior two years of the date of the most recent financial statement, there have been no changes in or disagreements with the Company’s accountants.
The management of the Company is responsible for establishing and maintaining adequate internal control over financial reporting as defined in Rules 13a-15(f) and 15d-15(f) under the Securities and Exchange Act of 1934. The Company’s internal control over financial reporting is designed to provide reasonable assurance regarding the reliability of financial reporting and the preparation of financial statements for external purposes in accordance with U.S. generally accepted accounting principles (“GAAP”).
The Company’s internal control over financial reporting includes those policies and procedures that: (i) pertain to the maintenance of records that, in reasonable detail, accurately and fairly reflect the transactions and dispositions of the assets of the Company; (ii) provide reasonable assurance that transactions are recorded as necessary to permit preparation of financial statements in accordance with GAAP, and that receipts and expenditures of the Company are being made only in accordance with authorizations of management and directors of the Company; and (iii) provide reasonable assurance regarding prevention or timely detection of unauthorized acquisition, use or disposition of the Company’s assets that could have a material effect on the financial statements.
Because of its inherent limitations, internal control over financial reporting may not prevent or detect misstatements. Management assessed the effectiveness of the Company’s internal control over financial reporting as of December 31, 2018.2019. In making this assessment, management used the 2013 criteria set forth by the Committee of Sponsoring Organizations of the Treadway
Commission (COSO) in Internal Control-Integrated Framework. Based on our assessment and those criteria, management concluded that the Company maintained effective internal control over financial reporting as of December 31, 2018.
The Company’s independent registered public accounting firm has issued their report on the Company’s internal control over financial reporting. That report appears under the heading, Report of Independent Registered Public Accounting Firm.
ITEM 9B. OTHER INFORMATION
117
PART III
The information required in response to this item will be contained under the captions “Election of Directors,” “Corporate Governance and the Board of Directors” and “Section“Delinquent Section 16(a) Beneficial Ownership Reporting Compliance”Reports” in the definitive Proxy Statement for the Annual Meeting of Stockholders to be held on April 9, 2019, as14, 2020, to be filed with the SEC on February 28, 2019,March 5, 2020, on Form DEF 14A, and such sections are incorporated herein by reference in response to this Item.
The information required in response to this item will be contained under the captions “Director Compensation,” “Executive Compensation,” "Compensation“Compensation Committee Interlocks and Insider Participation,"” and “Compensation Committee Report” in the definitive Proxy Statement, for the Annual Meeting of Stockholders to be held on April 9, 2019, as14, 2020, to be filed with the SEC on February 28, 2019,March 5, 2020, on Form DEF 14A, is incorporated herein by reference in response to this Item. The information included under the heading “Compensation Committee Report” in the Proxy Statement shall not be deemed “soliciting” materials or to be “filed” with the SEC or subject to Regulation 14A or 14C, or to the liabilities of Section 18 of the Securities Exchange Act of 1934, as amended.
ITEM 12. SECURITY OWNERSHIP OF CERTAIN BENEFICIAL OWNERS AND MANAGEMENT AND RELATED SHARELHOLDER MATTERS
The information appearing under the caption “Security“Security Ownership of Certain Beneficial Owners and Management” in the definitive Proxy Statement, for the Annual Meeting of Stockholders to be held on April 9, 2019, as14, 2020, to be filed with the SEC on February 28, 2019,March 5, 2020, on Form DEF 14A, is incorporated herein by reference in response to this Item.
See Item 5 above for equity compensation plan information.
The information appearing under the caption “Certain Relationships and Related Transactions” in the definitive Proxy Statement, for the Annual Meeting of Stockholders to be held on April 9, 2019, as14, 2020, to be filed February 28, 2019,March 5, 2020, on Form DEF 14A, is incorporated herein by reference in response to this Item. Certain additional information on related party transactions is also included in Note 14 - Related Party Transactions to the Company’s financial statements contained in Item 8.
The information appearing under the caption “Accountant Fees”“Fees Paid to Independent Registered Public Accounting Firm” in the definitive Proxy Statement, for the Annual Meeting of Stockholders to be held on April 9, 2019, as14, 2020, to be filed February 28, 2019,March 5, 2020, on Form DEF 14A, is incorporated herein by reference in response to this Item.
118
PART IV
The documents listed below are filed as a part of this report:
Exhibit No. | Document | Incorporated by reference to | ||
| | |||
| Amended and Restated Articles of Incorporation of Lakeland Financial Corporation | Exhibit 3.1 to the Company’s Form 8-K | ||
| | |||
3.2 | | |||
Exhibit 3.2 to the Company’s Form 10-K | ||||
| | |||
3.3 | | |||
Exhibit 3.2 to the Company’s Form 10-K | ||||
| | |||
| Exhibit 4.1 to the Company’s | |||
| | |||
| Exhibit 4.2 to the Company’s Form 10-K | |||
| | |||
| Exhibit 10.3 to the Company’s | |||
| | |||
4.4 | | | Attached hereto | |
| | | | |
10.1 | | Exhibit 10.1 to the Company’s | ||
| | |||
10.2 | |
Exhibit 10.1 to the Company’s Form | ||||
| | |||
| Amended and Restated Lakeland Financial Corporation Director’s Fee Deferral Plan | Exhibit 10.4 to the Company’s | ||
| | |||
| ||||
| Exhibit 10.1 of the Company’s Form 8-K filed on March 2, 2016 | |||
| | |||
| Exhibit 10.7 to the Company’s | |||
| | | | |
| Exhibit 10.11 to the Company’s Form | |||
| | |||
| Exhibit 10.1 to the Company’s Form | |||
| | |||
| Appendix A to the Definitive | |||
| |
119
120
| | | | |
101.DEF | | XBRL Taxonomy Extension Definition Linkbase Document | | |
| | | | |
101.LAB | | XBRL Taxonomy Extension Label Linkbase Document | | |
| | | | |
101.PRE | | XBRL Taxonomy Extension Presentation Linkbase Document | | |
| | | | |
104 | | Cover Page Interactive Data File - the cover page XBRL tags are embedded within the Inline XBRL document contained in Exhibit 101 | | |
ITEM 16. FORM 10-K SUMMARY
None.
121
SIGNATURES
Pursuant to the requirements of Section 15(d) of the Securities and Exchange Act of 1934, the Registrant has duly caused this report to be signed on its behalf by the undersigned, thereunto duly authorized.
LAKELAND FINANCIAL CORPORATION | ||
Date: February | By | /s/ David M. Findlay |
David M. Findlay, Chief Executive Officer | ||
Pursuant to the requirements of the Securities and Exchange Act of 1934, this report has been signed by the following persons on behalf of the Registrant and in the capacities and on the dates indicated.
Name | Title | Date | ||
| | |||
/s/ David M. Findlay | | President, Chief Executive Officer and Director | | |
David M. Findlay | | (principal executive officer) | | February |
| | |||
| | |||
/s/ Lisa M. O’Neill | | Executive Vice President, Chief Financial Officer | | |
Lisa M. O’Neill | | (principal financial | | February 24, 2020 |
| | |||
/s/ Brok A. Lahrman | | Senior Vice President, Finance and Chief Accounting Officer | | |
Brok A. Lahrman | | (principal accounting officer) | | February |
| | |||
/s/ Blake W. Augsburger | | | ||
Blake W. Augsburger | | Director | | February |
| | |||
| | |||
/s/ Robert E. Bartels, Jr. | | | ||
Robert E. Bartels, Jr. | | Director | | February |
| | |||
| | |||
/s/Darrianne P. Christian | | | ||
Darrianne P. Christian | | Director | | February |
| | |||
| | |||
/s/ Daniel F. Evans, Jr. | | | ||
Daniel F. Evans, Jr. | | Director | | February |
| | |||
| | |||
/s/ Thomas A. Hiatt | | | ||
Thomas A. Hiatt | | Director | | February |
| | |||
| | |||
/s/ Michael L. Kubacki | | | ||
Michael L. Kubacki | | Chairman and Director | | February |
| | |||
| | |||
/s/ Emily E. Pichon | | | ||
Emily E. Pichon | | Director | | February |
122
| | | | |
| | | | |
/s/ Steven D. Ross | | | ||
Steven D. Ross | | Director | | February |
| | |||
| | |||
/s/ Brian J. Smith | | | ||
Brian J. Smith | | Director | | February |
| | |||
| | |||
/s/ Bradley J. Toothaker | | | ||
Bradley J. Toothaker | | Director | | February |
| | |||
| | |||
/s/ Ronald D. Truex | | | ||
Ronald D. Truex | | Director | | February |
| | |||
| | |||
/s/ M. Scott Welch | | | ||
M. Scott Welch | | Director | | February |
123