UNITED STATES
SECURITIES AND EXCHANGE COMMISSION
WASHINGTON, D.C. 20549
FORM 10-K
ý ANNUAL REPORT PURSUANT TO SECTION 13 OR 15(d) OF THE
SECURITIES EXCHANGE ACT OF 1934
For the fiscal year ended December 31, 20162018
OR
o TRANSITION REPORT PURSUANT TO SECTION 13 OR 15(d) OF THE
SECURITIES EXCHANGE ACT OF 1934
For the transition period from to
COMMISSION FILE NO. 001-10308
AVIS BUDGET GROUP, INC.
(Exact name of Registrant as specified in its charter)
|
| | |
| DELAWARE | | 06-0918165 |
| (State or other jurisdiction of incorporation or organization) | | (I.R.S. Employer Identification Number) |
| | |
6 SYLVAN WAY PARSIPPANY, NJ | | 07054 |
| (Address of principal executive offices) | | (Zip Code) |
973-496-4700
(Registrant’s telephone number, including area code)
SECURITIES REGISTERED PURSUANT TO SECTION 12(b) OF THE ACT:
|
| | |
| TITLE OF EACH CLASS | | NAME OF EACH EXCHANGE ON WHICH REGISTERED |
| Common Stock, Par Value $.01 | | The NASDAQ Global Select Market |
Preferred Stock Purchase Right | | The NASDAQ Global Select Market |
SECURITIES REGISTERED PURSUANT TO SECTION 12(g) OF THE ACT: None
Indicate by check mark if the registrant is a well-known seasoned issuer, as defined in Rule 405 of the Securities Act. Yes þ No o
Indicate by check mark if the registrant is not required to file reports pursuant to Section 13 or Section 15(d) of the Act. Yes o No þ
Indicate by check mark whether the registrant (1) has filed all reports required to be filed by Section 13 or 15(d) of the Securities Exchange Act of 1934 during the preceding 12 months (or for such shorter period that the Registrant was required to file such reports), and (2) has been subject to such filing requirements for the past 90 days. Yes þ No o
Indicate by check mark whether the registrant has submitted electronically and posted on its corporate Web site, if any, every Interactive Data File required to be submitted and posted pursuant to Rule 405 of Regulation S-T (§ 232.405 of this chapter) during the preceding 12 months (or for such shorter period that the registrant was required to submit and post such files). Yes þ No o
Indicate by check mark if disclosure of delinquent filers pursuant to Item 405 of Regulation S-K (§229.405 of this chapter) is not contained herein, and will not be contained, to the best of registrant’s knowledge, in definitive proxy or information statements incorporated by reference in Part III of this Form 10-K or any amendment to this Form 10-K. oþ
Indicate by check mark whether the registrant is a large accelerated filer, an accelerated filer, a non-accelerated filer or a smaller reporting company. See the definition of “large accelerated filer”, “accelerated filer” and “smaller reporting company” in Rule 12b-2 of the Exchange Act.
|
| | | |
Large accelerated filer þ | Accelerated filer o | Non-accelerated filer o |
Smaller reporting company o | Emerging growth company o | |
If an emerging growth company, indicate by check mark if the registrant has elected not to use the extended transition period for complying with any new or revised financial accounting standards provided pursuant to Section 13(a) of the Exchange Act. o
Indicate by check mark whether the registrant is a shell company (as defined in Rule 12b-2 of the Act). Yes o No þ
As of June 30, 2016,2018, the aggregate market value of the registrant’s common stock held by non-affiliates of the registrant was $2,911,952,460$2,564,141,255 based on the closing price of its common stock on the NASDAQ Global Select Market. All executive officers and directors of the registrant have been deemed, solely for the purpose of the foregoing calculation, to be “affiliates” of the registrant.
As of January 31, 2017,2019, the number of shares outstanding of the registrant’s common stock was 85,991,536.75,769,075.
DOCUMENTS INCORPORATED BY REFERENCE
Portions of the registrant’s definitive proxy statement to be mailed to stockholders in connection with the registrant’s 2019 annual stockholders’ meeting scheduled to be held on May 16, 2017of stockholders (the “Annual Proxy Statement”) are incorporated by reference into Part III hereof.
TABLE OF CONTENTS
| | | | | |
| Item | Description | Page | Description | Page |
| | | |
| | PART I | | PART I | |
| 1 | | | | |
| 1A | | | | |
| 1B | | | | |
| 2 | | | | |
| 3 | | | | |
| 4 | | | | |
| | | |
| | PART II | | PART II | |
| 5 | | | | |
| 6 | | | | |
| 7 | | | | |
| 7A | | | | |
| 8 | | | | |
| 9 | | | | |
| 9A | | | | |
| 9B | | | | |
| | | |
| | PART III | | PART III | |
| 10 | | | | |
| 11 | | | | |
| 12 | | | | |
| 13 | | | | |
| 14 | | | | |
| | | |
| | PART IV | | PART IV | |
| 15 | | | | |
| | | | | |
FORWARD-LOOKING STATEMENTS
Certain statements contained in this Annual Report on Form 10-K may be considered “forward-looking statements” as that term is defined in the Private Securities Litigation Reform Act of 1995. The forward-looking statements contained herein are subject to known and unknown risks, uncertainties, assumptions and other factors that may cause our actual results, performance or achievements to be materially different from those expressed or implied by any such forward-looking statements. Forward-looking statements include information concerning our future financial performance, business strategy, projected plans and objectives. These statements may be identified by the fact that they do not relate to historical or current facts and may use words such as “believes,” “expects,” “anticipates,” “will,” “should,” “could,” “may,” “would,” “intends,” “projects,” “estimates,” “plans,” and similar words, expressions or phrases. The following important factors and assumptions could affect our future results and could cause actual results to differ materially from those expressed in such forward-looking statements:
the high level of competition in the vehicle rentalmobility industry, including from new companies or technology, and the impact such competition may have on pricing and rental volume;
a change in travel demand, including changes in airline passenger traffic;
a change in our fleet costs as a result of a change in the cost of new vehicles, manufacturer recalls, disruption in the supply of new vehicles, and/or a change in the price at which we dispose of used vehicles either in the used vehicle market or under repurchase or guaranteed depreciation programs;
the results of operations or financial condition of the manufacturers of our cars, which could impact their ability to perform their payment obligations under our agreements with them, including repurchase and/or guaranteed depreciation arrangements, and/or their willingness or ability to make cars available to us or the rental car industry as a whole on commercially reasonable terms or at all;
a change in travel demand, including changes or disruptions in airline passenger traffic;
any change in economic conditions generally, particularly during our peak season or in key market segments;
our ability to continue to achieve and maintain cost savings and successfully implement our business strategies;
our ability to obtain financing for our global operations, including the funding of our vehicle fleet through the issuance of asset-backed securities and use of the global lending markets;
an occurrence or threat of terrorism, pandemic disease, natural disasters, military conflict, or civil unrest or political instability in the locations in which we operate;
any substantial changes in the cost or supply of fuel, vehicle parts, energy, labor or other resources on which we depend to operate our business;
our ability to continue to successfully implement our business strategies, achieve and maintain cost savings and adapt our business to changes in mobility;
political, economic or commercial instability in the countries in which we operate, and our ability to conform to multiple and conflicting laws or regulations in those countries;
our dependence on third-party distribution channels, third-party suppliers of other services and co-marketing arrangements with third parties;
our dependence on the performance and retention of our senior management and key employees;
risks related to completed or future acquisitions or investments that we may pursue, including the incurrence of incremental indebtedness to help fund such transactions and our ability to promptly and effectively integrate any acquired businesses or capitalize on joint ventures, partnerships and other investments;
our ability to utilize derivative instruments, and the impact of derivative instruments we utilize, which can be affected by fluctuations in interest rates, gasoline prices and exchange rates, changes in government regulations and other factors;
our ability to accurately estimate our future results;
any major disruptions in our communication networks or information systems;
our exposure to uninsured or unpaid claims in excess of historical levels;
risks associated with litigation, governmental or regulatory inquiries, or any failure or inability to comply with laws, regulations or contractual obligations or any changes in laws, regulations or contractual obligations, including with respect to personally identifiable information and taxes;consumer privacy, labor and employment, and tax;
risks related to protecting the integrity of, and preventing unauthorized access to, our information technology systems or those of our third-party vendors, and protecting the confidential information of our employees and customers against security breaches, including physical or cybersecurity breaches, attacks, or other disruptions, and compliance with privacy and data protection regulation;
any impact on us from the actions of our licensees, dealers, third-party vendors and independent contractors;
any substantialmajor disruptions in our communication networks or information systems;
risks related to tax obligations and the effect of future changes in the cost or supply of fuel, vehicle parts, energy, labor or other resources on which we depend to operate our business;tax laws and accounting standards;
risks related to our indebtedness, including our substantial outstanding debt obligations, potential interest rate increases, and our ability to incur substantially more debt;
our ability to obtain financing for our global operations, including the funding of our vehicle fleet through the issuance of asset-backed securities and use of the global lending markets;
our ability to meet the financial and other covenants contained in the agreements governing our indebtedness;
risks related to tax obligations and the effect of future changes in accounting standards;
risks related to completed or future acquisitions or investments that we may pursue, including any incurrence of incremental indebtedness to help fund such transactions and our ability to promptly and effectively integrate any acquired businesses;
risks related to protecting the integrity ofaccurately estimate our information technology systems and the confidential information of our employees and customers against security breaches, including cyber-security breaches;future results; and
other business, economic, competitive, governmental, regulatory, political or technological factors affecting our operations, pricing or services, including uncertainty and instability related to potential withdrawal of countries from the European Union.services.
We operate in a continuously changing business environment and new risk factors emerge from time to time. New risk factors, factors beyond our control, or changes in the impact of identified risk factors may cause actual results to differ materially from those set forth in any forward-looking statements. Accordingly, forward-looking statements should not be relied upon as a prediction of actual results. Moreover, we do not assume responsibility for the accuracy and completeness of those statements. Other factors and assumptions not identified above, including those discussed in “Management’s Discussion and Analysis of Financial Condition and Results of Operations” set forth in Item 7, in “Risk Factors” set forth in Item 1A and in other portions of this Annual Report on Form 10-K, may contain forward-looking statements and involve uncertainties that could cause actual results to differ materially from those projected in such statements.
Although we believe that our assumptions are reasonable, any or all of our forward-looking statements may prove to be inaccurate and we can make no guarantees about our future performance. Should unknown risks or uncertainties materialize or underlying assumptions prove inaccurate, actual results could differ materially from past results and/or those anticipated, estimated or projected. Except to the extent of our obligations under the federal securities laws, weWe undertake no obligation to release any revisions to any forward-looking statements, to report events or to report the occurrence of unanticipated events. For any forward-looking statements contained in any document, we claim the protection of the safe harbor for forward-looking statements contained in the Private Securities Litigation Reform Act of 1995.
PART I
Except as expressly indicated or unless the context otherwise requires, the “Company,” “Avis Budget,” “we,” “our” or “us” means Avis Budget Group, Inc. and its subsidiaries. “Avis,” “Budget,” “Budget Truck,” “Zipcar,” “Payless,” “Apex,” “Maggiore”“Maggiore,” “Morini Rent,” “Turiscar” and “France Cars”“FranceCars” refer to our Avis Rent A Car System, LLC, Budget Rent A Car System, Inc., Budget Truck Rental, LLC, Zipcar, Inc., Payless Car Rental, Inc., Apex Car Rentals, Maggiore Rent S.p.A., Morini S.p.A., Turiscar Group and AAA France Cars SAS operations, respectively, and, unless the context otherwise requires, do not include the operations of our licensees, as further discussed below.
We are a leading global provider of vehicle rental and car sharing services, operatingmobility solutions through our three of the most recognized brands, in the industry through Avis, Budget and Zipcar. We are a leading vehicle rental operatorZipcar, together with several other brands, well recognized in North America, Europe, Australia, New Zealand and certain other regions we serve.their respective markets. We and our licensees operate the Avis and Budget brands in approximately 180 countries throughout the world. We generally maintain a leading share of airport car rental revenue in North America, Europe Australia and New Zealand,Australasia, and we operate one of the leading truck rental businesses in the United States.
Our brands are differentiated tobrands help us meet a wide range of customer mobility needs throughout the world. Avis is a leading vehicle rental car supplierbrand positioned to serve the premium commercial and leisure segments of the travel industry, andindustry. Budget is a leading vehicle rental vehicle supplierbrand focused primarily on more value-conscious segments of the industry. Our Zipcar brand is one of the world’s leading car sharing networks offering an alternative to traditional vehicle rental and ownership.
On average, our rental fleet totaled approximately 600,000nearly 650,000 vehicles in 2018 and we completed more than 3940 million vehicle rental transactions worldwide in 2016.worldwide. We generate approximately 70%65% of our vehicle rental revenue from on-airport locations and approximately 30%35% of our revenue from off-airport locations. We also license the use of the Avis, Budget, Zipcar and BudgetPayless trademarks to licensees in areas in which we do not operate directly. Our brands have an extended global reach with more than 11,000 car and truck rental locations throughout the world, including approximately 5,0004,600 car rental locations operated by our licensees. We believe that Avis, Budget and Zipcar enjoy complementary demand patterns with mid-week commercial demand balanced by weekend leisure demand.
Our Zipcar brand is the world’s leading car sharing company, with more than one million members in the United States, Canada and Europe. We operate Budget Truck, one of the leading truck rental businesses in the United States, with a fleet of approximately 22,000 vehicles that operate through a network of approximately 1,000 dealer-operated and 480 Company-operated locations throughout the continental United States. We also own Payless, a car rental brand that operates in the deep-value segment of the industry;industry in the United States and certain other international regions; Apex, which is a leading deep-value car rental brand in New Zealand and Australia; Maggiore aand Morini Rent, leading vehicle rental brands in Italy; Turiscar, a well-established car rental brand in Italy;Portugal; and France Cars,FranceCars, which operates one of the largest light commercial vehicle fleets in France. We also have investments in certain of our Avis and Budget licensees outside of the United States, including joint ventures in India and China.
Founded in 1946, Avis is believed to be the first company to rent cars from airport locations. Avis expanded its geographic reach throughout the United States through growth in licensed and Company-operated locations in the 1950s and 1960s. In 1963, Avis introduced its award winning “We try harder®” advertising campaign, which was recognized as one of the top ten advertising campaigns of the 20th century by Advertising Age magazine.
HFS Incorporated acquired Avis in 1996 and merged with our predecessor company in 1997, with the combined entity being renamed Cendant Corporation. The Company is a Delaware corporation headquartered in Parsippany, New Jersey.
In 2002, Cendant acquired the Budget brand and Budget vehicle rental operations in North America, Australia and New Zealand. Budget was founded in 1958 as a car rental company for the value-conscious vehicle rental
customer and grew its business rapidly during the 1960s, expanding its rental car offerings throughout North America and significantly expanding its Budget truck rental business in the 1990s.
In 2006, Cendant completed the sales and spin-offs of several significant subsidiaries and changed its name to Avis Budget Group, Inc. In 2011, we expanded our international operations with the acquisition of Avis Europe, which was previously an independently-owned licensee operating the Avis and Budget brands in Europe, the Middle East and Africa, and the Avis brand in Asia. Upon the completion of the acquisition of Avis Europe, the Avis and Budget brands were globally re-united under a single company, making Avis Budget Group one of the largest vehicle rental companies in the world.
In 2013, we acquired Zipcar, the world’s leading car sharing company, to further increase our growth potential and our ability to better serve a greater variety of our customers’ mobility needs. In 2012 and 2013, we acquired our Apex and Payless brands, respectively, which allowed us to expand our presence in the deep-value segment of the car rental industry. In 2014, we also acquired our long-standing Budget licensee for Southern California and Las Vegas, which further expanded our Company-operated locations in the United States. In 2015, we acquired the operations of our former Avis and Budget licensees in Brazil, Norway, Sweden and Denmark; our Avis licensee in Poland; and Maggiore, a leading provider of vehicle rental services in Italy. In 2016, we acquired France Cars, a privately held vehicle rental company based in France, to significantly expand our presence in the French market. These acquisitions have allowed us to further expand our global footprint of Company-operated locations.
We have a long history of innovation in the vehicle rental and car sharing business, including:
in 1973, we launched our proprietary Wizard system, a constantly updated information-technology system that is the backbone of our operations;
in 1987, we introduced our Roving Rapid Return program, powered by a handheld computer device that allows customers to bypass the car return counter;
in 1996, we became one of the first car rental companies to accept online reservations;
in 2000, we introduced Avis Interactive, the first Internet-based reporting system in the car rental industry;
in 2009, we launched what we believe to be the first car rental iPhone application in the United States;
in 2012, we believe that our Avis brand became the first in the industry to offer mobile applications to customers on all major mobile platforms;
in 2015, our Avis brand was the first in the industry to offer an Android application that allows customers to use voice-activated technology to make, confirm or cancel their car rental reservations;
in 2015, our Avis brand was the first U.S. car rental company to offer an application for the Apple Watch, which enables our customers to email themselves a car rental receipt and view current, upcoming and past car rental reservations from their wrists;
in 2015, we continued to expand our use of yield management systems, which the Company designed to help optimize its decision-making with respect to pricing and fleet management; and
in 2016, we introduced Avis Now, a mobile app-enabled rental process that provides Avis customers with greater control of their rental experience using their smartphone or tablet device.
Our Zipcar operations have been a constantly innovating pioneer in using advanced vehicle technologies as the first car sharing company in the United States to develop a self-service solution to manage the complex interactions of real-time, location-based activities inherent in a large-scale car sharing operation, including new member application, reservations and keyless vehicle access, fleet management and member management. Zipcar was also the first to allow members to reserve the specific make, model and type of car by phone, Internet or wireless mobile device. In 2015, Zipcar introduced Instant Join and Drive, a technology innovation that
dramatically reduces the time it takes to become a Zipcar member, and the flexibility to make both round-trip and one-way reservations.
Since becoming an independent vehicle rental services company in 2006, we have focused on strengthening our brands, our operations, our technology, our competitiveness and our profitability. In conjunction with these efforts, we have implemented process improvements impacting virtually all areas of the business; realized significant cost savings through the integration of acquired businesses with our pre-existing operations; achieved reductions in operating and selling, general and administrative expenses, including significant reductions in staff; assessed location, segment and customer profitability to address less-profitable aspects of our business; implemented price increases and changes to our sales, marketing and affinity programs to improve profitability; and sought to better optimize our acquisition, deployment and disposition of fleet in order to lower costs and better meet customer demand.
We categorize our operations into two reportingreportable business segments:
Americas, which provides and licenses the Company’s brands to third parties for vehicle rentals and ancillary products and services in North America, South America, Central America and the Caribbean, and operates the Company’s car sharing business in certain of these markets; and
International, which provides and licenses the Company’s brands to third parties for vehicle rentals and ancillary products and services in Europe, the Middle East, Africa, Asia Australia and New Zealand,Australasia, and operates the Company’s car sharing business in certain of these markets.
The following table presents key operating metrics for eachAdditional discussion of our two reporting segments:
|
| | | | | | | |
| | | Total 2016 Rental Days | | Average 2016 Time and Mileage (“T&M”) Revenue per Day | | Average 2016 Rental Fleet Size |
| Americas | | 101 | million | | $40.38 | | 385,000 |
| International | | 46 | million | | $32.01 | | 177,000 |
| Total Company | | 147 | million | | | | 562,000 |
________
Note: Operating metrics exclude Zipcarreportable segments is included in the Item 7. “Management’s Discussion and U.S. truck rental operations, which had average fleetsAnalysis of 14,000Financial Condition and 22,000 vehicles, respectively.
The following graphs present the compositionResults of our rental daysOperations” and our average rental fleet in 2016, by segment:
Financial data for our segments and geographic areas are reported in Note 19-Segment Information19 to ourthe Consolidated Financial Statements included in Item 8 of this Annual Report on Form 10-K.
Avis was founded in 1946 and is believed to be the first company to rent cars from airport locations. Since its founding, Avis has expanded its business throughout the United States and internationally, becoming one of the largest and most recognized car rental brands in the world. In 1996, Avis was acquired by HFS Incorporated and in 1997 merged with our predecessor company, with the combined entity being renamed Cendant Corporation. In 2006, Cendant spun off several significant subsidiaries and changed its name to Avis Budget Group, Inc. The Company is a Delaware corporation headquartered in Parsippany, New Jersey.
Budget was founded in 1958 to appeal to the value-conscious car rental customer. In 2002, we acquired the Budget brand and certain Budget vehicle rental operations, including the Budget truck rental business. In 2011, we acquired Avis Europe, an independently-owned Company licensee, to expand our international operations and globally reunite the Avis and Budget brands. In 2012 and 2013, we acquired our Apex and Payless brands, respectively, which allowed us to expand our presence in the deep-value segment of the car rental industry. In 2013, we acquired Zipcar, one of the world’s leading car sharing networks, to better serve a greater variety of our customers’ mobility needs. In 2015, we acquired Maggiore, a leading provider of vehicle rental services in Italy. In 2016, we acquired FranceCars, a privately held vehicle rental company based in France, which significantly expanded our presence in the French market. In 2018, we acquired Morini, which focuses on rentals of cars, vans and refrigerated trucks in Northern Italy, and Turiscar, a well-established vehicle rental company in Portugal, and also invested in our licensee in Greece. These acquisitions have allowed us to continue to expand our global footprint of Company-operated locations and brand presence.
Our objective is to strategically acceleratedrive sustainable, profitable growth for our growth, strengthen our global position as a leading provider of vehicle rental services, enhance our customers’ rental experience, control costs and drive efficiency throughout the organization. We expect to achieve our goalsCompany by focusing our efforts on the following coredelivering strategic initiatives:
Strategically Accelerate Growth. We have pursued and will continue to pursue numerous opportunities intended to increase our revenues and make disproportionate contributions to our earnings. For instance:
| |
◦ | We are focused on promoting car class upgrades, adjusting our mix of vehicles to match customer demand, growing our rentals to small-business and international travelers, increasing the number of rentals that customers book through our own websites and mobile applications, increasing the proportion of transactions in which customers prepay us, and expanding our ancillary revenues derived from offering additional ancillary products and services to the rental transactions of an increasing percentage of our customers. We believe these efforts will not only enhance the rental experience, but also generate incremental revenue and add to profitability. |
| |
◦ | We are focused on yield management and pricing optimization in an effort to increase the rental fees we earn per rental day. We have implemented, and plan to continue to implement, new technology systems that strengthen our yield management and enable us to tailor our product, service and price offerings not only to meet our customers’ needs, but also in response to actions taken by our competitors. We expect to continue to adjust our pricing to bolster profitability and match changes in demand. |
| |
◦ | We continue to see significant growth opportunities related to our Zipcar brand. We expect to increase our Zipcar membership base by growing the number of businesses, government agencies and universities that Zipcar serves within its existing markets, as well as expanding the brand into new markets where our existing car rental presence will help enable the introduction of Zipcar’s car sharing services. We expect that such growth will include making more Zipcars available at airport locations, offering one-way usage of Zipcars at certain locations, cross-marketing partnerships through our well-established corporate and affinity relationships and expanding our car sharing footprint outside of the United States. |
| |
◦ | We continue to focus on addressing the need of the deep-value segment of the vehicle rental industry with our Payless and Apex brands and look to increase our profitability in this segment as we grow our revenues. |
Strengthening Our Global Position. While we currently operate, either directly or through licensees, in approximately 180 countries around the world, we will continue to strengthen and further expand our global footprint through organic growth and potentially through acquisitions, joint ventures, licensing agreements or other relationships:
| |
◦ | In countries where we have Company-operated locations, we will continue to identify opportunities to add new rental locations, to grant licenses to independent third parties for regions where we do not currently operate and/or do not wish to operate directly, to strengthen the presence of our brands and to re-acquire previously granted license rights in certain cases. |
| |
◦ | In countries operated by licensees, including our joint ventures in India and China, we will seek to ensure that our licensees are well positioned to realize the growth potential of our brands in those countries and are aggressively growing their presence in those markets, and we expect to consider the re-acquisition of previously granted license rights in certain cases. |
| |
◦ | Zipcar represents a substantial growth opportunity for us as we believe that there are numerous geographic markets outside the United States, particularly in Europe and the Asia Pacific region, where Zipcar’s proven car sharing model can be utilized to meet substantial, currently unmet transportation needs. |
Enhancing Customers’ Rental Experience. We are committed to serving our customers and enhancing their rental experience, including through our Customer Led, Service Driven™ initiative, which isinitiatives aimed at improving our customers’ rental experience with ourwinning and retaining customers through differentiated brands our systems and our employees. Following extensive reviews of the ways, places and occasions in which our brands, our systems and our employees interact with existing and potential customers, we have implemented actions that further enhance the service we provide at these customer “touch points.” For example:
| |
◦ | With significant input from our customers, we created our Avis Now mobile application, which provides our Avis customers a new and innovative way to control many elements of their rental experience via their smartphone or tablet device. Through the Avis Now application, our customers are able to view which cars are available in real-time; exchange or upgrade a car prior to or while on the rental lot; confirm, cancel or extend a rental; add ancillary products; return a car without assistance; view their rental agreement; confirm their fuel level at beginning and end of rental as well as miles driven; and obtain assistance on demand.
|
| |
◦ | We offer Avis PreferredSelect & Go™, a vehicle-choice program for customers, have revised our rental agreements and receipts to improve transparency, and offer mobile applications to accept reservations and to better communicate with customers. We have also continued improving the overall customer experience by focusing on our understanding of and improving upon our customer service practices, soliciting more feedback from our customers and expanding our customer-service-oriented training of our employees.
|
| |
◦ | We continue to upgrade our technology, to make the reservation, pick-up and return process more convenient and user-friendly, with a particular emphasis on enabling and simplifying our customers’ online interactions with us. |
We expect to continue to invest in these efforts, with a particular emphasis on self-service technologies that we believe will allow us to serve customers more effectively and efficiently.
Controlling Costs and Driving Efficiency throughout the Organization.We have continued our efforts to rigorously control costs. We continue to aggressively reduce expenses throughout our organization, and we have consistently eliminated or reduced significant costs through the integration of acquired businesses. In addition:
| |
◦ | We continued to develop and implement our Performance Excellence process improvement initiative to increase efficiencies, reduce operating costs and create sustainable cost savings using LEAN, Six Sigma and other tools. This global initiative has generated substantial savings since its implementation and is expected to continue to provide incremental benefits. |
| |
◦ | We have taken significant actions to further streamline our administrative and shared-services infrastructure through a restructuring program that identifies and replicates best practices, leverages the scale and capabilities of third-party service providers, and will increase the global standardization and consolidation of non-rental-location functions over time. |
| |
◦ | We have implemented initiatives to integrate our acquired businesses, to realize cost efficiencies from combined maintenance, systems, technology and administrative infrastructure, as well as fleet utilization benefits and savings by combining our car rental and car sharing fleets at times to reduce the number of unutilized vehicles. |
| |
◦ | We have also continued to implement technology solutions, including self-service voice reservation technology, mobile communications with customers and fleet optimization technologies to reduce costs, and we will further continue to pursue innovative solutions to support our strategic initiatives. |
We believe such steps will continue to aid our financial performance.
In 2016, we continued to refine our strategies to further emphasize supporting and strengthening our brands,products, increasing our margins and seizingvia revenue growth and operational efficiency opportunities asand enhancing our leadership in the evolving mobility solutions continue to evolve. Inindustry.
Supporting and Strengthening Our Brands
In executing our strategy, we plan towill continue to position our distinct and well-recognized global brands to focus on different segments of customer demand, complemented by our other brands in their respective regional markets. With Avis as a premium brand preferred moreWhile our brands address different use-cases and target customers, we achieve efficiencies by corporate and upscale leisure travelers, Budget as a mid-tier brand preferred more by value-conscious travelers, Payless as a deep-value brand, Maggiore, France Cars and Apex as well-recognized regional brands and Zipcar offering its members an economical alternative to car ownership, we believe we are able to target a broad range of demand, particularly since the brands often sharesharing the same operational and administrative infrastructure while providing differentiated though consistently high levelsvalue propositions tailored to each of customer service.our brands.
We currently operate our brands, either directly or through independent operators and licensees around the world and we plan to continue to strengthen and further expand our global footprint through organic growth and, potentially, through acquisitions, joint ventures, licensing agreements or other relationships:
In countries where we have Company-operated locations, we will continue to identify opportunities to add new rental locations, to grant licenses to independent third parties for areas where we do not currently operate and do not wish to operate directly, to strengthen the presence of our brands and in certain cases to re-acquire previously granted license rights.
In countries operated by licensees or partners, we will seek to ensure that those businesses are well positioned to realize the growth potential of our brands in those countries and are growing their presence in those markets, and in certain cases we will continue to consider the re-acquisition of previously granted license rights.
In countries where we have either Company-operated or licensee-operated locations, we will also continue to identify opportunities to leverage our Zipcar brand and its car sharing model, which allows us to fulfill the expanding urban mobility needs of customers.
Since our Avis brand represents approximately 60%58% of our revenue and is recognized as a global leader in vehicle rental, services, we are particularly focused on maintaining and building its reputation as a reliably high-quality service provider. Our Avis Preferred loyalty program, which offers our customers the ability to bypass the rental
counter and also earn reward points, coupled with our continued investment in technology, including the roll-out of our Avis Now mobile application and new Avis websites, is aand our growing fleet of connected cars, are all key partparts of our efforts. We have also increased our marketing activities in support ofefforts to enhance the Avis and Budget brands.
experience for our customers.
We aim to provide a range of vehicles, products and services and pricing,at competitive prices, to useleverage various marketing channels and to maintain marketing affiliations and corporate account contracts that complement each brand’s positioning. We plan toalso continue to invest in our brands through a variety of efforts, including television commercials, print advertisements andboth on-line and off-line marketing. We continue to see particular growth opportunities for Budget and our Budget brandother local brands in Europe, as Budget’sthe share of airport car rentals for Budget is significantly smaller in Europe than in certain other parts of the world,world.
To further support and for Zipcar internationally, wherestrengthen our brands, we are committed to serving our customers and enhancing their rental experience through new organic offerings that optimize our brands, our systems and our employees. We frequently solicit feedback from and survey our customers to better understand their needs and we have implemented actions to enhance our services, including the brand’s provenfollowing:
We created our Avis mobile application to provide a higher quality end-to-end user experience, building upon direct feedback from customers to re-design the rental experience to meet their needs. Our Avis mobile application allows customers to reserve, update and cancel reservations, choose their car, sharing model can be expanded into numerous geographic markets.exchange or upgrade their vehicle, add ancillary products, extend rentals, return the vehicle with one click, view and share current and past rental receipts to expedite expense processing, review rental agreement details and the vehicle’s insurance card, and, in the case of connected vehicles, lock and unlock the vehicle, confirm their fuel level at the beginning and end of their rental as well as miles driven, using their mobile device;
In executingWe continue to upgrade our technology and the ways it can further serve our customers, to make the vehicle reservation, pick-up and return processes more convenient and user-friendly, with a particular emphasis on enabling and simplifying our customers’ online transactions. We have partnered with other technology and product companies to continuously improve the user experience through various mobile and technology capabilities. These include working with Amazon to allow for voice-controlled access to our services through Amazon Alexa enabled devices; and
We piloted and subsequently launched “Curbside Delivery” services in select U.S. airport markets, in which customers can bring their car to the Avis and Budget return lot, where an Avis or Budget employee will drive them to their appointed terminal or gate and complete the vehicle return process transaction at the curb.
We will continue to invest in these and other innovative efforts, with a particular emphasis on technologies, services and products that will allow us to not only serve customers more effectively and efficiently, but offer new brand-differentiating options.
Margins and Operational Efficiency
Our strategy we are keenlyis focused on identifying and implementing actions that willto increase our margins over the next several years. We see significant potential in the areas of optimizingopportunities that optimize our pricing and customer mix andmix; increase sales of ancillary products and services; optimizingservices through new product and service development; optimize our procurement processes; refine the deployment and disposition of vehicles including increased(e.g. increasing the use of non-auction channels for selling our cars; continuing tovehicles); drive operational efficiency in our business; and applying connected-car/apply connected car/in-vehicle systems and other emerginginnovative mobility technologies in our operations. Our margins have increased significantly from 2010 to 2016, and we see opportunities to continue the trend of longer-term margin growth.
We also believe that new technologiescontinue to pursue opportunities intended to drive our margins and evolving customer preferences that favor the rental or sharing of vehicles rather than personal car ownership represent important opportunities for us to meet newincrease our revenues and growing consumer and commercial demand for the types ofprofitability, including:
Offering our customers useful ancillary products and services, promoting car class upgrades, adjusting our mix of vehicles to match customer demand; repositioning our sales strategy to focus on the most profitable segments, increasing the number of rentals that we provide. We seecustomers book directly through our Zipcar brand expanding into new marketswebsites and providing new transportation solutions,mobile applications and increasing the proportion of “Pay Now” transactions by which customers prepay for rentals.
Investing in yield management and pricing analytics tools, such as one-way trips,our Revenue Management System, to both shapeincrease the profits we earn per rental day. We have implemented, and satisfy consumers’ needs. In addition, we believe there are substantial opportunities forplan to continue deploying, new technology systems that strengthen our Avisyield management decisions and Budget brandsenable us to benefit and grow as mobility solutions and vehicle-related technologies evolve.tailor our product,
service and price offerings to meet our customers’ needs and react quickly to shifting market conditions. We operate in a highly competitive industry,will continue to adjust our pricing to improve profitability and manage our results can be impacted by external factors, such as travel demand and uncertain economic conditions in various parts of the world. We seek to mitigate our exposure to risks in numerous ways, including delivering upon the core strategic initiatives described above and through continued optimization of fleet levels to match changes in demand for vehicle rentals, maintenance of liquidity to funddemand.
Managing and improving our fleet decisions to better optimize and drive the purchase, deployment, and disposition of our fleet to lower costs and meet customer demand, grow our direct-to-dealer and consumer sales performance, reduce maintenance and repair expenses, better optimize our salvage costs, reduce the risk of damage to our vehicles, and improve fleet utilization benefits and savings by combining our vehicle rental and car sharing fleets when appropriate which we believe will create significant financial benefits.
Seeking opportunities where our investments will generate strong margin returns, including expanding rental locations, acquiring and integrating existing licensees in key markets, participating in joint ventures and acquiring leading local brands.
Increasing our Zipcar membership base within its existing markets, as well as expanding the brand into new markets.
We also continued to focus our efforts on rigorously controlling our costs, aggressively reducing expenses and increasing efficiencies throughout our organization by:
Implementing process improvements throughout our business to increase efficiencies, reduce operating costs and create sustainable cost savings.
Achieving reductions in underlying direct operating and selling, general and administrative expenses, including reductions in staff where and when appropriate.
Assessing location, segment and transaction profitability to address less-profitable aspects of our business and focus on the more-profitable accounts that will help drive increased margins.
Deploying changes to our sales, marketing and affinity programs to improve profitability.
Integrating our acquired businesses, to realize cost efficiencies from combined maintenance, systems, technology and administrative infrastructure.
Implementing innovative technological solutions like self-service voice reservation technology, mobile communications with customers and fleet optimization technologies to reduce costs.
We believe such operational improvements will continue to assist and in some cases, drive our financial performance.
Our Evolving Mobility Platform
We believe our Company is well-positioned as a global leader in the evolving mobility marketplace. Mobility is more than providing a clean reliable car of choice for a customer to use to get from point A to point B; it also means providing our customers the choice to rent a vehicle or share a vehicle, and to do so by the year, month, week, day, hour or fraction of an hour. Mobility means our customers, using their smartphones or tablets, can customize their experiences with our products, services, and employees, bypass the counter or change their minds about the make or model of a vehicle and review their options on their mobile device right up to the moment they exit the parking lot. Mobility also means providing customers with choices even on the shortest trips, including how they want to be transported to or from their rental vehicles at the airport or by providing them with real time data about the wait time for the next shuttle.
When our customers return their rental vehicles to our fleet, whether at an airport or off-airport facility or a designated customer parking spot, our preferred customers can receive their complete charges for their transaction including gas, ancillary products use, and any other applicable charges, via email or text, within minutes of their proper return of the vehicle. In the future we intend to deliver more data content to our customers in their vehicles and to their devices that will provide them with customized access to useful information they want to know about, including eating, shopping, lodging, emergency assistance and tips on just enjoying the location they are visiting.
With our connected cars, mobility means being able to collect data about the car that will improve customer service and vehicle safety. It also means that we will be able to provide a new suite of services for clients who are looking to utilize our operational experience and our operations,technology to maintain and adjustmentsmanage their own fleets, and provide supply chain services with quality and precision at levels that exceed their ability to do so themselves.
Our current and growing list of business partnerships with other mobility service providers in adjacent business models allows us to offer more options to our business and leisure customers to satisfy a wide variety of mobility needs.
For our shareholders, mobility means seizing opportunities that will increase our overall value through strategies that expand the use of our technologies, fleet and employees, open new markets, increase revenue and margins across all our brands; and maintain our strength as an innovator in the size, natureexpanding mobility market.
Since 2017, we have undertaken several initiatives and termsentered into partnerships in support of our relationshipsstrategy, including:
Exceeding our goal of having more than 100,000 connected vehicles in our U.S. Avis fleet in 2018, delivering both customer benefits and operational efficiencies, including entering into agreements with Ford and Toyota to connect all their vehicles in our U.S. Avis fleet. We also expect to expand connected vehicles in Europe during 2019, bringing us closer to our goal of having a 100% global connected fleet;
Our launch of our first-ever Mobility Lab in the Kansas City, Missouri area, utilizing fully connected vehicles that allows us to leverage our capabilities to deliver operational efficiencies through on-demand inventory counts, mileage management and automated maintenance notifications that enhance and optimize the Company’s fleet management capabilities;
Our integration with Amazon Alexa, which allows travelers to book and manage their car rental reservations through the voice platform on Amazon Echo;
Our partnership with Waymo, an Alphabet Inc. company, through which we are offering fleet support and maintenance services for their growing fleet of autonomous vehicles in Phoenix, Arizona. This provides a unique opportunity to grow our understanding of the support and operational maintenance requirements for self-driving vehicles at the fleet level, including staffing and facility requirements;
Our focus on emerging technologies through our collaboration with various international and local technology incubators;
Our partnership with Lyft, in which we are enabling Lyft drivers across North America the ability to use Avis vehicles on a monthly and weekly basis as an alternative to using their own personal vehicle;
Our partnership with Brightline in Florida, the only privately owned and operated passenger rail service in the United States, in which we offer Brightline passengers and those living or working near Brightline’s stations convenient access to Avis and Zipcar vehicles that can be reserved via integration with the Brightline app; and
Our use of Amazon Web Services’ (“AWS”) Connected Vehicle Solution to build our data analytics platform, providing highly secure and scalable cloud services and allows us to leverage AWS’ capabilities for artificial intelligence, machine learning, and data management to develop a wide variety of innovative connected vehicle manufacturers.applications and mobility services.
We are committed to finding new and innovative ways of thinking and operating, and to leverage our technology, employees, global presence and capabilities to be leaders among the contributors that are now shaping the evolving mobility market.
|
|
| OUR BRANDS AND OPERATIONS |
OUR BRANDS
Our Avis, Budget and Zipcar brands are three of the most recognized brands in our industry. We believe that we enjoy significant benefits from operating our Avisbrands with services and Budget brandsproducts targeted to target different rental customers but shareand sharing the same maintenance facilities, fleet management systems, technology and administrative infrastructure. In addition, we are able to recognize significant benefits and savings by combining our car rental and car sharing maintenance activities and fleets at times to reduce the number of unutilized carsincrease our fleet utilization efficiency and to meet demand peaks. We believe that Avis, Budget and Zipcar all enjoy complementary demand patterns with mid-week commercial demand balanced by weekend leisure demand. We also operate the Apex and Payless brands, which operate in the deep-value segment of the car rental industry, and augmentaugmenting our Avis, Budget and Zipcar brands. In addition, our Maggiore and Morini brands in Italy, FranceCars brand in France and Turiscar brand in Portugal further extend the range of vehicle use occasions we are able to serve.
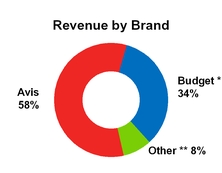
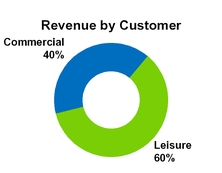
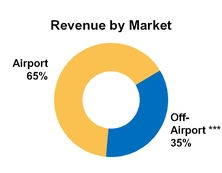
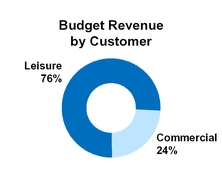
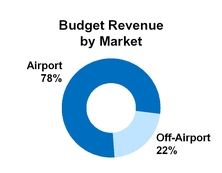
The following graphs present the approximate composition of our revenue by brand, customer and market in 2018.
| |
| ** | Includes Zipcar and other operating brands. |
*** Includes Budget Truck and Zipcar.
Avis
The Avis is a leadingbrand provides high-quality vehicle rental car supplier positionedand other mobility solutions at price points generally above non-branded and value-branded vehicle rental companies to serve the premium commercial and leisure segments of the travel industry. The Avis brand provides high-quality car rental services at price points generally above non-branded and value-branded national car rental companies. We operate or license the Avis carvehicle rental system (the “Avis System”), one of the largest carglobal vehicle rental systems, in the world, comprised ofat approximately 5,500 locations worldwide, including in virtually all of the largest commercial airports and cities in the world.
We operateThe Avis System is comprised of an approximately 2,750 Avis carequal number of company-owned and licensee vehicle rental locations worldwide, in both the on-airport and off-airport, or local, rental markets. The table below presents the approximate number of locations that comprise the Avis System as of December 31, 2018.
|
| | | | | | | | |
| | Avis System Locations* |
| | Americas | | International | | Total |
| Company-operated locations | 1,550 |
| | 1,300 |
| | 2,850 |
|
| Licensee locations | 700 |
| | 1,950 |
| | 2,650 |
|
| Total Avis System Locations | 2,250 |
| | 3,250 |
| | 5,500 |
|
| |
| * | Certain locations support multiple brands. |
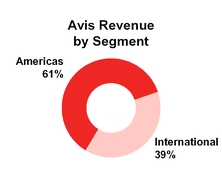
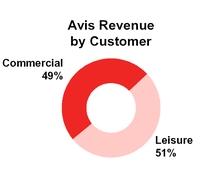
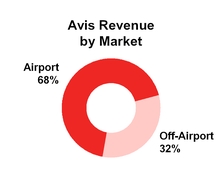
In 2016,2018, our company-operated Avis operationslocations generated total world-wide revenue of approximately $5.1$5.3 billion, of which approximately 63% (or $3.2 billion)$2.6 billion was derived from operationscommercial customers and approximately $3.6 billion was derived from customers renting at airports. The following graphs present the approximate composition of our Avis revenue by segment, customer and market in the Americas. In addition, we2018.
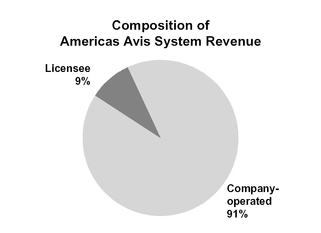
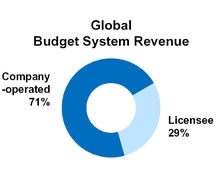
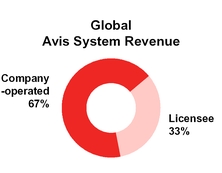
We also license the Avis brandSystem to other independent commercial owners inwho operate approximately 2,750half of our locations throughout the world. In 2016, approximately 71% of the Avis System total revenue was generated by our Company-operated locationsworldwide and the remainder was generated by locations operated by independent licensees, which generally pay royalty fees to us based on a percentage of applicable revenue.
The table below presents In 2018, approximately 33% of the approximate number of locations that comprise theglobal Avis System:
|
| | | | | | | | |
| | Avis System Locations |
| | Americas | | International | | Total |
| Company-operated locations | 1,550 |
| | 1,200 |
| | 2,750 |
|
| Licensee locations | 700 |
| | 2,050 |
| | 2,750 |
|
| Total Avis System Locations | 2,250 |
| | 3,250 |
| | 5,500 |
|
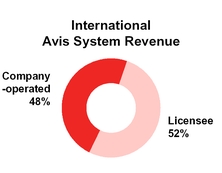
System revenue was generated by our licensees. The graphs below present the approximate composition of the Americas Avis System revenue and global Avis System revenue in 2016:2018.
In 2016, Avis derived approximately $1.8 billion and $1.8 billion (or 50% and 50%) of its vehicle rental revenue from commercial and leisure customers, respectively, and $2.5 billion and $1.1 billion (or 70% and 30%) of its vehicle rental revenue from customers renting at airports and locally, respectively.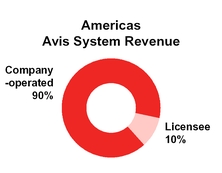
We offer Avis customers a variety of premium services, including:
the Avis Now,mobile application, which allows customers a new and innovative way to control many elements of their rental experience via their mobile application-enabled process thatdevices without the need to visit the rental counter. The Avis mobile application also allows customers to reserve, confirm, choose or upgradetrack Avis shuttle buses to rental locations, find their car, add ancillary products, openvehicle, and close or extend rentals,locate nearby gas stations and in the case of certain connected vehicles, lock and unlock the vehicle, using their smartphone or tablet device.
parking facilities;
Avis Preferred, a frequent renter rewards program that offers counter bypasscounter-bypass at major airport locations and reward points for every dollar spent on vehicle rentals and related products;
the Avis Preferred Select & Go, a service that allows customers at certain locations to select an alternate vehicle or upgrade their vehicle choice without visiting the rental counter;
Avis Signature Series, a selection of luxury vehicles including BMWs,Mercedes, Jaguars, Corvettes, Mercedes and Maseratis;
rental of portable GPS navigation units, tablets and in-dash satellite radio service;others;
availability of premium, sport and performance vehicles as well as eco-friendly vehicles, including gasoline/electric hybrids;
roadside assistance;access to portable navigation units, tablets and in-dash satellite radio service;
e-receipts;
a 100% smoke-free carAvis rental fleet in North America;
services such as roadside assistance, fuel service options, e-receipts, electronic toll collection services that allow customers to pay highway tolls without waiting in toll booth lines;
lines, and amenities such as Avis Access, a full range of special products and services for drivers and passengers with disabilities;
Curbside Delivery, a service that provides customers at select airport locations in the United States with the added convenience of being dropped off at the airport terminal in the same car that they rented;
for our corporate customers, Avis Interactive,Budget Group Business Intelligence, a proprietary managementcustomer reporting solution that provides a centralized reporting tool that allowsand customer reporting portal for all corporate clients around the globe. This enables them to easily view and analyze their rental activity, via the Internet, permitting these clientsthem to better manage their travel budgets and monitor employee compliance with applicable travel policies; and
supporting online interactions withapplications that serve our customers through various mobile and technology platforms, including an application for the Apple Watch devices and an Android application featuring voice-activated reservations.
Avis has been named the leading car rental company in customer loyalty in the Brand Keys Customer Loyalty Engagement Index for the seventeen consecutive years. In addition, Avis was named to the 2016 Brand Keys Loyalty Leaders List and received numerous other awards.voice-controlled access through Amazon Alexa enabled devices.
Budget
The Budget brand is a leading supplier of vehicle rental car supplierand other mobility solutions focused primarily on more value-conscious segments of the industry.customers. We operate or license the Budget vehicle rental system (the “Budget System”), which is comprised of approximately 4,050 carvehicle rental locations and represents one of the largest car rental systems in the world. The Budget System encompasses locations at most of the largest airports and cities in the world.
We operate approximately 2,050 Budget car rental locations worldwide. In 2016, our Budget car rental operations generated total revenue of approximately $2.5 billion, of which 83% (or $2.1 billion) was derived from operations in the Americas. We also license the Budget System to independent commercial owners who operate approximately 2,000 locations worldwide. In 2016, approximately 71% of the Budget System total revenue was generated by our Company-operated locations with the remainder generated by locations operated by independent licensees, which generally pay royalty fees to us based on a percentage of applicable revenue.
The table below presents the approximate number of locations that comprise the Budget System:System as of December 31, 2018.
| | | | Budget System Locations | Budget System Locations* |
| | Americas | | International | | Total | Americas | | International | | Total |
| Company-operated locations | 1,400 |
| | 650 |
| | 2,050 |
| 1,375 |
| | 875 |
| | 2,250 |
|
| Licensee locations | 650 |
| | 1,350 |
| | 2,000 |
| 650 |
| | 1,100 |
| | 1,750 |
|
| Total Budget System Locations | 2,050 |
| | 2,000 |
| | 4,050 |
| 2,025 |
| | 1,975 |
| | 4,000 |
|
| |
| * | Certain locations support multiple brands. |
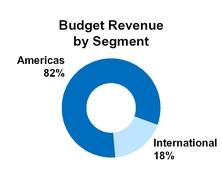
In 2018, our company-operated Budget vehicle rental operations generated total revenue of approximately $2.7 billion, of which approximately $2.0 billion was derived from leisure customers and $2.1 billion was derived from customers renting at airports. The following graphs present the approximate composition of our Budget revenue by segment, customer and market in 2018.
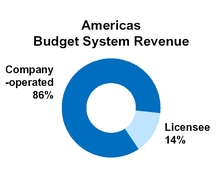
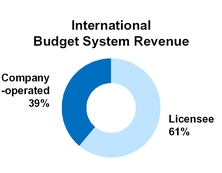
We also license the Budget System to independent commercial owners who operate approximately half of our locations worldwide and generally pay royalty fees to us based on a percentage of applicable revenue. In 2018, approximately 29% of the global Budget System revenue was generated by our licensees. The graphs below present the approximate composition of the Americas Budget System revenue and global Budget System revenue in 2016:2018.
In 2016, Budget derived approximately $1.3 billion and $435 million (or 75% and 25%) of its vehicle rental revenue from leisure and commercial customers, respectively, and $1.3 billion and $427 million (or 75% and 25%) of its vehicle rental revenue from customers renting at airports and locally, respectively.
Budget offers its customers several products and services similar to Avis, such as portable GPS navigation units,refueling options, roadside assistance, electronic toll collection, curbside dropoff and other supplemental rental products, emailed receipts and refueling options, as well as aspecial rental rates for frequent renters. In addition, Budget’s mobile application that allows customers to reserve, modify and cancel reservations on their smartphone, special rental rates for frequent rentersmobile device, and Budget’sits Fastbreak service, an expeditedexpedites rental service for frequent travelers.
In 2016, Budget received numerous awards, including for its award-winning loyalty program, Unlimited Rewards®, which was selected by Travel Weekly as a 2016 Gold Magellan Award Winner.
Zipcar
Founded in 2000, Zipcar operates the world’s leading membership-based car sharing network that provides “wheels when you want them” to more than one million members, also known as “Zipsters,” in over 30 major metropolitan areas, over 550 college campuses and in more than 500 cities and towns across the United States, Canada and Europe. Zipcar provides its members self-service vehicles in reserved parking spaces located in residential neighborhoods, business districts, college campuses, business office complexes and airports.
Our members may reserve vehicles by the hour or by the day at rates that include gasoline, insurance and other costs associated with vehicle ownership, and they can make their reservations through Zipcar’s reservation system, which is available by phone, Internet or through the Zipcar application on their smartphone. Our members have the flexibility to choose from a variety of makes and models of vehicles depending on their specific needs and desires for each trip and the available Zipcars in their neighborhoods. The flexibility and affordability of our service, as well as broader consumer trends toward responsible and sustainable living, provide a significant platform for future growth.
We continue to make substantial investment in refining, innovating and enhancing Zipcar’s operations and fleet management systems, and we have integrated numerous elements of Zipcar’s operations and fleet management into our existing processes. We believe that the experience that we have gained and continue to accumulate while growing and operating our network is a key advantage, informing our decisions regarding our existing operations and services as well as our plans for expansion.
Zipcar offers its members the freedom of on-demand access to a fleet of vehicles at any hour of the day or night, in their neighborhood or in any of our Zipcar cities and locations. Benefits to members include:
Cost-effective alternative to car ownership - Members pay for time they reserve the vehicle and have no responsibility for the additional costs and hassles associated with car ownership, including parking, gasoline, taxes, registration, insurance, maintenance and lease payments.
Convenience and accessible fleet - Zipcars are interspersed throughout local neighborhoods, colleges and corporate campuses where they are parked in reserved parking spaces and garages within an easy walk of where our members live, study and work. Members can book a designated vehicle online, by phone or via their mobile device, unlock the selected vehicle using a keyless entry card (called a “Zipcard”), and drive away. Because each Zipcar has a designated parking space, members are spared the often time-consuming undertaking of finding an available parking spot.
Freedom and control - We provide our members with much of the freedom associated with car ownership while being complementary to public transportation options. Like car owners, our members can choose when and where they want to drive. They also have the added benefit of being able to choose, based upon the readily available Zipcars in their neighborhoods, the make, model and type of vehicle they want to drive based on their specific needs and desires for each trip.
Responsible and sustainable living - We are committed to providing our members with socially responsible, sustainable options that support the global environment, their communities and city livability. Studies show that car sharing reduces the number of miles driven, the number of personally-owned vehicles on the road and carbon emissions.
Zipcar for Universities - We provide college students, faculty, staff and local residents living in or near rural and urban campuses with access to Zipcars. Zipcars are located on over 550 college and university campuses. Our program for universities helps university administrators maximize the use of limited parking space on campus and reduce campus congestion while providing an important amenity for students, faculty, staff and local residents. In some cases, Zipcar may be the only automobile transportation available to students, since many traditional rental car services have higher age restrictions.
Zipcar for Business - We provide companies with a business-friendly alternative to providing company cars with car-sharing programs that give their employees convenient, on-demand access to vehicles at exclusive rates. Zipcar for Business also allows easy billing, enabling members to charge driving to the driver or directly to their employer.
In 2016, we expanded Zipcar’s ONE>WAY program in selected markets, allowing members in more locations to take on-demand one-way trips. We also opened the first pilot of Zipcar’s “floating” car sharing product in Brussels, allowing members to drive one-way and leave the car in any designated space. The Zipcar brand has continued to be recognized as the world’s leading car sharing network and for the quality of the customer experience it offers.
Budget Truck
Our Budget Truck rental business is one of the largest local and one-way truck rental businesses in the United States. OurAs of December 31, 2018, our Budget Truck fleet is comprised of approximately 22,00018,000 vehicles that are rented through a network of approximately 1,000 dealers640 dealer-operated and 480430 Company-operated locations throughout the continental United States. These dealers are independently-owned businesses that generally operate other retail service businesses. In addition to their principal businesses, the dealers rent our light- and medium-duty trucks to consumers and to our commercial accountscustomers and are responsible for collecting payments on our behalf. The dealers receive a commission on all truck and ancillary equipment rentals. The Budget Truck rental business serves both the consumer and light commercial sectors. The consumer sector consists primarily of individuals who rent trucks to move household goods on either a one-way or local basis. The light commercial sector consists of a wide range of businesses that rent light- to medium-duty trucks, which we define as trucks having a gross vehicle weight of less than 26,000
pounds, for a variety of commercial applications.
Zipcar
Zipcar operates one of the world’s leading membership-based car sharing networks, which provides its members on-demand access to vehicles in over 500 cities and towns and at more than 600 college campuses around the world. Zipcar provides its members on-demand, self-service vehicles in reserved parking spaces located in neighborhoods, business districts, office complexes, college campuses and airports, as an alternative to car ownership. Members can reserve vehicles online, on a mobile device or over the phone, by the minute, hour or by the day, at rates that include gasoline, insurance and other costs associated with vehicle ownership. In 2018, we widened Zipcar’s product offering by launching our Zipcar Commuter product, which is now available in 11 major markets in North America and provides unlimited, sole access to a vehicle and dedicated parking spot for Zipcar members who commute outside of the city for work. We also began offering our Zipcar “Flex” product in London providing for one-way rentals that are typically at a lower price than ride-hailing services.
Other Brands
Our Payless brand is a leading rental car supplier positioned to serve the deep-value segment of the carvehicle rental industry. We operate or license the Payless brand, which is comprised of approximately 240 vehicle rental280 locations worldwide, including approximately 90120 Company-operated locations and more than 150160 locations operated by licensees. Company-operated Payless locations are primarily located in North America, the majority of which are at or near major airports. Payless’ base T&Mrental fees are often lower than those of larger, more
established brands, but Payless has historically achieved a greater penetration of ancillary products and services with its customers. The Payless business model allows the Company to extend the life cyclelife-cycle of a portion of our fleet, as we “cascade” certain vehicles that exceed certain Avis and Budget age or mileage thresholds to be used by Payless.
Our Apex brand operates primarily in the deep-value segment of the carvehicle rental industry in New Zealand and Australia, where we have approximately 25 Apex30 rental locations. Apex operates its own rental fleet, separate from Avis and Budget vehicles and generally older and less expensive than vehicles offered by Avis, Budget and other traditional car rental companies.vehicles. Apex generates substantially all of its reservations through its proprietary websites andas well as its contact center and online travel agencies and typically has a greater than averagegreater-than-average length of rental. The substantial majority of Apex operates rental locations are at, or near, major airport locations.airports and in several metropolitan cities.
Our Maggiore brand is a leading vehicle rental brand in Italy, where we operate or license more than 130approximately 140 rental locations under the Maggiore name. Our Maggiore brand has a strong domestic reputation in the commercial, leisure and insurance replacement/leasing segments and benefits from a strong presence at airport, off-airport and railway locations. We have integrated numerous elementslocations, and benefits from the integration of Maggiore’sour existing operations and fleet management intoexpertise. In addition, our existing processes. recently acquired Morini brand is a leading vehicle rental brand in Italy, which offers rental of cars, vans and refrigerated vehicles. We operate or license more than 40 rental locations under the Morini name throughout the country.
Our France CarsFranceCars brand operates one of the largest light commercial vehicle fleets in France from more than 60approximately 85 rental locations. Withlocations and leverages our existing operational processes and local customer base.
Our recently acquired Turiscar brand is a leading vehicle rental brand in Portugal, primarily in the purchase of France Cars in December 2016, we further increased our ability to serve customers’ needs for vans andcorporate market, including light truckscommercial vehicles, from approximately 25 rental locations throughout France.the country.
RESERVATIONS, MARKETING AND SALES
Reservations
Our customers can make vehicle rental reservations through our brand-specific websites and through our toll-free reservation centers, by calling a specific location directly, through our brand-specific mobile applications, through online travel agencies, through travel agents or through selected partners, including many major airlines, associations and retailers. Travel agents can access our reservation systems through all major global distribution systems, (“GDSs”), which provide information with respect to rental locations, vehicle availability and applicable rate structures.
Our Zipcar members may reserve cars by the minute, hour or by the day through Zipcar’s reservation system, which is accessible through the Zipcar website, through the Zipcar application on their smartphone or by phone.
We also provide two-way SMS texting, enabling us to proactively reach out to members during their reservation via their mobile device to manage their reservation, including instant reservation extension.
In 2016, we generated approximately 29% of our vehicle rental reservations through our brand-specific websites, 10% through our contact centers, 25% through GDSs, 14% through online travel agencies, 12% through direct-connect technologies and 10% through other sources. Virtually all of our Zipcar car sharing reservations were generated online or through our Zipcar mobile applications. We use a voice reservation system that allows customers to conduct certain transactions such as confirmation, cancellation and modification of reservations using self-service interactive voice response technology. In addition to our Zipcar mobile applications, we have also developed Avis and Budget mobile applications for various mobile platforms, allowing our customers to more easily manage their car rental reservations on their mobile devices.
Marketing and Sales
We support our brands through a range of marketing channels and campaigns, including traditional media, such as television radio and print advertising, as well as Internet and email marketing, social media and wireless mobile device applications. We market through sponsorships of major sports entities such as the PGA Tour, the New York Yankees, the Toronto Maple Leafs and Toronto FC. We also market through sponsorships of charitable organizations such as the Make-A-Wish Foundation. We utilize a customer relationship management system that enables us to deliver more targeted and relevant offers to customers across both online and offline channels and allows our customers to benefit through better and more relevant marketing, improved service delivery and loyalty programs that reward frequent renters with free rental days and car class upgrades.
We use social media to promote our brands and provide our customers with the tools to interact with our brands electronically through multiple web-based platforms. We also use digital marketing activities to drive international reservations.
Our Zipcar brand also utilizes localized marketing initiatives, which include low-cost, word-of-mouth marketing strategies and the use of marketing “brand ambassadors” that target potential members on a more personal, local level. These efforts highlight simple messages that communicate the benefits of “wheels when you want them.” Zipcar members also actively recruit new members as incentivized by Zipcar’s member referral program, which awards driving credit for new member referrals.
In 2016, we maintained, expanded or entered into marketing alliances with key marketing partners that include brand exposure and cross-marketing opportunities for each of the brands involved. For example, in 2016, we became the exclusive car rental partner of JetBlue Airways and JetBlue’s True Blue loyalty rewards program. We also extended our relationships with American Airlines, AARP, USAA and Aeroplan. Additionally, as the “Official Rental Car of the PGA TOUR,” Avis promoted its products and services to millions of golf enthusiasts worldwide through prominent advertising placements in PGA TOUR television broadcasts, scoreboards at tournaments, online media channels and additional official partner channels.
We continue to maintain strong links to the travel industry and we expanded or entered intoincluding marketing alliances with numerous marketing partners, in 2016:such as:
We maintain marketing partnerships with manyMany major airlines, including Air Canada, Air France, Air New Zealand, American Airlines, British Airways, Frontier Airlines, Hawaiian Airlines, Iberia Airlines, Japan Airlines, JetBlue Airways, KLM, Lufthansa, Norwegian Air, Qantas, SAS, Southwest Airlines, Virgin America and Virgin America.WestJet Airlines;
We maintain marketing partnerships with severalMany major hotel companies, including Best Western International, Inc., HiltonChoice Hotels Corporation,International, Hyatt Corporation, MGM Resorts International, Radisson Hotels and Resorts, Starwood Hotels and Resorts Worldwide, Inc., Universal Parks & Resorts and Wyndham Worldwide.Hotels & Resorts and in 2018, we became the exclusive car rental partner of Luxury Retreats, an Airbnb worldwide villa rental company;
We offerOffering customers the ability to earn frequent traveler points with many major airlines’ and hotels’ frequent traveler programs, and weprograms. We are the exclusive rental partner of the Aeroplan, JetBlue and Wyndham Rewards program.loyalty programs; and
And we have marketing relationshipsRelationships with numerous non-travel-relatednon-travel entities, includingsuch as affinity groups, membership organizations, retailers, financial institutions and credit card companies.
In 2016, approximately 61%addition, we developed new relationships that provide brand exposure and access to new customers, including a multi-year deal with Lyft to provide vehicles to the Lyft Express Drive Program in cities across North America, an agreement with Amazon to reward customers who rent an Avis or Budget car with gift cards, and a mobility partnership with Brightline, a privately owned passenger rail service in Florida.
Approximately 60% of vehicle rental transactions in 2018 from our Company-operated Avis locations were generated by travelers who rented from Avis under contracts between Avis and the travelers’their employers or through membership in an organization with which Avis has a contractual affiliation (such as AARP and Costco Wholesale). Avis also maintains marketing relationships with other organizations such as American Express, MasterCard International and Sears,others, through which we are able to provide their customers with incentives to rent from Avis. Generally, Avis licensees also generally have the option to participate in these affiliations.
Additionally, we offer “Unlimited Rewards®,” an award-winning loyalty incentive program for travel agents, and Avis and Budget programs for small businesses that offersoffer discounted rates, central billing options and rental credits to members. Budget has contractual arrangements with American Express, MasterCard International and other organizations, which offer members incentives to rent from Budget.
Budget Truck also maintains certain truck-rental-specific marketing and/or co-location relationships, including those with Sears, Simply Self Storage and Extra Space Storage. We also have an exclusive agreement to advertise Budget Truck rental services in the Mover’s Guide, an official U.S. Postal Service change of address product.
Our Zipcar brand also partners with other active lifestyle brands that appeal to our Zipcar members and organizes, sponsorswe organize, sponsor and participatesparticipate in charitable and community events with organizations that are important to us and our Zipcar members. Zipcar maintains close relationships with universities that allow us to market to the “next generation consumer” who, upon graduation, may migrate to the major metropolitan areas that we serve, continue their relationship with us and advocate for broad sponsorship of Zipcar membership at their places of work.
Through our Zipcar for Business program, we also offer reduced membership fees and weekday driving rates to employees of companies, federal agencies and local governments that sponsor the use of Zipcars.
LICENSING
We have licensees in approximately 170175 countries throughout the world. Royalty fee revenue derived from our vehicle rental licensees in 20162018 totaled $132$135 million, with approximately $94$97 million in our International segment and $38 million in our Americas segment. Licensed locations are independently operated by our licensees and range from large operations at major airport locations and territories encompassing entire countries to relatively small operations in suburban or rural locations. Our licensees generally maintain separate independently owned and operated fleets. Royalties generated from licensing provide us with a source of high-margin revenue because there are relatively limited additional fixed costs associated with fees paid by licensees to us. Locations operated by licensees represented approximately 50%45% of our Avis and Budget carvehicle rental locations worldwide and approximately 29%31% of total revenue generated by the Avis and Budget Systems in 2016.2018. We facilitate one-way carvehicle rentals between Company-operated and licensed locations, which enables us to offer an integrated network of locations to our customers.
We generally enjoy good relationships with our licensees and meet regularly with them at regional, national and international meetings. Our relationships with our licensees are governed by license agreements that grant the licensee the right to operate independently operated vehicle rental businesses in certain territories. Our license agreements generally provide our licensees with the exclusive right to operate under one or more of our brands in their assigned territory. These agreements impose obligations on the licensee regarding its operations, and most agreements restrict the licensee’s ability to sell, transfer or assign its rights granted under the license agreement and capital stock.or to change the control of its ownership without our consent.
The terms of our license agreements, including duration, royalty fees and termination provisions, vary based upon brand, territory, and original signing date. Royalty fees are generally structured to be a percentage of the licensee’s gross rental income. We maintain the right to monitor the operations of licensees and, when applicable, can declare a licensee to be in default under its license agreement. We perform audits as part of our program to assure licensee compliance with brand quality standards and contract provisions. Generally, we can terminate license agreements for certain defaults, including failure to pay royalties or to adhere to our operational standards. Upon termination of a license agreement, the licensee is prohibited from using our brand names and related marks in any business. In the United States, these license relationships constitute “franchises” under most federal and state laws regulating the offer and sale of franchises and the relationship of the parties to a franchise agreement.
We continue to optimize the Avis and Budget Systems by issuing new license agreements and periodically acquiring licensees to grow our revenues and expand our global presence. Discussion of our recent acquisitions is included in Note 5 to the Consolidated Financial Statements included in this Annual Report on Form 10-K.
OTHER REVENUE
In addition to revenue from our vehicle rentals and licensee royalties, we generate revenue from our customers through the sale and/or rental of optional ancillary products and services and membership fees.services. We offer products to customers that will enhance their rental experience, including including:
collision and loss damage waivers, under which we agree to relieve a customer from financial responsibility arising from vehicle damage incurred during the rental such as rental;
additional/supplemental liability insurance or personal accident/effects insurance products which provide customers with additional protections for personal or third-party losses incurred;
products for driving convenience such as portable GPS navigation units, tablet rentals, optionalfuel service options, chauffeur drive services, roadside assistance services, fuel service options, electronic toll collection services, curbside dropoff, tablet rentals, access to satellite radio, portable navigation units and child safety seat rentals. We alsorentals; and
products that supplement our daily truck rental revenue by offering customersincluding automobile towing equipment and other moving accessories such as hand trucks, furniture pads and moving supplies. In addition, we
We offer customized bundling of certain of these ancillary products and services, allowing our customers to benefit from discounted pricing and providing customers the flexibility to add multiple products or services that suit their needs.
We also receive payment from our customers for certain operating expenses that we incur, including vehicle licensing fees, as well as airport concession fees that we pay in exchange for the right to operate at airports and other locations. In 2016, approximately 6% ofaddition, we collect membership fees in connection with our revenue was generated by the sale of collision and loss damage waivers.car sharing business.
OUR TECHNOLOGIES
CarVehicle Rental
We use a broad range of technologies in our carvehicle rental operations, substantially all of which are linked to what we call our Wizard system, which is a worldwide reservation, rental, fleet control, data processing and information management system. The Wizard system enables us to process millions of incoming customer inquiries each day, providing our customers with accurate and timely information about our locations, rental rates and vehicle availability, as well as
the ability to place or modify reservations. Additionally, the Wizard system is linked to virtually all major travel distribution networks worldwide and provides real-time processing for travel agents, travel industry partners (such as airlines and online travel sites), corporate travel departments and individual consumers through our websites or contact centers. The Wizard system also provides personal profile information to our reservation and rental agents to help us better serve our customers.
We also use data supplied from the Wizard system and other third-party reservation and information management systems to maintain centralized control of major business processes such as fleet acquisition and logistics, sales to corporate accounts and determination of rental rates.pricing. The principal components of the systems we employ include:
Fleet planning model. We have a comprehensive decision tool to develop fleet plans and schedules for the acquisition and disposition of our fleet, along with fleet age, mix, mileage and cost reports, based upon these plans and schedules. This tool allowsallowing management to monitor and change fleet volume and compositiondeployment on a daily basis and to optimize our fleet plan based on estimated business levels and available repurchase and guaranteed depreciation programs. We also use third-party software to further optimize our fleet acquisition, rotation and disposition activities.
YieldRevenue management system. We have a yieldrevenue management system which is designed to enhance profitsprofitability by providing greater control of vehicle availability, inventory movements and rate availability changespricing at our rental locations. Our system monitors and forecasts both vehicle supply and customer demand to support our effortsstrategy to optimize volume and rate at each location. Integrated into this yield management system is aAn integrated fleet distribution module that takes into consideration the costs as well as the potentialand benefits associated with distributing vehicles to various rental locations within a geographic area to accommodate rental demand, at these locations. The fleet distribution module makesand make specific recommendations for movement of vehicles between locations.
Pricing decision support systems. Pricing in the vehicle rental industry is highly competitive and complex. To improve our ability to respond to rental rate changes in the marketplace, we have utilized We utilize sophisticated systems to gather and report competitive industry rental rate changes every day. Our systems,day using data from third-party reservation systems, as its source of information,which automatically scan rate movements and report significant changes to our staff of pricing analysts for evaluation. These systems greatly enhance our ability to gather and respond to rate changes in the marketplace. In 2016, we continued to implement an integrated pricing and fleet optimization tool that has allowed us to test and implement improved pricing strategies and optimization algorithms, as well as automate the implementation of certain price changes.
Websites and Mobile Applicationsmobile applications. We have developed brand-specificOur websites and mobile applications that leverage our technology across brands and provide the flexibility and ease of transacting thata simpler, streamlined experience for our customers demand for their interactions with us. Our websites and apps are optimized for various devices and provide a simple interface for each mode of communication such as computer, smartphone, tablets and other electronic devices.customers.
Customer service applications. Our customer service applications are comprehensive case management systems that our customer care agents use to handle a variety of issues and questions from our customers. Our multi-branded systems interface with our Wizard system and give our agents current and historical information about a caller so that they are better equipped to provide informed and expedited assistance, while at the same time allowing us to be consistent in our case handling and responses.
Enterprise data warehouseConnected car services application. We have developed an enterprise-wide application that interfaces with various telematics solutions that support our self-service and connected car strategy. This application, among other things, enables a sophisticatedmore accurate reading of fuel and comprehensive electronic data storagemileage to enable a customer to self-service check-out and retrieval system which retains information related to various aspects of our business. This data warehouse allows us to take advantage of comprehensive management reports and provides easy access to data for strategic decision making for our brands.
Sales and marketing systems. We have developed a sophisticated system of online data tracking which enables our sales force to analyze key account information of our corporate customers including historical and current rental activity, revenue and booking sources, top renting locations, rate usage categories and customer satisfaction data. We use this information, which is updated weekly and captured on a country-by-country basis, to assess opportunities for revenue growth, profitability and improvement.check-in their vehicle.
Campaign management. We have deployed tools that enable us to recognize customer segments and value, and to automatically present appropriate offers on our websites.
Interactive adjustments. We have developed a customer data system that allows us to easily retrieve pertinent customer information and make needed adjustments to completed rental transactions online for superior customer service. This data system links with our other accounting systems to handle any charge card transaction automatically.
Interactive voice response system. We have developed an automated voice response system that enables the automated processing of customer reservation confirmations, cancellations, identification of rental locations, extension of existing rentals and requests for copies of rental receipts over the phone using speech recognition software.
Car Sharing
Our Zipcar car sharing technology was specifically designed and built for our car sharing business and has been continually refined and upgraded to optimize the Zipcar experience for our members.upgraded. Our fully-integrated platform centralizes the management of our Zipcar reservations, member services, fleet operations and financial systems to optimize the member experience, minimize costs and leverage efficiencies. Through thisOur platform we:
processallows for basic functions such as processing new member applications;
support a mobile application and a website used by members to make and manage reservations and account information;
manageapplications, managing reservations and keyless vehicle access;
access, and providing the mobile and website applications used by our members. This platform also allows us to manage and monitor member interactions and communications, including through interactive voice response systems, email and text messaging;
integrate with third parties that provide additional services such as gas card and mapping services;
manage billing and payment processing, across multiple currencies;
manage our car sharing fleet, including scheduled service and cleanings;
managecleanings, vehicle locations and location information, including parking agreements; and
monitor and analyze key metrics of each Zipcar such as utilization rate, mileage and maintenance requirements.
Each Zipcar is typically equipped with a combination of telematics modules, including a control unit with mobile data service, radio frequency identification card readers, wireless antennae, wiring harness, vehicle interface modules and transponders for toll systems. This hardware, together with internally developed embedded firmware, vehicle communication protocols and datacenter software, allows us to authorize secure access to our Zipcars from our data centers and provides us with a comprehensive set of fleet management data that is stored in our centralized database.
Interactions between members and our Zipcars are captured in our system, across all communication channels, providing us with knowledge we use to improve our members’ experiences and better optimize our business processes. We have built and continue to innovate our technology platform in orderto provide scale to support growth, drive operational efficiency and scalability.
improve the member experience.
OUR FLEET
We offer a wide variety of vehicles in our rental fleet, including luxury cars, specialty-use vehicles and specialty-uselight commercial vehicles. Our fleet consists primarily of vehicles from the current and immediately preceding model year. We maintain a single fleet of vehicles for Avis and Budget in countries where we operate both brands. The substantial majority of Zipcar’s fleet is dedicated to use by Zipcar, but we have developed processes to share vehicles between the Avis/Budget fleet and Zipcar’s fleet primarily to help meet Zipcar’s demand peaks.Zipcar. We maintain a diverse car rental fleet, in which no vehicle manufacturer represented more than 18%14% of our 20162018 fleet purchases, and we regularly adjust our fleet levels to be consistent with demand. We participate in a variety of vehicle purchase programs with major vehicle manufacturers. In 2016, we purchased vehicles from Audi, BMW, Chrysler, Citroen, Fiat, Ford, General Motors, Hyundai, Kia, Mercedes, Nissan, Opel, Peugeot, Renault, Seat, Toyota, Volkswagen and Volvo, among others. During 2016, approximately 18%, 11% and 9%The following presents the approximate percentage of the cars acquiredfleet purchases by manufacturer in 2018.
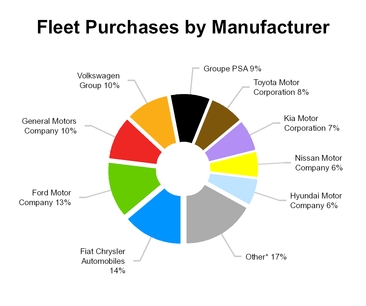
* Includes all manufacturers for our car rentalwhich fleet purchases were manufactured by Ford, General Motors and Chrysler, respectively.less than 5%.
Fleet costs represented approximately 24%25% of our aggregate expenses in 2016.2018. Fleet costs can vary from year to year based on the prices at which we are able to purchase and dispose of rental vehicles.
In 2016,2018, on average, approximately 44%38% of our rental car fleet was comprised of vehicles subject to agreements requiring automobile manufacturers to repurchase vehicles at a specified price during a specified time period or guarantee our rate of depreciation on the vehicles during a specified period of time, or were vehicles subject to operating leases.leases, which are subject to a fixed lease period and interest rate. We refer to cars subject to these agreements as “program” cars and cars not subject to these agreements as “risk” cars because we retain the risk associated with such cars’ residual values at the time of their disposition. SuchThe following graphs present the approximate percentage of program cars in both our average rental car fleet and fleet purchases within each of our reporting segments in the last three years.
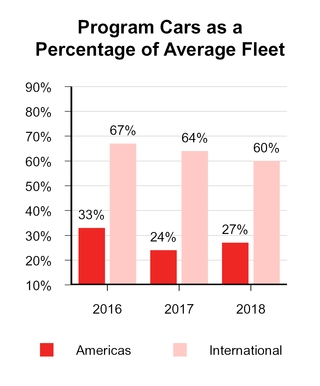
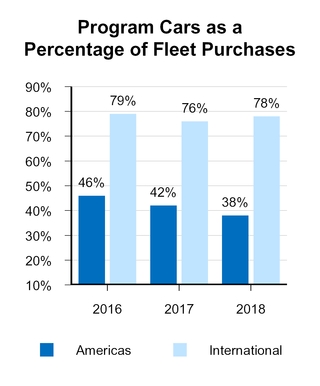
Our agreements with automobile manufacturers typically require that we pay more for program cars and maintain them in our fleet for a minimum number of months and impose certain return conditions, including car condition and mileage requirements. When we return program cars to the manufacturer, we receive the price guaranteed at the time of purchase and are thustherefore protected from fluctuations in the prices of previously-owned vehicles in the wholesale market. In 2016,2018, approximately 64%54% of the vehicles we disposed of were sold pursuant to repurchase or guaranteed depreciation programs. The future percentages of program and risk cars in our fleet will depend on several factors, including our expectations for future used car prices, our seasonal needs and the availability and attractiveness of manufacturers’ repurchase and guaranteed depreciation programs. The Company has agreed to purchase approximately $7.7 billion of vehicles from manufacturers in 2017.
We dispose of our risk cars largely through automobile auctions including auctions that enable dealers to purchase vehicles online more quickly than through traditional auctions, as well as throughand direct-to-dealer sales. In 2016,2018, we continued to expand the numberscope of states that can participateour direct-to-consumer car sales program to include the sale of our risk cars directly to consumers through our retail lots in several U.S. cities and through our Ultimate Test Drive consumer car sales program, which offers customers the ability to purchase well-maintained, late-model rental vehicles from our rental vehicles.car fleet. Alternative disposition channels such as Ultimate Test Drive,direct-to-consumer, online auctions, retail lots and directdirect-to-dealer sales provide the opportunity to dealer sales represented approximately 39% of our riskincrease vehicle dispositions in the Americas in 2016sale prices and provide us with per-vehicle cost savingsreduce relevant fleet costs compared to selling cars at auctions.
For 2016,In 2018, our average monthly vehicle rental fleet size (including U.S. rental trucks) ranged from a low of approximately 507,000557,000 vehicles in January to a high of approximately 683,000746,000 vehicles in July. Our average monthly car rental fleet size typically peaks in the summer months. Average fleet utilization for 2016,2018, which is based on the number of rental days (or portion thereof) that vehicles are rented compared to the total amount of time that vehicles are available for rent, ranged from 66%65% in DecemberJanuary to 76%75% in August.July. Our calculation of utilization may not be comparable to other companies’ calculation of similarly titled statistics.metrics.
We place a strong emphasis on the quality of our vehicle maintenance for customer safety and customer satisfaction reasons, and because quick and proper repairs are critical to fleet utilization. To accomplish this task, we employ a fully-certified Automotive Service Excellence manager and have developed a specialized training programprograms for our technicians. Our technician training departmentMaintenance and Damage Planning Department prepares its own technical service bulletins that can be retrieved electronically at our repair locations. In addition, we have implemented policies and procedures to promptly address manufacturer recalls as part of our ongoing maintenance and repair efforts.
CUSTOMER SERVICE
We believe ourOur commitment to delivering a consistently high level of customer service across all of our brands is a critical element of our success and business strategy. Our Customer Led, Service Driven™ program focuses on continually improving the overall customer experience based on our research of customer service practices, improved customer insights, executing our customer relationship management strategy, and delivering customer-centric employee training.training and leverage our mobile applications technology and the enriched experience it provides our customers.
Our associates and managersThe employees at our Company-operated locations are trained and empowered to resolve most customer issues at the location level. We also continuously track customer-satisfaction levels by sending location-specific surveys to recent customers and utilize detailed reports and tracking to assess and identify ways that we can improve our customer service delivery and the overall customer experience. In 2016, we received feedback from more than 2 million customers globally. Our location-specific surveys ask customers to evaluate their overall satisfaction with their rental experience and the likelihood that they will recommend our brands, as well as key elements of the rental experience. Results are analyzed in aggregate and by location to help further enhance our service levels to our customers.
In 2016,We understand our customers’ time is valuable and we expandedoffer rental options that provide greater control and enhancedself-service capabilities. While our comprehensive case management system thatmobile applications provide a fast customer experience, our customer care agents usecustomers know a company representative is always available to consistentlymeet their needs. Our survey platform includes specific questions to learn more about individual preferences and expeditiously handle a variety of issuesfind innovative ways to better serve and questions fromanticipate our customers.customers’ needs.
EMPLOYEES
As of December 31, 2016,2018, we employed approximately 30,000 people worldwide, of whom approximately 8,800 were employed on a part-time basis. Of our approximately 30,000 employees, approximately 20,00018,000 were employed in our Americas segment and 10,00012,000 in our International segment.
In our Americas segment, the majority of our employees are at-will employees and, therefore, not subject to any type of employment contract or agreement. Certain of our executive officers may be employed under employment contracts that specify a term of employment and specify pay and other benefits. In our International segment, we enter into employment contracts and agreements in those countries in which such relationships are mandatory or customary. The provisions of these agreements correspond in each case with the required or customary terms in the subject jurisdiction. Many of our employees are covered by a wide variety of union contracts and governmental regulations affecting, among other things, compensation, job retention rights and pensions.
As of December 31, 2016,2018, approximately 35%27% of our employees were covered by collective bargaining or similar agreements with various labor unions. We believe our employee relations are satisfactory. We have never experienced a large-scale work stoppage.
AIRPORT CONCESSION AGREEMENTS
We generally operate our vehicle rental and car sharing services at airports under concession agreements with airport authorities, pursuant to which we typically make airport concession payments and/or lease payments. In general, concession fees for on-airport locations are based on a percentage of total commissionable revenue (as defined by each airport authority), often subject to minimum annual guaranteed amounts. Concessions are typically awarded by airport authorities every three to ten years based upon competitive bids. Our concession agreements with the various airport authorities generally impose certain minimum operating requirements, provide for relocation in the event of future construction and provide for abatement of the minimum annual guarantee in the event of extended low passenger volume.
|
|
| OTHER BUSINESS CONSIDERATIONS |
SEASONALITY
Our carvehicle rental business is subject to seasonal variations in customer demand patterns, with the spring and summer vacation periods representing our peak seasons.seasons for the majority of the countries in which we operate. We vary our fleet size over the course of the year to help manage any seasonal variations in demand, as well as localized changes in demand. The following chart presents our quarterly revenues for the years ended December 31, 2016, 2017 and 2018.
COMPETITION
The competitive environment for the vehicle rentalour industry is generally characterized by intense price and service competition among global, local and regional competitors. Competition in our vehicle rental operations is based primarily upon price, customer service quality, including usability of booking systems and ease of rental and return, vehicle availability, reliability, rental locations, product innovation and national or international distribution. In addition, competition is also influenced strongly by advertising, marketing, loyalty programs and brand reputation. We believe the prominence and service reputation of our brands, extensive worldwide ownership of mobility solutions and commitment to innovation provides us with a competitive advantage.
The use of technology has increased pricing transparency among vehicle rental companies byand other mobility solutions providers enabling cost-conscious customers to more easily compare on the Internet and their mobile devices the rental rates available from various vehicle rental companies for any given rental.the mobility solutions that fit their needs. This transparency has further increased the prevalence and intensity of price competition in the industry.
Our vehicle rental and car sharing operations compete primarily with Enterprise Holdings, Inc., which operates the Enterprise, National and Alamo car rental brands; Europcar Group; Hertz Global Holdings, Inc., which operates the Hertz, Dollar and Thrifty brands; Europcar Mobility Group, which operates the Europcar, Goldcar, InterRent and Ubeeqo brands; and Sixt AG. We also compete with smaller local and regional vehicle rental companies for vehicle rental market share, and with ride-hailing companies largely for short length trips in urban areas. Our Zipcar brand also competes with various local and regional mobility companies, including mobility services sponsored by several auto manufacturers, ride-hailing and car sharing companies as well asand other technology players in the mobility industry. Our Budget Truck operations in the United States competes with several other local, regional and nationwide truck rental companies such asincluding U-Haul International, Inc., Penske Truck Leasing Corporation, and Ryder Systems, Inc. and Enterprise.
INSURANCE AND RISK MANAGEMENT
Our vehicle rental operations and corporate operations expose us to various types of claims for bodily injury, death and property damage related to the use of our vehicles and/or properties, as well as general employment-related matters stemming from our operations. We generally assume the risk ofretain economic exposure for liability to third parties arising from vehicle rental and car sharing services in the United States, Canada, Puerto Rico and the U.S. Virgin Islands, in accordance with the minimum financial responsibility requirements (“MFRs”) and primacy of coverage laws of the relevant jurisdiction. In certain cases, we assume liability above applicable MFRs, butup to no more than $1 million per occurrence, other than in cases involving a negligent act on the part of the Company, for which we purchase insurance coverage for exposures beyond retained amounts from a combination of unaffiliated excess insurers.
In Europe, we insure the risk of liability to third parties arising from vehicle rental and car sharing services in accordance with local regulatory requirements primarily through a combination of insurance policies provided by unaffiliated insurers and through reinsurance.insurers. We may retain a portion of the insured risk of liability includingthrough local deductibles, and by reinsuring certain risks through our captive insurance subsidiary AEGIS Motor Insurance Limited. In Australasia, motor vehicle bodily injury insurance coverage is compulsory and provided upon vehicle registration. In addition, we provide our customers with third-party property damage insurance through an unaffiliated third-party insurer. We limit our retainedretain a share of property damage risk of liability through the unaffiliated insurers.local deductibles and through AEGIS Motor Insurance Limited. We insure the risk of liability to third parties in Argentina Australia,and Brazil and New Zealand through a combination of unaffiliated insurers and one of our affiliates. These insurers provide insurance coverage supplemental to minimum local requirements.insurers.
We offer our U.S. customers a range of optional insurance products and coverages such as supplemental liability insurance, personal accident insurance, personal effects protection, emergency sickness protection, automobile towing protection and cargo insurance, which create additional risk exposure for us. When a customer elects to purchase supplemental liability insurance or other optional insurance related products, we typically retain economic exposure to loss, since the insurance is provided by an unaffiliated insurer that is reinsuring its exposure through our captive insurance subsidiary, Constellation Reinsurance Co., Ltd. Additional personal accident insurance offered to our customers in Europe and Australasia is underwrittenprovided by a third-party insurer, and reinsured by our Avis Budget Europe International Reinsurance Limited subsidiary. We also maintain excess insurance coverage through unaffiliated carriers to help mitigate our potential exposure to large liability losses. We otherwise bear these and other risks, except to the extent that the risks are transferred through insurance or contractual arrangements.
OUR INTELLECTUAL PROPERTY
We rely primarily on a combination of trademark, trade secret and copyright laws, as well as contractual provisions with employees and third parties, to establish and protect our intellectual property rights. The service marks “Avis,” “Budget,” and “Zipcar” and related marks or designs incorporating such terms and related logos and marks such as “We try harder,Try Harder,” “We Know The Road” and “wheels when you want them”“Own The Trip, Not The Car” are material to our vehicle rental and car sharing businesses. Our subsidiaries and licensees actively use these marks. All of the material marks used by
Avis, Budget and Zipcar are registered (or have applications pending for registration) with the United StatesU.S. Patent and Trademark Office as well as in foreign jurisdictions. Our subsidiaries own the marks and other intellectual property, including the Wizard system, used in our business. We also own trademarks and logos related to the “Apex Car Rentals” brand in Australia and New Zealand, the “Payless Car Rental” brand in the United States and several other countries, the “Maggiore” and “Morini” brands in Italy, the “FranceCars” brand in ItalyFrance and the “France Cars”“Turiscar” brand in France.Portugal.
CORPORATE SOCIAL RESPONSIBILITY
The Company strivesAt Avis Budget Group, we take our responsibilities as a corporate citizen seriously. We remain aware of how our actions can benefit the community and are sensitive to the needs of the environment, our customers and our employees. We recognize that being a successful organization means our progress is measured not only in economic terms, but also in the many ways we impact the world around us.
We believe in being responsible global corporate citizens and strive to establish and maintain best practices in corporate social responsibility which includesthrough a focus on:
The Environment: As a responsible corporate citizen, we are committed to monitoring, measuring and managing our environmental impact, and working to reduce it where practicable on an emphasisongoing basis. The following illustrate those commitments:
Car Sharing: Through our Zipcar brand, operating one of the world’s leading car sharing networks, considered to be one of the most environmentally-friendly transportation alternatives available;
Fleet: Offering our customers a wide variety of vehicles that are environmentally friendly, including as defined by the U.S. Environmental Protection Agency’s SmartWay Certification Program;
Outreach: Partnering with our corporate customers to help them measure and manage the environmental impact of Avis and Budget rental vehicles used by their employees and, where applicable, partnering to help them achieve their sustainability goals;
Compliance: Meeting or voluntarily exceeding the requirements of all federal, state and local health, safety and environmental protection laws; and
Reduction: Limiting our use of natural resources and recycling where practicable, whether water, oil, tire rubber, paper, plastic or other materials.
Our People and our Customers: We believe that our success has its foundation in how we treat our employees. Avis Budget Group is committed to maintaining a professional and supportive workplace built on several key initiatives, including a global ethicstrust between employees and compliance program for allmanagement. In concert with our core values, we seek to foster an environment where communication among our employees worldwide; data protection guidelines aimed at protecting Companyis open, honest, and customer data; a competitive employee benefits program; commitmentsrespectful; performance is recognized; growth is encouraged; and accomplishments – individual and collective – are celebrated. We also seek to equal employment opportunitiessupport the well-being and diversity; offering fuel-efficient rental vehicles;development of the people we employ and a commitment to corporate philanthropy through which we give back to the communities in which we operate.
Ethical Standards. We seek to holdthey work. The following initiatives reflect our employees to high ethical standards. We place great emphasis on professional conduct, safety and security, information protection and integrity. Our employees are required to follow our Code of Conduct. Our Code of Conduct represents the core of our business philosophy and values and covers numerous areas, including standards of work-related behavior; security of information, systems and other assets; conflicts of interest; securities laws; and community service. We provide employees with training to help understand both our Code of Conduct and how to interpret it in various situations. Failure to comply with our Code of Conduct is grounds for disciplinary action, up to and including termination of employment. Our Third Party Standards of Conduct represent the Company’s commitment to fostering sustainable relationships with our business partners, agents, consultants, suppliers and other third parties and ensuring that they uphold ethical, social and environmental standards.achieving these goals:
Data Protection.Employee Engagement: We are committedperiodically measure the success of our workplace initiatives in a Company-wide employee survey. Conducted by an independent third-party to taking appropriate measuresensure impartiality and confidentiality, the survey is part of a long tradition of listening to properly secure information, records, systems and property. Employees are trainedwhat employees have to take particular precautions to protectsay about the Company, ourabout the job they do, and about what they expect. The findings from each survey are presented by managers to employees vendors and customers, and, in many cases, themselves, from the unlawful or inappropriate use or disclosure of that information.
plans to address areas for improvement are established;
Employee Benefits Programs.Programs: Our employees are critical to our success. To ensure their well-being and professional growth, we generally offer a competitive salary, plus incentive compensation potential and comprehensive benefits. In addition, we offer health and welfare benefits that may include a range of training, employee assistance and personal development programs to help employees and their families prosper. Our employee benefitsbenefit programs are all offered and administered in compliance with applicable local law.
law;
Live Well – Healthy Living: We maintain a comprehensive program of initiatives designed to encourage our employees and their families to be mindful of their health and to enhance their ability to care for themselves and manage their health care expenses;
Equal Opportunity Employment.Employment: We are committed to providing equal employment opportunity to all applicants and employees without regard to race, religion, color, religion, sex, sexual orientation, gender, gender identity, age, marital status, national origin, ancestry, citizenship, physicalprotected veteran or mental disability military veteran status or any other protected classification under anyfactor prohibited by law, and as such we affirm in policy and practice to support and promote the concept of equal employee opportunity and affirmative action, in accordance with all applicable law.federal, state, provincial and municipal laws. In addition, the Company will reasonably accommodate known disabilities and religious beliefs of employees and qualified applicants.
applicants; and
Diversity. and Inclusion: As a growing global organization, the Company is proud of the diversity of its workforce. We strive to attract and retain talented and diverse people throughout our organization. We engageorganization by engaging in several initiatives to support diversity throughout our Company,and inclusion, including programs specifically designed to develop female leaders in our organization and our commitment to assistingassist current and former military personnel. The Company also maintains an industry-leading supplier diversity program to promote the growth and development of suppliers who are disadvantaged, minority-owned or women-owned business enterprises.
SustainabilityOur Communities. As a responsible corporate citizen, we are committed to monitoring, measuring and managing our environmental impact, and working to reduce it where practicable on an ongoing basis. In this regard, the Company has focused on six primary initiatives:
| |
◦ | Operations: Recycling and reducing solid and liquid waste, including motor oil, glass, and tires.
|
| |
◦ | Fleet: Offering our customers a wide variety of vehicles that are environmentally friendly, including as defined by the U.S. Environmental Protection Agency’s SmartWay Certification Program.
|
| |
◦ | Outreach: Partnering with our corporate customers to help them measure and manage the environmental impact of Avis and Budget rental vehicles used by their employees.
|
| |
◦ | Compliance: Meeting or voluntarily exceeding the requirements of all federal, state and local health, safety and environmental protection laws.
|
| |
◦ | Reduction: Limiting our use of natural resources, recycling where practicable, whether water, oil, tire rubber, paper, plastic or other materials.
|
| |
◦ | Car Sharing: Through its Zipcar brand, operating the world’s leading car-sharing network, considered to be one of the most environmentally-friendly transportation alternatives available.
|
Philanthropy.: The Company is committed to supporting the communities in which it operates by working with nonprofit organizations focused on assisting those in need.need such as Make-A-Wish. Through relationships with widely-recognized charitable groups and outreach through the Avis Budget Group Charitable Foundation and employee volunteer teams, the Company and its employees contribute to many worthwhile organizations and deserving causes that help improve and inspire change in our communities.
Our Business: We hold our employees to high ethical standards. We place great emphasis on professional conduct, safety and security, information protection and integrity.
Ethical Standards: Our employees are required to follow our Code of Conduct. This important document represents the core of our business philosophy and values and covers numerous areas, including standards of work-related behavior; safe work practices; security of information, systems and other assets; conflicts of interest; securities laws; and community service. We provide employees with training to help them understand both our Code of Conduct and how to interpret it in various situations.
Sustainable Procurement: Our Third-Party Standards of Conduct represents the Company’s commitment to fostering sustainable relationships with our business partners, agents, consultants, suppliers and other third parties and ensuring that they uphold ethical, social and environmental standards.
Supplier Diversity: The Company also maintains an industry-leading supplier diversity program to promote the growth and development of suppliers who are disadvantaged, minority-owned or women-owned business enterprises. As a result of our commitment, we are honored to be one of America’s Top Corporations for Women’s Business Enterprises for 17 consecutive years and a corporate member of the Billion Dollar Roundtable.
Data Protection: We are committed to taking appropriate measures to properly secure information, records, systems and property. Employees are trained to take particular precautions to protect the Company, our employees, vendors and customers, and, in many cases, themselves, from the unlawful or inappropriate use or disclosure of that information.
REGULATION
We are subject to a wide variety of laws and regulations in the United States and internationally,countries in which we operate, including those relating to, among others, consumer protection, insurance products and rates, franchising, customer privacy and data protection, securities and public disclosure, competition and antitrust, environmental matters, taxes, automobile-related liability, corruption and anti-bribery, labor and employment matters, health and safety, claims management, automotive retail sales, currency-exchange and other various banking and financial industry regulations, cost and fee recovery, the protection of our trademarks and other intellectual property, and local ownership or investment requirements. Additional information about the regulations that we are subject to can be found in Item 1A - Risk Factors of this Annual Report on Form 10-K.
COMPANY INFORMATION
Our principal executive office is located at 6 Sylvan Way, Parsippany, New Jersey 07054 (our telephone number is 973-496-4700). The Company files electronically with the Securities and Exchange Commission (the “SEC”) required reports on Form 8-K, Form 10-Q, Form 10-K and Form 11-K; proxy materials; ownership reports for insiders as required by Section 16 of the Securities Exchange Act of 1934; registration statements and other forms or reports as required. Certain of the Company’s officers and directors also file statements of changes in beneficial ownership on Form 4 with the SEC. The public may read and copy any materials that the Company has filed with the SEC at the SEC’s Public Reference Room located at 100 F Street, NE, Washington, D.C. 20549. The public may obtain information on the operation of the Public Reference Room by calling the SEC at 800-SEC-0330. Such materials may also be accessed electronically on the SEC’s Internet site (sec.gov). The Company maintains a website (avisbudgetgroup.com) and copies of our annual report on Form 10-K, quarterly reports on Form 10-Q, current reports on Form 8-K, Section 16 reports, proxy materials and any amendments to these reports filed or furnished with the SEC are available free of charge in the Investor Relations section of our website, as soon as reasonably practicable after filing with the SEC. Copies of our board committee charters, Codes of Conduct and Ethics, Corporate Governance Guidelines and other corporate governance information are also available on our website. If the Company should decide to amend any of its
board committee charters, Codes of Conduct and Ethics or other corporate governance documents, copies of such amendments will be made available to the public through the Company’s website. The information contained on the Company’s website is not included in, or incorporated by reference into, this Annual Report on Form 10-K.
The following is a cautionary discussion of the most significant risks, uncertainties and assumptions that we believe are significant to our business and should be considered carefully in conjunction with all of the other information set forth in this Annual Report on Form 10-K. The risks described below are not an exhaustive list of all of the risks that we face and are not listed by order of priority or materiality. In addition to the factors discussed elsewhere in this report,Annual Report on Form 10-K, the factors described in this item could, individually or in the aggregate, cause our actual results to differ materially from those described in any forward-looking statements. Should unknown risks or uncertainties materialize or underlying assumptions prove inaccurate, actual results could materially differ from past results and/or those anticipated, estimated or projected. Achievement of future results is subject to risks, uncertainties and potentially inaccurate assumptions. Past financial performance may not be a reliable indicator of future performance and historical trends should not be used to anticipate results or trends in future periods.
RISKS RELATED TO OUR BUSINESS
We face risks related to the high level of competition in the vehicle rentalmobility industry.
The vehicle rentalmobility industry is highly competitive, with price being one of the primary competitive factors. We risk losing rental volume toTo the extent that our competitors reduce their pricing and we do not provide competitive pricing or if price increases we seek to implement make us less competitive.competitive, we risk losing rental volume from existing customers, as well as lessening the chances of success for future bids for new customer accounts. If competitive pressures lead us to lose rental volume or match any downward pricing and we are unable to reduce our operating costs, then our financial condition or results of operations could be materially adversely impacted.
Additionally, pricing in the vehicle rental industry is impacted by the size of rental fleets and the supply of vehicles available for rent. Any significant fluctuations in the supply of rental vehicles available in the market due to an unexpected decrease in demand, or actions taken by our competitors to increase market share by acquiring more fleet could negatively affect our pricing, operating plans or results of operations if we are unable to adjust the size of our rental fleet in response to fluctuations in demand.
We expect that the competitive environment for our mobility services will become more intense as additional companies, including automobile manufacturers, ride-hailing companies, car sharing companies, and other technology players in the mobility industry enter our existing markets or try to expand their operations. Companies offering new mobility business models, including ride-hailing or car sharing services, or autonomous vehicles, may affect demand for rental vehicles. Some of these companies may have access to substantial capital, innovative technologies or have the ability to launch new services at a relatively low cost. To the extent these companies can improve transportation efficiency, alter driving patterns or attitudes toward vehicle rental, offer more competitive prices or fleet management services, more effectively utilize mobile platforms, undertake more aggressive marketing campaigns, price their competing services below market or otherwise disrupt the mobility industry, we risk heightened pricing competition and/or loss of rental volume, which could adversely impact our business and results of operations if we are unable to compete with such efforts.
The risk of competition on the basis of pricing in the truck rental industry can be even more impactful than in the car rental industry becauseas it can be more difficult to reduce the size of our truck rental fleet in response to significantly reduced demand.
We face risks related to fleet costs.
Fleet costs typically represent our single largest expense and can vary from year to year based on the prices that we are able to purchase and dispose of our rentalvehicles. We purchase program cars, which are guaranteed a rate of depreciation through agreements with auto manufacturers, and non-program, or “risk” vehicles. In 2016,2018, on average approximately 44%62% of our rental car fleet was comprised of risk vehicles.
The costs of our risk vehicles may be adversely impacted by the relative strength of the used car market, particularly the market for one- to two-year old used vehicles. We currently sell risk vehicles through various sales channels in the used vehicle marketplace, including traditional auctions, on-line auctions, direct-to-dealer sales, and directly to consumers through either retail lots or our Ultimate Test Drive consumer car sales program. These
channels may not produce stable vehicle prices in the future, as the market for used vehicles is subject to changes in demand for such vehicles, consumer interests, inventory levels, new car pricing, interest rates, fuel costs, tariffs and general economic conditions. A reduction in residual values for risk vehicles in our rental fleet could cause us to sustain a substantial loss on the ultimate sale of such vehicles or require us to depreciate those vehicles at a more accelerated rate than previously anticipated while we own them.
If the market value of the vehicles in our fleet is reduced or our ability to sell vehicles in the used vehicle marketplace were to become severely limited, we may have difficulty meeting collateral requirements due under our asset-backed financing facilities, which could lead to decreased capacity in such facilities and effectively increase our fleet costs or adversely impact our profitability. In addition, if we are unable to meet our collateral requirements under such facilities, the outstanding principal amount due may be required to be repaid earlier than anticipated. If that were to occur, the holders of our asset-backed debt may have the ability to exercise their right to instruct the trustee to direct the return of program cars and/or vehicles subjectthe sale of risk cars to operating leases. Such program carsgenerate proceeds sufficient to repay such debt.
Program and leased vehicles enable us to determine our depreciation expense in advance of purchase, which is a significant componentpurchase. Our program and leased vehicles also generally provide us with flexibility to reduce the size of our fleet costs. However, as discussed below, suchrapidly. This flexibility is affected by the percentage of program cars resultvehicles in additional exposureour fleet and the features of the programs provided by auto manufacturers. Our inability to reduce the manufacturers with whom wesize of our fleet in response to seasonal demand fluctuations, economic constraints or other changes in demand could have such agreements.an adverse impact on our fleet costs and results of operations.
WeWhile we source our fleet purchases from a wide range of auto manufacturers. Tomanufacturers, our program purchases expose us to risk to the extent that any of these auto manufacturers significantly curtail production, increase the cost of purchasing program carsvehicles or decline to sell program carsvehicles to us on terms or at prices consistent with past agreements,agreements. Should any of these risks occur, we may be unable to obtain a sufficient number of vehicles to operate our business without significantly increasing our fleet costs or reducing our volumes.
Our program car purchases also generally provide us with flexibility to reduce the size of our fleet rapidly in response to seasonal demand fluctuations, economic constraints or other changes in demand. This flexibility may be reduced in the future to the extent that we reduce the percentage of program cars in our car rental fleet or features of the programs are altered.
Failure by a manufacturer to fulfill its obligations under any program agreement or incentive payment obligation could leave us with a material expense if we are unable to dispose of program cars at prices estimated at the time of purchase or with a substantial unpaid claim against the manufacturer, particularly with respect to program cars that were either (i) resold for an amount less than the amount guaranteed under the applicable program and therefore subject to a “true-up” payment obligation from the manufacturer; or (ii) returned to the manufacturer, but for which we were not yet paid, and therefore we could incur a substantial loss as a result of such failure to perform. Any reduction in the market value of the vehicles in our fleet could effectively increase our fleet costs,
adversely impact our profitability and potentially lead to decreased capacity in our asset-backed car rental funding facilities due to the collateral requirements for such facilities that effectively increase as market values for vehicles decrease.
The costs of our non-program vehicles may also be adversely impacted by the relative strength of the used car market, particularly the market for one- to two-year old used vehicles. We currently sell non-program vehicles through auctions, third-party resellers and other channels in the used vehicle marketplace. Such channels may not produce stable used vehicle prices. A reduction in residual values for non-program vehicles in our rental fleet could cause us to sustain a substantial loss on the ultimate sale of such vehicles or require us to depreciate those vehicles at a more accelerated rate while we own them.
If our ability to sell vehicles in the used vehicle marketplace were to become severely limited at a time when required collateral levels were rising, the outstanding principal amount due under our asset-backed financing facilities may be required to be repaid sooner than anticipated with vehicle disposition proceeds and lease payments we make to our vehicle program subsidiaries. If that were to occur, the holders of our asset-backed debt may have the ability to exercise their right to instruct the trustee to direct the return of program cars and/or the sale of risk cars to generate proceeds sufficient to repay such debt.
We face risks related to safety recalls.recalls affecting our vehicles.
Our vehicles may be subject to safety recalls by their manufacturers that could have an adverse impact on our business when we remove such recalled vehicles from our rentable fleet. We cannot control the number of vehicles that will be subject to manufacturer recalls in the future. Recalls often causerequire us to retrieve vehicles from customers and/or not to re-renthold vehicles until we can arrange for the repairs described in the recalls to be completed. As such, recalls can result in incremental costs, negatively impact our revenues and/or reduce our fleet utilization. If a large number of vehicles were to be the subject of simultaneous recalls, or if needed replacement parts were not in adequate supply, we may be unable to re-rentutilize recalled vehicles for a significant period of time. We could also face liability claims related to vehicles subject to a safety recall. Depending on the nature and severity of the recall, it could create customer service problems, reduce the residual value of the vehicles involved, harm our general reputation and/or have an adverse impact on our financial condition or results of operations.
Weakness in travel demand or general economic conditions, in the United States, Europe and other areas in which we operate, weakness in travel demand and/or a significant increase in fuel costs, can adversely impact our business.
Demand for vehicle rentals can be subject to and impacted by international, national and local economic conditions. If travel demand or economic conditions in the United States, Europe and/or worldwide were to weaken, including due to uncertainty and instability related to the potential withdrawal of countries from the European Union, our financial condition or results of operations could be adversely impacted.
Any significant airline capacity reductions, airfare or related fee increases, reduced flight schedules, or any events that disrupt or reduce business or leisure air travel or weaken travel demand and tourism, such as work
stoppages, military conflicts, terrorist incidents, natural disasters, disease epidemics, or the response of governments to any such events, could have an adverse impact on our results of operations. Likewise, any significant increases in fuel prices, a severe protracted disruption in fuel supplies or rationing of fuel could discourage our customers from renting vehicles or reduce or disrupt air travel, which could also adversely impact our results of operations.
Our truck rental business can be impacted by the housing market. If conditions in the housing market were to weaken, we may see a declinereduction in truck rental transactions, which could have an adverse impact on our business.
We face risks related to our ability to successfully implement our business strategies and to preserve the value of our brands.
Our objective is to focus on strategically accelerating growth,strategic objectives involve winning and retaining customers through supporting and strengthening our globalbrands, increasing operational efficiency and margins and enhancing our position as a leading provider of vehicle rental services, continuing to enhance our customers’ rental experience and controlling costs and driving efficiency throughoutin the organization.evolving mobility industry. We see significant potential in the areas of optimizing our pricing, customer mix and sales of ancillary products and services; optimizing our procurement, deployment and
disposition of vehicles, including increased use of non-auction channels for selling our risk cars; and applying connected-car/in-vehicle systems and other emerging technologies in our operations. If we are unsuccessful in implementing our strategic initiatives, our financial condition or results of operations could be adversely impacted.
Since 2014, theThe Company has taken significant actionscontinues to further streamline its administrative and shared-services infrastructure through a restructuring program that identifies and replicates best practices, leverages the scale and capabilities of third-party service providers, and is designed to increase the global standardization and consolidation of non-rental-location functions over time. We cannot be certain that such initiatives will continue to be successful. Failure to successfully implement any of these initiatives could have an adverse impact toon our financial condition or results of operations.
Any failure to adapt to changes in the mobility industry, provide a high-quality reservation and rental experience for our customers and members, to adopt new technologies, capitalize on cost saving initiatives or to meet evolving customer preferencesneeds could substantially harm our reputation and competitiveness, and could adversely impact our financial condition or results of operations.
We face risks related to our Zipcar operations.
We expect that the competitive environment for our car sharing services will become more intense as additional companies, including automobile manufacturers, enter our existing markets or try to expand their operations. Competitors could introduce new solutions with competitive price and convenience characteristics, offer new technologies, undertake more aggressive marketing campaigns than we do or price their products below cost. Such developments could adversely impact our business and result of operations should we be unable to compete with such efforts.
Because Zipcar members are located primarily in cities, we compete for limited parking locations that are convenient to our members or are available on terms that are commercially reasonable to our business. If we are unable to obtain and maintain a sufficient number of parking locations that are convenient to our members, then our ability to attract and retain members could suffer and our business and results of operations could be materially impacted.
We face risks related to political, economic and commercial instability or uncertainty in the countries in which we operate.
Our global operations are dependent upon products manufactured, purchasedexpose us to a number of risks, including exposure to a wide range of international, national and soldlocal economic and political conditions and instability. For example, our operations in the United StatesKingdom includes a significant amount of cross-border business that could be negatively impacted by the withdrawal of the United Kingdom from the European Union. Uncertainty related to the proposed withdrawal of the United Kingdom from the European Union could lead to volatility in the global financial markets, adversely affect tax, legal and internationally, includingregulatory regimes, and could impact the economies of the United Kingdom and other countries in countries with political and economic instability.which we operate, which could have a material adverse effect on our results in such countries. Operating and seeking to expandour business in a number of different regions and countries exposes us to a number of risks, including:
multiple and potentially conflicting laws, regulations, trade policies and agreements that are subject to change;
varying tax regimes, including consequences from changes in applicable tax laws;
the imposition of currency restrictions, restrictions on repatriation of earnings or other restraints;
local ownership or investment requirements,restraints, as well as difficulties in obtaining financing in foreign countries for local operations;
varying tax regimes, including consequences frompotential changes to import-export laws, trade treaties or tariffs in applicable tax laws;the countries where we purchase vehicles;
local ownership or investment requirements, or compliance with local laws, regulations or business practices;
uncertainty and changes to political and regulatory regimes as a result of changing social, political, regulatory and economic environments in the United States and internationally;
national and international conflict, including terrorist acts; and
political and economic instability or civil unrest that may severely disrupt economic activity in affected countries.
The occurrence of one or more ofExposure to these eventsrisks may adversely impact our financial condition or results of operations. Our licensees’ vehicle rental operations may also be impacted by political, economic and commercial instability, which in turn could impact the amount of royalty payments they make to us.
We face risks related to third-party distribution channels that we rely upon.
We rely upon third-party distribution channels to generate a significant portion of our car rental reservations, including:
traditional and online travel agencies, airlines and hotel companies, marketing partners such as credit card companies and membership organizations and other entities that help us attract customers; and
global distribution systems (“GDS”), such as Amadeus, Galileo/Apollo, Sabre and Worldspan, that connect travel agents, travel service providers and corporations to our reservationsreservation systems.
Changes in our pricing agreements, commission schedules or arrangements with third-party distribution channels, the termination of any of our relationships or a reduction in the transaction volume of such channels, or a GDS’s inability to process and communicate reservations to us could have an adverse impact on our financial condition or results of operations, particularly if our customers are unable to access our reservation systems through alternate channels.
We face risks related to our reliance on communications networks and centralized information systems.
We rely heavily on the satisfactory performance and availability of our information systems, including our reservation systems, websites and network infrastructure to attract and retain customers, accept reservations, process rental and sales transactions, manage our fleet of vehicles, account for our activities and otherwise conduct our business. We have centralized our information systems and we rely on third-party communications service and system providers to provide technology services and link our systems with the business locations these systems were designed to serve. A failure or interruption that results in the unavailability of any of our information systems, or a major disruption of communications between a system and the locations it serves, could cause a loss of reservations, interfere with our fleet management, slow rental and sales processes, create negative publicity that damages our reputation or otherwise adversely impacts our ability to manage our business effectively. We may experience system interruptions or disruptions for a variety of reasons, including as the result of network failures, power outages, cyber attacks, employee errors, software errors, an unusually high volume of visitors attempting to access our systems, or localized conditions such as fire, explosions or power outages or broader geographic events such as earthquakes, storms, floods, epidemics, strikes, acts of war, civil unrest or terrorist acts. Because we are dependent in part on independent third parties for the implementation and maintenance of certain aspects of our systems and because some of the causes of system interruptions may be outside of our control, we may not be able to remedy such interruptions in a timely manner, or at all. Our systems’ business continuity plans and insurance programs seek to mitigate such risks but they cannot fully eliminate the risks as a disruption could be experienced in any of our information systems.
We face risks related to cybersecurity breaches of our systems and information technology.
Threats to network and data security are becoming increasingly diverse and sophisticated. As cybersecurity threats become more frequent, intense and sophisticated, costs of proactive defense measures may increase. Third parties may have the technology or expertise to breach the security of our customer transaction data and our security measures may not prevent physical security or cybersecurity breaches, which could result in substantial harm to our business, our reputation or our results of operations. We rely on encryption and/or
authentication technology licensed from and, at times, administered by independent third parties to secure transmission of confidential information, including credit card numbers and other customer personal information. Our outsourcing agreements with these third-party service providers generally require that they have adequate security systems in place to protect our customer transaction data. However, advances in computer capabilities, new discoveries in the field of cryptography or other cybersecurity developments could render our security systems and information technology, or those used by our third-party service providers, vulnerable to a breach. In addition, anyone who is able to circumvent our security measures could misappropriate proprietary information or cause interruptions in our operations. Risks of cybersecurity incidents caused by malicious third parties using sophisticated, targeted methods to circumvent firewalls, encryption, and other security defenses, could include hacking, viruses, malicious software, ransomware, phishing attacks, denial of service attacks and other attempts to capture, disrupt or gain unauthorized access to data are rapidly evolving and could lead to disruptions in our reservation system or other data systems, unauthorized release of confidential or otherwise protected information or corruption of data. The techniques used by third parties change frequently and may be difficult to detect for long periods of time. Any successful efforts by individuals to infiltrate, break into, disrupt, damage or otherwise steal from the Company’s, its licensees’ or its third-party service providers’ security or information systems could damage our reputation and expose us to increased costs, litigation or other liability that could adversely impact our financial condition or results of operations. Failure to appropriately address these issues could also give rise to potentially material legal risks and liabilities.
We face risks related to our property leases and vehicle rental concessions.
We lease or have vehicle rental concessions at locations throughout the world, including at most airports both in the United Stateswhere we operate, and internationally andat train stations throughout Europe, where vehicle rental companies are frequently required to bid periodically for the availablespace at these locations. If we were to lose anya property lease or vehicle rental concession, particularly at an airport or a train station in a major metropolitan area, there can be no assurance that we would be able to find a suitable replacement location on reasonable terms andwhich could adversely impact our business could be adversely impacted.business.
We face risks related to the seasonality of our business.
In our business, the third quarter of the year has historically been our strongestmost profitable quarter as measured by net income and Adjusted EBITDA due to the increased level of summer leisure travel and household moving activity. We vary our fleet size over the course of the year to help manage seasonal variations in demand, as well as localized changes in demand that we may encounter in the various regions in which we operate. In 2016, the third quarter accounted for 30% of our total revenue for the year and was our most profitable quarter as measured by net income and Adjusted EBITDA. Any circumstance or occurrence that disrupts rental activity during the third quarter, especially in North America and Europe, could have a disproportionately adverse impact on our financial condition or results of operations.
We are dependent on our senior management and other key personnel.
Our success depends on our senior management team and other key personnel, our ability to effectively recruit and retain high quality employees, and replace those who retire or resign. The loss of services of one or more members of our senior management team could adversely affect our business. Failure to retain and motivate our senior management and to hire, retain and develop other important personnel could impact our management and operations, ability to execute our strategies and adversely affect our business and operating results.
We face risks related to acquisitions, including the acquisition of existing licensees or investments in or partnerships with other related businesses.
We may engage in strategic transactions, including the acquisition of or investment in existing licensees and/or other related businesses.businesses, or partnerships or joint ventures with companies in related or cross-function lines of business. The risks involved in engaging in these strategic transactions include the possible failure to successfully integrate the operations of acquired businesses, or to realize the expected benefits of such transactions within the anticipated time frame, or at all, such as cost savings, synergies, or sales orand growth opportunities. In addition, the integration of an acquired business or oversight of a partnership or joint venture may result in material unanticipated challenges, expenses, liabilities or competitive responses, including:
a failure to implement our strategy for a particular strategic transaction, including successfully integrating the acquired business into our existing infrastructure, or a failure to realize value from a strategic partnership, joint venture or other investment;
inconsistencies between our standards, procedures and policies and those of the acquired business;business, partnership and/or joint venture;
costs or inefficiencies associated with the integration of our operational and administrative systems;
the increased scope and complexity of our operations could require significant attention from management and could impose constraints on our operations or other projects;
unforeseen expenses, delays or conditions, including required regulatory or other third-party approvals or consents;consents, or provisions in contracts with third parties that could limit our flexibility to take certain actions;
an inability to retain the customers, employees, suppliers and/or marketing partners of the acquired business;
business, partnership or joint venture or generate new customers or revenue opportunities through a strategic partnership;
the costs of compliance with U.S. and internationallocal laws and regulations includingand the acquisition orimplementation of compliance processes, as well as the assumption of unexpected liabilities, litigation, penalties or other enforcement actions;
provisions in our and the acquired business’s contracts with third parties that could limit our flexibility to take certain actions or our ability to retain customers;
higher than expected costs arising due to unforeseen changes in tax, trade, environmental, labor, safety, payroll or pension policies;
higher than expected investments required to implement necessary compliance processes and related systems, including accounting systems and internal controls over financial reporting;
limitations on, or costs associated with, workforce reductions;
a failure to implement our strategy for a particular acquisition, including successfully integrating the acquired business; and
the possibility of other costs or inefficiencies associated with the integration and consolidation of operational and administrative systems, processes and infrastructures of the combined company.policies.
Any one of these factors could result in delays, increased costs or decreases in the amount of expected revenues related to combining the companies or derived from a strategic transaction and could adversely impact our financial condition or results of operations.
We face risks related to fluctuations in currency exchange rates.
Our operations generate revenue and incur operating costs in a variety of currencies. The financial position and results of operations of many of our foreign subsidiaries are reported in the relevant local currency and then translated to U.S. dollars at the applicable currency exchange rate for inclusion in our Consolidated Financial Statements. Changes in exchange rates among these currencies and the U.S. dollar will affect the recorded levels of our assets and liabilities in our consolidated financial statements. While we take steps to manage our currency exposure, such as currency hedging, we may not be able to effectively limit our exposure to intermediate- or long-term movements in currency exchange rates, which could adversely impact our financial condition or results of operations.
We face risks related to our derivative instruments.
We typically utilize derivative instruments to manage fluctuations in interestforeign exchange rates, foreign exchangeinterest rates and gasoline prices. The derivative instruments we use to manage our risk are usually in the form of interest rate swaps and caps and foreign exchange and commodity contracts. Periodically, we are required to determine the change in fair value, called the “mark to market,” of some of these derivative instruments, which could expose us to substantial mark-to-market losses or gains if such rates or prices fluctuate materially from the time the derivatives were entered into. Accordingly, volatility in rates or prices may adversely impact our financial position or results of operations and could impact the cost and effectiveness of our derivative instruments in managing our risks.
We face risks related to fluctuations in currency exchange rates.
Our international operations generate revenue and incur operating costs in a variety of currencies. The financial position and results of operations of many of our foreign subsidiaries are reported in the relevant local currency and then translated to U.S. dollars at the applicable currency exchange rate for inclusion in our Consolidated Financial Statements. Changes in exchange rates among these currencies and the U.S. dollar will affect the recorded levels of our assets and liabilities in our financial statements. While we take steps to manage our currency exposure, such as currency hedging, we may not be able to effectively limit our exposure to intermediate- or long-term movements in currency exchange rates, which could adversely impact our financial condition or results of operations.
We face risks related to liability and insurance.
Our businessesglobal operations expose us to several forms of liability, including claims for bodily injury, death and property damage related to the use of our vehicles, or for having our customers on our premises, and foras well as workers’ compensation claims and other employment-related claims by our employees. We may become exposed to uninsured liability at levels in excess of our historical levels resulting from unusually high losses or otherwise. In addition, liabilities in respect of existing or future claims may exceed the level of our reserves and/or our insurance, which
could adversely impact our financial condition and results of operations. Furthermore, insurance with unaffiliated insurers may not continue to be available to us on economically reasonable terms or at all. Should we be subject to an adverse ruling, or experience other significant liability for which we did not plan and are unable to adequately insure against such liability, our results of operations, or financial position or cash flows could be negatively impacted.
We reinsure certain insurance exposures as well as offer optional insurance coverages through unaffiliated third-party insurers, which then reinsure all or a portion of their risks through our insurance company subsidiaries, that
in turnwhich subjects us to regulation under various insurance laws and statutes in the jurisdictions in which our insurance company subsidiaries are domiciled. Any changes in regulations that alter or impede our reinsurance obligations or insurance subsidiary operations in all or certain jurisdictions could adversely impact the economic benefits that we rely upon to support our reinsurance efforts, which in turn would adversely impact our financial condition or results of operations.
Optional insurance products that we offer to renters in the United States, including, but not limited to, supplemental liability insurance, personal accident insurance and personal effects protection, are regulated under state laws governing such products. Our car rental operations outside the United States must also comply with certain local laws and regulations regarding the sale of supplemental liability and personal accident and effects insurance by intermediaries. Any changes in U.S. or international lawslaw that changeaffect our operating requirements with respect to our sale of optional insurance products could increase our costs of compliance or make it uneconomical to offer such products, which would lead to a reduction in revenue and profitability. Should more of our customers decline purchasingto purchase optional liability insurance products as a result of any changes in these laws or otherwise, our financial condition or results of operations could be adversely impacted.
We offer loss damage waivers to our customers as an option for them to reduce their financial responsibility that may be incurred as a result of loss or damage to the rental vehicle. Certain states in the United States have enacted legislation that mandates disclosure to each customer at the time of rental that damage to the rented vehicle may be covered to some extent by the customer’s personal automobile insurance and that loss damage waivers may not be necessary. In addition, some states have statutes that establish or cap the daily rate that can be charged for loss damage waivers. Should new state or federal laws or regulations arise that place new limits on our ability to offer loss damage waivers to our customers, our financial condition or results of operations could be adversely impacted.
If theAdditionally, current U.S. federal law that pre-emptedpre-empts state laws that imputedimpute tort liability based solely based on ownership of a vehicle involved in an accidentaccident. If such federal law were to change, our insurance liability exposure could materially increase.
We may be unable to collect amounts that we believe are owed to us by customers, insurers and other third parties related to vehicle damage claims or liabilities. The inability to collect such amounts in a timely manner or to the extent that we expect could adversely impact our financial condition or results of operations.
Costs associated with lawsuits, or investigations or increases in the legal reserves that we establish based on our assessment of contingent liabilities may have an adverse effect on our results of operations.
We are involved inOur global operations expose us to various claims, and lawsuits and other legal proceedings that arise in and outside of the ordinary course of our business. We have been subjectbusiness in the past, andcountries in which we operate. We may be in the future,subject to complaints and/or litigation involving our customers, licensees, employees, independent contractors, licensees, customersoperators and others with whom we conduct business, including claims for bodily injury, death and property damage related to use of our vehicles or our locations by customers, or claims based on allegations of discrimination, misclassification as exempt employees under the Fair Labor Standards Act, wage and hourly pay disputes, and various other claims. We could incurbe subject to substantial costs andand/or adverse outcomes tofrom such complaints or litigation, which could have a material adverse effect on our financial condition, cash flows or results of operations.
We outsource some of our business functions to third parties, including operations at many of our Company-owned locations, which are third-party independent operators who receive commissions to operate such locations. We are involved or may become involved in legal proceedings and investigations that claim that our third-party independent operators should instead be treated as employees. There can be no assurance that legislative, judicial or regulatory authorities will not assert interpretations of existing laws or introduce new
regulations that would mandate that we change the classification of these operators. In the event of such a reclassification, we could be exposed to material liabilities and additional costs which could have an adverse effect on our business and results of operations. These liabilities and additional costs could include exposure under federal, state and local tax laws, workers’ compensation, unemployment benefits, labor, and employment laws, as well as potential liability for penalties and interest.
From time to time, our Company and/or other companies in the vehicle rental industry or our practices may be reviewed or investigated by government regulators, which could lead to tax assessments, enforcement actions, fines and penalties or the assertion of private litigation claims. It is not possible to predict with certainty the outcome of claims, investigations and lawsuits, and we could in the future incur judgments, taxes, fines or penalties or enter into settlements of lawsuits or claims that could have an adverse impact on our financial condition or results of operations. In addition, while we maintain insurance coverage with respect to exposure for certain types of legal claims, we may not be able to obtain such insurance on acceptable terms in the future, if at all, and any such insurance may not provide adequate coverage against any such claims.
As required by U.S. generally accepted accounting principles (“GAAP”), we establish reserves based on our assessment of actual or potential loss contingencies, including contingencies related to legal claims asserted against us. Subsequent developments may affect our assessment and estimates of thesuch loss contingency recorded as a reservecontingencies and require us to make payments in excess of our reserves, which could have an adverse effect on our financial condition or results of operations.
We face risks related to U.S. and international laws and regulations that could impact our global operations.
We are subject to multiple, and sometimes conflicting, laws and regulations in the United States and internationallycountries in which we operate that relate to, among others, consumer protection, competition and antitrust, customer privacy and data protection, securities and public disclosure, automotive retail sales, franchising, fraudcorruption and anti-bribery, environmental matters, taxes, automobile-related liability, labor and employment matters, cost and fee recovery, currency-exchange and other various banking and financial industry matters,regulations, health and safety, insurance rates and products, claims management, protection of our trademarks and other intellectual property and other trade-related laws and regulations in numerous jurisdictions.regulations. Recent years have seen a substantial increase in the global enforcement of certain of these laws such as the U.S. Foreign Corrupt Practices Act, the UK Bribery Act and similar foreign laws and regulations. Our continued operationglobal operations and expansion outside of the United States, including in developing countries, could increase the risk of governmental investigations and violations of such laws. We cannot predict the nature, scope or effect of future regulatory requirements to which our global operations may be subject or the manner in which existing or future laws may be administered or interpreted. Any alleged or actual violations of any law or regulation, change in law, regulation, trade treaties or regulationtariffs, or changes in the interpretation of existing laws or regulations may subject us to government scrutiny, investigation and civil and criminal penalties, may limit our ability to provide services in any of the countries in which we operate and could result in a material adverse impact on our reputation, business, financial position or results of operations.
In the United States and certain other international locations wherecountries in which we have Company-operated locations, we may recover certain costs from consumers, variousincluding costs associated with the title and registration of our vehicles, and certain costs, includingor concession costs imposed by an airport authority or the owner and/or operator of the premises from which our vehicles are rented. We may in the future be subject to potential U.S. or international laws or regulations that could negatively impact our ability to separately state, charge and recover such costs, which could adversely impact our financial condition or results of operations.
With respectWe are subject to U.S.privacy, data protection, security transfer and internationalother regulations, as well as private industry standards, that could negatively impact our global operations and cause us to incur additional incremental expense that impacts our future operating results.
Our business requires the secure processing and storage of sensitive information relating to our customers, employees, business partners and others. Current consumer privacy and data protection laws, particularly the European Union’s General Data Protection Regulation which became effective in 2018 (the “GDPR”), and other regulations in the jurisdictions in which we operate we may be limited inlimit the types of information that we may collect, process and retain about our customers and other individuals with whom we deal or propose to deal, as well as how we collect, process and retain the information that we are permitted to collect, some of which may be non-public personally identifiable information. The GDPR, which is wide-ranging in scope, provides EU residents greater control over their personal data and imposes several requirements relating to the consent of the individuals to whom the personal data relates, the information provided to the individuals, the security and
confidentiality of the personal data, data breach notification and the use of third-party processors in connection with the processing of personal data. It also imposes significant forfeitures and penalties for noncompliance. The Company has adopted policies and procedures in compliance with the GDPR, however, such policies and procedures may need to be updated as additional information concerning best practices is made available through guidance from regulatory authorities or published enforcement decisions. Other privacy laws may be interpreted and applied inconsistently from country to country and impose inconsistent or conflicting requirements. Complying with varying jurisdictional privacy requirements could increase our operating costs, divert management attention or require additional changes to our business practices. Should we be found to not be in compliance with the GDPR or similar privacy and data protection laws, we could be subject to substantial monetary forfeitures and other penalties that could negatively impact our operating results or harm our reputation.
The centralized nature of our information systems requires the routine flow of information about customers and potential customers across national borders, particularly in the United States and Europe. Should this flow of information become illegal or subject to onerous restrictions, our ability to serve our customers could be negatively impacted for an extended period of time. In addition, our failure to maintain the security of the data we hold, whether as a result of our own error or the actions of others, could harm our reputation or give rise to legal liabilities that adversely impact our financial condition or results of operations. Privacy and data protection laws and regulations impactrestrict the ways that we process our transaction information and increase our compliance costs. In addition, the Payment Card Industry imposes strict customer credit card data security standards to ensure that our customers’ credit card information is protected. Failure to meet these data security standards could result in substantial increased fees to credit card companies, other liabilities and/or loss of the right to collect credit card payments, which could adversely impact our financial condition or results of operations.
We face risks related to environmental laws and regulations.
We are subject to a wide variety of environmental laws and regulations in the United States and internationally in connection with our operations, including, among other things, with respect to the ownership or use of tanks for the storage of petroleum products such as gasoline, diesel fuel and motor and waste oils; the treatment or discharge of waste waters; and the generation, storage, transportation and off-site treatment or disposal of solid or liquid wastes. We maintain liability insurance covering storage tanks at our storage tanks.locations. In the United States, we have institutedadminister an environmental compliance program designed to ensure that these tanks are properly registered in the jurisdiction in which they are located and are in compliance with applicable technical and operational requirements. We are also subject to various environmental regulatory requirements in other countries in which we operate. The tank systems located at each of our locations may not at all times remain free from undetected leaks, and the use of these tanks may result in significant spills, which may require remediation and expose us to material liabilities.
uninsured liability or liabilities in excess of insurance.
We may also be subject to requirements related to the remediation of substances that have been released into the environment at properties owned or operated by us or at properties to which we send substances for treatment or disposal. Such remediation requirements may be imposed without regard to fault and liability for environmental remediation can be substantial. These remediation requirements and other environmental regulations differ depending on the country where the property is located. We have made, and will continue to make, expenditures to comply with environmental laws and regulations, including, among others, expenditures for the remediation of contamination at our owned and leased properties, as well as contamination at other locations at which our wastes have reportedly been identified. Our compliance with existing or future environmental laws and regulations may, however, require material expenditures by us or otherwise have an adverse impact on our financial condition or results of operations.
The U.S. Congress and other legislative andEnvironmental regulatory authorities in the United States and internationally have considered, and willare likely to continue to consider, numerouspursue measures related to climate change and greenhouse gas emissions. Should rules establishing limitations on greenhouse gas emissions or rules imposing fees on entities deemed to be responsible for greenhouse gas emission become effective in the countries in which we operate, demand for our services could be affected, our fleet and/or other costs could increase, and our business could be adversely impacted.
We face risks related to franchising or licensing laws and regulations.
We frequently renew and sometimes sell licenseslicense to third parties the right to operate locations underusing our brands in exchange for the payment of a royalty by the third-party licensee.payments. Our licensing activities and sales are subject to various U.S. and international laws and regulations.regulations in the countries in which we operate. In particular, laws in the United States require that we are required to makeprovide extensive disclosure to prospective licensees in connection with
licensing offers and sales, as well as to comply with franchise relationship laws that could limit our ability to, among other things, terminate license agreements or withhold consent to the renewal or transfer of these agreements. We are also subject to certain regulations affecting our license arrangements in Europe and other international locations. Although our licensing operations have not been materially adversely affected by such existing regulations, such regulations could have a greater impact on us if we were to become more active in granting or selling new licenses to third parties. Should our operations become subject to new laws or regulations that negatively impact our ability to engage in licensing activities, our financial condition or results of operations could be adversely impacted.
We face risks related to the actions of, or failures to act by, our licensees, dealers, independent operators or independent operators.third-party vendors.
Our vehicle rental licensee and dealer locations are independently owned and operated. We also operate many of our Company-owned locations through agreements with “independent operators,” which are third-party independent contractors who receive commissions to operate such locations. OurWe also enter into service contracts with various third-party vendors that provide services for us or in support of our business. Under our agreements with our licensees, dealers, and independent operators (“and third-party vendors (collectively referred to as “third-party operators”), the third-party operators retain control over the employment and management of all personnel at their locations or in support of the services that they provide our Company. These agreements also generally require that theythird-party operators comply with all laws and regulations applicable to their businesses, including relevant internal policies and standards. Under these agreements, third-party operators retain control over the employment and management of all personnel at their locations. Regulators, courts or others may seek to hold us responsible for the actions of, or failures to act by, third-party operators.operators or their employees based on theories of vicarious liability, negligence, joint operations or joint employer liability. Although we actively monitor the operations of these third-party operators, and under certain circumstances have the ability to terminate their agreements for failure to adhere to contracted operational standards, we are unlikely to detect all problems.misconduct or noncompliance by the third-party operator or its employees. Moreover, there are occasions when the actions of third-party operators may not be clearly distinguishable from our own. It is our policy to vigorously seek to be dismissed from any claims involving third-party operators and to pursue indemnity for any adverse outcomes that affect the Company. Failure of third-party operators to comply with laws and regulations or our operational standards, or our inability to be dismissed from claims against our third-party operators, may expose us to liability, damages and negative publicity that may damage our brand and reputation and adversely impactaffect our financial condition or results of operations.
We face risks related to our reliance on communications networks and centralized information systems.
We rely heavily on the satisfactory performance and availability of our information systems, including our reservation systems, websites and network infrastructure to attract and retain customers, accept reservations, process rental and sales transactions, manage our fleet of vehicles, account for our activities and otherwise conduct our business. We have centralized our information systems, and we rely on communications service providers to link our systems with the business locations these systems were designed to serve. A failure or interruption that results in the unavailability of any of our information systems, or a major disruption of communications between a system and the locations it serves, could cause a loss of reservations, interfere with
our fleet management, slow rental and sales processes, create negative publicity that damages our reputation or otherwise adversely impacts our ability to manage our business effectively. We may experience temporary system interruptions for a variety of reasons, including network failures, power outages, cyber-attacks, software errors or an overwhelming number of visitors trying to access our systems. Because we are dependent in part on independent third parties for the implementation and maintenance of certain aspects of our systems and because some of the causes of system interruptions may be outside of our control, we may not be able to remedy such interruptions in a timely manner, or at all. Our systems’ business continuity plans and insurance programs seek to mitigate such risks but they cannot fully eliminate the risks as a disruption could be experienced in any of our information systems.
We face risks related to cyber security breaches of our systems and information technology.
Third parties may have the technology or expertise to breach the security of our customer transaction data and our security measures may not prevent physical security or cyber-security breaches, which could result in substantial harm to our business, our reputation or our results of operations. We rely on encryption and/or authentication technology licensed from and, at times, administered by independent third parties to secure transmission of confidential information, including credit card numbers and other customer personal information. Our outsourcing agreements with these third-party service providers generally require that they have adequate security systems in place to protect our customer transaction data. However, advances in computer capabilities, new discoveries in the field of cryptography or other cyber-security developments could render our security systems and information technology or those employed by our third-party service providers vulnerable to a breach. In addition, anyone who is able to circumvent our security measures could misappropriate proprietary information or cause interruptions in our operations. Cyber-security risks such as malicious software and attempts to gain unauthorized access to data are rapidly evolving and could lead to disruptions in our reservation system or other data systems, unauthorized release of confidential or otherwise protected information or corruption of data. Any successful efforts by individuals to infiltrate, break into, disrupt, damage or otherwise steal from the Company’s, its licensees’ or its third-party service providers’ security or information systems could damage our reputation and expose us to a risk of loss or litigation and possible liability that could adversely impact our financial condition or results of operations.
We face risks associated with our like-kind exchange program.
We utilize a like-kind exchange program whereby we replace vehicles in a manner that allows tax gains on vehicles sold in the United States to be deferred. The program has resulted in a material deferral of federal and state income taxes beginning in 2004. The benefit of deferral is dependent on reinvestment of vehicle disposition proceeds in replacement vehicles within a prescribed period of time (usually six months). An extended downsizing of our fleet could result in reduced deferrals, utilization of tax attributes and increased payment of federal and state income taxes that could require us to make material cash payments. Such a downsizing or reduction in purchases would likely occur if, and to the extent, we are unable to obtain financing when our asset-backed rental car financings mature or in connection with a significant decrease in demand for vehicle rentals. Therefore, we cannot offer assurance that the expected tax deferral will continue or that the relevant law concerning like-kind exchange programs will remain intact in its current form.
In the United States, tax reform has been identified as a high priority for legislative action in 2017. U.S. federal and state income tax laws, legislation or regulations governing like-kind exchange and accelerated depreciation deductions and the administrative interpretations of those laws, legislation or regulations are subject to amendment at any time. We cannot predict when or if any such new federal or state income tax laws, legislation, regulations or administrative interpretations will be adopted or what the structure of such reform would encompass. Any such change could eliminate certain tax deferrals that are currently available with respect to like-kind exchange or accelerated depreciation deductions, which could adversely impact our financial condition or results of operations by reducing or eliminating deferral of federal or state income taxes allowed for our U.S. vehicle rental fleet.
We face risks related to our protection of our intellectual property.
We have registered “Avis,” “Budget,” “Zipcar”certain marks and “Payless” and various related marks or designs such as “We try harder,” and “wheels when you want them,” as trademarks in the United States and in certain other countries. At times, competitors may adopt service names similar to ours, thereby impeding our ability to build brand identity
and possibly leading to market confusion. In addition, there could be potential trade name or trademark infringement claims brought by owners of other registered trademarks or trademarks that incorporate variations of our registered trademarks. From time to time, we have acquired or attempted to acquire Internet domain names held by others when such names have caused consumer confusion or had the potential to cause consumer confusion.
Our efforts to enforce or protect our proprietary rights related to trademarks, trade secrets, domain names, copyrights or other intellectual property may be ineffective and could result in substantial costs and diversion of resources and could adversely impact our financial condition or results of operations.
We face risks associated with tax reform.
In 2017, the Tax Cuts and Jobs Act (the “Tax Act”) was signed into law, which broadly reforms the U.S. corporate income tax system. Several provisions of the Tax Act affect the Company, specifically the provision eliminating the use of like-kind exchange for personal property and the provision allowing for full expensing of qualified property purchases through the year 2022. Since 2004, we have utilized a like-kind exchange program whereby we replace vehicles in a manner that allows tax gains on vehicles sold in the U.S. to be deferred, resulting in a material deferral of U.S. federal and state income taxes. The Tax Act repealed like-kind exchange treatment for vehicle sales as of January 1, 2018. The effect of the elimination of our like-kind exchange will be largely offset through 2022 by the full expensing provision of certain business assets in the year placed in service, which we believe includes our vehicles. However, an extended downsizing of our fleet would significantly decrease the amount of tax deductions available under the full expensing provision. This would result in the utilization of tax attributes and increased federal and state income tax liabilities that could require us to make material cash payments. Such a downsizing or reduction in purchases would likely occur if, and to the extent, we are unable to
obtain financing when our asset-backed rental car financings mature, or in connection with a significant decrease in demand for vehicle rentals. In addition, the full expensing provision phases out at the end of year 2022 and we are not certain if this provision will be extended. U.S. states continue to modify their tax statutes as a result of the Tax Act and such state legislation could negate the full expensing benefits granted under the Tax Act or negatively impact our tax liability in that state. Therefore, we cannot offer assurance that the benefits from the expected tax deductions will continue.
The Tax Act also makes significant changes to the U.S. Internal Revenue Code applicable to corporations. Such changes include a permanent reduction to the corporate income tax rate, a mandatory one-time repatriation tax on undistributed historic earnings of foreign subsidiaries, elimination or limitation of the deductibility of certain business expenses, and requiring the inclusion in the U.S. tax base certain earnings generated by foreign subsidiaries, among other changes. While the Company believes it will not be materially impacted by these changes, the ultimate impact of the Tax Act may differ from our current estimates due to changes in interpretations of the Tax Act, legislative action, changes in accounting standards for income taxes, among other things, which could adversely impact our financial condition or results of operations.
RISKS RELATED TO OUR INDEBTEDNESS
We face risks related to our current and future debt obligations.
Our ability to satisfy and manage our debt obligations depends on our ability to generate cash flow and on overall financial market conditions. To some extent, this is subject to prevailing economic and competitive conditions and to certain financial, business and other factors, many of which are beyond our control. Our totaloutstanding debt as of December 31, 2016, was $12.4 billion, requiringobligations require us to dedicate a significant portion of our cash flows to pay interest and principal on our debt, which reduces the funds available to us for other purposes. Our business may not generate sufficient cash flow from operations to permit us to service our debt obligations and meet our other cash needs, which may force us to reduce or delay capital expenditures, sell or curtail assets or operations, seek additional capital or seek to restructure or refinance our indebtedness. If we must sell or curtail our assets or operations, it may negatively affect our ability to generate revenue. Certain of our debt obligations contain restrictive covenants and provisions applicable to us and our subsidiaries that limit our ability to, among other things:
incur additional debt to fund working capital, capital expenditures, debt service requirements, execution of our business strategy or acquisitions and other purposes;
provide guarantees in respect of obligations of other persons;
pay dividends or distributions, redeem or repurchase capital stock;
prepay, redeem or repurchase debt;
create or incur liens;
make distributions from our subsidiaries;
sell assets and capital stock of our subsidiaries;
consolidate or merge with or into, or sell substantially all of our assets to, another person; and
respond to adverse changes in general economic, industry and competitive conditions, as well as changes in government regulation and changes to our business.
Our failure to comply with the restrictive covenants contained in the agreements or instruments that govern our debt obligations, if not waived, would cause a default under our senior credit facility and could result in a cross-default under several of our other debt obligations, including our U.S. and European asset-backed debt facilities. If such a failuredefault were to occur, certain provisions in our various debt agreements could require that we repay or accelerate debt payments to the lenders or holders of our debt, and there can be no assurance that we would be able to refinance or obtain a replacement for such financing programs.
We face risks related to movements or disruptions in the credit and asset-backed securities markets.
We finance our vehicle fleet purchases and operations through the use of asset-backed securities in the United States, Canada, Australia and Europe and other debt financing structures available through the credit market. Our total asset-backed debt as of December 31, 2016, was approximately $8.9 billion, with remaining available capacity of approximately $3.6 billion. We maintain asset-backed facilities in
the United States, Canada, Australia and Europe.markets. If the asset-backed financing marketand/or credit markets were to be disrupted for any reason, we may be unable to obtain refinancing for our operations or vehicle fleet purchases at current levels, or at all, when our respective asset-backed financings or debt financings mature. Likewise, any disruption of the asset-backed financing marketor credit markets could also increase our borrowing costs, as we seek to engage in new financings or refinance our existing asset-backed financings. In addition, we could be subject to increased collateral requirements to the extent that we request any amendment or renewal of any of our existing asset-backed or debt financings.
We face risks related to potential increases in interest rates.
A portion of our borrowings, primarily our vehicle-backed borrowings, bears interest at variable rates that expose us to interest rate risk. If interest rates were to increase, whether due to an increase in market interest rates or an increase in our own cost of borrowing, our debt service obligations for our variable rate indebtedness would increase even though the amount of borrowings remained the same, and our results of operations could be adversely affected. As of December 31, 2016,2018, our total outstanding debt of approximately $12.4$13.8 billion included unhedged interest rate sensitive debt of approximately $2.6$4.1 billion. During our seasonal borrowing peak in 2016,2018, outstanding unhedged interest rate sensitive debt totaled approximately $3.7$5.5 billion.
Approximately $0.7 billionVirtually all of our debt under vehicle programs and certain of our corporate indebtedness as of December 31, 2016, and virtually all of our $8.9 billion of debt under vehicle programs, matures within the next five years. If we are unable to refinance maturing indebtedness at interest rates that are equivalent to or lower than the interest rates on our maturing debt, our results of operations or our financial condition may be adversely affected.
RISKS RELATED TO OUR COMMON STOCK
We face risks related to the market price of our common stock.
We cannot predict the prices at which our common stock will trade. The market price of our common stock experienced substantial volatility in the past and may fluctuate widely in the future, depending upon many factors, some of which may be beyond our control, including:
weakness in general economic conditions and credit markets;
changes in consumers’, investors’ and analysts’ perceptions of our industry, business or related industries;
our quarterly or annual earnings, or those of other companies in our industry, including our key suppliers;
financial estimates that we provide to the public, any changes in such estimates, or our failure to meet such estimates;
actual or anticipated fluctuations in our operating results;
changes in accounting standards, policies, guidance, interpretations or principles;
announcements by us or our competitors of acquisitions, dispositions, strategies, management or shareholderstockholder changes, marketing affiliations, projections, fleet costs, pricing actions or other competitive actions;
changes in earnings estimates by securities analysts or our ability to meet those estimates;
changes in investors’ and analysts’ perceptions of our industry, business or related industries;
the operating and stock price performance of other comparable companies;
overall stock market fluctuations;
success or failure of competitive service offerings or technologies;
tax or regulatory developments in the United States or foreign countries;and other countries in which we operate;
litigation involving us;
actions of activist stockholders and responses from our Board and senior management; and
the timing and amount of any share repurchases by us; and
general economic conditions and conditions in the credit markets.us.
If any of the foregoing occurs, it could cause our stock price to fall and may expose us to litigation, including class action lawsuits that, even if unsuccessful, could be costly to defend and a distraction to management.
Our shareholders’stockholders’ percentage of ownership may be diluted in the future.
Our shareholders’stockholders’ percentage of ownership may be diluted in the future due to equity issuances or equity awards that we granted or will grant to our directors, officers and employees. In addition, we may undertake acquisitions financed in part through public or private offerings of securities, or other arrangements. If we issue equity securities or equity-linked securities, the issued securities would have a dilutive effect on the interests of the holders of our common shares. In 2016, we granted approximately 1.1 million restricted stock units. We expect to continue to grant restricted stock units, stock options and/or other types of equity awards in the future.
Certain provisions of our certificate of incorporation and by-laws, and Delaware law and our stockholder rights plan could prevent or delay a potential acquisition of control of our Company, which could decrease the trading price of our common stock.
Our amended and restated certificate of incorporation, amended and restated by-laws and the laws in the State of Delaware contain provisions that are intended to deter coercive takeover practices and inadequate takeover bids by making such practices or bids unacceptably expensive to the prospective acquirer and to encourage prospective acquirers to negotiate with our Board of Directors rather than to attempt a hostile takeover. Delaware law also imposes restrictions on mergers and other business combinations between us and any holder of 15% or more of our outstanding common stock. In January 2017, our Board of Directors authorized the adoption of a short-term stockholder rights plan, which may cause substantial dilution to a person or group that attempts to acquire control of the Company on terms not approved by our Board of Directors.
We believe these provisions and the stockholder rights plan protect our stockholders from coercive or otherwise unfair takeover tactics by effectively requiring those who seek to obtain control of the Company to negotiate with our Board of Directors and by providing our Board with more time to assess any acquisition of control. However, these provisions could apply even if an acquisition of control of the Company may be considered beneficial by some stockholders and could delay or prevent an acquisition of control that our Board of Directors determines is not in the best interests of our Company and our stockholders.
Our business could be adversely impacted as a result of actions by activist stockholders or others.
The Company values constructive input from investors and regularly engages in dialogue with its stockholders regarding strategy and performance. The Company’s Board of Directors and management team are committed to acting in the best interests of all of the Company’s stockholders. There is no assurance that the actions taken by the Board of Directors and management in seeking to maintain constructive engagement with the Company’s stockholders will be successful, and we may be subject to formal or informal actions or requests from stockholders or others. Responding to such actions could be costly and time-consuming, divert attention of management and employees, and may have an adverse effect on our business, results of operations and cash flow and the market price of our common stock.
|
|
| ITEM 1B. UNRESOLVED STAFF COMMENTS |
None.
Our principal executive offices are located at 6 Sylvan Way, Parsippany, New Jersey 07054 pursuant to a lease agreement that expires in 2023. We own a facility in Virginia Beach, Virginia, which serves as a satellite administrative facility for our car and truck rental operations. We also lease office space in Tulsa, Oklahoma, and Boston, Massachusetts, pursuant to leases expiring in 2022 and 2023, respectively. These locations primarily provide operational and administrative services or contact center operations.operations for our Americas segment. We also lease office space in Bracknell, England, Budapest, Hungary and Barcelona, Spain, pursuant to leases expiring in 2027, 2021 and 2019, respectively, for corporate offices, contact center activities and other administrative functions, respectively, in Europe.for our International segment. Other office locations throughout the world are leased for administrative, regional sales and operations activities.
We lease or have vehicle rental concessions for our brands at locations throughout the world. Avis operatesWe own approximately 1,5502% of the locations from which we operate and in some cases we sublease to franchisees or other third parties. The remaining locations from which we operate our vehicle rental businesses are leased or operated under concession agreements with governmental authorities and private entities. Those leases and concession agreements typically require the Americaspayment of minimum rents or minimum concession fees and approximately 1,200 locations inoften also require us to pay or reimburse operating expenses, to pay additional rent, or concession fees above guaranteed minimums, based on a percentage of revenues or sales arising at the relevant premises, or to do both. See Note 14 to our International segment. Of those locations, approximately 315 in the Americas and approximately 240 in our International segment are at airports. Budget operates at approximately 1,400 locations in the Americas, of which approximately 270 are at airports. Budget also operates approximately 650 locations in our International segment, of which approximately 190 are at airports. Payless operates at approximately 85 locations in the Americas, the majority of which are at orConsolidated Financial Statements for information regarding lease commitments.
near airports, and approximately 5 locations in our International segment. We believe that our properties are sufficient to meet our present needs and we do not anticipate any difficulty in securing additional space, as needed, on acceptable terms.
|
|
| ITEM 3. LEGAL PROCEEDINGS |
The Company is involved in variousFor information regarding legal proceedings, related to wage and hour and employee classification claims that involve allegations that we violated the Fair Labor Standards Act and various other state labor laws by misclassifying certain management employees as exempt from receiving overtime compensation. The relief sought in these cases varies but most cases typically seek to recover payment for alleged unpaid overtime compensation and attorneys’ fees and costs. These matters are at various stages in the litigation process and we intend to vigorously defend against these suits.
In May 2016, the French Competition Authority issued a second statement of objections affirming the allegations that it raised in its first statement of objections, issued in February 2015, which alleges that several car rental companies, including the Company and two of its European subsidiaries, engaged with (i) twelve French airports, the majority of which are controlled by public administrative bodies or the French state, violated competition law through the distribution of company-specific statistics by airports to car rental companies operating at those airports; and (ii) two other international car rental companies in a concerted practice relating to train station surcharges. The Company believes that it has valid defenses and intends to vigorously defend against the allegations, but it is currently unable to predict the outcome of the proceedings or range of reasonably possible losses, which may be material.
In February 2017, following a state court trial in Georgia, a jury found the Company liable for damages in a case brought by a plaintiff who was injured in a vehicle accident allegedly caused by an employee of an independent contractor of the Company who was acting outside of the scope of employment. The Company considers the attribution of liability to the Company, and the amount of damages awarded, to be unsupported by the facts of the case, and intends to appeal the verdict. The Company also faces a similar case from another plaintiff. The Company has recognized a liability for the expected loss related to these cases of $26 million.
We are involved in other claims, legal proceedings and governmental inquiries related, among other things,see Note 14 to our vehicle rental and car sharing operations, including, among others, business practice disputes, contract and licensee disputes, employment and wage-and-hour claims, competition matters, insurance and liability claims, intellectual property claims and other regulatory, environmental, commercial and tax matters. The Company believes that it has adequately accrued for such matters as appropriate. However, litigation is inherently unpredictable and, although the Company believes that its accruals are adequate and/or that it has valid defenses in these matters, unfavorable resolutions could occur, which could adversely impact the Company’s financial position, results of operations or cash flows.Consolidated Financial Statements.
|
|
| ITEM 4. MINE SAFETY DISCLOSURES |
Not applicable.
PART II
|
| |
| ITEM 5. | MARKET FOR REGISTRANT’S COMMON EQUITY, RELATED STOCKHOLDER |
| | MATTERS AND ISSUER PURCHASES OF EQUITY SECURITIES |
MARKET PRICE OFFOR COMMON STOCKEQUITY
Our common stock is currently traded on the NASDAQ Global Select Market (“NASDAQ”) under the symbol “CAR.” The following table sets forth the quarterly high and low sales prices per share of our common stock as reported by NASDAQ for 2016 and 2015. At January 31, 2017,2019, the number of stockholders of record was 2,811.
|
| | | | | | | | |
| | | High | | Low |
| | 2016 | | | |
| | First Quarter | $ | 36.32 |
| | $ | 21.73 |
|
| | Second Quarter | 34.85 |
| | 21.85 |
|
| | Third Quarter | 39.54 |
| | 29.72 |
|
| | Fourth Quarter | 41.53 |
| | 30.60 |
|
| | | | | |
| | | High | | Low |
| | 2015 | | | |
| | First Quarter | $ | 68.25 |
| | $ | 56.01 |
|
| | Second Quarter | 59.45 |
| | 43.90 |
|
| | Third Quarter | 47.75 |
| | 39.04 |
|
| | Fourth Quarter | 53.04 |
| | 32.76 |
|
DIVIDEND POLICY
We neither declared nor paid any cash dividend on our common stock in 20162018 and 2015,2017, and we do not currently anticipate paying cash dividends on our common stock. Our ability toHowever, we evaluate our dividend policy on a regular basis and may pay dividends in the future, subject to holders ofcompliance with the covenants in our common stock is limited by the Company’s senior credit facility, the indentures governing our senior notes and our vehicle financing programs, insofar as we may seek to pay dividends out of funds made available to the Company by certain of its subsidiaries.programs. The declaration and payment of future dividends to holders of our common stock will be at the discretion of our Board of Directors and will also depend upon many factors, including our financial condition, earnings, capital requirements of our businesses, covenants associated with certain debt obligations, legal requirements, regulatory constraints, industry practice and other factors that the Board of Directors deems relevant.
SECURITIES AUTHORIZED FOR ISSUANCE UNDER EQUITY COMPENSATION PLANS
The following table provides information about shares of our common stock that may be issued upon the exercise of options and restricted stock units under all of our existing equity compensation plans as of December 31, 2016.2018.
| | | Plan Category | | Number of Securities to be Issued Upon Exercise of Outstanding Options, Warrants, Rights and Restricted Stock Units (a) | | Weighted-Average Exercise Price of Outstanding Options, Warrants and Rights (Excludes Restricted Stock Units) ($) | | Number of Securities Remaining Available for Future Issuance Under Equity Compensation Plans (Excluding Securities Reflected in First Column) (b) | | Number of Securities to be Issued Upon Exercise of Outstanding Options, Warrants, Rights and Restricted Stock Units (a) | | Weighted-Average Exercise Price of Outstanding Options, Warrants and Rights (Excludes Restricted Stock Units) ($) | | Number of Securities Remaining Available for Future Issuance Under Equity Compensation Plans (Excluding Securities Reflected in First Column) (b) |
| Equity compensation plans approved by security holders | | 3,037,882 |
| | $ | 2.91 |
| | 7,625,873 |
| | 2,457,610 |
| | $ | 0.79 |
| | 5,889,509 |
|
| Equity compensation plans not approved by security holders | | — |
| | — |
| | — |
| | — |
| | — |
| | — |
|
| Total | | 3,037,882 |
| | | | 7,625,873 |
| | 2,457,610 |
| | $ | 0.79 |
| | 5,889,509 |
|
__________
| |
(a) | Includes options and other awards granted under the Amended and Restated Equity and Incentive Plan, which plan was approved by stockholders. |
| |
(b) | Represents 5,182,0403,469,070 shares available for issuance under the Amended and Restated Equity and Incentive Plan and 2,443,8332,420,439 shares available for issuance pursuant to the 2009 Employee Stock Purchase Plan. |
ISSUER PURCHASES OF EQUITY SECURITIES
The following is a summary of the Company’s common stock repurchases by month for the quarter ended December 31, 2016:2018: |
| | | | | | | | | | | | | | |
| Period | | Total Number of Shares Purchased(a) | | Average Price Paid per Share | | Total Number of Shares Purchased as Part of Publicly Announced Plans or Programs | | Approximate Dollar Value of Shares That May Yet Be Purchased under the Plans or Programs |
| October 2016 | | 1,050,897 |
| | $ | 32.39 |
| | 1,050,897 |
| | $ | 116,434,853 |
|
| November 2016 | | 777,559 |
| | 37.49 |
| | 777,559 |
| | 337,284,137 |
|
| December 2016 | | 972,421 |
| | 37.85 |
| | 972,421 |
| | 300,475,790 |
|
| Total | | 2,800,877 |
| | $ | 35.70 |
| | 2,800,877 |
| | $ | 300,475,790 |
|
|
| | | | | | | | | | | | | | |
| Period | | Total Number of Shares Purchased(a) | | Average Price Paid per Share | | Total Number of Shares Purchased as Part of Publicly Announced Plans or Programs | | Dollar Value of Shares That May Yet Be Purchased under the Plans or Programs |
| October 2018 | | 672,141 |
| | $ | 31.83 |
| | 672,141 |
| | $ | 200,501,901 |
|
| November 2018 | | 804,549 |
| | 29.89 |
| | 804,549 |
| | 176,451,029 |
|
| December 2018 | | 989,200 |
| | 26.23 |
| | 989,200 |
| | 150,501,899 |
|
| Total | | 2,465,890 |
| | $ | 28.95 |
| | 2,465,890 |
| | $ | 150,501,899 |
|
________
| |
(a) | Excludes, for the three months ended December 31, 2016, 34,9832018, 106 shares which were withheld by the Company to satisfy employees’ income tax liabilities attributable to the vesting of restricted stock unit awards. |
The Company’s Board of Directors has authorized the repurchase of up to approximately $1.5$1.7 billion of its common stock under a plan originally approved in 2013 and subsequently expanded, most recently in 2016.August 2018. The Company’s stock repurchases may occur through open market purchases or trading plans pursuant to Rule 10b5-1 of the Securities Exchange Act of 1934. The amount and timing of specific repurchases are subject to market conditions, applicable legal requirements and other factors. The repurchase program may be suspended, modified or discontinued at any time without prior notice. The repurchase program has no set expiration or termination date.
PERFORMANCE GRAPH
Set forth below are a line graph and table comparing the cumulative total stockholder return of our common stock against the cumulative total returns of peer group indices, the S&P Midcap 400 Index, the S&P 500 Index and the Dow Jones U.S. Transportation Average Index for the period of five fiscal years commencing December 31, 20112013 and ending December 31, 2016.2018. The broad equity market indices used by the Company are the S&P 500Midcap 400 Index, which measures the performance of large-sizedmid-sized companies and the Dow Jones U.S. Transportation Average Index, which measures the performance of transportation companies. The Company has elected to begin using the S&P Midcap 400 Index in place of the S&P 500 Index for future period comparisons because the S&P Midcap 400 Index is a more appropriate benchmark in light of the Company’s equity market capitalization. The graph and table depict the result of an investment on December 31, 20112013 of $100 in the Company’s common stock, the S&P Midcap 400 Index, the S&P 500 Index and the Dow Jones U.S. Transportation Average Index, including investment of dividends.

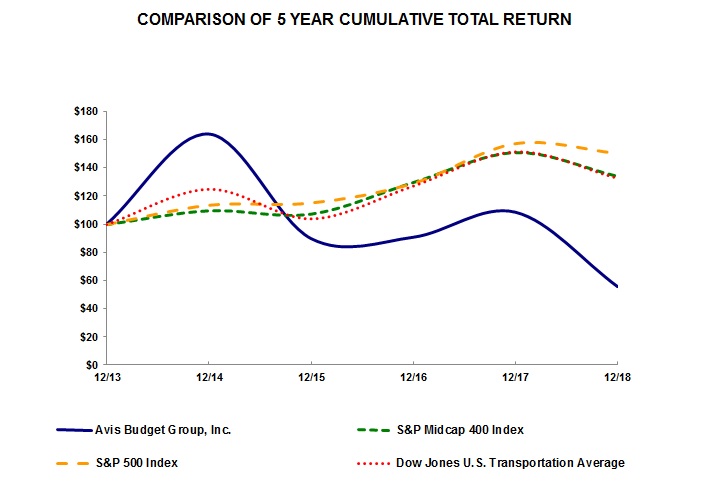
| | | | As of December 31, | As of December 31, |
| | 2011 | | 2012 | | 2013 | | 2014 | | 2015 | | 2016 | 2013 | | 2014 | | 2015 | | 2016 | | 2017 | | 2018 |
| Avis Budget Group, Inc. | $ | 100.00 |
| | $ | 184.89 |
| | $ | 377.05 |
| | $ | 618.75 |
| | $ | 338.53 |
| | $ | 342.16 |
| $ | 100.00 |
| | $ | 164.10 |
| | $ | 89.78 |
| | $ | 90.75 |
| | $ | 108.56 |
| | $ | 55.62 |
|
| S&P Midcap 400 Index | | $ | 100.00 |
| | $ | 109.77 |
| | $ | 107.38 |
| | $ | 129.65 |
| | $ | 150.71 |
| | $ | 134.01 |
|
| S&P 500 Index | $ | 100.00 |
| | $ | 116.00 |
| | $ | 153.58 |
| | $ | 174.60 |
| | $ | 177.01 |
| | $ | 198.18 |
| $ | 100.00 |
| | $ | 113.69 |
| | $ | 115.26 |
| | $ | 129.05 |
| | $ | 157.22 |
| | $ | 150.33 |
|
| Dow Jones U.S. Transportation Average Index | $ | 100.00 |
| | $ | 107.55 |
| | $ | 152.05 |
| | $ | 190.17 |
| | $ | 158.30 |
| | $ | 193.64 |
| $ | 100.00 |
| | $ | 125.07 |
| | $ | 104.11 |
| | $ | 127.36 |
| | $ | 151.58 |
| | $ | 132.90 |
|
|
|
ITEM 6. SELECTED FINANCIAL DATA |
| | | | | As of or For the Year Ended December 31, | | As of or For the Year Ended December 31, |
| | | 2016 | | 2015 | | 2014 | | 2013 | | 2012 | | 2018 | | 2017 | | 2016 | | 2015 | | 2014 |
| | | | | (In millions, except per share data) | | | | | | (In millions, except per share data) | | |
| Results of Operations | Results of Operations | | | | | | | | | | Results of Operations | | | | | | | | | |
| Net revenues | $ | 8,659 |
| | $ | 8,502 |
| | $ | 8,485 |
| | $ | 7,937 |
| | $ | 7,357 |
| |
| Revenues | | Revenues | $ | 9,124 |
| | $ | 8,848 |
| | $ | 8,659 |
| | $ | 8,502 |
| | $ | 8,485 |
|
| | | | | | | | | | | | | | | | | | | | | |
| Net income | Net income | $ | 163 |
| | $ | 313 |
| | $ | 245 |
| | $ | 16 |
| | $ | 290 |
| Net income | $ | 165 |
| | $ | 361 |
| | $ | 163 |
| | $ | 313 |
| | $ | 245 |
|
| | | | | | | | | | | | | | | | | | | | | |
Adjusted EBITDA (a) | Adjusted EBITDA (a) | $ | 838 |
| | $ | 903 |
| | $ | 876 |
| | $ | 769 |
| | $ | 840 |
| Adjusted EBITDA (a) | $ | 781 |
| | $ | 735 |
| | $ | 838 |
| | $ | 903 |
| | $ | 876 |
|
| | | | | | | | | | | | | | | | | | | | | |
| Earnings per share | Earnings per share | | | | | | | | | | Earnings per share | | | | | | | | | |
| | Basic | $ | 1.78 |
| | $ | 3.02 |
| | $ | 2.32 |
| | $ | 0.15 |
| | $ | 2.72 |
| Basic | $ | 2.08 |
| | $ | 4.32 |
| | $ | 1.78 |
| | $ | 3.02 |
| | $ | 2.32 |
|
| | Diluted | 1.75 |
| | 2.98 |
| | 2.22 |
| | 0.15 |
| | 2.42 |
| Diluted | 2.06 |
| | 4.25 |
| | 1.75 |
| | 2.98 |
| | 2.22 |
|
| | | | | | | | | | | | | | | | | | | | | |
| Financial Position | Financial Position | | | | | | | | | | Financial Position | | | | | | | | | |
| Total assets | Total assets | $ | 17,643 |
| | $ | 17,634 |
| | $ | 16,842 |
| | $ | 16,150 |
| | $ | 15,090 |
| Total assets | $ | 19,149 |
| | $ | 17,699 |
| | $ | 17,643 |
| | $ | 17,634 |
| | $ | 16,842 |
|
| Assets under vehicle programs | Assets under vehicle programs | 11,578 |
| | 11,716 |
| | 11,058 |
| | 10,452 |
| | 10,099 |
| Assets under vehicle programs | 12,779 |
| | 11,879 |
| | 11,578 |
| | 11,716 |
| | 11,058 |
|
| Corporate debt | Corporate debt | 3,523 |
| | 3,461 |
| | 3,353 |
| | 3,321 |
| | 2,833 |
| Corporate debt | 3,551 |
| | 3,599 |
| | 3,523 |
| | 3,461 |
| | 3,353 |
|
Debt under vehicle programs (b) | Debt under vehicle programs (b) | 8,878 |
| | 8,860 |
| | 8,056 |
| | 7,276 |
| | 6,750 |
| Debt under vehicle programs (b) | 10,232 |
| | 9,221 |
| | 8,878 |
| | 8,860 |
| | 8,056 |
|
| Stockholders’ equity | Stockholders’ equity | 221 |
| | 439 |
| | 665 |
| | 771 |
| | 757 |
| Stockholders’ equity | 414 |
| | 573 |
| | 221 |
| | 439 |
| | 665 |
|
| Ratio of debt under vehicle programs to assets under vehicle programs | Ratio of debt under vehicle programs to assets under vehicle programs | 77 | % | | 76 | % | | 73 | % | | 70 | % | | 67 | % | Ratio of debt under vehicle programs to assets under vehicle programs | 80 | % | | 78 | % | | 77 | % | | 76 | % | | 73 | % |
__________
| |
(a) | The following table reconciles Net Income to Adjusted EBITDA to Net income within our Selected Financial Data, which we define as income from continuing operations before non-vehicle related depreciation and amortization, any impairment charge,charges, restructuring expense,and other related charges, early extinguishment of debt costs, non-vehicle related interest, transaction-related costs, net charges for an unprecedented personal-injury legal mattermatters, non-operational charges related to shareholder activist activity and income taxes. ChargesNet charges for theunprecedented personal-injury legal mattermatters are recorded within operating expenses in our consolidated statementConsolidated Statements of operations.Operations. We have revised our definition of Adjusted EBITDA to exclude non-operational charges for an unprecedented personal-injuryrelated to shareholder activist activity. Non-operational charges related to shareholder activist activity include third-party advisory, legal matter which we do not view as indicativeand other professional service fees and are recorded within selling, general and administrative expenses in our Consolidated Statements of underlying business results due to its nature.Operations. We did not revise prior years’ Adjusted EBITDA amounts because there were no chargescosts similar in nature to this legal matter.these items. Our presentation of Adjusted EBITDA may not be comparable to similarly-titled measures used by other companies. See Management’s Discussion and Analysis of Financial Condition and Results of Operations, Item 7, for an explanation of why we believe Adjusted EBITDA is a useful measure. |
|
| | | | | | | | | | | | | | | | | | | |
| | For the Year Ended December 31, |
| | 2016 | | 2015 | | 2014 | | 2013 | | 2012 |
| Adjusted EBITDA | $ | 838 |
| | $ | 903 |
| | $ | 876 |
| | $ | 769 |
| | $ | 840 |
|
| Less: Non-vehicle related depreciation and amortization | 253 |
| | 218 |
| | 180 |
| | 152 |
| | 125 |
|
| Interest expense related to corporate debt, net | 203 |
| | 194 |
| | 209 |
| | 228 |
| | 268 |
|
| Early extinguishment of corporate debt | 27 |
| | 23 |
| | 56 |
| | 147 |
| | 75 |
|
| Restructuring expense | 29 |
| | 18 |
| | 26 |
| | 61 |
| | 38 |
|
| Transaction-related costs, net | 21 |
| | 68 |
| | 13 |
| | 51 |
| | 34 |
|
| Impairment | — |
| | — |
| | — |
| | 33 |
| | — |
|
| Charges for legal matter | 26 |
| | — |
| | — |
| | — |
| | — |
|
| Income before income taxes | 279 |
| | 382 |
| | 392 |
| | 97 |
| | 300 |
|
| Provision for income taxes | 116 |
| | 69 |
| | 147 |
| | 81 |
| | 10 |
|
| Net income | $ | 163 |
| | $ | 313 |
| | $ | 245 |
| | $ | 16 |
| | $ | 290 |
|
|
| | | | | | | | | | | | | | | | | | | | |
| | | For the Year Ended December 31, |
| | | 2018 | | 2017 | | 2016 | | 2015 | | 2014 |
| Net income | $ | 165 |
| | $ | 361 |
| | $ | 163 |
| | $ | 313 |
| | $ | 245 |
|
| Provision for (benefit from) income taxes | 102 |
| | (150 | ) | | 116 |
| | 69 |
| | 147 |
|
| Income before income taxes | 267 |
| | 211 |
| | 279 |
| | 382 |
| | 392 |
|
| Add: | Non-vehicle related depreciation and amortization | 256 |
| | 259 |
| | 253 |
| | 218 |
| | 180 |
|
| | Interest expense related to corporate debt, net | 188 |
| | 188 |
| | 203 |
| | 194 |
| | 209 |
|
| | Restructuring and other related charges | 22 |
| | 63 |
| | 29 |
| | 18 |
| | 26 |
|
| | Transaction-related costs, net | 20 |
| | 23 |
| | 21 |
| | 68 |
| | 13 |
|
| | Early extinguishment of corporate debt | 19 |
| | 3 |
| | 27 |
| | 23 |
| | 56 |
|
| | Non-operational charges related to shareholder activist activity | 9 |
| | — |
| | — |
| | — |
| | — |
|
| | Impairment | — |
| | 2 |
| | — |
| | — |
| | — |
|
| | Charges for legal matter, net | — |
| | (14 | ) | | 26 |
| | — |
| | — |
|
| Adjusted EBITDA | $ | 781 |
| | $ | 735 |
| | $ | 838 |
| | $ | 903 |
| | $ | 876 |
|
| |
(b) | Includes related-party debt due to Avis Budget Rental Car Funding (AESOP) LLC (“Avis Budget Rental Car Funding”). See Note 13 to our Consolidated Financial Statements. |
In presenting the financial data above in conformity with GAAP, we are required to make estimates and assumptions that affect the amounts reported. See “Critical Accounting Policies” under Item 7 of this Annual Report for a detailed discussion of the accounting policies that we believe require subjective and complex judgments that could potentially affect reported results.
RESTRUCTURING AND OTHER RELATED CHARGES, TRANSACTION-RELATED COSTS, RESTRUCTURING AND OTHER ITEMS
DuringIn 2018, 2017, 2016, 2015 and 2014, we recorded restructuring and other related charges of $22 million, $63 million, $29 million, $18 million, and $26 million, respectively. See Note 4 to our Consolidated Financial Statements.
In 2018, 2017, 2016, 2015 2014, 2013 and 2012,2014, we recorded $20 million, $23 million, $21 million, $68 million $13 million, $51 million and $34$13 million, respectively, of transaction-related costs, primarily related to the acquisition and integration of acquired businesses with our operations. In 2018 and 2017, these costs primarily related to integration-related costs of acquired businesses and acquisition-related costs of businesses pursued. In 2016, these costs primarily related to integration-related costs of acquired businesses. In 2015, these costs were primarily related to acquisition- and integration-related costs of acquired businesses, including $25 million of non-cash charges recognized in connection with the acquisition of the Avis and Budget license rights for Norway, Sweden and Denmark and Avis license rights for Poland, costs associated with the acquisition of the remaining 50% equity interest in our Brazilian licensee, which is now a wholly-owned subsidiary, and expenses related to certain pre-acquisition contingencies. In 2014, these costs were primarily related to acquisition- and integration-related costs of acquired businesses, including a non-cash gain recognized in connection with the acquisition of our Budget license rights in southern California and Las Vegas, and contingent consideration related to our Apex Car Rentals acquisition. In 2013, these costs were primarily related to the acquisition of Zipcar and the integration of acquired businesses. During 2012, these costs were primarily related to the integration of Avis Europe’s operations with the Company’s. See Notes 2 and 5 to our Consolidated Financial Statements.
DuringIn 2018, 2017, 2016, 2015 and 2014, we committed to various strategic initiatives to identify best practices and drive efficiency throughout our organization, by reducing headcount, improving processes and consolidating functions. In 2015, in conjunction with recent acquisitions, we identified opportunities to integrate and streamline our operations, primarily in Europe. During 2012, we initiated a strategic restructuring initiative related to our truck rental operations in the United States. During 2011 we implemented a major restructuring initiative subsequent to the acquisition of Avis Europe. We recorded expenses related to these and other restructuring initiatives of $29$19 million, in 2016, $18$3 million, in 2015, $26 million in 2014, $61 million in 2013, and $38 million in 2012. See Note 4 to our Consolidated Financial Statements.
In 2016, 2015, 2014, 2013 and 2012 we recorded $27 million, $23 million $56 million, $147 million and $75$56 million, respectively, of expense related to the early extinguishment of corporate debt. See Note 12 to our Consolidated Financial Statements.
In 2013,2017, we recorded a $2 million impairment charge related to our Zipcar trademark.
In 2017, we recognized recoverable insurance proceeds of $27 million and a charge of $33$13 million for the impairment of our equity-method investmentrelated to an adverse legal judgment against us in our Brazilian licensee.
a personal injury case. In 2016, we recorded a charge of $26 million related to an adversethe same legal judgment against us in a personal-injury case.matter. This adverse legal judgment is recorded within operating expenses in our consolidated statement of operations.
|
| |
ITEM 7. | MANAGEMENT’S DISCUSSION AND ANALYSIS OF FINANCIAL CONDITION AND RESULTS OF |
| | OPERATIONS |
The following discussion should be read in conjunction with our Consolidated Financial Statements and accompanying Notes thereto included elsewhere herein.in this Annual Report on Form 10-K commencing on page F-1. Our actual results of operations may differ materially from those discussed in forward-looking statements as a result of various factors, including but not limited to those included in Item 1A, “Risk Factors” and other portions of this Annual Report on Form 10-K. Unless otherwise noted, all dollar amounts in tables are in millions and those relating to our results of operations are presented before taxes.millions.
OUR COMPANY
We operate three of the most globally recognized brands in the global vehicle rental and car sharing industry,mobility solutions, Avis, Budget and Zipcar.Zipcar together with several other brands, well recognized in their respective markets. We are a leading vehicle rental operator in North America, Europe, Australia, New ZealandAustralasia and certain other regions we serve, with aan average rental fleet of approximately 600,000nearly 650,000 vehicles. We also license the use of our trademarks to licensees in the areas in which we do not operate directly. We and our licensees operate our brands in approximately 180 countries throughout the world.
OUR SEGMENTS
We categorize our operations into two reportable business segments: Americas and International, as discussed in Part I of this Form 10-K.
BUSINESS AND TRENDS
Our revenues are derived principally from vehicle rentals in our Company-owned operations and include:
time and& mileage (“T&M”) fees charged to our customers for vehicle rentals;
sales of loss damage waivers and insurance and other supplemental items in conjunction with vehicle rentals; and
payments from our customers with respect to certain operating expenses we incur, including gasoline and vehicle licensing fees, as well as concession fees, which we pay in exchange for the right to operate at airports and other locations;locations.
sales of loss damage waivers and insurance and rentals of navigation units and other items in conjunction with vehicle rentals; and
In addition, we receive royalty revenue and associated fees from our licensees in conjunction with their vehicle rental transactions.
Our operating results are subject to variability due to seasonality, macroeconomic conditions and other factors. Car rental volumes tend to be associated with the travel industry, particularly airline passenger volumes, or enplanements, which in turn tend to reflect general economic conditions. Our vehicle rental operations are also seasonal, with the third quarter of the year historically having been our strongest due to the increased level of leisure travel during such quarter. We have a partially variable cost structure and routinely adjust the size, and therefore the cost, of our rental fleet in response to fluctuations in demand.
We believe that the following factors, among others, may affect our financial conditionThroughout 2018, worldwide demand for mobility solutions increased and results of operations:
general travel demand, including worldwide enplanements;
fleet, pricing, marketing and strategic decisions made by us and by our competitors;
changes in fleet costs and in conditionsused-vehicle values in the used vehicle marketplace, as well as manufacturer recalls;
changes in borrowing costsUnited States strengthened counterbalanced by the incremental impact of rising interest rates, higher salaries, wages and in market willingness to purchase corporate and vehicle-related debt;
demand for truck rentals and car sharing services;
changes in the price of gasoline; and
changes in currency exchange rates.
Throughout 2016,related benefits. In 2019, we operated in an uncertain and uneven economic environment marked by heightened geopolitical risks. We expect such economic conditions to continue in 2017. Nonetheless, we continue to anticipate that worldwide demand for vehicle rental and car sharing servicesmobility solutions will increase, in 2017, most likely against a backdrop of modest and possibly uneven global economic growth. Our access to new fleet vehicles has been adequate to meet our needs for both replacement of existing vehicles in the normal course and for growth to meet incremental demand, and we expect that to continue to be the case.
We will look toaggressively pursue opportunities for pricing increases in 2017 to enhance our returnsprofitability and return on invested capital and profitability.
capital. Our objective continuesis to be to focusdrive sustainable profitable growth by delivering on strategically acceleratingstrategic initiatives aimed at winning customers through differentiated brands and products, increasing our margins via revenue growth strengtheningand operational efficiency and enhancing our global position as a leading provider of vehicle rental services, continuing to enhance our customers’ rental experience, and controlling costs and driving efficiency throughoutleadership in the organization.evolving mobility solutions industry. Our strategies are intended to support and strengthen our brands and to grow our Adjusted EBITDA marginmargins and earnings over time, and to seizeachieve growth and efficiency opportunities as mobility solutions continue to evolve.
We operate in a highly competitive industry and we expect to continue to face challenges and risks.risks in managing our business. We seek to mitigate our exposure to risks in numerous ways, including delivering upon our core
strategic initiatives and through continued optimization of fleet levels to match changes in demand for vehicle rentals, maintenance of liquidity to fund our fleet investment and our operations, appropriate investments in technology and adjustments in the size and the nature and terms of our relationships with vehicle manufacturers.
During 2016:2018:
Our net revenues totaled $8.7$9.1 billion, and grew 2%increasing 3% compared to the prior year (including a $61 million (1%) negative impact from currency exchange rate movements).2017, due to higher rental volumes.
Our net income was $163$165 million representing a $150 million year-over-year decline in earnings, and our Adjusted EBITDA was $838$781 million representing a $65 million year-over-year decline, due todriven by higher revenues and Americas’ lower pricing, higher per-unit fleet costs and a $28 million (3%) negative impact from currency exchange rate movements, partially offset by increased rental volume.costs.
We repurchased $390$200 million of our common stock, reducing our shares outstanding by approximately 12.35.9 million shares, or 13%7%.
We amended the terms of our Floating Rate Term Loan due 2022 and our Senior revolving credit facility maturing 2021 and extended the maturity to 2025 and 2023, respectively.
We issued $350€350 million of 6⅜4¾% euro-denominated Senior Notes due 2024,January 2026, the proceeds of which were used primarily to redeem all $300$400 million of our outstanding 4⅞5⅛% Senior Notes due 2017.
We issued €300 million of 4⅛% Euro-denominated Senior Notes due 2024, the proceeds of which were used primarily to redeem €275 million of our outstanding 6% Euro-denominated Senior Notes due 2021.
We extended the maturity date for $825 million of our existing $970 million of corporate term loan borrowings by three years, to MarchJune 2022.
We acquired vehicle rental services company France Cars, making us one of the largest light commercial vehicle fleet operatorsMorini S.p.A in France.Northern Italy, Turiscar Group in Portugal, various licensees in Europe and North America, and a 40% ownership stake in our licensee in Greece.
We measure performance principally using the following key operating statistics:metrics: (i) rental days, which representsrepresent the total number of days (or portion thereof) a vehicle was rented, and (ii) T&M revenue per rental day, which represents revenues divided by rental days, (iii) vehicle utilization, which represents rental days divided by available rental days, available rental days is defined as average rental fleet times the number of days in the period, and (iv) per-unit fleet costs, which represent vehicle depreciation, lease charges and gain or loss on vehicle sales, divided by average daily revenue we earned from rental and mileage fees charged to our customers, both of which exclude our U.S. truckfleet. Our rental and Zipcar car sharing operations. We also measure our ancillary revenues (rental-transaction revenue other than T&M revenue), such as from the sale of collision and loss damage waivers, insurance products, fuel service options and portable GPS navigation unit rentals. Our vehicle rental operating statistics (rental days, and T&M revenue per rental day)day and vehicle utilization metrics are all calculated based on the actual rental of the vehicle during a 24-hour period. We believe that this methodology provides our managementus with the most relevant statisticsmetrics in order to manage the business. Our calculation may not be comparable to other companies’the calculation of similarly-titled statistics. In addition, per-unit fleet costs exclude our U.S. truck rental operations.metrics by other companies. We present currency exchange rate impactseffects to provide a method of assessing how our business performed excluding the effects of foreign currency rate fluctuations. Currency exchange rate impactseffects are calculated by translating the current-year results at the prior-period average exchange rate plus any related gains and losses on currency hedges.
We assess performance and allocate resources based upon the separate financial information of our operating segments. In identifying our reportable segments, we also consider the nature of services provided by our operating segments, the geographical areas in which our segments operate and other relevant factors. Management evaluates the operating results of each of our reportable segments based upon revenue and “Adjusted EBITDA,” which we define as income from continuing operations before non-vehicle related depreciation and amortization, any impairment charges, restructuring expense,and other related charges, early extinguishment of debt costs, non-vehicle related interest, transaction-related costs, net charges for an unprecedented personal-injury legal mattermatters, non-operational charges related to shareholder activist activity and income taxes. ChargesNet charges for theunprecedented personal-injury legal mattermatters are recorded within operating expenses in our consolidated statementresults of operations. We have revised our definition of Adjusted EBITDA to exclude non-operational charges for an unprecedented personal-injuryrelated to shareholder activist activity. Non-operational charges related to shareholder activist activity include third-party advisory, legal matter which we do not view as indicativeand other professional service fees and are recorded within selling, general and administrative expenses in our consolidated results of underlying business results due to its nature.operations. We did not revise prior years’ Adjusted EBITDA amounts because there were no chargescosts similar in nature to this legal matter.these costs. We believe Adjusted EBITDA is useful as a supplemental measure in evaluating the aggregate performance of our operating businesses and in comparing our results from period to period. We also believe that Adjusted EBITDA is useful to investors because it allows investorsthem to assess our financial condition and results of operations and financial condition on the same basis that management uses internally. Adjusted EBITDA is a non-GAAP measure and should not be considered in isolation or as a substitute for net income or other income statement data prepared in accordance with U.S. GAAP. Our presentation of Adjusted EBITDA may not be comparable to similarly-titled measures used by other companies.
Year Ended December 31, 20162018 vs. Year Ended December 31, 20152017
Our consolidated results of operations comprised the following:
| | | | | Year Ended
December 31, | | | | | | Year Ended
December 31, | | | | |
| | | 2016 | | 2015 | | Change | | % Change | | 2018 | | 2017 | | $ Change | | % Change |
| Revenues | Revenues | | | | | | | | Revenues | $ | 9,124 |
| | $ | 8,848 |
| | $ | 276 |
| | 3 | % |
| | Vehicle rental | $ | 6,081 |
| | $ | 6,026 |
| | $ | 55 |
| | 1 | % | | | | | | | | |
| Expenses | | Expenses | | | | | | | |
| | Other | 2,578 |
| | 2,476 |
| | 102 |
| | 4 | % | Operating | 4,639 |
| | 4,472 |
| | (167 | ) | | (4 | %) |
| Net revenues | 8,659 |
| | 8,502 |
| | 157 |
| | 2 | % | |
| | | | | | | | | | |
| Expenses | | | | | | | | |
| | Operating | 4,382 |
| | 4,284 |
| | 98 |
| | 2 | % | Vehicle depreciation and lease charges, net | 2,179 |
| | 2,221 |
| | 42 |
| | 2 | % |
| | Vehicle depreciation and lease charges, net | 2,047 |
| | 1,933 |
| | 114 |
| | 6 | % | Selling, general and administrative | 1,220 |
| | 1,120 |
| | (100 | ) | | (9 | %) |
| | Selling, general and administrative | 1,134 |
| | 1,093 |
| | 41 |
| | 4 | % | Vehicle interest, net | 314 |
| | 286 |
| | (28 | ) | | (10 | %) |
| | Vehicle interest, net | 284 |
| | 289 |
| | (5 | ) | | (2 | %) | Non-vehicle related depreciation and amortization | 256 |
| | 259 |
| | 3 |
| | 1 | % |
| | Non-vehicle related depreciation and amortization | 253 |
| | 218 |
| | 35 |
| | 16 | % | Interest expense related to corporate debt, net: | | | | |
|
| | |
| | Interest expense related to corporate debt, net: | | | | | | | | | Interest expense | 188 |
| | 188 |
| | — |
| | 0 | % |
| | | Interest expense | 203 |
| | 194 |
| | 9 |
| | 5 | % | | Early extinguishment of debt | 19 |
| | 3 |
| | (16 | ) | | n/m |
|
| | | Early extinguishment of debt | 27 |
| | 23 |
| | 4 |
| | 17 | % | Restructuring and other related charges | 22 |
| | 63 |
| | 41 |
| | 65 | % |
| | Restructuring expense | 29 |
| | 18 |
| | 11 |
| | 61 | % | Transaction-related costs, net | 20 |
| | 23 |
| | 3 |
| | 13 | % |
| | Transaction-related costs, net | 21 |
| | 68 |
| | (47 | ) | | (69 | %) | Impairment | — |
| | 2 |
| | 2 |
| | n/m |
|
| Total expenses | Total expenses | 8,380 |
| | 8,120 |
| | 260 |
| | 3 | % | Total expenses | 8,857 |
| | 8,637 |
| | (220 | ) | | (3 | %) |
| | | | | | | | | | | | | | | | | |
| Income before income taxes | Income before income taxes | 279 |
| | 382 |
| | (103 | ) | | (27 | %) | Income before income taxes | 267 |
| | 211 |
| | 56 |
| | 27 | % |
| Provision for income taxes | 116 |
| | 69 |
| | 47 |
| | 68 | % | |
| Provision for (benefit from) income taxes | | Provision for (benefit from) income taxes | 102 |
| | (150 | ) | | (252 | ) | | n/m |
|
| | | | | | | | | | | | | | | | | |
| Net income | Net income | $ | 163 |
| | $ | 313 |
| | $ | (150 | ) | | (48 | %) | Net income | $ | 165 |
| | $ | 361 |
| | $ | (196 | ) | | (54 | %) |
__________
During 2016, our net revenuesRevenues increased during 2018, compared to 2017, as a result of 4% higher rental volumes and a 3% increase in total rental days,$41 million benefit from currency exchange rate movements, partially offset by a 2% decrease1% reduction in pricing (including a $36 million (1%) negative impact from currencyrevenue per day excluding exchange rate movements).movements.
Total expenses increased as a result of increasedadditional rental volumes, increased marketing costshigher salaries, wages and commissions, a 3% increase inrelated benefits and higher vehicle interest rates, partially offset by lower per-unit fleet costs and a $26 million charge for a legal matter.in the Americas. These increases were partially offset by an approximately $43to expenses include a $27 million (1%) favorable impact on expensesnegative effect from currency exchange rate movements.
Operating expenses increased to 50.8% of revenue during 2018 compared to 50.5% in 2017. Vehicle depreciation and lease charges decreased to 23.9% of revenue during 2018 compared to 25.1% in 2017, primarily due to Americas’ lower per-unit fleet costs. Selling, general and administrative costs increased to 13.4% of revenue during 2018 compared to 12.7% in 2017, primarily due to higher salary related benefits. Vehicle interest costs were 3.4% of revenue during 2018 compared to 3.2% in 2017.
Our effective tax rates were a provision of 42%38% and 18%a benefit of 71% in 20162018 and 2015,2017, respectively, which in 20152018 included additional tax expense of $30 million related to the completion of the accounting for the one-time transition tax on the deemed repatriation of cumulative foreign subsidiary earnings initially recorded during 2017 related to the Tax Cuts and Jobs Act (the “Tax Act”) and in 2017 included a $98$213 million provisional income tax benefit related to the resolutionTax Act. This net benefit primarily consisted of a prior-yearbenefit of $317 million from the revaluation of net deferred tax matter.liabilities as a result of the corporate income tax rate reduction and a provisional expense of $104 million for the one-time transition tax on the deemed repatriation of cumulative foreign subsidiary earnings.
For 2018, the Company reported earnings of $2.06 per diluted share, which includes a net tax provision related to the adjustment of the one-time transition tax on the deemed repatriation of cumulative foreign subsidiary earnings of ($0.37) per share and a benefit from the impact of our 2018 share repurchases of $0.05 per share. For 2017, the Company reported earnings of $4.25 per diluted share, which includes a net tax benefit from the impact of the Tax Act of $2.51 per share.
Following is a more detailed discussion of the results of each of our reportable segments:
|
| | | | | | | | | | | | | | | | | | |
| | | | | 2018 | | 2017 |
| | | | | Revenues | | Adjusted EBITDA | | Revenues | | Adjusted EBITDA |
| Americas | $ | 6,186 |
| | $ | 558 |
| | $ | 6,100 |
| | $ | 486 |
|
| International | 2,938 |
| | 287 |
| | 2,748 |
| | 305 |
|
Corporate and Other (a) | — |
| | (64 | ) | | — |
| | (56 | ) |
| | Total Company | $ | 9,124 |
| | $ | 781 |
| | $ | 8,848 |
| | $ | 735 |
|
| | | | | | | | | | | |
| | | | | Reconciliation of net income to Adjusted EBITDA |
| | | | | | | | | 2018 | | 2017 |
| Net income | | $ | 165 |
| | $ | 361 |
|
| Provision for (benefit from) income taxes | | 102 |
| | (150 | ) |
| Income before income taxes | | 267 |
| | 211 |
|
| | | | | | |
| Add: | Non-vehicle related depreciation and amortization | | 256 |
| | 259 |
|
| | | Interest expense related to corporate debt, net: | | | | |
| | | Interest expense | | 188 |
| | 188 |
|
| | | Early extinguishment of debt | | 19 |
| | 3 |
|
| | | Restructuring and other related charges (b) | | 22 |
| | 63 |
|
| | | Transaction-related costs, net (c) | | 20 |
| | 23 |
|
| | | Non-operational charges related to shareholder activist activity (d) | | 9 |
| | — |
|
| | | Impairment (e) | | — |
| | 2 |
|
| | | Charges for legal matter, net (f) | | — |
| | (14 | ) |
| Adjusted EBITDA | | $ | 781 |
| | $ | 735 |
|
__________
| |
(a) | Includes unallocated corporate overhead which is not attributable to a particular segment. |
| |
(b) | Other related charges include costs associated with the separation of certain officers of the Company and our limited voluntary opportunity plans. |
| |
(c) | Primarily comprised of acquisition- and integration-related expenses. |
| |
(d) | Reported within selling, general and administrative expenses in our consolidated results of operations. |
| |
(e) | Impairment charge is related to our Zipcar trademark. |
| |
(f) | Reported within operating expenses in our consolidated results of operations. |
|
| | | | | | | | | | | |
| | | 2018 | | 2017 | | % Change |
| Revenues | | $ | 6,186 |
| | $ | 6,100 |
| | 1 | % |
| Adjusted EBITDA | | 558 |
| | 486 |
| | 15 | % |
Revenues increased 1% during 2018, compared to 2017, primarily due to a 1% increase in rental volumes, partially offset by a $10 million negative effect from currency exchange rate movements.
Operating expenses increased to 49.7% of revenue during 2018 compared to 49.4% in 2017. Vehicle depreciation and lease charges decreased to 25.4% of revenue during 2018 compared to 27.4% in 2017, primarily due to 7% lower per-unit fleet costs. Selling, general and administrative costs increased to 11.9% of revenue during 2018 compared to 11.3% in 2017, primarily due to higher salary related benefits, partially offset by lower marketing costs. Vehicle interest costs increased to 4.1% of revenue during 2018 compared to 3.7% in 2017, primarily due to higher interest rates.
Adjusted EBITDA increased 15% during 2018, compared to 2017, due to higher revenues and lower per-unit fleet costs, partially offset by higher salaries, wages and related benefits, and higher interest rates. Currency movements increased Adjusted EBITDA by $3 million.
|
| | | | | | | | | | | |
| | | 2018 | | 2017 | | % Change |
| Revenues | | $ | 2,938 |
| | $ | 2,748 |
| | 7 | % |
| Adjusted EBITDA | | 287 |
| | 305 |
| | (6 | %) |
Revenues increased 7% during 2018, compared to 2017, primarily due to an 8% increase in rental volumes and a $51 million benefit from currency exchange rate movements, partially offset by a 3% reduction in revenue per day excluding exchange rate movements.
Operating expenses were 52.8% of revenue during 2018 compared to 52.7% in 2017. Vehicle depreciation and lease charges increased to 20.8% of revenue during 2018 compared to 20.0% in 2017, primarily due to lower revenue per day excluding exchange rate movements. Selling, general and administrative costs increased to 14.5% of revenue during 2018 compared to 14.1% in 2017, primarily due to higher marketing costs. Vehicle interest costs were 2.1% of revenue during 2018 compared to 2.2% in 2017.
Adjusted EBITDA decreased 6% during 2018, compared to 2017, due to lower revenue per day excluding exchange rate movements, increased maintenance and damage costs and increased marketing costs, partially offset by increased rental volumes and a $15 million benefit from currency exchange rate movements.
|
| | | | | | | | | | |
| | | 2018 | | 2017 | | % Change |
| Revenues | | $ | — |
| | $ | — |
| | n/m |
| Adjusted EBITDA | | (64 | ) | | (56 | ) | | n/m |
__________
Adjusted EBITDA decreased $8 million during 2018, compared to 2017, primarily due to higher selling, general and administrative expenses which are not attributable to a particular segment.
Year Ended December 31, 2017 vs. Year Ended December 31, 2016
For the years ended December 31, 2017 and 2016, we measured performance principally using the following key metrics: (i) rental days, which represent the total number of days (or portion thereof) a vehicle was rented, (ii) time & mileage revenue per rental day, which represents the average daily revenue we earned from rental time & mileage fees charged to our customers, both of which exclude our U.S. truck rental and Zipcar car sharing operations and (iii) per-unit fleet costs, which represent vehicle depreciation, lease charges and gain or loss on vehicle sales, divided by average rental fleet and exclude our U.S. truck rental operations. We also measure our ancillary revenues (rental-transaction revenue other than time & mileage revenue), such as from the sale of collision and loss damage waivers, insurance products, fuel service options and rental of other supplemental products. Our rental days and time & mileage revenue per rental day vehicle rental metrics are all calculated based on the actual rental of the vehicle during a 24-hour period. We believe that this methodology provides us with the most relevant metrics in order to manage the business. Our calculation may not be comparable to the calculation of similarly-titled metrics by other companies. We present currency exchange rate effects to provide a method of assessing how our business performed excluding the effects of foreign currency rate fluctuations. Currency exchange rate effects are calculated by translating the current-year results at the prior-period average exchange rate plus any related gains and losses on currency hedges.
Our consolidated results of operations comprised the following:
|
| | | | | | | | | | | | | | | | | |
| | | | | Year Ended
December 31, | | | | |
| | | | | 2017 | | 2016 | | $ Change | | % Change |
| Revenues | | | | | | | |
| | Vehicle rental | $ | 6,219 |
| | $ | 6,081 |
| | $ | 138 |
| | 2 | % |
| | Other | 2,629 |
| | 2,578 |
| | 51 |
| | 2 | % |
| Net revenues | 8,848 |
| | 8,659 |
| | 189 |
| | 2 | % |
| | | | | | | | | | | |
| Expenses | | | | | | | |
| | Operating | 4,472 |
| | 4,382 |
| | (90 | ) | | (2 | %) |
| | Vehicle depreciation and lease charges, net | 2,221 |
| | 2,047 |
| | (174 | ) | | (9 | %) |
| | Selling, general and administrative | 1,120 |
| | 1,134 |
| | 14 |
| | 1 | % |
| | Vehicle interest, net | 286 |
| | 284 |
| | (2 | ) | | (1 | %) |
| | Non-vehicle related depreciation and amortization | 259 |
| | 253 |
| | (6 | ) | | (2 | %) |
| | Interest expense related to corporate debt, net: | | | | | | | |
| | | Interest expense | 188 |
| | 203 |
| | 15 |
| | 7 | % |
| | | Early extinguishment of debt | 3 |
| | 27 |
| | 24 |
| | 89 | % |
| | Restructuring and other related charges | 63 |
| | 29 |
| | (34 | ) | | n/m |
|
| | Transaction-related costs, net | 23 |
| | 21 |
| | (2 | ) | | (10 | %) |
| | Impairment | 2 |
| | — |
| | (2 | ) | | n/m |
|
| Total expenses | 8,637 |
| | 8,380 |
| | (257 | ) | | (3 | %) |
| | | | | | | | | | | |
| Income before income taxes | 211 |
| | 279 |
| | (68 | ) | | (24 | %) |
| Provision for (benefit from) income taxes | (150 | ) | | 116 |
| | 266 |
| | n/m |
|
| | | | | | | | |
| Net income | $ | 361 |
| | $ | 163 |
| | $ | 198 |
| | n/m |
|
_________
During 2017, our revenues increased as a result of a 5% increase in rental volumes, partially offset by a 1% decrease in time & mileage revenue per day. Currency exchange rate movements increased revenues by $58 million.
Total expenses increased as a result of higher rental volumes, a 4% increase in per-unit fleet costs (including a 1% negative impact from currency exchange rate movements) and increased restructuring and other related charges, partially offset by cost mitigating actions. Currency movements increased expenses by $25 million year-over-year.
Operating expenses were 50.5% of revenue during 2017 compared to 50.6% in 2016. Vehicle depreciation and lease charges increased to 25.1% of revenue during 2017 compared to 23.6% in 2016, primarily due to higher per-unit fleet costs and lower time & mileage revenue per day, partially offset by higher utilization. Selling, general and administrative costs decreased to 12.7% of revenue during 2017 compared to 13.1% in 2016, primarily due to cost mitigating actions, partially offset by higher marketing commissions. Vehicle interest costs were 3.2% of revenue during 2017 compared to 3.3% in 2016.
Our effective tax rates were a benefit of 71% and a provision of 42% in 2017 and 2016, respectively, which in 2017 included a $213 million provisional income tax benefit related to the impact of the Tax Act. This net benefit primarily consists of a benefit of $317 million from the revaluation of net deferred tax liabilities as a result of the corporate income tax rate reduction and a provisional expense of $104 million for the one-time transition tax on cumulative foreign earnings. As a result of these items, our net income decreasedincreased by $150$198 million.
For 2017, the Company reported earnings of $4.25 per diluted share, which includes after-tax restructuring and other related charges of ($0.48) per share, after-tax transaction-related costs of ($0.23) per share, after-tax debt extinguishment costs of ($0.02) per share, after-tax impairment charge of ($0.01) per share, after-tax reversal of charges for legal matter of $0.10 per share and a net tax benefit from the impact of the Tax Act of $2.51 per share. For 2016, the Company reported earnings of $1.75 per diluted share, which includes after-tax restructuring expenseand
other related charges of ($0.23) per share, after-tax debt extinguishment costs of ($0.18) per share, after-tax charges for legal matter of ($0.17) per share and after-tax transaction-related costs, net, of ($0.17) per share. For 2015, the Company reported earnings of $2.98 per diluted share, which includes after-tax transaction-related costs, net, of ($0.52) per share, after-tax debt extinguishment costs of ($0.13) per share, after-tax restructuring expense of ($0.12) per share and an income tax benefit related to resolution of prior-year tax matter of $0.93 per share.
In the year ended December 31, 2016:
Operating expenses increased to 50.6% of revenue compared to 50.4% in the prior year.
Vehicle depreciation and lease charges increased to 23.6% of revenue from 22.7% in 2015, due to higher per-unit fleet costs and lower pricing.
Selling, general and administrative costs were 13.1% of revenue compared to 12.9% in 2015.
Vehicle interest costs were 3.3% of revenue compared to 3.4% in the prior year.
Following is a more detailed discussion of the results of each of our reportable segments:
| | | | | | Revenues | | Adjusted EBITDA | | | 2017 | | 2016 |
| | | | 2016 | | 2015 | | % Change | | 2016 | | 2015 | | % Change | | | Revenues | | Adjusted EBITDA | | Revenues | | Adjusted EBITDA |
| Americas | Americas | $ | 6,121 |
| | $ | 6,069 |
| | 1 | % | | $ | 633 |
| | $ | 682 |
| | (7 | %) | Americas | $ | 6,100 |
| | $ | 486 |
| | $ | 6,121 |
| | $ | 633 |
|
| International | International | 2,538 |
| | 2,433 |
| | 4 | % | | 273 |
| | 277 |
| | (1 | %) | International | 2,748 |
| | 305 |
| | 2,538 |
| | 273 |
|
Corporate and Other (a) | Corporate and Other (a) | — |
| | — |
| | * |
| | (68 | ) | | (56 | ) | | * |
| Corporate and Other (a) | — |
| | (56 | ) | | — |
| | (68 | ) |
| | Total Company | $ | 8,659 |
| | $ | 8,502 |
| | 2 | % | | 838 |
| | 903 |
| | (7 | %) | Total Company | $ | 8,848 |
| | $ | 735 |
| | $ | 8,659 |
| | $ | 838 |
|
| | | | | | | | | | | | | | | | | | | | | |
| Less: | Non-vehicle related depreciation and amortization (b) | | 253 |
| | 218 |
| | | |
| | | | Reconciliation of net income to Adjusted EBITDA |
| | | | | | | | 2017 | | 2016 |
| Net income | | Net income | | $ | 361 |
| | $ | 163 |
|
| Provision for (benefit from) income taxes | | Provision for (benefit from) income taxes | | (150 | ) | | 116 |
|
| Income before income taxes | | Income before income taxes | | 211 |
| | 279 |
|
| | | | | | | | |
| Add: | | Add: | Non-vehicle related depreciation and amortization | | 259 |
| | 253 |
|
| | | Interest expense related to corporate debt, net: | | | | | | | | Interest expense related to corporate debt, net: | | | | |
| | | Interest expense | | 203 |
| | 194 |
| | | | Interest expense | | 188 |
| | 203 |
|
| | | Early extinguishment of debt | | 27 |
| | 23 |
| | | | Early extinguishment of debt | | 3 |
| | 27 |
|
| | | Restructuring expense | | 29 |
| | 18 |
| | | | Restructuring and other related charges(b) | | 63 |
| | 29 |
|
| | | Transaction-related costs, net (c) | | 21 |
| | 68 |
| | | | Transaction-related costs, net (c) | | 23 |
| | 21 |
|
| | | Charges for legal matter (d) | | 26 |
| | — |
| | | | Impairment (d) | | 2 |
| | — |
|
| Income before income taxes | | $ | 279 |
| | $ | 382 |
| | | |
| | | | Charges for legal matter, net (e) | | (14 | ) | | 26 |
|
| Adjusted EBITDA | | Adjusted EBITDA | | $ | 735 |
| | $ | 838 |
|
__________
| |
(a) | Includes unallocated corporate overhead which is not attributable to a particular segment. |
| |
(b) | AmortizationOther related charges include costs associated with the separation of acquisition-related intangible assets was $59 million in 2016certain officers of the Company and $55 million in 2015.our limited voluntary opportunity plans. |
| |
(c) | Primarily comprised of acquisition- and integration-related expenses. |
| |
(d) | Reported within operating expenses inImpairment charge is related to our consolidated statement of operations. |
|
| | | | | | | | | | | |
| | | 2016 | | 2015 | | % Change |
| Revenue | | $ | 6,121 |
| | $ | 6,069 |
| | 1 | % |
| Adjusted EBITDA | | 633 |
| | 682 |
| | (7 | %) |
Revenues increased 1% in 2016 compared with 2015, primarily due to 1% growth in rental volumes, partially offset by a $15 million negative impact from currency exchange rate movements. Pricing was essentially unchanged year-over-year.
Adjusted EBITDA decreased 7% in 2016 compared with 2015, primarily due to a 5% increase in per-unit fleet costs and a $5 million (1%) negative impact from currency exchange rate changes, partially offset by increased rental volumes.
In the year ended December 31, 2016:
Operating expenses increased to 49.6% of revenue compared to 49.3% in 2015.
Vehicle depreciation and lease charges increased to 25.5% of revenue from 24.3% in 2015, principally due to higher per-unit fleet costs.
Selling, general and administrative costs were 11.3% of revenue compared to 11.2% in the prior year.
Vehicle interest costs were 3.7% of revenue compared to 3.9% in the prior year.
|
| | | | | | | | | | | |
| | | 2016 | | 2015 | | % Change |
| Revenue | | $ | 2,538 |
| | $ | 2,433 |
| | 4 | % |
| Adjusted EBITDA | | 273 |
| | 277 |
| | (1 | %) |
Revenues increased 4% during 2016 compared with 2015, primarily due to an 8% increase in rental volumes, partially offset by a 5% decrease in pricing (including a 2% negative impact from currency exchange rate changes). Currency movements negatively impacted revenues by $46 million (2%) year-over-year.
Adjusted EBITDA declined 1% in 2016 compared with 2015, due to lower pricing, a $23 million (8%) negative impact from currency exchange rate changes and increased marketing costs and commissions, partially offset by an increase in rental volumes.
In the year ended December 31, 2016:
Operating expenses were 52.6% of revenue compared to 52.7% in 2015.
Vehicle depreciation and lease charges increased to 19.2% of revenue from 18.7% in the prior year, primarily due to lower pricing, partially offset by a 1% decrease in per-unit fleet costs (including a 2% favorable impact from currency exchange rate changes).
Selling, general and administrative costs were 15.1% of revenue compared to 14.9% in the prior year.
Vehicle interest costs were 2.3% of revenue compared to 2.2% in the prior year.
Corporate and Other |
| | | | | | | | | | |
| | | 2016 | | 2015 | | % Change |
| Revenue | | $ | — |
| | $ | — |
| | * |
| Adjusted EBITDA | | (68 | ) | | (56 | ) | | * |
__________
Adjusted EBITDA decreased $12 million in 2016 compared with 2015, primarily due to higher selling, general and administrative expenses which are not attributable to a particular segment.
Year Ended December 31, 2015 vs. Year Ended December 31, 2014
Our consolidated results of operations comprised the following:
|
| | | | | | | | | | | | | | | | | |
| | | | | Year Ended
December 31, | | | | |
| | | | | 2015 | | 2014 | | Change | | % Change |
| Revenues | | | | | | | |
| | Vehicle rental | $ | 6,026 |
| | $ | 6,026 |
| | $ | 0 |
| | 0 | % |
| | Other | 2,476 |
| | 2,459 |
| | 17 |
| | 1 | % |
| Net revenues | 8,502 |
| | 8,485 |
| | 17 |
| | 0 | % |
| | | | | | | | | | | |
| Expenses | | | | | | | |
| | Operating | 4,284 |
| | 4,251 |
| | 33 |
| | 1 | % |
| | Vehicle depreciation and lease charges, net | 1,933 |
| | 1,996 |
| | (63 | ) | | (3 | %) |
| | Selling, general and administrative | 1,093 |
| | 1,080 |
| | 13 |
| | 1 | % |
| | Vehicle interest, net | 289 |
| | 282 |
| | 7 |
| | 2 | % |
| | Non-vehicle related depreciation and amortization | 218 |
| | 180 |
| | 38 |
| | 21 | % |
| | Interest expense related to corporate debt, net: | | | | | | | |
| | | Interest expense | 194 |
| | 209 |
| | (15 | ) | | (7 | %) |
| | | Early extinguishment of debt | 23 |
| | 56 |
| | (33 | ) | | (59 | %) |
| | Transaction-related costs, net | 68 |
| | 13 |
| | 55 |
| | * |
|
| | Restructuring expense | 18 |
| | 26 |
| | (8 | ) | | (31 | %) |
| Total expenses | 8,120 |
| | 8,093 |
| | 27 |
| | 0 | % |
| | | | | | | | | | | |
| Income before income taxes | 382 |
| | 392 |
| | (10 | ) | | (3 | %) |
| Provision for income taxes | 69 |
| | 147 |
| | (78 | ) | | (53 | %) |
| | | | | | | | |
| Net income | $ | 313 |
| | $ | 245 |
| | $ | 68 |
| | 28 | % |
__________
During 2015, our net revenues increased as a result of a 7% increase in total rental days (5% excluding Maggiore), largely offset by a 7% (6%, excluding Maggiore) decrease in pricing (including a 5% negative impact from currency exchange rate movements). Currency movements negatively impacted revenues by $444 million (5%) year-over-year.
Total expenses increased as a result of increased volumes, a 7% increase in our car rental fleet (4% excluding Maggiore) and transaction-related costs, net, primarily associated with the acquisitions of Scandinavia and Brazil, most of which were non-cash expenses. This increase was largely offset by a favorable impact from currency exchange rate movements of approximately $418 million (5%). Our effective tax rates were a provision of 18% and 38% in 2015 and 2014, respectively, which includes a $98 million income tax benefit related to the resolution of a prior-year tax matter for 2015. As a result of these items, our net income increased by $68 million.
For 2015, the Company reported earnings of $2.98 per diluted share, which includes after-tax transaction-related costs, net, of ($0.52) per share, after-tax debt extinguishment costs of ($0.13) per share, after-tax restructuring expense of ($0.12) per share and an income tax benefit related to resolution of prior-year tax matter of $0.93 per share. For 2014, the Company reported earnings of $2.22 per diluted share, which includes after-tax debt extinguishment costs of ($0.31) per share, after-tax restructuring expense of ($0.16) per share and after-tax transaction costs, net, of ($0.08) per share.
In the year ended December 31, 2015:
Operating expenses increased to 50.4% of revenue from 50.1% in the prior year.
Vehicle depreciation and lease charges decreased to 22.7% of revenue from 23.5% in 2014, principally due to 10% lower per-unit fleet costs (including a 5% favorable impact from currency exchange rate movements).
Selling, general and administrative costs were 12.9% of revenue compared to 12.7% in 2014.
Vehicle interest costs were 3.4% of revenue compared to 3.3% in the prior year.
Following is a more detailed discussion of the results of each of our reportable segments:
|
| | | | | | | | | | | | | | | | | | | | | | | | |
| | | | | Revenues | | Adjusted EBITDA |
| | | | | 2015 | | 2014 | | % Change | | 2015 | | 2014 | | % Change |
| Americas | $ | 6,069 |
|
| $ | 5,961 |
| | 2 | % | | $ | 682 |
|
| $ | 656 |
| | 4 | % |
| International | 2,433 |
|
| 2,524 |
| | (4 | %) | | 277 |
|
| 280 |
| | (1 | %) |
Corporate and Other (a) | — |
| | — |
| | * |
| | (56 | ) | | (60 | ) | | * |
|
| | Total Company | $ | 8,502 |
|
| $ | 8,485 |
|
| 0 | % |
| 903 |
|
| 876 |
| | 3 | % |
| | | | | | | | | | | | | | | |
| Less: | Non-vehicle related depreciation and amortization (b) | | 218 |
| | 180 |
| | |
| | | Interest expense related to corporate debt, net: | | | | | | |
| | | | Interest expense | | 194 |
| | 209 |
| | |
| | | | Early extinguishment of debt | | 23 |
| | 56 |
| | |
| | | Transaction-related costs, net (c) |
| 68 |
| | 13 |
| | |
| | | Restructuring expense | | 18 |
| | 26 |
| | |
| Income before income taxes | | $ | 382 |
| | $ | 392 |
| | |
__________
| |
* | Not meaningfulZipcar trademark. |
| |
(a)(e)
| Includes unallocated corporate overhead which is not attributable to a particular segment. |
| |
(b)
| AmortizationReported within operating expenses in our consolidated results of acquisition-related intangible assets increased to $55 million in 2015 from $33 million in 2014. |
| |
(c)
| Primarily comprised of acquisition- and integration-related expenses.operations. |
| | | | | 2015 | | 2014 | | % Change | | 2017 | | 2016 | | % Change |
| Revenue | | $ | 6,069 |
| | $ | 5,961 |
| | 2 | % | |
| Revenues | | | $ | 6,100 |
| | $ | 6,121 |
| | — | % |
| Adjusted EBITDA | | 682 |
| | 656 |
| | 4 | % | | 486 |
| | 633 |
| | (23 | %) |
Revenues increased 2%decreased in 20152017 compared with 2014,2016, primarily due to 4%a 1% reduction in time & mileage revenue per day, partially offset by 2% growth in rental volumes, partially offset by a 2% decrease in pricing (including a 1% negative impact from currency exchange rate movements).volumes. Currency movements negatively impactedincreased revenues by $59$9 million (1%) year-over-year.
Adjusted EBITDA increased 4% in 2015 compared with 2014, due to increased rental volumes and 4% lower per-unit fleet costs (including a 1% favorable impact from currency exchange rate movements), partially offset by decreased pricing, higher maintenance and damage and insurance costs. Currency movements negatively impacted Adjusted EBITDA by $7 million (1%) year-over-year.
In the year ended December 31, 2015:
Operating expenses were 49.3%decreased to 49.4% of revenue during 2017 compared to 49.1%49.6% in 2014.
2016. Vehicle depreciation and lease charges decreasedincreased to 24.3%27.4% of revenue from 25.0%during 2017 compared to 25.5% in 2014, principally2016, primarily due to lowera 6% increase in per-unit fleet costs.
costs, partially offset by higher utilization. Selling, general and administrative costs, increased to 11.2%at 11.3% of revenue from 10.9% in the prior year.
during 2017, remained level compared to 2016. Vehicle interest costs, at 3.9%3.7% of revenue during 2017, remained level compared to the prior year.2016.
Adjusted EBITDA decreased 23% in 2017 compared with 2016, due to higher per-unit fleet costs, lower revenues and higher marketing commissions, partially offset by cost mitigating actions and higher utilization.
| | | | | 2015 | | 2014 | | % Change | | 2017 | | 2016 | | % Change |
| Revenue | | $ | 2,433 |
| | $ | 2,524 |
| | (4 | %) | |
| Revenues | | | $ | 2,748 |
| | $ | 2,538 |
| | 8 | % |
| Adjusted EBITDA | | 277 |
| | 280 |
| | (1 | %) | | 305 |
| | 273 |
| | 12 | % |
Revenues decreased 4%increased 8% during 20152017 compared with 2014,2016, primarily due to a 19% (18% excluding Maggiore) decrease in pricing (including a 15% negative impact from currency exchange rate movements) partially offset by an 18%12% increase in rental volumes, (9% excluding Maggiore)including a 7% benefit from FranceCars which was acquired in December 2016, partially offset by a 2% reduction in time & mileage revenue per day (including a 1% favorable effect from currency movements). Currency movements negatively impactedincreased revenues by $385 million (15%) year-over-year. Excluding Maggiore, total revenue per rental day decreased 16% (including a 15% negative impact from currency exchange rate movements).
Adjusted EBITDA declined 1% in 2015 compared with 2014, due to lower pricing and a $42 million (15%) negative impact from currency exchange rate changes, partially offset by an increase in rental volumes, 23% lower per-unit fleet costs (including a 14% favorable impact from currency exchange rate movements) and the acquisitions of Maggiore and Scandinavia.
In the year ended December 31, 2015:
$49 million.
Operating expenses increased towere 52.7% of revenue during 2017 compared to 52.0%52.6% in 2014, primarily due to lower pricing and higher insurance costs, partially offset by increased rental volumes.
2016. Vehicle depreciation and lease charges decreasedincreased to 18.7%20.0% of revenue from 20.0%during 2017 compared to the prior year, driven by19.2% in 2016, primarily due to lower per-unit fleet costs.
time & mileage revenue per day. Selling, general and administrative costs decreasedwere reduced to 14.9%14.1% of revenue during 2017 compared to 15.0%15.1% in the prior year.
2016, primarily due to increased revenues and cost mitigating actions, partially offset by higher marketing commissions. Vehicle interest costs increased towere 2.2% of revenue during 2017 compared to 1.9%2.3% in the prior year.2016.
Adjusted EBITDA increased 12% in 2017 compared with 2016, due to increased revenues and cost mitigating actions, partially offset by higher marketing commissions. Currency movements increased Adjusted EBITDA by $24 million.
| | | | | 2015 | | 2014 | | % Change | | 2017 | | 2016 | | % Change |
| Revenue | | $ | — |
| | $ | — |
| | * | |
| Revenues | | | $ | — |
| | $ | — |
| | n/m |
| Adjusted EBITDA | | (56 | ) | | (60 | ) | | * | | (56 | ) | | (68 | ) | | n/m |
__________
Adjusted EBITDA increased $4$12 million in 20152017 compared with 2014,2016, primarily due to lower selling, general and administrative expenses which are not attributable to a particular segment.
|
|
| FINANCIAL CONDITION, LIQUIDITY AND CAPITAL RESOURCES |
We present separately the financial data of our vehicle programs. These programs are distinct from our other activities as the assets under vehicle programs are generally funded through the issuance of debt that is collateralized by such assets. The income generated by these assets is used, in part, to repay the principal and interest associated with the debt. Cash inflows and outflows relating to the generation or acquisition of such assets and the principal debt repayment or financing of such assets are classified as activities of our vehicle programs. We believe it is appropriate to segregate the financial data of our vehicle programs because, ultimately, the source of repayment of such debt is the realization of such assets.
FINANCIAL CONDITION
| | | | As of December 31, | | | As of December 31, | | |
| | 2016 | | 2015 | | Change | 2018 | | 2017 | | Change |
| Total assets exclusive of assets under vehicle programs | $ | 6,065 |
| | $ | 5,918 |
| | $ | 147 |
| $ | 6,370 |
| | $ | 5,820 |
| | $ | 550 |
|
| Total liabilities exclusive of liabilities under vehicle programs | 5,775 |
| | 5,680 |
| | 95 |
| 6,011 |
| | 5,935 |
| | 76 |
|
| Assets under vehicle programs | 11,578 |
| | 11,716 |
| | (138 | ) | 12,779 |
| | 11,879 |
| | 900 |
|
| Liabilities under vehicle programs | 11,647 |
| | 11,515 |
| | 132 |
| 12,724 |
| | 11,191 |
| | 1,533 |
|
| Stockholders’ equity | 221 |
| | 439 |
| | (218 | ) | 414 |
| | 573 |
| | (159 | ) |
Total assets exclusive of assets under vehicle programs increased 2% compared to 2015.2017 primarily due to an increase in deferred income taxes from the Tax Act and an increase in other current assets (See Note 9 to our
Consolidated Financial Statements). Total liabilities exclusive of liabilities under vehicle programs increased by 2% (see “Liquidity and Capital Resources—Debt and Financing Arrangements” regarding the changes in our corporate financings).was substantially unchanged compared to 2017.
Assets under vehicle programs decreased by 1% compared to 2015, and liabilities under vehicle programs increased by 1%.
compared to 2017 primarily due to an increase in the size of our vehicle rental fleet. The decrease in stockholders’ equity is primarily due to the repurchaseour repurchases of our common stock and the adoption of ASU 2014-09, “Revenue from Contracts with Customers (Topic 606),” (See Note 2 to our Consolidated Financial Statements), partially offset by our net income.
LIQUIDITY AND CAPITAL RESOURCES
Overview
Our principal sources of liquidity are cash on hand and our ability to generate cash through operations and financing activities, as well as available funding arrangements and committed credit facilities, each of which is discussed below.
During 2016,2018, we amended the terms of our Floating Rate Term Loan due 2022 and our Senior revolving credit facility maturing 2021 and extended the maturity to 2025 and 2023, respectively. In addition, our Avis Budget Rental Car Funding subsidiary issued $350approximately $400 million and $550 million in asset-backed notes with an expected final payment date of 6⅜% Senior Notes dueSeptember 2023 and March 2024, at par.respectively, and a weighted average interest rate of 4%. The proceeds from these borrowings were used to redeem $300 million principal amountfund the repayment of our 4⅞% Senior Notes due 2017 during second quarter 2016maturing vehicle-backed debt and for general corporate purposes.the acquisition of rental cars in the United States. We also issued €300increased our capacity under our European rental fleet securitization program by €150 million of 4⅛% Euro-denominated Senior Notes due 2024,(approximately $175 million), the proceeds of which were used primarilyto finance fleet purchases for certain of our European operations, and extended its maturity to 2021. We issued €350 million of 4¾% euro-denominated Senior Notes due January 2026 at par. The proceeds from this borrowing were used to redeem a portionall of our outstanding 6% Euro-denominated5⅛% euro-denominated Senior Notes due 2021. In addition, weJune 2022. We repurchased approximately 12.35.9 million shares of our outstanding common stock for approximately $390$200 million during 2016.2018.
Cash Flows
Year Ended December 31, 20162018 vs. Year Ended December 31, 20152017
The following table summarizes our cash flows:
| | | | Year Ended December 31, | | | Year Ended December 31, | | |
| | 2016 | | 2015 | | Change | 2018 | | 2017 | | Change |
| Cash provided by (used in): | | | | | | | | | | |
| Operating activities | $ | 2,629 |
| | $ | 2,584 |
| | $ | 45 |
| $ | 2,609 |
| | $ | 2,648 |
| | $ | (39 | ) |
| Investing activities | (2,149 | ) | | (2,830 | ) | | 681 |
| (3,426 | ) | | (2,204 | ) | | (1,222 | ) |
| Financing activities | (438 | ) | | 115 |
| | (553 | ) | 667 |
| | (308 | ) | | 975 |
|
| Effects of exchange rate changes | (4 | ) | | (41 | ) | | 37 |
| (16 | ) | | 45 |
| | (61 | ) |
| Net change in cash and cash equivalents | 38 |
| | (172 | ) | | 210 |
| |
| Cash and cash equivalents, beginning of period | 452 |
| | 624 |
| | (172 | ) | |
| Cash and cash equivalents, end of period | $ | 490 |
| | $ | 452 |
| | $ | 38 |
| |
| Net change in cash and cash equivalents, program and restricted cash | | (166 | ) | | 181 |
| | (347 | ) |
| Cash and cash equivalents, program and restricted cash, beginning of period | | 901 |
| | 720 |
| | 181 |
|
| Cash and cash equivalents, program and restricted cash, end of period | | $ | 735 |
| | $ | 901 |
| | $ | (166 | ) |
Cash provided by operating activities during 2016 increased 2%2018 was substantially unchanged compared with 2015.2017.
The increase in cash used in investing activities during 2018 compared with 2017 is primarily due to increases in investment in vehicles and business acquisition activity.
The decrease in cash used in investing activities during 2016 compared with 2015 is primarily due to a net decrease in investment in vehicles and reduced business acquisition activity.
The increase in cash used in financing activities during 20162018 compared with 2015 is2017 primarily due to an increasereflects a decrease in net payments under vehicle programs.
We anticipate that our non-vehicle property and equipment additions will be approximately $210$235 million in 2017. As of December 31, 2016, we had approximately $300 million of authorized share repurchase capacity. We currently anticipate that we will utilize most of such capacity to repurchase common stock in 2017.2019.
Year Ended December 31, 20152017 vs. Year Ended December 31, 20142016
The following table summarizes our cash flows:
| | | | Year Ended December 31, | | | Year Ended December 31, | | |
| | 2015 | | 2014 | | Change | 2017 | | 2016 | | Change |
| Cash provided by (used in): | | | | | | | | | | |
| Operating activities | $ | 2,584 |
| | $ | 2,579 |
| | $ | 5 |
| $ | 2,648 |
| | $ | 2,640 |
| | $ | 8 |
|
| Investing activities | (2,830 | ) | | (2,807 | ) | | (23 | ) | (2,204 | ) | | (2,182 | ) | | (22 | ) |
| Financing activities | 115 |
| | 182 |
| | (67 | ) | (308 | ) | | (449 | ) | | 141 |
|
| Effects of exchange rate changes | (41 | ) | | (23 | ) | | (18 | ) | 45 |
| | (6 | ) | | 51 |
|
| Net change in cash and cash equivalents | (172 | ) | | (69 | ) | | (103 | ) | |
| Cash and cash equivalents, beginning of period | 624 |
| | 693 |
| | (69 | ) | |
| Cash and cash equivalents, end of period | $ | 452 |
| | $ | 624 |
| | $ | (172 | ) | |
| Net change in cash and cash equivalents, program and restricted cash | | 181 |
| | 3 |
| | 178 |
|
| Cash and cash equivalents, program and restricted cash, beginning of period | | 720 |
| | 717 |
| | 3 |
|
| Cash and cash equivalents, program and restricted cash, end of period | | $ | 901 |
| | $ | 720 |
| | $ | 181 |
|
Cash provided by operating activities during 2017 was substantially unchanged during 2015 compared with 2014.2016.
Cash used in investing activities during 2017 was substantially unchanged during 2015 compared with 2014.2016.
The decrease in cash provided byused in financing activities in 2015during 2017 compared with 2014 is2016 primarily due to an increasereflects a decrease in our stock repurchases.repurchases of common stock.
Debt and Financing Arrangements
At December 31, 2016,2018, we had approximately $12.4$13.8 billion of indebtedness (including corporate indebtedness of approximately $3.5$3.6 billion and debt under vehicle programs of approximately $8.9$10.2 billion). We use various hedging strategies, including derivative instruments, to manage a portion of the risks associated with our floating rate debt.
Corporate indebtedness consisted of:
|
| | | | | | | | | | | | | |
| | | | As of December 31, | | |
| | Maturity Date | | 2016 | | 2015 | | Change |
| 4⅞% Senior Notes | November 2017 | | $ | — |
| | $ | 300 |
| | $ | (300 | ) |
Floating Rate Senior Notes (a) | December 2017 | | 249 |
| | 249 |
| | — |
|
Floating Rate Term Loan (b) | March 2019 | | 144 |
| | 970 |
| | (826 | ) |
| 6% Euro-denominated Senior Notes | March 2021 | | 194 |
| | 502 |
| | (308 | ) |
Floating Rate Term Loan (c) | March 2022 | | 816 |
| | — |
| | 816 |
|
| 5⅛% Senior Notes | June 2022 | | 400 |
| | 400 |
| | — |
|
| 5½% Senior Notes | April 2023 | | 675 |
| | 674 |
| | 1 |
|
| 6⅜% Senior Notes | April 2024 | | 350 |
| | — |
| | 350 |
|
| 4⅛% Euro-denominated Senior Notes | November 2024 | | 316 |
| | — |
| | 316 |
|
| 5¼% Senior Notes | March 2025 | | 375 |
| | 375 |
| | — |
|
Other (d) | | | 57 |
| | 46 |
| | 11 |
|
| Deferred financing fees | | | (53 | ) | | (55 | ) | | 2 |
|
| Total | | | $ | 3,523 |
| | $ | 3,461 |
| | $ | 62 |
|
__________
| |
(a)
| The interest rate on these notes is equal to three-month LIBOR plus 275 basis points, for an aggregate rate of 3.68% at December 31, 2016; the Company has entered into an interest rate swap to hedge its interest rate exposure related to these notes at an aggregate rate of 3.58%.
|
| |
(b)
| The floating rate term loan is part of the Company’s senior revolving credit facility, which is secured by pledges of capital stock of certain subsidiaries of the Company, and liens on substantially all of the Company’s intellectual property and certain other real and personal property. As of December 31, 2016, the floating rate term loan due 2019 bears interest at the greater of three-month LIBOR or 0.75%, plus 225 basis points, for an aggregate rate of 3.25%.
|
| |
(c)
| The floating rate term loan is part of the Company’s senior credit facility, which is secured by pledges of capital stock of certain subsidiaries of the Company, and liens on substantially all of the Company’s intellectual property and certain other real and personal property. As of December 31, 2016, the floating rate term loan due 2022 bears interest at the greater of three-month LIBOR or 0.75%, plus 250 basis points, for an aggregate rate of 3.50%. The Company has entered into a swap to hedge $600 million of its interest rate exposure related to the floating rate term loan at an aggregate rate of 4.21%.
|
| |
(d)
| Primarily includes capital leases that are secured by liens on the related assets.
|
The following table summarizes the components ofFor detailed information regarding our debt under vehicle programs, including related party debt due to Avis Budget Rental Car Funding:
|
| | | | | | | | | | | |
| | As of December 31, | | |
| | 2016 | | 2015 | | Change |
| Americas – Debt due to Avis Budget Rental Car Funding | $ | 6,733 |
| | $ | 6,837 |
| | $ | (104 | ) |
| Americas – Debt borrowings | 577 |
| | 643 |
| | (66 | ) |
International – Debt borrowings (a) | 1,449 |
| | 1,187 |
| | 262 |
|
| International – Capital leases | 162 |
| | 238 |
| | (76 | ) |
| Other | 7 |
| | 8 |
| | (1 | ) |
Deferred financing fees (b) | (50 | ) | | (53 | ) | | 3 |
|
| Total | $ | 8,878 |
| | $ | 8,860 |
| | $ | 18 |
|
__________
| |
(a)
| The increase reflects additional borrowings principally to fund increases in the Company's car rental fleet and to replace capital lease financing. |
| |
(b)
| Deferred financing fees related to Debt due to Avis Budget Rental Car Funding as of December 31, 2016 and 2015 were $38 million and $41 million, respectively.
|
The following table provides the contractual maturities for our corporate debt and our debt under vehicle programs, including related party debt due to Avis Budget Rental Car Funding, at December 31, 2016:
|
| | | | | | | |
| | Corporate Debt | | Debt under Vehicle Programs |
| Due in 2017 | $ | 279 |
| | $ | 1,094 |
|
| Due in 2018 | 17 |
| | 2,508 |
|
| Due in 2019 | 158 |
| | 2,613 |
|
| Due in 2020 | 12 |
| | 1,618 |
|
| Due in 2021 | 205 |
| | 950 |
|
| Thereafter | 2,905 |
| | 145 |
|
| | $ | 3,576 |
| | $ | 8,928 |
|
At December 31, 2016, we had approximately $4.6 billion of available funding under our various financingborrowing arrangements, (comprised of $1.0 billion of availability under our committed credit facilities and approximately $3.6 billion available for use in our vehicle programs). As of December 31, 2016, the committed non-vehicle-backed credit facilities available to us and/or our subsidiaries included:
|
| | | | | | | | | | | | | | | |
| | Total Capacity | | Outstanding Borrowings | | Letters of Credit Issued | | Available Capacity |
Senior revolving credit facility maturing 2021 (a) | $ | 1,800 |
| | $ | — |
| | $ | 753 |
| | $ | 1,047 |
|
Other credit facilities (b) | 5 |
| | 5 |
| | — |
| | — |
|
__________
| |
(a)
| The senior revolving credit facility bears interest at one-month LIBOR plus 200 basis points and is part of the Company’s senior credit facility, which is secured by pledges of capital stock of certain subsidiaries of the Company, and liens on substantially all of the Company’s intellectual property and certain other real and personal property.
|
| |
(b)
| These facilities encompass bank overdraft lines of credit, bearing interest of 1.50% to 3.10% as of December 31, 2016. |
At December 31, 2016, the Company had various other uncommitted credit facilities available, which bear interest at rates of 0.75% to 4.50%, under which it had drawn approximately $5 million.
The following table presents available funding under our debt arrangements related to our vehicle programs, including related party debt due to Avis Budget Rental Car Funding, at December 31, 2016:
|
| | | | | | | | | | | |
| | Total Capacity(a) | | Outstanding Borrowings | | Available Capacity |
Americas – Debt due to Avis Budget Rental Car Funding (b) | $ | 9,083 |
| | $ | 6,733 |
| | $ | 2,350 |
|
Americas – Debt borrowings (c) | 895 |
| | 577 |
| | 318 |
|
International – Debt borrowings (d) | 2,373 |
| | 1,449 |
| | 924 |
|
International – Capital Leases (e) | 194 |
| | 162 |
| | 32 |
|
| Other | 7 |
| | 7 |
| | — |
|
| Total | $ | 12,552 |
| | $ | 8,928 |
| | $ | 3,624 |
|
__________
| |
(a)
| Capacity is subject to maintaining sufficient assets to collateralize debt. |
| |
(b)
| The outstanding debt is collateralized by $8.2 billion of underlying vehicles and related assets. |
| |
(c)
| The outstanding debt is collateralized by $0.8 billion of underlying vehicles and related assets. |
| |
(d)
| The outstanding debt is collateralized by $1.9 billion of underlying vehicles and related assets. |
| |
(e)
| The outstanding debt is collateralized by $0.2 billion of underlying vehicles and related assets. |
The significant terms for our outstanding debt instruments, credit facilities and available funding arrangements as of December 31, 2016, can be found insee Notes 12 and 13 to our Consolidated Financial Statements.
Our primary liquidity needs include the payment of operating expenses, servicing of corporate and vehicle-related debt and procurement of rental vehicles to be used in our operations.operations, servicing of corporate and vehicle-related debt and the payment of operating expenses. The present intention of management is to reinvest the undistributed earnings of the Company’sour foreign subsidiaries indefinitely into itsour foreign operations. We do not anticipate the need to repatriate foreign earnings to the United States to service corporate debt or for other U.S. needs. Our primary sources of funding are operating revenue, cash received upon the sale of vehicles, borrowings under our vehicle-backed borrowing arrangements and our senior revolving credit facility, and other financing activities.
As discussed above, as of December 31, 2016,2018, we have cash and cash equivalents of $490 million,$0.6 billion, available borrowing capacity under our committed credit facilities of $1.0$0.6 billion, and available capacity under our vehicle programs of approximately $3.6$2.8 billion. In 2016, the Company’s Board of Directors increased the Company’s share repurchase program authorization by a total of $550 million.
Our liquidity position could be negatively affected by financial market disruptions or a downturn in the U.S. and worldwide economies, which may result in unfavorable conditions in the vehicle rentalmobility industry, in the asset-backed financing market and in the credit markets, generally. We believe these factors have in the past affected and could in the future affect the debt ratings assigned to us by credit rating agencies and the cost of our borrowings. Additionally, a downturn in the worldwide economy or a disruption in the credit markets could impact our liquidity due to (i) decreased demand and pricing for vehicles in the used vehicle market, (ii) increased costs associated with, and/or reduced capacity or increased collateral needs under, our financings, (iii) the adverse impact of vehicle manufacturers including Ford, General Motors, Chrysler, Peugeot, Kia, Volkswagen, Fiat, Mercedes, Toyota and Volvo, being unable or unwilling to honor their obligations to repurchase or guarantee the depreciation on the related program vehicles and (iv) disruption in our ability to obtain financing due to negative credit events specific to us or affecting the overall debt market (see Item 1A. Risk Factors for further discussion).
Our liquidity position could also be negatively impacted if we are unable to remain in compliance with the financial and other covenants associated with our senior revolving credit facility and other borrowings, including a
maximum leverage ratio. As of December 31, 2016,2018, we were in compliance with the financial covenants governing our indebtedness.
CONTRACTUAL OBLIGATIONS
The following table summarizes our principal future contractual obligations as of December 31, 2016:2018:
| | | | 2017 | | 2018 | | 2019 | | 2020 | | 2021 | | Thereafter | | Total | 2019 | | 2020 | | 2021 | | 2022 | | 2023 | | Thereafter | | Total |
| Corporate debt | $ | 279 |
| | $ | 17 |
| | $ | 158 |
| | $ | 12 |
| | $ | 205 |
| | $ | 2,905 |
| | $ | 3,576 |
| $ | 23 |
| | $ | 17 |
| | $ | 16 |
| | $ | 16 |
| | $ | 690 |
| | $ | 2,834 |
| | $ | 3,596 |
|
Debt under vehicle programs | 1,094 |
| | 2,508 |
| | 2,613 |
| | 1,618 |
| | 950 |
| | 145 |
| | 8,928 |
| 1,502 |
| | 3,810 |
| | 2,486 |
| | 947 |
| | 1,086 |
| | 450 |
| | 10,281 |
|
| Debt interest | 386 |
| | 339 |
| | 240 |
| | 193 |
| | 152 |
| | 219 |
| | 1,529 |
| 460 |
| | 404 |
| | 287 |
| | 255 |
| | 187 |
| | 162 |
| | 1,755 |
|
Operating leases (a) | 710 |
| | 473 |
| | 426 |
| | 313 |
| | 174 |
| | 605 |
| | 2,701 |
| 835 |
| | 476 |
| | 345 |
| | 253 |
| | 162 |
| | 590 |
| | 2,661 |
|
Commitments to purchase vehicles (b) | 7,707 |
| | — |
| | — |
| | — |
| | — |
| | — |
| | 7,707 |
| 8,664 |
| | 3 |
| | 1 |
| | — |
| | — |
| | — |
| | 8,668 |
|
Defined benefit pension plan contributions (c) | 11 |
| | — |
| | — |
| | — |
| | — |
| | — |
| | 11 |
| 14 |
| | — |
| | — |
| | — |
| | — |
| | — |
| | 14 |
|
Other purchase commitments (d) | 71 |
| | 34 |
| | 12 |
| | 12 |
| | 11 |
| | 1 |
| | 141 |
| 76 |
| | 43 |
| | 38 |
| | 21 |
| | — |
| | — |
| | 178 |
|
Total (e) | $ | 10,258 |
| | $ | 3,371 |
| | $ | 3,449 |
| | $ | 2,148 |
| | $ | 1,492 |
| | $ | 3,875 |
| | $ | 24,593 |
| $ | 11,574 |
| | $ | 4,753 |
| | $ | 3,173 |
| | $ | 1,492 |
| | $ | 2,125 |
| | $ | 4,036 |
| | $ | 27,153 |
|
__________
| |
(a) | Operating lease obligations are presented net of sublease rentals to be received (see Note 14 to our Consolidated Financial Statements) and include commitments to enter into operating leases. |
| |
(b) | Represents commitments to purchase vehicles, the majority of which are from Ford, Fiat Chrysler and General Motors and Chrysler.Motors. These commitments are generally subject to the vehicle manufacturers satisfying their obligations under the repurchase and guaranteed depreciation agreements. The purchase of such vehicles is generally financed through borrowings under vehicle programs in addition to cash received upon the sale of vehicles, manysome of which were purchased under repurchase and guaranteed depreciation programs (see Note 14 to our Consolidated Financial Statements). |
| |
(c) | Represents the expected contributions to our defined benefit pension plans in 2017.2019. The amount of future contributions to our defined benefit pension plans will depend on the rates of return generated from plan assets and other factors (see Note 17 to our Consolidated Financial Statements) and are not included above. |
| |
(d) | Primarily represents commitments under service contracts for information technology, telecommunications and marketing agreements with travel service companies. |
| |
(e) | Excludes income tax uncertainties of $40$41 million, $15$13 million of which is subject to indemnification by Realogy and Wyndham. We are unable to estimate the period in which these income tax uncertainties are expected to be settled. |
For more information regarding guarantees and indemnifications, see Note 14 to our Consolidated Financial Statements.
ACCOUNTING POLICIES
Critical Accounting Policies
In presenting our financial statements in conformity with GAAP, we are required to make estimates and assumptions that affect the amounts reported therein. Several of the estimates and assumptions we are required to make relate to matters that are inherently uncertain as they pertain to future events and/or events that are outside of our control. If there is a significant unfavorable change to current conditions, it could result in a material adverse impact to our consolidated results of operations, financial position and liquidity. We believe that the estimates and assumptions we used when preparing our financial statements were the most appropriate at that time. Presented below are those accounting policies that we believe require subjective and complex judgments that could potentially affect reported results. However, our businesses operate in environments where we are paid a fee for a service performed, and therefore the results of the majority of our recurring operations are recorded in our financial statements using accounting policies that are not particularly subjective, nor complex.
Goodwill and Other Indefinite-lived Intangible Assets. We have reviewed the carrying value of our goodwill and other indefinite-lived intangible assets for impairment. In performing this review, we are required to make an assessment of fair value for our goodwill and other indefinite-lived intangible assets. When determining fair value, we utilize various assumptions, including the fair market trading price of our common stock and management’s projections of future cash flows. A change in these underlying assumptions will cause a change in the results of the tests and, as such, could cause the fair value to be less than the respective carrying amount. In such event, we would then be required to record a charge, which would impact earnings. We review the carrying value of
goodwill and other indefinite-lived intangible assets for impairment annually, or more frequently if circumstances indicate that an impairment may have occurred.
Our goodwill and other indefinite-lived intangible assets are allocated among our reporting units. During 2016, 20152018, 2017 and 2014,2016, there was no impairment of goodwill orand no material impairment of other intangible assets.assets, see Note 6 to our Consolidated Financial Statements. In the future, failure to achieve our business plans, a significant deterioration of the macroeconomic conditions of the countries in which we operate, or significant changes in the assumptions and estimates that are used in our impairment testing for goodwill and indefinite-lived intangible assets (such as the discount rate) could result in significantly different estimates of fair value that could trigger an impairment of the goodwill or intangible assets of our reporting units.units or intangible assets.
Vehicles. We present vehicles at cost, net of accumulated depreciation, on the Consolidated Balance Sheets. We record the initial cost of the vehicle, net of incentives and allowances from manufactures.manufacturers. We acquire our rental vehicles either through repurchase and guaranteed depreciation programs with certain automobile manufacturers or outside of such programs. For rental vehicles purchased under such programs, we depreciate the vehicles such that the net book value on the date of sale or return to the manufacturers is intended to equal the contractual guaranteed residual values. For risk vehicles, acquired outside of manufacturer repurchase and guaranteed depreciation programs, we depreciate based on the vehicles’ estimated residual market values andat their expected dates of disposition. The estimation of residual values requires the Company to make assumptions regarding the age and mileage of the vehicle at the time of disposal, as well as expected used vehicle market conditions. The Company periodicallyregularly evaluates estimated residual values and adjusts depreciation rates as appropriate. Differences between actual residual values and those estimated result in a gain or loss on disposal and are recorded as part of vehicle depreciation and lease charges, net, at the time of sale. See Note 2 to our Consolidated Financial Statements.
Income Taxes. We account for income taxes under the asset and liability method, which requires the recognition of deferred tax assets and liabilities for the expected future tax consequences of events that have been reflected in the financial statements. Under this method, deferred tax assets and liabilities are determined based on the differences between the financial statement and tax bases of assets and liabilities using enacted tax rates in effect for the year in which the differences are expected to reverse. The effect of a change in tax rates on deferred tax assets and liabilities is recognized in income in the period that includes the enactment date. The Tax Act enacted in the fourth quarter of 2017 included a change in the U.S. federal corporate income tax rate. For more information regarding the accounting for the effects of the Tax Act, see Note 8 of our Consolidated Financial Statements.
We record net deferred tax assets to the extent we believe these assets will more likely than not be realized. In making such determination, we consider all available positive and negative evidence, including scheduled reversals of deferred tax liabilities, projected future taxable income, tax planning strategies and recent results of operations. In the event we were to determine that we would be able to realize deferred income tax assets in the future in excess of their net recorded amount, we would make an adjustment to the valuation allowance which would reduce the provision for income taxes. Currently we do not record valuation allowances on the majority of our tax loss carryforwards as there are adequate deferred tax liabilities that could be realized within the carryforward period.
See Notes 2 and 8 to our Consolidated Financial Statements for more information regarding income taxes.
Public Liability, Property Damage and Other Insurance Liabilities. Insurance liabilities on our Consolidated Balance Sheets include supplemental liability insurance, personal effects protection insurance, public liability, property damage and personal accident insurance claims for which we are self-insured. We estimate the required liability of such claims on an undiscounted basis utilizing an actuarial method that is based upon various assumptions which include, but are not limited to, our historical loss experience and projected loss development factors. The required liability is also subject to adjustment in the future based upon changes in claims experience, including changes in the number of incidents for which we are ultimately liable and changes in the cost per incident.
Adoption of New Accounting Pronouncements
For a description of our adoption of new accounting pronouncements and the impact thereof on our business, see Note 2 to our Consolidated Financial Statements.
Recently Issued Accounting Pronouncements
For a description of recently issued accounting pronouncements and the impact thereof on our business, see Note 2 to our Consolidated Financial Statements.
|
|
| ITEM 7A. QUANTITATIVE AND QUALITATIVE DISCLOSURES ABOUT MARKET RISK |
We are exposed to a variety of market risks, including changes in currency exchange rates, interest rates and gasoline prices. We manage our exposure to market risks through our regular operating and financing activities and, when deemed appropriate, through the use of derivative financial instruments, particularly currency forward contracts to manage and reduce currency exchange rate risk; swap contracts, futures and options contracts, to manage and reduce the interest rate risk related to our debt; currency forward contracts to manage and reduce currency exchange rate risk; and derivative commodity instruments to manage and reduce the risk of changing unleaded gasoline prices.
We are exclusively an end user of these instruments. We do not engage in trading, market-making or other speculative activities in the derivatives markets. We manage our exposure to counterparty credit risk related to our use of derivatives through specific minimum credit standards, diversification of counterparties, and procedures to monitor concentrations of credit risk. Our counterparties are substantial investment and commercial banks with significant experience providing such derivative instruments.
Our total market risk is influenced by a wide variety of factors including the volatility present within the markets and the liquidity of the markets. There are certain limitations inherent in the sensitivity analyses discussed below. These “shock tests” are constrained by several factors, including the necessity to conduct the analysis based on a single point in time and the inability to include the complex market reactions that normally would arise from the market shifts modeled. For additional information regarding our borrowings and financial instruments, see Notes 12, 13 and 18 to our Consolidated Financial Statements.
Currency Risk Management
We have currency rate exposure to currency exchange rate fluctuations worldwide and particularly with respect to the Australian, Canadian and New Zealand dollars, the Euroeuro and British pound sterling. We use currency forward contracts and currency swap contracts to manage exchange rate risk that arises from certain intercompany transactions and from non-functional currency denominated assets and liabilities and earnings denominated in non-U.S. dollar currencies. Our currency forward contracts are often not designated as hedges and therefore
changes in the fair value of these derivatives are recognized in earnings as they occur. We anticipate that such currency exchange rate risk will remain a market risk exposure for the foreseeable future.
We assess our market risk based on changes in currency exchange rates utilizing a sensitivity analysis. The sensitivity analysis measures the potential impact on earnings, cash flows and fair values based on a hypothetical 10% appreciation or depreciation in the value of the underlying currencies being hedged, against the U.S. dollar at December 31, 2016.2018. With all other variables held constant, a hypothetical 10% change (increase or decrease) in currency exchange rates would not have a material impact on our 20162018 earnings. Because unrealized gains or losses related to foreign currency forward and swap contracts are expected to be offset by corresponding gains or losses on the underlying exposures being hedged, when combined, these foreign currency contracts and the offsetting underlying commitments do not create a material impact on our Consolidated Financial Statements.
Interest Rate Risk Management
Our primary interest rate exposure at December 31, 20162018 was interest rate fluctuations in the United States,U.S., specifically LIBOR and commercial paper interest rates due to their impact on variable rate borrowings and other interest rate sensitive liabilities. We use interest rate swaps and caps to manage our exposure to interest rate movements. We anticipate that LIBOR and commercial paper rates will remain a primary market risk exposure for the foreseeable future.
We assess our market risk based on changes in interest rates utilizing a sensitivity analysis. Based on our interest rate exposures and derivatives as of December 31, 2016,2018, we estimate that a 10% change in interest rates would not have a material impact on our 20162018 earnings. Because gains or losses related to interest rate derivatives are expected to be offset by corresponding gains or losses on the underlying exposures being hedged, when combined, these interest rate contracts and the offsetting underlying commitments do not create a material impact on our Consolidated Financial Statements.
Commodity Risk Management
We have commodity price exposure related to fluctuations in the price of gasoline. We anticipate that such commodity risk will remain a market risk exposure for the foreseeable future. We determined that a hypothetical 10% change in the price of gasoline would not have a material impact on our earnings as of December 31, 2016.2018.
|
|
| ITEM 8. FINANCIAL STATEMENTS AND SUPPLEMENTARY DATA |
See Consolidated Financial Statements and Consolidated Financial Statement Index commencing on Page F-1 hereof.
|
|
| ITEM 9. CHANGES IN AND DISAGREEMENTS WITH ACCOUNTANTS ON ACCOUNTING AND FINANCIAL DISCLOSURE |
None.
|
|
| ITEM 9A. CONTROLS AND PROCEDURES |
| |
| (a) | Disclosure Controls and Procedures. Under the supervision and with the participation of our Chief Executive Officer and Chief Financial Officer, our management conducted an evaluation of the effectiveness of our disclosure controls and procedures (as such term is defined in Rules 13a-15(e) and 15d-15(e) under the Securities Exchange Act of 1934, as amended (the “Exchange Act”)). Based on such evaluation, our Chief Executive Officer and Chief Financial Officer have concluded that our disclosure controls and procedures were effective as of the end of the period covered by this annual report. |
| |
| (b) | Management’s Annual Report on Internal Control Over Financial Reporting. Our management is responsible for establishing and maintaining adequate internal control over financial reporting, as defined in Rules 13a-15(f) and 15d-15(f) under the Exchange Act. Our management assessed the effectiveness of our internal control over financial reporting as of December 31, 2016.2018. In making this assessment, management used the criteria set forth by the Committee of Sponsoring Organizations of the Treadway Commission (COSO) in Internal Control - Integrated Framework (2013). Based on this assessment, our management believes that, as of December 31, 2016,2018, our internal control over financial reporting was effective. The effectiveness of the Company’s internal control over financial reporting as of December 31, 2016,2018, has been audited by Deloitte & Touche LLP, an independent registered public accounting firm. Their attestation report is included below. |
Touche LLP, an independent registered public accounting firm. Their attestation report is included below.
| |
| (c) | Changes in Internal Control Over Financial Reporting. During the fiscal quarter to which this report relates, there has been no change in the Company’s internal control over financial reporting (as such term is defined in Rules 13a-15(f) and 15d-15(f) under the Exchange Act) that has materially affected, or is reasonably likely to materially affect, the Company’s internal control over financial reporting. |
REPORT OF INDEPENDENT REGISTERED PUBLIC ACCOUNTING FIRM
To the Stockholders and the Board of Directors and Stockholders of
Avis Budget Group, Inc.
Parsippany, New Jersey
Opinion on Internal Control over Financial Reporting
We have audited the internal control over financial reporting of Avis Budget Group, Inc. and subsidiaries (the "Company") as of December 31, 2016,2018, based on criteria established in Internal Control - Integrated Framework (2013)issued by the Committee of Sponsoring Organizations of the Treadway Commission. Commission (COSO). In our opinion, the Company maintained, in all material respects, effective internal control over financial reporting as of December 31, 2018, based on criteria established in Internal Control - Integrated Framework (2013) issued by COSO.
We have also audited, in accordance with the standards of the Public Company Accounting Oversight Board (United States) (PCAOB), the consolidated financial statements and financial statement schedule as of and for the year ended December 31, 2018 of the Company and our report dated February 21, 2019 expressed an unqualified opinion on those consolidated financial statements and financial statement schedule.
Basis for Opinion
The Company's management is responsible for maintaining effective internal control over financial reporting and for its assessment of the effectiveness of internal control over financial reporting, included in the accompanying Management’s Annual Report on Internal Control over Financial Reporting. Our responsibility is to express an opinion on the Company's internal control over financial reporting based on our audit. We are a public accounting firm registered with the PCAOB and are required to be independent with respect to the Company in accordance with the U.S. federal securities laws and the applicable rules and regulations of the Securities and Exchange Commission and the PCAOB.
We conducted our audit in accordance with the standards of the Public Company Accounting Oversight Board (United States).PCAOB. Those standards require that we plan and perform the audit to obtain reasonable assurance about whether effective internal control over financial reporting was maintained in all material respects. Our audit included obtaining an understanding of internal control over financial reporting, assessing the risk that a material weakness exists, testing and evaluating the design and operating effectiveness of internal control based on the assessed risk, and performing such other procedures as we considered necessary in the circumstances. We believe that our audit provides a reasonable basis for our opinion.
Definition and Limitations of Internal Control over Financial Reporting
A company's internal control over financial reporting is a process designed by, or under the supervision of, the company's principal executive and principal financial officers, or persons performing similar functions, and effected by the company's board of directors, management, and other personnel to provide reasonable assurance regarding the reliability of financial reporting and the preparation of financial statements for external purposes in accordance with generally accepted accounting principles. A company's internal control over financial reporting includes those policies and procedures that (1) pertain to the maintenance of records that, in reasonable detail, accurately and fairly reflect the transactions and dispositions of the assets of the company; (2) provide reasonable assurance that transactions are recorded as necessary to permit preparation of financial statements in accordance with generally accepted accounting principles, and that receipts and expenditures of the company are being made only in accordance with authorizations of management and directors of the company; and (3) provide reasonable assurance regarding prevention or timely detection of unauthorized acquisition, use, or disposition of the company's assets that could have a material effect on the financial statements.
Because of theits inherent limitations, of internal control over financial reporting including the possibility of collusion or improper management override of controls, material misstatements due to error or fraud may not be preventedprevent or detected on a timely basis.detect misstatements. Also, projections of any evaluation of the effectiveness of the internal control over financial reporting to future periods are subject to the risk that the controls may become inadequate because of changes in conditions, or that the degree of compliance with the policies or procedures may deteriorate.
In our opinion, the Company maintained, in all material respects, effective internal control over financial reporting as of December 31, 2016, based on the criteria established in Internal Control - Integrated Framework (2013)issued by the Committee of Sponsoring Organizations of the Treadway Commission.
We have also audited, in accordance with the standards of the Public Company Accounting Oversight Board (United States), the consolidated financial statements and financial statement schedule as of and for the year ended December 31, 2016 of the Company and our report dated February 21, 2017 expressed an unqualified opinion on those consolidated financial statements and financial statement schedule.
/s/ DELOITTE & TOUCHE LLP
New York, New York
February 21, 20172019
|
|
| ITEM 9B. OTHER INFORMATION |
None.
PART III
|
|
| ITEM 10. DIRECTORS, EXECUTIVE OFFICERS AND CORPORATE GOVERNANCE |
The information contained in the Company’s Annual Proxy Statement under the sections titled “Corporate Governance“Election of Directors - BoardBiographical Information for Nominees,” “Election of Directors - Director Nomination Process,” “Corporate Governance - Functions and Meetings of the Board of Directors,” “Corporate Governance - Functions and Meetings of the Board of Directors - Codes of Conduct,” “Corporate Governance - Committees of the Board of Directors,” “Executive Officers” and “Section 16(a) Beneficial Ownership Reporting Compliance” is incorporated herein by reference in response to this item.
|
|
| ITEM 11. EXECUTIVE COMPENSATION |
The information contained in the Company’s Annual Proxy Statement under the section titled “Executive Compensation” is incorporated herein by reference in response to this item.
|
|
| ITEM 12. SECURITY OWNERSHIP OF CERTAIN BENEFICIAL OWNERS AND MANAGEMENT AND RELATED STOCKHOLDER MATTERS |
The information contained in the Company’s Annual Proxy Statement under the section titled “Security Ownership of Certain Beneficial Owners” is incorporated herein by reference in response to this item.
Information concerning our equity compensation plans is included in Part II of this report under the caption “Securities Authorized for Issuance under Equity Compensation Plans.”
|
|
| ITEM 13. CERTAIN RELATIONSHIPS AND RELATED TRANSACTIONS, AND DIRECTOR INDEPENDENCE |
The information contained in the Company’s Annual Proxy Statement under the section titled “Corporate Governance - Related Person Transactions” and “Corporate Governance - Functions and Meetings of the Board of Directors - Director Independence” is incorporated herein by reference in response to this item.
|
|
| ITEM 14. PRINCIPAL ACCOUNTING FEES AND SERVICES |
The information contained in the Company’s Annual Proxy Statement under the section titled “Proposals To Be Voted On At Meeting-Proposal No. 2: Ratification of Appointment of Auditors” is incorporated herein by reference in response to this item.
PART IV
|
|
| ITEM 15. EXHIBITS, FINANCIAL STATEMENT SCHEDULES |
|
|
| ITEM 15(A)(1). FINANCIAL STATEMENTS |
See Consolidated Financial Statements and Consolidated Financial Statements Index commencing on page F-1 hereof.
|
|
| ITEM 15(A)(2). FINANCIAL STATEMENT SCHEDULES |
See Schedule II – Valuation and Qualifying Accounts for the years ended December 31, 2016, 20152018, 2017 and 20142016 commencing on page G-1 hereof.
See Exhibit Index commencing on page H-1 hereof.
SIGNATURES
Pursuant to the requirements of Section 13 or 15(d) of the Securities Exchange Act of 1934, the registrant has duly caused this report to be signed on its behalf by the undersigned, thereunto duly authorized.
|
| | | |
| | AVIS BUDGET GROUP, INC. |
| | | |
| | By: | /s/ DAVID T. CALABRIA |
| | | David T. Calabria |
| | Senior Vice President and Chief Accounting Officer |
| | Date: | February 21, 20172019 |
Pursuant to the requirements of the Securities Exchange Act of 1934, this report has been signed below by the following persons on behalf of the registrant and in the capacities and on the dates indicated. |
| | | | |
| | | | | |
| Signature | | Title | | Date |
| | | |
| /s/ LARRY D. DE SHON | | President, Chief Executive Officer and Director | | February 21, 20172019 |
| (Larry D. De Shon) | | | |
| | | |
/s/ DAVID B. WYSHNERMARTYN SMITH | | President andInterim Chief Financial Officer | | February 21, 20172019 |
(David B. Wyshner)Martyn Smith) | | |
| | | | | |
| /s/ DAVID T. CALABRIA | | Senior Vice President and Chief Accounting Officer | | February 21, 20172019 |
| (David T. Calabria) | | | |
| | | |
/s/ W. ALUN CATHCART | | Director | | February 21, 2017 |
(W. Alun Cathcart) | | |
| | | | |
/s/ BRIAN CHOI | | Director | | February 21, 20172019 |
| (Brian Choi) | | | |
| | | | | |
| /s/ MARY C. CHOKSI | | Director | | February 21, 20172019 |
| (Mary C. Choksi) | | | |
| | | |
| /s/ LEONARD S. COLEMAN, JR. | | DirectorChairman of the Board of Directors | | February 21, 20172019 |
| (Leonard S. Coleman, Jr.) | | | |
| | | |
| /s/ JEFFREY H. FOX | | Director | | February 21, 20172019 |
| (Jeffrey H. Fox) | | | |
| | |
/s/ JOHN D. HARDY, JR. | | Director | | February 21, 2017 |
(John D. Hardy, Jr.) | | | |
| | | |
| /s/ LYNN KROMINGA | | Director | | February 21, 20172019 |
| (Lynn Krominga) | | | |
| | |
| /s/ GLENN LURIE | | Director | | February 21, 2019 |
| (Glenn Lurie) | | | |
| | | |
| /s/ EDUARDO G. MESTRE | | Director | | February 21, 20172019 |
| (Eduardo G. Mestre) | | | |
| | | |
/s/ RONALD L. NELSONJAGDEEP PAHWA | | Executive Chairman of the Board of DirectorsDirector | | February 21, 20172019 |
(Ronald L. Nelson)Jagdeep Pahwa) | | | |
| | | | | |
| /s/ F. ROBERT SALERNO | | Director | | February 21, 20172019 |
| (F. Robert Salerno) | | | |
| | | |
/s/ STENDER E. SWEENEYFRANCIS J. SHAMMO | | Director | | February 21, 20172019 |
(Stender E. Sweeney)Francis J. Shammo) | | | |
| | | | |
| /s/ CARL SPARKS | | Director | | February 21, 2019 |
| (Carl Sparks) | | | |
| | | | | |
| /s/ SANOKE VISWANATHAN | | Director | | February 21, 20172019 |
| (Sanoke Viswanathan) | | | |
INDEX TO CONSOLIDATED FINANCIAL STATEMENTS
REPORT OF INDEPENDENT REGISTERED PUBLIC ACCOUNTING FIRM
To the Stockholders and the Board of Directors and Stockholders of
Avis Budget Group, Inc.
Parsippany, New Jersey
Opinion on the Financial Statements
We have audited the accompanying consolidated balance sheets of Avis Budget Group, Inc. and subsidiaries (the "Company") as of December 31, 20162018 and 2015,2017, and the related consolidated statements of operations, comprehensive income, stockholders' equity, and cash flows for each of the three years in the period ended December 31, 2016. Our audits also included2018, and the financial statementrelated notes and the schedule listed in the Index at Item 15. These consolidated financial statements and financial statement schedule are15 (collectively referred to as the responsibility of the Company's management. Our responsibility is to express an opinion on the consolidated financial statements and financial statement schedule based on our audits.
We conducted our audits in accordance with the standards of the Public Company Accounting Oversight Board (United States)“financial statements”). Those standards require that we plan and perform the audit to obtain reasonable assurance about whether the financial statements are free of material misstatement. An audit includes examining, on a test basis, evidence supporting the amounts and disclosures in the financial statements. An audit also includes assessing the accounting principles used and significant estimates made by management, as well as evaluating the overall financial statement presentation. We believe that our audits provide a reasonable basis for our opinion.
In our opinion, such consolidatedthe financial statements present fairly, in all material respects, the financial position of the Company as of December 31, 20162018 and 2015,2017, and the results of its operations and its cash flows for each of the three years in the period ended December 31, 2016,2018, in conformity with accounting principles generally accepted in the United States of America. Also, in our opinion, such financial statement schedule, when considered in relation to the basic consolidated financial statements taken as a whole, presents fairly, in all material respects, the information set forth therein.
We have also audited, in accordance with the standards of the Public Company Accounting Oversight Board (United States) (PCAOB), the Company's internal control over financial reporting as of December 31, 2016,2018, based on the criteria established in Internal Control - Integrated Framework (2013) issued by the Committee of Sponsoring Organizations of the Treadway Commission and our report dated February 21, 20172019, expressed an unqualified opinion on the Company's internal control over financial reporting.
Basis for Opinion
These financial statements are the responsibility of the Company's management. Our responsibility is to express an opinion on the Company’s financial statements based on our audits. We are a public accounting firm registered with the PCAOB and are required to be independent with respect to the Company in accordance with the U.S. federal securities laws and the applicable rules and regulations of the Securities and Exchange Commission and the PCAOB.
We conducted our audits in accordance with the standards of the PCAOB. Those standards require that we plan and perform the audit to obtain reasonable assurance about whether the financial statements are free of material misstatement, whether due to error or fraud. Our audits included performing procedures to assess the risks of material misstatement of the financial statements, whether due to error or fraud, and performing procedures that respond to those risks. Such procedures included examining, on a test basis, evidence regarding the amounts and disclosures in the financial statements. Our audits also included evaluating the accounting principles used and significant estimates made by management, as well as evaluating the overall presentation of the financial statements. We believe that our audits provide a reasonable basis for our opinion.
/s/ DELOITTE & TOUCHE LLP
New York, New York
February 21, 20172019
We have served as the Company’s auditor since 1997.
Avis Budget Group, Inc.
CONSOLIDATED STATEMENTS OF OPERATIONS
(In millions, except per share data)
| | | | | | | | | | | | Year Ended December 31, |
| | | Year Ended December 31, | | 2018 | | 2017 | | 2016 |
| | | 2016 | | 2015 | | 2014 | | | | | | |
| Revenues | Revenues | | | | | | Revenues | $ | 9,124 |
| | $ | 8,848 |
| | $ | 8,659 |
|
| | Vehicle rental | $ | 6,081 |
| | $ | 6,026 |
| | $ | 6,026 |
| | | | | | |
| Expenses | | Expenses | | | | | |
| | Other | 2,578 |
| | 2,476 |
| | 2,459 |
| Operating | 4,639 |
| | 4,472 |
| | 4,382 |
|
| Net revenues | 8,659 |
| | 8,502 |
| | 8,485 |
| |
| | | | | | | |
| Expenses | | | | | | |
| | Operating | 4,382 |
| | 4,284 |
| | 4,251 |
| Vehicle depreciation and lease charges, net | 2,179 |
| | 2,221 |
| | 2,047 |
|
| | Vehicle depreciation and lease charges, net | 2,047 |
| | 1,933 |
| | 1,996 |
| Selling, general and administrative | 1,220 |
| | 1,120 |
| | 1,134 |
|
| | Selling, general and administrative | 1,134 |
| | 1,093 |
| | 1,080 |
| Vehicle interest, net | 314 |
| | 286 |
| | 284 |
|
| | Vehicle interest, net | 284 |
| | 289 |
| | 282 |
| Non-vehicle related depreciation and amortization | 256 |
| | 259 |
| | 253 |
|
| | Non-vehicle related depreciation and amortization | 253 |
| | 218 |
| | 180 |
| Interest expense related to corporate debt, net: | | | | | |
| | Interest expense related to corporate debt, net: | | | | | | | Interest expense | 188 |
| | 188 |
| | 203 |
|
| | | Interest expense | 203 |
| | 194 |
| | 209 |
| | Early extinguishment of debt | 19 |
| | 3 |
| | 27 |
|
| | | Early extinguishment of debt | 27 |
| | 23 |
| | 56 |
| Restructuring and other related charges | 22 |
| | 63 |
| | 29 |
|
| | Restructuring expense | 29 |
| | 18 |
| | 26 |
| Transaction-related costs, net | 20 |
| | 23 |
| | 21 |
|
| | Transaction-related costs, net | 21 |
| | 68 |
| | 13 |
| Impairment | — |
| | 2 |
| | — |
|
| Total expenses | Total expenses | 8,380 |
| | 8,120 |
| | 8,093 |
| Total expenses | 8,857 |
| | 8,637 |
| | 8,380 |
|
| | | | | | | | | | | | | | | |
| Income before income taxes | Income before income taxes | 279 |
| | 382 |
| | 392 |
| Income before income taxes | 267 |
| | 211 |
| | 279 |
|
| Provision for income taxes | 116 |
| | 69 |
| | 147 |
| |
| Provision for (benefit from) income taxes | | Provision for (benefit from) income taxes | 102 |
| | (150 | ) | | 116 |
|
| | | | | | | | | | | | | |
| Net income | Net income | $ | 163 |
| | $ | 313 |
| | $ | 245 |
| Net income | $ | 165 |
| | $ | 361 |
| | $ | 163 |
|
| | | | | | | | | | | | | |
| Earnings per share | Earnings per share | | | | | | Earnings per share | | | | | |
| | Basic | $ | 1.78 |
| | $ | 3.02 |
| | $ | 2.32 |
| Basic | $ | 2.08 |
| | $ | 4.32 |
| | $ | 1.78 |
|
| | Diluted | $ | 1.75 |
| | $ | 2.98 |
| | $ | 2.22 |
| Diluted | $ | 2.06 |
| | $ | 4.25 |
| | $ | 1.75 |
|
See Notes to Consolidated Financial Statements.
Avis Budget Group, Inc.
CONSOLIDATED STATEMENTS OF COMPREHENSIVE INCOME
(In millions)
| | | | | Year Ended December 31, | | Year Ended December 31, |
| | | 2016 | | 2015 | | 2014 | | 2018 | | 2017 | | 2016 |
| | | | | | | | | | | | | |
| Net income | Net income | $ | 163 |
| | $ | 313 |
| | $ | 245 |
| Net income | $ | 165 |
| | $ | 361 |
| | $ | 163 |
|
| | | | | | | | | | | | | |
| Other comprehensive income (loss), net of tax | Other comprehensive income (loss), net of tax | | | | | | Other comprehensive income (loss), net of tax | | | | | |
| | Currency translation adjustments, net of tax of $(9), $(22) and $(30), respectively | $ | 41 |
| | $ | (131 | ) | | $ | (115 | ) | Currency translation adjustments, net of tax of $(8), $33 and $(9), respectively | $ | (81 | ) | | $ | 110 |
| | $ | 41 |
|
| | Available-for-sale securities: | | | | | | Available-for-sale securities: | | | | | |
| | | Net unrealized gains (losses) on available-for-sale securities, net of tax of $(1), $1,and $0, respectively | 1 |
| | (2 | ) | | — |
| | Net unrealized gains (losses) on available-for-sale securities, net of tax of $0, $(1), and $(1), respectively | — |
| | 1 |
| | 1 |
|
| | Cash flow hedges: | | | | | | Cash flow hedges: | | | | | |
| | | Net unrealized holding gains (losses), net of tax of $(1), $4, and $4, respectively. | — |
| | (6 | ) | | (7 | ) | | Net unrealized holding gains (losses), net of tax of $0, $0, and $(1), respectively | (2 | ) | | 1 |
| | — |
|
| | | Less: Cash flow hedges reclassified to earnings, net of tax of $(2), $(3) and $(3), respectively | 4 |
| | 5 |
| | 5 |
| | Reclassification of cash flow hedges to earnings, net of tax of $1, $(2), and $(2), respectively | (2 | ) | | 2 |
| | 4 |
|
| | Minimum pension liability adjustment: | | | | | | Minimum pension liability adjustment: | | | | | |
| | | Pension and post-retirement benefits, net of tax of $21, $(1) and $25, respectively. | (57 | ) | | 6 |
| | (24 | ) | | Pension and post-retirement benefits, net of tax of $6, $(4), and $21, respectively | (23 | ) | | 11 |
| | (57 | ) |
| | | Less: Pension and post-retirement benefits reclassified to earnings, net of tax of $(2), $(2) and $(1), respectively | 4 |
| | 3 |
| | 2 |
| | Reclassification of pension and post-retirement benefits to earnings, net of tax of $(2), $(3), and $(2), respectively | 5 |
| | 5 |
| | 4 |
|
| | | (7 | ) | | (125 | ) | | (139 | ) | | (103 | ) | | 130 |
| | (7 | ) |
| Total comprehensive income | Total comprehensive income | $ | 156 |
| | $ | 188 |
| | $ | 106 |
| Total comprehensive income | $ | 62 |
| | $ | 491 |
| | $ | 156 |
|
See Notes to Consolidated Financial Statements.
Avis Budget Group, Inc.
CONSOLIDATED BALANCE SHEETS
(In millions, except par value)
| | | | | December 31, | | December 31, |
| | | 2016 | | 2015 | | 2018 | | 2017 |
| Assets | Assets | | | | Assets | | | |
| Current assets: | Current assets: | | | | Current assets: | | | |
| | Cash and cash equivalents | $ | 490 |
| | $ | 452 |
| Cash and cash equivalents | $ | 615 |
| | $ | 611 |
|
| | Receivables (net of allowance for doubtful accounts of $38 and $34, respectively) | 808 |
| | 668 |
| Receivables (net of allowance for doubtful accounts of $39 and $36, respectively) | 955 |
| | 922 |
|
| | Other current assets | 519 |
| | 507 |
| Other current assets | 604 |
| | 533 |
|
| Total current assets | Total current assets | 1,817 |
| | 1,627 |
| Total current assets | 2,174 |
| | 2,066 |
|
| | | | | | | | | |
| Property and equipment, net | Property and equipment, net | 685 |
| | 681 |
| Property and equipment, net | 736 |
| | 704 |
|
| Deferred income taxes | Deferred income taxes | 1,493 |
| | 1,488 |
| Deferred income taxes | 1,301 |
| | 931 |
|
| Goodwill | Goodwill | 1,007 |
| | 973 |
| Goodwill | 1,092 |
| | 1,073 |
|
| Other intangibles, net | Other intangibles, net | 870 |
| | 917 |
| Other intangibles, net | 825 |
| | 850 |
|
| Other non-current assets | Other non-current assets | 193 |
| | 232 |
| Other non-current assets | 242 |
| | 196 |
|
| Total assets exclusive of assets under vehicle programs | Total assets exclusive of assets under vehicle programs | 6,065 |
| | 5,918 |
| Total assets exclusive of assets under vehicle programs | 6,370 |
| | 5,820 |
|
| | | | | | | | | |
| Assets under vehicle programs: | Assets under vehicle programs: | | | | Assets under vehicle programs: | | | |
| | Program cash | 225 |
| | 258 |
| Program cash | 115 |
| | 283 |
|
| | Vehicles, net | 10,464 |
| | 10,658 |
| Vehicles, net | 11,474 |
| | 10,626 |
|
| | Receivables from vehicle manufacturers and other | 527 |
| | 438 |
| Receivables from vehicle manufacturers and other | 631 |
| | 547 |
|
| | Investment in Avis Budget Rental Car Funding (AESOP) LLC—related party | 362 |
| | 362 |
| Investment in Avis Budget Rental Car Funding (AESOP) LLC—related party | 559 |
| | 423 |
|
| | | 11,578 |
| | 11,716 |
| | 12,779 |
| | 11,879 |
|
| Total assets | Total assets | $ | 17,643 |
| | $ | 17,634 |
| Total assets | $ | 19,149 |
| | $ | 17,699 |
|
| | | | | | | | | |
| Liabilities and stockholders’ equity | Liabilities and stockholders’ equity | | | | Liabilities and stockholders’ equity | | | |
| Current liabilities: | Current liabilities: | | | | Current liabilities: | | | |
| | Accounts payable and other current liabilities | $ | 1,488 |
| | $ | 1,485 |
| Accounts payable and other current liabilities | $ | 1,693 |
| | $ | 1,619 |
|
| | Short-term debt and current portion of long-term debt | 279 |
| | 26 |
| Short-term debt and current portion of long-term debt | 23 |
| | 26 |
|
| Total current liabilities | Total current liabilities | 1,767 |
| | 1,511 |
| Total current liabilities | 1,716 |
| | 1,645 |
|
| | | | | | | | | |
| Long-term debt | Long-term debt | 3,244 |
| | 3,435 |
| Long-term debt | 3,528 |
| | 3,573 |
|
| Other non-current liabilities | Other non-current liabilities | 764 |
| | 734 |
| Other non-current liabilities | 767 |
| | 717 |
|
| Total liabilities exclusive of liabilities under vehicle programs | Total liabilities exclusive of liabilities under vehicle programs | 5,775 |
| | 5,680 |
| Total liabilities exclusive of liabilities under vehicle programs | 6,011 |
| | 5,935 |
|
| | | | | | | | | |
| Liabilities under vehicle programs: | Liabilities under vehicle programs: | | | | Liabilities under vehicle programs: | | | |
| | Debt | 2,183 |
| | 2,064 |
| Debt | 2,874 |
| | 2,741 |
|
| | Debt due to Avis Budget Rental Car Funding (AESOP) LLC—related party | 6,695 |
| | 6,796 |
| Debt due to Avis Budget Rental Car Funding (AESOP) LLC—related party | 7,358 |
| | 6,480 |
|
| | Deferred income taxes | 2,429 |
| | 2,367 |
| Deferred income taxes | 1,961 |
| | 1,594 |
|
| | Other | 340 |
| | 288 |
| Other | 531 |
| | 376 |
|
| | | 11,647 |
| | 11,515 |
| | 12,724 |
| | 11,191 |
|
| | | | | | | | | |
| Commitments and contingencies (Note 14) | Commitments and contingencies (Note 14) |
| |
| Commitments and contingencies (Note 14) |
| |
|
| | | | | | | | | |
| Stockholders’ equity: | Stockholders’ equity: | | | | Stockholders’ equity: | | | |
| | Preferred stock, $.01 par value—authorized 10 shares; none issued and outstanding | — |
| | — |
| Preferred stock, $.01 par value—authorized 10 shares; none issued and outstanding | — |
| | — |
|
| | Common stock, $.01 par value—authorized 250 shares; issued 137 shares, respectively | 1 |
| | 1 |
| Common stock, $.01 par value—authorized 250 shares; issued 137 shares, respectively | 1 |
| | 1 |
|
| | Additional paid-in capital | 6,918 |
| | 7,010 |
| Additional paid-in capital | 6,771 |
| | 6,820 |
|
| | Accumulated deficit | (1,639 | ) | | (1,802 | ) | Accumulated deficit | (1,091 | ) | | (1,222 | ) |
| | Accumulated other comprehensive loss | (154 | ) | | (147 | ) | Accumulated other comprehensive loss | (133 | ) | | (24 | ) |
| | Treasury stock, at cost—51 and 39 shares, respectively | (4,905 | ) | | (4,623 | ) | Treasury stock, at cost—61 and 56 shares, respectively | (5,134 | ) | | (5,002 | ) |
| Total stockholders’ equity | Total stockholders’ equity | 221 |
| | 439 |
| Total stockholders’ equity | 414 |
| | 573 |
|
| Total liabilities and stockholders’ equity | Total liabilities and stockholders’ equity | $ | 17,643 |
| | $ | 17,634 |
| Total liabilities and stockholders’ equity | $ | 19,149 |
| | $ | 17,699 |
|
See Notes to Consolidated Financial Statements.
Avis Budget Group, Inc.
CONSOLIDATED STATEMENTS OF CASH FLOWS
(In millions)
|
| | | | | | | | | | | | | |
| | | | Year Ended December 31, |
| | | | 2016 | | 2015 | | 2014 |
| Operating activities | | | | | |
| Net income | $ | 163 |
| | $ | 313 |
| | $ | 245 |
|
| Adjustments to reconcile net income to net cash provided by operating activities: | | | | | |
| | Vehicle depreciation | 1,877 |
| | 1,837 |
| | 1,840 |
|
| | Gain on sale of vehicles, net | (10 | ) | | (60 | ) | | (7 | ) |
| | Non-vehicle related depreciation and amortization | 253 |
| | 218 |
| | 180 |
|
| | Deferred income taxes | 51 |
| | 58 |
| | 65 |
|
| | Stock-based compensation | 27 |
| | 28 |
| | 25 |
|
| | Amortization of debt financing fees | 37 |
| | 42 |
| | 41 |
|
| | Early extinguishment of debt costs | 27 |
| | 23 |
| | 56 |
|
| | Net change in assets and liabilities: | | | | | |
| | | Receivables | (65 | ) | | (42 | ) | | (60 | ) |
| | | Income taxes | 5 |
| | (18 | ) | | 37 |
|
| | | Accounts payable and other current liabilities | (9 | ) | | (79 | ) | | (3 | ) |
| | Other, net | 273 |
| | 264 |
| | 160 |
|
| Net cash provided by operating activities | 2,629 |
| | 2,584 |
| | 2,579 |
|
| | | | | | |
| Investing activities | | | | | |
| Property and equipment additions | (190 | ) | | (199 | ) | | (182 | ) |
| Proceeds received on asset sales | 19 |
| | 15 |
| | 21 |
|
| Net assets acquired (net of cash acquired) | (55 | ) | | (256 | ) | | (416 | ) |
| Other, net | 3 |
| | 6 |
| | (11 | ) |
| Net cash used in investing activities exclusive of vehicle programs | (223 | ) | | (434 | ) | | (588 | ) |
| | | | | | |
| Vehicle programs: | | | | | |
| | Decrease (increase) in program cash | 31 |
| | (148 | ) | | (10 | ) |
| | Investment in vehicles | (12,461 | ) | | (11,928 | ) | | (11,875 | ) |
| | Proceeds received on disposition of vehicles | 10,504 |
| | 9,680 |
| | 9,666 |
|
| | | | (1,926 | ) | | (2,396 | ) | | (2,219 | ) |
| Net cash used in investing activities | (2,149 | ) | | (2,830 | ) | | (2,807 | ) |
| | | | | | | | |
| Financing activities | | | | | |
| Proceeds from long-term borrowings | 894 |
| | 377 |
| | 871 |
|
| Payments on long-term borrowings | (847 | ) | | (301 | ) | | (762 | ) |
| Net change in short-term borrowings | 4 |
| | (22 | ) | | 5 |
|
| Debt financing fees | (20 | ) | | (7 | ) | | (17 | ) |
| Repurchases of common stock | (387 | ) | | (393 | ) | | (297 | ) |
| Other, net | — |
| | (7 | ) | | — |
|
| Net cash used in financing activities exclusive of vehicle programs | (356 | ) | | (353 | ) | | (200 | ) |
|
| | | | | | | | | | | | | |
| | | | Year Ended December 31, |
| | | | 2018 | | 2017 | | 2016 |
| Operating activities | | | | | |
| Net income | $ | 165 |
| | $ | 361 |
| | $ | 163 |
|
| Adjustments to reconcile net income to net cash provided by operating activities: | | | | | |
| | Vehicle depreciation | 1,974 |
| | 1,947 |
| | 1,877 |
|
| | (Gain) loss on sale of vehicles, net | (48 | ) | | 52 |
| | (10 | ) |
| | Non-vehicle related depreciation and amortization | 256 |
| | 259 |
| | 253 |
|
| | Deferred income taxes | 14 |
| | (192 | ) | | 51 |
|
| | Stock-based compensation | 24 |
| | 13 |
| | 27 |
|
| | Amortization of debt financing fees | 28 |
| | 34 |
| | 37 |
|
| | Early extinguishment of debt costs | 19 |
| | 3 |
| | 27 |
|
| | Net change in assets and liabilities: | | | | | |
| | | Receivables | (44 | ) | | (59 | ) | | (65 | ) |
| | | Income taxes | 35 |
| | (16 | ) | | 5 |
|
| | | Accounts payable and other current liabilities | 48 |
| | 49 |
| | 2 |
|
| | Other, net | 138 |
| | 197 |
| | 273 |
|
| Net cash provided by operating activities | 2,609 |
| | 2,648 |
| | 2,640 |
|
| | | | | | |
| Investing activities | | | | | |
| Property and equipment additions | (231 | ) | | (197 | ) | | (190 | ) |
| Proceeds received on asset sales | 17 |
| | 8 |
| | 19 |
|
| Net assets acquired (net of cash acquired) | (91 | ) | | (21 | ) | | (55 | ) |
| Other, net | (44 | ) | | 5 |
| | 1 |
|
| Net cash used in investing activities exclusive of vehicle programs | (349 | ) | | (205 | ) | | (225 | ) |
| | | | | | |
| Vehicle programs: | | | | | |
| | Investment in vehicles | (12,589 | ) | | (11,538 | ) | | (12,461 | ) |
| | Proceeds received on disposition of vehicles | 9,648 |
| | 9,600 |
| | 10,504 |
|
| | Investment in debt securities of Avis Budget Rental Car Funding (AESOP)—related party | (188 | ) | | (61 | ) | | — |
|
| | Proceeds from debt securities of Avis Budget Rental Car Funding (AESOP)—related party | 52 |
| | — |
| | — |
|
| | | | (3,077 | ) | | (1,999 | ) | | (1,957 | ) |
| Net cash used in investing activities | (3,426 | ) | | (2,204 | ) | | (2,182 | ) |
| | | | | | | | |
| Financing activities | | | | | |
| Proceeds from long-term borrowings | 485 |
| | 589 |
| | 894 |
|
| Payments on long-term borrowings | (515 | ) | | (602 | ) | | (847 | ) |
| Net change in short-term borrowings | (4 | ) | | (4 | ) | | 4 |
|
| Debt financing fees | (15 | ) | | (9 | ) | | (20 | ) |
| Repurchases of common stock | (216 | ) | | (210 | ) | | (398 | ) |
| Other, net | 3 |
| | 1 |
| | — |
|
| Net cash used in financing activities exclusive of vehicle programs | (262 | ) | | (235 | ) | | (367 | ) |
Avis Budget Group, Inc.
CONSOLIDATED STATEMENTS OF CASH FLOWS (Continued)
(In millions)
|
| | | | | | | | | | | | | |
| | | | Year Ended December 31, |
| | | | 2016 | | 2015 | | 2014 |
| Vehicle programs: | | | | | |
| | Proceeds from borrowings | 15,769 |
| | 14,138 |
| | 14,373 |
|
| | Payments on borrowings | (15,826 | ) | | (13,648 | ) | | (13,963 | ) |
| | Debt financing fees | (25 | ) | | (22 | ) | | (28 | ) |
| | | | (82 | ) | | 468 |
| | 382 |
|
| Net cash (used in) provided by financing activities | (438 | ) | | 115 |
| | 182 |
|
| | | | | | |
| Effect of changes in exchange rates on cash and cash equivalents | (4 | ) | | (41 | ) | | (23 | ) |
| | | | | | |
| Net increase (decrease) in cash and cash equivalents | 38 |
| | (172 | ) | | (69 | ) |
| Cash and cash equivalents, beginning of period | 452 |
| | 624 |
| | 693 |
|
| Cash and cash equivalents, end of period | $ | 490 |
| | $ | 452 |
| | $ | 624 |
|
| | | | | | |
| Supplemental disclosure | | | | | |
| Interest payments | $ | 461 |
| | $ | 454 |
| | $ | 474 |
|
| Income tax payments, net | $ | 60 |
| | $ | 29 |
| | $ | 45 |
|
|
| | | | | | | | | | | | | |
| | | | Year Ended December 31, |
| | | | 2018 | | 2017 | | 2016 |
| Vehicle programs: | | | | | |
| | Proceeds from borrowings | 17,339 |
| | 17,212 |
| | 15,769 |
|
| | Payments on borrowings | (16,385 | ) | | (17,269 | ) | | (15,826 | ) |
| | Debt financing fees | (25 | ) | | (16 | ) | | (25 | ) |
| | | | 929 |
| | (73 | ) | | (82 | ) |
| Net cash provided by (used in) financing activities | 667 |
| | (308 | ) | | (449 | ) |
| | | | | | |
| Effect of changes in exchange rates on cash and cash equivalents, program and restricted cash | (16 | ) | | 45 |
| | (6 | ) |
| | | | | | |
| Net (decrease) increase in cash and cash equivalents, program and restricted cash | (166 | ) | | 181 |
| | 3 |
|
| Cash and cash equivalents, program and restricted cash, beginning of period | 901 |
| | 720 |
| | 717 |
|
| Cash and cash equivalents, program and restricted cash, end of period | $ | 735 |
| | $ | 901 |
| | $ | 720 |
|
| | | | | | |
| Supplemental disclosure | | | | | |
| Interest payments | $ | 497 |
| | $ | 460 |
| | $ | 461 |
|
| Income tax payments, net | $ | 53 |
| | $ | 58 |
| | $ | 60 |
|
See Notes to Consolidated Financial Statements.
Avis Budget Group, Inc.
CONSOLIDATED STATEMENTS OF STOCKHOLDERS’ EQUITY
(In millions)
| | | | Common Stock | | Additional Paid-in Capital | | Accumulated Deficit | | Accumulated Other Comprehensive Income (Loss) | | Treasury Stock | | Total Stockholders’ Equity | Common Stock | | Additional Paid-in Capital | | Accumulated Deficit | | Accumulated Other Comprehensive Income (Loss) | | Treasury Stock | | Total Stockholders’ Equity |
| | Shares | | Amount | | Shares | | Amount | | Shares | | Amount | | Shares | | Amount | |
| Balance at January 1, 2014 | 137.1 |
| | $ | 1 |
| | $ | 7,893 |
| | $ | (2,360 | ) | | $ | 117 |
| | (30.5 | ) | | $ | (4,880 | ) | | $ | 771 |
| |
| Balance at January 1, 2016 | | 137.1 |
| | $ | 1 |
| | $ | 7,010 |
| | $ | (1,802 | ) | | $ | (147 | ) | | (39.3 | ) | | $ | (4,623 | ) | | $ | 439 |
|
| | | | | | | | | | | | | | | | | | | | | | | | | | | | | | | |
| Comprehensive income: | | | | | | | | | | | | | | | | | | | | | | | | | | | | | | |
| Net income | — |
| | — |
| | — |
| | 245 |
| | — |
| | — |
| | — |
| | | — |
| | — |
| | — |
| | 163 |
| | — |
| | — |
| | — |
| | |
| Other comprehensive loss | — |
| | — |
| | — |
| | — |
| | (139 | ) | | — |
| | — |
| | | — |
| | — |
| | — |
| | — |
| | (7 | ) | | — |
| | — |
| | |
| | | | | | | | | | | | | | | | | | | | | | | | | | | | | | | |
| Total comprehensive income | | | | | | | | | | | | | | | 106 |
| | | | | | | | | | | | | | | 156 |
|
| | | | | | | | | | | | | | | | | | | | | | | | | | | | | | | |
| Net activity related to restricted stock units | — |
| | — |
| | (143 | ) | | — |
| | — |
| | 0.7 |
| | 153 |
| | 10 |
| |
| Exercise of stock options | — |
| | — |
| | (20 | ) | | — |
| | — |
| | 0.1 |
| | 20 |
| | — |
| |
| Change in excess tax benefit on equity awards | — |
| | — |
| | 12 |
| | — |
| | — |
| | — |
| | — |
| | 12 |
| |
| Activity related to employee stock purchase plan | — |
| | — |
| | (1 | ) | | — |
| | — |
| | — |
| | 1 |
| | — |
| |
| Issuance of common stock - conversion of convertible debt | — |
| | — |
| | (529 | ) | | — |
| | — |
| | 4.0 |
| | 595 |
| | 66 |
| |
| Repurchase of common stock | — |
| | — |
| | — |
| | — |
| | — |
| | (5.7 | ) | | (300 | ) | | (300 | ) | |
| | | | | | | | | | | | | | | | | |
| Balance at December 31, 2014 | 137.1 |
| | $ | 1 |
| | $ | 7,212 |
| | $ | (2,115 | ) | | $ | (22 | ) | | (31.4 | ) | | $ | (4,411 | ) | | $ | 665 |
| |
| | | | | | | | | | | | | | | | | |
| Comprehensive income: | | | | | | | | | | | | | | | | |
| Net income | — |
| | — |
| | — |
| | 313 |
| | — |
| | — |
| | — |
| | | |
| Other comprehensive loss | — |
| | — |
| | — |
| | — |
| | (125 | ) | | — |
| | — |
| | | |
| | | | | | | | | | | | | | | | | |
| Total comprehensive income | | | | | | | | | | | | | | | 188 |
| |
| | | | | | | | | | | | | | | | | |
| Net activity related to restricted stock units | — |
| | — |
| | (191 | ) | | — |
| | — |
| | 0.9 |
| | 178 |
| | (13 | ) | |
| Exercise of stock options | — |
| | — |
| | (3 | ) | | — |
| | — |
| | — |
| | 3 |
| | — |
| |
| Change in excess tax benefit on equity awards | — |
| | — |
| | (7 | ) | | — |
| | — |
| | — |
| | — |
| | (7 | ) | |
| Activity related to employee stock purchase plan | — |
| | — |
| | (1 | ) | | — |
| | — |
| | — |
| | 1 |
| | — |
| |
| Repurchase of common stock | — |
| | — |
| | — |
| | — |
| | — |
| | (8.8 | ) | | (394 | ) | | (394 | ) | |
| | | | | | | | | | | | | | | | | |
| Balance at December 31, 2015 | 137.1 |
| | $ | 1 |
| | $ | 7,010 |
| | $ | (1,802 | ) | | $ | (147 | ) | | (39.3 | ) | | $ | (4,623 | ) | | $ | 439 |
| |
| | | | | | | | | | | | | | | | | |
| Comprehensive income: | | | | | | | | | | | | | | | | |
| Net income | — |
| | — |
| | — |
| | 163 |
| | — |
| | — |
| | — |
| | | |
| Other comprehensive loss | — |
| | — |
| | — |
| | — |
| | (7 | ) | | — |
| | — |
| | | |
| | | | | | | | | | | | | | | | | |
| Total comprehensive income | | | | | | | | | | | | | | | 156 |
| |
| Non-controlling interest | — |
| | — |
| | 5 |
| | — |
| | — |
| | — |
| | — |
| | 5 |
| — |
| | — |
| | 5 |
| | — |
| | — |
| | — |
| | — |
| | 5 |
|
| Net activity related to restricted stock units | — |
| | — |
| | (89 | ) | | — |
| | — |
| | 0.5 |
| | 104 |
| | 15 |
| — |
| | — |
| | (89 | ) | | — |
| | — |
| | 0.5 |
| | 104 |
| | 15 |
|
| Exercise of stock options | — |
| | — |
| | (2 | ) | | — |
| | — |
| | — |
| | 2 |
| | — |
| — |
| | — |
| | (2 | ) | | — |
| | — |
| | — |
| | 2 |
| | — |
|
| Change in excess tax benefit on equity awards | — |
| | — |
| | (5 | ) | | — |
| | — |
| | — |
| | — |
| | (5 | ) | — |
| | — |
| | (5 | ) | | — |
| | — |
| | — |
| | — |
| | (5 | ) |
| Activity related to employee stock purchase plan | — |
| | — |
| | (1 | ) | | — |
| | — |
| | — |
| | 2 |
| | 1 |
| — |
| | — |
| | (1 | ) | | — |
| | — |
| | — |
| | 2 |
| | 1 |
|
| Repurchase of common stock | — |
| | — |
| | — |
| | — |
| | — |
| | (12.3 | ) | | (390 | ) | | (390 | ) | — |
| | — |
| | — |
| | — |
| | — |
| | (12.3 | ) | | (390 | ) | | (390 | ) |
| | | | | | | | | | | | | | | | | | | | | | | | | | | | | | | |
| Balance at December 31, 2016 | 137.1 |
| | $ | 1 |
| | $ | 6,918 |
| | $ | (1,639 | ) | | $ | (154 | ) | | (51.1 | ) | | $ | (4,905 | ) | | $ | 221 |
| 137.1 |
| | $ | 1 |
| | $ | 6,918 |
| | $ | (1,639 | ) | | $ | (154 | ) | | (51.1 | ) | | $ | (4,905 | ) | | $ | 221 |
|
| | | | | | | | | | | | | | | | | |
| Cumulative effect of accounting change | | — |
| | — |
| | — |
| | 56 |
| | — |
| | — |
| | — |
| | 56 |
|
| | | | | | | | | | | | | | | | | |
| Comprehensive income: | | | | | | | | | | | | | | | | |
| Net income | | — |
| | — |
| | — |
| | 361 |
| | — |
| | — |
| | — |
| | |
| Other comprehensive income | | — |
| | — |
| | — |
| | — |
| | 130 |
| | — |
| | — |
| | |
| | | | | | | | | | | | | | | | | |
| Total comprehensive income | | | | | | | | | | | | | | | | 491 |
|
| | | | | | | | | | | | | | | | | |
| Non-controlling interest | | — |
| | — |
| | 1 |
| | — |
| | — |
| | — |
| | — |
| | 1 |
|
| Net activity related to restricted stock units | | — |
| | — |
| | (50 | ) | | — |
| | — |
| | 0.4 |
| | 54 |
| | 4 |
|
| Exercise of stock options | | — |
| | — |
| | (48 | ) | | — |
| | — |
| | 0.5 |
| | 48 |
| | — |
|
| Activity related to employee stock purchase plan | | — |
| | — |
| | (1 | ) | | — |
| | — |
| | — |
| | 1 |
| | — |
|
| Repurchase of common stock | | — |
| | — |
| | — |
| | — |
| | — |
| | (6.1 | ) | | (200 | ) | | (200 | ) |
| | | | | | | | | | | | | | | | | |
| Balance at December 31, 2017 | | 137.1 |
| | $ | 1 |
| | $ | 6,820 |
| | $ | (1,222 | ) | | $ | (24 | ) | | (56.3 | ) | | $ | (5,002 | ) | | $ | 573 |
|
| | | | | | | | | | | | | | | | | |
| Cumulative effect of accounting change | | — |
| | — |
| | — |
| | (34 | ) | | (6 | ) | | — |
| | — |
| | (40 | ) |
| | | | | | | | | | | | | | | | | |
| Comprehensive income: | | | | | | | | | | | | | | | | |
| Net income | | — |
| | — |
| | — |
| | 165 |
| | — |
| | — |
| | — |
| | |
| Other comprehensive loss | | — |
| | — |
| | — |
| | — |
| | (103 | ) | | — |
| | — |
| | |
| | | | | | | | | | | | | | | | | |
| Total comprehensive income | | | | | | | | | | | | | | | | 62 |
|
| Net activity related to restricted stock units | | — |
| | — |
| | (31 | ) | | — |
| | — |
| | 0.5 |
| | 48 |
| | 17 |
|
| Exercise of stock options | | — |
| | — |
| | (17 | ) | | — |
| | — |
| | 0.2 |
| | 19 |
| | 2 |
|
| Activity related to employee stock purchase plan | | — |
| | — |
| | (1 | ) | | — |
| | — |
| | — |
| | 1 |
| | — |
|
| Repurchase of common stock | | — |
| | — |
| | — |
| | — |
| | — |
| | (5.9 | ) | | (200 | ) | | (200 | ) |
| | | | | | | | | | | | | | | | | |
| Balance at December 31, 2018 | | 137.1 |
| | $ | 1 |
| | $ | 6,771 |
| | $ | (1,091 | ) | | $ | (133 | ) | | (61.5 | ) | | $ | (5,134 | ) | | $ | 414 |
|
See Notes to Consolidated Financial Statements.
Avis Budget Group, Inc.
NOTES TO CONSOLIDATED FINANCIAL STATEMENTS
(Unless otherwise noted, all dollar amounts are in millions, except per share amounts)
Avis Budget Group, Inc. provides car and truck rentals, car sharing services and ancillary servicesmobility solutions to businesses and consumers worldwide. The accompanying Consolidated Financial Statements include the accounts and transactions of Avis Budget Group, Inc. and its subsidiaries, as well as entities in which Avis Budget Group, Inc. directly or indirectly has a controlling financial interest (collectively, the “Company”).
The Company operates the following reportable business segments:
Americas—provides and licenses the Company’s brands to third parties forconsisting primarily of (i) vehicle rentals and ancillary products and servicesrental operations in North America, South America, Central America and the Caribbean, and operates the Company’s(ii) car sharing businessoperations in certain of these markets.markets, and (iii) licensees in the areas in which the Company does not operate directly.
International—provides and licenses the Company’s brands to third parties forconsisting primarily of (i) vehicle rentals and ancillary products and servicesrental operations in Europe, the Middle East, Africa, Asia Australia and New Zealand, and operates the Company’sAustralasia, (ii) car sharing businessoperations in certain of these markets.markets, and (iii) licensees in the areas in which the Company does not operate directly.
In 2016, 2015 and 2014, theThe Company has completed the business acquisitions discussed in Note 5 to these Consolidated Financial Statements. The operating results of the acquired businesses are included in the accompanying Consolidated Financial Statements from the dates of acquisition.
The Company presents separately the financial data of its vehicle programs. These programs are distinct from the Company’s other activities since the assets under vehicle programs are generally funded through the issuance of debt that is collateralized by such assets. The income generated by these assets is used, in part, to repay the principal and interest associated with the debt. Cash inflows and outflows relating to the acquisition of such assets and the principal debt repayment or financing of such assets are classified as activities of the Company’s vehicle programs. The Company believes it is appropriate to segregate the financial data of its vehicle programs because, ultimately, the source of repayment of such debt is the realization of such assets.
| |
| 2. | Summary of Significant Accounting Policies |
Accounting Principles
The Company’s Consolidated Financial Statements have been prepared in accordance with accounting principles generally accepted in the United States of America (“GAAP”).
Principles of Consolidation
The Consolidated Financial Statements include the accounts of the Company and all entities in which it has a direct or indirect controlling financial interest and variable interest entities for which the Company has determined it is the primary beneficiary. Intercompany transactions have been eliminated in consolidation.
Use of Estimates and Assumptions
The use of estimates and assumptions as determined by management is required in the preparation of the Consolidated Financial Statements in conformity with GAAP. These estimates are based on management’s evaluation of historical trends and other information available when the Consolidated Financial Statements are prepared and may affect the amounts reported and related disclosures. Actual results could differ from those estimates.
Revenue Recognition
The Company derives revenuerevenues primarily through the operation and licensing of its rental systems and by providing vehicle rentals and other related products and mobility services to businesscommercial and leisure travelerscustomers, as well as through licensing of its rental systems. Other related products and others. Other revenue includesmobility services include sales of collision and loss damage waivers under which a customer is relieved from financial responsibility arising from vehicle damage incurred during the
rental; products and insurance products, fuel andservices for driving convenience such as fuel service charges,options, chauffeur drive services, roadside safety net, electronic toll collection, tablet rentals, of GPSaccess to satellite radio, portable navigation units and child safety seat rentals; and rentals of other items. Revenue issupplemental items including automobile towing equipment and other moving accessories and supplies. The Company also receives payment from customers for certain operating expenses that it incurs, including airport concession fees that are paid by the Company in exchange for the right to operate at airports and other locations, as well as vehicle licensing fees. In addition, the Company collects membership fees in connection with its car sharing business.
Prior to January 1, 2018, the Company recognized revenue when persuasive evidence of an
arrangement exists,existed, the services havehad been rendered to customers,the customer, the pricing iswas fixed orand determinable and collection iswas reasonably assured.
Vehicle rental and rental-related revenue iswas recognized over the period the vehicle was rented.
For periods beginning after January 1, 2018, revenue is rented.recognized when obligations under the terms of a contract with the customer are satisfied; generally this occurs evenly over the contract (over time); when control of the promised products or services is transferred to the customer. Revenue is measured as the amount of consideration the Company expects to be entitled to receive in exchange for transferring products or services. Certain customers may receive cash-based rebates, which are accounted for as variable consideration. The Company estimates these rebates based on the expected amount to be provided to customers and reduces revenue recognized. Vehicle rental and rental-related revenues are recognized evenly over the period of rental. Licensing revenuerevenues principally consistsconsist of royalties paid by the Company’s licensees and isare recorded within other revenues as the licensees’ revenue isrevenues are earned (over the rental period of a vehicle)period). The Company renews license agreements in the normal course of business and occasionally terminates, purchases or sells license agreements. In connection with ongoing fees that the Company receives from its licensees pursuant to license agreements, the Company is required to provide certain services, such as training, marketing and the operation of reservation systems. Revenue
The Company excludes from the measurement of its transaction price any tax assessed by a governmental authority that is both imposed on and concurrent with a specific revenue-producing transaction and collected from a customer. As a result, revenue is recorded net of such taxes collected. Revenues and expenses associated with gasoline, airport concessions and vehicle licensing and airport concessions are recorded on a gross basis within revenuerevenues and operating expenses. Membership fees related to the Company’s car sharing business are generally nonrefundable, are deferred and recognized ratably over the period of membership and are included in accounts payablemembership.
The following table presents the Company’s revenues disaggregated by geography.
|
| | | | |
| | | Year Ended December 31, 2018 |
| Americas | $ | 6,186 |
|
| Europe, Middle East and Africa | 2,314 |
|
| Asia and Australasia | 624 |
|
| Total revenues | $ | 9,124 |
|
The following table presents the Company’s revenues disaggregated by brand.
|
| | | | |
| | | December 31, 2018 |
| Avis | $ | 5,266 |
|
| Budget | 3,057 |
|
| Other | 801 |
|
| Total revenues | $ | 9,124 |
|
________
Other includes Zipcar and other current liabilitiesoperating brands.
Contract Liabilities
The Company records deferred revenues when cash payments are received in advance of satisfying its performance obligations, including amounts that are refundable. In addition, certain customers earn loyalty points on rentals, for which the Company defers a portion of its rental revenues generally equivalent to the estimated retail value of points expected to be redeemed. The Company estimates points that will never be redeemed based upon actual redemption and expiration patterns. Currently loyalty points expire at the earlier of 12 months of member inactivity or five years from when they were earned. Future changes to expiration assumptions or expiration policy, or to program rules, may result in changes to deferred revenue as well as recognized revenues from the program.
The following table presents changes in the Consolidated Balance Sheets.Company’s contract liabilities during the year ended December 31, 2018.
|
| | | | | | | | | | | | | | | |
| | Balance at January 1, 2018 | | Revenue deferred | | Revenue recognized | | Balance at December 31, 2018 |
Prepaid rentals(a) | $ | 101 |
| | $ | 1,764 |
| | $ | 1,761 |
| | $ | 104 |
|
Other deferred revenue(b) | 93 |
| | 218 |
| | 228 |
| | 83 |
|
| Total deferred revenue | $ | 194 |
| | $ | 1,982 |
| | $ | 1,989 |
| | $ | 187 |
|
________
| |
(a) | At December 31, 2018, included in accounts payable and other current liabilities. |
| |
(b) | At December 31, 2018, $36 million included in accounts payable and other current liabilities and $47 million in other non-current liabilities. Non-current amounts are expected to be recognized as revenue within two to three years. |
Currency Translation
Assets and liabilities of foreign operations are translated at the rate of exchange in effect on the balance sheet date; income and expenses are translated at the prevailing monthly average rate of exchange. The related translation adjustments are reflected in accumulated other comprehensive income (loss) in the stockholders’ equity section of the Consolidated Balance Sheets and in the Consolidated Statements of Comprehensive Income. The accumulated currency translation adjustment as of December 31, 20162018 and 20152017 was a loss of $(39)3 million and $(80)a gain of $71 million, respectively. The Company has designated its Euro-denominatedeuro-denominated Notes as a hedge of its investment in Euro-denominatedeuro-denominated foreign operations and, accordingly, records the effective portion of gains or losses on this net investment hedge in accumulated other comprehensive income (loss) as part of currency translation adjustments.
Cash and Cash Equivalents, Program Cash and Restricted Cash
The Company considers highly liquid investments purchased with an original maturity of three months or less to be cash equivalents. Program cash primarily represents amounts specifically designated to purchase assets under vehicle programs and/or to repay the related debt, as such the Company considers it a restricted cash equivalent. The following table provides a detail of cash and cash equivalents, program and restricted cash reported within the Consolidated Balance Sheets to the amounts shown in the Consolidated Statements of Cash Flows:
|
| | | | | | | |
| | As of December 31, |
| | 2018 | | 2017 |
| Cash and cash equivalents | $ | 615 |
| | $ | 611 |
|
| Program cash | 115 |
| | 283 |
|
Restricted cash (a) | 5 |
| | 7 |
|
| Total cash and cash equivalents, program and restricted cash | $ | 735 |
| | $ | 901 |
|
_________
| |
(a) | Included within other current assets. |
Property and Equipment
Property and equipment (including leasehold improvements) are stated at cost, net of accumulated depreciation and amortization. Depreciation (non-vehicle related) is computed utilizing the straight-line
method over the estimated useful lives of the related assets. Amortization of leasehold improvements is computed utilizing the straight-line method over the estimated benefit period of the related assets, which may not exceed 20 years, or the lease term, if shorter. Useful lives are as follows:
|
| |
| Buildings | 30 years |
| Furniture, fixtures & equipment | 3 to 10 years |
| Capitalized software | 3 to 7 years |
| Buses and support vehicles | 4 to 15 years |
The Company capitalizes the costs of software developed for internal use when the preliminary project stage is completed and management (i) commits to funding the project and (ii) believes it is probable that the project will be completed and the software will be used to perform the function intended. The software developed or obtained for internal use is amortized on a straight-line basis commencing when such software is ready for its intended use. The net carrying value of software developed or obtained for internal use was $184188 million and $185196 million as of December 31, 20162018 and 2015,2017, respectively.
Goodwill and Other Intangible Assets
Goodwill represents the excess, if any, of the fair value of the consideration transferred by the acquirer and the fair value of any non-controlling interest remaining in the acquiree, if any, over the fair values of the identifiable net assets acquired. The Company does not amortize goodwill, but assesses it for impairment at least annually and whenever events or changes in circumstances indicate that the carrying amounts of their respective reporting units exceed their fair values. The Company performs its annual impairment assessment in the fourth quarter of each year at the reporting unit level. The Company assesses goodwill
for such impairment by comparing the carrying value of each reporting unit to its fair value using the present value of expected future cash flows. When appropriate, comparative market multiples and other factors are used to corroborate the discounted cash flow results.
Other intangible assets, primarily trademarks, with indefinite lives are not amortized but are evaluated annually for impairment and whenever events or changes in circumstances indicate that the carrying amount of this asset may exceed its fair value. If the carrying value of an other intangible asset exceeds its fair value, an impairment loss is recognized in an amount equal to that excess. Other intangible assets with finite lives are amortized over their estimated useful lives and are evaluated each reporting period to determine if circumstances warrant a revision to these lives.
Impairment of Long-Lived Assets
The Company is required to assess long-lived assets for impairment whenever circumstances indicate impairment may have occurred. This analysis is performed by comparing the respective carrying values of the assets to the undiscounted expected future cash flows to be generated from such assets. Property and equipment is evaluated separately at the lowest level of identifiable cash flows. If such analysis indicates that the carrying value of these assets is not recoverable, the carrying value of such assets is reduced to fair value.
Program Cash
Program cash primarily represents amounts specifically designated to purchase assets under vehicle programs and/or to repay the related debt.
Vehicles
Vehicles are stated at cost, net of accumulated depreciation. The initial cost of the vehicles is recorded net of incentives and allowances from manufacturers. The Company acquires manya portion of its rental vehicles pursuant to repurchase and guaranteed depreciation programs established by automobile manufacturers. Under these programs, the manufacturers agree to repurchase vehicles at a specified price and date, or guarantee the depreciation rate for a specified period of time, subject to certain eligibility criteria (such as car condition and mileage requirements). The Company depreciates vehicles such that the net book value on the date of return to the manufacturers is intended to equal the contractual guaranteed residual values, thereby minimizing any gain or loss.
Rental vehicles acquired outside of manufacturer repurchase and guaranteed depreciation programs are depreciated based upon their estimated residual values at their expected dates of disposition, after giving effect to anticipated conditions in the used car market. Any adjustments to depreciation are made prospectively.
The estimation of residual values requires the Company to make assumptions regarding the age and mileage of the car at the time of disposal, as well as expected used vehicle auction market conditions. The Company periodicallyregularly evaluates estimated residual values and adjusts depreciation rates as appropriate. Differences between actual residual values and those estimated result in a gain or loss on disposal and are recorded as part of vehicle depreciation at the time of sale. Vehicle-related interest expense amounts are net of vehicle-related interest income of $1815 million, $138 million and $1018 million for 2016, 20152018, 2017 and 2014,2016, respectively.
Advertising Expenses
Advertising costs are generally expensed in the period incurred. Advertising expenses,incurred and are recorded within selling, general and administrative expense on ourin the Company’s Consolidated Statements of Operations, include radio, television, travel partner rewards programs, InternetOperations. During 2018, 2017 and 2016, advertising and other advertising and promotions andcosts were approximately$116 million, $111 million and $127 million,$123 million and $112 million in 2016, 2015 and 2014, respectively.
Taxes
The Company accounts for income taxes under the asset and liability method, which requires the recognition of deferred tax assets and liabilities for the expected future tax consequences of events that have been included in the financial statements. Under this method, deferred tax assets and liabilities are
determined based on the differences between the financial statement and tax basis of assets and liabilities using enacted tax rates in effect for the year in which the differences are expected to reverse. The effect of a change in tax rates on deferred tax assets and liabilities is recognized in income in the period that includes the enactment date. For information regarding the accounting for the effects of the Tax Cuts and Jobs Act (the “Tax Act”), see Note 8-Income Taxes.
The Company records net deferred tax assets to the extent it believes that it is more likely than not that these assets will be realized. In making such determination, the Company considers all available positive and negative evidence, including scheduled reversals of deferred tax liabilities, projected future taxable income, tax planning strategies and recent results of operations. In the event the Company were to determine that it would be able to realize the deferred income tax assets in the future in excess of their net recorded amount, the Company would adjust the valuation allowance, which would reduce the provision for income taxes.
The Company reports revenues net of any tax assessed by a governmental authority that is both imposed on and concurrent with a specific revenue-producing transaction between a seller and a customer.
Fair Value Measurements
The Company measures fair value of assets and liabilities and discloses the source for such fair value measurements. Financial assets and liabilities are classified as follows: Level 1, which refers to assets and liabilities valued using quoted prices from active markets for identical assets or liabilities; Level 2, which refers to assets and liabilities for which significant other observable market inputs are readily available; and Level 3, which are valued based on significant unobservable inputs.
The fair value of the Company’s financial instruments is generally determined by reference to market values resulting from trading on a national securities exchange or in an over-the-counter market (Level 1 inputs). In some cases where quoted market prices are not available, prices are derived by considering the yield of the benchmark security that was issued to initially price the instruments and adjusting this rate by the credit spread that market participants would demand for the instruments as of the measurement date (Level 2 inputs). In situations where long-term borrowings are part of a conduit facility backed by short-term floating rate debt, the Company has determined that its carrying value approximates the fair value of this debt (Level 2 inputs). The carrying amounts of cash and cash equivalents, available-for-sale securities, accounts receivable, program cash and accounts payable and accrued liabilities approximate fair value due to the short-term maturities of these assets and liabilities.
The Company’s derivative assets and liabilities consist principally of currency exchange contracts, interest rate swaps, interest rate caps and commodity contracts, and are carried at fair value based on significant observable inputs (Level 2 inputs). Derivatives entered into by the Company are typically executed over-the-counter and are valued using internal valuation techniques, as no quoted market prices exist for such instruments. The valuation technique and inputs depend on the type of derivative and the nature of the underlying exposure. The Company principally uses discounted cash flows to value these instruments. These models take into account a variety of factors including, where applicable, maturity, commodity prices,currency exchange rates, interest rate yield curves of the Company and counterparties, credit curves, counterparty
creditworthiness and currency exchange rates.commodity prices. These factors are applied on a consistent basis and are based upon observable inputs where available.
Derivative Instruments
Derivative instruments are used as part of the Company’s overall strategy to manage exposure to market risks associated with fluctuations in currency exchange rates, interest rates and gasoline costs. As a matter of policy, derivatives are not used for trading or speculative purposes.
All derivatives are recorded at fair value either as assets or liabilities. Changes in fair value of derivatives not designated as hedging instruments are recognized currently in earnings within the same line item as the hedged item. The effective portion of changes in fair value of a derivative that is designated as either a cash flow or net investment hedge is recorded as a component of accumulated other comprehensive income (loss). The ineffective portion is recognized in earnings within the same line item as the hedged item, including vehicle interest, net or interest related to corporate debt, net. Amounts included in accumulated other comprehensive income (loss) are reclassified into earnings in the same period during which the hedged item affects earnings. Amounts related to our derivative instruments are recognized in the
Consolidated Statements of Cash Flows consistent with the nature of the hedged item (principally operating activities).
Investments
Joint venture investments are typically accounted for under the equity method of accounting. Under this method, the Company records its proportional share of the joint venture’s net income or loss within operating expenses in the Consolidated Statements of Operations. The Company assesses equity method investments for impairment whenever events or changes in circumstances indicate that the carrying amounts of such investments may not be recoverable. Any difference between the carrying value of the equity method investment and its estimated fair value is recognized as an impairment charge if the loss in value is deemed other than temporary. As of December 31, 2016 and 2015, the Company had investments in several joint ventures with a carrying value of $36 million, in each period, recorded within other non-current assets on the Consolidated Balance Sheets.
Aggregate realized gains and losses on investments and dividend income are recorded within operating expenses on the Consolidated Statements of Operations. During 2014, the Company realized gains of $7 million from the sale of equity investments and during 2016 and 2015, the amounts realized were not material.
Self-Insurance Reserves
The Consolidated Balance Sheets include $437 million and $413 million of liabilities associated with retained risks of liability to third parties as of December 31, 2016 and 2015, respectively. Such liabilities relate primarily to public liability and third-party property damage claims, as well as claims arising from the sale of ancillary insurance products including but not limited to supplemental liability, personal effects protection and personal accident insurance. These obligations represent an estimate for both reported claims not yet paid and claims incurred but not yet reported. The estimated reserve requirements for such claims are recorded on an undiscounted basis utilizing actuarial methodologies and various assumptions which include, but are not limited to, the Company’s historical loss experience and projected loss development factors. The required liability is also subject to adjustment in the future based upon changes in claims experience, including changes in the number of incidents for which the Company is ultimately liable and changes in the cost per incident. These amounts are included within accounts payable and other current liabilities and other non-current liabilities.
The Consolidated Balance Sheets also include liabilities of approximately $71 million and $70 million as of December 31, 2016 and 2015, respectively, related to workers’ compensation, health and welfare and other employee benefit programs. The liabilities represent an estimate for both reported claims not yet paid and claims incurred but not yet reported, utilizing actuarial methodologies similar to those mentioned above. These amounts are included within accounts payable and other current liabilities and other non-current liabilities.
Stock-Based Compensation
Stock-based compensation cost is measured at the grant date, based on the fair value of the award, and is recognized as expense on a straight-line basis over the vesting period. The Company’s policy is to record compensation expense for stock options, and restricted stock units that are time- and performance-based, for the portion of the award that is expected to vest. Compensation expense related to market-based restricted stock units is recognized provided that the requisite service is rendered, regardless of when, if ever, the market condition is satisfied. We estimate the fair value of restricted stock units using the market price of the Company’s common stock on the date of grant. We estimate the fair value of stock-based and cash unit awards containing a market condition using a Monte Carlo simulation model. Key inputs and assumptions used in the Monte Carlo simulation model include the stock price of the award on the grant date, the expected term, the risk-free interest rate over the expected term, the expected annual dividend yield and the expected stock price volatility. The expected volatility is based on a combination of the historical and implied volatility of the Company’s publicly traded, near-the-money stock options, and the valuation period is based on the vesting period of the awards. The risk-free interest rate is derived from the U.S. Treasury yield curve in effect at the time of grant and, since the Company does not currently pay or plan to pay a dividend on its common stock, the expected dividend yield was zero.
Business Combinations
The Company uses the acquisition method of accounting for business combinations, which requires that the assets acquired and liabilities assumed be recorded at their respective fair values at the date of acquisition. Assets acquired and liabilities assumed in a business combination that arise from contingencies are recognized if fair value can be reasonably estimated at the acquisition date. The excess, if any, of (i) the fair value of the consideration transferred by the acquirer and the fair value of any non-controlling interest remaining in the acquiree, over (ii) the fair values of the identifiable net assets acquired is recorded as goodwill. Gains and losses on the re-acquisition of license agreements are recorded in the Consolidated Statements of Operations within transaction-related costs, net, upon completion of the respective acquisition. Costs incurred to effect a business combination are expensed as incurred, except for the cost to issue debt related to the acquisition.
The Company records contingent consideration resulting from a business combination at its fair value on the acquisition date. The fair value of the contingent consideration is generally estimated by utilizing a Monte Carlo simulation technique, based on a range of possible future results (Level 3). Any changes in contingent consideration are recorded in transaction-related costs, net. During 2015, the Company paid $18 million of contingent consideration associated with the acquisition of Apex, which consisted of $9 million related to the liability recognized at fair value as of the acquisition date and $13 million related to fair value adjustments previously recognized in earnings, partially offset by $4 million of favorable currency exchange rate movements.
Transaction-related Costs, net
Transaction-related costs, net are classified separately in the Consolidated Statements of Operations. These costs are comprised of expenses related to acquisition-related activities such as due-diligence and other advisory costs, expenses related to the integration of the acquiree’s operations with those of the Company, including the implementation of best practices and process improvements, non-cash gains and losses related to re-acquired rights, expenses related to pre-acquisition contingencies and contingent consideration related to acquisitions.
Currency Transactions
Currency gains and losses resulting from foreign currency transactions are generally included in operating expenses within the Consolidated Statement of Operations; however, the net gain or loss of currency transactions on intercompany loans and the unrealized gain or loss on intercompany loan hedges are included within interest expense related to corporate debt, net. During the years ended December 31, 2016, 20152018 and 2014,2017, the Company recorded lossesa gain of $3 million, in each period, and during the year ended December 31, 2016, the Company recorded a loss of $6 million $11on such items.
Self-Insurance Reserves
The Consolidated Balance Sheets include $421 million and $422 million of liabilities associated with retained risks of liability to third parties as of December 31, 2018 and 2017, respectively. Such liabilities relate primarily to public liability and third-party property damage claims, as well as claims arising from the sale of ancillary insurance products including but not limited to supplemental liability, personal effects protection and personal accident insurance. These obligations represent an estimate for both reported claims not yet paid and claims incurred but not yet reported. The estimated reserve requirements for such claims are recorded on an undiscounted basis utilizing actuarial methodologies and various assumptions which include, but are not limited to, the Company’s historical loss experience and projected loss development factors. The required liability is also subject to adjustment in the future based upon changes in claims experience, including changes in the number of incidents for which the Company is ultimately liable and changes in the cost per incident. These amounts are included within accounts payable and other current liabilities and other non-current liabilities.
The Consolidated Balance Sheets also include liabilities of approximately $60 million and $66 million as of December 31, 2018 and 2017, respectively, related to workers’ compensation, health and welfare and other employee benefit programs. The liabilities represent an estimate for both reported claims not yet paid and claims incurred but not yet reported, utilizing actuarial methodologies similar to those described above. These amounts are included within accounts payable and other current liabilities and other non-current liabilities.
Stock-Based Compensation
Stock-based compensation cost is measured at the grant date, based on the fair value of the award, and is recognized as expense on a straight-line basis over the vesting period. The Company’s policy is to record compensation expense for stock options, and restricted stock units that are time- and performance-based, for the portion of the award that vests. Compensation expense related to market-based restricted stock units is recognized provided that the requisite service is rendered, regardless of when, if ever, the market condition is satisfied. We estimate the fair value of restricted stock units using the market price of the Company’s common stock on the date of grant. We estimate the fair value of stock-based and cash unit awards containing a market condition using a Monte Carlo simulation model. Key inputs and assumptions
used in the Monte Carlo simulation model include the stock price of the award on the grant date, the expected term, the risk-free interest rate over the expected term, the expected annual dividend yield and the expected stock price volatility. The expected volatility is based on a combination of the historical and implied volatility of the Company’s publicly traded, near-the-money stock options, and the valuation period is based on the vesting period of the awards. The risk-free interest rate is derived from the U.S. Treasury yield curve in effect at the time of grant and, since the Company does not currently pay or plan to pay a dividend on its common stock, the expected dividend yield was zero.
Business Combinations
The Company uses the acquisition method of accounting for business combinations, which requires that the assets acquired and liabilities assumed be recorded at their respective fair values at the date of acquisition. Assets acquired and liabilities assumed in a business combination that arise from contingencies are recognized if fair value can be reasonably estimated at the acquisition date. The excess, if any, of (i) the fair value of the consideration transferred by the acquirer and the fair value of any non-controlling interest remaining in the acquiree, over (ii) the fair values of the identifiable net assets acquired is recorded as goodwill. Gains and losses on the re-acquisition of license agreements are recorded in the Consolidated Statements of Operations within transaction-related costs, net, upon completion of the respective acquisition. Costs incurred to effect a business combination are expensed as incurred, except for the cost to issue debt related to the acquisition.
The Company records contingent consideration resulting from a business combination at its fair value on the acquisition date. The fair value of the contingent consideration is generally estimated by utilizing a Monte Carlo simulation technique, based on a range of possible future results (Level 3). Any changes in contingent consideration are recorded in transaction-related costs, net.
Transaction-related Costs, net
Transaction-related costs, net are classified separately in the Consolidated Statements of Operations. These costs are comprised of expenses related to acquisition-related activities such as due-diligence and other advisory costs, expenses related to the integration of the acquiree’s operations with those of the Company, including the implementation of best practices and process improvements, non-cash gains and losses related to re-acquired rights, expenses related to pre-acquisition contingencies and contingent consideration related to acquisitions.
Investments
Joint venture investments are typically accounted for under the equity method of accounting. Under this method, the Company records its proportional share of the joint venture’s net income or loss within operating expenses in the Consolidated Statements of Operations. The Company assesses equity method investments for impairment whenever events or changes in circumstances indicate that the carrying amounts of such investments may not be recoverable. Any difference between the carrying value of the equity method investment and its estimated fair value is recognized as an impairment charge if the loss in value is deemed other than temporary. As of December 31, 2018 and 2017, the Company had investments in joint ventures with a carrying value of $48 million and $9$32 million, respectively, recorded within other non-current assets on the Consolidated Balance Sheets.
Aggregate realized gains and losses on equity investments and dividend income are recorded within operating expenses on the Consolidated Statements of Operations. During 2018, the amounts realized from the sale of equity investments and dividend income was $5 million and during 2017 and 2016, the amounts were not material.
Divestitures
The Company classifies long-lived assets and liabilities to be disposed of as held for sale in the period in which they are available for immediate sale in their present condition and the sale is probable and expected to be completed within one year. The Company initially measures assets and liabilities held for sale at the lower of their carrying value or fair value less costs to sell and assesses their fair value each reporting period until disposed. When the divestiture represents a strategic shift that has, or will have, a major effect on the Company’s operations and financial results, the disposal is presented as a discontinued operation.
During 2018, the Company, entered into a definitive stock purchase agreement “Purchase Agreement” to sell the Company’s 50% equity method investment in Anji Car Rental & Leasing Company Limited (“Anji”), respectively,located in China, to Shanghai Automotive Industry Sales Company, Ltd., a 50% owner of Anji. Anji’s operations are reported within the Company’s International segment. The sale is expected to close in the first half of 2019 upon receiving clearance from applicable regulatory authorities in China. As of December 31, 2018, the carrying value of the Company’s 50% equity method investment in Anji is $25 million and is recorded as assets held for sale, which is included in other non-current assets on such items.the Consolidated Balance Sheets.
During 2018, as a result of the sale of a non-core business, the Company recognized a gain of $4 million within operating expenses on the Consolidated Statement of Operations.
Nonmarketable Equity Securities
The Company classifies investments without readily determinable fair values that are not accounted for under the equity method as nonmarketable equity securities. The accounting guidance requires nonmarketable equity securities to be recorded at cost and adjusted to fair value at each reporting period. The Company applies the measurement alternative, which allows these investments to be recorded at cost, less impairment, if any, and subsequently adjust for observable price changes of identical or similar investments of the same issuer. Any changes in value are recorded within operating expenses. As of December 31, 2018, the Company’s carrying amount of nonmarketable equity securities is $8 million and is recorded within other non-current assets. There were no material adjustments made to the carrying amounts of nonmarketable equity securities during the years ended December 31, 2018 and 2017.
Adoption of New Accounting Pronouncements
Reclassification of Certain Tax Effects from Accumulated Other Comprehensive Income
On January 1, 2016,2018, as a result of a new accounting pronouncement, the Company early adopted ASU 2018-02, “Income Statement-Reporting Comprehensive Income (Topic 220): Reclassification of Certain Tax Effects from Accumulated Other Comprehensive Income,” which allows a reclassification from accumulated other comprehensive income to retained earnings for the adjustment of deferred taxes due to the reduction of the corporate income tax rate as a result of the Tax Act. Accordingly, the Company has reclassified $4 million of net tax benefits from accumulated other comprehensive loss to beginning accumulated deficit related to the following (see Note 15 - Stockholders’ Equity). Prior period amounts have not been retrospectively adjusted.
|
| | | | | | | | | | | | | | | | | | |
| Currency Translation Adjustments | | Net Unrealized Gains (Losses) on Cash Flow Hedges | | Net Unrealized Gains (Losses) on Available-for Sale Securities | | Minimum Pension Liability Adjustment | | Accumulated Other Comprehensive Income (Loss) |
| $ | 7 |
| | $ | 1 |
| | $ | — |
| | $ | (12 | ) | | $ | (4 | ) |
Improving the Presentation of Net Periodic Pension Cost and Net Periodic Postretirement Benefit Cost
On January 1, 2018, as a result of a new accounting pronouncement, the Company adopted Accounting Standards Update (“ASU”) 2015-16, “SimplifyingASU 2017-07, “Compensation—Retirement Benefits (Topic 715): Improving the Accounting for Measurement-Period Adjustments,Presentation of Net Periodic Pension Costs and Net Periodic Postretirement Benefit Cost,” which eliminatesrequires an entity to disaggregate the requirement to retrospectively account for adjustments made to provisional amountscomponents of net benefit cost recognized in a business combination at the acquisition date. Instead, the cumulative impactits consolidated statements of any adjustment will be recognized in the reporting period in which the adjustment is identified.operations. The adoption of this accounting pronouncement did not have a material impact on the Company’s Consolidated Financial Statements.
Recognition and Measurement of Financial Assets and Financial Liabilities
On January 1, 2016,2018, as a result of a new accounting pronouncement, the Company adopted ASU 2015-05, “Customer’s Accounting2016-01, “Financial Instruments—Overall (Subtopic 825-10): Recognition and Measurement of Financial Assets and Financial Liabilities” along with a related clarifying update, which makes limited amendments to the classification and measurement of financial instruments. The amendments supersede the guidance to classify equity securities with readily determinable fair values into different categories (trading or available-for-sale) and require equity securities (including other ownership interests, such as partnerships, unincorporated joint ventures, and limited liability companies) to be measured at fair value with changes in
the fair value recognized through net income. Accordingly, the Company has reclassified $2 million of net unrealized gains associated with available for Fees Paid in a Cloud Computing Arrangement,” which provides guidance for determining whether a cloud computing arrangement contains a software license that should be accounted for as internal-use software, rather than as a service contract.sale equity securities from accumulated other comprehensive loss to beginning accumulated deficit (see Note 15 - Stockholders’ Equity). The adoption of this accounting pronouncement did not have a material impact on the Company’s Consolidated Financial Statements.accounting for equity method investments.
Intra-Entity Transfers of Assets Other Than Inventory
On January 1, 2016,2018, as a result of a new accounting pronouncement, the Company adopted ASU 2014-15, “Disclosure2016-16, “Income Taxes (Topic 740): Intra-Entity Transfers of Uncertainties about an Entity’s Ability to Continue as a Going Concern,Assets Other Than Inventory,” which requires management to perform interim and annual assessments of an entity’s ability to continue as a going concern within one yearremoves the prohibition in Topic 740 against the immediate recognition of the date the financial statements are issuedcurrent and to provide related footnote
disclosures in certain circumstances.deferred income tax effects of intra-entity transfers of assets other than inventory. The adoption of this accounting pronouncement did not have an impact on the Company’s Consolidated Financial Statements.
Recently Issued Accounting PronouncementsRevenue from Contracts with Customers
On January 1, 2017,2018, as a result of a new accounting pronouncement, the Company adopted ASU 2016-09, “Improvements to Employee Share-Based Payment Accounting,” which simplifies several aspects of the accounting for employee share-based payment transactions, including the accounting for income taxes, forfeitures, minimum statutory withholding requirements and classification in the statement of cash flow. Accordingly, in the Company’s consolidated balance sheet at January 1, 2017, deferred income tax assets, net of the valuation allowance were increased by $56 million related to previously unrecognized excess tax benefits associated with equity awards, with a corresponding decrease to accumulated deficit, using the modified retrospective method.
In January 2017, the Financial Accounting Standards Board (“FASB”) issued ASU 2017-04, “Intangibles—Goodwill and Other, Simplifying the Test for Goodwill Impairment,” which requires an entity to perform its goodwill impairment test by comparing the fair value of a reporting unit with its carrying amount and to recognize an impairment charge for the amount by which the carrying amount exceeds the reporting unit’s fair value. ASU 2017-04 becomes effective for the Company on January 1, 2020. The adoption of this of this accounting pronouncement is not expected to have an impact on the Company’s Consolidated Financial Statements.
In January 2017, the FASB issued ASU 2017-01, “Business Combinations, Clarifying the Definition of a Business,” which assists entities in evaluating whether transactions should be accounted for as acquisitions of assets or businesses. ASU 2017-01 becomes effective for the Company on January 1, 2018. The adoption of this accounting pronouncement is not expected to have a material impact on the Company’s Consolidated Financial Statements.
In November 2016, the FASB issued ASU 2016-18, “Statement of Cash Flows, Restricted Cash,” which clarifies guidance on the classification and presentation of restricted cash in the statement of cash flows. ASU 2016-18 becomes effective for the Company on January 1, 2018. The adoption of this accounting pronouncement will impact the presentation of restricted cash in the Company’s Consolidated Statements of Cash Flows.
In August 2016, the FASB issued ASU 2016-15, “Classification of Certain Cash Receipts and Cash Payments,” which clarifies guidance on the classification of certain cash receipts and cash payments in the statement of cash flow. ASU 2016-15 becomes effective for the Company on January 1, 2018. The adoption of this accounting pronouncement is not expected to have a material impact on the Company’s Consolidated Financial Statements.
In February 2016, the FASB issued ASU 2016-02, “Leases,” which requires a lessee to recognize all long-term leases on its balance sheet as a liability for its lease obligation, measured at the present value of lease payments not yet paid, and a corresponding asset representing its right to use the underlying asset over the lease term and expands disclosure of key information about leasing arrangements. The ASU does not significantly change a lessee’s recognition, measurement and presentation of expenses and cash flows. Additionally, ASU 2016-02 aligns key aspects of lessor accounting with the new revenue recognition guidance in ASU 2014-09, “Revenue from Contracts with Customers” (see below). ASU 2016-02 becomes effective for the Company on January 1, 2019. Early adoption is permitted. In transition, lessees and lessors are required to recognize and measure leases at the beginning of the earliest period presented using a modified retrospective approach which includes a number of optional practical expedients that entities may elect to apply. The Company is currently evaluating and planning for the implementation of this ASU, including assessing its overall impact, and expects most of its operating lease commitments will be subject to the new standard and recognized as operating lease liabilities and right-of-use assets upon adoption, which will materially increase total assets and total liabilities relative to such amounts prior to adoption.
In January 2016, the FASB issued ASU 2016-01, “Recognition and Measurement of Financial Assets and Financial Liabilities,” which makes limited amendments to the classification and measurement of financial instruments. The new standard amends certain disclosure requirements associated with the fair value of
financial instruments. ASU 2016-01 becomes effective for the Company on January 1, 2018. The adoption of this accounting pronouncement is not expected to have a material impact on the Company’s Consolidated Financial Statements.
In May 2014, the FASB issued ASU 2014-09, “Revenue from Contracts with Customers (Topic 606),” which outlines a single model for entities to use in accounting for revenue arising from contracts with customers and supersedes current revenue recognition guidance. The new guidance applies to all contracts with customers except for leases, insurance contracts, financial instruments, certain nonmonetary exchanges and certain guarantees. Also, additional disclosures are required about the nature, amount, timing and uncertainty of revenue and cash flows arising from customer contracts, including significant judgments and changes in judgments. The Company has adopted the requirements of the new standard on a modified retrospective basis applied to all contracts. Prior periods have not been retrospectively adjusted. As discussed in Leases below, the Company’s rental related revenues will be accounted for under Topic 606 until the adoption of ASU 2014-092016-02, “Leases (Topic 842)” on January 1, 2019. Under Topic 606, each transaction that generates customer loyalty points results in the deferral of revenue generally equivalent to the estimated retail value of points expected to be redeemed. The associated revenue will be recognized at the time the customer redeems the loyalty points. Previously, the Company did not defer revenue and recorded an expense associated with the incremental cost of providing the future rental at the time when the loyalty points were earned. In the Company’s Consolidated Balance Sheet at January 1, 2018, customer loyalty program liability increased approximately $50 million related to the estimated retail value of customer loyalty points earned, with a corresponding increase to accumulated deficit (approximately $40 million, net of tax) due to the cumulative impact of adopting Topic 606. Certain customers may receive cash-based rebates, which are accounted for as variable consideration under Topic 606. The Company estimates these rebates based on the expected amount to be provided to customers and reduces revenue recognized.
The impact of adoption of Topic 606 on the Company’s Consolidated Statement of Comprehensive Income for the year ended December 31, 2018 and Consolidated December 31, 2018 Balance Sheet was as follows:
|
| | | | | | | | | | | |
| | Year Ended December 31, 2018 |
| | As Reported | | Balances without Adoption of Topic 606 | | Effect of Change |
| Consolidated Statement of Comprehensive Income | | | | | |
| Revenues | $ | 9,124 |
| | $ | 9,124 |
| | $ | — |
|
| | | | | | |
| Expenses | | | | | |
| Operating | 4,639 |
| | 4,642 |
| | (3 | ) |
| Total expenses | 8,857 |
| | 8,860 |
| | (3 | ) |
| | | | | | |
| Income before income taxes | 267 |
| | 264 |
| | 3 |
|
| Provision for income taxes | 102 |
| | 101 |
| | 1 |
|
| Net income | $ | 165 |
| | $ | 163 |
| | $ | 2 |
|
| | | | | | |
| Comprehensive income | $ | 62 |
| | $ | 60 |
| | $ | 2 |
|
| | | | | | |
| | December 31, 2018 |
| | As Reported | | Balances without Adoption of Topic 606 | | Effect of Change |
| Consolidated Balance Sheet | | | | | |
| Deferred income taxes | $ | 1,301 |
| | $ | 1,292 |
| | $ | 9 |
|
| Total assets exclusive of assets under vehicle programs | 6,370 |
| | 6,361 |
| | 9 |
|
| Total assets | 19,149 |
| | 19,140 |
| | 9 |
|
| | | | | | |
| Accounts payable and other current liabilities | 1,693 |
| | 1,688 |
| | 5 |
|
| Total current liabilities | 1,716 |
| | 1,711 |
| | 5 |
|
| | | | | | |
| Other non-current liabilities | 767 |
| | 725 |
| | 42 |
|
| Total liabilities exclusive of liabilities under vehicle programs | 6,011 |
| | 5,964 |
| | 47 |
|
| | | | | | |
| Accumulated deficit | (1,091 | ) | | (1,053 | ) | | (38 | ) |
| Total stockholders’ equity | $ | 414 |
| | $ | 452 |
| | $ | (38 | ) |
Income Taxes
In January 2018, the FASB issued FASB Staff Question and Answer Topic 740, No. 5: Accounting for Global Intangible Low-Taxed Income (“GILTI”), which provides guidance on accounting for the GILTI provisions of the Tax Act. The GILTI provisions impose a tax on foreign income in excess of a deemed return on tangible assets of foreign corporations. The guidance allows accounting for tax on GILTI to be treated as a deferred tax item or as a component of current period income tax expense in the year incurred, subject to an accounting policy election. The Company has elected to account for tax on GILTI as a component of current period income tax expense in the year incurred.
Recently Issued Accounting Pronouncements
Nonemployee Share-Based Payment Accounting
On January 1, 2019, as the result of a new accounting pronouncement, the Company adopted ASU 2018-07, “Stock Compensation (Topic 718): Improvements to Nonemployee Share-Based Payment Accounting,” which simplifies the accounting for share-based payments granted to nonemployees for goods and services and aligns most of the guidance on such payments to nonemployees with the requirements for share-based payments granted to employees. The adoption of this accounting pronouncement will not have an impact on the Company's Consolidated Financial Statements.
Accounting for Hedging Activities
On January 1, 2019, as the result of a new accounting pronouncement, the Company adopted ASU 2017-12, “Derivatives and Hedging (Topic 815): Targeted Improvements to Accounting for Hedging Activities,” which amends the existing guidance to allow companies to more accurately present the economic results of an entity’s risk management activities in the financial statements. The adoption of this accounting pronouncement will not have a material impact on the Company’s Consolidated Financial Statements.
Leases
On January 1, 2019, as the result of a new accounting pronouncement, the Company adopted ASU 2016-02, “Leases (Topic 842)” along with related updates, which require a lessee to recognize all long-term leases on its balance sheet as a liability for its lease obligation, measured at the present value of lease payments not yet paid, and a corresponding asset representing its right to use the underlying asset over the lease term and expands disclosure of key information about leasing arrangements. Topic 842 does not significantly change a lessee’s recognition, measurement and presentation of expenses and cash flows. Additionally, Topic 842 aligns key aspects of lessor accounting with the revenue recognition guidance in Topic 606 (see Revenue from Contracts with Customers above). The Company elected available practical expedients for existing or expired contracts of lessees and lessors wherein the Company is not required to reassess whether such contracts contain leases, the lease classification or the initial direct costs.The Company is not utilizing the practical expedient which allows the use of hindsight by lessees and lessors in determining the lease term and in assessing impairment of its right of use assets. Additionally, the Company elected as accounting policies to not recognize right of use assets or lease liabilities for short-term leases (i.e. those with a term of 12 months or less) and, by class of underlying asset, to combine lease and non-lease components in the contract. The Company utilized the transition method allowing entities to only apply the new lease standard in the year of adoption.
Adoption of this standard will result in most of the Company’s operating lease commitments being recognized as operating lease liabilities and right-of-use assets, which will increase total assets and total liabilities by approximately $3 billion. The Company has determined portions of its vehicle rental contracts that convey the right to control the use of identified assets are within the scope of the accounting guidance contained in Topic 842. As discussed in Revenue from Contracts with Customers above, the Company’s rental related revenues have been accounted for under the revenue accounting standards, until the adoption of Topic 842 on January 1, 2019.
Intangibles—Goodwill and Other—Internal-Use Software
In August 2018, the Financial Accounting Standards Board (“FASB”) issued ASU 2018-15 “Customer’s Accounting for Fees Paid in a Cloud Computing Arrangement That Is a Service Contract”, which provides guidance for determining when the arrangement includes a software license. The amendments align the requirements for capitalizing implementation costs incurred in a hosting arrangement that is a service contract with the requirements for capitalizing implementation costs incurred to develop or obtain internal-use software (and hosting arrangements that include an internal use software license). The amendments in this Update also require the entity to expense the capitalized implementation costs of a hosting arrangement that is a service contract over the term of the hosting arrangement, to present the expense in the same line in its statement of income as the fees associated with the hosting element (service) of the arrangement and classify payments for capitalized implementation costs in its statement of cash flows in the same manner as payments made for fees associated with the hosting element. The entity is also required to present the capitalized implementation costs in its balance sheet in the same line that a prepayment for the fees of the associated hosting arrangement would be presented. ASU 2018-15 becomes effective for the Company on January 1, 2018 and may be adopted on either a full or modified retrospective basis.2020. Early adoption is permitted. The Company is currently evaluating the impact of adopting this accounting pronouncement on its Consolidated Financial Statements.
Compensation—Retirement Benefits—Defined Benefit Plans
In August 2018, the FASB issued ASU 2018-14, “Disclosure Framework—Changes to the Disclosure Requirements for Defined Benefit Plans,” which adds, removes, and planningclarifies disclosure requirements related to defined benefit pension and other postretirement plans. These changes are part of the FASB’s disclosure framework project, which the Board launched in 2014 to improve the effectiveness of disclosures in notes to financial statements. ASU 2018-14 becomes effective for the implementationCompany on January 1, 2021. Early adoption is permitted. The adoption of this accounting pronouncement is not expected to have a material impact on the Company's Consolidated Financial Statements.
Fair Value Measurement
In August 2018, the FASB issued ASU 2018-13, “Disclosure Framework—Changes to the Disclosure Requirements for Fair Value Measurement,” which adds, removes, and modifies disclosure requirements related to fair value measurements. ASU 2018-13 becomes effective for the Company on January 1, 2020. Early adoption is permitted. The adoption of this accounting pronouncement is not expected to have a material impact on the Company's Consolidated Financial Statements.
Measurement of Credit Losses on Financial Instruments
In June 2016, the FASB issued ASU 2016-13, “Financial Instruments—Credit Losses (Topic 326): Measurement of Credit Losses on Financial Instruments,” which sets forth a current expected credit loss impairment model for financial assets that replaces the current incurred loss model. This model requires a financial asset (or group of financial assets), including assessing its overalltrade receivables, measured at amortized cost to be presented at the net amount expected to be collected with an allowance for credit losses deducted from the amortized cost basis. The allowance for credit losses should reflect management’s current estimate of credit losses that are expected to occur over the remaining life of a financial asset. ASU 2016-13 becomes effective for the Company on January 1, 2020. Early adoption is permitted as of January 1, 2019. The adoption of this accounting pronouncement is not expected to have a material impact and expectson the guidance will affect its accounting for certain contracts.Company's Consolidated Financial Statements.
3. Earnings Per Share
The following table sets forth the computation of basic and diluted earnings per share (“EPS”) (shares in millions):
| | | | | Year Ended December 31, | | Year Ended December 31, |
| | | 2016 | | 2015 | | 2014 | | 2018 | | 2017 | | 2016 |
| Net income for basic EPS | $ | 163 |
| | $ | 313 |
| | $ | 245 |
| |
| Convertible debt interest, net of tax | — |
| | — |
| | 1 |
| |
| Net income for diluted EPS | $ | 163 |
| | $ | 313 |
| | $ | 246 |
| |
| Net income for basic and diluted EPS | | Net income for basic and diluted EPS | $ | 165 |
| | $ | 361 |
| | $ | 163 |
|
| | | | | | | | | | | | | |
| Basic weighted average shares outstanding | Basic weighted average shares outstanding | 92.0 |
| | 103.4 |
| | 105.4 |
| Basic weighted average shares outstanding | 79.3 |
| | 83.4 |
| | 92.0 |
|
| Options and non-vested stock | Options and non-vested stock | 1.3 |
| | 1.6 |
| | 2.1 |
| Options and non-vested stock | 0.8 |
| | 1.4 |
| | 1.3 |
|
| Convertible debt | — |
| | — |
| | 3.1 |
| |
| Diluted weighted average shares outstanding | Diluted weighted average shares outstanding | 93.3 |
| | 105.0 |
| | 110.6 |
| Diluted weighted average shares outstanding | 80.1 |
| | 84.8 |
| | 93.3 |
|
| | | | | | | | | | | | | |
| Earnings per share: | Earnings per share: | | | | | | Earnings per share: | | | | | |
| | Basic | $ | 1.78 |
| | $ | 3.02 |
| | $ | 2.32 |
| Basic | $ | 2.08 |
| | $ | 4.32 |
| | $ | 1.78 |
|
| | Diluted | $ | 1.75 |
| | $ | 2.98 |
| | $ | 2.22 |
| Diluted | $ | 2.06 |
| | $ | 4.25 |
| | $ | 1.75 |
|
The following table summarizes the Company’s outstanding common stock equivalents that were anti-dilutive and therefore excluded from the computation of diluted EPS (shares in millions):
|
| | | | | | | | |
| | As of December 31, |
| | 2016 | | 2015 | | 2014 |
Non-vested stock (a) | 0.2 |
| | 0.1 |
| | — |
|
|
| | | | | | | | |
| | As of December 31, |
| | 2018 | | 2017 | | 2016 |
Non-vested stock (a) | 0.2 |
| | 0.5 |
| | 0.2 |
|
__________
| |
(a) | The weighted average grant date fair value for anti-dilutive non-vested stock for 2018, 2017 and 2016 was $48.66, $38.40 and 2015 was $52.07, and $61.15, respectively. |
4. Restructuring and Other Related Charges
Restructuring
During first quarter 2018, the Company initiated a strategic restructuring plan to improve processes and reduce headcount in response to its new workforce planning technology that allows more effective management of staff levels (“Workforce planning”). During the year ended December 31, 2018, as part of this process, the Company formally communicated the termination of employment to approximately 190 employees, and as of December 31, 2018, the Company had terminated the employment of approximately 180 of these employees. The costs associated with this initiative primarily represent severance, outplacement services and other costs associated with employee terminations, the majority of which have been or are expected to be settled in cash. The Company expects no further restructuring expense related to this initiative. This initiative is substantially complete.
During fourth quarter 2017, the Company initiated a strategic restructuring initiative to better position its truck rental operations in the U.S., in which it closed certain rental locations and reduced the size of the older rental fleet, with the intent to increase fleet utilization and reduce vehicle and overhead costs (“Truck initiative”). During the year ended December 31, 2017, as part of this initiative, the Company formally communicated the termination of employment to approximately 25 employees and as of December 31, 2018 this initiative is substantially complete.
During first quarter 2017, the Company initiated a strategic restructuring initiative to drive operational efficiency throughout the organization by reducing headcount, improving processes and consolidating functions, closing certain rental locations and decreasing the size of its fleet (“T17”). During the year ended December 31, 2017, as part of this initiative, the Company formally communicated the termination of employment to approximately 680 employees, and as of December 31, 2018, the Company had terminated the employment of approximately 675 of these employees. The costs associated with this initiative primarily represent severance, outplacement services and other costs associated with employee terminations, the majority of which have been or are expected to be settled in cash. This initiative is substantially complete.
In 2014, the Company committed to various strategic initiatives to identify best practices and drive efficiency throughout its organization, by reducing headcount, improving processes and consolidating functions (the “T15 restructuring”(“T15”). In first quarter 2016, the Company expanded the T15 restructuring to take advantage of additional efficiency opportunities. The expanded T15 restructuring fits within the initiative’s focus areas to identify best practices and drive efficiency throughout the organization, including the consolidation of rental locations. During the yearsyear ended December 31, 2016, 2015 and 2014, as part of this process, the Company formally communicated the termination of employment to approximately 615 325 and 75 employees, respectively.employees. At December 31 2016,2018, the Company had terminated approximately 945990 employees as part of these employees.this initiative. The costs associated with this initiative primarily represent severance, outplacement services and other costs associated with employee terminations, the majority of which have been or are expected to be settled in cash. This initiative is substantially complete.
In conjunction with previous acquisitions, the Company identified opportunities to integrate and streamline its operations, primarily in Europe (the “Acquisition integration”). During the years ended December 31, 2016 and 2015, as part of this process, the Company formally communicated the termination of employment to approximately 115 and 180 employees, respectively. At December 31, 2016, the Company had terminated approximately 255 of these employees. The Company expects further restructuring expense of approximately $2 million related to this initiative to be incurred in 2017.
In 2011, subsequent to the acquisition of Avis Europe plc, the Company initiated restructuring initiatives, identifying synergies across the Company, enhancing organizational efficiencies and consolidating and rationalizing processes (the “Avis Europe restructuring”). During the year ended December 31, 2014, as part of this process, the Company formally communicated the termination of employment to approximately 230 employees. The costs associated with severance, outplacement services and other costs associated with employee terminations were settled in cash. This initiative is complete.
The following tables summarize the change to our restructuring-related liabilities and identify the amounts recorded within the Company’s reporting segments for restructuring charges and corresponding payments and utilizations:
|
| | | | | | | | | | | | | | | | |
| | | Personnel Related | | Facility Related | | Other (a) | | Total |
| Balance as of January 1, 2014 | $ | 17 |
| | $ | 5 |
| | $ | — |
| | $ | 22 |
|
| | T15 restructuring expense | 5 |
| | — |
| | — |
| | 5 |
|
| | Avis Europe restructuring expense | 20 |
| | 1 |
| | — |
| | 21 |
|
| | T15 restructuring payment | (1 | ) | | — |
| | — |
| | (1 | ) |
| | Avis Europe restructuring payment | (27 | ) | | (3 | ) | | — |
| | (30 | ) |
| Balance as of December 31, 2014 | 14 |
| | 3 |
| | — |
| | 17 |
|
| | T15 restructuring expense | 9 |
| | — |
| | — |
| | 9 |
|
| | Acquisition integration expense | 9 |
| | — |
| | — |
| | 9 |
|
| | Avis Europe restructuring payment | (7 | ) | | (2 | ) | | — |
| | (9 | ) |
| | T15 restructuring payment | (12 | ) | | — |
| | — |
| | (12 | ) |
| | Acquisition integration payment | (3 | ) | | — |
| | — |
| | (3 | ) |
| Balance as of December 31, 2015 | 10 |
| | 1 |
| | — |
| | 11 |
|
| | T15 restructuring expense | 15 |
| | 1 |
| | 5 |
| | 21 |
|
| | Acquisition integration expense | 9 |
| | — |
| | — |
| | 9 |
|
| | Avis Europe restructuring expense | (1 | ) | | — |
| | — |
| | (1 | ) |
| | T15 restructuring payment | (12 | ) | | (1 | ) | | (5 | ) | | (18 | ) |
| | Acquisition integration payment | (15 | ) | | — |
| | — |
| | (15 | ) |
| | Avis Europe restructuring payment | (1 | ) | | — |
| | — |
| | (1 | ) |
| Balance as of December 31, 2016 | $ | 5 |
| | $ | 1 |
| | $ | — |
| | $ | 6 |
|
|
| | | | | | | | | | | | | | | |
| | Personnel Related | | Facility Related | | Other (a) | | Total |
| Balance as of January 1, 2016 | $ | 10 |
| | $ | 1 |
| | $ | — |
| | $ | 11 |
|
| Restructuring expense: | | | | | | | |
| T15 | 15 |
| | 1 |
| | 5 |
| | 21 |
|
| Acquisition integration | 9 |
| | — |
| | — |
| | 9 |
|
| Avis Europe | (1 | ) | | — |
| | — |
| | (1 | ) |
| Restructuring payment/utilization: | | | | | | | |
| T15 | (12 | ) | | (1 | ) | | (5 | ) | | (18 | ) |
| Acquisition integration | (15 | ) | | — |
| | — |
| | (15 | ) |
| Avis Europe | (1 | ) | | — |
| | — |
| | (1 | ) |
| Balance as of December 31, 2016 | 5 |
| | 1 |
| | — |
| | 6 |
|
| Restructuring expense: | | | | | | | |
| Truck initiative | 1 |
| | — |
| | 4 |
| | 5 |
|
| T17 | 20 |
| | — |
| | 15 |
| | 35 |
|
| Restructuring payment/utilization: | | | | | | | |
| Truck initiative | (1 | ) | | — |
| | (4 | ) | | (5 | ) |
| T17 | (17 | ) | | (1 | ) | | (15 | ) | | (33 | ) |
| T15 | (3 | ) | | — |
| | — |
| | (3 | ) |
| Acquisition integration | (1 | ) | | — |
| | — |
| | (1 | ) |
| Balance as of December 31, 2017 | 4 |
| | — |
| | — |
| | 4 |
|
| Restructuring expense: | | | | | | | |
| Workforce planning | 11 |
| | — |
| | 2 |
| | 13 |
|
| Truck initiative | 1 |
| | — |
| | 4 |
| | 5 |
|
| T17 | — |
| | — |
| | 2 |
| | 2 |
|
| T15 | 1 |
| | — |
| | — |
| | 1 |
|
| Restructuring payment/utilization: | | | | | | | |
| Workforce planning | (11 | ) | | — |
| | (1 | ) | | (12 | ) |
| Truck initiative | (1 | ) | | — |
| | (4 | ) | | (5 | ) |
| T17 | (3 | ) | | — |
| | (2 | ) | | (5 | ) |
| T15 | (1 | ) | | — |
| | — |
| | (1 | ) |
| Balance as of December 31, 2018 | $ | 1 |
| | $ | — |
| | $ | 1 |
| | $ | 2 |
|
__________
| |
(a) | Includes expenses primarily related to the disposition of vehicles. |
|
| | | | | | | | | | | | |
| | | Americas | | International | | Total |
| Balance as of January 1, 2014 | $ | 1 |
| | $ | 21 |
| | $ | 22 |
|
| | T15 restructuring expense | 4 |
| | 1 |
| | 5 |
|
| | Avis Europe restructuring expense | 4 |
| | 17 |
| | 21 |
|
| | T15 restructuring payment | (1 | ) | | — |
| | (1 | ) |
| | Avis Europe restructuring payment | (4 | ) | | (26 | ) | | (30 | ) |
| Balance as of December 31, 2014 | 4 |
| | 13 |
| | 17 |
|
| | T15 restructuring expense | 6 |
| | 3 |
| | 9 |
|
| | Acquisition integration expense | 1 |
| | 8 |
| | 9 |
|
| | Avis Europe restructuring payment | (1 | ) | | (8 | ) | | (9 | ) |
| | T15 restructuring payment | (8 | ) | | (4 | ) | | (12 | ) |
| | Acquisition integration payment | (1 | ) | | (2 | ) | | (3 | ) |
| Balance as of December 31, 2015 | 1 |
| | 10 |
| | 11 |
|
| | T15 restructuring expense | 11 |
| | 10 |
| | 21 |
|
| | Acquisition integration expense | — |
| | 9 |
| | 9 |
|
| | Avis Europe restructuring expense | — |
| | (1 | ) | | (1 | ) |
| | T15 restructuring payment | (11 | ) | | (7 | ) | | (18 | ) |
| | Acquisition integration payment | — |
| | (15 | ) | | (15 | ) |
| | Avis Europe restructuring payment | — |
| | (1 | ) | | (1 | ) |
| Balance as of December 31, 2016 | $ | 1 |
| | $ | 5 |
| | $ | 6 |
|
|
| | | | | | | | | | | |
| | Americas | | International | | Total |
| Balance as of January 1, 2016 | $ | 1 |
| | $ | 10 |
| | $ | 11 |
|
| Restructuring expense: | | | | | |
| T15 | 11 |
| | 10 |
| | 21 |
|
| Acquisition integration | — |
| | 9 |
| | 9 |
|
| Avis Europe | — |
| | (1 | ) | | (1 | ) |
| Restructuring payment/utilization: | | | | | |
| T15 | (11 | ) | | (7 | ) | | (18 | ) |
| Acquisition integration | — |
| | (15 | ) | | (15 | ) |
| Avis Europe | — |
| | (1 | ) | | (1 | ) |
| Balance as of December 31, 2016 | 1 |
| | 5 |
| | 6 |
|
| Restructuring expense: | | | | | |
| Truck initiative | 5 |
| | — |
| | 5 |
|
| T17 | 25 |
| | 10 |
| | 35 |
|
| Restructuring payment/utilization: | | | | | |
| Truck initiative | (5 | ) | | — |
| | (5 | ) |
| T17 | (24 | ) | | (9 | ) | | (33 | ) |
| T15 | (1 | ) | | (2 | ) | | (3 | ) |
| Acquisition integration | — |
| | (1 | ) | | (1 | ) |
| Balance as of December 31, 2017 | 1 |
| | 3 |
| | 4 |
|
| Restructuring expense: | | | | | |
| Workforce planning | 4 |
| | 9 |
| | 13 |
|
| Truck initiative | 5 |
| | — |
| | 5 |
|
| T17 | 2 |
| | — |
| | 2 |
|
| T15 | — |
| | 1 |
| | 1 |
|
| Restructuring payment/utilization: | | | | | |
| Workforce planning | (4 | ) | | (8 | ) | | (12 | ) |
| Truck initiative | (5 | ) | | — |
| | (5 | ) |
| T17 | (3 | ) | | (2 | ) | | (5 | ) |
| T15 | — |
| | (1 | ) | | (1 | ) |
| Balance as of December 31, 2018 | $ | — |
| | $ | 2 |
| | $ | 2 |
|
Officer Separation Costs
On May 12, 2017, the Company announced the resignation of David B. Wyshner as the Company’s President and Chief Financial Officer. In connection with Mr. Wyshner’s departure, the Company recorded other related charges of $7 million during the year ended December 31, 2017, inclusive of accelerated stock-based compensation expense of $2 million.
Limited Voluntary Opportunity Plans (“LVOP”)
During 2017, the Company offered voluntary termination programs to certain employees in the Americas’ field operations, shared services, and general and administrative functions for a limited time. These employees, if qualified, elected resignation from employment in return for enhanced severance benefits to be settled in cash. During the year ended December 31, 2017, the Company recorded other related charges of $16 million in connection with LVOP. As of December 31, 2018, 358 qualified employees elected to participate in the plan and the employment of all participants had been terminated.
5. Acquisitions and Other Investments
Acquisitions
2018
Turiscar Group
In October 2018, the Company completed the acquisition of Turiscar Group, a provider of vehicle rental services in Portugal, for €22 million (approximately $25 million), net of acquired cash, of which €23 million (approximately $26 million) was paid. The remaining €4 million of the purchase price will be paid during the three months ended December 31, 2020. The investment enabled the Company to strengthen and expand its commitment in the Portuguese market. The excess of the purchase price over preliminary fair value of net assets acquired was allocated to goodwill, which was assigned to the Company’s International reportable segment. In connection with this acquisition, approximately $12 million was recorded in goodwill, and other intangibles of $10 million related to customer relationships and $2 million related to trademarks were recorded. The customer relationships and trademarks are being amortized over a weighted average useful life of approximately 11 years. The goodwill is not deductible for tax purposes. The fair value of assets acquired and liabilities assumed has not been finalized and is therefore subject to change.
Morini S.p.A.
In July 2018, the Company completed the acquisition of Morini S.p.A. (”Morini”) for €35 million (approximately $40 million), net of acquired cash, plus potential earn-out payments of €5 million (approximately $6 million) based on Morini’s performance over the next two years. During the year ended December 31, 2018, the Company paid €28 million (approximately $32 million). The remaining €7 million of the purchase price will be paid during the three months ended March 31, 2020. The investment enabled the Company to expand its footprint of vehicle rental services in Northern Italy. The excess of the purchase price over preliminary fair value of net assets acquired was allocated to goodwill, which was assigned to the Company’s International reportable segment. In connection with this acquisition, approximately $42 million was recorded in goodwill, and other intangibles of $6 million related to customer relationships, $3 million related to trademarks and $2 million related to license agreements were recorded. The customer relationships, trademarks and license agreements are being amortized over a weighted average useful life of approximately six years. The goodwill is not deductible for tax purposes. The fair value of assets acquired and liabilities assumed has not been finalized and is therefore subject to change.
Avis and Budget Licensees
In 2018, the Company completed the acquisitions of various licensees in Europe and North America, for
approximately $38 million, net of acquired cash. These investments were in line with the Company’s strategy to re-acquire licensees when advantageous to expand its footprint of Company-operated locations. The acquired fleet was financed under the Company’s existing financing arrangements. In connection with these acquisitions, other intangibles of approximately $42 million related to license agreements was recorded. The license agreements are being amortized over a weighted average useful life of approximately two years. The fair value of the assets acquired and liabilities assumed has not yet been finalized and is therefore subject to change.
2017
ACL Hire Limited
In November 2017, the Company completed the acquisition of ACL Hire Limited, a vehicle rental company in the UK specializing in commercial and mid-size transit vans, for approximately $5 million, net of acquired cash, and agreed to an additional $2 million of contingent consideration which is contingent on ACL Hire Limited’s future financial performance. The excess of the purchase price over preliminary fair value of net assets acquired was allocated to goodwill, which was assigned to the Company’s International reportable segment. In connection with this acquisition, approximately $6 million was recorded in goodwill. The
goodwill is not deductible for tax purposes. Differences between the preliminary allocation of purchase price and the final allocation were not material.
Avis and Budget Licensees
During 2017, the Company completed the acquisitions of various licensees in Europe and North America, for approximately $9 million, plus $4 million for acquired fleet. These investments were in line with the Company’s strategy to re-acquire licensees when advantageous to expand its footprint of Company-operated locations. The acquired fleet was financed under the Company’s existing financing arrangements. In connection with these acquisitions, other intangibles of approximately $12 million related to license agreements was recorded. The license agreements will be amortized over a weighted average useful life of approximately three years. In addition, at the time of the acquisitions, the Company recorded $2 million in non-cash charges within transaction-related costs, net in connection with the license rights reacquired by the Company. Differences between the preliminary allocation of purchase price and the final allocation were not material for Avis and Budget Licensees.
2016
France CarsFranceCars
In December 2016, the Company completed the acquisition of France CarsFranceCars for approximately $45 million, net of acquired cash. The investment enablesenabled the Company to expand its footprint with a leading provider of vehicle rental services in France. The excess of the purchase price over preliminary fair value of net assets acquired was allocated to goodwill, which was assigned to the Company’s International reportable segment. In connection with this acquisition, approximately $23$22 million was recorded in goodwill, and other intangibles of $6 million was recorded inrelated to customer relationships and $9 million related to trademarks was recorded in other intangibles.were recorded. The customer relationships and trademarks will beare being amortized over a weighted average useful life of approximately 16 years. The fair value of the assets acquired and liabilities assumed has not yet been finalized and is therefore subject to change. The goodwill is not expected to be deductible for tax purposes.
2015
Maggiore Group
In April 2015, the Company completed the acquisition of Maggiore Group (“Maggiore”) for approximately $160 million, net of acquired cash and short-term investments. The investment enabled the Company to expand its footprint with a leading provider of vehicle rental services in Italy. The excess of the purchase price over preliminary fair value of net assets acquired was allocated to goodwill, which was assigned to the Company’s International reportable segment. In connection with this acquisition, approximately $82 million was recorded in goodwill, $50 million was recorded in customer relationships, $34 million related to trademarks were recorded in other intangibles and $11 million was recorded in license agreements. The customer relationships, trademarks and license agreements will be amortized over a weighted average useful life of approximately teneight years. The goodwill is not deductible for tax purposes. Differences between the preliminary allocation of purchase price and the final allocation were not material for Maggiore.FranceCars.
BrazilOther Investments
2018
In August 2013,March 2018, the Company made an initial equity investment of $53€16 million ($20 million) in its Brazilian licensee in Greece (“Brazil”Greece”), for a 50%20% ownership stake. Approximately $47 million of this consideration was paid in 2013 and the remaining consideration of $6 million was paid in 2014. In April 2015,June 2018, the Company acquired the remaining 50%purchased an additional 20% equity interestinvestment for €17 million ($19 million), including an acceleration premium, and as of June 30, 2018, had a 40% ownership stake in Brazil, which is now a wholly-owned subsidiary, for cash consideration of
$8 million plus $46 million principally to acquire debt interests and settle certain debt and accrued interest obligations. The acquisition enabled the Company to significantly increase its presence in the Brazilian car rental market.Greece. The Company’s initialequity investment in Brazil wasis recorded as an equity investment within other non-current assets, and theassets. The Company’s share of Brazil’s operatingGreece’s results wasare reported within operating expenses. Atexpenses and is $8 million for the year ended December 31, 2014, the Company’s investment, which was recorded in its Americas reportable segment, totaled approximately $12 million, net of an impairment charge of $33 million ($33 million, net of tax). The impairment charge was recorded at the time of the initial investment based on a combination of observable and unobservable fair value inputs (Level 3), specifically a combination of the Income approach-discounted cash flow method and the Market approach-public company market multiple method. Since the Company previously accounted for its 50% interest in Brazil as an equity-method investment, in order to recognize Brazil as a wholly-owned subsidiary in April 2015, the Company remeasured its previously held equity method investment to fair value using the Income approach-discounted cash flow method (Level 3), resulting in a loss of $8 million during 2015 as part of transaction-related costs. The results of the operations of Brazil and the fair value of its assets and liabilities have been included in the Company’s Consolidated Financial Statements from the date of the acquisition. As the fair value of the licensee’s liabilities exceeded its assets, $77 million was allocated to goodwill for the excess of the purchase price over preliminary fair value of net assets acquired, which was assigned to the Company’s Americas reportable segment and is not deductible for tax purposes. Differences between the preliminary allocation of purchase price and the final allocation were not material for Brazil.
Avis and Budget Licensees
In November and January 2015, the Company completed the acquisitions of its Avis licensee in Poland and its Avis and Budget licensees in Norway, Sweden and Denmark, respectively, for approximately $62 million, net of acquired cash. Additionally, the Company settled debt obligations of approximately $23 million in Poland. These investments enabled the Company to expand its footprint of Company-operated locations in Europe. The excess of the purchase price over preliminary fair value of net assets acquired was allocated to goodwill, which was assigned to the Company’s International reportable segment. In connection with these acquisitions, approximately $36 million was recorded in license agreements, $29 million was recorded in goodwill and $12 million was recorded in customer relationships. The license agreements and customer relationships will be amortized over a weighted average useful life of approximately eight years. In addition, at the time of acquisition, the Company recorded a $25 million non-cash charge within transaction-related costs, net in connection with license rights reacquired by the Company. The goodwill is not deductible for tax purposes. Differences between the preliminary allocation of purchase price and the final allocation were not material for Avis and Budget Licensees.
2014
Budget Licensees
During 2014, the Company completed the acquisition of its Budget licensees for Edmonton, Canada; Southern California and Las Vegas, and reacquired the right to operate the Budget brand in Portugal, for approximately $263 million, plus $132 million for acquired fleet. These investments enabled the Company to expand its footprint of Company-operated locations. The acquired fleet was financed under the Company’s existing vehicle financing arrangements. The excess of the purchase price over preliminary fair value of net assets acquired was allocated to goodwill, which was assigned to the Company’s Americas reportable segment for Edmonton, Southern California and Las Vegas and to the Company’s International reportable segment for Portugal. In connection with these acquisitions, approximately $58 million was recorded in identifiable intangible assets (consisting of $10 million related to customer relationships and $48 million related to the license agreements) and $192 million was recorded in goodwill. The customer relationships will be amortized over a weighted average useful life of approximately12 years and the license agreements will be amortized over a weighted average useful life of approximately three years. In addition, the Company recorded a non-cash gain of approximately $20 million within transaction-related costs, net in connection with license rights reacquired by the Company. The goodwill is deductible for tax purposes. Differences between the preliminary allocation of purchase price and the final allocation were not material for Edmonton, Southern California and Las Vegas and Portugal.2018.
6. Intangible Assets
Intangible assets consisted of:
| | | | As of December 31, 2016 | | As of December 31, 2015 | As of December 31, 2018 | | As of December 31, 2017 |
| | Gross Carrying Amount | | Accumulated Amortization | | Net Carrying Amount | | Gross Carrying Amount | | Accumulated Amortization | | Net Carrying Amount | Gross Carrying Amount | | Accumulated Amortization | | Net Carrying Amount | | Gross Carrying Amount | | Accumulated Amortization | | Net Carrying Amount |
| Amortized Intangible Assets | | | | | | | | | | | | | | | | | | | | | | |
License agreements (a) | $ | 261 |
| | $ | 109 |
| | $ | 152 |
| | $ | 263 |
| | $ | 81 |
| | $ | 182 |
| $ | 305 |
| | $ | 168 |
| | $ | 137 |
| | $ | 281 |
| | $ | 140 |
| | $ | 141 |
|
Customer relationships (b) | 224 |
| | 90 |
| | 134 |
| | 222 |
| | 68 |
| | 154 |
| 251 |
| | 141 |
| | 110 |
| | 242 |
| | 119 |
| | 123 |
|
Other (c) | 46 |
| | 12 |
| | 34 |
| | 41 |
| | 8 |
| | 33 |
| 52 |
| | 21 |
| | 31 |
| | 51 |
| | 18 |
| | 33 |
|
| | $ | 531 |
| | $ | 211 |
| | $ | 320 |
| | $ | 526 |
| | $ | 157 |
| | $ | 369 |
| $ | 608 |
| | $ | 330 |
| | $ | 278 |
| | $ | 574 |
| | $ | 277 |
| | $ | 297 |
|
| | | | | | | | | | | | | | | | | | | | | | | |
| Unamortized Intangible Assets | | | | | | | | | | | | | | | | | | | | | | |
| Goodwill | $ | 1,007 |
| | | | | | $ | 973 |
| | | | | $ | 1,092 |
| | | | | | $ | 1,073 |
| | | | |
| Trademarks | $ | 550 |
| | | | | | $ | 548 |
| | | | | $ | 547 |
| | | | | | $ | 553 |
| | | | |
_________
| |
(a) | Primarily amortized over a period ranging from 10 to 40 years with a weighted average life of 1816 years. |
| |
(b) | Primarily amortized over a period ranging from 3 to 20 years with a weighted average life of 12 years. |
| |
(c) | Primarily amortized over a period ranging from 3 to 2010 years with a weighted average life of 9 years. |
During 2017, the Company recorded an impairment related to the unamortized Zipcar trademark of $2 million based on a combination of observable and unobservable fair value inputs (Level 3), specifically the Income approach-relief from royalty method, which considers market inputs.
Amortization expense relating to all intangible assets was as follows:
| | | | Year Ended December 31, | Year Ended December 31, |
| | 2016 | | 2015 | | 2014 | 2018 | | 2017 | | 2016 |
| License agreements | $ | 35 |
| | $ | 31 |
| | $ | 16 |
| $ | 36 |
| | $ | 33 |
| | $ | 35 |
|
| Customer relationships | 23 |
| | 21 |
| | 18 |
| 24 |
| | 24 |
| | 23 |
|
| Other | 7 |
| | 7 |
| | 2 |
| 5 |
| | 5 |
| | 7 |
|
| Total | $ | 65 |
| | $ | 59 |
| | $ | 36 |
| $ | 65 |
| | $ | 62 |
| | $ | 65 |
|
Based on the Company’s amortizable intangible assets at December 31, 2016,2018, the Company expects related amortization expense of approximately $56 million for 2017, $42 million for 2018, $39 million for 2019, $38$48 million for 2020, and $25$34 million for 2021, $26 million for 2022 and $23 million for 2023 excluding effects of currency exchange rates.
The carrying amounts of goodwill and related changes are as follows:
|
| | | | | | | | | | | | |
| �� | | Americas | | International | | Total Company |
| Gross goodwill as of January 1, 2015 | $ | 2,066 |
| | $ | 894 |
| | $ | 2,960 |
|
| | Accumulated impairment losses as of January 1, 2015 | (1,587 | ) | | (531 | ) | | (2,118 | ) |
| Goodwill as of January 1, 2015 | 479 |
| | 363 |
| | 842 |
|
| | Acquisitions | 77 |
| | 117 |
| | 194 |
|
| | Currency translation adjustments and other | (19 | ) | | (44 | ) | | (63 | ) |
| Goodwill as of December 31, 2015 | 537 |
| | 436 |
| | 973 |
|
| | Acquisitions | 2 |
| | 23 |
| | 25 |
|
| | Currency translation adjustments and other | 13 |
| | (4 | ) | | 9 |
|
| Goodwill as of December 31, 2016 | $ | 552 |
| | $ | 455 |
| | $ | 1,007 |
|
|
| | | | | | | | | | | | |
| | | Americas | | International | | Total Company |
| | | | | | | |
| Gross goodwill as of January 1, 2017 | $ | 2,139 |
| | $ | 986 |
| | $ | 3,125 |
|
| | Accumulated impairment losses as of January 1, 2017 | (1,587 | ) | | (531 | ) | | (2,118 | ) |
| Goodwill as of January 1, 2017 | 552 |
| | 455 |
| | 1,007 |
|
| | Acquisitions | — |
| | 5 |
| | 5 |
|
| | Currency translation adjustments and other | — |
| | 61 |
| | 61 |
|
| Goodwill as of December 31, 2017 | 552 |
| | 521 |
| | 1,073 |
|
| | Acquisitions | — |
| | 54 |
| | 54 |
|
| | Currency translation adjustments and other | (13 | ) | | (22 | ) | | (35 | ) |
| Goodwill as of December 31, 2018 | $ | 539 |
| | $ | 553 |
| | $ | 1,092 |
|
| |
7. | Vehicle Rental Activities |
7. Vehicle Rental Activities
The components of vehicles, net within assets under vehicle programs are as follows:
| | | | As of December 31, | As of December 31, |
| | 2016 | | 2015 | 2018 | | 2017 |
| Rental vehicles | $ | 10,937 |
| | $ | 11,195 |
| $ | 12,548 |
| | $ | 11,652 |
|
| Less: Accumulated depreciation | (1,454 | ) | | (1,500 | ) | (1,670 | ) | | (1,652 | ) |
| | 9,483 |
| | 9,695 |
| 10,878 |
| | 10,000 |
|
| Vehicles held for sale | 981 |
| | 963 |
| 596 |
| | 626 |
|
| Vehicles, net | $ | 10,464 |
| | $ | 10,658 |
| $ | 11,474 |
| | $ | 10,626 |
|
The components of vehicle depreciation and lease charges, net are summarized below:
| | | | Year Ended December 31, | Year Ended December 31, |
| | 2016 | | 2015 | | 2014 | 2018 | | 2017 | | 2016 |
| Depreciation expense | $ | 1,877 |
| | $ | 1,837 |
| | $ | 1,840 |
| $ | 1,974 |
| | $ | 1,947 |
| | $ | 1,877 |
|
| Lease charges | 180 |
| | 156 |
| | 163 |
| 253 |
| | 222 |
| | 180 |
|
| Gain on sale of vehicles, net | (10 | ) | | (60 | ) | | (7 | ) | |
| (Gain) loss on sale of vehicles, net | | (48 | ) | | 52 |
| | (10 | ) |
| Vehicle depreciation and lease charges, net | $ | 2,047 |
| | $ | 1,933 |
| | $ | 1,996 |
| $ | 2,179 |
| | $ | 2,221 |
| | $ | 2,047 |
|
At December 31, 2016, 20152018, 2017 and 2014,2016, the Company had payables related to vehicle purchases included in liabilities under vehicle programs - other of $321472 million, $269$346 million and $222$321 million, respectively, and receivables related to vehicle sales included in assets under vehicle programs - receivables from vehicle manufacturers and other of $520$622 million, $433$545 million and $352$520 million, respectively.
8. Income Taxes
On December 22, 2017 the Tax Act made substantial changes to corporate income tax laws. Among the key provisions were a U.S. corporate tax rate reduction from 35% to 21% effective for tax years beginning January 1, 2018 and a one-time transition tax on the deemed repatriation of cumulative earnings from foreign subsidiaries and changes to U.S. taxation of foreign earnings from a worldwide to a territorial tax system effective for tax years beginning January 1, 2018. The Company recognized the effects of the Tax Act in its Consolidated Financial Statements in accordance with Staff Accounting Bulletin No. 118, which provides SEC staff guidance for the application of FASB Accounting Standards Codification Topic 740, Income Taxes, in the reporting period that the Tax Act was signed into law.
In 2017 the Company recorded a provisional income tax benefit of $317 million related to the remeasurement of its net deferred income tax liabilities as a result of the reduced corporate tax rate, and a provisional tax expense of $104 million for the one-time transition tax on the deemed repatriation of cumulative foreign subsidiary earnings.
The Company completed the accounting for the effects of the Tax Act during 2018 and recorded an additional income tax expense of $30 million for the one-time transition tax on the deemed repatriation of foreign earnings.
The provision for (benefit from) income taxes consists of the following:
| | | | | Year Ended December 31, | | Year Ended December 31, |
| | | 2016 | | 2015 | | 2014 | | 2018 | | 2017 | | 2016 |
| Current | Current | | | | | | Current | | | | | |
| | Federal | $ | (1 | ) | | $ | (32 | ) | | $ | (1 | ) | Federal | $ | (7 | ) | | $ | — |
| | $ | (1 | ) |
| | State | 3 |
| | 3 |
| | 4 |
| State | 36 |
| | 5 |
| | 3 |
|
| | Foreign | 63 |
| | 40 |
| | 79 |
| Foreign | 59 |
| | 37 |
| | 63 |
|
| | Current income tax provision | 65 |
| | 11 |
| | 82 |
| Current income tax provision | 88 |
| | 42 |
| | 65 |
|
| | | | | | | | | | | | | |
| Deferred | Deferred | | | | | | Deferred | | | | | |
| | Federal | 51 |
| | 45 |
| | 89 |
| Federal | 63 |
| | (205 | ) | | 51 |
|
| | State | 5 |
| | (1 | ) | | 2 |
| State | (39 | ) | | (5 | ) | | 5 |
|
| | Foreign | (5 | ) | | 14 |
| | (26 | ) | Foreign | (10 | ) | | 18 |
| | (5 | ) |
| | Deferred income tax provision | 51 |
| | 58 |
| | 65 |
| Deferred income tax provision | 14 |
| | (192 | ) | | 51 |
|
| Provision for income taxes | $ | 116 |
| | $ | 69 |
| | $ | 147 |
| |
| Provision for (benefit from) income taxes | | Provision for (benefit from) income taxes | $ | 102 |
| | $ | (150 | ) | | $ | 116 |
|
Pretax income for domestic and foreign operations consists of the following:
| | | | Year Ended December 31, | Year Ended December 31, |
| | 2016 | | 2015 | | 2014 | 2018 | | 2017 | | 2016 |
United States (a) | $ | 127 |
| | $ | 258 |
| | $ | 248 |
| $ | 114 |
| | $ | 17 |
| | $ | 127 |
|
| Foreign | 152 |
| | 124 |
| | 144 |
| 153 |
| | 194 |
| | 152 |
|
| Pretax income | $ | 279 |
| | $ | 382 |
| | $ | 392 |
| $ | 267 |
| | $ | 211 |
| | $ | 279 |
|
__________
| |
(a)
| For the years ended December 31, 2016, 2015 and 2014, includes corporate debt extinguishment costs of $27 million, $23 million and $56 million, respectively. |
Deferred income tax assets and liabilities are comprised of the following:
| | | | | As of December 31, | | As of December 31, |
| | | 2016 | | 2015 | | 2018 | | 2017 |
| Deferred income tax assets: | Deferred income tax assets: | | | | Deferred income tax assets: | | | |
| | Net tax loss carryforwards | $ | 1,587 |
| | $ | 1,567 |
| |
| | Accrued liabilities and deferred revenue | 281 |
| | 276 |
| Net tax loss carryforwards | $ | 1,390 |
| | $ | 1,104 |
|
| | Tax credits | 62 |
| | 76 |
| Accrued liabilities and deferred revenue | 230 |
| | 216 |
|
| | Depreciation and amortization | 2 |
| | 13 |
| Tax credits | 17 |
| | 24 |
|
| | Acquisition and integration-related liabilities | 5 |
| | 13 |
| Depreciation and amortization | 16 |
| | 4 |
|
| | Provision for doubtful accounts | 7 |
| | 7 |
| Provision for doubtful accounts | 6 |
| | 8 |
|
| | Other | 52 |
| | 46 |
| Other | 38 |
| | 50 |
|
| | Valuation allowance (a) | (357 | ) | | (351 | ) | Valuation allowance (a) | (311 | ) | | (331 | ) |
| Deferred income tax assets | Deferred income tax assets | 1,639 |
| | 1,647 |
| Deferred income tax assets | 1,386 |
| | 1,075 |
|
| | | | | | | | | |
| Deferred income tax liabilities: | Deferred income tax liabilities: | | | | Deferred income tax liabilities: | | | |
| | Depreciation and amortization | 112 |
| | 123 |
| Depreciation and amortization | 60 |
| | 121 |
|
| | Prepaid expenses | 32 |
| | 29 |
| Prepaid expenses | 20 |
| | 20 |
|
| | Other | 2 |
| | 7 |
| Other | 5 |
| | 3 |
|
| Deferred income tax liabilities | Deferred income tax liabilities | 146 |
| | 159 |
| Deferred income tax liabilities | 85 |
| | 144 |
|
| Deferred income tax assets, net | Deferred income tax assets, net | $ | 1,493 |
| | $ | 1,488 |
| Deferred income tax assets, net | $ | 1,301 |
| | $ | 931 |
|
__________
| |
(a) | The valuation allowance of $357$311 million at December 31, 20162018 relates to tax loss carryforwards foreign tax credits and certain deferred tax assets of $289 million, $39$283 million and $29$28 million, respectively. The valuation allowance will be reduced when and if the Company determines it is more likely than not that the related deferred income tax assets will be realized. The valuation allowance of $351331 million at December 31, 20152017 relates to tax loss carryforwards foreign tax credits and certain deferred tax assets of $267$302 million, $53 and $29 million, respectively. The valuation allowance will be reduced when and $31 million, respectively.if the Company determines it is more likely than not that the related deferred income tax assets will be realized. |
Deferred income tax assets and liabilities related to vehicle programs are comprised of the following:
| | | | As of December 31, | As of December 31, |
| | 2016 | | 2015 | 2018 | | 2017 |
| Deferred income tax assets: | | | | | | |
| Depreciation and amortization | $ | 52 |
| | $ | 53 |
| $ | 44 |
| | $ | 58 |
|
| | | | | | | |
| Deferred income tax liabilities: | | | | | | |
| Depreciation and amortization | 2,481 |
| | 2,420 |
| 2,005 |
| | 1,652 |
|
| Deferred income tax liabilities under vehicle programs, net | $ | 2,429 |
| | $ | 2,367 |
| $ | 1,961 |
| | $ | 1,594 |
|
At December 31, 2016,2018, the Company had U.S. federal net operating loss carryforwards of approximately $3.54.9 billion, most. The majority of whichthe net operating loss carryforwards expire in by 2031. and a significant remaining portion has an indefinite utilization period pursuant to the Tax Act. Such net operating loss carryforwards are primarily related to accelerated depreciation of the Company’s U.S. vehicles. Currently, the Company does not record valuation allowances on the majority of its U.S. federal tax loss carryforwards as there are adequate deferred tax liabilities that could be realized within the carryforward period. At December 31, 2016,2018, the Company had foreign net operating loss carryforwards of approximately $690903 million with an indefinite utilization period. No provision has been made for U.S. federal deferred income taxes on approximately $1.1 billion of accumulated and
At December 31, 2018, we have undistributed earnings of certain foreign subsidiaries at December 31, 2016, since it isof approximately $699 million that we have indefinitely reinvested, and on which we have not recognized deferred taxes. Estimating the present intentionamount of management to reinvest the undistributed earnings indefinitely in those foreign operations. Due to the variability associated with the various methods in which such earnings could be repatriated, itpotential tax is not practicable because of the complexity and variety of assumptions necessary to estimatecompute the actual amount of such deferred tax liabilities. If such earnings were repatriated and subject to taxation at the current U.S. federal tax rate, the Company would consider and pursue alternatives to reduce the tax liability.
tax.
The reconciliation between the U.S. federal income tax statutory rate and the Company’s effective income tax rate is as follows:
| | | | | Year Ended December 31, | | Year Ended December 31, |
| | | 2016 | | 2015 | | 2014 | | 2018 | | 2017 | | 2016 |
| U.S. federal statutory rate | U.S. federal statutory rate | 35.0 | % | | 35.0 | % | | 35.0 | % | U.S. federal statutory rate | 21.0 | % | | 35.0 | % | | 35.0 | % |
| Adjustments to reconcile to the effective rate: | Adjustments to reconcile to the effective rate: | | | | | | Adjustments to reconcile to the effective rate: | | | | | |
| | State and local income taxes, net of federal tax benefits | 2.0 |
| | 2.8 |
| | 3.3 |
| State and local income taxes, net of federal tax benefits | 5.5 |
| | 3.8 |
| | 2.0 |
|
| | Changes in valuation allowances | (0.2 | ) | | (0.6 | ) | | (3.0 | ) | Changes in valuation allowances | 6.3 |
| | (4.7 | ) | | (0.2 | ) |
| | Taxes on foreign operations at rates different than statutory U.S. federal rates | 3.1 |
| | 3.7 |
| | 1.4 |
| Taxes on foreign operations at rates different than statutory U.S. federal rates | (5.2 | ) | | (3.6 | ) | | 3.1 |
|
| | Resolution of a prior-year tax matter (a) | — |
| | (25.6 | ) | | — |
| Stock-based compensation | (0.8 | ) | | (3.4 | ) | | — |
|
| | Non-deductible transaction-related costs | — |
| | 0.9 |
| | — |
| Tax Act (benefit) expense | 11.2 |
| | (100.8 | ) | | — |
|
| | Other non-deductible expenses | 1.7 |
| | 1.8 |
| | 0.9 |
| Other non-deductible expenses | 1.1 |
| | 2.2 |
| | 1.7 |
|
| | Other | — |
| | 0.1 |
| | (0.1 | ) | Other | (0.9 | ) | | 0.4 |
| | — |
|
| | | 41.6 | % | | 18.1 | % | | 37.5 | % | | 38.2 | % | | (71.1 | )% | | 41.6 | % |
__________
| |
a)
| For the year ended December 31, 2015, the Company recognized a $98 million income tax benefit from the resolution of a prior-year income tax matter.
|
The following is a tabular reconciliation of the gross amount of unrecognized tax benefits for the year:
| | | | | 2016 | | 2015 | | 2014 | | 2018 | | 2017 | | 2016 |
| Balance at January 1 | Balance at January 1 | $ | 56 |
| | $ | 63 |
| | $ | 63 |
| Balance at January 1 | $ | 63 |
| | $ | 59 |
| | $ | 56 |
|
| | Additions for tax positions related to current year | 3 |
| | 6 |
| | 5 |
| Additions for tax positions related to current year | 8 |
| | 6 |
| | 3 |
|
| | Additions for tax positions for prior years | 3 |
| | 3 |
| | 5 |
| Additions for tax positions for prior years | — |
| | 9 |
| | 3 |
|
| | Reductions for tax positions for prior years | (3 | ) | | (14 | ) | | (8 | ) | Reductions for tax positions for prior years | (6 | ) | | (10 | ) | | (3 | ) |
| | Settlements | — |
| | (1 | ) | | (2 | ) | Settlements | (3 | ) | | — |
| | — |
|
| | Statute of limitations | — |
| | (1 | ) | | — |
| Statute of limitations | (1 | ) | | (1 | ) | | — |
|
| Balance at December 31 | Balance at December 31 | $ | 59 |
| | $ | 56 |
| | $ | 63 |
| Balance at December 31 | $ | 61 |
| | $ | 63 |
| | $ | 59 |
|
The Company does not anticipate that total unrecognized tax benefits will change significantly in 2017.2019.
The Company is subject to taxation in the United States and various foreign jurisdictions. As of December 31, 2016,2018, the 20132015 through 20152017 tax years generally remain subject to examination by the federal tax authorities. The 20112012 through 20152017 tax years generally remain subject to examination by various state tax
authorities. In significant foreign jurisdictions, the 20102011 through 20152017 tax years generally remain subject to examination by their respective tax authorities.
Substantially all of the gross amount of the unrecognized tax benefits at December 31, 2016, 20152018, 2017 and 2014,2016, if recognized, would affect the Company’s provision for, or benefit from, income taxes. As of December 31, 2016,2018, the Company’s unrecognized tax benefits were offset by tax loss carryforwards in the amount of $2023 million.
The following table presents unrecognized tax benefits:
| | | | As of December 31, | As of December 31, |
| | 2016 | | 2015 | 2018 | | 2017 |
Unrecognized tax benefit in non-current income taxes payable (a) | $ | 40 |
| | $ | 37 |
| $ | 41 |
| | $ | 46 |
|
Accrued interest payable on potential tax liabilities (b) | 29 |
| | 28 |
| 29 |
| | 26 |
|
__________
| |
(a) | Pursuant to the agreements governing the disposition of certain subsidiaries in 2006, the Company is entitled to indemnification for certain pre-disposition tax contingencies. As of December 31, 20162018 and 2015, $152017, $13 million in each period of unrecognized tax benefits are related to tax contingencies for which the Company believes it is entitled to indemnification. |
| |
(b) | The Company recognizes potential interest related to unrecognized tax benefits within interest expense related to corporate debt, net on the accompanying Consolidated Statements of Operations. Penalties incurred during the years ended December 31, 2016, 20152018, 2017 and 2014,2016, were not significant and were recognized as a component of the provision for income taxes. |
9. Other Current Assets
Other current assets consisted of:
| | | | As of December 31, | As of December 31, |
| | 2016 | | 2015 | 2018 | | 2017 |
| Prepaid expenses | $ | 212 |
| | $ | 192 |
| $ | 241 |
| | $ | 196 |
|
| Sales and use taxes | 153 |
| | 159 |
| 180 |
| | 174 |
|
| Other | 154 |
| | 156 |
| 183 |
| | 163 |
|
| Other current assets | $ | 519 |
| | $ | 507 |
| $ | 604 |
| | $ | 533 |
|
| |
10. | Property and Equipment, net |
10. Property and Equipment, net
Property and equipment, net consisted of:
| | | | As of December 31, | As of December 31, |
| | 2016 | | 2015 | 2018 | | 2017 |
| Land | $ | 47 |
| | $ | 50 |
| $ | 49 |
| | $ | 49 |
|
| Buildings and leasehold improvements | 597 |
| | 567 |
| 625 |
| | 626 |
|
| Capitalized software | 524 |
| | 460 |
| 613 |
| | 583 |
|
| Furniture, fixtures and equipment | 354 |
| | 332 |
| 411 |
| | 387 |
|
| Projects in process | 99 |
| | 89 |
| 169 |
| | 118 |
|
| Buses and support vehicles | 91 |
| | 93 |
| 95 |
| | 93 |
|
| | 1,712 |
| | 1,591 |
| 1,962 |
| | 1,856 |
|
| Less: Accumulated depreciation and amortization | (1,027 | ) | | (910 | ) | (1,226 | ) | | (1,152 | ) |
| Property and equipment, net | $ | 685 |
| | $ | 681 |
| $ | 736 |
| | $ | 704 |
|
Depreciation and amortization expense relating to property and equipment during 2016, 20152018, 2017 and 20142016 was $188191 million, $159197 million and $144188 million, respectively (including $8792 million, $6195 million and $4687 million, respectively, of amortization expense relating to capitalized software).
| |
11. | Accounts Payable and Other Current Liabilities |
11. Accounts Payable and Other Current Liabilities
Accounts payable and other current liabilities consisted of:
| | | | As of December 31, | As of December 31, |
| | 2016 | | 2015 | 2018 | | 2017 |
| Accounts payable | $ | 343 |
| | $ | 352 |
| $ | 371 |
| | $ | 359 |
|
| Accrued sales and use taxes | 206 |
| | 220 |
| 208 |
| | 218 |
|
| Accrued payroll and related | 173 |
| | 199 |
| 200 |
| | 176 |
|
| Accrued advertising and marketing | | 192 |
| | 190 |
|
| Public liability and property damage insurance liabilities – current | 141 |
| | 131 |
| 149 |
| | 145 |
|
| Deferred revenue – current | 114 |
| | 103 |
| 140 |
| | 135 |
|
| Accrued insurance | | 91 |
| | 103 |
|
| Other | 511 |
| | 480 |
| 342 |
| | 293 |
|
| Accounts payable and other current liabilities | $ | 1,488 |
| | $ | 1,485 |
| $ | 1,693 |
| | $ | 1,619 |
|
| |
12. | Long-term Debt and Borrowing Arrangements |
12. Long-term Corporate Debt and Borrowing Arrangements
Long-term debt and other borrowing arrangements consisted of:
| | | | Maturity
Date | | As of December 31, | Maturity
Date | | As of December 31, |
| | 2016 | | 2015 | 2018 | | 2017 |
| 4⅞% Senior Notes | November 2017 | | $ | — |
| | $ | 300 |
| |
| Floating Rate Senior Notes | December 2017 | | 249 |
| | 249 |
| |
Floating Rate Term Loan (a) | March 2019 | | 144 |
| | 970 |
| March 2022 | | — |
| | 1,136 |
|
| 6% Euro-denominated Senior Notes | March 2021 | | 194 |
| | 502 |
| |
| Floating Rate Term Loan | March 2022 | | 816 |
| | — |
| |
| 5⅛% Senior Notes | June 2022 | | 400 |
| | 400 |
| June 2022 | | — |
| | 400 |
|
| 5½% Senior Notes | April 2023 | | 675 |
| | 674 |
| April 2023 | | 675 |
| | 675 |
|
| 6⅜% Senior Notes | April 2024 | | 350 |
| | — |
| April 2024 | | 350 |
| | 350 |
|
| 4⅛% Euro-denominated Senior Notes | November 2024 | | 316 |
| | — |
| |
| 4⅛% euro-denominated Senior Notes | | November 2024 | | 344 |
| | 360 |
|
Floating Rate Term Loan (a) | | February 2025 | | 1,123 |
| | — |
|
| 5¼% Senior Notes | March 2025 | | 375 |
| | 375 |
| March 2025 | | 375 |
| | 375 |
|
| 4½% euro-denominated Senior Notes | | May 2025 | | 287 |
| | 300 |
|
| 4¾% euro-denominated Senior Notes | | January 2026 | | 401 |
| | — |
|
Other (b) | | 57 |
| | 46 |
| | 41 |
| | 49 |
|
| Deferred financing fees | | (53 | ) | | (55 | ) | | (45 | ) | | (46 | ) |
| Total | | 3,523 |
| | 3,461 |
| | 3,551 |
| | 3,599 |
|
| Less: Short-term debt and current portion of long-term debt | | 279 |
| | 26 |
| | 23 |
| | 26 |
|
| Long-term debt | | $ | 3,244 |
| | $ | 3,435 |
| | $ | 3,528 |
| | $ | 3,573 |
|
__________
| |
(a) | The floating rate term loan is part of the Company’s senior revolving credit facility, which is secured by pledges of capital stock of certain subsidiaries of the Company, and liens on substantially all of the Company’s intellectual property and certain other real and personal property. |
| |
(b) | Primarily includes capital leases which are secured by liens on the related assets. |
Term Loan
Floating Rate Term Loan due 2019. The Company issued $500 million, $200 million, and $300 million of Floating Rate Term Loan due 2019 in March 2012, October 2012 and October 2013, respectively, under the Company’s senior credit facility. The term loan bears interest at the greater of three-month LIBOR or 0.75%, plus 225 basis points, for an aggregate rate of 3.25% at December 31, 2016.
Floating Rate Term Loan due 2022. In May 2016,March 2017, the Company extendedincreased its Floating Rate Term Loan due 2022 to $1.1 billion and reduced the maturity date for $825 million of its $970 million existing corporate floatingloan interest rate term loan borrowings by three years to March 2022. The extended portion now bears interest atthree-month LIBOR plus 2.50%2.00%, subject to a LIBOR floorfor an aggregate rate of 0.75%3.70%; however, the Company has entered into an interest rate swap to hedge $600$700 million of its interest rate exposure related to the floating rate term loan at an aggregate rate of 4.21%3.79%. The Company used the incremental term loan proceeds to repay all of its outstanding Floating Rate Term Loan due 2019. In June 2017, the Company used the remaining proceeds to redeem the remainder of its outstanding Floating Rate Senior Notes due 2017.
Floating Rate Term Loan due 2025. In February 2018, the Company amended its Floating Rate Term Loan due 2022 and extended its maturity term to 2025. The loan bears interest at one-month LIBOR plus 2.00%, for an aggregate rate of 4.53%; however, the Company entered into an interest rate swap to hedge $700 million of its interest rate exposure related to the floating rate term loan at an aggregate rate of 3.67%.
Senior Notes
4⅞% Senior Notes due 2017. In November 2012, the Company issued its 4⅞% Senior Notes at par, for aggregate proceeds of $300 million with interest payable semi-annually. The Company has the right to redeem these notes in whole or in part at any time on or after May 15, 2015, at specified prices, plus accrued interest through the redemption date. In May 2016, the Company redeemed the full principal amount for $304 million plus accrued interest.
Floating Rate Senior Notes due 2017. In November 2013, the Company issued its Floating Rate Senior Notes at 98.75% of their face value for aggregate proceeds of $247 million. The interest rate on these notes is equal to three-month LIBOR plus 275 basis points, for an aggregate rate of 3.68% at December 31, 2016; however, the Company has entered into an interest rate swap to hedge its interest rate exposure related to these notes at an aggregate rate of 3.58%.
6% Euro-denominated Senior Notes due 2021. In March 2013, the Company issued €250 million (approximately $325 million, at issuance) of 6% Euro-denominated Senior Notes due March 2021, at par, with interest payable semi-annually. The notes are unsecured obligations of the Company’s Avis Budget Finance plc subsidiary, are guaranteed on a senior basis by the Company and certain of its domestic subsidiaries and rank equally with all of the Company’s existing senior unsecured debt. The Company has the right to redeem these notes in whole or in part on or after April 1, 2016 at specified redemption prices plus accrued interest.
In March 2014, the Company issued €200 million (approximately $275 million, at issuance) of additional 6% Euro-denominated Senior Notes due 2021. These notes were sold at 106.75% of their face value for aggregate proceeds of approximately $295 million, with a yield to maturity of 4.85%. In April 2014, the Company used the proceeds to repurchase $292 million principal amount of its 8¼% Senior Notes. In October 2016, the Company redeemed €275 million (approximately $302 million) of its principal amount for €287 million (approximately $315 million) plus accrued interest.
5⅛% Senior Notes due 2022. In May 2014, the Company issued $400 million of 5⅛% Senior Notes due 2022 at par.2022. In June 2014, the Company used the proceeds to repurchase the remaining $395 million principal
amount of its 8¼% Senior Notes. The notes were issued at par, with interest payable semi-annually. The Company has the right to redeem these notes in whole or in part at any time on or after June 1, 2017 at specified redemption prices plus accrued interest. In October 2018, the Company redeemed its outstanding $400 million principal amount for $410 million plus accrued interest.
5½% Senior Notes due 2023. In April 2013, the Company completed an offering of $500 million of 5½% Senior Notes due April 2023. The notes were issued at par, with interest payable semi-annually. The Company has the right to redeem these notes in whole or in part on or after April 1, 2018 at specified redemption prices plus accrued interest.
In November 2014, the Company issued $175 million of additional 5½% Senior Notes due 2023 at 99.625% of their face value, with interest payable semi-annually. The Company has the right to redeem these notes in whole or in part on or after April 1, 2018 at specified redemption prices plus accrued interest. The Company used the proceeds from the issuance to partially fund the acquisition of its Budget licensee for Southern California and Las Vegas.
6⅜% Senior Notes due 2024. In March 2016, the Company issued $350 million of 6⅜% Senior Notes due 2024 at par, with interest payable semi-annually. The Company has the right to redeem these notes in whole or in part at any time on or after April 1, 2019 at specified redemption prices plus accrued interest. In May 2016, the Company used the net proceeds from the offering to redeem $300 million principal amount of its previous 4⅞% Senior Notes due 2017 and for general corporate purposes.
4⅛% Euro-denominatedeuro-denominated Senior Notes due 2024. In September 2016, the Company issued €300 million (approximately $337 million, at issuance) of 4⅛% Euro-denominatedeuro-denominated Senior Notes due 2024 at par, with interest payable semi-annually. The notes are unsecured obligations of the Company’s Avis Budget Finance plc subsidiary, are guaranteed on a senior basis by the Company and certain of its domestic subsidiaries and rank equally with all of the Company’s existing senior unsecured debt. The Company has the right to redeem these notes in whole or in part at any time on or after November 15, 2019 at specified redemption prices plus accrued interest. In October 2016, the Company used the net proceeds from the offering primarily to redeem €275 million of its outstanding 6% Euro-denominatedeuro-denominated Senior Notes due 2021.
5¼% Senior Notes due 2025. In March 2015, the Company issued $375 million of 5¼% Senior Notes due 2025 at par, with interest payable semi-annually. The Company has the right to redeem these notes in whole or in part at any time on or after March 15, 2020 at specified redemption prices plus accrued interest. In April 2015, the Company used net proceeds from the offering to redeem the remaining $223 million principal amount of its 9¾% Senior Notes and to partially fund the acquisition of Maggiore.
4½% euro-denominated Senior Notes due 2025. In March 2017, the Company issued €250 million of 4½% euro-denominated Senior Notes due 2025, at par, with interest payable semi-annually. The Company has the right to redeem these notes in whole or in part on or after May 15, 2020 at specified redemption prices plus accrued interest. In April 2017, the Company used the net proceeds from the offering to redeem its outstanding €175 million principal amount of 6% euro-denominated Senior Notes due 2021 for €180 million plus accrued interest. In June 2017, the Company used the remaining proceeds to redeem a portion of its Floating Rate Senior Notes due 2017.
4¾% euro-denominated Senior Notes due 2026. In October 2018, the 4⅞Company issued €350 million of 4¾% euro-denominated Senior Notes due 2026, at par, with interest payable semi-annually. The Company has the right to redeem these notes in whole or in part on or after September 30, 2021 at specified redemption prices plus accrued interest. In October 2018, the Company used the net proceeds from the offering to redeem its 5⅛% Senior Notes thedue June 2022 for $410 million plus accrued interest.
The 5⅛% Senior Notes, the 5½% Senior Notes, 6⅜% Senior Notes and the 5¼% Senior Notes are senior unsecured obligations of the Company’s Avis Budget Car Rental, LLC (“ABCR”) subsidiary, are guaranteed by the Company and certain of its domestic subsidiaries and rank equally in right of payment with all of the Company’s existing and future senior unsecured indebtedness.
The 4⅛% euro-denominated Senior Notes, 4½% euro-denominated Senior Notes and 4¾% euro-denominated Senior Notes are unsecured obligations of the Company’s Avis Budget Finance plc subsidiary, are guaranteed on a senior basis by the Company and certain of its domestic subsidiaries and rank equally with all of the Company’s existing senior unsecured debt.
In connection with the debt amendments and repayments for the years ended December 31, 2016, 20152018, 2017 and 2014,2016, the Company recorded $27$19 million, $23$3 million and $56$27 million in early extinguishment of debt costs, respectively.
DEBT MATURITIESDebt Maturities
The following table provides contractual maturities of the Company’s corporate debt at December 31, 2016:2018:
| | | Year | Amount | Amount |
| 2017 | $ | 279 |
| |
| 2018 | 17 |
| |
| 2019 | 158 |
| $ | 23 |
|
| 2020 | 12 |
| 17 |
|
| 2021 | 205 |
| 16 |
|
| 2022 | | 16 |
|
| 2023 | | 690 |
|
| Thereafter | 2,905 |
| 2,834 |
|
| | $ | 3,576 |
| $ | 3,596 |
|
COMMITTED CREDIT FACILITIES AND AVAILABLE FUNDING ARRANGEMENTSCommitted Credit Facilities And Available Funding Arrangements
At December 31, 2016,2018, the committed corporate credit facilities available to the Company and/or its subsidiaries were as follows:
| | | | Total Capacity | | Outstanding Borrowings | | Letters of Credit Issued | | Available Capacity | Total Capacity | | Outstanding Borrowings | | Letters of Credit Issued | | Available Capacity |
Senior revolving credit facility maturing 2021 (a) | $ | 1,800 |
| | $ | — |
| | $ | 753 |
| | $ | 1,047 |
| |
Senior revolving credit facility maturing 2023 (a) | | $ | 1,800 |
| | $ | — |
| | $ | 1,167 |
| | $ | 633 |
|
Other facilities (b) | 5 |
| | 5 |
| | — |
| | — |
| 1 |
| | 1 |
| | — |
| | — |
|
__________
| |
(a) | The senior revolving credit facility bears interest at one-month LIBOR plus 200 basis points and is part of the Company’s senior credit facility, which is secured by pledges of capital stock of certain subsidiaries of the Company, and liens on substantially all of the Company’s intellectual property and certain other real and personal property. |
| |
(b) | These facilities encompass bank overdraft lines of credit, bearing interest of 1.50% to 3.10%3.22% as of December 31, 2016.2018. |
In February 2018, the Company amended the terms of its Senior revolving credit facility maturing 2021 and extended its maturity to 2023.
At December 31, 20162018 and 2015,2017, the Company had various uncommitted credit facilities available, which bear interest at rates of 0.21%0.74% to 4.50%6.60%, under which it had drawn approximately $5$1 million and $3$2 million, respectively.
DEBT COVENANTSDebt Covenants
The agreements governing the Company’s indebtedness contain restrictive covenants, including restrictions on dividends paid to the Company by certain of its subsidiaries, the incurrence of additional indebtedness by the Company and certain of its subsidiaries, acquisitions, mergers, liquidations, and sale and leaseback transactions. The Company’s senior credit facility also contains a maximum leverage ratio requirement. As of December 31, 2016,2018, the Company was in compliance with the financial covenants governing its indebtedness.
| |
13. | Debt under Vehicle Programs and Borrowing Arrangements |
13. Debt under Vehicle Programs and Borrowing Arrangements
Debt under vehicle programs, including related party debt due to Avis Budget Rental Car Funding (AESOP) LLC (“Avis Budget Rental Car Funding”), consisted of:
| | | | As of December 31, | As of December 31, |
| | 2016 | | 2015 | 2018 | | 2017 |
| Americas – Debt due to Avis Budget Rental Car Funding | $ | 6,733 |
| | $ | 6,837 |
| $ | 7,393 |
| | $ | 6,516 |
|
| Americas – Debt borrowings | 577 |
| | 643 |
| 635 |
| | 660 |
|
International – Debt borrowings (a) | 1,449 |
| | 1,187 |
| 2,060 |
| | 1,942 |
|
| International – Capital leases | 162 |
| | 238 |
| 191 |
| | 146 |
|
| Other | 7 |
| | 8 |
| 2 |
| | 1 |
|
Deferred financing fees (b) | (50 | ) | | (53 | ) | (49 | ) | | (44 | ) |
| Total | $ | 8,878 |
| | $ | 8,860 |
| $ | 10,232 |
| | $ | 9,221 |
|
__________
| |
(a) | The increase reflects additional borrowings principally to fund increases in the Company's car rental fleet and to replace capital lease financing.fleet. |
| |
(b) | Deferred financing fees related to Debt due to Avis Budget Rental Car Funding as of December 31, 20162018 and 20152017 were $38$35 million and $41$36 million, respectively. |
Americas
Debt due to Avis Budget Rental Car Funding. Avis Budget Rental Car Funding, an unconsolidated bankruptcy remote qualifying special purpose limited liability company, issues privately placed notes to investors as well as to banks and bank-sponsored conduit entities. Avis Budget Rental Car Funding uses the proceeds from its note issuances to make loans to a wholly-owned subsidiary of the Company, AESOP Leasing LP (“AESOP Leasing”), on a continuing basis. AESOP Leasing is required to use the proceeds of such loans to acquire or finance the acquisition of vehicles used in the Company’s rental car operations. By issuing debt through the Avis Budget Rental Car Funding program, the Company pays a lower rate of interest than if it had issued debt directly to third parties. Avis Budget Rental Car Funding is not consolidated, as the Company is not the “primary beneficiary” of Avis Budget Rental Car Funding. The Company determined that it is not the primary beneficiary because the Company does not have the obligation to absorb the potential losses or receive the benefits of Avis Budget Rental Car Funding’s activities since the Company’s only significant source of variability in the earnings, losses or cash flows of Avis Budget Rental Car Funding is exposure to its own creditworthiness, due to its loan from Avis Budget Rental Car Funding. Because Avis Budget Rental Car Funding is not consolidated, AESOP Leasing’s loan obligations to Avis Budget Rental Car Funding are reflected as related party debt on the Company’s Consolidated Balance Sheets. The Company also has an asset within Assets under vehicle programs on its Consolidated Balance Sheets which represents securities issued to the Company by Avis Budget Rental Car Funding. AESOP Leasing is consolidated, as the Company is the “primary beneficiary” of AESOP Leasing; as a result, the vehicles purchased by AESOP Leasing remain on the Company’s Consolidated Balance Sheets. The Company determined it is the primary beneficiary of AESOP Leasing, as it has the ability to direct its activities, an obligation to absorb a majority of its expected losses and the right to receive the benefits of AESOP Leasing’s activities. AESOP Leasing’s vehicles and related assets, which as of December 31, 2016,2018, approximate $8.59.0 billion and manysome of which are subject to manufacturer repurchase and guaranteed depreciation agreements, collateralize the debt issued by Avis Budget Rental Car Funding. The assets and liabilities of AESOP Leasing are presented on the Company’s Consolidated Balance Sheets within Assets under vehicle programs and Liabilities under vehicle programs, respectively. The assets of AESOP Leasing, included within assets under vehicle programs (excluding the investment in Avis Budget Rental Car Funding (AESOP) LLC—related party) are restricted. Such assets may be used only to repay the respective AESOP Leasing liabilities, included within Liabilities under vehicle programs, and to purchase new vehicles, although if certain collateral coverage requirements are met, AESOP Leasing may pay dividends from excess cash. The creditors of AESOP Leasing and Avis Budget Rental Car Funding have no recourse to the general credit of the Company. The Company periodically provides Avis Budget Rental Car Funding with non-contractually required support, in the form of equity and loans, to serve as additional collateral for the debt issued by Avis Budget Rental Car Funding.
The business activities of Avis Budget Rental Car Funding are limited primarily to issuing indebtedness and using the proceeds thereof to make loans to AESOP Leasing for the purpose of acquiring or financing the acquisition of vehicles to be leased to the Company’s rental car subsidiaries and pledging its assets to secure the indebtedness. Because Avis Budget Rental Car Funding is not consolidated by the Company, its
results of operations and cash flows are not reflected within the Company’s financial statements.
During January 2015March 2017 and May 2015,December 2017, Avis Budget Rental Car Funding issued approximately $650$600 million in asset-backed notes with an expected final payment date of July 2020September 2022 and $500 million in asset-backed notes with an expected final payment date of March 2023, respectively. During April 2018 and October 2018, Avis Budget Rental Car Funding issued approximately $400 million in asset-backed notes with an expected final payment date of September 2023 and approximately $550 million in asset-backed notes with an expected final payment date of December 2020, respectively. During March 2016 and June 2016, Avis Budget Rental Car Funding issued approximately $450 million in asset-backed notes with an expected final payment date of June 2021 and approximately $500 million in asset-backed notes with an expected final payment date of November 2021,2024, respectively. The Company used the proceeds from these borrowings to fund the repayment of maturing vehicle-backed debt and the acquisition of rental cars in the United States. Borrowings under the Avis Budget Rental Car Funding program primarily represent fixed rate notes and had a weighted average interest rate of 3% as of December 31, 20162018 and 2015.2017, in each period.
Debt borrowings. The Company finances the acquisition of vehicles used in its Canadian rental operations through a consolidated, bankruptcy remote special-purpose entity, which issues privately placed notes to investors and bank-sponsored conduits. The Company finances the acquisition of fleet for its truck rental operations in the United States through a combination of debt facilities and leases. These debt borrowings represent a mix of fixed and floating rate debt and had a weighted average interest rate of 4% and 3% as of December 31, 20162018 and 2015, respectively.2017, in each period.
International
Debt borrowings. In 2013, the Company entered into a three-year, €500 million (approximately $687 million) European rental fleet securitization program, which is used to finance fleet purchases for certain of the Company’s European operations. During 2018, 2017, 2016, 2015 and 2014, the Company increased its capacity under this program by €150 million (approximately $175 million), €250 million (approximately $281 million), €400 million (approximately $458 million), €210 million (approximately $235 million) and €290 million (approximately $370 million), respectively, and recently extended the securitization’s maturity to 2019.2021. The Company finances the acquisition of vehicles used in its International rental car operations through this and other consolidated, bankruptcy remote special-purpose entities, which issue privately placed notes to banks and bank-sponsored conduits. The International borrowings primarily represent floating rate notes and had a weighted average interest rate of 2% and 3% as of December 31, 20162018 and 2015, respectively.2017.
Capital leases. The Company obtained a portion of its International vehicles under capital lease arrangements. For the yearyears ended December 31, 20162018 and 2015,2017, the weighted average interest rate on these borrowings was 2%.1%, in each period. All capital leases are on a fixed repayment basis and interest rates are fixed at the contract date.
DEBT MATURITIESDebt Maturities
The following table provides the contractual maturities of the Company’s debt under vehicle programs, including related party debt due to Avis Budget Rental Car Funding, at December 31, 2016:2018:
|
| | | |
| | Debt under Vehicle Programs |
2017(a) | $ | 1,094 |
|
| 2018 | 2,508 |
|
| 2019 | 2,613 |
|
| 2020 | 1,618 |
|
| 2021 | 950 |
|
| Thereafter | 145 |
|
| | $ | 8,928 |
|
|
| | | |
| | Debt under Vehicle Programs (a) |
| 2019 | $ | 1,502 |
|
2020 (b) | 3,810 |
|
2021 (c) | 2,486 |
|
| 2022 | 947 |
|
| 2023 | 1,086 |
|
| Thereafter | 450 |
|
| | $ | 10,281 |
|
__________
| |
(a) | Vehicle-backed debt maturing within one year primarily represents term asset-backed securities. |
| |
(b) | Includes $2.2 billion of bank and bank-sponsored facilities. |
| |
(c) | Includes $1.5 billion of bank and bank-sponsored facilities. |
COMMITTED CREDIT FACILITIES AND AVAILABLE FUNDING ARRANGEMENTS
Committed Credit Facilities And Available Funding Arrangements
The following table presents available funding under the Company’s debt arrangements related to its vehicle programs, including related party debt due to Avis Budget Rental Car Funding, at December 31, 2016:2018:
| | | | Total Capacity (a) | | Outstanding Borrowings | | Available Capacity | Total Capacity (a) | | Outstanding
Borrowings (b) | | Available Capacity |
Americas – Debt due to Avis Budget Rental Car Funding (b) | $ | 9,083 |
| | $ | 6,733 |
| | $ | 2,350 |
| $ | 8,883 |
| | $ | 7,393 |
| | $ | 1,490 |
|
Americas – Debt borrowings (c) | 895 |
| | 577 |
| | 318 |
| 947 |
| | 635 |
| | 312 |
|
International – Debt borrowings (d) | 2,373 |
| | 1,449 |
| | 924 |
| 3,071 |
| | 2,060 |
| | 1,011 |
|
International – Capital leases (e) | 194 |
| | 162 |
| | 32 |
| 209 |
| | 191 |
| | 18 |
|
| Other | 7 |
| | 7 |
| | — |
| 2 |
| | 2 |
| | — |
|
| Total | $ | 12,552 |
| | $ | 8,928 |
| | $ | 3,624 |
| $ | 13,112 |
| | $ | 10,281 |
| | $ | 2,831 |
|
__________
| |
(a) | Capacity is subject to maintaining sufficient assets to collateralize debt. |
| |
(b) | The outstanding debt is collateralized by $8.2 billion of underlying vehicles and related assets. |
| |
assets of $8.8 billion for Americas - Debt due to Avis Budget Rental Car Funding; $0.7 billion for Americas - Debt borrowings; $2.3 billion for International - Debt borrowings; and $0.2 billion for International - Capital leases.
(c) | The outstanding debt is collateralized by $0.8 billion of underlying vehicles and related assets. |
| |
(d)
| The outstanding debt is collateralized by $1.9 billion of underlying vehicles and related assets. |
| |
(e)
| The outstanding debt is collateralized by $0.2 billion of underlying vehicles and related assets. |
DEBT COVENANTSDebt Covenants
The agreements under the Company’s vehicle-backed funding programs contain restrictive covenants, including restrictions on dividends paid to the Company by certain of its subsidiaries and restrictions on indebtedness, mergers, liens, liquidations and sale and leaseback transactions, and in some cases also require compliance with certain financial requirements. As of December 31, 2016,2018, the Company is not aware
of any instances of non-compliance with any of the financial or restrictive covenants contained in the debt agreements under its vehicle-backed funding programs.
| |
14. | Commitments and Contingencies |
14. Commitments and Contingencies
Lease Commitments
The Company is committed to making rental payments under noncancelable operating leases covering various facilities and equipment. Many of the Company’s operating leases for facilities contain renewal options. These renewal options vary, but the majority include clauses for various term lengths and prevailing market rate rents.
Future minimum lease payments required under noncancelable operating leases, including minimum concession fees charged by airport authorities, which in many locations are recoverable from vehicle rental customers, as of December 31, 2016,2018, are as follows:
| | | | Amount | Amount |
| 2017 | $ | 710 |
| |
| 2018 | 473 |
| |
| 2019 | 426 |
| $ | 835 |
|
| 2020 | 313 |
| 476 |
|
| 2021 | 174 |
| 345 |
|
| 2022 | | 253 |
|
| 2023 | | 162 |
|
| Thereafter | 605 |
| 590 |
|
| | $ | 2,701 |
| $ | 2,661 |
|
The future minimum lease payments in the above table have been reduced by minimum future sublease rental inflows in the aggregate of $4 million for all periods shown in the table.
The Company maintains concession agreements with various airport authorities that allow the Company to conduct its car rental operations on site. In general, concession fees for airport locations are based on a percentage of total commissionable revenue (as defined by each airport authority), subject to minimum annual guaranteed amounts. These concession fees, which are included in the Company’s total rent expense, were as follows for the years ended December 31:
| | | | 2016 | | 2015 | | 2014 | 2018 | | 2017 | | 2016 |
| Rent expense (including minimum concession fees) | $ | 699 |
| | $ | 679 |
| | $ | 639 |
| $ | 709 |
| | $ | 715 |
| | $ | 699 |
|
| Contingent concession expense | 214 |
| | 195 |
| | 193 |
| 273 |
| | 221 |
| | 214 |
|
| | 913 |
| | 874 |
| | 832 |
| 982 |
| | 936 |
| | 913 |
|
| Less: sublease rental income | (5 | ) | | (5 | ) | | (6 | ) | (5 | ) | | (4 | ) | | (5 | ) |
| Total | $ | 908 |
| | $ | 869 |
| | $ | 826 |
| $ | 977 |
| | $ | 932 |
| | $ | 908 |
|
Commitments under capital leases, other than those within the Company’s vehicle rental programs, for which the future minimum lease payments have been reflected in Note 13-Debt Under Vehicle Programs and Borrowing Arrangements, are not significant.
The Company leases a portion of its vehicles under operating leases, some of which extend through 2020.2025. As of December 31, 2016,2018, the Company has guaranteed up to $278$305 million of residual values for these vehicles at the end of their respective lease terms. The Company believes that, based on current market conditions, the net proceeds from the sale of these vehicles at the end of their lease terms will equal or exceed their net book values and therefore has not recorded a liability related to guaranteed residual values.
Contingencies
In 2006, the Company completed the spin-offs of its Realogy and Wyndham subsidiaries. The Company does not believe that the impact of any resolution of pre-existing contingent liabilities in connection with the spin-offs should result in a material liability to the Company in relation to its consolidated financial position or liquidity, as Realogy and Wyndham each have agreed to assume responsibility for these liabilities. The Company is also named in litigation that is primarily related to the businesses of its former subsidiaries, including Realogy and Wyndham. The Company is entitled to indemnification from such entities for any liability resulting from such litigation.
In February 2015, the French Competition Authority issued a statement of objections alleging that several car rental companies, including the Company and two of its European subsidiaries, engaged with (i) twelve French airports, the majority of which are controlled by public administrative bodies or the French state, and violated competition law through the distribution by airports of company-specific statistics to car rental companies operating at those airports; and (ii) two other international car rental companies in a concerted practice relating to train station surcharges. In May 2016, the French Competition authority issued a second statement of objections reiterating the allegations that it raised in its first statement of objections. The Company believes that it has valid defenses and intends to vigorously defend against the allegations, but it is currently unable to predict the outcome of the proceedings or range of reasonably possible losses, which may be material.
In February 2017, following a state court trial in Georgia, a jury found the Company liable for damages in a case brought by a plaintiff who was injured in a vehicle accident allegedly caused by an employee of an independent contractor of the Company who was acting outside of the scope of employment. In March 2017, the Company was also found liable for damages in a companion case arising from the same incident. The Company is appealing both verdicts and considers the attribution of liability to the Company, and the amount of damages awarded, to be unsupported by the facts of the case, and intends to appeal the verdict. The Company also faces a similar case from another plaintiff.these cases. The Company has recognized a liability for the expected loss related to these cases, net of $26recoverable insurance proceeds, of approximately $12 million.
The Company is involved in claims, legal proceedings and governmental inquiries related, among other things,that are incidental to its vehicle rental and car sharing operations, including, among others, contract and licensee disputes, competition matters, employment matters,and wage-and-hour claims, insurance and liability claims, intellectual property claims, business practice disputes and other regulatory, environmental, commercial and tax matters. Litigation is inherently unpredictable and, although the Company believes that its accruals are adequate and/or that it has valid defenses in these matters, unfavorable resolutions could occur. Excluding the French competition and personal injury matters discussed above, theThe Company estimates that the potential exposure resulting from adverse outcomes of legal proceedings in which it is reasonably possible that a loss may be incurred could, in the aggregate, be up to approximately $45 million in excess of amounts accrued as of December 31, 2016;2018; however, the Company does not believe that the impact should result in a material liability to the Company in relation to its consolidated financial condition or annual results of operations.
Commitments to Purchase Vehicles
The Company maintains agreements with vehicle manufacturers under which the Company has agreed to purchase approximately $7.7$8.7 billion of vehicles from manufacturers over the next 12 months. The majoritymonths financed primarily through the issuance of vehicle-backed debt and cash received upon the disposition of vehicles.
Certain of these commitments are subject to the vehicle manufacturers satisfying their obligations under their respective repurchase and guaranteed depreciation agreements. The purchase of such vehicles is financed primarily through the issuance of vehicle-backed debt and cash received upon the disposition of vehicles.
Other Purchase Commitments
In the normal course of business, the Company makes various commitments to purchase other goods or services from specific suppliers, including those related to marketing, advertising, computer services and capital expenditures. As of December 31, 2016,2018, the Company had approximately $141$178 million of purchase obligations, which extend through 2022.2023.
Concentrations
Concentrations of credit risk at December 31, 2016,2018, include (i) risks related to the Company’s repurchase and guaranteed depreciation agreements with domestic and foreign car manufacturers, including Ford, Fiat Chrysler and General Motors, Chrysler, Peugeot, Kia, Volkswagen, Fiat, Mercedes, Toyota and Volvo, and primarily with respect to receivables for program cars that have been disposed but for which the Company has not yet received payment from the manufacturers and (ii) risks related to Realogy and Wyndham, including receivables of $41$27 million and $25$16 million, respectively, related to certain contingent, income tax and other corporate liabilities assumed by Realogy and Wyndham in connection with their disposition.
Asset Retirement Obligations
The Company maintains a liability for asset retirement obligations. An asset retirement obligation is a legal obligation to perform certain activities in connection with the retirement, disposal or abandonment of assets.
The Company’s asset retirement obligations, which are measured at discounted fair values, are primarily related to the removal of underground gasoline storage tanks at its rental facilities. The liability accrued for asset retirement obligations was $24$22 million and $23 million at December 31, 20162018 and 2015.2017, respectively.
Standard Guarantees/Indemnifications
In the ordinary course of business, the Company enters into numerous agreements that contain standard guarantees and indemnities whereby the Company agrees to indemnify another party, among other things, for performance under contracts and any breaches of representations and warranties thereunder. In addition, many of these parties are also indemnified against any third-party claim resulting from the transaction that is contemplated in the underlying agreement. Such guarantees or indemnifications are granted under various agreements, including those governing (i) purchases, sales or outsourcing of assets, businesses or activities, (ii) leases of real estate, (iii) licensing of trademarks, (iv) access to credit facilities and use of derivatives and (v) issuances of debt or equity securities. The guarantees or indemnifications issued are for the benefit of the (i) buyers in sale agreements and sellers in purchase agreements, (ii) landlords in lease contracts, (iii) licensees under licensing agreements, (iv) financial institutions in credit facility arrangements and derivative contracts and (v) underwriters and placement agents in debt or equity security issuances. While some of these guarantees extend only for the duration of the underlying agreement, many may survive the expiration of the term of the agreement or extend into perpetuity (unless subject to a legal statute of limitations). There are no specific limitations on the maximum potential amount of future payments that the Company could be required to make under these guarantees, nor is the Company able to develop an estimate of the maximum potential amount of future payments to be made under these guarantees as the triggering events are not subject to predictability. With respect to certain of the aforementioned guarantees, such as indemnifications provided to landlords against third-party claims for the use of real estate property leased by the Company, the Company maintains insurance coverage that mitigates its potential exposure.
15. Stockholders’ Equity
Cash Dividend Payments
During 2016, 20152018, 2017 and 2014,2016, the Company did not declare or pay any cash dividends. The Company’s ability to pay dividends to holders of its common stock is limited by the Company’s senior credit facility, the indentures governing its senior notes and its vehicle financing programs.
Share Repurchases
The Company’s Board of Directors has authorized the repurchase of up to approximately $1.5$1.7 billion of its common stock under a plan originally approved in 2013 and subsequently expanded, most recently in 2016.2018. During 2016, 20152018, 2017 and 2014,2016, the Company repurchased approximately 2724 million shares of common stock at a cost of $1.1 billionapproximately $800 million under the program. As of December 31, 2016,2018, approximately $300$150 million of authorization remained available to repurchase common stock under this plan.
Convertible Note
In October 2009, the Company issued 3½% Convertible Senior Notes due October 2014.
In October 2014, the $66 million of outstanding Convertible Notes that had not been repurchased by the Company between issuance and maturity were converted into approximately 4.0 million shares of the Company’s common stock at the initial conversion rate of 61.5385 shares of common stock per $1,000 principal amount.
Accumulated Other Comprehensive Income (Loss)
The components of accumulated other comprehensive income (loss) are as follows:
| | | | Currency Translation Adjustments | | Net Unrealized Gains (Losses) on Cash Flow Hedges (a) | | Net Unrealized Gains (Losses) on Available-For-Sale Securities | | Minimum Pension Liability Adjustment (b) | | Accumulated Other Comprehensive Income (Loss) | Currency Translation Adjustments | | Net Unrealized Gains (Losses) on Cash Flow Hedges (a) | | Net Unrealized Gains (Losses) on Available-For-Sale Securities | | Minimum Pension Liability Adjustment (b) | | Accumulated Other Comprehensive Income (Loss) |
| Balance, January 1, 2014 | $ | 166 |
| | $ | 1 |
| | $ | 2 |
| | $ | (52 | ) | | $ | 117 |
| |
| Other comprehensive income (loss) before reclassifications | (115 | ) | | (7 | ) | | — |
| | (24 | ) | | (146 | ) | |
| Amounts reclassified from accumulated other comprehensive income (loss) | — |
| | 5 |
| | — |
| | 2 |
| | 7 |
| |
| Net current-period other comprehensive income (loss) | (115 | ) | | (2 | ) | | — |
| | (22 | ) | | (139 | ) | |
| Balance, December 31, 2014 | 51 |
| | (1 | ) | | 2 |
| | (74 | ) | | (22 | ) | |
| Other comprehensive income (loss) before reclassifications | (131 | ) | | (6 | ) | | (2 | ) | | 6 |
| | (133 | ) | |
| Amounts reclassified from accumulated other comprehensive income (loss) | — |
| | 5 |
| | — |
| | 3 |
| | 8 |
| |
| Net current-period other comprehensive income (loss) | (131 | ) | | (1 | ) | | (2 | ) | | 9 |
| | (125 | ) | |
| Balance, December 31, 2015 | (80 | ) | | (2 | ) | | — |
| | (65 | ) | | (147 | ) | |
| Balance, January 1, 2016 | | $ | (80 | ) | | $ | (2 | ) | | $ | — |
| | $ | (65 | ) | | $ | (147 | ) |
| Other comprehensive income (loss) before reclassifications | 41 |
| | — |
| | 1 |
| | (57 | ) | | (15 | ) | 41 |
| | — |
| | 1 |
| | (57 | ) | | (15 | ) |
| Amounts reclassified from accumulated other comprehensive income (loss) | — |
| | 4 |
| | — |
| | 4 |
| | 8 |
| — |
| | 4 |
| | — |
| | 4 |
| | 8 |
|
| Net current-period other comprehensive income (loss) | 41 |
| | 4 |
| | 1 |
| | (53 | ) | | (7 | ) | 41 |
| | 4 |
| | 1 |
| | (53 | ) | | (7 | ) |
| Balance, December 31, 2016 | $ | (39 | ) | | $ | 2 |
| | $ | 1 |
| | $ | (118 | ) | | $ | (154 | ) | (39 | ) | | 2 |
| | 1 |
| | (118 | ) | | (154 | ) |
| Other comprehensive income (loss) before reclassifications | | 110 |
| | 1 |
| | 1 |
| | 11 |
| | 123 |
|
| Amounts reclassified from accumulated other comprehensive income (loss) | | — |
| | 2 |
| | — |
| | 5 |
| | 7 |
|
| Net current-period other comprehensive income (loss) | | 110 |
| | 3 |
| | 1 |
| | 16 |
| | 130 |
|
| Balance, December 31, 2017 | | 71 |
| | 5 |
| | 2 |
| | (102 | ) | | (24 | ) |
Cumulative effect of accounting change (c) | | 7 |
| | 1 |
| | (2 | ) | | (12 | ) | | (6 | ) |
| Balance, January 1, 2018 | | 78 |
| | 6 |
| | — |
| | (114 | ) | | (30 | ) |
| Other comprehensive income (loss) before reclassifications | | (81 | ) | | (2 | ) | | — |
| | (23 | ) | | (106 | ) |
| Amounts reclassified from accumulated other comprehensive income (loss) | | — |
| | (2 | ) | | — |
| | 5 |
| | 3 |
|
| Net current-period other comprehensive income (loss) | | (81 | ) | | (4 | ) | | — |
| | (18 | ) | | (103 | ) |
| Balance, December 31, 2018 | | $ | (3 | ) | | $ | 2 |
| | $ | — |
| | $ | (132 | ) | | $ | (133 | ) |
__________
All components of accumulated other comprehensive income (loss) are net of tax, except currency translation adjustments, which exclude income taxes related to indefinite investments in foreign subsidiaries (see Note 8-Income Taxes for impacts of the Tax Act) and include an $83a $64 million gain, net of tax, related to the Company’s hedge of its investment in Euro-denominatedeuro-denominated foreign operations (See Note 18-Financial Instruments).
| |
(a) | For the years ended December 31, 20162018, 20152017 and 2014,2016, the amounts reclassified from accumulated other comprehensive income (loss) into corporate interest expense were $3 million ($2 million, net of tax), $4 million ($2 million, net of tax) and $6 million ($4 million, net of tax), $7 million ($4 million, net of tax) and $8 million ($5 million, net of tax), respectively. For the yearsyear ended December 31, 2016, and 2015, amountsamount reclassified from accumulated other comprehensive income (loss) into vehicle interest expense werewas $1 million ($0 million, net of tax) and $1 million ($1 million, net of tax), respectively.. |
| |
(b) | For the years ended December 31, 2016, 20152018, 2017 and 2014,2016, amounts reclassified from accumulated other comprehensive income (loss) into selling, general and administrative expenses were $7 million ($5 million, net of tax), $8 million ($5 million, net of tax) and $6 million ($4 million, net of tax), $5 million ($3 million, netrespectively. |
| |
(c) | See Note 2-Summary of tax)Significant Accounting Policies for the impact of adoption of ASU 2016-01 and $3 million ($2 million, net of tax), respectively.ASU 2018-02. |
| |
16. | Stock-Based Compensation |
16. Stock-Based Compensation
The Company’s Amended and Restated Equity and Incentive Plan provides for the grant of options, stock appreciation rights, restricted stock, restricted stock units (“RSUs”) and other stock- or cash-based awards to employees, directors and other individuals who perform services for the Company and its subsidiaries. The maximum number of shares reserved for grant of awards under the plan is 20.1 million, with approximately 4.33.5 million shares available as of December 31, 20162018. The Company typically settles stock-based awards with treasury shares.
Time-based awards generally vest ratably over a three-year period following the date of grant, and performance- or market-based awards generally vest three years following the date of grant based on the attainment of performance- or market-based goals, all of which are subject to a service condition.
Cash Unit Awards
The fair value of time-based restricted cash units is based on the Company’s stock price on the grant date. Market-vesting restricted cash units generally vest depending on the level of relative total shareholder return achieved by the Company during the period prior to scheduled vesting. Settlement of restricted cash units is based on the Company’s average closing stock price over a specified number of trading days and the value of these awards varies based on changes in the Company’s stock price.
Stock Unit Awards
Stock unit awards entitle the holder to receive shares of common stock upon vesting on a one-to-one basis. Performance-basedCertain performance-based RSUs principally vest based upon the level of performance attained, but vesting can increase (typically by up to 20%) if certain relative total shareholder return goals are achieved. Market-based RSUs generally vest based on the level of total shareholder return or absolute stock price attainment.
The grant date fair value of the performance-based RSUs incorporates the total shareholder return metric, which is estimated using a Monte Carlo simulation model to estimate the Company’s ranking relative to an applicable stock index. During the years ended December 31, 2018 and 2017, the Company did not issue any stock unit awards containing a market condition. The weighted average assumptions used in the Monte Carlo simulation model to calculate the fair value of the Company’s stock unit awards are outlined in the table below.
|
| | | | | |
| | 2016 | | 2015 | | 2014 |
| Expected volatility of stock price | 46% | | 37% | | 40% |
| Risk-free interest rate | 0.98% | | 0.74% | | 0.83% |
| Valuation period | 3 years | | 3 years | | 3 years |
| Dividend yield | 0% | | 0% | | 0% |
|
| | | |
| | | 2016 |
| Expected volatility of stock price | | | 46% |
| Risk-free interest rate | | | 0.98% |
| Valuation period | | | 3 years |
| Dividend yield | | | 0% |
Annual activity related to stock units and cash units consisted of (in thousands of shares):
|
| | | | | | | | | | | | | | | | | | | | | |
| | | Time-Based RSUs | | Performance-Based and Market Based RSUs | | Cash Unit Awards |
| | | Number of Shares | | Weighted
Average
Grant Date
Fair Value | | Number of Shares | | Weighted
Average
Grant Date
Fair Value | | Number of Units | | Weighted
Average
Grant Date
Fair Value |
| Outstanding at January 1, 2016 | 819 |
| | $ | 43.34 |
| | 941 |
| | $ | 35.18 |
| | 111 |
| | $ | 18.04 |
|
| | Granted (a) | 587 |
| | 25.92 |
| | 528 |
| | 23.33 |
| | — |
| | — |
|
| | Vested (b) | (491 | ) | | 38.17 |
| | (487 | ) | | 25.13 |
| | (111 | ) | | 18.04 |
|
| | Forfeited/expired | (37 | ) | | 37.47 |
| | (59 | ) | | 28.58 |
| | — |
| | — |
|
Outstanding at December 31, 2016 (c) | 878 |
| | $ | 34.83 |
| | 923 |
| | $ | 34.11 |
| | — |
| | $ | — |
|
|
| | | | | | | | | | | | | | |
| | | | Number of Shares | | Weighted
Average
Grant Date
Fair Value | | Weighted Average Remaining Contractual Term (years) | | Aggregate Intrinsic Value (in millions) |
| Time-based RSUs | | | | | | | |
| | Outstanding at January 1, 2018 | 1,160 |
| | $ | 34.54 |
| | | | |
| | | Granted (a) | 322 |
| | 48.41 |
| | | | |
| | | Vested (b) | (560 | ) | | 36.02 |
| | | | |
| | | Forfeited | (84 | ) | | 36.53 |
| | | | |
| | Outstanding and expected to vest at December 31, 2018 (c) | 838 |
| | $ | 38.67 |
| | 0.8 | | $ | 19 |
|
| Performance-based and market-based RSUs | | | | | | | |
| | Outstanding at January 1, 2018 | 994 |
| | $ | 33.06 |
| | | | |
| | | Granted (a) | 353 |
| | 48.52 |
| | | | |
| | | Vested (b) | — |
| | — |
| | | | |
| | | Forfeited | (178 | ) | | 50.05 |
| | | | |
| | Outstanding at December 31, 2018 | 1,169 |
| | $ | 35.14 |
| | 1.0 | | $ | 26 |
|
| | Outstanding and expected to vest at December 31, 2018 (c) | 255 |
| | $ | 44.57 |
| | 1.9 | | $ | 6 |
|
__________
| |
(a) | Reflects the maximum number of stock units assuming achievement of all performance-, market- and time-vesting criteria and does not include those for non-employee directors, which are discussed separately below. The weighted-average fair value of time-based RSUs and performance-based and market-based RSUs granted in 20152017 was $54.70$35.32 and $55.51,$35.21, respectively, and the weighted-average fair value of time-based RSUs and performance-based and market-based RSUs granted in 20142016 was $42.05$25.92 and $42.03,$23.33, respectively. |
| |
(b) | The total fair value of RSUs vested during 20162018, 20152017 and 20142016 was $31$20 million, $25$23 million and $15$31 million, respectively. The total grant date fair value of cash units vested during the yearsyear 2016 and 2015 was $2 million, in each period.million. |
| |
(c) | The Company’s outstanding time-based RSUs and performance-based and market-based RSUs had aggregate intrinsic value of $32 million and $34 million, respectively. Aggregate unrecognized compensation expense related to time-based RSUs and performance-based and market-based RSUs amounted to $26$28 million and will be recognized over a weighted average vesting period of 1.1 years. The Company assumes that substantially all outstanding awards will vest over time.1.0 year. |
Stock Options
The annual stock option activity consisted of (in thousands of shares):
|
| | | | | | | | | | | | | |
| | | Number of Options | | Weighted
Average
Exercise
Price | | Aggregate Intrinsic Value (in millions) | | Weighted
Average
Remaining Contractual Term (years) |
| Outstanding at January 1, 2016 | 827 |
| | $ | 2.87 |
| | $ | 28 |
| | 3.3 |
| | Granted (a) | — |
| | — |
| |
|
| | |
| | Exercised (b) | (17 | ) | | 0.79 |
| | 1 |
| | |
| | Forfeited/expired | — |
| | — |
| |
|
| | |
| Outstanding and exercisable at December 31, 2016 | 810 |
| | $ | 2.91 |
| | $ | 27 |
| | 2.3 |
|
| | | | | | | | | | | | | |
| | | Number of Options | | Weighted
Average
Exercise
Price | | Weighted
Average
Remaining Contractual Term (years) | | Aggregate Intrinsic Value (in millions) |
| Outstanding at January 1, 2018 | 273 |
| | $ | 7.08 |
| | 1.7 | | $ | 10 |
|
| | Granted (a) | — |
| | — |
| |
| | — |
|
| | Exercised (b) | (216 | ) | | 8.72 |
| |
| | 8 |
|
| | Forfeited/expired | — |
| | — |
| |
| | |
| Outstanding and exercisable at December 31, 2018 | 57 |
| | $ | 0.79 |
| | 0.1 | | $ | 1 |
|
__________
| |
(a) | No stock options were granted during 2017 and 2015 or 20142016. |
| |
(b) | Stock options exercised during 20152017 and 20142016 had intrinsic values of $121 million and $6$1 million,, respectively, and the respectively. The cash received from the exercise of options was $2 million in 2018 and insignificant in 2016, 20152017 and 2014.2016. |
Non-employee Directors Deferred Compensation Plan
The Company grants stock awards on a quarterly basis to non-employee directors representing between 50% and 100% of a director’s annual compensation and such awards can be deferred under the Non-employee Directors Deferred Compensation Plan. During 20162018, 20152017 and 20142016, the Company granted 34,000, 40,000, 22,00036,000 and 20,00040,000 awards, respectively, to non-employee directors.
Employee Stock Purchase Plan
The Company is authorized to sell shares of its common stock to eligible employees at 95% of fair market value. This plan has been deemed to be non-compensatory and therefore no compensation expense has been recognized.
Stock-Compensation Expense
During 20162018, 20152017 and 20142016, the Company recorded stock-based compensation expense of $28$24 million ($18 million, net of tax), $2610 million ($177 million, net of tax) and $3428 million ($2118 million, net of tax), respectively. In jurisdictions with net operating loss carryforwards, exercises and/or vestings of stock-based awards have generated $150 million of total tax deductions at December 31, 2016. Approximately $56 million of tax benefits were recorded in accumulated deficit upon adoption of ASU 2016-09 on January 1, 2017 related to these tax deductions (see Note 2-Summary of Significant Accounting Policies).
| |
17. | Employee Benefit Plans |
17. Employee Benefit Plans
Defined Contribution Savings Plans
The Company sponsors several defined contribution savings plans in the United States and certain foreign subsidiaries that provide certain eligible employees of the Company an opportunity to accumulate funds for retirement. The Company matches portions of the contributions of participating employees on the basis specified by the plans. The Company’s contributions to these plans were $33 million, $3236 million and $3433 million during 2016, 20152018, 2017 and 2014,2016, respectively.
Defined Benefit Pension Plans
The Company sponsors defined benefit pension plans in the United States and in certain foreign subsidiaries with some plans offering participation in the plans at the employees’ option. Under these plans, benefits are based on an employee’s years of credited service and a percentage of final average compensation. However, the majority of the plans are closed to new employees and participants are no longer accruing benefits.
The funded status of the defined benefit pension plans is recognized on the Consolidated Balance Sheets and the gains or losses and prior service costs or credits that arise during the period, but are not recognized as components of net periodic benefit cost, are recognized as a component of accumulated other comprehensive loss, net of tax.
The components of net periodic benefit(benefit) cost consisted of the following:
| | | | Year Ended December 31, | Year Ended December 31, |
| | 2016 | | 2015 | | 2014 | 2018 | | 2017 | | 2016 |
Service cost | $ | 4 |
| | $ | 5 |
| | $ | 5 |
| $ | 6 |
| | $ | 5 |
| | $ | 4 |
|
Interest cost | 21 |
| | 22 |
| | 29 |
| 19 |
| | 19 |
| | 21 |
|
Expected return on plan assets | (27 | ) | | (31 | ) | | (32 | ) | (33 | ) | | (30 | ) | | (27 | ) |
Amortization of unrecognized amounts | 5 |
| | 5 |
| | 3 |
| 7 |
| | 8 |
| | 5 |
|
| Net periodic benefit cost | $ | 3 |
| | $ | 1 |
| | $ | 5 |
| |
| Net periodic (benefit) cost | | $ | (1 | ) | | $ | 2 |
| | $ | 3 |
|
__________
| |
(a) | For the year ended December 31, 2018, $4 million and $2 million were included in operating expenses and selling, general and administrative expenses, respectively. |
| |
(b) | Included in selling, general and administrative expenses. |
The estimated amount that will be amortized from accumulated other comprehensive loss into net periodic benefit cost in 20172019 is $9$7 million, which consists primarily of $8 million for net actuarial loss and $1 million for prior service cost.
losses.
The Company uses a measurement date of December 31 for its pension plans. The funded status of the pension plans were as follows: | | | | As of December 31, | As of December 31, |
| Change in Benefit Obligation | 2016 | | 2015 | 2018 | | 2017 |
| Benefit obligation at end of prior year | $ | 656 |
| | $ | 716 |
| $ | 779 |
| | $ | 720 |
|
| Service cost | 4 |
| | 5 |
| 6 |
| | 5 |
|
| Interest cost | 21 |
| | 22 |
| 19 |
| | 19 |
|
| Actuarial (gain) loss | 115 |
| | (32 | ) | (32 | ) | | 15 |
|
| Currency translation adjustment | (53 | ) | | (30 | ) | (24 | ) | | 44 |
|
| Net benefits paid | (23 | ) | | (25 | ) | (26 | ) | | (24 | ) |
| Benefit obligation at end of current year | $ | 720 |
| | $ | 656 |
| $ | 722 |
| | $ | 779 |
|
| | | | | | | |
| Change in Plan Assets | | | | | | |
| Fair value of assets at end of prior year | $ | 527 |
| | $ | 553 |
| $ | 614 |
| | $ | 523 |
|
| Actual return on plan assets | 60 |
| | 5 |
| (29 | ) | | 59 |
|
| Employer contributions | 12 |
| | 14 |
| 11 |
| | 24 |
|
| Currency translation adjustment | (53 | ) | | (20 | ) | (21 | ) | | 32 |
|
| Net benefits paid | (23 | ) | | (25 | ) | (26 | ) | | (24 | ) |
| Fair value of assets at end of current year | $ | 523 |
| | $ | 527 |
| $ | 549 |
| | $ | 614 |
|
| | | | As of December 31, | As of December 31, |
| Funded Status | 2016 | | 2015 | 2018 | | 2017 |
| Classification of net balance sheet assets (liabilities): | | | | | | |
| Non-current assets | $ | — |
| | $ | 30 |
| $ | 18 |
| | $ | 24 |
|
| Current liabilities | (1 | ) | | (1 | ) | (4 | ) | | (3 | ) |
| Non-current liabilities | (196 | ) | | (158 | ) | (187 | ) | | (186 | ) |
| Net funded status | $ | (197 | ) | | $ | (129 | ) | $ | (173 | ) | | $ | (165 | ) |
The following assumptions were used to determine pension obligations and pension costs for the principal plans in which the Company’s employees participated:
| | | | | For the Year Ended December 31, | | For the Year Ended December 31, |
| U.S. Pension Benefit Plans | U.S. Pension Benefit Plans | 2016 | | 2015 | | 2014 | U.S. Pension Benefit Plans | 2018 | | 2017 | | 2016 |
| Discount rate: | Discount rate: | | | | | | Discount rate: | | | | | |
| | Net periodic benefit cost | 4.40 | % | | 4.00 | % | | 4.75 | % | Net periodic benefit cost | 3.50 | % | | 3.90 | % | | 4.40 | % |
| | Benefit obligation | 3.90 | % | | 4.40 | % | | 4.00 | % | Benefit obligation | 4.15 | % | | 3.50 | % | | 3.90 | % |
| Long-term rate of return on plan assets | Long-term rate of return on plan assets | 7.00 | % | | 7.25 | % | | 7.50 | % | Long-term rate of return on plan assets | 7.00 | % | | 7.00 | % | | 7.00 | % |
| | | | | | | | | | | | | |
| Non-U.S. Pension Benefit Plans | Non-U.S. Pension Benefit Plans | | | | | | Non-U.S. Pension Benefit Plans | | | | | |
| Discount rate: | Discount rate: | | | | | | Discount rate: | | | | | |
| | Net periodic benefit cost | 3.45 | % | | 3.30 | % | | 4.50 | % | Net periodic benefit cost | 2.55 | % | | 2.45 | % | | 3.45 | % |
| | Benefit obligation | 2.45 | % | | 3.45 | % | | 3.30 | % | Benefit obligation | 2.75 | % | | 2.55 | % | | 2.45 | % |
| Long-term rate of return on plan assets | Long-term rate of return on plan assets | 4.45 | % | | 4.65 | % | | 5.30 | % | Long-term rate of return on plan assets | 4.50 | % | | 4.70 | % | | 4.45 | % |
To select discount rates for its defined benefit pension plans, the Company uses a modeling process that involves matching the expected cash outflows of such plans, to yield curves constructed from portfolios of AA-rated fixed-income debt instruments. The Company uses the average yields of the hypothetical portfolios as a discount rate benchmark.
The Company’s expected rate of return on plan assets of 7.00% and 4.45%4.50% for the U.S. plans and non-U.S. plans, respectively, used to determine pension obligations and pension costs, is aare long-term raterates based on historic plan asset returns in individual jurisdictions, over varying long-term periods combined with current market expectations and broad asset mix considerations.
As of December 31, 2016,2018, plans with benefit obligations in excess of plan assets had accumulated benefit obligations of $720$423 million and plan assets of $523$234 million. As of December 31, 2015,2017, plans with benefit obligations in excess of plan assets had accumulated benefit obligations of $386$453 million and plan assets of
$228 $264 million. The accumulated benefit obligation for all plans was $712$713 million and $646$769 million as of December 31, 20162018 and 2015,2017, respectively. The Company expects to contribute approximately $47 million to the U.S. plans and $7 million to the non-U.S. plans in 2017.2019.
The Company’s defined benefit pension plans’ assets are invested primarily in mutual funds and may change in value due to various risks, such as interest rate and credit risk and overall market volatility. Due to the level of risk associated with investment securities, it is reasonably possible that changes in the values of the pension plans’ investment securities will occur in the near term and that such changes would materially affect the amounts reported in the Company’s financial statements.
The defined benefit pension plans’ investment goals and objectives are managed by the Company or Company-appointed and member-appointed trustees with consultation from independent investment advisors. While the objectives may vary slightly by country and jurisdiction, collectively the Company seeks to produce returns on pension plan investments, which are based on levels of liquidity and investment risk that the Company believes are prudent and reasonable, given prevailing capital market conditions. The pension plans’ assets are managed in the long-term interests of the participants and the beneficiaries of the plans. A suitable strategic asset allocation benchmark is determined for each plan to maintain a diversified portfolio, taking into account government requirements, if any, regarding unnecessary investment risk and protection of pension plans’ assets. The Company believes that diversification of the pension plans’ assets is an important investment strategy to provide reasonable assurance that no single security or class of securities will have a disproportionate impact on the pension plans. As such, the Company allocates assets among traditional equity, fixed income (government issued securities, corporate bonds and short-term cash investments) and other investment strategies.
The equity component’s purpose is to provide a total return that will help preserve the purchasing power of the assets. The pension plans hold various mutual funds that invest in equity securities and are diversified among funds that invest in large cap, small cap, growth, value and international stocks as well as funds that are intended to “track” an index, such as the S&P 500. The equity investments in the portfolios will represent a greater assumption of market volatility and risk as well as provide higher anticipated total return over the long term. The equity component is expected to approximate 40%-60% of the plans’ assets.
The purpose of the fixed income component is to provide a deflation hedge, to reduce the overall volatility of the pension plans’ assets in relation to the liability and to produce current income. The pension plans hold mutual funds that invest in securities issued by governments, government agencies and corporations. The fixed income component is expected to approximate 40%-60% of the plans’ assets.
The following table presents the defined benefit pension plans’ assets measured at fair value, as of December 31:
| | | | 2016 | 2018 |
| Asset Class | Level 1 | | Level 2 | | Total | Level 1 | | Level 2 | | Total |
| Cash equivalents and short-term investments | $ | 12 |
| | $ | 15 |
| | $ | 27 |
| $ | 10 |
| | $ | 25 |
| | $ | 35 |
|
| U.S. equities | 87 |
| | 34 |
| | 121 |
| 82 |
| | 42 |
| | 124 |
|
| Non-U.S. equities | 40 |
| | 70 |
| | 110 |
| 49 |
| | 80 |
| | 129 |
|
| Real estate | — |
| | 15 |
| | 15 |
| — |
| | 17 |
| | 17 |
|
| Government bonds | 7 |
| | 70 |
| | 77 |
| 3 |
| | 8 |
| | 11 |
|
| Corporate bonds | 82 |
| | 40 |
| | 122 |
| 89 |
| | 31 |
| | 120 |
|
| Other assets | 2 |
| | 49 |
| | 51 |
| 2 |
| | 111 |
| | 113 |
|
| Total assets | $ | 230 |
| | $ | 293 |
| | $ | 523 |
| $ | 235 |
| | $ | 314 |
| | $ | 549 |
|
| | | | 2015 | 2017 |
| Asset Class | Level 1 | | Level 2 | | Total | Level 1 | | Level 2 | | Total |
| Cash equivalents and short-term investments | $ | — |
| | $ | 12 |
| | $ | 12 |
| $ | 12 |
| | $ | 29 |
| | $ | 41 |
|
| U.S. equities | — |
| | 126 |
| | 126 |
| 102 |
| | 43 |
| | 145 |
|
| Non-U.S. equities | — |
| | 129 |
| | 129 |
| 50 |
| | 100 |
| | 150 |
|
| Real estate | | — |
| | 18 |
| | 18 |
|
| Government bonds | — |
| | 103 |
| | 103 |
| 7 |
| | 11 |
| | 18 |
|
| Corporate bonds | — |
| | 133 |
| | 133 |
| 90 |
| | 37 |
| | 127 |
|
| Other assets | — |
| | 24 |
| | 24 |
| 3 |
| | 112 |
| | 115 |
|
| Total assets | $ | — |
| | $ | 527 |
| | $ | 527 |
| $ | 264 |
| | $ | 350 |
| | $ | 614 |
|
The Company estimates that future benefit payments from plan assets will be $23 million, $25 million, $27 million, $27 million, $28 million, $29 million, $30 million, $31 million and $158172 million for 2017, 2018, 2019, 2020, 2021, 2022, 2023 and 20222024 to 2026,2028, respectively.
Multiemployer Plans
The Company contributes to a number of multiemployer plans under the terms of collective-bargaining agreements that cover a portion of its employees. The risks of participating in these multiemployer plans are different from single-employer plans in the following aspects: (i) assets contributed to the multiemployer plan by one employer may be used to provide benefits to employees of other participating employers; (ii) if a participating employer stops contributing to the plan, the unfunded obligations of the plan may be borne by the remaining participating employers; (iii) if the Company elects to stop participating in a multiemployer plan, it may be required to contribute to such plan an amount based on the under-funded status of the plan; and (iv) the Company has no involvement in the management of the multiemployer plans’ investments. For the years ended December 31, 2016, 20152018, 2017 and 2014,2016, the Company contributed a total of $9 million in each of the periods to multiemployer plans.
18. Financial Instruments
Risk Management
Currency Risk. The Company uses currency exchange contracts to manage its exposure to changes in currency exchange rates associated with its non-U.S.-dollar denominated receivables and forecasted royalties, forecasted earnings of non-U.S. subsidiaries and forecasted non-U.S.-dollar denominated
acquisitions. The Company primarily hedges a portion of its current-year currency exposure to the Australian, Canadian and New Zealand dollars, the Euroeuro and the British pound sterling. The majority of forward contracts do not qualify for hedge accounting treatment. The fluctuations in the value of these forward contracts do, however, largely offset the impact of changes in the value of the underlying risk they economically hedge. Forward contracts used to hedge forecasted third-party receipts and disbursements up to 12 months are designated and do qualify as cash flow hedges. The Company has designated its Euro-denominatedeuro-denominated notes as a hedge of its investment in Euro-denominatedeuro-denominated foreign operations.
The amount of gains or losses reclassified from other comprehensive income (loss) to earnings resulting from ineffectiveness or from excluding a component of the hedges’ gain or loss from the effectiveness calculation for cash flow and net investment hedges during 2016, 20152018, 2017 and 20142016 was not material, nor is the amount of gains or losses the Company expects to reclassify from accumulated other comprehensive income (loss) to earnings over the next 12 months.
Interest Rate Risk. The Company uses various hedging strategies including interest rate swaps and interest rate caps to create an appropriate mix of fixed and floating rate assets and liabilities. The after-tax amount of gains or losses reclassified from accumulated other comprehensive income (loss) to earnings resulting from ineffectiveness for 2016, 2015 and 2014related to the Company’s cash flow hedges was not material during 2018, 2017 and 2016 to the Company’s results of operations. The Company expects $4estimates that $6 million of lossesgains currently deferredrecorded in accumulated other comprehensive income (loss) towill be recognized in earnings during 2017.over the next 12 months.
Commodity Risk. The Company periodically enters into derivative commodity contracts to manage its exposure to changes in the price of gasoline. These instruments were designated as freestanding derivatives and the changes in fair value are recorded in the Company’s consolidated results of operations.
Credit Risk and Exposure. The Company is exposed to counterparty credit risks in the event of nonperformance by counterparties to various agreements and sales transactions. The Company manages such risk by evaluating the financial position and creditworthiness of such counterparties and by requiring collateral in certain instances in which financing is provided. The Company mitigates counterparty credit risk associated with its derivative contracts by monitoring the amount for which it is at risk with each counterparty, periodically evaluating counterparty creditworthiness and financial position, and where possible, dispersing its risk among multiple counterparties.
There were no significant concentrations of credit risk with any individual counterparty or groups of counterparties at December 31, 20162018 or 2015,2017, other than (i) risks related to the Company’s repurchase and guaranteed depreciation agreements with domestic and foreign car manufacturers, including Ford, General Motors, Chrysler, Peugeot, Kia, Volkswagen, Fiat, Mercedes, Toyota and Volvo, and primarily with respect to receivables for program cars that were disposed but for which the Company has not yet received payment from the manufacturers (see Note 2-Summary of Significant Accounting Policies), (ii) receivables from Realogy and Wyndham related to certain contingent, income tax and other corporate liabilities assumed by Realogy and Wyndham in connection with their disposition and (iii) risks related to leases which have been assumed by Realogy Wyndham or Travelport but of which the Company is a guarantor. Concentrations of credit risk associated with trade receivables are considered minimal due to the Company’s diverse customer base. The Company does not normally require collateral or other security to support credit sales.
Fair Value
Derivative instruments and hedging activities
As described above, derivative assets and liabilities consist principally of currency exchange contracts, interest rate swaps, interest rate caps and commodity contracts.
The Company held derivative instruments with absolute notional values as follows:
| | | | As of December 31, | As of December 31, |
| | 2016 | | 2015 | 2018 | | 2017 |
Interest rate caps (a) | $ | 9,736 |
| | $ | 10,179 |
| $ | 8,431 |
| | $ | 10,968 |
|
| Interest rate swaps | 1,950 |
| | 900 |
| 1,500 |
| | 1,000 |
|
| Foreign exchange contracts | 692 |
| | 811 |
| 1,235 |
| | 934 |
|
__________
| |
(a) | Represents $7.4$5.7 billion of interest rate caps sold, partially offset by approximately $2.3$2.7 billion of interest rate caps purchased at December 31, 20162018 and $8.2$8.0 billion of interest rate caps sold, partially offset by approximately $2.0$3.0 billion of interest rate caps purchased at December 31, 2015.2017. These amounts exclude $5.1$3.0 billion and $6.2$5.0 billion of interest rate caps purchased by the Company’s Avis Budget Rental Car Funding subsidiary at December 31, 20162018 and 2015,2017, respectively. |
Fair values (Level 2) of derivative instruments are as follows:
| | | | | As of December 31, 2016 | | As of December 31, 2015 | | As of December 31, 2018 | | As of December 31, 2017 |
| | | Fair Value, Asset Derivatives | | Fair Value, Liability Derivatives | | Fair Value, Asset Derivatives | | Fair Value, Liability Derivatives | | Fair Value, Asset Derivatives | | Fair Value, Liability Derivatives | | Fair Value, Asset Derivatives | | Fair Value, Liability Derivatives |
| Derivatives designated as hedging instruments | Derivatives designated as hedging instruments | | | | | | | | Derivatives designated as hedging instruments | | | | | | | |
| | Interest rate swaps (a) | $ | 7 |
| | $ | 4 |
| | $ | 1 |
| | $ | 5 |
| Interest rate swaps (a) | $ | 12 |
| | $ | 8 |
| | $ | 8 |
| | $ | — |
|
| Derivatives not designated as hedging instruments | Derivatives not designated as hedging instruments | | | | | | | | Derivatives not designated as hedging instruments | | | | | | | |
| | Interest rate caps (b) | 1 |
| | 7 |
| | 1 |
| | 5 |
| Interest rate caps (b) | — |
| | 2 |
| | — |
| | 1 |
|
| | Foreign exchange contracts (c) | 7 |
| | 2 |
| | 16 |
| | 2 |
| Foreign exchange contracts (c) | 5 |
| | 11 |
| | 3 |
| | 7 |
|
| | Commodity contracts (c) | — |
| | — |
| | — |
| | 1 |
| Commodity contracts (c) | — |
| | 1 |
| | — |
| | $ | — |
|
| | Total | $ | 15 |
| | $ | 13 |
| | $ | 18 |
| | $ | 13 |
| Total | $ | 17 |
| | $ | 22 |
| | $ | 11 |
| | $ | 8 |
|
__________
Amounts in this table exclude derivatives issued by Avis Budget Rental Car Funding, as it is not consolidated by the Company; however, certain amounts related to the derivatives held by Avis Budget Rental Car Funding are included within accumulated other comprehensive income (loss), as discussed in Note 15-Stockholders’ Equity.
| |
(a) | Included in other non-current assets or other non-current liabilities. |
| |
(b) | Included in assets under vehicle programs or liabilities under vehicle programs. |
| |
(c) | Included in other current assets or other current liabilities. |
The effects of derivatives recognized in the Company’s Consolidated Financial Statements are as follows:
| | | | | Year Ended December 31, | | Year Ended December 31, |
| | | 2016 | | 2015 | | 2014 | | 2018 | | 2017 | | 2016 |
Financial instruments designated as hedging instruments (a) | Financial instruments designated as hedging instruments (a) | | | | | | Financial instruments designated as hedging instruments (a) | | | | | |
| | Interest rate swaps | $ | 4 |
| | $ | (1 | ) | | $ | (2 | ) | Interest rate swaps | $ | (4 | ) | | $ | 3 |
| | $ | 4 |
|
| | Euro-denominated notes | 14 |
| | 34 |
| | 46 |
| Euro-denominated notes | 24 |
| | (50 | ) | | 14 |
|
Financial instruments not designated as hedging instruments (b) | Financial instruments not designated as hedging instruments (b) | | | | | | Financial instruments not designated as hedging instruments (b) | | | | | |
| | Foreign exchange contracts (c) | 42 |
| | 48 |
| | 8 |
| Foreign exchange contracts (c) | 31 |
| | (42 | ) | | 42 |
|
| | Interest rate caps (d) | (2 | ) | | (2 | ) | | (3 | ) | Interest rate caps (d) | (3 | ) | | (1 | ) | | (2 | ) |
| | Commodity contracts (e) | — |
| | — |
| | (3 | ) | Commodity contracts (e) | — |
| | (1 | ) | | — |
|
| Total | Total | $ | 58 |
| | $ | 79 |
| | $ | 46 |
| Total | $ | 48 |
| | $ | (91 | ) | | $ | 58 |
|
__________
| |
(a) | Recognized, net of tax, as a component of accumulated other comprehensive income (loss) within stockholders’ equity. |
| |
(b) | Gains (losses) related to derivative instruments are expected to be largely offset by (losses) gains on the underlying exposures being hedged. |
| |
(c) | For the year ended December 31, 2016,2018, included a $68$19 million gain included in interest expense and a $2612 million gain included in operating expenses. For the year ended December 31, 2017, included a $23 million loss included in interest expense and a $19 million loss included in operating expenses. For the year ended December 31, 2015,2016, included a $32 million gain in interest expense and a $16 million gain included in operating expenses. For the year ended December 31, 2014, included a $10$68 million gain in interest expense and a $2$26 million loss included in operating expenses. |
| |
(d) | For the years ended December 31, 2016, 2015 and 2014, amounts arePrimarily included in vehicle interest, net. |
| |
(e) | Included in operating expenses. |
Debt Instruments
The carrying amounts and estimated fair values (Level 2) of debt instruments are as follows:
| | | | | As of December 31, 2016 | | As of December 31, 2015 | | As of December 31, 2018 | | As of December 31, 2017 |
| | | Carrying Amount | | Estimated Fair Value | | Carrying Amount | | Estimated Fair Value | | Carrying Amount | | Estimated Fair Value | | Carrying Amount | | Estimated Fair Value |
| Corporate debt | Corporate debt | | | | | | | | Corporate debt | | | | | | | |
| | Short-term debt and current portion of long-term debt | $ | 279 |
| | $ | 280 |
| | $ | 26 |
| | $ | 26 |
| Short-term debt and current portion of long-term debt | $ | 23 |
| | $ | 23 |
| | $ | 26 |
| | $ | 26 |
|
| | Long-term debt | 3,244 |
| | 3,265 |
| | 3,435 |
| | 3,478 |
| Long-term debt | 3,528 |
| | 3,462 |
| | 3,573 |
| | 3,677 |
|
| | | | | | | | | | | | | | | | | |
| Debt under vehicle programs | Debt under vehicle programs | | | | | | | | Debt under vehicle programs | | | | | | | |
| | Vehicle-backed debt due to Avis Budget Rental Car Funding | $ | 6,695 |
| | $ | 6,722 |
| | $ | 6,796 |
| | $ | 6,836 |
| Vehicle-backed debt due to Avis Budget Rental Car Funding | $ | 7,358 |
| | $ | 7,383 |
| | $ | 6,480 |
| | $ | 6,537 |
|
| | Vehicle-backed debt | 2,176 |
| | 2,187 |
| | 2,060 |
| | 2,071 |
| Vehicle-backed debt | 2,871 |
| | 2,881 |
| | 2,740 |
| | 2,745 |
|
| | Interest rate swaps and interest rate caps (a) | 7 |
| | 7 |
| | 4 |
| | 4 |
| Interest rate swaps and interest rate caps (a) | 3 |
| | 3 |
| | 1 |
| | 1 |
|
___________
| |
(a) | Derivatives in liability position. |
19. Segment Information
The Company’s chief operating decision maker assesses performance and allocates resources based upon the separate financial information from the Company’s operating segments. In identifying its reportable segments, the Company considered the nature of services provided, the geographical areas in which the segments operated and other relevant factors. The Company aggregates certain of its operating segments into its reportable segments.
Management evaluates the operating results of each of its reportable segments based upon revenue and “Adjusted EBITDA,” which the Company defines as income from continuing operations before non-vehicle related depreciation and amortization, any impairment charge,charges, restructuring expense,and other related charges, early extinguishment of debt costs, non-vehicle related interest, transaction-related costs, net charges for an unprecedented personal-injury legal mattermatters, non-operational charges related to shareholder activist activity and income taxes. ChargesNet charges for theunprecedented personal-injury legal mattermatters are recorded inwithin operating expenses in the Company’s consolidated statementConsolidated Statements of operations.Operations. The Company has revised its definition of Adjusted EBITDA to exclude non-operational charges for an unprecedented personal-injuryrelated to shareholder activist activity. Non-operational charges related to shareholder activist activity include third-party advisory, legal matter whichand other professional service fees and are recorded within selling, general and administrative expenses in the Company does not view as indicativeCompany’s Consolidated Statements of underlying business results due to its nature. WeOperations. The Company did not revise prior years’ Adjusted EBITDA amounts because there were no chargescosts similar in nature to this legal matter.
these items. The Company’s presentation of Adjusted EBITDA may not be comparable to similarly-titled measures used by other companies.
Year Ended December 31, 20162018 | | | | Americas | | International | | Corporate and Other (a) | | Total | Americas | | International | | Corporate and Other (a) | | Total |
| Net revenues | $ | 6,121 |
| | $ | 2,538 |
| | $ | — |
| | $ | 8,659 |
| |
| Revenues | | $ | 6,186 |
| | $ | 2,938 |
| | $ | — |
| | $ | 9,124 |
|
| Vehicle depreciation and lease charges, net | 1,559 |
| | 488 |
| | — |
| | 2,047 |
| 1,568 |
| | 611 |
| | — |
| | 2,179 |
|
| Vehicle interest, net | 226 |
| | 58 |
| | — |
| | 284 |
| 252 |
| | 62 |
| | — |
| | 314 |
|
| Adjusted EBITDA | 633 |
| | 273 |
| | (68 | ) | | 838 |
| 558 |
| | 287 |
| | (64 | ) | | 781 |
|
| Non-vehicle depreciation and amortization | 165 |
| | 88 |
| | — |
| | 253 |
| 152 |
| | 104 |
| | — |
| | 256 |
|
| Assets exclusive of assets under vehicle programs | 4,017 |
| | 1,990 |
| | 58 |
| | 6,065 |
| 3,782 |
| | 2,495 |
| | 93 |
| | 6,370 |
|
| Assets under vehicle programs | 9,210 |
| | 2,368 |
| | — |
| | 11,578 |
| 9,670 |
| | 3,109 |
| | — |
| | 12,779 |
|
| Capital expenditures (excluding vehicles) | 121 |
| | 62 |
| | 7 |
| | 190 |
| 134 |
| | 76 |
| | 21 |
| | 231 |
|
__________
| |
(a) | Primarily represents unallocated corporate expenses and receivables from our former subsidiaries.subsidiaries. |
Year Ended December 31, 20152017
| | | | Americas | | International | | Corporate and Other (a) | | Total | Americas | | International | | Corporate and Other (a) | | Total |
| Net revenues | $ | 6,069 |
| | $ | 2,433 |
| | $ | — |
| | $ | 8,502 |
| |
| Revenues | | $ | 6,100 |
| | $ | 2,748 |
| | $ | — |
| | $ | 8,848 |
|
| Vehicle depreciation and lease charges, net | 1,478 |
| | 455 |
| | — |
| | 1,933 |
| 1,671 |
| | 550 |
| | — |
| | 2,221 |
|
| Vehicle interest, net | 234 |
| | 55 |
| | — |
| | 289 |
| 226 |
| | 60 |
| | — |
| | 286 |
|
| Adjusted EBITDA | 682 |
| | 277 |
| | (56 | ) | | 903 |
| 486 |
| | 305 |
| | (56 | ) | | 735 |
|
| Non-vehicle depreciation and amortization | 143 |
| | 75 |
| | — |
| | 218 |
| 168 |
| | 91 |
| | — |
| | 259 |
|
| Assets exclusive of assets under vehicle programs | 3,940 |
| | 1,901 |
| | 77 |
| | 5,918 |
| 3,388 |
| | 2,353 |
| | 79 |
| | 5,820 |
|
| Assets under vehicle programs | 9,440 |
| | 2,276 |
| | — |
| | 11,716 |
| 9,017 |
| | 2,862 |
| | — |
| | 11,879 |
|
| Capital expenditures (excluding vehicles) | 131 |
| | 68 |
| | — |
| | 199 |
| 122 |
| | 62 |
| | 13 |
| | 197 |
|
__________
| |
(a) | Primarily represents unallocated corporate expenses and receivables from our former subsidiaries. |
Year Ended December 31, 20142016
| | | | Americas | | International | | Corporate and Other (a) | | Total | Americas | | International | | Corporate and Other (a) | | Total |
| Net revenues | $ | 5,961 |
| | $ | 2,524 |
| | $ | — |
| | $ | 8,485 |
| |
| Revenues | | $ | 6,121 |
| | $ | 2,538 |
| | $ | — |
| | $ | 8,659 |
|
| Vehicle depreciation and lease charges, net | 1,492 |
| | 504 |
| | — |
| | 1,996 |
| 1,559 |
| | 488 |
| | — |
| | 2,047 |
|
| Vehicle interest, net | 234 |
| | 48 |
| | — |
| | 282 |
| 226 |
| | 58 |
| | — |
| | 284 |
|
| Adjusted EBITDA | 656 |
| | 280 |
| | (60 | ) | | 876 |
| 633 |
| | 273 |
| | (68 | ) | | 838 |
|
| Non-vehicle depreciation and amortization | 122 |
| | 58 |
| | — |
| | 180 |
| 165 |
| | 88 |
| | — |
| | 253 |
|
| Assets exclusive of assets under vehicle programs | 3,946 |
| | 1,730 |
| | 108 |
| | 5,784 |
| 4,017 |
| | 1,990 |
| | 58 |
| | 6,065 |
|
| Assets under vehicle programs | 9,162 |
| | 1,896 |
| | — |
| | 11,058 |
| 9,210 |
| | 2,368 |
| | — |
| | 11,578 |
|
| Capital expenditures (excluding vehicles) | 113 |
| | 69 |
| | — |
| | 182 |
| 121 |
| | 62 |
| | 7 |
| | 190 |
|
__________
| |
(a) | Primarily represents unallocated corporate expenses and receivables from our former subsidiaries. |
Provided below is a reconciliation of Adjusted EBITDA to income before income taxes.
| | | | | For the Year Ended December 31, | | For the Year Ended December 31, |
| | | 2016 | | 2015 | | 2014 | | 2018 | | 2017 | | 2016 |
| Adjusted EBITDA | Adjusted EBITDA | $ | 838 |
| | $ | 903 |
| | $ | 876 |
| Adjusted EBITDA | $ | 781 |
| | $ | 735 |
| | $ | 838 |
|
Less: Non-vehicle related depreciation and amortization (a) | Less: Non-vehicle related depreciation and amortization (a) | 253 |
| | 218 |
| | 180 |
| Less: Non-vehicle related depreciation and amortization (a) | 256 |
| | 259 |
| | 253 |
|
| | Interest expense related to corporate debt, net | 203 |
| | 194 |
| | 209 |
| Interest expense related to corporate debt, net | 188 |
| | 188 |
| | 203 |
|
| | Early extinguishment of corporate debt | 27 |
| | 23 |
| | 56 |
| Early extinguishment of corporate debt | 19 |
| | 3 |
| | 27 |
|
| | Restructuring expense | 29 |
| | 18 |
| | 26 |
| Restructuring and other related charges | 22 |
| | 63 |
| | 29 |
|
| | Transaction-related costs, net | 21 |
| | 68 |
| | 13 |
| Transaction-related costs, net | 20 |
| | 23 |
| | 21 |
|
| | Charges for legal matter (b) | 26 |
| | — |
| | — |
| Non-operational charges related to shareholder activist activity (b) | 9 |
| | — |
| | — |
|
| | | Impairment | — |
| | 2 |
| | — |
|
| | | Charges for legal matter, net (c) | — |
| | (14 | ) | | 26 |
|
| Income before income taxes | Income before income taxes | $ | 279 |
| | $ | 382 |
| | $ | 392 |
| Income before income taxes | $ | 267 |
| | $ | 211 |
| | $ | 279 |
|
__________
| |
(a) | Includes amortization of intangible assets recognized in purchase accounting of $61 million in 2018, $58 million in 2017 and $59 million in 2016, $55 million in 2015 and $33 million in 2014.2016. |
| |
(b) | Reported within selling, general and administrative expenses in our Consolidated Statements of Operations. |
| |
(c) | Reported within operating expenses in our consolidated statementConsolidated Statements of operations.Operations. |
The geographic segment information provided below is classified based on the geographic location of the Company’s subsidiaries.
| | | | United States | | All Other Countries | | Total | United States | | All Other Countries | | Total |
| 2016 | | | | | | |
| Net revenues | $ | 5,674 |
| | $ | 2,985 |
| | $ | 8,659 |
| |
| 2018 | | | | | | |
| Revenues | | $ | 5,708 |
| | $ | 3,416 |
| | $ | 9,124 |
|
| Assets exclusive of assets under vehicle programs | 3,699 |
| | 2,366 |
| | 6,065 |
| 3,494 |
| | 2,876 |
| | 6,370 |
|
| Assets under vehicle programs | 8,552 |
| | 3,026 |
| | 11,578 |
| 9,021 |
| | 3,758 |
| | 12,779 |
|
| Net long-lived assets | 1,489 |
| | 1,073 |
| | 2,562 |
| 1,476 |
| | 1,177 |
| | 2,653 |
|
| | | | | | | | | | | |
| 2015 | | | | | | |
| Net revenues | $ | 5,635 |
| | $ | 2,867 |
| | $ | 8,502 |
| |
| 2017 | | | | | | |
| Revenues | | $ | 5,629 |
| | $ | 3,219 |
| | $ | 8,848 |
|
| Assets exclusive of assets under vehicle programs | 3,677 |
| | 2,241 |
| | 5,918 |
| 3,069 |
| | 2,751 |
| | 5,820 |
|
| Assets under vehicle programs | 8,786 |
| | 2,930 |
| | 11,716 |
| 8,192 |
| | 3,687 |
| | 11,879 |
|
| Net long-lived assets | 1,502 |
| | 1,069 |
| | 2,571 |
| 1,451 |
| | 1,176 |
| | 2,627 |
|
| | | | | | | | | | | |
| 2014 | | | | | | |
| Net revenues | $ | 5,471 |
| | $ | 3,014 |
| | $ | 8,485 |
| |
| 2016 | | | | | | |
| Revenues | | $ | 5,674 |
| | $ | 2,985 |
| | $ | 8,659 |
|
| Assets exclusive of assets under vehicle programs | 3,745 |
| | 2,039 |
| | 5,784 |
| 3,699 |
| | 2,366 |
| | 6,065 |
|
| Assets under vehicle programs | 8,428 |
| | 2,630 |
| | 11,058 |
| 8,552 |
| | 3,026 |
| | 11,578 |
|
| Net long-lived assets | 1,481 |
| | 885 |
| | 2,366 |
| 1,489 |
| | 1,073 |
| | 2,562 |
|
20. Guarantor and Non-Guarantor Consolidating Financial Statements
The following consolidating financial information presents Consolidating Condensed Statements of Operations for the years ended December 31, 2016, 20152018, 2017 and 2014,2016, Consolidating Condensed Balance Sheets as of December 31, 20162018 and December 31, 20152017 and Consolidating Condensed Statements of Cash Flows for the years ended December 31, 2016, 20152018, 2017 and 20142016 for: (i) Avis Budget Group, Inc. (the “Parent”); (ii) ABCR and Avis Budget Finance, Inc. (the “Subsidiary Issuers”); (iii) the guarantor subsidiaries; (iv) the non-guarantor subsidiaries; (v) elimination entries necessary to consolidate the Parent with the Subsidiary Issuers, the guarantor and non-guarantor subsidiaries; and (vi) the Company on a consolidated basis. The Subsidiary Issuers and the guarantor and non-guarantor subsidiaries are 100% owned by the Parent, either directly or indirectly. All guarantees are full and unconditional and joint and several. This financial information is being presented in relation to the Company’s guarantee of the payment of principal, premium (if any) and interest on the notes issued by the Subsidiary Issuers. See Note 12-Long-term Corporate Debt and Borrowing Arrangements for additional description of these guaranteed notes. The Senior Notes have separate investors than the equity investors of the Company and are guaranteed by the Parent and certain subsidiaries.
Investments in subsidiaries are accounted for using the equity method of accounting for purposes of the consolidating presentation. The principal elimination entries relate to investments in subsidiaries and intercompany balances and transactions. For purposes of the accompanying Consolidating Condensed Statements of Operations, certain expenses incurred by the Subsidiary Issuers are allocated to the guarantor and non-guarantor subsidiaries.
The following table provides a reconciliation of the cash and cash equivalents, program and restricted cash reported within the Consolidating Condensed Balance Sheets to the amounts shown in the Consolidating Condensed Statements of Cash Flows.
|
| | | | | | | | | | | | | |
| | As of December 31, |
| | 2018 | | 2017 |
| | Non-Guarantor | Total | | Non-Guarantor | Total |
| Cash and cash equivalents | $ | 601 |
| $ | 615 |
| | $ | 593 |
| $ | 611 |
|
| Program cash | 115 |
| 115 |
| | 283 |
| 283 |
|
Restricted cash (a) | 5 |
| 5 |
| | 7 |
| 7 |
|
| Total cash and cash equivalents, program and restricted cash | $ | 721 |
| $ | 735 |
| | $ | 883 |
| $ | 901 |
|
_________
| |
(a) | Included within other current assets. |
Consolidating Condensed Statements of Operations
For the Year Ended December 31, 20162018
| | | | | Parent | | Subsidiary Issuers | | Guarantor Subsidiaries | | Non- Guarantor Subsidiaries | | Eliminations | | Total | | Parent | | Subsidiary Issuers | | Guarantor Subsidiaries | | Non- Guarantor Subsidiaries | | Eliminations | | Total |
| Revenues | Revenues | | | | | | | | | | | | Revenues | $ | — |
| | $ | — |
| | $ | 5,431 |
| | $ | 6,006 |
| | $ | (2,313 | ) | | $ | 9,124 |
|
| | Vehicle rental | $ | — |
| | $ | — |
| | $ | 4,134 |
| | $ | 1,947 |
| | $ | — |
| | $ | 6,081 |
| |
| | Other | — |
| | — |
| | 1,209 |
| | 3,563 |
| | (2,194 | ) | | 2,578 |
| |
| Net revenues | — |
| | — |
| | 5,343 |
| | 5,510 |
| | (2,194 | ) | | 8,659 |
| |
| | | | | | | | | | | | | | | | | | | | | | | | | |
| Expenses | Expenses | | | | | | | | | | | | Expenses | | | | | | | | | | | |
| | Operating | 4 |
| | 18 |
| | 2,622 |
| | 1,738 |
| | — |
| | 4,382 |
| Operating | 4 |
| | 7 |
| | 2,668 |
| | 1,960 |
| | — |
| | 4,639 |
|
| | Vehicle depreciation and lease charges, net | — |
| | — |
| | 1,993 |
| | 2,045 |
| | (1,991 | ) | | 2,047 |
| Vehicle depreciation and lease charges, net | — |
| | — |
| | 2,162 |
| | 2,102 |
| | (2,085 | ) | | 2,179 |
|
| | Selling, general and administrative | 38 |
| | 18 |
| | 631 |
| | 447 |
| | — |
| | 1,134 |
| Selling, general and administrative | 48 |
| | 11 |
| | 662 |
| | 499 |
| | — |
| | 1,220 |
|
| | Vehicle interest, net | — |
| | — |
| | 198 |
| | 289 |
| | (203 | ) | | 284 |
| Vehicle interest, net | — |
| | — |
| | 229 |
| | 313 |
| | (228 | ) | | 314 |
|
| | Non-vehicle related depreciation and amortization | — |
| | 2 |
| | 155 |
| | 96 |
| | — |
| | 253 |
| Non-vehicle related depreciation and amortization | — |
| | 1 |
| | 145 |
| | 110 |
| | — |
| | 256 |
|
| | Interest expense related to corporate debt, net: | | | | | | | | | | | | Interest expense related to corporate debt, net: | | | | | | | | | | | |
| | | Interest expense | — |
| | 141 |
| | 3 |
| | 59 |
| | — |
| | 203 |
| | Interest expense | — |
| | 153 |
| | 3 |
| | 32 |
| | — |
| | 188 |
|
| | | Intercompany interest expense (income) | (13 | ) | | (7 | ) | | 23 |
| | (3 | ) | | — |
| | — |
| | Intercompany interest expense (income) | (12 | ) | | (11 | ) | | 26 |
| | (3 | ) | | — |
| | — |
|
| | | Early extinguishment of debt | — |
| | 10 |
| | — |
| | 17 |
| | — |
| | 27 |
| | Early extinguishment of debt | — |
| | 19 |
| | — |
| | — |
| | — |
| | 19 |
|
| | Restructuring Expense | — |
| | — |
| | 9 |
| | 20 |
| | — |
| | 29 |
| Restructuring and other related charges | — |
| | — |
| | 11 |
| | 11 |
| | — |
| | 22 |
|
| | Transaction-related costs, net | — |
| | 2 |
| | 1 |
| | 18 |
| | — |
| | 21 |
| Transaction-related costs, net | — |
| | 1 |
| | 4 |
| | 15 |
| | — |
| | 20 |
|
| Total expenses | Total expenses | 29 |
| | 184 |
| | 5,635 |
| | 4,726 |
| | (2,194 | ) | | 8,380 |
| Total expenses | 40 |
| | 181 |
| | 5,910 |
| | 5,039 |
| | (2,313 | ) | | 8,857 |
|
| | | | | | | | | | | | | | | | | | | | | | | | | |
| Income (loss) before income taxes and equity in earnings of subsidiaries | Income (loss) before income taxes and equity in earnings of subsidiaries | (29 | ) | | (184 | ) | | (292 | ) | | 784 |
| | — |
| | 279 |
| Income (loss) before income taxes and equity in earnings of subsidiaries | (40 | ) | | (181 | ) | | (479 | ) | | 967 |
| | — |
| | 267 |
|
| Provision for (benefit from) income taxes | Provision for (benefit from) income taxes | (11 | ) | | (70 | ) | | 123 |
| | 74 |
| | — |
| | 116 |
| Provision for (benefit from) income taxes | (10 | ) | | (48 | ) | | 93 |
| | 67 |
| | — |
| | 102 |
|
| Equity in earnings of subsidiaries | Equity in earnings of subsidiaries | 181 |
| | 295 |
| | 710 |
| | — |
| | (1,186 | ) | | — |
| Equity in earnings of subsidiaries | 195 |
| | 328 |
| | 900 |
| | — |
| | (1,423 | ) | | — |
|
| Net income | Net income | $ | 163 |
| | $ | 181 |
| | $ | 295 |
| | $ | 710 |
| | $ | (1,186 | ) | | $ | 163 |
| Net income | $ | 165 |
| | $ | 195 |
| | $ | 328 |
| | $ | 900 |
| | $ | (1,423 | ) | | $ | 165 |
|
| | | | | | | | | | | | | | | | | | | | | | | | | |
| Comprehensive income | Comprehensive income | $ | 156 |
| | $ | 173 |
| | $ | 283 |
| | $ | 712 |
| | $ | (1,168 | ) | | $ | 156 |
| Comprehensive income | $ | 62 |
| | $ | 92 |
| | $ | 228 |
| | $ | 806 |
| | $ | (1,126 | ) | | $ | 62 |
|
For the Year Ended December 31, 20152017
| | | | | Parent | | Subsidiary Issuers | | Guarantor Subsidiaries | | Non-Guarantor Subsidiaries | | Eliminations | | Total | | Parent | | Subsidiary Issuers | | Guarantor Subsidiaries | | Non-Guarantor Subsidiaries | | Eliminations | | Total |
| Revenues | Revenues | | | | | | | | | | | | Revenues | $ | — |
| | $ | — |
| | $ | 5,312 |
| | $ | 5,931 |
| | $ | (2,395 | ) | | $ | 8,848 |
|
| | Vehicle rental | $ | — |
| | $ | — |
| | $ | 4,124 |
| | $ | 1,902 |
| | $ | — |
| | $ | 6,026 |
| | | | | | | | | | | | |
| Expenses | | Expenses | | | | | | | | | | | |
| | Other | — |
| | — |
| | 1,181 |
| | 3,335 |
| | (2,040 | ) | | 2,476 |
| Operating | 3 |
| | 20 |
| | 2,598 |
| | 1,851 |
| | — |
| | 4,472 |
|
| Net revenues | — |
| | — |
| | 5,305 |
| | 5,237 |
| | (2,040 | ) | | 8,502 |
| |
| | | | | | | | | | | | | | |
| Expenses | | | | | | | | | | | | |
| | Operating | 2 |
| | 17 |
| | 2,587 |
| | 1,678 |
| | — |
| | 4,284 |
| Vehicle depreciation and lease charges, net | — |
| | — |
| | 2,226 |
| | 2,183 |
| | (2,188 | ) | | 2,221 |
|
| | Vehicle depreciation and lease charges, net | — |
| | 1 |
| | 1,819 |
| | 1,936 |
| | (1,823 | ) | | 1,933 |
| Selling, general and administrative | 39 |
| | 8 |
| | 619 |
| | 454 |
| | — |
| | 1,120 |
|
| | Selling, general and administrative | 32 |
| | 15 |
| | 619 |
| | 427 |
| | — |
| | 1,093 |
| Vehicle interest, net | — |
| | — |
| | 199 |
| | 294 |
| | (207 | ) | | 286 |
|
| | Vehicle interest, net | — |
| | — |
| | 204 |
| | 302 |
| | (217 | ) | | 289 |
| Non-vehicle related depreciation and amortization | — |
| | 1 |
| | 160 |
| | 98 |
| | — |
| | 259 |
|
| | Non-vehicle related depreciation and amortization | — |
| | 1 |
| | 133 |
| | 84 |
| | — |
| | 218 |
| Interest expense related to corporate debt, net: | | | | | | | | | | | |
| | Interest expense related to corporate debt, net: | | | | | | | | | | | | | Interest expense | — |
| | 157 |
| | 1 |
| | 30 |
| | — |
| | 188 |
|
| | | Interest expense | — |
| | 159 |
| | (5 | ) | | 40 |
| | — |
| | 194 |
| | Intercompany interest expense (income) | (12 | ) | | 95 |
| | 23 |
| | (106 | ) | | — |
| | — |
|
| | | Intercompany interest expense (income) | (12 | ) | | (11 | ) | | 16 |
| | 7 |
| | — |
| | — |
| | Early extinguishment of debt | — |
| | 4 |
| | — |
| | (1 | ) | | — |
| | 3 |
|
| | | Early extinguishment of debt | — |
| | 23 |
| | — |
| | — |
| | — |
| | 23 |
| Restructuring and other related charges | — |
| | 7 |
| | 44 |
| | 12 |
| | — |
| | 63 |
|
| | Transaction-related costs, net | — |
| | 22 |
| | 6 |
| | 40 |
| | — |
| | 68 |
| Transaction-related costs, net | — |
| | 1 |
| | 3 |
| | 19 |
| | — |
| | 23 |
|
| | Restructuring expense | — |
| | — |
| | 6 |
| | 12 |
| | — |
| | 18 |
| Impairment | — |
| | — |
| | 2 |
| | — |
| | — |
| | 2 |
|
| Total expenses | Total expenses | 22 |
| | 227 |
| | 5,385 |
| | 4,526 |
| | (2,040 | ) | | 8,120 |
| Total expenses | 30 |
| | 293 |
| | 5,875 |
| | 4,834 |
| | (2,395 | ) | | 8,637 |
|
| | | | | | | | | | | | | | | | | | | | | | | | | |
| Income (loss) before income taxes and equity in earnings of subsidiaries | Income (loss) before income taxes and equity in earnings of subsidiaries | (22 | ) | | (227 | ) | | (80 | ) | | 711 |
| | — |
| | 382 |
| Income (loss) before income taxes and equity in earnings of subsidiaries | (30 | ) | | (293 | ) | | (563 | ) | | 1,097 |
| | — |
| | 211 |
|
| Provision for (benefit from) income taxes | Provision for (benefit from) income taxes | (9 | ) | | (178 | ) | | 170 |
| | 86 |
| | — |
| | 69 |
| Provision for (benefit from) income taxes | (5 | ) | | 267 |
| | (527 | ) | | 115 |
| | — |
| | (150 | ) |
| Equity in earnings of subsidiaries | Equity in earnings of subsidiaries | 326 |
| | 375 |
| | 625 |
| | — |
| | (1,326 | ) | | — |
| Equity in earnings of subsidiaries | 386 |
| | 946 |
| | 982 |
| | — |
| | (2,314 | ) | | — |
|
| Net income | Net income | $ | 313 |
| | $ | 326 |
| | $ | 375 |
| | $ | 625 |
| | $ | (1,326 | ) | | $ | 313 |
| Net income | $ | 361 |
| | $ | 386 |
| | $ | 946 |
| | $ | 982 |
| | $ | (2,314 | ) | | $ | 361 |
|
| | | | | | | | | | | | | | | | | | | | | | | | | |
| Comprehensive income | Comprehensive income | $ | 188 |
| | $ | 203 |
| | $ | 253 |
| | $ | 504 |
| | $ | (960 | ) | | $ | 188 |
| Comprehensive income | $ | 491 |
| | $ | 515 |
| | $ | 1,073 |
| | $ | 1,103 |
| | $ | (2,691 | ) | | $ | 491 |
|
For the Year Ended December 31, 20142016
| | | | | Parent | | Subsidiary Issuers | | Guarantor Subsidiaries | | Non-Guarantor Subsidiaries | | Eliminations | | Total | | Parent | | Subsidiary Issuers | | Guarantor Subsidiaries | | Non-Guarantor Subsidiaries | | Eliminations | | Total |
| Revenues | Revenues | | | | | | | | | | | | Revenues | $ | — |
| | $ | — |
| | $ | 5,343 |
| | $ | 5,510 |
| | $ | (2,194 | ) | | $ | 8,659 |
|
| | Vehicle rental | $ | — |
| | $ | — |
| | $ | 4,038 |
| | $ | 1,988 |
| | $ | — |
| | $ | 6,026 |
| |
| | Other | — |
| | — |
| | 1,167 |
| | 3,426 |
| | (2,134 | ) | | 2,459 |
| |
| Net revenues | — |
| | — |
| | 5,205 |
| | 5,414 |
| | (2,134 | ) | | 8,485 |
| |
| | | | | | | | | | | | | | | | | | | | | | | | | |
| Expenses | Expenses | | | | | | | | | | | | Expenses | | | | | | | | | | | |
| | Operating | 10 |
| | 13 |
| | 2,525 |
| | 1,703 |
| | — |
| | 4,251 |
| Operating | 4 |
| | 18 |
| | 2,622 |
| | 1,738 |
| | — |
| | 4,382 |
|
| | Vehicle depreciation and lease charges, net | — |
| | 1 |
| | 1,920 |
| | 1,996 |
| | (1,921 | ) | | 1,996 |
| Vehicle depreciation and lease charges, net | — |
| | — |
| | 1,993 |
| | 2,045 |
| | (1,991 | ) | | 2,047 |
|
| | Selling, general and administrative | 27 |
| | 23 |
| | 602 |
| | 428 |
| | — |
| | 1,080 |
| Selling, general and administrative | 38 |
| | 18 |
| | 631 |
| | 447 |
| | — |
| | 1,134 |
|
| | Vehicle interest, net | — |
| | — |
| | 200 |
| | 295 |
| | (213 | ) | | 282 |
| Vehicle interest, net | — |
| | — |
| | 198 |
| | 289 |
| | (203 | ) | | 284 |
|
| | Non-vehicle related depreciation and amortization | — |
| | 2 |
| | 111 |
| | 67 |
| | — |
| | 180 |
| Non-vehicle related depreciation and amortization | — |
| | 2 |
| | 155 |
| | 96 |
| | — |
| | 253 |
|
| | Interest expense related to corporate debt, net: | | | | | | | | | | | | Interest expense related to corporate debt, net: | | | | | | | | | | | |
| | | Interest expense | 2 |
| | 163 |
| | 2 |
| | 42 |
| | — |
| | 209 |
| | Interest expense | — |
| | 141 |
| | 3 |
| | 59 |
| | — |
| | 203 |
|
| | | Intercompany interest expense (income) | (13 | ) | | (11 | ) | | 1 |
| | 23 |
| | — |
| | — |
| | Intercompany interest expense (income) | (13 | ) | | (7 | ) | | 23 |
| | (3 | ) | | — |
| | — |
|
| | | Early extinguishment of debt | — |
| | 56 |
| | — |
| | — |
| | — |
| | 56 |
| | Early extinguishment of debt | — |
| | 10 |
| | — |
| | 17 |
| | — |
| | 27 |
|
| | Restructuring expense | — |
| | — |
| | 7 |
| | 19 |
| | — |
| | 26 |
| Restructuring and other related charges | — |
| | — |
| | 9 |
| | 20 |
| | — |
| | 29 |
|
| | Transaction-related costs, net | 1 |
| | 8 |
| | (20 | ) | | 24 |
| | — |
| | 13 |
| Transaction-related costs, net | — |
| | 2 |
| | 1 |
| | 18 |
| | — |
| | 21 |
|
| Total expenses | Total expenses | 27 |
| | 255 |
| | 5,348 |
| | 4,597 |
| | (2,134 | ) | | 8,093 |
| Total expenses | 29 |
| | 184 |
| | 5,635 |
| | 4,726 |
| | (2,194 | ) | | 8,380 |
|
| | | | | | | | | | | | | | | | | | | | | | | | | |
| Income (loss) before income taxes and equity in earnings of subsidiaries | Income (loss) before income taxes and equity in earnings of subsidiaries | (27 | ) | | (255 | ) | | (143 | ) | | 817 |
| | — |
| | 392 |
| Income (loss) before income taxes and equity in earnings of subsidiaries | (29 | ) | | (184 | ) | | (292 | ) | | 784 |
| | — |
| | 279 |
|
| Provision for (benefit from) income taxes | Provision for (benefit from) income taxes | (10 | ) | | (108 | ) | | 186 |
| | 79 |
| | — |
| | 147 |
| Provision for (benefit from) income taxes | (11 | ) | | (70 | ) | | 123 |
| | 74 |
| | — |
| | 116 |
|
| Equity in earnings of subsidiaries | Equity in earnings of subsidiaries | 262 |
| | 409 |
| | 738 |
| | — |
| | (1,409 | ) | | — |
| Equity in earnings of subsidiaries | 181 |
| | 295 |
| | 710 |
| | — |
| | (1,186 | ) | | — |
|
| Net income | Net income | $ | 245 |
| | $ | 262 |
| | $ | 409 |
| | $ | 738 |
| | $ | (1,409 | ) | | $ | 245 |
| Net income | $ | 163 |
| | $ | 181 |
| | $ | 295 |
| | $ | 710 |
| | $ | (1,186 | ) | | $ | 163 |
|
| | | | | | | | | | | | | | | | | | | | | | | | | |
| Comprehensive income | Comprehensive income | $ | 106 |
| | $ | 123 |
| | $ | 273 |
| | $ | 624 |
| | $ | (1,020 | ) | | $ | 106 |
| Comprehensive income | $ | 156 |
| | $ | 173 |
| | $ | 283 |
| | $ | 712 |
| | $ | (1,168 | ) | | $ | 156 |
|
Consolidating Condensed Balance Sheets
As of December 31, 20162018
| | | | | Parent | | Subsidiary Issuers | | Guarantor Subsidiaries | | Non-Guarantor Subsidiaries | | Eliminations | | Total | | Parent | | Subsidiary Issuers | | Guarantor Subsidiaries | | Non-Guarantor Subsidiaries | | Eliminations | | Total |
| Assets | Assets | | | | | | | | | | | | Assets | | | | | | | | | | | |
| Current assets: | Current assets: | | | | | | | | | | | | Current assets: | | | | | | | | | | | |
| | Cash and cash equivalents | $ | 3 |
| | $ | 12 |
| | $ | — |
| | $ | 475 |
| | $ | — |
| | $ | 490 |
| Cash and cash equivalents | $ | 1 |
| | $ | 12 |
| | $ | 1 |
| | $ | 601 |
| | $ | — |
| | $ | 615 |
|
| | Receivables, net | — |
| | — |
| | 231 |
| | 577 |
| | — |
| | 808 |
| Receivables, net | — |
| | — |
| | 239 |
| | 716 |
| | — |
| | 955 |
|
| | Other current assets | 2 |
| | 101 |
| | 90 |
| | 326 |
| | — |
| | 519 |
| Other current assets | 5 |
| | 112 |
| | 116 |
| | 371 |
| | — |
| | 604 |
|
| Total current assets | Total current assets | 5 |
| | 113 |
| | 321 |
| | 1,378 |
| | — |
| | 1,817 |
| Total current assets | 6 |
| | 124 |
| | 356 |
| | 1,688 |
| | — |
| | 2,174 |
|
| | | | | | | | | | | | | | | | | | | | | | | | | |
| Property and equipment, net | Property and equipment, net | — |
| | 148 |
| | 341 |
| | 196 |
| | — |
| | 685 |
| Property and equipment, net | — |
| | 199 |
| | 319 |
| | 218 |
| | — |
| | 736 |
|
| Deferred income taxes | Deferred income taxes | 20 |
| | 1,219 |
| | 268 |
| | — |
| | (14 | ) | | 1,493 |
| Deferred income taxes | 13 |
| | 1,015 |
| | 207 |
| | 66 |
| | — |
| | 1,301 |
|
| Goodwill | Goodwill | — |
| | — |
| | 489 |
| | 518 |
| | — |
| | 1,007 |
| Goodwill | — |
| | — |
| | 471 |
| | 621 |
| | — |
| | 1,092 |
|
| Other intangibles, net | Other intangibles, net | — |
| | 28 |
| | 502 |
| | 340 |
| | — |
| | 870 |
| Other intangibles, net | — |
| | 26 |
| | 475 |
| | 324 |
| | — |
| | 825 |
|
| Other non-current assets | Other non-current assets | 75 |
| | 24 |
| | 16 |
| | 78 |
| | — |
| | 193 |
| Other non-current assets | 47 |
| | 39 |
| | 16 |
| | 140 |
| | — |
| | 242 |
|
| Intercompany receivables | Intercompany receivables | 171 |
| | 359 |
| | 1,466 |
| | 670 |
| | (2,666 | ) | | — |
| Intercompany receivables | 159 |
| | 404 |
| | 2,104 |
| | 1,262 |
| | (3,929 | ) | | — |
|
| Investment in subsidiaries | Investment in subsidiaries | 42 |
| | 3,717 |
| | 3,698 |
| | — |
| | (7,457 | ) | | — |
| Investment in subsidiaries | 246 |
| | 4,786 |
| | 3,852 |
| | — |
| | (8,884 | ) | | — |
|
| Total assets exclusive of assets under vehicle programs | Total assets exclusive of assets under vehicle programs | 313 |
| | 5,608 |
| | 7,101 |
| | 3,180 |
| | (10,137 | ) | | 6,065 |
| Total assets exclusive of assets under vehicle programs | 471 |
| | 6,593 |
| | 7,800 |
| | 4,319 |
| | (12,813 | ) | | 6,370 |
|
| | | | | | | | | | | | | | | | | | | | | | | | | |
| Assets under vehicle programs: | Assets under vehicle programs: | | | | | | | | | | | | Assets under vehicle programs: | | | | | | | | | | | |
| | Program cash | — |
| | — |
| | — |
| | 225 |
| | — |
| | 225 |
| Program cash | — |
| | — |
| | — |
| | 115 |
| | — |
| | 115 |
|
| | Vehicles, net | — |
| | 24 |
| | 70 |
| | 10,370 |
| | — |
| | 10,464 |
| Vehicles, net | — |
| | 55 |
| | 54 |
| | 11,365 |
| | — |
| | 11,474 |
|
| | Receivables from vehicle manufacturers and other | — |
| | 1 |
| | — |
| | 526 |
| | — |
| | 527 |
| Receivables from vehicle manufacturers and other | — |
| | 2 |
| | — |
| | 629 |
| | — |
| | 631 |
|
| | Investment in Avis Budget Rental Car Funding (AESOP) LLC-related party | — |
| | — |
| | — |
| | 362 |
| | — |
| | 362 |
| Investment in Avis Budget Rental Car Funding (AESOP) LLC-related party | — |
| | — |
| | — |
| | 559 |
| | — |
| | 559 |
|
| | | — |
| | 25 |
| | 70 |
| | 11,483 |
| | — |
| | 11,578 |
| | — |
| | 57 |
| | 54 |
| | 12,668 |
| | — |
| | 12,779 |
|
| Total assets | Total assets | $ | 313 |
| | $ | 5,633 |
| | $ | 7,171 |
| | $ | 14,663 |
| | $ | (10,137 | ) | | $ | 17,643 |
| Total assets | $ | 471 |
| | $ | 6,650 |
| | $ | 7,854 |
| | $ | 16,987 |
| | $ | (12,813 | ) | | $ | 19,149 |
|
| | | | | | | | | | | | | | | | | | | | | | | | | |
| Liabilities and stockholders’ equity | Liabilities and stockholders’ equity | | | | | | | | | | | | Liabilities and stockholders’ equity | | | | | | | | | | | |
| Current liabilities: | Current liabilities: | | | | | | | | | | | | Current liabilities: | | | | | | | | | | | |
| | Accounts payable and other current liabilities | $ | 23 |
| | $ | 189 |
| | $ | 512 |
| | $ | 764 |
| | $ | — |
| | $ | 1,488 |
| Accounts payable and other current liabilities | $ | 16 |
| | $ | 246 |
| | $ | 582 |
| | $ | 849 |
| | $ | — |
| | $ | 1,693 |
|
| | Short-term debt and current portion of long-term debt | — |
| | 264 |
| | 3 |
| | 12 |
| | — |
| | 279 |
| Short-term debt and current portion of long-term debt | — |
| | 18 |
| | 3 |
| | 2 |
| | — |
| | 23 |
|
| Total current liabilities | Total current liabilities | 23 |
| | 453 |
| | 515 |
| | 776 |
| | — |
| | 1,767 |
| Total current liabilities | 16 |
| | 264 |
| | 585 |
| | 851 |
| | — |
| | 1,716 |
|
| | | | | | | | | | | | | | | | | | | | | | | | | |
| Long-term debt | Long-term debt | — |
| | 2,730 |
| | 3 |
| | 511 |
| | — |
| | 3,244 |
| Long-term debt | — |
| | 2,501 |
| | 3 |
| | 1,024 |
| | — |
| | 3,528 |
|
| Other non-current liabilities | Other non-current liabilities | 69 |
| | 88 |
| | 253 |
| | 368 |
| | (14 | ) | | 764 |
| Other non-current liabilities | 41 |
| | 87 |
| | 257 |
| | 382 |
| | — |
| | 767 |
|
| Intercompany payables | Intercompany payables | — |
| | 2,306 |
| | 359 |
| | 1 |
| | (2,666 | ) | | — |
| Intercompany payables | — |
| | 3,524 |
| | 404 |
| | 1 |
| | (3,929 | ) | | — |
|
| Total liabilities exclusive of liabilities under vehicle programs | Total liabilities exclusive of liabilities under vehicle programs | 92 |
| | 5,577 |
| | 1,130 |
| | 1,656 |
| | (2,680 | ) | | 5,775 |
| Total liabilities exclusive of liabilities under vehicle programs | 57 |
| | 6,376 |
| | 1,249 |
| | 2,258 |
| | (3,929 | ) | | 6,011 |
|
| Liabilities under vehicle programs: | Liabilities under vehicle programs: | | | | | | | | | | | | Liabilities under vehicle programs: | | | | | | | | | | | |
| | Debt | — |
| | 14 |
| | 66 |
| | 2,103 |
| | — |
| | 2,183 |
| Debt | — |
| | 28 |
| | 49 |
| | 2,797 |
| | — |
| | 2,874 |
|
| | Due to Avis Budget Rental Car Funding (AESOP) LLC-related party | — |
| | — |
| | — |
| | 6,695 |
| | — |
| | 6,695 |
| Due to Avis Budget Rental Car Funding (AESOP) LLC-related party | — |
| | — |
| | — |
| | 7,358 |
| | — |
| | 7,358 |
|
| | Deferred income taxes | — |
| | — |
| | 2,258 |
| | 171 |
| | — |
| | 2,429 |
| Deferred income taxes | — |
| | — |
| | 1,770 |
| | 191 |
| | — |
| | 1,961 |
|
| | Other | — |
| | — |
| | — |
| | 340 |
| | — |
| | 340 |
| Other | — |
| | — |
| | — |
| | 531 |
| | — |
| | 531 |
|
| | | — |
| | 14 |
| | 2,324 |
| | 9,309 |
| | — |
| | 11,647 |
| | — |
| | 28 |
| | 1,819 |
| | 10,877 |
| | — |
| | 12,724 |
|
| Total stockholders’ equity | Total stockholders’ equity | 221 |
| | 42 |
| | 3,717 |
| | 3,698 |
| | (7,457 | ) | | 221 |
| Total stockholders’ equity | 414 |
| | 246 |
| | 4,786 |
| | 3,852 |
| | (8,884 | ) | | 414 |
|
| Total liabilities and stockholders’ equity | Total liabilities and stockholders’ equity | $ | 313 |
| | $ | 5,633 |
| | $ | 7,171 |
| | $ | 14,663 |
| | $ | (10,137 | ) | | $ | 17,643 |
| Total liabilities and stockholders’ equity | $ | 471 |
| | $ | 6,650 |
| | $ | 7,854 |
| | $ | 16,987 |
| | $ | (12,813 | ) | | $ | 19,149 |
|
As of December 31, 20152017
| | | | | Parent | | Subsidiary Issuers | | Guarantor Subsidiaries | | Non-Guarantor Subsidiaries | | Eliminations | | Total | | Parent | | Subsidiary Issuers | | Guarantor Subsidiaries | | Non-Guarantor Subsidiaries | | Eliminations | | Total |
| Assets | Assets | | | | | | | | | | | | Assets | | | | | | | | | | | |
| Current assets: | Current assets: | | | | | | | | | | | | Current assets: | | | | | | | | | | | |
| | Cash and cash equivalents | $ | 4 |
| | $ | 70 |
| | $ | — |
| | $ | 378 |
| | $ | — |
| | $ | 452 |
| Cash and cash equivalents | $ | 4 |
| | $ | 14 |
| | $ | — |
| | $ | 593 |
| | $ | — |
| | $ | 611 |
|
| | Receivables, net | — |
| | — |
| | 212 |
| | 456 |
| | — |
| | 668 |
| Receivables, net | — |
| | — |
| | 255 |
| | 667 |
| | — |
| | 922 |
|
| | Other current assets | 2 |
| | 78 |
| | 83 |
| | 344 |
| | — |
| | 507 |
| Other current assets | 4 |
| | 89 |
| | 101 |
| | 339 |
| | — |
| | 533 |
|
| Total current assets | Total current assets | 6 |
| | 148 |
| | 295 |
| | 1,178 |
| | — |
| | 1,627 |
| Total current assets | 8 |
| | 103 |
| | 356 |
| | 1,599 |
| | — |
| | 2,066 |
|
| | | | | | | | | | | | | | | | | | | | | | | | | |
| Property and equipment, net | Property and equipment, net | — |
| | 134 |
| | 345 |
| | 202 |
| | — |
| | 681 |
| Property and equipment, net | — |
| | 167 |
| | 321 |
| | 216 |
| | — |
| | 704 |
|
| Deferred income taxes | Deferred income taxes | 20 |
| | 1,246 |
| | 253 |
| | — |
| | (31 | ) | | 1,488 |
| Deferred income taxes | 14 |
| | 704 |
| | 154 |
| | 59 |
| | — |
| | 931 |
|
| Goodwill | Goodwill | — |
| | — |
| | 487 |
| | 486 |
| | — |
| | 973 |
| Goodwill | — |
| | — |
| | 471 |
| | 602 |
| | — |
| | 1,073 |
|
| Other intangibles, net | Other intangibles, net | — |
| | 30 |
| | 525 |
| | 362 |
| | — |
| | 917 |
| Other intangibles, net | — |
| | 27 |
| | 480 |
| | 343 |
| | — |
| | 850 |
|
| Other non-current assets | Other non-current assets | 93 |
| | 15 |
| | 17 |
| | 107 |
| | — |
| | 232 |
| Other non-current assets | 46 |
| | 29 |
| | 16 |
| | 105 |
| | — |
| | 196 |
|
| Intercompany receivables | Intercompany receivables | 160 |
| | 367 |
| | 1,070 |
| | 696 |
| | (2,293 | ) | | — |
| Intercompany receivables | 187 |
| | 382 |
| | 1,506 |
| | 824 |
| | (2,899 | ) | | — |
|
| Investment in subsidiaries | Investment in subsidiaries | 272 |
| | 3,426 |
| | 3,680 |
| | — |
| | (7,378 | ) | | — |
| Investment in subsidiaries | 381 |
| | 4,681 |
| | 3,938 |
| | — |
| | (9,000 | ) | | — |
|
| Total assets exclusive of assets under vehicle programs | Total assets exclusive of assets under vehicle programs | 551 |
| | 5,366 |
| | 6,672 |
| | 3,031 |
| | (9,702 | ) | | 5,918 |
| Total assets exclusive of assets under vehicle programs | 636 |
| | 6,093 |
| | 7,242 |
| | 3,748 |
| | (11,899 | ) | | 5,820 |
|
| | | | | | | | | | | | | | | | | | | | | | | | | |
| Assets under vehicle programs: | Assets under vehicle programs: | | | | | | | | | | | | Assets under vehicle programs: | | | | | | | | | | | |
| | Program cash | — |
| | — |
| | — |
| | 258 |
| | — |
| | 258 |
| Program cash | — |
| | — |
| | — |
| | 283 |
| | — |
| | 283 |
|
| | Vehicles, net | — |
| | 18 |
| | 78 |
| | 10,562 |
| | — |
| | 10,658 |
| Vehicles, net | — |
| | 34 |
| | 61 |
| | 10,531 |
| | — |
| | 10,626 |
|
| | Receivables from vehicle manufacturers and other | — |
| | — |
| | — |
| | 438 |
| | — |
| | 438 |
| Receivables from vehicle manufacturers and other | — |
| | 1 |
| | — |
| | 546 |
| | — |
| | 547 |
|
| | Investment in Avis Budget Rental Car Funding (AESOP) LLC-related party | — |
| | — |
| | — |
| | 362 |
| | — |
| | 362 |
| Investment in Avis Budget Rental Car Funding (AESOP) LLC-related party | — |
| | — |
| | — |
| | 423 |
| | — |
| | 423 |
|
| | | — |
| | 18 |
| | 78 |
| | 11,620 |
| | — |
| | 11,716 |
| | — |
| | 35 |
| | 61 |
| | 11,783 |
| | — |
| | 11,879 |
|
| Total assets | Total assets | $ | 551 |
| | $ | 5,384 |
| | $ | 6,750 |
| | $ | 14,651 |
| | $ | (9,702 | ) | | $ | 17,634 |
| Total assets | $ | 636 |
| | $ | 6,128 |
| | $ | 7,303 |
| | $ | 15,531 |
| | $ | (11,899 | ) | | $ | 17,699 |
|
| | | | | | | | | | | | | | | | | | | | | | | | | |
| Liabilities and stockholders’ equity | Liabilities and stockholders’ equity | | | | | | | | | | | | Liabilities and stockholders’ equity | | | | | | | | | | | |
| Current liabilities: | Current liabilities: | | | | | | | | | | | | Current liabilities: | | | | | | | | | | | |
| | Accounts payable and other current liabilities | $ | 24 |
| | $ | 180 |
| | $ | 471 |
| | $ | 810 |
| | $ | — |
| | $ | 1,485 |
| Accounts payable and other current liabilities | $ | 23 |
| | $ | 207 |
| | $ | 552 |
| | $ | 837 |
| | $ | — |
| | $ | 1,619 |
|
| | Short-term debt and current portion of long-term debt | — |
| | 14 |
| | 5 |
| | 7 |
| | — |
| | 26 |
| Short-term debt and current portion of long-term debt | — |
| | 17 |
| | 3 |
| | 6 |
| | — |
| | 26 |
|
| Total current liabilities | Total current liabilities | 24 |
| | 194 |
| | 476 |
| | 817 |
| | — |
| | 1,511 |
| Total current liabilities | 23 |
| | 224 |
| | 555 |
| | 843 |
| | — |
| | 1,645 |
|
| | | | | | | | | | | | | | | | | | | | | | | | | |
| Long-term debt | Long-term debt | — |
| | 2,932 |
| | 2 |
| | 501 |
| | — |
| | 3,435 |
| Long-term debt | — |
| | 2,910 |
| | 3 |
| | 660 |
| | — |
| | 3,573 |
|
| Other non-current liabilities | Other non-current liabilities | 88 |
| | 85 |
| | 237 |
| | 355 |
| | (31 | ) | | 734 |
| Other non-current liabilities | 40 |
| | 83 |
| | 216 |
| | 378 |
| | — |
| | 717 |
|
| Intercompany payables | Intercompany payables | — |
| | 1,897 |
| | 336 |
| | 60 |
| | (2,293 | ) | | — |
| Intercompany payables | — |
| | 2,515 |
| | 382 |
| | 2 |
| | (2,899 | ) | | — |
|
| Total liabilities exclusive of liabilities under vehicle programs | Total liabilities exclusive of liabilities under vehicle programs | 112 |
| | 5,108 |
| | 1,051 |
| | 1,733 |
| | (2,324 | ) | | 5,680 |
| Total liabilities exclusive of liabilities under vehicle programs | 63 |
| | 5,732 |
| | 1,156 |
| | 1,883 |
| | (2,899 | ) | | 5,935 |
|
| Liabilities under vehicle programs: | Liabilities under vehicle programs: | | | | | | | | | | | | Liabilities under vehicle programs: | | | | | | | | | | | |
| | Debt | — |
| | 4 |
| | 74 |
| | 1,986 |
| | — |
| | 2,064 |
| Debt | — |
| | 15 |
| | 57 |
| | 2,669 |
| | — |
| | 2,741 |
|
| | Due to Avis Budget Rental Car Funding (AESOP) LLC-related party | — |
| | — |
| | — |
| | 6,796 |
| | — |
| | 6,796 |
| Due to Avis Budget Rental Car Funding (AESOP) LLC-related party | — |
| | — |
| | — |
| | 6,480 |
| | — |
| | 6,480 |
|
| | Deferred income taxes | — |
| | — |
| | 2,199 |
| | 168 |
| | — |
| | 2,367 |
| Deferred income taxes | — |
| | — |
| | 1,407 |
| | 187 |
| | — |
| | 1,594 |
|
| | Other | — |
| | — |
| | — |
| | 288 |
| | — |
| | 288 |
| Other | — |
| | — |
| | 2 |
| | 374 |
| | — |
| | 376 |
|
| | | — |
| | 4 |
| | 2,273 |
| | 9,238 |
| | — |
| | 11,515 |
| | — |
| | 15 |
| | 1,466 |
| | 9,710 |
| | — |
| | 11,191 |
|
| Total stockholders’ equity | Total stockholders’ equity | 439 |
| | 272 |
| | 3,426 |
| | 3,680 |
| | (7,378 | ) | | 439 |
| Total stockholders’ equity | 573 |
| | 381 |
| | 4,681 |
| | 3,938 |
| | (9,000 | ) | | 573 |
|
| Total liabilities and stockholders’ equity | Total liabilities and stockholders’ equity | $ | 551 |
| | $ | 5,384 |
| | $ | 6,750 |
| | $ | 14,651 |
| | $ | (9,702 | ) | | $ | 17,634 |
| Total liabilities and stockholders’ equity | $ | 636 |
| | $ | 6,128 |
| | $ | 7,303 |
| | $ | 15,531 |
| | $ | (11,899 | ) | | $ | 17,699 |
|
Consolidating Condensed Statements of Cash Flows
For the Year Ended December 31, 20162018
| | | | Parent | | Subsidiary Issuers | | Guarantor Subsidiaries | | Non-Guarantor Subsidiaries | | Eliminations | | Total | Parent | | Subsidiary Issuers | | Guarantor Subsidiaries | | Non-Guarantor Subsidiaries | | Eliminations | | Total |
| Net cash provided by (used in) operating activities | $ | 268 |
| | $ | (10 | ) | | $ | 80 |
| | $ | 2,633 |
| | $ | (342 | ) | | $ | 2,629 |
| $ | 210 |
| | $ | 235 |
| | $ | 193 |
| | $ | 2,380 |
| | $ | (409 | ) | | $ | 2,609 |
|
| | | | | | | | | | | | | | | | | | | | | | | |
| Investing activities | | | | | | | | | | | | | | | | | | | | | | |
| Property and equipment additions | — |
| | (32 | ) | | (89 | ) | | (69 | ) | | — |
| | (190 | ) | — |
| | (64 | ) | | (88 | ) | | (79 | ) | | — |
| | (231 | ) |
| Proceeds received on asset sales | — |
| | 7 |
| | 4 |
| | 8 |
| | — |
| | 19 |
| — |
| | 2 |
| | 4 |
| | 11 |
| | — |
| | 17 |
|
| Net assets acquired (net of cash acquired) | — |
| | — |
| | (4 | ) | | (51 | ) | | — |
| | (55 | ) | — |
| | (3 | ) | | (10 | ) | | (78 | ) | | — |
| | (91 | ) |
| Intercompany loan receipts (advances) | — |
| | — |
| | 28 |
| | (316 | ) | | 288 |
| | — |
| — |
| | — |
| | — |
| | (404 | ) | | 404 |
| | — |
|
| Other, net | 118 |
| | (1 | ) | | — |
| | 4 |
| | (118 | ) | | 3 |
| — |
| | (8 | ) | | — |
| | (36 | ) | | — |
| | (44 | ) |
| Net cash provided by (used in) investing activities exclusive of vehicle programs | 118 |
| | (26 | ) | | (61 | ) | | (424 | ) | | 170 |
| | (223 | ) | — |
| | (73 | ) | | (94 | ) | | (586 | ) | | 404 |
| | (349 | ) |
| | | | | | | | | | | | | | | | | | | | | | | |
| Vehicle programs: | | | | | | | | | | | | | | | | | | | | | | |
| Decrease in program cash | — |
| | — |
| | — |
| | 31 |
| | — |
| | 31 |
| |
| Investment in vehicles | — |
| | (9 | ) | | (4 | ) | | (12,448 | ) | | — |
| | (12,461 | ) | — |
| | (2 | ) | | (1 | ) | | (12,586 | ) | | — |
| | (12,589 | ) |
| Proceeds received on disposition of vehicles | — |
| | 31 |
| | — |
| | 10,473 |
| | — |
| | 10,504 |
| — |
| | 42 |
| | — |
| | 9,606 |
| | — |
| | 9,648 |
|
| Investment in debt securities of Avis Budget Rental Car Funding (AESOP) LLC — related party | | — |
| | — |
| | — |
| | (188 | ) | | — |
| | (188 | ) |
| Proceeds from debt securities of Avis Budget Rental Car Funding (AESOP) LLC — related party | | — |
| | — |
| | — |
| | 52 |
| | — |
| | 52 |
|
| | — |
| | 22 |
| | (4 | ) | | (1,944 | ) | | — |
| | (1,926 | ) | — |
| | 40 |
| | (1 | ) | | (3,116 | ) | | — |
| | (3,077 | ) |
| Net cash provided by (used in) investing activities | 118 |
| | (4 | ) | | (65 | ) | | (2,368 | ) | | 170 |
| | (2,149 | ) | — |
| | (33 | ) | | (95 | ) | | (3,702 | ) | | 404 |
| | (3,426 | ) |
| | | | | | | | | | | | | | | | | | | | | | | |
| Financing activities | | | | | | | | | | | | | | | | | | | | | | |
| Proceeds from long-term borrowings | — |
| | 557 |
| | — |
| | 337 |
| | — |
| | 894 |
| — |
| | 81 |
| | — |
| | 404 |
| | — |
| | 485 |
|
| Payments on long-term borrowings | — |
| | (525 | ) | | (5 | ) | | (317 | ) | | — |
| | (847 | ) | — |
| | (510 | ) | | (3 | ) | | (2 | ) | | — |
| | (515 | ) |
| Net change in short-term borrowings | — |
| | — |
| | — |
| | 4 |
| | — |
| | 4 |
| — |
| | — |
| | — |
| | (4 | ) | | — |
| | (4 | ) |
| Debt financing fees | — |
| | (15 | ) | | — |
| | (5 | ) | | — |
| | (20 | ) | — |
| | (9 | ) | | — |
| | (6 | ) | | — |
| | (15 | ) |
| Repurchases of common stock | (387 | ) | | — |
| | — |
| | — |
| | — |
| | (387 | ) | (216 | ) | | — |
| | — |
| | — |
| | — |
| | (216 | ) |
| Intercompany loan borrowings (payments) | — |
| | 316 |
| | — |
| | (28 | ) | | (288 | ) | | — |
| — |
| | 404 |
| | — |
| | — |
| | (404 | ) | | — |
|
| Other, net | — |
| | (385 | ) | | — |
| | (75 | ) | | 460 |
| | — |
| 3 |
| | (167 | ) | | (85 | ) | | (157 | ) | | 409 |
| | 3 |
|
| Net cash provided by (used in) financing activities exclusive of vehicle programs | (387 | ) | | (52 | ) | | (5 | ) | | (84 | ) | | 172 |
| | (356 | ) | (213 | ) | | (201 | ) | | (88 | ) | | 235 |
| | 5 |
| | (262 | ) |
| | | | | | | | | | | | | | | | | | | | | | | |
| Vehicle programs: | | | | | | | | | | | | | | | | | | | | | | |
| Proceeds from borrowings | — |
| | 8 |
| | — |
| | 15,761 |
| | — |
| | 15,769 |
| — |
| | — |
| | — |
| | 17,339 |
| | — |
| | 17,339 |
|
| Payments on borrowings | — |
| | — |
| | (9 | ) | | (15,817 | ) | | — |
| | (15,826 | ) | — |
| | (3 | ) | | (9 | ) | | (16,373 | ) | | — |
| | (16,385 | ) |
| Debt financing fees | — |
| | — |
| | (1 | ) | | (24 | ) | | — |
| | (25 | ) | — |
| | — |
| | — |
| | (25 | ) | | — |
| | (25 | ) |
| | — |
| | 8 |
| | (10 | ) | | (80 | ) | | — |
| | (82 | ) | — |
| | (3 | ) | | (9 | ) | | 941 |
| | — |
| | 929 |
|
| Net cash provided by (used in) financing activities | (387 | ) | | (44 | ) | | (15 | ) | | (164 | ) | | 172 |
| | (438 | ) | (213 | ) | | (204 | ) | | (97 | ) | | 1,176 |
| | 5 |
| | 667 |
|
| Effect of changes in exchange rates on cash and cash equivalents | — |
| | — |
| | — |
| | (4 | ) | | — |
| | (4 | ) | |
| Net increase (decrease) in cash and cash equivalents | (1 | ) | | (58 | ) | | — |
| | 97 |
| | — |
| | 38 |
| |
| Cash and cash equivalents, beginning of period | 4 |
| | 70 |
| | — |
| | 378 |
| | — |
| | 452 |
| |
| Cash and cash equivalents, end of period | $ | 3 |
| | $ | 12 |
| | $ | — |
| | $ | 475 |
| | $ | — |
| | $ | 490 |
| |
| Effect of changes in exchange rates on cash and cash equivalents, program and restricted cash | | — |
| | — |
| | — |
| | (16 | ) | | — |
| | (16 | ) |
| Net increase in cash and cash equivalents, program and restricted cash | | (3 | ) | | (2 | ) | | 1 |
| | (162 | ) | | — |
| | (166 | ) |
| Cash and cash equivalents, program and restricted cash, beginning of period | | 4 |
| | 14 |
| | — |
| | 883 |
| | — |
| | 901 |
|
| Cash and cash equivalents, program and restricted cash, end of period | | $ | 1 |
| | $ | 12 |
| | $ | 1 |
| | $ | 721 |
| | $ | — |
| | $ | 735 |
|
For the Year Ended December 31, 20152017
| | | | Parent | | Subsidiary Issuers | | Guarantor Subsidiaries | | Non-Guarantor Subsidiaries | | Eliminations | | Total | Parent | | Subsidiary Issuers | | Guarantor Subsidiaries | | Non-Guarantor Subsidiaries | | Eliminations | | Total |
| Net cash provided by (used in) operating activities | $ | 60 |
| | $ | 249 |
| | $ | 146 |
| | $ | 2,204 |
| | $ | (75 | ) | | $ | 2,584 |
| $ | 110 |
| | $ | (89 | ) | | $ | 97 |
| | $ | 2,697 |
| | $ | (167 | ) | | $ | 2,648 |
|
| | | | | | | | | | | | | | | | | | | | | | | |
| Investing activities | | | | | | | | | | | | | | | | | | | | | | |
| Property and equipment additions | — |
| | (26 | ) | | (98 | ) | | (75 | ) | | — |
| | (199 | ) | — |
| | (49 | ) | | (81 | ) | | (67 | ) | | — |
| | (197 | ) |
| Proceeds received on asset sales | — |
| | 7 |
| | 1 |
| | 7 |
| | — |
| | 15 |
| — |
| | 1 |
| | — |
| | 7 |
| | — |
| | 8 |
|
| Net assets acquired (net of cash acquired) | — |
| | (8 | ) | | (9 | ) | | (239 | ) | | — |
| | (256 | ) | — |
| | (1 | ) | | (5 | ) | | (15 | ) | | — |
| | (21 | ) |
| Intercompany loan receipts (advances) | — |
| | (30 | ) | | (96 | ) | | — |
| | 126 |
| | — |
| — |
| | — |
| | — |
| | (264 | ) | | 264 |
| | — |
|
| Other, net | 334 |
| | (127 | ) | | 1 |
| | 8 |
| | (210 | ) | | 6 |
| 100 |
| | 110 |
| | 110 |
| | 5 |
| | (320 | ) | | 5 |
|
| Net cash provided by (used in) investing activities exclusive of vehicle programs | 334 |
| | (184 | ) | | (201 | ) | | (299 | ) | | (84 | ) | | (434 | ) | 100 |
| | 61 |
| | 24 |
| | (334 | ) | | (56 | ) | | (205 | ) |
| | | | | | | | | | | | | | | | | | | | | | | |
| Vehicle programs: | | | | | | | | | | | | | | | | | | | | | | |
| Increase in program cash | — |
| | — |
| | — |
| | (148 | ) | | — |
| | (148 | ) | |
| Investment in vehicles | — |
| | (1 | ) | | (2 | ) | | (11,925 | ) | | — |
| | (11,928 | ) | — |
| | (1 | ) | | — |
| | (11,537 | ) | | — |
| | (11,538 | ) |
| Proceeds received on disposition of vehicles | — |
| | 19 |
| | — |
| | 9,661 |
| | — |
| | 9,680 |
| — |
| | 46 |
| | — |
| | 9,554 |
| | — |
| | 9,600 |
|
| Investment in debt securities of Avis Budget Rental Car Funding (AESOP) LLC- related party | | — |
| | — |
| | — |
| | (61 | ) | | — |
| | (61 | ) |
| | — |
| | 18 |
| | (2 | ) | | (2,412 | ) | | — |
| | (2,396 | ) | — |
| | 45 |
| | — |
| | (2,044 | ) | | — |
| | (1,999 | ) |
| Net cash provided by (used in) investing activities | 334 |
| | (166 | ) | | (203 | ) | | (2,711 | ) | | (84 | ) | | (2,830 | ) | 100 |
| | 106 |
| | 24 |
| | (2,378 | ) | | (56 | ) | | (2,204 | ) |
| | | | | | | | | | | | | | | | | | | | | | | |
| Financing activities | | | | | | | | | | | | | | | | | | | | | | |
| Proceeds from long-term borrowings | — |
| | 375 |
| | — |
| | 2 |
| | — |
| | 377 |
| — |
| | 325 |
| | — |
| | 264 |
| | — |
| | 589 |
|
| Payments on long-term borrowings | — |
| | (256 | ) | | (4 | ) | | (41 | ) | | — |
| | (301 | ) | — |
| | (406 | ) | | (2 | ) | | (194 | ) | | — |
| | (602 | ) |
| Net change in short-term borrowings | — |
| | — |
| | — |
| | (22 | ) | | — |
| | (22 | ) | — |
| | — |
| | — |
| | (4 | ) | | — |
| | (4 | ) |
| Debt financing fees | — |
| | (7 | ) | | — |
| | — |
| | — |
| | (7 | ) | — |
| | (5 | ) | | — |
| | (4 | ) | | — |
| | (9 | ) |
| Repurchases of common stock | (393 | ) | | — |
| | — |
| | — |
| | — |
| | (393 | ) | (210 | ) | | — |
| | — |
| | — |
| | — |
| | (210 | ) |
| Intercompany loan borrowings (payments) | — |
| | — |
| | — |
| | 126 |
| | (126 | ) | | — |
| — |
| | 264 |
| | — |
| | — |
| | (264 | ) | | — |
|
| Other, net | 1 |
| | (335 | ) | | 70 |
| | (28 | ) | | 285 |
| | (7 | ) | 1 |
| | (192 | ) | | (110 | ) | | (185 | ) | | 487 |
| | 1 |
|
| Net cash provided by (used in) financing activities exclusive of vehicle programs | (392 | ) | | (223 | ) | | 66 |
| | 37 |
| | 159 |
| | (353 | ) | (209 | ) | | (14 | ) | | (112 | ) | | (123 | ) | | 223 |
| | (235 | ) |
| | | | | | | | | | | | | | | | | | | | | | | |
| Vehicle programs: | | | | | | | | | | | | | | | | | | | | | | |
| Proceeds from borrowings | — |
| | — |
| | — |
| | 14,138 |
| | — |
| | 14,138 |
| — |
| | — |
| | — |
| | 17,212 |
| | — |
| | 17,212 |
|
| Payments on borrowings | — |
| | — |
| | (9 | ) | | (13,639 | ) | | — |
| | (13,648 | ) | — |
| | (1 | ) | | (9 | ) | | (17,259 | ) | | — |
| | (17,269 | ) |
| Debt financing fees | — |
| | — |
| | — |
| | (22 | ) | | — |
| | (22 | ) | — |
| | — |
| | — |
| | (16 | ) | | — |
| | (16 | ) |
| | — |
| | — |
| | (9 | ) | | 477 |
| | — |
| | 468 |
| — |
| | (1 | ) | | (9 | ) | | (63 | ) | | — |
| | (73 | ) |
| Net cash provided by (used in) financing activities | (392 | ) | | (223 | ) | | 57 |
| | 514 |
| | 159 |
| | 115 |
| (209 | ) | | (15 | ) | | (121 | ) | | (186 | ) | | 223 |
| | (308 | ) |
| Effect of changes in exchange rates on cash and cash equivalents | — |
| | — |
| | — |
| | (41 | ) | | — |
| | (41 | ) | |
| Net decrease in cash and cash equivalents | 2 |
| | (140 | ) | | — |
| | (34 | ) | | — |
| | (172 | ) | |
| Cash and cash equivalents, beginning of period | 2 |
| | 210 |
| | — |
| | 412 |
| | — |
| | 624 |
| |
| Cash and cash equivalents, end of period | $ | 4 |
| | $ | 70 |
| | $ | — |
| | $ | 378 |
| | $ | — |
| | $ | 452 |
| |
| Effect of changes in exchange rates on cash and cash equivalents, program and restricted cash | | — |
| | — |
| | — |
| | 45 |
| | — |
| | 45 |
|
| Net increase (decrease) in cash and cash equivalents, program and restricted cash | | 1 |
| | 2 |
| | — |
| | 178 |
| | — |
| | 181 |
|
| Cash and cash equivalents, program and restricted cash, beginning of period | | 3 |
| | 12 |
| | — |
| | 705 |
| | — |
| | 720 |
|
| Cash and cash equivalents, program and restricted cash, end of period | | $ | 4 |
| | $ | 14 |
| | $ | — |
| | $ | 883 |
| | $ | — |
| | $ | 901 |
|
For the Year Ended December 31, 20142016
|
| | | | | | | | | | | | | | | | | | | | | | | |
| | Parent | | Subsidiary Issuers | | Guarantor Subsidiaries | | Non-Guarantor Subsidiaries | | Eliminations | | Total |
| Net cash provided by (used in) operating activities | $ | — |
| | $ | 469 |
| | $ | 340 |
| | $ | 1,840 |
| | $ | (70 | ) | | $ | 2,579 |
|
| | | | | | | | | | | | |
| Investing activities | | | | | | | | | | | |
| Property and equipment additions | — |
| | (20 | ) | | (84 | ) | | (78 | ) | | — |
| | (182 | ) |
| Proceeds received on asset sales | — |
| | 7 |
| | 8 |
| | 6 |
| | — |
| | 21 |
|
| Net assets acquired (net of cash acquired) | — |
| | — |
| | (263 | ) | | (153 | ) | | — |
| | (416 | ) |
| Other, net | 285 |
| | (9 | ) | | (2 | ) | | — |
| | (285 | ) | | (11 | ) |
| Net cash provided by (used in) investing activities exclusive of vehicle programs | 285 |
| | (22 | ) | | (341 | ) | | (225 | ) | | (285 | ) | | (588 | ) |
| | | | | | | | | | | | |
| Vehicle programs: | | | | | | | | | | | |
| Increase in program cash | — |
| | — |
| | — |
| | (10 | ) | | — |
| | (10 | ) |
| Investment in vehicles | — |
| | (9 | ) | | (90 | ) | | (11,776 | ) | | — |
| | (11,875 | ) |
| Proceeds received on disposition of vehicles | — |
| | 8 |
| | — |
| | 9,658 |
| | — |
| | 9,666 |
|
| | — |
| | (1 | ) | | (90 | ) | | (2,128 | ) | | — |
| | (2,219 | ) |
| Net cash provided by (used in) investing activities | 285 |
| | (23 | ) | | (431 | ) | | (2,353 | ) | | (285 | ) | | (2,807 | ) |
| | | | | | | | | | | | |
| Financing activities | | | | | | | | | | | |
| Proceeds from long-term borrowings | — |
| | 575 |
| | — |
| | 296 |
| | — |
| | 871 |
|
| Payments on long-term borrowings | — |
| | (756 | ) | | (5 | ) | | (1 | ) | | — |
| | (762 | ) |
| Net change in short-term borrowings | — |
| | — |
| | — |
| | 5 |
| | — |
| | 5 |
|
| Debt financing fees | — |
| | (12 | ) | | — |
| | (5 | ) | | — |
| | (17 | ) |
| Repurchases of common stock | (297 | ) | | — |
| | — |
| | — |
| | — |
| | (297 | ) |
| Other, net | — |
| | (285 | ) | | — |
| | (70 | ) | | 355 |
| | — |
|
| Net cash provided by (used in) financing activities exclusive of vehicle programs | (297 | ) | | (478 | ) | | (5 | ) | | 225 |
| | 355 |
| | (200 | ) |
| | | | | | | | | | | | |
| Vehicle programs: | | | | | | | | | | | |
| Proceeds from borrowings | — |
| | — |
| | 88 |
| | 14,285 |
| | — |
| | 14,373 |
|
| Payments on borrowings | — |
| | — |
| | (3 | ) | | (13,960 | ) | | — |
| | (13,963 | ) |
| Debt financing fees | — |
| | — |
| | (1 | ) | | (27 | ) | | — |
| | (28 | ) |
| | — |
| | — |
| | 84 |
| | 298 |
| | — |
| | 382 |
|
| Net cash provided by (used in) financing activities | (297 | ) | | (478 | ) | | 79 |
| | 523 |
| | 355 |
| | 182 |
|
| Effect of changes in exchange rates on cash and cash equivalents | — |
| | — |
| | — |
| | (23 | ) | | — |
| | (23 | ) |
| Net decrease in cash and cash equivalents | (12 | ) | | (32 | ) | | (12 | ) | | (13 | ) | | — |
| | (69 | ) |
| Cash and cash equivalents, beginning of period | 14 |
| | 242 |
| | 12 |
| | 425 |
| | — |
| | 693 |
|
| Cash and cash equivalents, end of period | $ | 2 |
| | $ | 210 |
| | $ | — |
| | $ | 412 |
| | $ | — |
| | $ | 624 |
|
|
| | | | | | | | | | | | | | | | | | | | | | | |
| | Parent | | Subsidiary Issuers | | Guarantor Subsidiaries | | Non-Guarantor Subsidiaries | | Eliminations | | Total |
| Net cash provided by (used in) operating activities | $ | 279 |
| | $ | (10 | ) | | $ | 80 |
| | $ | 2,633 |
| | $ | (342 | ) | | $ | 2,640 |
|
| | | | | | | | | | | | |
| Investing activities | | | | | | | | | | | |
| Property and equipment additions | — |
| | (32 | ) | | (89 | ) | | (69 | ) | | — |
| | (190 | ) |
| Proceeds received on asset sales | — |
| | 7 |
| | 4 |
| | 8 |
| | — |
| | 19 |
|
| Net assets acquired (net of cash acquired) | — |
| | — |
| | (4 | ) | | (51 | ) | | — |
| | (55 | ) |
| Intercompany loan receipts (advances) | — |
| | — |
| | 28 |
| | (316 | ) | | 288 |
| | — |
|
| Other, net | 118 |
| | (1 | ) | | — |
| | 2 |
| | (118 | ) | | 1 |
|
| Net cash provided by (used in) investing activities exclusive of vehicle programs | 118 |
| | (26 | ) | | (61 | ) | | (426 | ) | | 170 |
| | (225 | ) |
| | | | | | | | | | | | |
| Vehicle programs: | | | | | | | | | | | |
| Investment in vehicles | — |
| | (9 | ) | | (4 | ) | | (12,448 | ) | | — |
| | (12,461 | ) |
| Proceeds received on disposition of vehicles | — |
| | 31 |
| | — |
| | 10,473 |
| | — |
| | 10,504 |
|
| | — |
| | 22 |
| | (4 | ) | | (1,975 | ) | | — |
| | (1,957 | ) |
| Net cash provided by (used in) investing activities | 118 |
| | (4 | ) | | (65 | ) | | (2,401 | ) | | 170 |
| | (2,182 | ) |
| | | | | | | | | | | | |
| Financing activities | | | | | | | | | | | |
| Proceeds from long-term borrowings | — |
| | 557 |
| | — |
| | 337 |
| | — |
| | 894 |
|
| Payments on long-term borrowings | — |
| | (525 | ) | | (5 | ) | | (317 | ) | | — |
| | (847 | ) |
| Net change in short-term borrowings | — |
| | — |
| | — |
| | 4 |
| | — |
| | 4 |
|
| Debt financing fees | — |
| | (15 | ) | | — |
| | (5 | ) | | — |
| | (20 | ) |
| Repurchases of common stock | (398 | ) | | — |
| | — |
| | — |
| | — |
| | (398 | ) |
| Intercompany loan borrowings (payments) | — |
| | 316 |
| | — |
| | (28 | ) | | (288 | ) | | — |
|
| Other, net | — |
| | (385 | ) | | — |
| | (75 | ) | | 460 |
| | — |
|
| Net cash provided by (used in) financing activities exclusive of vehicle programs | (398 | ) | | (52 | ) | | (5 | ) | | (84 | ) | | 172 |
| | (367 | ) |
| | | | | | | | | | | | |
| Vehicle programs: | | | | | | | | | | | |
| Proceeds from borrowings | — |
| | 8 |
| | — |
| | 15,761 |
| | — |
| | 15,769 |
|
| Payments on borrowings | — |
| | — |
| | (9 | ) | | (15,817 | ) | | — |
| | (15,826 | ) |
| Debt financing fees | — |
| | — |
| | (1 | ) | | (24 | ) | | — |
| | (25 | ) |
| | — |
| | 8 |
| | (10 | ) | | (80 | ) | | — |
| | (82 | ) |
| Net cash provided by (used in) financing activities | (398 | ) | | (44 | ) | | (15 | ) | | (164 | ) | | 172 |
| | (449 | ) |
| Effect of changes in exchange rates on cash and cash equivalents, program and restricted cash | — |
| | — |
| | — |
| | (6 | ) | | — |
| | (6 | ) |
| Net increase (decrease) in cash and cash equivalents, program and restricted cash | (1 | ) | | (58 | ) | | — |
| | 62 |
| | — |
| | 3 |
|
| Cash and cash equivalents, program and restricted cash, beginning of period | 4 |
| | 70 |
| | — |
| | 643 |
| | — |
| | 717 |
|
| Cash and cash equivalents, program and restricted cash, end of period | $ | 3 |
| | $ | 12 |
| | $ | — |
| | $ | 705 |
| | $ | — |
| | $ | 720 |
|
| |
21. | Selected Quarterly Financial Data—(unaudited) |
21. Selected Quarterly Financial Data—(unaudited)
Provided below are selected unaudited quarterly financial data for 20162018 and 2015.2017.
The earnings per share information is calculated independently for each quarter based on the weighted average number of common stock and common stock equivalents outstanding, which may fluctuate, based on quarterly income levels and market prices. Therefore and due to the seasonality of the Company’s earnings, the sum of the quarters’ per share information may not equal the annual amount presented on the Consolidated Statements of Operations.
| | | | | 2016 | | 2018 |
| | | First | | Second | | Third | | Fourth | | First | | Second | | Third (a) | | Fourth |
| Net revenues | $ | 1,881 |
| | $ | 2,243 |
| | $ | 2,656 |
| | $ | 1,879 |
| |
| Revenues | | Revenues | $ | 1,968 |
| | $ | 2,328 |
| | $ | 2,778 |
| | $ | 2,050 |
|
| Net income (loss) | Net income (loss) | (51 | ) | | 36 |
| | 209 |
| | (31 | ) | Net income (loss) | (87 | ) | | 26 |
| | 213 |
| | 13 |
|
| | | | | | | | | | | | | | | | | |
| Per share information: | Per share information: | | | | | | | | Per share information: | | | | | | | |
| | Basic | | | | | | | | Basic | | | | | | | |
| | | Net income (loss) | $ | (0.53 | ) | | $ | 0.39 |
| | $ | 2.32 |
| | $ | (0.35 | ) | | Net income (loss) | $ | (1.08 | ) | | $ | 0.33 |
| | $ | 2.71 |
| | $ | 0.16 |
|
| | | Weighted average shares | 96.3 |
| | 93.9 |
| | 90.4 |
| | 87.4 |
| | Weighted average shares | 81.0 |
| | 80.7 |
| | 78.8 |
| | 76.9 |
|
| | | | | | | | | | | | | | | | | |
| | Diluted | | | | | | | | Diluted | | | | | | | |
| | | Net income (loss) | $ | (0.53 | ) | | $ | 0.38 |
| | $ | 2.28 |
| | $ | (0.35 | ) | | Net income (loss) | $ | (1.08 | ) | | $ | 0.32 |
| | $ | 2.68 |
| | $ | 0.16 |
|
| | | Weighted average shares | 96.3 |
| | 95.1 |
| | 91.8 |
| | 87.4 |
| | Weighted average shares | 81.0 |
| | 81.5 |
| | 79.5 |
| | 77.6 |
|
| | | | | 2015 | | 2017 |
| | | First | | Second | | Third | | Fourth | | First | | Second | | Third | | Fourth (a) |
| Net revenues | $ | 1,850 |
| | $ | 2,173 |
| | $ | 2,577 |
| | $ | 1,902 |
| |
| Revenues | | Revenues | $ | 1,839 |
| | $ | 2,238 |
| | $ | 2,752 |
| | $ | 2,019 |
|
| Net income (loss) | Net income (loss) | (9 | ) | | 143 |
| | 184 |
| | (5 | ) | Net income (loss) | (107 | ) | | 3 |
| | 245 |
| | 220 |
|
| | | | | | | | | | | | | | | | | |
| Per share information: | Per share information: | | | | | | | | Per share information: | | | | | | | |
| | Basic | | | | | | | | Basic | | | | | | | |
| | | Net income (loss) | $ | (0.09 | ) | | $ | 1.36 |
| | $ | 1.80 |
| | $ | (0.06 | ) | | Net income (loss) | $ | (1.25 | ) | | $ | 0.04 |
| | $ | 2.96 |
| | $ | 2.70 |
|
| | | Weighted average shares | 106.1 |
| | 105.5 |
| | 102.7 |
| | 99.5 |
| | Weighted average shares | 85.7 |
| | 84.0 |
| | 82.6 |
| | 81.3 |
|
| | | | | | | | | | | | | | | | | |
| | Diluted | | | | | | | | Diluted | | | | | | | |
| | | Net income (loss) | $ | (0.09 | ) | | $ | 1.34 |
| | $ | 1.77 |
| | $ | (0.06 | ) | | Net income (loss) | $ | (1.25 | ) | | $ | 0.04 |
| | $ | 2.91 |
| | $ | 2.65 |
|
| | | Weighted average shares | 106.1 |
| | 106.7 |
| | 104.0 |
| | 99.5 |
| | Weighted average shares | 85.7 |
| | 85.2 |
| | 84.0 |
| | 82.7 |
|
| |
22.(a) | Subsequent EventNet income for fourth quarter 2017 included provisional amounts for the Tax Act of (i) a tax benefit of $317 million resulting from the remeasurement of net deferred income tax liabilities as a result of the reduced corporate tax rate and (ii) a tax provision of $104 million for the one-time transition tax on the deemed repatriation of cumulative foreign subsidiary earnings. Net income for the third quarter 2018 included additional tax expense of $30 million resulting from the completion of the accounting for the effects of the Tax Act for the one-time transition tax on the deemed repatriation of cumulative foreign subsidiary earnings. |
22. Subsequent Event
In February 2019, the Company’s BoardAvis Budget Rental Car Funding subsidiary issued approximately $600 million in asset-backed notes with an expected final payment date of Directors authorized the adoptionMarch 2022 incurring interest at a weighted average rate of a short-term stockholder rights plan, which expires on January 22, 2018. Pursuant to the rights plan, the Company declared a dividend of one preferred share purchase right for each outstanding share of common stock, payable to holders of record as of the close of business on February 2, 2017. Each right, which is exercisable only in the event any person or group acquires a voting or economic position of 10% or more of the Company’s outstanding common stock (with certain limited exceptions), would entitle any holder other than the person or group whose ownership position has exceeded the ownership limit to purchase common stock having a value equal to twice the $90 exercise price of the right, or, at the election of the Board of Directors, to exchange each right for one share of common stock (subject to adjustment)approximately 4%.
*****
Schedule II – Valuation and Qualifying Accounts
(in millions)
| | | Description | Balance at Beginning of Period | | Expensed | | Other Adjustments | | Deductions | | Balance at End of Period | | Balance at Beginning of Period | | Expense (Benefit) | | Other Adjustments | | Deductions | | Balance at End of Period |
| Allowance for Doubtful Accounts: | | | | | | | | | | | | | | | | | | | |
| Year Ended December 31, | | | | | | | | | | | | | | | | | | | |
2018 (a) | | | $ | 36 |
| | $ | 34 |
| | $ | (2 | ) | | $ | (29 | ) | | $ | 39 |
|
2017 (a) | | | 38 |
| | 29 |
| | 3 |
| | (34 | ) | | 36 |
|
2016 (a) | $ | 34 |
| | $ | 27 |
| | $ | (2 | ) | | $ | (21 | ) | | $ | 38 |
| | 34 |
| | 27 |
| | (2 | ) | | (21 | ) | | 38 |
|
2015 (a) | 34 |
| | 24 |
| | (3 | ) | | (21 | ) | | 34 |
| |
2014 (a) | 50 |
| | 17 |
| | (3 | ) | | (30 | ) | | 34 |
| |
| | | | | | | | | | | | | | | | | | | | |
| Tax Valuation Allowance: | | | | | | | | | | | | | | | | | | | |
| Year Ended December 31, | | | | | | | | | | | | | | | | | | | |
2018 (a) | | | $ | 331 |
| | $ | (3 | ) | | $ | (17 | ) | | $ | — |
| | $ | 311 |
|
2017 (a) | | | 357 |
| | — |
| | 13 |
| | (39 | ) | | 331 |
|
2016 (a) | $ | 351 |
| | $ | 17 |
| | $ | 3 |
| | $ | (14 | ) | | $ | 357 |
| | 351 |
| | 17 |
| | 3 |
| | (14 | ) | | 357 |
|
2015 (a)(b) | 319 |
| | 20 |
| | 12 |
| | — |
| | 351 |
| |
2014 (a) | 347 |
| | (9 | ) | | (13 | ) | | (6 | ) | | 319 |
| |
__________
| |
(a) | Other adjustments relate to currency translation adjustments. |
| |
| Other adjustments relate to the acquisition of Brazil. |
|
| | |
| EXHIBIT NO. | | DESCRIPTION |
| 2.1 | | |
| 2.2 | | |
| 3.1 | | |
| 3.2 | | |
| 3.3 | | |
4.13.4 | | Indenture dated asCertificate of March 7, 2013 amongElimination of Series S Preferred Stock of Avis Budget Finance, plc, as Issuer, the Guarantors from time to time parties thereto, Bank of Nova Scotia Trust Company of New York as Trustee and Citibank, N.A.Group Inc., London Branch, as paying agent and note registrardated April 16, 2018 (Incorporated by reference to Exhibit 4.13.1 to the Company’s Current Report on Form 8-K dated March 11, 2013)April 16, 2018). |
4.1(a)4.1 | | Supplemental Indenture, dated as of June 21, 2013, to the Indenture, dated as of March 7, 2013, by and among Avis Budget Finance plc, as Issuer, the Guarantors from time to time parties thereto and The Bank of Nova Scotia Trust Company of New York as Trustee (Incorporated by reference to Exhibit 4.11(b) to Avis Budget Car Rental, LLC and Avis Budget Finance, Inc.’s Registration Statement on Form S-4, Registration No. 333-189524,dated June 21, 2013). |
4.2 | | Form of 6.0% Senior Notes Due 2021 (Incorporated by reference to Exhibit 4.2 to the Company’s Current Report on Form 8-K dated March 11, 2013). |
4.3 | | |
4.3(a)4.1(a) | | Supplemental Indenture, dated as of June 21, 2013, to the Indenture, dated as of April 3, 2013, by and among Avis Budget Finance plc, as Issuer, the Guarantors from time to time parties thereto and The Bank of Nova Scotia Trust Company of New York as Trustee (Incorporated by reference to Exhibit 4.12(b) to Avis Budget Car Rental, LLC and Avis Budget Finance, Inc.’s Registration Statement on Form S-4, Registration No.
333-189524, dated June 21, 2013). |
4.44.2 | | |
4.54.3 | | Indenture dated as of November 25, 2013 among Avis Budget Car Rental, LLC and Avis Budget Finance, Inc., as Issuers, the Guarantors from time to time parties thereto and Deutsche Bank Trust Company Americas as Trustee (Incorporated by reference to Exhibit 4.1 to the Company’s Current Report on Form 8-K dated December 2, 2013). |
4.6 | | Form of Floating Rate Senior Notes Due 2017 (Incorporated by reference to Exhibit 4.2 to the Company’s Current Report on Form 8-K dated December 2, 2013). |
4.7 | | Indenture dated as of May 16, 2014 among Avis Budget Car Rental, LLC and Avis Budget Finance, Inc., as Issuers, the Guarantors from time to time parties thereto and Deutsche Bank Trust Company Americas as Trustee (Incorporated by reference to Exhibit 4.1 to the Company’s Current Report on Form 8-K dated May 19, 2014). |
4.8 | | Form of 5.125% Senior Notes Due 2022 (Incorporated by reference to Exhibit 4.2 to the Company’s Current Report on Form 8-K dated May 19, 2014). |
4.9 | | |
4.104.4 | | |
4.114.5 | | |
4.124.6 | | |
|
| | |
4.134.7 | | |
4.144.8 | | Indenture dated as of March 8, 2017 among Avis Budget Finance, plc, as Issuer, the Guarantors from time to time parties hereto, Deutsche Bank Trust Company Americas, as Trustee, Deutsche Bank AG, London Branch, as Paying Agent and Deutsche Bank Luxembourg S.A., as Registrar (Incorporated by reference to Exhibit 4.2 to the Company’s Quarterly Report on Form 10-Q for the quarter ended March 31, 2017, dated May 4, 2017). |
| 4.9 | | |
| 4.10 | | Indenture dated as of October 4, 2018 among Avis Budget Finance, plc, as Issuer, the Guarantors from time to time parties thereto, Deutsche Bank Trust Company Americas, as Trustee, Deutsche Bank AG, London Branch, as Paying Agent and Deutsche Bank Luxembourg S.A., as Registrar (Incorporated by reference to Exhibit 4.1 to the Company’s Quarterly Report on Form 10-Q for the quarterly period ended September 30, 2018 dated November 6, 2018). |
| 4.11 | | |
| 4.12 | | Rights Agreement, dated as of January 23, 2017,14, 2018, between Avis Budget Group, Inc. and Computershare Trust Company, N.A., as Rights Agent (Incorporated by reference to Exhibit 4.1 to the Company’s Current Report on Form 8-K dated January 23, 2017)16, 2018). |
10.14.13 | | Amended and Restated EmploymentAmendment No. 1, dated April 16, 2018, to the Rights Agreement, dated as of January 14, 2018, between Avis Budget Group, Inc. and Ronald L. NelsonComputershare Trust Company, N.A., as Rights Agent (Incorporated by reference to Exhibit 10.14.1 to the Company’s Current Report on Form 8-K dated April 22, 2014)16, 2018).† |
|
10.1(a) | | |
| 10.1 | | Amendment to Employment Agreement between Avis Budget Group, Inc. and Ronald L. Nelson dated as of March 28, 2016 (Incorporated by reference to Exhibit 10.1 to the Company’s Current Report on Form 8-K dated March 29, 2016).† |
10.1(b) | | Amendment to Employment Agreement between Avis Budget Group, Inc. and Ronald L. Nelson dated as of December 12, 2016 (Incorporated by reference to Exhibit 10.1 to the Company’s Current Report on Form 8-K dated December 15, 2016). † |
10.2 | | |
10.310.2 | | Employment |
10.410.3 | | |
10.510.4 | | |
| 10.5 | | |
| 10.6 | | Form of |
| 10.7 | | |
10.710.8 | | |
10.810.9 | | |
10.8(a)10.9(a) | | |
10.8(b)10.9(b) | | |
10.8(c)10.9(c) | | |
10.910.10 | | |
10.1010.11 | | |
10.10(a)10.11(a) | | |
10.11 | | Form of Award Agreement-Restricted Stock Units (Incorporated by reference to Exhibit 10.17(a) to the Company’s Annual Report on Form 10-K for the year ended December 31, 2011, dated February 29, 2012).† |
| 10.12 | | |
| 10.13 | | |
| 10.14 | | |
| 10.15 | | |
| 10.16 | | |
|
| | |
| 10.17 | | |
| 10.18 | | |
| 10.19 | | |
| 10.20 | | |
| 10.21 | | |
| 10.22 | | |
|
| | |
| 10.23 | | |
| 10.24 | | |
| 10.25 | | |
| 10.26 | | |
| 10.27 | | |
| 10.28 | | |
10.28(a)10.29(a) | | |
10.2910.30 | | |
10.29(a)10.30(a) | | |
10.30 | | Agreement dated August 14, 2015 between Avis Budget Car Rental, LLC and General Motors LLC (Incorporated by reference to Exhibit 10.2 to the Company’s Current Report on Form 8-K dated August 20, 2015).†† |
| 10.31 | | |
| 10.32 | | |
10.33 | | Avis Budget Car Rental29, 2017 Model Year Program Letter dated August 26, 2016 between Avis Budget Car Rental, LLC and Ford Motor Company (Incorporated by reference to Exhibit 10.1 to the Company’s Current Report on Form 8-K dated August 31, 2016)2017).†† |
10.3410.33 | | |
|
| | |
| 10.34(a) | | Supplemental Indenture No. 1, dated as of December 23, 2005, among Cendant Rental Car Funding (AESOP) LLC***, as Issuer, and The Bank of New York, as Trustee, to the Second Amended and Restated Base Indenture, dated as of June 3, 2004 (Incorporated by reference to Exhibit 10.1 to the Company’s Current Report on Form 8-K dated January 20, 2006). |
| 10.34(b) | | Supplemental Indenture No. 2, dated as of May 9, 2007, among Avis Budget Rental Car Funding (AESOP) LLC, as Issuer, and The Bank of New York Trust Company, N.A. (as successor in interest to The Bank of New York), as Trustee, to the Second Amended and Restated Base Indenture, dated as of June 3, 2004 (Incorporated by reference to Exhibit 10.6 to the Company’s Quarterly Report on Form 10-Q for the quarterly period ended June 30, 2007, dated August 8, 2007). |
| 10.34(c) | | Supplemental Indenture No. 3, dated as of August 16, 2013, among Avis Budget Rental Car Funding (AESOP) LLC, as Issuer, and The Bank of New York Trust Company, N.A. (as successor in interest to The Bank of New York), as Trustee, to the Second Amended and Restated Base Indenture, dated as of June 3, 2004 (Incorporated by reference to Exhibit 10.35(c) to the Company’s Annual Report on Form 10-K for the year ended December 31, 2013, dated February 20, 2014). |
| 10.35 | | Second Amended and Restated Loan Agreement, dated as of June 3, 2004, among AESOP Leasing L.P., as Borrower, Quartx Fleet Management, Inc., as a Permitted Nominee, PV Holding Corp., as a Permitted Nominee, and Cendant Rental Car Funding (AESOP) LLC***, as Lender (Incorporated by reference to Exhibit
10.8 to the Company’s Quarterly Report on Form 10-Q for the quarterly period ended June 30, 2004, dated August 2, 2004). |
| 10.35(a) | | First Amendment, dated as of December 23, 2005, among AESOP Leasing L.P., as Borrower, Quartx Fleet Management, Inc., as a Permitted Nominee, PV Holding Corp., as a Permitted Nominee, and Cendant Rental Car Funding (AESOP) LLC***, as Lender, to the Second Amended and Restated Loan Agreement, dated as of June 3, 2004 (Incorporated by reference to Exhibit 10.2 to the Company’s Current Report on Form 8-K dated January 20, 2006). |
|
| | |
| 10.35(b) | | Second Amendment, dated as of May 9, 2007, among AESOP Leasing L.P., as Borrower, PV Holding Corp., as a Permitted Nominee, Quartx Fleet Management, Inc., as a Permitted Nominee, and Avis Budget Rental Car Funding (AESOP) LLC, as Lender, to the Second Amended and Restated Loan Agreement, dated as of June 3, 2004 (Incorporated by reference to Exhibit 10.8 to the Company’s Quarterly Report on Form 10-Q for the quarterly period ended June 30, 2007, dated August 8, 2007). |
| 10.35(c) | | Third Amendment, dated as of August 16, 2013, among AESOP Leasing L.P., as Borrower, PV Holding Corp., as a Permitted Nominee, Quartx Fleet Management, Inc., as a Permitted Nominee, and Avis Budget Rental Car Funding (AESOP) LLC, as Lender, to the Second Amended and Restated Loan Agreement, dated as of June 3, 2004 (Incorporated by reference to Exhibit 10.36(c) to the Company’s Annual Report on Form 10-K for the year ended December 31, 2013, dated February 20, 2014). |
| 10.36 | | |
| 10.36(a) | | First Amendment, dated as of December 23, 2005, among AESOP Leasing L.P., as Borrower, and Cendant Rental Car Funding (AESOP) LLC***, as Lender, to the Amended and Restated Loan Agreement, dated as of June 3, 2004 (Incorporated by reference to Exhibit 10.29(b) to the Company’s Annual Report on Form 10-K for the year ended December 31, 2006, dated March 1, 2007). |
| 10.36(b) | | Second Amendment, dated as of the May 9, 2007, among AESOP Leasing L.P., as Borrower, and Avis Budget Rental Car Funding (AESOP) LLC, as Lender, to the Amended and Restated Loan Agreement, dated as of June 3, 2004 (Incorporated by reference to Exhibit 10.7 to the Company’s Quarterly Report on Form 10-Q for the quarterly period ended June 30, 2007, dated August 8, 2007). |
| 10.36(c) | | Third Amendment, dated as of August 16, 2013, among AESOP Leasing L.P., as Borrower, and Avis Budget Rental Car Funding (AESOP) LLC, as Lender, to the Amended and Restated Loan Agreement, dated as of June 3, 2004 (Incorporated by reference to Exhibit 10.37(c) to the Company’s Annual Report on Form 10-K for the year ended December 31, 2013, dated February 20, 2014). |
| 10.37 | | Second Amended and Restated Master Motor Vehicle Operating Lease Agreement, dated as of June 3, 2004, among AESOP Leasing L.P., as Lessor, and Cendant Car Rental Group, Inc.**, as Lessee and as Administrator (Incorporated by reference to Exhibit 10.9 to the Company’s Quarterly Report on Form 10-Q for the quarterly period ended June 30, 2004, dated August 2, 2004). |
10.37(a)10.37a) | | First Amendment, dated December 23, 2005, among AESOP Leasing L.P., as Lessor, and Cendant Car Rental Group, Inc.**, as Lessee and as Administrator, to the Second Amended and Restated Master Motor Vehicle Operating Lease Agreement, dated as of December 23, 2005 (Incorporated by reference to Exhibit 10.3 to the Company’s Current Report on Form 8-K dated January 20, 2006). |
| 10.37(b) | | Third Amendment, dated as of May 9, 2007, among AESOP Leasing L.P., as Lessor and Avis Budget Car Rental, LLC, as Lessee and as the Administrator, to the Second Amended and Restated Master Motor Vehicle Operating Lease Agreement, dated as of June 3, 2004 (Incorporated by reference to Exhibit 10.9 to the Company’s Quarterly Report on Form 10-Q for the quarterly period ended June 30, 2007, dated August 8, 2007). |
| 10.37(c) | | Fourth Amendment, dated as of August 16, 2013, among AESOP Leasing L.P., as Lessor and Avis Budget Car Rental, LLC, as Lessee and as the Administrator, to the Second Amended and Restated Master Motor Vehicle Operating Lease Agreement, dated as of June 3, 2004 (Incorporated by reference to Exhibit 10.38(c) to the Company’s Annual Report on Form 10-K for the year ended December 31, 2013, dated February 20, 2014). |
|
| | |
| 10.38 | | Amended and Restated Master Motor Vehicle Finance Lease Agreement, dated as of June 3, 2004, among AESOP Leasing L.P., as Lessor, Cendant Car Rental Group, Inc.**, as Lessee, as Administrator and as Finance Lease Guarantor, Avis Rent A Car System, Inc.****, as Lessee, and Budget Rent A Car System, Inc., as Lessee (Incorporated by reference to Exhibit 10.30(a) to the Company’s Annual Report on Form 10-K for the year ended December 31, 2006, dated March 1, 2007). |
| 10.38(a) | | First Amendment, dated as of December 23, 2005, among AESOP Leasing L.P., as Lessor, Cendant Car Rental Group, Inc.**, as Lessee, as Administrator and as Finance Lease Guarantor, Avis Rent A Car System, Inc.****, as Lessee, and Budget Rent A Car System, Inc., as Lessee, to the Amended and Restated Master Motor Vehicle Finance Lease Agreement, dated as of June 3, 2004 (Incorporated by reference to Exhibit 10.30(b) to the Company’s Annual Report on Form 10-K for the year ended December 31, 2006, dated March 1, 2007). |
| 10.38(b) | | Third Amendment, dated as of May 9, 2007, among AESOP Leasing L.P., as Lessor, Avis Budget Car Rental, LLC, as Lessee, as Administrator and as Finance Lease Guarantor, Avis Rent A Car System, LLC, as Lessee, and Budget Rent A Car System, Inc., as Lessee, to the Amended and Restated Master Motor Vehicle Finance Lease Agreement, dated as of June 3, 2004 (Incorporated by reference to Exhibit 10.11 to the Company’s Quarterly Report on Form 10-Q for the quarterly period ended June 30, 2007, dated August 8, 2007). |
10.38(c)10.38c) | | Fourth Amendment, dated as of August 16, 2013, among AESOP Leasing L.P., as Lessor, Avis Budget Car Rental, LLC, as Lessee, as Administrator and as Finance Lease Guarantor, Avis Rent A Car System, LLC, as Lessee, and Budget Rent A Car System, Inc., as Lessee, to the Amended and Restated Master Motor Vehicle Finance Lease Agreement, dated as of June 3, 2004 (Incorporated by reference to Exhibit 10.39(c) to the Company’s Annual Report on Form 10-K for the year ended December 31, 2013, dated February 20, 2014). |
| 10.39 | | |
|
| | |
| 10.40 | | Second Amended and Restated Administration Agreement, dated as of June 3, 2004, among Cendant Rental Car Funding (AESOP) LLC***, AESOP Leasing L.P., AESOP Leasing Corp. II, Avis Rent A Car System, Inc.****, Budget Rent A Car System, Inc., Cendant Car Rental Group, Inc.** and The Bank of New York, as Trustee (Incorporated by reference to Exhibit 10.34 to the Company’s Annual Report on Form 10-K for the year ended December 31, 2005, dated March 1, 2006). |
| 10.40(a) | | First Amendment, dated as of August 16, 2013, among Avis Budget Rental Car Funding (AESOP) LLC, AESOP Leasing L.P., AESOP Leasing Corp. II, Avis Rent A Car System, LLC, Budget Rent A Car System, Inc. and Avis Budget Car Rental, LLC, as Administrator, to the Second Amended and Restated Administration Agreement dated as of June 3, 2004 (Incorporated by reference to Exhibit 10.41(a) to the Company’s Annual Report on Form 10-K for the year ended December 31, 2013, dated February 20, 2014). |
| 10.41 | | |
| 10.42 | | SecondThird Amended and Restated Series 2010-6 Supplement, dated as of November 5, 2013,August 16, 2018, by and among Avis Budget Rental Car Funding (AESOP) LLC, as Issuer, Avis Budget Car Rental, LLC, as Administrator, JPMorgan Chase Bank, N.A., as Administrative Agent, the Non-Conduit Purchasers, the CP Conduit Purchasers, the APA Banks andCommitted Note Purchasers, the Funding Agents and APA Banks named therein and The Bank of New York Mellon Trust Company, N.A., as Trustee and as Series 2010-6 Agent (Incorporated by reference to Exhibit 10.1 to the Company’s Current Report on Form 8-K, dated November 7, 2013).Agent. |
10.42(a)10.43 | | First Amendment to the Second Amended and Restated Series 2010-62015-3 Supplement, dated as of November 20, 2014, by and amongAugust 16, 2018, between Avis Budget Rental Car Funding (AESOP) LLC, as Issuer, Avis Budget Car Rental, LLC, as Administrator, JPMorgan Chase Bank, N.A., as Administrative Agent, the Non-Conduit Purchasers, the CP Conduit Purchasers, the APA Banks andCommitted Note Purchasers, the Funding Agents named therein and The Bank of New York Mellon Trust Company, N.A., as Trustee and as Series 2010-6 Agent (Incorporated by reference to Exhibit 10.1 to the Company’s Current Report on Form 8-K dated November 26, 2014). |
10.42(b) | | Second Amendment to the Second Amended and Restated Series 2010-6 Supplement, dated as of November 19, 2015, among Avis Budget Rental Car Funding (AESOP) LLC, the administrator, administrative agent, purchasers and funding agents listedAPA Banks named therein, and The Bank of New York Mellon Trust Company, N.A., as trustee and as Series 2010-6 Agent (Incorporated by reference to Exhibit 10.2 to the Company’s Current Report on Form 8-K dated November 24, 2015). |
10.42(c) | | Third Amendment to the Second Amended and Restated Series 2010-6 Supplement, dated as of November 17, 2016 by and among Avis Budget Rental Car Funding (AESOP) LLC, as Issuer, Avis Budget Car Rental, LLC, as Administrator, JPMorgan Chase Bank, N.A., as Administrative Agent, the Non-Conduit Purchasers, the CP Conduit Purchasers, the APA Banks and the Funding Agents named therein and The Bank of New York Mellon Trust Company, N.A., as Trustee and as Series 2010-6 Agent (Incorporated by reference to Exhibit 10.2 to the Company’s Current Report on Form 8-K dated November 22, 2016). |
10.43 | | Amended and Restated Series 2011-5 Supplement, dated as of September 9, 2013, between Avis Budget Rental Car Funding (AESOP) LLC and The Bank of New York Mellon Trust Company, N.A., as trustee and as Series 2011-5 Agent (Incorporated by reference to Exhibit 10.10 to the Company’s Quarterly Report on Form 10-Q for the period ended September 30, 2013, dated November 1, 2013).2015-3 Agent. |
| 10.44 | | Amended and Restated Series 2012-2 Supplement, dated as of September 9, 2013, between Avis Budget Car Funding (AESOP) LLC and The Bank of New York Mellon Trust company, N.A., as trustee and as Series
2012-2 Agent (Incorporated by reference to Exhibit 10.9 to the Company’s Quarterly Report on Form 10-Q for the period ended September 30, 2013, dated November 1, 2013). |
|
| | |
10.45 | | Amended and Restated Series 2012-3 Supplement, dated as of September 9, 2013, between Avis Budget Rental Car Funding (AESOP) LLC and The Bank of New York Mellon Trust Company, N.A., as trustee and as Series 2012-3 Agent (Incorporated by reference to Exhibit 10.8 to the Company’s Quarterly Report on Form 10- Q for the period ended September 30, 2013, dated November 1, 2013). |
10.46 | | Amended and Restated Series 2013-1 Supplement, dated as of September 9, 2013, between Avis Budget Rental Car Funding (AESOP) LLC and The Bank of New York Mellon Trust Company, N.A., as trustee and as Series 2013-1 Agent (Incorporated by reference to Exhibit 10.7 to the Company’s Quarterly Report on Form 10- Q for the period ended September 30, 2013, dated November 1, 2013). |
10.47 | | Amended and Restated Series 2013-2 Supplement, dated as of February 12, 2014, between Avis Budget Rental Car Funding (AESOP) LLC and The Bank of New York Mellon Trust Company, N.A., as trustee and as Series 2013-2 Agent (Incorporated by reference to Exhibit 10.54 to the Company’s Annual Report on Form 10- K for the year ended December 31, 2013, dated February 20, 2014). |
10.4810.45 | | |
10.4910.46 | | |
10.5010.47 | | |
10.5110.48 | | |
10.5210.49 | | Series 2015-3 Supplement, dated as of November 19, 2015, between Avis Budget Rental Car Funding (AESOP) LLC, the administrator, administrative agent, purchasers and funding agents listed therein, and The Bank of New York Mellon Trust Company, N.A., as trustee and as Series 2015-3 Agent (Incorporated by reference to Exhibit 10.1 to the Company’s Current Report on Form 8-K dated November 24, 2015). |
10.52(a) | | First Amendment to the Series 2015-3 Supplement, dated as of November 17, 2016 between Avis Budget Rental Car Funding (AESOP) LLC and the Bank of New York Mellon Trust Company, N.A., as trustee and as Series 2015-3 Agent (Incorporated by reference to Exhibit 10.1 to the Company’s Current Report on Form 8-K dated November 22, 2016). |
10.53 | | |
10.5410.50 | | |
| 10.51 | | |
| 10.52 | | |
| 10.53 | | |
| 10.54 | | |
|
| | |
| 10.55 | | FourthFifth Amended and Restated Credit Agreement dated as of October 7, 2016,February 13, 2018, among Avis Budget Holdings, LLC, Avis Budget Car Rental, LLC, Avis Budget Group, Inc., the Subsidiary Borrowers from time to time parties there,thereto, the several banks and other financial institutions or entities from time to time parties thereto, JPMorgan Chase Bank, N.A., as Administrative Agent, Deutsche Bank Securities Inc., as Syndication Agent, Citibank, N.A., Bank of America, N.A., Barclays Bank plc and Credit Agricole Corporate and Investment Bank, as Co-Documentation Agents Incorporated(Incorporated by reference to Exhibit 10.1 to the Company’s Current Report on Form 8-K dated October 12, 2016)February 16, 2018). |
| 10.56 | | |
| 10.56(a) | | Amendment dated as of March 4, 2013, to the Amended and Restated Credit Agreement and the Amended and Restated Guarantee & Collateral Agreement, each dated as of May 3, 2011, among Avis Budget Holdings, LLC, Avis Budget Car Rental, LLC and certain of its Subsidiaries, JPMorgan Chase Bank, N.A., as Administrative Agent and certain other signatories thereto (Incorporated by reference to Exhibit 10.2 to the Company’s Current Report on Form 8-K dated March 5, 2013). |
| 10.56(b) | | Second Amendment to the Amended and Restated Guarantee & Collateral Agreement, dated as of October 3, 2014, among Avis Budget Holdings, LLC, Avis Budget Car Rental, LLC and certain of its Subsidiaries, in favor of JPMorgan Chase Bank, N.A., as Administrative Agent (Incorporated by reference to Exhibit 10.2 to the Company’s Current Report on Form 8-K dated October 6, 2014). |
| 10.57 | | Purchase Agreement, dated as of February 28, 2013, by and among Avis Budget Finance, plc, as issuer, Avis Budget Group, Inc. and certain of its subsidiaries as guarantors, and Citigroup Global Markets Limited, for itself and on behalf of the several initial purchasers (Incorporated by reference to Exhibit 10.1 to the Company’s Current Report on Form 8-K dated March 5, 2013). |
10.58 | | |
|
| | |
10.5910.58 | | |
10.6010.59 | | Purchase Agreement, dated as of November 20, 2013, by and among Avis Budget Car Rental, LLC and Avis Budget Finance, Inc. as issuers, Avis Budget Group, Inc. and certain of its subsidiaries as guarantors, and Citigroup Global Markets, Inc. as the initial purchaser Trustee (Incorporated by reference to Exhibit 10.1 to the Company’s Current Report on Form 8-K dated November 22, 2013). |
10.61 | | Registration Rights Agreement, dated November 25, 2013, among Avis Budget Car Rental, LLC and Avis Budget Finance, Inc., the guarantors parties thereto and Citigroup Global Markets Inc. (Incorporated by reference to Exhibit 10.1 to the Company’s Current Report on Form 8-K dated December 2, 2013). |
10.62 | | Agreement of Resignation, Appointment And Acceptance, dated as of September 5, 2013, by and among Avis Budget Car Rental, LLC, Avis Budget Finance, Inc., The Bank of Nova Scotia Trust Company of New York, as the retiring trustee, and Deutsche Bank Trust Company Americas, as the successor trustee under the indentures described therein (Incorporated by reference to Exhibit 10.4 to the Company’s Quarterly Report on Form 10-Q for the period ended September 30, 2013, dated November 1, 2013). |
10.6310.60 | | Agreement of Resignation, Appointment And Acceptance, dated as of September 5, 2013, by and among Avis Budget Finance, The Bank of Nova Scotia Trust Company of New York, as the retiring trustee, and Deutsche Bank Trust Company Americas, as the successor trustee under the indenture dated as of March 7, 2013 (as amended and supplemented) (Incorporated by reference to Exhibit 10.5 to the Company’s Quarterly Report on Form 10-Q for the period ended September 30, 2013, dated November 1, 2013). |
10.64 | | Purchase Agreement, dated as of May 13, 2014, by and among Avis Budget Car Rental, LLC and Avis Budget Finance, Inc. as issuers, Avis Budget Group, Inc. and certain of its subsidiaries as guarantors, Morgan Stanley
& Co. LLC for itself and on behalf of the several initial purchasers (Incorporated by reference to Exhibit 10.1 to the Company’s Current Report on Form 8-K dated May 19, 2014). |
10.65 | | Purchase Agreement, dated as of November 6, 2014, by and among Avis Budget Car Rental, LLC and Avis Budget Finance, Inc. as issuers, Avis Budget Group, Inc. and certain of its subsidiaries as guarantors, and Credit Agricole Securities (USA) Inc. for itself and on behalf of the several initial purchasers (Incorporated by reference to Exhibit 10.73 to Avis Budget Car Rental, LLC and Avis Budget Finance, Inc.’s Registration Statement on Form S-4, Registration Number 333-201102-19, dated December 19, 2014). |
10.66 | | Registration Rights Agreement, dated November 14, 2014, among Avis Budget Car Rental, LLC and Avis Budget Finance, Inc., the guarantors parties thereto and Credit Agricole Securities (USA) Inc. for itself and on behalf of the several initial purchasers (Incorporated by reference to Exhibit 10.74 to Avis Budget Car Rental, LLC and Avis Budget Finance, Inc.’s Registration Statement on Form S-4, Registration Number 333-201102-19, dated December 19, 2014). |
10.67 | | Purchase Agreement, dated as of March 4, 2015, by and among Avis Budget Car Rental, LLC and Avis Budget Finance, Inc. as issuers, Avis Budget Group, Inc. and certain of its subsidiaries as guarantors and Merrill Lynch, Pierce, Fenner & Smith Incorporated for itself and on behalf of the several initial purchasers (Incorporated by reference to Exhibit 10.1 to the Company’s Current Report on Form 8-K dated March 10, 2015). |
10.6810.61 | | |
10.6910.62 | | Amended and Restated Framework Agreement dated May 21, 2014 among CarFin Finance International Limited, Credit Agricole Corporate And Investment Bank, Deutsche Trustee Company Limited, Avis Budget Car Rental, LLC, Avis Finance Company Limited, Avis Budget EMEA Limited, Deutsche Bank AG, London Branch, Caceis Bank France, FCT CarFin, Eurotitrisation, the Senior Noteholders named therein and certain other entities named therein (Incorporated by reference to Exhibit 10.4 to the Company’s Quarterly Report on Form 10-Q for the period ended June 30, 2014, dated August 5, 2014).†† |
10.7010.63 | | Master Definitions Agreement dated March 5, 2013, among CarFin Finance International Limited, Credit Agricole Corporate And Investment Bank, Deutsche Trustee Company Limited, Credit Agricole Corporate and Investment Bank, Avis Budget Car Rental, LLC, Avis Finance Company Limited, Avis Budget EMEA Limited, Deutsche Bank AG, London Branch, the Senior Noteholders named therein and certain other entities named therein (Incorporated by reference to Exhibit 10.5 to the Company'sCompany’s Quarterly Report on Form 10-Q for the period ended June 30, 2014, dated August 5, 2014).†† |
10.7110.64 | | Fourth Master Amendment and Restatement Deed, by and among CarFin Finance International Limited, Credit Agricole Corporate And Investment Bank, Deutsche Trustee Company Limited, Credit Agricole Corporate And Investment Bank, the Opcos, Servicers, Lessees and Fleetcos listed therein, Avis Budget Car Rental, LLC, Avis Finance Company Limited, Avis Budget EMEA Limited, the Account Banks listed therein, Deutsche Bank Ag, London Branch, the Senior Noteholders listed therein, Structured Finance Management (Ireland) Limited, CarFin Finance Holdings Limited, Intertrust (Netherlands) B.V. And Vistra B.V., Credit Agricole Corporate And Investment Bank, FCT CarFin, Caceis Bank France, Caceis Corporate Trust, Deutsche Bank Luxembourg S.A. and Fiserv Automotive Solutions, Inc., dated December 15, 2014 (Incorporated by reference to Exhibit 10.1 to the Company’s Current Report on Form 8-K dated December 19, 2014).†† |
|
| | |
10.7210.65 | | Seventh Master Amendment and Restatement Deed, by and among CarFin Finance International Limited, Credit Agricole Corporate And Investment Bank, Deutsche Trustee Company Limited, Credit Agricole Corporate And Investment Bank, the Opcos, Servicers, Lessees and Fleetcos listed therein, Avis Budget Car Rental, LLC, Avis Finance Company Limited, Avis Budget EMEA Limited, the Account Banks listed therein, Deutsche Bank Ag, London Branch, the Senior Noteholders and certain other entities named therein, dated January 22, 2016 (Incorporated by reference to Exhibit 10.6 to the Company’s Current Report on Form 8-K dated April 21, 2016).†† |
|
10.73 | | |
| 10.66 | | EighthNinth Master Amendment and Restatement Deed, by and among CarFin Finance International Limited, Credit Agricole Corporate And Investment Bank, Deutsche Trustee Company Limited, Credit Agricole Corporate And Investment Bank, the Opcos, Servicers, Lessees and Fleetcos listed therein, Avis Budget Car Rental, LLC, Avis Finance Company Limited, Avis Budget EMEA Limited, the Account Banks listed therein, Deutsche Bank Ag, London Branch, the Senior Noteholders and certain other entities named therein, dated April 15, 2016May 16, 2017 (Incorporated by reference to Exhibit 10.1 to the Company’s Current Report on Form 8-K dated April 21, 2016)May 22, 2017).†† |
1210.67 | | Statement Re: Computation of Ratio of EarningsTenth Master Amendment and Restatement Deed, by and among CarFin Finance International, DAC, Credit Agricole Corporate and Investment Bank, Deutsche Trustee Company Limited, Credit Agricole Corporate and Investment Bank, the Opcos, Servicers, Lessees and FleetCos listed herein. Avis Budget Car Rental, LLC, Avis Finance Company Limited, Avis Budget EMEA Limited, the Account Banks listed therein, Deutsche Bank Ag. London Branch, the Senior Noteholders and certain other entities named therein, dated May 30, 2018 (Incorporated by reference to Fixed Charges.Exhibit 10.1 to the Company’s Current Report on Form 8-K dated June 5, 2018).†† |
| 21 | | |
| 23.1 | | |
| 31.1 | | |
| 31.2 | | |
| 32 | | |
| 101.INS | | XBRL Instance Document. |
| 101.SCH | | XBRL Taxonomy Extension Schema. |
| 101.CAL | | XBRL Taxonomy Extension Calculation Linkbase. |
| 101.DEF | | XBRL Taxonomy Extension Definition Linkbase. |
| 101.LAB | | XBRL Taxonomy Extension Label Linkbase. |
| 101.PRE | | XBRL Taxonomy Extension Presentation Linkbase. |
|
| |
| * | Cendant Corporation is now known as Avis Budget Group, Inc. |
| ** | Cendant Car Rental Group, LLC (formerly known as Cendant Car Rental Group, Inc.) is now known as Avis Budget Car Rental, LLC. |
| *** | Cendant Rental Car Funding (AESOP) LLC, formerly known as AESOP Funding II L.L.C, is now known as Avis Budget Rental Car Funding (AESOP) LLC. |
| **** | Avis Rent A Car System, Inc. is now known as Avis Rent A Car System, LLC. |
| ***** | Avis Group Holdings, Inc. is now known as Avis Group Holdings, LLC. |
| † | Denotes management contract or compensatory plan. |
| †† | Confidential treatment has been requested for certain portions of this Exhibit pursuant to Rule 24b-2 of the Securities Exchange Act of 1934, as amended, which portions have been omitted and filed separately with the Securities and Exchange Commission. |