The terms the "Company," "Bel," "we," "us," and "our" as used in this Annual Report on Form 10-K ("(this "Form 10-K"or this "Annual Report on Form 10-K") refer to Bel Fuse Inc. and its consolidated subsidiaries unless otherwise specified.
The Company's consolidated operating results are affected by a wide variety of factors that could materially and adversely affect revenues and profitability, including the risk factors described in Item 1A of this Form 10-K.10-K, and the risk factors described in our other reports and documents filed from time to time with the Securities and Exchange Commission ("SEC"). As a result of these and other factors, the Company may experience material fluctuations in future operating results on a quarterly or annual basis, which could materially and adversely affect its business, consolidated financial condition, operating results, and common stock prices. Furthermore, this document and other reports and documents filed by the Company with the Securities and Exchange Commission ("SEC")SEC contain certain forward-looking statements under the Private Securities Litigation Reform Act of 1995 ("Forward-Looking Statements") with respect to the business of the Company. Forward-Looking Statements are necessarily subject to risks and uncertainties, many of which are outside our control, that could cause actual results to differ materially from these statements. Forward-Looking Statements can be identified by such words as "anticipates," "believes," "plans to,"plan," "assumes," "forecasts," "could," "should," "estimates," "expects," "intends," "potential," "seek," "predict," "may," "will" and similar expressions. references to future periods. All statements other than statements of historical facts included in this report regarding our strategies, prospects, financial condition, operations, costs, plans and objectives and regarding the anticipated impact of COVID-19 ("COVID") are Forward-Looking Statements.
These Forward-Looking Statements are subject to certain risks and uncertainties, including those detailed in Item 1A.1A of this Form 10-K, and the risk factors described in our other reports and documents filed from time to time with the SEC, which could cause actual results to differ materially from these Forward-Looking Statements. Any Forward-Looking Statements are qualified in the entirety by reference to such risk factors discussed throughout this Form 10-K and as described in our other reports and documents filed from time to time with the SEC. Some of the risks, uncertainties and assumptions that could cause actual results to differ materially from estimates or projections contained in the Forward-Looking Statements include but are not limited to:
● | the market concerns facing our customers, and risks for the Company’s business in the event of the loss of certain substantial customers; |
● | the continuing viability of sectors that rely on our products; |
● | the effects of business and economic conditions, and challenges impacting the macroeconomic environment generally and/or our industry in particular; |
| ● | the effects of rising input costs, and cost changes generally, including the potential impact and effects of inflationary pressures; | |
| ● | difficulties associated with integrating previously acquired companies; | |
| ● | capacity and supply constraints or difficulties, including supply chain constraints or other challenges; | |
● | the impact of public health crises (such as the governmental, social and economic effects of COVID or other future epidemics or pandemics); |
● | difficulties associated with the availability of labor, and the risks of any labor unrest or labor shortages; |
● | risks associated with our international operations, including our substantial manufacturing operations in the People's Republic of China (the "PRC"); |
● | risks associated with restructuring programs or other strategic initiatives, including any difficulties in implementation or realization of the expected benefits or cost savings; |
● | product development, commercialization or technological difficulties; |
● | the regulatory and trade environment; |
● | risks associated with fluctuations in foreign currency exchange rates and interest rates; |
● | uncertainties associated with legal proceedings; |
● | the market's acceptance of the Company's new products and competitive responses to those new products; and |
● | the impact of changes to U.S. and applicable foreign legal and regulatory requirements, including tax laws, trade and tariff policies. |
The Company undertakesforegoing list sets forth some, but not all, of the factors that could affect our ability to achieve results described in any Forward-Looking Statements, which speak only as of the date of this Form 10-K or the date of the document incorporated by reference into this report. Except as required by law, we assume no obligation and expressly disclaim any duty to publicly release the results of any revisions to these Forward-Looking Statements which may be necessaryor otherwise update any Forward-Looking Statement to reflect events or circumstances after the date hereofof this Form 10-K or to reflect the occurrence of unanticipated events. In addition, we cannot assess the impact of each factor on our business or the extent to which any factor, or combination of factors, may cause actual results to differ materially from those contained in any Forward-Looking Statements contained in this Form 10-K. Any Forward-Looking Statement made by the Company is based only on information currently available to us and speaks only as of the date on which it is made. All Forward-Looking Statements are expressly qualified in their entirety by the cautionary statements contained in this section.
Bel Fuse Inc. designs, manufactures and markets a broad array of products that power, protect and connect electronic circuits. These products are primarily used in the networking, telecommunications, computing, general industrial, high-speed data transmission, military, commercial aerospace, transportation and broadcastingeMobility industries. Bel's portfolio of products also finds application in the automotive, medical, broadcasting and consumer electronics markets.
With over 6575 years in operation, Bel has reliably demonstrated the ability to succeedparticipate in a variety of product areas across a global platform. The Company has a strong track record of technical innovation working with the engineering teams of market leaders. Bel has consistently proven itself a valuable supplier to the foremostworld-class companies in its chosen industries by developing cost-effective solutions for the challenges of new product development. By combining our strength in product designproducts with our own specially-designed manufacturing facilities, Bel has established itself as a formidable competitor on a global basis.
The Company whichwas incorporated in 1949 and is organized under New Jersey law, operates in one industry with three reportable operating segments, North America, Asia and Europe (representing 50%, 34% and 16% of the Company's 2017 sales, respectively).law. Bel's principal executive offices are located at 206 Van Vorst Street, Jersey City,300 Executive Drive, Suite 300, West Orange, New Jersey 07302; 07052, and Bel's telephone number is (201) 432-0463. The Company operates facilities in North America, Europe and Asia and trades on the NASDAQ Global Select Market (BELFA(ticker symbols BELFA and BELFB). For information regarding Bel's three geographic operating segments, see
Acquisitions have played a critical role in the growth of Bel and the expansion of both our product portfolio and our customer base and continue to be a keyan important element in our growth strategy. We frequently evaluate possible acquisition candidates that would expand our product and technology offerings to our customers and/or optimize our overall cost structure. The Company may, from time to time, purchase equity positions in companies that are potential merger candidates. We frequently evaluate possible merger candidates
On February 1, 2023, Bel closed on an €8.0 million (approximately $8.8 million as of the February 2023 closing) noncontrolling (one-third) investment in innolectric AG ("innolectric"), a Germany-based business in the field of on-board charging for eMobility applications. This passive investment creates a strategic alliance that would provide an expandedis focused on Electric Vehicles (“EV”) on-board power electronics, and in particular next generation fast-charging technology. With no product overlap, this relationship expands the Bel eMobility Power portfolio, further enhancing Bel's competitive position in this emerging field. The innolectric investment is part of Bel's Power Solutions and technology base that will allow us to expandProtection group.
On March 31, 2021, the breadth of our product offerings to our strategic customers and/or provide an opportunity to reduce overall operating expense as a percentage of revenue. We also consider whether the merger candidates are positioned to take advantage of our lower cost offshore manufacturing facilities, and whether a cultural fit will allow the acquired company to be integrated smoothly and efficiently.
On January 8, 2021, the Company acquired rms Connectors, Inc. (“rms Connectors” or "rms"), from rms Company Inc., a division of Cretex Companies, Inc., for $9.0 million in cash, including a working capital adjustment. rms Connectors is a highly regarded connector manufacturer with over 30 years of experience producing harsh environment circular connectors used in a variety of military and aerospace applications. This acquisition complemented Bel's existing military and aerospace product portfolio and enabled us to expand key customer relationships within these end markets and leverage the combined manufacturing resources to improve our operational efficiency. Originally based in Coon Rapids, Minnesota, the rms Connectors business ("Power Solutions")was relocated into Bel's existing facilities during the second quarter of ABB Ltd. On July 25, 2014, we completed the acquisition2021, and is part of 100% of the issued and outstanding capital stock of the U.S. and U.K.Bel's Connectivity Solutions businesses from Emerson Electric Co. ("Emerson"). group.
On August 29, 2014,December 3, 2019, we completed the acquisition of the Connectivity Solutions business in China from Emerson (collectively with the U.S. and U.K. portionmajority of the transaction, "Connectivity Solutions"power supply products business of CUI Inc. (the "CUI power business"). through an asset purchase agreement with CUI Global Inc. for $29.2 million (after a working capital adjustment), plus the assumption of certain liabilities. The acquisitionsCUI power business designs and markets a broad portfolio of AC/DC and DC/DC power supplies and board level components. The CUI power business is headquartered in Tualatin, Oregon and contributed sales of $50.8 million for 2023, $64.5 million for 2022, $55.8 million for 2021 and $43.1 million for 2020. The acquisition of the CUI power business enhanced Bel's existing offering of power products, allowing us to better address more of our customers' power needs. It also introduced an alternative business model to Bel's, one which carries a higher gross margin profile and lower manufacturing risk. CUI is part of Bel's Power Solutions and Connectivity Solutions may hereafter be referred to collectively as either the "2014 Acquisitions" or the "2014 Acquired Companies".Protection group.
The Company primarily generates revenue through the sale of the following products:
Power Solutions and Protection
Bel's power conversion products include AC-DCinternal and external AC/DC power supplies, DC-DCDC/DC converters and battery charging solutions. The DC-DC product offering consistsDC/AC inverters. These products provide power conversion solutions for a number of standardindustrial, networking and custom isolated and non-isolated DC-DC converters designed specifically to power low voltage silicon devices or provide regulated mid-bus voltages. The need for converting one DC voltage to another is growing rapidly as developers of integrated circuits commonly adjust the supply voltage as a means of optimizing device performance. The DC-DC converters are used in data networking equipment, distributed power architecture, and telecommunication devices, as well as data storage systems, computers and peripherals. Opportunities for the DC-DC products also extend into industrialconsumer applications.
Product Line | Function | Applications | Brands Sold Under | |
Power Solutions and Protection | Front-End Power Supplies | Provides the primary point of isolation between AC main line (input) and the low-voltage DC output that is used to power all electronics | Servers, telecommunication, network and data storage | Bel Power Solutions |
Board-Mount Power Products | These are designed to be mounted on a circuit board. These converters take input voltage and provide localized on-board power to low-voltage electronics. | Telecommunication, networking and a broad range of industrial | Bel Power Solutions | |
Industrial and Transportation Power Products | Designed to be used in industrial equipment or on-board and off-board transportation applications for powering various AC | Rail, transportation, automation, test and measurement, medical | Bel Power Solutions | |
Circuit Protection | Protects devices by preventing current in an electrical circuit from exceeding acceptable levels. | Consumer electronics, power supplies, electric vehicles, EV chargers, battery charging and lighting. | Bel Power |
Connectivity Solutions
Bel offers a comprehensive line of high speed and harsh environment copper and optical fiber connectors and integrated assemblies, which provide connectivity for a wide range of applications across multiple industries including commercial aerospace, military communications, defense, network infrastructure, structured building cabling and several industrial applications. Bel's Stewart Connector business designs and deploys modular connector systems primarily used in high speed Telecom/Datacom applications. In January 2010, Bel completed the acquisition of Cinch Connectors. Cinch products are designed and manufactured for high reliablity/harsh enviroment applications. Cinch also possesses various enabling technologies and expertise with which to provide custom solutions and products. In 2012, the acquistions of Fiberco and GigaCom further enhanced the Cinch product offering with the addition of fiber optic connector and cable products optomized for harsh envirment applications. In 2013, the acquisition of Array (a manufacturer of aerospace and military connector products) further broadened the copper based product portfolio and expanded sales within the aerospace market. The acquisition of Connectivity Solutions in 2014 brought additional products and has strengthened our position with strategic OEM customers in the military, aerospace and networking segments as well as with key distribution partners. Connectivity Solutions is a leading innovator and producer of RF coaxial connectors and cables, harsh environment optical active and passive devices, and microwave components.
Product Line | Function | Applications | Brands Sold Under | |
Connectivity Solutions | Expanded Beam Fiber Optic Connectors, Cable Assemblies and Active Optical Devices (transceivers and media converters) | Harsh-environment, high-reliability, flight-grade optical connectivity for high-speed communications. | Military/aerospace, oil and gas well monitoring and exploration, broadcast, communications, | Stratos®, Fibreco® |
Copper-based Connectors / Cable Assemblies-FQIS | Harsh-environment, high-reliability connectivity and fuel quantity monitoring (FQIS). | Avionics, smart munitions, communications, | Cinch® | |
RF Connectors, Cable Assemblies, Microwave Devices and Low Loss Cable | Connectors and cable assemblies designed to provide connectivity within radio frequency (RF) applications. | Military/aerospace, test and measurement, IoT, 5G high-frequency and wireless | Johnson, Trompeter, Midwest MicrowaveTM, Semflex® | |
| RJ45, RJ11, M12, IP67 and | Stewart Connector |
Magnetic Solutions
Bel's Magnetics offers industry-leading products. The Company's ICM products integrate RJ45 connectors with discrete magnetic components to provide better performance and a more robust device that allows customers to substantially reduce board space and optimize performance. Power Transformers include standard and custom designs for use in a wide array of applications, including industrial instrumentation, alarm and security systems, motion control, elevators, and medical products.
Product Line | Function | Applications | Brands Sold Under | |
Magnetic Solutions | Integrated Connector Modules (ICMs) | Condition, filter, and isolate the electronic signal to ensure accurate data/voice/video transmission and provide RJ45 and USB connectivity. | Network switches, routers, hubs, and PCs used in multi-speed Gigabit Ethernet, Power over Ethernet (PoE), PoE Plus and home networking applications. | Bel, TRP Connector®, MagJack® |
Power Transformers | Safety isolation and distribution. | Power supplies, alarm, fire detection, and security systems, HVAC, lighting and medical equipment. Class 2, three phase, chassis mount, and PC mount designs available. | Signal | |
SMD Power Inductors & SMPS Transformers | A passive component that stores energy in a magnetic field. Widely used in analog electronic circuitry. | Switchmode power supplies, DC/DC converters, LED lighting, automotive and consumer electronics. | Signal | |
Discrete Components-Ethernet | Condition, filter, and isolate the electronic signals to ensure high speed Ethernet data transmission. | Network switches, routers, hubs, and PCs used in multi-speed Gigabit Ethernet and Power over Ethernet (PoE). | Bel |
We sell our products to customers throughout North America, Europe and Asia. Sales are made through one of three channels: direct strategic account managers or in some cases, regional sales managers, working directly with our customers; regional sales managers working with independent sales representative organizationsorganizations; or authorized distributors. Bel's strategic account managers are assigned to handle major accounts requiring global coordination.
Independent sales representatives and authorized distributors are overseen by the Company's sales management personnel located throughout the world.
As of December 31,Sales support functions have also been established and located in our international facilities to provide timely, efficient support for customers. This supplemental level of service, in addition to first-line sales support, enables us to be more responsive to customers
Market Factors
Competition
We operate in a variety of markets, all of which are highly competitive. There are numerous independent companies and divisions of major companies that manufacture products that are competitive with one or more of our products.
Our ability to compete is dependent upon several factors including product performance, quality, reliability, depth of product line, customer service, technological innovation, design, delivery time and price. Overall financial stability and global presence also give us a favorable position in relation to some of our competitors. Management intends to maintain a strong competitive posture in the markets we serve by continued expansion of our product lines and ongoing investment in research, development and manufacturing resources. The preceding sentence represents a Forward-Looking Statement. See "Cautionary Notice Regarding Forward-Looking Information."
Trends in Market Demand
Product orders, or bookings, received during 2023 amounted to $447.6 million, a 41% decrease from 2022. By product group, orders received for our Power Solutions and Protection products amounted to $184.0 million in 2023, a 55% decrease from 2022. This decrease was partially due to a $17.7 million reduction in orders related to expedite fees. Orders received for our Connectivity Solutions products were $210.9 million in 2023, 5% lower than in 2022, as a result of decreased demand from our distribution partners largely offset by a rebound in demand from our direct and aftermarket commercial aerospace and military customers. Bookings for our Magnetic Solutions products decreased by 58% from 2022 to $52.7 million in 2023, largely due to reduced demand from our networking customers.
Backlog of Orders
We typically manufacture products against firm orders and projected usage by customers. Cancellation and return arrangements are either negotiated by us on a transactional basis or contractually determined. We estimate the value of the backlog of orders as of February 29, 2024 to be approximately $362.5 million as compared with a backlog of $526.9 million as of February 28, 2023. Management estimates that approximately 80%-85% of the Company's backlog as of February 29, 2024 will be shipped by December 31, 2024. The current level of backlog is still viewed by management as being elevated compared to historical levels (i.e. pre-COVID, the Company's backlog level was $160 million as of December 31, 2019). Factors that could cause the Company to fail to ship all such orders by year-end include unanticipated supply difficulties, changes in customer demand and new customer designs. Due to these factors, backlog may not be a reliable indicator of the timing of future sales. The preceding statements regarding customer concentrations, see "Management's Discussionthe Company’s backlog, including but not limited to estimates and Analysisanticipated timing of Financial Condition and Resultsshipping, represent Forward-Looking Statements. See "Cautionary Notice Regarding Forward-Looking Information."
Research and Development ("R&D")
Our engineering groups are strategically located around the world to facilitate communication with and access to customers' engineering personnel. This collaborative approach enables partnerships with customers for technical development efforts. The global capabilities and collaborative approach allows Bel to develop leading edge technological products that support highly complex and evolving markets such as eMobility, cloud computing, military, aerospace, and others. On occasion, we execute non-disclosure agreements with customers to help develop proprietary, next generation products destinedintended for rapid deployment.
R&D costs are expensed as incurred and are included in cost of sales on the consolidated statements of operations.incurred. Generally, R&D is performed internally for the benefit of the Company. R&D costs include salaries, building maintenance and utilities, rents, materials, administrative costs and miscellaneous other items. R&D expenses for the years ended December 31, 2017, 2016 and 2015 amounted to $28.8 million, $26.7 million and $27.7 million, respectively.
Resources
Raw Materials and Sourcing
We have multiple suppliers for most of the raw materials that we purchase. Where possible, we have contractual agreements with suppliers to assure a continuing supply of critical components.
With respect to those items which are purchased from single sources, we believe that comparable items would be available in the event that there waswere a termination of our existing business relationships with any such supplier. While such a termination could produce a disruption in production, we believe that the termination of business with any one of our suppliers would not have a material adverse effect on our long-term operations. Actual experience could differ materially from this belief as a result of a number of factors, including the time required to locate an alternative supplier, and the nature of the demand for our products.In the past, we have experienced shortages in certain raw materials, such as capacitors, ferrites and integrated circuits ("IC's"), when these materials were in great demand. Even though we may have more than one supplier for certain materials, it is possible that these materials may not be available to us in sufficient quantities or at the times desired by us. In the event that the current economic conditions have a negative impact on the financial condition of our suppliers, this may impact the availability and cost of our raw materials.
Intellectual Property
We have acquired or been granted a number of patents in the U.S., Europe and Asia and have additional patent applications pending relating to our products. While we believe that the issuedOur U.S. design patents are defendablehave a life of 14 years and that the pending patent applications relate to patentable inventions, there can be no assurance thatour U.S. utility patents have a patent will be obtainedlife of 17 years from the applicationsdate of issue or that our20 years from filing of patent applications. Our existing patents can be successfully defended. expire on various dates through July 2041. It is management's opinion that the successful continuation and operation of our business does not depend upon the ownership of patents or the granting of pending patent applications, but upon the innovative skills, technical competence and marketing and managerial abilities of our personnel. Our U.S. design patents have a life of 14 years and our U.S. utility patents have a life of 17 years from the date of issue or 20 years from filing of patent applications. Our existing patents expire on various dates from
We utilize registered trademarks in the U.S., Europe and Asia to identify various products that we manufacture. The trademarks survive as long as they are in use and the registrations of these trademarks are renewed.
Government economic, social and labor policies in the PRC may cause shortages of factory labor in areas where we have some of our products manufactured. If we are required to manufacture more of these products outside of the PRC as a result of such shortages, our margins will likely be materially adversely affected.
We must comply with and are affected by laws and regulations relating to the award, administration, and performance of U.S. Government contracts. Government contract laws and regulations affect how we do business with our customers and, in some instances, impose added costs on our business. A violation of specific laws and regulations could result in the imposition of fines and penalties or the termination of our contracts or debarment from bidding on contracts. These fines and penalties could be imposed for failing to follow procurement integrity and bidding rules, employing improper billing practices or otherwise failing to follow cost accounting standards, receiving or paying kickbacks, or filing false claims. We have been, and expect to continue to be, subjected to audits and investigations by government agencies. The failure to comply with the terms of our government contracts could harm our business reputation. It could also result in our progress payments being withheld.
In some instances, these laws and regulations impose terms or rights that are more favorable to the government than those typically available to commercial parties in negotiated transactions. For example, the U.S. Government may terminate any of our government contracts and, in general, subcontracts, at its convenience as well as for default based on performance. Upon termination for convenience of a fixed-price type contract, we normally are entitled to receive the purchase price for delivered items, reimbursement for allowable costs for work-in-process, and an allowance for profit on work actually completed on the contract or adjustment for loss if completion of performance would have resulted in a loss. Upon termination for convenience of a Federal Government cost reimbursement contract, we normally are entitled to reimbursement of allowable costs plus a portion of the fee. Such allowable costs would normally include our cost to terminate agreements with our suppliers and subcontractors. The amount of the fee recovered, if any, is related to the portion of the work accomplished prior to termination and is determined by negotiation.
Seasonality
In the PRC, the availability of labor is cyclical and is significantly affected by the migration of workers in relation to the annual Lunar New Year holiday. Each year following the Lunar New Year holiday, we must assess the worker return rate and whether it is adequate to meet the needs of current demand from our customers. Accordingly, we must continually recruit and train new workers to replace those lost to attrition each year and to address peaks in demand that may occur from time to time. This temporary setback in production has historically resulted in our first quarter sales being the lowest sales quarter of the year. Further, recruiting and training efforts and related inefficiencies, as well as overtime required in order to meet demand, can add volatility to the costs incurred by the Company for labor in the PRC, primarily during the first quarter of the year.
Government Regulations
The Company is subject to various government regulations in the United States as well as various jurisdictions where it operates. These regulations cover several diverse areas including trade compliance, anti-bribery, anti-corruption, money laundering, and data and privacy protection. Regulatory or government authorities where the Company operates may have enforcement powers that can subject the company to legal penalties or other measures and can impose changes or conditions in the way it conducts business.
Human Capital Resources, Strategy and Management
At Bel, our values guide everything we do. We are committed to the highest standards of ethical and legal conduct and have created an environment where open and honest communication is the expectation, not the exception. Failing to do so puts Bel’s name, reputation for integrity and business at risk. We hold all employees of Bel (our associates) to this standard and offer the same in return. Our Code of Ethics was created to ensure that our associates, officers, directors, partners, contractors, and suppliers follow our commitment to customer satisfaction in accordance with ethical and legal standards, guided by the basic, unchanging principle of integrity.
Our Human Capital Strategy is built around four areas:
Extraordinary Performance
Our associates are a critical driver of Bel’s global business results. On December 31, 2023, Bel employed approximately 5,260 associates, almost all of which are full-time, across 6 countries, with 33.0% located within North America. Outside of the United States, our largest employee populations were located within the PRC, Mexico, Slovakia, the Dominican Republic, India and the United Kingdom. We regularly monitor various key performance indicators around the key human capital priorities of attracting, retaining, and engaging our global talent. In addition, we enable the execution of our strategic priorities by providing all associates with access to training and development opportunities to improve critical skill sets.
Great Associates
Bel is committed to fostering an inclusive environment that respects and encourages individual differences, diversity of thought, and talent. We strive to create a workplace where associates feel that their contributions are welcomed and valued, allowing them to fully utilize their talents while achieving personal satisfaction in their respective roles within Bel.
Across the organization, we invest in our people to learn in a variety of ways - on the job, in the classroom, through self-directed learning, and through leadership programs. We have expanded our learning management system to make new content and training available to our associates. The Company has advanced its leadership development programs and continues to enhance internship and apprenticeship programs to develop new talent.
Health and Safety
Bel offers a variety of programs globally to protect the health and safety of our associates. While we maintain targets for year-over-year reduction of the total recordable incident rate and serious injuries, our goal is always zero.
In 2023, we maintained our focus on the safety and well-being of our associates around the world in light of COVID and the variants of COVID that have followed. Our management team closely monitors the situation at each of our facilities; protective measures, where possible and as applicable under governing regulations, remain in place throughout our facilities. See "Overview - Key Factors Affecting our Business - Potential Future Impacts of COVID" in Item 7 of this Annual Report on Form 10-K for a discussion of current and potential future impacts of COVID upon our business.
Culture
In an increasingly competitive global marketplace, Bel succeeds when we attract and retain the best talent that is reflective of the diversity of the communities in which we work and live.
We are committed to increasing the diversity of our workforce by participating in networking and community events and actively recruiting and hiring veterans, women, minorities, and individuals with disabilities.
As a global leader in delivering reliable solutions, Bel has signed a Statement of Support Program declaration to show support for National Guard and Reserve member associates coordinated by the Department of Defense's Employer Support of the Guard and Reserve (ESGR) program. The intent of the program is to increase employer support by encouraging employers to act as advocates for associate participation in the military.
The global Human Resources team members are strategically placed, primarily in manufacturing facilities, to provide support to all our associates. The mission of Human Resources is to attract, retain and engage the best people. We create a positive work environment where associates can make a difference.
As a company that has been in business for 75 years, Bel understands the importance of trust, integrity and accountability of all levels of the organization. Our policies, practices and priorities are continually reviewed to align with the best interests of our associates, shareholders and other stakeholders.
Environmental, Social and Governance (“ESG”)
Bel is committed to creating a better tomorrow by understanding how our actions impact the world around us. We aim to accomplish this by making tangible steps, big and small, to invest in our communities, to seek to minimize environmental impact and to promote alignment of interest among stakeholders. As an organization that thrives on learning and continuous improvement, Bel welcomes and embraces change. The below sections outline some recent developments at Bel as we work to drive continuous improvements in these areas.
Global Director of ESG
In November 2022 Bel appointed a Global Director of ESG. This new dedicated role has allowed the Company to embark on a series of initiatives aimed at improving Bel’s commitment to its ESG program.
ESG Committee
The first internal (operations-level) ESG Committee was formed in early December of 2022. The purpose of the ESG Committee is to support the Company’s ongoing commitment to ESG matters including environmental stewardship, health and safety, corporate social responsibility, corporate governance, sustainability, and other related issues of significance to the Company.
The ESG Committee aims to:
● | Define ESG priorities, objectives and strategy with the goal of further integrating sustainability into the Company’s strategy and operations, subject to the oversight and overall direction of the Nominating and ESG Committee of our Board of Directors (as described below); |
● | Oversee and coordinate the implementation of the Company’s ESG initiatives at the operational level; |
● | Assist the Nominating and ESG Committee of our Board of Directors in fulfilling its oversight responsibilities with respect to the Company’s ESG efforts; and |
● | Monitor and assess developments relating to and improving the Company’s understanding of ESG matters. |
The members of the ESG Committee include senior executives and associates from various regions and business segments while taking into account each person’s expertise in relevant disciplines, such as environmental, health and safety, operations, marketing, legal, investor relations, corporate governance, finance, and human resources.
Board-Level Oversight of ESG Matters
In October 2022, Bel’s Board of Directors approved an expanded role for its Nominating Committee, broadening the purposes and functions of such committee to include oversight and monitoring of ESG matters, and re-designating the committee as the “Nominating and ESG Committee” in recognition of these new responsibilities. In accordance with the amended charter of the Nominating and ESG Committee, a copy of which can be found at https://ir.belfuse.com/corporate-governance, certain oversight functions were added including:
● | To oversee the Company’s corporate governance initiatives and periodically consider, and report to the Board on, such initiatives and applicable policies, including development and periodic review of corporate governance guidelines for the Company; and |
● | To assist the Board in overseeing and monitoring the Company’s environmental, social and corporate governance policies, activities, practices and initiatives, including matters relating to sustainability, environmental stewardship, corporate social responsibility including ethical business practices, corporate culture and health and safety programs, and other public issues of significance which affect investors and other key stakeholders including such other matters that may be referred to the Committee by the Board from time to time. |
Bel’s internal ESG Committee provides updates to either the Nominating and ESG Committee or to the full Board on a quarterly basis.
Environmental
At Bel, we understand the impact of climate change upon so many aspects of our lives and our future, and we are committed to reducing environmental impact for a more sustainable tomorrow. We consistently look for alternatives and approaches to consider in Bel’s business and strategies at multiple levels, from improving the efficiency ratings of our products and factories to better managing our consumption habits of electricity and water.
Bel has started the process of measuring the impact of its operations on the environment and intends to utilize these measurements to establish reduction goals and related initiatives throughout the global organization. Today we have 19 manufacturing facilities of various sizes and five of them are ISO 14001 certified and represent 73% of our manufacturing footprint. These five sites have been measuring their consumption levels of natural gas, electricity and water and have targets in place for reducing consumption and waste and improving recycling efforts. For the rest of our manufacturing sites, we intend to follow an approach comparable to the template laid out with these five as we begin the process of better understanding our impact.
Social
Associates are the cornerstone of our business and key to our success. At Bel, we believe in the need for diversity and inclusion that reflects the communities in which we work and live. Associates are encouraged to bring with them their unique perspectives, opinions and experiences as they work for the betterment of Bel, its customers and the locations in which we operate. Bel recognizes its role in the global community and giving back is a priority. From coaching their local sports team to raising funds for local charities of choice, Bel supports and encourages our associates’ participation in these types of activities.
2023 Charitable Contribution Program:
In 2022, Bel launched a Company-wide Charitable Contribution Program to ensure consistency and drive our corporate values across the organization. The social program is also in alignment with our Core Value of Community Engagement and directly reflects the ambitions of our ESG initiative to support the global communities within which we operate. In 2023, the program resulted in contributions to 52 local charities across 14 countries. In addition, there was a matching program for the organizations selected and associates who donated.
Governance
As a company that has been in business for 75 years, Bel understands the importance of trust, integrity and accountability at all levels of the organization. Recent additions to our Board and executive management team have brought greater diversity and new perspectives to Bel. We intend that our policies, practices and priorities will be periodically and continually reviewed as appropriate to better align with the best interests of our shareholders, associates and other stakeholders.
In addition to the establishment of Board-level ESG oversight pursuant to the Nominating and ESG Committee’s expanded role and the creation of Bel’s internal ESG Committee as discussed above, in February 2023, the Board adopted Bel’s Corporate Governance Guidelines which are available at https://ir.belfuse.com/corporate-governance. These guidelines, which are designed to enhance the Company’s corporate governance, will serve as a framework within which the Board will conduct its business, subject to applicable laws, regulations, listing requirements, and the Company’s organizational documents and Board committee charters.
Bel is committed to a better tomorrow. With a solid foundation and oversight functions having been established, we expect ESG to be an ongoing journey of continuous improvement.
The foregoing discussion of ESG matters contains Forward-Looking Statements. See "Cautionary Notice Regarding Forward-Looking Information."
Available Information
We maintain a website at www.belfuse.com where we make available free of charge the proxy statements, press releases, registration statements and reports on Forms 3, 4, 8-K, 10-K and 10-Q, and amendments to those reports filed or furnished pursuant to Section 13(a) or 15(d) of the Exchange Act that we (and in the case of Section 16 reports, our insiders) file with the SEC. These forms are made available as soon as reasonably practicable after such material is electronically filed with or furnished to the SEC. Press releases are also issued via electronic transmission to provide access to our financial and product news, and we provide notification of and access to voice and internet broadcasts of our quarterly and annual results. Our website also includes investor presentations and corporate governance materials. The information contained on our website is not incorporated by reference into this Annual Report on Form 10-K or in any other report or document we file with the SEC.
The risks described below should be carefully considered before making an investment decision. These are the risk factors that we consider to be material, but they are not the only risk factors that should be considered in making an investment decision. This Form 10-K also contains Forward-Looking Statements that involve risks and uncertainties. See the "Cautionary Notice Regarding Forward-Looking Information," above. Our business, consolidated financial condition and consolidated results of operations could be materially adversely affected by any of the risk factors described below, under "Cautionary Notice Regarding Forward-Looking Information" or with respect to specific Forward-Looking Statements presented herein. The trading price of our securities could decline due to any of these risks, and investors in our securities may lose all or part of their investment. Additional risks and uncertainties not presently known to us or that we currently believe to be immaterial may also materially adversely affect our business in the future. Except as required by the federal securities law, we undertake no obligation to update or revise any risk factor, whether as a result of new information, future events or otherwise.
STRATEGIC RISKS
We conduct business in a highly competitive industry.
Our business operates in a globally competitive industry, with relatively low barriers to entry. We compete principally on the basis of product performance, quality, reliability, depth of product line, customer service, technological innovation, design, delivery time and price. The industry in which we operate has become increasingly concentrated and globalized in recent years and our major competitors, many of which are larger than Bel, have significant financial resources and technological capabilities.
Our intellectual property rights may not be adequately protected under the current state of the law.
Our efforts to protect our intellectual property rights through patent, copyright, trademark and trade secret laws in the United States and in other countries may not prevent misappropriation, and our failure or inability to protect our proprietary rights could materially adversely affect our business, financial condition, operating results and future prospects. A third party could, without authorization, copy or otherwise appropriate our proprietary information. Our agreements with employees and others who participate in development activities could be breached, we may not have adequate remedies for any breach, and our trade secrets may otherwise become known or independently developed by competitors.
Our acquisitions may not produce the anticipated results.
A significant portion of our growth has been attributable to acquisitions. We cannot assure that we will identify or successfully complete transactions with suitable acquisition candidates in the future. If an acquired business fails to operate as anticipated or cannot be successfully integrated with our other businesses, our results of operations, enterprise value, market value and prospects could all be materially and adversely affected. Integration of new acquisitions into our consolidated operations may result in lower average operating results for the group as a whole, and may divert management's focus from the ongoing operations of the Company during the integration period.
Our strategy also focuses on the reduction of selling, general and administrative expenses through the integration or elimination of redundant sales facilities and administrative functions at acquired companies. If we are unable to achieve our expectations with respect to our acquisitions, such inability could have a material and adverse effect on our results of operations. If the acquisitions fail to perform up to our expectations, or if there is a weakening of economic conditions, we could be required to record impairment charges on the goodwill associated with our acquisitions.
We are dependent on our ability to develop new products.
Our future operating results are dependent, in part, on our ability to develop, produce and market new and more technologically advanced products. There are numerous risks inherent in this process, including the risks that we will be unable to anticipate the direction of technological change or that we will be unable to timely develop and bring to market new products and applications to meet customers' changing needs.
OPERATIONAL RISKS
Our global operations and demand for our products face risks related to health epidemics such as the coronavirus.
Any outbreaks of contagious diseases and other adverse public health developments in countries where we operate could have a material and adverse effect on our business, consolidated financial condition and consolidated results of operations. Over the past three years, our business was impacted by temporary facility closures, shelter-in-place orders and challenges related to travel restrictions imposed by the local governmental authorities as a result of COVID. Our suppliers, customers and our customers’ contract manufacturers have experienced similar challenges from time to time throughout the pandemic.
As the status of the COVID pandemic and its effects continue to evolve, additional Bel facilities could become negatively impacted. COVID remains a potential supply continuity risk due to the unknown nature of future outbreaks including as a result of the emergence of further COVID virus variants. The extent to which COVID will impact our business and our consolidated financial results will depend on future developments which are highly uncertain and cannot be predicted at the time of the filing of this Annual Report on Form 10-K. See "Overview - Key Factors Affecting our Business - Potential Future Impacts of COVID" in Item 7 of this Annual Report on Form 10-K for a discussion of current and potential future impacts of COVID upon our business.
We may experience labor unrest.
As we periodically implement transfers of certain of our operations, we may experience strikes or other types of labor unrest as a result of lay-offs or termination of employees in higher labor cost countries. Our manufacturing facilities in the United Kingdom and Mexico are represented by labor unions and substantially all of our factory workers in the PRC are represented by government-sponsored unions.
We may experience labor shortages.
Government, economic, social and labor policies in the PRC may cause shortages of factory labor in areas where we have some of our products manufactured. Further, availability of labor in the PRC is cyclical and is significantly affected by the migration of workers in relation to the annual Lunar New Year holiday. If we are required to manufacture more of these products outside of the PRC as a result of such shortages, our margins will likely be materially adversely affected.
A shortage of availability or an increase in the cost of raw materials, components and other resources may adversely impact our ability to procure these items at cost effective prices and thus may negatively impact profit margins. Additionally, inflationary pressures could result in higher input costs and materially adversely affect our financial results.
Our results of operations may be materially adversely impacted by difficulties in obtaining raw materials, supplies, power, labor, natural resources and any other items needed for the production of our products, as well as by the effects of quality deviations in raw materials and the effects of significant fluctuations in the prices of existing inventories and purchase commitments for these materials. Many of these materials and components are produced by a limited number of suppliers and their availability to us may be constrained by supplier capacity. Any material disruption could materially adversely affect our financial results. In addition, inflationary pressures could result in higher input costs, including those related to our raw materials, labor, freight, utilities, healthcare and other expenses. Our future operating results will depend, in part, on our continued ability to manage these fluctuations through pricing actions, cost savings initiatives and sourcing decisions, and any negative impact of inflation could materially adversely affect our financial results. See “Overview - Key Factors Affecting our Business" in Item 7 of this Annual Report on Form 10-K for a discussion of how pricing and availability of materials is currently impacting our business.
We have substantial manufacturing operations located in the PRC, which exposes us to significant risks that could materially and adversely affect our business, operations, consolidated financial condition and consolidated results of operations.
The majority of Bel's Magnetic Solutions manufacturing capacity and supplier base is located in the PRC, as is a portion of Bel's Power Solutions and Protection group. As of December 31, 2023, 50% of our associates, 74% of our owned or leased manufacturing facilities (by square footage) and 24% of our Company’s tangible assets were all located in the PRC. Our Company’s presence and operations in the PRC expose us to significant risks that could materially and adversely affect our Company and our business, operations, financial position and results of operations.
For example, our significant operational presence in the PRC exposes us to foreign currency exchange risk. Our PRC-based manufacturing associates’ salaries, and other labor and overhead costs, associated with our PRC operations are paid in the Chinese renminbi. As a result, the cost of our operations and our consolidated operating results may be adversely impacted by the effects of fluctuations in the applicable exchange rate for the renminbi as compared to the U.S dollar.
Our significant labor force based within the PRC subjects us to risks associated with staffing and managing this substantial complement of factory workers and other associates who are important to our Company’s operations and success. As noted above, factory workers in the PRC are represented by government-sponsored unions, and are participants in a cyclical labor market that may become subject to shortages including as a result of PRC government policies. See “We may experience labor unrest” and “We may experience labor shortages” above. Wage rates in the PRC have been increasing in recent years as PRC government-mandated increases in the minimum wage rate have caused an increase in our overall pay scale for our PRC workers.
The PRC government has broad authority and discretion to regulate the economy, manufacturing, industry, and the technology sector, among other areas generally. As a result, our activities and operations in the PRC as well as those of our PRC-based suppliers are subject to extensive local government regulation. Additionally, the PRC government has implemented policies from time to time to regulate economic expansion. It exercises significant control over its economic growth through the allocation of resources, setting monetary policy and providing preferential treatment to particular industries or companies. Any additional new regulations or the amendment of previously implemented regulations could require us to change our business plans, increase our costs, or limit our ability to manufacture and sell products domestically and/or otherwise restrict or curtail our operations in the PRC. To the extent our suppliers in the PRC are negatively impacted by new or amended regulations, any such negative implications could adversely impact our supply chain, including in the form of increased costs, disruptions, shortages or unavailability of product or component parts, and/or other deleterious consequences, which could materially adversely affect our business and operating results.
Our significant manufacturing operations in the PRC may expose us to other risks. Risks inherent in our PRC operations include the following:
● | changes in import, export, transportation regulations and tariffs, and risks associated with boycotts and embargoes; |
● | changes in, or impositions of, legislative or regulatory requirements or restrictions, including tax and trade laws in the U.S. and in the PRC, and government action to restrict our ability to sell to customers where sales of products may require export licenses; |
● | transportation delays and other supply chain issues; |
● | changes in tax regulations in the U.S. and/or the PRC, including restrictions and/or taxes applicable to the transfer or repatriation of funds; |
● | international political relationships, including the relationship between the U.S. and the PRC; |
● | epidemics and illnesses (including COVID, any new variants that may emerge, and any future health crises) within the PRC that affect the areas in which we operate and manufacture our products; |
● | economic, social and political instability; |
● | longer accounts receivable collection cycles and difficulties in collecting accounts receivable; |
● | less effective protection of intellectual property and contractual arrangements, and risks associated with enforcing contracts and legal rights and remedies generally; |
● | uncertainties associated with the PRC legal system, which is based on civil law, can involve protected proceedings involving substantial judicial discretion, and is based in part on PRC government policies and internal rules, some of which are not published on a timely basis, or at all, and may have retroactive effect; |
● | risks arising out of any changes in governmental and economic policy and the potential for adverse developments arising out of any political or economic instability related to Hong Kong or Taiwan; |
● | the potential for political unrest, expropriation, nationalization, revolution, war or acts of terrorism; and |
● | risks associated with the concentration of a substantial portion of our manufacturing capacity and supplier base in the PRC. |
In addition to the risks associated with our PRC operations described above, the global nature of our operations generally subjects us to additional risks. We conduct operations in 14 countries, and outside of the United States (and the PRC), our largest manufacturing operations and associate populations are located within Mexico, Slovakia, the Dominican Republic, India and the United Kingdom. Please see the Risk Factor appearing below under the caption, "The global nature of our operations exposes us to numerous risks that could materially adversely affect our consolidated financial condition and consolidated results of operations.”
The loss of certain substantial customers could materially and adversely affect us.
During the year ended December 31, 2023, while there were no direct customers whose sales exceeded 10% of our 2023 consolidated net sales, approximately11.6% of the Company's total net sales were sold to one ultimate end-user through various intermediary contract manufacturers. While Bel sells a diversified portfolio of products to this ultimate end-user, we believe that the loss of this end user could have a material adverse effect on our consolidated financial position and consolidated results of operations. We have experienced significant concentrations of customers in prior years. See Note 14, "Segments" for additional disclosures related to our significant customers. Furthermore, factors that negatively impact the businesses of our major customers could materially and adversely affect us even if the customer represents less than 10% of our 2023 consolidated net sales.
We may not achieve all of the expected benefits from our restructuring programs.
In 2022, we announced restructuring plans related to four facility consolidations as further described in "Overview - Key Factors Affecting our Business - Restructuring" in Item 7 of this Annual Report. Management has estimated that these initiatives will result in restructuring costs of approximately $13.4 million ($6.3 million of which was incurred through December 31, 2023), incremental capital expenditures of approximately $5 million and once complete, annualized cost savings of approximately $6.9 million. Additionally, in connection with a new restructuring initiative implemented in the fourth quarter of 2023 involving the transition of certain manufacturing from our Glen Rock, Pennsylvania facility to other existing Bel sites as further described in "Overview – Key Factors Affecting our Business – Restructuring" in Item 7 of this Annual Report, management estimated that the initiative will result in restructuring costs of approximately $0.5 million ($0.4 million of which was incurred through December 31, 2023) and once complete, annualized cost savings of approximately $1.0 million. We made certain assumptions in estimating the anticipated savings we expect to achieve related to these initiatives, which include the estimated savings from the elimination of certain headcount and the consolidation of facilities. These assumptions may turn out to be incorrect due to a variety of factors. In addition, our ability to realize the expected benefits from these programs is subject to significant business, economic and competitive uncertainties and contingencies, many of which are beyond our control. If we are unsuccessful in implementing these programs or if we do not achieve our expected results, our results of operations and cash flows could be adversely affected or our business operations could be disrupted. As mentioned above, the amounts set forth in the foregoing including anticipated restructuring costs, incremental capital expenditure spend and annualized cost savings are the Company’s current estimates based on information presently available to the Company, assumptions and circumstances as they exist in each case at the time of filing of this Annual Report on Form 10-K, and are subject to change. See "Cautionary Notice Regarding Forward-Looking Information."
FINANCIAL RISKS
There are several factors which can cause our margins to suffer.
Our margins could be substantially impacted by the following factors.
● | Declines in Selling Prices: The average selling prices for our products tend to decrease over their life cycles, and customers put pressure on suppliers to lower prices even when production costs are increasing. Further, increased competition from low-cost suppliers around the world has put additional pressures on pricing. Any drop in demand for our products or increase in supply of competitive products could also cause a significant drop in our average sales prices. |
● | Increases in Material Costs: While we continually strive to negotiate better pricing for components and raw materials, there are many factors that could lead to higher material costs, or premiums incurred for expedited orders, including an increase in industry demand for or supplier shortages of certain components, or inflationary pressures. Further, commodity prices, especially those pertaining to gold, copper and silver, can be volatile. Fluctuations in these prices and other commodity prices associated with Bel's raw materials will have a corresponding impact on our profit margins. |
● | Increases in Labor Costs: Wage rates, particularly in the PRC, Mexico and Slovakia where the majority of our manufacturing associates are located, have been gradually increasing in recent years as government-mandated increases in the minimum wage rate in these jurisdictions cause an increase in our overall pay scale. Labor costs can also be impacted by fluctuations in the exchange rates in which local wages are paid as compared to the U.S. dollar. |
Profit margins will be materially and adversely impacted if we are not able to reduce our costs of production, introduce technological innovations as sales prices decline, or pass through cost increases to customers.
Our backlog figures may not be reliable indicators.
Many of the orders that comprise our backlog may be delayed, accelerated or canceled by customers without penalty. Customers may on occasion double order from multiple sources to ensure timely delivery when lead times are particularly long. Customers often cancel orders when business is weak and inventories are excessive. Additional factors that could cause the Company to fail to ship orders comprising our backlog include unanticipated supply difficulties, changes in customer demand and new customer designs. Throughout 2023, Bel has faced macroeconomic and excessive levels of inventory within the supply channel and these conditions expected to continue through at least the first half of 2024. Due to the foregoing factors, we cannot be certain that the amount of our backlog equals or exceeds the level of orders that will ultimately be delivered, and backlog may not be a reliable indicator of the timing of future sales. Our results of operations could be adversely impacted if customers cancel a material portion of orders in our backlog.
We may not be able to generate sufficient cash to service all of our indebtedness and may be forced to take other actions to satisfy our obligations under our indebtedness, which may not be successful.
Our ability to make scheduled payments on or refinance our debt obligations depends on our financial condition and operating performance, which are subject to prevailing economic and competitive conditions and to certain financial, business, legislative, regulatory and other factors beyond our control. We may be unable to maintain a level of cash flows from operating activities sufficient to permit us to pay the principal, premium, if any, and interest on our indebtedness.
If our cash flows and capital resources are insufficient to fund our debt service obligations, we could face substantial liquidity problems and could be forced to reduce or delay acquisitions, investments and capital expenditures or to dispose of material assets or operations, seek additional debt or equity capital or restructure or refinance our indebtedness. We may not be able to effect any such alternative measures on commercially reasonable terms or at all and, even if successful, those alternative actions may not allow us to meet our scheduled debt service obligations. Our credit agreement restricts our ability to dispose of assets and use the proceeds from those dispositions and may also restrict our ability to raise debt or equity capital to be used to repay other indebtedness when it becomes due. We may not be able to consummate those dispositions or to obtain proceeds in an amount sufficient to meet any debt service obligations then due.
Our inability to generate sufficient cash flows to satisfy our debt obligations, or to refinance our indebtedness on commercially reasonable terms or at all, would materially and adversely affect our consolidated financial position and consolidated results of operations. If we cannot make scheduled payments on our debt, we will be in default, the lenders under the credit agreement could terminate their commitments to loan money, the lenders could foreclose against the assets securing their borrowings and we could be forced into bankruptcy or liquidation.
Our level of indebtedness could negatively impact our access to the capital markets and our ability to satisfy financial covenants under our existing credit agreement.
Our U.S. debt service requirements are significant in relation to our U.S. revenue and cash flow. This leverage exposes us to risk in the event of downturns in our business, in our industry or in the economy generally, and may impair our operating flexibility and our ability to compete effectively. Our current credit agreement requires us to maintain certain covenant ratios. If we do not continue to satisfy these required ratios or receive waivers from our lenders, we will be in default under the credit agreement, which could result in an accelerated maturity of our debt obligations. We cannot assure investors that we will be able to access private or public debt or equity on satisfactory terms, or at all. Any equity financing that could be arranged may dilute existing shareholders and any debt financing that could be arranged may result in the imposition of more stringent financial and operating covenants.
LEGAL, TAX AND REGULATORY RISKS
We may be sued by third parties for alleged infringement of their proprietary rights and we may incur defense costs and possibly royalty obligations or lose the right to use technology important to our business.
From time to time, we receive claims by third parties asserting that our products violate their intellectual property rights. Any intellectual property claims, with or without merit, could be time consuming and expensive to litigate or settle and could divert management attention from administering our business. A third party asserting infringement claims against us or our customers with respect to our current or future products may materially and adversely affect us by, for example, causing us to enter into costly royalty arrangements or forcing us to incur settlement or litigation costs.
We are subject to taxation in multiple jurisdictions. As a result, any adverse development in the tax laws of any of these jurisdictions or any disagreement with our tax positions could have a material adverse effect on our business, consolidated financial condition or consolidated results of operations.
We are subject to taxation in, and to the tax laws and regulations of, multiple jurisdictions as a result of the international scope of our operations and our corporate and financing structure. We are also subject to transfer pricing laws with respect to our intercompany transactions, including those relating to the flow of funds among our companies. Adverse developments in fiscal or tax laws, regulations or policies, or any change in position regarding the application, administration or interpretation thereof, in any applicable jurisdiction, could have a material adverse effect on our business, consolidated financial condition or consolidated results of our operations. In addition, the tax authorities in any applicable jurisdiction, including the United States, may disagree with the positions we have taken or intend to take regarding the tax treatment or characterization of any of our transactions. If any applicable tax authorities, including U.S. tax authorities, were to successfully challenge the tax treatment or characterization of any of our transactions, it could have a material adverse effect on our business, consolidated financial condition or consolidated results of our operations.
Our results of operations may be materially and adversely impacted by environmental and other regulations.
Our manufacturing operations, products and/or product packaging are subject to environmental laws and regulations governing air emissions; wastewater discharges; the handling, disposal and remediation of hazardous substances, wastes and certain chemicals used or generated in our manufacturing processes; employee health and safety labeling or other notifications with respect to the content or other aspects of our processes, products or packaging; restrictions on the use of certain materials in or on design aspects of our products or product packaging; and, responsibility for disposal of products or product packaging. Discussions and proposals related to gas emissions and climate change have increasingly become the subject of substantial attention; additional regulation in this area could have the effect of restricting our business operations or increasing our operating costs. More stringent environmental regulations may be enacted in the future, and we cannot presently determine the modifications, if any, in our operations that any such future regulations might require, or the cost of compliance with these regulations.
ESG issues, including those related to climate change and sustainability, may have an adverse effect on our business, financial condition and results of operations and could damage our reputation.
Companies across all industries are facing increasing scrutiny relating to their ESG policies. Increased focus and activism related to ESG may hinder our access to capital, as investors may reconsider their capital investment as a result of their assessment of our ESG practices. In particular, investors, customers and other stakeholders are increasingly focusing on environmental issues, including climate change, water use, waste and other sustainability concerns. Changing customer or consumer preferences may also result in increased demands regarding components and materials including packaging materials, including with respect to their environmental impact on sustainability. These demands could impact the profitability products, cause us to incur additional costs, to make changes to our operations, or to make additional commitments, set targets or establish additional goals and take actions to meet them, which could expose us to market, operational and execution costs or risks. In addition, governmental and non-governmental organizations, investors, customers, consumers, our employees and other stakeholders have placed increasing importance on ESG matters, and depending on their assessment of our ESG practices, certain investors may reconsider their investment in the Company.
Concern over climate change, waste, consumption or use of materials including packaging materials, may result in new or increased legal and regulatory requirements to reduce or mitigate impacts to the environment. Increased regulatory requirements, including in relation to various aspects of ESG including the SEC’s recent disclosure proposal on climate change, or environmental causes may result in increased compliance or input costs of energy, raw materials or compliance with emissions standards, which may cause disruptions in the manufacture of our products or an increase in operating costs. We may undertake additional costs to control, assess and report on ESG metrics as the nature, scope and complexity of ESG reporting, diligence and disclosure requirements expand. Our ability to achieve any stated goal, target, or objective is subject to numerous factors and conditions, many of which are outside of our control. Any failure to achieve our ESG goals or ambitions or a perception (whether or not valid) of our failure to act responsibly with respect to the environment or to effectively respond to new, or changes in, legal or regulatory requirements concerning environmental or other ESG matters, or increased operating or manufacturing costs due to increased regulation or environmental causes could adversely affect our business and reputation.
If we do not adapt to or comply with new regulations, or fail to meet ESG goals or ambitions or evolving investor, industry or stakeholder expectations and standards, or if we are perceived to have not responded appropriately to the growing concern for ESG issues, customers may choose to stop purchasing our products or purchase products from another company or a competitor, and our reputation, business or financial condition may be adversely affected.
Expanding and evolving data privacy laws and regulations could impact our business and expose us to increased liability.
Our global business is subject to complex and changing laws and regulations including but not limited to privacy, data security and data localization. Evolving foreign events may adversely affect our revenues and could subject us to new regulatory costs and challenges (such as the transfer of personal data between the EU and the United Kingdom), in addition to other adverse effects that we are unable to effectively anticipate. This may impose significant requirements on how we collect, process and transfer personal data, as well as significant financial penalties for non-compliance. Any inability to adequately address privacy concerns, even if unfounded, or to comply with the more complex privacy or data protection laws, regulations and privacy standards, could lead to significant financial penalties, which may result in a material and adverse effect on our consolidated results of operations.
RISKS RELATED TO OUR COMMON STOCK
As a result of protective provisions in the Company's Restated Certificate of Incorporation, as amended, the voting power of holders of Class A common shares whose voting rights are not suspended (including officers, directors and principal shareholders) may be increased at future meetings of the Company's shareholders.
The Company's Restated Certificate of Incorporation, as amended, provides that if a shareholder, other than shareholders subject to specific exceptions, acquires (after the date of the Company's 1998 recapitalization) 10% or more of the outstanding Class A common stock and does not own an equal or greater percentage of all then outstanding shares of both Class A and Class B common stock (all of which common stock must have been acquired after the date of the 1998 recapitalization), such shareholder must, within 90 days of the trigger date, purchase Class B common shares, in an amount and at a price determined in accordance with a formula described in the Company's Restated Certificate of Incorporation, as amended, or forfeit its right to vote its Class A common shares. As of February 29, 2024, to the Company's knowledge, there was one shareholder of the Company's common stock with ownership in excess of 10% of Class A outstanding shares with no ownership of the Company's Class B common stock and with no basis for exception from the operation of the above-mentioned provisions. In order to vote its shares at Bel's next shareholders' meeting, this shareholder must either purchase the required number of Class B common shares or sell or otherwise transfer Class A common shares until its Class A holdings are under 10%. As of February 29, 2024, to the Company's knowledge, this shareholder owned 16.7% of the Company's Class A common stock and had not taken steps to either purchase the required number of Class B common shares or sell or otherwise transfer Class A common shares until its Class A holdings fall below 10%. Unless and until this situation is satisfied in a manner permitted by the Company's Restated Certificate of Incorporation, as amended, the subject shareholder will not be permitted to vote its shares of common stock.
To the extent that the voting rights of particular holders of Class A common stock are suspended as of times when the Company's shareholders vote due to the above-mentioned provisions, such suspension will have the effect of increasing the voting power of those holders of Class A common shares whose voting rights are not suspended. As of February 29, 2024, Daniel Bernstein, the Company's Chief Executive Officer, beneficially owned 382,032 Class A common shares (or 21.4%) of the outstanding Class A common shares whose voting rights were not suspended, and all directors and current executive officers as a group (which includes Daniel Bernstein) beneficially owned 396,175 Class A common shares (or 22.2%) of the outstanding Class A common shares whose voting rights were not suspended.
Our stock price, like that of many companies, has been and may continue to be volatile.
The market price of our common stock may fluctuate as a result of variations in our quarterly operating results and other factors beyond our control. These fluctuations may be exaggerated if the trading volume of our common stock is low. The market price of our common stock may rise and fall in response to a variety of other factors, including:
• | announcements of technological or competitive developments; |
• | general market or economic conditions; |
• | the continuing and uncertain future impact of the COVID pandemic on our operations and supply chain; |
• | market or economic conditions specific to particular geographical areas in which we operate; |
• | acquisitions or strategic alliances by us or our competitors; |
| • | our ability to achieve our anticipated cost savings from announced restructuring programs; |
• | the gain or loss of a significant customer or order; |
| • | changes in the amount or frequency of our payments of dividends or repurchases of our common stock; or |
• | changes in estimates of our financial performance or changes in recommendations by securities analysts regarding us or our industry. |
In addition, equity securities of many companies have experienced significant price and volume fluctuations even in periods when the capital markets generally are not distressed. These price and volume fluctuations often have been unrelated to the operating performance of the affected companies.
GENERAL RISKS
The global nature of our operations exposes us to numerous risks that could materially adversely affect our consolidated financial condition and consolidated results of operations.
We manufacture in 7 countries, and our products are distributed in those countries as well as in other parts of the world. A large portion of our manufacturing operations are located outside of the United States and a large portion of our sales are generated outside of the United States. Operations outside of the United States, particularly operations in developing regions, are subject to various risks that may not be present or as significant for our U.S. operations. Economic uncertainty in some of the geographic regions in which we operate, including developing regions, could result in the disruption of commerce and negatively impact cash flows from our operations in those areas.
Risks inherent in our international operations include:
● | COVID-related closures and other pandemic-related uncertainties in the countries in which we operate; |
● | Import and export regulations that could erode profit margins or restrict exports; |
● | Foreign exchange controls and tax rates; |
● | Foreign currency exchange rate fluctuations, including devaluations; |
● | Changes in regional and local economic conditions, including local inflationary pressures; |
● | Difficulty of enforcing agreements and collecting receivables through certain foreign legal systems; |
● | Variations in protection of intellectual property and other legal rights; |
● | More expansive legal rights of foreign unions or works councils; |
● | Changes in labor conditions and difficulties in staffing and managing international operations; |
● | Inability or regulatory limitations on our ability to move goods across borders; |
● | Changes in laws and regulations, including the laws and policies of the United States affecting trade, tariffs and foreign investment; |
● | Restrictive governmental actions such as those on transfer or repatriation of funds and trade protection matters, including antidumping duties, tariffs, trade wars, embargoes and prohibitions or restrictions on acquisitions or joint ventures; |
● | Social plans that prohibit or increase the cost of certain restructuring actions; |
● | The potential for nationalization of enterprises or facilities; and |
● | Unsettled political conditions and possible terrorist attacks against U.S. or other interests. |
As a multi-national company, we are faced with increased complexities due to recent changes to the U.S. corporate tax code relating to our unremitted foreign earnings, potential revisions to international tax law treaties, and renegotiated trade deals. In addition, other events, such as the ongoing discussion and negotiations concerning varying levels of tariffs on product imported from the PRC, also create a level of uncertainty. If we are unable to anticipate and effectively manage these and other risks, it could have a material and adverse effect on our business, our consolidated results of operations and consolidated financial condition.
The recent political tensions and armed conflict involving Russia and Ukraine continues to evolve and we are closely monitoring this dynamic situation. The Company has indefinitely ceased all shipments of product to customers in Russia. The Company's operations in Slovakia have not been, and are not currently expected to be, impacted by the political instability of the Russia-Ukraine conflict as our facility is not in close proximity to the Ukraine border. We do not currently anticipate any material impact to the Company's financial results.
For additional information regarding risks associated with our operations in the PRC, see the discussion set forth above under the caption, "We have substantial manufacturing operations located in the PRC, which exposes us to significant risks that could materially and adversely affect our business, operations, consolidated financial condition and consolidated results of operations."
Cybersecurity risk and the failure to maintain the integrity of our operational or security systems or infrastructure, or those of third parties with which we do business, could have a material adverse effect on our business, consolidated financial condition and consolidated results of operations.
Cybersecurity threats, including but not limited to malware, phishing, credential harvesting, ransomware and other attacks, are rapidly evolving and are becoming increasingly sophisticated, making it difficult to detect and prevent such threats from impacting the Company. Our Company has seen an increased volume of cybersecurity threats and ransomware attempts in 2023 and expects to continue to experience cybersecurity threats from time to time, which pose a risk to the security of our systems and networks and the confidentiality, availability and integrity of our data. Disruptions or failures in the physical infrastructure or operating systems that support our businesses and customers, or cybersecurity attacks or security breaches of our networks, systems or applications, could result in the loss of customers and business opportunities, legal liability, regulatory fines, penalties or intervention, other litigation, regulatory and legal risks and the costs associated therewith, reputational damage, reimbursement or other compensatory costs, remediation costs, increased cybersecurity protection costs, additional compliance costs, increased insurance premiums, and lost revenues, damage to the Company's competitiveness, stock price, and long-term shareholder value, any of which could materially adversely affect our business, financial condition and results of operations. While we attempt to mitigate these risks, our systems, networks, products, solutions and services remain potentially vulnerable to advanced and persistent threats. We also maintain and have access to sensitive, confidential or personal data or information in certain of our businesses that is subject to privacy and security laws and regulations. Despite our efforts to protect such sensitive, confidential or personal data or information, our facilities and systems and those of our customers and third-party service providers may be vulnerable to security breaches, theft, fraud, misplaced or lost data, “Acts of God”, programming and/or human errors that could lead to the compromising of sensitive, confidential or personal data or information, improper use of our systems, software solutions or networks, unauthorized access, use, disclosure, modification or destruction of information, defective products, production downtimes and operational disruptions, which in turn could adversely affect our consolidated financial condition and consolidated results of operations.
A loss of the services of the Company's executive officers or other skilled associates could negatively impact our operations and results.
The success of the Company's operations is largely dependent upon the performance of its executive officers, managers, engineers and salespeople. Many of these individuals have a significant number of years of experience within the Company and/or the industry in which we compete and would be extremely difficult to replace. The loss of the services of any of these associates may materially and adversely impact our results of operations if we are unable to replace them in a timely manner.
None.
Bel employs a full-time Cyber Security Expert who reports directly into our Senior Director of Global IT Services. During 2023, the Company worked with third-party cybersecurity companies to continually enhance the programs Bel has in place. These relationships involve regular communication and collaboration between the Bel cybersecurity team and our third-party providers to share threat intelligence and implement proactive measures to safeguard our systems and data. The Company has continued to invest in IT security, including additional end-user training, using layered defenses, identifying, and protecting critical assets, strengthening monitoring and alerting, and engaging experts. Our cybersecurity team regularly monitors alerts and meets to discuss threat levels, trends, and remediation. Further, we conduct periodic external penetration tests. In addition to assessing our own cybersecurity preparedness, we also consider and evaluate cybersecurity risks associated with the use of third-party service providers that host our applications. The internal business owners of the hosted applications are required to document user access reviews at least annually and provide from the vendor a System and Organization Controls (SOC) 1 or SOC 2 report. Third party contractors or vendors that require access to our network are given specific limited access to only the specific resource. The access provided expires automatically after a period determined by the project and must follow all Company security measures.
The Audit Committee of the Board of Directors is responsible for overseeing the management of cybersecurity risks. The Audit Committee is informed about cybersecurity risks through quarterly reports from the Senior Director of Global IT Services and, as necessary, to the full Board. The Audit Committee also reviews and approves the company’s cybersecurity policies and the Company’s Senior Director of Global IT Services is responsible for developing and implementing our information security program and reporting on cybersecurity matters to the Board. This includes our overall information security strategy, policy, security engineering, operations and cyber incident detection and response reporting in alignment with Company policies. The current Senior Director of Global IT Services has more than 15 years of information technology and program management experience which includes information security, and others on our IT security team have years of cybersecurity experience and certifications.
The Company is headquartered in Jersey City,West Orange, New Jersey, where it currently
The Company also
The following is a list of the locations of the Company's principal manufacturing facilities at December 31, 2017:
Location | Approximate Square Feet | Owned/ Leased | Percentage Used for Manufacturing | ||||||
| Dongguan, People's Republic of China | 650,000 | Leased | 28 | % | |||||
| Pingguo, People's Republic of China | 256,000 | Leased | 69 | % | |||||
| Shenzhen, People's Republic of China | 227,000 | Leased | 100 | % | |||||
| Zhongshan, People's Republic of China | 315,000 | Leased | 86 | % | |||||
| Zhongshan, People's Republic of China | 118,000 | Owned | 100 | % | |||||
| Zhongshan, People's Republic of China | 78,000 | Owned | 100 | % | |||||
| Louny, Czech Republic | 11,000 | Owned | 75 | % | |||||
| Dubnica nad Vahom, Slovakia | 35,000 | Owned | 100 | % | |||||
| Dubnica nad Vahom, Slovakia | 70,000 | Leased | 100 | % | |||||
| Worksop, United Kingdom | 52,000 | Leased | 28 | % | |||||
| Chelmsford, United Kingdom | 21,000 | Leased | 60 | % | |||||
| Dominican Republic | 41,000 | Leased | 85 | % | |||||
| Cananea, Mexico | 42,000 | Leased | 60 | % | |||||
| Reynosa, Mexico | 77,000 | Leased | 56 | % | |||||
| Inwood, New York | 39,000 | Owned | 40 | % | |||||
| Glen Rock, Pennsylvania | 74,000 | Owned | 60 | % | |||||
| Waseca, Minnesota | 124,000 | Leased | 83 | % | |||||
| McAllen, Texas | 40,000 | Leased | 56 | % | |||||
| Melbourne, Florida | 18,000 | Leased | 64 | % | |||||
| Tempe, Arizona | 8,000 | Leased | 100 | % | |||||
| 2,296,000 | |||||||||
Location | Approximate Square Feet | Product Group Produced at Facility | Owned/ Leased | Percentage Used for Manufacturing | |||||||
Dongguan, People's Republic of China | 661,000 | Magnetic Solutions | Leased | 36 | % | ||||||
Pingguo, People's Republic of China | 180,000 | Magnetic Solutions | Leased | 39 | % | ||||||
Shenzhen, People's Republic of China | 227,000 | Power Solutions & Protection | Leased | 100 | % | ||||||
Zhongshan, People's Republic of China | 77,000 | All three product groups | Leased | 100 | % | ||||||
Zhongshan, People's Republic of China | 118,000 | All three product groups | Owned | 100 | % | ||||||
Zhongshan, People's Republic of China | 78,000 | All three product groups | Owned | 100 | % | ||||||
Guangxi, People's Republic of China | 243,000 | Magnetic Solutions | Leased | 54 | % | ||||||
Mumbai, India | 56,000 | Power Solutions & Protection | Leased | 46 | % | ||||||
Dubnica nad Vahom, Slovakia | 35,000 | Power Solutions & Protection | Owned | 50 | % | ||||||
Dubnica nad Vahom, Slovakia | 70,000 | Power Solutions & Protection | Leased | 100 | % | ||||||
Worksop, United Kingdom | 51,000 | Connectivity Solutions | Leased | 28 | % | ||||||
Chelmsford, United Kingdom | 17,000 | Connectivity Solutions | Leased | 80 | % | ||||||
Dominican Republic | 33,000 | Magnetic Solutions | Leased | 85 | % | ||||||
Cananea, Mexico | 30,000 | Connectivity Solutions | Leased | 60 | % | ||||||
Reynosa, Mexico | 80,000 | Connectivity Solutions | Leased | 56 | % | ||||||
Glen Rock, Pennsylvania | 74,000 | Connectivity Solutions | Owned | 60 | % | ||||||
Waseca, Minnesota | 127,000 | Connectivity Solutions | Leased | 83 | % | ||||||
McAllen, Texas | 40,000 | Connectivity Solutions | Leased | 56 | % | ||||||
Melbourne, Florida | 13,000 | Connectivity Solutions | Leased | 64 | % | ||||||
| 2,210,000 | |||||||||||
Of the space described
above,The Territory of Hong Kong became a Special Administrative Region ("SAR") of the PRC during 1997.
The territory of Macao became a SAR of the PRC at the end of 1999. Management cannot presently predict what future impact, if any, this will have on the Company or how the political climate in the PRC will affect its contractual arrangements in the PRC. A significant portion of the Company's manufacturing operations and approximatelyThe information called for by this Item is incorporated herein by reference to the caption "Legal Proceedings" in Note 16, "Commitments19, "Commitments and Contingencies."
Not applicable.
Market Information |
The Company's voting Class A Common Stock, par value $0.10 per share, and non-voting Class B Common Stock, par value $0.10 per share ("Class A" and "Class B," respectively), are traded on the NASDAQ Global Select Market under the symbols BELFA and BELFB. The following table sets forth the high and low sales price range (as reported by The Nasdaq Stock Market Inc.) for the Common Stock on NASDAQ for each quarter during the past two years.
| Class A | Class B | |||||||||||||||
| High | Low | High | Low | |||||||||||||
| Year Ended December 31, 2017 | ||||||||||||||||
| First Quarter | $ | 26.54 | $ | 19.37 | $ | 33.00 | $ | 21.65 | ||||||||
| Second Quarter | 23.40 | 18.80 | 26.55 | 21.85 | ||||||||||||
| Third Quarter | 28.12 | 20.00 | 32.00 | 24.40 | ||||||||||||
| Fourth Quarter | 29.90 | 19.25 | 33.45 | 23.80 | ||||||||||||
| Year Ended December 31, 2016 | ||||||||||||||||
| First Quarter | $ | 15.87 | $ | 9.69 | $ | 19.15 | $ | 13.33 | ||||||||
| Second Quarter | 17.16 | 12.80 | 19.35 | 13.31 | ||||||||||||
| Third Quarter | 20.47 | 15.00 | 24.43 | 16.98 | ||||||||||||
| Fourth Quarter | 26.97 | 18.27 | 33.60 | 23.00 | ||||||||||||
Holders |
As of February 28, 2018,29, 2024, there were 47were 34 registered shareholders of the Company's Class A Common Stock and 378317 registered shareholders of the Company's Class B Common Stock. AsWe believe that the number of February 28, 2018,beneficial owners is substantially greater than the Company estimates that there were 568 beneficial shareholdersnumber of the Company'srecord holders because a large portion of our Class A Common Stock and 2,258 beneficial shareholders of the Company's Class B Common Stock.Stock is held in "street name" by brokers. At February 28, 2018,29, 2024, to the Company's knowledge, there was one shareholder of the Company's Class A common stock whose voting rights were suspended. This shareholder owned 23.2%16.7% of the Company's outstanding shares of Class A common stock. For additional discussion, see Item 1A – "Risk"Risk Factors – As a result of protective provisions in the Company's restated certificate of incorporation, as amended, the voting power of certainholders of Class A common shares whose voting rights are not suspended (including officers, directors and principal shareholdersshareholders) may be increased at future meetings of the Company's shareholders".
Dividends |
During the years ended December 31, 2017, 20162023 and 2015,2022, the Company declared dividends on a quarterly basis at a rate of $0.06 per Class A share of common stock and $0.07 per Class B share of common stock totaling $3.3$3.5 million in 2023 and $3.4 million in 2017 and $3.2 million during each of 2016 and 2015. There are no contractual restrictions on the Company's ability to pay dividends provided the Company is not in default under its credit agreements immediately before such payment and after giving effect to such payment.2022. On February 1, 2018,2024, the Company paid a dividend to all shareholders of record at January 15, 20182024 of Class A and Class B Common Stock in the total amount of $0.1 million ($0.06 per share) and $0.7 million ($0.07 perper share), respectively. On February 21, 2018, 2024, Bel's Board of Directors declared a dividend in the amount of $0.06 per Class A common share and $0.07 per Class B common share which is scheduled to be paid on May 1, 20182024 to all shareholders of record at April 13, 2018. The Company currently anticipates paying dividends quarterly in the future.
There are no contractual restrictions on the same date in: (a)Company's ability to pay dividends provided the NASDAQ Stock Market (U.S. Companies)Company is not in default under its credit agreement immediately before such payment and (b) a groupafter giving effect to such payment. Cash dividends are payable to the holders of companies within our industry. Total return for each assumed investment assumes the reinvestment of all dividends on December 31 of the year in which the dividends were paid.
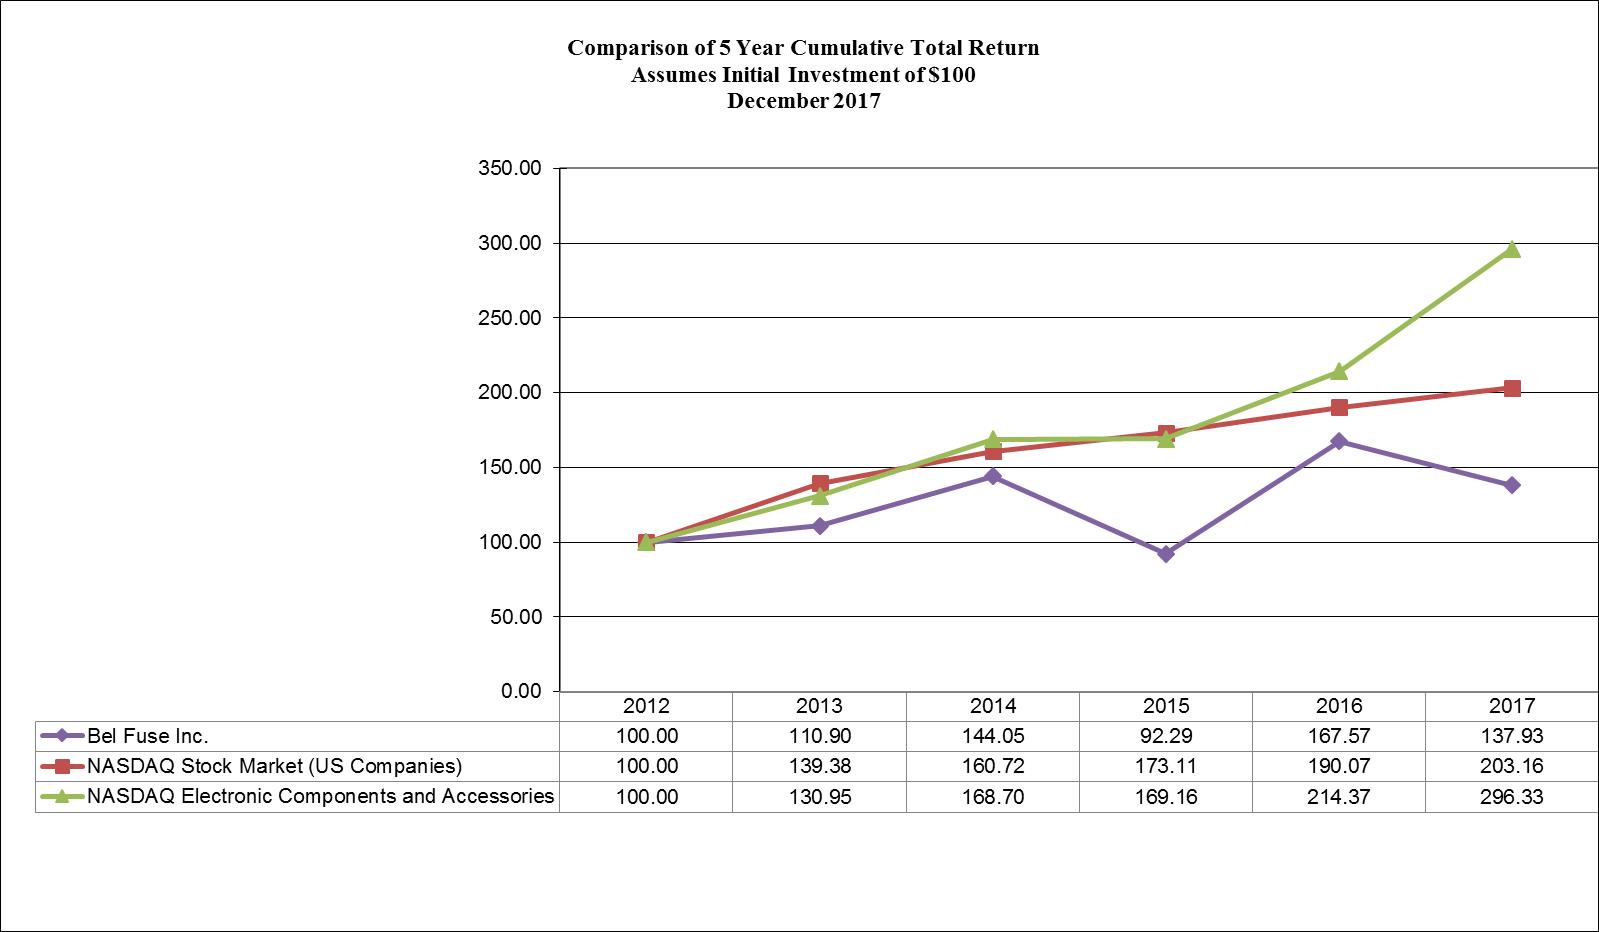
| Period | Total Number of Shares Purchased | Average Price Paid per Share | Total Number of Shares Purchased as Part of Publicly Announced Plans or Programs | Approximate Dollar Value of Shares that May Yet Be Purchased Under the Plan | ||||||||||||
| October 1 - October 31, 2017 | 10,188 | $ | 28.32 | 10,188 | $ | 260,029 | ||||||||||
| November 1 - November 30, 2017 | 4,966 | 22.96 | 4,966 | 146,026 | ||||||||||||
| December 1 - December 31, 2017 | 6,435 | 22.49 | 6,435 | - | ||||||||||||
| Total | 21,589 | $ | 25.35 | 21,589 | $ | - | ||||||||||
Stock Performance Graph |
Not applicable.
Issuer Purchases of Equity Securities
The following table above were made undersummarizes the 10b5-1 Plan. The maximum dollar amount for cumulative purchases under the 10b5-1 Planactivity related to repurchases of our equity securities during the plan period (September 14, 2017 to February 15, 2018) will not exceed $650,000. At December 31, 2017, there were no further shares available for purchase under the 10b5-1 Plan, as the maximum dollar amount for cumulative purchases had been met.
| Years Ended December 31, | ||||||||||||||||||||
| 2017 | 2016 | 2015 | 2014 | 2013 | ||||||||||||||||
| (In thousands of dollars, except per share data) | ||||||||||||||||||||
| Selected Consolidated Statements of Operations Data: (a) | ||||||||||||||||||||
| Net sales | $ | 491,611 | $ | 500,153 | $ | 567,080 | $ | 487,076 | $ | 349,189 | ||||||||||
| Cost of sales | 389,601 | 400,245 | 458,253 | 399,721 | 286,952 | |||||||||||||||
| Selling, general and administrative expenses | 85,067 | 71,005 | 77,952 | 72,061 | 45,872 | |||||||||||||||
| Impairment of goodwill and other intangible assets (b) | - | 105,972 | - | - | - | |||||||||||||||
| Loss (gain) on sale of property, plant and equipment (c) | 297 | (2,644 | ) | 161 | (10 | ) | (69 | ) | ||||||||||||
| Stock-based compensation | 3,030 | 2,817 | 2,815 | 2,717 | 1,879 | |||||||||||||||
| Restructuring charges (d) | 308 | 2,087 | 2,114 | 1,832 | 1,387 | |||||||||||||||
| Earnings (loss) before income taxes | 9,643 | (82,552 | ) | 25,732 | 9,770 | 15,165 | ||||||||||||||
| Net (loss) earnings | $ | (11,897 | ) | $ | (64,834 | ) | $ | 19,197 | $ | 8,603 | $ | 15,908 | ||||||||
| Reconciliation of net earnings to EBITDA (e): | ||||||||||||||||||||
| Net (loss) earnings | $ | (11,897 | ) | $ | (64,834 | ) | $ | 19,197 | $ | 8,603 | $ | 15,908 | ||||||||
| Depreciation and amortization (f) | 20,718 | 21,778 | 23,008 | 20,367 | 12,382 | |||||||||||||||
| Interest expense | 6,802 | 6,662 | 7,588 | 3,978 | 156 | |||||||||||||||
| Income tax provision (benefit) (g) | 21,540 | (17,718 | ) | 6,535 | 1,167 | (743 | ) | |||||||||||||
| EBITDA (e) | $ | 37,163 | $ | (54,112 | ) | $ | 56,328 | $ | 34,115 | $ | 27,703 | |||||||||
| Net (loss) earnings per share: | ||||||||||||||||||||
| Class A common share - basic and diluted | $ | (0.97 | ) | $ | (5.25 | ) | $ | 1.53 | $ | 0.69 | $ | 1.32 | ||||||||
| Class B common share - basic and diluted | $ | (0.99 | ) | $ | (5.48 | ) | $ | 1.64 | $ | 0.75 | $ | 1.41 | ||||||||
| Cash dividends declared per share: | ||||||||||||||||||||
| Class A common share | $ | 0.24 | $ | 0.24 | $ | 0.24 | $ | 0.24 | $ | 0.24 | ||||||||||
| Class B common share | $ | 0.28 | $ | 0.28 | $ | 0.28 | $ | 0.28 | $ | 0.28 | ||||||||||
| As of December 31, | ||||||||||||||||||||
| 2017 | 2016 | 2015 | 2014 | 2013 | ||||||||||||||||
| (In thousands of dollars, except percentages) | ||||||||||||||||||||
| Selected Consolidated Balance Sheet Data and Ratios: | ||||||||||||||||||||
| Cash and cash equivalents | $ | 69,354 | $ | 73,411 | $ | 85,040 | $ | 77,138 | $ | 62,123 | ||||||||||
| Working capital (h) | 178,799 | 163,115 | 158,619 | 183,459 | 134,179 | |||||||||||||||
| Goodwill | 20,177 | 17,951 | 121,634 | 118,369 | 18,490 | |||||||||||||||
| Total assets (h) | 431,265 | 426,740 | 578,505 | 630,372 | 308,141 | |||||||||||||||
| Total debt (h) | 122,694 | 141,245 | 183,548 | 227,576 | - | |||||||||||||||
| Stockholders' equity | 157,960 | 158,434 | 233,122 | 224,273 | 228,702 | |||||||||||||||
| Return on average total assets (h)(i) | -2.8 | % | -13.9 | % | 3.0 | % | 1.8 | % | 5.4 | % | ||||||||||
| Return on average stockholders' equity (i) | -7.2 | % | -38.6 | % | 8.2 | % | 3.8 | % | 7.3 | % | ||||||||||
Total Number of Shares Purchased (1) | Average Price Paid per Share(1) | Total Number of Shares Purchased as Part of Publicly Announced Plans or Programs | Approximate Dollar Value of Shares that May Yet Be Purchased Under the Plans or Programs(2) | |||||||||||||
October 1, 2023 – October 31, 2023 | - | $ | - | - | (2) | |||||||||||
November 1, 2023 – November 30, 2023 | - | - | - | (2) | ||||||||||||
December 1, 2023 – December 31, 2023 | 2,000 (Class B)(1) | 52.60 | (1) | - | (2) | |||||||||||
Total | 2,000 (Class B)(1) | $ | 52.60 | (1) | - | (2) | ||||||||||
(1) | Represents 2,000 shares of |
(2) | As the relevant authorization and |
Item 7. Management's Discussion and Analysis of Financial Condition and Results of Operations
The information in this MD&A should be read in conjunction with the Company's consolidated financial statements and the notes related thereto. The discussion of results, causes and trends should not be construed to
imply any conclusion that such results, causes or trends will necessarily continue in the future. SeeThe Company has been (and is for purposes of this Form 10-K) a “smaller reporting company” under applicable SEC rules and regulations, permitting the Company to use the scaled disclosure requirements applicable to smaller reporting companies, including a reduced number of years covered by the consolidated financial statements in Item 8. As a result of the measurement of the Company’s public float as of the June 30, 2023 determination date, the Company will no longer qualify as a smaller reporting company. However, pursuant to Rule 12b-2 of the Securities Exchange Act of 1934, as amended, the Company is not required to reflect the change in its smaller reporting company status or comply with the non-scaled disclosure obligations until the Company’s first quarterly report on Form 10-Q for the quarter ending March 31, 2024. In accordance with applicable rules, the Company is permitted to use the scaled disclosure requirements applicable to smaller reporting companies in this Form 10-K and has elected to do so. See the “Explanatory Note” on the cover page of this Form 10-K.
Overview
Our Company
We design, manufacture and market a broad array of products that power, protect and connect electronic circuits. These products are primarily used in the networking, telecommunications, computing, general industrial, high-speed data transmission, military, commercial aerospace, transportation and broadcastingeMobility industries. Bel's portfolio of products also finds application in the automotive, medical, broadcasting and consumer electronics markets.
We operate through three geographic segments: North America, Asia and Europe.product group segments, in addition to a Corporate segment. In 2017, 50%2023, 49% of the Company's revenues were derived from North America, 34%Power Solutions and Protection, 33% from AsiaConnectivity Solutions and 16%18% from its Europeour Magnetic Solutions operating segment. By product group, 35% of 2017 sales related to the Company's connectivity solutions products, 33% in magnetic solutions products and 32% in power solutions and protection products.
Our operating expenses are driven principally by the cost of labor where the factories that Bel uses are located, the cost of the materials that we use and our ability to effectively and efficiently manage overhead costs. As labor and material costs vary by product line and region, any significant shift in product mix can have an associated impact on our costs of sales. Costs are recorded as incurred for all products manufactured. Such amounts are determined based upon the estimated stage of production and include labor cost and fringes and related allocations of factory overhead. Our products are manufactured at various facilities in the U.S., Mexico, India, the Dominican Republic, England, Czech Republic,the United Kingdom, Slovakia and the PRC.
We have little visibility into the ordering habits of our customers and we can be subjected to large and unpredictable variations in demand for our products. Accordingly, we must continually recruit and train new workers to replace those lost to attrition and be able to address peaks in demand that may occur from time to time. These recruiting and training efforts and related inefficiencies, and overtime required in order to meet any increase in demand, can add volatility to the labor costs incurred by us.
The Company believes the key factors affecting Bel's 20172023 and/or future results include the following:
• | Revenues |
| • | Backlog – Our backlog of orders totaled $373.1 million at December 31, 2023, representing a decrease of $192.3 million, or 34%, from December 31, 2022. From 2022 to the 2023 year-end, the backlog for our Power Solutions and Protection products decreased by 37%, due to a reduction in |
• | Product Mix – Material and labor costs vary by product line and any significant shift in product mix between higher- and lower-margin product lines will have a corresponding impact on the |
Pricing and Availability of Materials – |
• | Labor Costs – Labor costs |
| • | Inflationary Pressures – Inflationary pressures could result in higher input costs, including those related to our raw materials, labor, freight, utilities, healthcare and other expenses. Our future operating results will depend, in part, on our continued ability to manage these fluctuations through pricing actions, cost savings initiatives and sourcing decisions. |
| • | Restructuring – During the third quarter of 2022, a series of initiatives were launched to streamline our operational footprint. Within our Magnetic Solutions group, our previously announced facility consolidation efforts in China were completed during the fourth quarter of 2023. Further, during 2023, we completed the transitions of our Tempe, Arizona and Sudbury, UK sites, moving those operations into other existing Bel facilities. The initiative related to our Connectivity site in Melbourne, Florida is substantially complete, with the final elements of the transition of these manufacturing operations to our existing site in Waseca, Minnesota scheduled for the first quarter of 2024. Aggregate annual cost savings related to the four facility consolidations announced in 2022 were estimated at $6.9 million, with full savings to be realized beginning in the first quarter of 2024. In a new restructuring initiative implemented in the fourth quarter of 2023, also within the Connectivity segment, certain manufacturing will transition from our Glen Rock, Pennsylvania facility to other existing Bel sites (the “Glen Rock initiative”) at an estimated cost to implement of $0.5 million. We anticipate estimated annualized cost savings of approximately $1.0 million |
• | Impact of Foreign Currency – |
• | Potential Future Impacts of COVID – The Company continues to be focused on the safety and well-being of its associates around the world in light of COVID and the variants of COVID that have followed. The combination of protective measures at our factories coupled with remote work arrangements have enabled us to maintain operations, including financial reporting systems, internal controls over financial reporting and disclosure controls and procedures. We have not experienced a negative impact on our liquidity to date as a result of the COVID pandemic. Our balance of cash on hand and held to maturity investments in U.S. Treasury securities continues to be strong at an aggregate amount of $126.9 million at December 31, 2023 as compared to $70.3 million at December 31, 2022. The Company also has availability under its current revolving credit facility; as of December 31, 2023, the Company could borrow an additional $115 million while still being in compliance with its debt covenants. COVID remains a potential supply continuity risk due to the unknown nature of future outbreaks including potential further variants. For additional information, see Item 1A -"Risk Factors - Our global operations and demand for our products face risks related to health epidemics such as the coronavirus." Our statements regarding the potential future impact of COVID represent Forward-Looking Statements. See “Cautionary Notice Regarding Forward-Looking Information.” |
| • | Effective Tax Rate – The Company's effective tax rate will fluctuate based on the geographic |
As our focus on streamlining the organization continues its momentum with reaching material milestones achieved, we will reemphasize and dedicate our focus on top priority for 2018 is growingline growth. We expect 2024 to start slow, with indications of a possible rebound in the Company's top line. Overall,second half of the Company's backlog increased to $146.5 million at December 31, 2017, which represents a 29% increase from its level at December 31, 2016. While we are unable to predictyear as inventory in the effect that this increase will ultimately have on 2018 sales, it is a good barometer that we are well positioned for organic growth in future periods. In addition, our new credit facility, coupled with availability of foreign earnings provided for with the transition tax, will enable future acquisitions to be a key component of our growth strategy should appropriate opportunities arise.supply channel normalizes. The preceding discussionssentences represent Forward-Looking Statements. See "Cautionary"Cautionary Notice Regarding Forward-Looking Statements.Information."
Results of Operations - Summary by Operating Segment
| 2017 | 2016 | 2015 | ||||||||||||||||||||||
| North America | $ | 245,834 | 50 | % | $ | 256,760 | 51 | % | $ | 304,328 | 54 | % | ||||||||||||
| Asia | 167,680 | 34 | % | 168,458 | 34 | % | 188,146 | 33 | % | |||||||||||||||
| Europe | 78,097 | 16 | % | 74,935 | 15 | % | 74,606 | 13 | % | |||||||||||||||
| $ | 491,611 | 100 | % | $ | 500,153 | 100 | % | $ | 567,080 | 100 | % | |||||||||||||
| 2017 | 2016 | 2015 | ||||||||||
| Total segment sales: | ||||||||||||
| North America | $ | 257,541 | $ | 268,935 | $ | 329,304 | ||||||
| Asia | 249,506 | 256,202 | 295,751 | |||||||||
| Europe | 89,765 | 86,750 | 148,735 | |||||||||
| Total segment sales | 596,812 | 611,887 | 773,790 | |||||||||
| Reconciling item: | ||||||||||||
| Intersegment sales | (105,201 | ) | (111,734 | ) | (206,710 | ) | ||||||
| Net sales | $ | 491,611 | $ | 500,153 | $ | 567,080 | ||||||
| Income (loss) from operations: | ||||||||||||
| North America | $ | 5,147 | $ | (35,722 | ) | $ | 11,012 | |||||
| Asia | 8,964 | (24,360 | ) | 8,175 | ||||||||
| Europe | 2,227 | (16,430 | ) | 9,413 | ||||||||
| $ | 16,338 | $ | (76,512 | ) | $ | 28,600 | ||||||
Net Sales Power Solutions and Protection, below. North America sales were also impacted by lower military spending for our connectivity solutions products and reduced sales through distributors. The decline in Asia segment sales in 2016 noted in the table above resulted from a reduction in customer demand for our integrated connector module (ICM) and TRP products in 2016 (producing a $10.6 million reduction in sales), as well as a $6.1 million decrease in sales of our DC/DC products.
The Company's net sales and gross margin by major product line for the years ended December 31, 2017, 20162023 and 20152022 were as follows (dollars in thousands):
| Years Ended | ||||||||||||||||||||||||
| December 31, | ||||||||||||||||||||||||
| 2017 | 2016 | 2015 | ||||||||||||||||||||||
| Connectivity solutions | $ | 170,337 | 35 | % | $ | 168,845 | 34 | % | $ | 181,697 | 32 | % | ||||||||||||
| Magnetic solutions | 161,011 | 33 | % | 155,232 | 31 | % | 166,182 | 29 | % | |||||||||||||||
| Power solutions and protection | 160,263 | 32 | % | 176,076 | 35 | % | 219,201 | 39 | % | |||||||||||||||
| $ | 491,611 | 100 | % | $ | 500,153 | 100 | % | $ | 567,080 | 100 | % | |||||||||||||
Years Ended | ||||||||||||||||
December 31, | ||||||||||||||||
Net Sales | Gross Margin | |||||||||||||||
| 2023 | 2022 | 2023 | 2022 | |||||||||||||
Power Solutions and Protection | $ | 314,105 | $ | 288,366 | 38.1 | % | 30.5 | % | ||||||||
Connectivity Solutions | 210,572 | 187,085 | 34.2 | % | 25.9 | % | ||||||||||
Magnetic Solutions | 115,136 | 178,782 | 22.0 | % | 27.6 | % | ||||||||||
| $ | 639,813 | $ | 654,233 | 33.7 | % | 28.0 | % | |||||||||
Power Solutions and Protection:
Sales of our Power Solutions and Protection products were higher by $25.7 million in power solutions and protection products during 20172023 as compared to 20162022. This increase was primarily attributabledue to a $15.8 million reduction in Power Solutions sales. The year-over-year sales comparisons within the Power Solutions business continues to be impacted by the phase-out of revenue associated with its NPS product line (sold in 2015), as we transition off of a 2-year manufacturing services agreement. This accounted to $10.1 million of the decline in sales from 2016. Following nine consecutive quarters of year-over-year declines, fourth quarter sales within our Power Solutions business were 6% higher compared to the same quarter of 2016, excluding the effects of the NPS divestiture. The year-over-year decline from Power Solutions was partially offset by a $3.1 million increase in sales of our AC/DC converterfront-end power products at our Bel Power Europe groupand board mount power products of $42.7 million and $6.9 million, respectively, both of which are used in Italy (acquired in 2012)networking and higher circuit protection productdatacenter applications. Further, sales of $1.2product into the eMobility end market increased by more than $7.5 million (40%) and sales of product into the rail end market increased by $7.5 million (33%) in 20172023 as compared to 2016.
Connectivity Solutions:
Sales of our Connectivity Solutions products increased by $23.5 million (12.6%) in 2023 as compared to 2022. These increases were primarily due to an increase in sales into the commercial aerospace sector, which remained solid throughout 2016.
Magnetic Solutions:
Sales of our Magnetic Solutions products declined by $63.6 million during 2023 as compared to 2022. Reduced demand for our ICM/TRPMagnetic Solutions products duefrom our networking customers and through our distribution channels has been the primary driver as we believe these customers continue to work through inventory on hand. The lower sales volume and favorable exchange rates with the continued weakness inChinese Renminbi versus the macro environment during 2016. This resulted in a decreaseU.S. dollar, was the primary driver of $10.6 million in sales related to these products as compared to 2015 volumes.
Cost of sales as a percentage of net sales for the three years ended December 31, 20172023 and 2022 consisted of the following:
| Years Ended | ||||||||||||
| December 31, | ||||||||||||
| 2017 | 2016 | 2015 | ||||||||||
| Material costs | 40.2 | % | 41.6 | % | 43.6 | % | ||||||
| Labor costs | 10.8 | % | 10.3 | % | 10.7 | % | ||||||
| Research and development expenses | 5.9 | % | 5.3 | % | 4.9 | % | ||||||
| Other expenses | 22.3 | % | 22.8 | % | 21.6 | % | ||||||
| Total cost of sales | 79.2 | % | 80.0 | % | 80.8 | % | ||||||
Years Ended | ||||||||
December 31, | ||||||||
2023 | 2022 | |||||||
Material costs | 40.8 | % | 45.4 | % | ||||
Labor costs | 6.6 | % | 8.3 | % | ||||
Other expenses | 18.9 | % | 18.3 | % | ||||
Total cost of sales | 66.3 | % | 72.0 | % | ||||
Material costs as a percentage of sales were lower during 2017 as2023 came down compared to 2016, primarily due2022, as pricing actions helped to offset the decline in sales within our power solutions and protection group, as those products carry a higher material content than our other product lines.
The other expenses noted in the table above include fixed cost items such as support labor and Foreign Currency Exchange" below for further information.
Research and Development ("R&D)
R&D expenses of $28.8 million, $26.7were $22.5 million and $27.7$20.2 million for the years ended December 31, 2017, 20162023 and 2015,2022, respectively. The increase noted in R&D expense in 2017 related to an increase in design work from our power solutions and protection group and a full year of cost of our R&D center in Taiwan which opened in August 2016. The reduction in R&D expense from 2015 to 2016 was primarilyexpenses during 2023 is largely due to lower fixed costs resulting from R&D facility consolidations.
Selling, General and Administrative Expenses ("SG&A")
SG&A expenses increased by $14.1were $99.1 million in 20172023 as compared with $92.3 million in 2022. Within SG&A, increases in salaries and fringe benefits of $6.1 million, legal and professional fees of $2.4 million, and travel of $1.0 million were partially offset by a $1.3 million reduction in commissions to outside sales representatives, and a $1.2 million reduction in depreciation and amortization as compared to 2016, primarily due to foreign currency exchange fluctuations, incremental costs from our ERP implementation, and non-recurring benefits2022.
Restructuring Charges
The Company recorded $10.1 million of restructuring charges in 2023 largely in connection with the four facility consolidation projects in the 2016 period. Foreign exchange lossesU.S., UK and PRC, as further described in "Overview - Key Factors Affecting our Business - Restructuring" above. In 2022, the Company recorded $7.3 million of $2.8restructuring charges related to these same initiatives.
Gain on Sale of Properties
During 2023, the Company recorded a gain of $3.8 million related to the sale of one of its properties in 2017 compared with foreign exchange gainsJersey City, New Jersey. In 2022, a gain of $3.1$1.6 million in 2016 resulted in an unfavorable year-over-year variance of $5.9 million. The Company's ERP implementation was ongoing throughout the full year of 2017, and as a result, consulting costs were $2.2 million higher than 2016. During 2016, SG&A benefited from a reversal of certain value-added and business tax items recorded in connection with the acquisitionsale of Power Solutions of $5.2 million.
Interest Expense
The Company incurred interest expense of $6.8$2.9 million in 2017, $6.72023 and $3.4 million in 2016 and $7.6 million in 20152022 primarily due to ourits outstanding borrowings under the Company's credit and security agreement used to fund the 2014 Acquisitions.agreement. The increasereduction in interest expense during 20172023 related to the acceleration of $1.0 million of deferred financing costs in connection with the refinancing of our credit facility in the fourth quarter of 2017, partially offset by a reduction in interest expense due to a lower debt balance throughout 20172023 as compared to 2016. The decline in interest expense in 2016 compared to 2015 was due to mandatory and voluntary repayments made in 2016.2022. See "Liquidity"Liquidity and Capital Resources" and Note 10, "Debt,11, "Debt" for further information on the Company's outstanding debt.
Other Income/Expense, Net
Other income/expense, net was a net expense of $2.8 million in 2023 compared to a net expense of $2.7 million in 2022. The net expense in 2023 was comprised of a foreign exchange loss of $1.4 million, the loss on liquidation of a foreign subsidiary of $2.7 million, $0.8 million of losses associated with Bel's investment in innolectric and $0.8 million of other expense; partially offset by $1.7 million of interest income and a gain of $1.2 million related to the Company's SERP investments. The net expense in 2022 was comprised of a loss of $2.2 million in 2022 related to the Company's SERP investments and $1.0 million of other expense; partially offset by foreign exchange gains of $0.3 million and $0.2 million of interest income.
Income Taxes
The Company'sCompany’s effective tax rate will fluctuate based on the geographic segmentregions in which the pretax profits are earned. Of the geographic segmentsjurisdictions in which the Company operates, the U.S. has the highest tax rates; Europe'sand Europe’s tax rates are generally lower than U.S. tax rates;equivalent; and Asia has the lowest tax rates of the Company'sCompany’s three geographical segments.geographic regions. See Note 9, "Income Taxes" and the "Tax Reform" discussion below.
2023 as Compared to as the Tax Cuts and Jobs Act (the "Tax Act"). 2022
The Tax Act significantly revises the U.S. corporateprovision for income tax law by, among other things, lowering the corporate income tax rate from 35% to 21% and imposing a one-time deemed repatriation tax on untaxed accumulated foreign earnings.
The Company has a portion of its products manufactured on the mainland of the PRC where Bel is not subject to corporate income tax on manufacturing services provided by third parties. Hong Kong has a territorial tax system which imposes corporate income tax at a rate of 16.5% on income from activities solely conducted in Hong Kong.
The Company holds an offshore business license from the government of Macao. With this license, a Macao offshore company named Bel Fuse (Macao Commercial Offshore) Limited has been established to handle the Company'sCompany’s sales to third-party customers in Asia. Sales by this company primarily consist of products manufactured in the PRC. This company is not subject toThe Macao corporate profit taxes which are imposed atimposes a tax rate of 12%. Additionally, the Company established TRP International, a China Business Trust ("CBT"), when it acquired the TRP group, as previously discussed. Sales by the CBT consists of products manufactured in the PRC and sold to third-party customers inside and outside of Asia. The CBT is not subject to PRC income taxes, which are generally imposed at a tax rate of 25%.
Due to its direct Hong Kong parent Transpower Technologies (Hong Kong) Ltd. Applicable income and dividend withholding taxes have been reflected in the accompanying consolidated statementspracticality of operations fordetermining the year ended December 31, 2017. However, U.S. deferred taxes need not be provided on these or the majority of the remaining earnings of foreign subsidiaries as we are currently analyzingoutside basis differences in our global working capital and cash requirements and the potential tax liabilities attributable to a repatriation, including calculating any excess of the amount for financial reporting over the tax basisinvestments in our foreign subsidiaries, management has not provided for deferred taxes on outside basis differences at December 31, 2023 and have yet to determine whether we plan to repatriate earnings and profits in the future.
Inflation and Foreign Currency Exchange
During the past threetwo years, we do not believe the effect of inflation on our consolidated financial position and results of operations was material to our consolidated financial position or our consolidated results of operations. We are exposed to market risk from changes in foreign currency exchange rates. Fluctuations of the U.S. dollar against other major currencies have not significantly affected our foreign operations as most sales continue to be denominated in U.S. dollars or currencies directly or indirectly linked to the U.S. dollar. Most significant expenses, including raw materials, labor and manufacturing expenses, are incurred primarily in U.S. dollars, Mexican pesos, or the Chinese renminbi, and to a lesser extent in British pounds, or Indian rupees. The Mexican pesos appreciated by 12%, Euro appreciated by 3%, British pound appreciated by 1%, the Indian rupee and Mexican pesos. The Chinesethe Chinese renminbi each depreciated by approximately 2%5% versus the U.S. dollar in 2017 as2023 compared to 2016 and the Mexican peso depreciated by 1% in 2017 as compared to 2016 .2022. To the extent the renminbi or peso appreciate in futurefuture periods, it could result in the Company's incurring higher costs for most expenses incurred in the PRC and Mexico. The Company periodically uses foreign currency forward contracts to manage its short-term exposures to fluctuations in operational cash flows resulting from changes in foreign currency exchange rates as further described in Note 13, "Derivative Instruments and Hedging Activities". The Company's European entities, whose functional currencies are euros,Euros and British pounds, and Czech korunas, enter into transactions which include sales that are denominated principally in euros,Euros, British pounds and various other European currencies, and purchases that are denominated principally in U.S. dollars and British pounds. Such transactions, as well as those related to our multi-currency intercompany payable and receivable transactions, resulted in a net realized and unrealized currency exchange (losses) gains loss of ($2.8)$1.4 million $3.1in 2023 and a gain of $0.3 million and $5.1 million for the years ended December 31, 2017, 2016 and 2015, respectively,
Liquidity and Capital Resources
Our primaryprincipal sources of liquidity include $89.4 million of cash are the collectionand cash equivalents at December 31, 2023, $37.5 million of trade receivables generated from the sales of our productsheld to maturity investments in U.S. Treasury securities, cash provided by operating activities and services to our customers and amountsborrowings available under our existing lines of credit, including our credit facility. Our primary uses of cash are paymentsWe expect to use this liquidity for operating expenses, investments in working capital, capital expenditures, interest, taxes, dividends, debt obligations and other long-term liabilities. We believe that our current liquidity position and future cash flows from operations will enable us to fund our operations, including all of the items mentioned aboveboth in the next twelve months.months and in the longer term.
Cash Flow Summary
During the year ended December 31, 2023, the Company's cash and cash equivalents increased by $19.1 million. This increase was primarily due to the following:
| • | net cash provided by operating activities of $108.3 million; | |
| • | proceeds from the sale of property, plant and equipment of $6.0 million; | |
| • | proceeds from held to maturity securities of $19.9 million; and | |
| • | proceeds from the sale of our business in the Czech Republic of $5.1 million; partially offset by | |
| • purchases of held to maturity and marketable securities of $60.0 million; | ||
| • payments for our equity method investment in innolectric of $10.3 million; | ||
• purchases of property, plant and equipment of $12.1 million; |
• dividend payments of $3.5 million; and |
• net repayments under our revolving credit line of $35.0 million. |
During the year ended December 31, 2022, the Company's cash and cash equivalents increased by $8.5 million. This increase was primarily due to cash provided by operating activities of $40.3 million, and proceeds from the sale of property, plant and equipment of $1.8 million; partially offset by the purchase of property, plant and equipment of $8.8 million, dividend payments of $3.4 million, and repayments under our revolving credit line of $17.5 million.
During the year ended December 31, 2023, accounts receivable decreased $22.5 million primarily due to the lower sales volume in the second half of 2023 as compared to the same period of 2022. Days sales outstanding (DSO) decreased to 55 days at December 31, 2023 from 58 days at December 31, 2022. Inventories decreased by $33.6 million from the December 31, 2022 level. Inventory turns, excluding R&D, were 3.1 times for the year ended December 31, 2023 and 2.7 times for the year ended December 31, 2022.
Cash and cash equivalents, held to maturity U.S. Treasury securities and accounts receivable comprised approximately 36.9% and31.7% of the Company's total assets at December 31, 2023 and December 31, 2022, respectively. The Company's current ratio (i.e., the ratio of current assets to current liabilities) was 3.4 to 1 and 2.8 to 1 at December 31, 2023 and December 31, 2022, respectively. At December 31, 20172023 and 2016, $50.52022, $40.9 million and $61.1$50.1 million, respectively (or 73%46% and 83%71%, respectively), of cash and cash equivalents was held by foreign subsidiaries of the Company. Management is currently analyzingDuring 2023, the Company repatriated $47.2 million of funds from outside of the U.S., with minimal incremental tax liability. We continue to analyze our global working capital and cash requirements and the potential tax liabilities attributable to further repatriation, and we have yet to determine whether we plan to repatriate thesemake any further determination regarding repatriation of funds from outside the U.S. to fund the Company's U.S. operations in the future. In the event these funds were needed for Bel's U.S. operations, the Company would be required to accrue and pay U.S. state taxes and any applicable foreign withholding taxes to repatriate these funds.
Future Cash Requirements
The Company expects foreseeable liquidity and capital resource requirements to be met through its existing cash and cash equivalents, held to maturity investments in U.S. Treasury securities and anticipated cash flows from operations, as well as borrowings available under its revolving credit facility, if needed. The Company's material cash requirements arising in the normal course of business primarily include:
Debt Obligations and Interest Payments - The Company had $60 million outstanding under its revolving credit facility at December 31, 2023, as further described below and in Note 11, "Debt". There are no mandatory principal payments due on the credit facility borrowings during 2024. The current balance of $60 million is due upon expiration of the credit facility on September 1, 2026. Anticipated interest payments due amount to $10.7 million, of which $4.0 million is expected to be paid in 2024 based on our debt balance and interest rate in place at December 31, 2023.
Lease Obligations - The Company has operating leases for its facilities used for manufacturing, research and development, sales and administration. There are also operating and finance leases related to manufacturing equipment, office equipment and vehicles. As of December 31, 2023, the Company was contractually obligated to pay future operating lease payments of $22.6 million, of which $6.7 million is expected to be paid in 2024, and future financing lease obligations of $2.1 million, of which $0.7 million is expected to be paid in 2024. See "Income Taxes" aboveNote 18,"Leases," for further details.
Purchase Obligations - The Company submits purchase orders for raw materials to various vendors throughout the year for current production requirements, as well as forecasted requirements. Certain of these purchase orders relate to special purpose material and, as such, the Company entered intomay incur penalties if an order is cancelled. The Company had outstanding purchase orders related to raw materials in the amount of $57.7 million at December 31, 2023, of which $50.6 million is expected to be paid in 2024. The Company also had outstanding purchase orders related to capital expenditures which totaled $5.8 million at December 31, 2023, all of which is expected to be paid in 2024.
Pension Benefit Obligations - As further described in Note 15, "Retirement Fund and Profit Sharing Plan", the Company maintains a senior CreditSupplemental Executive Retirement Plan ("SERP"). At December 31, 2023, estimated future obligations under the plan amounted to $19.5 million. It is expected that the Company will pay $0.8 million in benefit payments in connection with the SERP during 2024. Included in other assets at December 31, 2023 is the cash surrender value of company-owned life insurance and Security Agreement,marketable securities held in a rabbi trust with an aggregate value of $15.4 million, which was subsequently amendedhas been designated by the Company to be utilized to fund the Company's SERP obligations.
Dividends - The Company has historically paid quarterly dividends on its two classes of common stock, which amounted to $3.5 million in March 2016,2023 as compared to $3.4 million in 2022. Consistent with the dividend rates declared in prior years, Bel's Board of Directors declared dividends on November 1, 2023 and further amendedagain on February 21, 2024 on each of our two classes of common stock. These two quarterly payments will be made in the first half of 2024 in the total anticipated amount of $1.7 million.
Share Repurchase Program - In February 2024, Bel's Board of Directors authorized the repurchase of up to $25 million of the Company's common stock. The Repurchase Program does not obligate the Company to repurchase any dollar amount or number of shares, and refinancedthe Repurchase Program may be suspended or terminated at any time. The timing and actual number of shares repurchased will depend on a variety of factors including price, market conditions, corporate and regulatory requirements and the consideration of other uses of cash including other investment opportunities.
Tax Payments - At December 31, 2023, we had liabilities for unrecognized tax benefits and related interest and penalties of $19.8 million, all of which is included in other liabilities on our consolidated balance sheet. At December 2017 (see31, 2023, we cannot reasonably estimate the future period or periods of cash settlement of these liabilities. See Note 10, "Debt,"Income Taxes", for additional details)further discussion. Also included on our consolidated balance sheet at December 31, 2023 is $2.7 million of liabilities for transition tax associated with the 2017 U.S. tax reform, of which $2.7 million is expected to be paid in 2024.
| Payments due by period (dollars in thousands) | ||||||||||||||||||||
| Contractual Obligations | Total | Less than 1 year | 1-3 years | 3-5 years | More than 5 years | |||||||||||||||
Long-term debt obligations(1) | $ | 125,000 | $ | 3,125 | $ | 9,375 | $ | 112,500 | $ | - | ||||||||||
Interest payments due on long-term debt(2) | 19,156 | 4,179 | 8,012 | 6,965 | - | |||||||||||||||
| Capital expenditure obligations | 2,975 | 2,975 | - | - | - | |||||||||||||||
Operating leases(3) | 18,647 | 5,819 | 7,911 | 4,469 | 448 | |||||||||||||||
| Raw material purchase obligations | 45,361 | 45,306 | 55 | - | - | |||||||||||||||
| First quarter 2018 quarterly cash dividend declared | 830 | 830 | - | - | - | |||||||||||||||
| Total | $ | 211,969 | $ | 62,234 | $ | 25,353 | $ | 123,934 | $ | 448 | ||||||||||
Critical Accounting Policies and Other Matters
The Company's consolidated financial statements include certain amounts that are based on management's best estimates and judgments. Estimates are used when accounting for amounts recorded in connection with mergers and acquisitions, including determination of the fair value of assets and liabilities. Additionally, estimates are used in determining such items as current fair values of goodwill and other intangible assets, as well as provisions related to product returns, bad debts, inventories, intangible assets, investments, SERP expense, income taxes and contingencies and litigation. The Company bases its estimates on historical experience and on various other assumptions, including in some cases future projections, that are believed to be reasonable under the circumstances, thecircumstances. The results of whichthese estimates form the basis for making judgments about the carrying values of assets and liabilities that are not readily apparent from other sources. Actual results may differ from these estimates under different assumptions or conditions. The following accounting policies requireDifferent assumptions and judgments could change the estimates used in the preparation of the consolidated financial statements, which, in turn, could change the results from those reported. Management evaluates its estimates, assumptions and judgments on an ongoing basis.
Based on the above, we have determined that our most critical accounting estimates that have the potential for significantly impacting Bel's financial statements.
Business Combinations
In a business combination, we allocate the fair value of purchase price consideration to the identifiable assets acquired, the liabilities assumed, and any noncontrolling interest in the acquiree based on their estimated losses resulting fromfair values. The excess of the likelihoodfair value of failurepurchase price consideration over the fair values of our customersthese identifiable assets and liabilities is recorded as goodwill. Such valuations require management to make required payments. An additional allowance may be required if the financial condition of our customers deteriorates. The allowance for doubtful accounts is maintained at a level that management assessessignificant estimates and assumptions, especially with respect to be appropriate to absorb estimated lossesintangible assets. Significant estimates in the accounts receivable portfolio. The allowance for doubtful accounts is reviewed at a minimum quarterly, and changes to the allowancevaluing certain intangible assets include, but are made through the provision for bad debts, which is included in SG&A expenses on our consolidated statements of operations. These changes may reflect changes in economic, business and market conditions. The allowance is increased by the provision for bad debts and decreased by the amount of charge-offs, net of recoveries.
Inventory Valuation
Inventories consist of raw materials. Future events that could adversely affect these decisions and result in significant charges to the Company's operations include miscalculating customer requirements, technology changes which render certain raw materials and finished goods obsolete, losspurchased components and are stated at the lower of customers and/cost and net realizable value. Material costs are principally determined by standard cost or cancellationthe weighted moving average method, both of sales orders, stock rotation with distributors and termination of distribution agreements.which approximate actual cost. The Company reduces the carrying value of its inventory for estimated obsolescence or unmarketable inventory by an amount equal to the difference between the cost of inventory and the estimated market value based on the aforementioned assumptions.
Goodwill
We use a fair value approach to test goodwill for impairment. We must recognize a non-cash impairment charge for the amount, if any, by which the carrying amount of goodwill exceeds its implied fair value. We derive an estimate of fair values for each of our reporting units using a combination of an income approach and an appropriate market approach, each based on an applicable weighting. We assess the applicable weighting based on such factors as current market conditions and the quality and reliability of the data. Absent an indication of fair value from a potential buyer or similar specific transactions, we believe that the use of these methods provides a reasonable estimate of a reporting unit's fair value.
Fair value computed by these methods is arrived at using a number of factors, including projected future operating results, anticipated future cash flows, effective income tax rates, comparable marketplace data within a consistent industry grouping, and the cost of capital. There are inherent uncertainties, however, related to these factors and to our judgment in applying them to this analysis. Nonetheless, we believe that the combination of these methods provides a reasonable approach to estimate the fair value of our reporting units. Assumptions for sales, net earnings and cash flows for each reporting unit were consistent among these methods.
Income Approach Used to Determine Fair Values
The income approach is based upon the present value of expected cash flows. Expected cash flows are converted to present value using factors that consider the timing and risk of the future cash flows. The estimate of cash flows used is prepared on an unleveraged debt-free basis. We use a discount rate that reflects a market-derived weighted average cost of capital. We believe that this approach is appropriate because it provides a fair value estimate based upon the reporting unit's expected long-term operating and cash flow performance. The projections are based upon our best estimates of projected economic and market conditions over the related period including growth rates, estimates of future expected changes in operating margins and cash expenditures. Other significant estimates and assumptions include terminal value long-term growth rates, provisions for income taxes, future capital expenditures and changes in future cashless, debt-free working capital.
Market Approach Used to Determine Fair Values
The market approach estimates the fair value of the reporting unit by applying multiples of operating performance measures to the reporting unit's operating performance (the "Public"Guideline Publicly Traded Company Method"). These multiples are derived from comparable publicly-tradedpublicly traded companies with similar investment characteristics to the reporting unit, and such comparables are reviewed and updated as needed annually. We believe that this approach is appropriate because it provides a fair value estimate using multiples from entities with operations and economic characteristics comparable to our reporting units and the Company. The second market approach is based on the publicly traded common stock of the Company and the estimate of fair value of the reporting unit is based on the applicable multiples of the Company (the "Quoted Price Method"). The third market approach is based on recent mergers and acquisitions of comparable publicly-traded and privately-held companies in our industries (the "Mergers and Acquisition Method").
In order to assess the reasonableness of the calculated fair values of our reporting units, we also compare the sum of the reporting units' fair values to our market capitalization and calculate an implied control premium (the excess of the sum of the reporting units' fair values over the market capitalization). We evaluate the control premium by comparing it to control premiums of recent comparable market transactions. If the implied control premium is not reasonable in light of these recent transactions, we will reevaluate our fair value estimates of the reporting units by adjusting the discount rates and/or other assumptions.
We applied a combined weighting of 25% to the market approach when determining the fair value of these reporting units.
As indicated in Note 5,"Goodwill and Other Intangible Assets", the fair value of each of our four reporting units exceeded their respective carrying values by a large margin (ranging from 71% to 169%). If our assumptionsmarket factors change and related estimates changethe discount rate utilized in the future,fair value calculation changes, it would result in a higher or lower fair value of our reporting units. The discount rates utilized in our October 1, 2023 impairment test ranged from 14.0% to 18.5%. An increase in the discount rate assumption of 50 basis points would have impacted the fair values of our reporting units, and would have reduced the excess of fair value over carrying value to a revised range of 69% to 163%. Further, if we are unable to achieve the projected revenue growth rates or margins assumed in our projections, this would also impact the fair value of our reporting units. Effective with the October 1, 2023 testing date, we changed our reporting unit structure to align with how management is currently reviewing and managing the business. Based on the testing performed, no impairment existed either under the former reporting unit structure or under the new reporting unit structure. If we were to change our reporting unit structure again or if other events and circumstances change (such as a sustained decrease in the price of our common stock, a decline in current market multiples, a significant adverse change in legal factors or business climates, an adverse action or assessment by a regulator, heightened competition, strategic decisions made in response to economic or competitive conditions or a more-likely-than-not expectation that a reporting unit or a significant portion of a reporting unit will be sold or disposed of), we may be required to record impairment charges in future periods. Any impairment charges that we may take in the future could be material to our consolidated results of operations and consolidated financial condition.
The Company conducted its annual goodwill impairment test as of October 1, 2017,2023, and no impairment was identified at that time. Management has also concluded that the fair value of its goodwill exceeded the associated carrying value at December 31, 20172023 and that no impairment exists as of that date.
Indefinite-Lived Intangible Assets
The Company annually tests indefinite-lived intangible assets for impairment annually on October 1, or upon a triggering event, using a fair value approach, the relief-from-royalty method (a form of the income approach). Due to weakened market conditions in early 2016, which lowered our forecasted results, the Company performed an interim impairment test related to its indefinite-lived intangible assets. In connection with the interim test, the Company recorded an impairment charge of $4.3 million during the first half of 2016. The Company conducted its annual impairment testtests as of October 1, 2017,2023 and 2022, and no impairment was identified at that time.either testing date. Management has also concluded that the fair value of its trademarks exceeds the associated carrying values at December 31, 20172023 and that no impairment existed as of that date. At December 31, 2017,2023, the Company's indefinite-lived intangible assets related solely to trademarks.
Pension Benefit Obligations
Net periodic benefit cost for the Company's SERP totaled $1.3 million in 2023 and Other Intangible Assets
Other Matters
The Company believes that it has sufficient cash reserves to fund its foreseeable working capital needs. It may, however, seek to expand such resources through bank borrowings, at favorable lending rates, from time to time. If the Company were to undertake another substantial acquisition for cash, the acquisition would either be funded with cash on hand or would be financed in part through cash on hand and in part through bank borrowings or the issuance of public or private debt or equity. If the Company borrows additional money to finance acquisitions, this would further decrease the Company's ratio of earnings to fixed charges, and could further impact the Company's material restrictive covenants, depending on the size of the borrowing and the nature of the target company. Under its existing credit facility, the Company is required to obtain its lender's consent for certain additional debt financing and to comply with other covenants, including the application of specific financial ratios, andwhich may be restricted from payinglimit the Company’s ability to pay cash dividends on its common stock.stock and/or the amounts thereof, including to the extent that payment of any such dividend would cause noncompliance with any such financial ratio. Depending on the nature of the transaction, the Company cannot assure investors that the necessary acquisition financing would be available to it on acceptable terms, or at all, when required. If the Company issues a substantial amount of stock either as consideration in an acquisition or to finance an acquisition, such issuance may dilute existing stockholders and may take the form of capital stock having preferences over its existing common stock.
New Financial Accounting Standards
The discussion of new financial accounting standards applicable to the Company is incorporated herein by reference to Note 1, "Description of Business and Summary of Significant Accounting Policies."
Item 7A. Quantitative and Qualitative Disclosures About Market Risk
The Company hasis not entered into any financial instrumentsrequired to provide the information called for trading or hedging purposes. The Company does not currently anticipate entering into interest rate swaps and/or similar instruments.
See the consolidated financial statements listed in the accompanying Index to Consolidated Financial Statements for the information required by this item.
BEL FUSE INC. | AND SUBSIDIARIES | ||||
INDEX TO CONSOLIDATED FINANCIAL STATEMENTS | |||||
Financial Statements | Page | ||||
Reports of Independent Registered Public Accounting Firm (Grant Thornton LLP, Iselin, New Jersey, PCAOB #248) | 35 | ||||
| 39 | |||||
| 40 | |||||
| 41 | |||||
| 42 | |||||
| 43 | |||||
Board of Directors and Stockholders of Shareholders
Bel Fuse Inc.Jersey City, New Jersey
Opinion on the Financial Statements and Internal Control over Financial Reporting
We have audited the accompanying consolidated balance sheets of Bel Fuse Inc. (a New Jersey corporation) and subsidiaries (the "Company"“Company”) as of December 31, 20172023 and 2016,2022, the related consolidated statements of operations, comprehensive (loss) income, stockholders'stockholders’ equity, and cash flows for each of the threetwo years in the period ended December 31, 2017,2023, and the related notes and the financial statement schedule listed in the Index at Item 15 (collectively referred to as the "financial statements"“financial statements”). We also have audited the Company's internal control over financial reporting as of December 31, 2017, based on criteria established in Internal Control — Integrated Framework (2013) issued by the Committee of Sponsoring Organizations of the Treadway Commission (COSO).
We also have audited, in our opinion,accordance with the standards of the Public Company maintained, in all material respects, effectiveAccounting Oversight Board (United States) (“PCAOB”), the Company’s internal control over financial reporting as of December 31, 2017,2023, based on criteria established in the 2013 Internal Control—Integrated Framework (2013) issued by COSO.
Basis for Opinions
These financial statements for maintaining effective internal control over financial reporting, and for its assessmentare the responsibility of the effectiveness of internal control over financial reporting, included in the accompanying Management's Annual Report on Internal Control Over Financial Reporting.Company’s management. Our responsibility is to express an opinion on thesethe Company’s financial statements and an opinion on the Company's internal control over financial reporting based on our audits. We are a public accounting firm registered with the Public Company Accounting Oversight Board (United States) (PCAOB)PCAOB and are required to be independent with respect to the Company in accordance with the U.S. federal securities laws and the applicable rules and regulations of the Securities and Exchange Commission and the PCAOB.
We conducted our audits in accordance with the standards of the PCAOB. Those standards require that we plan and perform the auditsaudit to obtain reasonable assurance about whether the financial statements are free of material misstatement, whether due to error or fraud, and whether effective internal control over financial reporting was maintained in all material respects.
Critical audit matter
Critical audit matters are matters arising from the current period audit of the financial statements that were communicated or required to be communicated to the audit committee and that: (1) relate to accounts or disclosures that are material to the financial statements and (2) involved our especially challenging, subjective, or complex judgements. We determined that there are no critical audit matters.
/s/ GRANT THORNTON LLP
We have served as the Company’s auditor since 2021.
Iselin, New Jersey
March 11, 2024
REPORT OF INDEPENDENT REGISTERED PUBLIC ACCOUNTING FIRM
Board of Directors and Shareholders
Bel Fuse Inc.
Opinion on internal control over financial reporting
We have audited the internal control over financial reporting of Bel Fuse Inc. (a New Jersey corporation) and subsidiaries (the “Company”) as of December 31, 2023, based on criteria established in the 2013 Internal Control—Integrated Framework issued by the Committee of Sponsoring Organizations of the Treadway Commission (“COSO”). In our opinion, the Company maintained, in all material respects, effective internal control over financial reporting as of December 31, 2023, based on criteria established in the 2013 Internal Control—Integrated Framework issued by COSO.
We also have audited, in accordance with the standards of the Public Company Accounting Oversight Board (United States) (“PCAOB”), the consolidated financial statements of the Company as of and for the year ended December 31, 2023, and our report dated March 11, 2024 expressed an unqualified opinion on those financial statements.
Basis for opinion
The Company’s management is responsible for maintaining effective internal control over financial reporting and for its assessment of the effectiveness of internal control over financial reporting, included in the accompanying Management’s Annual Report on Internal Control Over Financial Reporting. Our responsibility is to express an opinion on the Company’s internal control over financial reporting based on our audit. We are a public accounting firm registered with the PCAOB and are required to be independent with respect to the Company in accordance with the U.S. federal securities laws and the applicable rules and regulations of the Securities and Exchange Commission and the PCAOB.
We conducted our audit in accordance with the standards of the PCAOB. Those standards require that we plan and perform the audit to obtain reasonable assurance about whether effective internal control over financial reporting was maintained in all material respects. Our audit included obtaining an understanding of internal control over financial reporting, assessing the risk that a material weakness exists, and testing and evaluating the design and operating effectiveness of internal control based on the assessed risk. Our audits also includedrisk, and performing such other procedures as we considered necessary in the circumstances. We believe that our audits provideaudit provides a reasonable basis for our opinions.opinion.
Definition and Limitationslimitations of Internal Controlinternal control over Financial Reporting
A company'scompany’s internal control over financial reporting is a process designed to provide reasonable assurance regarding the reliability of financial reporting and the preparation of financial statements for external purposes in accordance with generally accepted accounting principles. A company'scompany’s internal control over financial reporting includes those policies and procedures that (1) pertain to the maintenance of records that, in reasonable detail, accurately and fairly reflect the transactions and dispositions of the assets of the company; (2) provide reasonable assurance that transactions are recorded as necessary to permit preparation of financial statements in accordance with generally accepted accounting principles, and that receipts and expenditures of the company are being made only in accordance with authorizations of management and directors of the company; and (3) provide reasonable assurance regarding prevention or timely detection of unauthorized acquisition, use, or disposition of the company'scompany’s assets that could have a material effect on the financial statements.
Because of its inherent limitations, internal control over financial reporting may not prevent or detect misstatements. Also, projections of any evaluation of effectiveness to future periods are subject to the risk that controls may become inadequate because of changes in conditions, or that the degree of compliance with the policies or procedures may deteriorate.
/s/ Deloitte & ToucheGRANT THORNTON LLP
Iselin, New York, New York
Jersey
March 9, 2018
| BEL FUSE INC. AND SUBSIDIARIES | ||||||||
| (dollars in thousands, except share and per share data) | ||||||||
| December 31, | December 31, | |||||||
| 2017 | 2016 | |||||||
| ASSETS | ||||||||
| Current assets: | ||||||||
| Cash and cash equivalents | $ | 69,354 | $ | 73,411 | ||||
| Accounts receivable - less allowance for doubtful accounts | ||||||||
| of $1,745 and $1,781 at December 31, 2017 and 2016, respectively | 78,808 | 74,416 | ||||||
| Inventories | 107,719 | 98,871 | ||||||
| Other current assets | 10,218 | 8,744 | ||||||
| Total current assets | 266,099 | 255,442 | ||||||
| Property, plant and equipment, net | 43,495 | 48,755 | ||||||
| Intangible assets, net | 69,366 | 74,828 | ||||||
| Goodwill | 20,177 | 17,951 | ||||||
| Deferred income taxes | 4,155 | 3,410 | ||||||
| Other assets | 27,973 | 26,354 | ||||||
| Total assets | $ | 431,265 | $ | 426,740 | ||||
| LIABILITIES AND STOCKHOLDERS' EQUITY | ||||||||
| Current liabilities: | ||||||||
| Accounts payable | $ | 47,947 | $ | 47,235 | ||||
| Accrued expenses | 30,508 | 31,549 | ||||||
| Current maturities of long-term debt | 2,641 | 11,395 | ||||||
| Other current liabilities | 6,204 | 2,148 | ||||||
| Total current liabilities | 87,300 | 92,327 | ||||||
| Long-term liabilities: | ||||||||
| Long-term debt | 120,053 | 129,850 | ||||||
| Liability for uncertain tax positions | 27,948 | 27,458 | ||||||
| Minimum pension obligation and unfunded pension liability | 19,134 | 16,900 | ||||||
| Deferred income taxes | 1,567 | 1,460 | ||||||
| Other long-term liabilities | 17,303 | 311 | ||||||
| Total liabilities | 273,305 | 268,306 | ||||||
| Commitments and contingencies | ||||||||
| Stockholders' equity: | ||||||||
| Preferred stock, no par value, 1,000,000 shares authorized; none issued | - | - | ||||||
| Class A common stock, par value $.10 per share, 10,000,000 shares | ||||||||
| authorized; 2,174,912 shares outstanding at each date (net of | ||||||||
| 1,072,769 treasury shares) | 217 | 217 | ||||||
| Class B common stock, par value $.10 per share, 30,000,000 shares | ||||||||
| authorized; 9,859,352 and 9,851,652 shares outstanding, respectively | ||||||||
| (net of 3,218,307 treasury shares) | 986 | 985 | ||||||
| Additional paid-in capital | 28,575 | 27,242 | ||||||
| Retained earnings | 147,807 | 161,287 | ||||||
| Accumulated other comprehensive loss | (19,625 | ) | (31,297 | ) | ||||
| Total stockholders' equity | 157,960 | 158,434 | ||||||
| Total liabilities and stockholders' equity | $ | 431,265 | $ | 426,740 | ||||
| See accompanying notes to consolidated financial statements. | ||||||||
CONSOLIDATED BALANCE SHEETS | |||||||
(dollars in thousands, except share and per share data) |
December 31, | December 31, | |||||||
2023 | 2022 | |||||||
ASSETS | ||||||||
Current assets: | ||||||||
Cash and cash equivalents | $ | 89,371 | $ | 70,266 | ||||
Held to maturity U.S. Treasury securities | 37,548 | - | ||||||
Accounts receivable, net of allowance of $1,388 and $1,552, at December 31, 2023 and 2022, respectively | 84,129 | 107,274 | ||||||
Inventories | 136,540 | 172,465 | ||||||
Unbilled receivables | 12,793 | 18,244 | ||||||
Other current assets | 21,097 | 13,159 | ||||||
Total current assets | 381,478 | 381,408 | ||||||
Property, plant and equipment, net | 36,533 | 36,833 | ||||||
Right-of-use assets | 20,481 | 21,551 | ||||||
Related-party note receivable | 2,152 | - | ||||||
Equity method investment | 10,282 | - | ||||||
Intangible assets, net | 49,391 | 54,111 | ||||||
Goodwill, net | 26,642 | 25,099 | ||||||
Deferred income taxes | 11,553 | 7,281 | ||||||
Other assets | 33,119 | 34,183 | ||||||
Total assets | $ | 571,631 | $ | 560,466 | ||||
LIABILITIES AND STOCKHOLDERS' EQUITY | ||||||||
Current liabilities: | ||||||||
Accounts payable | $ | 40,441 | $ | 64,589 | ||||
Accrued expenses | 54,657 | 50,873 | ||||||
Operating lease liability, current | 6,350 | 5,870 | ||||||
Other current liabilities | 9,161 | 14,972 | ||||||
Total current liabilities | 110,609 | 136,304 | ||||||
Long-term liabilities: | ||||||||
Long-term debt | 60,000 | 95,000 | ||||||
Operating lease liability, long-term | 14,212 | 15,742 | ||||||
Liability for uncertain tax positions | 19,823 | 24,798 | ||||||
Minimum pension obligation and unfunded pension liability | 19,876 | 18,522 | ||||||
Deferred income taxes | 1,456 | 1,257 | ||||||
Other long-term liabilities | 5,097 | 6,497 | ||||||
Total liabilities | 231,073 | 298,120 | ||||||
Commitments and contingencies (see Note 19) | ||||||||
Stockholders' equity: | ||||||||
Preferred stock, no par value, 1,000,000 shares authorized; none issued | - | - | ||||||
Class A common stock, par value $.10 per share, 10,000,000 shares authorized; 2,141,589 shares outstanding at each date (net of 1,072,769 restricted treasury shares) | 214 | 214 | ||||||
Class B common stock, par value $.10 per share, 30,000,000 shares authorized; 10,620,260 shares and 10,642,760 shares outstanding at December 31, 2023 and December 31, 2022, respectively (net of 3,218,307 restricted treasury shares) | 1,065 | 1,067 | ||||||
Treasury stock (unrestricted, consisting of 3,323 Class A shares and 17,342 Class B shares) | (454 | ) | (349 | ) | ||||
Additional paid-in capital | 44,260 | 40,772 | ||||||
Retained earnings | 307,510 | 237,188 | ||||||
Accumulated other comprehensive loss | (12,037 | ) | (16,546 | ) | ||||
Total stockholders' equity | 340,558 | 262,346 | ||||||
Total liabilities and stockholders' equity | $ | 571,631 | $ | 560,466 | ||||
See accompanying notes to consolidated financial statements. |
| BEL FUSE INC. AND SUBSIDIARIES | ||||||||||||
| (dollars in thousands, except per share data) | ||||||||||||
| Year Ended December 31, | ||||||||||||
| 2017 | 2016 | 2015 | ||||||||||
| Net sales | $ | 491,611 | $ | 500,153 | $ | 567,080 | ||||||
| Cost of sales | 389,601 | 400,245 | 458,253 | |||||||||
| Gross profit | 102,010 | 99,908 | 108,827 | |||||||||
| Selling, general and administrative expenses | 85,067 | 71,005 | 77,952 | |||||||||
| Impairment of goodwill and other intangible assets | - | 105,972 | - | |||||||||
| Loss (gain) on disposal of property, plant and equipment | 297 | (2,644 | ) | 161 | ||||||||
| Restructuring charges | 308 | 2,087 | 2,114 | |||||||||
| Income (loss) from operations | 16,338 | (76,512 | ) | 28,600 | ||||||||
| Interest expense | (6,802 | ) | (6,662 | ) | (7,588 | ) | ||||||
| Interest income and other, net | 107 | 622 | 4,720 | |||||||||
| Earnings (loss) before provision for (benefit from) income taxes | 9,643 | (82,552 | ) | 25,732 | ||||||||
| Provision for (benefit from) income taxes | 21,540 | (17,718 | ) | 6,535 | ||||||||
| Net (loss) earnings available to common shareholders | $ | (11,897 | ) | $ | (64,834 | ) | $ | 19,197 | ||||
| Net (loss) earnings per common share: | ||||||||||||
| Class A common shares - basic and diluted | $ | (0.97 | ) | $ | (5.25 | ) | $ | 1.53 | ||||
| Class B common shares - basic and diluted | $ | (0.99 | ) | $ | (5.48 | ) | $ | 1.64 | ||||
| Weighted-average shares outstanding: | ||||||||||||
| Class A common shares - basic and diluted | 2,175 | 2,175 | 2,175 | |||||||||
| Class B common shares - basic and diluted | 9,857 | 9,749 | 9,698 | |||||||||
| Dividends paid per common share: | ||||||||||||
| Class A common shares | $ | 0.24 | $ | 0.24 | $ | 0.24 | ||||||
| Class B common shares | $ | 0.28 | $ | 0.28 | $ | 0.28 | ||||||
| See accompanying notes to consolidated financial statements. | ||||||||||||
CONSOLIDATED STATEMENTS OF OPERATIONS | |||||||
(in thousands, except per share data) |
Years Ended December 31, | ||||||||
2023 | 2022 | |||||||
Net sales | $ | 639,813 | $ | 654,233 | ||||
Cost of sales | 423,964 | 470,780 | ||||||
Gross profit | 215,849 | 183,453 | ||||||
Research and development costs | 22,487 | 20,238 | ||||||
Selling, general and administrative expenses | 99,091 | 92,342 | ||||||
Restructuring charges | 10,114 | 7,322 | ||||||
Gain on sale of properties | (3,819 | ) | (1,596 | ) | ||||
Income from operations | 87,976 | 65,147 | ||||||
Gain on sale of Czech Republic business | 980 | - | ||||||
Interest expense | (2,850 | ) | (3,379 | ) | ||||
Other income/expense, net | (2,806 | ) | (2,709 | ) | ||||
Earnings before provision for income taxes | 83,300 | 59,059 | ||||||
Provision for income taxes | 9,469 | 6,370 | ||||||
Net earnings available to common shareholders | $ | 73,831 | $ | 52,689 | ||||
Net earnings per common share: | ||||||||
Class A common shares - basic and diluted | $ | 5.52 | $ | 4.01 | ||||
Class B common shares - basic and diluted | $ | 5.83 | $ | 4.24 | ||||
Weighted-average shares outstanding: | ||||||||
Class A common shares - basic and diluted | 2,142 | 2,143 | ||||||
Class B common shares - basic and diluted | 10,634 | 10,394 | ||||||
See accompanying notes to consolidated financial statements. |
CONSOLIDATED STATEMENTS OF COMPREHENSIVE INCOME | |||||||
(dollars in thousands) |
Years Ended December 31, | ||||||||
2023 | 2022 | |||||||
Net earnings | $ | 73,831 | $ | 52,689 | ||||
Other comprehensive income: | ||||||||
Currency translation adjustment, net of taxes of ($93) and ($47) | 6,684 | (8,196 | ) | |||||
Unrealized (losses) gains on interest rate swap cash flow hedge, net of taxes of $0 in both periods | (1,579 | ) | 5,655 | |||||
Unrealized holding gains (losses) on marketable securities arising during the period, net of taxes of $0 in both periods | 1 | (11 | ) | |||||
Change in unfunded SERP liability, net of taxes of ($161) and ($1,381) | (597 | ) | 4,869 | |||||
Other comprehensive income | 4,509 | 2,317 | ||||||
Comprehensive income | $ | 78,340 | $ | 55,006 | ||||
See accompanying notes to consolidated financial statements. |
CONSOLIDATED STATEMENTS OF STOCKHOLDERS' EQUITY | |||||||||||||||||||||||
(dollars in thousands) |
Accumulated | ||||||||||||||||||||||||||||
Other | Class A | Class B | Additional | |||||||||||||||||||||||||
Retained | Comprehensive | Common | Common | Treasury | Paid-In | |||||||||||||||||||||||
Total | Earnings | (Loss) Income | Stock | Stock | Stock | Capital | ||||||||||||||||||||||
Balance at December 31, 2021 | $ | 208,743 | $ | 187,935 | $ | (18,863 | ) | $ | 214 | $ | 1,038 | $ | - | $ | 38,419 | |||||||||||||
Net earnings | 52,689 | 52,689 | - | - | - | - | - | |||||||||||||||||||||
Dividends declared: | ||||||||||||||||||||||||||||
Class A Common Stock, $0.24/share | (514 | ) | (514 | ) | - | - | - | - | - | |||||||||||||||||||
Class B Common Stock, $0.28/share | (2,922 | ) | (2,922 | ) | - | - | - | - | - | |||||||||||||||||||
Issuance of restricted common stock | - | - | - | - | 33 | - | (33 | ) | ||||||||||||||||||||
Forfeiture of restricted common stock | - | - | - | - | (4 | ) | - | 4 | ||||||||||||||||||||
Repurchase of treasury stock | (349 | ) | - | - | - | - | (349 | ) | - | |||||||||||||||||||
Foreign currency translation adjustment, net of taxes of ($47) | (8,196 | ) | - | (8,196 | ) | - | - | - | - | |||||||||||||||||||
Unrealized gains on interest rate swap cash flow hedge, net of taxes of $0 | 5,655 | - | 5,655 | - | - | - | - | |||||||||||||||||||||
Unrealized holding losses on marketable securities, net of taxes of $0 | (11 | ) | - | (11 | ) | - | - | - | - | |||||||||||||||||||
Stock-based compensation expense | 2,382 | - | - | - | - | - | 2,382 | |||||||||||||||||||||
Change in unfunded SERP liability, net of taxes of ($1,381) | 4,869 | - | 4,869 | - | - | - | - | |||||||||||||||||||||
Balance at December 31, 2022 | 262,346 | 237,188 | (16,546 | ) | 214 | 1,067 | (349 | ) | 40,772 | |||||||||||||||||||
Net earnings | 73,831 | 73,831 | - | - | - | - | - | |||||||||||||||||||||
Dividends declared: | ||||||||||||||||||||||||||||
Class A Common Stock, $0.24/share | (512 | ) | (512 | ) | - | - | - | - | - | |||||||||||||||||||
Class B Common Stock, $0.28/share | (2,997 | ) | (2,997 | ) | - | - | - | - | - | |||||||||||||||||||
Issuance of restricted common stock | - | - | - | - | 1 | - | (1 | ) | ||||||||||||||||||||
Forfeiture of restricted common stock | - | - | - | - | (3 | ) | - | 3 | ||||||||||||||||||||
Repurchase of treasury stock | (105 | ) | - | - | - | - | (105 | ) | - | |||||||||||||||||||
Foreign currency translation adjustment, including writeoff of $2,724 related to liquidation of foreign subsidiary, net of taxes of ($93) | 6,684 | - | 6,684 | - | - | - | - | |||||||||||||||||||||
Unrealized losses on interest rate swap cash flow hedge, net of taxes of $0 | (1,579 | ) | - | (1,579 | ) | - | - | - | - | |||||||||||||||||||
Unrealized holding gains on marketable securities, net of taxes of $0 | 1 | - | 1 | - | - | - | - | |||||||||||||||||||||
Stock-based compensation expense | 3,486 | - | - | - | - | - | 3,486 | |||||||||||||||||||||
Change in unfunded SERP liability, net of taxes of ($161) | (597 | ) | - | (597 | ) | - | - | - | - | |||||||||||||||||||
Balance at December 31, 2023 | $ | 340,558 | $ | 307,510 | $ | (12,037 | ) | $ | 214 | $ | 1,065 | $ | (454 | ) | $ | 44,260 | ||||||||||||
See accompanying notes to consolidated financial statements. |
| BEL FUSE INC. AND SUBSIDIARIES | ||||||||||||
| (dollars in thousands) | ||||||||||||
| Year Ended December 31, | ||||||||||||
| 2017 | 2016 | 2015 | ||||||||||
| Net (loss) earnings | $ | (11,897 | ) | $ | (64,834 | ) | $ | 19,197 | ||||
| Other comprehensive income (loss): | ||||||||||||
| Currency translation adjustment, net of taxes of $183, ($648) and ($194) | 12,439 | (9,671 | ) | (9,954 | ) | |||||||
| Unrealized holding (losses) gains on marketable securities arising during | ||||||||||||
| the period, net of taxes of ($177), ($2) and $5 | (279 | ) | (10 | ) | 5 | |||||||
| Change in unfunded SERP liability, net of taxes of $237, $71 and | ||||||||||||
| $2, respectively | (488 | ) | 260 | 21 | ||||||||
| Other comprehensive income (loss): | 11,672 | (9,421 | ) | (9,928 | ) | |||||||
| Comprehensive (loss) income | $ | (225 | ) | $ | (74,255 | ) | $ | 9,269 | ||||
| See accompanying notes to consolidated financial statements. | ||||||||||||
CONSOLIDATED STATEMENTS OF CASH FLOWS | |||||||
(dollars in thousands) |
Years Ended December 31, | ||||||||
2023 | 2022 | |||||||
Cash flows from operating activities: | ||||||||
Net earnings | $ | 73,831 | $ | 52,689 | ||||
Adjustments to reconcile net earnings to net cash provided by operating activities: | ||||||||
Depreciation and amortization | 13,312 | 14,863 | ||||||
Stock-based compensation | 3,486 | 2,382 | ||||||
Amortization of deferred financing costs | 33 | 34 | ||||||
Deferred income taxes | (3,872 | ) | (4,594 | ) | ||||
Unrealized losses (gains) on foreign currency revaluation | 1,356 | (278 | ) | |||||
Gains on sale/disposal of property, plant and equipment | (2,117 | ) | (1,596 | ) | ||||
Gain on sale of Czech Republic business | (980 | ) | - | |||||
Other, net | (1,037 | ) | 1,195 | |||||
Changes in operating assets and liabilities: | ||||||||
Accounts receivable | 22,500 | (20,702 | ) | |||||
Unbilled receivables | 5,451 | 10,031 | ||||||
Inventories | 33,613 | (36,592 | ) | |||||
Other current assets | (217 | ) | (1,210 | ) | ||||
Other assets | 2,971 | 7,000 | ||||||
Accounts payable | (22,745 | ) | 1,522 | |||||
Accrued expenses | 5,356 | 10,933 | ||||||
Accrued restructuring costs | (1,228 | ) | 6,784 | |||||
Other liabilities | (16,388 | ) | (4,162 | ) | ||||
Income taxes payable | (4,976 | ) | 1,958 | |||||
Net cash provided by operating activities | 108,349 | 40,257 | ||||||
Cash flows from investing activities: | ||||||||
Purchase of property, plant and equipment | (12,126 | ) | (8,832 | ) | ||||
Purchases of held to maturity and marketable securities | (59,992 | ) | - | |||||
Proceeds from held to maturity securities | 19,918 | - | ||||||
Payment for equity method investment | (10,282 | ) | - | |||||
Investment in related party notes receivable | (2,152 | ) | - | |||||
Proceeds from disposal/sale of property, plant and equipment | 6,036 | 1,833 | ||||||
Proceeds from sale of business | 5,063 | - | ||||||
Net cash used in investing activities | (53,535 | ) | (6,999 | ) | ||||
(continued) |
BEL FUSE INC. AND SUBSIDIARIES | |||||||
CONSOLIDATED STATEMENTS OF CASH FLOWS (Continued) | |||||||
(dollars in thousands) |
Years Ended December 31, | ||||||||
2023 | 2022 | |||||||
Cash flows from financing activities: | ||||||||
Dividends paid to common shareholders | (3,492 | ) | (3,413 | ) | ||||
Purchase of treasury stock | (105 | ) | (349 | ) | ||||
Borrowings under revolving credit line | 5,000 | - | ||||||
Repayments under revolving credit line | (40,000 | ) | (17,500 | ) | ||||
Net cash used in financing activities | (38,597 | ) | (21,262 | ) | ||||
Effect of exchange rate changes on cash | 2,888 | (3,486 | ) | |||||
Net increase in cash and cash equivalents | 19,105 | 8,510 | ||||||
Cash and cash equivalents - beginning of year | 70,266 | 61,756 | ||||||
Cash and cash equivalents - end of year | $ | 89,371 | $ | 70,266 | ||||
Supplemental cash flow information: | ||||||||
Cash paid during the year for: | ||||||||
Income taxes, net of refunds received | $ | 25,056 | $ | 14,618 | ||||
Interest payments | $ | 4,729 | $ | 3,371 | ||||
ROU assets obtained in exchange for lease obligations | $ | 5,999 | $ | 8,052 | ||||
| BEL FUSE INC. AND SUBSIDIARIES | ||||||||||||||||||||||||
| (dollars in thousands) | ||||||||||||||||||||||||
| Accumulated | ||||||||||||||||||||||||
| Other | Class A | Class B | Additional | |||||||||||||||||||||
| Retained | Comprehensive | Common | Common | Paid-In | ||||||||||||||||||||
| Total | Earnings | (Loss) Income | Stock | Stock | Capital | |||||||||||||||||||
| Balance at December 31, 2014 | $ | 224,273 | $ | 213,409 | $ | (11,948 | ) | $ | 217 | $ | 969 | $ | 21,626 | |||||||||||
| Cash dividends declared on Class A common stock | (522 | ) | (522 | ) | - | - | - | - | ||||||||||||||||
| Cash dividends declared on Class B common stock | (2,713 | ) | (2,713 | ) | - | - | - | - | ||||||||||||||||
| Issuance of restricted common stock | - | - | - | - | 8 | (8 | ) | |||||||||||||||||
| Forfeiture of restricted common stock | - | - | - | - | (7 | ) | 7 | |||||||||||||||||
| Foreign currency translation adjustment, net of taxes of ($194) | (9,954 | ) | - | (9,954 | ) | - | - | - | ||||||||||||||||
| Unrealized holding gains on marketable securities | ||||||||||||||||||||||||
| arising during the year, net of taxes of $5 | 5 | - | 5 | - | - | - | ||||||||||||||||||
| Stock-based compensation expense | 2,815 | - | - | - | - | 2,815 | ||||||||||||||||||
| Change in unfunded SERP liability, net of taxes of $2 | 21 | - | 21 | - | - | - | ||||||||||||||||||
| Net earnings | 19,197 | 19,197 | - | - | - | - | ||||||||||||||||||
| Balance at December 31, 2015 | 233,122 | 229,371 | (21,876 | ) | 217 | 970 | 24,440 | |||||||||||||||||
| Cash dividends declared on Class A common stock | (522 | ) | (522 | ) | - | - | - | - | ||||||||||||||||
| Cash dividends declared on Class B common stock | (2,728 | ) | (2,728 | ) | - | - | - | - | ||||||||||||||||
| Issuance of restricted common stock | - | - | - | - | 18 | (18 | ) | |||||||||||||||||
| Forfeiture of restricted common stock | - | - | - | - | (3 | ) | 3 | |||||||||||||||||
| Foreign currency translation adjustment, net of taxes of ($648) | (9,671 | ) | - | (9,671 | ) | - | - | - | ||||||||||||||||
| Unrealized holding gains on marketable securities | ||||||||||||||||||||||||
| arising during the year, net of taxes of ($2) | (10 | ) | - | (10 | ) | - | - | - | ||||||||||||||||
| Stock-based compensation expense | 2,817 | - | - | - | - | 2,817 | ||||||||||||||||||
| Change in unfunded SERP liability, net of taxes of $71 | 260 | - | 260 | - | - | - | ||||||||||||||||||
| Net loss | (64,834 | ) | (64,834 | ) | - | - | - | - | ||||||||||||||||
| Balance at December 31, 2016 | 158,434 | 161,287 | (31,297 | ) | 217 | 985 | 27,242 | |||||||||||||||||
| Cash dividends declared on Class A common stock | (522 | ) | (522 | ) | - | - | - | - | ||||||||||||||||
| Cash dividends declared on Class B common stock | (2,757 | ) | (2,757 | ) | - | - | - | - | ||||||||||||||||
| Issuance of restricted common stock | - | - | - | - | 5 | (5 | ) | |||||||||||||||||
| Forfeiture of restricted common stock | - | - | - | - | (4 | ) | 4 | |||||||||||||||||
| Foreign currency translation adjustment, net of taxes of $183 | 12,439 | - | 12,439 | - | - | - | ||||||||||||||||||
| Unrealized holding gains on marketable securities | ||||||||||||||||||||||||
| arising during the year, net of taxes of ($177) | (279 | ) | - | (279 | ) | - | - | - | ||||||||||||||||
| Stock-based compensation expense | 3,030 | - | - | - | - | 3,030 | ||||||||||||||||||
| Change in unfunded SERP liability, net of taxes of $237 | (488 | ) | - | (488 | ) | - | - | - | ||||||||||||||||
| Reclassification of APIC pool upon adoption of ASU 2016-09 | - | 1,696 | - | - | - | (1,696 | ) | |||||||||||||||||
| Net loss | (11,897 | ) | (11,897 | ) | - | - | - | - | ||||||||||||||||
| Balance at December 31, 2017 | $ | 157,960 | $ | 147,807 | $ | (19,625 | ) | $ | 217 | $ | 986 | $ | 28,575 | |||||||||||
| See accompanying notes to consolidated financial statements. | ||||||||||||||||||||||||
See accompanying notes to consolidated financial statements. |
| BEL FUSE INC. AND SUBSIDIARIES | ||||||||||||
| (dollars in thousands) | ||||||||||||
| Years Ended December 31, | ||||||||||||
| 2017 | 2016 | 2015 | ||||||||||
| Cash flows from operating activities: | ||||||||||||
| Net (loss) earnings | $ | (11,897 | ) | $ | (64,834 | ) | $ | 19,197 | ||||
| Adjustments to reconcile net (loss) earnings to net cash | ||||||||||||
| provided by operating activities: | �� | |||||||||||
| Impairment of goodwill and other intangible assets | - | 105,972 | - | |||||||||
| Depreciation and amortization | 20,718 | 21,778 | 23,009 | |||||||||
| Stock-based compensation | 3,030 | 2,817 | 2,815 | |||||||||
| Amortization of deferred financing costs | 2,259 | 1,804 | 1,432 | |||||||||
| Deferred income taxes | (315 | ) | (6,401 | ) | (356 | ) | ||||||
| Unrealized losses (gains) on foreign currency revaluation | 2,770 | (3,063 | ) | (5,095 | ) | |||||||
| Loss (gain) on disposal of property, plant and equipment | 109 | (2,583 | ) | 426 | ||||||||
| Other, net | 1,897 | 864 | 3,209 | |||||||||
| Changes in operating assets and liabilities: | ||||||||||||
| Accounts receivable | (2,948 | ) | 10,803 | 12,187 | ||||||||
| Inventories | (6,160 | ) | (2,794 | ) | 12,951 | |||||||
| Other current assets | (2,423 | ) | (670 | ) | 846 | |||||||
| Other assets | (1,621 | ) | 297 | 2,161 | ||||||||
| Accounts payable | (1,426 | ) | (588 | ) | (10,022 | ) | ||||||
| Accrued expenses | (1,861 | ) | (6,120 | ) | (3,113 | ) | ||||||
| Other liabilities | 16,566 | (16,565 | ) | (295 | ) | |||||||
| Income taxes payable | 5,422 | (2,114 | ) | 6,437 | ||||||||
| Net cash provided by operating activities | 24,120 | 38,603 | 65,789 | |||||||||
| Cash flows from investing activities: | ||||||||||||
| Purchase of property, plant and equipment | (6,425 | ) | (8,223 | ) | (9,891 | ) | ||||||
| Purchase of company-owned life insurance | - | (2,164 | ) | (2,820 | ) | |||||||
| Proceeds from sale of marketable securities | - | 2,164 | 2,820 | |||||||||
| Proceeds from disposal/sale of property, plant and equipment | 76 | 5,839 | 77 | |||||||||
| Net cash used in investing activities | (6,349 | ) | (2,384 | ) | (9,814 | ) | ||||||
| (continued) | ||||||||||||
| See notes to consolidated financial statements. | ||||||||||||
| BEL FUSE INC. AND SUBSIDIARIES | ||||||||||||
| CONSOLIDATED STATEMENTS OF CASH FLOWS (Continued) | ||||||||||||
| (dollars in thousands) | ||||||||||||
| Year Ended December 31, | ||||||||||||
| 2017 | 2016 | 2015 | ||||||||||
| Cash flows from financing activities: | ||||||||||||
| Dividends paid to common shareholders | (3,281 | ) | (3,245 | ) | (3,238 | ) | ||||||
| Deferred financing costs | (2,012 | ) | (718 | ) | (15 | ) | ||||||
| Borrowings under revolving credit line | 6,000 | - | 12,500 | |||||||||
| Repayments under revolving credit line | (6,000 | ) | - | (35,500 | ) | |||||||
| Reduction in notes payable | (225 | ) | (126 | ) | (123 | ) | ||||||
| Proceeds from long-term debt | 125,000 | - | - | |||||||||
| Repayments of long-term debt | (143,799 | ) | (43,389 | ) | (22,438 | ) | ||||||
| Net cash used in financing activities | (24,317 | ) | (47,478 | ) | (48,814 | ) | ||||||
| Effect of exchange rate changes on cash | 2,489 | (370 | ) | 741 | ||||||||
| Net (decrease) increase in cash and cash equivalents | (4,057 | ) | (11,629 | ) | 7,902 | |||||||
| Cash and cash equivalents - beginning of year | 73,411 | 85,040 | 77,138 | |||||||||
| Cash and cash equivalents - end of year | $ | 69,354 | $ | 73,411 | $ | 85,040 | ||||||
| Supplemental cash flow information: | ||||||||||||
| Cash paid during the year for: | ||||||||||||
| Income taxes, net of refunds received | $ | 756 | $ | 2,459 | $ | 580 | ||||||
| Interest payments | $ | 4,353 | $ | 4,843 | $ | 6,153 | ||||||
| See accompanying notes to consolidated financial statements. | ||||||||||||
AS OF AND FOR THE YEARS ENDED DECEMBERDecember 31, 2017, 2016 AND 20152023 and 2022
| 1. | DESCRIPTION OF BUSINESS AND SUMMARY OF SIGNIFICANT ACCOUNTING POLICIES |
Bel Fuse Inc. and subsidiaries ("Bel," the "Company,"
All amounts included in the tables to these notes to consolidated financial statements, except per share amounts, are in thousands.
Principles of Consolidation
- The consolidated financial statements include all of the accounts of the Company and its wholly owned subsidiaries. All intercompany transactions and balances have been eliminated in consolidation.Estimates
and Uncertainties - The preparation of the consolidated financial statements in conformity with accounting principles generally accepted in the United States of America ("U.S. GAAP") requires us to make estimates and judgments that affect the reported amounts of assets, liabilities, revenues and expenses, and related disclosure of contingent assets and liabilities. On an on-going basis, we evaluate our estimates, including but not limited to those related to product returns, provisions for bad debt, inventories, goodwill, intangible assets, investments, Supplemental Executive Retirement Plan ("SERP") expense, income taxes, contingenciesCash, Cash Equivalents
and Investments - Cash equivalents include short-term investments in money market funds and certificates of deposit with an original maturity of three months or less when purchased.The Company has held to maturity securities comprised of U.S. Treasury Bills. These investments are classified as held to maturity as the Company has the intent and ability to hold these investments until they mature. The held to maturity securities mature within the next 12 months. The table below shows the amortized costs, associated gross unrealized gains and associated fair value of the held to maturity securities at December 31, 2023:
Amortized Cost | Gross Unrealized Gain | Fair Value | ||||||||||
Held to maturity U.S. Treasury securities | $ | 37,548 | $ | 103 | $ | 37,651 | ||||||
In determining the fair value of the Company's held to maturity U.S. Treasury securities, the Company utilized Level 1 inputs of the market price for comparable securities as of December 31 2023.
Allowance for Doubtful Accounts
Effects of Foreign Currency
– In non-U.S. locations that are not considered highly inflationary, we translate the non-equity components of our foreign balance sheets at the end of period exchange rates with translation adjustments accumulated within stockholders' equity on our consolidated balance sheets. We translate the statements of operations at the average exchange rates during the applicable period. In connection with foreign currency denominated transactions, including multi-currency intercompany payable and receivable transactions and loans, the Company incurred a net realized and unrealized currency exchangeConcentration of Credit Risk
- Financial instruments which potentially subject us to concentrations of credit risk consist principally of accounts receivable and temporary cash investments. We grant credit to customers that are primarily original equipment manufacturers,Inventories
- Inventories are stated at the lower ofRevenue Recognition
– Revenue is recognized when a customer obtains control of promised goods or services. The amount of revenue recognized reflects theProduct Warranties
– Warranties vary by product line and are competitive for the markets in which the Company operates. Warranties generally extend for one to three years from the date ofProduct Returns – We estimate product returns, including product exchanges under warranty, based on historical experience. In general, the Company is not contractually obligated to accept returns except for defective product or in instances where the product does not meet the Company's product specifications. However, the Company may permit its customers to return product for other reasons. In certain instances, the Company would generally require a significant cancellation penalty payment by the customer. The Company estimates such returns, where applicable, based upon management's evaluation of historical experience, market acceptance of products produced and known negotiations with customers. Such estimates are deducted from sales and provided for at the time revenue is recognized. Distribution customers often receive what is referred to as "ship and debit" arrangements, whereby Bel will invoice them at an agreed upon unit price upon shipment of product and a price reduction may be granted if the market price of the product declines after shipment. Distributors may also be entitled to special pricing discount credits, and certain customers are entitled to return allowances based on previous sales volumes. Bel deducts estimates for anticipated credits, refunds and returns from sales each quarter based on historical experience.
Goodwill and Identifiable Intangible Assets
– Goodwill represents the excess of the aggregate of theIdentifiable intangible assets consist primarily of patents, licenses, trademarks, trade names, customer lists and relationships, non-compete agreements and technology basedtechnology-based intangibles and other contractual agreements. We amortize finite livedfinite-lived identifiable intangible assets over the shorter of their stated or statutory duration or their estimated useful lives, ranging from 21 to 1916 years, on a straight-line basis to their estimated residual values and periodically review them for impairment. Total identifiable intangible assets comprise 16.1% 8.6% and 9.7% at December 31, 2023 and 17.5% in 2017 and 2016,2022, respectively, of our consolidated total assets.
We use the acquisition method of accounting for allthose business combinations andin which we acquire 100% of the equity. We do not amortize goodwill or intangible assets with indefinite useful lives. Goodwill and intangible assets with indefinite useful lives are tested for possible impairment annually during the fourth quarter of each fiscal year or more frequently if events or changes in circumstances indicate that the asset might be impaired.
Impairment and Disposal of Long-Lived Assets – For definite-lived intangible assets, such as customer relationships, contracts, intellectual property, and for other long-lived assets, such as property, plant and equipment, whenever impairment indicators are present, we perform a review for impairment. We calculate the undiscounted value of the projected cash flows associated with the asset, or asset group, and compare this estimated amount to the carrying amount. If the carrying amount is found to be greater, we record an impairment loss for the excess of book value over the fair value. In addition, in all cases of an impairment review, we re-evaluate the remaining useful lives of the assets and modify them, as appropriate.
For indefinite-lived intangible assets, such as goodwill, trademarks and trade names, each year and whenever impairment indicators are present, we determine the fair value of the asset and record an impairment loss for the excess of book value over the fair value, if any. In addition, in all cases of an impairment review we re-evaluate whether continuing to characterize the asset as indefinite-lived is appropriate. See Note 4, "Goodwill5,"Goodwill and Other Intangible Assets," for additional details.
Depreciation
- Property, plant and equipment are stated at cost less accumulated depreciation and amortization. Depreciation and amortization are calculated primarily using the straight-line method over the estimated useful life of the asset. The estimated useful lives primarily rangeDerivative Financial Instruments - As part of our risk management strategy, when considered appropriate, the Company uses derivative financial instruments including foreign currency forward contracts and interest rate swap agreements to hedge against certain foreign currency and interest rate exposures. The intent is to mitigate gains and losses caused by the underlying exposures with offsetting gains and losses on the derivative contracts. By policy, Bel does not enter into speculative positions with derivative instruments.
The Company records all derivatives as assets or liabilities on our consolidated balance sheets at their fair values. Gains and losses from the changes in values of these derivatives are accounted for based on the use of the derivative and whether it qualifies for hedge accounting. The Company's interest rate swaps and foreign currency forward contracts related to the Chinese renminbi (both further described in Note 13,"Derivative Instruments and Hedging Activities") have been designated as cash flow hedges and as such, gains/losses are recorded in accumulated other comprehensive income until such time the hedged item affects earnings.
The counterparties to our derivative financial instruments consist of several major international financial institutions. We regularly monitor the financial strength of these institutions. While the counterparties to these contracts expose us to the potential risk of credit-related losses in the event of a counterparty’s non-performance, the risk would be limited to the unrealized gains on such affected contracts.
Income Taxes
- We account for income taxes under the asset and liability method, which requires the recognition of deferred tax assets and liabilities for the expected future tax consequences of events that have been included in the consolidated financial statements. Under this method, deferred tax assets and liabilities are determined based on the differences between the financial statement and tax bases of assets and liabilities using enacted tax rates in effect for the year in which the differences are expected to reverse. The effect of a change in tax rates on deferred tax assets and liabilities is recognized in income in the period that includes the enactment date. See NoteEarnings per Share
– We utilize theThe earnings and weighted average shares outstanding used in the computation of basic and diluted earnings per share are as follows:
| 2017 | 2016 | 2015 | ||||||||||
| Numerator: | ||||||||||||
| Net (loss) earnings | $ | (11,897 | ) | $ | (64,834 | ) | $ | 19,197 | ||||
| Less dividends declared: | ||||||||||||
| Class A | 522 | 522 | 522 | |||||||||
| Class B | 2,757 | 2,728 | 2,713 | |||||||||
| Undistributed (loss) earnings | $ | (15,176 | ) | $ | (68,084 | ) | $ | 15,962 | ||||
| Undistributed (loss) earnings allocation - basic and diluted: | ||||||||||||
| Class A undistributed (loss) earnings | $ | (2,635 | ) | $ | (11,930 | ) | $ | 2,809 | ||||
| Class B undistributed (loss) earnings | (12,541 | ) | (56,154 | ) | 13,153 | |||||||
| Total undistributed (loss) earnings | $ | (15,176 | ) | $ | (68,084 | ) | $ | 15,962 | ||||
| Net (loss) earnings allocation - basic and diluted: | ||||||||||||
| Class A net (loss) earnings | $ | (2,113 | ) | $ | (11,408 | ) | $ | 3,331 | ||||
| Class B net (loss) earnings | (9,784 | ) | (53,426 | ) | 15,866 | |||||||
| Net (loss) earnings | $ | (11,897 | ) | $ | (64,834 | ) | $ | 19,197 | ||||
| Denominator: | ||||||||||||
| Weighted average shares outstanding: | ||||||||||||
| Class A - basic and diluted | 2,175 | 2,175 | 2,175 | |||||||||
| Class B - basic and diluted | 9,857 | 9,749 | 9,698 | |||||||||
| Net (loss) earnings per share: | ||||||||||||
| Class A - basic and diluted | $ | (0.97 | ) | $ | (5.25 | ) | $ | 1.53 | ||||
| Class B - basic and diluted | $ | (0.99 | ) | $ | (5.48 | ) | $ | 1.64 | ||||
Years Ended December 31, | ||||||||
2023 | 2022 | |||||||
Numerator: | ||||||||
Net earnings | $ | 73,831 | $ | 52,689 | ||||
Less dividends declared: | ||||||||
Class A | 512 | 514 | ||||||
Class B | 2,997 | 2,922 | ||||||
Undistributed earnings | $ | 70,322 | $ | 49,253 | ||||
Undistributed earnings allocation: | ||||||||
Class A undistributed earnings | $ | 11,318 | $ | 8,084 | ||||
Class B undistributed earnings | 59,004 | 41,169 | ||||||
Total undistributed earnings | $ | 70,322 | $ | 49,253 | ||||
Net earnings allocation: | ||||||||
Class A net earnings | $ | 11,830 | $ | 8,598 | ||||
Class B net earnings | 62,001 | 44,091 | ||||||
Net earnings | $ | 73,831 | $ | 52,689 | ||||
Denominator: | ||||||||
Weighted average shares outstanding: | ||||||||
Class A | 2,142 | 2,143 | ||||||
Class B | 10,634 | 10,394 | ||||||
Net earnings per share: | ||||||||
Class A | $ | 5.52 | $ | 4.01 | ||||
Class B | $ | 5.83 | $ | 4.24 | ||||
Research and Development ("R&D")
- Our engineering groups are strategically located around the world to facilitate communication with and access to customers' engineering personnel. This collaborative approach enables partnerships with customers for technical development efforts. On occasion, we execute non-disclosure agreements with our customers to help develop proprietary, next generation products destined for rapid deployment. R&D costs are expensed as incurred, and areFair Value Measurements
- We utilize the accounting guidance for fair value measurements and disclosures for all financial assets and liabilities and nonfinancial assets and liabilities that are recognized or disclosed at fair value in the consolidated financial statements on a recurring basis or on a nonrecurring basis during the reporting period. The fair value is an exit price, representing the price that would be received to sell an asset or paid to transfer a liability in an orderly transaction between market participants based upon the best use of the asset or liability at the measurement date. The Company utilizes market data or assumptions that market participants would use in pricing the asset or liability. We classify our fair value measurements based on the lowest level of input included in the establishedLevel 1
- Observable inputs such as quoted market prices in active marketsLevel 2
- Inputs other than quoted prices in active markets that are either directly or indirectly observableLevel 3
- Unobservable inputs about which little or no market data exists, therefore requiring an entity to develop its own assumptionsFor financial instruments such as cash and cash equivalents, accounts receivable, accounts payable and accrued expenses, and notes payable, the carrying amount approximates fair value because of the short maturities of such instruments. See Note 5, "Fair6,"Fair Value Measurements," for additional disclosures related to fair value measurements.
Recently Issued Accounting Standards
Recently Adopted Accounting Standards
In March 2016, 2020, the Financial Accounting Standards Board (FASB) issued Accounting Standard Update (ASU) 2020-04,Reference Rate Reform (Topic 848): Facilitation of the Effects of Reference Rate Reform on Financial Reporting. ASU 2020-04 provides temporary optional guidance on contract modifications and hedging accounting to ease the financial reporting burdens of the market transition from the London Interbank Offered Rate (“LIBOR”) to alternative reference rates. In January 2021, the FASB
In July 2015, June 2016, the FASB issued ASU 2015-11, Simplifying the2016-13,Financial Instruments Credit Losses (Topic 326): Measurement of InventoryCredit Losses on Financial Instruments, which requires entities to measure most inventory atas amended. The new guidance broadens the lower of cost and net realizable value, thereby simplifying the current guidance under whichinformation that an entity must measure inventory at the lower of cost or market. The updateconsider in developing its expected credit loss estimates related to its financial instruments and adds to U.S. GAAP an impairment model that is effective for fiscal years beginning after December 15, 2016, and interim periods therein. We adopted this guidancebased on expected losses rather than incurred losses. On January 1, 2017.2023, the Company adopted ASU 2016-13. The adoption of this guidancestandard did not have a material impact on the Company's condensed consolidated financial statements.
Accounting Standards Issued But Not Yet Adopted
In June 2014, November 2023, the FASB issued ASU 2014-12, Compensation – Stock Compensation2023-07,Segment Reporting (Topic 718)280): Accounting for Share-Based Payments When the Terms of an Award Provide That a Performance Target Could Be Achieved after the Requisite Service Period. The amendment requires that a performance target that affects vesting and that could be achieved after the requisite service period be treated as a performance condition. A reporting entity should apply existing guidance in Topic 718 as it relatesImprovements to awards with performance conditions that affect vesting to account for such awards. Compensation cost should be recognized in the period in which it becomes probable that the performance target will be achieved and should represent the compensation cost attributable to the period(s) for which the requisite service has already been rendered. This guidance was adopted by the Company effective January 1, 2016 and it did not have any impact on the Company's consolidated financial position or results of operations.
In January 2017, December 2023, the FASB issued ASU 2017-01, Business Combinations2023-09,Income Taxes (Topic 805)740): ClarifyingImprovements to Income Tax Disclosures, which focuses on the Definition ofrate reconciliation and income taxes paid. ASU 2023-09 requires a Business ("ASU 2017-01"),public business entity (PBE) to clarifydisclose, on an annual basis, a tabular rate reconciliation using both percentages and currency amounts, broken out into specified categories with certain reconciling items further broken out by nature and jurisdiction to the definition ofextent those items exceed a business with the objective of adding guidance to assistspecified threshold. In addition, all entities with evaluating whether transactions should be accounted for as acquisitions (or disposals) of assets or businesses. The definition of a business affects many areas of accounting including acquisitions, disposals, goodwill and consolidation. ASU 2017-01 provides a framework that gives entities a basis for making reasonable judgments about whether a transaction involves an asset or a business. The Company isare required to adopt ASU 2017-01 for periods beginning after December 15, 2017, including interim periods,disclose income taxes paid, net of refunds received disaggregated by federal, state/local, and foreign and by jurisdiction if the guidanceamount is to be applied on a prospective basis. Early applicationat least 5% of total income tax payments, net of refunds received. For PBEs, the new standard is permitted for transactions for which the acquisition date occurs before the issuance date or effective date of the amendments, only when the transaction has not been reported in financial statements that have been issued.
2. | INVESTMENT IN INNOLECTRIC |
On January 23, 2015, February 1, 2023, the Company completed the saleclosed on a noncontrolling (one-third) investment in Germany-based innolectric AG (“innolectric”) for consideration of €8.0 million (approximately $8.8 million as of the Network Power Systems ("NPS") product line and related transactions of the acquired Power Solutions business to Unipower LLC ("Unipower") for $9.0 million in cash. The sale also included $1.0 million of escrow pending Unipower's realization of certain sales targets. The net proceeds of $9.0 million from the sale were used to repay outstanding borrowings in accordance with the provisions of the Credit and Security Agreement (see Note 10, "Debt")February 2023 closing). The transaction provided that Bel would move processes and people to Unipower under an interim transition services agreement and that Bel would also continue to manufacture the NPS products for up to 24 months under a manufacturing services agreement.
| 2016 | 2017 | |||||||||||||||||||||||||||
| Liability at | Cash Payments | Liability at | Cash Payments | Liability at | ||||||||||||||||||||||||
| December 31, | New | and Other | December 31, | New | and Other | December 31, | ||||||||||||||||||||||
| 2015 | Charges | Settlements | 2016 | Charges | Settlements | 2017 | ||||||||||||||||||||||
| Severance costs | $ | 110 | $ | 1,407 | $ | (929 | ) | $ | 588 | $ | 86 | $ | (674 | ) | $ | - | ||||||||||||
| Other restructuring costs | - | 2 | (2 | ) | - | 51 | (51 | ) | - | |||||||||||||||||||
| Total | $ | 110 | $ | 1,409 | $ | (931 | ) | $ | 588 | $ | 137 | $ | (725 | ) | $ | - | ||||||||||||
This passive investment creates a leased facility locatedstrategic alliance that is focused on Electric Vehicles (“EV”) on-board power electronics, and in Shanghai, Chinaparticular next generation fast-charging technology. With no product overlap, this relationship expands the Bel eMobility Power portfolio, further enhancing Bel's competitive position in this emerging field. Our investment in innolectric is accounted for using the equity method and we have determined that the innolectric investment is not a variable interest entity (VIE). Results from this investment have been included in Bel's Power Solution and Protection segment and amounted to a loss of $0.8 million during the year ended December 31, 2023. The Company adopted a policy to record its share of innolectric's results on a one-month lag on a consistent basis to allow time for innolectric to provide its financial statements to Bel.
Related Party Transactions
From time to time, the Company provides cash loans to innolectric to fund working capital needs and further business development. During 2023, the Company provided loans to innolectric in the aggregate amount of €2.0 million (approximately $2.1 million at the December 31, 2023 exchange rate). These loans bear interest at a rate of 5% per annum. This balance is shown as a related-party note receivable on the accompanying consolidated balance sheet at December 31, 2023.
| 3. | DIVESTITURE OF SUBSIDIARY |
On June 1, 2023, the Company completed its divestment of Bel Stewart s.r.o., a former subsidiary in the Czech Republic which arehas historically been reported within Bel’s Connectivity Solutions segment. The business was sold to PEI Genesis (“PEI”) for total consideration of $5.1 million, subject to working capital adjustments. The divestment of this non-core business was a strategic decision which allows the Connectivity Solutions segment to focus on its main product categories serving customer end markets such as commercial air, defense, industrial and networking which better align with its long-term growth objectives.
The carrying amounts of the major classes of assets and liabilities included as restructuring chargespart of the sale were as follows:
Total | ||||
Cash and cash equivalents | $ | 2,072 | ||
Accounts receivable | 1,030 | |||
Inventories | 1,310 | |||
Property, plant and equipment | 326 | |||
Other assets | 48 | |||
Accounts payable | (441 | ) | ||
Accrued expenses | (126 | ) | ||
Income taxes payable | (100 | ) | ||
Other current liabilities | (13 | ) | ||
Other long-term liabilities | (23 | ) | ||
Total net assets transferred | 4,083 | |||
Consideration received | 5,063 | |||
Gain on sale recognized | $ | 980 | ||
| 4. | REVENUE |
Nature of Goods and Services
Our revenues are substantially derived from sales of our products.
In our Power Solutions and Protection product group, we provide AC/DC and DC/DC power conversion devices and circuit protection products. Applications range from board-mount power to system-level architectures for servers, storage, networking, industrial and transportation.
In our Connectivity Solutions product group, we provide connectors and cable assemblies to the aerospace, military/defense, commercial, rugged harsh environment and communication markets. This group also includes passive jacks, plugs and cable assemblies that provide connectivity in networking equipment, as well as modular plugs and cable assemblies used within the structured cabling system, known as premise wiring.
In our Magnetic Solutions product group, we provide an extensive line of integrated connector modules (ICM), where an Ethernet magnetic solution is integrated into a connector package. Products within the Company's Magnetic Solutions group are primarily used in networking and industrial applications.
The Company also provides incremental services to our customers in the form of training, technical support, special tooling, and other support as deemed necessary from time to time. For purposes of ASC 606, all such incremental services were concluded to be immaterial in the context of the contracts.
Types of Contracts
Substantially all of the Company's revenue is derived from contracts with its customers under one of the following types of contracts:
• | Direct with customer: This includes contracts with original equipment manufacturers (OEMs), original design manufacturers (ODMs), and contract manufacturers (CMs). The nature of Bel's products are such that they represent components which are installed in various end applications (e.g., servers, aircraft, missiles and rail applications). The OEMs, ODMs or CMs that purchase our product for further installation are our end customers. Contracts with these customers are broad-based and cover general terms and conditions. Details such as order volume and pricing are typically contained in individual purchase orders, and as a result, we view each product on each purchase order as an individual performance obligation. Incremental services included in the contracts, such as training, tooling and other customer support are determined to be immaterial in the context of the contract, both individually and in the aggregate. Revenue under these contracts is generally recognized at a point in time, generally upon shipping or delivery, which closely mirrors the shipping terms dictated by the applicable contract. |
| • | Distributor: Distribution customers buy product directly from Bel and sell it in the marketplace to end customers. Bel contracts directly with the distributor. These contracts are typically global in nature and cover a variety of our product groups. Similar to contracts with OEMs, ODMs and CMs, each product on each purchase order is considered an individual performance obligation. Revenue is recognized at a point in time, generally upon shipping or delivery, which closely mirrors the shipping terms dictated by the applicable contract. |
| • | Customer-Designated Hub Arrangements: These customers operate under a type of concession agreement whereby the Company ships goods to a warehouse or hub, where they will be pulled by the customer at a later date. The terms specified in the customer-designated hub contracts specify that the Company will not invoice the customer for product until it is pulled from the warehouse or hub. Once product arrives at the hub, it is generally not returned to Bel unless there is a warranty issue (see Note 1,"Description of Business and Summary of Significant Accounting Policies - Product Warranties" above). Similar to the contracts described above, each product on each purchase order is considered an individual performance obligation. Under ASC 606, it was determined that the majority of these hubs are customer-controlled, and therefore control transfers to the customer upon either delivery from Bel's warehouse, or arrival at the customer-controlled hub, depending upon the applicable shipping terms. Revenue is therefore recognized as control of the product is transferred to the customer (for customer-controlled hubs, this is at the time product is shipped to the hub). The accompanying consolidated balance sheet reflects a corresponding unbilled receivable balance, as we do not have the right to invoice the customer until product is pulled from the hub. |
| • | Licensing Agreements: License agreements are only applicable to our Power Solutions and Protection product group, and include provisions for Bel to receive sales-based royalty income related to the licensing of Bel's patents or other intellectual property (IP) utilized by a third-party entity. Income related to these agreements is tracked by the licensee throughout the year based on their sales of product that utilize Bel's IP, and that data is reported to Bel either on a quarterly or annual basis, with payment generally received within 30 days of the reporting date. Our performance obligation is satisfied upon delivery of the IP at the beginning of the license period, as the licenses are functional in nature. However, the recognition of revenue associated with these licenses is subject to the sales- or usage-based constraint on variable consideration. As such, the Company records a constrained estimate of this variable consideration as royalty income in the period of the underlying customers' product sales, with adjustments made as actual licensee sales data becomes available. |
Significant Payment Terms
Contracts with customers indicate the general terms and conditions in which business will be conducted for a set period of time. Individual purchase orders state the description, quantity and price of each product purchased. Payment for products sold under direct contracts with customers or contracts with distributors is typically due in full within 30-90 days from the transfer of title to the customer. Payment for products sold under our customer-designated hub arrangements is typically due within 60 days of the customer pulling the product from the hub. Payment due related to our licensing agreements is generally within 30 days of receiving the licensee sales data, which is either on a quarterly or annual basis.
Since the customer agrees to a stated price for each product on each purchase order, the majority of contracts are not subject to variable consideration. However, the "ship and debit" arrangements with distributors, royalty income associated with our licensing agreements, and the product returns described above are each deemed to be variable consideration which requires the Company to make constrained estimates based on historical data.
Disaggregation of Revenue
The following table provides information about disaggregated revenue by geographic region and sales channel, and includes a reconciliation of the disaggregated revenue to our reportable segments:
Year Ended December 31, 2023 | ||||||||||||||||
Power Solutions | Connectivity | Magnetic | ||||||||||||||
and Protection | Solutions | Solutions | Consolidated | |||||||||||||
By Geographic Region: | ||||||||||||||||
North America | $ | 233,016 | $ | 172,518 | $ | 42,259 | $ | 447,793 | ||||||||
Europe | 57,567 | 32,689 | 8,263 | 98,519 | ||||||||||||
Asia | 23,522 | 5,365 | 64,614 | 93,501 | ||||||||||||
| $ | 314,105 | $ | 210,572 | $ | 115,136 | $ | 639,813 | |||||||||
By Sales Channel: | ||||||||||||||||
Direct to customer | $ | 221,828 | $ | 130,893 | $ | 86,608 | $ | 439,329 | ||||||||
Through distribution | 92,277 | 79,679 | 28,528 | 200,484 | ||||||||||||
| $ | 314,105 | $ | 210,572 | $ | 115,136 | $ | 639,813 | |||||||||
Year Ended December 31, 2022 | ||||||||||||||||
Power Solutions | Connectivity | Magnetic | ||||||||||||||
and Protection | Solutions | Solutions | Consolidated | |||||||||||||
By Geographic Region: | ||||||||||||||||
North America | $ | 217,381 | $ | 141,585 | $ | 50,234 | $ | 409,200 | ||||||||
Europe | 42,121 | 35,596 | 10,903 | 88,620 | ||||||||||||
Asia | 28,864 | 9,904 | 117,645 | 156,413 | ||||||||||||
| $ | 288,366 | $ | 187,085 | $ | 178,782 | $ | 654,233 | |||||||||
By Sales Channel: | ||||||||||||||||
Direct to customer | $ | 186,439 | $ | 112,128 | $ | 135,247 | $ | 433,814 | ||||||||
Through distribution | 101,927 | 74,957 | 43,535 | 220,419 | ||||||||||||
| $ | 288,366 | $ | 187,085 | $ | 178,782 | $ | 654,233 | |||||||||
Contract Assets and Contract Liabilities:
A contract asset results when goods or services have been transferred to the customer but payment is contingent upon a future event, other than passage of time. In the case of our customer-controlled hub arrangements, we are unable to invoice the customer until product is pulled from the hub by the customer, which generates an unbilled receivable (a contract asset) when revenue is initially recognized.
A contract liability results when cash payments are received or due in advance of our performance obligation being met. We have certain customers who provide payment in advance of product being shipped, which results in deferred revenue (a contract liability).
The balances of the Company's contract assets and contract liabilities at December 31, 2023 and December 31, 2022 are as follows:
December 31, | December 31, | |||||||
2023 | 2022 | |||||||
Contract assets - current (unbilled receivables) | $ | 12,793 | $ | 18,244 | ||||
Contract liabilities - current (deferred revenue) | $ | 3,046 | $ | 8,847 | ||||
The change in balance of our unbilled receivables from December 31, 2022 to December 31, 2023 primarily relates to a timing difference between the Company's performance (i.e. when our product is shipped to a customer-controlled hub) and the point at which the Company can invoice the customer per the terms of the customer contract (i.e. when the customer pulls our product from the customer-controlled hub). The deferred revenue balance is included within other current liabilities on the consolidated statementaccompanying balance sheets.
A tabular presentation of operations during 2016the activity within the deferred revenue account for the year ended December 31, 2023 is presented below:
Year Ended | ||||
December 31, 2023 | ||||
Balance, January 1 | $ | 8,847 | ||
New advance payments received | 4,121 | |||
Recognized as revenue during period | (9,930 | ) | ||
Currency translation | 8 | |||
Balance, December 31 | $ | 3,046 | ||
Transaction Price Allocated to Future Obligations:
The aggregate amount of transaction price allocated to remaining performance obligations that have not been fully satisfied as of December 31, 2023 related to contracts that exceed one year in duration amounted to $4.4 million, with expected contract expiration dates that range largely from 2025 – 2026. It is expected that $2.4 million of this aggregate amount will be recognized in 2025, $1.9 million will be recognized in 2026 and 2017, respectively.the remainder will be recognized in years beyond 2026. The majority of the Company's orders received (but not yet shipped) at December 31, 2023 is related to contracts that have an original expected duration of one year or less, for which the Company is electing to utilize the practical expedient available within the guidance, and are excluded from the transaction price related to these future obligations. The Company will generally satisfy the remaining performance obligations as we transfer control of the products ordered to our customers.
5. | GOODWILL AND OTHER INTANGIBLE ASSETS |
Goodwill
Goodwill represents the excess of the purchase price and related acquisition costs over the fair value assigned to the net tangible and other intangible assets acquired in a business acquisition.
| • | Power Solutions and Protection: includes the 2012 acquisition of Powerbox Italia, the 2014 acquisition of ABB's Power Solutions business, the 2019 acquisition of the majority of CUI Inc.'s power products business, the 2021 acquisition of EOS, the 2023 equity method investment in innolectric, in addition to sales and an estimated allocation of expenses related to power products manufactured at Bel sites that are not product group specific. | |
| • | Connectivity Solutions: includes the 2010 acquisition of Cinch Connectors, the 2012 acquisitions of Fibreco Limited and GigaCom Interconnect, the 2013 acquisition of Array Connector, the 2014 acquisition of Emerson Network Power Connectivity Solutions, the 2021 acquisition of rms Connectors, in addition to sales and an estimated allocation of expenses related to connectivity products manufactured at Bel sites that are not product group specific. | |
| • | Magnetic Solutions: includes the 2013 acquisition of TE Connectivity's Coil Wound Magnetics business, our Signal Transformer business, in addition to sales and an estimated allocation of expenses related to Bel's ICM and discrete magnetic products that are manufactured at Bel sites that are not product group specific. |
The changes in the carrying value of goodwill classified by our segment reporting structure for the yearsyear ended December 31, 2017 and 20162023 are as follows:
| Total | North America | Asia | Europe | |||||||||||||
| Balance at January 1, 2016: | ||||||||||||||||
| Goodwill, gross | 148,575 | 63,364 | 54,532 | 30,679 | ||||||||||||
| Accumulated impairment charges | (26,941 | ) | (14,066 | ) | (12,875 | ) | - | |||||||||
| Goodwill, net | $ | 121,634 | $ | 49,298 | $ | 41,657 | $ | 30,679 | ||||||||
| Impairment charge | (101,650 | ) | (40,408 | ) | (41,633 | ) | (19,609 | ) | ||||||||
| Foreign currency translation | (2,033 | ) | - | (24 | ) | (2,009 | ) | |||||||||
| Balance at December 31, 2016: | ||||||||||||||||
| Goodwill, gross | 146,542 | 63,364 | 54,508 | 28,670 | ||||||||||||
| Accumulated impairment charges | (128,591 | ) | (54,474 | ) | (54,508 | ) | (19,609 | ) | ||||||||
| Goodwill, net | $ | 17,951 | $ | 8,890 | $ | - | $ | 9,061 | ||||||||
| Foreign currency translation | 2,226 | - | - | 2,226 | ||||||||||||
| Balance at December 31, 2017: | ||||||||||||||||
| Goodwill, gross | 148,768 | 63,364 | 54,508 | 30,896 | ||||||||||||
| Accumulated impairment charges | (128,591 | ) | (54,474 | ) | (54,508 | ) | (19,609 | ) | ||||||||
| Goodwill, net | $ | 20,177 | $ | 8,890 | $ | - | $ | 11,287 | ||||||||
Total | Power Solutions & Protection | Connectivity Solutions | Magnetic Solutions | |||||||||||||
Balance at January 1, 2023: | ||||||||||||||||
Goodwill, gross | $ | 25,099 | $ | 18,152 | $ | 6,947 | $ | - | ||||||||
Goodwill, net | $ | 25,099 | $ | 18,152 | $ | 6,947 | $ | - | ||||||||
Foreign currency translation | 1,543 | 471 | 1,072 | - | ||||||||||||
Balance at December 31, 2023: | ||||||||||||||||
Goodwill, gross | $ | 26,642 | $ | 18,623 | $ | 8,019 | $ | - | ||||||||
Goodwill, net | $ | 26,642 | $ | 18,623 | $ | 8,019 | $ | - | ||||||||
The Company has accumulated impairment charges totaling $137.5 million, which were incurred under a former segment and reporting unit structure which was in place prior to October 1, 2019.
As discussed in Note 5, 6, "Fair Value Measurements,Measurements", goodwill is reviewed for impairment on a reporting unit basis annually during the fourth quarter of each year and whenever events or changes in circumstances indicate the carrying value of goodwill may not be recoverable. TheIn testing goodwill for impairment, we may perform both a qualitative assessment and quantitative assessment. For the qualitative test, involvesthe assessment is based on a two-step process. In the first step, the fair valuereview of eachgeneral macroeconomic conditions, industry and market conditions, changes in cost factors, overall financial performance (both actual and expected performance) and other reporting unit is compared to its carrying value. If the fair value of the reporting unit exceeds its carrying value, goodwill is not impaired and no further testing is required. If the fair value of the reporting unit is less thanunit-specific events such as significant changes in management, customers, litigation or a change in the carrying value, the second step of the impairment test must be performed to measure the amount of net assets. If it is determined that a potential impairment loss.may exist, we would proceed with a quantitative assessment. In the second step, the reporting unit's fair value is allocatedcases where we elect to all of the assets and liabilities of the reporting unit, including any unrecognized intangible assets, inperform a hypothetical analysis that calculates the implied fair value of goodwill in the same manner as if the reporting unit was being acquired in a business combination. If the implied fair value of the reporting unit's goodwill is less than the carrying value, the difference is recorded as an impairment loss and a reduction to goodwill.
2023 Annual Impairment Test
On October 1, 2023, the fourth quarter of 2017, the CompanyCompany completed step onea quantitative assessment of our annual goodwill impairment test for our four existing reporting units. We concluded that the fair value of each of the Company's Connectivity Europe, Power Europe, EOS and CUI reporting units exceeded the respective carrying valuesvalue and that there was no indication of impairment.
The excess of estimated fair values over carrying value, including goodwill for each of our former reporting units that had goodwill as of the 20172023 annual impairment test were as follows:
Reporting Unit | % by Which Estimated Fair Value Exceeds Carrying Value | |||
Power Europe | 89.1% | |||
Connectivity Europe | 79.9% | |||
EOS | 71.2% | |||
CUI | 169.4% | |||
2022 Impairment Tests
The Company performed a qualitative assessment as of October 1, 2022 related to its EOS reporting unit, as the first quarter of 2016, management determined that sufficient indicators of potential impairment existed to require an interim goodwill impairment analysis for all of the Company's reporting units. These indicators included the recent business performance of those reporting units, combined with the long-term market conditions and business trends within the reporting units.
On October 1, 2022, the rangeCompany completed a quantitative assessment of assumptions utilized across the various reporting units.
| Goodwill Impairment Analysis | |||||
| Key Assumptions | |||||
| 2016 - Interim | 2015 - Annual | ||||
| Income Approach - Discounted Cash Flows (a): | |||||
| Revenue 5-year compound annual growth rate (CAGR) | (9.0%) - (0.6%) | 2.6% - 2.7% | |||
| 2016 EBITDA margins (b) | 5.1% - 6.6% | 7.2% - 8.4% | |||
| Cost of equity capital | 11.6% - 14.7% | 12.3% - 16.5% | |||
| Cost of debt capital | 3.6% - 8.5% | 2.4% - 5.9% | |||
| Weighted average cost of capital | 10.0% - 14.0% | 11.0% - 15.0% | |||
| Market Approach - Multiples of Guideline Companies (a): | |||||
| Net operating revenue multiples used | 0.4 - 0.6 | 0.4 - 0.5 | |||
| Operating EBITDA multiples used (b) | 5.9 - 6.3 | 5.0 - 5.3 | |||
| Invested capital control premium | 25% | 25% | |||
| Weighting of Valuation Methods: | |||||
| Income Approach - Discounted Cash Flows | 75% | 75% | |||
| Market Approach - Multiples of Guideline Companies | 25% | 25% | |||
| (a) Ranges noted reflect assumptions and multiples used throughout the North America, Asia and Europe reporting units | |||||
| (b) EBITDA represents earnings before interest, taxes, depreciation and amortization. EBITDA margin is calculated by | |||||
| dividing EBITDA by net sales. | |||||
As noted above, the fair value determined under step one ofin connection with the goodwill impairment test completed in the fourth quarter of 20172023 exceeded the carrying value for each reporting unit. Therefore, there was no impairment of goodwill. However, if the fair value decreases in future periods, the Company may fail step one of theneed to complete an interim goodwill impairment test and be required to perform step two. In performing step two, the fair value would have to be allocated to all of the assets and liabilities of the reporting unit. Therefore, any potential goodwill impairment charge would be dependent upon the estimated fair value of the reporting unit at that time and the outcome of step two of the impairmentimpairment test. The fair values of the assets and liabilities of the reporting unit, including the intangible assets, could vary depending on various factors.
The future occurrence of a potential indicator of impairment, such as a decrease in expected net earnings, adverse equity market conditions, a decline in current market multiples, a declinesustained decrease in the price of our common stock, price, a significant adverse change in legal factors or business climates, an adverse action or assessment by a regulator, unanticipated competition, strategic decisions made in response to economic or competitive conditions, or a more-likely-than-notmore-likely-than-not expectation that a reporting unit or a significant portion of a reporting unit will be sold or disposed of, could require an interim assessment for some or all of the reporting units before the next required annual assessment. In the event of significant adverse changes of the nature described above, it may be necessary for us to recognize an additional non-cash impairment of goodwill, which could have a material adverse effect on our consolidated financial condition and consolidated results of operations.
Other Intangible Assets
Other identifiable intangible assets include patents, technology, license agreements, non-compete agreements and trademarks. Amounts assigned to these intangible assets have been determined by management. Management considered a number of factors in determining the allocations, including valuations and independent appraisals. Trademarks have indefinite lives and are reviewed for impairment on an annual basis.basis, or when there is a triggering event. Other intangible assets, excluding trademarks, are being amortized over 21 to 19 years.
The Company tests indefinite-lived intangible assets for impairment using a fair value approach, the relief-from-royalty method (a form of the income approach). At December 31, 2017,2023, the Company's indefinite-lived intangible assets related to the trademarks acquired in the CUI, Power Solutions, Connectivity Solutions, Cinch and Fibreco acquisitions.
The components of definite and indefinite-lived intangible assets are as follows:
| December 31, 2017 | December 31, 2016 | |||||||||||||||||||||||
| Gross Carrying | Accumulated | Net Carrying | Gross Carrying | Accumulated | Net Carrying | |||||||||||||||||||
| Amount | Amortization | Amount | Amount | Amortization | Amount | |||||||||||||||||||
| Patents, licenses and technology | $ | 39,218 | $ | 14,926 | $ | 24,292 | $ | 38,658 | $ | 11,276 | $ | 27,382 | ||||||||||||
| Customer relationships | 44,704 | 11,478 | 33,226 | 43,821 | 8,302 | 35,519 | ||||||||||||||||||
| Non-compete agreements | 2,711 | 2,711 | - | 2,667 | 2,376 | 291 | ||||||||||||||||||
| Trademarks | 11,888 | 40 | 11,848 | 11,677 | 41 | 11,636 | ||||||||||||||||||
| $ | 98,521 | $ | 29,155 | $ | 69,366 | $ | 96,823 | $ | 21,995 | $ | 74,828 | |||||||||||||
December 31, 2023 | December 31, 2022 | |||||||||||||||||||||||
Gross Carrying | Accumulated | Net Carrying | Gross Carrying | Accumulated | Net Carrying | |||||||||||||||||||
Amount | Amortization | Amount | Amount | Amortization | Amount | |||||||||||||||||||
Patents, licenses and technology | $ | 19,176 | $ | 11,386 | $ | 7,790 | $ | 38,607 | $ | 30,156 | $ | 8,451 | ||||||||||||
Customer relationships | 56,711 | 32,099 | 24,612 | 56,917 | 28,096 | 28,821 | ||||||||||||||||||
Non-compete agreements | - | - | - | 2,662 | 2,662 | - | ||||||||||||||||||
Trademarks (indefinite-lived) | 17,148 | 159 | 16,989 | 16,999 | 160 | 16,839 | ||||||||||||||||||
| $ | 93,035 | $ | 43,644 | $ | 49,391 | $ | 115,185 | $ | 61,074 | $ | 54,111 | |||||||||||||
Amortization expense was $6.7$4.7 million and $6.0 million $7.0 millionduring each of 2023 and $7.0 million in 2017, 2016 and 2015,2022, respectively.
Estimated amortization expense for intangible assets for the next five years is as follows:
| December 31, | Amortization Expense | |||
| 2018 | $ | 6,290 | ||
| 2019 | 6,288 | |||
| 2020 | 6,251 | |||
| 2021 | 6,281 | |||
| 2022 | 4,685 | |||
December 31, | Amortization Expense | |||
2024 | $ | 4,563 | ||
2025 | 4,551 | |||
2026 | 4,551 | |||
2027 | 4,551 | |||
2028 | 4,551 | |||
2023 and 2022 Impairment Test
The Company completed its annual indefinite-lived intangible assets impairment test during the fourth quarteras of 2017, noting no further impairment. October 1, 2023 and October 1, 2022. Management has concluded that the fair value of these trademarks exceeded the related carrying values at both December 31, 20172023 and that there was December 31, 2022, with no indication of impairment.impairment at either date.
6. | FAIR VALUE MEASUREMENTS |
The following tables show the Company's analysis, the fair values of all of the Company's trademarks were lower than the respective carrying values. As a result, in 2016, the Company recorded a non-cash impairment of $4.3 million which is included in impairment of goodwillcash, cash equivalents and other intangible assets on the consolidated statements of operations.
December 31, 2023 | ||||||||||||||||
Carrying value | Fair value | Cash and cash equivalents | Other Current Assets | |||||||||||||
Cash | $ | 57,544 | $ | 57,544 | $ | 57,544 | $ | - | ||||||||
Level 1: | ||||||||||||||||
Money market funds | 31,188 | 31,188 | 31,188 | - | ||||||||||||
Money market funds (Rabbi Trust) | 303 | 303 | - | 303 | ||||||||||||
Subtotal | 31,491 | 31,491 | 31,188 | 303 | ||||||||||||
Level 2: | ||||||||||||||||
Certificates of deposit and time deposits | 3,629 | 3,926 | 639 | 2,990 | ||||||||||||
Subtotal | 3,629 | 3,926 | 639 | 2,990 | ||||||||||||
Total | $ | 92,664 | $ | 92,961 | $ | 89,371 | $ | 3,293 | ||||||||
December 31, 2022 | ||||||||||||||||
Carrying value | Fair value | Cash and cash equivalents | Other Current Assets | |||||||||||||
Cash | $ | 70,266 | $ | 70,266 | $ | 70,266 | $ | - | ||||||||
Level 1: | ||||||||||||||||
Money market funds (Rabbi Trust) | 101 | 101 | - | 101 | ||||||||||||
Subtotal | 101 | 101 | - | 101 | ||||||||||||
Total | $ | 70,367 | $ | 70,367 | $ | 70,266 | $ | 101 | ||||||||
As of December 31, 2017 2023 and 2016, the Company held certain financial assets that are measured at fair value on a recurring basis. These2022, our available-for-sale securities primarily consisted of securities that are among the Company's investments held in a rabbi trust which are intended to fund the Company'sCompany’s Supplemental Executive Retirement Plan ("SERP"(“SERP”) obligations, and other marketableobligations. These securities described below. The securities that are held in the rabbi trust are categorized as available-for-sale securities and are included as other assets in the accompanying consolidated balance sheets at December 31, 2017 and 2016. The gross unrealized gains associated with the investments held in the rabbi trust were $0.2 million and $0.7 million at December 31, 2017 and 2016, respectively. Such unrealized gains are included, net of tax, in accumulated other comprehensive income.
Throughout 2023 and 2022, the Company entered into a series of foreign currency forward contracts, the fair value of which was $0.5 million at December 31, 2023 and $0.4 million at December 31, 2022. The estimated fair value of foreign currency forward contracts is based on quotes received from the applicable counterparty, and represents the estimated amount we would receive or pay to settle the contracts, taking into consideration current exchange rates which can be validated through readily observable data from external sources (Level 2).
The Company is a party to two interest rate swap agreements as further described in Note 13,"Derivative Instruments and Hedging Activities". The fair value of the interest rate swap agreements was $4.0 million and $5.5 million at December 31, 2023 and 2022, respectively, which was based on data received from the counterparty, and represents the estimated amount we would receive or pay to settle the agreements, taking into consideration current and projected future interest rates as well as the creditworthiness of the parties, all of which can be validated through readily observable data from external sources.
The fair values of our derivative financial instruments (which are measured using Level 2 fair value inputs) and their classifications in our consolidated balance sheets as of December 31, 2023 were as follows:
Balance Sheet Classification | December 31, 2023 | December 31, 2022 | |||||||
Derivative assets: | |||||||||
Foreign currency forward contracts: | |||||||||
Designated as cash flow hedges | Other current assets | $ | - | $ | 359 | ||||
Not designated as hedging instruments | Other current assets | 486 | - | ||||||
Interest rate swap agreements: | |||||||||
Designated as a cash flow hedge | Other assets | 3,960 | 5,539 | ||||||
Total derivative assets | $ | 4,446 | $ | 5,898 | |||||
Derivative liabilities: | |||||||||
Foreign currency forward contracts: | |||||||||
Designated as cash flow hedges | Other current liabilities | $ | 5 | $ | - | ||||
Total derivative liabilities | $ | 5 | $ | - | |||||
The Company does not have any financial assets measured at fair value on a recurring basis categorized as Level 3, and there were no transfers in or out of Level 1, Level 2 or Level 3 during 20172023 or 2016.2022. There were no changes to the Company'sCompany’s valuation techniques used to measure asset fair values on a recurring or nonrecurring basis during 2017.
There were no financial assets accounted for at fair value on a nonrecurring basis as of December 31, 20172023 or 2016.
The Company has other financial instruments, such as cash and cash equivalents, accounts receivable, restricted cash, accounts payable and accrued expenses, and notes payable, which are not measured at fair value on a recurring basis but are recorded at amounts that approximate fair value due to their liquid or short-term nature. The fair value of the Company'sCompany’s long-term debt is estimated using a discounted cash flow method based on interest rates that are currently available for debt issuances with similar terms and maturities. At December 31, 2017 2023 and 2016,2022, the estimated fair value of total debt was $124.8 million$60 million and $144.3$95.0 million, respectively, compared to a carrying amount of $122.7$60 million and $141.2$95.0 million, respectively. The Company did not have any other financial liabilities within the scope of the fair value disclosure requirements as of December 31, 2017.
Nonfinancial assets and liabilities, such as goodwill, indefinite-lived intangible assets and long-lived assets, are accounted for at fair value on a nonrecurring basis. These items are tested for impairment upon the occurrence of a triggering event or in the case of goodwill, on at least an annual basis. SeeSee Note 4,5, "Goodwill and Other Intangible Assets," for further information about goodwill and other indefinite-lived intangible assets.
7. | OTHER ASSETS |
At December 31, 2017 2023 and 2016,2022, the Company hashad obligations of $19.1 million$19.5 million and $16.9$18.2 million, respectively, associated with its SERP. As a means of informally funding these obligations, the Company has invested in life insurance policies related to certain employees and marketable securities held in a rabbi trust. At December 31, 2017 2023 and 2016,2022, these assets had a combined value of $15.4 million and $14.0 million, and $12.7 million, respectively.
Company-Owned Life Insurance
Investments in company-owned life insurance policies ("COLI") were made with the intention of utilizing them as a long-term funding source for the Company's SERP obligations. However, the cash surrender value of the COLI does not represent a committed funding source for these obligations. Any proceeds from these policies are subject to claims from creditors. The cash surrender value of the COLI of $12.3 million$15.1 million and $10.9$13.9 million at December 31, 2017 2023 and 2016,2022, respectively, is included in other assets in the accompanying consolidated balance sheets. During 2016, the Company sold $2.2 million of marketable securities within the rabbi trust and utilized the proceeds to purchase additional COLI. The volatility in global equity markets in recent years has also had an effect on the cash surrender value of the COLI policies. The Company recorded income (expense) to account for the increase (decrease) in cash surrender value in the amount of $1.3 million, $0.5 millionmillion and ($0.1)2.2) million during the years ended December 31, 2017, 2016 2023 and 2015,2022, respectively. These fluctuations in the cash surrender value were allocated between cost of sales and selling, general and administrative expensesare classified as other income (expense), net on the consolidated statements of operations for the years ended December 31, 2017, 2016 and 2015. The allocationall periods presented. This classification is consistent with the costs associated with the long-term employee benefit obligations that the COLI is intended to fund.
Other Investments
At December 31, 2017 2023 and 2016,2022, the Company held, in the aforementioned rabbi trust, available-for-sale investments at a cost of $1.3$0.3 million and $1.0 million,$0.1 million, respectively. Together with the COLI described above, these investments are intended to fund the Company's SERP obligations and are classified as other assets in the accompanying consolidated balance sheets. The Company monitors these investments for impairment on an ongoing basis. As discussed above, the Company sold $2.2 million of its SERP investments during 2016. At December 31, 2017 2023 and 2016,2022, the fair market value of these investments was $1.5 $0.3 million and $1.7$0.1 million, respectively. The gross unrealized gainrespectively.
8. | INVENTORIES |
The components of inventories are as follows:
December 31, | ||||||||
2023 | 2022 | |||||||
Raw materials | $ | 63,647 | $ | 74,572 | ||||
Work in progress | 42,038 | 44,397 | ||||||
Finished goods | 30,855 | 53,496 | ||||||
Inventories | $ | 136,540 | $ | 172,465 | ||||
| December 31, | ||||||||
| 2017 | 2016 | |||||||
| Raw materials | $ | 46,712 | $ | 43,376 | ||||
| Work in progress | 17,688 | 18,008 | ||||||
| Finished goods | 43,319 | 37,487 | ||||||
| Inventories | $ | 107,719 | $ | 98,871 | ||||
9. | PROPERTY, PLANT AND EQUIPMENT, NET |
Property, plant and equipment, net consist of the following:
| December 31, | ||||||||
| 2017 | 2016 | |||||||
| Land | $ | 2,259 | $ | 2,234 | ||||
| Buildings and improvements | 30,761 | 30,061 | ||||||
| Machinery and equipment | 122,773 | 113,780 | ||||||
| Construction in progress | 1,511 | 3,029 | ||||||
| 157,304 | 149,104 | |||||||
| Accumulated depreciation | (113,809 | ) | (100,349 | ) | ||||
| Property, plant and equipment, net | $ | 43,495 | $ | 48,755 | ||||
December 31, | ||||||||
2023 | 2022 | |||||||
Land | $ | 348 | $ | 1,098 | ||||
Buildings and improvements | 15,286 | 21,529 | ||||||
Machinery and equipment | 98,527 | 118,358 | ||||||
Construction in progress | 1,567 | 4,239 | ||||||
| 115,728 | 145,224 | |||||||
Accumulated depreciation | (79,195 | ) | (108,391 | ) | ||||
Property, plant and equipment, net | $ | 36,533 | $ | 36,833 | ||||
Depreciation expense for the years ended December 31, 2017, 2016 2023 and 20152022 was $14.0 $8.6 million and $8.9 million, $14.8respectively. At December 31, 2023 and December 31, 2022, a total of $1.3 million and $16.0$1.5 million, respectively.respectively, of property was classified as assets held for sale on the accompanying consolidated balance sheet related to several buildings in Zhongshan, PRC.
| 10. | INCOME TAXES |
The Company and its subsidiaries file income tax returns in the U.S. federal jurisdiction and various states and foreign jurisdictions. The Company is no longer subject to U.S. federal examinations by tax authorities for years before 20142020 and for state examinations before 2011. 2017.Regarding foreign subsidiaries, the Company is no longer subject to examination by tax authorities for yearsyears before 20072013 in Asia and generally 20102015 in Europe.
At December 31, 2015, the Company was under examination by the taxing authorities in Germany for the tax years 2011 through 2013. This audit concluded in April 20162023 and resulted in an immaterial amount of incremental tax expense.
A reconciliation of the beginning and ending amount of the liability for uncertain tax positions, including the portion included in income taxes payable, is as follows:follows:
Years Ended December 31, | ||||||||
2023 | 2022 | |||||||
Liability for uncertain tax positions - January 1 | $ | 24,798 | $ | 28,434 | ||||
Additions based on tax positions related to the current year | 973 | 1,284 | ||||||
Translation adjustment | (249 | ) | (1,121 | ) | ||||
Settlement/expiration of statutes of limitations | (5,699 | ) | (3,799 | ) | ||||
Liability for uncertain tax positions - December 31 | $ | 19,823 | $ | 24,798 | ||||
| 2017 | 2016 | 2015 | ||||||||||
| Liability for uncertain tax positions - January 1 | $ | 27,828 | $ | 42,158 | $ | 39,970 | ||||||
| Additions based on tax positions | ||||||||||||
| related to the current year | 2,168 | 2,483 | 3,241 | |||||||||
| Translation adjustment | 804 | (881 | ) | (844 | ) | |||||||
| Settlement/expiration of statutes of limitations | (370 | ) | (15,932 | ) | (209 | ) | ||||||
| Liability for uncertain tax positions - December 31 | $ | 30,430 | $ | 27,828 | $ | 42,158 | ||||||
The Company'sCompany’s policy is to recognize interest and penalties related to uncertain tax positions as a component of the current provision for income taxes. During the years ended December 31, 2017, 20162023 and 2015,2022, the Company recognized $0.9 million, $1.3 million$0.4 million and $2.5$0.6 million, respectively, in interest and penalties in the consolidated statements of operations. During the years ended December 31, 2017, 20162023 and 2015,2022, the Company recognized zero, a benefit of $3.1 $2.3 million and less than $0.1$1.6 million, respectively, for the reversal of such interest and penalties, relating to the expiration of statues of limitations and settlement of the acquired liability for uncertain tax positions, respectively. The Company has approximately $3.2 million $2.0 million and $2.2$4.0 million accrued for the payment of interest and penalties at December 31, 20172023 and 2016,2022, respectively, which is included in both income taxes payable and liability for uncertain tax positions in the consolidated balance sheets.
The Company'sCompany’s total (loss) earnings before (benefit) provision for income taxes included (loss) earningslosses from domestic operations of ($2.0) million, ($43.3)$51.5 million and $6.1$14.2 million for 2017, 20162023 and 2015,2022, respectively, and earnings (loss) before provision (benefit) for income taxes from foreign operations of $11.7 million, ($39.2)$31.7 million and $19.6$44.8 million for 2017, 20162023 and 2015, respectively.
The provision (benefit) for income taxes consists of the following:
| Years Ended December 31, | ||||||||||||
| 2017 | 2016 | 2015 | ||||||||||
| Current: | ||||||||||||
| Federal | $ | 16,055 | $ | (1,163 | ) | $ | 1,494 | |||||
| State | 115 | 18 | 70 | |||||||||
| Foreign | 5,685 | (10,172 | ) | 5,327 | ||||||||
| 21,855 | (11,317 | ) | 6,891 | |||||||||
| Deferred: | ||||||||||||
| Federal | (1,312 | ) | (6,272 | ) | 1,019 | |||||||
| State | (329 | ) | (464 | ) | (64 | ) | ||||||
| Foreign | 1,326 | 335 | (1,311 | ) | ||||||||
| (315 | ) | (6,401 | ) | (356 | ) | |||||||
| $ | 21,540 | $ | (17,718 | ) | $ | 6,535 | ||||||
Years Ended December 31, | ||||||||
2023 | 2022 | |||||||
Current: | ||||||||
Federal | $ | 11,403 | $ | 9,175 | ||||
State | 975 | 787 | ||||||
Foreign | 963 | 1,002 | ||||||
| 13,341 | 10,964 | |||||||
Deferred: | ||||||||
Federal | (3,128 | ) | (4,064 | ) | ||||
State | (139 | ) | (255 | ) | ||||
Foreign | (605 | ) | (275 | ) | ||||
| (3,872 | ) | (4,594 | ) | |||||
| $ | 9,469 | $ | 6,370 | |||||
A reconciliation of taxes on income computed at the U.S. federal statutory rate to amounts provided is as follows:
Years Ended December 31, | ||||||||||||||||
2023 | 2022 | |||||||||||||||
$ | % | $ | % | |||||||||||||
Tax provision computed at the federal statutory rate | $ | 17,493 | 21 | % | $ | 12,402 | 21 | % | ||||||||
(Decrease) increase in taxes resulting from: | ||||||||||||||||
Different tax rates applicable to foreign operations | (1,697 | ) | (2 | %) | (1,677 | ) | (3 | %) | ||||||||
Reversal of liability for uncertain tax positions - net | (4,726 | ) | (6 | %) | (2,515 | ) | (4 | %) | ||||||||
Research and experimentation and foreign tax credits | (75 | ) | (0 | %) | (139 | ) | (0 | %) | ||||||||
State taxes, net of federal benefit | (433 | ) | (1 | %) | 292 | 0 | % | |||||||||
SERP/COLI and restricted stock income | (756 | ) | (1 | %) | 733 | 1 | % | |||||||||
Other, net | (337 | ) | (0 | %) | (2,726 | ) | (5 | %) | ||||||||
Tax provision computed at the Company's effective tax rate | $ | 9,469 | 11 | % | $ | 6,370 | 11 | % | ||||||||
| Years Ended December 31, | ||||||||||||||||||||||||
| 2017 | 2016 | 2015 | ||||||||||||||||||||||
| $ | % | $ | % | $ | % | |||||||||||||||||||
| Tax (benefit) provision computed at the | ||||||||||||||||||||||||
| federal statutory rate | $ | 3,375 | 35 | % | $ | (28,893 | ) | 35 | % | $ | 9,006 | 35 | % | |||||||||||
| Increase (decrease) in taxes resulting from: | ||||||||||||||||||||||||
| Different tax rates applicable to foreign operations | (2,531 | ) | (26 | %) | (4,427 | ) | 5 | % | (5,353 | ) | (21 | %) | ||||||||||||
| Impairment of goodwill & intangibles | - | 0 | % | 30,445 | (37 | %) | - | 0 | % | |||||||||||||||
| Increase in (reversal of) liability for uncertain | ||||||||||||||||||||||||
| tax positions - net | 1,082 | 11 | % | (13,974 | ) | 17 | % | 3,032 | 12 | % | ||||||||||||||
| Impact of U.S. Tax Reform | 19,171 | 199 | % | - | 0 | % | - | 0 | % | |||||||||||||||
| Utilization of research and experimentation, solar and foreign | ||||||||||||||||||||||||
| tax credits | (272 | ) | (3 | %) | (349 | ) | 0 | % | (349 | ) | (1 | %) | ||||||||||||
| State taxes, net of federal benefit | (261 | ) | (3 | %) | (420 | ) | 1 | % | 56 | 0 | % | |||||||||||||
| Foreign tax on gain, net of federal benefit | 1,223 | 13 | % | - | 0 | % | - | 0 | % | |||||||||||||||
| Current year (reversal) increase in U.S. valuation allowances | - | 0 | % | - | 0 | % | (343 | ) | (1 | %) | ||||||||||||||
| Federal tax on profit of foreign disregarded entities | ||||||||||||||||||||||||
| net of deferred tax | - | 0 | % | - | 0 | % | 872 | 3 | % | |||||||||||||||
| Other, including qualified production activity credits, SERP/COLI | ||||||||||||||||||||||||
| income, under/(over) accruals, unrealized foreign exchange gains | ||||||||||||||||||||||||
| and amortization of purchase accounting intangibles | (247 | ) | (3 | %) | (100 | ) | 0 | % | (386 | ) | (2 | %) | ||||||||||||
| Tax (benefit) provision computed at the Company's | ||||||||||||||||||||||||
| effective tax rate | $ | 21,540 | 223 | % | $ | (17,718 | ) | 21 | % | $ | 6,535 | 25 | % | |||||||||||
As of December 31, 2017,2023, the Company has $26.0 million of deferred tax assets, which the Company evaluates for utilization on an annual basis. The Company has gross federal, state and foreign income tax net operating losses ("NOL"(“NOL”) of $32.2$15.1 million foreign tax credits of $0.3 million and capital loss carryforwards of $0.2 million whichwhich amount to a total of $7.6$4.0 million of deferred tax assets. The Company has established valuation allowances totaling $7.3 million against these deferreddeferred tax assets. In addition, the Company has gross federal and state income tax NOLs of $14.4 million, including $3.7$0.6 million of NOLscredit carryforwards and acquired from Array and $9.0 million of NOLs acquired from Connectivity Solutions, which amount to $5.3 million of deferred tax assets and taxof $0.6 million. The Company believes that it is more likely than not that the benefit arising from certain NOL, credit carryforwards and acquisition assets will not be realized. In recognition of $1.1 million. Thethis risk, the Company has establishedprovided a valuation allowancesallowance of $0.2$2.0 million and $1.0 million, respectively, againston these deferred tax assets. The federal and certain foreign NOL'sNOLs can be carried forward indefinitely, the NOL acquired from Array expires at various times during 2026 – 2027, the NOL acquired from Connectivity Solutionsstate and certain foreign NOLs expire at various times during 2022-2033, the state NOL's expire at various times during 2018 during 2027– 20312042 and the tax credit carryforwards expire at various times during 20252030 - 2034.
Management has no specific plans to indefinitely reinvest the Company's intention to repatriate substantially all net income from its wholly owned PRC subsidiary, Dongguan Transpower Electric Products Co., Ltd, a Chinese Limited Liability Company, to its direct Hong Kong parent Transpower Technologies (Hong Kong) Ltd.unremitted earnings of our foreign subsidiaries as of December 31, 2023. Applicable income and dividend withholding taxes of $0.2 million have been reflected in the accompanying consolidated statements of operations for the year ended December 31, 2017. However, U.S.2023. Due to the practicality of determining the deferred taxes need not be provided on these or the majority of the remaining earnings of foreign subsidiaries as we are currently analyzingoutside basis differences in our global working capital and cash requirements and the potential tax liabilities attributable to a repatriation, including calculating any excess of the amount for financial reporting over the tax basisinvestments in our foreign subsidiaries, we have not provided for deferred taxes on outside basis differences and have yet to determine whether we plan to repatriate earnings and profits in the future.
Components of deferred income tax assets and liabilities are as follows:
| December 31, | ||||||||
| 2017 | 2016 | |||||||
| Tax Effect | Tax Effect | |||||||
| Deferred tax assets: | ||||||||
| State tax credits | $ | 1,033 | $ | 902 | ||||
| Unfunded pension liability | 1,139 | 1,398 | ||||||
| Reserves and accruals | 2,828 | 4,335 | ||||||
| Federal, state and foreign net operating loss | ||||||||
| and credit carryforwards | 10,524 | 12,891 | ||||||
| Depreciation | 917 | 1,057 | ||||||
| Amortization | - | - | ||||||
| Other accruals | 4,915 | 8,278 | ||||||
| Total deferred tax assets | 21,356 | 28,861 | ||||||
| Deferred tax liabilities: | ||||||||
| Reserves and accruals | - | 64 | ||||||
| Depreciation | 989 | 3,028 | ||||||
| Amortization | 8,490 | 15,361 | ||||||
| Other accruals | 946 | 973 | ||||||
| Total deferred tax liabilities | 10,425 | 19,426 | ||||||
| Valuation allowance | 8,343 | 7,485 | ||||||
| Net deferred tax assets/(liabilities) | $ | 2,588 | $ | 1,950 | ||||
December 31, | ||||||||
2023 | 2022 | |||||||
Tax Effect | Tax Effect | |||||||
Deferred tax assets: | ||||||||
State tax credits | $ | 424 | $ | 571 | ||||
Unfunded pension liability | (255 | ) | (416 | ) | ||||
Reserves and accruals | 4,504 | 4,947 | ||||||
Federal, state and foreign net operating loss and credit carryforwards | 4,303 | 4,316 | ||||||
Depreciation | 435 | 437 | ||||||
Amortization | 6,004 | 2,968 | ||||||
Lease accounting | 4,605 | 4,816 | ||||||
Other accruals | 5,997 | 6,486 | ||||||
Total deferred tax assets | 26,017 | 24,125 | ||||||
Deferred tax liabilities: | ||||||||
Depreciation | 2,331 | 2,227 | ||||||
Amortization | 6,359 | 6,178 | ||||||
Lease accounting | 4,659 | 4,889 | ||||||
Other accruals | 562 | 780 | ||||||
Total deferred tax liabilities | 13,911 | 14,074 | ||||||
Valuation allowance | 2,009 | 4,027 | ||||||
Net deferred tax assets | $ | 10,097 | $ | 6,024 | ||||
The Company continues to monitor proposed legislation affecting the taxation of transfers of U.S. intangible property and other potential tax law changes.
11. | DEBT |
The Company has a Credit and Security Agreement with KeyBank National Association (as amended, the "credit agreement" or the "CSA"). The CSA provides a $175 million 5-year senior secured revolving credit facility ("revolver"), with a sublimit of up to $10 million available for letters of credit and a sublimit of up to $5 million available for swing line loans. Revolving loans borrowed under the CSA mature on September 1, 2026. At December 31, 2017 2023 and 2016,2022, outstanding borrowings outstanding relatedunder the revolver amounted to the respective term loans described below were $125.0$60 million and $143.8$95.0 million, respectively, with no borrowings outstanding under the applicable revolver at either date.respectively. The unused credit available under the applicable credit facility was $75.0$115 million at December 31, 2023 and $80.0 million at December 31, 2017 and $50.0 million at December 31, 2016. At December 31, 2017 and 2016, the carrying value of the debt on the consolidated balance sheets is reflected net of $2.3 million and $2.6 million, respectively, of deferred financing costs.
The interest rate in effect at December 31, 2023 was 2.47%. The weighted-average interest rate in effect for the variable-rate portion of our outstanding borrowings ($35.0 million at December 31, 2022) was 5.51% at December 31, 2022 and consisted of LIBOR plus the Company’s credit spread at December 31, 2022, as determined per the terms of the 2014 CSACSA. No outstanding borrowings were subject to modify (i)a variable interest rate at December 31,2023. In order to manage our interest rate exposure on the date by whichremaining borrowings, and as further described in Note 13,"Derivative Instruments and Hedging Activities", the Company was obligated to make excess cash flow prepayments in 2016 on account of excess cash flow achieved for fiscal year 2015, (ii) the method of application of mandatory and voluntary prepayments relatedis party to the Company's loans, and (iii)2021 Swaps, each with an aggregate notional amount of $30 million, or $60 million in the maximum Leverage Ratioaggregate, the effect of which is to fix the SOFR portion (or, for periods prior to January 31, 2023, the LIBOR portion) of the Company allowed under the 2014 CSA for the period from the effective dateinterest rate on a portion of the amendment through September 2016. In connection with this amendmentour outstanding debt on our Revolver (or such portion thereof up to the 2014 CSA, the Company paid $0.7aggregate $60 million of deferred financing costs, and the modification to the amortization schedule resulted in $0.5 million of existing deferred financing costs to be accelerated and recorded as interest expense during the first quarter of 2016.
Under the terms of the Amended CSA,its credit agreement, the Company is entitled, subject to the satisfaction of certain conditions, to request additional commitments under the revolving creditrevolver or the addition of a term loan facility or term loans in the aggregate principal amount of up to $75$100 million for all such increases (revolver and term) to the extent that existing or new lenders agree to provide such additional commitments and/or term loans.
In connection with the credit agreement, the Company under the Amended CSA (and previously under the 2014 CSA) are guaranteed byand certain of the Company'sCompany’s material U.S. subsidiaries (together with the Company, the "Loan Parties"“Loan Parties”) provided to the administrative agent, for the benefit of the lenders, guaranty of payment. As a result, the obligations of the Company under the credit agreement are guaranteed by the Loan Parties’ material U.S. subsidiaries, and are secured by a first priority security interest in substantially all of the existing and future personal property of the Loan Parties, certain material real property of the Loan Parties and certain of the Loan Parties'Parties’ material U.S. subsidiaries, including 65% of the voting capital stock of certain of the Loan Parties'Parties’ direct foreign subsidiaries.
The borrowings under the 2014 CSA borecredit agreement bear interest, generally payable quarterly, at a rate equal to, at the Company's option, either (1)(1) LIBOR, plus a margin ranging from 1.75%1.125% per annum to 3.00%2.125% per annum depending on the Company'sCompany’s leverage ratio, or (2)(2)(a) an "Alternate Basealternate “Base Rate,"” which is the highest of (i) KeyBank’s prime rate, (ii) the federal funds rate plus 0.50%, (ii) KeyBank's prime rate and (iii) the LIBOR rate with a maturity of one month plus 1.00%1%, plus (b) a margin ranging from 0.75%0.125% per annum to 2.00%1.125% per annum, depending on the Company'sCompany’s leverage ratio. The borrowings underAdditionally, the Amended CSA bearcredit agreement contains standard provisions and procedures for transition to a benchmark other than the Eurodollar Rate to determine the applicable interest rate (including reference to the secured overnight financing rate (SOFR) published by the Federal Reserve Bank of New York), with provisions applying that alternate benchmark where applicable following the replacement of LIBOR. Pursuant to the terms of the credit agreement, the Company has agreed to pay to KeyBank, as administrative agent for the ratable account of the revolving lenders in consideration for their commitments in respect of the revolver, a commitment fee due quarterly in arrears and calculated based on the average unused amount of the facility (exclusive of swing line exposure), at a rate equal to, at the Company's option, either (1) LIBOR, plus a margin ranging from 1.375%0.2% per annum to 2.75%0.3% per annum, depending on the Company'sCompany’s leverage ratio, or (2)(a) an "Alternate Base Rate," which is ratio. On January 12, 2023, the highestCompany amended its credit agreement for the purpose of (i)transitioning its reference rate related to interest from LIBOR to SOFR.
Revolving loans borrowed under the federal funds rate plus 0.50%, (ii) KeyBank's prime rate credit agreement mature on September 1, 2026, and (iii) the LIBOR ratecommitments with a maturity of one month plus 1.00%, plus (b) a margin ranging from 0.375% per annumrespect to 1.75% per annum, dependingthe revolver will automatically terminate on the Company's leverage ratio.
The Amended CSA (and previously, the 2014 CSA)credit agreement contains customary representations and warranties, covenants and events of default anddefault. In addition, the credit agreement contains financial covenants that measure (i) the ratio of the Company'sCompany’s total funded indebtedness, on a consolidated basis, less the aggregate amount of all unencumbered cash and cash equivalents, to the amount of the Company'sCompany’s consolidated EBITDA as defined, ("(“Leverage Ratio"Ratio”) and (ii) the ratio of the amount of the Company'sCompany’s consolidated EBITDA to the Company'sCompany’s consolidated fixed charges ("(“Fixed Charge Coverage Ratio"Ratio”). If an event of default occurs, the lenders under the CSAcredit agreement would be entitled to take various actions, including the acceleration of amounts due thereunder and all actions permitted to be taken by a secured creditor.
At December 31, 2017,2023, the Company was in compliance with its debt covenants, including its most restrictive covenant, the Leveragethe Fixed Charge Coverage Ratio.
Scheduled principal payments of the total debt outstanding at December 31, 20172023 are as follows (in thousands):
2024 | $ | - | ||
2025 | - | |||
2026 | 60,000 | |||
2027 | - | |||
2028 | - | |||
Total long-term debt | 60,000 | |||
Less: Current maturities of long-term debt | - | |||
Noncurrent portion of long-term debt | $ | 60,000 |
| 2018 | $ | 3,125 | ||
| 2019 | 3,125 | |||
| 2020 | 6,250 | |||
| 2021 | 6,250 | |||
| 2022 | 106,250 | |||
| Total long-term debt | 125,000 | |||
| Less: Current maturities of long-term debt | (3,125 | ) | ||
| Noncurrent portion of long-term debt | $ | 121,875 |
| 12. | ACCRUED EXPENSES |
Accrued expenses consist of the following:
December 31, | ||||||||
2023 | 2022 | |||||||
Salaries, bonuses and related benefits | $ | 33,566 | $ | 27,422 | ||||
Deferred revenue | 3,046 | 8,847 | ||||||
Accrued restructuring costs | 5,498 | 6,796 | ||||||
Sales commissions | 2,347 | 2,521 | ||||||
Subcontracting labor | 1,622 | 1,875 | ||||||
Warranty accrual | 1,542 | 1,287 | ||||||
Other | 7,036 | 2,125 | ||||||
| $ | 54,657 | $ | 50,873 | |||||
The change in warranty accrual during 2023 primarily related to repair costs incurred and adjustments to pre-existing warranties. There were no new material warranty charges incurred during 2023.
Restructuring Activities:
Activity and liability balances related to restructuring costs for the year ended December 31, 2023 are as follows:
Year Ended | ||||||||||||||||
December 31, 2023 | ||||||||||||||||
Liability at | Cash Payments | Liability at | ||||||||||||||
December 31, | New | and Other | December 31, | |||||||||||||
2022 | Charges | Settlements | 2023 | |||||||||||||
Severance costs | $ | 3,390 | $ | 7,590 | $ | (9,429 | ) | $ | 1,551 | |||||||
| Disposal of equipment in connection with restructuring | - | 1,320 | (1,320 | ) | - | |||||||||||
Other restructuring costs | 3,406 | 1,204 | (663 | ) | 3,947 | |||||||||||
Total | $ | 6,796 | $ | 10,114 | $ | (11,412 | ) | $ | 5,498 | |||||||
During the third quarter of 2022, a series of initiatives were launched to streamline our operational footprint. In a project completed during the fourth quarter of 2023,two of our Magnetic Solutions manufacturing facilities in Zhongshan and Pingguo, China, were largely consolidated into a single centralized site in the Binyang county of Southwestern China (the new Bel Guangxi facility). Further, during the first half of 2023, we completed the transition out of our Tempe, Arizona and Sudbury, UK facilities (both within our Connectivity Solutions segment) into other existing Bel sites. As of December 31, 2023, our Connectivity Solutions Melbourne, Florida site was substantially complete in transitioning its manufacturing operations into our existing site in Waseca, Minnesota. The $10.1 million of restructuring charges incurred the year ended December 31, 2023, and the accrued restructuring costs of $5.5 million at December 31, 2023, are associated with these collective initiatives.
| Year Ended December 31, | ||||||||
| 2017 | 2016 | |||||||
| Sales commissions | $ | 2,461 | $ | 2,066 | ||||
| Subcontracting labor | 1,408 | 1,370 | ||||||
| Salaries, bonuses and related benefits | 16,531 | 17,587 | ||||||
| Warranty accrual | 1,769 | 2,718 | ||||||
| Other | 8,339 | 7,808 | ||||||
| $ | 30,508 | $ | 31,549 | |||||
| 13. | DERIVATIVE INSTRUMENTS AND HEDGING ACTIVITIES |
Our primary objective for holding derivative financial instruments is to manage foreign currency exchange rate risk and interest rate risk, when deemed appropriate. We enter into these contracts in the normal course of business to mitigate risks and not for speculative purposes.
Foreign Currency Forward Contracts
Under our risk management strategy, we periodically use foreign currency forward contracts to manage our short-term exposures to fluctuations in operational cash flows resulting from changes in foreign currency exchange rates. These cash flow exposures result from portions of our forecasted operating expenses, primarily compensation and related expenses, which are transacted in currencies other than the U.S. dollar, most notably the Chinese renminbi and the Mexican peso. These foreign currency forward contracts generally have maturities of no longer than twelve months, although occasionally we will execute a contract that extends beyond twelve months, depending upon the nature of the activityunderlying risk.
We held outstanding foreign currency forward contracts with notional amounts of $25.8 million and $25.7 million as of December 31, 2023 and 2022, respectively. The Company's foreign currency forward contracts related to the Chinese renminbi are designated as cash flow hedges for accounting purposes and as such, changes in their fair value are recognized in accumulated other comprehensive income (loss) in the consolidated balance sheet and are reclassified into the statement of operations within cost of goods sold in the warranty accrual accountperiod in which the hedged transaction affects earnings.
Interest Rate Swap Agreements
To partially mitigate risks associated with the variable interest rates on the revolver borrowings under its credit agreement, the Company is a party to a pay-fixed, receive-variable interest rate swap agreement with each of two multinational financial institutions under which we, for periods prior to January 31, 2023, (i) paid interest at a fixed rate of 1.3055% and received variable interest of one-month LIBOR on a notional amount of $30.0 million and (ii) paid interest at a fixed rate of 1.3180% and received variable interest of one-month LIBOR on a notional amount of $30.0 million (the “2021 Swaps”). The effective date of the 2021 Swaps was December 31, 2021, and settlements with the counterparties began on January 31, 2022 and occur on a monthly basis. The 2021 Swaps will terminate on August 31, 2026. In January 2023, and in connection with related changes to its credit agreement, the Company amended its two interest rate swap agreements to transition the related reference rates in these agreements from LIBOR to SOFR, effective January 31, 2023. Effective January 31, 2023, the 2021 Swaps require the Company to pay interest on the notional amount at the rate of 1.334% and 1.348%, respectively, in exchange for the daily SOFR rate plus 10 basis points.
The 2021 Swaps are designated as cash flow hedges for accounting purposes and as such, changes in their fair value are recognized in accumulated other comprehensive income (loss) in the consolidated balance sheet and are reclassified into the statement of operations within interest expense in the period in which the hedged transaction affects earnings.
Fair Values of Derivative Financial Instruments
See Note 6, "Fair Value Measurements" for the gross fair values of the Company's derivative assets and liabilities as of December 31, 2023 and 2022.
Derivative Financial Instruments in Cash Flow Hedging Relationships
The effects of derivative financial instruments designated as cash flow hedges on AOCL and on the consolidated statements of operations for the years ended December 31, 20172023 and 2016 is presented below:
| Year Ended December 31, | ||||||||
| 2017 | 2016 | |||||||
| Balance, beginning of year | $ | 2,718 | $ | 3,659 | ||||
| Charges and costs accrued | 268 | 761 | ||||||
| Adjustments related to pre-existing warranties | ||||||||
| (including changes in estimates) | (969 | ) | (1,063 | ) | ||||
| Less: Repair costs incurred | (311 | ) | (544 | ) | ||||
| Currency translation | 63 | (95 | ) | |||||
| Balance, end of year | $ | 1,769 | $ | 2,718 | ||||
Years Ended December 31, | ||||||||
2023 | 2022 | |||||||
Net (losses) gains recognized in AOCL: | ||||||||
Foreign currency forward contracts | $ | (1,470 | ) | $ | (119 | ) | ||
Interest rate swap agreements | 689 | 5,886 | ||||||
| $ | (781 | ) | $ | 5,767 | ||||
Net (losses) gains reclassified from AOCL to the consolidated statement of operations: | ||||||||
Foreign currency forward contracts | $ | (537 | ) | $ | (805 | ) | ||
Interest rate swap agreements | 2,268 | 230 | ||||||
| $ | 1,731 | $ | (575 | ) | ||||
The losses related to the foreign currency forward contracts are included as a component of currency translation adjustment on the accompanying consolidated statements of comprehensive income at December 31, 2023 and 2022.
DerivativeFinancial InstrumentsNot Designated as Hedging Instruments
Gains recognized on derivative financial instruments not designated as hedging instruments in our consolidated statements of operations for the years ended December 31, 2023 and 2022 were as follows:
Years Ended December 31, | |||||||||
Classification in Consolidated Statements of Operations | 2023 | 2022 | |||||||
Foreign currency forward contracts | Other expense, net | 150 | 58 | ||||||
| $ | 150 | $ | 58 | ||||||
| 14. | SEGMENTS |
The Company operates in one industry with three reportable operating segments, which are geographic in nature. The segments consistrepresent the Company's three product groups, consisting of North America, AsiaPower Solutions and Europe.Protection, Connectivity Solutions and Magnetic Solutions. The primary criteria by which financial performance is evaluated and resources are allocated are net sales and income from operations.gross profit. The following is a summary of key financial data:
Year Ended December 31, 2023 | ||||||||||||||||||||
Power Solutions and Protection | Connectivity Solutions | Magnetic Solutions | Corporate/ Other | Total | ||||||||||||||||
Net sales | $ | 314,105 | $ | 210,572 | $ | 115,136 | $ | - | $ | 639,813 | ||||||||||
Gross Profit | 119,741 | 72,031 | 25,314 | (1,237 | ) | 215,849 | ||||||||||||||
Gross Profit % | 38.1 | % | 34.2 | % | 22.0 | % | nm | 33.7 | % | |||||||||||
Total Assets | 222,068 | 197,045 | 47,900 | 104,618 | 571,631 | |||||||||||||||
Capital Expenditures | 4,563 | 7,384 | 160 | 19 | 12,126 | |||||||||||||||
Depreciation and Amortization Expense | 5,280 | 6,152 | 1,094 | 786 | 13,312 | |||||||||||||||
Year Ended December 31, 2022 | ||||||||||||||||||||
Power Solutions and Protection | Connectivity Solutions | Magnetic Solutions | Corporate/ Other | Total | ||||||||||||||||
Net sales | $ | 288,366 | $ | 187,085 | $ | 178,782 | $ | - | $ | 654,233 | ||||||||||
Gross Profit | 87,840 | 48,488 | 49,290 | (2,165 | ) | 183,453 | ||||||||||||||
Gross Profit % | 30.5 | % | 25.9 | % | 27.6 | % | nm | 28.0 | % | |||||||||||
Total Assets | 234,095 | 170,895 | 107,891 | 47,585 | 560,466 | |||||||||||||||
Capital Expenditures | 3,916 | 4,566 | 350 | - | 8,832 | |||||||||||||||
Depreciation and Amortization Expense | 6,470 | 6,145 | 2,133 | 115 | 14,863 | |||||||||||||||
| 2017 | 2016 | 2015 | ||||||||||
| Net Sales to External Customers: | (Revised) | |||||||||||
| North America | $ | 245,834 | $ | 256,760 | $ | 304,328 | ||||||
| Asia | 167,680 | 168,458 | 188,146 | |||||||||
| Europe | 78,097 | 74,935 | 74,606 | |||||||||
| $ | 491,611 | $ | 500,153 | $ | 567,080 | |||||||
| Net Sales: | ||||||||||||
| North America | $ | 257,541 | $ | 268,935 | $ | 329,304 | ||||||
| Asia | 249,506 | 256,202 | 295,751 | |||||||||
| Europe | 89,765 | 86,750 | 148,735 | |||||||||
| Less intercompany | ||||||||||||
| net sales | (105,201 | ) | (111,734 | ) | (206,710 | ) | ||||||
| $ | 491,611 | $ | 500,153 | $ | 567,080 | |||||||
| Income (Loss) from Operations: | ||||||||||||
| North America | $ | 5,147 | $ | (35,722 | ) | $ | 11,012 | |||||
| Asia | 8,964 | (24,360 | ) | 8,175 | ||||||||
| Europe | 2,227 | (16,430 | ) | 9,413 | ||||||||
| $ | 16,338 | $ | (76,512 | ) | $ | 28,600 | ||||||
| Total Assets: | ||||||||||||
| North America | $ | 172,674 | $ | 168,061 | $ | 238,930 | ||||||
| Asia | 152,447 | 166,028 | 231,063 | |||||||||
| Europe | 106,144 | 92,651 | 108,512 | |||||||||
| $ | 431,265 | $ | 426,740 | $ | 578,505 | |||||||
| Capital Expenditures: | ||||||||||||
| North America | $ | 1,734 | $ | 2,641 | $ | 2,425 | ||||||
| Asia | 2,617 | 4,329 | 4,888 | |||||||||
| Europe | 2,074 | 1,253 | 2,578 | |||||||||
| $ | 6,425 | $ | 8,223 | $ | 9,891 | |||||||
| Depreciation and Amortization Expense: | ||||||||||||
| North America | $ | 10,641 | $ | 10,522 | $ | 10,841 | ||||||
| Asia | 6,728 | 7,976 | 8,706 | |||||||||
| Europe | 3,349 | 3,280 | 3,462 | |||||||||
| $ | 20,718 | $ | 21,778 | $ | 23,009 | |||||||
| 2017 | 2016 | 2015 | ||||||||||
| North America | $ | 4 | $ | 692 | $ | 1,452 | ||||||
| Asia | 167 | 1,305 | 352 | |||||||||
| Europe | 137 | 90 | 310 | |||||||||
| $ | 308 | $ | 2,087 | $ | 2,114 | |||||||
Entity-Wide Information
The following is a summary of entity-wide information related to the Company's net sales to external customers by geographic area and by major product line.
| 2017 | 2016 | 2015 | ||||||||||
| Net Sales by Geographic Location: | ||||||||||||
| United States | $ | 245,834 | $ | 256,760 | $ | 304,328 | ||||||
| Macao | 167,681 | 163,971 | 182,248 | |||||||||
| United Kingdom | 24,110 | 21,953 | 27,552 | |||||||||
| Switzerland | 15,366 | 14,048 | 18,050 | |||||||||
| Slovakia | 14,194 | 17,622 | 2,807 | |||||||||
| Germany | 13,857 | 14,104 | 16,314 | |||||||||
| All other foreign countries | 10,569 | 11,695 | 15,781 | |||||||||
| Consolidated net sales | $ | 491,611 | $ | 500,153 | $ | 567,080 | ||||||
| Net Sales by Major Product Line: | ||||||||||||
| Connectivity solutions | $ | 170,337 | $ | 168,845 | $ | 181,697 | ||||||
| Magnetic solutions | 161,011 | 155,232 | 166,182 | |||||||||
| Power solutions and protection | 160,263 | 176,076 | 219,201 | |||||||||
| Consolidated net sales | $ | 491,611 | $ | 500,153 | $ | 567,080 | ||||||
Years Ended December 31, | ||||||||
2023 | 2022 | |||||||
Net Sales by Geographic Location: | ||||||||
United States | $ | 447,793 | $ | 409,199 | ||||
People's Republic of China | 43,109 | 77,061 | ||||||
Macao | 35,026 | 61,744 | ||||||
United Kingdom | 25,648 | 21,903 | ||||||
Slovakia | 35,555 | 22,120 | ||||||
Germany | 17,327 | 24,112 | ||||||
India | 15,365 | 17,608 | ||||||
Switzerland | 11,237 | 9,893 | ||||||
All other foreign countries | 8,753 | 10,593 | ||||||
Consolidated net sales | $ | 639,813 | $ | 654,233 | ||||
Net Sales by Major Product Line: | ||||||||
Power solutions and protection | $ | 314,105 | $ | 288,366 | ||||
Connectivity solutions | 210,572 | 187,085 | ||||||
Magnetic solutions | 115,136 | 178,782 | ||||||
Consolidated net sales | $ | 639,813 | $ | 654,233 | ||||
The following is a summary of long-lived assets by geographic area as of December 31, 2017 2023 and 2016:
| 2017 | 2016 | |||||||
| Long-lived Assets by Geographic Location: | ||||||||
| United States | $ | 27,594 | $ | 29,740 | ||||
| People's Republic of China (PRC) | 30,151 | 32,666 | ||||||
| Slovakia | 7,625 | 6,574 | ||||||
| Switzerland | 3,632 | 3,593 | ||||||
| United Kingdom | 1,345 | 1,419 | ||||||
| All other foreign countries | 1,121 | 1,117 | ||||||
| Consolidated long-lived assets | $ | 71,468 | $ | 75,109 | ||||
December 31, | ||||||||
2023 | 2022 | |||||||
Long-lived Assets by Geographic Location: | ||||||||
United States | $ | 34,990 | $ | 33,875 | ||||
People's Republic of China (PRC) | 23,621 | 28,222 | ||||||
Slovakia | 7,468 | 6,738 | ||||||
United Kingdom | 3,024 | 1,109 | ||||||
All other foreign countries | 549 | 1,072 | ||||||
Consolidated long-lived assets | $ | 69,652 | $ | 71,016 | ||||
Long-lived assets consist of property, plant and equipment, net and other assets of the Company that are identified with the operations of each geographic area.
The territory of Hong Kong became a Special Administrative Region ("SAR") of the PRC in the middle of 1997. The territory of Macao became a SAR of the PRC at the end of 1999. Management cannot presently predict what future impact this will have on the Company, if any, or how the political climate in the PRC will affect the Company's contractual arrangements in the PRC. A significant portion of the Company's manufacturing operations and approximately 36.9%21.6% of its identifiable assets are located in Asia.
Net Sales to Major Customers
The Company had no direct customers whose net sales to one customerrepresented in excess of ten percent of the Company's consolidated net sales in each of 2017, 2016 and 2015. The2023. In 2022, the Company had one direct customer with net sales associated with this customer was $57.7of $83.9 million in 2017 (11.7% of sales), $59.8 million in 2016 (12.0% of sales) and $74.8 million in 2015 (13.2%(12.8% of sales). Net sales related to this significant customer were primarily reflected in the AsiaMagnetic Solutions operating segment during eachsegment.
| 15. | RETIREMENT FUND AND PROFIT SHARING PLAN |
The Company maintains the Bel Fuse Inc. Employees' Savings Plan, a defined contribution plan that is intended to meet the applicable requirements for tax-qualification under sections 401(a)401(a) and (k) of the Internal Revenue Code of 1986, as amended (the "Code"). The Employees' Savings Plan allows eligible employees to voluntarily contribute a percentage of their eligible compensation, subject to Code limitations, which contributions are matched by the Company in an amount equal to 100% of the first1% of compensation contributed by participants, and 50% of the next 5% of compensation contributed by participants. Effective January 1, 2017, theThe Company's matching contribution is made in the form of Bel Fuse Inc. Class A common stock. For plan years beginning on Prior to January 1, 2012, through December 31, 2016, the Company's matching contributions were made in cash. Prior to January 1, 2012, the Company's matching and profit sharing contributions were made in the form of shares of Bel Fuse Inc. Class A and Class B common stock. The expense for each of the years ended December 31, 2017, 2016 2023 and 20152022 amounted to $1.2 million, $1.1 million and $1.2 million, respectively.$1.3 million. As of December 31, 2017,2023, the plan owned 67,891 and 144,276 approximately 287,777 shares and65,089 shares of Bel Fuse Inc. Class A and Class B common stock, respectively.
The Company also maintains a Nonqualified Deferred Compensation Plan (the "DCP"). With certain exceptions, the Company's contributions to the DCP are discretionary and become fully vested by the participants upon reaching age 65. The expense for the years ended December 31, 2023 and 2022 amounted to $0.2 million and $0.1 million, respectively. As the plan is fully funded, the assets and liabilities related to the DCP were in equal amounts of $1.0 million at December 31, 2023 and $0.7 million at December 31, 2022. These amounts are included in other assets and other liabilities, respectively, on the accompanying consolidated balance sheets as of each date.
The Company's subsidiaries in Asia have a retirement fund covering substantially all of their Hong Kong based full-time employees. Eligible employees contribute up to 5% of salary to the fund. In addition, the Company must contribute a minimum of 5% of eligible salary, as determined by Hong Kong government regulations. The Company currently contributes 7% of eligible salary in cash or Company stock. cash. The expense for the years ended December 31, 2017, 2016 2023 and 20152022 amounted to approximately $0.3$1.5 million and $1.8 million, in each year.respectively. As of December 31, 2017,2022, the plan owned 3,323 and 17,342 sharesshares of Bel Fuse Inc. Class A and Class B common stock, respectively.
The Company maintains a SERP, which is designed to provide a limited group of key management and other key employees of the Company
with supplemental retirement and death benefits. Participants in the SERP are selected by the Compensation Committee of the Board ofThe benefits available under the SERP vary according to when and how the participant terminates employment with the Company. If a participant retires (with the prior written consent of the Company) on his normal retirement date (65(65 years old, 20 years of service, and 5 years of Plan participation), his normal retirement benefit under the Plan would be annual payments equal to 40% of his average base compensation (calculated using compensation from the highest five consecutive calendar years of Plan participation), payable in monthly installments for the remainder of his life. If a participant retires early from the Company (55(55 years old, 20 years of service, and five years of Plan participation), his early retirement benefit under the Plan would be an amount (i) calculated as if his early retirement date were in fact his normal retirement date, (ii) multiplied by a fraction, with the numerator being the actual years of service the participant has with the Company and the denominator being the years of service the participant would have had if he had retired at age 65, and (iii) actuarially reduced to reflect the early retirement date. If a participant dies prior to receiving 120 monthly payments under the Plan, his beneficiary would be entitled to continue receiving benefits for the shorter of (i) the time necessary to complete 120 monthly payments or (ii) 60 months. If a participant dies while employed by the Company, his beneficiary would receive, as a survivor benefit, an annual amount equal to (i) 100% of the participant's annual base salary at date of death for one year, and (ii) 50% of the participant's annual base salary at date of death for each of the following four years, each payable in monthly installments. The Plan also provides for disability benefits, and a forfeiture of benefits if a participant terminates employment for reasons other than those contemplated under the Plan. The expense related to the Plan for the years ended December 31, 2017, 2016 2023 and 20152022 amounted to $1.7 $1.3 million $1.6 million andand $1.5 million, respectively.
Net Periodic Benefit Cost
The net periodic benefit cost related to the SERP consisted of the following components during the years ended December 31, 2017, 2016 2023 and 2015:2022:
Years Ended December 31, | ||||||||
2023 | 2022 | |||||||
Service Cost | $ | 369 | $ | 503 | ||||
Interest Cost | 886 | 636 | ||||||
Net amortization | 71 | 312 | ||||||
Net periodic benefit cost | $ | 1,326 | $ | 1,451 | ||||
The service cost component of net benefit cost is presented within cost of sales or selling, general and administrative expense on the accompanying consolidated statements of operations, in accordance with where compensation cost for the related associate is reported. All other components of net benefit cost, including interest cost and net amortization noted above, are presented within other income/expense, net in the accompanying consolidated statements of operations.
| 2017 | 2016 | 2015 | ||||||||||
| Service Cost | $ | 700 | $ | 593 | $ | 552 | ||||||
| Interest Cost | 673 | 659 | 567 | |||||||||
| Net amortization | 375 | 391 | 366 | |||||||||
| Net periodic benefit cost | $ | 1,748 | $ | 1,643 | $ | 1,485 | ||||||
Obligations and Funded Status
Summarized information related to the SERP about the changes in plan assets and benefit obligation, the funded status and the amounts recorded at December 31,
| 2017 | 2016 | |||||||
| Fair value of plan assets, January 1 | $ | - | $ | - | ||||
| Company contributions | 240 | 129 | ||||||
| Benefits paid | (240 | ) | (129 | ) | ||||
| Fair value of plan assets, December 31 | - | - | ||||||
| Benefit obligation, January 1 | 16,900 | 15,576 | ||||||
| Service cost | 700 | 593 | ||||||
| Interest cost | 673 | 659 | ||||||
| Benefits paid | (240 | ) | (129 | ) | ||||
| Plan amendments | 198 | 487 | ||||||
| Actuarial (gains) losses | 903 | (286 | ) | |||||
| Benefit obligation, December 31 | 19,134 | 16,900 | ||||||
| Underfunded status, December 31 | $ | (19,134 | ) | $ | (16,900 | ) | ||
Years Ended December 31, | ||||||||
2023 | 2022 | |||||||
Fair value of plan assets, January 1 | $ | - | $ | - | ||||
Company contributions | 775 | 606 | ||||||
Benefits paid | (775 | ) | (606 | ) | ||||
Fair value of plan assets, December 31 | $ | - | $ | - | ||||
Benefit obligation, January 1 | $ | 18,175 | $ | 23,580 | ||||
Service cost | 370 | 503 | ||||||
Interest cost | 886 | 636 | ||||||
Benefits paid | (775 | ) | (606 | ) | ||||
Actuarial loss (gain) | 828 | (5,938 | ) | |||||
Benefit obligation, December 31 | $ | 19,484 | $ | 18,175 | ||||
Underfunded status, December 31 | $ | (19,484 | ) | $ | (18,175 | ) | ||
The Company has recorded the 20172023 and 20162022 underfunded status as a long-term liability on the consolidated balance sheets. The accumulated benefit obligation for the SERP was $16.1$18.1 million as of December 31, 2023 and $17.0 million as of December 31, 2017 and $13.8 million as of December 31, 2016.
The estimated net loss and prior service cost for the defined benefit pension planSERP that will be amortized from accumulated other comprehensive loss into net periodic benefit cost over the next fiscal year is $0.4$0.1 million. TheThe Company expects to make contributions of $0.3 $0.8 million to the SERP in 2018.2024. The Company had no net transition assets or obligations recognized as an adjustment to other comprehensive income and does not anticipate any plan assets being returned to the Company during 2018,2024, as the plan has no assets.
The following benefit payments, which reflect expected future service, are expected to be paid:
| Years Ending | ||
| December 31, | ||
| 2018 | $ | 317 |
| 2019 | 564 | |
| 2020 | 622 | |
| 2021 | 622 | |
| 2222 | 909 | |
| 2023 - 2027 | 5,193 | |
Years Ending | |||||
December 31, | |||||
2024 | $ | 972 | |||
2025 | 1,015 | ||||
2026 | 1,033 | ||||
2027 | 1,150 | ||||
2028 | 1,321 | ||||
| 2029 - 2033 | 7,218 |
The following gross amounts are recognized net of tax in accumulated other comprehensive loss:
| 2017 | 2016 | |||||||
| Prior service cost | $ | 1,135 | $ | 1,172 | ||||
| Net loss | 3,732 | 2,970 | ||||||
| $ | 4,867 | $ | 4,142 | |||||
December 31, | ||||||||
2023 | 2022 | |||||||
Prior service cost | $ | 212 | $ | 334 | ||||
Net loss | (1,336 | ) | (2,216 | ) | ||||
| $ | (1,124 | ) | $ | (1,882 | ) | |||
Actuarial Assumptions
The weighted average assumptions used in determining the periodic net cost and benefit obligation information related to the SERP are as follows:
Years Ended December 31, | ||||||||
2023 | 2022 | |||||||
Net periodic benefit cost: | ||||||||
Discount rate | 5.00 | % | 2.75 | % | ||||
Rate of compensation increase | 2.50 | % | 2.50 | % | ||||
Benefit obligation: | ||||||||
Discount rate | 4.75 | % | 5.00 | % | ||||
Rate of compensation increase | 2.50 | % | 2.50 | % | ||||
| 2017 | 2016 | 2015 | |||
Net periodic benefit cost: | |||||
| Discount rate | 4.00% | 4.25% | 4.00% | ||
Rate of compensation increase | 3.00% | 3.00% | 3.00% | ||
| Benefit obligation: | |||||
| Discount rate | 3.50% | 4.00% | 4.25% | ||
| Rate of compensation increase | 3.00% | 3.00% | 3.00% |
| 16. | SHARE-BASED COMPENSATION |
The Company has
an equity compensation program (theThe Company records compensation expense in its consolidated statements of operations related to employee stock-based options and awards. The aggregate pretax compensation cost recognized for stock-based compensation amounted to approximately $3.0 million, $2.8 $3.5 million and $2.8$2.4 million for 2017, 20162023 and 2015,2022, respectively, and related solely to restricted stock awards
Restricted Stock Awards
The Company provides common stock awards to certain officers, directors and key employees. The Company grants these awards, at its discretion, from the shares available under the Program. Unless otherwise provided at the date of grant or unless subsequently accelerated, the shares awarded are typically earned in 25% increments on the second, third, fourth and fifth anniversaries of the award and are distributed provided the employee has remained employed by the Company through such anniversary dates; otherwise the unearned shares are forfeited. The market value of these shares at the date of award is recorded as compensation expense on the straight-line method over the applicable vesting period from the respective award dates as adjusted for forfeituresutilizing an estimated annual forfeiture rate of unvested awards.5%. During 2017, 20162023 and 2015,2022, the Company issued 46,400 10,000 shares 180,000 shares and 84,000322,500 shares of the Company's Class B common stock, respectively, under a restricted stock plan to various officers, directors and employees.
A summary of the restricted stock activity under the Program as of for the year ended December 31, 20172023 is presented below:
| Weighted Average | |||||||||
| Restricted Stock | Weighted Average | Remaining | |||||||
| Awards | Shares | Award Price | Contractual Term | ||||||
| Outstanding at January 1, 2017 | 558,600 | $ | 22.64 | 3.1 years | |||||
| Granted | 46,400 | 24.05 | |||||||
| Vested | (141,800 | ) | 21.59 | ||||||
| Forfeited | (38,700 | ) | 21.70 | ||||||
| Outstanding at December 31, 2017 | 424,500 | $ | 23.23 | 3.0 years | |||||
Weighted Average | ||||||||||||
Restricted Stock | Weighted Average | Remaining | ||||||||||
Awards | Shares | Award Price | Contractual Term (In Years) | |||||||||
Outstanding at January 1, 2023 | 636,500 | $ | 26.31 | 4.4 | ||||||||
Granted | 10,000 | 49.19 | ||||||||||
Vested | (119,250 | ) | 17.96 | |||||||||
Forfeited | (30,500 | ) | 21.30 | |||||||||
Outstanding at December 31, 2023 | 496,750 | $ | 29.09 | 3.7 | ||||||||
As of December 31, 2017,2023, there was $6.6 million$9.8 million of total pretax unrecognized compensation cost included within additional paid-in capital related to non-vested stock basedstock-based compensation arrangements granted under the restricted stock award plan. That cost is expected to be recognized over a period of 4.9 years.4.4 years. This expense is recorded in cost of sales, R&D and SG&A expense based upon the employment classification of the award recipients.
The Company's policy isin 2023 was to issue new shares to satisfy restricted stock awards. Currently the Company believes that substantially allthe majority of its restricted stock awards will vest.
| 17. | COMMON STOCK |
As of December 31, 2017,2023, according to regulatory filings, there was one shareholder of the Company's common stock (other than shareholders subject to specific exceptions) with ownership in excess of 10% of Class A outstanding shares with no ownership of the Company's Class B common stock. In accordance with the Company's certificateRestated Certificate of incorporation,Incorporation, as amended, the Class B Protection clause is triggered if a shareholder owns 10% or more of the outstanding Class A common stock and does not own an equal or greater percentage of all then outstanding shares of both Class A and Class B common stock (all of which common stock must have been acquired after the date of the 1998 recapitalization). In such a circumstance, such shareholder must, within 90 days of the trigger date, purchase Class B common shares, in an amount and at a price determined in accordance with a formula described in the Company's certificateRestated Certificate of incorporation,Incorporation, as amended, or forfeit its right to vote its Class A common shares. As of December 31, 2017,2023, to the Company's knowledge, this shareholder had not purchased any Class B shares to comply with these requirements. In order to vote its shares at Bel's next shareholders' meeting, this shareholder must either purchase the required number of Class B common shares or sell or otherwise transfer Class A common shares until its Class A holdings are under 10%. As of December 31, 2017,2023, to the Company's knowledge, this shareholder owned 23.2% ofowned 16.7% of the Company's Class A common stock in the aggregate and had not taken steps to either purchase the required number of Class B common shares or sell or otherwise transfer Class A common shares until its Class A holdings fall below 10%.Unless and until this situation is satisfied in a manner permitted by the Company's Restated Certificate of Incorporation,Incorporation, as amended, the subjectsubject shareholder will not be permitted to vote its shares of common stock.
Throughout 2017, 20162023 and 2015,2022, the Company declared cash dividends on a quarterly basis at a rate of $0.06 per Class A (voting) share of common stock and $0.07 per Class B (non-voting) share of common stock. The Company declared and paid cash dividends totaling $3.3$3.5 million in 20172023 and $3.2$3.4 million in each of 2016 and 2015.2022. There are no contractual restrictions on the Company's ability to pay dividends, provided that the Company is not in default under its credit agreementsagreement immediately before such payment and after giving effect to such payment.
| 18. | LEASES |
The Company leases various facilities underhas operating leases expiring through August 2027. Somefor its facilities used for manufacturing, research and development, sales and administration. There are also operating and finance leases related to manufacturing equipment, office equipment and vehicles. These leases have remaining lease terms ranging from1 year to 8 years. Certain of thesethe leases requirecontain options to extend the term of the lease and certain of the leases contain options to terminate the lease within a specified period of time. These options to extend or terminate a lease are included in the lease term only when it is reasonably likely that the Company will elect that option. The Company is not a party to pay certain executoryany material sublease arrangements.
The components of lease expense, which are included in cost of sales, research and development costs, (such as insurance and maintenance).
Years Ended December 31, | ||||||||
2023 | 2022 | |||||||
Amortization of ROU assets - finance leases | $ | 491 | $ | 448 | ||||
Interest on lease liabilities - finance leases | 121 | 137 | ||||||
Operating lease cost (cost resulting from lease payments) | 8,127 | 8,426 | ||||||
Short-term lease cost | 207 | 201 | ||||||
Variable lease cost (cost excluded from lease payments) | 397 | 410 | ||||||
Total lease cost | $ | 9,343 | $ | 9,622 | ||||
Supplemental cash flow information related to leases is as follows:
Years Ended December 31, | ||||||||
2023 | 2022 | |||||||
Cash paid for amounts included in the measurement of lease liabilities: | ||||||||
Operating cash flows from operating leases | $ | 8,090 | $ | 8,970 | ||||
Operating cash flows from finance leases | 121 | 137 | ||||||
Finance cash flows from finance leases | 527 | 423 | ||||||
Right-of-use assets obtained in exchange for lease obligations: | ||||||||
Operating leases | 5,999 | 8,052 | ||||||
Finance leases | 199 | 207 | ||||||
| Year Ending | ||||
| December 31, | ||||
| 2018 | $ | 5,819 | ||
| 2019 | 4,194 | |||
| 2020 | 3,717 | |||
| 2021 | 3,112 | |||
| 2022 | 1,357 | |||
| Thereafter | 448 | |||
| $ | 18,647 | |||
Supplemental balance sheet information related to leases was approximately $8.2 million, $7.9 million and $8.8 million foras follows:
2023 | 2022 | |||||||
Operating Leases: | ||||||||
Operating lease right-of-use assets | $ | 20,481 | $ | 21,551 | ||||
Operating lease liability, current | 6,350 | 5,870 | ||||||
Operating lease liability, long-term | 14,212 | 15,742 | ||||||
Total operating lease liabilities | $ | 20,562 | $ | 21,612 | ||||
Finance Leases: | ||||||||
Property, plant and equipment, gross | $ | 3,484 | $ | 3,096 | ||||
Accumulated depreciation | (1,613 | ) | (1,089 | ) | ||||
Property, plant and equipment, net | $ | 1,871 | $ | 2,007 | ||||
Other current liabilities | $ | 485 | $ | 446 | ||||
Other long-term liabilities | 1,539 | 1,608 | ||||||
Total finance lease liabilities | $ | 2,024 | $ | 2,054 | ||||
2023 | 2022 | |||||||
Weighted-Average Remaining Lease Term: | ||||||||
Operating leases (in years) | 4.3 | 5.1 | ||||||
Finance leases (in years) | 4.3 | 4.9 | ||||||
Weighted-Average Discount Rate: | ||||||||
Operating leases | 6.0 | % | 6.0 | % | ||||
Finance leases | 6.0 | % | 6.1 | % | ||||
Our discount rate is based on our incremental borrowing rate, as adjusted based on the years ended geographic regions in which our lease assets are located.
Maturities of lease liabilities were as follows as of December 31, 2017, 2016 and 2015, respectively.2023:
Year Ending | Operating | Finance | ||||||
December 31, | Leases | Leases | ||||||
2024 | $ | 6,658 | $ | 705 | ||||
2025 | 5,954 | 439 | ||||||
2026 | 4,381 | 411 | ||||||
2027 | 2,342 | 324 | ||||||
2028 | 1,240 | 263 | ||||||
Thereafter | 1,976 | 4 | ||||||
Total undiscounted cash flows | 22,551 | 2,146 | ||||||
Less imputed interest | (1,989 | ) | (234 | ) | ||||
Present value of lease liabilities | $ | 20,562 | $ | 1,912 | ||||
| 19. | COMMITMENTS AND CONTINGENCIES |
Other Commitments
The Company submits purchase orders for raw materials to various vendors throughout the year for current production requirements, as well as forecasted requirements. Certain of these purchase orders relate to special purpose material and, as such, the Company may incur penalties if an order is cancelled. The Company had outstanding purchase orders related to raw materials in the amount of $45.4$57.7 million and $31.0$113.4 million at December 31, 20172023 and December 31, 2016,2022, respectively. The Company also had outstanding purchase orders related to capital expenditures in the amount of $3.0 million$5.8 million and $2.8$7.8 million at December 31, 20172023 and December 31, 2016,2022, respectively.
Legal Proceedings
The Company is party to a number of legal actions and claims, none of which individually or in the aggregate, in the opinion of management, are expected to have a material adverse effect on the Company's consolidated results of operations or consolidated financial position.
On June 23, 2021, a patent infringement lawsuit styled Bel Power Solutions, Inc. v. Monolithic Power Systems, Inc., Case Number 6:21cv00655, was filed in the United States District Court for the Western District of Texas (Waco Division) by Bel Power Solutions, Inc. against Monolithic Power Systems, Inc. ("MPS") for infringement of various patents directed towards systems, methods and articles of manufacture that provide a substantial improvement in power control for circuits, including novel and unique point-of-load regulators. On July 27, 2023, the Western District of Texas court filed an Order granting MPS’s motion for summary judgment of non-infringement. The Court’s memorandum and opinion is forthcoming. The Company is evaluating its options for appeal.
In connection with the Company's 2014acquisition of the Power-One Power Solutions business ("Power Solutions") of ABB Ltd., there is an ongoing claim by the Arezzo Revenue Agency in Italy concerning certain tax matters related to what was then Power-One Asia Pacific Electronics Shenzhen Co. Ltd. (now Bel Power Solutions Asia Pacific Electronics Shenzhen Co. Ltd, or "BPS China"“BPS China”) for the years 2004 to 2006. In September 2012, the Tax Court of Arezzo ruled in favor of BPS China and cancelled the claim. In February 2013, the Arezzo Revenue Agency filed an appeal of the Tax Court'sCourt’s ruling. The hearing of the appeal was held on October 2, 2014. On October 13, 2014, BPS China was informed of the Regional Tax Commission of Florence ruling which was in favor of the Arezzo Revenue Agency and against BPS China. An appeal was filed on July 18, 2015 before the Regional Tax Commission of Florence and rejected. On December 5, 2016, the Arezzo Revenue Agency filed an appeal with the Supreme Court and BPS China filed a counter-appeal on January 4, 2017. The Supreme Court has yet to render its judgment. The estimated liability related to this matter is approximately $12.0 million and has been included as a liability for uncertain tax positions on the accompanying consolidated balance sheets.sheets at December 31, 2023 and 2022. As Bel is fully indemnified in this matter per the terms of the stock purchase agreement with ABB, a corresponding other asset for indemnification is also included in other assets on the accompanying consolidated balance sheets at September 30, 2017 and December 31, 2016.
In 2015, connection with the Company's 2021 acquisition of EOS Power ("EOS"), there is an ongoing claim asserted with respect to EOS by the Principal Commissioner of Customs (Preventive), Mumbai related to customs duties and imposed fines and penalties dating back to 1994. The original demand was in the amount of approximately $1.4 million, of which EOS has paid $0.5 million. EOS filed an Appeal in 2016 which is pending with the Customs, Excise and Service Tax Appellate Tribunal in Mumbai related to the $0.9 million balance of the original demand net of EOS' payment. As part of the EOS acquisition agreement entered into in March 2021, the Company was provided noticeis indemnified for this matter for a period of a potential patent infringement claim by Setec Netzwerke AG ("Setec"), a German company, for7 years from the alleged infringement of their patent EP 306 934 B1. Setec subsequently filed a lawsuit against the Company and three of its subsidiaries in Dusseldorf, Germany on January 29, 2016 for patent infringement.acquisition date. The Company filed its defenseis unable to Setec's complaint and a nullity lawsuit against Setec's patent on August 31, 2016. The Court hearing on infringement took place on March 23, 2017. Upon hearing argument from both parties, the Court issued a decision on April 6, 2017 staying the infringement case pending resolution of the nullity lawsuit. The nullity lawsuit is currently pending before the Patent Court in Munich, Germany. The Company does not have enough informationdetermine at this time what amount, if any, may ultimately be due in order to make any further conclusions or assessmentsconnection with this claim. As such, no estimate was accrued as to infringement or any potential damages.
The Company is not a party to any other legal proceeding, the adverse outcome of which is likely to have a material adverse effect on the Company's consolidated financial condition or consolidated results of operations.
| 20. | ACCUMULATED OTHER COMPREHENSIVE LOSS |
The components of accumulated other comprehensive loss as of December 31, 2017, 2016 2023 and 20152022 are summarized below:
| 2017 | 2016 | 2015 | ||||||||||
| Foreign currency translation adjustment | $ | (16,537 | ) | $ | (28,976 | ) | $ | (19,305 | ) | |||
| Unrealized holding gain on available-for-sale | ||||||||||||
| securities, net of taxes of $85, $263 and $265 as of | ||||||||||||
| December 31, 2017, 2016 and 2015 | 145 | 424 | 434 | |||||||||
| Unfunded SERP liability, net of taxes of ($1,635), ($1,398) | ||||||||||||
| and ($1,327) as of December 31, 2017, 2016 and 2015 | (3,233 | ) | (2,745 | ) | (3,005 | ) | ||||||
| Accumulated other comprehensive loss | $ | (19,625 | ) | $ | (31,297 | ) | $ | (21,876 | ) | |||
December 31, | ||||||||
2023 | 2022 | |||||||
Foreign currency translation adjustment, net of taxes of ($276) at December 31, 2023 and ($369) at December 31, 2022 | $ | (16,423 | ) | $ | (23,107 | ) | ||
Unrealized holding gains on interest rate swap cash flow hedge, net of taxes of $0 at December 31, 2023 and $0 at December 31, 2022 | 3,960 | 5,539 | ||||||
Unrealized holding gains on marketable securities, net of taxes of ($7) at December 31, 2023 and ($7) at December 31, 2022 | 19 | 18 | ||||||
Unfunded SERP liability, net of taxes of $718 at December 31, 2023 and $879 at December 31, 2022 | 407 | 1,004 | ||||||
Accumulated other comprehensive loss | $ | (12,037 | ) | $ | (16,546 | ) | ||
Changes in accumulated other comprehensive (loss) income by component during the years ended December 31, 2017 2023 and 20162022 are as follows. All amounts are net of tax.
| Unrealized Holding | |||||||||||||||||
| Foreign Currency | Gains on | ||||||||||||||||
| Translation | Available-for- | Unfunded | |||||||||||||||
| Adjustment | Sale Securities | SERP Liability | Total | ||||||||||||||
| Balance at January 1, 2016 | $ | (19,305 | ) | $ | 434 | $ | (3,005 | ) | $ | (21,876 | ) | ||||||
| Other comprehensive income (loss) before reclassifications | (9,671 | ) | (10 | ) | 5 | (9,676 | ) | ||||||||||
| Amounts reclassified from accumulated other | |||||||||||||||||
| comprehensive income (loss) | - | - | 255 | (a) | 255 | ||||||||||||
| Net current period other comprehensive income (loss) | (9,671 | ) | (10 | ) | 260 | (9,421 | ) | ||||||||||
| Balance at December 31, 2016 | (28,976 | ) | 424 | (2,745 | ) | (31,297 | ) | ||||||||||
| Other comprehensive income (loss) before reclassifications | 12,439 | (279 | ) | (733 | ) | 11,427 | |||||||||||
| Amounts reclassified from accumulated other | |||||||||||||||||
| comprehensive income (loss) | - | - | 245 | (a) | 245 | ||||||||||||
| Net current period other comprehensive income (loss) | 12,439 | (279 | ) | (488 | ) | 11,672 | |||||||||||
| Balance at December 31, 2017 | $ | (16,537 | ) | $ | 145 | $ | (3,233 | ) | $ | (19,625 | ) | ||||||
Foreign Currency Translation Adjustment | Unrealized Gains (Losses) on Interest Rate Swap Cash Flow Hedge | Unrealized Holding Gains (Losses) on Marketable Securities | Unfunded SERP Liability | Total | |||||||||||||||||
Balance at January 1, 2022 | $ | (14,911 | ) | $ | (116 | ) | $ | 29 | $ | (3,865 | ) | $ | (18,863 | ) | |||||||
Other comprehensive income (loss) before reclassifications | (7,391 | ) | 5,655 | (11 | ) | 5,119 | 3,372 | ||||||||||||||
Amounts reclassified from accumulated other comprehensive income (loss) | (805 | ) | - | - | (250 | ) | (a) | (1,055 | ) | ||||||||||||
Net current period other comprehensive income (loss) | (8,196 | ) | 5,655 | (11 | ) | 4,869 | 2,317 | ||||||||||||||
Balance at December 31, 2022 | (23,107 | ) | 5,539 | 18 | 1,004 | (16,546 | ) | ||||||||||||||
Other comprehensive income (loss) before reclassifications | 7,221 | (1,579 | ) | 1 | (542 | ) | 5,101 | ||||||||||||||
Amounts reclassified from accumulated other comprehensive income (loss) | (537 | ) | - | - | (55 | ) | (a) | (592 | ) | ||||||||||||
Net current period other comprehensive income (loss) | 6,684 | (1,579 | ) | 1 | (597 | ) | 4,509 | ||||||||||||||
Balance at December 31, 2023 | $ | (16,423 | ) | $ | 3,960 | $ | 19 | $ | 407 | $ | (12,037 | ) | |||||||||
| (a) | This reclassification relates to the amortization of prior service costs and gains/losses associated with the Company's SERP plan. This expense is |
| 21. | SUBSEQUENT EVENTS |
Share Repurchase Program Authorization
In connectionFebruary 2024, Bel's Board of Directors authorized the repurchase of up to $25.0 million in shares of the Company’s outstanding Class A common stock and Class B common stock (the "Repurchase Program"). The aggregate $25.0 million available for repurchases under the Repurchase Program has been suballocated for purchases of Class A shares and Class B shares in portions of $4.0 million and $21.0 million, respectively, prorated to take into account the number of outstanding shares of each respective class. Shares of common stock may be repurchased pursuant to the Repurchase Program in open market, privately negotiated or block transactions or otherwise from time to time, depending upon market conditions and other factors, and in accordance with its acquisitionapplicable law and regulations of Power Solutions,the Securities and Exchange Commission, including Rule 10b-18 of the Securities Exchange Act of 1934, as amended. The exact number of shares to be repurchased by the Company, acquired a 49% interest in a joint ventureif any, is not guaranteed. Depending on market conditions and other factors, these repurchases may be commenced or suspended at any time or periodically without prior notice. The Company initiated its Share Repurchase program on March 1, 2024 and began making repurchases of both Class A and Class B common stock in the People's Republic of China ("PRC"). The joint venture purchased raw components and other goods from open market on that date.
Property Held for Sale
In January 2024, the Company and sold finished goods to the Companybegan actively marketing its property located in Glen Rock, Pennsylvania. The net book value of this property was $0.8 million as well as to other third parties. The Company purchased $1.5 million of inventory from the joint venture during the year ended December 31, 2015. The Company did not purchase any inventory from the joint venture during 2016 or 2017. At December 31, 2016, the Company owed the joint venture approximately $0.5 million, which is included in accounts payable on the accompanying consolidated balance sheet. During the fourth quarter2023.
| 2017 | |||||||||||||||||||
| First | Second | Third | Fourth | ||||||||||||||||
| Quarter | Quarter | Quarter | Quarter | ||||||||||||||||
| Net sales | $ | 113,668 | $ | 131,617 | $ | 126,386 | $ | 119,940 | |||||||||||
| Gross profit | 23,278 | 29,042 | 27,617 | 22,075 | |||||||||||||||
| Net earnings (loss) | 746 | 3,120 | 5,024 | (20,787 | ) | (a) | |||||||||||||
| Net earnings (loss) per share: | |||||||||||||||||||
| Class A common share - basic and diluted | $ | 0.05 | $ | 0.24 | $ | 0.40 | $ | (1.66 | ) | ||||||||||
| Class B common share - basic and diluted | $ | 0.06 | $ | 0.26 | $ | 0.42 | $ | (1.74 | ) | ||||||||||
| 2016 | |||||||||||||||||||
| First | Second | Third | Fourth | ||||||||||||||||
| Quarter | Quarter | Quarter | Quarter | ||||||||||||||||
| Net sales | $ | 121,182 | $ | 131,622 | $ | 128,809 | $ | 118,539 | |||||||||||
| Gross profit | 23,074 | 25,692 | 26,575 | 24,579 | |||||||||||||||
| Net (loss) earnings | (100,696 | ) | (b) | 22,776 | (b) | 9,710 | 3,377 | ||||||||||||
| Net (loss) earnings per share: | |||||||||||||||||||
| Class A common share - basic and diluted | $ | (8.15 | ) | $ | 1.83 | $ | 0.78 | $ | 0.27 | ||||||||||
| Class B common share - basic and diluted | $ | (8.55 | ) | $ | 1.93 | $ | 0.82 | $ | 0.29 | ||||||||||
| BEL FUSE INC. AND SUBSIDIARIES | ||||||||||||||||||||
| SCHEDULE II - VALUATION AND QUALIFYING ACCOUNTS | ||||||||||||||||||||
| (Amounts in thousands) | ||||||||||||||||||||
| Column A | Column B | Column C | Column D | Column E | ||||||||||||||||
| Additions | ||||||||||||||||||||
| Balance at | (1) | (2) | Balance | |||||||||||||||||
| beginning | Charged to costs | Charged to other | Deductions | at end | ||||||||||||||||
| Description | of period | and expenses | accounts (b) | (a) | of period | |||||||||||||||
| Year ended December 31, 2017: | ||||||||||||||||||||
| Allowance for doubtful accounts | $ | 1,781 | $ | 139 | $ | (132 | ) | $ | (43 | ) | $ | 1,745 | ||||||||
| Allowance for excess and obsolete inventory | $ | 6,263 | $ | 3,893 | $ | 661 | $ | (2,521 | ) | $ | 8,296 | |||||||||
| Deferred tax assets - valuation allowances | $ | 7,485 | $ | 1,599 | $ | - | $ | (739 | ) | $ | 8,345 | |||||||||
| Year ended December 31, 2016: | ||||||||||||||||||||
| Allowance for doubtful accounts | $ | 1,747 | $ | (163 | ) | $ | 281 | $ | (84 | ) | $ | 1,781 | ||||||||
| Allowance for excess and obsolete inventory | $ | 5,268 | $ | 3,513 | $ | 185 | $ | (2,703 | ) | $ | 6,263 | |||||||||
| Deferred tax assets - valuation allowances | $ | 6,635 | $ | 887 | $ | - | $ | (37 | ) | $ | 7,485 | |||||||||
| Year ended December 31, 2015: | ||||||||||||||||||||
| Allowance for doubtful accounts | $ | 1,989 | $ | 295 | $ | 303 | $ | (840 | ) | $ | 1,747 | |||||||||
| Allowance for excess and obsolete inventory | $ | 6,809 | $ | 2,186 | $ | (59 | ) | $ | (3,668 | ) | $ | 5,268 | ||||||||
| Deferred tax assets - valuation allowances | $ | 6,692 | $ | 456 | $ | - | $ | (513 | ) | $ | 6,635 | |||||||||
| (a) Write-offs | ||||||||||||||||||||
| (b) Includes foreign currency translation adjustments | ||||||||||||||||||||
None.
Evaluation of Disclosure Controls and Procedures
During the fourth quarter of 2017,2023, the Company's management, including the principal executive officer and principal financial officer, supervised and participated in the evaluation of the Company's disclosure controls and procedures (as defined in Rules 13a-15(e) and 15d-15(e) under the Securities Exchange Act of 1934) related to the recording, processing, summarization, and reporting of information in the Company's periodic reports that the Company files with the SEC. These disclosure controls and procedures have been designed to ensure that material information relating to the Company, including its subsidiaries, is made known to the Company's management, including these officers,the principal executive officer and principal financial officer, by other of the Company'sCompany’s other employees, and that this information is recorded, processed, summarized,
In designing and evaluating the disclosure controls and procedures, the Company recognizes that any controls and procedures, no matter how well designed and operated, provide only reasonable, not absolute, assurance that the above objectives have been met. Notwithstanding these limitations, the Company believes that its disclosure controls and procedures are designed and are operating to provide reasonable assurances of achieving their objectives.
Based on their evaluation as of December 31, 2017,2023, the Company's principal executive officer and principal financial officer have concluded that the Company's disclosure controls and procedures (as defined in Rules 13a-15(e) and 15d-15(e) under the Securities Exchange Act of 1934) are effective to ensure that the information required to be disclosed by the Company in the reports that the Company files or submits under the Securities Exchange Act of 1934 is recorded, processed, summarized and reported within the time periods specified in SEC rules and forms.
Management's Annual Report on Internal Control Over Financial Reporting
The Company's management is responsible for establishing and maintaining adequate internal control over financial reporting, as such term is defined in Exchange Act Rule 13a-15(f). Under the supervision and with the participation of the Company's management, including the Company's principal executive officer and principal financial officer, the Company conducted an evaluation of the effectiveness of the Company's internal control over financial reporting based on the framework in Internal Control – Integrated Framework (2013) issued by the Committee of Sponsoring Organizations of the Treadway Commission.
Based on the Company's evaluation under the framework in Internal Control – Integrated Framework (2013), the Company's management concluded that the Company's internal control over financial reporting was effective as of December 31, 2017.
Grant Thornton LLP has audited the effectiveness of the Company's internal control over financial reporting as of December 31, 20172023 and has expressed an unqualified opinion on the effectiveness of our internal control over financial reporting as of December 31, 20172023 in their report which is included in Item 8 herein.
Changes in Internal Controls Over Financial Reporting
There has not been any change in our internal control over financial reporting during the three months ended December 31, 20172023 that has materially affected, or is reasonably likely to materially affect, our internal control over financial reporting.
Other Information – Restructuring
The discussion captioned “Overview – Key Factors Affecting our Business – Restructuring,” as set forth in Part II, Item 7, “Management’s Discussion and Analysis of Financial Condition and Results of Operations,” above, is hereby incorporated by reference into this Part II, Item 9B, of this Annual Report on Form 10-K.
Rule 10b5-1 Trading Arrangements and Non-Rule 10b5-1 Trading Arrangements
During the fiscal quarter ended December 31, 2023, none of our officers or directors, as those terms are defined in Rule 16a-1(f), adopted or terminated a “Rule 10b5-1 trading arrangement” or a “non-Rule 10b5-1 trading arrangement,” as those terms are defined in Item 408 of Regulation S-K.
Item 9C. Disclosure Regarding Foreign Jurisdictions that Prevent Inspections
Not applicable.
PART III
Item 10. Directors, Executive Officers and Corporate Governance
The Registrant incorporates by reference herein the information to be set forth in its definitive proxy statement for its 2018 2024 annual meeting of shareholders (the “Proxy Statement”), which will be filed no later than 120 days after December 31, 2023, that is responsive to the remaining information required with respect to this item.
The Registrant has adopted a code of ethics for all of its associates, including directors, executive officers and all other senior financial personnel. The code of ethics, as amended from time to time, is available on the Registrant's website under Investors > Corporate Governance.Governance at https://ir.belfuse.com/corporate-governance. The Registrant will also make copies of its code of ethics available to investors upon request. Any such request should be sent by mail to Bel Fuse Inc., 206 Van Vorst Street, Jersey City,300 Executive Drive, Suite 300, West Orange, NJ 0730207052 Attn: Craig BrosiousLynn Hutkin, Vice President of Financial Reporting and Investor Relations, or should be made by telephone by calling Craig BrosiousLynn Hutkin at 201-432-0463.
The Registrant intends to satisfy the disclosure requirement under Item 5.05 of Form 8-K regarding an amendment to, or a waiver from, a provision of its code of ethics that applies to the Registrant’s principal executive officer, principal financial officer, principal accounting officer or controller, or persons performing similar functions and that relates to any element of the code of ethics definition enumerated in paragraph (b) of Item 406 of the SEC’s Regulation S-K, by posting such information on the Registrant’s website, www.belfuse.com.
The Registrant incorporates by reference herein information to be set forth in its definitive proxy statement for its 2018 annual meeting of shareholdersthe Proxy Statement that is responsive to the information required with respect to this Item.
The Registrant incorporates by reference herein information to be set forth in its definitive proxy statement for its 2018 annual meeting of shareholdersthe Proxy Statement that is responsive to the remaining information required with respect to this Item.
The table below depicts the securities authorized for issuance under the Company's equity compensation plans.
Equity Compensation Plan Information
Plan Category | Number of Securities to be Issued Upon Exercise of Outstanding Options, Warrants and Rights | Number of Securities Remaining Available for Future Issuance Under Equity Compensation Plans (Excluding Securities Reflected in Column (a)) | ||||||||||
| (a) | (b) | (c) | ||||||||||
Equity compensation plans approved by security holders: | ||||||||||||
2020 Equity Compensation Plan | - | $ | - | |||||||||
Equity compensation plans not approved by security holders | - | - | - | |||||||||
Totals | - | $ | - | |||||||||
The Registrant incorporates by reference herein information to be set forth in its definitive proxy statement for its 2018 annual meeting of shareholdersthe Proxy Statement that is responsive to the information required with respect to this Item.
The Registrant incorporates by reference herein information to be set forth in its definitive proxy statement for its 2018 annual meeting of shareholdersthe Proxy Statement that is responsive to the information required with respect to this Item.
PART IV
24.1* | |||
31.1* | |||
31.2* | |||
32.1** | |||
32.2** | |||
| 97.1†* | Bel Fuse Inc. Compensation Recovery Policy. | ||
101.INS* | Inline XBRL Instance Document | ||
101.SCH* | Inline XBRL Taxonomy Extension Schema Document | ||
101.CAL* | Inline XBRL Taxonomy Extension Calculation Linkbase Document | ||
101.DEF* | Inline XBRL Taxonomy Extension Definition Linkbase Document | ||
101.LAB* | Inline XBRL Taxonomy Extension Label Linkbase Document | ||
101.PRE* | Inline XBRL Taxonomy Extension Presentation Linkbase Document | ||
| 104* | Cover Page Interactive Data File (formatted as Inline XBRL and contained in Exhibit 101) |
* Filed herewith.
** Submitted herewith.
† Management contract or compensatory plan or arrangement.
None.
Pursuant to the requirements of Section 13 or 15(d) of the Securities Exchange Act of 1934, the registrant has duly caused this report to be signed on its behalf by the undersigned, thereunto duly authorized.
BEL FUSE INC. (Registrant) | |||
By: | /s/ Daniel Bernstein | ||
Daniel Bernstein | |||
President and Chief Executive Officer | |||
KNOW ALL MEN BY THESE PRESENTS, that each person whose signature appears below constitutes and appoints Daniel Bernstein and Colin DunnFarouq Tuweiq as his/her attorney-in-fact and agent, with full power of substitution and resubstitution, for him/her and in his/her name, place, and stead, in any and all capacities, to sign and file any and all amendments to this Annual Report on Form 10-K, with all exhibits thereto and hereto, and other documents with the Securities and Exchange Commission, granting unto said attorney-in-fact and agent, and each of them, full power and authority to do and perform each and every act and thing requisite or necessary to be done in and about the premises, as fully to all intents and purposes as he/she might or could do in person, hereby ratifying and confirming all that said attorneys-in-fact and agents, or any of them, or their or his substitutes, may lawfully do or cause to be done by virtue hereof.
Pursuant to the requirements of the Securities Exchange Act of 1934, this report has been signed below by the following persons on behalf of the registrant and in the capacities and on the dates indicated.
Signature | Title | Date | ||
/s/ Daniel Bernstein | President, Chief Executive Officer and Director | March 11, 2024 | ||
Daniel Bernstein | (Principal Executive Officer) | |||
/s/ Peter Gilbert | Director | March 11, 2024 | ||
Peter Gilbert | ||||
/s/ John Tweedy | Director | March 11, 2024 | ||
John Tweedy | ||||
/s/ Mark Segall | Director | March 11, 2024 | ||
Mark Segall |
/s/ Eric Nowling | Director | March 11, 2024 | ||
Eric Nowling | ||||
/s/ Vincent Vellucci | Director | March 11, 2024 | ||
Vincent Vellucci | ||||
| /s/ | ||||
| Director | March | |||
| /s/ | Director | March | ||
| /s/ Jacqueline Brito | Director | March 11, 2024 | ||
| Jacqueline Brito | ||||
/s/ | Chief Financial Officer | March | ||
Farouq Tuweiq | (Principal Financial Officer) | |||
| /s/ | ||||
| Vice President of | March | |||
| (Principal | ||||
81